Notebookcheck Logo

X-Plane 10 Benchmarked

Serious. After Microsoft more or less abandoned the flight simulator market following the release of their Flight Simulator X, Laminar Research has the only viable and constantly updated alternative with their X-Plane Flight Simulator. Our review will focus on the hardware requirements and show which notebooks and desktops handle the simulator smoothly.

Benchmark

For the original German article, see here.

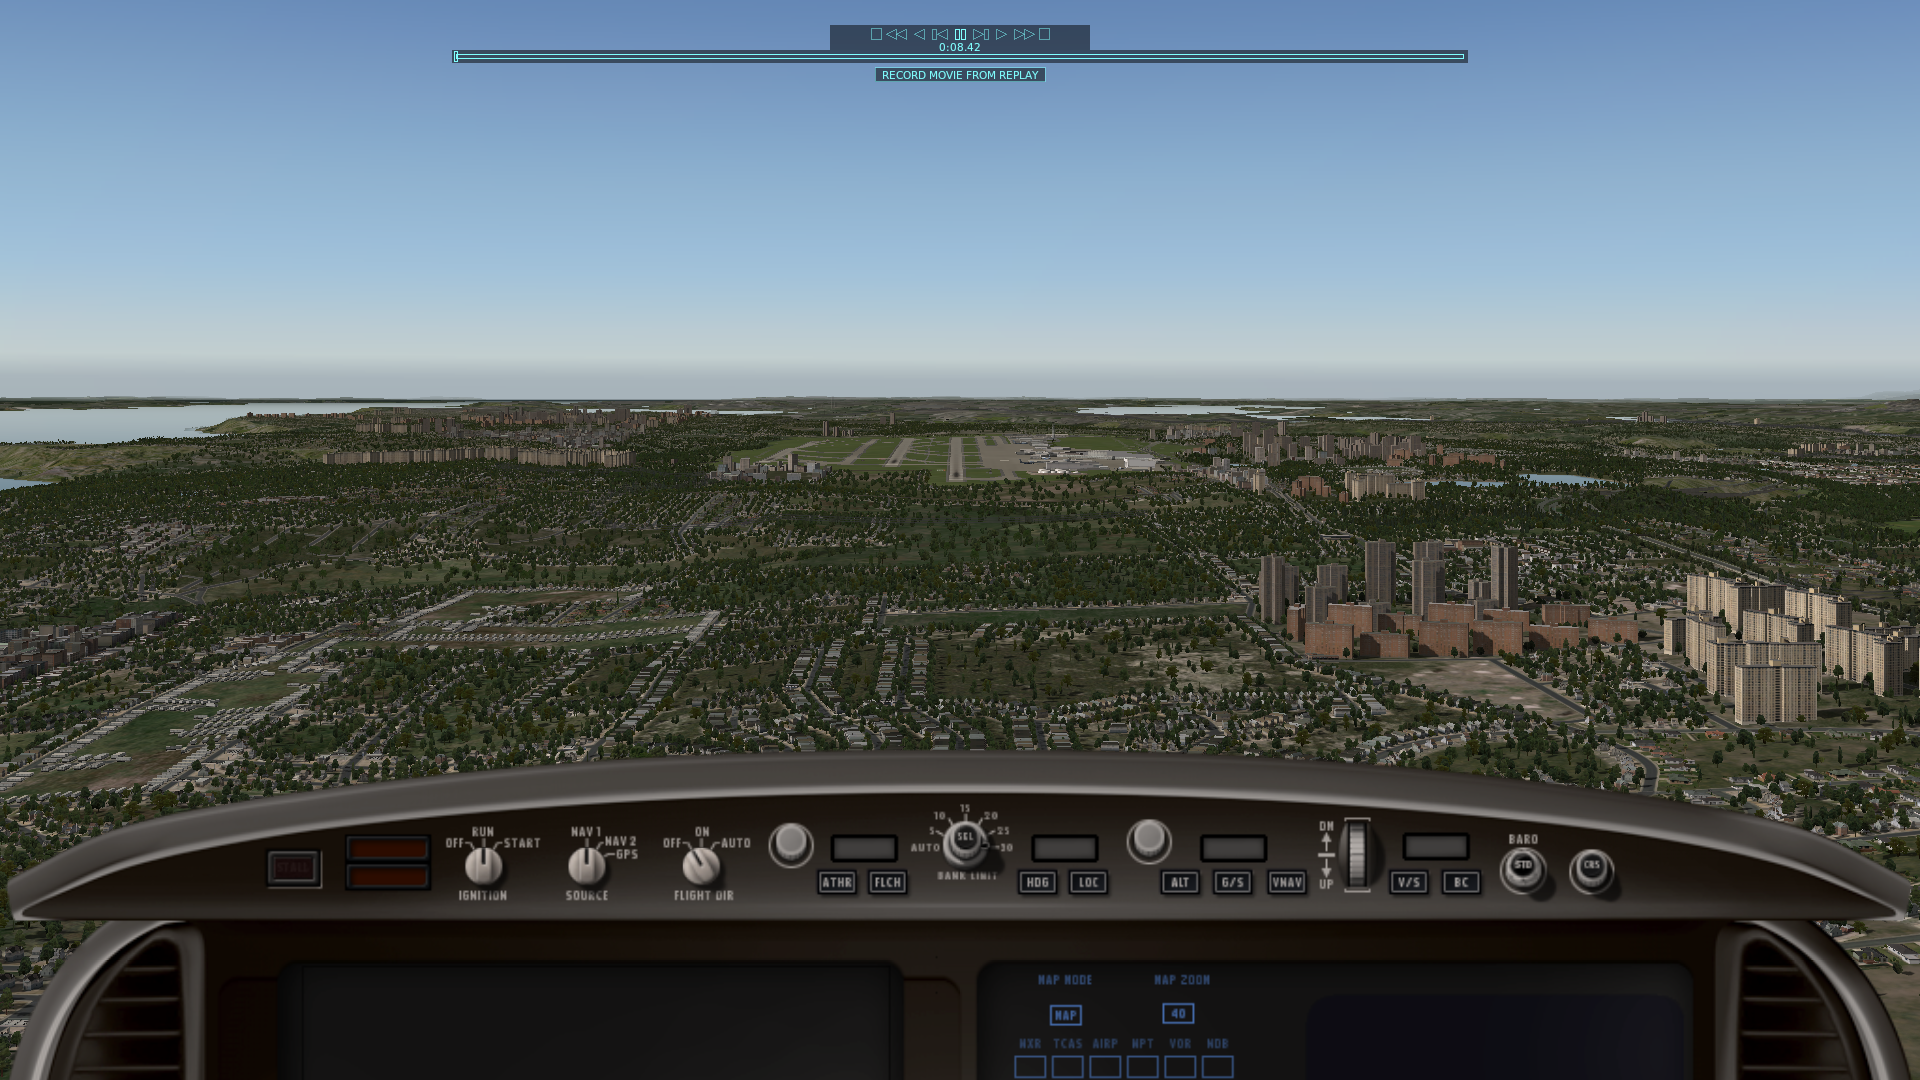
For this review we'll use the integrated benchmark functionality in X-Plane 10, which can be started via the parameter --fps_test. For the most basic functionality, the user simply inputs the numbers from 1 to 4 to specify the quality settings from low to ultra-high. In addition, we'll also specify the resolution (1024x768, 1366x768, and 1920x1080) and the color depth (32-bit). We decided to use the time demo test_flight_c4 as our sequence, which is included in the 64-bit web demo version 10.25 as used for this review.

Update: We received a mail from an X-Plane developer that test 4 is not intended for benchmarking: 

However, test 4 is _not_ an actual test of the product - it is a specialized "CPU-only" test that was put in so that driver developers could look at changes in performance between driver versions.  The test intentionally ignores the GPU to "focus" on CPU driver time.  (Similarly test 5 is a GPU only test to focus on shader compilation.

Here are the 4 commands to execute the benchmark:


X-Plane.exe --fps_test=1 --load_smo=Output/replays/test_flight_c4.fdr --pref:_is_full_ALL=1 --pref:_x_res_full_ALL=1024 --pref:_y_res_full_ALL=768 --pref:_bpp_full_ALL=32
X-Plane.exe --fps_test=2 --load_smo=Output/replays/test_flight_c4.fdr --pref:_is_full_ALL=1 --pref:_x_res_full_ALL=1366 --pref:_y_res_full_ALL=768 --pref:_bpp_full_ALL=32
X-Plane.exe --fps_test=3 --load_smo=Output/replays/test_flight_c4.fdr --pref:_is_full_ALL=1 --pref:_x_res_full_ALL=1366 --pref:_y_res_full_ALL=768 --pref:_bpp_full_ALL=32
X-Plane.exe --fps_test=4 --load_smo=Output/replays/test_flight_c4.fdr --pref:_is_full_ALL=1 --pref:_x_res_full_ALL=1920 --pref:_y_res_full_ALL=1080 --pref:_bpp_full_ALL=32
1024x768 fps_test=1 ... low
1366x768 fps_test=2 ... medium
1366x768 fps_test=3 ... high
1920x1080 fps_test=4 ... ultra
1024x768 fps_test=1 ... low
1366x768 fps_test=2 ... medium
1366x768 fps_test=3 ... high
1920x1080 fps_test=4 ... ultra

Results

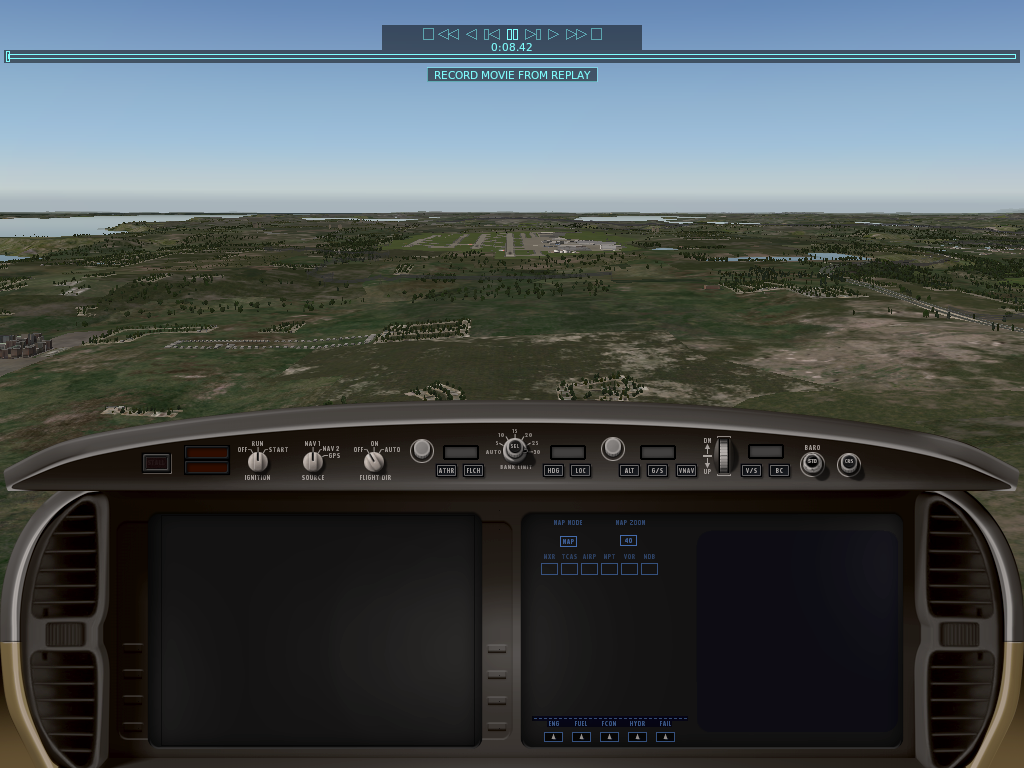
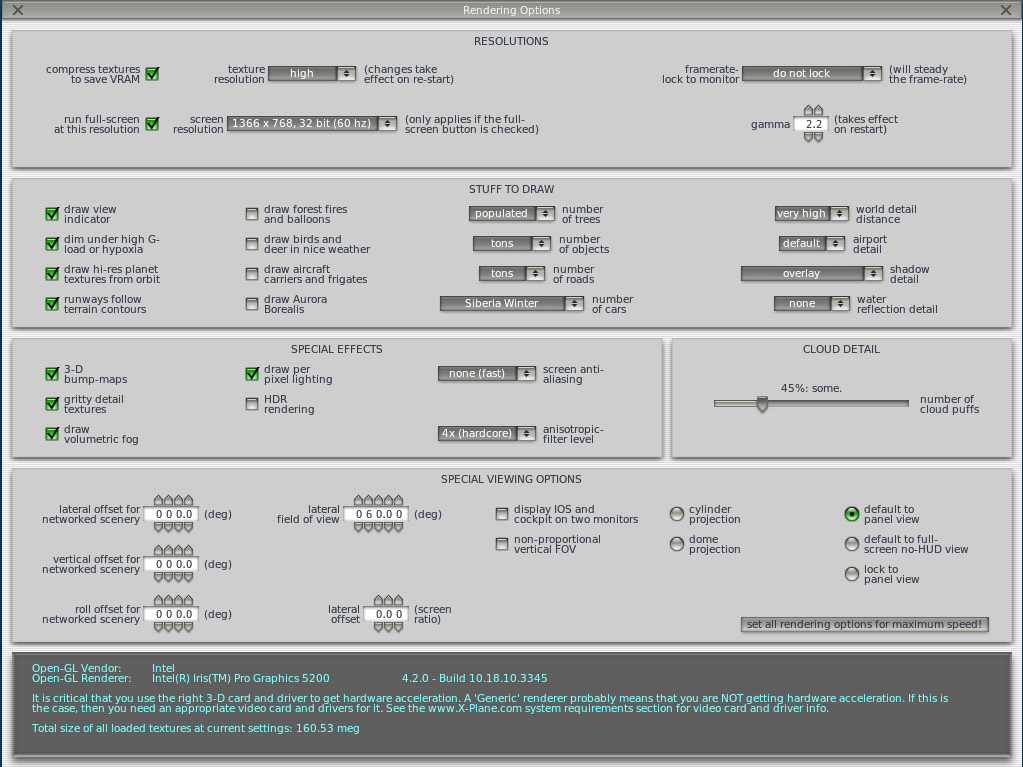
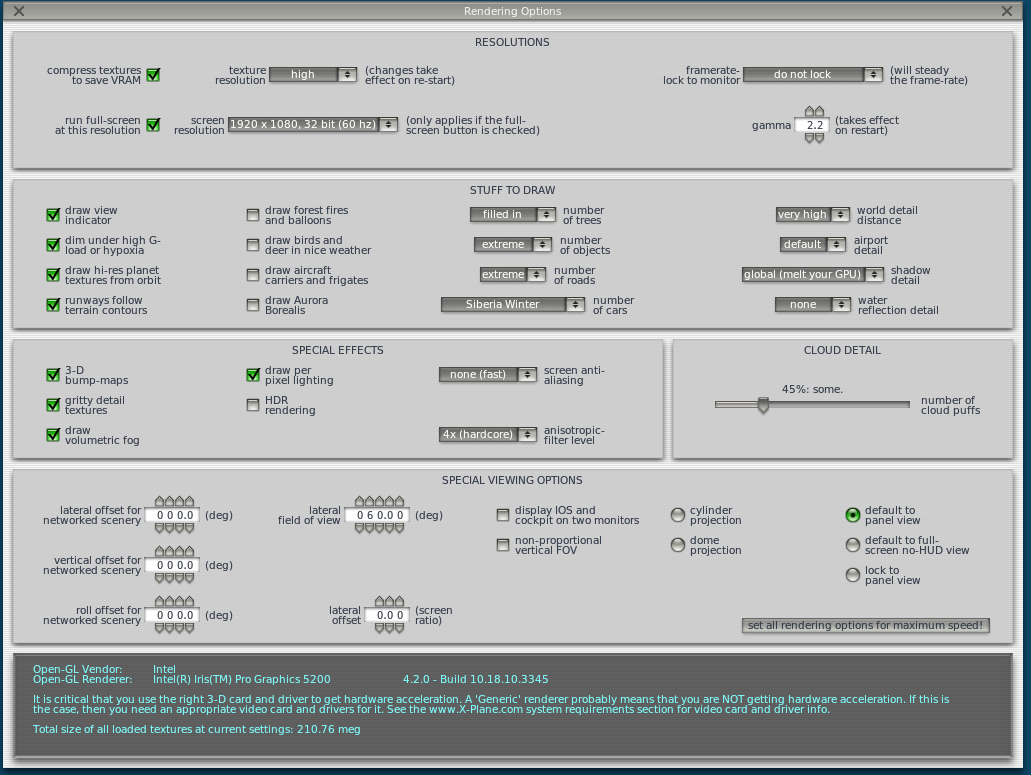
The screenshots depicting the various settings show that even the lowest preset is not necessarily the lowest setting since "texture resolution" and "world detail distance" are still set to high and very high, respectively. Though these settings are comparatively high, an Intel HD Graphics 4000 GPU is already a workable solution.

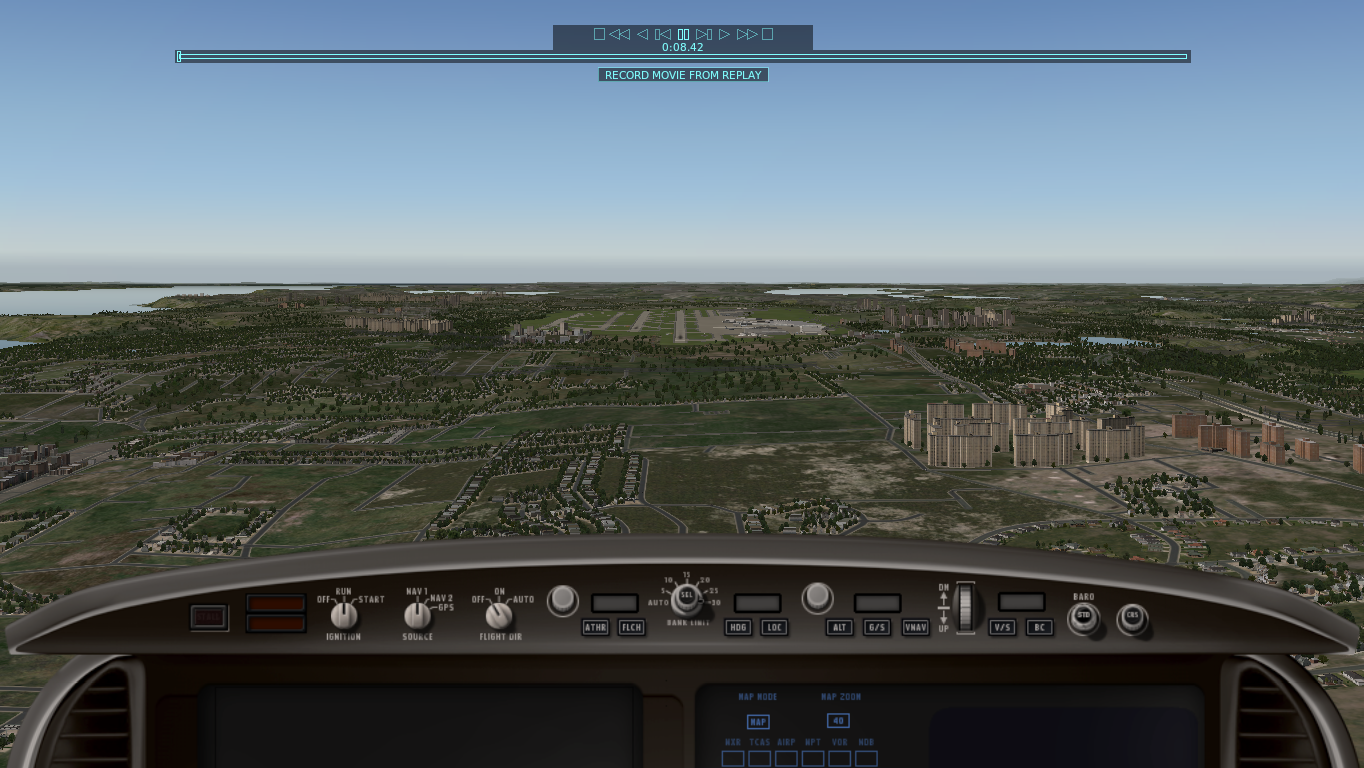
The next setting reveals far more graphical details than the first. Medium details (fps_test=2) require at least a middle-class graphics card like a GeForce GT 640M to ensure smooth operation. Even so, we advise users to scale back some settings for improved frame rates. Some slower cards like the GT 720M proved to be an acceptable alternative at times with decently high frame rates. It appears that the X-Plane benchmark can really take advantage of the high clock speeds that the dual-core Haswell CPUs offer.

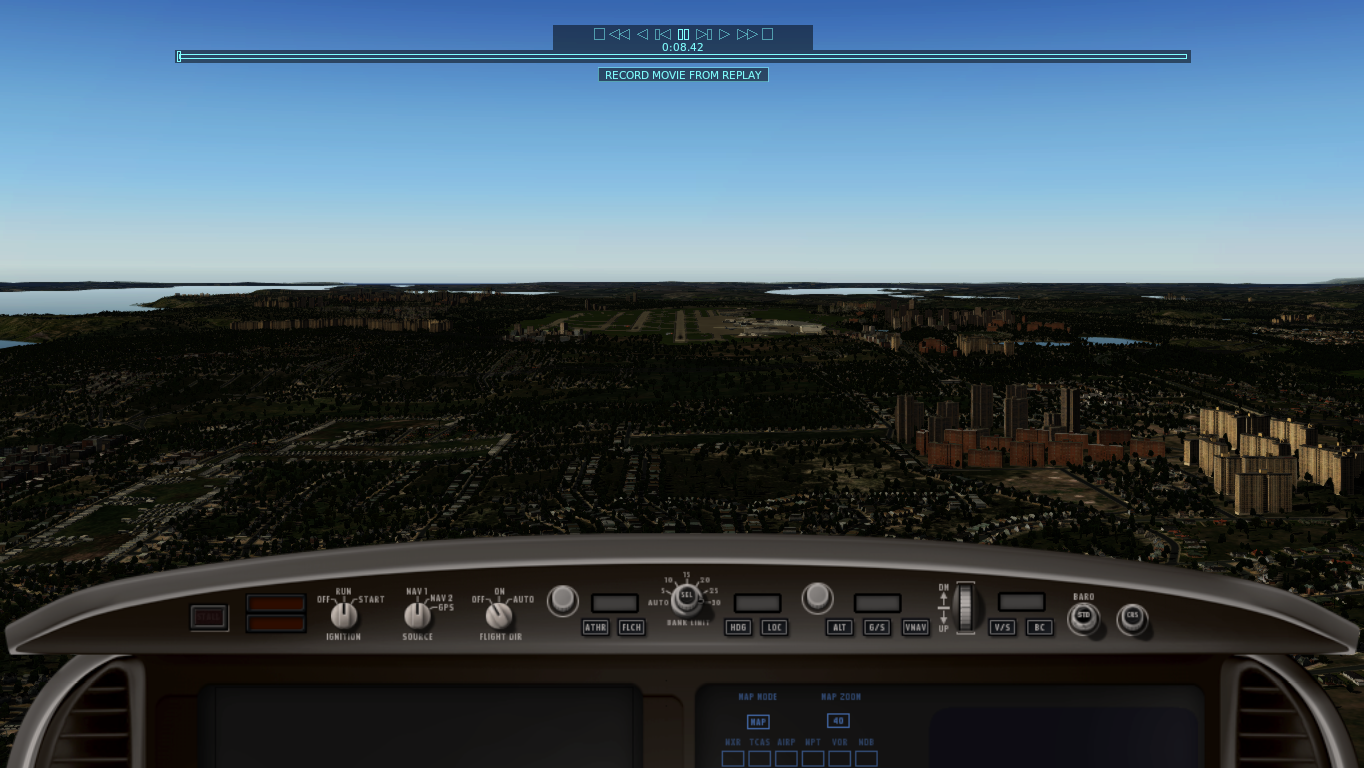
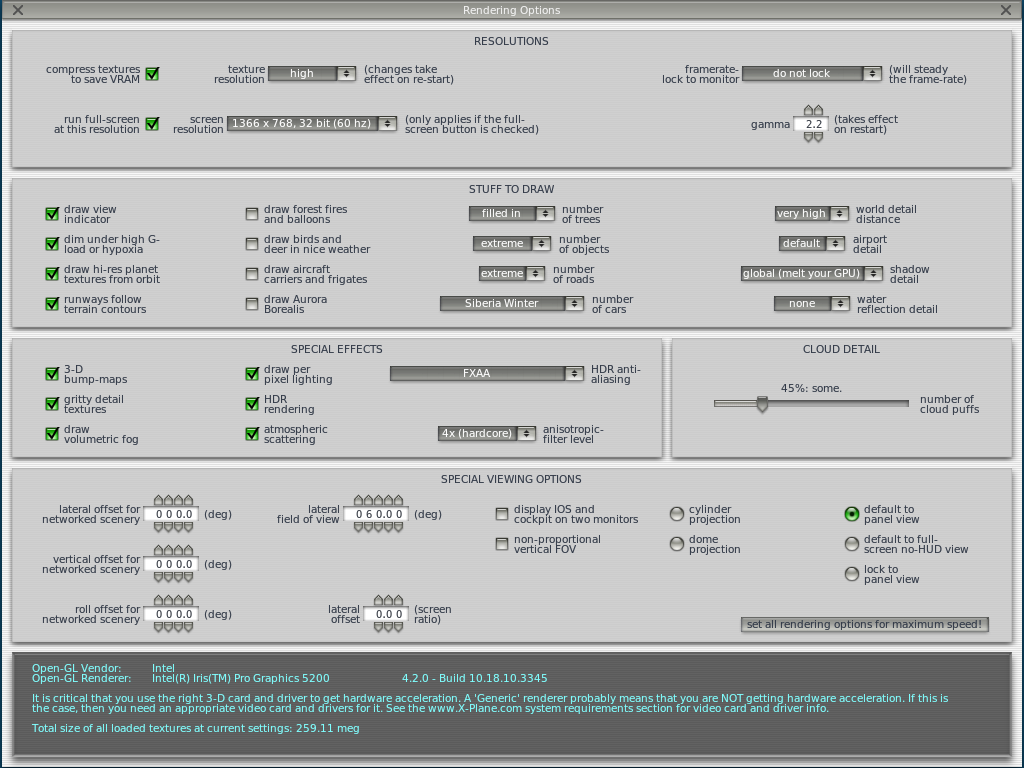
The next higher setting (fps_test=3) requires a high-end graphics card like the desktop GPU NVIDIA GeForce GTX 780M to ensure stutter-free performance. Additionally, a high-end CPU is also required.

Update: Our ultra settings are not suitable for benchmarking, see quote above.

The highest setting is most likely reserved for top-of-the-line desktop graphics cards like the Radeon R9 290X or the Nvidia GeForce 780 Ti in combination with a fast CPU. In the benchmarks we conducted, none of the test systems reached frame rates above 25 fps, although the Schenker W503 with GTX 780M and Core i7-4700MQ came quite close.

Of utmost importance is a powerful CPU. The GTX 780M paired with a Haswell Core i7-4700MQ, for example, posted the highest test scores and beat out a GTX 680 desktop GPU with a Core i7-2600K CPU at the highest settings. A detailed analysis of how the processor can impact performance is shown below.

X-Plane 10.25
    1920x1080 ultra (fps_test=4) test_flight_c4     1366x768 high (fps_test=3) test_flight_c4     1366x768 med (fps_test=2) test_flight_c4     1024x768 low (fps_test=1) test_flight_c4
GeForce GTX 780M, 4700MQ
Schenker W503
22.1 (0min) fps ∼81%
27.1 (0min) fps ∼83%
50.8 (0min) fps ∼87%
101.9 (0min) fps ∼85%
GeForce GTX 765M, 4700MQ
Schenker W503
14.9 (0min) fps ∼55%
26.1 (0min) fps ∼80%
50.6 (0min) fps ∼86%
104.3 (0min) fps ∼87%
GeForce GTX 680, 2600K, Samsung SSD 840 Pro 256GB MZ7PD256HAFV-0Z000
Desktop GTX 680, Intel Core i7-2600K
20.1 (0min) fps ∼74%
24.1 (0min) fps ∼74%
43.1 (0min) fps ∼73%
95 (0min) fps ∼79%
GeForce GT 740M, 4200M
HP Envy 15-j011sg
9.9 (0min) fps ∼36%
16.7 (0min) fps ∼51%
41.9 (0min) fps ∼71%
89.1 (0min) fps ∼74%
Radeon HD 6870, FX-8350, Samsung SSD 830 Series MZ-7PC256D/EU
Desktop Asus M5A97 Evo Desktop
14.3 (0min) fps ∼52%
18.4 (0min) fps ∼56%
35.7 (0min) fps ∼61%
69 (0min) fps ∼58%
GeForce GT 720M, 4200M, WDC Scorpio Blue WD10JPVX-22JC3T0
MSI CX61-i572M
12.3 (0min) fps ∼38%
33.9 (0min) fps ∼58%
80.2 (0min) fps ∼67%
GeForce GT 640M, 2637M, Lite-On LMT-256M3M
Acer Aspire M3-581TG
6.4 (0min) fps ∼23%
13.1 (0min) fps ∼40%
27.6 (0min) fps ∼47%
65 (0min) fps ∼54%
Iris Pro Graphics 5200, 4750HQ, Intel SSD 525 Series SSDMCEAC180B3
SCHENKER S413
11.1 (0min) fps ∼41%
13.5 (0min) fps ∼41%
29.8 (0min) fps ∼51%
62 (0min) fps ∼52%
HD Graphics 4600, 4700MQ
Schenker W503
9.4 (0min) fps ∼34%
12.1 (0min) fps ∼37%
28.8 (0min) fps ∼49%
51.2 (0min) fps ∼43%
Radeon HD 7660G, A10-4600M, Samsung SSD 830 Series MZ-7PC0128D/EU
AMD Pumori Platform A10-4600M
5.8 (0min) fps ∼21%
8.7 (0min) fps ∼27%
19.2 (0min) fps ∼33%
42.8 (0min) fps ∼36%
HD Graphics 4000, 3720QM
Asus N56VM
4.4 (0min) fps ∼16%
6.6 (0min) fps ∼20%
14.6 (0min) fps ∼25%
37.7 (0min) fps ∼31%
Radeon HD 8400, A6-5200, Samsung SSD 830 Series MZ-7PC256D/EU
ASRock IMB-A180-H Mini-ITX AMD Kit
3.4 (0min) fps ∼12%
4.9 (0min) fps ∼15%
10.9 (0min) fps ∼19%
21.4 (0min) fps ∼18%
Show Restrictions
PosModel< PrevNext >X-Plane 10.25
 X-Plane 10.25 (2013)
low
1024x768
low (fps_test=1) test_flight_c4
med.
1366x768
med (fps_test=2) test_flight_c4
high
1366x768
high (fps_test=3) test_flight_c4
ultra
1920x1080
ultra (fps_test=4) test_flight_c4
NVIDIA GeForce GTX 1060 Mobile
81.8
46.6
24.5
24.5
AMD Radeon RX 580 (Laptop)
72
42.2
21.8
20.6
NVIDIA GeForce GTX 980M
120
58.7
32.6
27.3
AMD Radeon R9 280X
89.1
47.8
24.8
18.6
NVIDIA GeForce GTX 680
95
43.1
24.1
20.1
NVIDIA GeForce GTX 880M
108.9
52
28.5
22.4
NVIDIA GeForce GTX 660 Ti
105.7
46.8
26.4
21.7
NVIDIA GeForce GTX 780M
101.9
50.8
27.1
22.1
NVIDIA GeForce GTX 965M
97.85n2
50.95n2
26.65n2
20.05n2
NVIDIA GeForce GTX 870M
100.4
49
25.2n2
19.65n2
AMD Radeon R9 M290X
71.7
41.4
22
16.4
AMD Radeon HD 8970M
81.7
46.3
23.7
17.2
NVIDIA GeForce GTX 680M
82.2
39.2
21.5
17.1
AMD Radeon R9 M390
84
52.5
24.7
19.8
AMD Radeon HD 7970M
67.9
38.8
20.2
14.7
NVIDIA GeForce GTX 960M
105.4
54.3
28.5
16.8
NVIDIA GeForce MX150
104.2
54.6
29.8
21.9
NVIDIA GeForce GTX 770M
104.1
48.8
25.8
17.1
NVIDIA GeForce GTX 860M
94.75n2
46.75n2
26.9n3
17.2n3
PosModel< PrevNext >X-Plane 10.25
low med. high ultra
NVIDIA GeForce GTX 675MX
83.1
39
21.3
13.7
NVIDIA GeForce GTX 850M
79.9n5
40.2n5
24.3n6
14.9n6
AMD Radeon RX Vega 11
65.9
44.7
20.1
18.75n2
AMD Radeon HD 6870
69
35.7
18.4
14.3
NVIDIA GeForce GTX 765M
104.3
50.6
26.1
14.9
NVIDIA GeForce GTX 670MX
82.5
38.9
22.3
13.7
NVIDIA GeForce GTX 660M
82.2
38.4
18.7
10
AMD Radeon HD 8850M
56.4
27.2
13.5
11.7
AMD Radeon R9 M265X
66.8
30.5
14.7
9
NVIDIA GeForce GT 750M
79.7
38.1
19.8
10.5
AMD Radeon RX Vega 8 (Ryzen 2000/3000)
51.85n2
31.95n2
14.8n2
18.2
NVIDIA GeForce 940M
80.5
41.6
21.6
11.1
NVIDIA GeForce 840M
76.4n2
36.8n2
18.3n2
10.5
NVIDIA GeForce GT 745M
71.1
33.7
16.7
AMD Radeon R7 512 Cores (Kaveri Desktop)
54.5
23.2
11.3
8.5
Intel Iris Pro Graphics 5200
62
29.8
13.5
11.1
AMD Radeon R7 384 Cores (Kaveri Desktop)
52.15n2
25.55n2
11.85n2
8.2
NVIDIA GeForce GT 740M
89.1
41.9
16.7
9.9
Intel Iris Graphics 550
30.3
22.7
19.1
NVIDIA GeForce 830M
54.6
27.4
14.1
PosModel< PrevNext >X-Plane 10.25
low med. high ultra
NVIDIA GeForce GT 735M
73.4
33.9
12.9
NVIDIA GeForce 825M
43.1
25.4
11.3
NVIDIA GeForce GT 730M
84.9
41.1
18.3
14.2
AMD Radeon HD 8750M
61.65n2
31.85n2
13.55n2
11.7
AMD Radeon R7 M270
59.6
31.5
13.4
5.1
AMD Radeon R7 M265
53.6n2
26.3n2
11.25n2
4.2
NVIDIA GeForce GT 640M
65
27.6
13.1
6.4
AMD Radeon R7 M260
54
30.7
13.5
11.8
Intel UHD Graphics 620
49.3
19.8
10.1
8
AMD Radeon HD 8670D
60.1
29.4
12.1
8.5
AMD Radeon R6 (Kaveri)
28.4
11.8
5.1
AMD Radeon HD 8570D
54.5
26
11.3
7.6
AMD Radeon HD 8670M
51.2
24.8
AMD Radeon HD 8650G
39.3n2
19.05n2
8.7
6.5
NVIDIA GeForce GT 630M
46.6
15.5
6.9
4.5
AMD Radeon R5 M255
56.1
34.3
14.6
12.2
NVIDIA GeForce 820M
68.2
29.2
12
NVIDIA GeForce GT 720M
80.2
33.9
12.3
AMD Radeon R5 M240
21.2
12.9
6.4
AMD Radeon R5 M230
53.3n2
27.25n2
10.6n2
9.1n2
PosModel< PrevNext >X-Plane 10.25
low med. high ultra
AMD Radeon R5 (Stoney Ridge)
31.7
17.7
9.6
Intel HD Graphics 6000
40
13
6.9
Intel Iris Graphics 5100
41.1
21.8
10.3
8.5
Intel HD Graphics 4600
43.35n2
24.9n2
10.1n2
9.4
Intel HD Graphics 5500
33.5n2
13.4n2
5.9n2
AMD Radeon R5 (Kaveri)
23.6
13.2
5.9
AMD Radeon HD 7660G
42.8
19.2
8.7
5.8
Intel HD Graphics 4400
30.2
18.4
8.8
AMD Radeon HD 8610G
29
14.3
5.7
Intel HD Graphics 5300
26.7
10.7
3.9
3.4
AMD Radeon HD 7480D
43.7
17.6
7.6
5.1
Intel HD Graphics 4000
41.85n2
16.35n2
7n2
4.55n2
AMD Radeon R5 (Beema/Carrizo-L)
27.4
16.7
6.3
2.7
AMD Radeon R4 (Beema)
21.3
11.1
4.8
4.3
AMD Radeon R3 (Mullins/Beema)
17.8
10.7
5.1
Intel HD Graphics 4200
26.2
13.9
AMD Radeon HD 8450G
38.6
17.5
7.5
5.4
AMD Radeon HD 8400
21.4
10.9
4.9
3.4
AMD Radeon HD 8350G
36.7
15.5
AMD Radeon HD 8330
17.7
9
PosModel< PrevNext >X-Plane 10.25
low med. high ultra
Intel HD Graphics 400 (Braswell)
11.8
Intel HD Graphics (Haswell)
22.1
13
AMD Radeon HD 8280
15.8
7.8
Intel HD Graphics 3000
18.05n2
9.65n2
4.85n2
3.4n2
AMD Radeon HD 8210
11.2
5.5
Intel HD Graphics (Ivy Bridge)
15
7.6
Intel HD Graphics (Sandy Bridge)
11.8
6.9
3.4
2.5
Intel HD Graphics (Bay Trail)
12.8
6
(-) * Smaller values are better. / n123 Number of benchmarks for this median value / * Approximate position


Legend
5Stutters – This game is very likely to stutter and have poor frame rates. Based on all known benchmarks using the specified graphical settings, average frame rates are expected to fall below 25fps
May Stutter – This graphics card has not been explicitly tested on this game. Based on interpolated information from surrounding graphics cards of similar performance levels, stutters and poor frame rates are expected.
30Fluent – Based on all known benchmarks using the specified graphical settings, this game should run at or above 25fps
40Fluent – Based on all known benchmarks using the specified graphical settings, this game should run at or above 35fps
60Fluent – Based on all known benchmarks using the specified graphical settings, this game should run at or above 58fps
May Run Fluently – This graphics card has not been explicitly tested on this game. Based on interpolated information from surrounding graphics cards of similar performance levels, fluent frame rates are expected.
?Uncertain – This graphics card experienced unexpected performance issues during testing for this game. A slower card may be able to achieve better and more consistent frame rates than this particular GPU running the same benchmark scene.
Uncertain – This graphics card has not been explicitly tested on this game and no reliable interpolation can be made based on the performances of surrounding cards of the same class or family.
The value in the fields displays the average frame rate of all values in the database. Move your cursor over the value to see individual results.

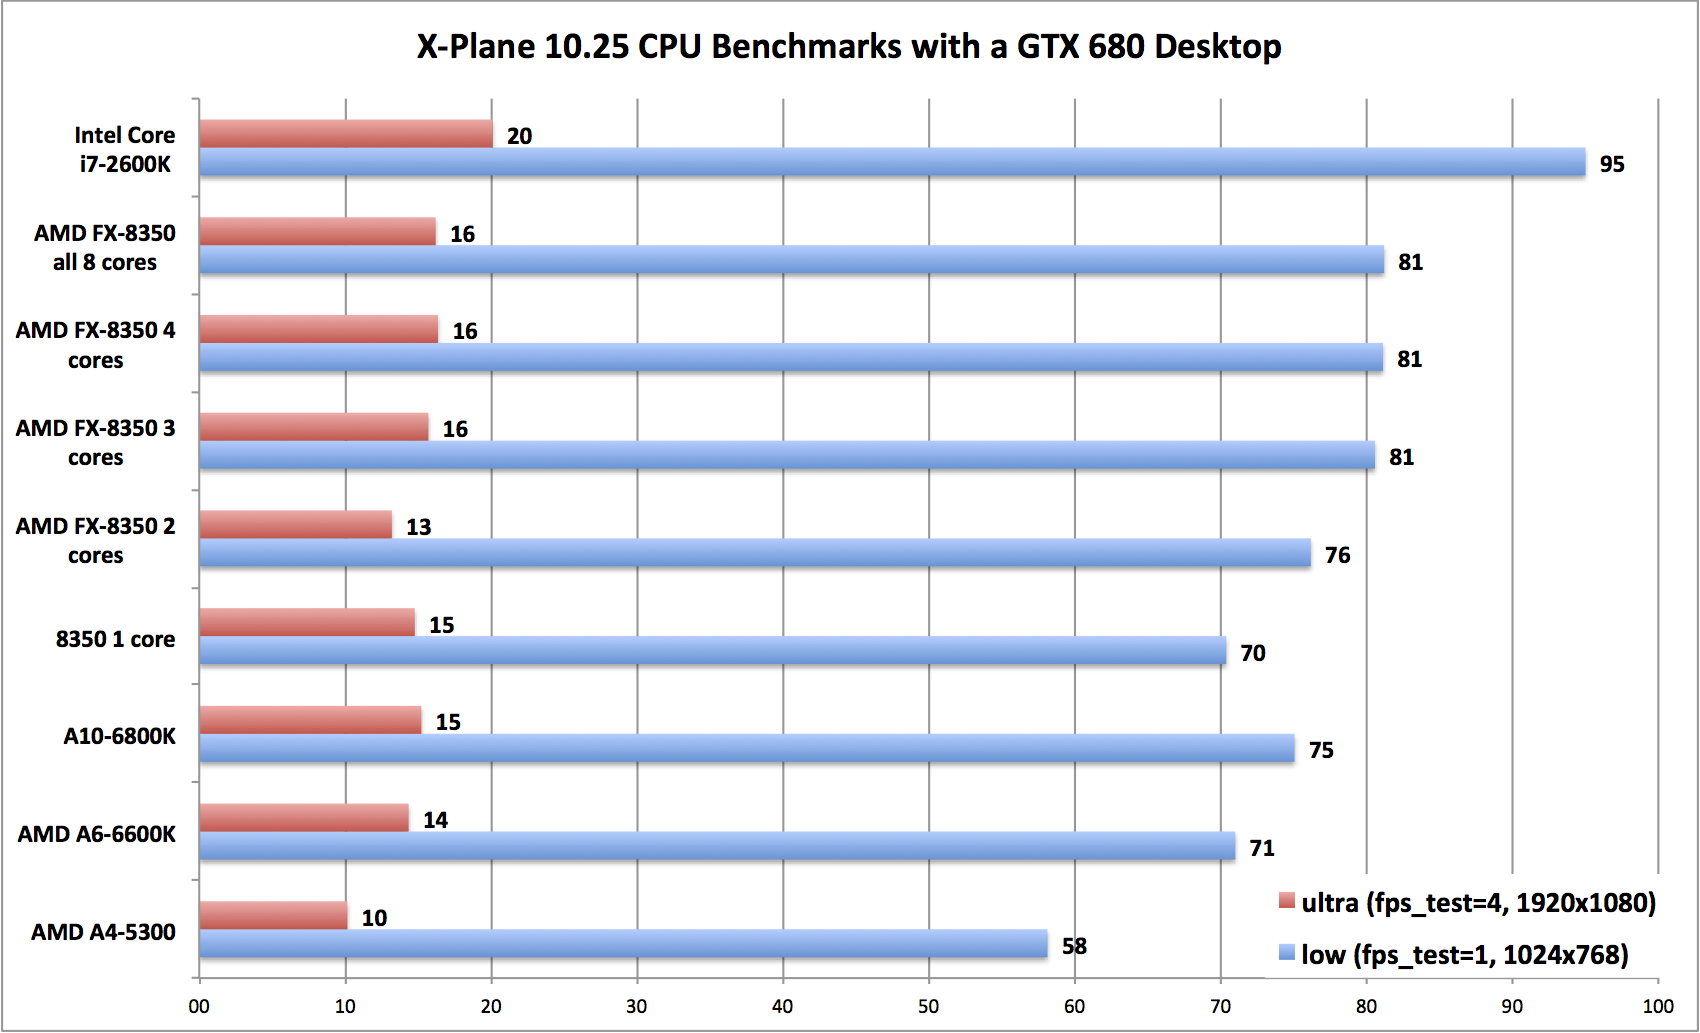
Processor Performance

As far as the impact of the CPU performance is concerned, our tests clearly indicate that the demanding simulations of the X-Plane 10 flight simulator benefit from a powerful processor. Stepping up from the inexpensive Trinity A4-5300 dual-core (1 module) to the Intel Core i7-2600K doubles the performance. AMD's high-end FX-8350 can't take advantage of its 8 cores, since performance doesn't increase significantly after 3 of the 8 cores are active. The result: the older Sandy Bridge Core i7-2600K with only 4 cores but better performance per MHz pulls ahead of AMD's flagship.

Benchmarks with NVidia GTX 680 and different CPUs (CPU dependency)
Read all 5 comments / answer
static version load dynamic
Loading Comments
Comment on this article
Please share our article, every link counts!
Klaus Hinum, 2014-02-15 (Update: 2016-10-10)