Notebook reviews with Intel HD Graphics 4200 graphics card
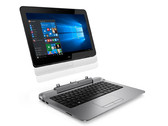
HP Pro x2 612 G1 Convertible Review
Business hybrid. HP's 12.5-inch detachable is designed primarily for business users. It is designed to be tablet and notebook in one device, and it actually works pretty well. However, you will not get the latest components. The device has been available since the summer of 2014 and has not been updated.
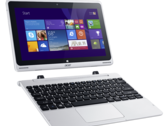
Intel Core i3-4012Y, HD Graphics 4200, 12.5", 1.9 kgAcer Aspire Switch 11 SW5-171-31U3 Notebook Review Update
Borderline case, part 2. Acer has combined an 11.6-inch Windows tablet with a keyboard dock, trying to win over buyers who do not want to decide between a tablet or a notebook. A passively cooled Core i3 processor provides the necessary computing power.
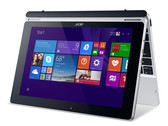
Intel Core i3-4012Y, HD Graphics 4200, 11.6", 1.6 kgAcer Aspire Switch 11 Pro 128GB HDD Dock Convertible Review
Shaky candidate. When a Windows tablet provides sufficient performance, ports, input devices and storage capacity, why would you need a conventional notebook or even a desktop PC? Acer brings the advantages of a laptop to a tablet via keyboard dock including hard drive.
Intel Core i5-4202Y, HD Graphics 4200, 11.6", 1.6 kgDell Venue 11 Pro 7130 Tablet Review Update
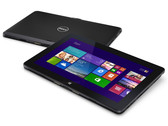
Stuck in a rut. The Venue 11 Pro was conceived as a tablet for use in the business environment. Dell outfitted the device with a Full HD IPS display and made it easy to access the tablet's inner workings. A quick SSD and a Core i5 processor do the device credit on paper too. But all told, can the tablet win us over?
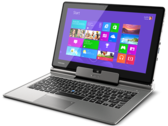
Intel Core i5-4300Y, HD Graphics 4200, 10.8", 810 gToshiba Portégé Z10t-A2111 Convertible Review Update
The business convertible. At a starting price of $1500, the Toshiba Z10t includes high-end hardware in a tablet form and competes directly against the Microsoft Surface models. This updated model includes mostly internal upgrades as we re-analyze the convertible's performance for the 2014 market.
Intel Core i7-4610Y, HD Graphics 4200, 11.6", 1.4 kgHP Split x2 13-m210eg: Intel Core i5-4210Y, 13.30", 2.2 kg
Review » HP Split x2 13-m210eg Convertible Review
Lenovo Miix 2 11: Intel Core i3-4012Y, 11.60", 1.4 kg
Review » Lenovo Miix 2 11 Convertible Review
Toshiba Satellite W30t-A-101: Intel Core i3-4020Y, 13.30", 2.1 kg
Review » Toshiba Satellite W30t-A-101 Convertible Review Update
HP Pro X2 410 G1: Intel Core i5-4202Y, 11.60", 1.6 kg
Review » HP Pro X2 410 G1 Convertible Review
Lenovo IdeaPad Yoga 11S (Haswell): Intel Core i5-4210Y, 11.60", 1.4 kg
Review » Review Update Lenovo IdeaPad Yoga 11S Convertible
Dell Venue 11 Pro: Intel Core i3-4020Y, 10.80", 1.5 kg
Review » Review Dell Venue 11 Pro Tablet
Dell XPS 11: Intel Core i5-4210Y, 11.60", 1.1 kg
Review » Review Dell XPS 11-9P33 Convertible
Sony Vaio Tap 11 SVT-1121G4E/B: Intel Core i5-4210Y, 11.60", 1.1 kg
Review » Review Sony Vaio Tap 11 SVT-1121G4E/B Tablet
HP Spectre 13-h205eg x2: Intel Core i5-4202Y, 13.30", 2 kg
Review » Review HP Spectre 13-h205eg x2 Convertible
Motion R12: Intel Core i7-4610Y, 12.50", 1.4 kg
External Review » Motion R12
Acer Aspire Switch 11 SW5-171-31U3: Intel Core i3-4012Y, 11.60", 1.6 kg
External Review » Acer Aspire Switch 11 SW5-171-31U3
Acer Aspire Switch 11 SW5-171-325N: Intel Core i3-4012Y, 11.60", 1.5 kg
External Review » Acer Aspire Switch 11 SW5-171-325N
Acer Aspire Switch 11 SW5-171-80KM: Intel Core i5-4202Y, 11.60", 1.6 kg
External Review » Acer Aspire Switch 11 SW5-171-80KM
Lenovo IdeaPad Yoga 11S-59393621: Intel Core i3-4020Y, 11.60", 1.4 kg
External Review » Lenovo IdeaPad Yoga 11S-59393621
Acer Aspire Switch 11 SW5-171-39LB: Intel Core i3-4012Y, 11.60", 1.5 kg
External Review » Acer Aspire Switch 11 SW5-171-39LB
HP Pro X2 612 G1: Intel Core i3-4012Y, 12.50", 1.9 kg
External Review » HP Pro X2 612 G1
Dell Venue 11 Pro 7000: Intel Core i3-4020Y, 10.80", 0.7 kg
External Review » Dell Venue 11 Pro 7000
Toshiba Portege Z10t-A X0432: Intel Core i5-4210Y, 11.60", 1.4 kg
External Review » Toshiba Portege Z10t-A X0432
HP Split 13-m200er x2: Intel Core i3-4020Y, 13.30", 1.1 kg
External Review » HP Split 13-m200er x2
HP Pro X2 410 G1: Intel Core i5-4202Y, 11.60", 1.6 kg
External Review » HP Pro X2 410 G1
HP Split 13-m100er x2: Intel Core i3-4010Y, 13.30", 2.2 kg
External Review » HP Split 13-m100er x2
Lenovo Miix 2 11: Intel Core i3-4012Y, 11.60", 0.8 kg
External Review » Lenovo Miix 2 11
Toshiba Portege Z10t-A2111: Intel Core i7-4610Y, 11.60", 1.4 kg
External Review » Toshiba Portege Z10t-A2111
Panasonic ToughPad FZ-M1: Intel Core i5-4302Y, 7.00", 0.5 kg
External Review » Panasonic ToughPad FZ-M1
Sony VAIO SVT1122X9R: Intel Core i5-4210Y, 11.60", 0.8 kg
External Review » Sony VAIO SVT1122X9R
Sony Vaio Tap 11 SV-T1121A4E: Intel Core i3-4020Y, 11.60", 0.8 kg
External Review » Sony Vaio Tap 11 SV-T1121A4E
HP Spectre 13t-h200 x2: Intel Core i5-4202Y, 13.30", 2 kg
External Review » HP Spectre 13t-h200 x2
HP Spectre 13-h211nr x2: Intel Core i5-4202Y, 13.30", 2 kg
External Review » HP Spectre 13-h211nr x2
HP Spectre 13-h205eg x2: Intel Core i5-4202Y, 13.30", 2 kg
External Review » HP Spectre 13-h205eg x2
Toshiba Satellite W30t-A-101: Intel Core i3-4020Y, 13.30", 1 kg
External Review » Toshiba Satellite W30t-A-101
Dell Venue 11 Pro: Intel Core i3-4020Y, 10.80", 1.5 kg
External Review » Dell Venue 11 Pro
Dell XPS 11: Intel Core i5-4210Y, 11.60", 1.1 kg
External Review » Dell XPS 11
HP Split 13-M170EF x2: Intel Core i3-4010Y, 13.30", 2.2 kg
External Review » HP Split 13-M170EF x2
Toshiba Satellite W30t-A-101: Intel Core i3-4020Y, 13.30", 2.1 kg
External Review » Toshiba Satellite W30t