Notebook reviews with AMD Radeon 610M graphics card
HP OmniBook 3 17 Laptop Review: A bargain or smelly leftovers depending on how you see it
Unfortunately, it happens quite often that old CPUs are refreshed as new models. What AMD allows itself with the Ryzen 5 40 Mendocino chip, however, surpasses almost everything as our test of the HP OmniBook 3 shows. Is the performance sufficient for modern applications? Let's find out.
AMD Ryzen 5 40, Radeon 610M, 17.3", 2 kgHP 255 G10 with 7120U review: Small budget, low performance
The HP 255 G10 promises a lot of everyday usability for little money as an affordable office notebook. In the test, we show why the Athlon Silver 7120U, the dark TN display and the features clearly slow down the budget laptop despite its good maintainability.
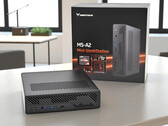
AMD Athlon Silver 7120U, Radeon 610M, 15.6", 1.6 kgMinisforum MS-A2 review: Compact AMD mini PC with workstation ambitions and GPU upgrade option
The Minisforum MS-A2 is a small-form-factor mini PC equipped with the AMD Ryzen 9 9955HX, delivering strong performance for demanding workloads such as video editing, 3D rendering, and multitasking. It supports multiple SSDs and includes a full PCIe x16 slot for adding dedicated graphics cards, making it suitable for users who need a compact yet upgradeable workstation.
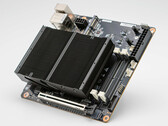
AMD Ryzen 9 9955HX, Radeon 610M, 1.5 kgMinisforum BD795i SE review: The Mini-ITX desktop mainboard with an AMD Ryzen 9 CPU as a DIY solution for gaming mini PCs
The Minisforum BD795i SE promises high performance and is ideal for building compact Mini-ITX PCs. With its factory-installed AMD Ryzen 9 7945HX, it is aimed at demanding users. We tested its performance during intensive tasks and analyzed its gaming performance with an Nvidia GeForce RTX 4090.
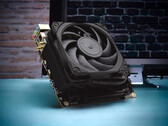
AMD Ryzen 9 7945HX, Radeon 610MMinisforum BD790i review: Mini-ITX mainboard with an AMD Ryzen 9 7945HX and PCIe 5.0 as a basis for small gaming PCs
The Minisforum BD790i mainboard promises a great deal of performance and, as a result, could be an excellent basis for compact Mini-ITX PCs. We took a look at the mainboard, which is equipped with an AMD Ryzen 9 7945HX ex works and is aimed specifically at users with high demands. In our test, we analyzed the system's performance during intensive tasks and, in combination with an Nvidia GeForce RTX 4090, we also took a look at its gaming performance.
AMD Ryzen 9 7945HX, Radeon 610MMinisforum BD770i: AMD Ryzen 7 7745HX
Review » Minisforum BD770i review: The mini-ITX motherboard with AMD Ryzen 7 7745HX as the basis for small gaming PCs
Acer Aspire 3 A315-24P-R77Z: AMD Ryzen 5 7520U, 15.60", 1.8 kg
Review » Acer Aspire 3 Laptop Review: An affordable Mendocino offering with excellent battery life and a sub-par screen
Asus ROG Strix G17 G713PI: AMD Ryzen 9 7945HX
Review » AMD Ryzen 9 7945HX Analysis - Zen4 Dragon Range is faster and more efficient than Intel Raptor Lake-HX
HP Omnibook 3 14-hy0000: AMD Ryzen 3 30, 14.00", 1.4 kg
External Review » HP Omnibook 3 14-hy0000 - Reviews and Specs
Dell Pro 15 Essential: AMD Ryzen 5 7520U, 15.60", 1.9 kg
External Review » Dell Pro 15 Essential
HP 17-cp2000ng: AMD Ryzen 3 7320U, 17.30", 2.2 kg
External Review » HP 17-cp2000ng
Dell Inspiron 15 3535: AMD Ryzen 5 7520U, 15.60", 1.7 kg
External Review » Dell Inspiron 15 3535
Acer Aspire Go 15 AG15-21P: AMD Ryzen 5 7520U, 15.60", 1.8 kg
External Review » Acer Aspire Go 15 AG15-21P
Lenovo IdeaPad Slim 1 15AMN7, R5 7520: AMD Ryzen 5 7520U, 15.60", 1.6 kg
External Review » Lenovo IdeaPad Slim 1 15AMN7, R5 7520
Acer Aspire Go 14 AG14-21P: AMD Ryzen 3 7320U, 14.00", 1.5 kg
External Review » Acer Aspire Go 14 AG14-21P
Asus Vivobook Go 14 E1404: AMD Ryzen 3 7320U, 14.00", 1.4 kg
External Review » Asus Vivobook Go 14 E1404
Acer Chromebook Plus 514 CB514-3H: AMD Ryzen 3 7320C, 14.00", 1.5 kg
External Review » Acer Chromebook Plus 514 CB514-3H
HP 14-em0750nd: AMD Ryzen 5 7520U, 14.00", 1.4 kg
External Review » HP 14-em0750nd
Acer Aspire 3 A314-23P-R3QA: AMD Ryzen 5 7520U, 14.00", 1.4 kg
External Review » Acer Aspire 3 A314-23P-R3QA
Asus Chromebook CM34 Flip CM3401: AMD Ryzen 3 7320C, 14.00", 1.9 kg
External Review » Asus Chromebook CM34 Flip CM3401
Asus VivoBook Go 14 E1404FA: AMD Ryzen 5 7520U, 14.00", 1.3 kg
External Review » Asus VivoBook Go 14 E1404FA
Acer Aspire 3 A314-23P: AMD Ryzen 3 7320U, 14.00", 1.4 kg
External Review » Acer Aspire 3 A314-23P
Asus VivoBook Go 15 E1504FA: AMD Ryzen 5 7520U, 15.60", 1.6 kg
External Review » Asus VivoBook Go 15 E1504FA
HP 15-fc0071ns: AMD Ryzen 5 7520U, 15.60", 1.6 kg
External Review » HP 15-fc0071ns
Lenovo V15 G4 AMN: AMD Athlon Gold 7220U, 15.60", 1.7 kg
External Review » Lenovo V15 G4 AMN
Asus Vivobook Go 15 E1504F: AMD Ryzen 5 7520U, 15.60", 1.6 kg
External Review » Asus Vivobook Go 15 E1504F
HP 14-em0000: AMD Ryzen 3 7320U, 14.00", 1.4 kg
External Review » HP 14-em0000
Acer Aspire 3 A315-24P-R7VH: AMD Ryzen 3 7320U, 15.60", 1.8 kg
External Review » Acer Aspire 3 A315-24P-R7VH
Lenovo Ideapad 1 15AMN7, R3 7320U: AMD Ryzen 3 7320U, 15.60", 1.6 kg
External Review » Lenovo Ideapad 1 15AMN7, R3 7320U
Lenovo IdeaPad 1 15AMN7: AMD Ryzen 5 7520U, 15.60", 1.6 kg
External Review » Lenovo IdeaPad 1 15AMN7
Asus Vivobook Go 14 2023, R5 7520U: AMD Ryzen 5 7520U, 14.00", 1.4 kg
External Review » Asus Vivobook Go 14 2023, R5 7520U
Acer Aspire 3 A315-24P-R75B: AMD Ryzen 3 7320U, 15.60", 1.8 kg
External Review » Acer Aspire 3 A315-24P-R75B
Lenovo IdeaPad Slim 1 14AMN7, R3 7320U: AMD Ryzen 3 7320U, 14.00", 1.4 kg
External Review » Lenovo IdeaPad Slim 1 14AMN7, R3 7320U
Minisforum BD795i SE: AMD Ryzen 9 7945HX
» AMD Ryzen 9-powered Minisforum 795S7 mini PC with RTX 4060 gets big price cut on Amazon
Asus ROG Strix G17 G713PI: AMD Ryzen 9 7945HX
» Asus ROG Strix G17 becomes super value as RTX 4070 and Ryzen 9 7940HX SKU records $450 price cut