Notebook reviews with Intel UHD Graphics 615 graphics card
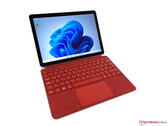
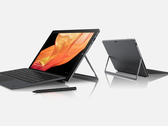
Microsoft Surface Go 3 in review - The compact convertible now with Windows 11
The developers at Microsoft apparently had their hands full with the new Surface Pro 8 and Studio, because the compact Surface Go 3 only gets a mini update with a different processor and the switch to Windows 11. We took a look at how this works in practice.
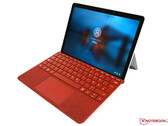
Intel Core i3-10100Y, UHD Graphics 615, 10.5", 783 gMicrosoft Surface Go 2 Review: Compact Convertible gets a bigger screen
Microsoft equips its compact convertible with a slightly larger screen and more pixels, but keeps the regular x86 processor compared to the Surface Pro X. But is the Surface Go 2 still competitive, and does the new screen affect the battery runtime?
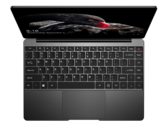
Intel Core m3-8100Y, UHD Graphics 615, 10.5", 790 gChuwi AeroBook Pro Laptop Review: Core m3 is Showing its Age
The AeroBook Pro is the 2020 refresh designed to replace the 2019 AeroBook. Despite what the name may suggest, however, both performance and the chassis remain almost exactly the same for no tangible year-over-year advantages.
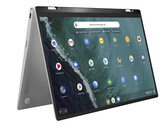
Intel Core m3-8100Y, UHD Graphics 615, 13.3", 1.3 kgAsus Chromebook Flip C434TA in review: Silent convertible offers good endurance
The Asus Chromebook Flip features a Core m3-8100Y processor, an IPS touchscreen display and good battery life. The integration of the Google Play Store allows the use of countless Android apps.
Intel Core m3-8100Y, UHD Graphics 615, 14", 1.5 kgChuwi UBook Pro Tablet Review: The Microsoft Surface Pro Clone
The UBook Pro offers high-end looks with low-end performance for a mid-range price. If you can get past the slow Core m3 processor, then you'll find the super-bright 12.3-inch display and three USB ports quite useful when compared to the dimmer and pricier Surface Pro.
Intel Core m3-8100Y, UHD Graphics 615, 12.3", 780 gPorsche Design Ultra One: Intel Core i7-8500Y, 15.60", 1.5 kg
Review » Porsche Design Ultra One laptop short review: Noisy SSD antagonizes the expensive laptop
Acer Swift 7 SF714-52T-76MR: Intel Core i7-8500Y, 14.00", 0.9 kg
Review » Acer Swift 7 SF714-52T Review: Slim and light subnotebook for a fat wallet
HP ProBook x360 11 G4: Intel Core m3-8100Y, 11.60", 1.4 kg
Review » HP ProBook x360 11 G4 EE laptop review: Robust convertible for schools
VAIO A12-92993: Intel Core i7-8500Y, 12.50", 1.1 kg
Review » VAIO A12 (Core i7-8500Y, 16 GB RAM, 512 GB SSD, FHD) Convertible Review
HP Spectre Folio 13t-ak000: Intel Core i7-8500Y, 13.30", 1.5 kg
Review » HP Spectre Folio 13 (i5-8500Y) Convertible Review
Microsoft Surface Go MHN-00003: Intel Pentium Gold 4415Y, 10.00", 0.5 kg
Review » Microsoft Surface Go (Pentium, 64GB eMMC) Tablet Review
Microsoft Surface Go 3 6500Y: Intel Pentium Gold 6500Y, 10.50", 0.8 kg
External Review » Microsoft Surface Go 3 6500Y
Asus Chromebook Flip Z3400FT-H50130: Intel Core m3-8100Y, 14.00", 1.3 kg
External Review » Asus Chromebook Flip Z3400FT-H50130
Microsoft Surface Go 3 Core i3: Intel Core i3-10100Y, 10.50", 0.8 kg
External Review » Microsoft Surface Go 3 Core i3
Chuwi Minibook, m3-8100Y: Intel Core m3-8100Y, 8.00", 0.7 kg
External Review » Chuwi Minibook, m3-8100Y
Asus Chromebook Flip C433TA-AS384T: Intel Core m3-8100Y, 14.00", 1.5 kg
External Review » Asus Chromebook Flip C433TA-AS384T
One Netbook OneGx1: Intel Core i5-10210Y, 7.00", 0.6 kg
External Review » One Netbook OneGx1
Xiaomi RedmiBook Air 13 i5-10210Y: Intel Core i5-10210Y, 13.30", 1.1 kg
External Review » Xiaomi RedmiBook Air 13 i5-10210Y
Asus Chromebook Flip Z3400FT-AJ0111: Intel Core m3-8100Y, 14.00", 1.5 kg
External Review » Asus Chromebook Flip Z3400FT-AJ0111
Microsoft Surface Go 2 LTE: Intel Core m3-8100Y, 10.50", 0.6 kg
External Review » Microsoft Surface Go 2 LTE
Asus Chromebook Flip C434TA-E10008: Intel Core i5-8200Y, 14.00", 1.5 kg
External Review » Asus Chromebook Flip C434TA-E10008
Chuwi AeroBook Pro: Intel Core m3-8100Y, 13.30", 1.3 kg
External Review » Chuwi AeroBook Pro
Microsoft Surface Go 2, m3-8100Y: Intel Core m3-8100Y, 10.50", 0.8 kg
External Review » Microsoft Surface Go 2, m3-8100Y
Microsoft Surface Go 2 Pentium Gold 4425Y: Intel Pentium Gold 4425Y, 10.50", 0.5 kg
External Review » Microsoft Surface Go 2 Pentium Gold 4425Y
Acer Swift 7 SF714-52T-77LW: Intel Core i7-8500Y, 14.00", 0.9 kg
External Review » Acer Swift 7 SF714-52T-77LW
Chuwi UBook Pro: Intel Core m3-8100Y, 12.30", 0.8 kg
External Review » Chuwi UBook Pro
Acer Swift 7 SF714-52T-7537: Intel Core i7-8500Y, 14.00", 1 kg
External Review » Acer Swift 7 SF714-52T-7537
Acer Swift 7 SF714-52T-741M: Intel Core i7-8500Y, 14.00", 0.9 kg
External Review » Acer Swift 7 SF714-52T-741M
Asus Chromebook Flip C433TA-AJ0005: Intel Core m3-8100Y, 14.00", 1.5 kg
External Review » Asus Chromebook Flip C433TA-AJ0005
One Mix 3S Yoga: Intel Core m3-8100Y, 8.40", 0.7 kg
External Review » One Mix 3S Yoga
Acer Swift 7 SF714-52T-76MR: Intel Core i7-8500Y, 14.00", 0.9 kg
External Review » Acer Swift 7 SF714-52T-76MR
Google Pixelbook Go i5: Intel Core i5-8200Y, 13.30", 1.1 kg
External Review » Google Pixelbook Go i5
Asus Chromebook C425TA-DH384: Intel Core m3-8100Y, 14.00", 1.3 kg
External Review » Asus Chromebook C425TA-DH384
Acer Swift 7 SF714-52T-75R6: Intel Core i7-8500Y, 14.00", 0.9 kg
External Review » Acer Swift 7 SF714-52T-75R6
Acer Swift 7 SF714-52T-763C: Intel Core i7-8500Y, 14.00", 0.9 kg
External Review » Acer Swift 7 SF714-52T-763C
Acer Swift 7 SF714-52T-51RC: Intel Core i5-8200Y, 14.00", 1 kg
External Review » Acer Swift 7 SF714-52T-51RC
Asus Chromebook Flip C434TA-E10013: Intel Core m3-8100Y, 14.00", 1.5 kg
External Review » Asus Chromebook Flip C434TA-E10013
Acer Swift 7 SF714-52T-75G4: Intel Core i7-8500Y, 14.00", 0.9 kg
External Review » Acer Swift 7 SF714-52T-75G4
VAIO A12-92993: Intel Core i7-8500Y, 12.50", 1.1 kg
External Review » VAIO A12-92993
HP Spectre Folio 13-AK0802no: Intel Core i5-8200Y, 13.30", 1.5 kg
External Review » HP Spectre Folio 13-AK0802no
Asus Chromebook Flip C434TA-DSM4T: Intel Core m3-8100Y, 14.00", 1.5 kg
External Review » Asus Chromebook Flip C434TA-DSM4T
HP Spectre Folio 13-ak0001na: Intel Core i7-8500Y, 13.30", 1.5 kg
External Review » HP Spectre Folio 13-ak0001na
HP Spectre Folio 13-ak0950nd: Intel Core i7-8500Y, 13.30", 1.5 kg
External Review » HP Spectre Folio 13-ak0950nd
Google Pixel Slate, Core m3: Intel Core m3-8100Y, 12.30", 0.7 kg
External Review » Google Pixel Slate, Core m3
Google Pixel Slate, Core i5: Intel Core i5-8200Y, 12.30", 0.7 kg
External Review » Google Pixel Slate, Core i5
Acer Swift 7 SF714-52T: Intel Core i7-8500Y, 14.00", 1 kg
External Review » Acer Swift 7 SF714-52T
HP Spectre Folio 13-ak0000ns: Intel Core i7-8500Y, 13.30", 1.5 kg
External Review » HP Spectre Folio 13-ak0000ns
Asus Chromebook Flip C434TA: Intel Core i5-8200Y, 14.00", 1.5 kg
External Review » Asus Chromebook Flip C434TA
HP Spectre Folio 13t-ak000: Intel Core i7-8500Y, 13.30", 1.5 kg
External Review » HP Spectre Folio 13t-ak000
HP Spectre Folio 13-ak0001nf : Intel Core i7-8500Y, 13.30", 1.5 kg
External Review » HP Spectre Folio 13-ak0001nf
HP Spectre Folio 13-ak0020ng: Intel Core i7-8500Y, 13.30", 1.5 kg
External Review » HP Spectre Folio 13-ak0020ng
HP Spectre Folio 13-ak0314ng: Intel Core i7-8500Y, 13.30", 1.5 kg
External Review » HP Spectre Folio 13-ak0314ng
HP Chromebook x2 12-f002nf : Intel Core m3-7Y30, 12.30", 1.5 kg
External Review » HP Chromebook x2 12-f002nf
HP Spectre Folio 13-AK0801no: Intel Core i7-8500Y, 13.30", 1.5 kg
External Review » HP Spectre Folio 13-AK0801no
HP Spectre Folio 13-AK0801en: Intel Core i7-8500Y, 13.30", 1.5 kg
External Review » HP Spectre Folio 13-AK0801en
Google Pixel Slate, i7: Intel Core i7-8500Y, 12.30", 0.7 kg
External Review » Google Pixel Slate, i7
HP Spectre Folio 13-ak0015nr: Intel Core i7-8500Y, 13.30", 1.5 kg
External Review » HP Spectre Folio 13-ak0015nr
Microsoft Surface Go MHN-00003: Intel Pentium Gold 4415Y, 10.00", 0.5 kg
External Review » Microsoft Surface Go MHN-00003
Microsoft Surface Go 2 Pentium Gold 4425Y: Intel Pentium Gold 4425Y, 10.50", 0.5 kg
Article » Revisited: MS Surface Go 2 now going for as low as €266
Microsoft Surface Go 2, m3-8100Y: Intel Core m3-8100Y, 10.50", 0.8 kg
» Microsofts Surface Go 2 is a compact convertible with LTE
Chuwi AeroBook Pro: Intel Core m3-8100Y, 13.30", 1.3 kg
» Caught red-handed: Chuwi fakes laptop product images to look thinner and sexier than they really are