Chuwi AeroBook Pro Laptop Review: Core m3 is Showing its Age
The 2020 Chuwi AeroBook Pro succeeds the original 2019 AeroBook by replacing the Core m3-6Y30 Skylake processor with the newer Core m3-8100Y Amber Lake-Y processor. The chassis is otherwise identical between the AeroBook and AeroBook Pro. We recommend checking out our existing review on the 2019 AeroBook since our comments on the chassis, keyboard, clickpad, ports, and other physical features all apply here on the 2020 model. This review will focus on any performance differences between the two systems.
Direct competitors to the AeroBook Pro include other budget subnotebooks like the Jumper EZbook, Asus VivoBook, or Lenovo IdeaPad S530. However, Chuwi likes to advertise the notebook as a cheap alternative to more well-known flagships like the Apple MacBook Air or Dell XPS 13.
Chuwi says it will give more details on the availability of the AeroBook Pro soon. AliExpress is currently holding a week-long sale on other Chuwi devices here.
More Chuwi reviews:
Rating | Date | Model | Weight | Height | Size | Resolution | Price |
|---|---|---|---|---|---|---|---|
| 77.7 % v7 (old) | 06 / 2020 | Chuwi AeroBook Pro m3-8100Y, UHD Graphics 615 | 1.3 kg | 15.2 mm | 13.30" | 1920x1080 | |
| 88 % v7 (old) | 04 / 2020 | Apple MacBook Air 2020 i5 i5-1030NG7, Iris Plus Graphics G7 (Ice Lake 64 EU) | 1.3 kg | 16.1 mm | 13.30" | 2560x1600 | |
| 88.8 % v7 (old) | 03 / 2020 | Dell XPS 13 9300 i5 FHD i5-1035G1, UHD Graphics G1 (Ice Lake 32 EU) | 1.2 kg | 14.8 mm | 13.40" | 1920x1200 | |
| 84.6 % v6 (old) | 01 / 2018 | Lenovo Yoga 720-12IKB i5-7200U, HD Graphics 620 | 1.2 kg | 15.8 mm | 12.50" | 1920x1080 | |
| 67.7 % v7 (old) | 04 / 2020 | Jumper EZbook X3 Celeron N3350, HD Graphics 500 | 1.3 kg | 18 mm | 13.30" | 1920x1080 | |
| 86.6 % v6 (old) | 03 / 2019 | Lenovo Ideapad S530-13IWL i5-8265U, UHD Graphics 620 | 1.2 kg | 14.8 mm | 13.30" | 1920x1080 |
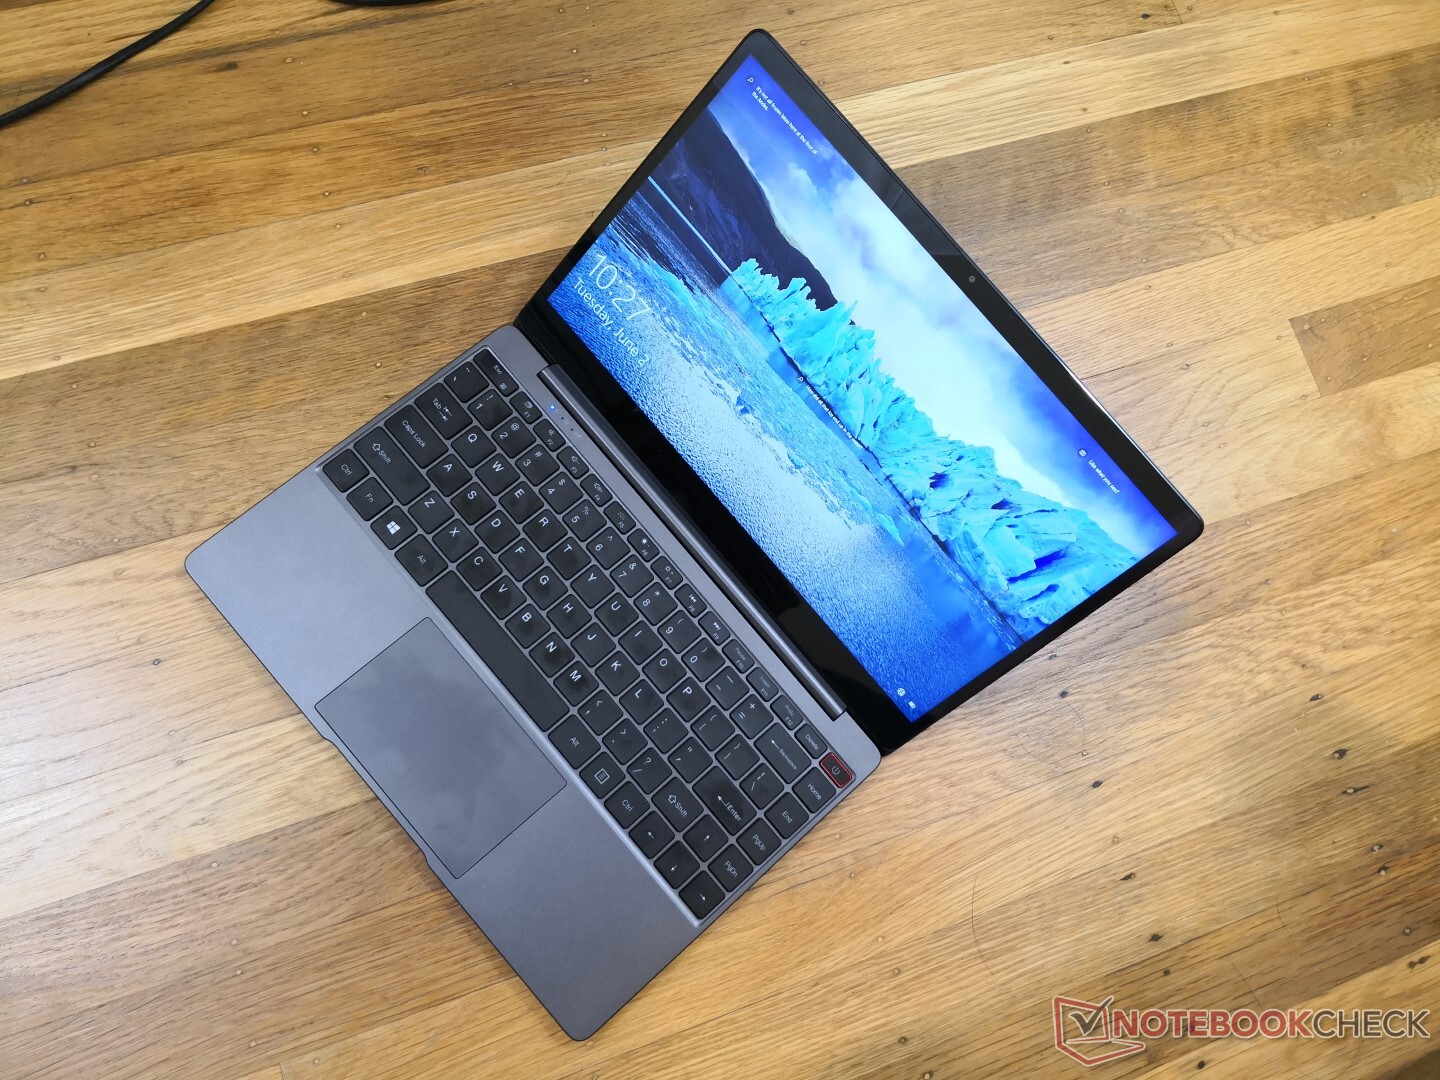
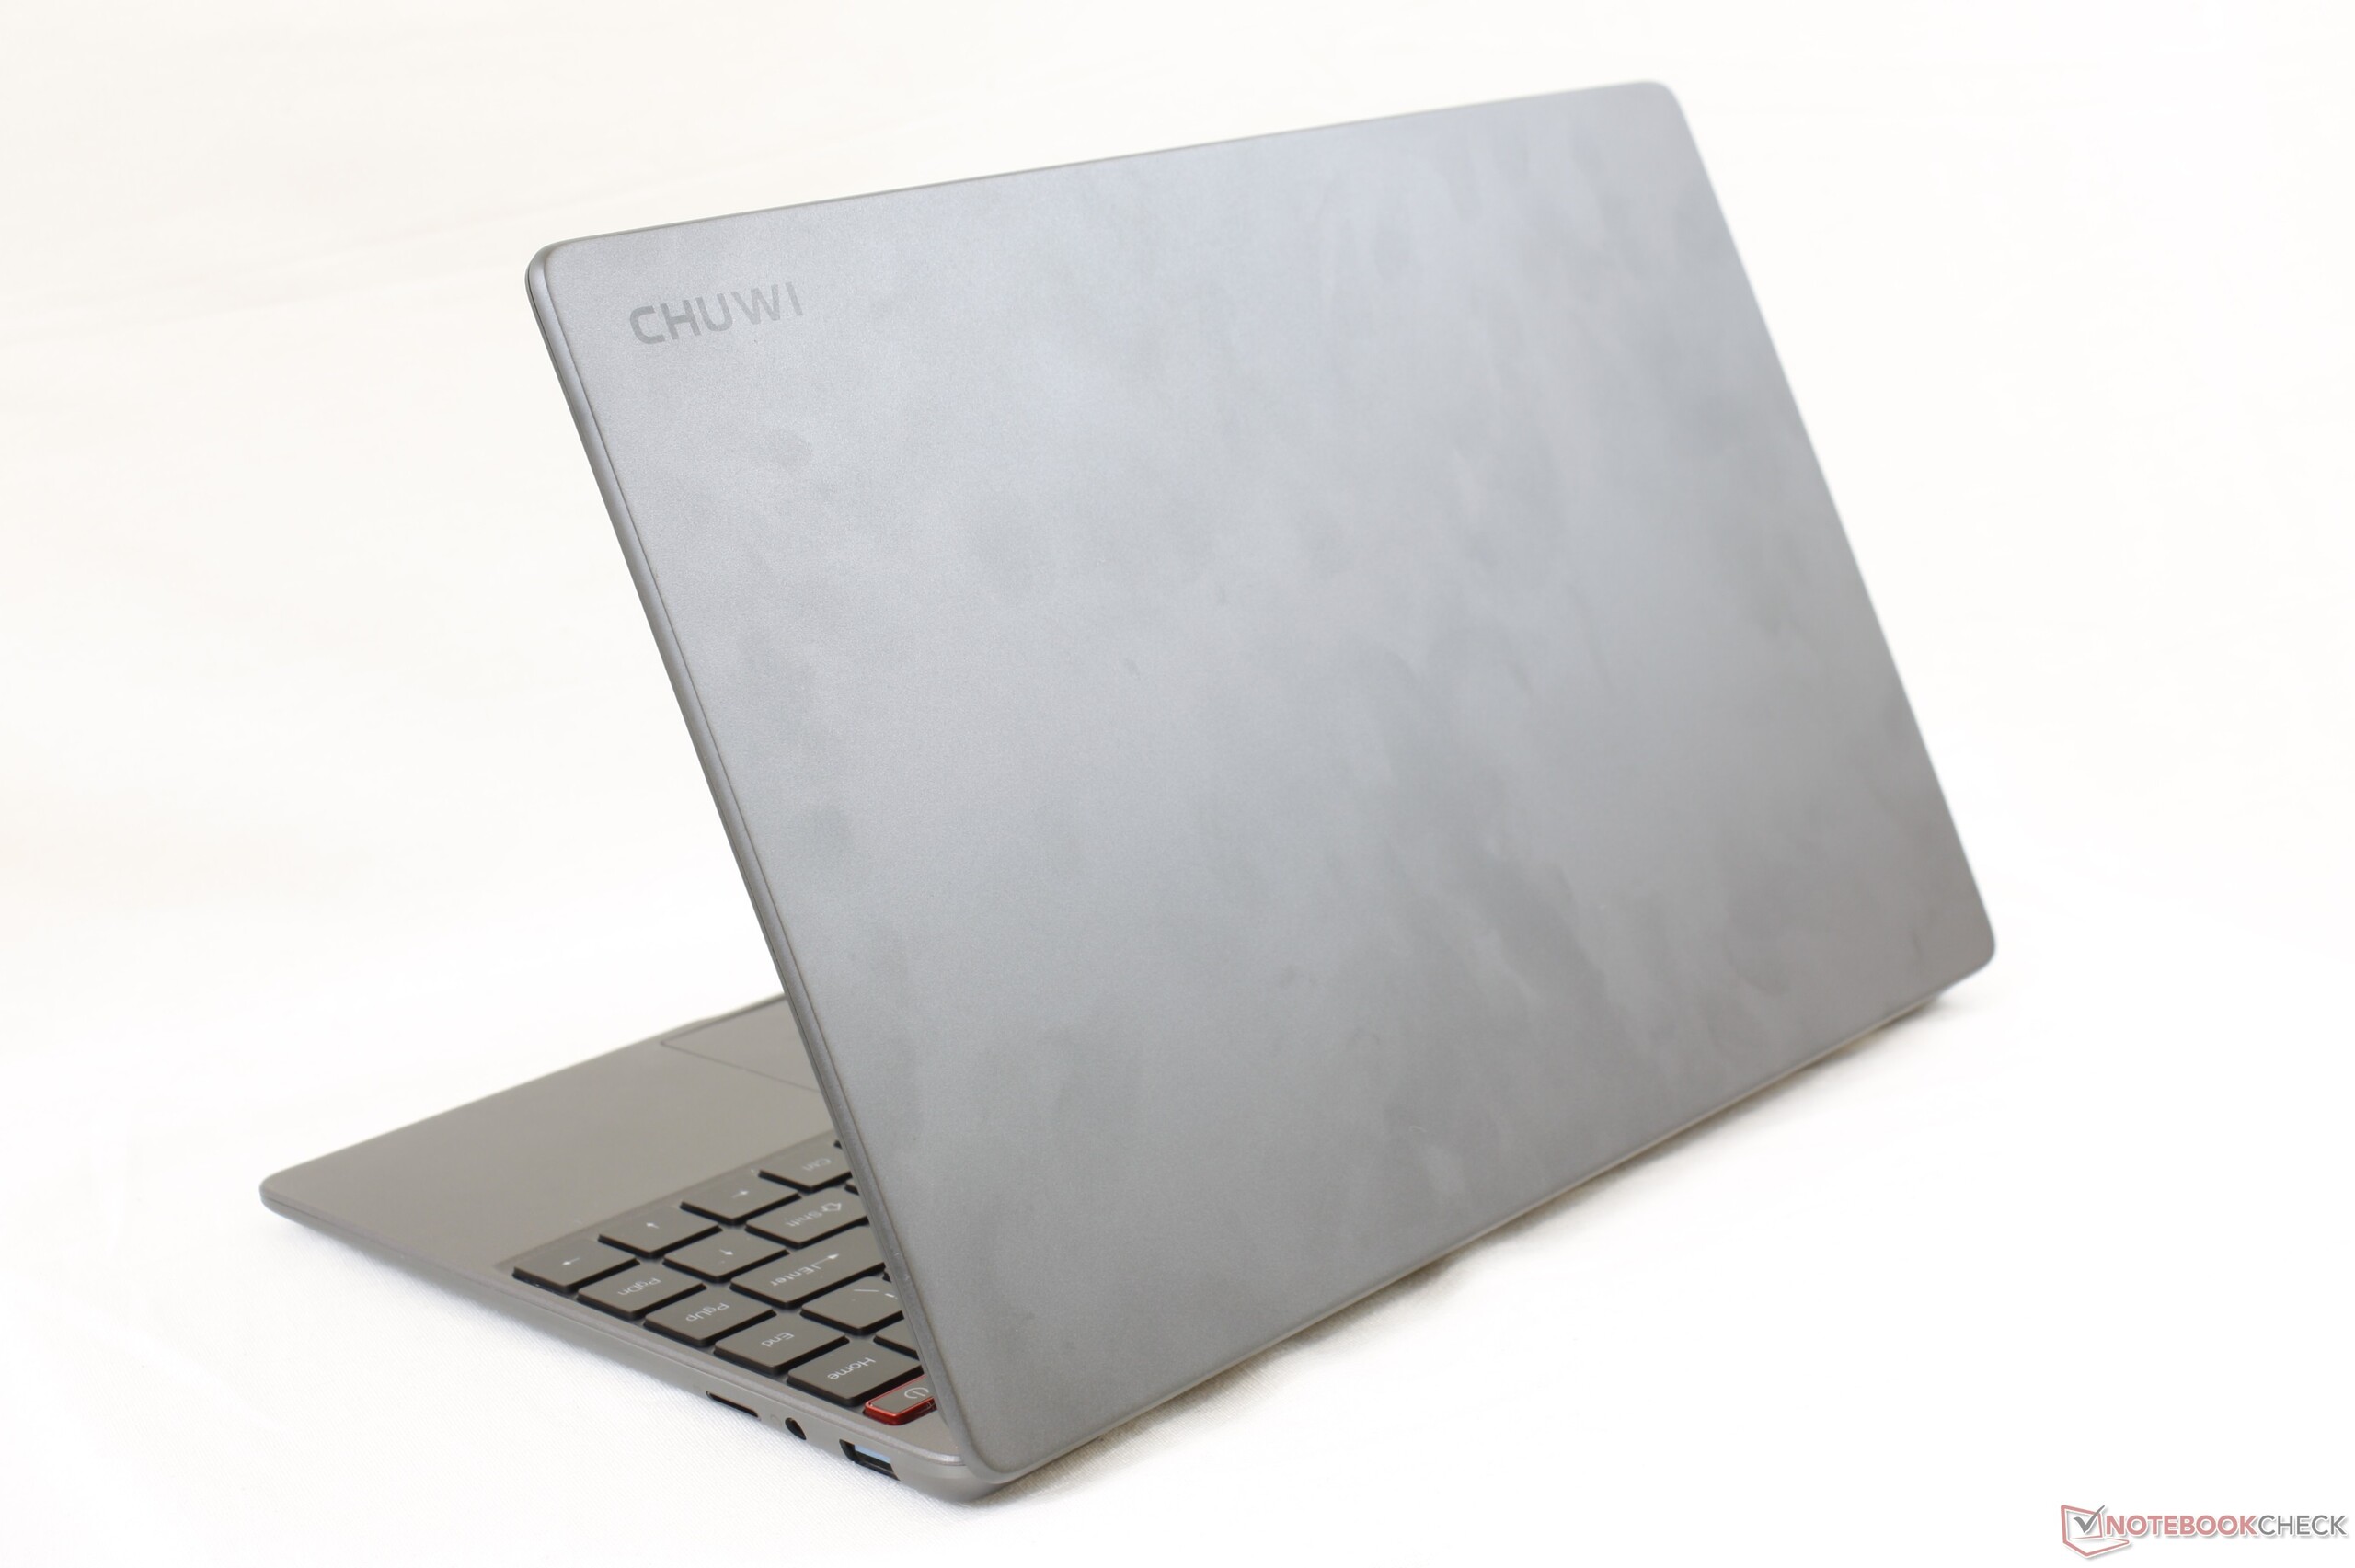
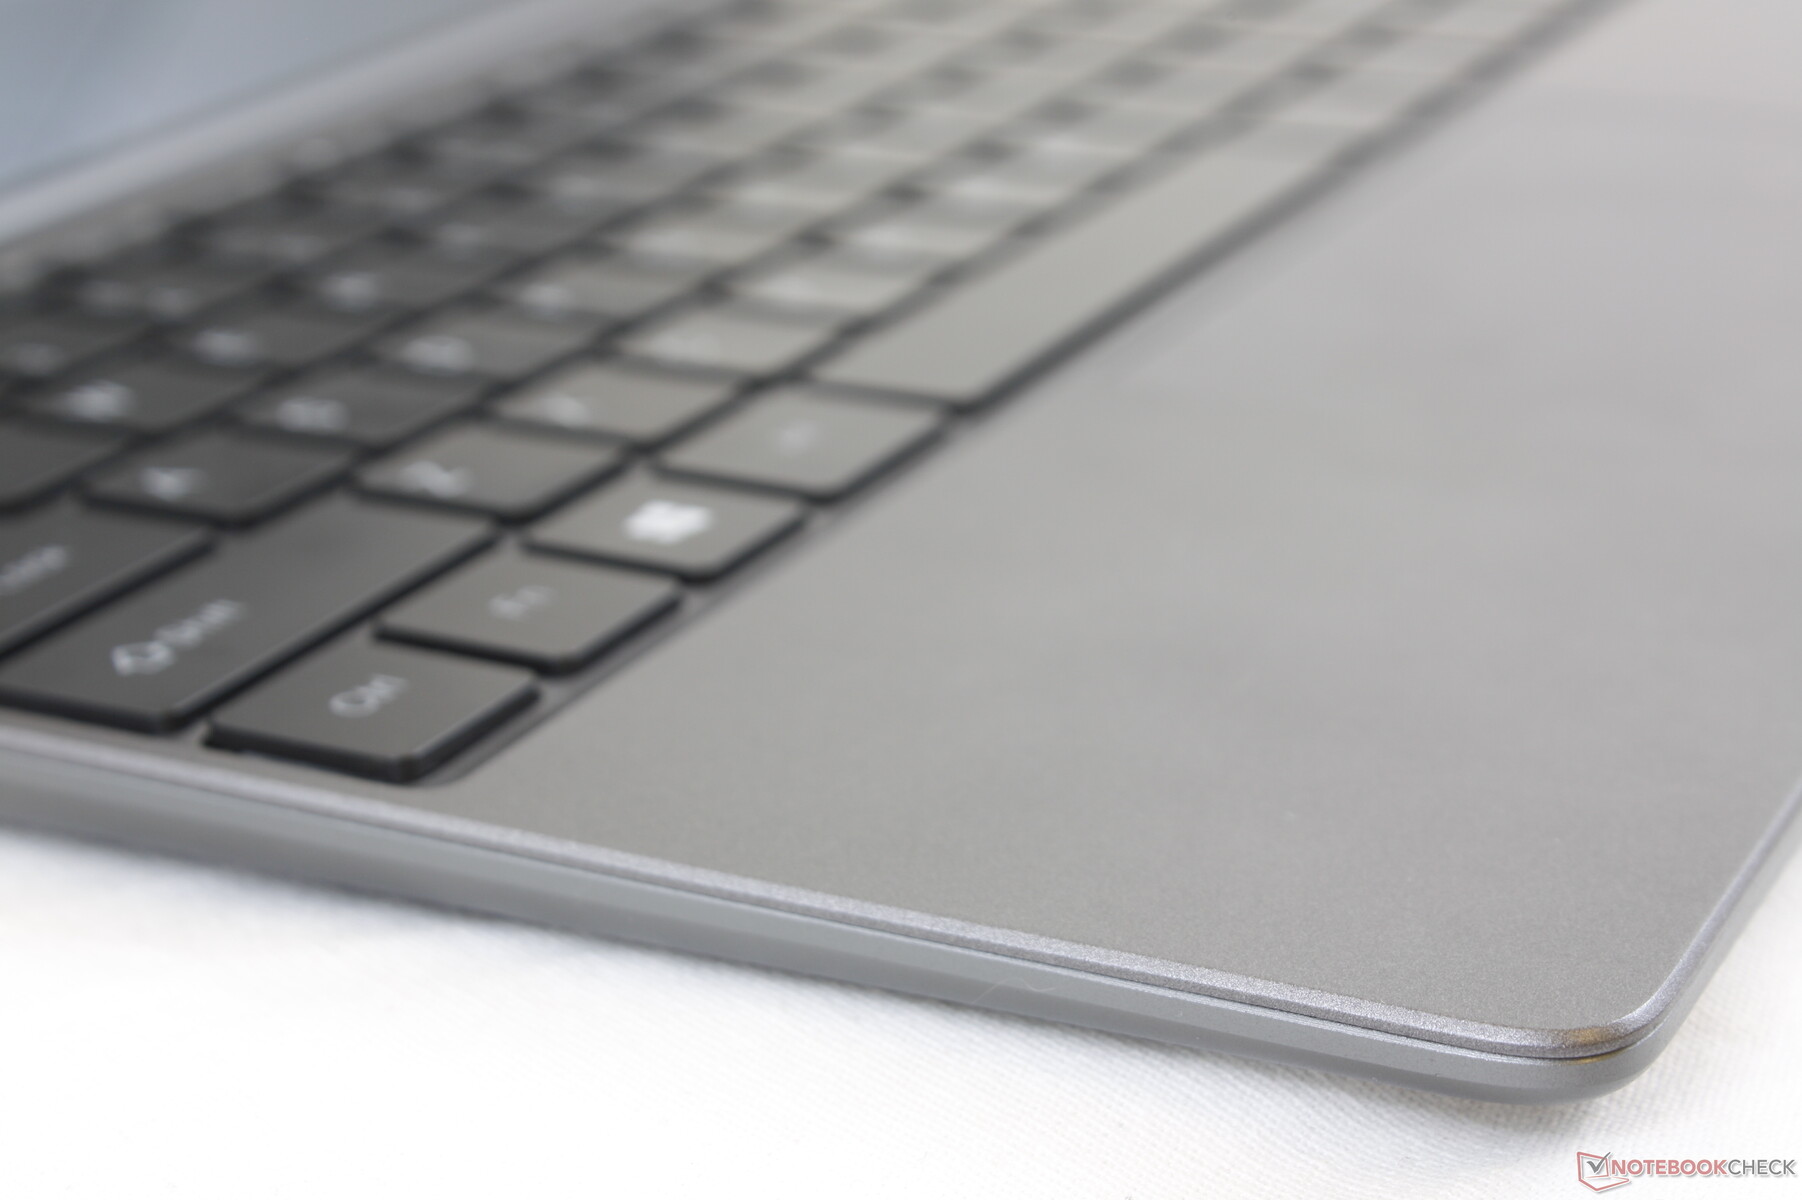
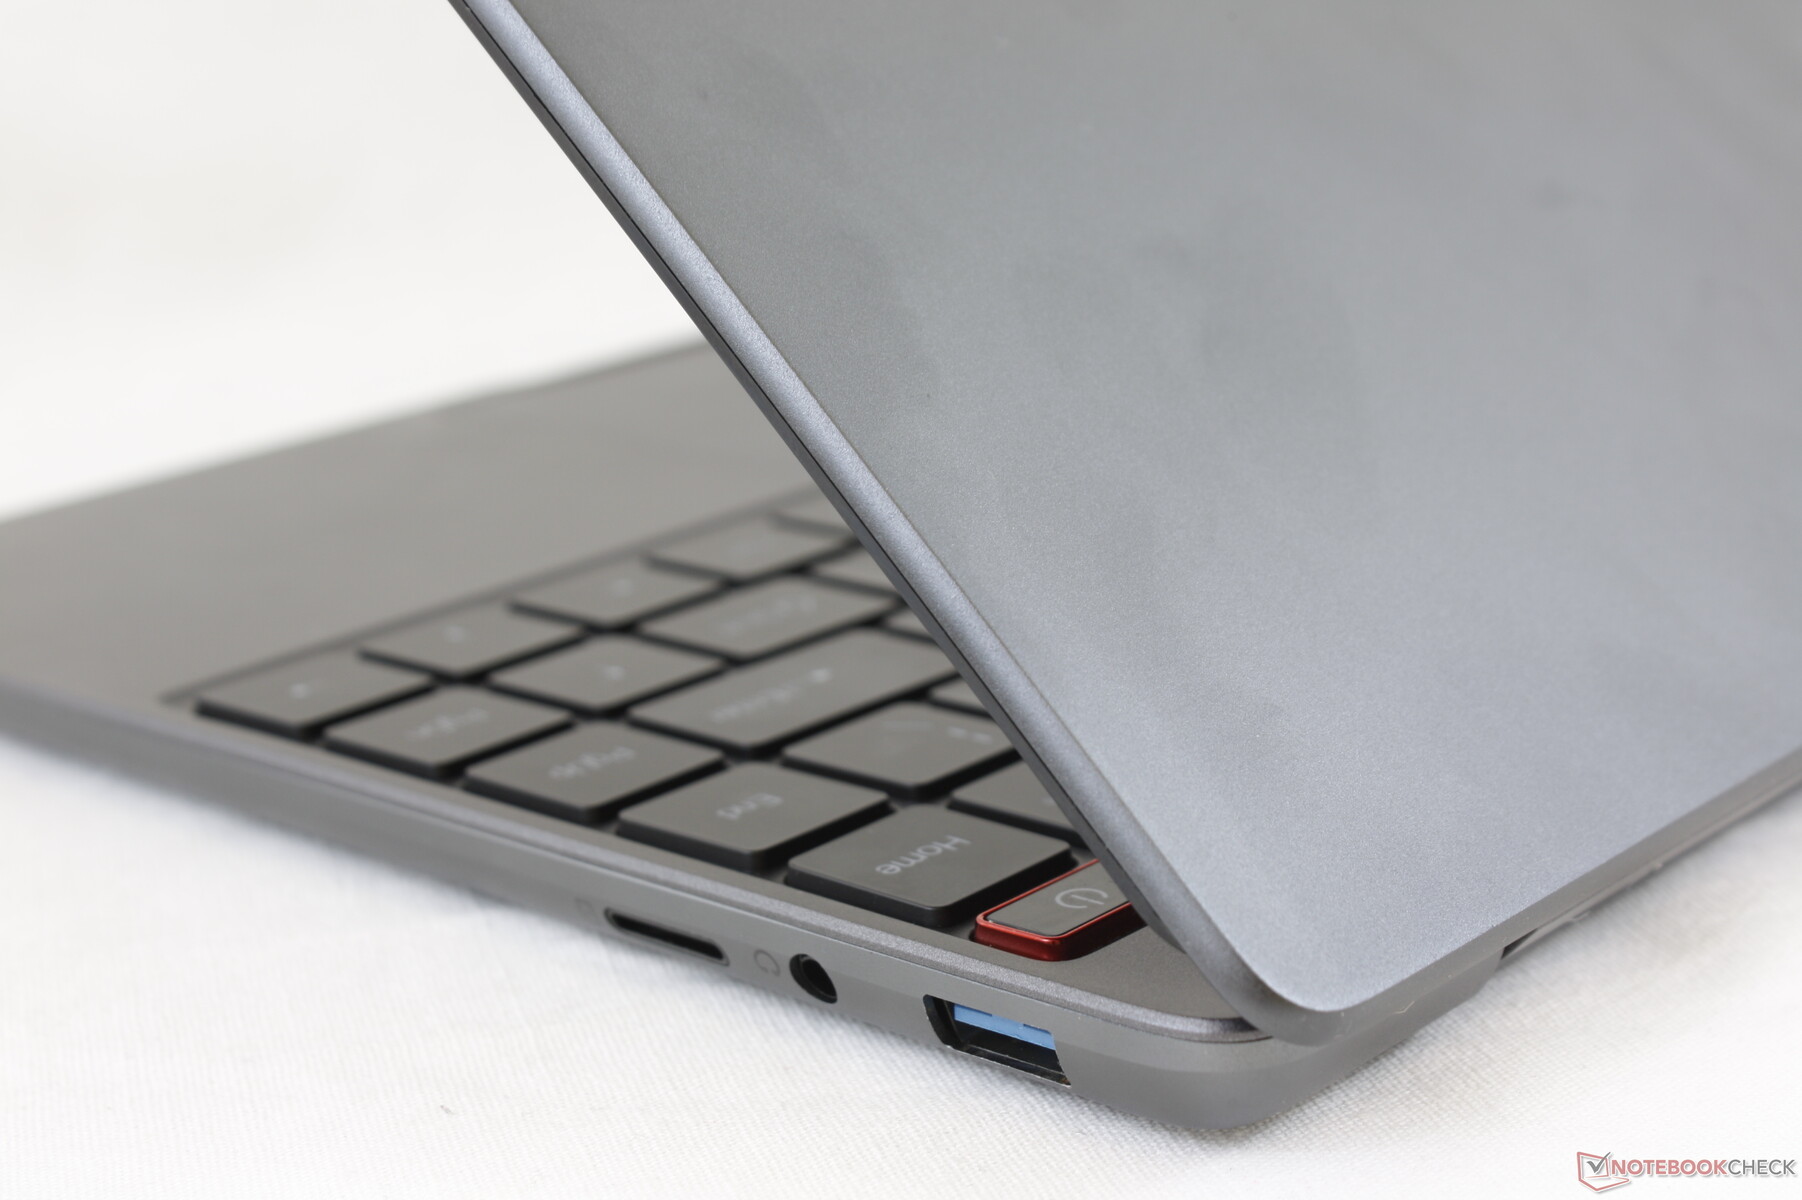
Case
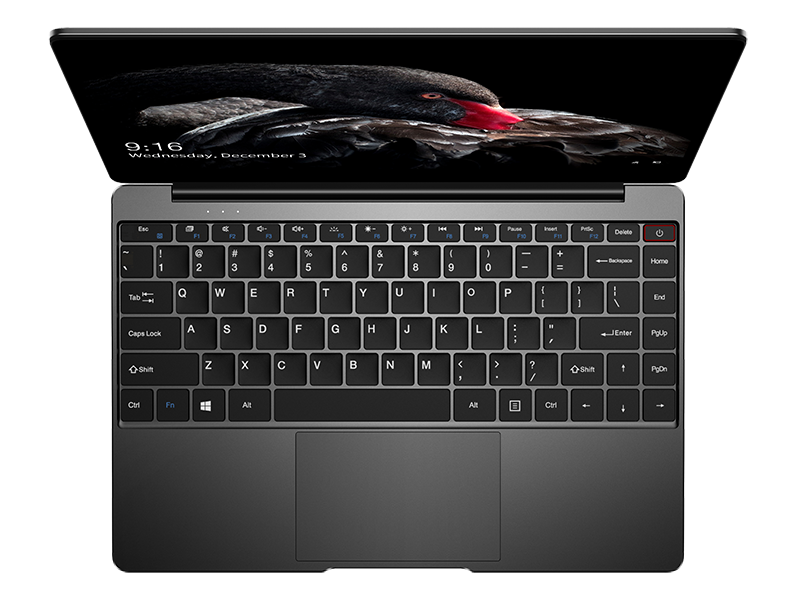
The visually attractive chassis remains the best part of the AeroBook. The metal materials aren't nearly as strong as the ones used on higher-end laptops like the MacBook Air, XPS 13, or HP Spectre, but it's a step up from the ugly plastic designs that most other inexpensive laptops gravitate towards. Weight and dimensions are both comparable to the 2020 Apple MacBook Air that Chuwi is attempting to imitate.
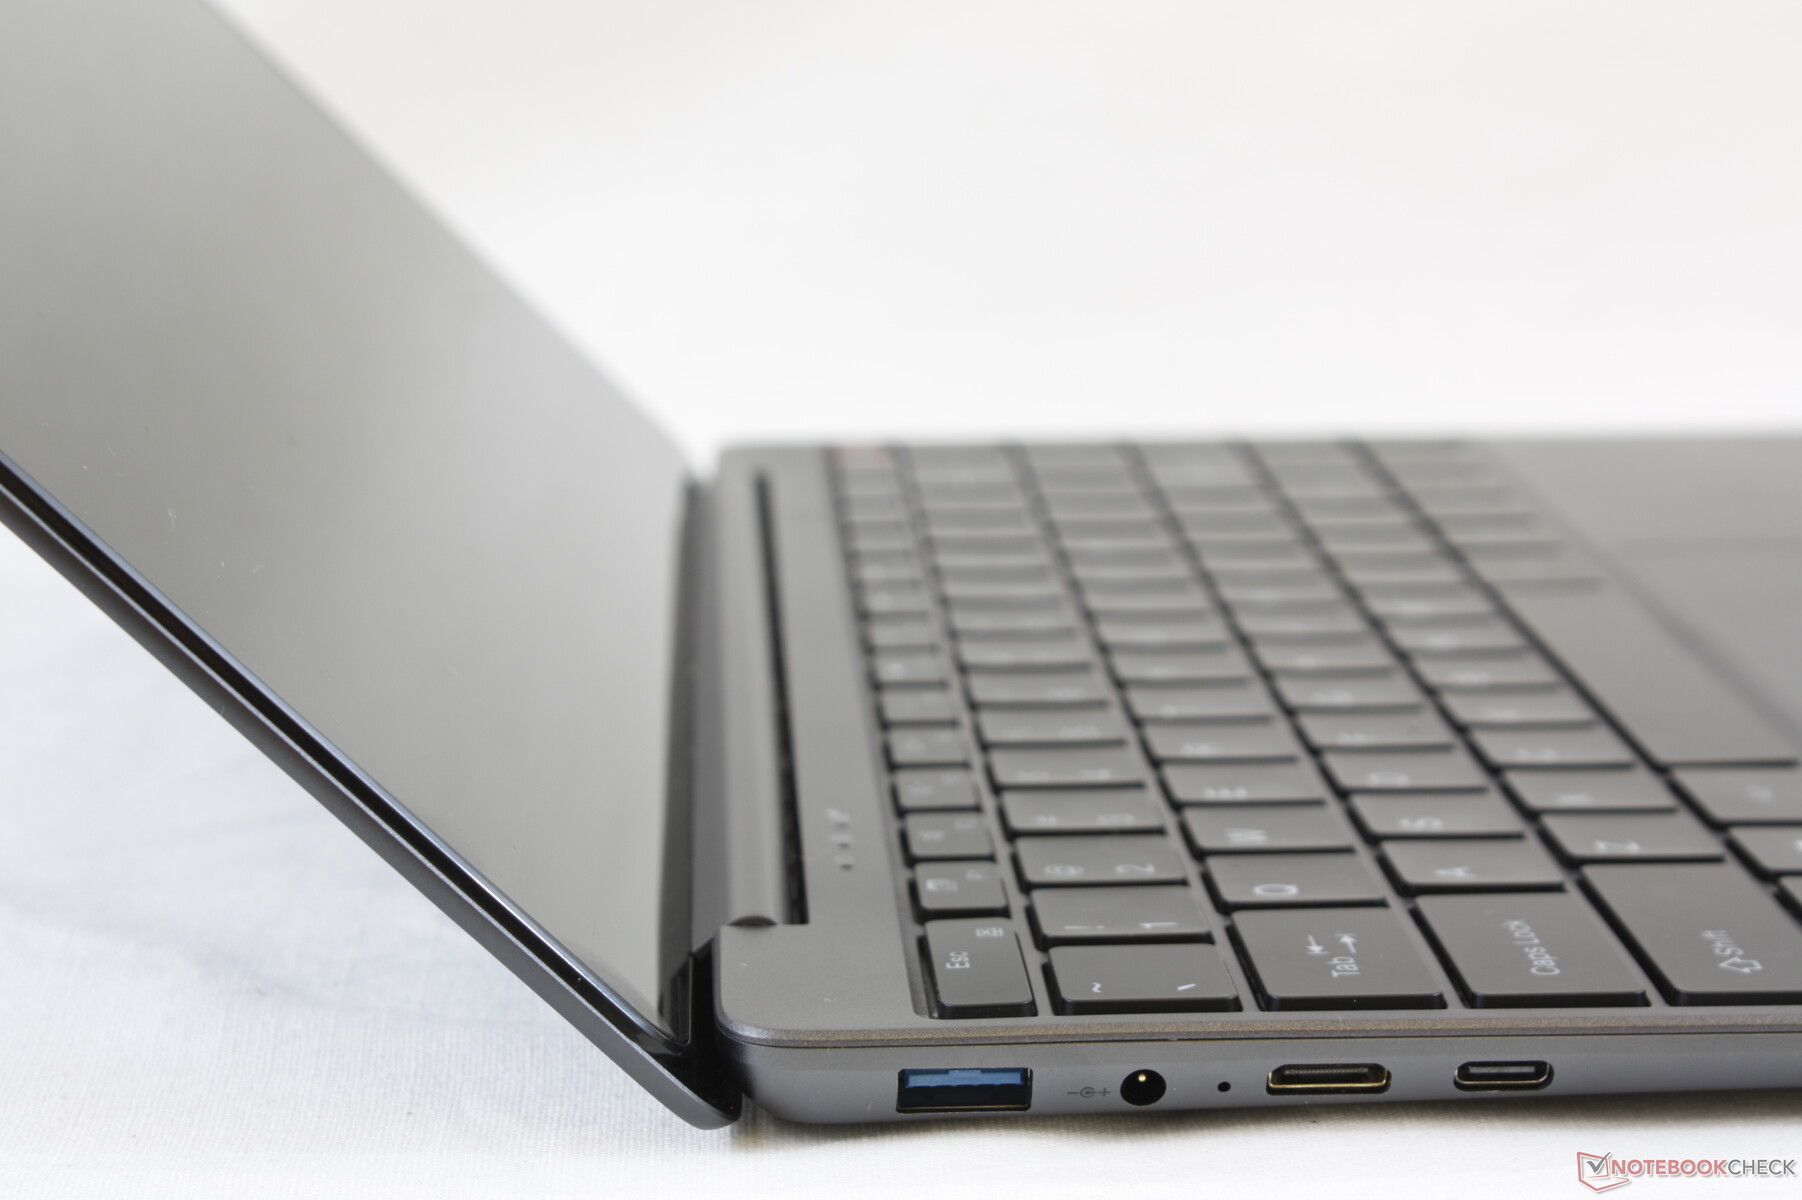
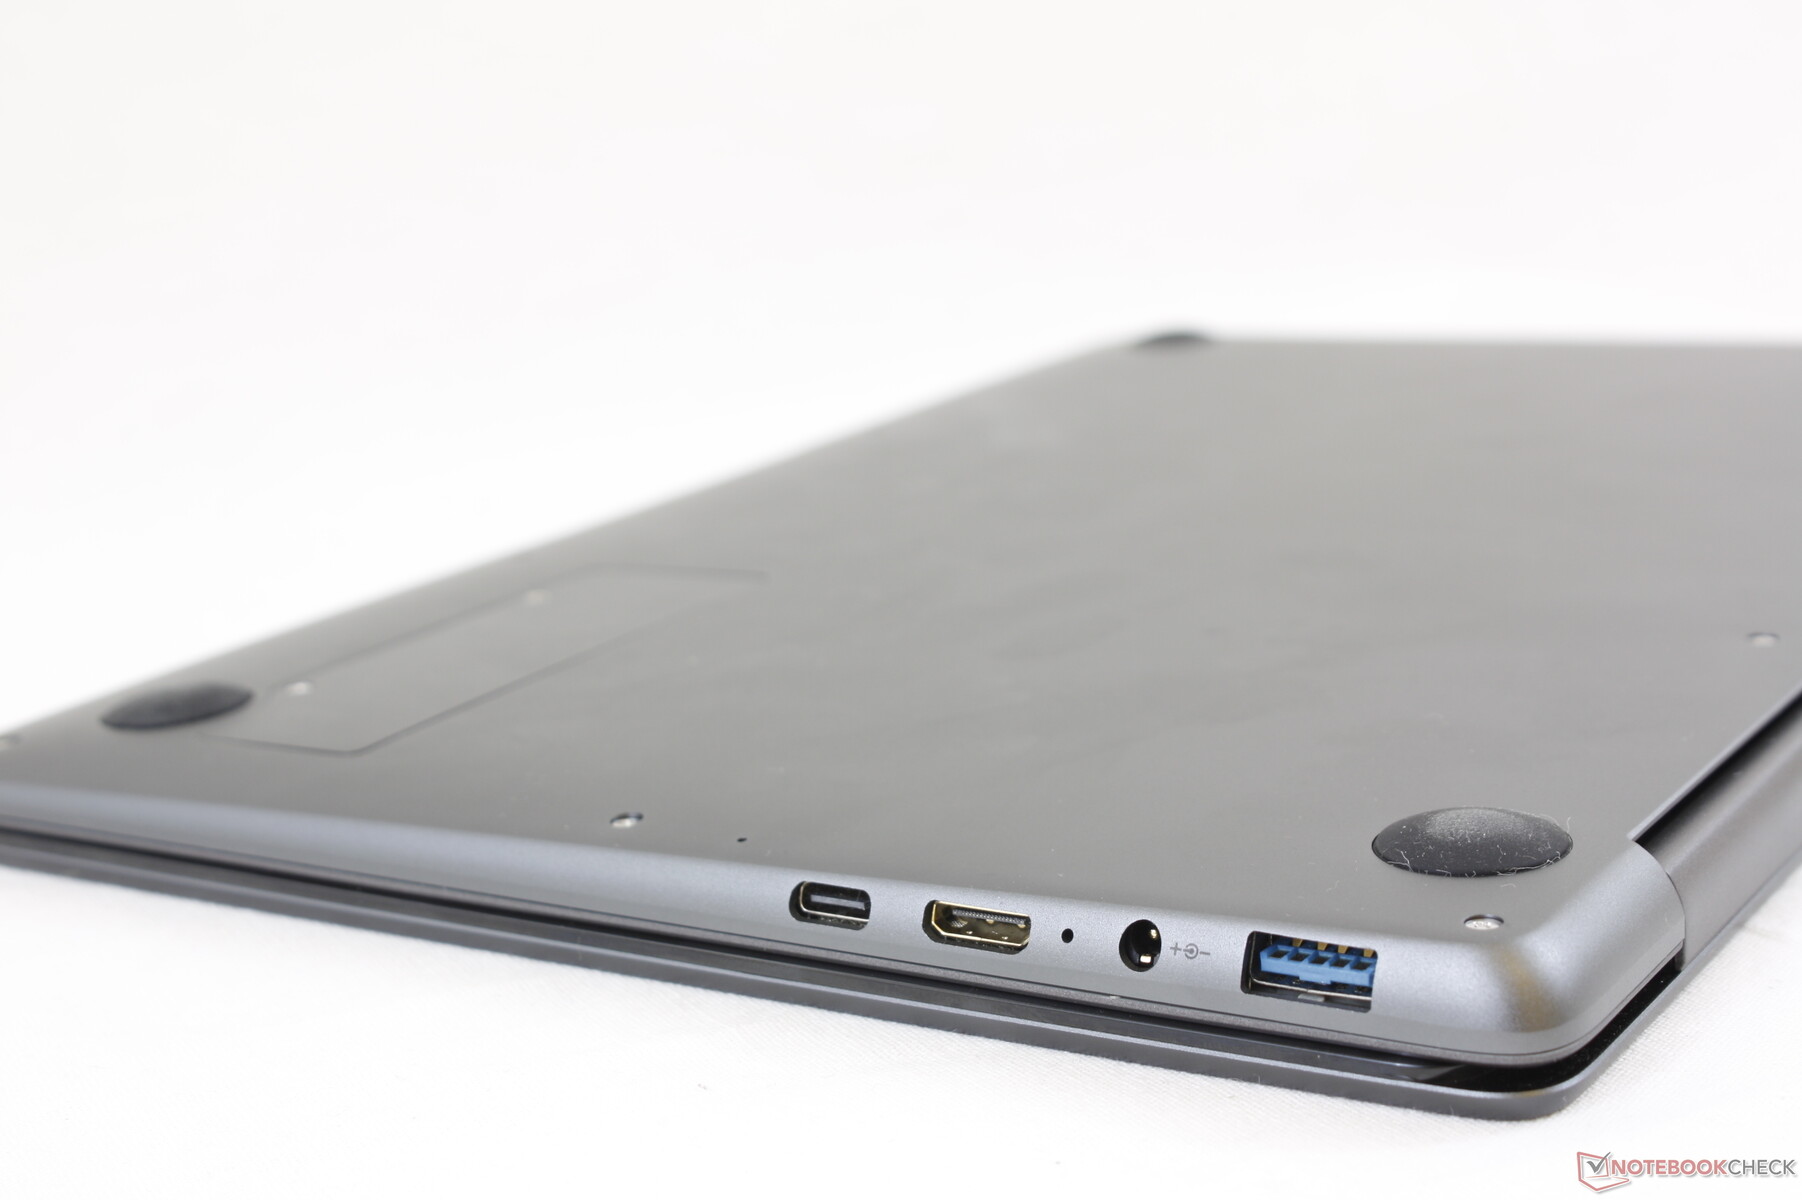

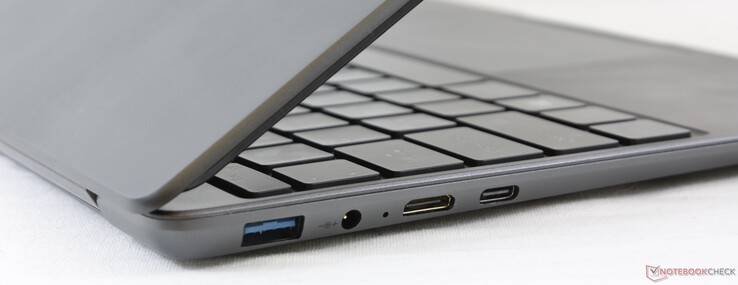
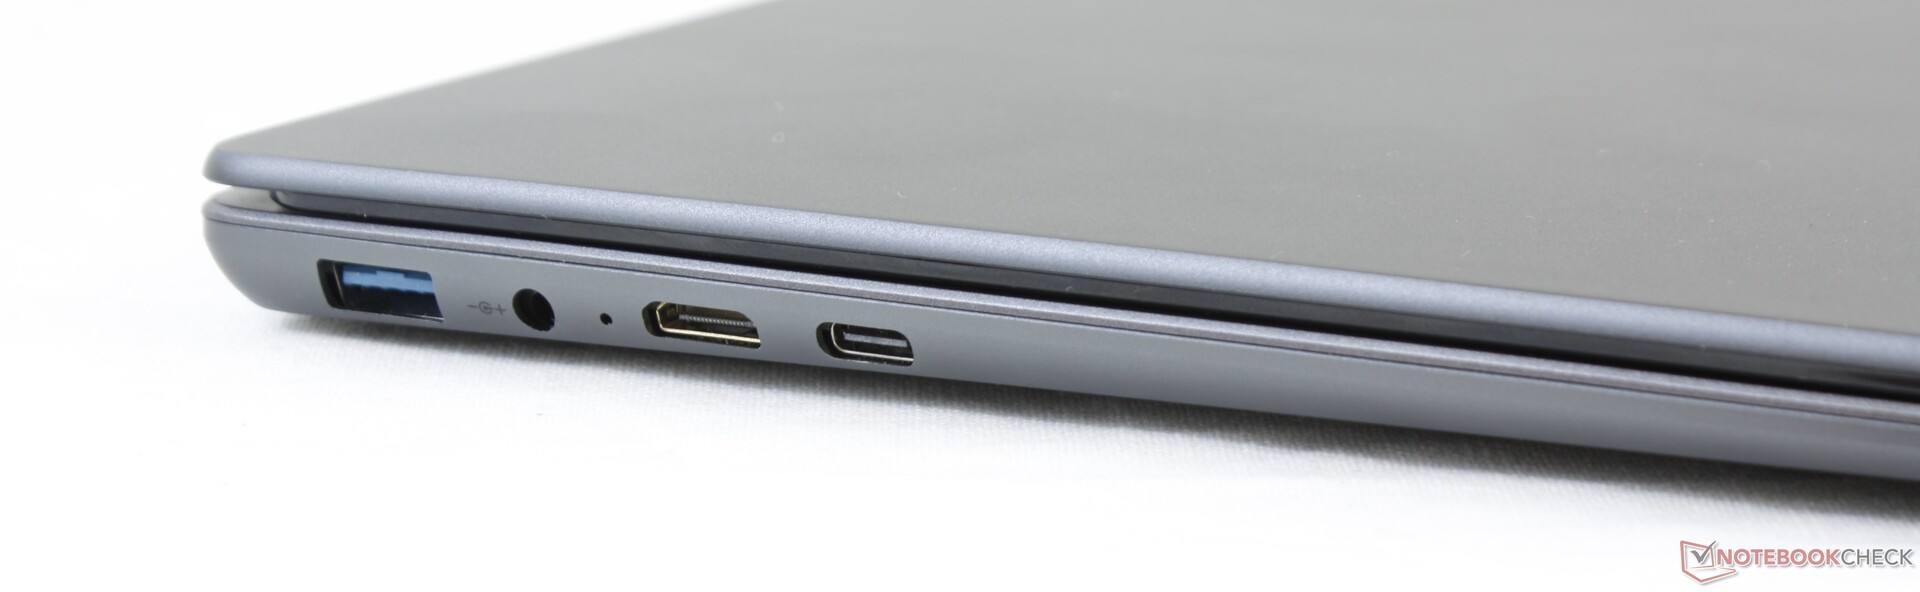
Connectivity
Port options are pretty good for a subnotebook, but most users are going to need a mini-HDMI to HDMI adapter. DisplayPort over USB-C is supported while recharging over USB-C is not.
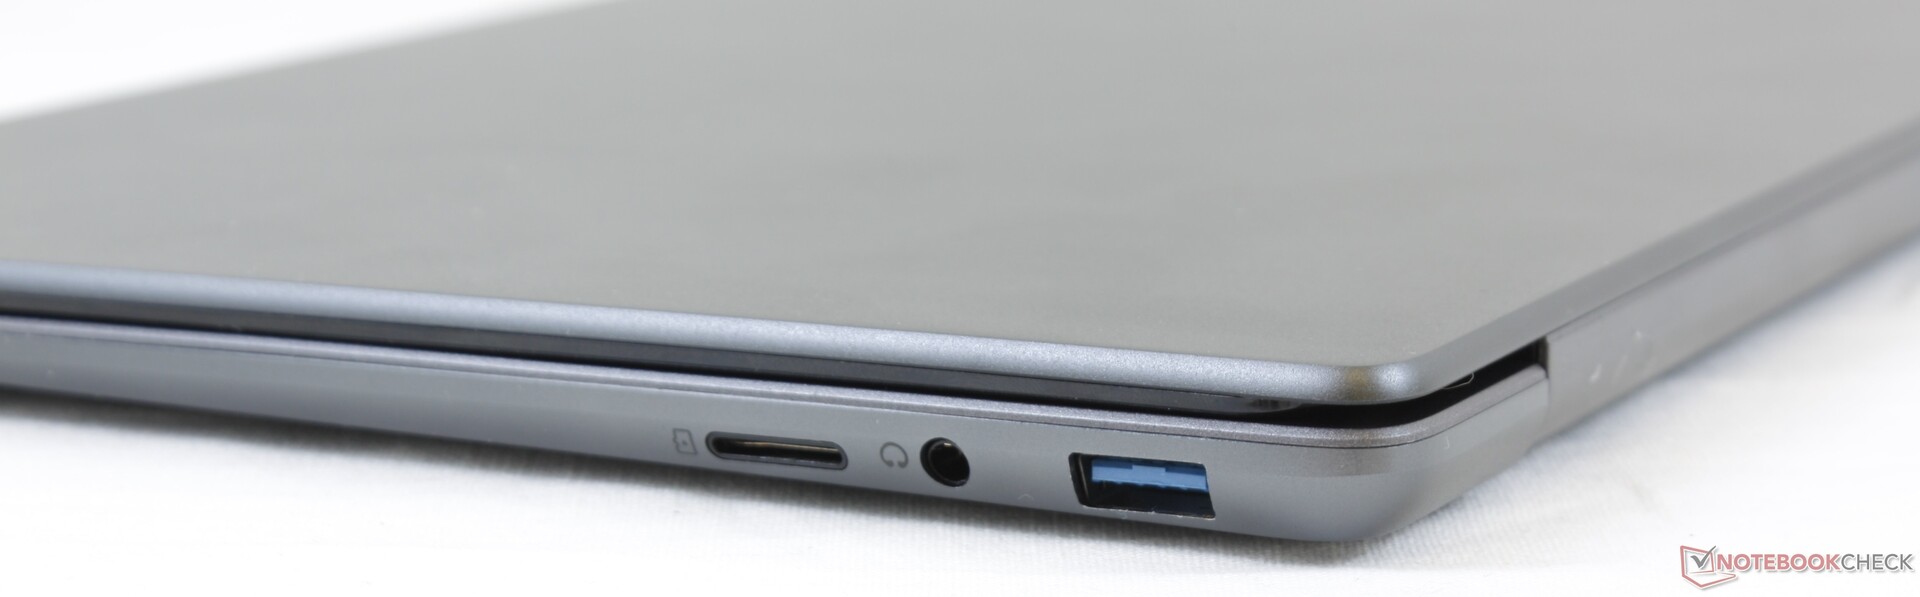
SD Card Reader
| SD Card Reader | |
| average JPG Copy Test (av. of 3 runs) | |
| Dell XPS 13 9300 i5 FHD (Toshiba Exceria Pro M501 64 GB UHS-II) | |
| Chuwi AeroBook Pro (Toshiba Exceria Pro M501 64 GB UHS-II) | |
| Jumper EZbook X3 | |
| maximum AS SSD Seq Read Test (1GB) | |
| Dell XPS 13 9300 i5 FHD (Toshiba Exceria Pro M501 64 GB UHS-II) | |
| Chuwi AeroBook Pro (Toshiba Exceria Pro M501 64 GB UHS-II) | |
| Jumper EZbook X3 | |
Communication
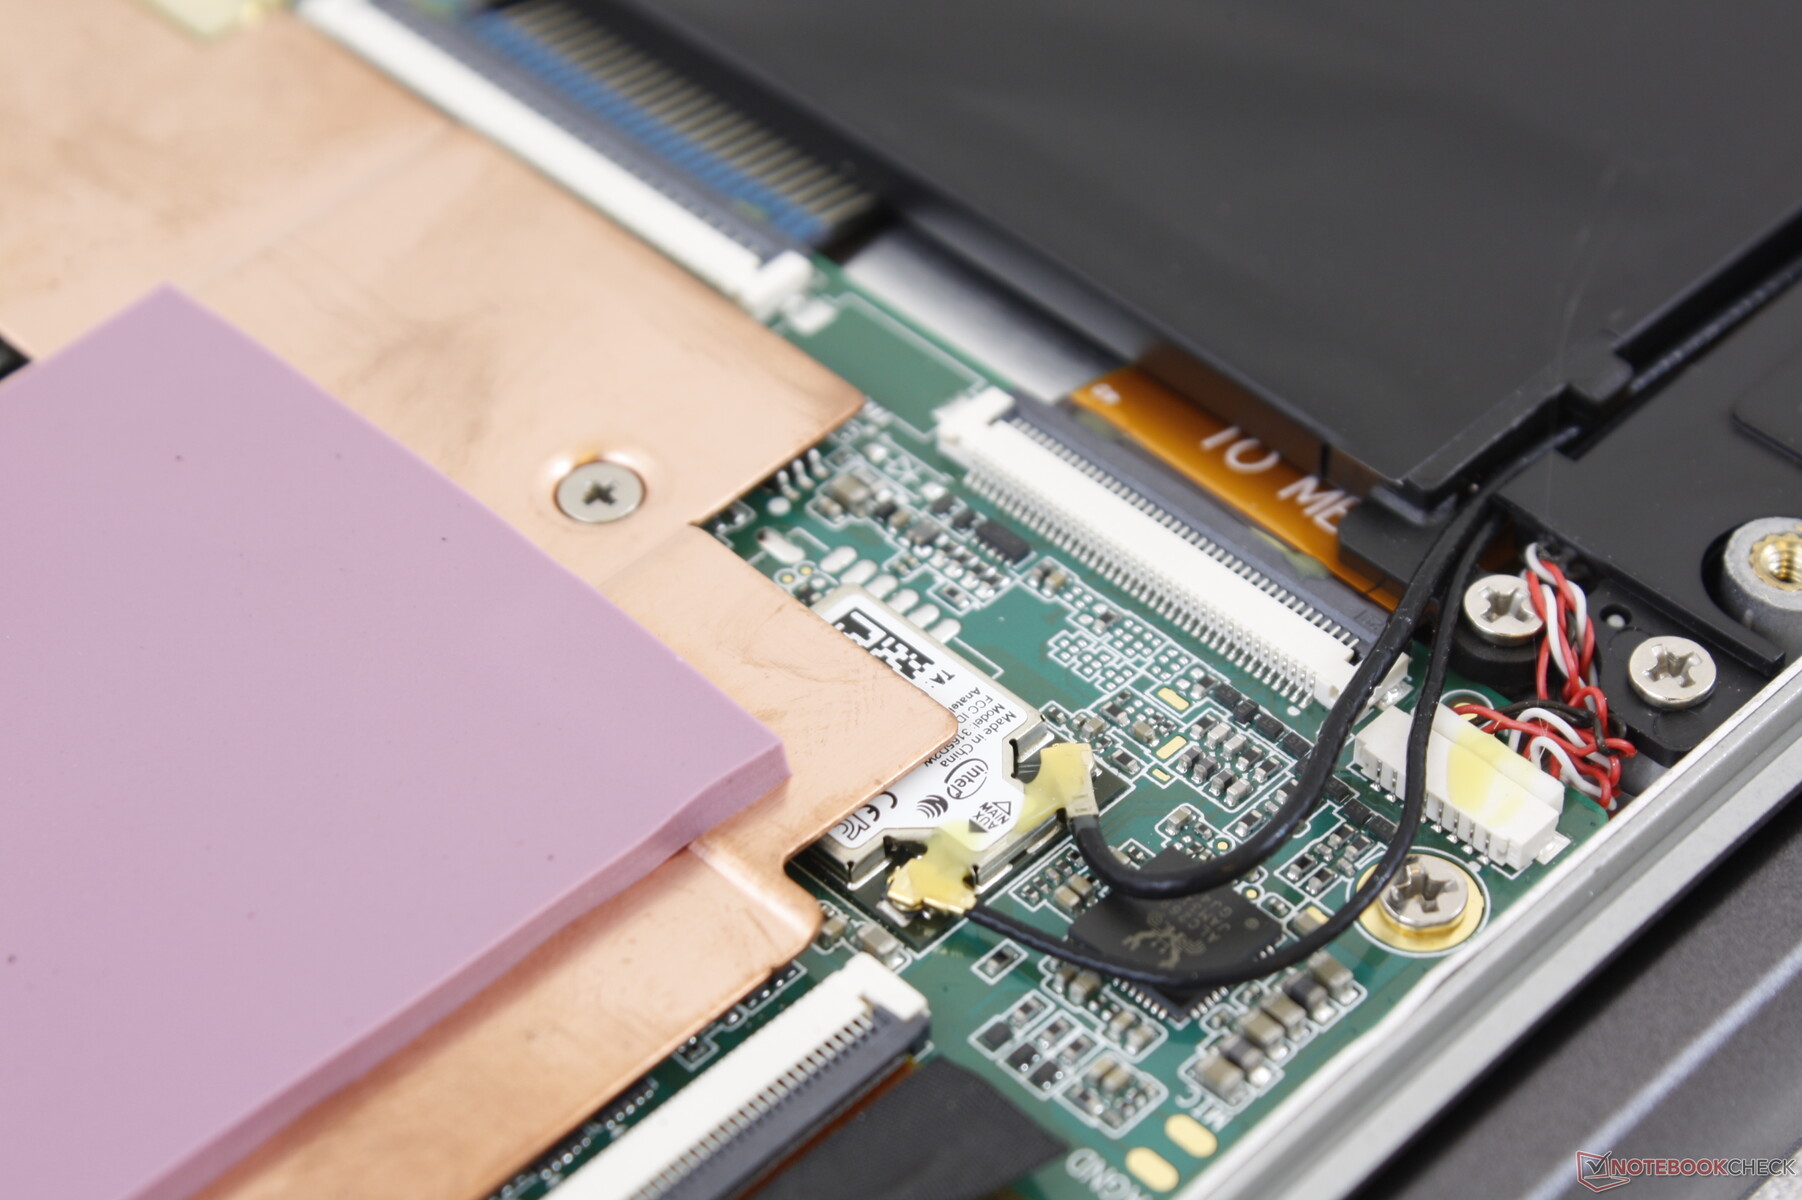
The Intel 3165 WLAN has not changed. We experienced no issues when connected to our Netgear RAX200 test router.
| Networking | |
| iperf3 transmit AX12 | |
| Dell XPS 13 9300 i5 FHD | |
| Apple MacBook Air 2020 i5 | |
| Jumper EZbook X3 | |
| Chuwi AeroBook Pro | |
| iperf3 receive AX12 | |
| Dell XPS 13 9300 i5 FHD | |
| Apple MacBook Air 2020 i5 | |
| Chuwi AeroBook Pro | |
| Jumper EZbook X3 | |
Webcam


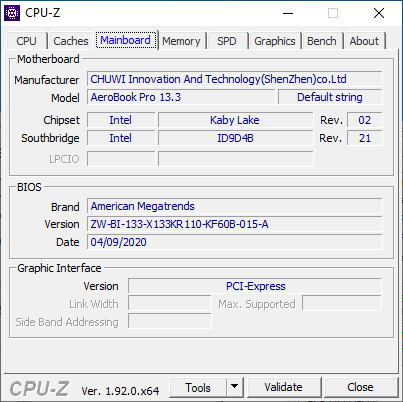
Maintenance
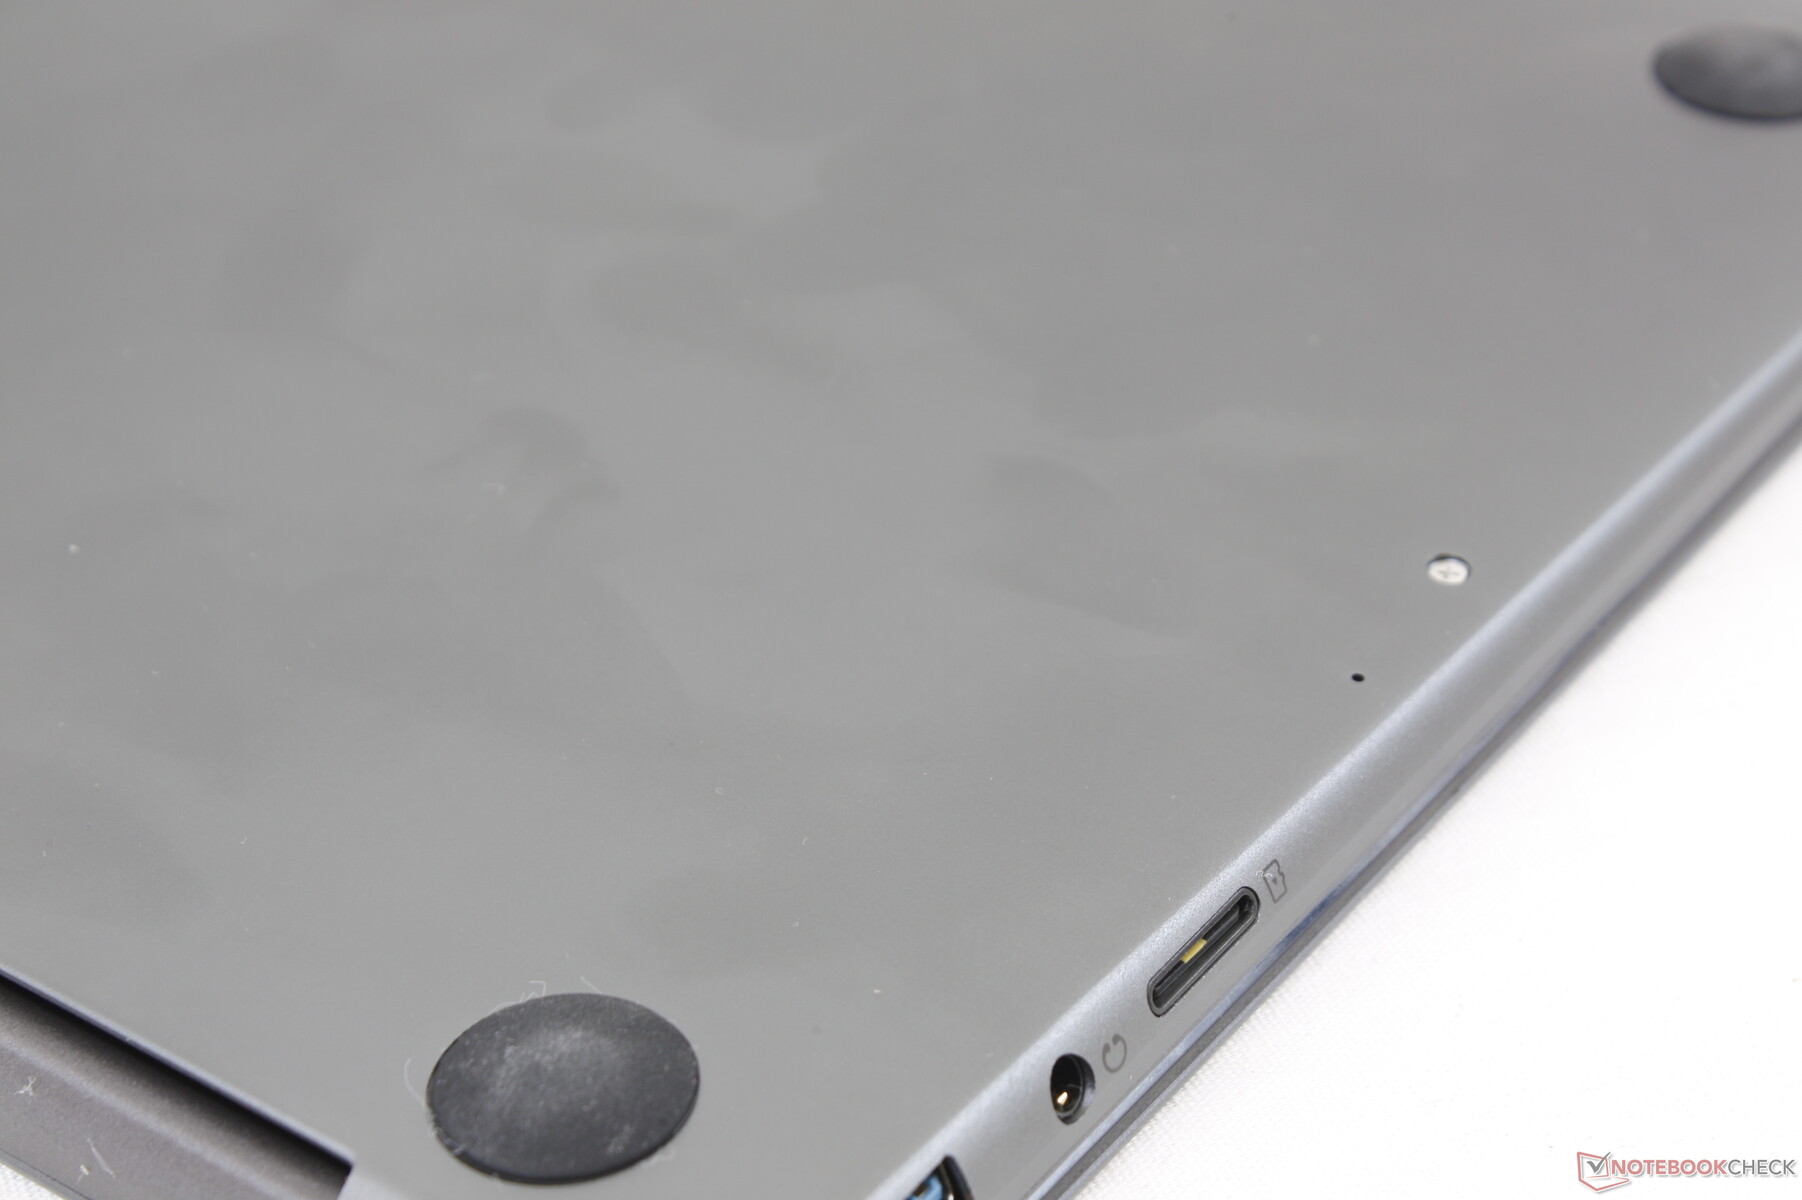
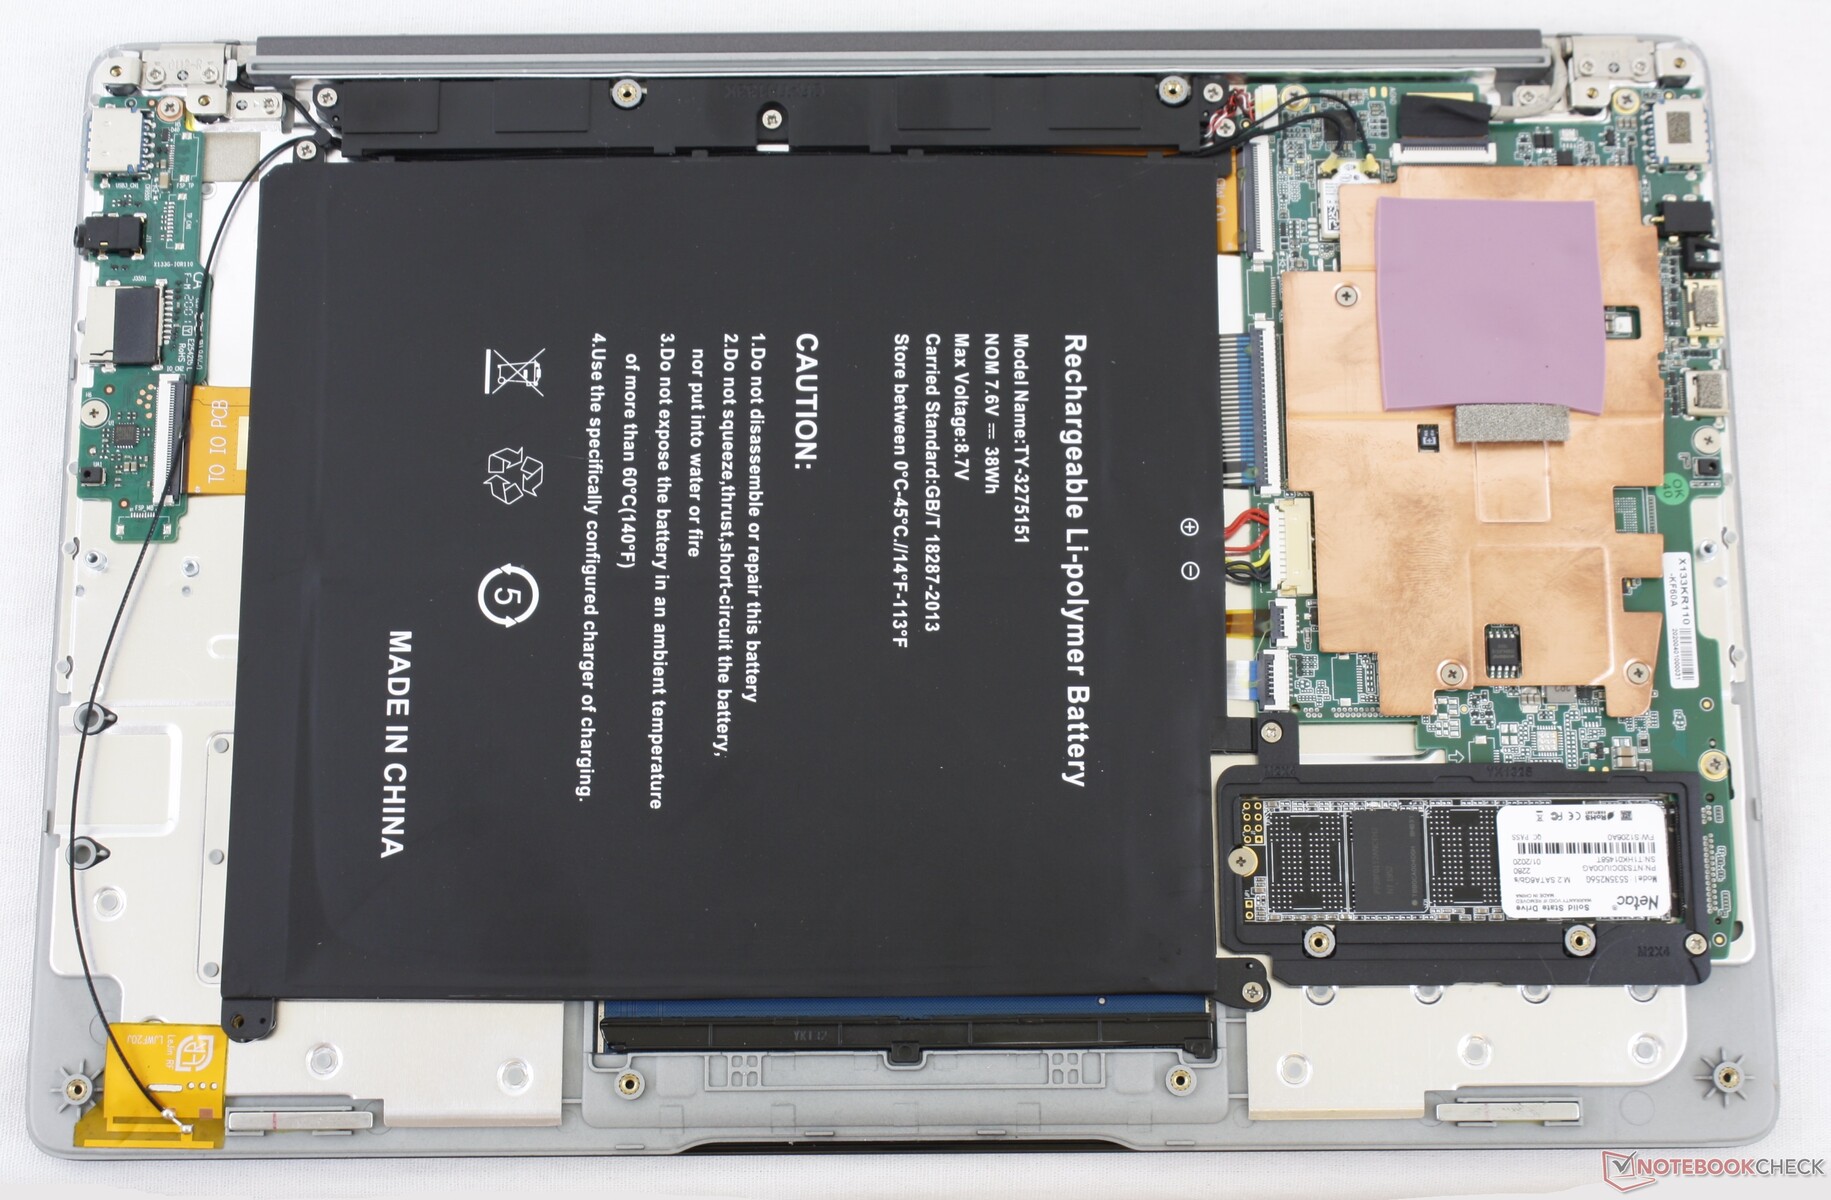
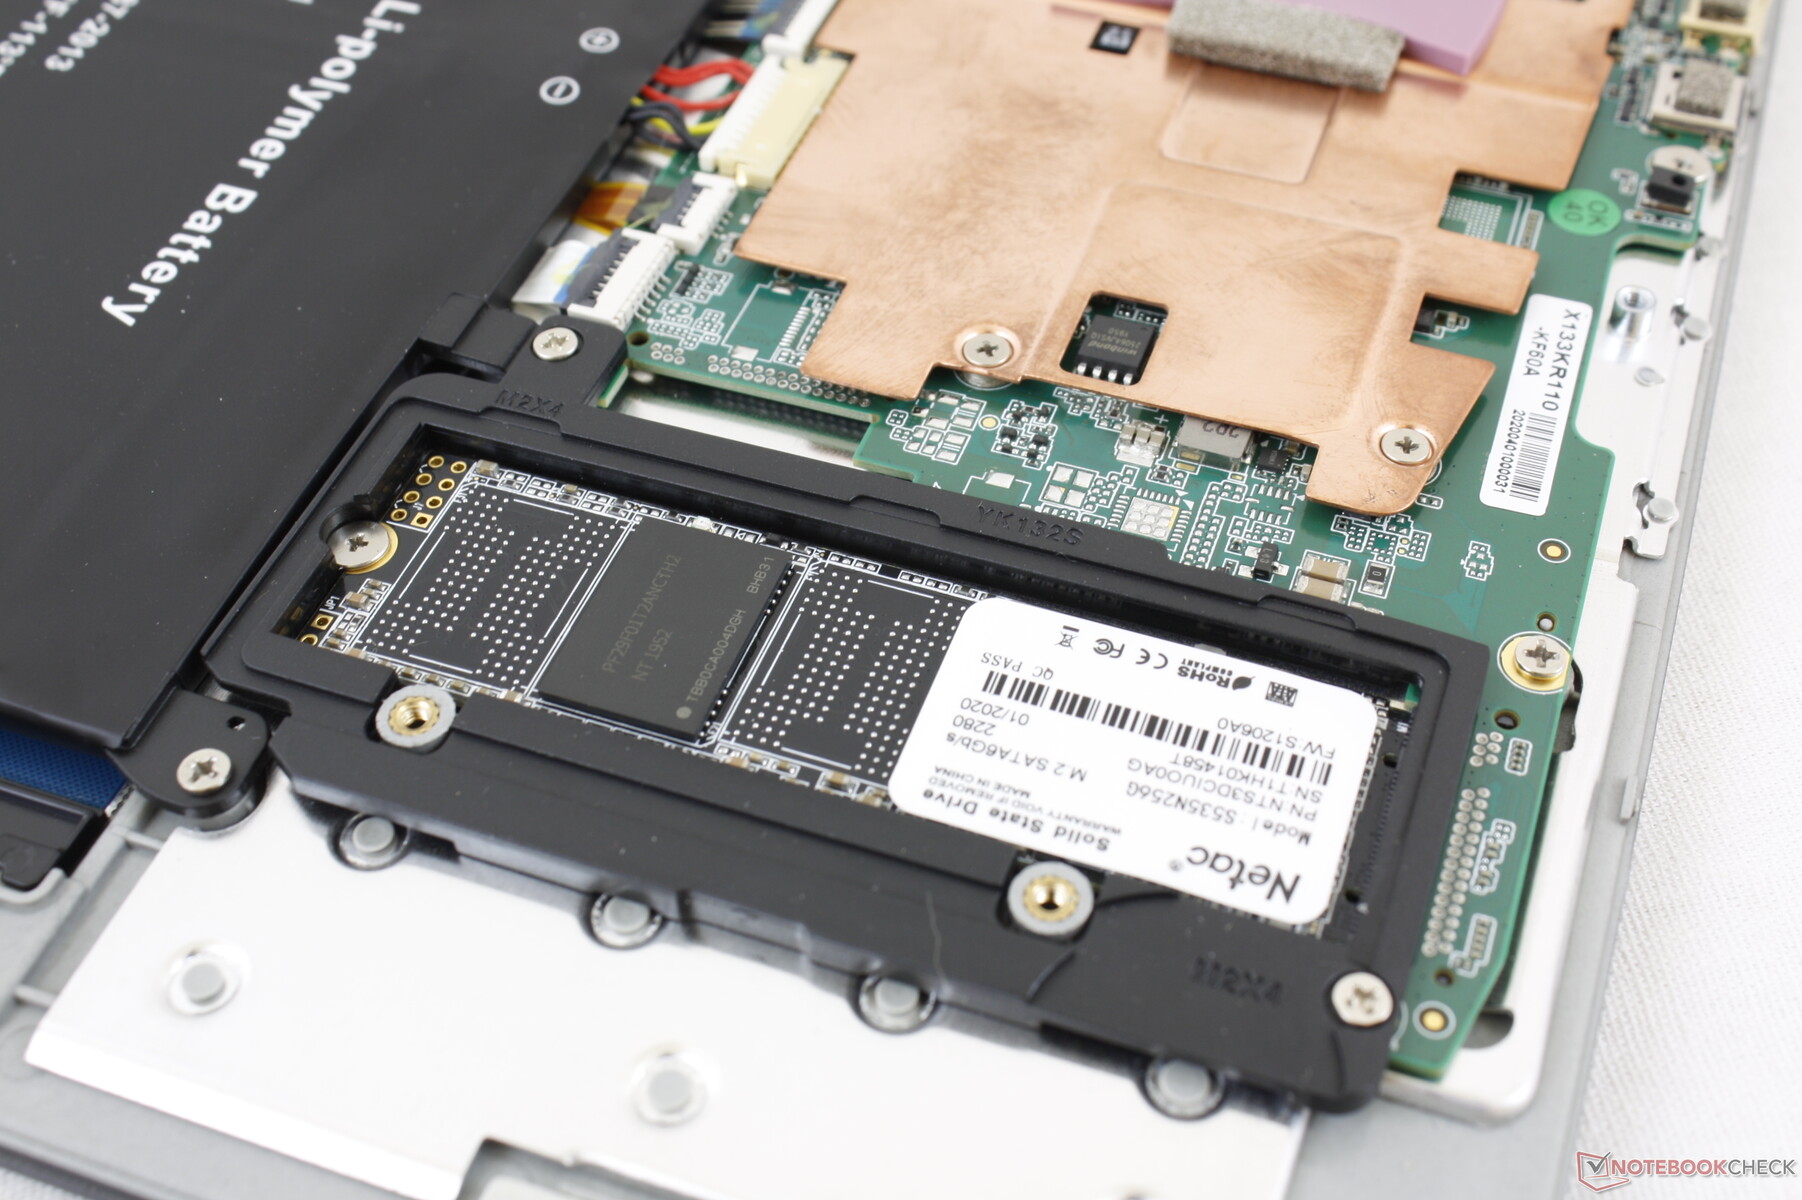
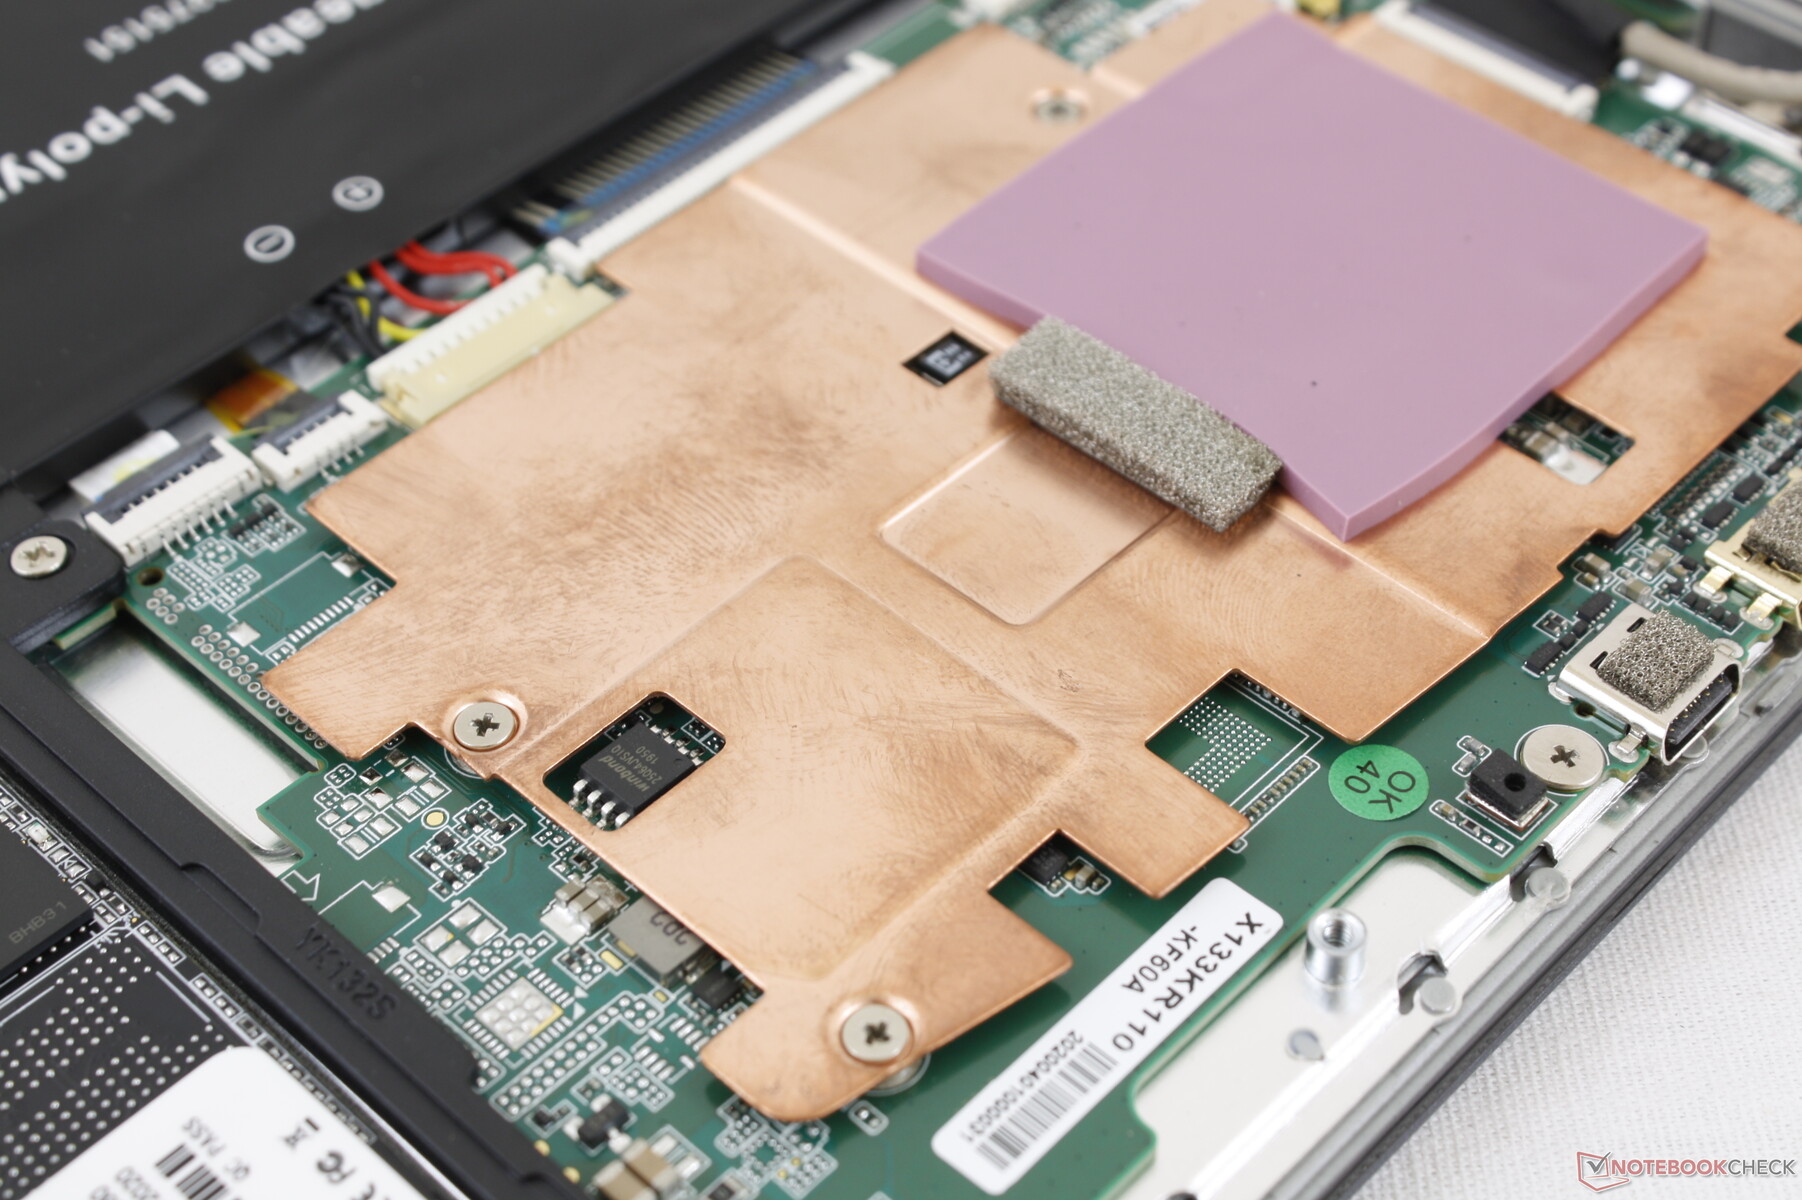
The bottom panel is secured by 12 Philips screws with 2 more hidden underneath the rear rubber footing. Upgrade options are limited to the M.2 2280 SATA slot only as RAM is soldered.
Accessories and Warranty
There are no extras included in the box outside of the AC adapter and small manual. Warranty claims may be difficult as returns are handled overseas.
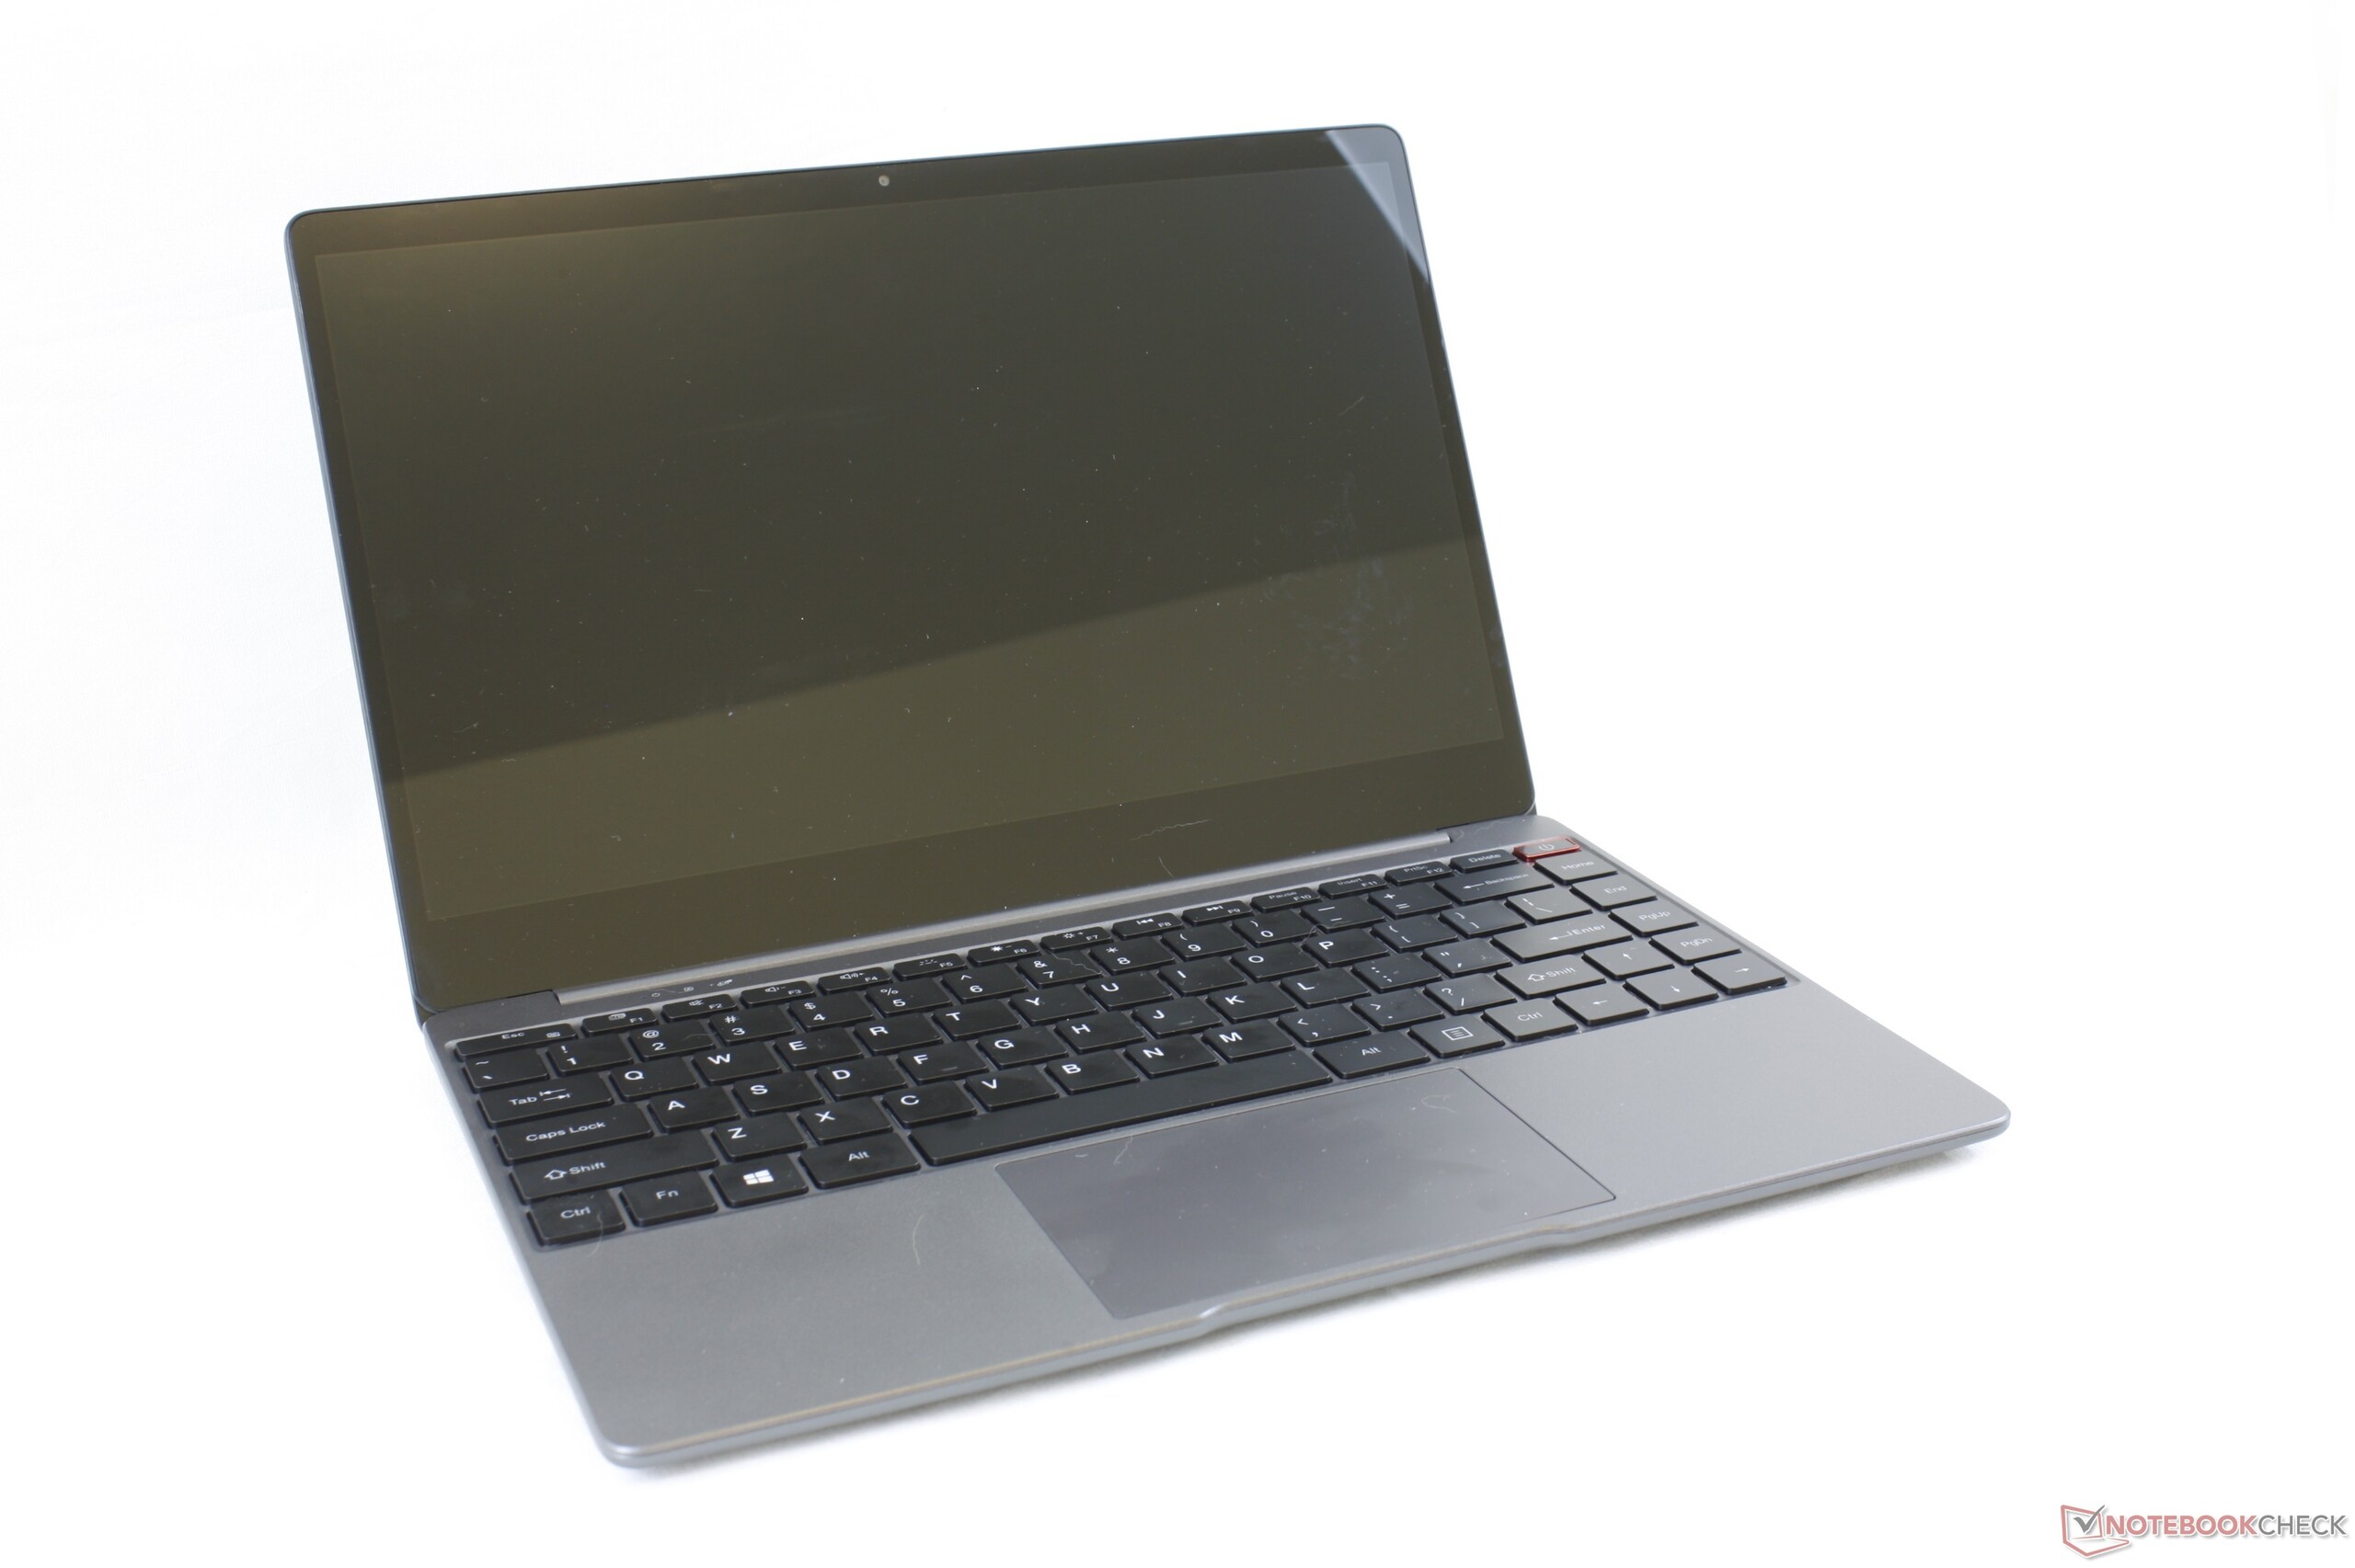
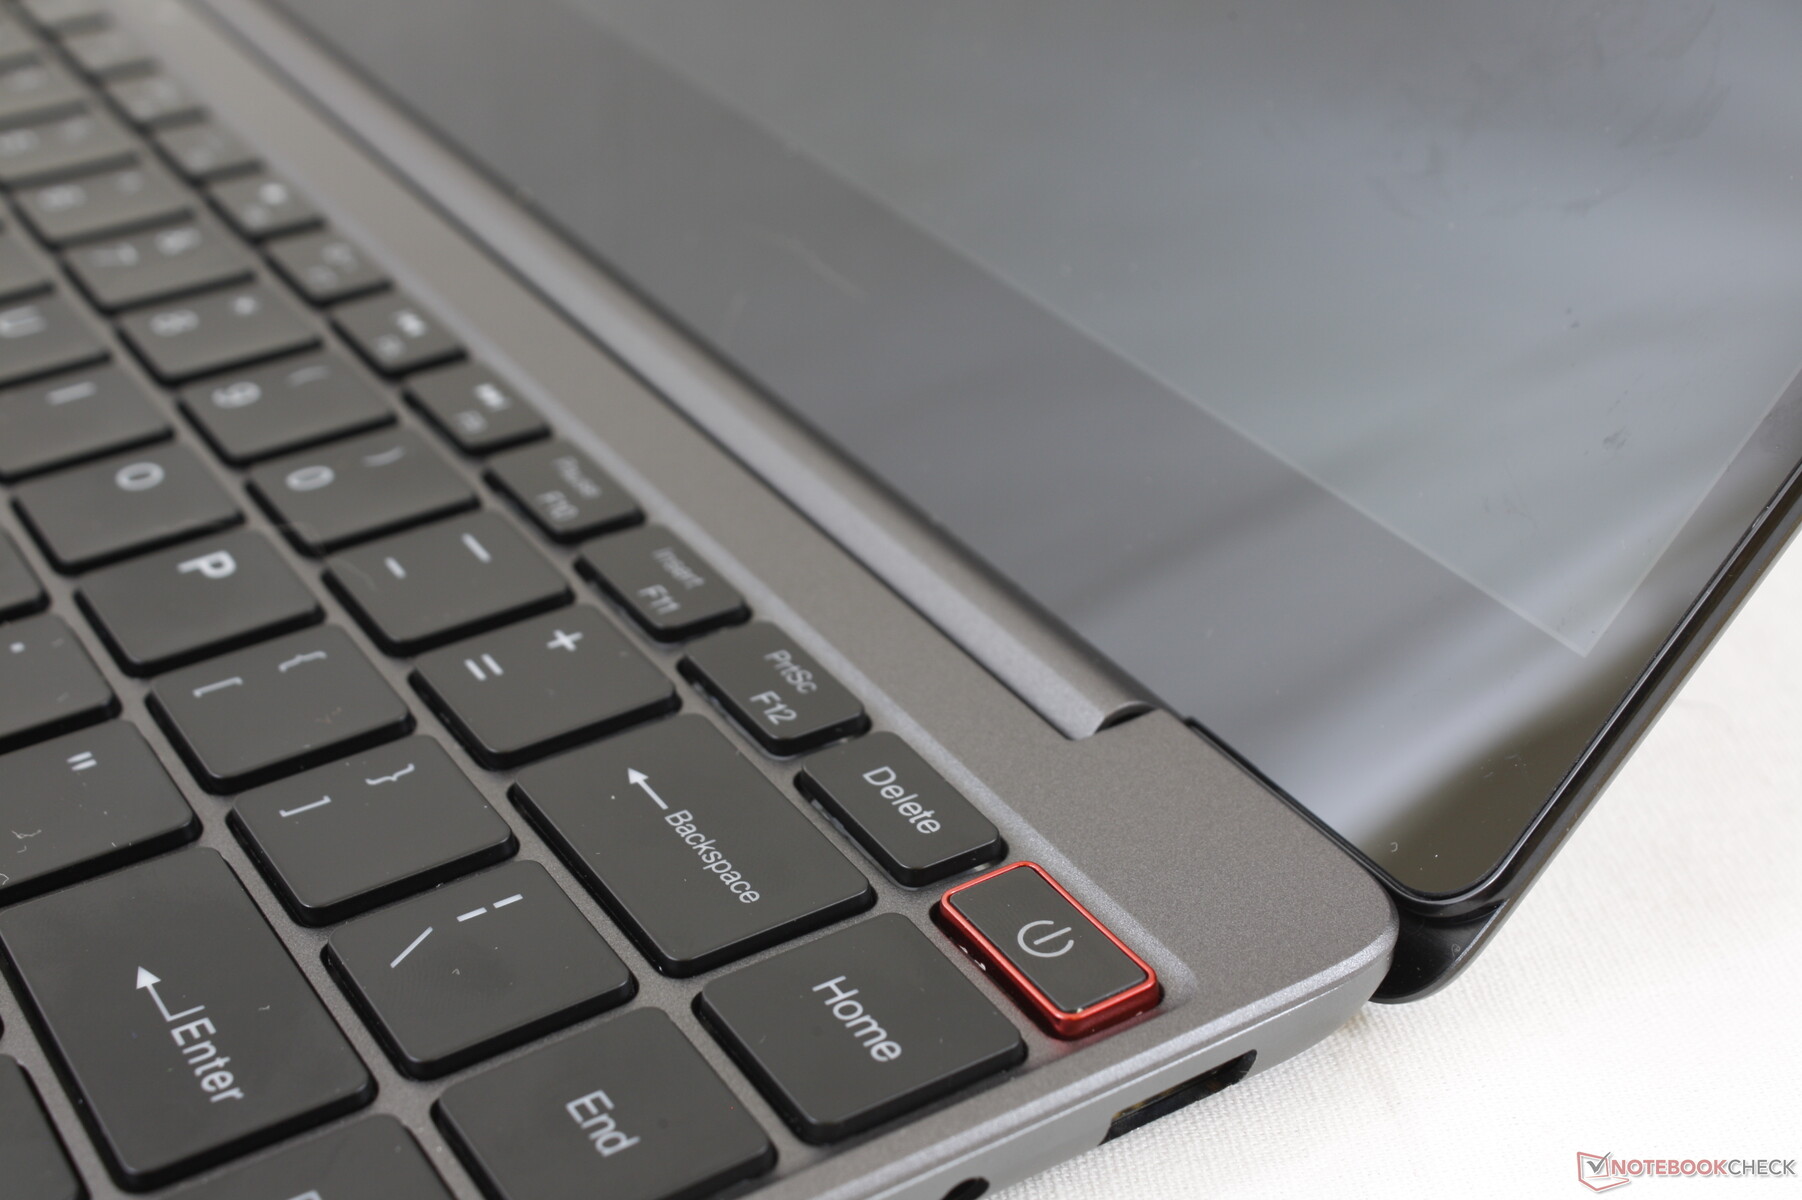
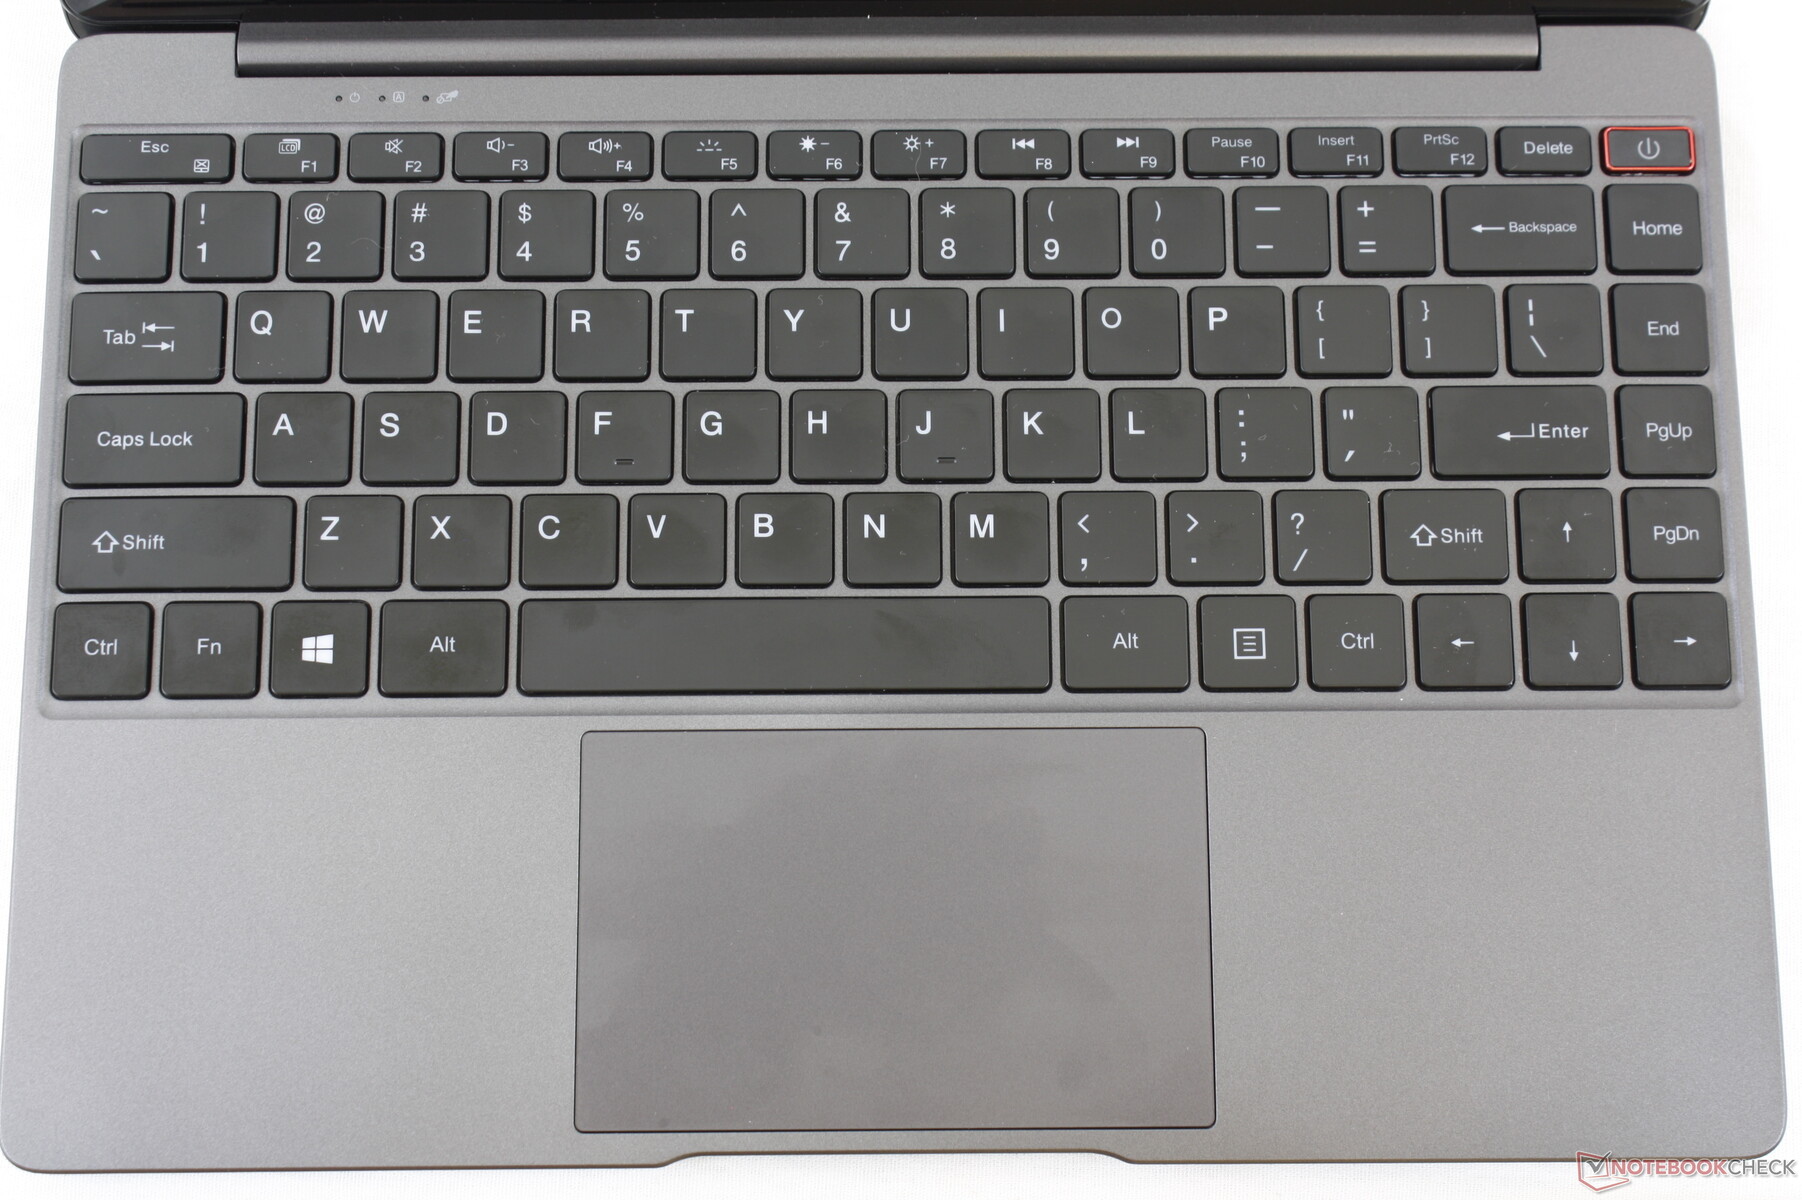
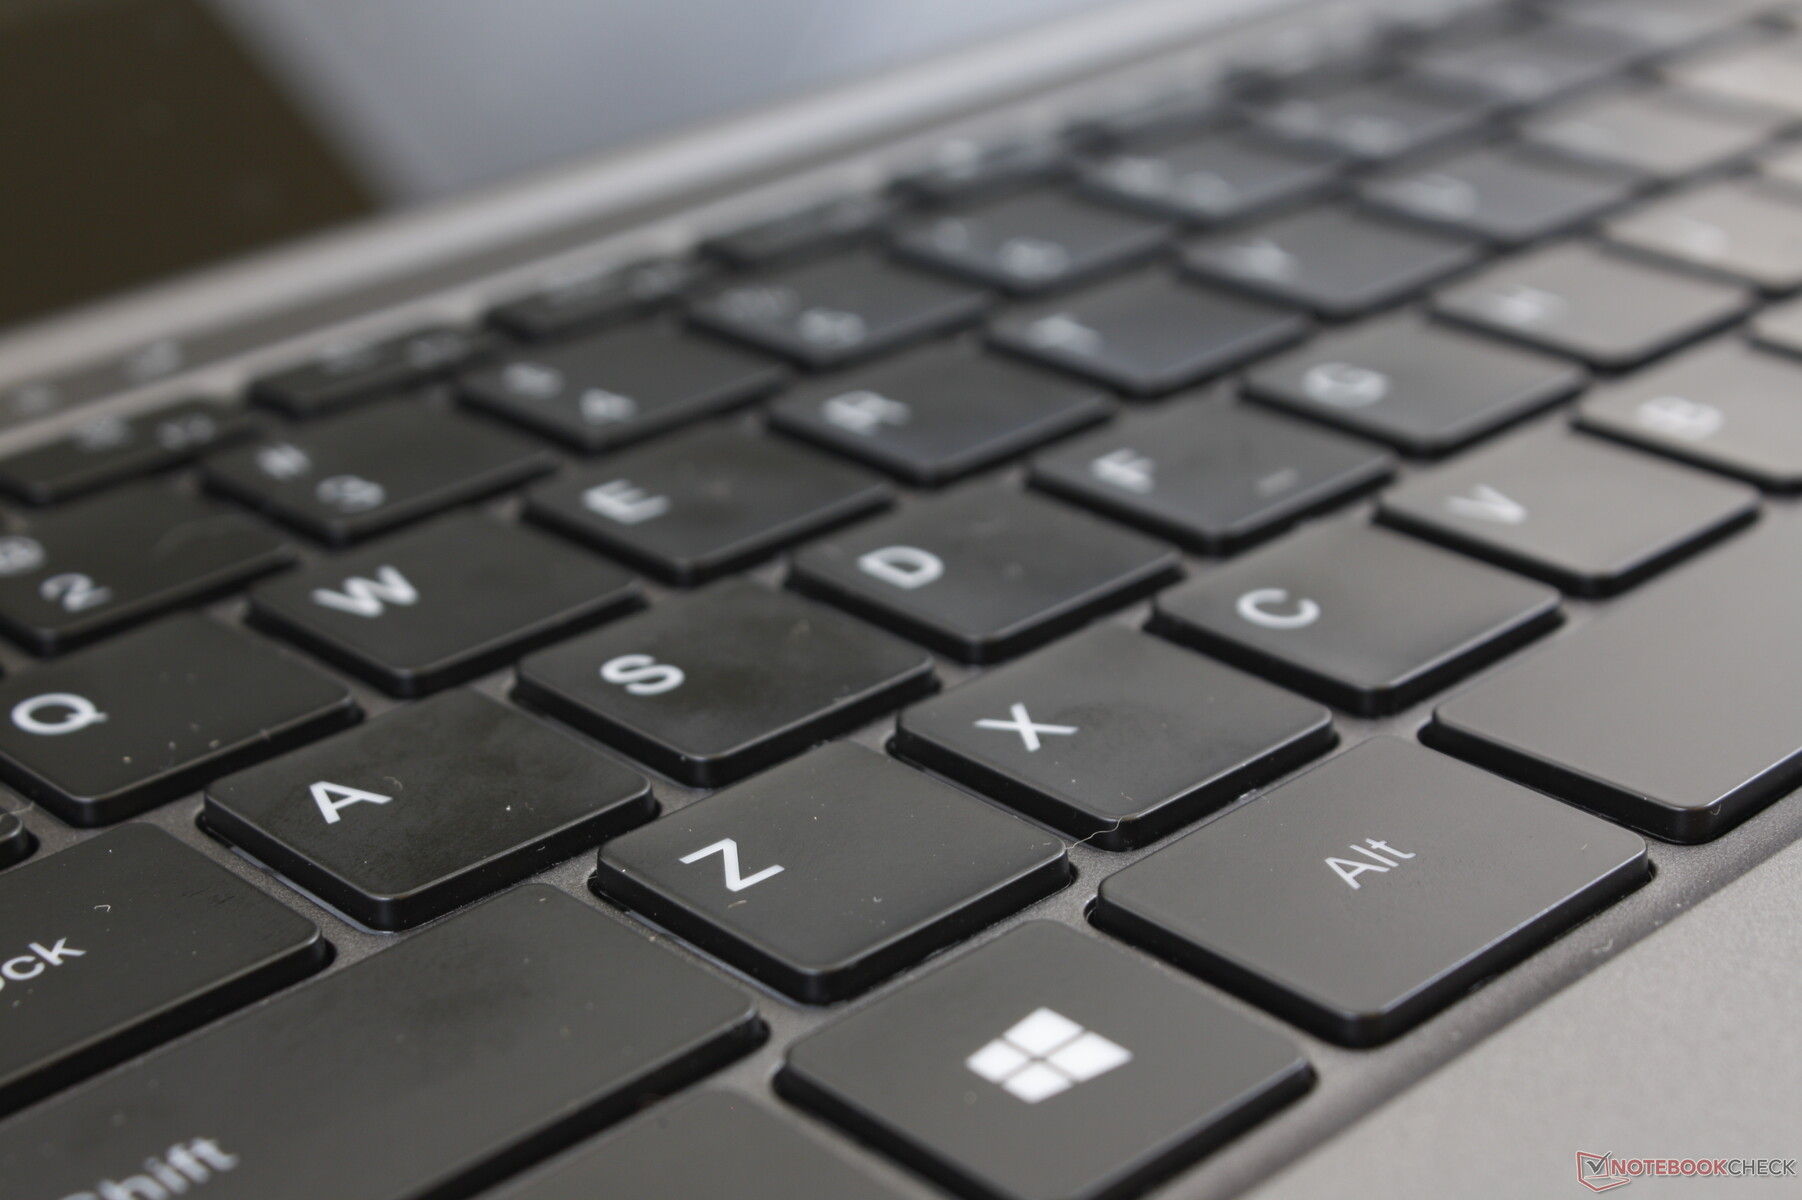
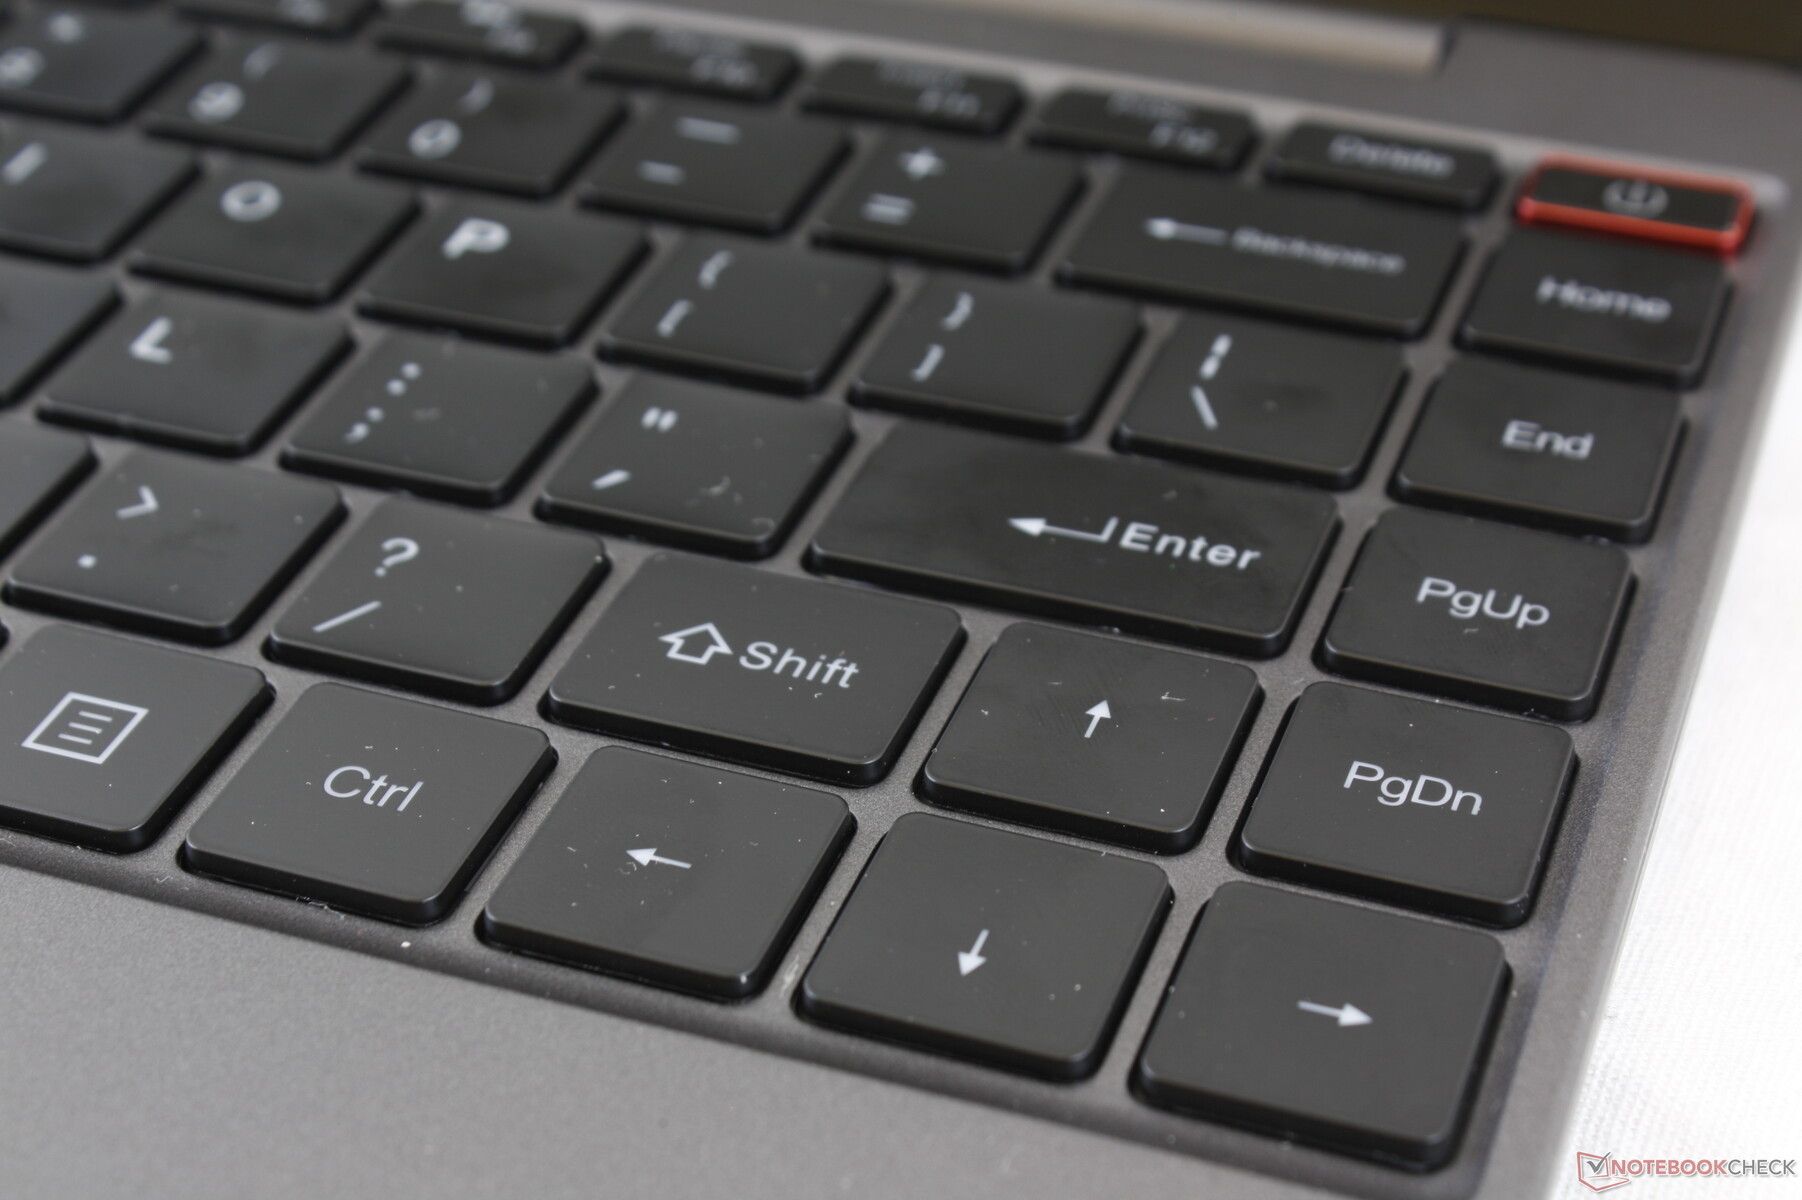
Input Devices
Keyboard
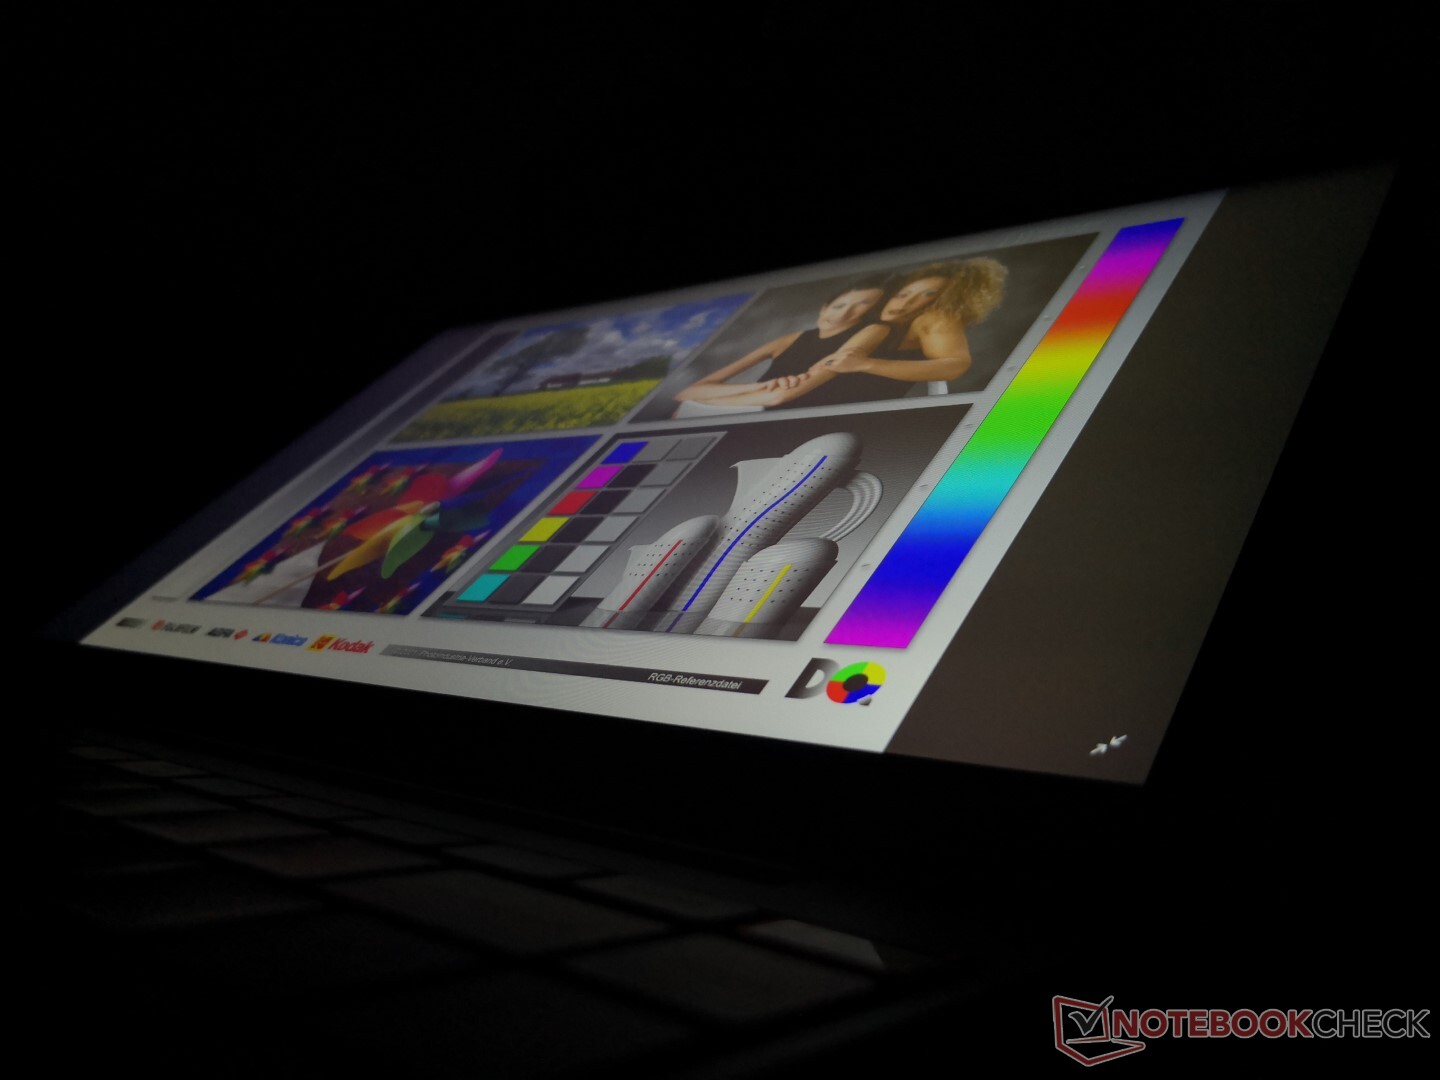
Display
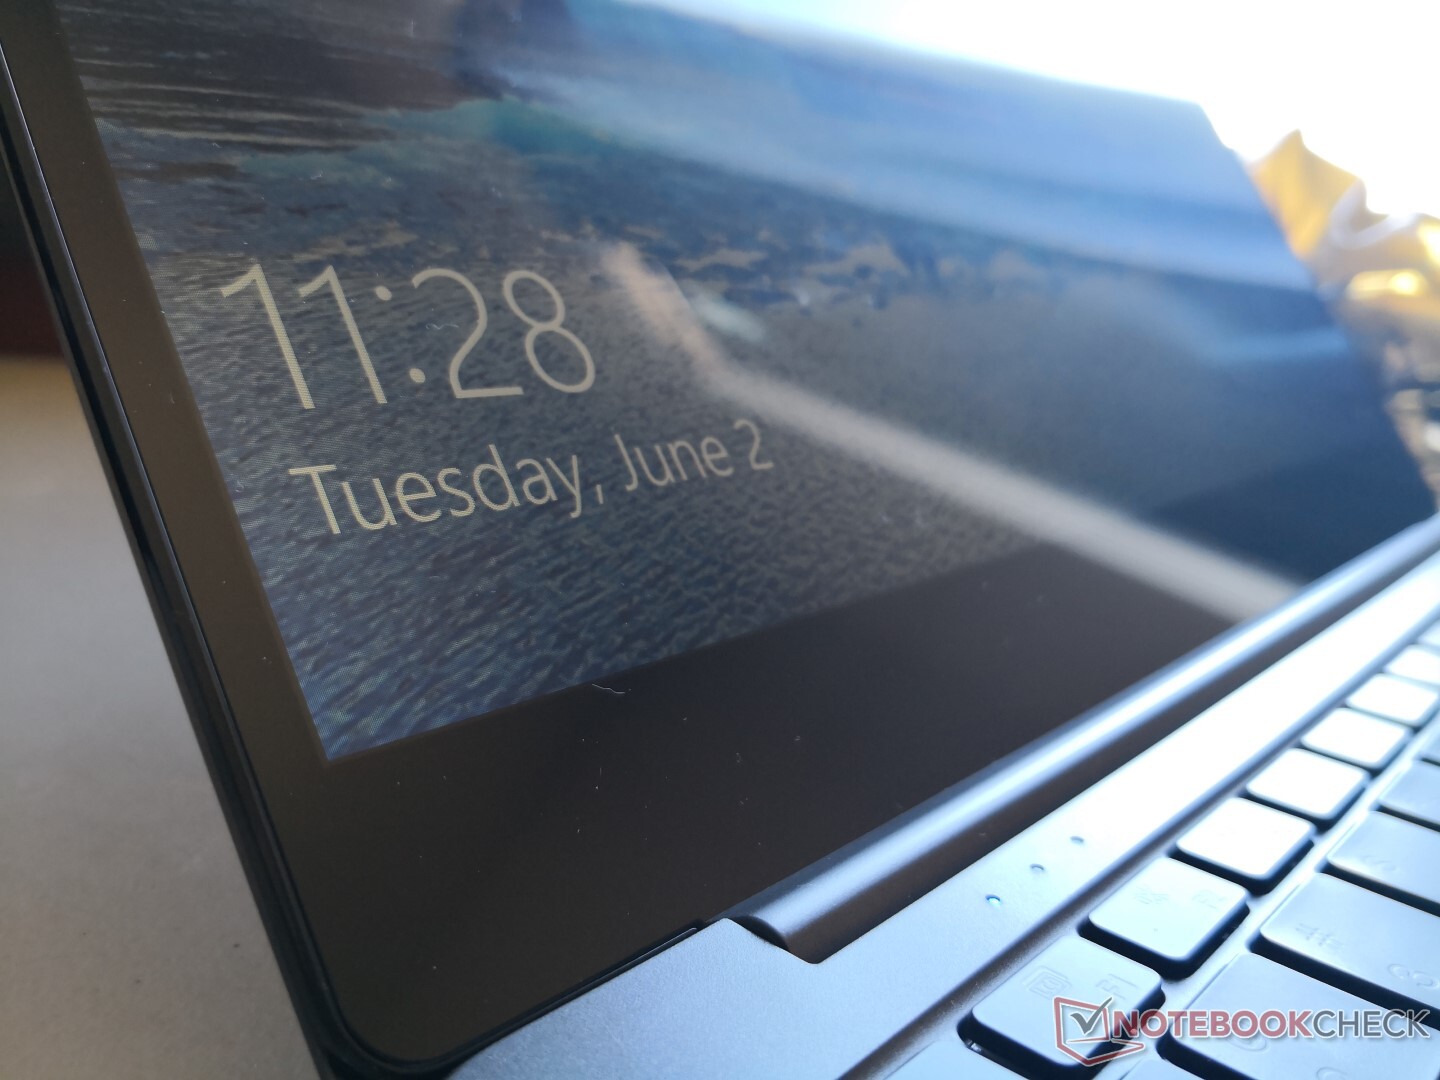
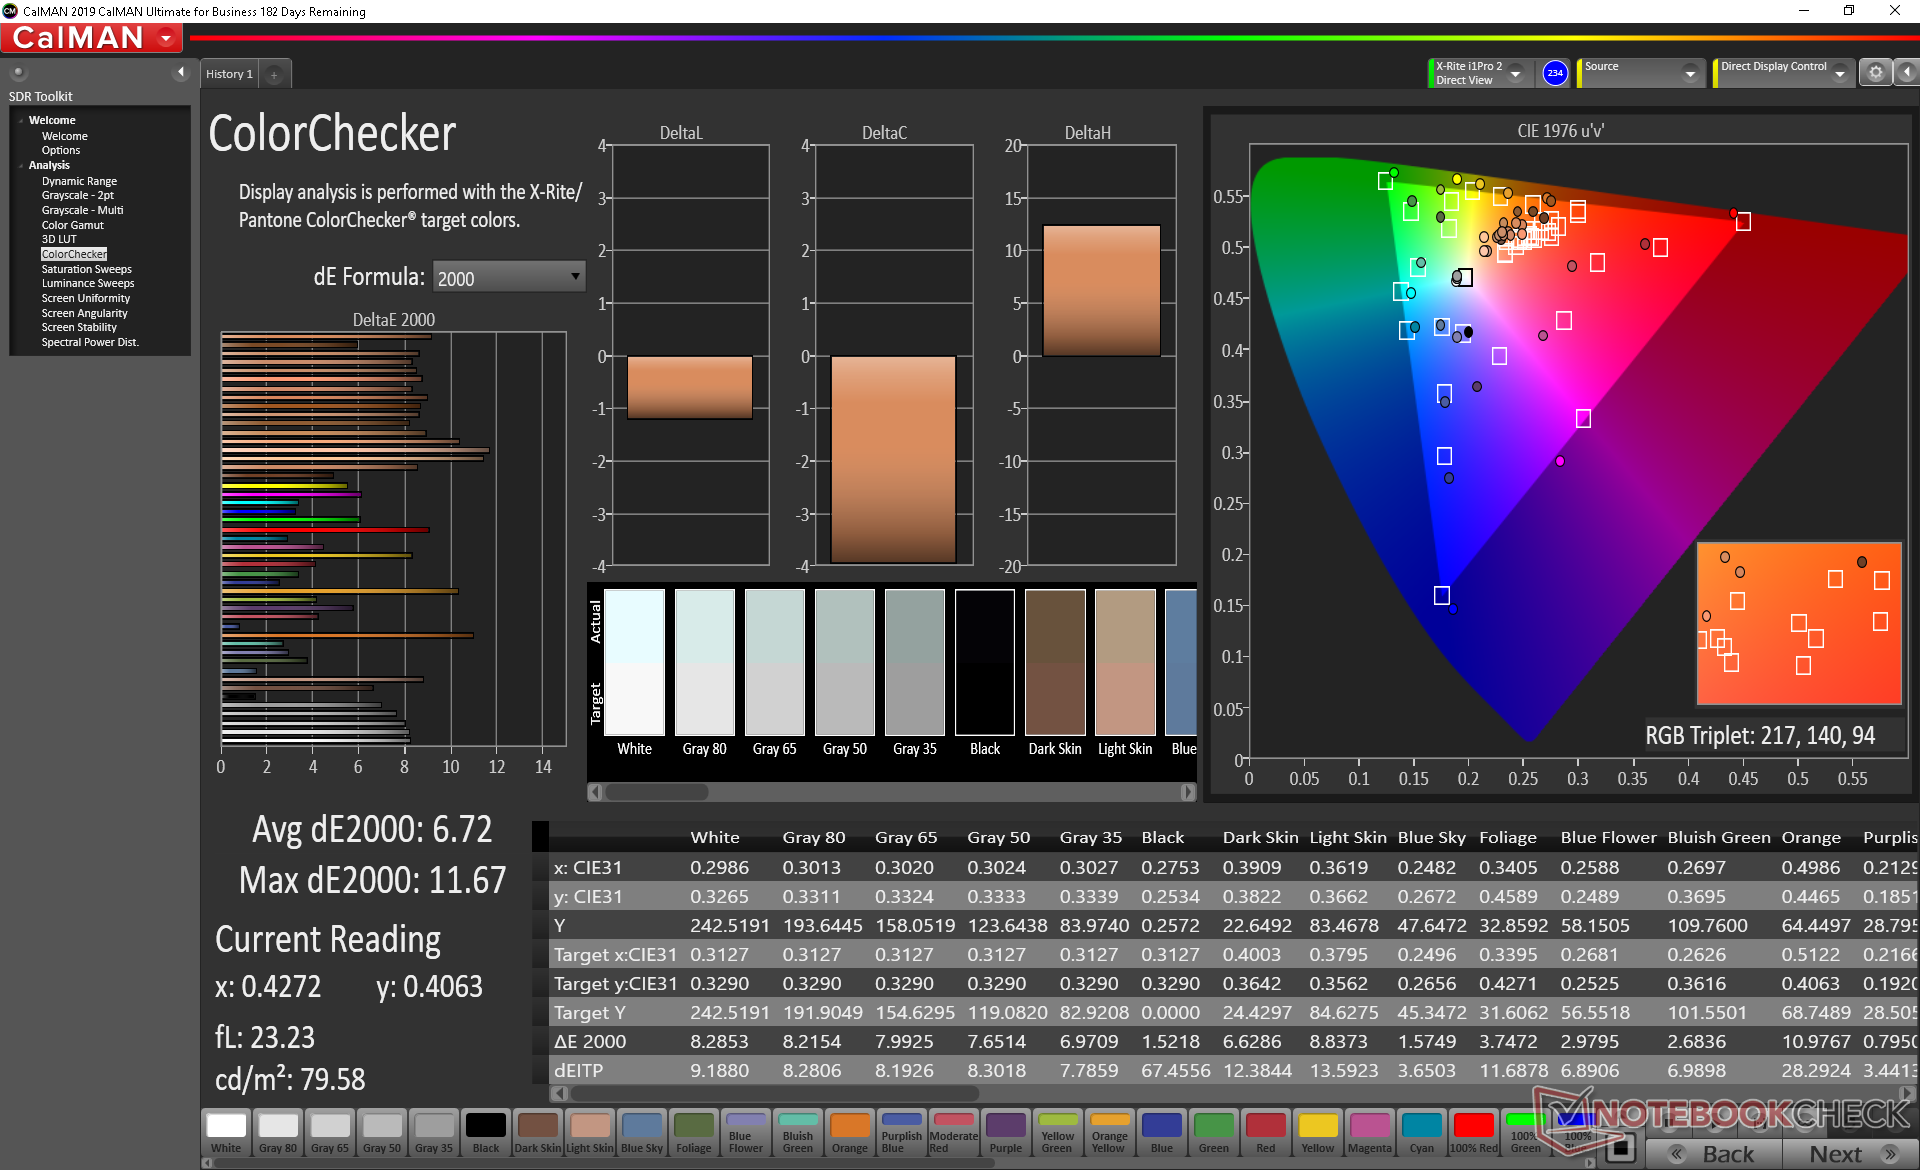
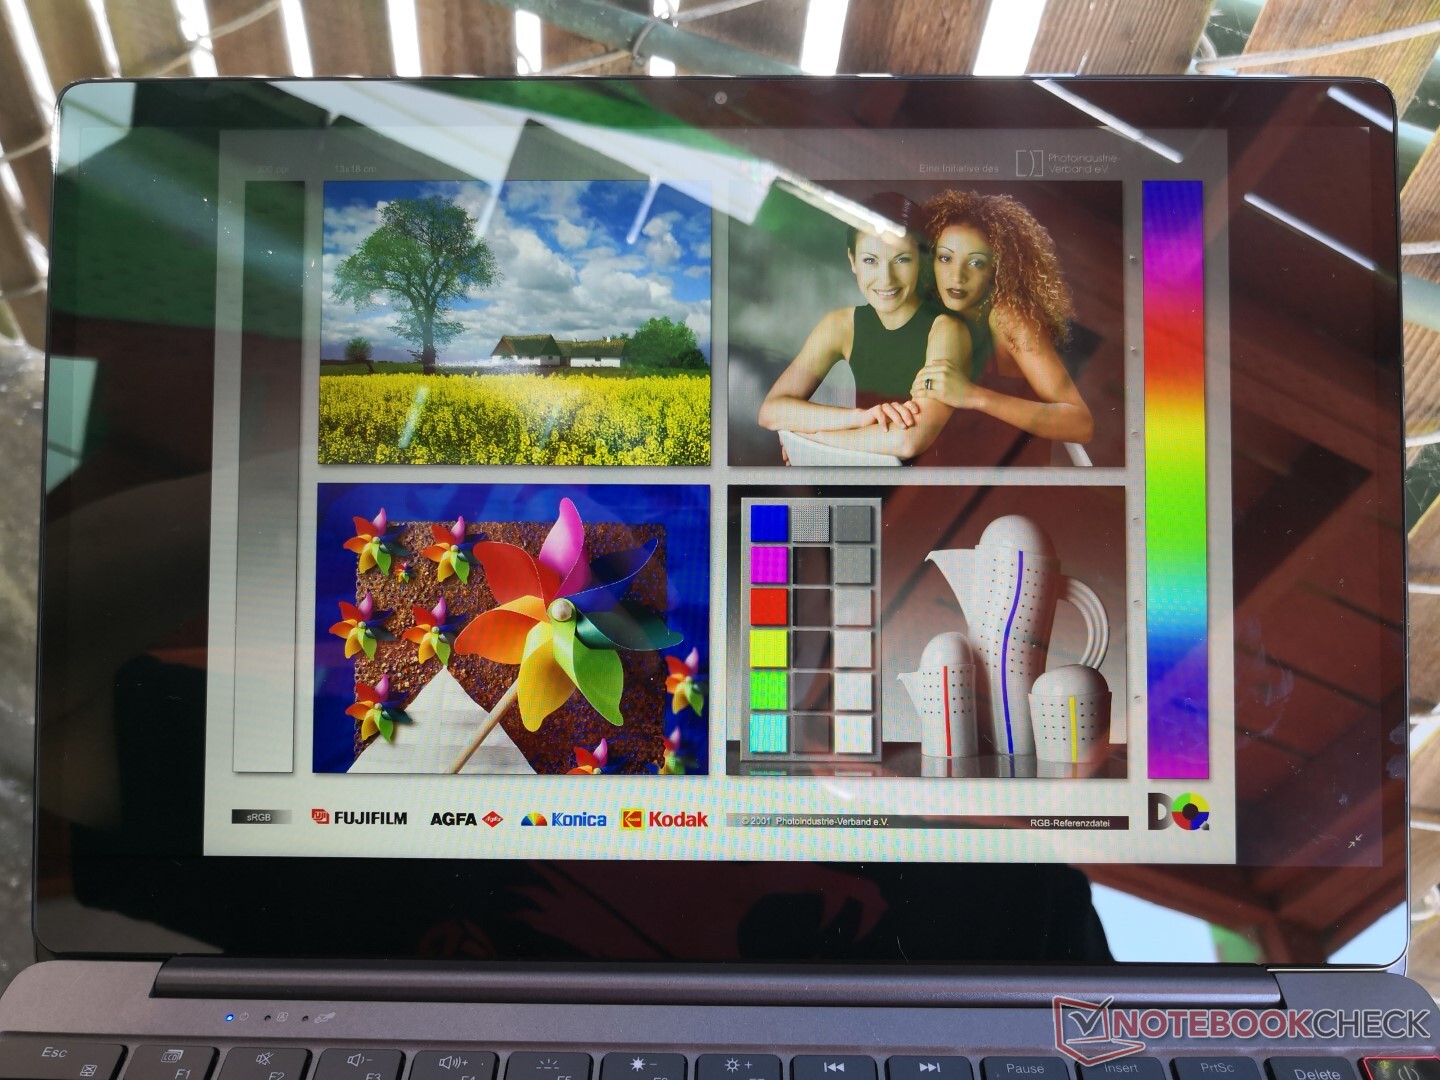
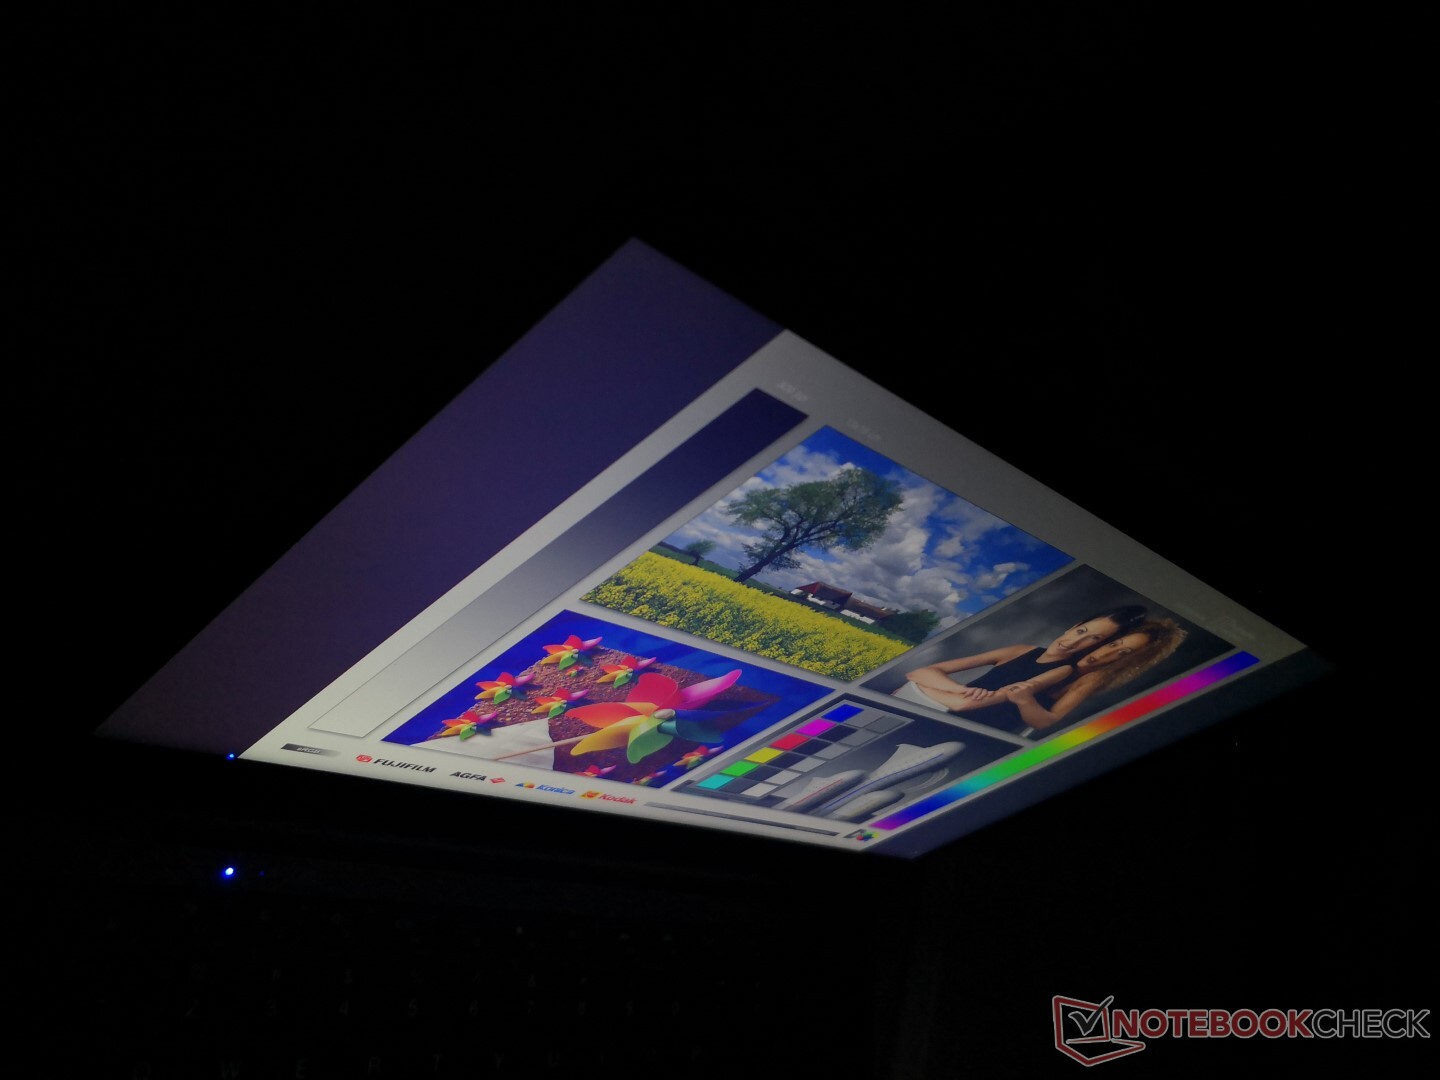
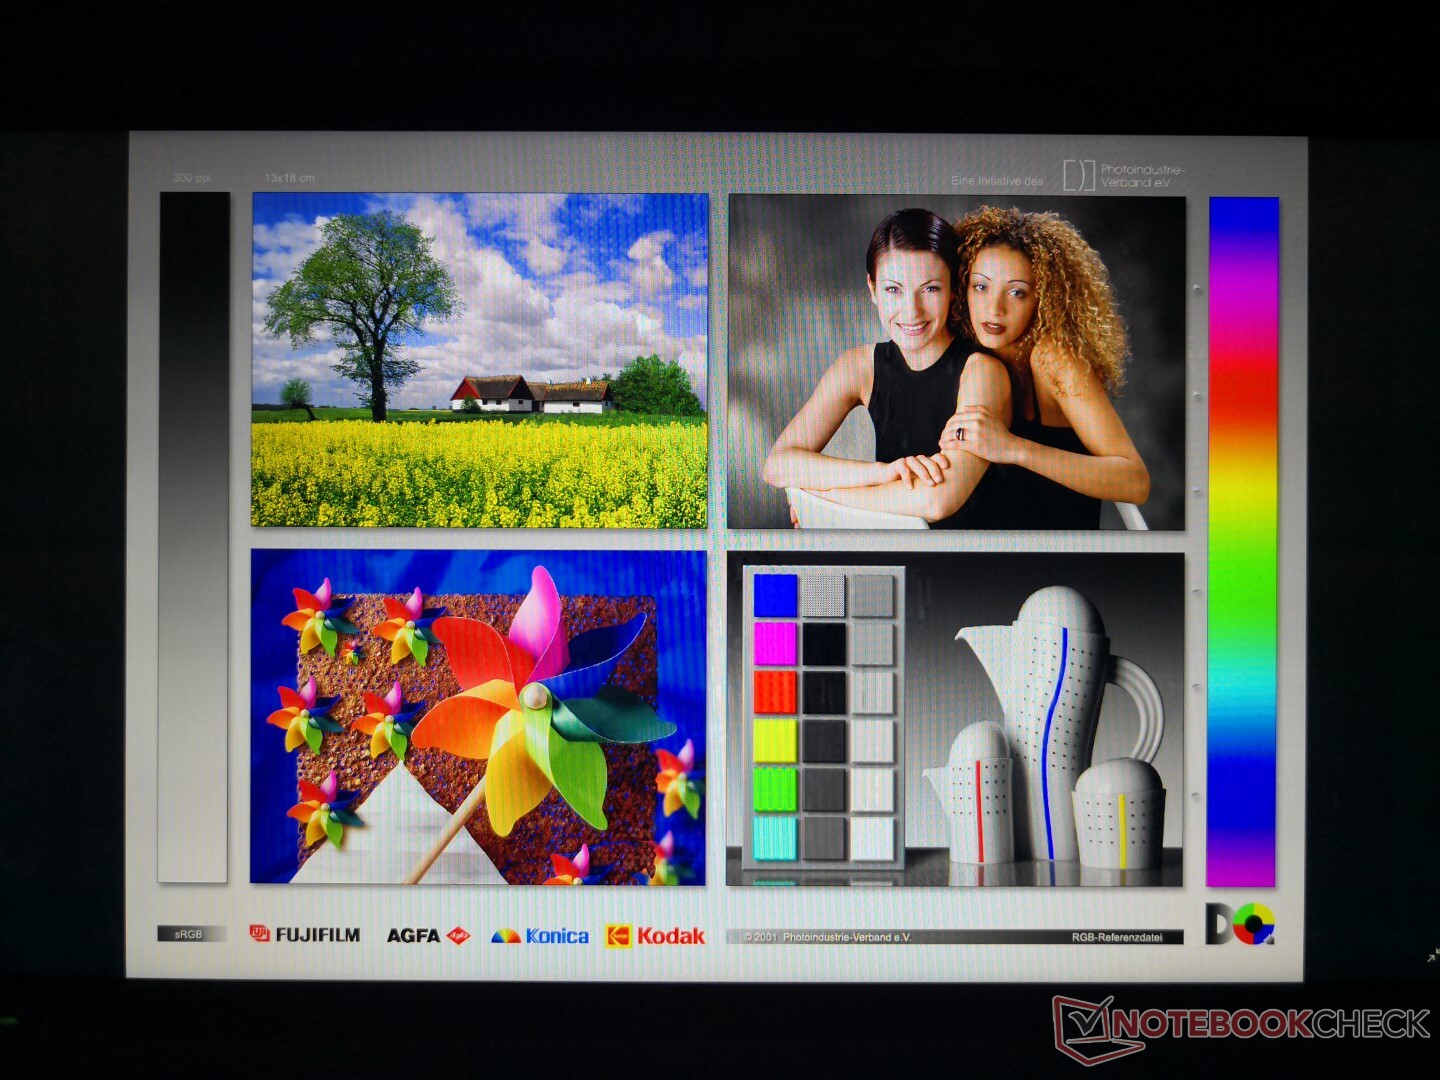
Interestingly, the AeroBook Pro uses a different 1080p BOE NV133FHM-N6A panel than the one found on the 2019 AeroBook. The biggest differences between them are that the display on the newer model is dimmer (242 nits vs. 307 nits) and pulse-width modulation is now even worse at 201 Hz on all brightness levels including maximum. Otherwise, other characteristics like response times, color coverage, and contrast ratio are almost the same. Chuwi laptops tend to have crisp and colorful displays relative to their cheap prices and the AeroBook Pro is no exception.
| |||||||||||||||||||||||||
Brightness Distribution: 88 %
Center on Battery: 242.3 cd/m²
Contrast: 782:1 (Black: 0.31 cd/m²)
ΔE ColorChecker Calman: 6.72 | ∀{0.5-29.43 Ø4.72}
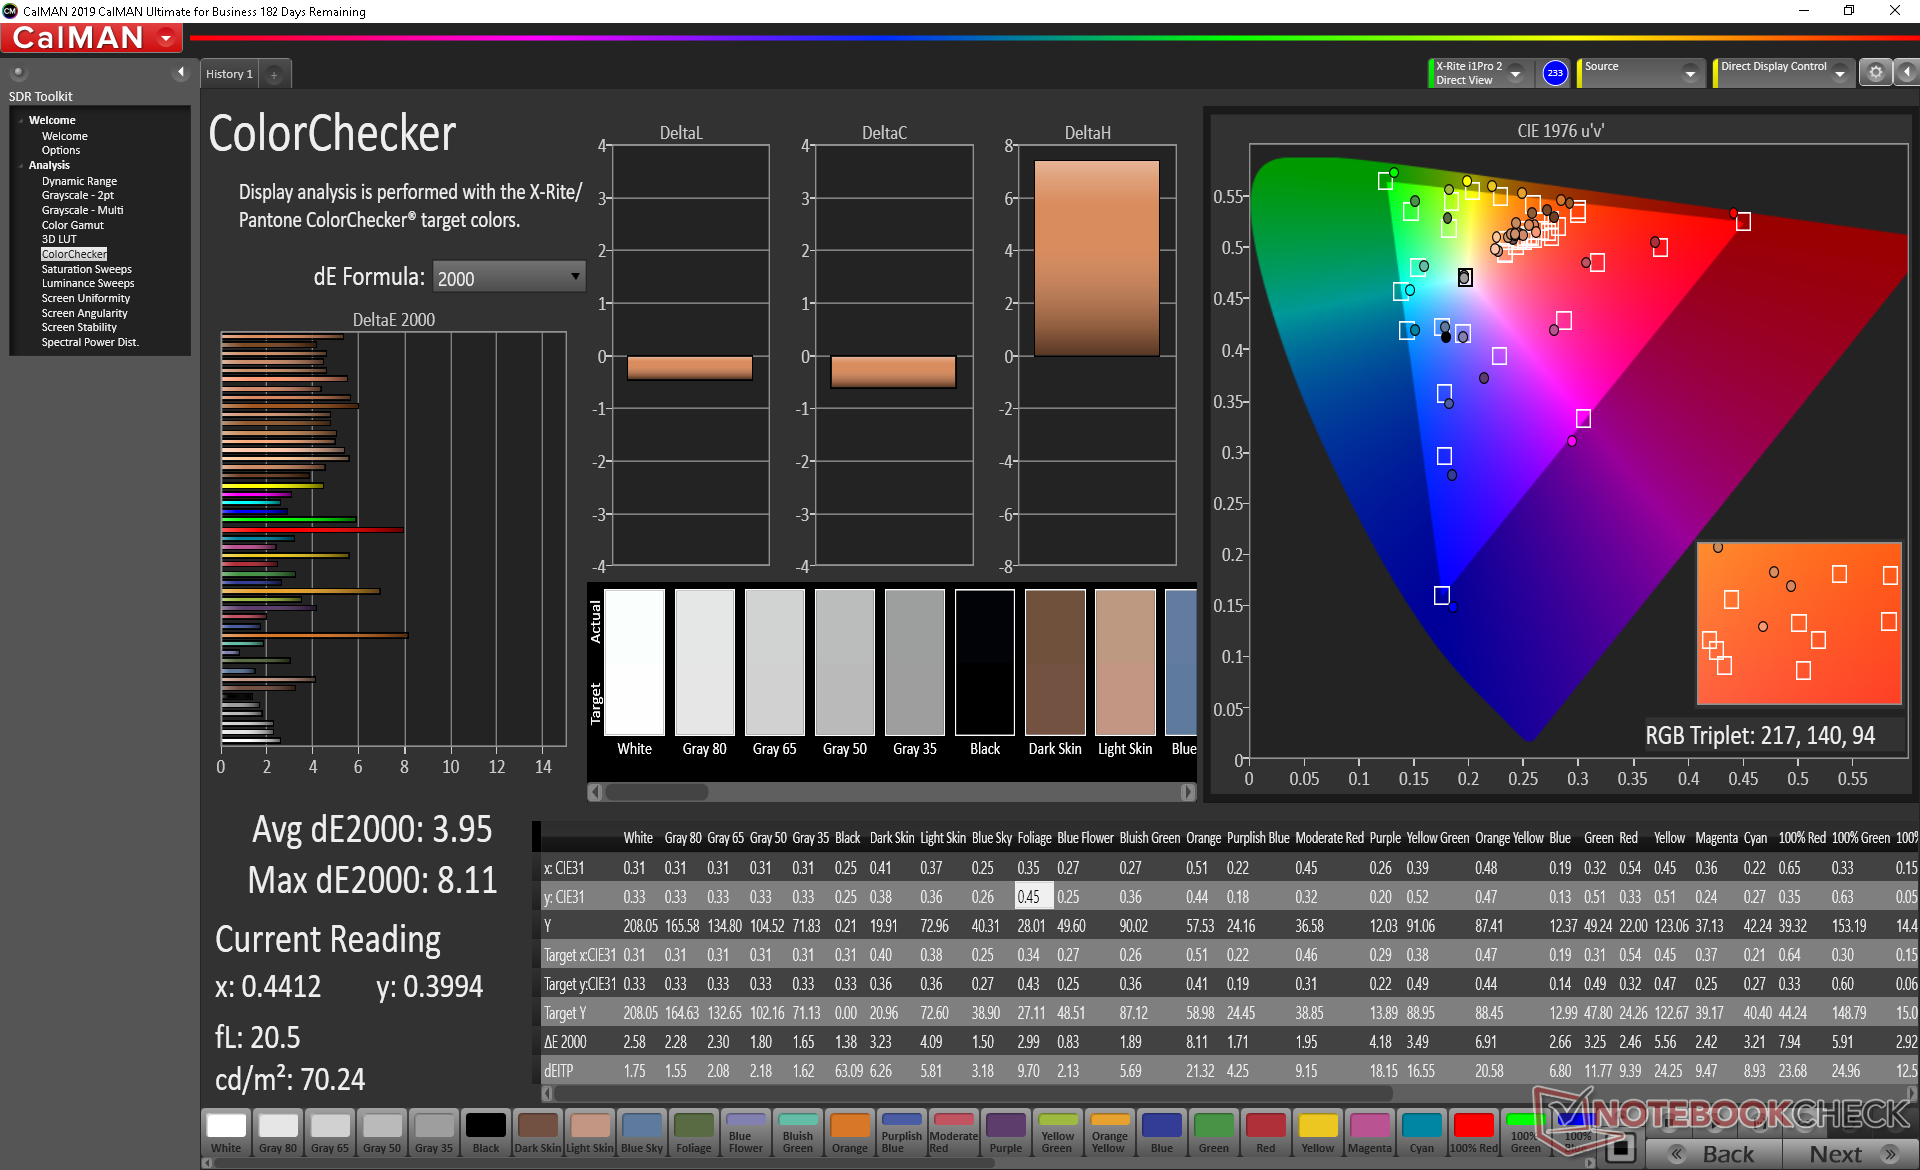
calibrated: 3.95
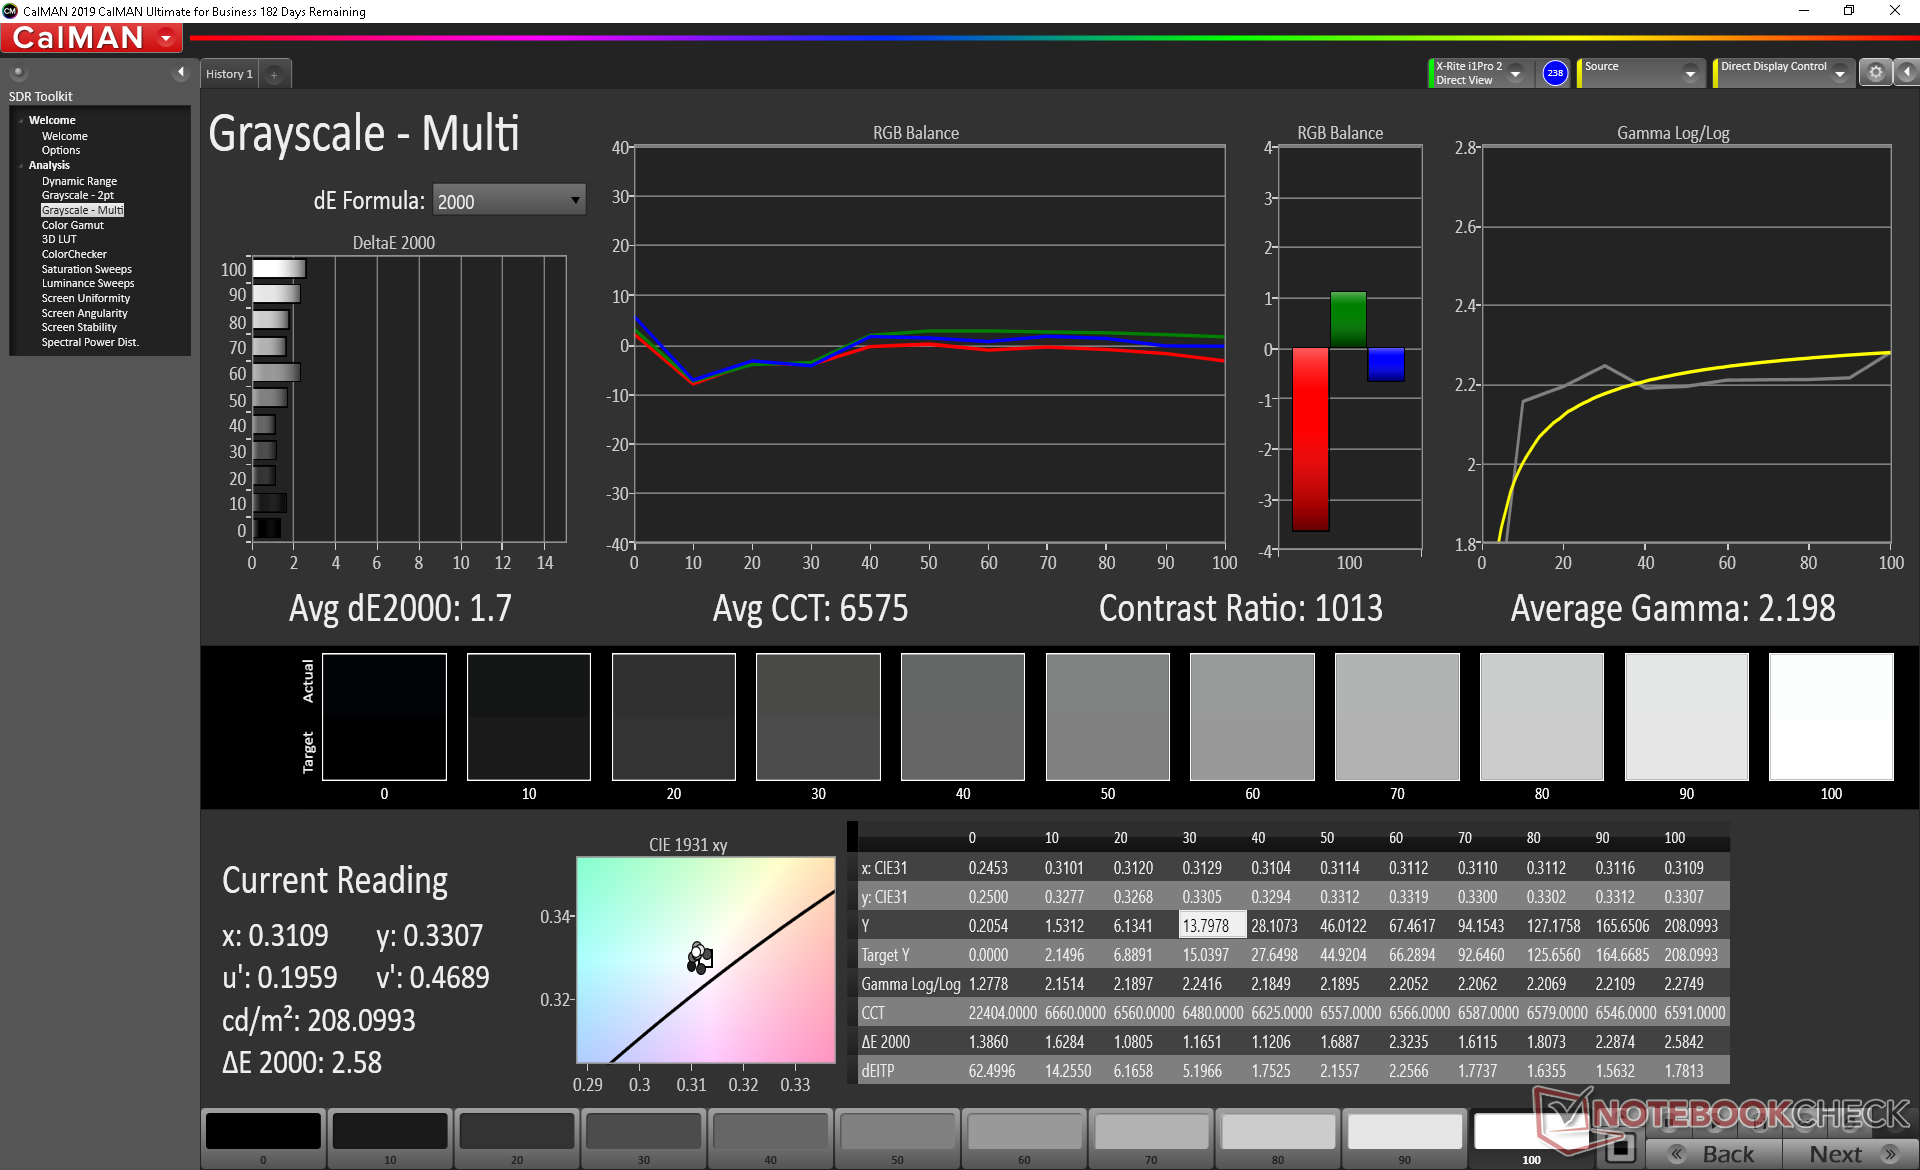
ΔE Greyscale Calman: 6 | ∀{0.09-98 Ø4.96}
87.7% sRGB (Argyll 1.6.3 3D)
57.5% AdobeRGB 1998 (Argyll 1.6.3 3D)
64.4% AdobeRGB 1998 (Argyll 3D)
88% sRGB (Argyll 3D)
68.7% Display P3 (Argyll 3D)
Gamma: 2.18
CCT: 7159 K
| Chuwi AeroBook Pro BOE NV133FHM-N6A, IPS, 13.3", 1920x1080 | Apple MacBook Air 2020 i5 APPA042, IPS, 13.3", 2560x1600 | Dell XPS 13 9300 i5 FHD SHP14CB, IPS, 13.4", 1920x1200 | Jumper EZbook X3 PBTB133F006 A, IPS, 13.3", 1920x1080 | Lenovo Ideapad S530-13IWL BOE07D7, IPS, 13.3", 1920x1080 | |
|---|---|---|---|---|---|
| Display | 8% | 10% | -5% | 1% | |
| Display P3 Coverage (%) | 68.7 | 70.4 2% | 71.5 4% | 60.4 -12% | 68.6 0% |
| sRGB Coverage (%) | 88 | 97.7 11% | 99.4 13% | 88.7 1% | 89.7 2% |
| AdobeRGB 1998 Coverage (%) | 64.4 | 71.7 11% | 73.5 14% | 61.7 -4% | 65.6 2% |
| Response Times | -10% | -49% | -7% | -13% | |
| Response Time Grey 50% / Grey 80% * (ms) | 31 ? | 38.7 ? -25% | 60 ? -94% | 34 ? -10% | 41 ? -32% |
| Response Time Black / White * (ms) | 32 ? | 30.44 ? 5% | 33.2 ? -4% | 33 ? -3% | 30 ? 6% |
| PWM Frequency (Hz) | 201.6 ? | 117000 ? | 2500 ? | 192 ? | |
| Screen | 47% | 57% | -1% | 18% | |
| Brightness middle (cd/m²) | 242.3 | 430 77% | 619 155% | 209 -14% | 306 26% |
| Brightness (cd/m²) | 233 | 405 74% | 591 154% | 203 -13% | 287 23% |
| Brightness Distribution (%) | 88 | 89 1% | 91 3% | 95 8% | 78 -11% |
| Black Level * (cd/m²) | 0.31 | 0.32 -3% | 0.35 -13% | 0.2 35% | 0.21 32% |
| Contrast (:1) | 782 | 1344 72% | 1769 126% | 1045 34% | 1457 86% |
| Colorchecker dE 2000 * | 6.72 | 1.8 73% | 3 55% | 8.43 -25% | 5.96 11% |
| Colorchecker dE 2000 max. * | 11.67 | 4.6 61% | 8.2 30% | 14.77 -27% | 11.34 3% |
| Colorchecker dE 2000 calibrated * | 3.95 | 1.6 59% | 1 75% | 1.68 57% | 2.69 32% |
| Greyscale dE 2000 * | 6 | 1.1 82% | 5.2 13% | 9.81 -64% | 6.9 -15% |
| Gamma | 2.18 101% | 2.14 103% | 2.46 89% | 2.35 94% | |
| CCT | 7159 91% | 6644 98% | 6340 103% | 10135 64% | 7554 86% |
| Color Space (Percent of AdobeRGB 1998) (%) | 57.5 | 64.2 12% | 66.9 16% | 57 -1% | 59 3% |
| Color Space (Percent of sRGB) (%) | 87.7 | 97.6 11% | 99.3 13% | 89 1% | 90 3% |
| Total Average (Program / Settings) | 15% /
33% | 6% /
35% | -4% /
-2% | 2% /
11% |
* ... smaller is better
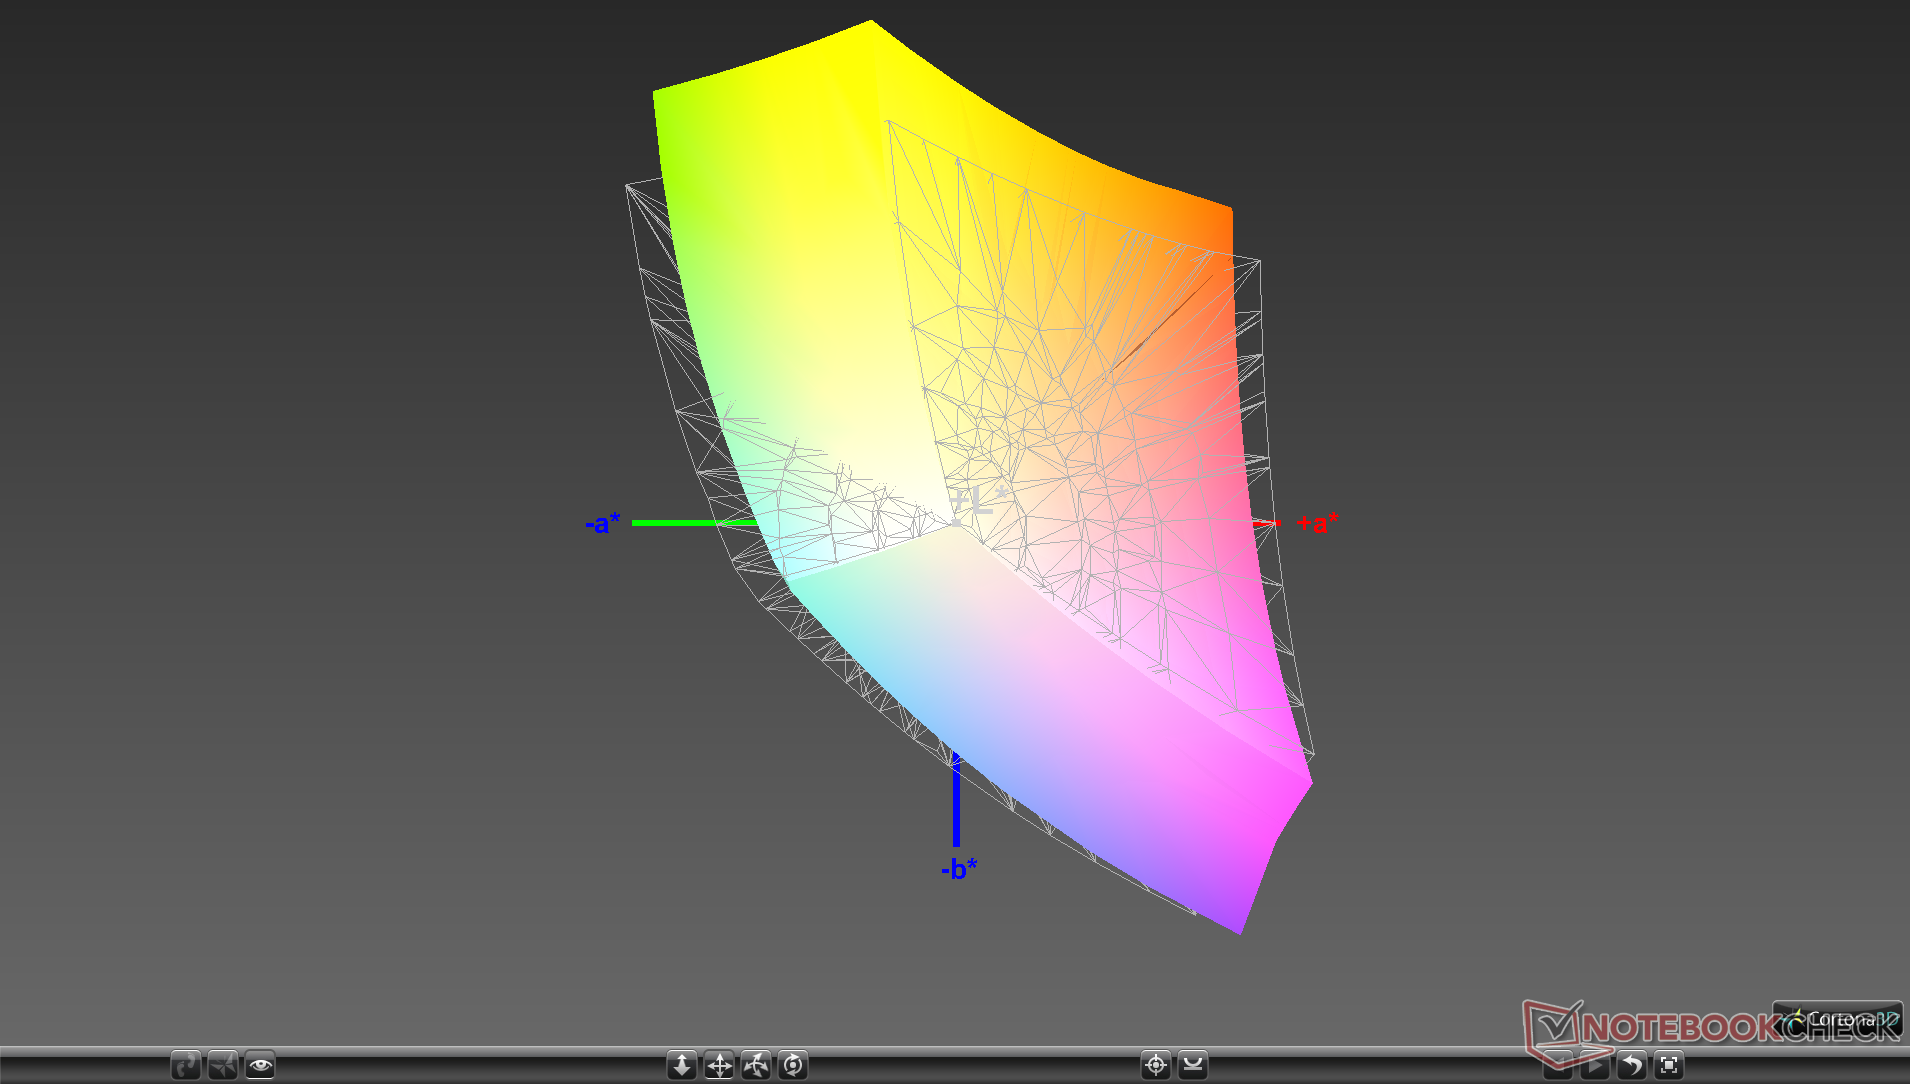
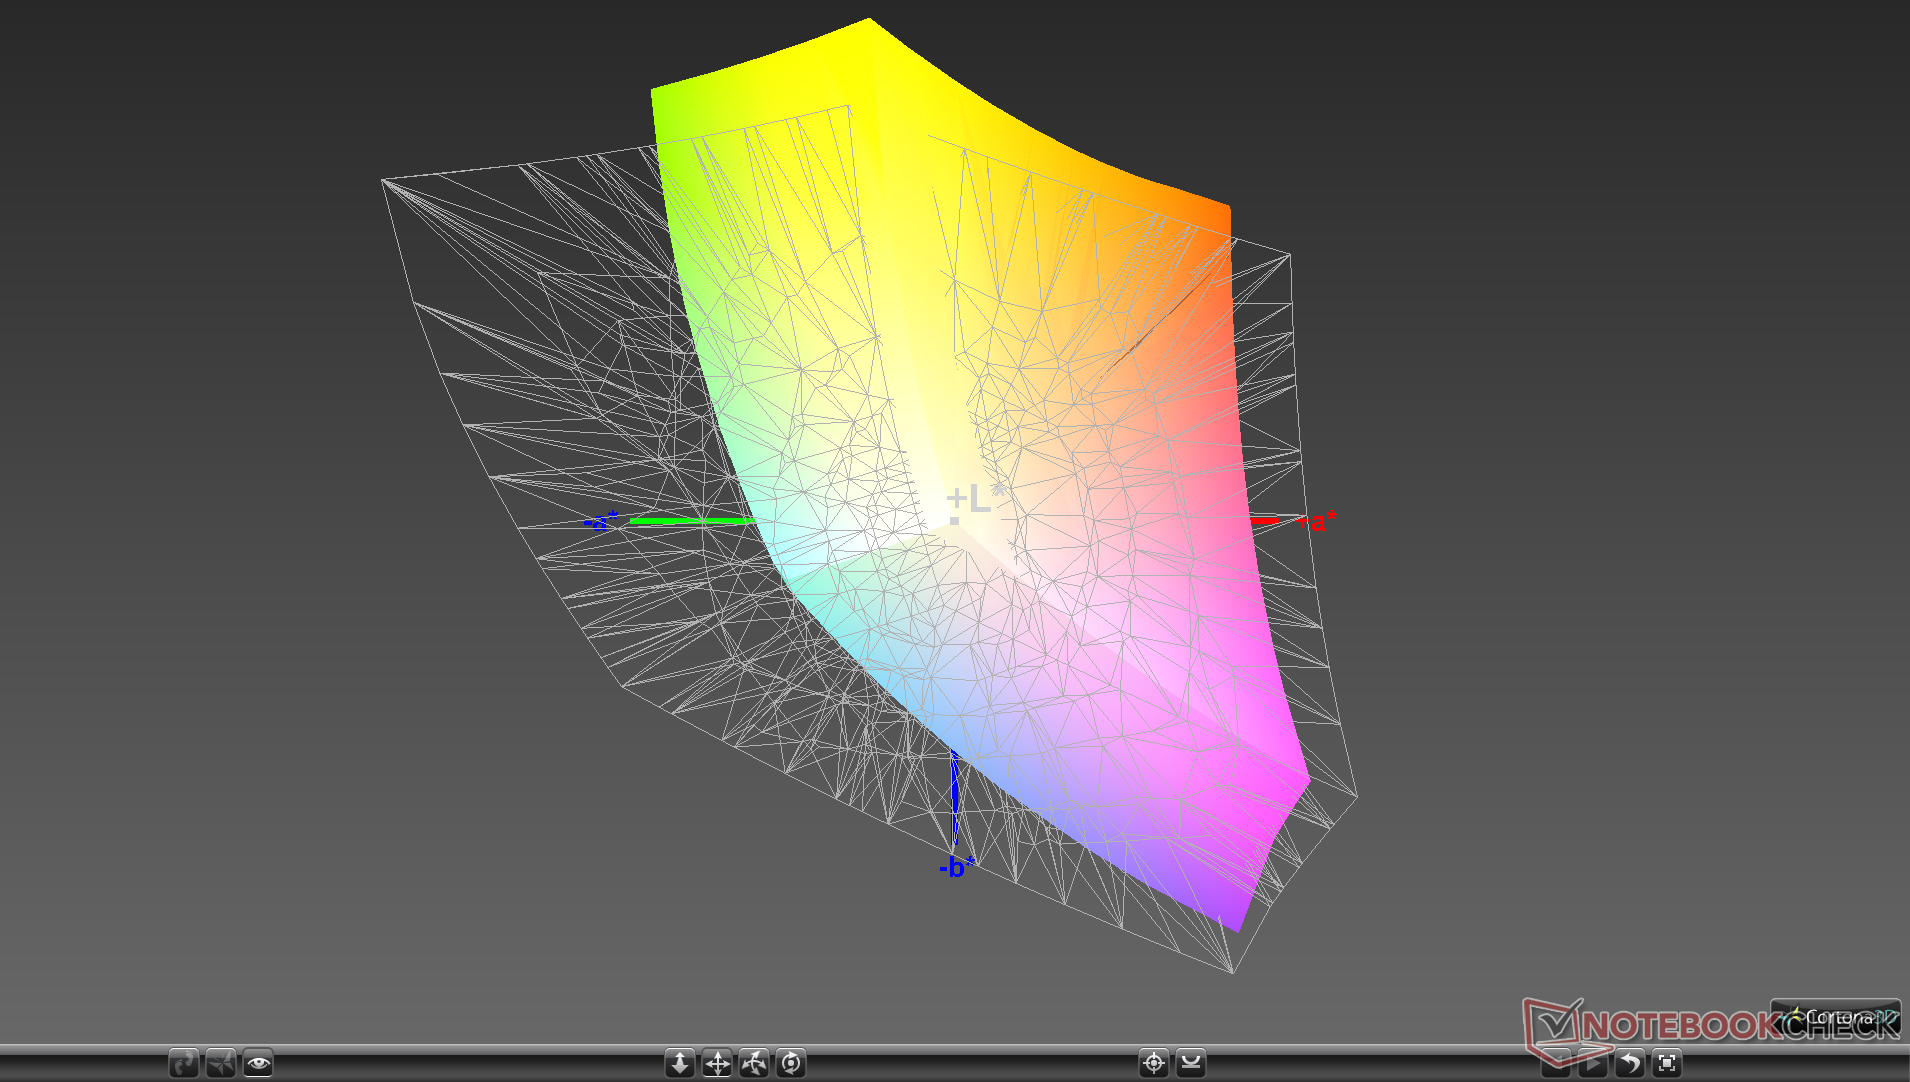
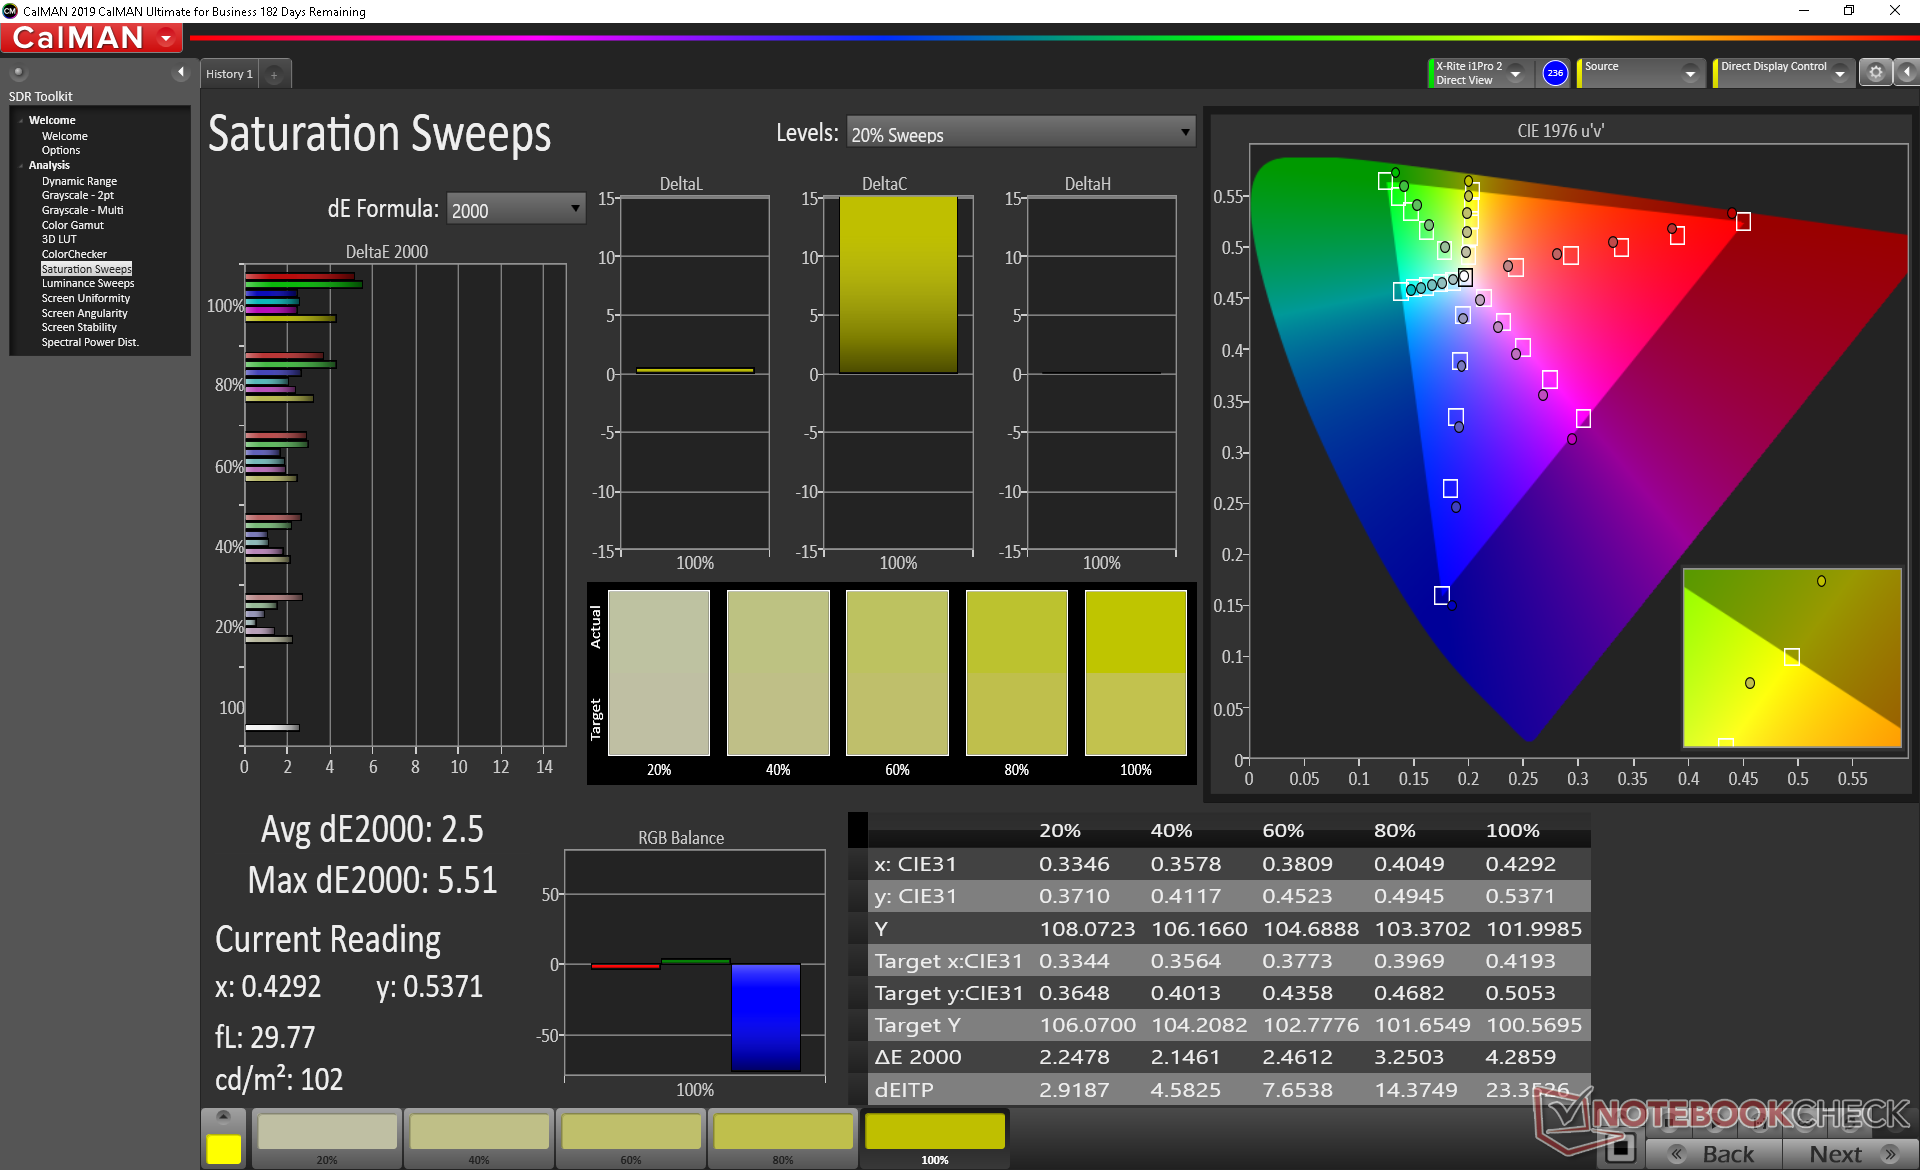
Color space covers approximately 88 percent of sRGB to be almost as wide as the color spaces on most flagship Ultrabooks. The color spaces on the MacBook Air and XPS 13, however, are measurably wider to cover all of the sRGB standard.
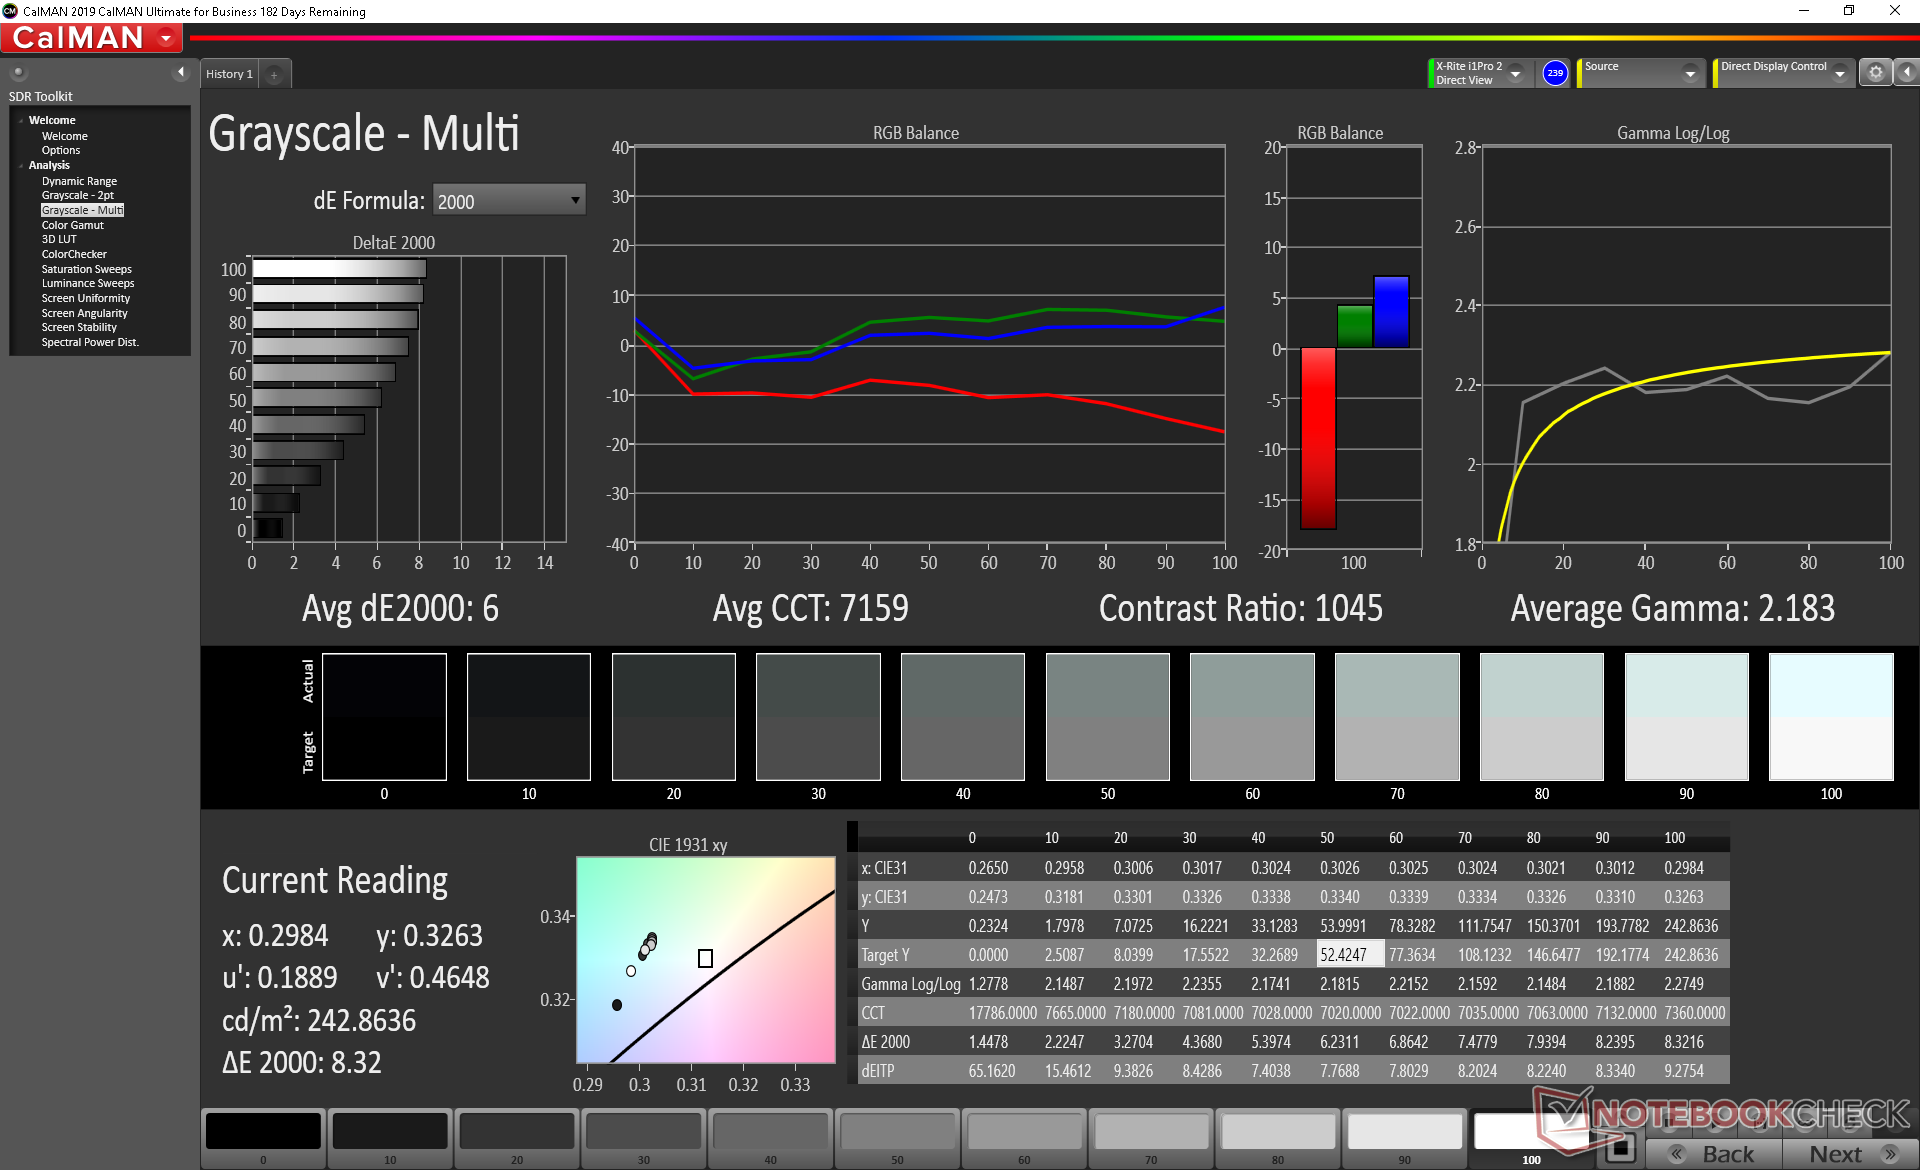
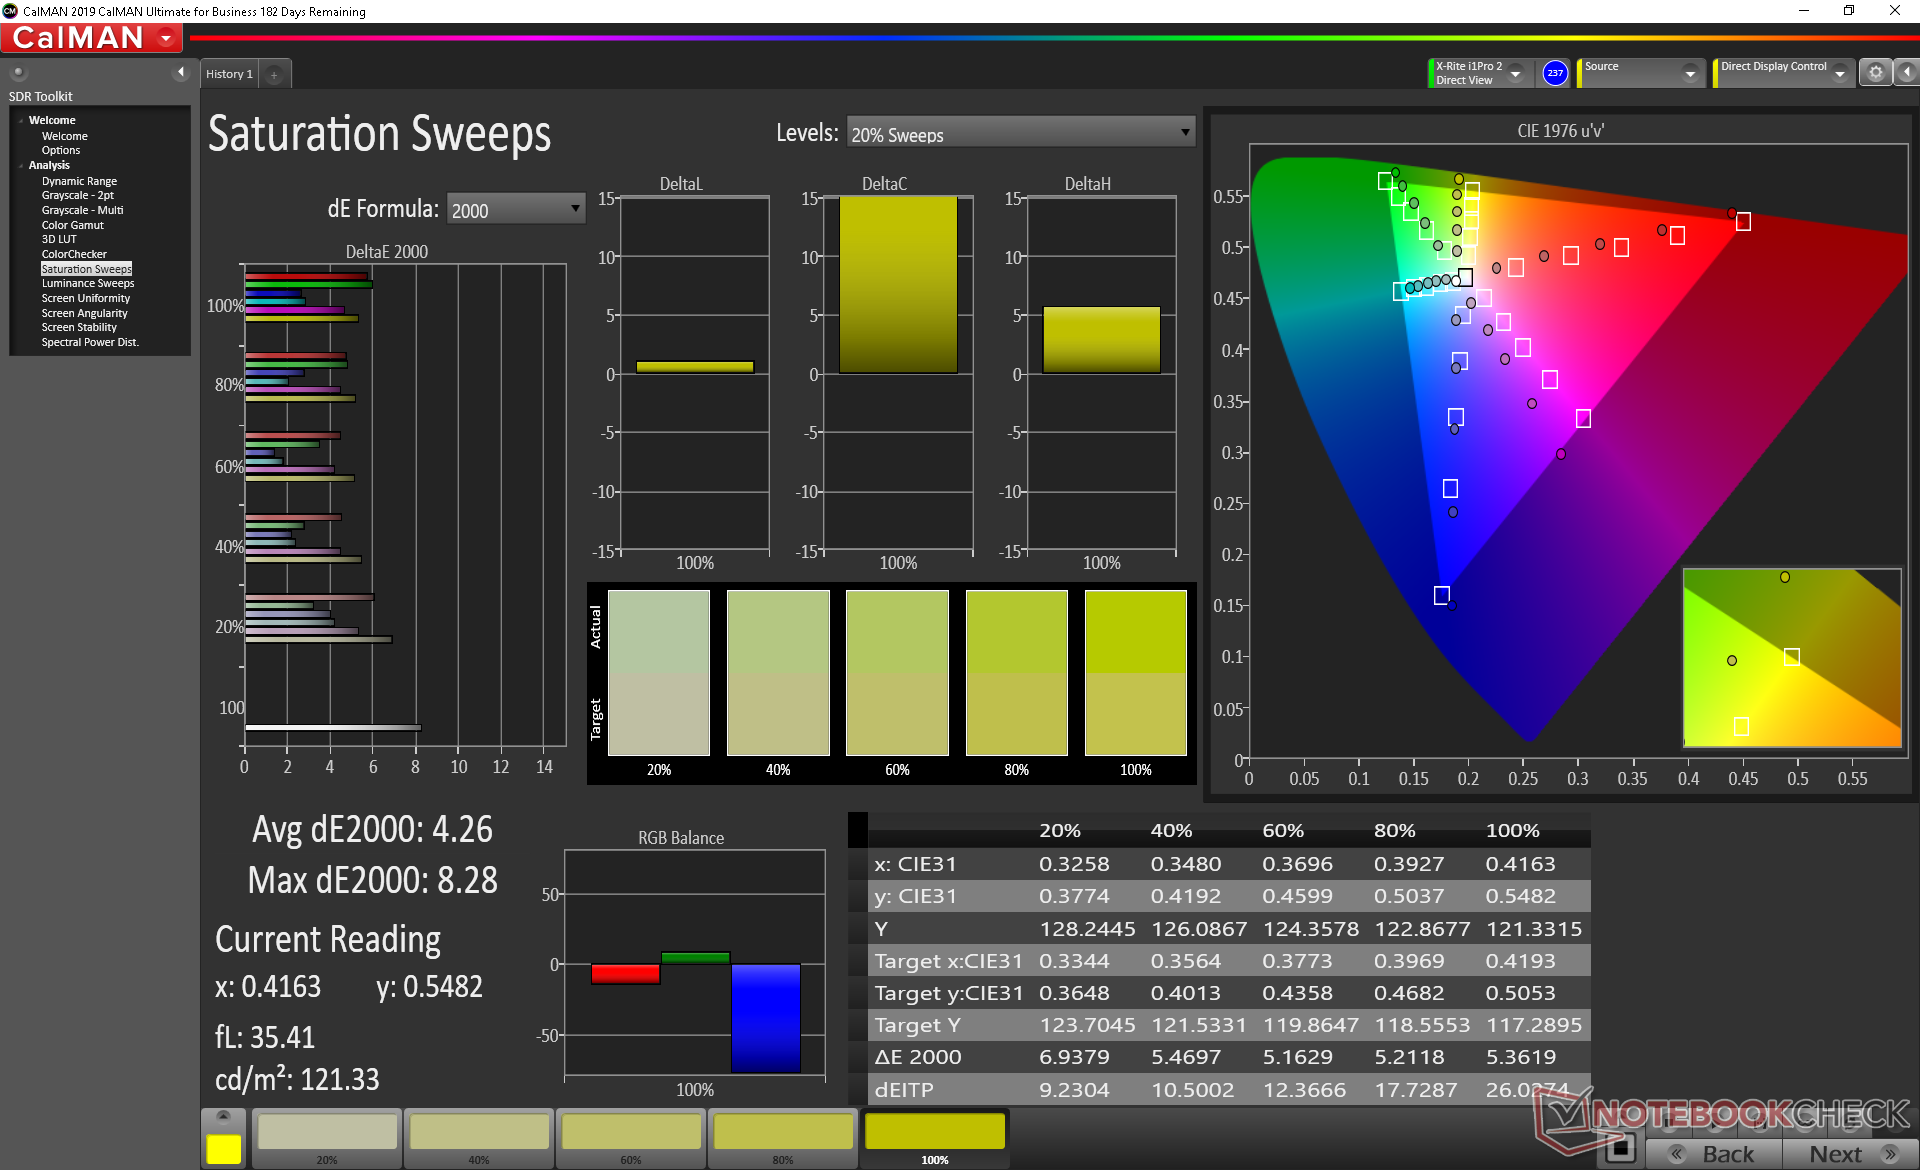
Further measurements with an X-Rite colorimeter reveal a poorly calibrated display out of the box. Color temperature, for example, is overly cool which is typical of budget laptops. Calibrating the panel ourselves would improve both colors and grayscale significantly. We recommend applying our ICM profile above to get the most out of the your display.
Display Response Times
| ↔ Response Time Black to White | ||
|---|---|---|
| 32 ms ... rise ↗ and fall ↘ combined | ↗ 16 ms rise | 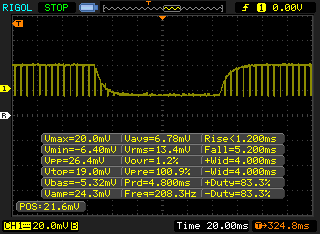 |
| ↘ 16 ms fall | ||
| The screen shows slow response rates in our tests and will be unsatisfactory for gamers. In comparison, all tested devices range from 0.1 (minimum) to 240 (maximum) ms. » 86 % of all devices are better. This means that the measured response time is worse than the average of all tested devices (19.8 ms). | ||
| ↔ Response Time 50% Grey to 80% Grey | ||
| 31 ms ... rise ↗ and fall ↘ combined | ↗ 16 ms rise | 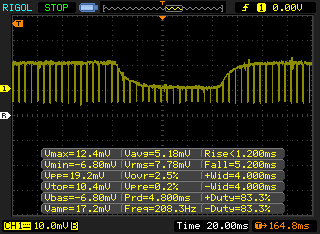 |
| ↘ 15 ms fall | ||
| The screen shows slow response rates in our tests and will be unsatisfactory for gamers. In comparison, all tested devices range from 0.165 (minimum) to 636 (maximum) ms. » 42 % of all devices are better. This means that the measured response time is similar to the average of all tested devices (31 ms). | ||
Screen Flickering / PWM (Pulse-Width Modulation)
| Screen flickering / PWM detected | 201.6 Hz | ≤ 100 % brightness setting | 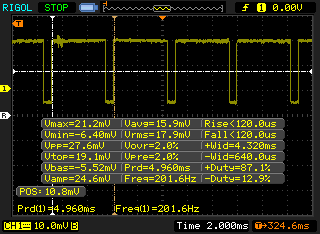 |
The display backlight flickers at 201.6 Hz (worst case, e.g., utilizing PWM) Flickering detected at a brightness setting of 100 % and below. There should be no flickering or PWM above this brightness setting. The frequency of 201.6 Hz is relatively low, so sensitive users will likely notice flickering and experience eyestrain at the stated brightness setting and below. In comparison: 52 % of all tested devices do not use PWM to dim the display. If PWM was detected, an average of 7747 (minimum: 5 - maximum: 343500) Hz was measured. | |||
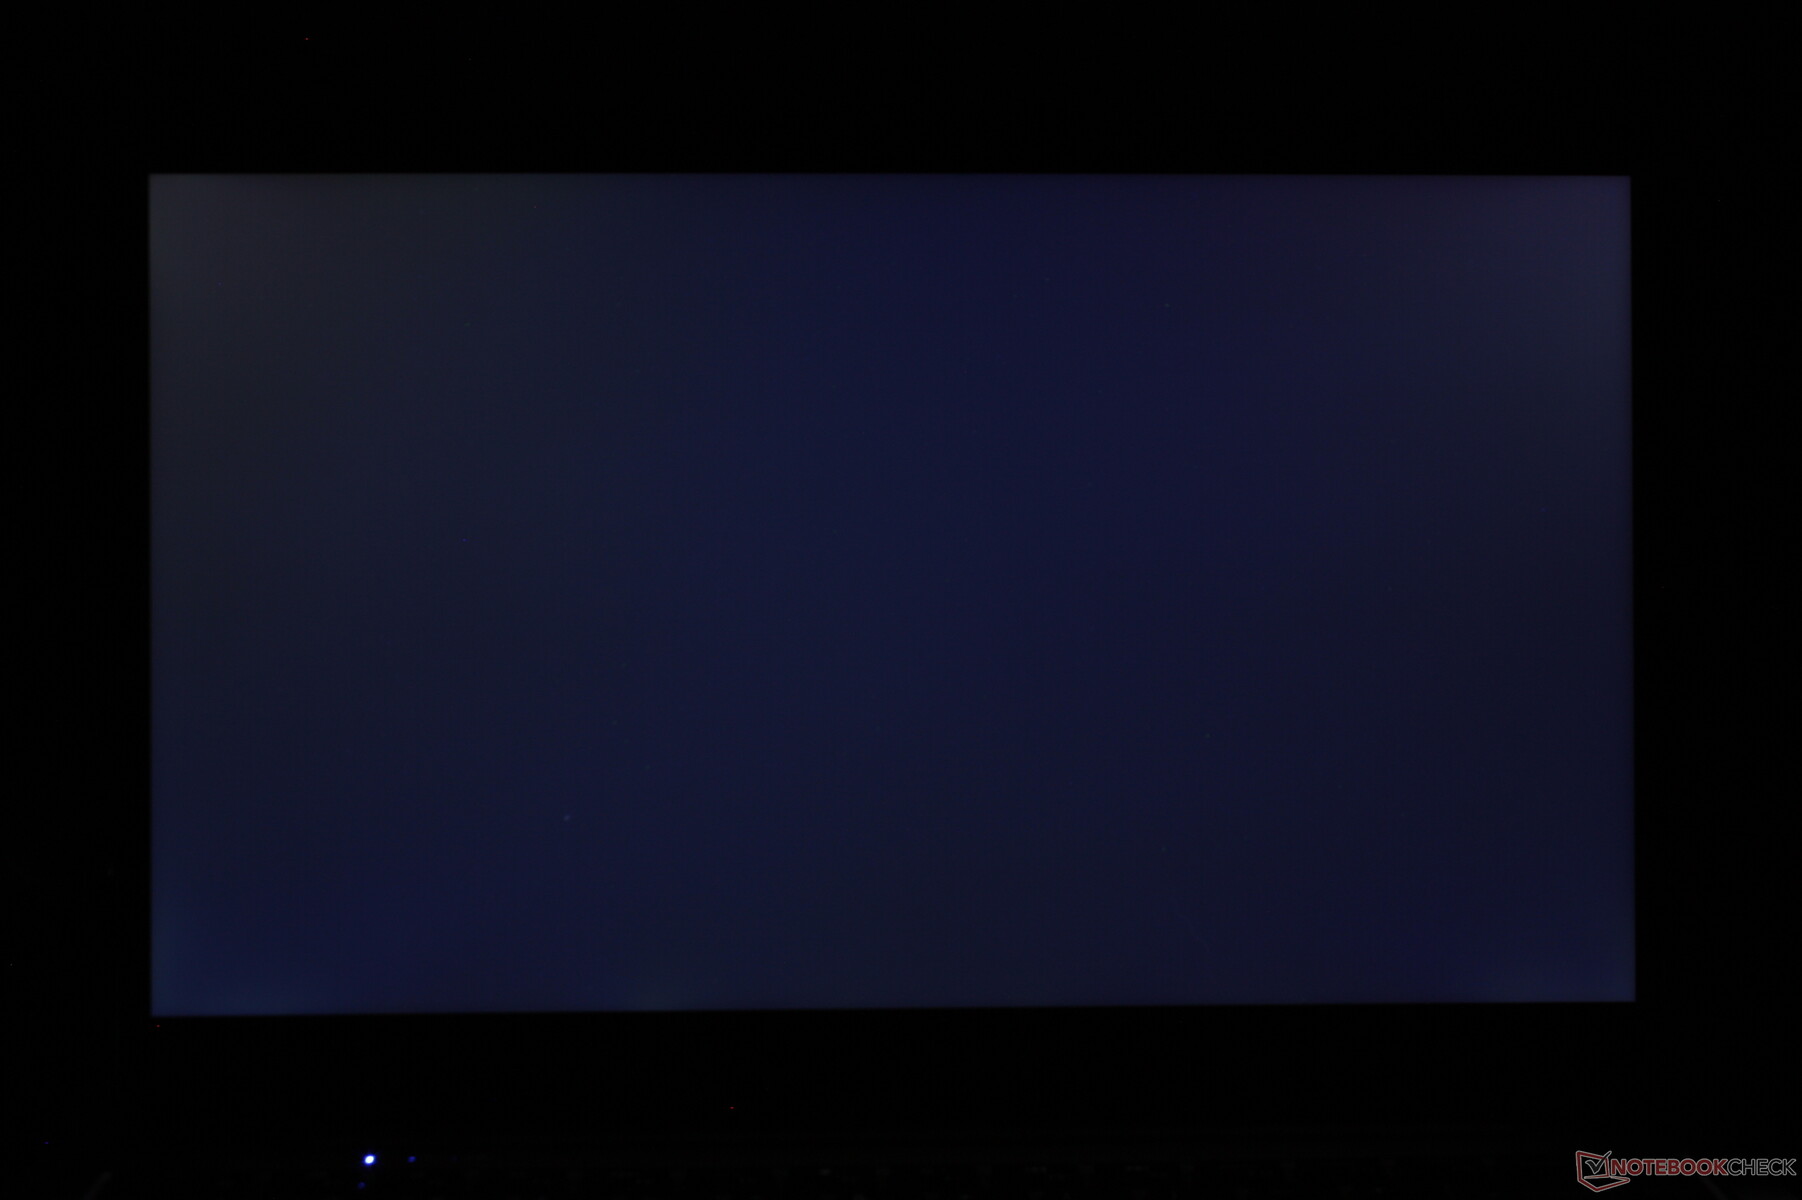
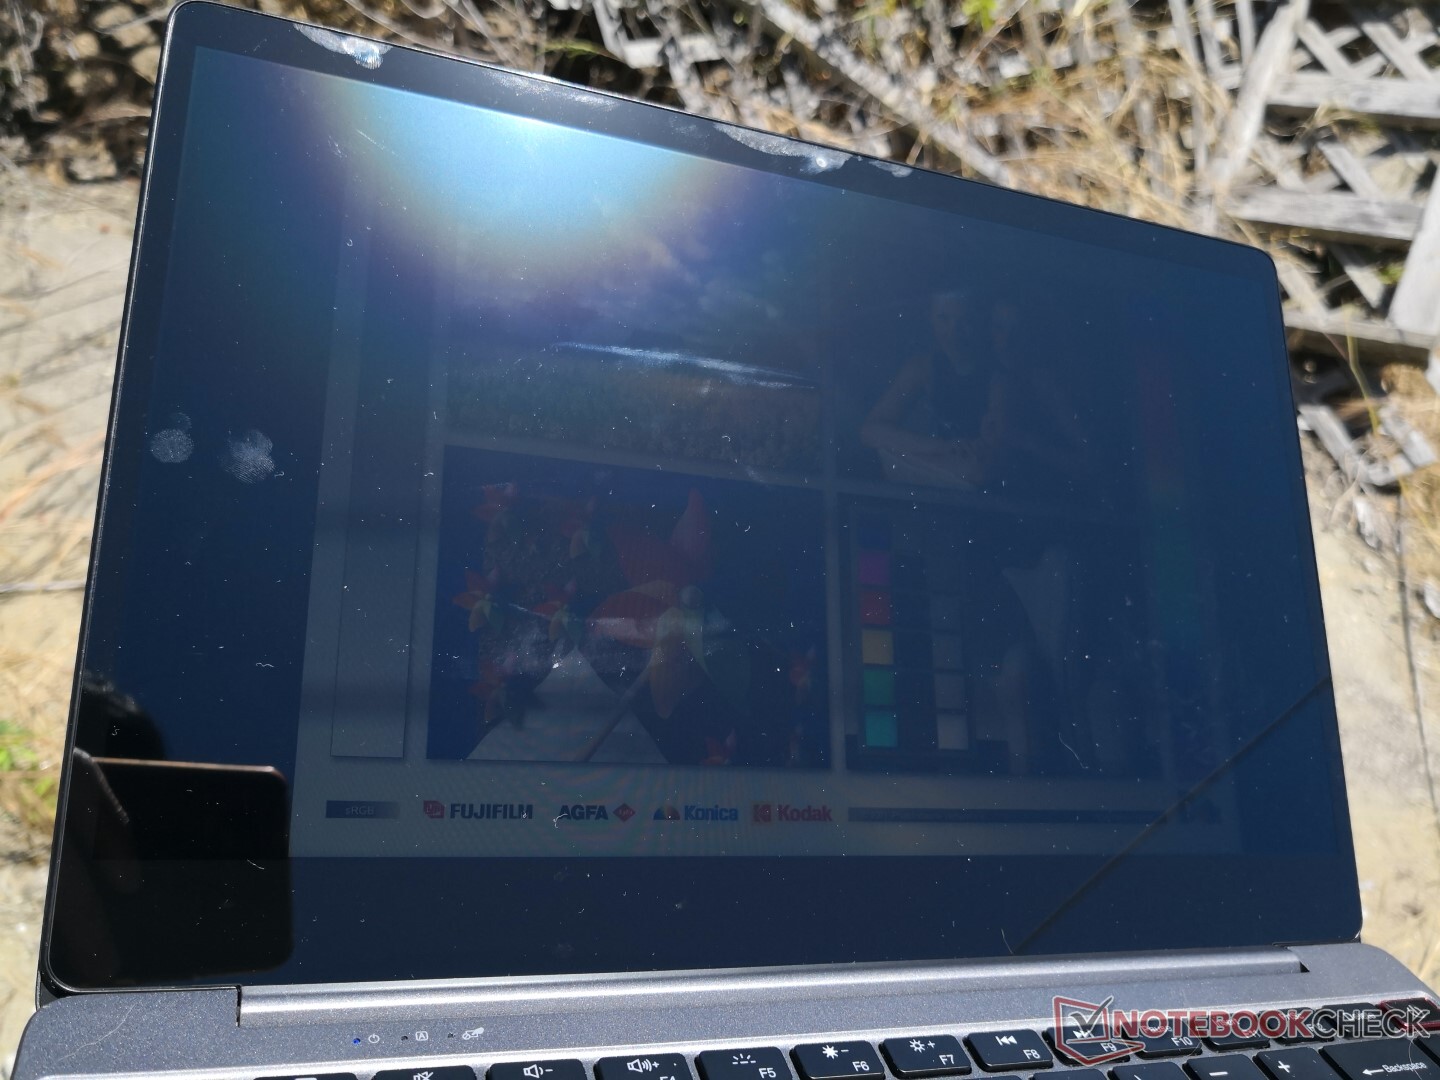
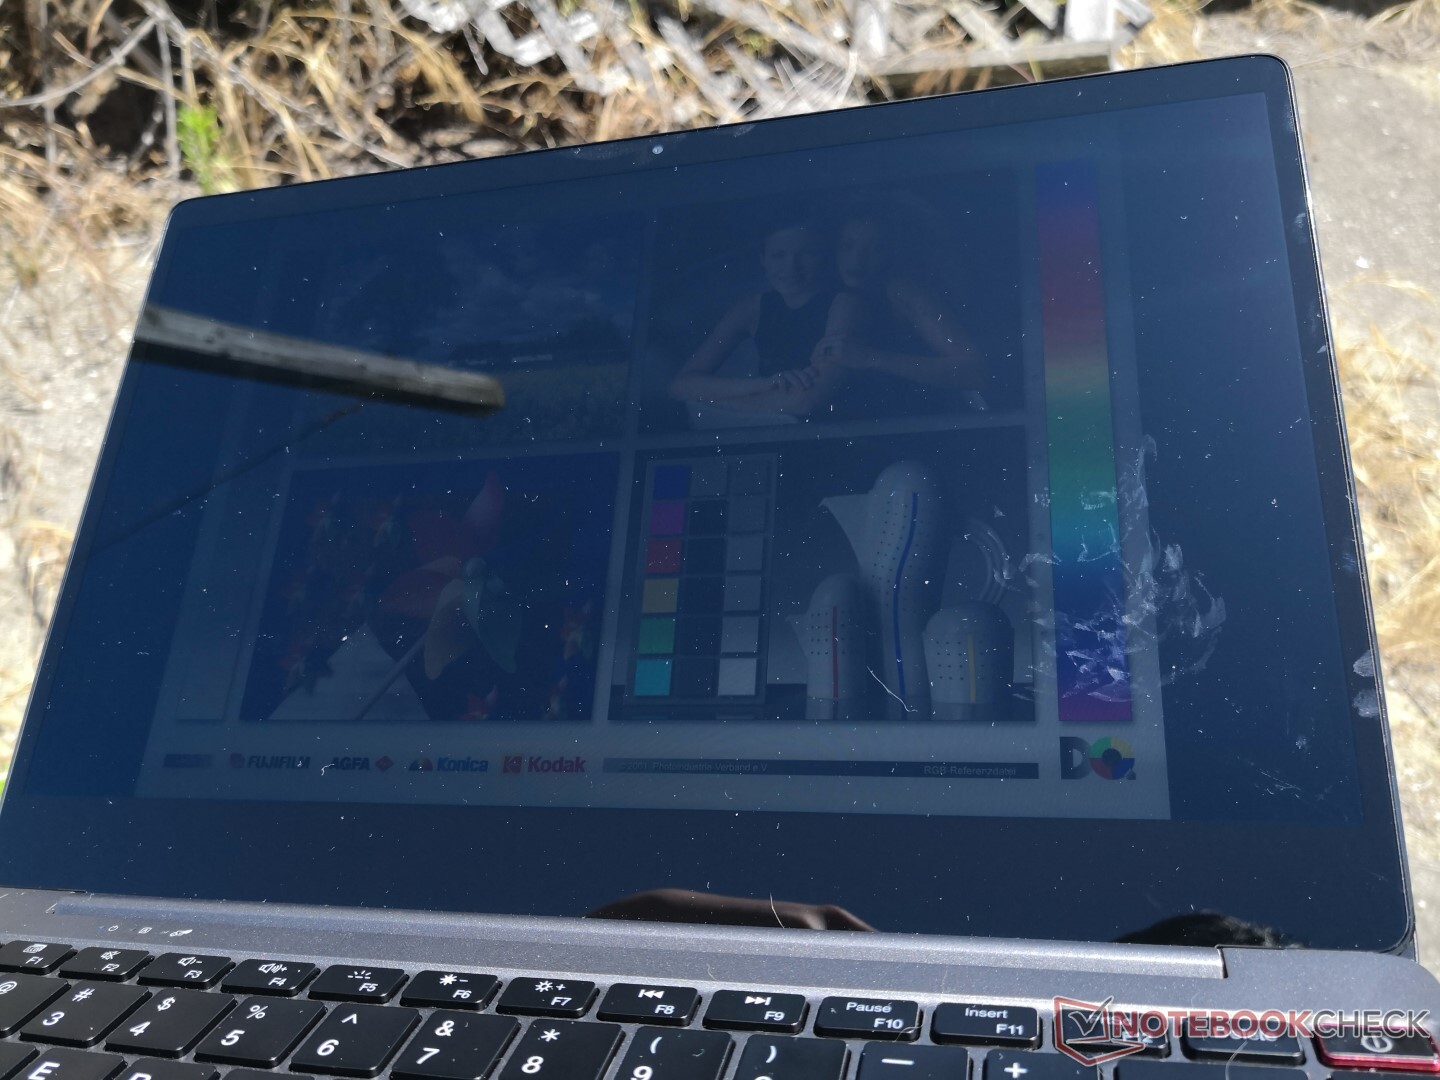
Outdoor visibility is poorer than most other Ultrabooks due to the dim backlight. Even if you manage to find shade, glare form the glossy screen will be unavoidable.
Performance
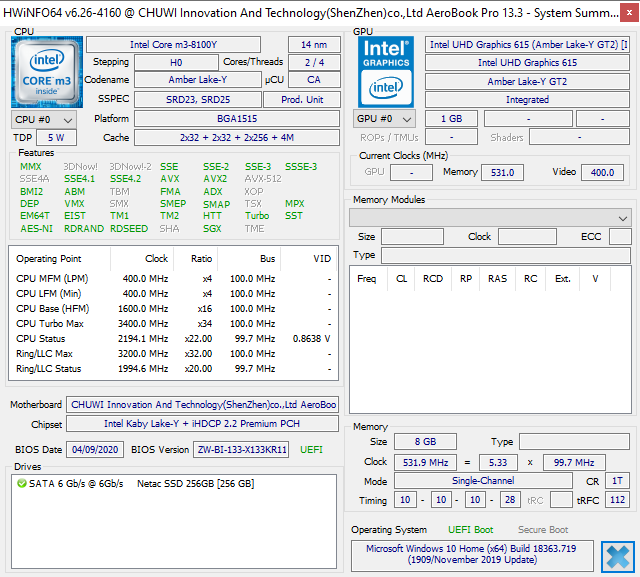
Chuwi laptops are very inexpensive because they utilize slow or old processors. The AeroBook Plus, for example, uses a five-year old Skylake-U processor while our AeroBook Pro uses a Core m3-8100Y. The Core m series requires no fans for a completely silent laptop, but system performance suffers as our benchmarks below will show.
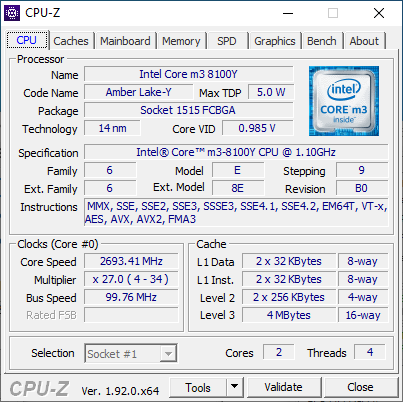
Processor
When compared to the Core m3-6Y30 that our Core m3-8100Y replaces, the newer processor offers essentially the same multi-thread performance while boosting single-thread performance by 40 percent. In practice, however, performance is still very slow and even laggy when simply browsing or word processing.
See our dedicated page on the Core m3-8100Y for more technical information and benchmark comparisons.
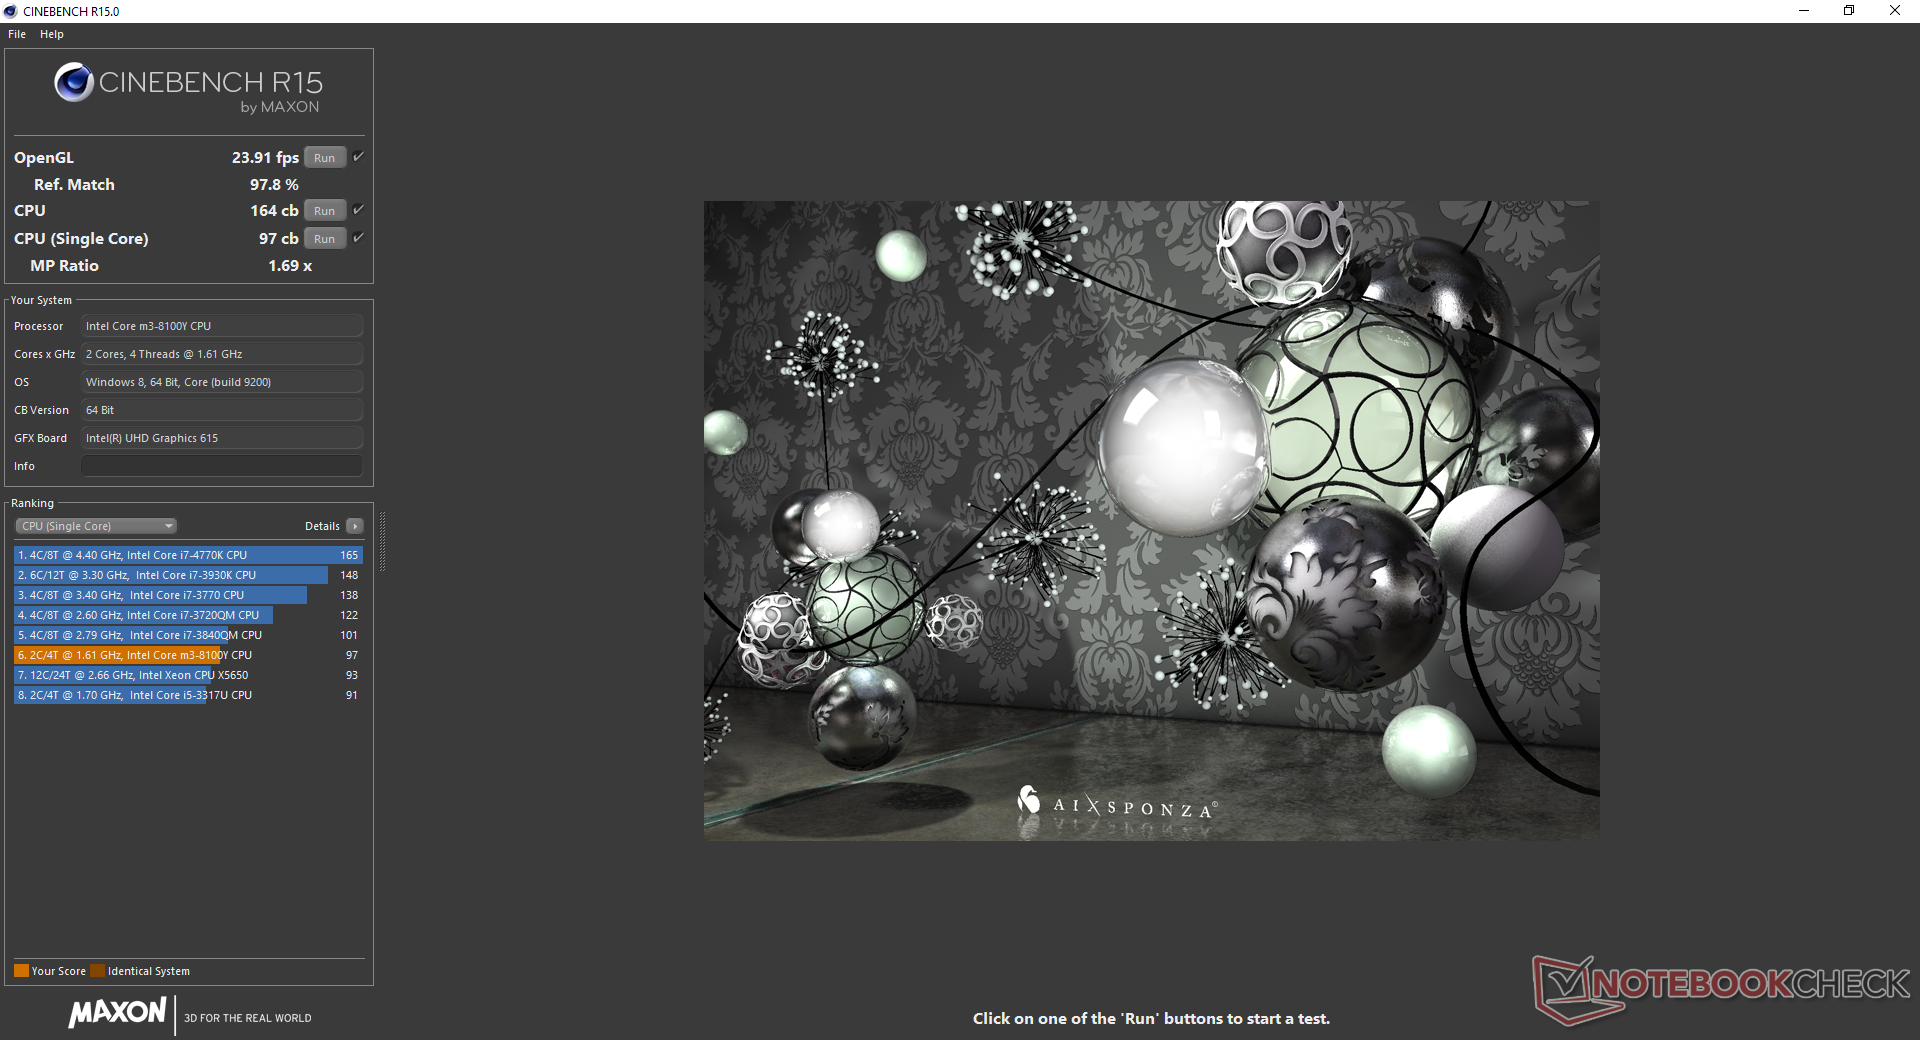
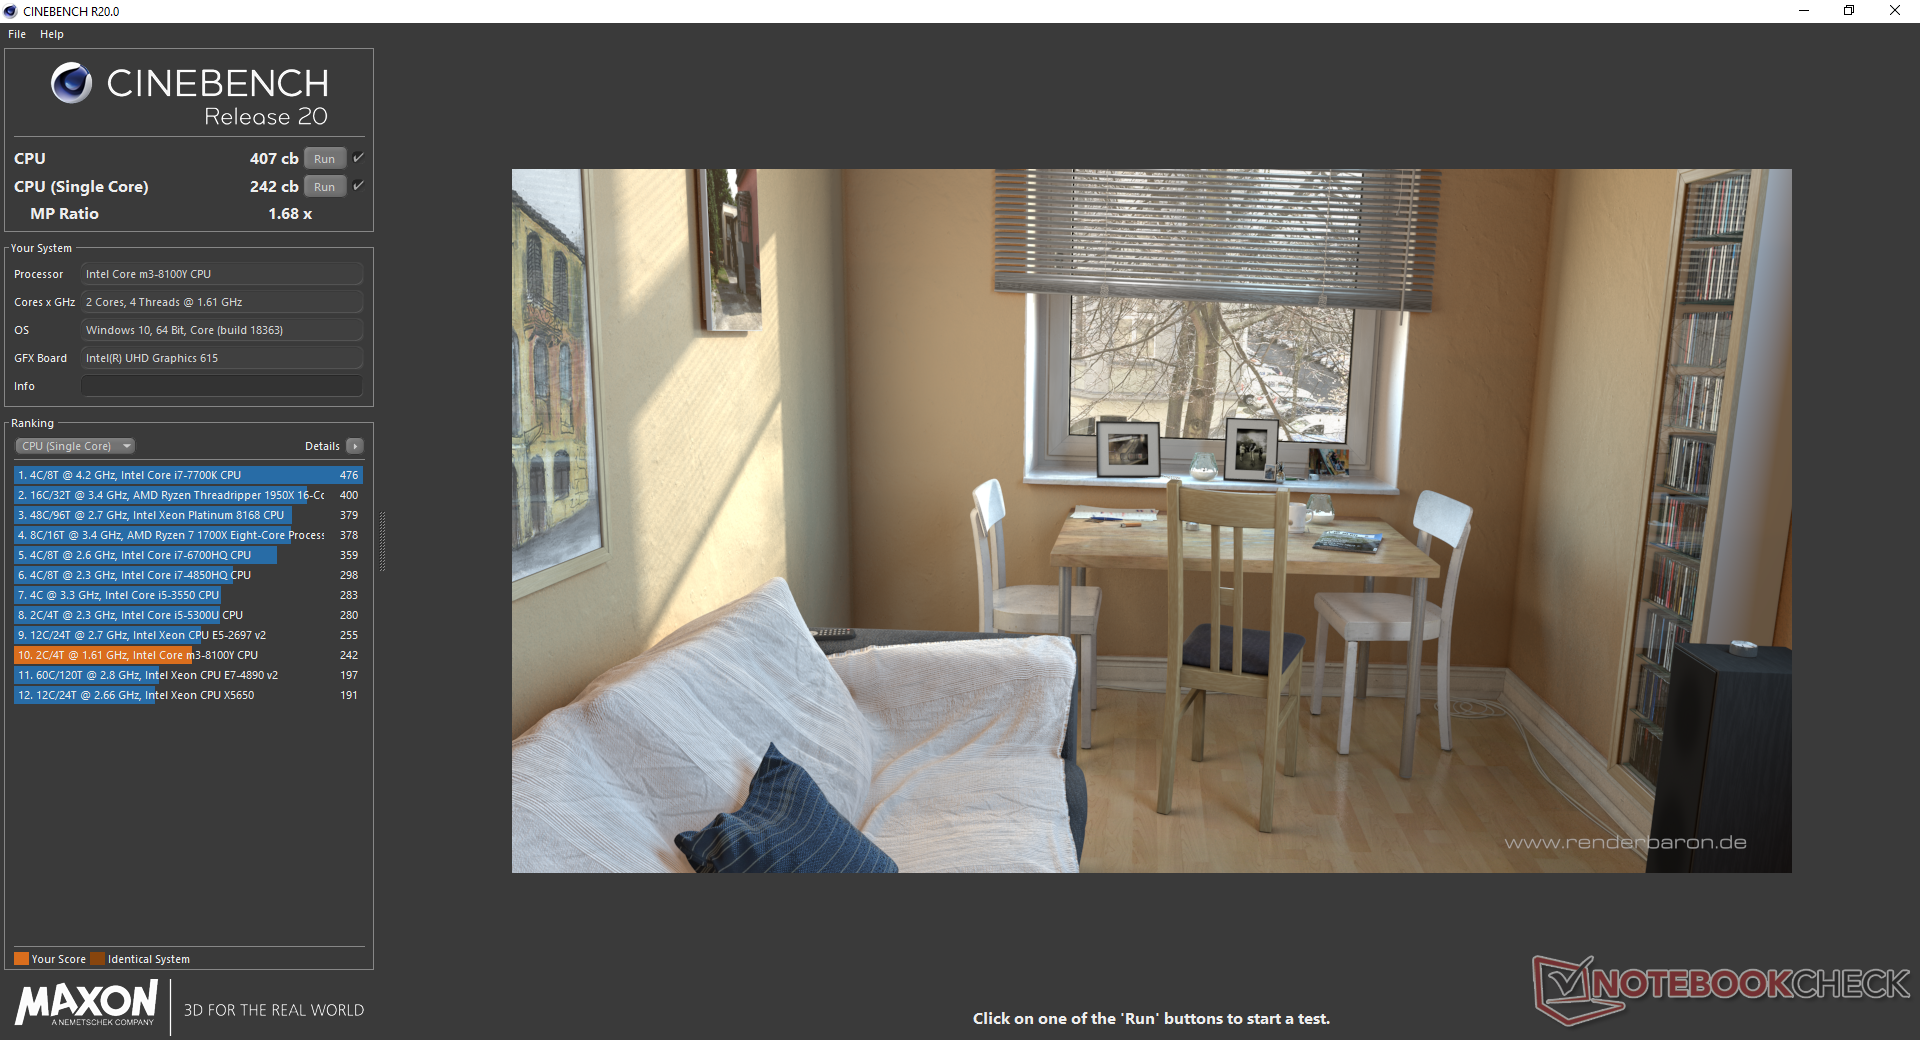
Cinebench R20: CPU (Multi Core) | CPU (Single Core)
Blender: v2.79 BMW27 CPU
7-Zip 18.03: 7z b 4 -mmt1 | 7z b 4
Geekbench 5.5: Single-Core | Multi-Core
HWBOT x265 Benchmark v2.2: 4k Preset
LibreOffice : 20 Documents To PDF
R Benchmark 2.5: Overall mean
| Cinebench R20 / CPU (Multi Core) | |
| Dynabook Portege X30L-G1331 | |
| Dell Latitude 3400 | |
| Apple MacBook Air 2020 i3 | |
| Average Intel Core m3-8100Y (382 - 527, n=3) | |
| Chuwi UBook CWI509 | |
| Chuwi AeroBook Pro | |
| Jumper EZbook X3 | |
| Cinebench R20 / CPU (Single Core) | |
| Dynabook Portege X30L-G1331 | |
| Apple MacBook Air 2020 i3 | |
| Dell Latitude 3400 | |
| Average Intel Core m3-8100Y (232 - 298, n=3) | |
| Chuwi AeroBook Pro | |
| Chuwi UBook CWI509 | |
| Jumper EZbook X3 | |
| Blender / v2.79 BMW27 CPU | |
| Jumper EZbook X3 | |
| Chuwi AeroBook Pro | |
| Average Intel Core m3-8100Y (1893 - 2519, n=2) | |
| Apple MacBook Air 2020 i3 | |
| Eve-Tech Eve V m3 | |
| Dynabook Portege X30L-G1331 | |
| 7-Zip 18.03 / 7z b 4 -mmt1 | |
| Dynabook Portege X30L-G1331 | |
| Apple MacBook Air 2020 i3 | |
| Average Intel Core m3-8100Y (2683 - 3282, n=2) | |
| Chuwi AeroBook Pro | |
| Jumper EZbook X3 | |
| 7-Zip 18.03 / 7z b 4 | |
| Dynabook Portege X30L-G1331 | |
| Apple MacBook Air 2020 i3 | |
| Average Intel Core m3-8100Y (4937 - 7554, n=2) | |
| Chuwi AeroBook Pro | |
| Jumper EZbook X3 | |
| Geekbench 5.5 / Single-Core | |
| Apple MacBook Air 2020 i3 | |
| Dynabook Portege X30L-G1331 | |
| Average Intel Core m3-8100Y (809 - 882, n=2) | |
| Chuwi AeroBook Pro | |
| Jumper EZbook X3 | |
| Geekbench 5.5 / Multi-Core | |
| Dynabook Portege X30L-G1331 | |
| Apple MacBook Air 2020 i3 | |
| Average Intel Core m3-8100Y (1178 - 1615, n=2) | |
| Chuwi AeroBook Pro | |
| Jumper EZbook X3 | |
| HWBOT x265 Benchmark v2.2 / 4k Preset | |
| Dynabook Portege X30L-G1331 | |
| Apple MacBook Air 2020 i3 | |
| Average Intel Core m3-8100Y (1.42 - 1.96, n=2) | |
| Chuwi AeroBook Pro | |
| Jumper EZbook X3 | |
| LibreOffice / 20 Documents To PDF | |
| Jumper EZbook X3 | |
| Chuwi AeroBook Pro | |
| Average Intel Core m3-8100Y (85.4 - 128, n=2) | |
| Apple MacBook Air 2020 i3 | |
| Dynabook Portege X30L-G1331 | |
| R Benchmark 2.5 / Overall mean | |
| Jumper EZbook X3 | |
| Chuwi AeroBook Pro | |
| Average Intel Core m3-8100Y (0.942 - 1.204, n=2) | |
| Apple MacBook Air 2020 i3 | |
| Dynabook Portege X30L-G1331 | |
Cinebench R20: CPU (Multi Core) | CPU (Single Core)
Blender: v2.79 BMW27 CPU
7-Zip 18.03: 7z b 4 -mmt1 | 7z b 4
Geekbench 5.5: Single-Core | Multi-Core
HWBOT x265 Benchmark v2.2: 4k Preset
LibreOffice : 20 Documents To PDF
R Benchmark 2.5: Overall mean
* ... smaller is better
System Performance
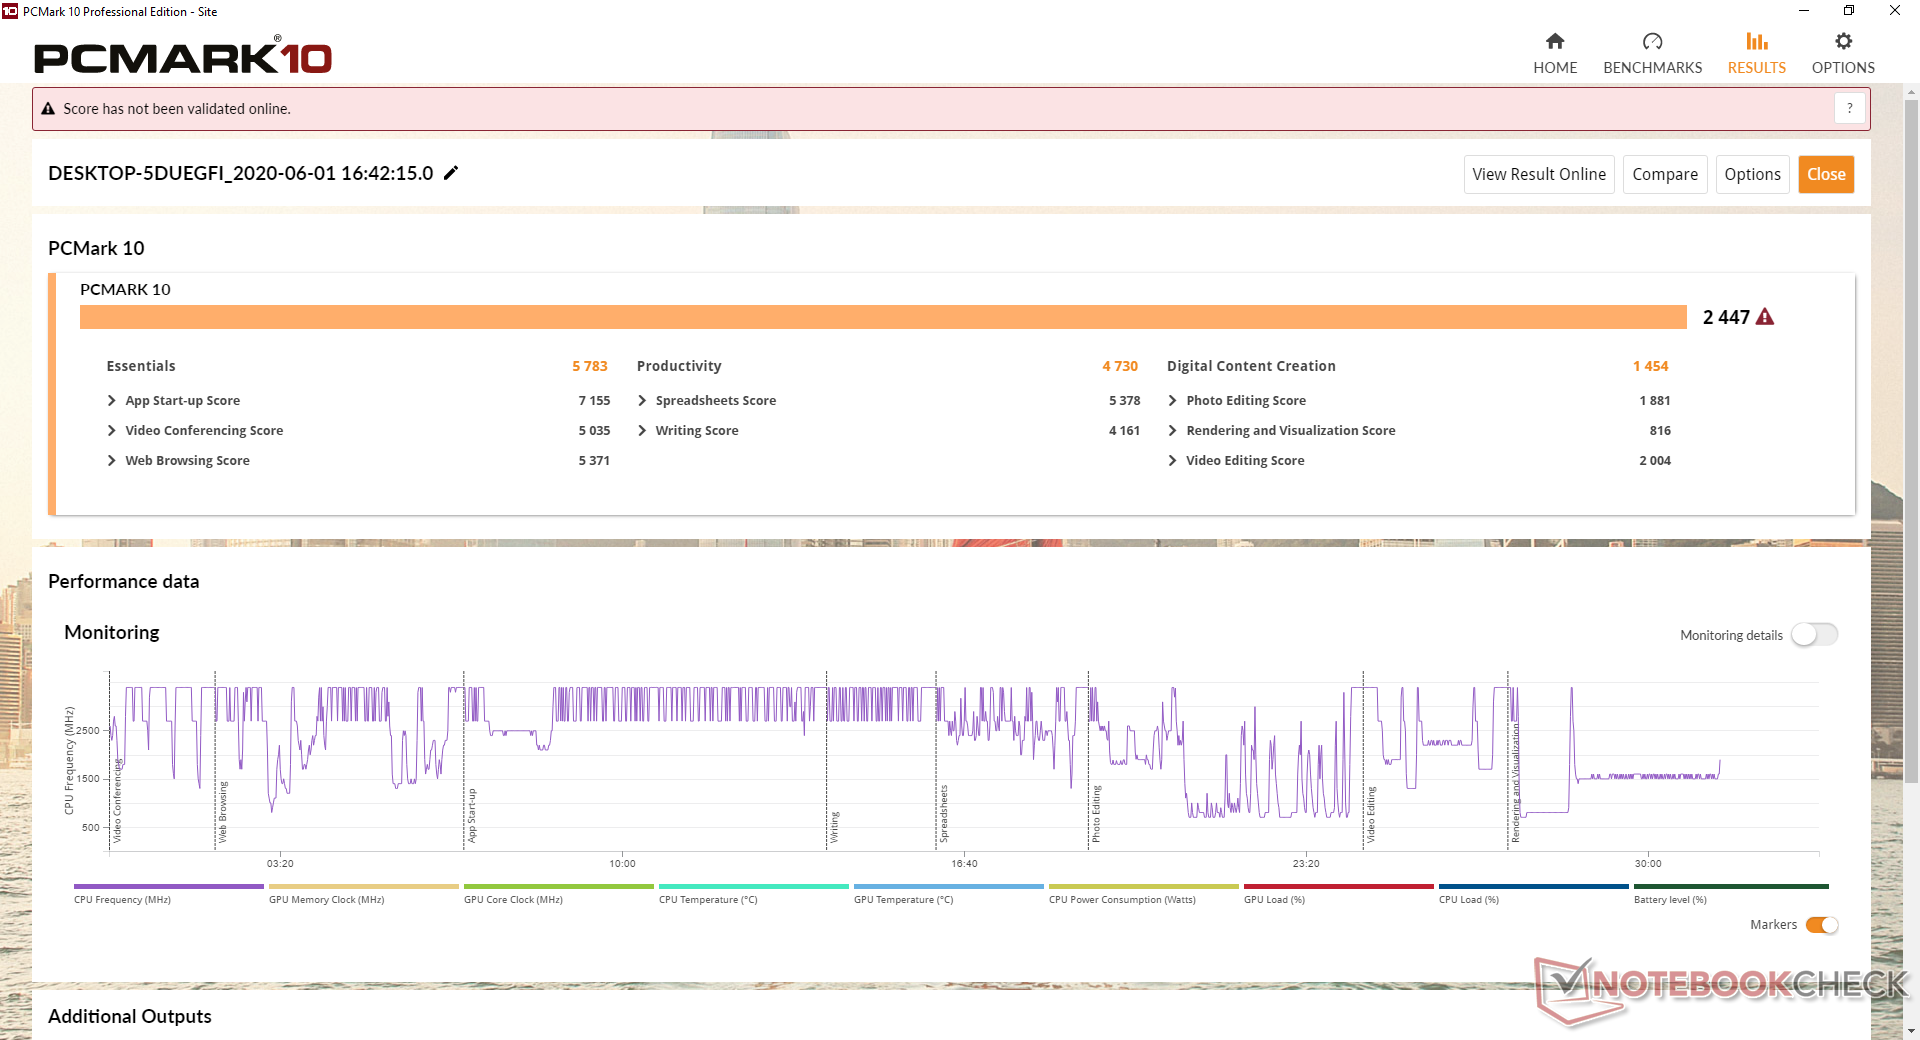
PCMark benchmarks are consistently higher than the 2019 AeroBook except in the Digital Content Creation benchmark since GPU performance between the two laptops are essentially identical.
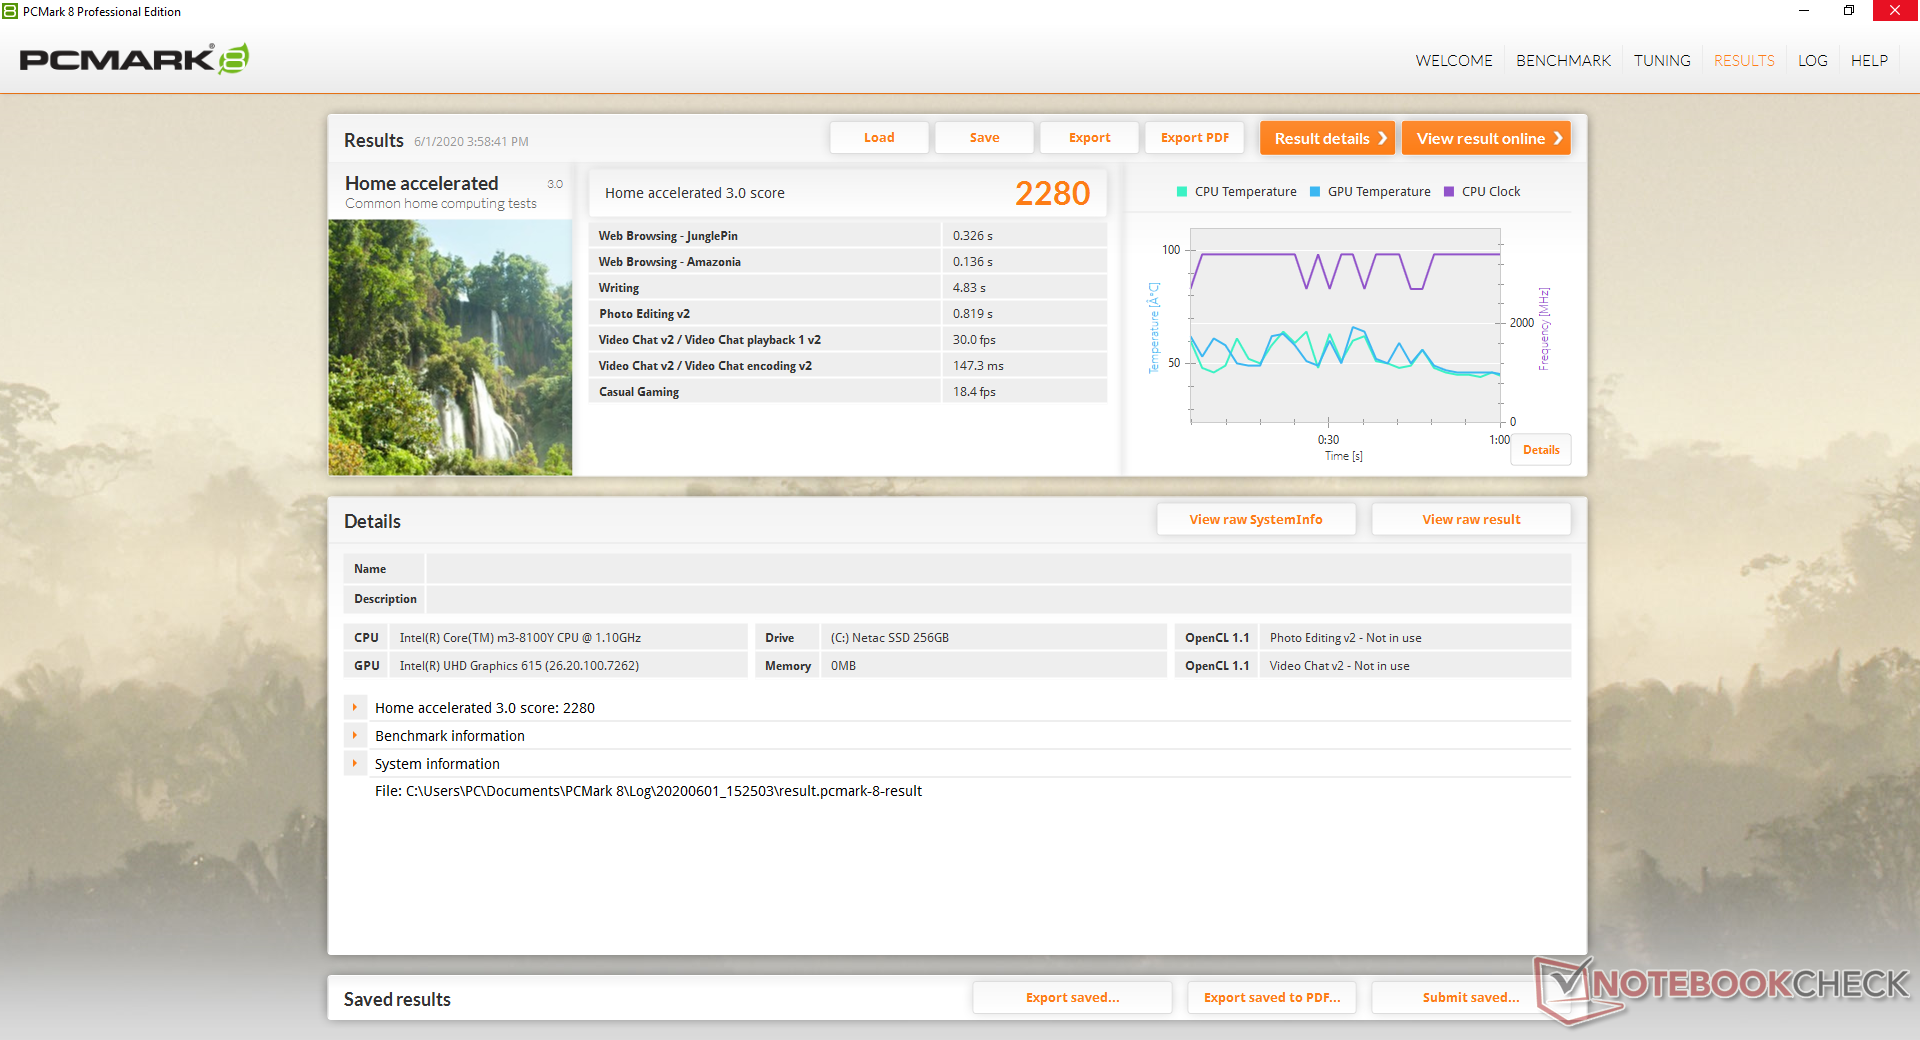
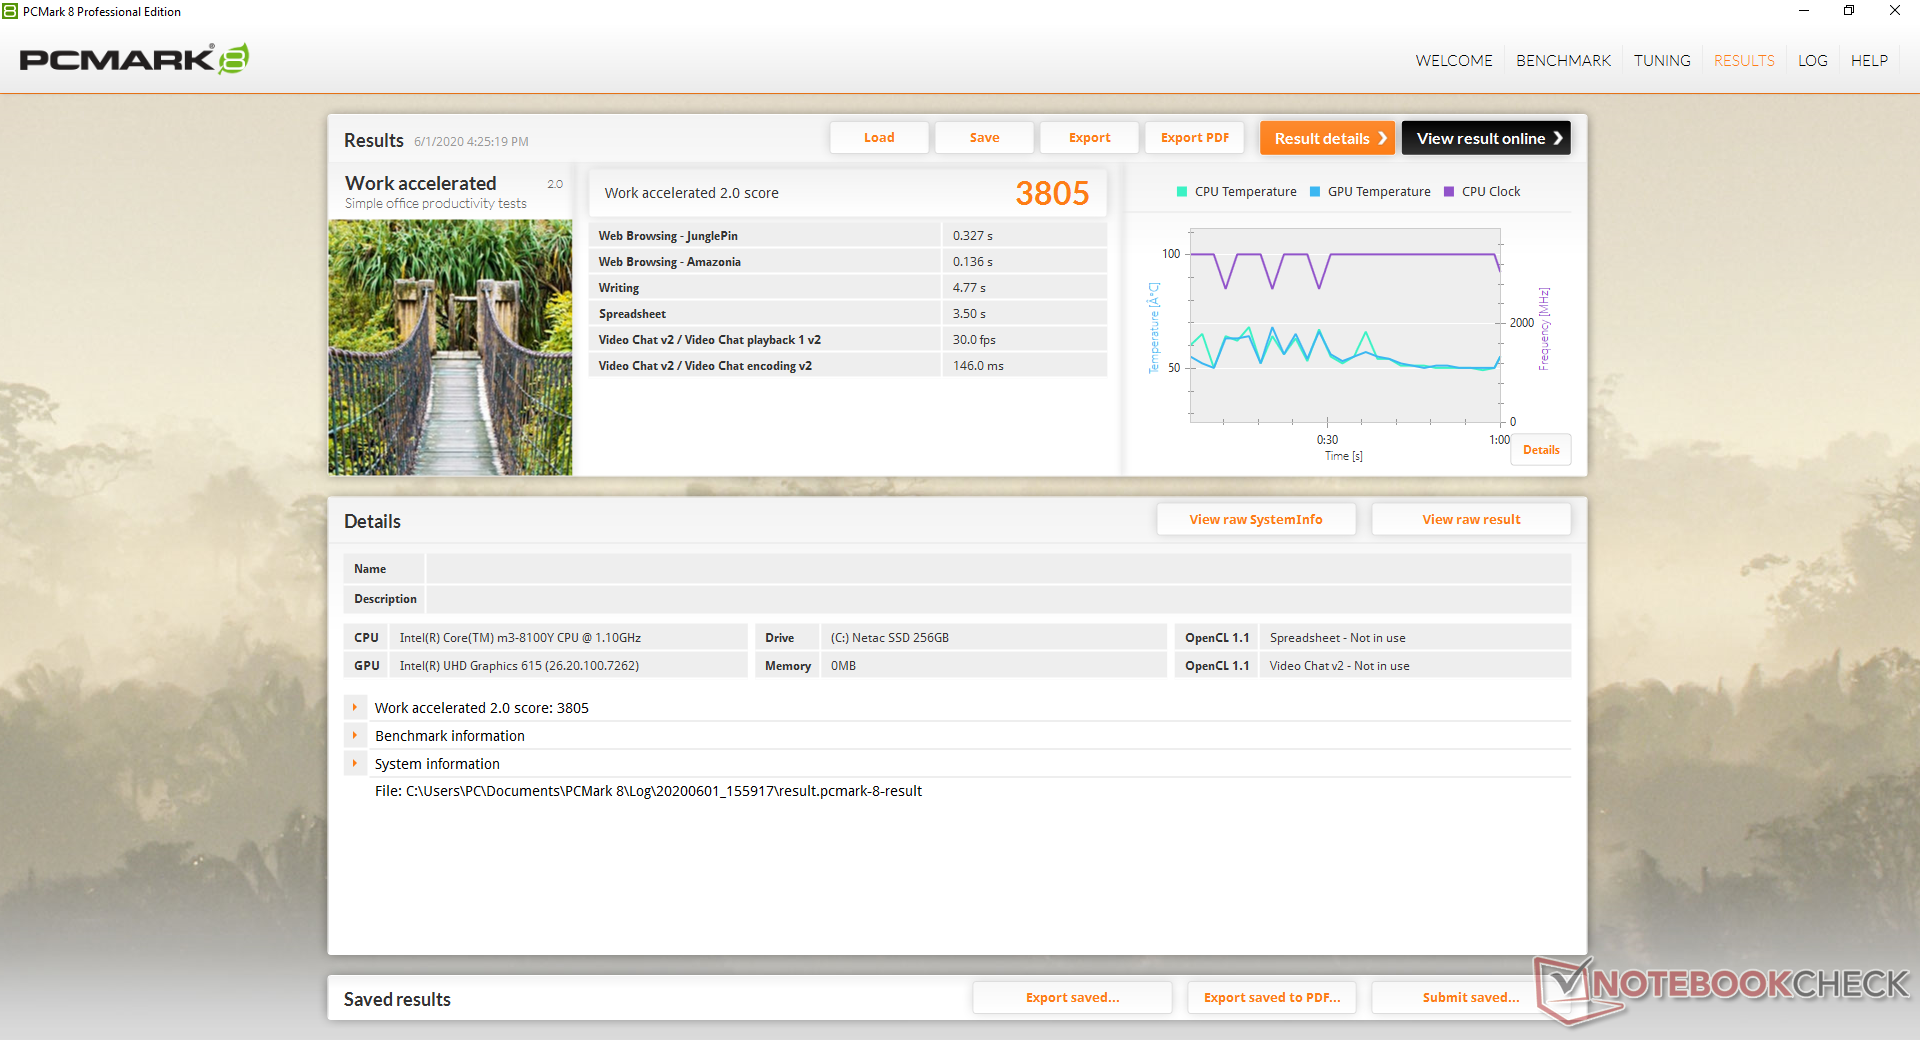
| PCMark 8 Home Score Accelerated v2 | 2280 points | |
| PCMark 8 Work Score Accelerated v2 | 3805 points | |
| PCMark 10 Score | 2447 points | |
Help | ||
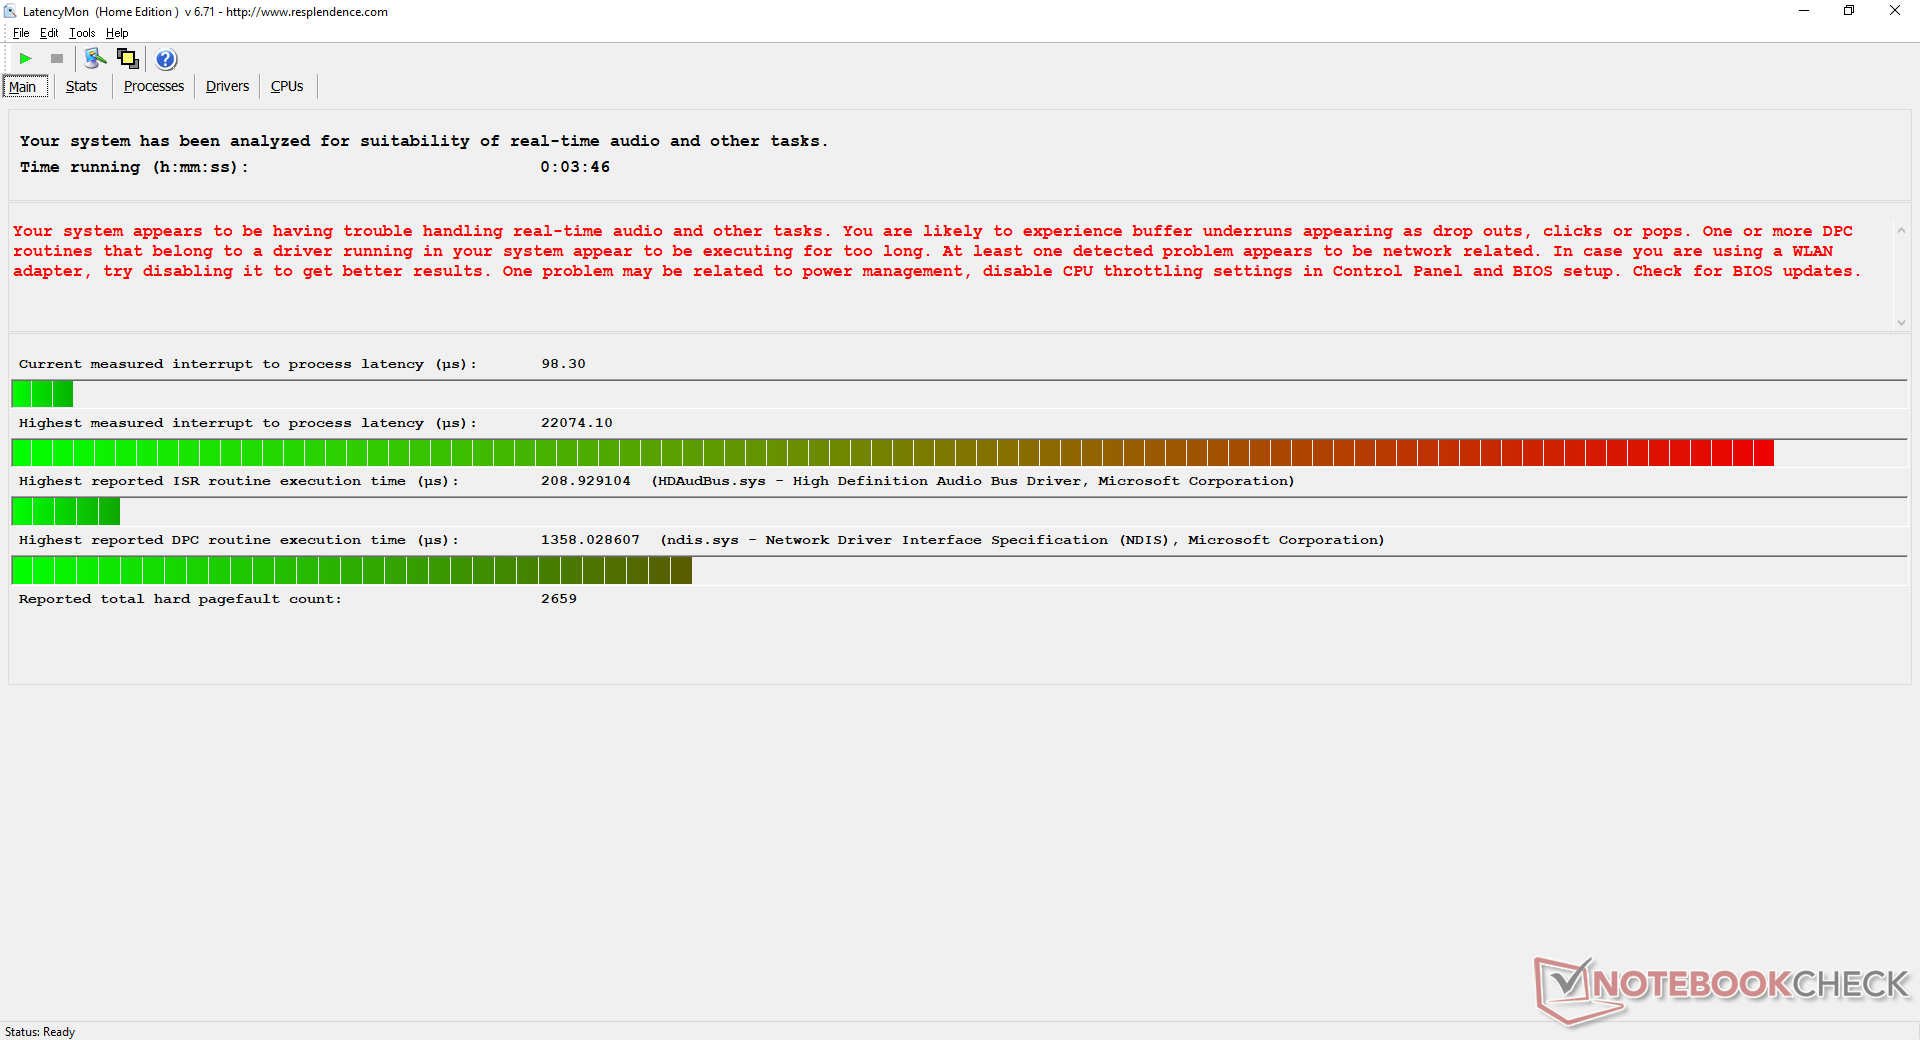
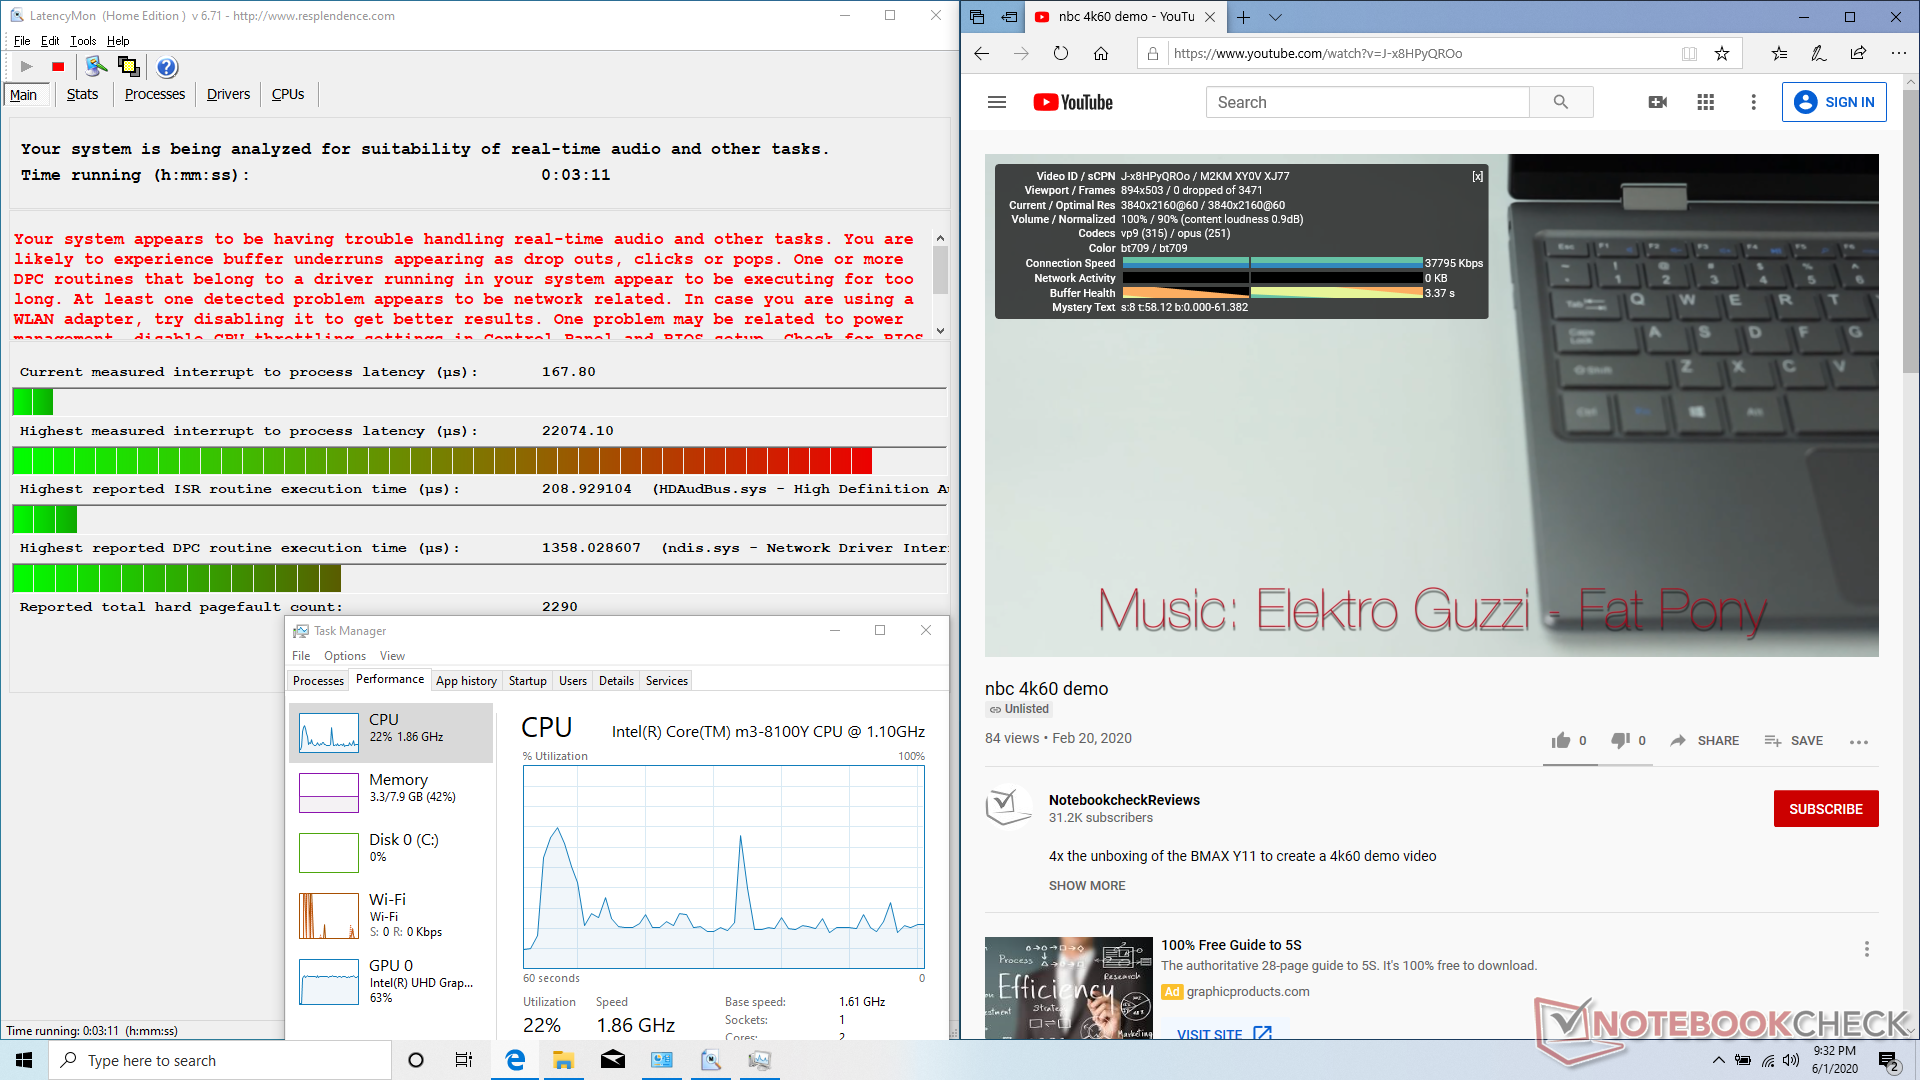
DPC Latency
LatencyMon reveals DPC latency issues when opening multiple browser tabs on our homepage. Thankfully, 4K UHD video playback is smooth and with no dropped frames.
| DPC Latencies / LatencyMon - interrupt to process latency (max), Web, Youtube, Prime95 | |
| Chuwi AeroBook Pro | |
| Apple MacBook Air 2020 i5 | |
| Dell XPS 13 9300 i5 FHD | |
* ... smaller is better
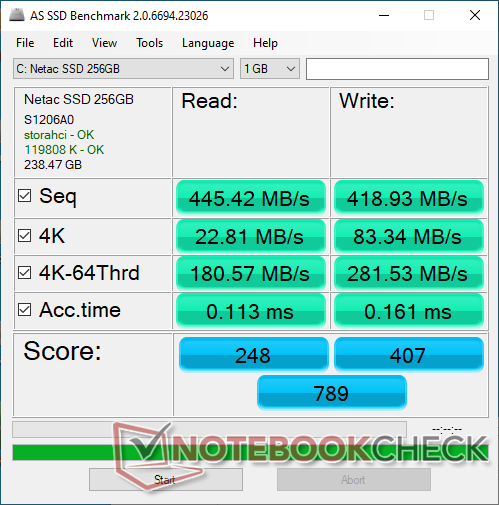
Storage Devices
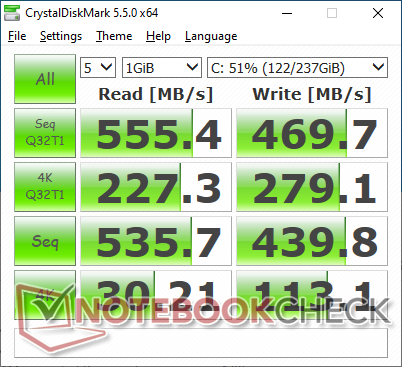
The system ships with the same 256 GB Netac M.2 SSD as found on the 2019 AeroBook. Performance is excellent for a SATA drive since NVMe would have been overkill for a laptop such as this. The M.2 slot is easily accessible behind a small panel secured by two screws.
More HDD and SSD benchmark comparisons can be found on our table here.
| Chuwi AeroBook Pro Netac SSD 256GB | Apple MacBook Air 2020 i5 Apple SSD AP0512 | Dell XPS 13 9300 i5 FHD Toshiba XG6 KXG60ZNV512G | Lenovo Yoga 720-12IKB Liteonit CV3-8D128 | Jumper EZbook X3 64 GB eMMC Flash | Lenovo Ideapad S530-13IWL Lenovo UMIS AM610 RPFTJ256PDD2MWX | |
|---|---|---|---|---|---|---|
| AS SSD | 73% | 229% | -11% | -93% | 132% | |
| Seq Read (MB/s) | 445.4 | 1153 159% | 2328 423% | 361.6 -19% | 246.2 -45% | 1377 209% |
| Seq Write (MB/s) | 418.9 | 1367 226% | 1137 171% | 240.8 -43% | 155.8 -63% | 805 92% |
| 4K Read (MB/s) | 22.81 | 12.95 -43% | 48.07 111% | 23.81 4% | 18.41 -19% | 45.01 97% |
| 4K Write (MB/s) | 83.3 | 24.52 -71% | 120.6 45% | 61.8 -26% | 22 -74% | 88.9 7% |
| 4K-64 Read (MB/s) | 180.6 | 665 268% | 899 398% | 232.6 29% | 22.45 -88% | 767 325% |
| 4K-64 Write (MB/s) | 281.5 | 159.5 -43% | 1220 333% | 89.3 -68% | 22.73 -92% | 611 117% |
| Access Time Read * (ms) | 0.113 | 0.295 -161% | 0.085 25% | 0.109 4% | 0.246 -118% | 0.141 -25% |
| Access Time Write * (ms) | 0.161 | 0.163 -1% | 0.033 80% | 0.067 58% | 0.621 -286% | 0.043 73% |
| Score Read (Points) | 248 | 793 220% | 1180 376% | 296 19% | 65 -74% | 950 283% |
| Score Write (Points) | 408 | 321 -21% | 1455 257% | 175 -57% | 60 -85% | 781 91% |
| Score Total (Points) | 789 | 1528 94% | 3189 304% | 620 -21% | 163 -79% | 2200 179% |
| Copy ISO MB/s (MB/s) | 410.8 | 1433 249% | ||||
| Copy Program MB/s (MB/s) | 204.4 | 363 78% | ||||
| Copy Game MB/s (MB/s) | 435.5 | 725 66% | ||||
| CrystalDiskMark 5.2 / 6 | 207% | -77% | 55% | |||
| Write 4K (MB/s) | 113.1 | 121.9 8% | 19.21 -83% | 101.5 -10% | ||
| Read 4K (MB/s) | 30.21 | 50 66% | 7.435 -75% | 44.47 47% | ||
| Write Seq (MB/s) | 439.8 | 1497 240% | 138.8 -68% | 603 37% | ||
| Read Seq (MB/s) | 536 | 2111 294% | 219.8 -59% | 686 28% | ||
| Write 4K Q32T1 (MB/s) | 279.1 | 365.9 31% | 24.39 -91% | 298.1 7% | ||
| Read 4K Q32T1 (MB/s) | 227.3 | 384.6 69% | 22.2 -90% | 358.7 58% | ||
| Write Seq Q32T1 (MB/s) | 469.7 | 2748 485% | 122.3 -74% | 872 86% | ||
| Read Seq Q32T1 (MB/s) | 555 | 3119 462% | 147.6 -73% | 1611 190% | ||
| Total Average (Program / Settings) | 73% /
73% | 218% /
220% | -11% /
-11% | -85% /
-86% | 94% /
100% |
* ... smaller is better

Disk Throttling: DiskSpd Read Loop, Queue Depth 8
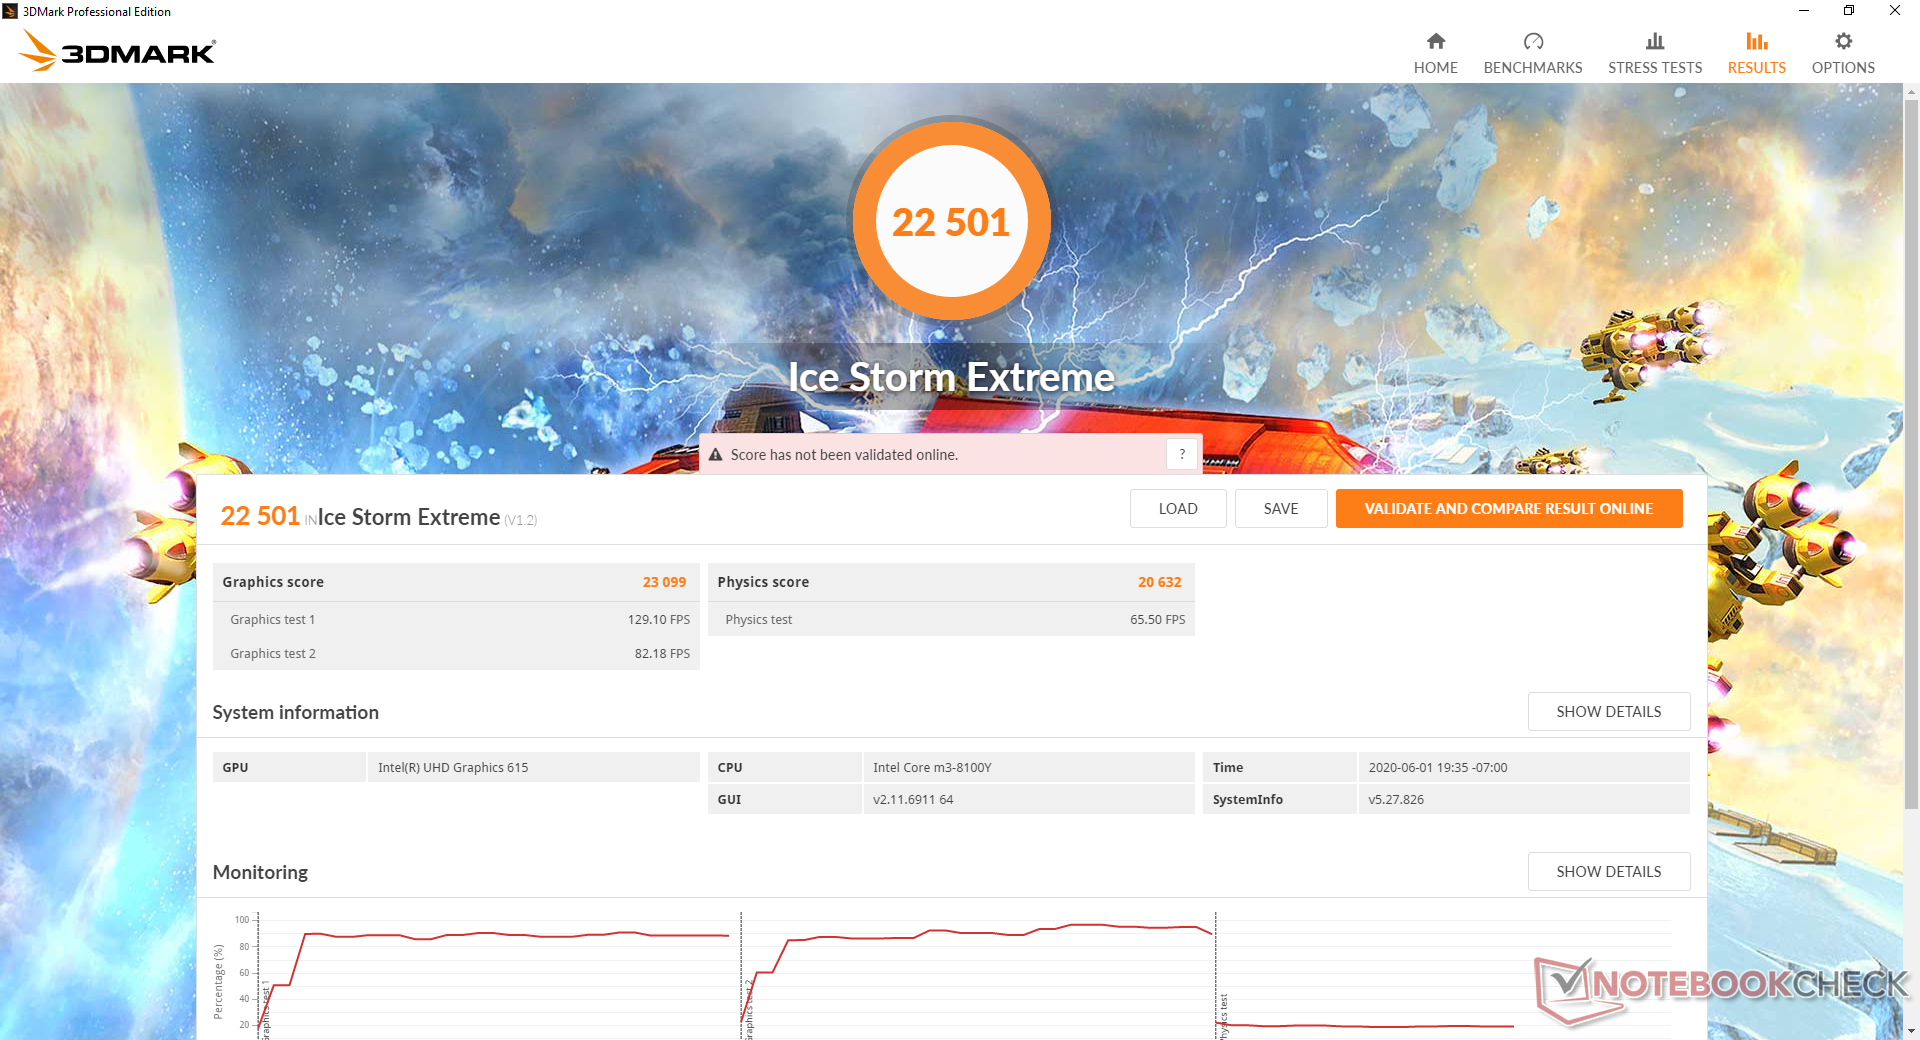
GPU Performance
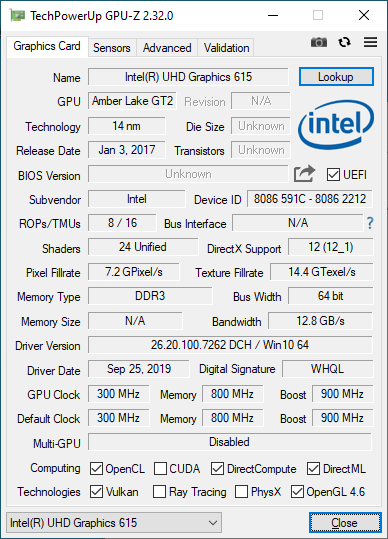
Even though the CPU has been upgraded from last year's model, the integrated GPU remains the same. Graphics performance is still very slow to be even slower than the already outdated UHD Graphics 620.
See our dedicated page on the UHD Graphics 615 for more technical information and benchmark comparisons.
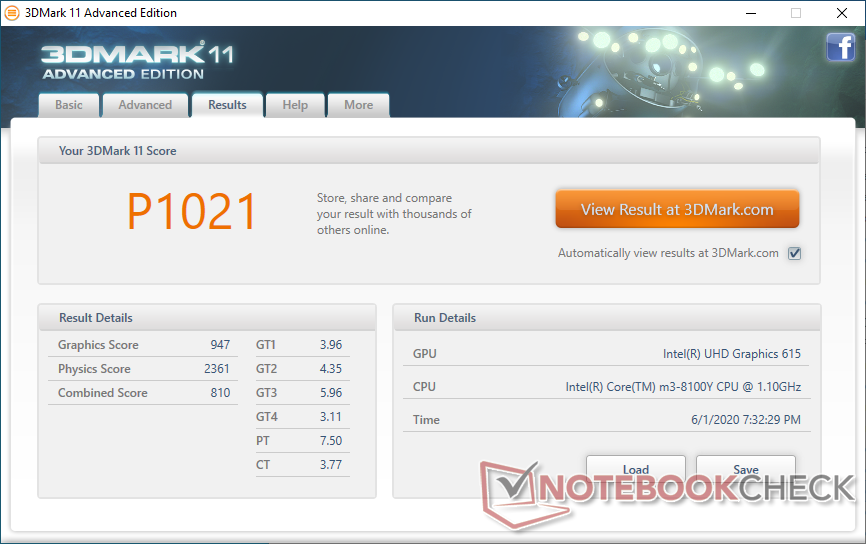
| 3DMark 11 Performance | 1021 points | |
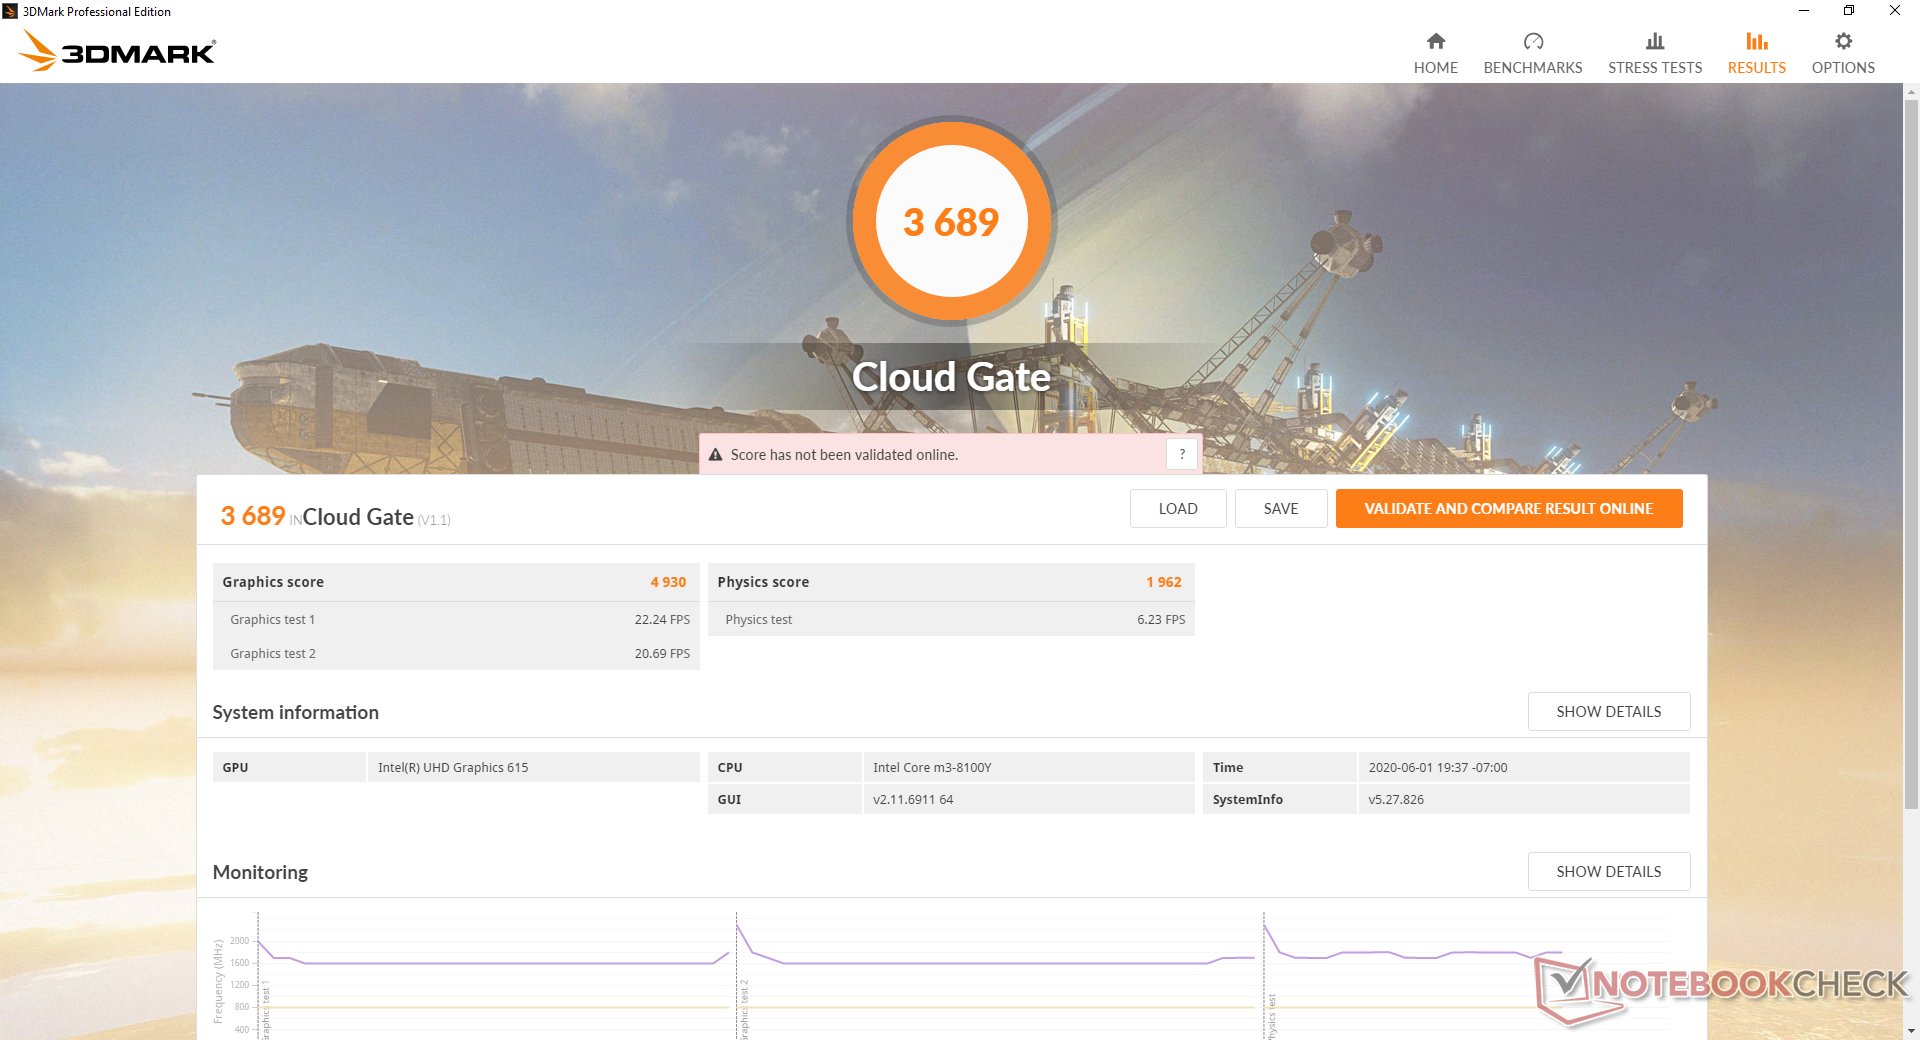
| 3DMark Cloud Gate Standard Score | 3689 points | |
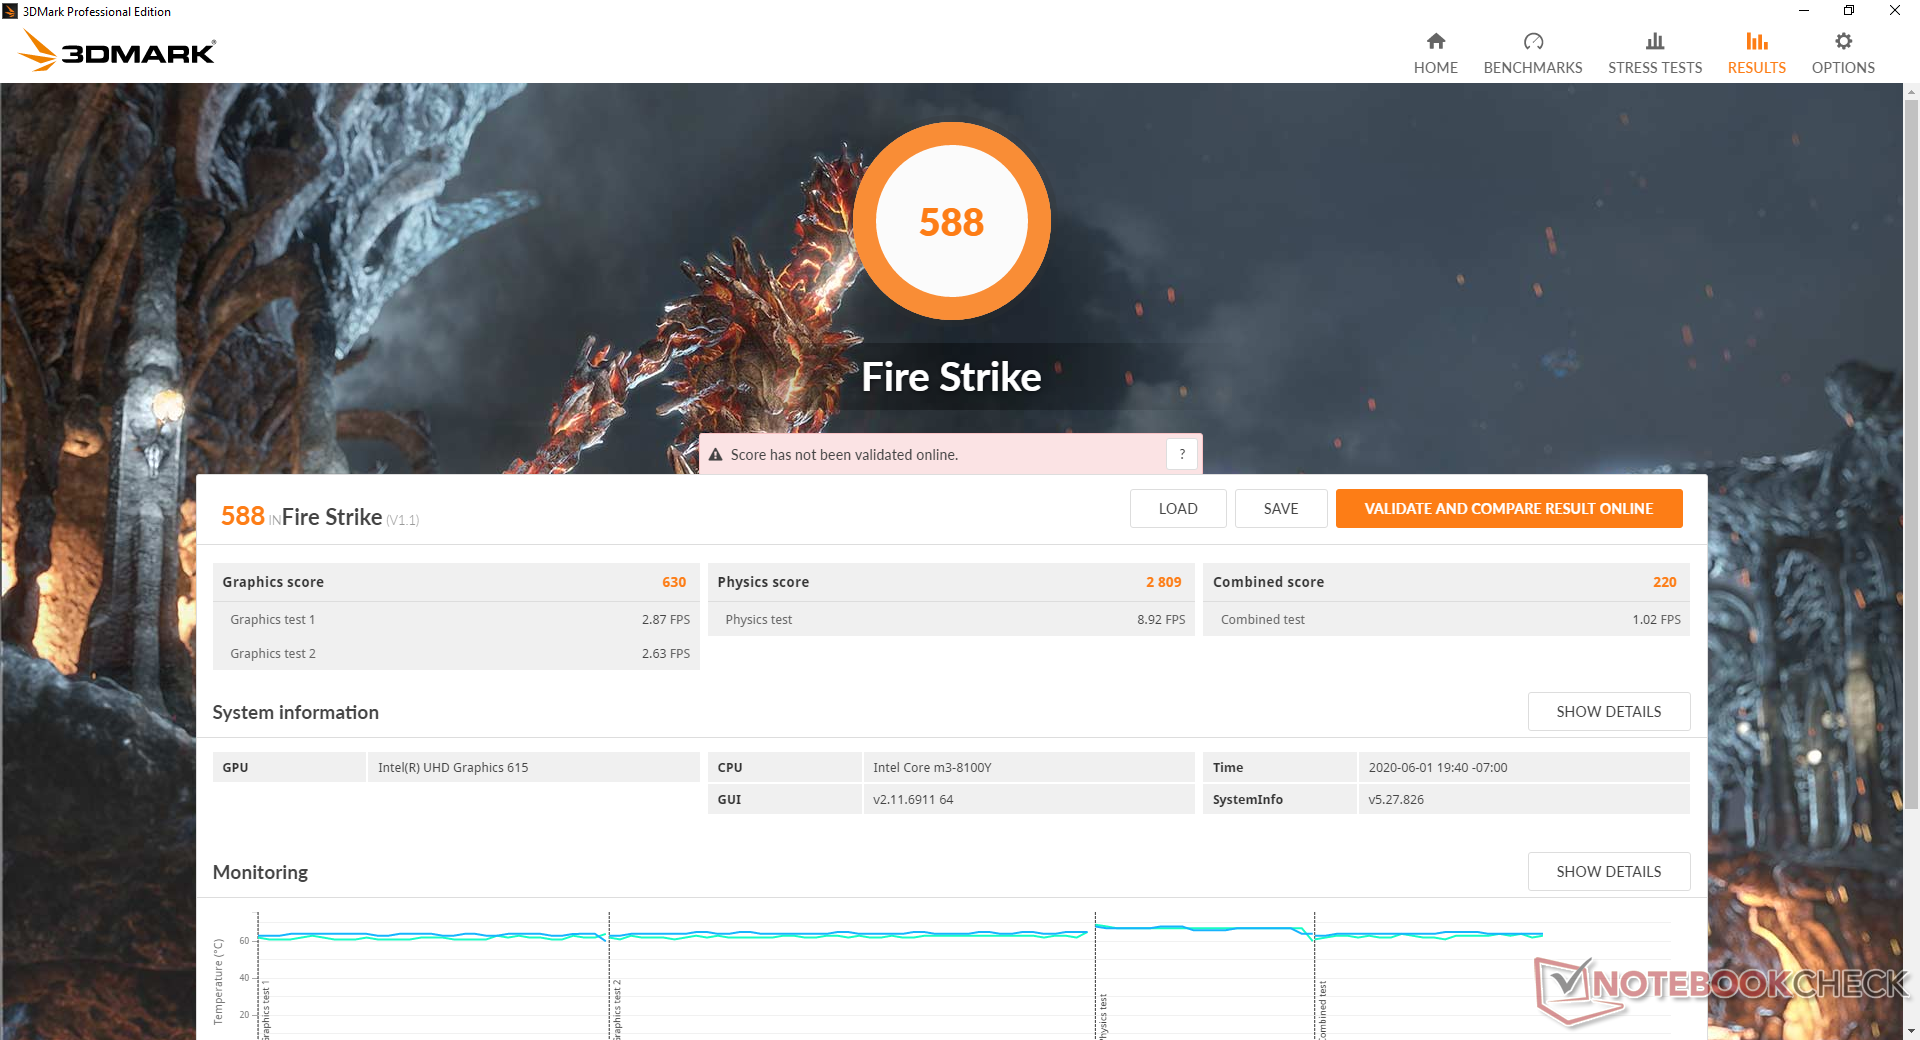
| 3DMark Fire Strike Score | 588 points | |
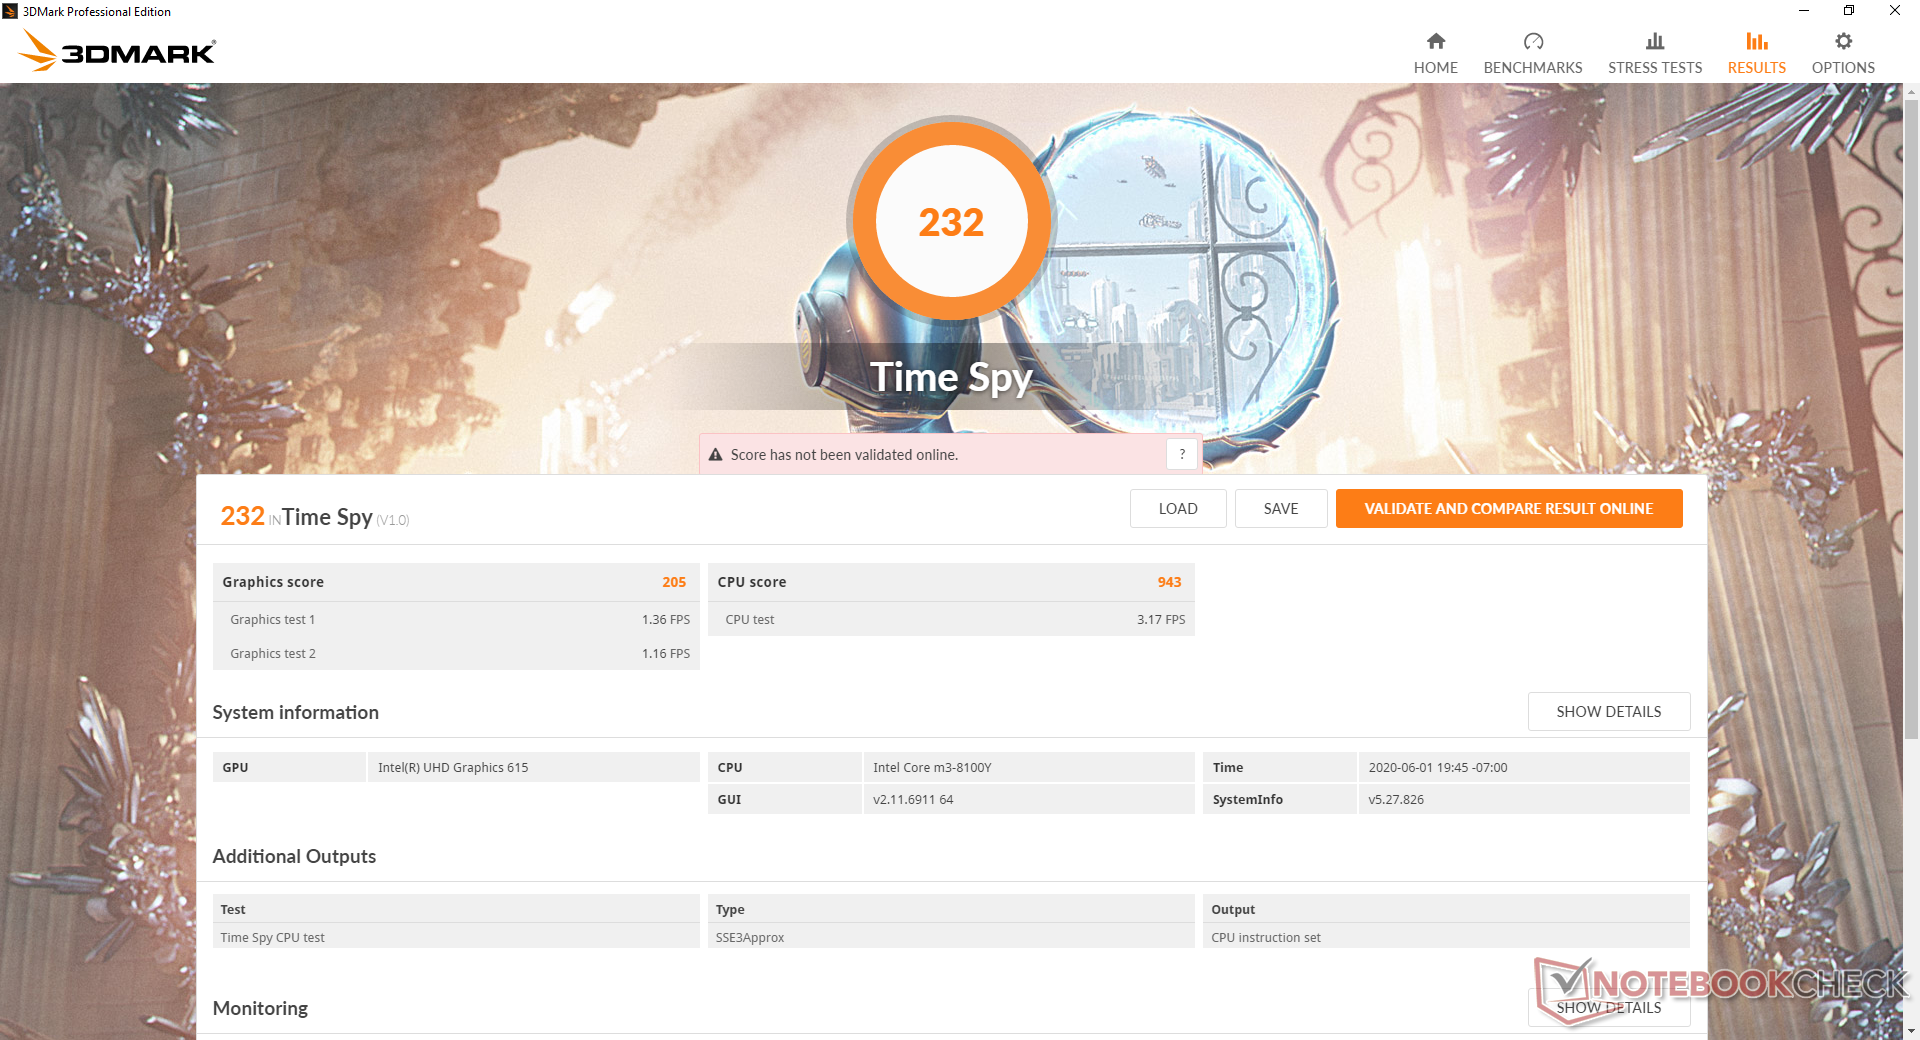
| 3DMark Time Spy Score | 232 points | |
Help | ||
| low | med. | high | ultra | |
|---|---|---|---|---|
| Dota 2 Reborn (2015) | 40.8 | 17.7 | 8.5 | 7.6 |
| X-Plane 11.11 (2018) | 10 | 7.2 |
Emissions
Temperature
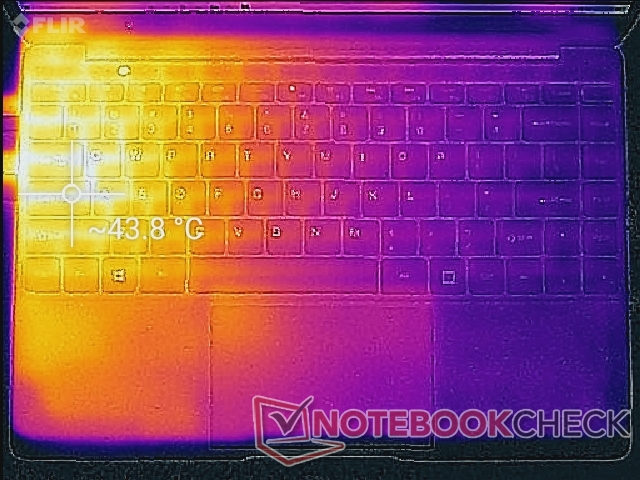
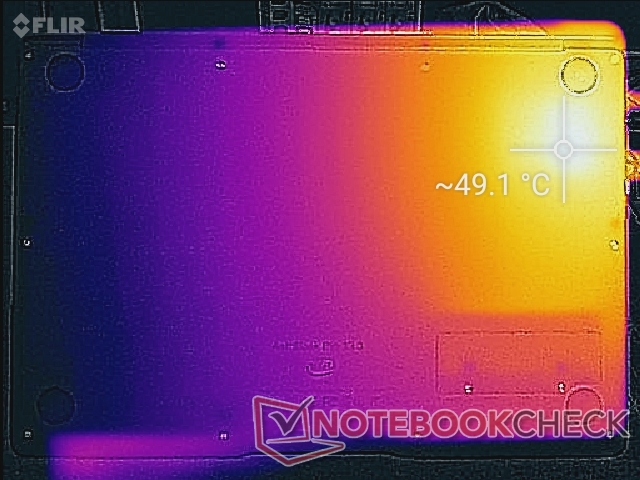
Surface temperatures are always warmer on the left half of the system than the right half due to how the motherboard is positioned. The difference is noticeable even during low loads like browsing or video streaming. At worst, the left palm rest can become uncomfortably warm and sweaty to the touch.
The difference between the warmest and coolest spots can be as much as 16 C.
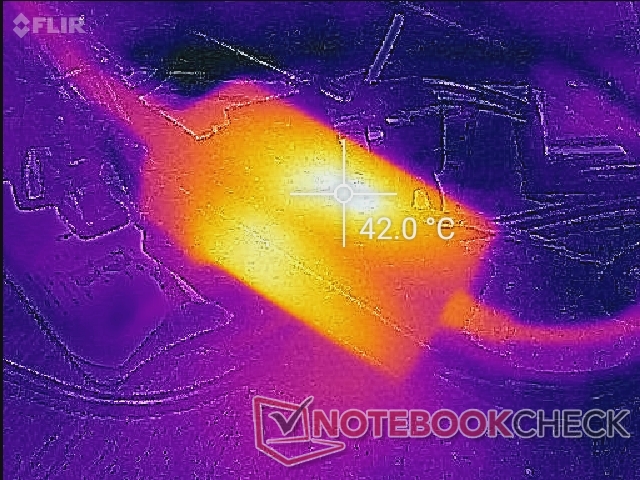
(±) The maximum temperature on the upper side is 44.2 °C / 112 F, compared to the average of 35.9 °C / 97 F, ranging from 21.4 to 59 °C for the class Subnotebook.
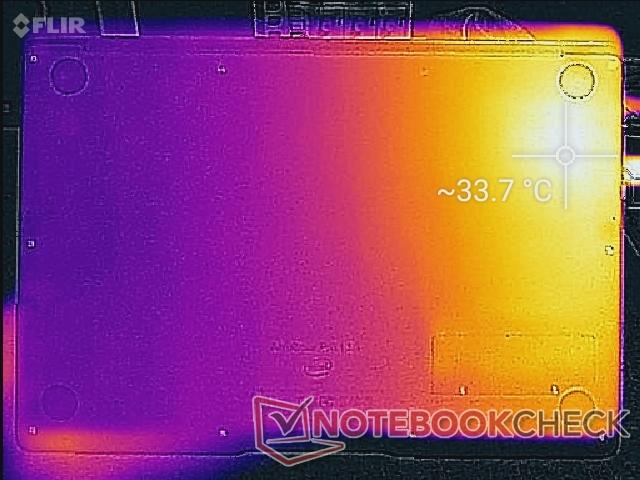
(-) The bottom heats up to a maximum of 49 °C / 120 F, compared to the average of 39.2 °C / 103 F
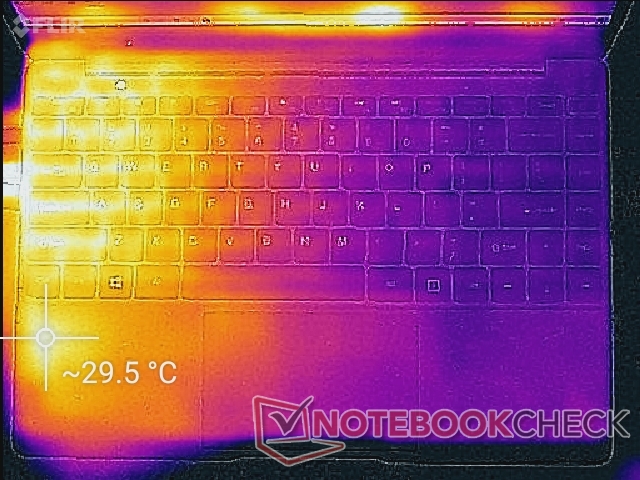
(+) In idle usage, the average temperature for the upper side is 27.2 °C / 81 F, compared to the device average of 30.8 °C / 87 F.
(±) The palmrests and touchpad can get very hot to the touch with a maximum of 37.4 °C / 99.3 F.
(-) The average temperature of the palmrest area of similar devices was 28.2 °C / 82.8 F (-9.2 °C / -16.5 F).
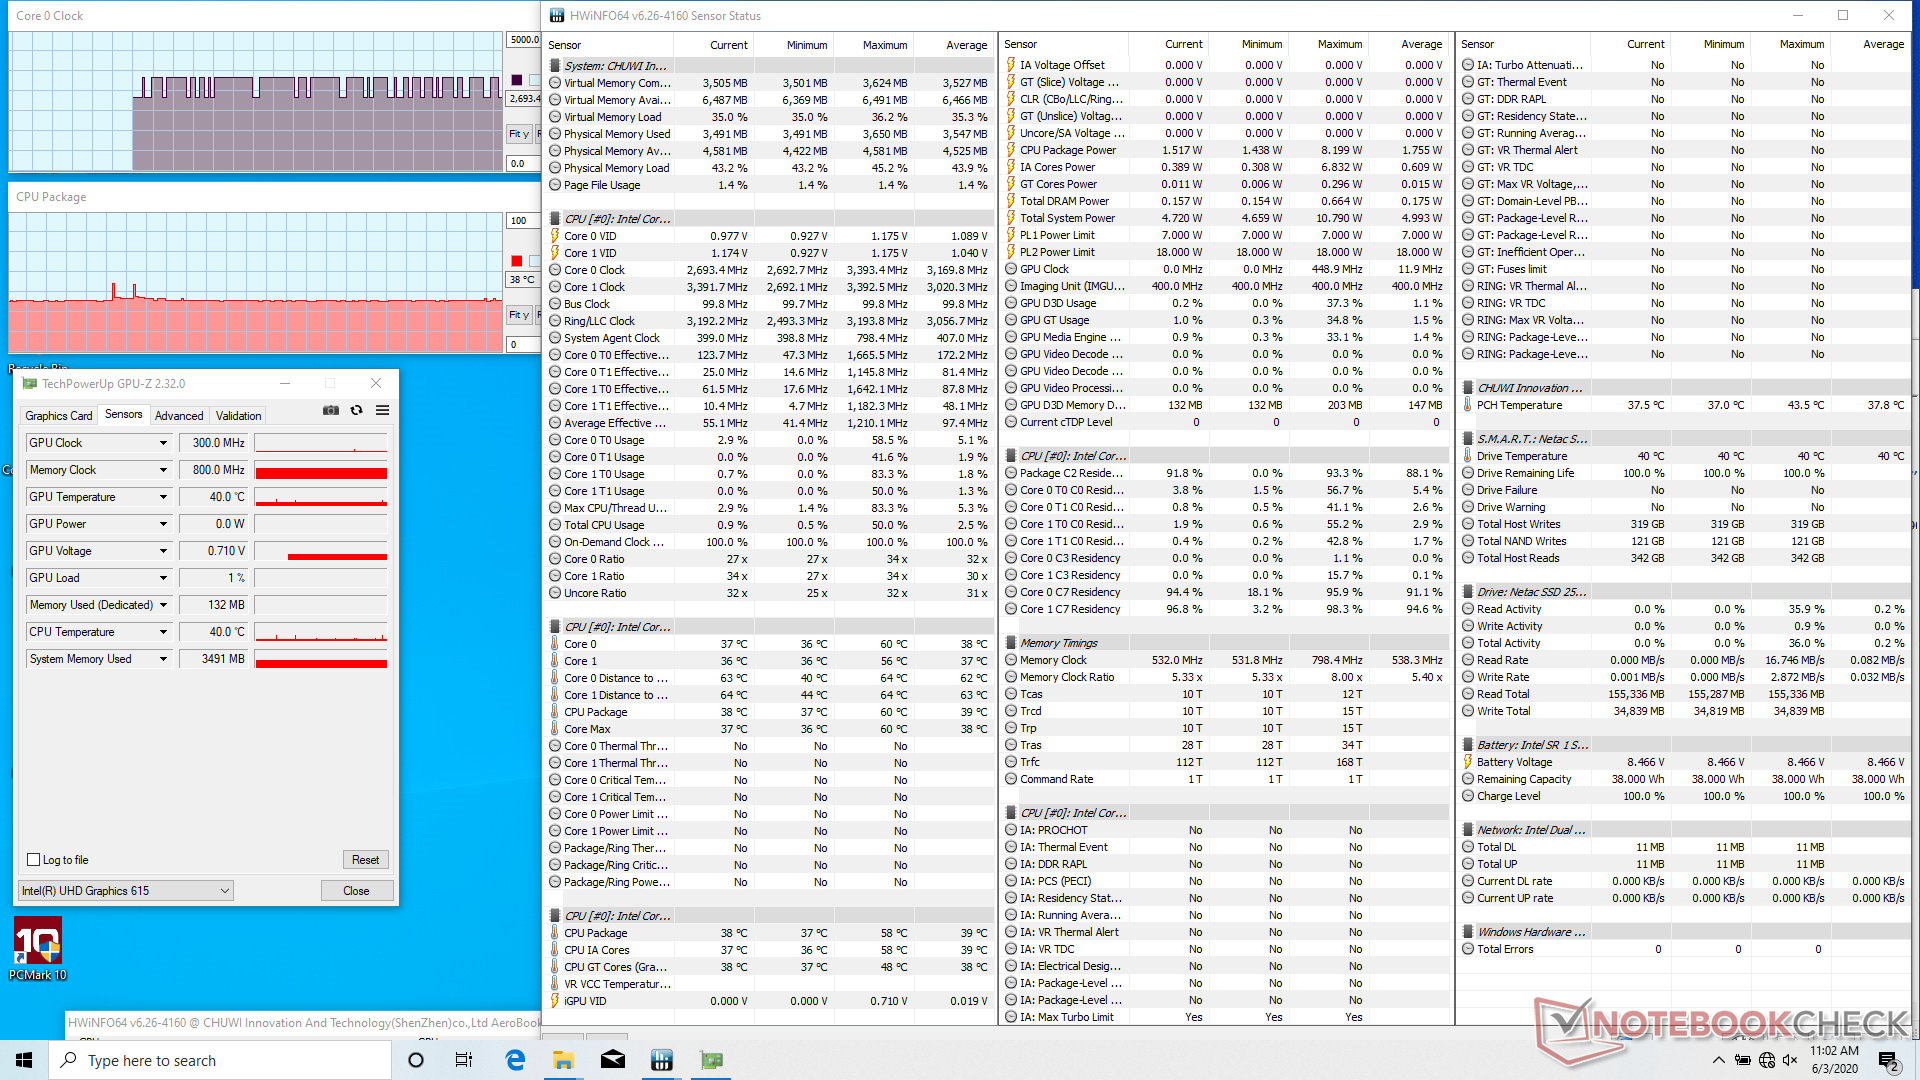
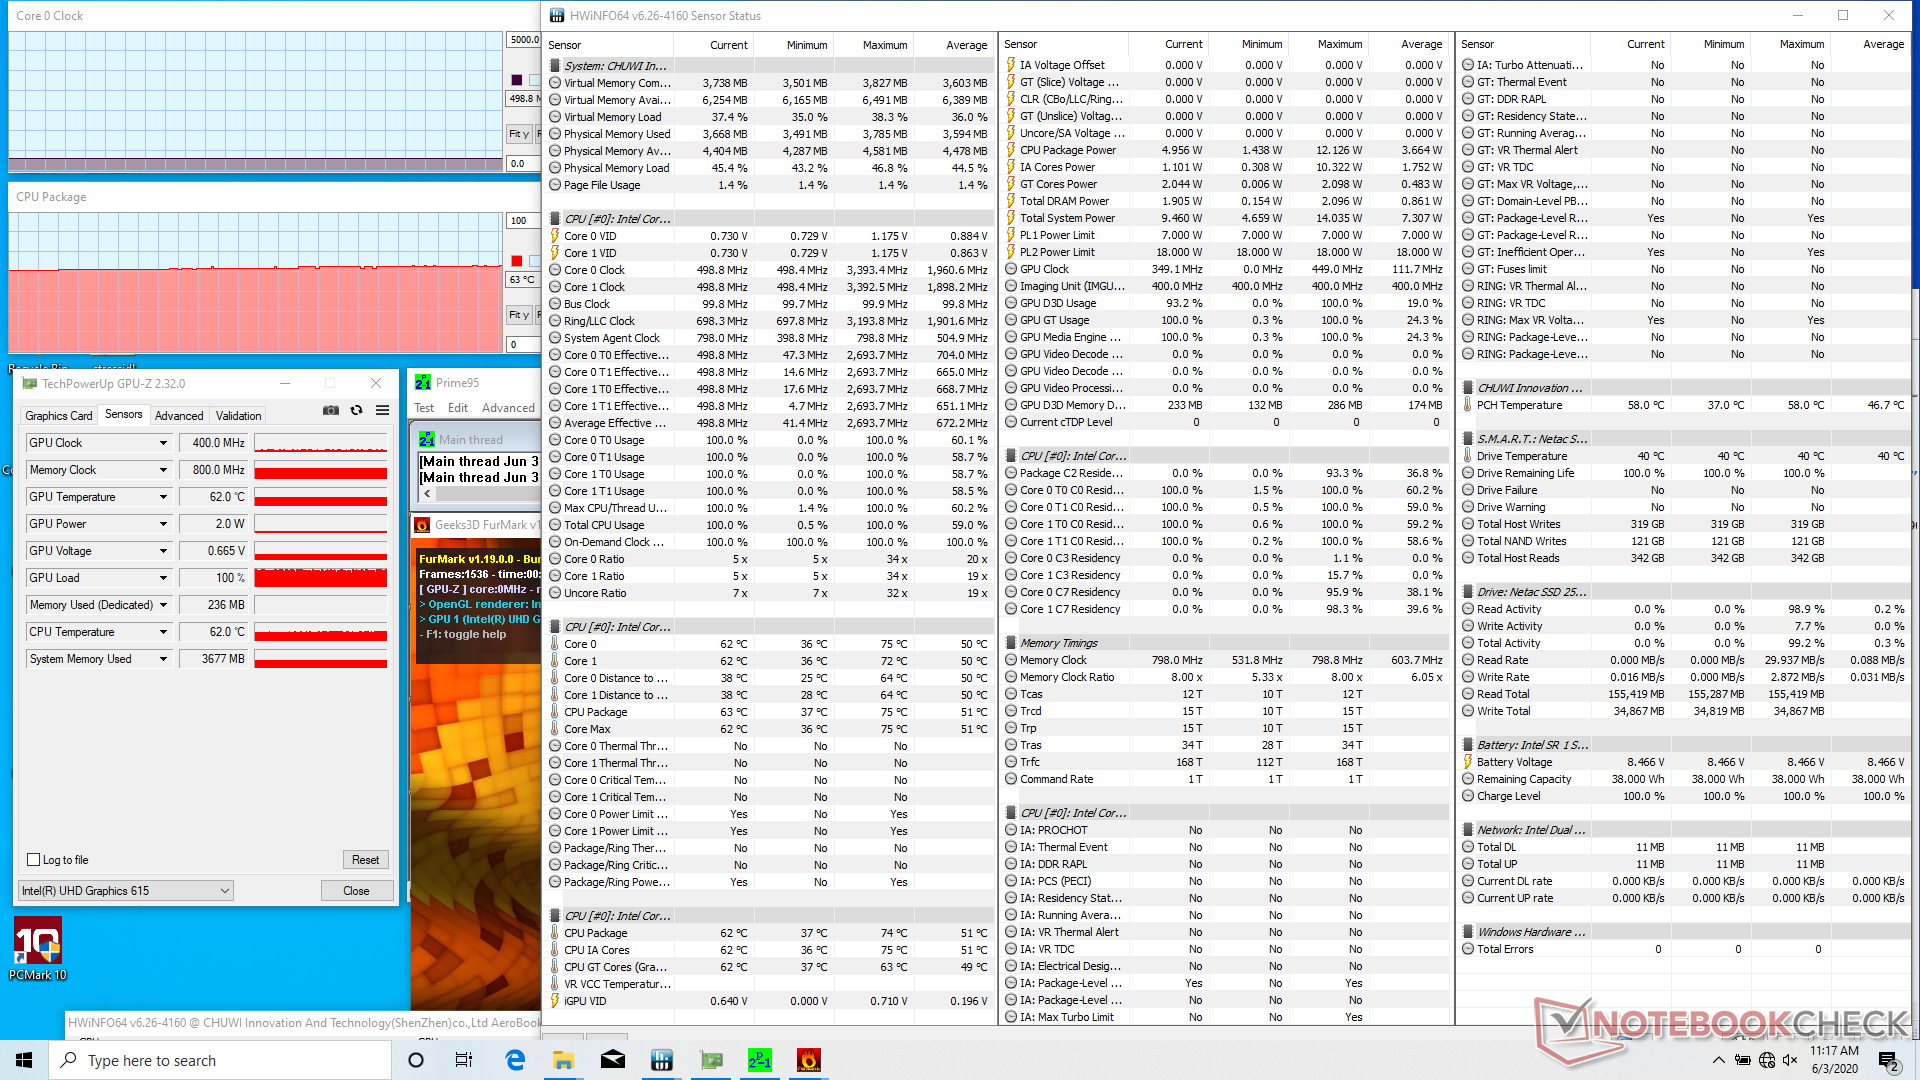
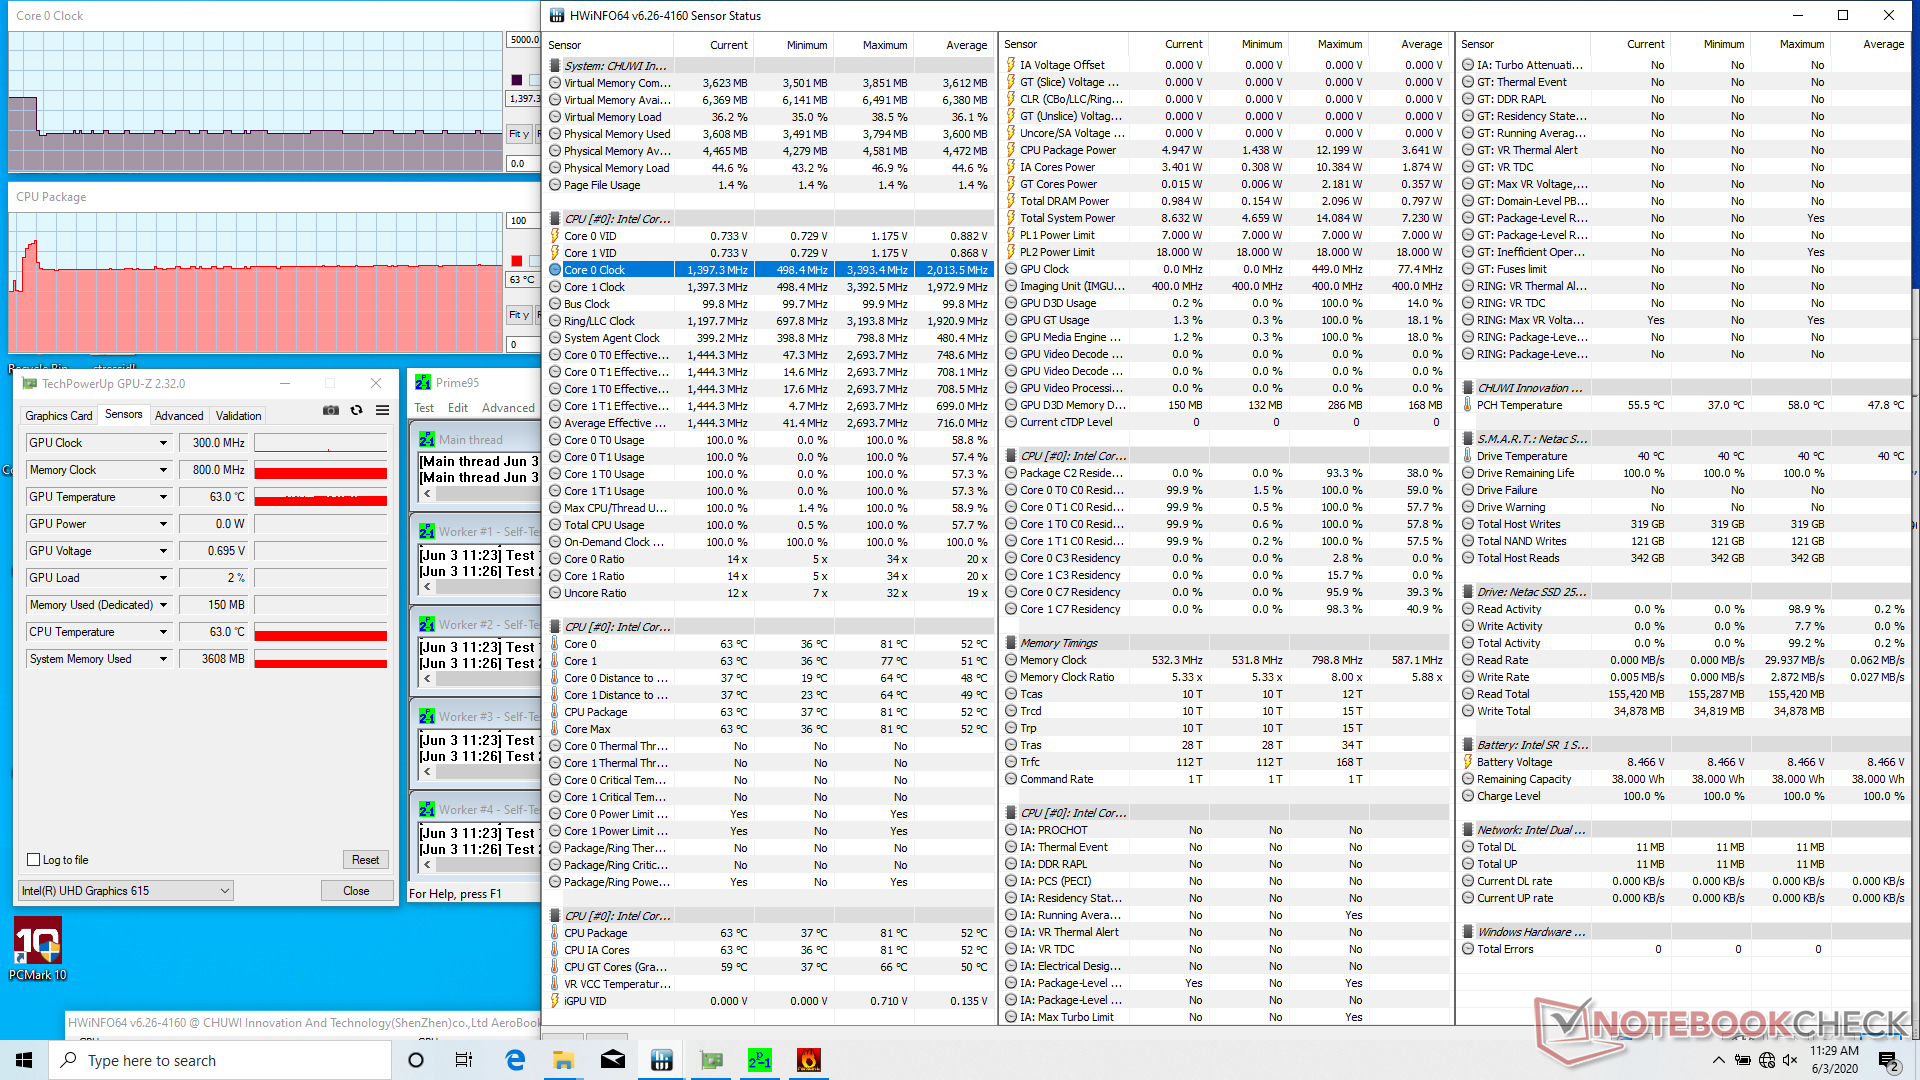
Stress Test
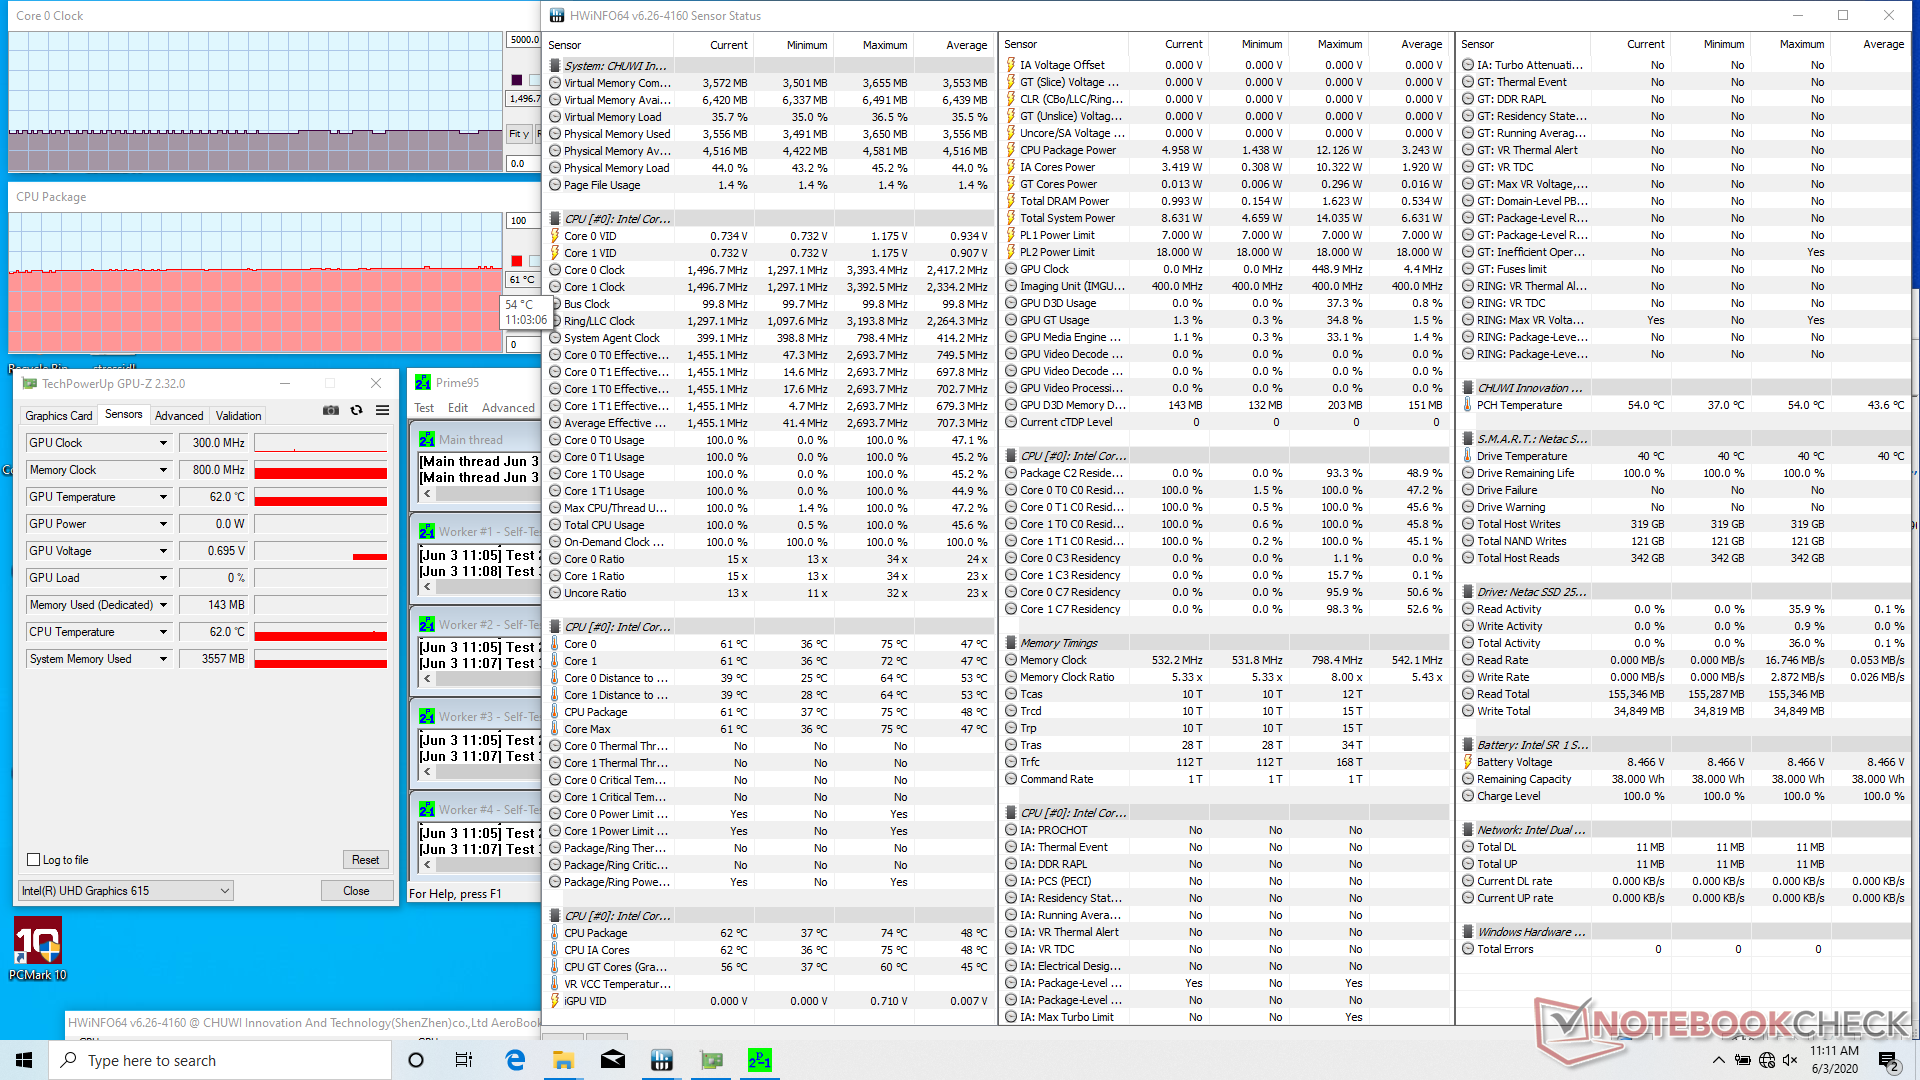
We stress the laptop with synthetic loads to identify for any potential throttling issues. When running Prime95, the CPU would boost to 2.7 GHz for the first few seconds before hitting a core temperature of 75 C. Thereafter, clock rates and temperature would drop and stabilize at 1.5 GHz and 62 C, respectively.
Running on battery will not impact performance significantly. A 3DMark 11 test on battery power returns Physics and Graphics scores of 2306 and 916 points, respectively, compared to 2361 and 947 points when on mains.
| CPU Clock (GHz) | GPU Clock (MHz) | Average CPU Temperature (°C) | |
| System Idle | |||
| Prime95 Stress | 1.4 - 1.5 | -- | 61 |
| Prime95 + FurMark Stress | 0.5 | 400 | 63 |
Speakers

Chuwi AeroBook Pro audio analysis
(+) | speakers can play relatively loud (82.8 dB)
Bass 100 - 315 Hz
(-) | nearly no bass - on average 24.7% lower than median
(+) | bass is linear (4.8% delta to prev. frequency)
Mids 400 - 2000 Hz
(±) | reduced mids - on average 7.2% lower than median
(±) | linearity of mids is average (10.8% delta to prev. frequency)
Highs 2 - 16 kHz
(±) | higher highs - on average 9.4% higher than median
(±) | linearity of highs is average (12% delta to prev. frequency)
Overall 100 - 16.000 Hz
(-) | overall sound is not linear (37.3% difference to median)
Compared to same class
» 97% of all tested devices in this class were better, 1% similar, 1% worse
» The best had a delta of 5%, average was 18%, worst was 53%
Compared to all devices tested
» 94% of all tested devices were better, 1% similar, 5% worse
» The best had a delta of 4%, average was 23%, worst was 134%
Apple MacBook 12 (Early 2016) 1.1 GHz audio analysis
(+) | speakers can play relatively loud (83.6 dB)
Bass 100 - 315 Hz
(±) | reduced bass - on average 11.3% lower than median
(±) | linearity of bass is average (14.2% delta to prev. frequency)
Mids 400 - 2000 Hz
(+) | balanced mids - only 2.4% away from median
(+) | mids are linear (5.5% delta to prev. frequency)
Highs 2 - 16 kHz
(+) | balanced highs - only 2% away from median
(+) | highs are linear (4.5% delta to prev. frequency)
Overall 100 - 16.000 Hz
(+) | overall sound is linear (10.2% difference to median)
Compared to same class
» 7% of all tested devices in this class were better, 2% similar, 90% worse
» The best had a delta of 5%, average was 18%, worst was 53%
Compared to all devices tested
» 5% of all tested devices were better, 1% similar, 94% worse
» The best had a delta of 4%, average was 23%, worst was 134%
Energy Management
Power Consumption
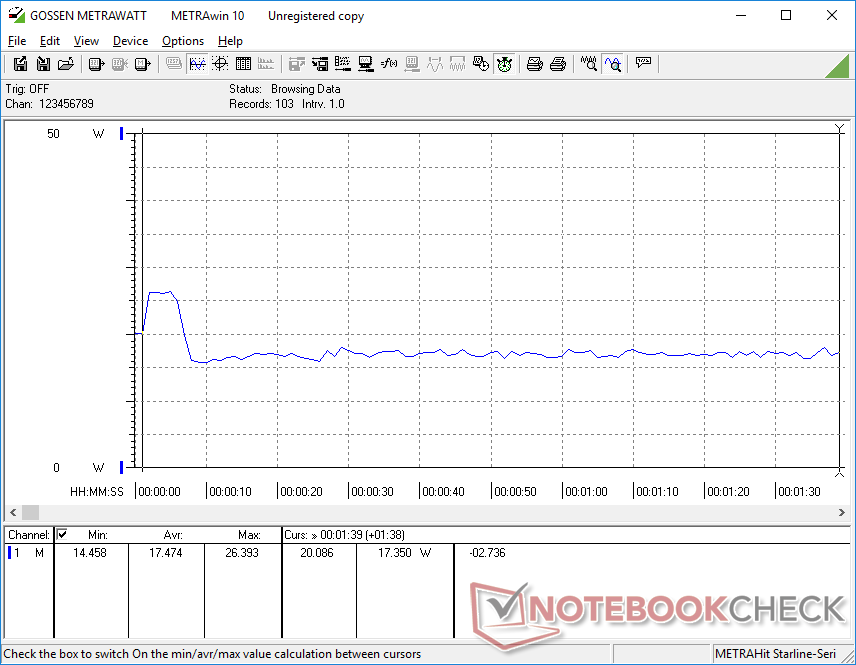
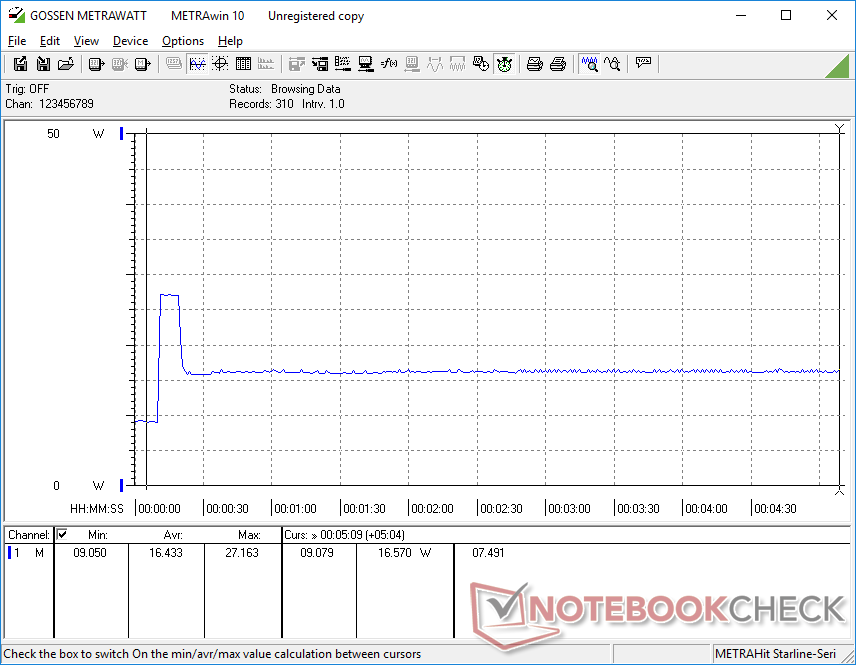
Idling on desktop consumes between 5 W and 10 W depending on the power profile and brightness setting. When running 3DMark 06, the AeroBook Pro consumes a bit less on average than the 2019 AeroBook.
The maximum consumption we're able to record is 27.2 W during the first few seconds of running Prime95 before falling due to thermal limitations. The small AC adapter (~9 x 4.4 x 3 cm) is rated for 24 W.
| Off / Standby | |
| Idle | |
| Load |
|
Key:
min: | |
| Chuwi AeroBook Pro m3-8100Y, UHD Graphics 615, Netac SSD 256GB, IPS, 1920x1080, 13.3" | Apple MacBook Air 2020 i5 i5-1030NG7, Iris Plus Graphics G7 (Ice Lake 64 EU), Apple SSD AP0512, IPS, 2560x1600, 13.3" | Dell XPS 13 9300 i5 FHD i5-1035G1, UHD Graphics G1 (Ice Lake 32 EU), Toshiba XG6 KXG60ZNV512G, IPS, 1920x1200, 13.4" | Lenovo Yoga 720-12IKB i5-7200U, HD Graphics 620, Liteonit CV3-8D128, IPS, 1920x1080, 12.5" | Jumper EZbook X3 Celeron N3350, HD Graphics 500, 64 GB eMMC Flash, IPS, 1920x1080, 13.3" | Lenovo Ideapad S530-13IWL i5-8265U, UHD Graphics 620, Lenovo UMIS AM610 RPFTJ256PDD2MWX, IPS, 1920x1080, 13.3" | |
|---|---|---|---|---|---|---|
| Power Consumption | 0% | -27% | 3% | 32% | -27% | |
| Idle Minimum * (Watt) | 5.7 | 2.4 58% | 3.4 40% | 3.7 35% | 3.3 42% | 2.8 51% |
| Idle Average * (Watt) | 8.2 | 6.8 17% | 6 27% | 5.7 30% | 6.4 22% | 5.6 32% |
| Idle Maximum * (Watt) | 9.2 | 10.5 -14% | 10.2 -11% | 6.9 25% | 7 24% | 7.4 20% |
| Load Average * (Watt) | 17.5 | 25.7 -47% | 36.6 -109% | 29.6 -69% | 13.4 23% | 41.6 -138% |
| Load Maximum * (Watt) | 27.2 | 30.4 -12% | 49.3 -81% | 29.4 -8% | 14 49% | 55 -102% |
| Witcher 3 ultra * (Watt) | 24.5 |
* ... smaller is better
Battery Life
Battery capacity hasn't changed from last year's model. We recorded almost 5 hours of real-world WLAN use compared to over 6 hours on the 2019 AeroBook when under similar conditions.
Recharging from empty to full capacity is very slow at almost 3.5 hours.
| Chuwi AeroBook Pro m3-8100Y, UHD Graphics 615, 38 Wh | Apple MacBook Air 2020 i5 i5-1030NG7, Iris Plus Graphics G7 (Ice Lake 64 EU), 49.9 Wh | Dell XPS 13 9300 i5 FHD i5-1035G1, UHD Graphics G1 (Ice Lake 32 EU), 52 Wh | Lenovo Yoga 720-12IKB i5-7200U, HD Graphics 620, 36 Wh | Jumper EZbook X3 Celeron N3350, HD Graphics 500, 34.9 Wh | Lenovo Ideapad S530-13IWL i5-8265U, UHD Graphics 620, 45 Wh | |
|---|---|---|---|---|---|---|
| Battery runtime | 106% | 134% | 20% | 58% | 32% | |
| WiFi v1.3 (h) | 5 | 10.3 106% | 11.7 134% | 6 20% | 7.9 58% | 6.6 32% |
| Load (h) | 2.9 | 3.4 | 1.5 | 1.3 | ||
| Reader / Idle (h) | 11.5 | 13.5 |
Pros
Cons
Verdict
Going from the AeroBook to the AeroBook Pro should mean upgrades across the board. Unfortunately, the AeroBook Pro is essentially the same despite the processor swap and the display changes are actually a downgrade. System performance remains incredibly slow to the point where even light multi-tasking will feel like a slog.
If you're looking for a cheap Ultrabook to get you by, then consider investing in an older generation Core U-series laptop like the Dell XPS 13, HP Spectre 13, or Asus ZenBook 13. Even a Core i3 2016-era configuration will both outlast and outperform the AeroBook Pro without costing all that much more.
The AeroBook Pro has a great display, great chassis design, and a great keyboard especially for the price. The very slow Core m3 processor drags down what could have otherwise been a decent budget deal.
Chuwi AeroBook Pro
- 06/04/2020 v7 (old)
Allen Ngo
Price comparison
