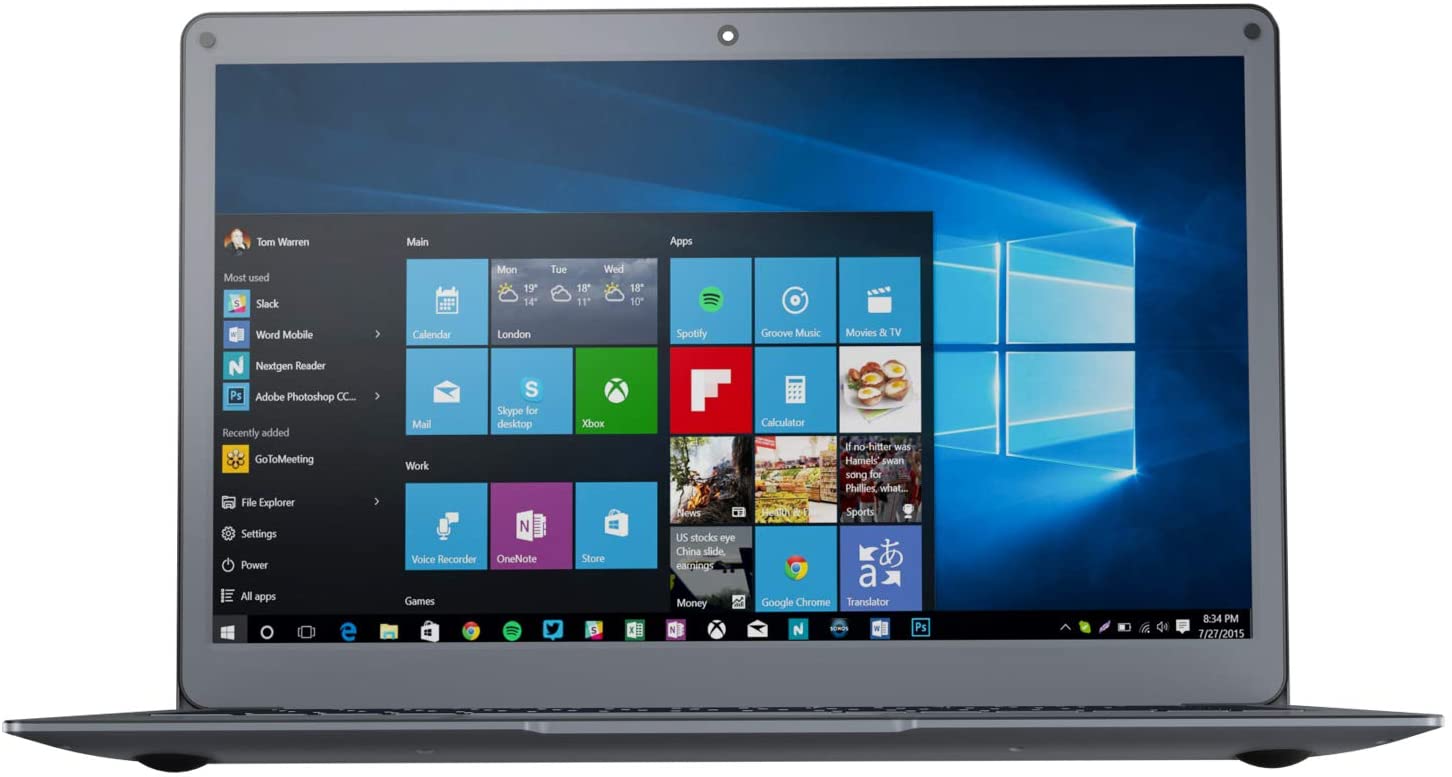
Jumper EZbook X3 Review: Ancient technology meets wobbly chassis

There's a new offer in the low-cost segment: The Jumper EZBook X3 is currently available for $250 and even has a Windows license. It is equipped with an old Intel Celeron N3350 processor - the rest of its hardware seems fairly up to date: an anti-glare IPS Full-HD display and an M.2 2280 slot for expanding storage capacity. What more could you want for a price like this?
The competition in the price segment below $300 is far and between. Manufacturers that address the low-cost segment do so with very few models only. There are some Medion and Lenovo devices, as well as LincPlus. The Akoya E4253 is most promising from a technological perspective - its Pentium N5000 processor is more modern and faster than the Celeron versions in other devices. The cheapest competitor is the IdeaPad Slim 1-14AST-05, whose performance, however, is not a lot better than that of our test unit (A6-9220e). Chuwi LapBook Pro and LincPlus P1 both have a better quad-core SoC and a reflective Full-HD IPS display.
Rating | Date | Model | Weight | Height | Size | Resolution | Price |
|---|---|---|---|---|---|---|---|
| 67.7 % v7 (old) | 04 / 2020 | Jumper EZbook X3 Celeron N3350, HD Graphics 500 | 1.3 kg | 18 mm | 13.30" | 1920x1080 | |
| 79.9 % v7 (old) | 08 / 2019 | Medion Akoya E4253-30025387 Pentium N5000, UHD Graphics 605 | 1.4 kg | 15 mm | 14.00" | 1920x1080 | |
| 73.5 % v7 (old) | 02 / 2020 | Lenovo IdeaPad Slim 1-14AST-05 A6-9220e, Radeon R4 (Stoney Ridge) | 1.4 kg | 20.9 mm | 14.00" | 1920x1080 | |
| 78.7 % v7 (old) | 08 / 2019 | Chuwi LapBook Pro Celeron N4100, UHD Graphics 600 | 1.4 kg | 13.4 mm | 14.00" | 1920x1080 | |
| 75.2 % v7 (old) | LincPlus P1 Celeron N4000, UHD Graphics 600 | 1.4 kg | 16 mm | 13.30" | 1920x1080 |
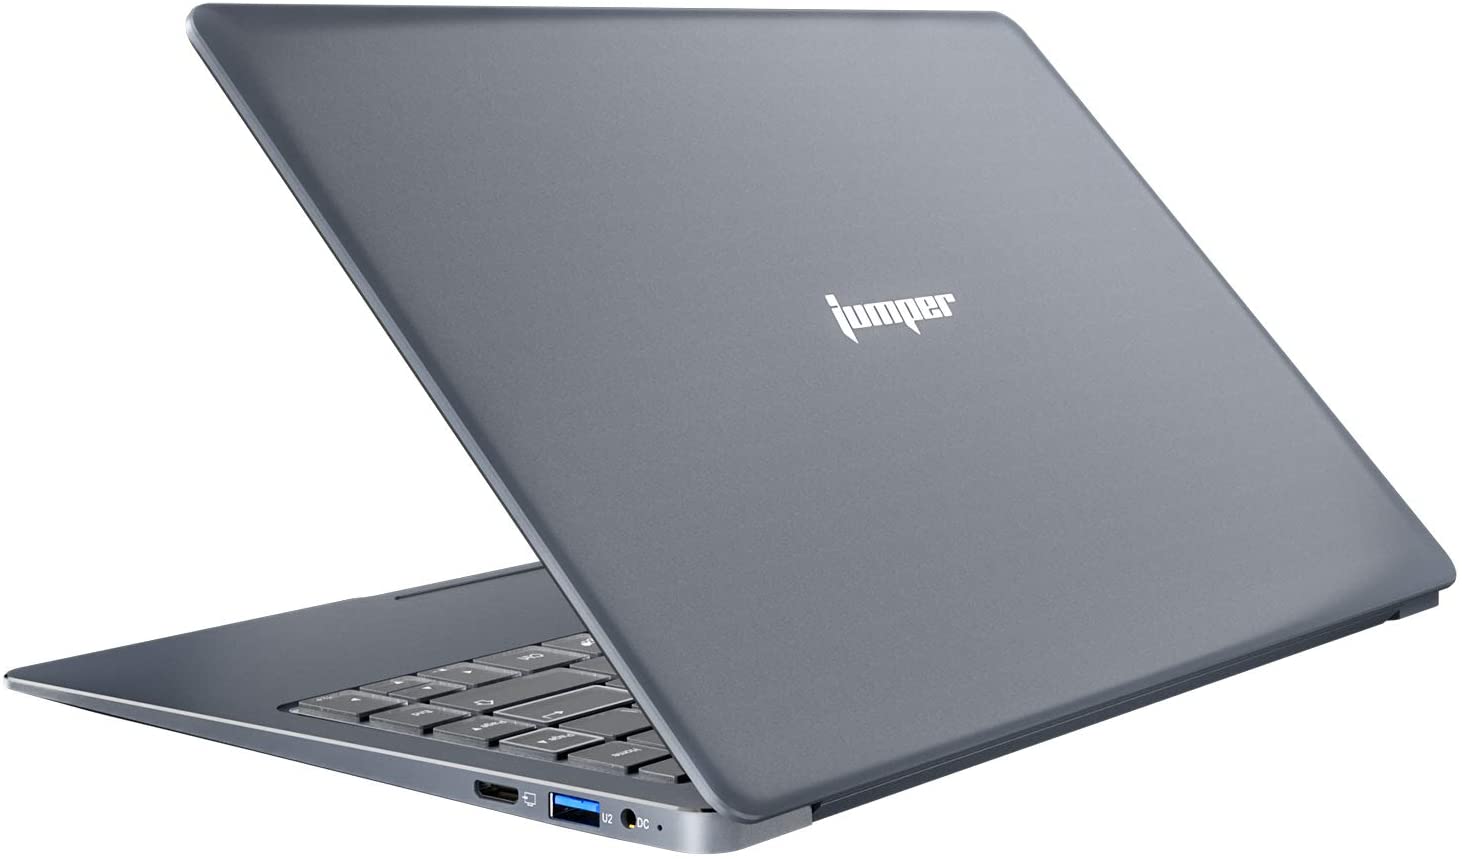
Case & Connectivity
The manufacturer obviously did not pay much attention while developing this device. We don't think we've ever laid our hands on a more flexible case. It was probably supposed to be as thin and light as possible - to which the quickest solution is to choose simple, cheap plastic.
The lid is also made of plastic, although it is significantly more solid than the base. The hinge gives a bad impression: Every time you move the screen, the back of the base unit gets warped.
The Jumper EZBook X3 does not have any maintenance options and RAM is soldered on. However, you can install a SATA SSD via the M.2 2280 interface through a hatch on the bottom of the base unit.
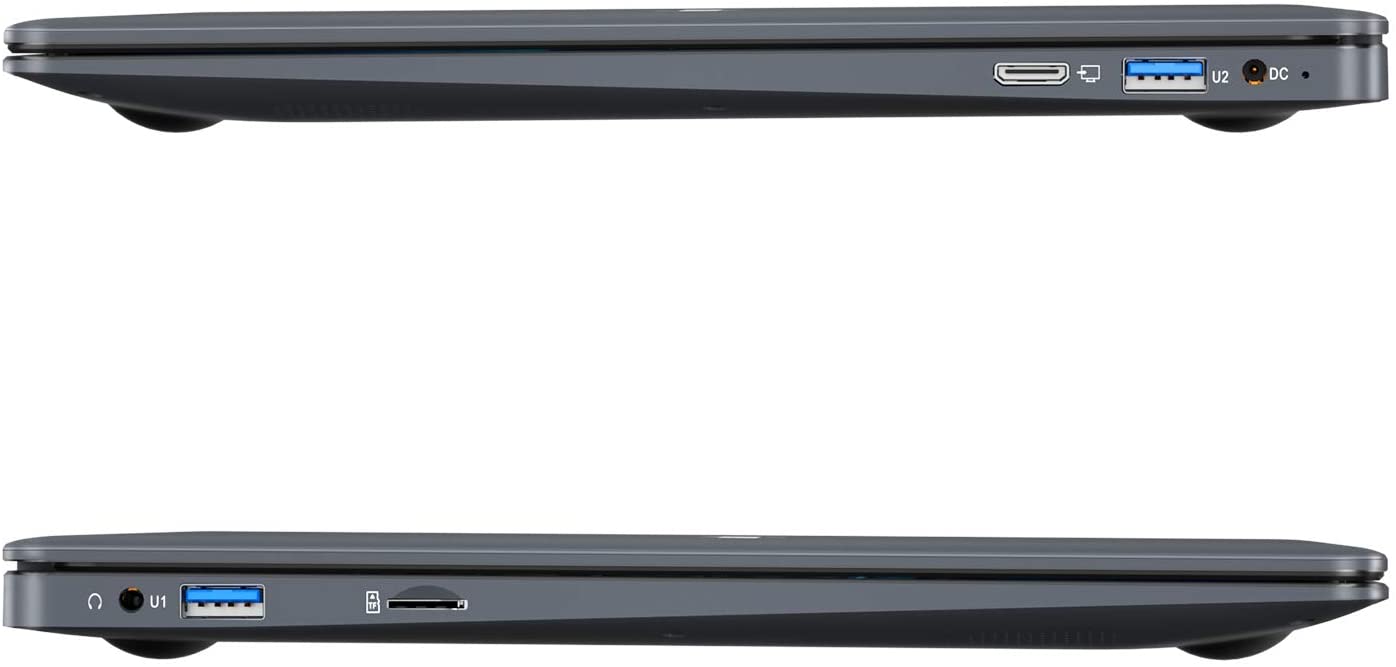
The port selection is rather disappointing as well, although at least there is a microSD card reader available. However, this must have a USB 2.0 interface as it has very slow transfer rates. Bluetooth is included but limited to the old 4.1 standard.
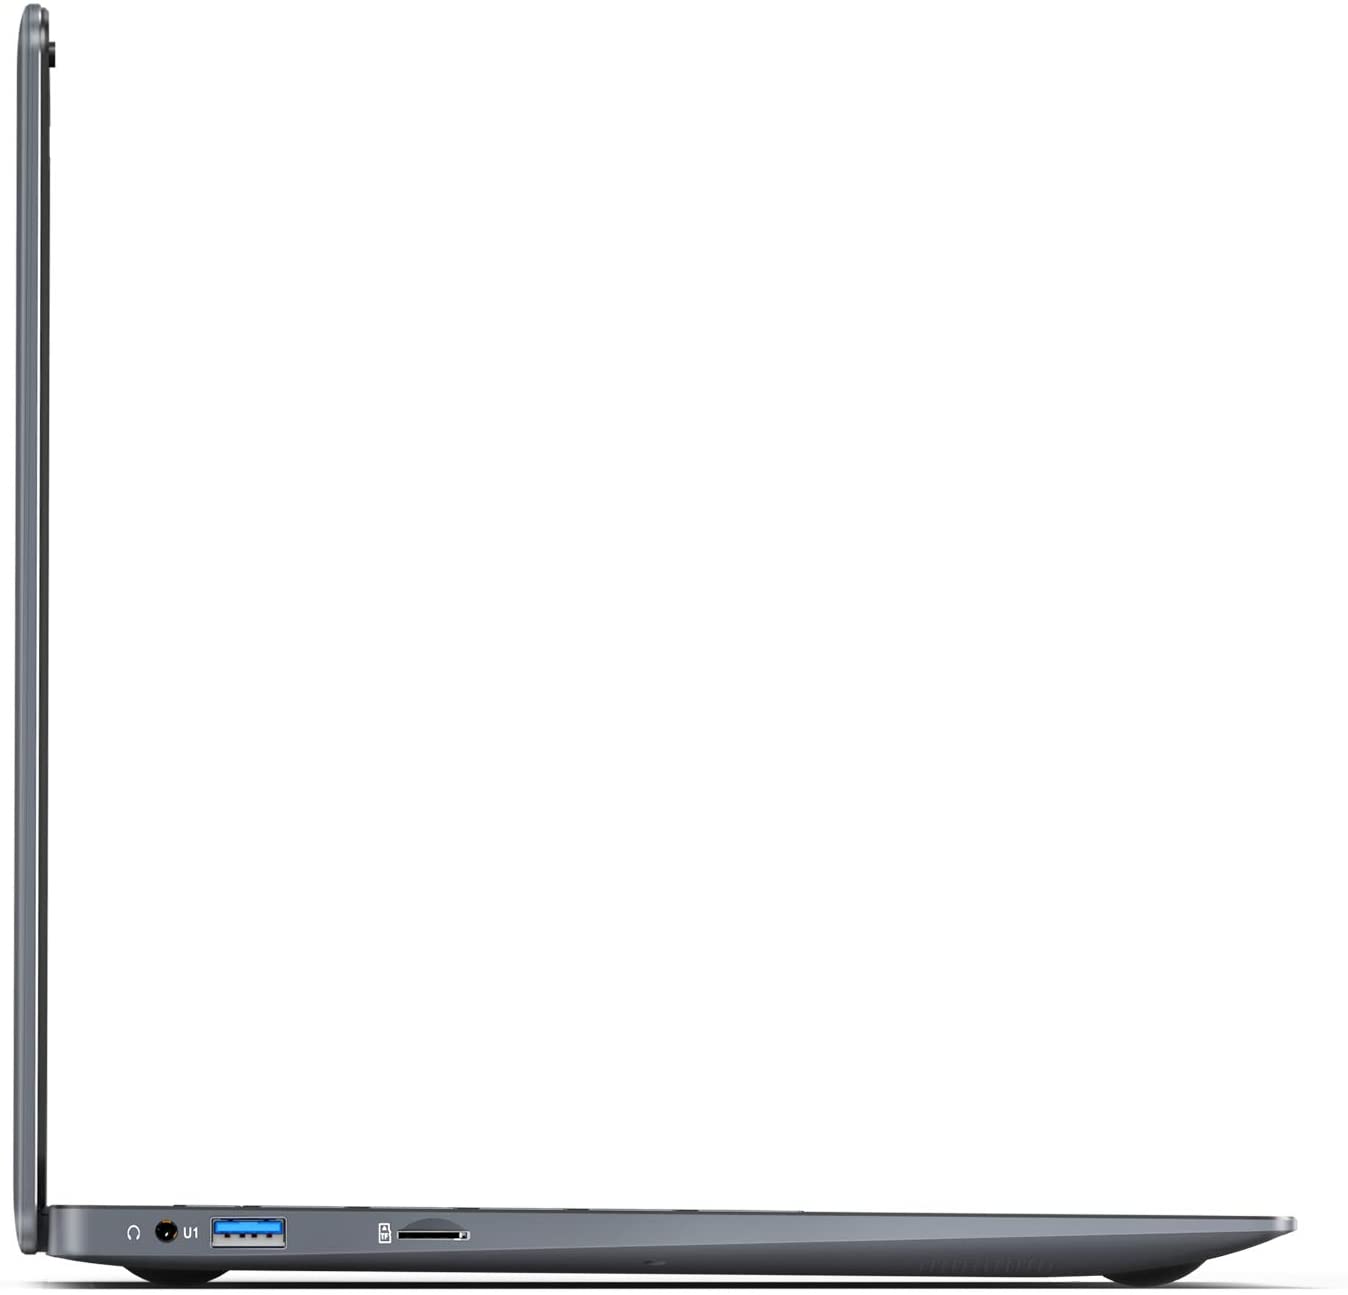
Port Selection
| SD Card Reader | |
| average JPG Copy Test (av. of 3 runs) | |
| Average of class Subnotebook (23.7 - 188, n=9, last 2 years) | |
| Lenovo IdeaPad Slim 1-14AST-05 (Toshiba Exceria Pro M501 microSDXC 64GB) | |
| Jumper EZbook X3 | |
| LincPlus P1 | |
| maximum AS SSD Seq Read Test (1GB) | |
| Average of class Subnotebook (24.9 - 195, n=8, last 2 years) | |
| Medion Akoya E4253-30025387 (Toshiba Exceria Pro M501 microSDXC 64GB) | |
| Lenovo IdeaPad Slim 1-14AST-05 (Toshiba Exceria Pro M501 microSDXC 64GB) | |
| Jumper EZbook X3 | |
| LincPlus P1 | |
| Networking | |
| iperf3 transmit AX12 | |
| Medion Akoya E4253-30025387 | |
| LincPlus P1 | |
| Jumper EZbook X3 | |
| Lenovo IdeaPad Slim 1-14AST-05 | |
| Chuwi LapBook Pro | |
| Average Intel Dual Band Wireless-AC 3165 (48 - 346, n=71) | |
| iperf3 receive AX12 | |
| Medion Akoya E4253-30025387 | |
| LincPlus P1 | |
| Average Intel Dual Band Wireless-AC 3165 (54 - 360, n=71) | |
| Jumper EZbook X3 | |
| Chuwi LapBook Pro | |
| Lenovo IdeaPad Slim 1-14AST-05 | |


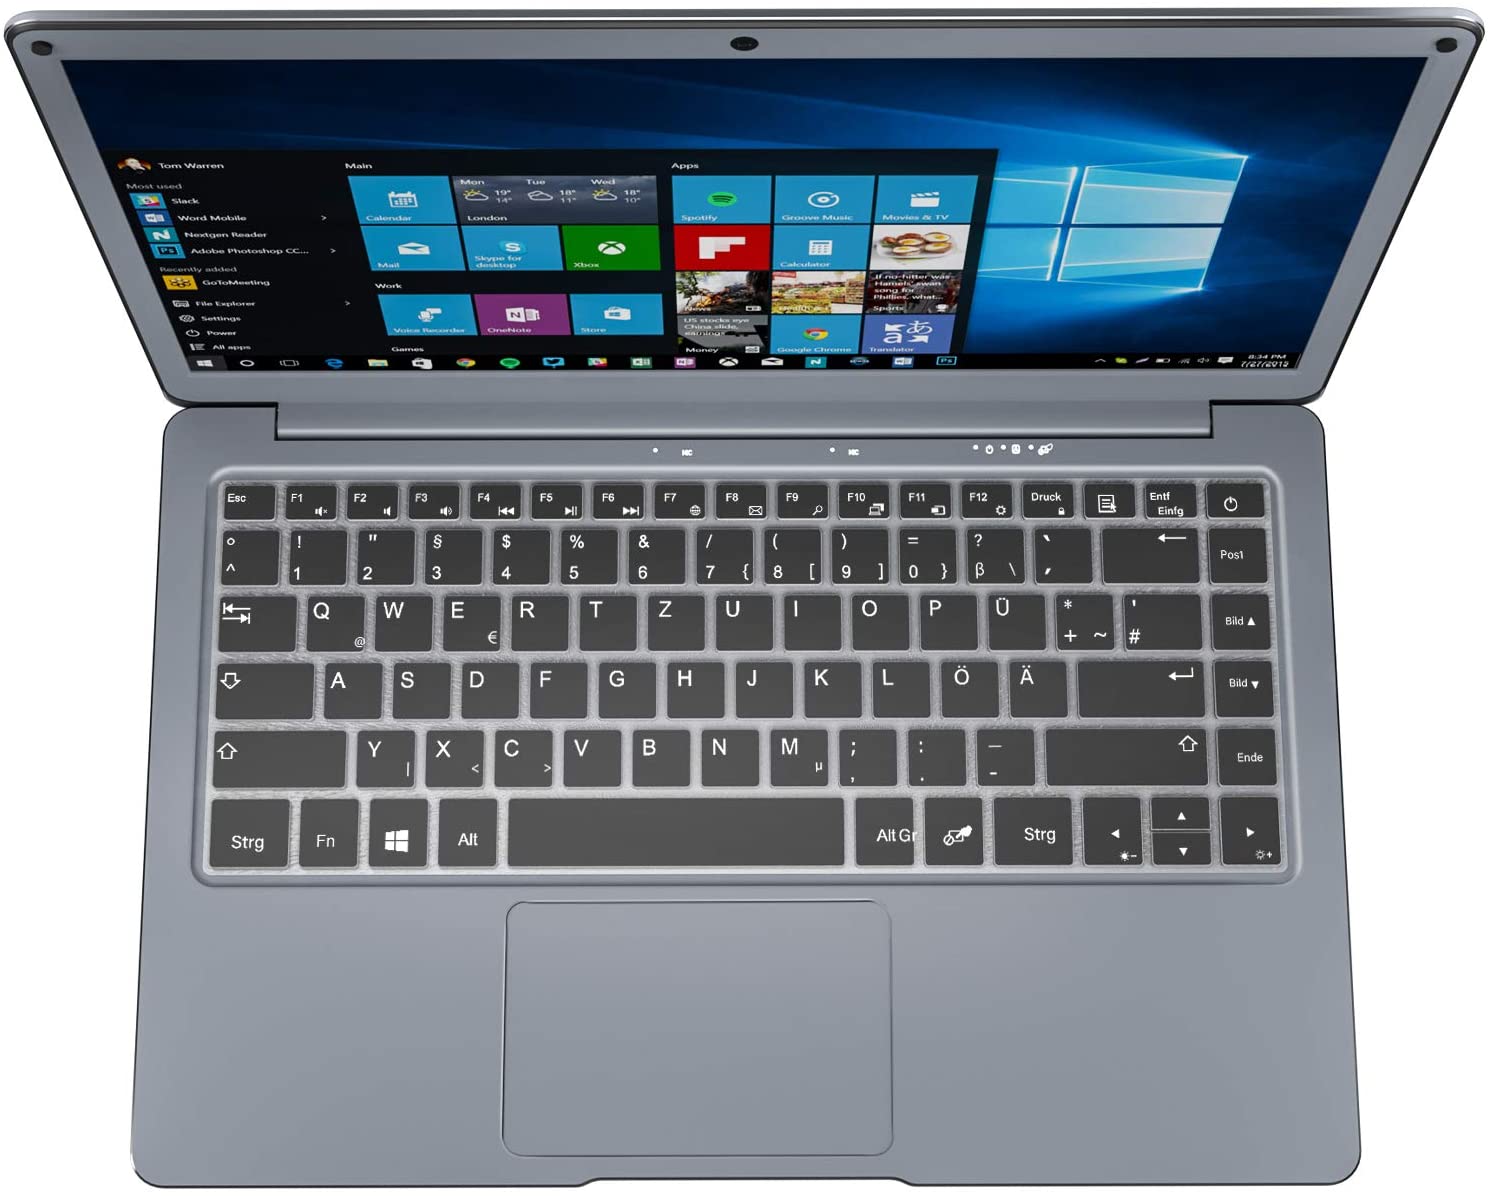
Input Devices
The flexible base is bad news for the input devices: The keyboard is quite bouncy - particularly towards the center. The material gives way as soon as the pressure increases slightly. The ClickPad's disappointing pressure point makes this even more apparent, since it requires more pressure to trigger an input.
Even the moderate travel and spacious layout cannot really make up for this. The LincPlus offered the best input devices of our comparison field.
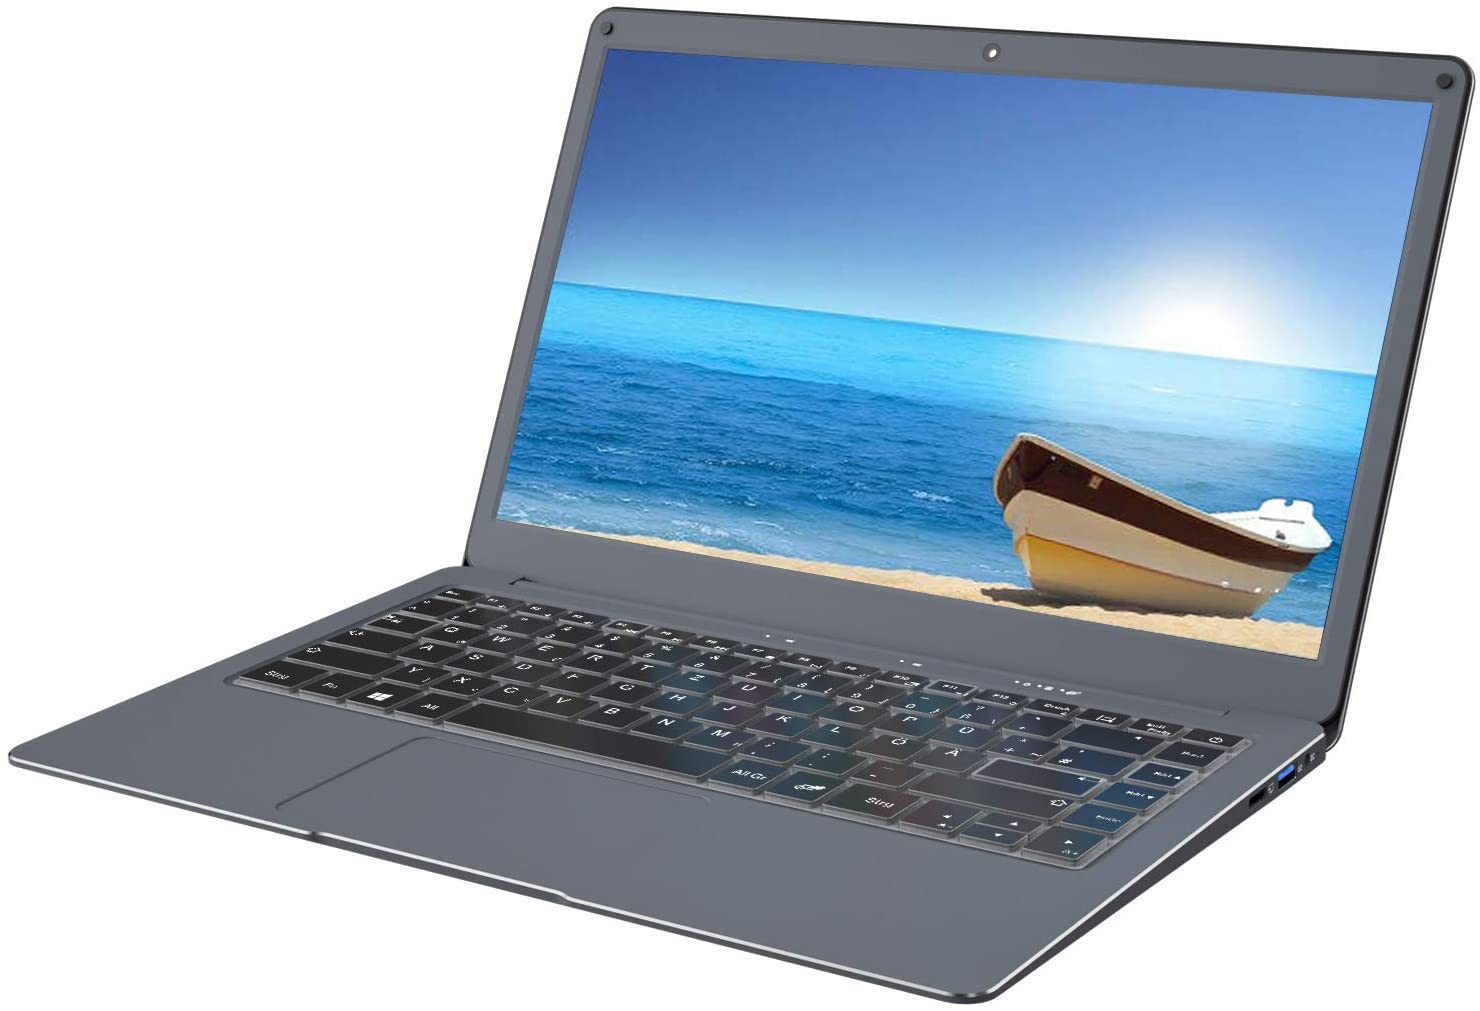
Display

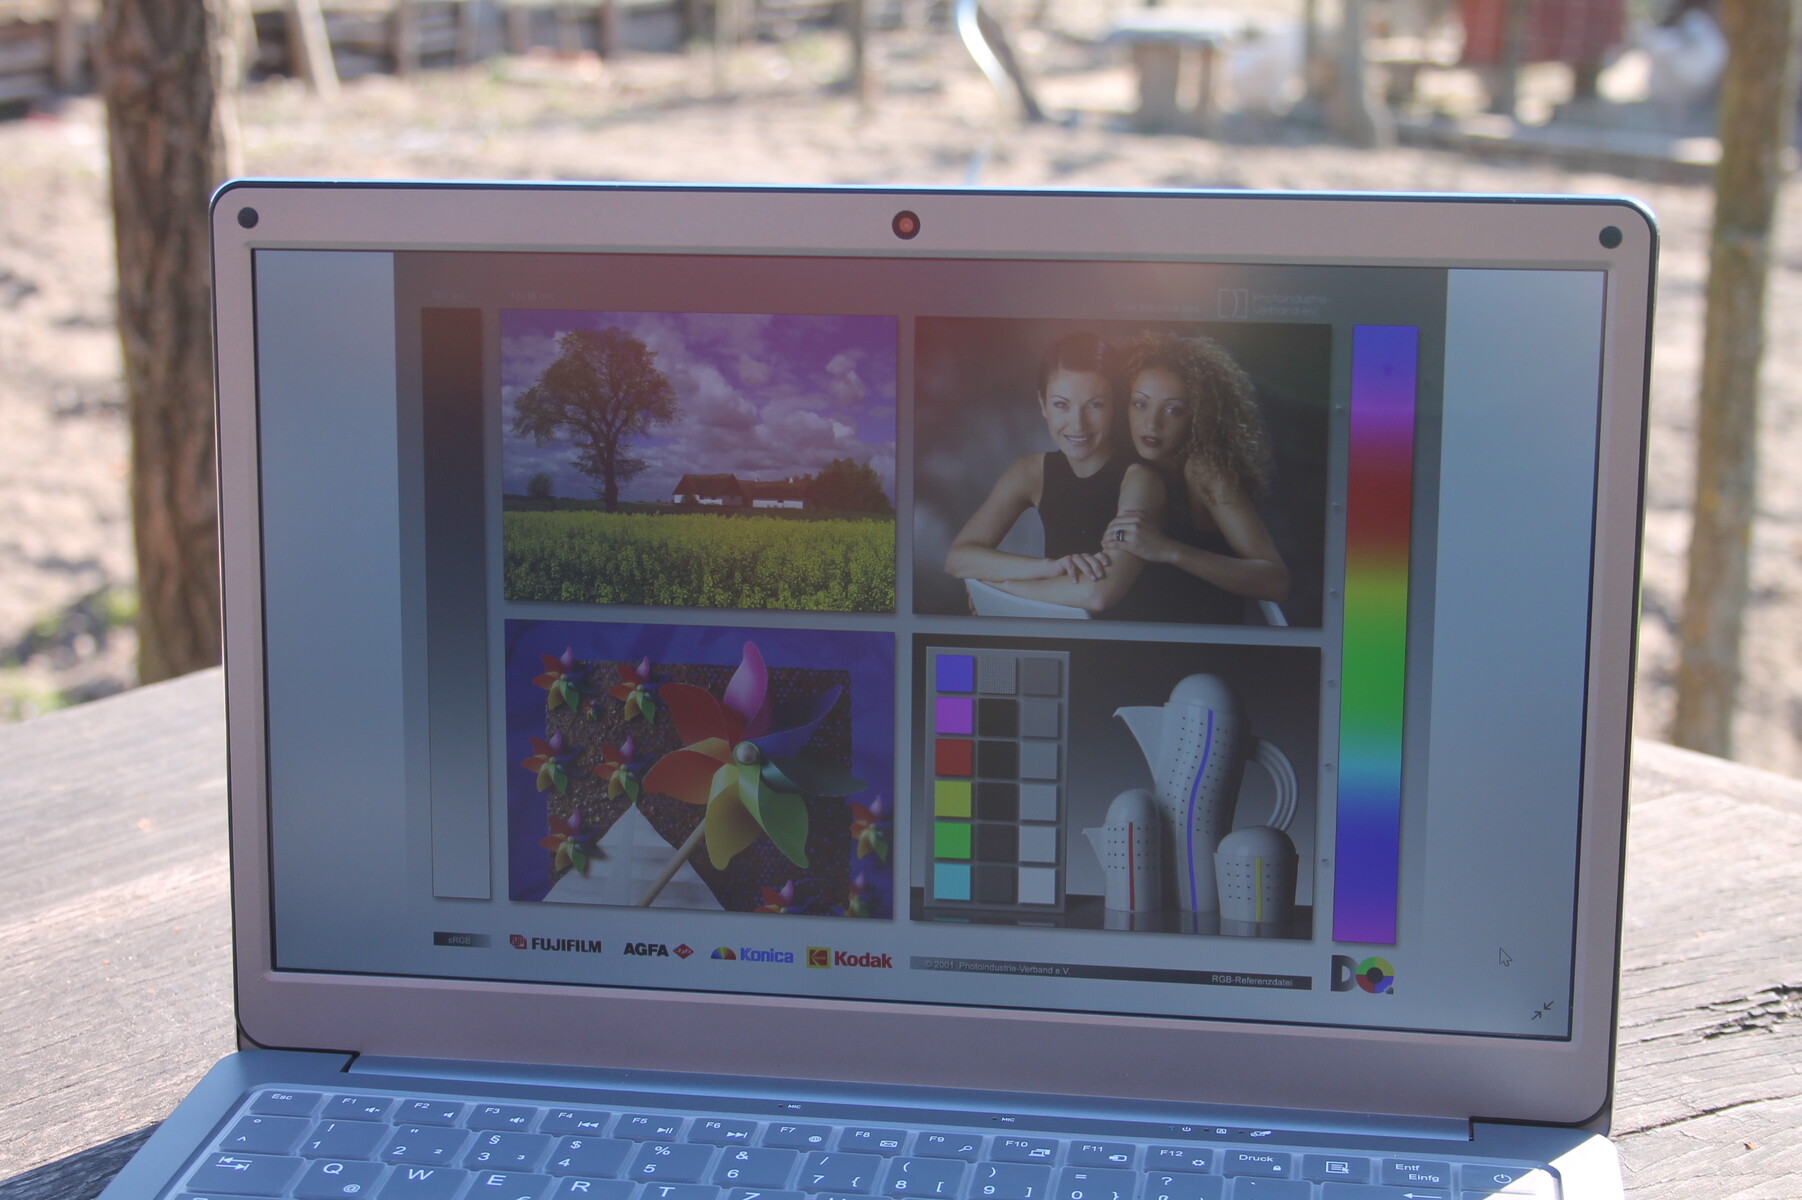
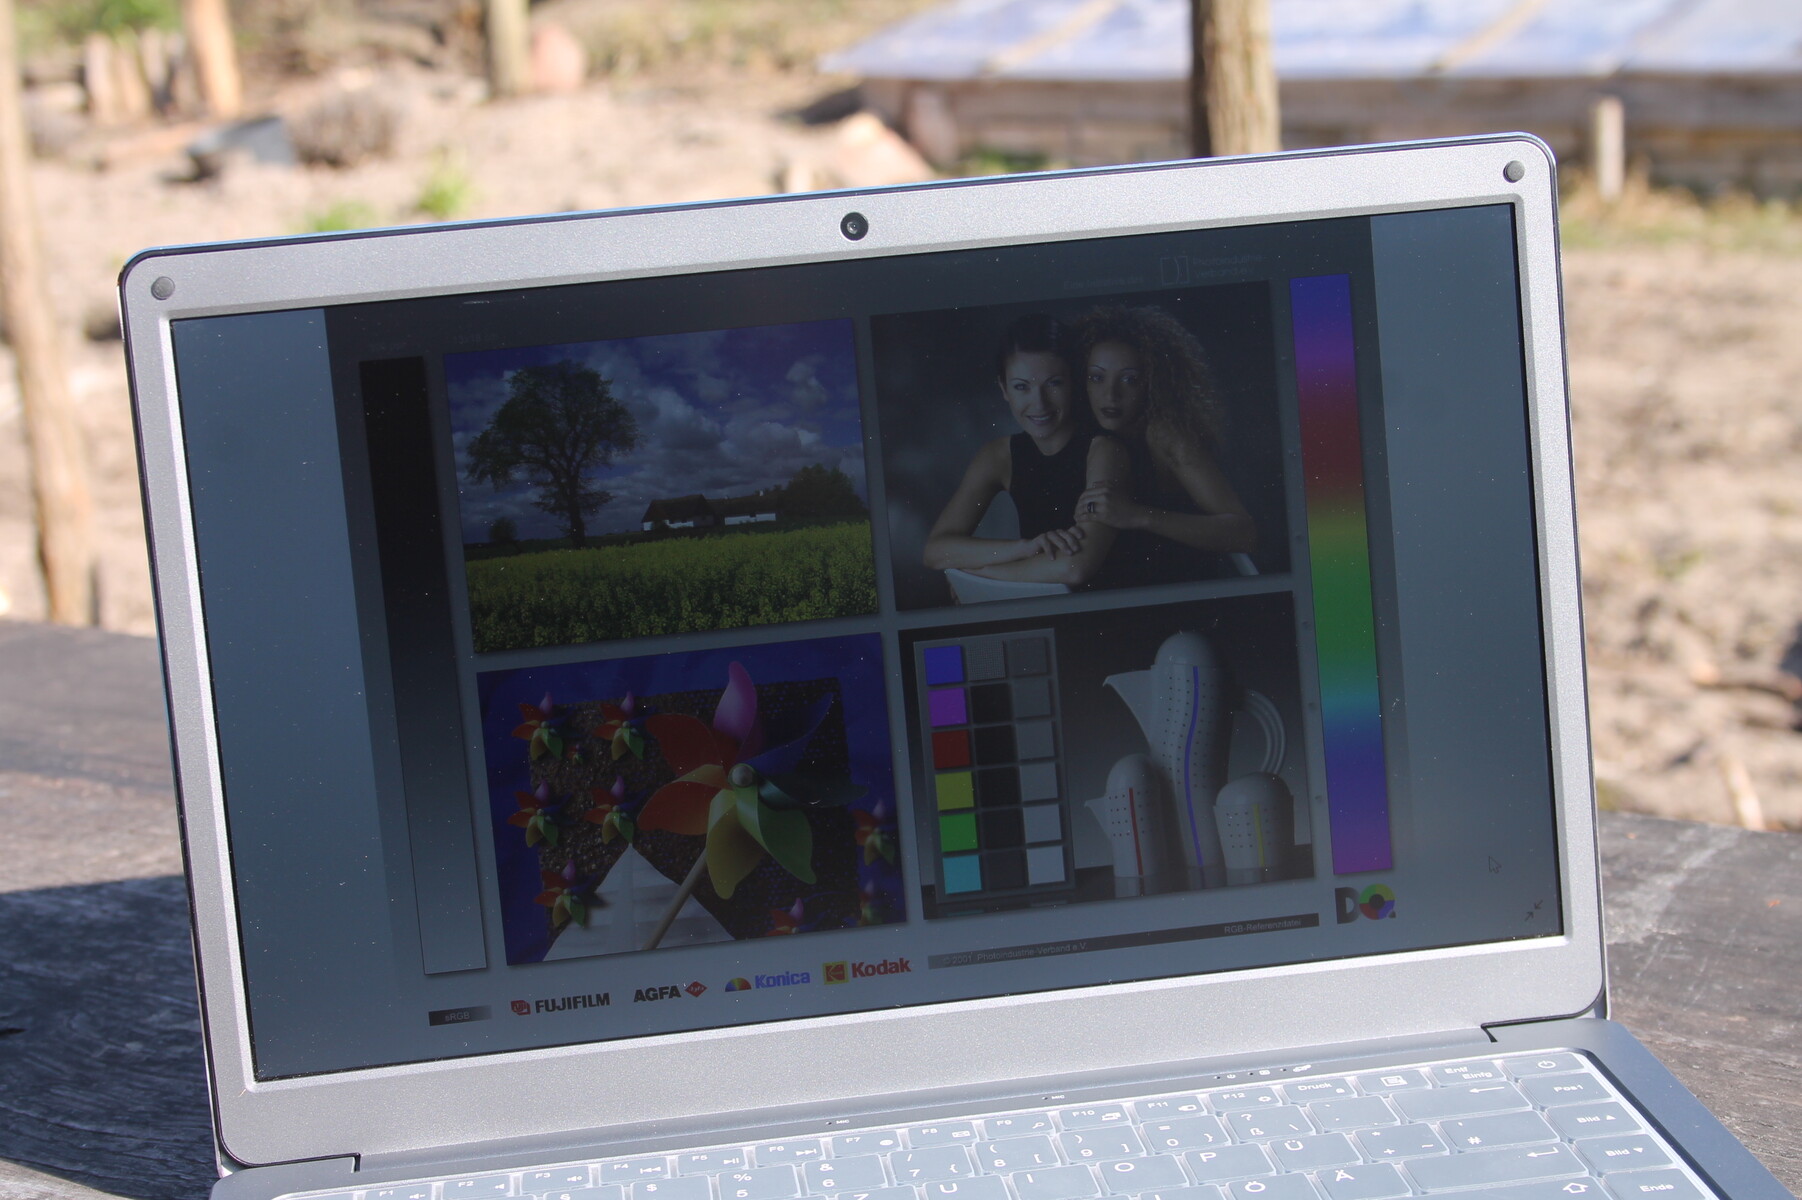
The anti-glare 13.3-inch panel has a resolution of 1920x1080 pixels and offers a decent contrast ratio of 1045:1 and a good color display. The screen does not use PWM to regulate the brightness.
The 60-Hz IPS display has stable viewing angles and an even brightness distribution. There is some clouding around the edges, although this is only noticeable on a black screen. Brightness is below average - all our test unit's competitors offered better luminosity. That's why the matte panel is of no real use in direct sunlight and becomes hard to read in bright daylight. The best panel is that of the Medion Akoya E4253. It is matte and sufficiently bright - but only has a low contrast ratio.
| |||||||||||||||||||||||||
Brightness Distribution: 95 %
Center on Battery: 210 cd/m²
Contrast: 1045:1 (Black: 0.2 cd/m²)
ΔE ColorChecker Calman: 8.43 | ∀{0.5-29.43 Ø4.73}
calibrated: 1.68
ΔE Greyscale Calman: 9.81 | ∀{0.09-98 Ø4.97}
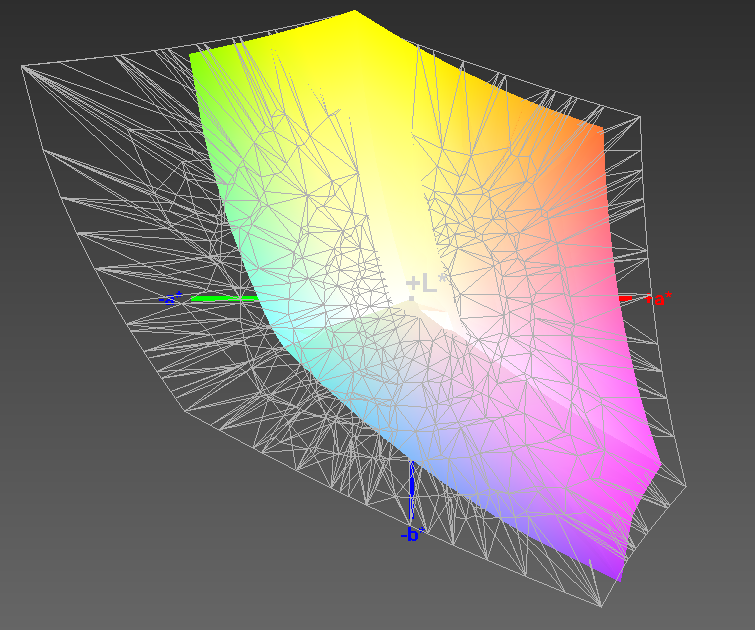
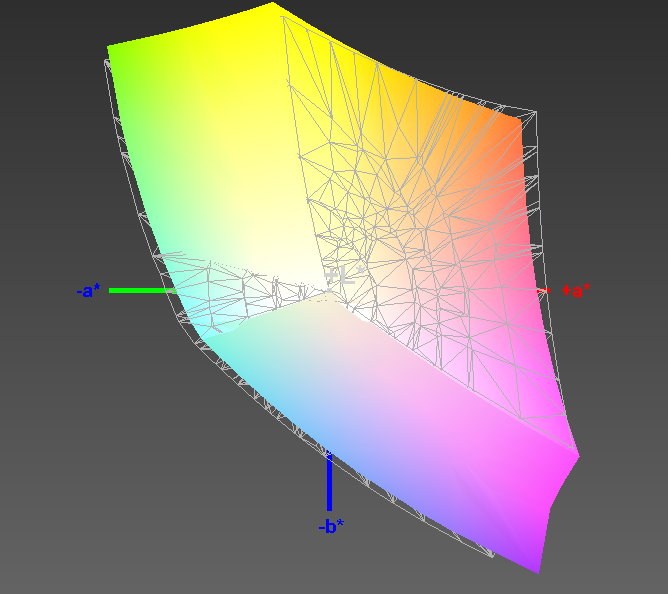
89% sRGB (Argyll 1.6.3 3D)
57% AdobeRGB 1998 (Argyll 1.6.3 3D)
61.7% AdobeRGB 1998 (Argyll 3D)
88.7% sRGB (Argyll 3D)
60.4% Display P3 (Argyll 3D)
Gamma: 2.46
CCT: 10135 K
| Jumper EZbook X3 PBTB133F006 A, IPS, 1920x1080, 13.3" | Medion Akoya E4253-30025387 Chi Mei N140HCA-EAB, IPS, 1920x1080, 14" | Lenovo IdeaPad Slim 1-14AST-05 Chi Mei N140HGA-EA1, TN LED, 1920x1080, 14" | Chuwi LapBook Pro BOE CQ HV140FHNM-N61, IPS, 1920x1080, 14" | LincPlus P1 LC133LF2L03, IPS, 1920x1080, 13.3" | |
|---|---|---|---|---|---|
| Display | -31% | -31% | 14% | 8% | |
| Display P3 Coverage (%) | 60.4 | 40.96 -32% | 41.15 -32% | 73 21% | 65.4 8% |
| sRGB Coverage (%) | 88.7 | 61.1 -31% | 61.8 -30% | 96.1 8% | 94.9 7% |
| AdobeRGB 1998 Coverage (%) | 61.7 | 42.37 -31% | 42.54 -31% | 70.3 14% | 66.8 8% |
| Response Times | -5% | 15% | -6% | 3% | |
| Response Time Grey 50% / Grey 80% * (ms) | 34 ? | 42 ? -24% | 44 ? -29% | 42 ? -24% | 36 ? -6% |
| Response Time Black / White * (ms) | 33 ? | 28 ? 15% | 14 ? 58% | 29 ? 12% | 29 ? 12% |
| PWM Frequency (Hz) | 24500 ? | 147 ? | 200 ? | 250 ? | |
| Screen | -12% | -49% | -9% | 4% | |
| Brightness middle (cd/m²) | 209 | 262 25% | 245 17% | 297 42% | 264 26% |
| Brightness (cd/m²) | 203 | 242 19% | 226 11% | 268 32% | 256 26% |
| Brightness Distribution (%) | 95 | 87 -8% | 86 -9% | 77 -19% | 84 -12% |
| Black Level * (cd/m²) | 0.2 | 0.505 -153% | 0.445 -123% | 0.625 -213% | 0.25 -25% |
| Contrast (:1) | 1045 | 519 -50% | 551 -47% | 475 -55% | 1056 1% |
| Colorchecker dE 2000 * | 8.43 | 5.49 35% | 10.75 -28% | 5.23 38% | 7.36 13% |
| Colorchecker dE 2000 max. * | 14.77 | 10.63 28% | 20.82 -41% | 9.53 35% | 12.72 14% |
| Colorchecker dE 2000 calibrated * | 1.68 | 5.48 -226% | 2.12 -26% | ||
| Greyscale dE 2000 * | 9.81 | 4.84 51% | 12.85 -31% | 6.72 31% | 8.74 11% |
| Gamma | 2.46 89% | 2.3 96% | 2.42 91% | 2.38 92% | 2.41 91% |
| CCT | 10135 64% | 6347 102% | 15973 41% | 7015 93% | 8741 74% |
| Color Space (Percent of AdobeRGB 1998) (%) | 57 | 39 -32% | 39 -32% | 63 11% | 62 9% |
| Color Space (Percent of sRGB) (%) | 89 | 61 -31% | 62 -30% | 96 8% | 95 7% |
| Total Average (Program / Settings) | -16% /
-15% | -22% /
-38% | -0% /
-4% | 5% /
5% |
* ... smaller is better
Display Response Times
| ↔ Response Time Black to White | ||
|---|---|---|
| 33 ms ... rise ↗ and fall ↘ combined | ↗ 21 ms rise | 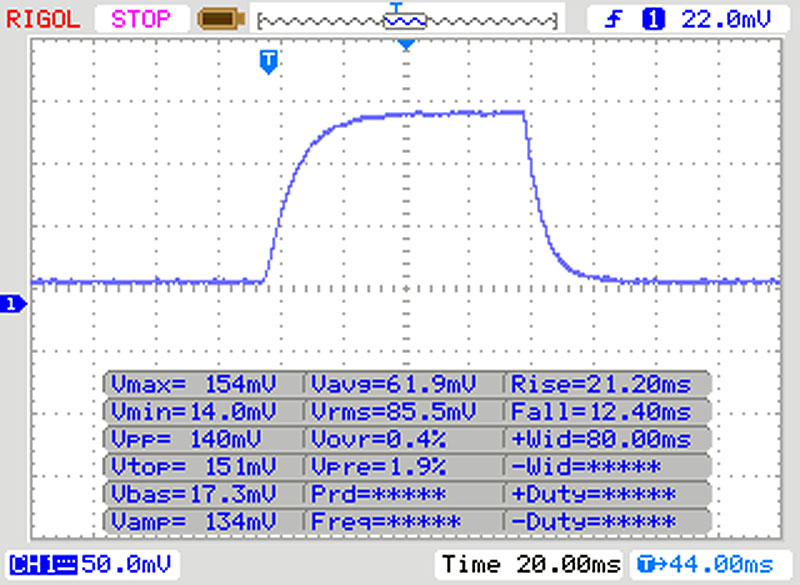 |
| ↘ 12 ms fall | ||
| The screen shows slow response rates in our tests and will be unsatisfactory for gamers. In comparison, all tested devices range from 0.1 (minimum) to 240 (maximum) ms. » 89 % of all devices are better. This means that the measured response time is worse than the average of all tested devices (19.9 ms). | ||
| ↔ Response Time 50% Grey to 80% Grey | ||
| 34 ms ... rise ↗ and fall ↘ combined | ↗ 22 ms rise | 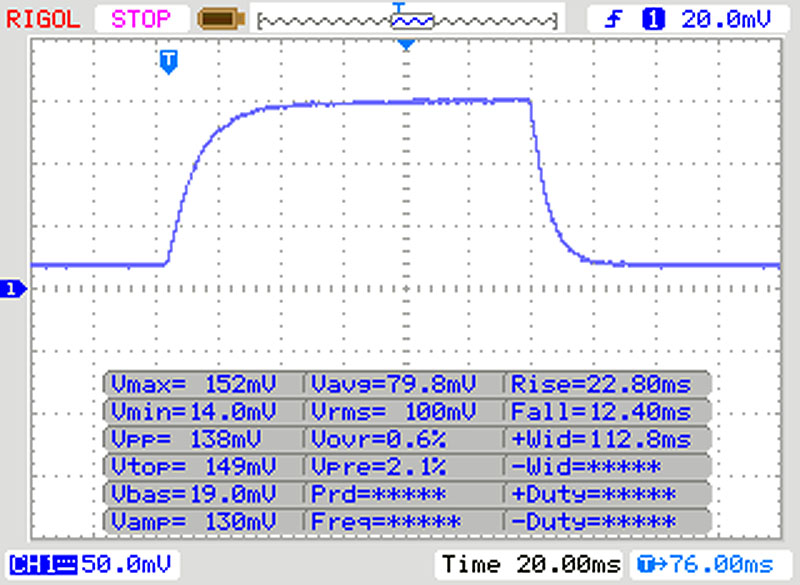 |
| ↘ 12 ms fall | ||
| The screen shows slow response rates in our tests and will be unsatisfactory for gamers. In comparison, all tested devices range from 0.165 (minimum) to 636 (maximum) ms. » 47 % of all devices are better. This means that the measured response time is similar to the average of all tested devices (31.1 ms). | ||
Screen Flickering / PWM (Pulse-Width Modulation)
| Screen flickering / PWM not detected | 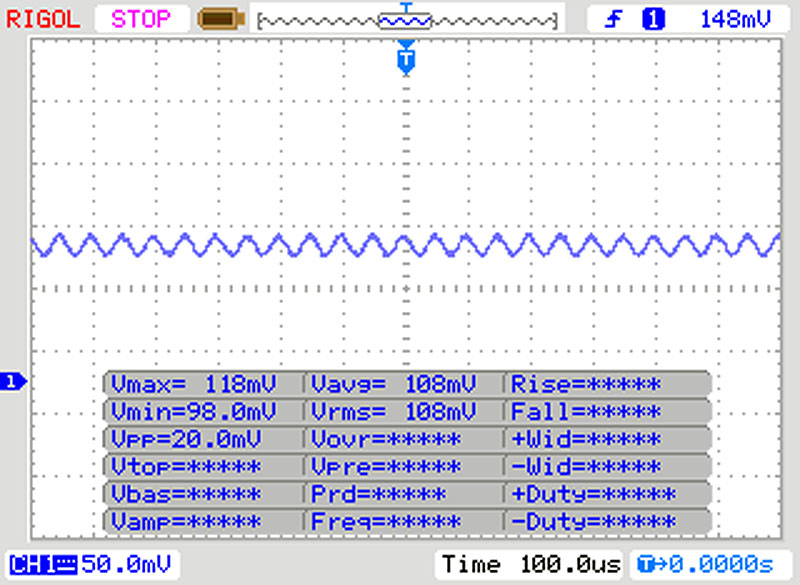 | ||
In comparison: 52 % of all tested devices do not use PWM to dim the display. If PWM was detected, an average of 7801 (minimum: 5 - maximum: 343500) Hz was measured. | |||
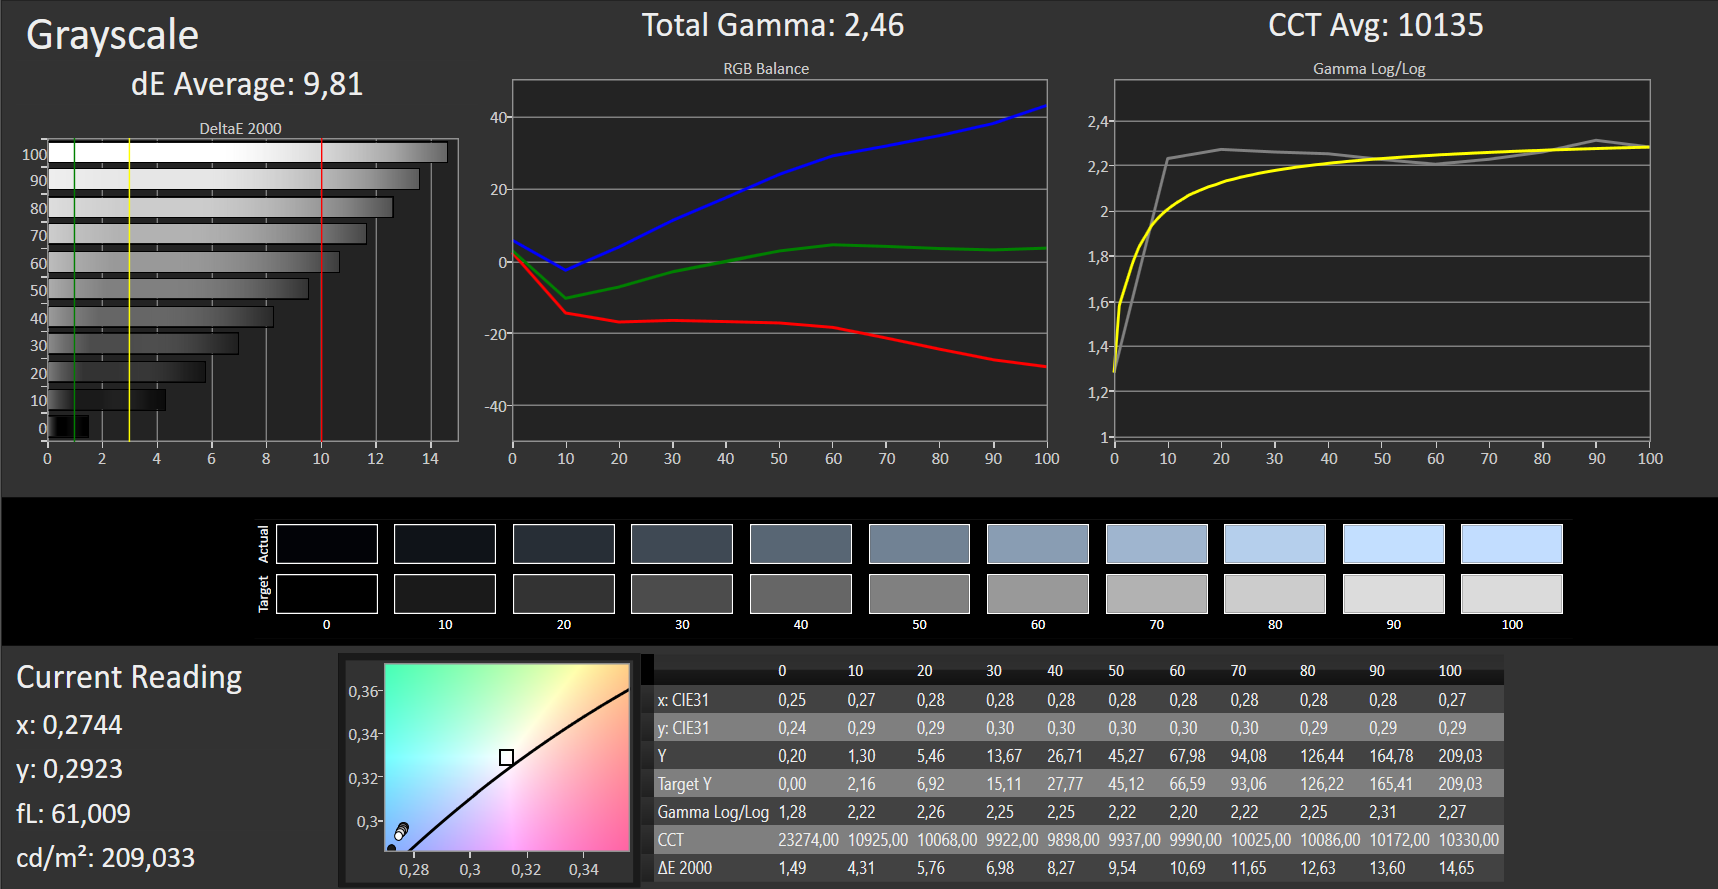
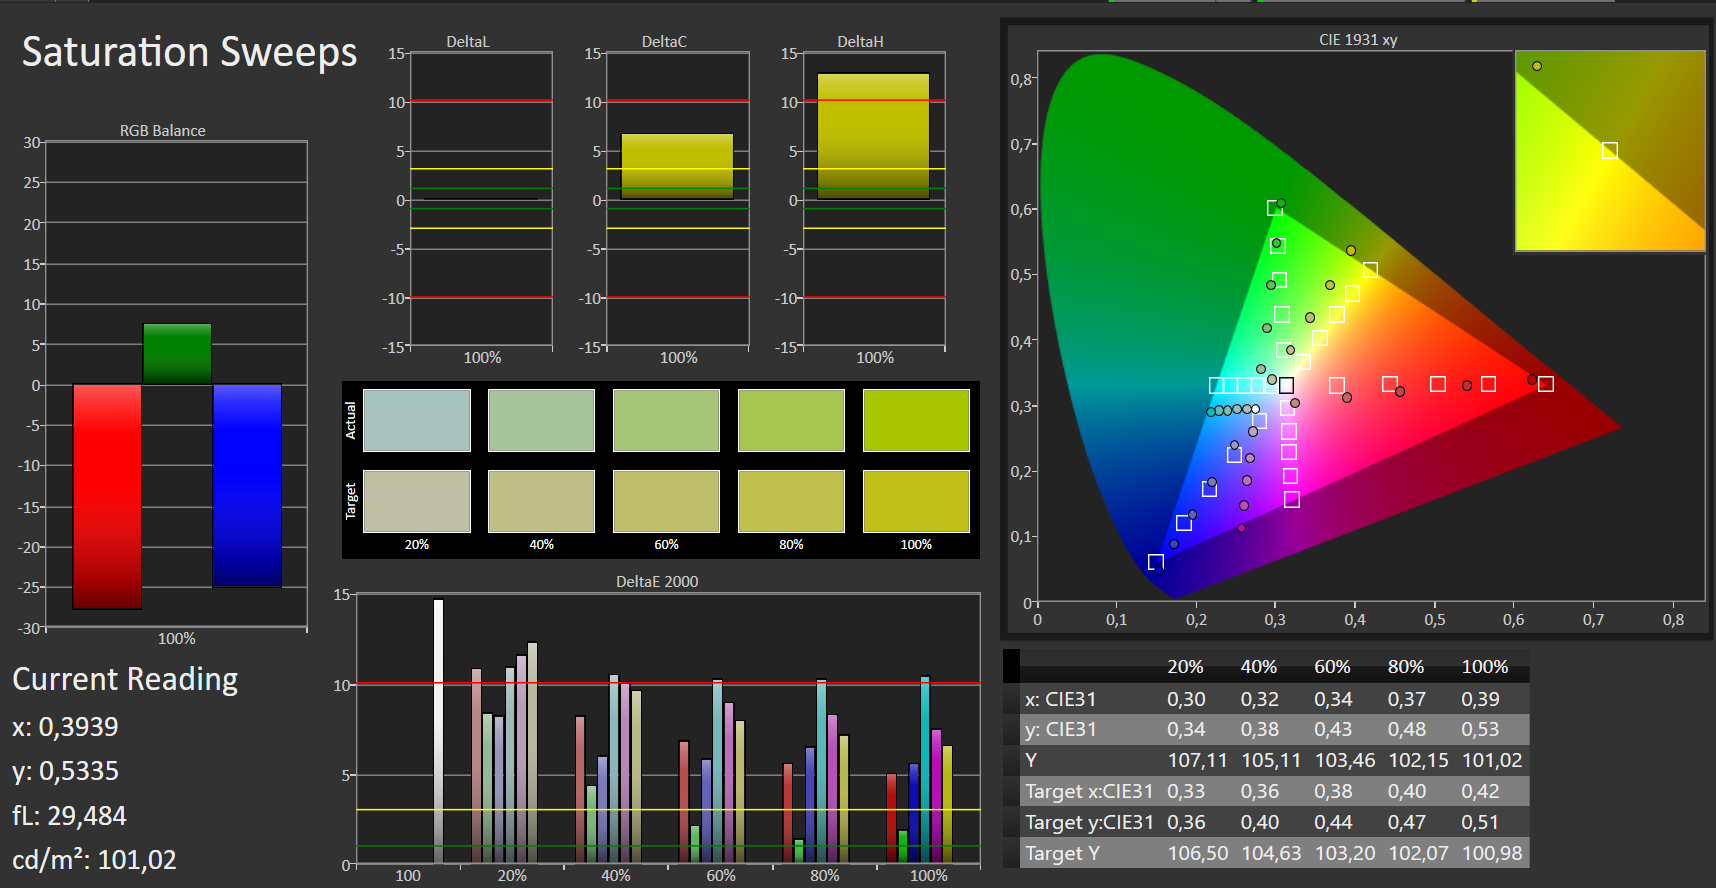
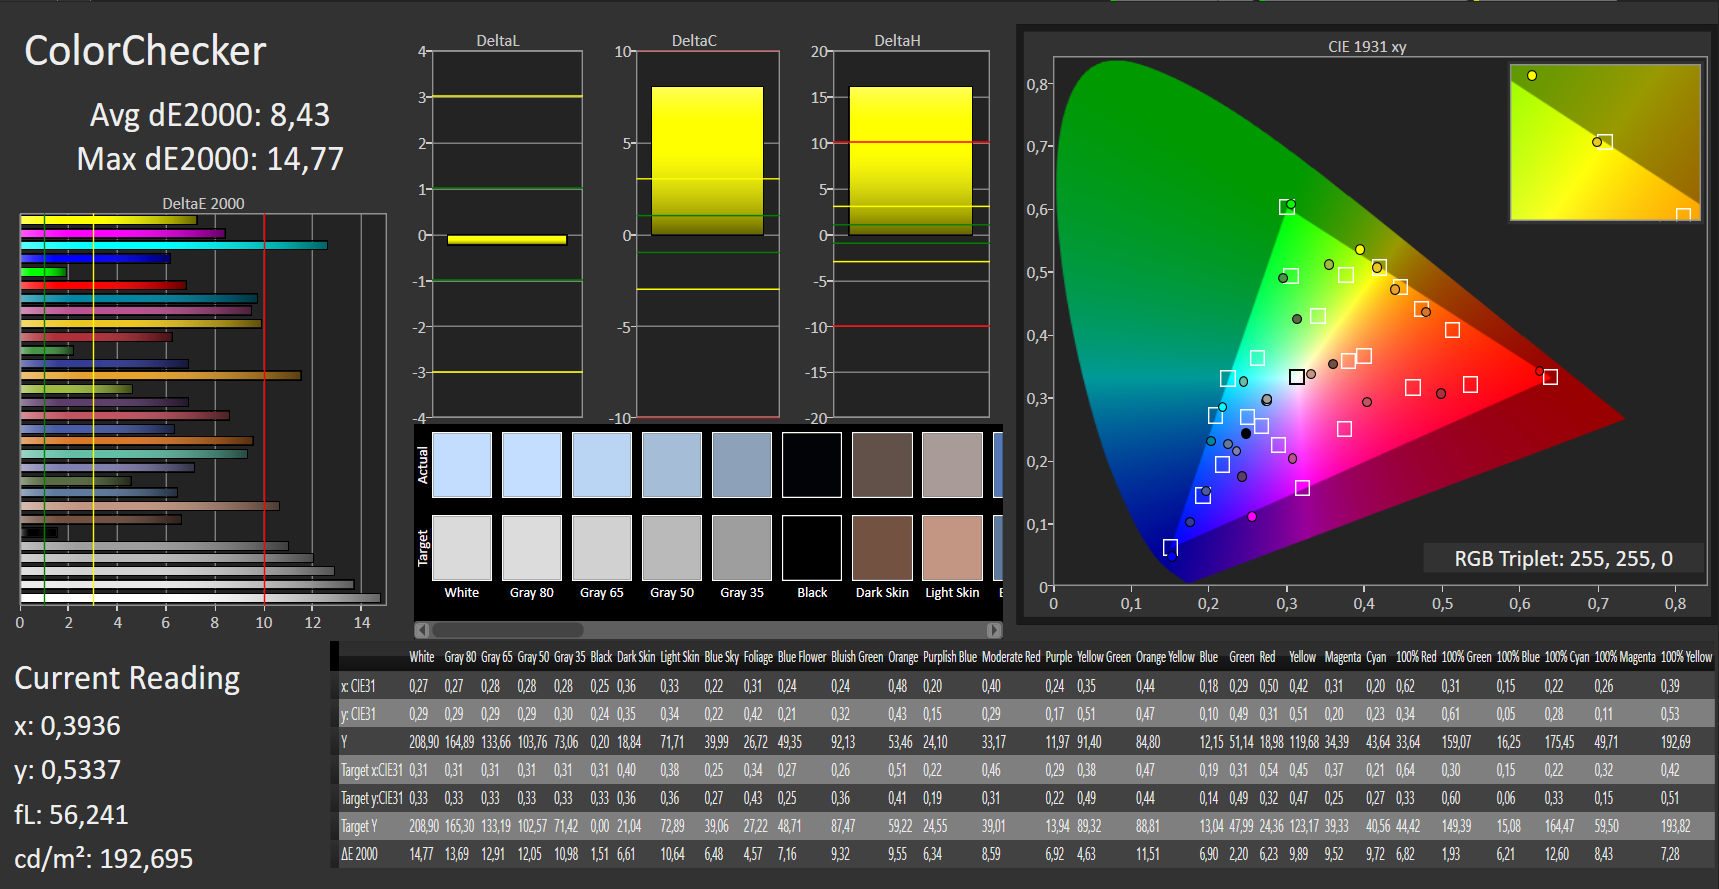
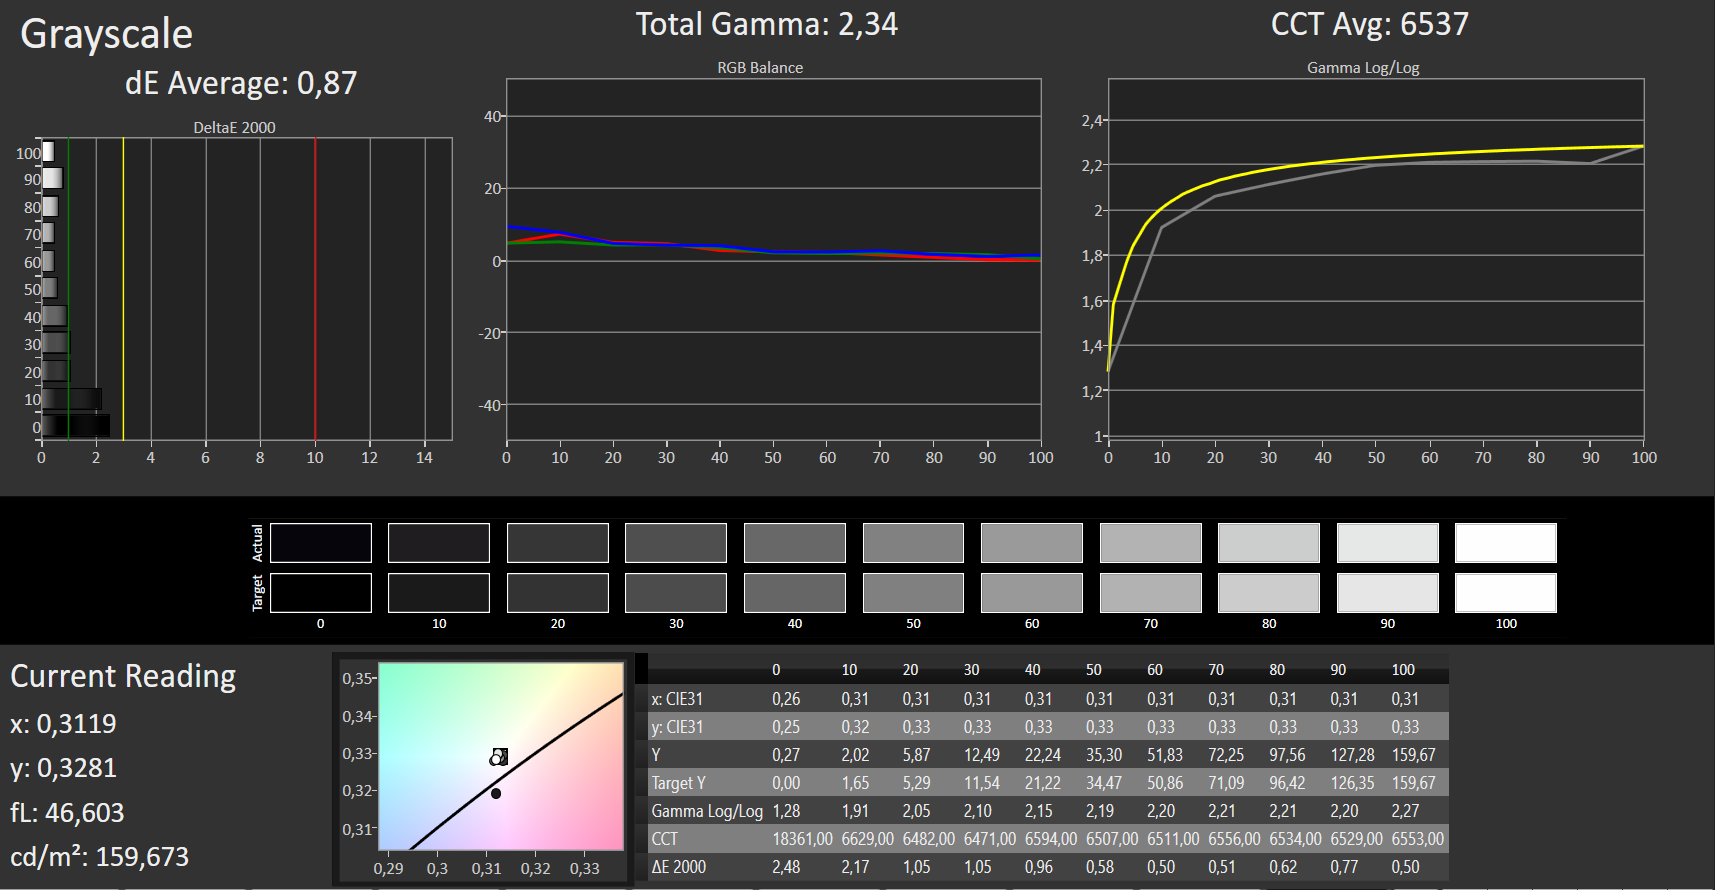
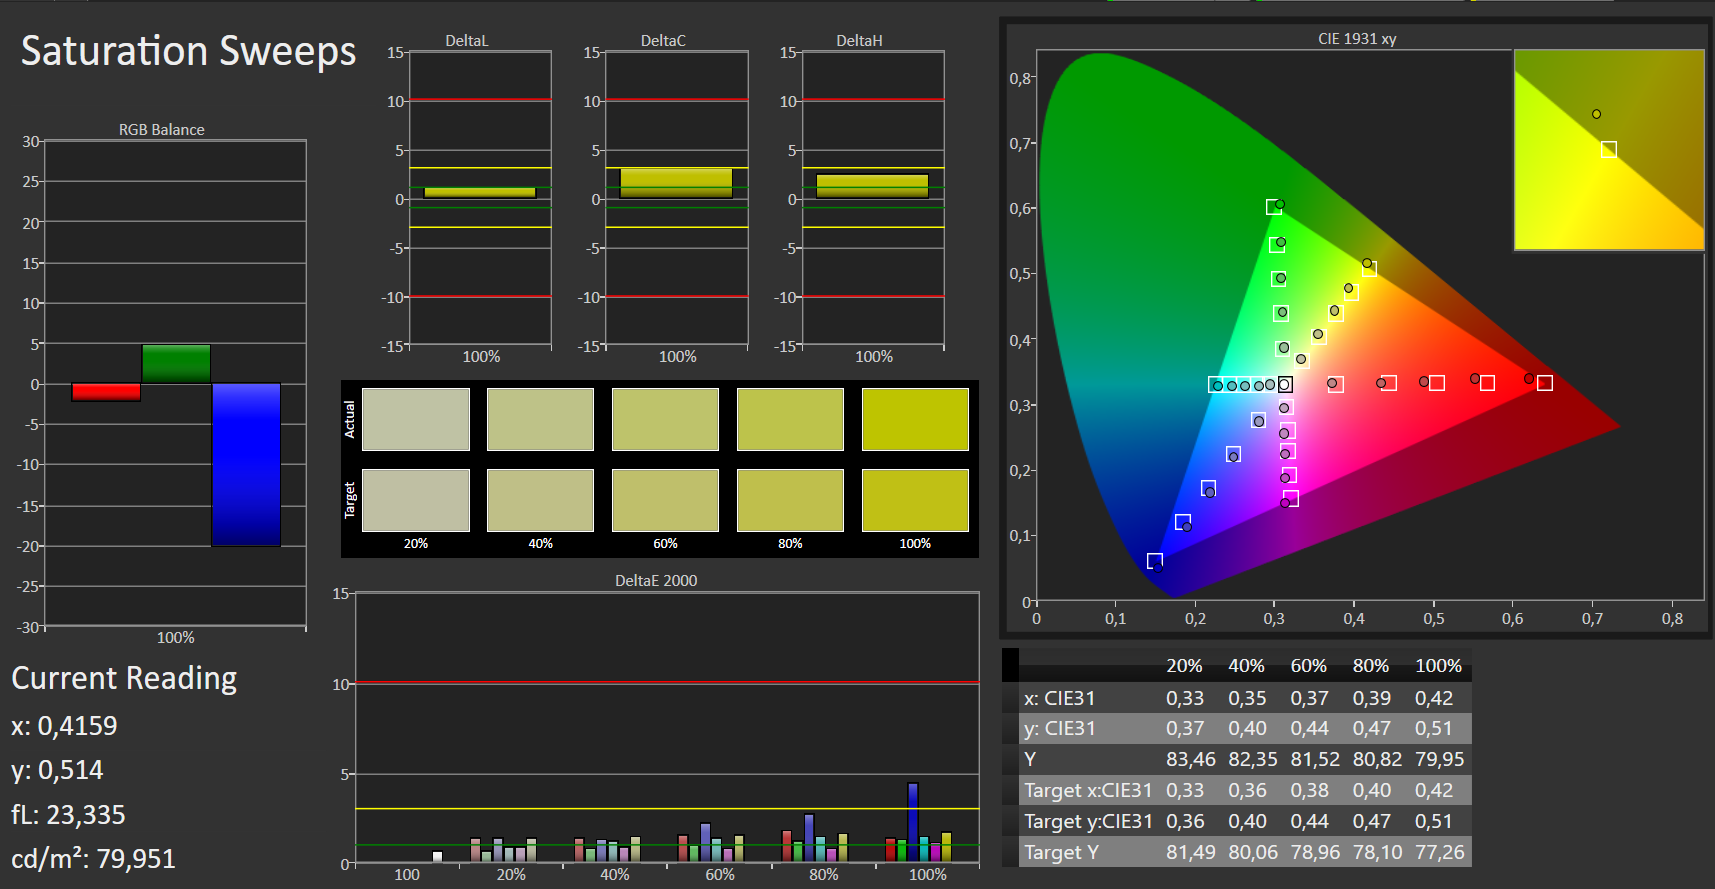
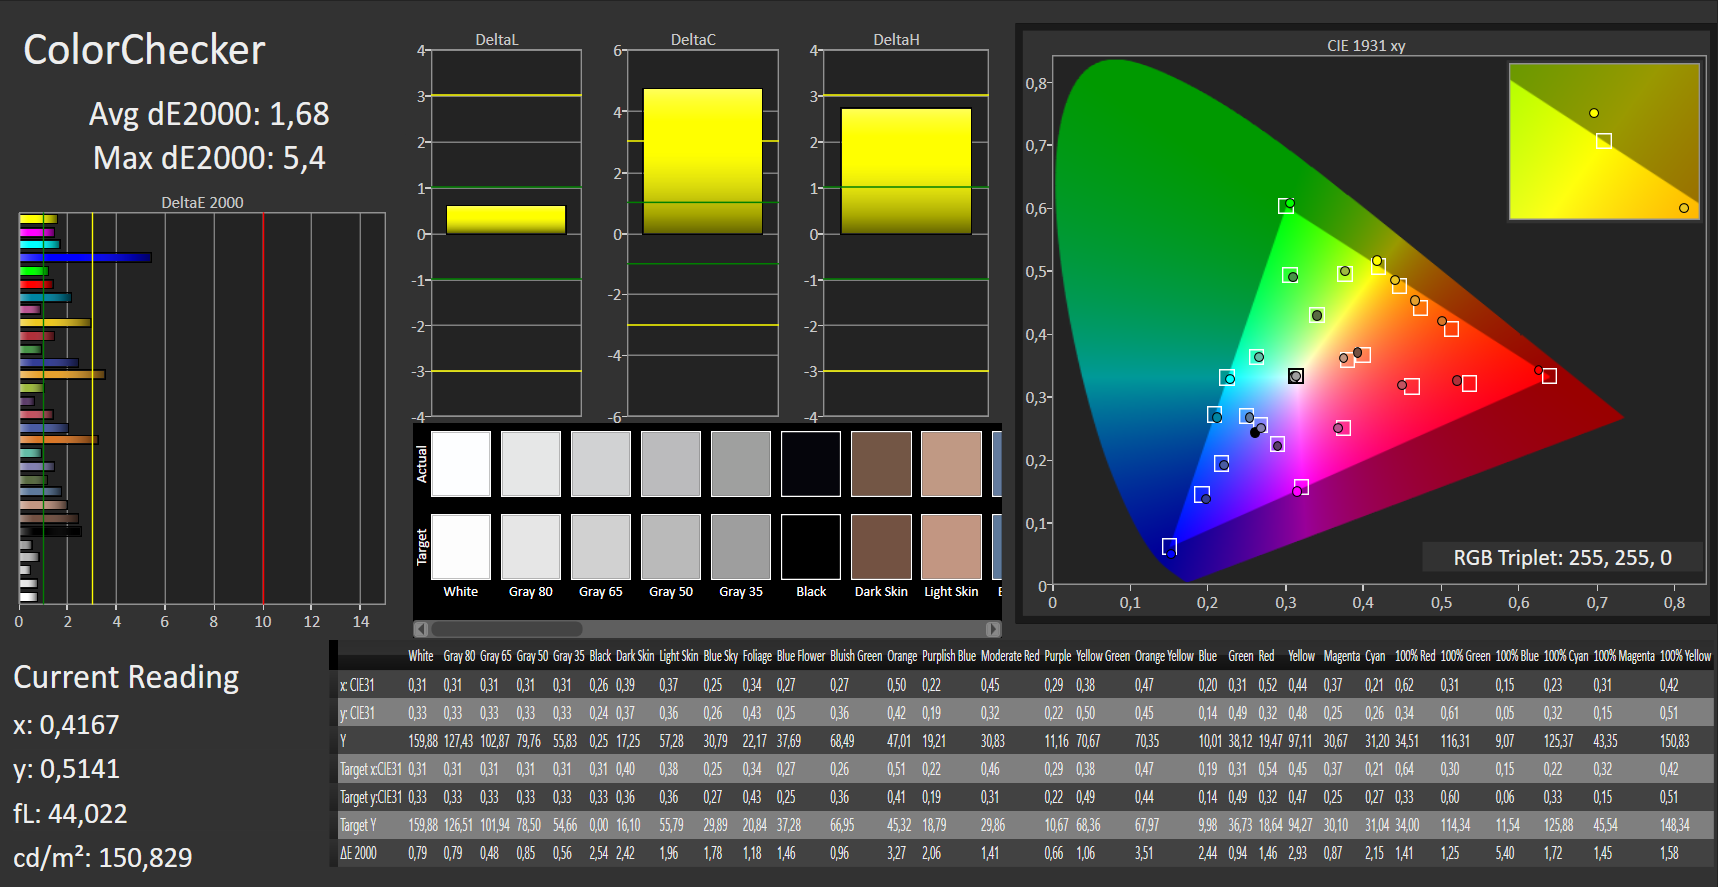
Color space coverage hardly plays a role in this price range. Nevertheless, our test unit covers 89% of the sRGB color space. So do Chuwi LapBook Pro and LincPlus P1. We would even recommend buyers to perform a calibration: The EZBook's ex-works DeltaE Grayscale result was 10! Our calibration brought it down to 0.9. The panel can display colors quite precisely after all.
Performance
The Jumper EZbook X3 (13.3 inch) is only available with a Celeron N3350 and 6 GB of RAM. The dual-core SoC, made for affordable low-end notebooks, is suitable for very simple areas of use such as writing emails, browsing or watching short videos.
But even this could tax the chip and slow eMMC storage. 5 browser tabs and the performance is brought to its knees. Even loading the home page of YouTube takes at least 10 minutes. While a video is playing, the device takes longer to switch between tabs and even going back and forth within Explorer is slower than usual. The Celeron N3350 really can't handle anything but the most simple applications.
The device is equipped with 64 GB of eMMC storage. The storage capacity can be expanded via a storage cart (up to 256 GB) and an M.2 SSD.
Processor
The Intel Celeron N3350 is a dual-core SoC from 2016 (Apollo Lake). It supports dual-channel storage, which is of no use as the 6 GB of RAM are in single channel mode.
You can't do a lot with this processor. On the contrary, the SoC lazes around at the bottom of our R15 loop comparison table, together with the AMD A6-9220e. Performance is constant. You can see clearly why the Pentium N5000 (Medion) and the Celeron N4100 (Chuwi LapBook Pro) are the better choice.
The processor reaches 2.3 GHz in our multi and single-core CineBench tests. The chip does not support hyper threading, which means that it can only work on two threads at the same time. Both the Celeron N4100 and the Pentium N5000 have four cores.
System Performance
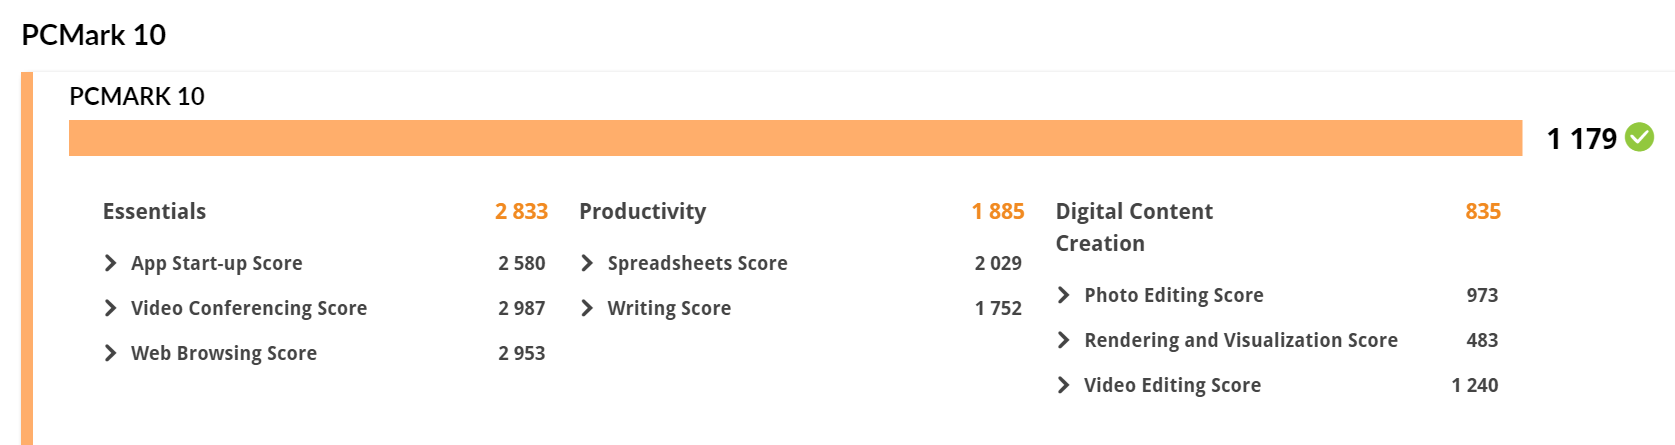
The results of the PCMark 10 benchmark are accordingly low. Only Lenovo's IdeaPad Slim 1 is slower. The results of Medion's Akoya E4253 (Pentium) are the best, and those of the LincPlus P1 (Celeron N4000) aren't bad either. We haven't got any figures for the Chuwi LapBook Pro.
Storage Devices
The 64-GB eMMC is actually rather good compared to other eMMC chips. All our competitor's flash storage devices are even slower. But that's little use considering that the storage speeds are still unbelievably slow compared to real SATA or PCI SSDs.
The system performance might improve if you installed a SATA SSD in the M.2 slot and installed the OS on there, but we can't be sure.
| Jumper EZbook X3 64 GB eMMC Flash | Medion Akoya E4253-30025387 64 GB eMMC Flash | Lenovo IdeaPad Slim 1-14AST-05 64 GB eMMC Flash | Chuwi LapBook Pro 64 GB eMMC Flash | LincPlus P1 64 GB eMMC Flash | Average 64 GB eMMC Flash | Average of class Subnotebook | |
|---|---|---|---|---|---|---|---|
| CrystalDiskMark 5.2 / 6 | -27% | -50% | -12% | -3% | 5% | 2003% | |
| Write 4K (MB/s) | 19.21 | 6.435 -67% | 4.58 -76% | 13.46 -30% | 20.32 6% | 16 ? -17% | 152.8 ? 695% |
| Read 4K (MB/s) | 7.435 | 5.91 -21% | 7.106 -4% | 7.071 -5% | 10.69 44% | 11 ? 48% | 63.9 ? 759% |
| Write Seq (MB/s) | 138.8 | 66.7 -52% | 37.33 -73% | 105.3 -24% | 98.6 -29% | 109 ? -21% | 2860 ? 1961% |
| Read Seq (MB/s) | 219.8 | 268.9 22% | 143 -35% | 235.5 7% | 217.7 -1% | 207 ? -6% | 3311 ? 1406% |
| Write 4K Q32T1 (MB/s) | 24.39 | 7.795 -68% | 5.623 -77% | 14.68 -40% | 23.81 -2% | 22.4 ? -8% | 427 ? 1651% |
| Read 4K Q32T1 (MB/s) | 22.2 | 22.76 3% | 9.663 -56% | 24.31 10% | 21.84 -2% | 31.5 ? 42% | 492 ? 2116% |
| Write Seq Q32T1 (MB/s) | 122.3 | 83 -32% | 41.03 -66% | 114.2 -7% | 79.6 -35% | 104.6 ? -14% | 4571 ? 3638% |
| Read Seq Q32T1 (MB/s) | 147.6 | 150 2% | 128.3 -13% | 140.7 -5% | 140.8 -5% | 166.5 ? 13% | 5754 ? 3798% |
| AS SSD | -1% | -24% | 2133% | ||||
| Seq Read (MB/s) | 246.2 | 236.1 -4% | 188.2 ? -24% | 4447 ? 1706% | |||
| Seq Write (MB/s) | 155.8 | 151.4 -3% | 102.6 ? -34% | 2911 ? 1768% | |||
| 4K Read (MB/s) | 18.41 | 19.26 5% | 18.6 ? 1% | 59.2 ? 222% | |||
| 4K Write (MB/s) | 22 | 23.21 6% | 18.9 ? -14% | 169.4 ? 670% | |||
| 4K-64 Read (MB/s) | 22.45 | 21.08 -6% | 20.6 ? -8% | 844 ? 3659% | |||
| 4K-64 Write (MB/s) | 22.73 | 23.41 3% | 17.5 ? -23% | 1697 ? 7366% | |||
| Access Time Read * (ms) | 0.246 | 0.23 7% | 0.3321 ? -35% | 0.06451 ? 74% | |||
| Access Time Write * (ms) | 0.621 | 0.774 -25% | 1.057 ? -70% | 0.05586 ? 91% | |||
| Score Read (Points) | 65 | 64 -2% | 54.9 ? -16% | 1346 ? 1971% | |||
| Score Write (Points) | 60 | 62 3% | 48.5 ? -19% | 2158 ? 3497% | |||
| Score Total (Points) | 163 | 163 0% | 132.9 ? -18% | 4130 ? 2434% | |||
| Total Average (Program / Settings) | -27% /
-27% | -50% /
-50% | -12% /
-12% | -2% /
-2% | -10% /
-12% | 2068% /
2078% |
* ... smaller is better

Graphics Performance
The integrated graphics card Intel HD Graphics 500 should not play a big role in the purchase decision. The most it can do is display browser games smoothly.
| 3DMark - 1920x1080 Fire Strike Graphics | |
| Average of class Subnotebook (832 - 16347, n=59, last 2 years) | |
| Medion Akoya E4253-30025387 | |
| Chuwi LapBook Pro | |
| LincPlus P1 | |
| Jumper EZbook X3 | |
| Average Intel HD Graphics 500 (293 - 444, n=8) | |
| Lenovo IdeaPad Slim 1-14AST-05 | |
| 3DMark Fire Strike Score | 349 points | |
Help | ||
Gaming Performance
If you would like to occasionally play real PC games, you're in the wrong price segment. That would require a notebook with a dedicated GeForce MX230 or MX250 at the very least - and those cost $600 minimum.
| X-Plane 11.11 | |
| 1280x720 low (fps_test=1) | |
| Average of class Subnotebook (29.9 - 82.5, n=62, last 2 years) | |
| Chuwi LapBook Pro | |
| Average Intel HD Graphics 500 (5.3 - 7.6, n=3) | |
| Jumper EZbook X3 | |
| LincPlus P1 | |
| 1920x1080 med (fps_test=2) | |
| Average of class Subnotebook (25.1 - 65.9, n=53, last 2 years) | |
| Chuwi LapBook Pro | |
| Average Intel HD Graphics 500 (3.93 - 4.7, n=2) | |
| Jumper EZbook X3 | |
| LincPlus P1 | |
| low | med. | high | ultra | |
|---|---|---|---|---|
| X-Plane 11.11 (2018) | 5.5 | 3.93 | 3.61 |
Emissions & Energy
System Noise
There are no noise emissions as the device does not have an active cooling system. The same goes for the competition.
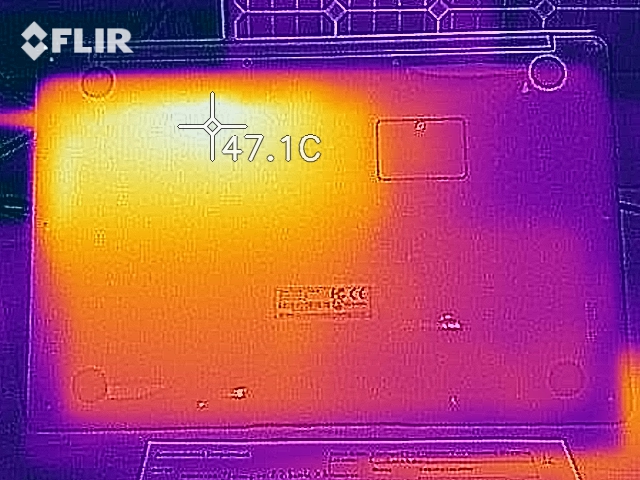
Temperature
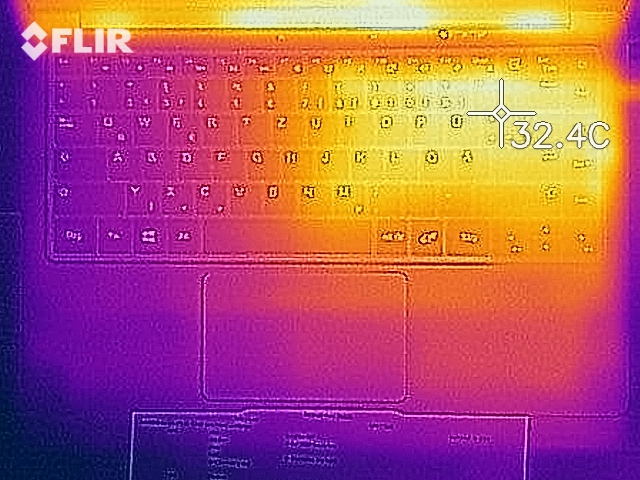
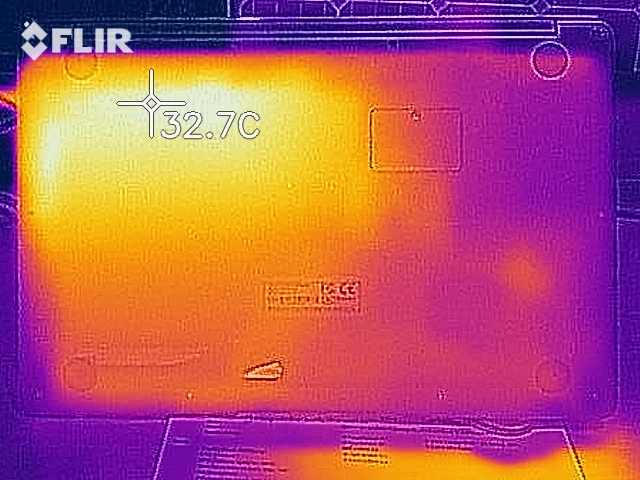
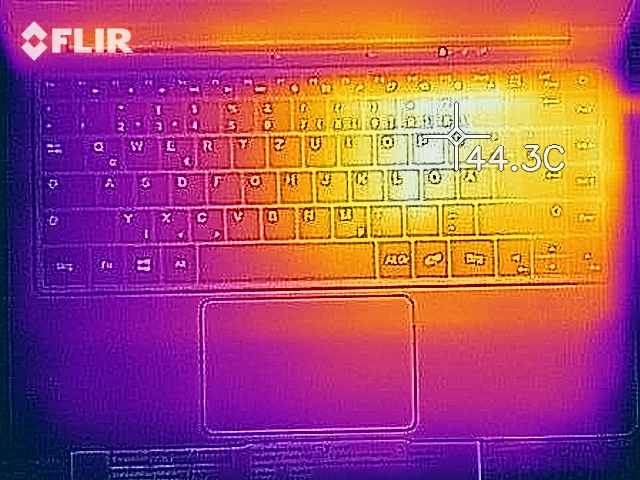
The 13-inch laptop only heats up moderately under load. We measured a hot spot of 40 °C (104 °F)on the top of the base unit. None of the systems in this price range become very warm - not even the Medion Akoya E4253, which has the best performance.
(±) The maximum temperature on the upper side is 40.1 °C / 104 F, compared to the average of 35.9 °C / 97 F, ranging from 21.4 to 59 °C for the class Subnotebook.
(±) The bottom heats up to a maximum of 40.4 °C / 105 F, compared to the average of 39.2 °C / 103 F
(+) In idle usage, the average temperature for the upper side is 25.4 °C / 78 F, compared to the device average of 30.8 °C / 87 F.
(+) The palmrests and touchpad are cooler than skin temperature with a maximum of 25.9 °C / 78.6 F and are therefore cool to the touch.
(+) The average temperature of the palmrest area of similar devices was 28.2 °C / 82.8 F (+2.3 °C / 4.2 F).
Speakers
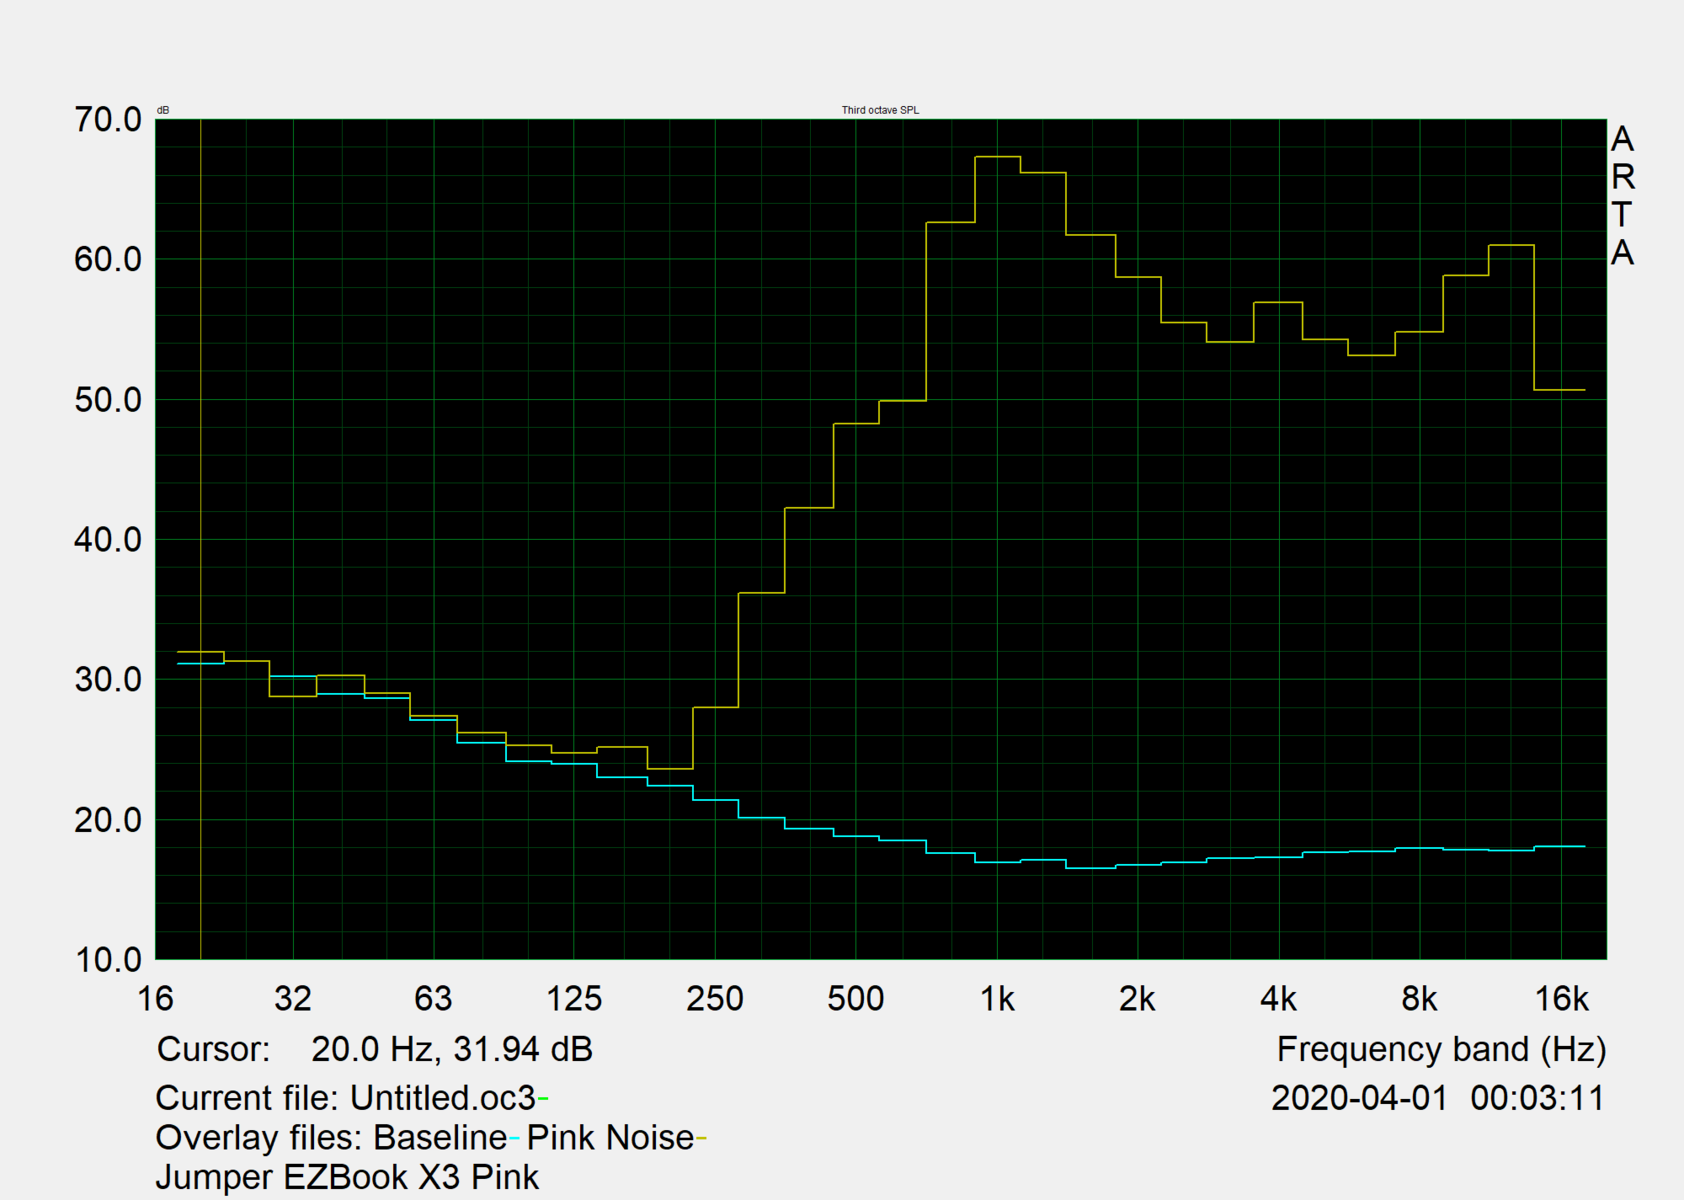
The speakers are weak and not particularly loud. They cannot fill a room. The dual-array microphone records voices very quietly and with a lot of noise. It's almost useless, basically.
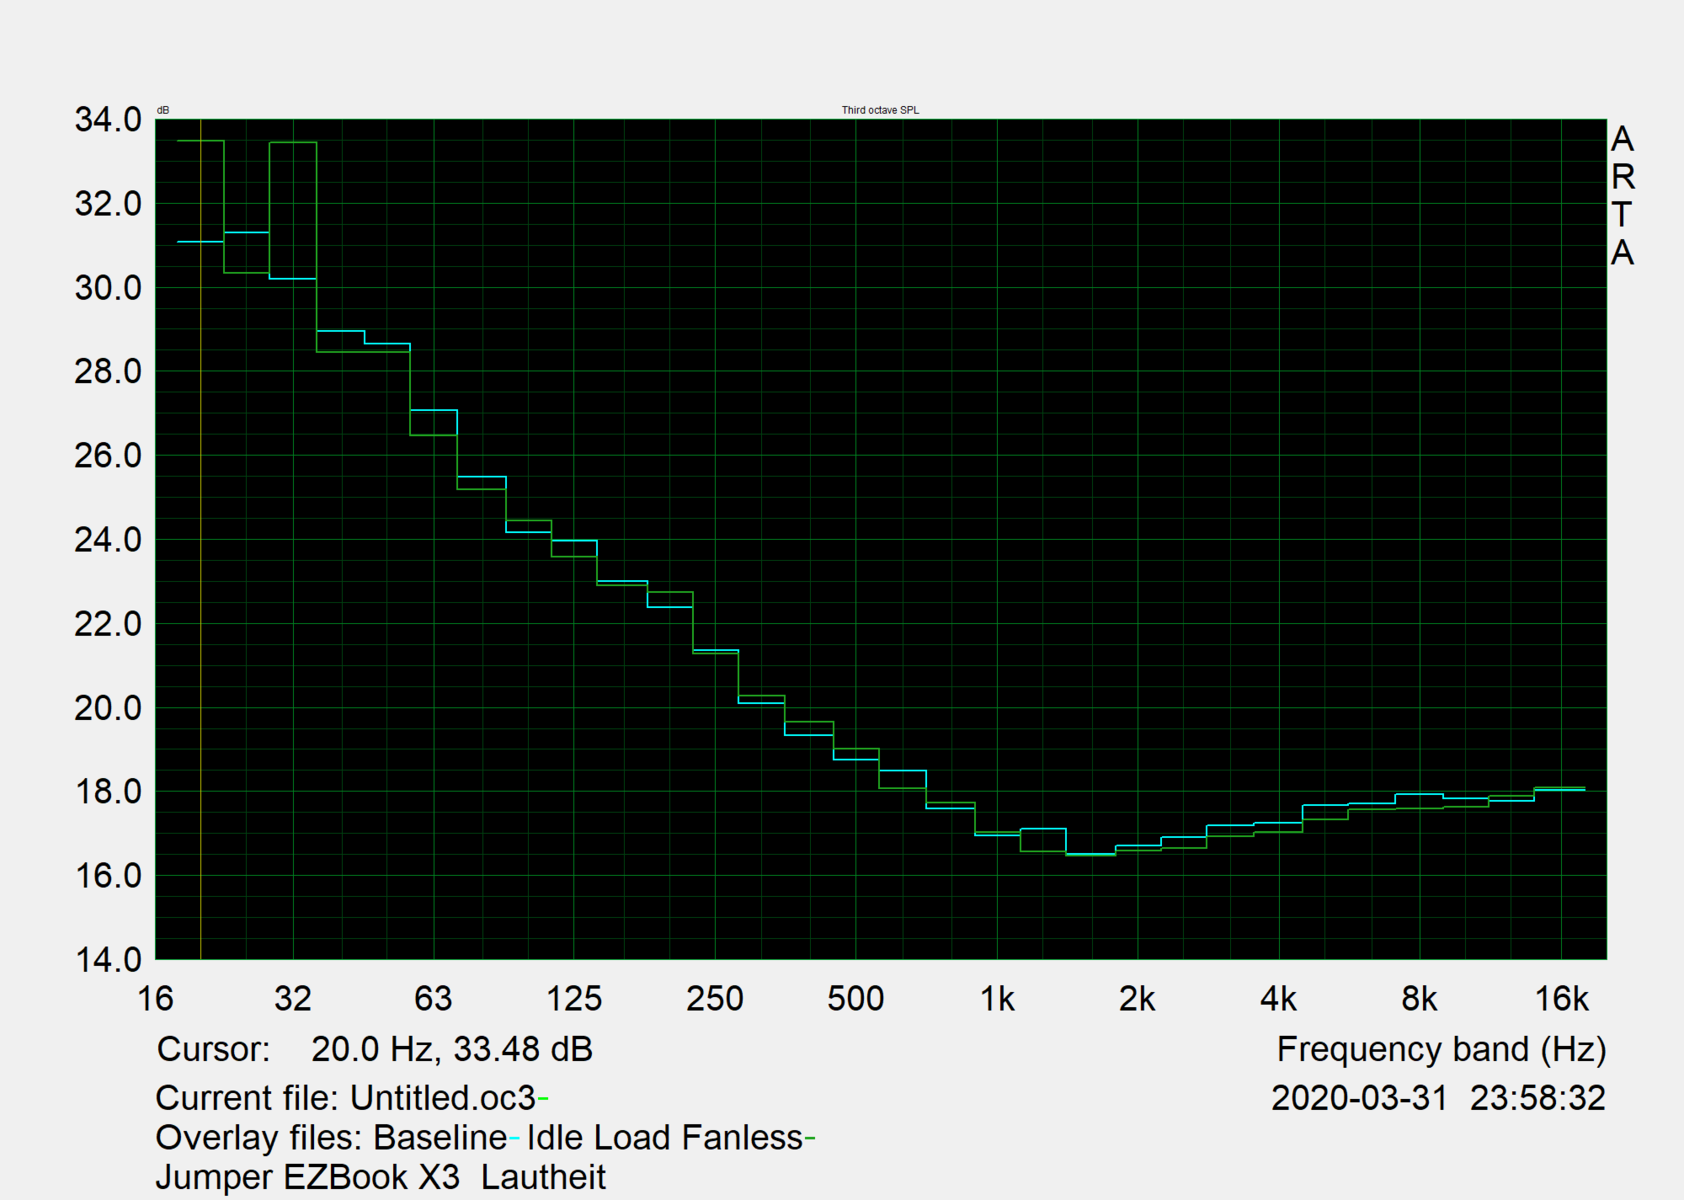
Jumper EZbook X3 audio analysis
(±) | speaker loudness is average but good (72.6 dB)
Bass 100 - 315 Hz
(-) | nearly no bass - on average 26.9% lower than median
(±) | linearity of bass is average (7.3% delta to prev. frequency)
Mids 400 - 2000 Hz
(±) | higher mids - on average 8.5% higher than median
(±) | linearity of mids is average (13.7% delta to prev. frequency)
Highs 2 - 16 kHz
(+) | balanced highs - only 1.5% away from median
(+) | highs are linear (6.7% delta to prev. frequency)
Overall 100 - 16.000 Hz
(-) | overall sound is not linear (32.8% difference to median)
Compared to same class
» 94% of all tested devices in this class were better, 2% similar, 3% worse
» The best had a delta of 5%, average was 18%, worst was 53%
Compared to all devices tested
» 92% of all tested devices were better, 1% similar, 7% worse
» The best had a delta of 4%, average was 24%, worst was 134%
Medion Akoya E4253-30025387 audio analysis
(±) | speaker loudness is average but good (72.5 dB)
Bass 100 - 315 Hz
(-) | nearly no bass - on average 21% lower than median
(±) | linearity of bass is average (9.2% delta to prev. frequency)
Mids 400 - 2000 Hz
(±) | higher mids - on average 7.4% higher than median
(±) | linearity of mids is average (7.8% delta to prev. frequency)
Highs 2 - 16 kHz
(±) | higher highs - on average 7.5% higher than median
(±) | linearity of highs is average (9.7% delta to prev. frequency)
Overall 100 - 16.000 Hz
(±) | linearity of overall sound is average (27.8% difference to median)
Compared to same class
» 89% of all tested devices in this class were better, 3% similar, 8% worse
» The best had a delta of 5%, average was 18%, worst was 53%
Compared to all devices tested
» 84% of all tested devices were better, 3% similar, 13% worse
» The best had a delta of 4%, average was 24%, worst was 134%
Power Consumption
The EZBook is energy efficient and has a particularly low power consumption while idling. This is not surprising considering the low brightness. Still, the Medion Akoya E4253 requires even less power while idling.
| Off / Standby | |
| Idle | |
| Load |
|
Key:
min: | |
Battery Life
The battery life in our Wi-Fi test is reasonable at 472 minutes from a 35-Wh battery. The Medion Akoya E4253 has a slightly higher capacity and still only manages 18% more (555 minutes). For the Wi-Fi test, we reduced the brightness to 150 cd/m² and browsed websites according to a script.
| Battery Runtime - WiFi Websurfing | |
| Average of class Subnotebook (7.25 - 26.4, n=63, last 2 years) | |
| Medion Akoya E4253-30025387 | |
| Chuwi LapBook Pro | |
| Jumper EZbook X3 | |
| LincPlus P1 | |
| Lenovo IdeaPad Slim 1-14AST-05 | |
Pros
Cons
Verdict
The Jumper EZBook X3 is positioned in the lowest possible price segment. It is currently available for $250 - including a Windows licence. Not surprisingly, the processor dates from 2016. At least there's an anti-glare Full-HD IPS display and an M.2 2280 slot for expanding storage capacity.
So what could go wrong? Well... the performance only just scraped by our benchmarks and the stability of the base unit leaves a lot to be desired, which also affects the input devices.
We cannot recommend buying this cheapie. The competitors from Chuwi, Medion and LincPlus all only cost a little more but are more stable, offer a better performance and better input devices.
This is one of the most wobbly, unstable cases we have ever seen. Do not buy this device.
We can really recommend buying the Medion Akoya E4253, equipped with a Pentium N5000. This 14-inch device also has an anti-glare display and is a lot faster.
Jumper EZbook X3
- 04/06/2020 v7 (old)
Sebastian Jentsch
Price comparison

