Reviews for the Intel Celeron N4100 processor
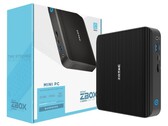
Affordable Zotac ZBOX edge mini PC in review
The new Zotac ZBOX edge barebone doesn't need an active cooling unit, allowing for silent operation. However, you have to live with limitations in terms of performance. In this review, we explain what this means in detail.
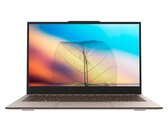
Intel Celeron N4100, UHD Graphics 600Jumper Tech EZbook X3 Air Laptop in review: Appealing design meets reasonable price
The Jumper EZbook X3 Air is based on much more expensive models with its flat construction and slim design. The metal housing provides a high-quality and robust impression. The test will show what the hardware can achieve in a device for about 350 Euros (~$410).
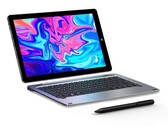
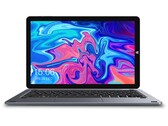
Intel Celeron N4100, UHD Graphics 600, 13.3", 1.1 kgChuwi Hi10 X Convertible Review: Metal Chassis for $230 USD
How far can a cheap passively-cooled Windows 10 tablet from a lesser-known Chinese manufacturer get you? If all you're doing is light web browsing or word processing, then the Chuwi Hi10 X can get the job done if just barely.
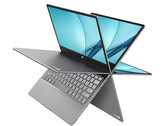
Intel Celeron N4100, UHD Graphics 600, 10.1", 600 gBMAX MaxBook Y11 H1M6 Convertible Review
An aluminum chassis, a 360-degree hinge, an IPS touchscreen, passive cooling, a 256-GB SSD and 8 GB of RAM for less than 300 Euros (~$335) sounds promising. Find out in this in-depth review, which compromises have to be made with the small 11.6-inch laptop.
Intel Celeron N4100, UHD Graphics 600, 11.6", 1 kgChuwi UBook CWI509 Tablet Review: The Surface Go Wannabe
Chuwi is at it again with yet another Microsoft Surface clone. This time, the Chinese manufacturer is targeting the Surface Go crowd with an 11.6-inch detachable. The end result has some respectable qualities, but it's a big miss overall.
Intel Celeron N4100, UHD Graphics 600, 11.6", 810 gChuwi LapBook Pro: Intel UHD Graphics 600, 14.00", 1.4 kg
Review » Chuwi LapBook Pro Laptop Review: An affordable 14-inch laptop with good battery life and wide colour gamut
Chuwi MiniBook CWI526: Intel UHD Graphics 600, 8.00", 0.7 kg
Review » Chuwi at its Best: Chuwi MiniBook Netbook Review
Lenovo Tablet 10-20L3000KGE: Intel UHD Graphics 600, 10.10", 0.7 kg
Review » Lenovo Tablet 10 (Celeron N4100, eMMC, LTE, WUXGA) Tablet Review
Chuwi LapBook SE: Intel UHD Graphics 600, 13.30", 1.4 kg
Review » Chuwi LapBook SE Laptop Review
Lenovo IdeaPad 330-15IGM: Intel UHD Graphics 600, 15.60", 2 kg
Review » Lenovo IdeaPad 330-15IGM (Celeron N4100) Laptop Review
Chuwi GBox CWI560: Intel UHD Graphics 600, 0.6 kg
Review » Chuwi GBox CWI560 (Celeron N4100) Mini PC Review
Lenovo 500e Chromebook G2: Intel UHD Graphics 600, 11.60", 1.3 kg
External Review » Lenovo 500e Chromebook G2
Prestigio Ecliptica 116 C3: Intel UHD Graphics 600, 11.60", 1.4 kg
External Review » Prestigio Ecliptica 116 C3
Jumper EZbook X3 Air: Intel UHD Graphics 600, 13.30", 1.1 kg
External Review » Jumper EZbook X3 Air
Acer Chromebook Spin 11 CP311-2H-C7BG: Intel UHD Graphics 600, 11.60", 1.2 kg
External Review » Acer Chromebook Spin 11 CP311-2H-C7BG
Acer Chromebook 11 CB311-9HT-C783: Intel UHD Graphics 600, 11.60", 1.1 kg
External Review » Acer Chromebook 11 CB311-9HT-C783
Chuwi MiniBook CWI526: Intel UHD Graphics 600, 8.00", 0.7 kg
External Review » Chuwi MiniBook CWI526
Lenovo IdeaPad 330-15IGM-81D1003TUS: Intel UHD Graphics 600, 15.60", 2 kg
External Review » Lenovo IdeaPad 330-15IGM-81D1003TUS
Lenovo Tablet 10-20L3000RGE: Intel UHD Graphics 600, 10.10", 0.7 kg
External Review » Lenovo Tablet 10-20L3000RGE
Teclast F5: Intel UHD Graphics 600, 11.60", 1.1 kg
External Review » Teclast F5
Lenovo Tablet 10-20L3000KGE: Intel UHD Graphics 600, 10.10", 0.7 kg
External Review » Lenovo Tablet 10-20L3000KGE
Chuwi LapBook SE: Intel UHD Graphics 600, 13.30", 1.4 kg
External Review » Chuwi LapBook SE
Chuwi SurBook SE: Intel UHD Graphics 600, 10.10"
External Review » Chuwi SurBook SE
Jumper EZBook X4: Intel UHD Graphics 600, 14.00", 1.3 kg
External Review » Jumper EZBook X4
Jumper EZBook X1: Intel UHD Graphics 600, 11.60", 1 kg
External Review » Jumper EZBook X1
Chuwi Hi10 X: Intel UHD Graphics 600, 10.10", 0.6 kg
» The Chuwi Hi10 X feels great to hold, but it's just too slow and unreliable