Chuwi LapBook SE Laptop Review
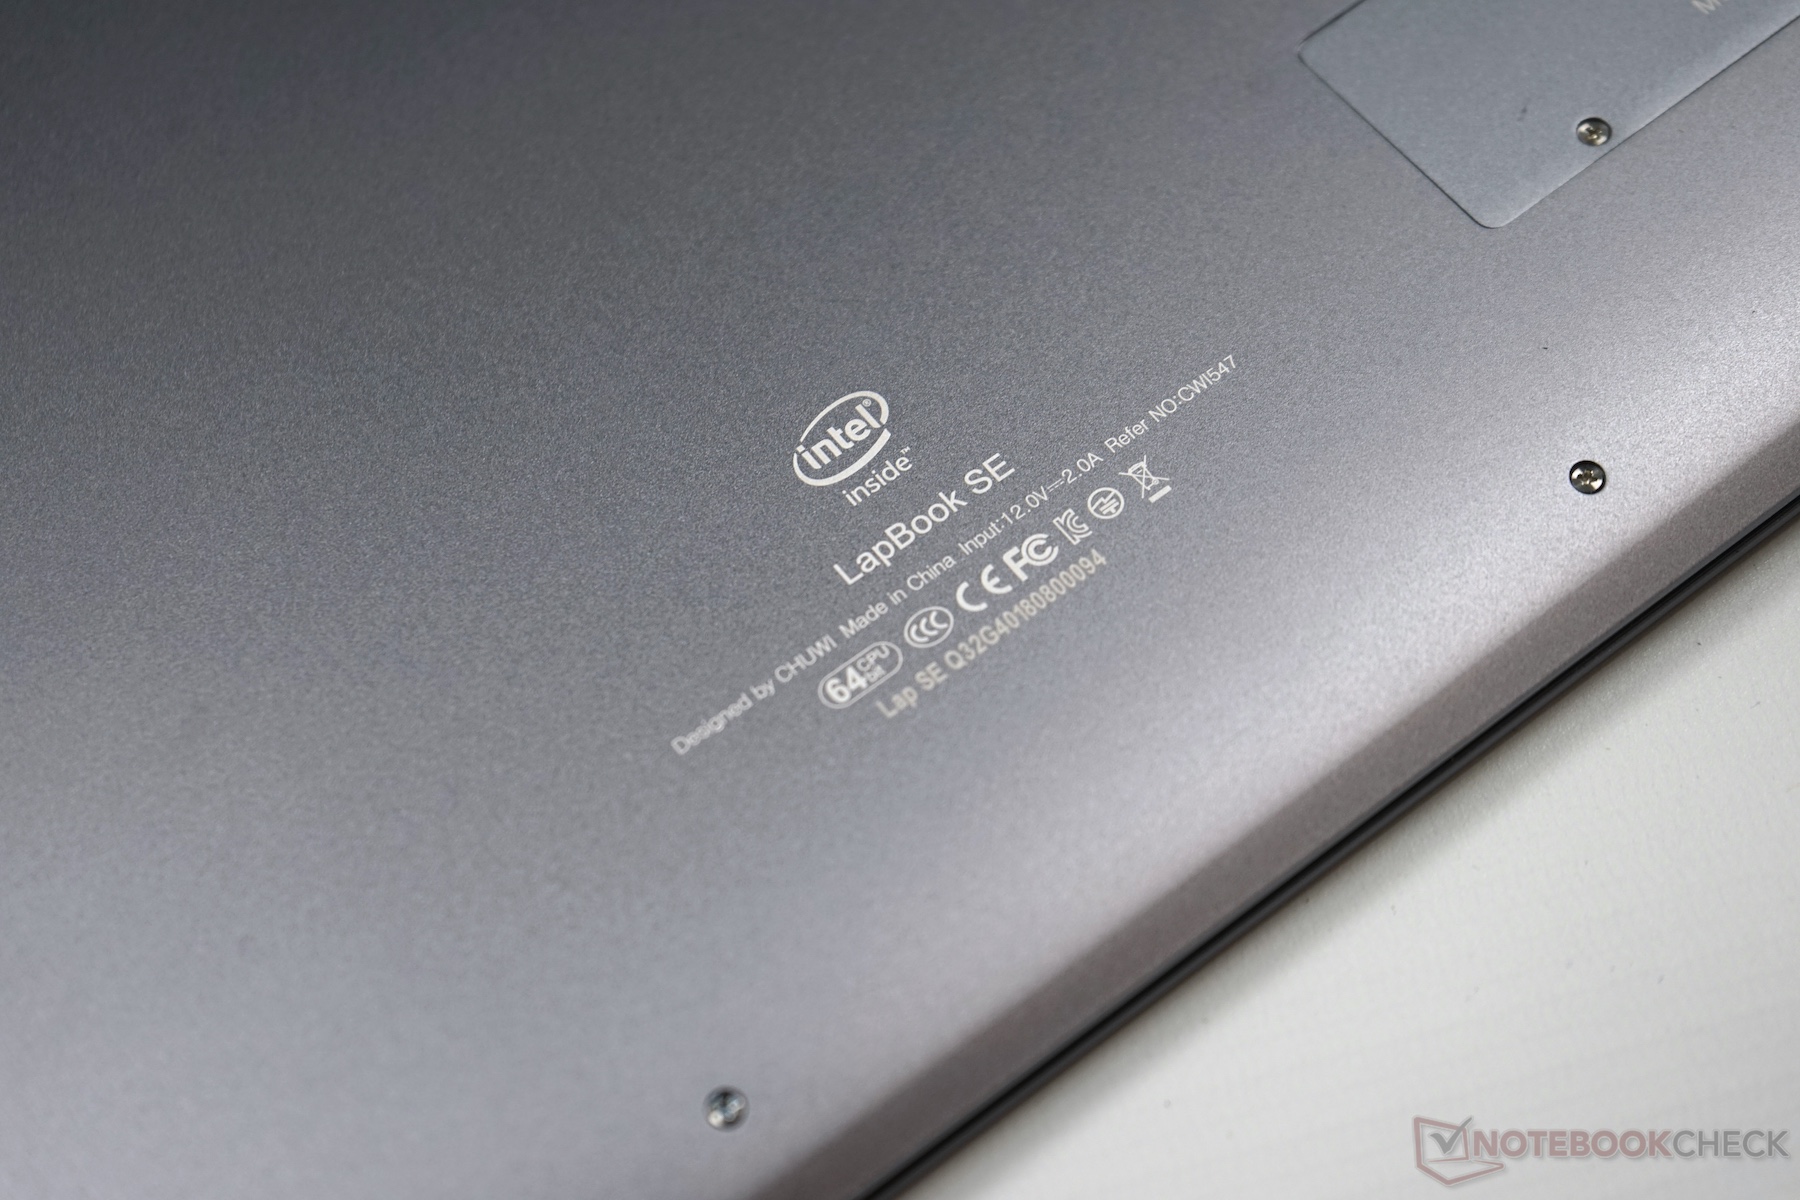
Chuwi currently sells the LapBook SE in one variant that has an Intel Celeron N4100 processor, 4 GB of RAM, a 28 GB eMMC on which Windows is installed and a 128 GB M.2-2280 SSD. However, the same case is also available on Gearbest without an SSD but is branded as an Alfawise laptop.
Chuwi Lapbook SE product page can be found here.
Case
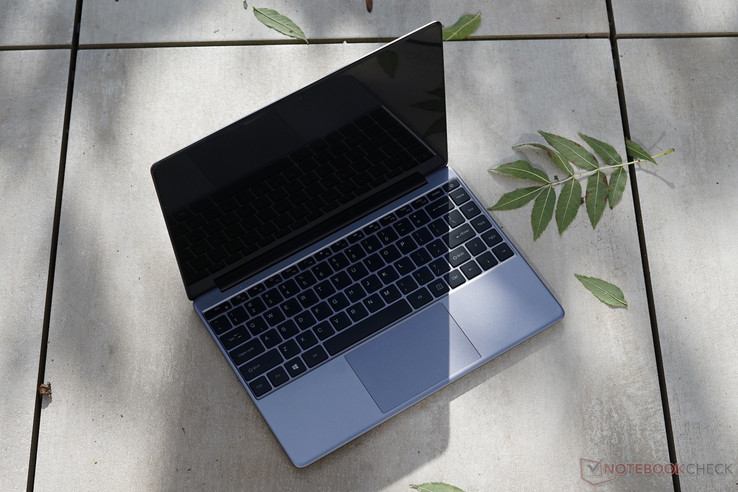
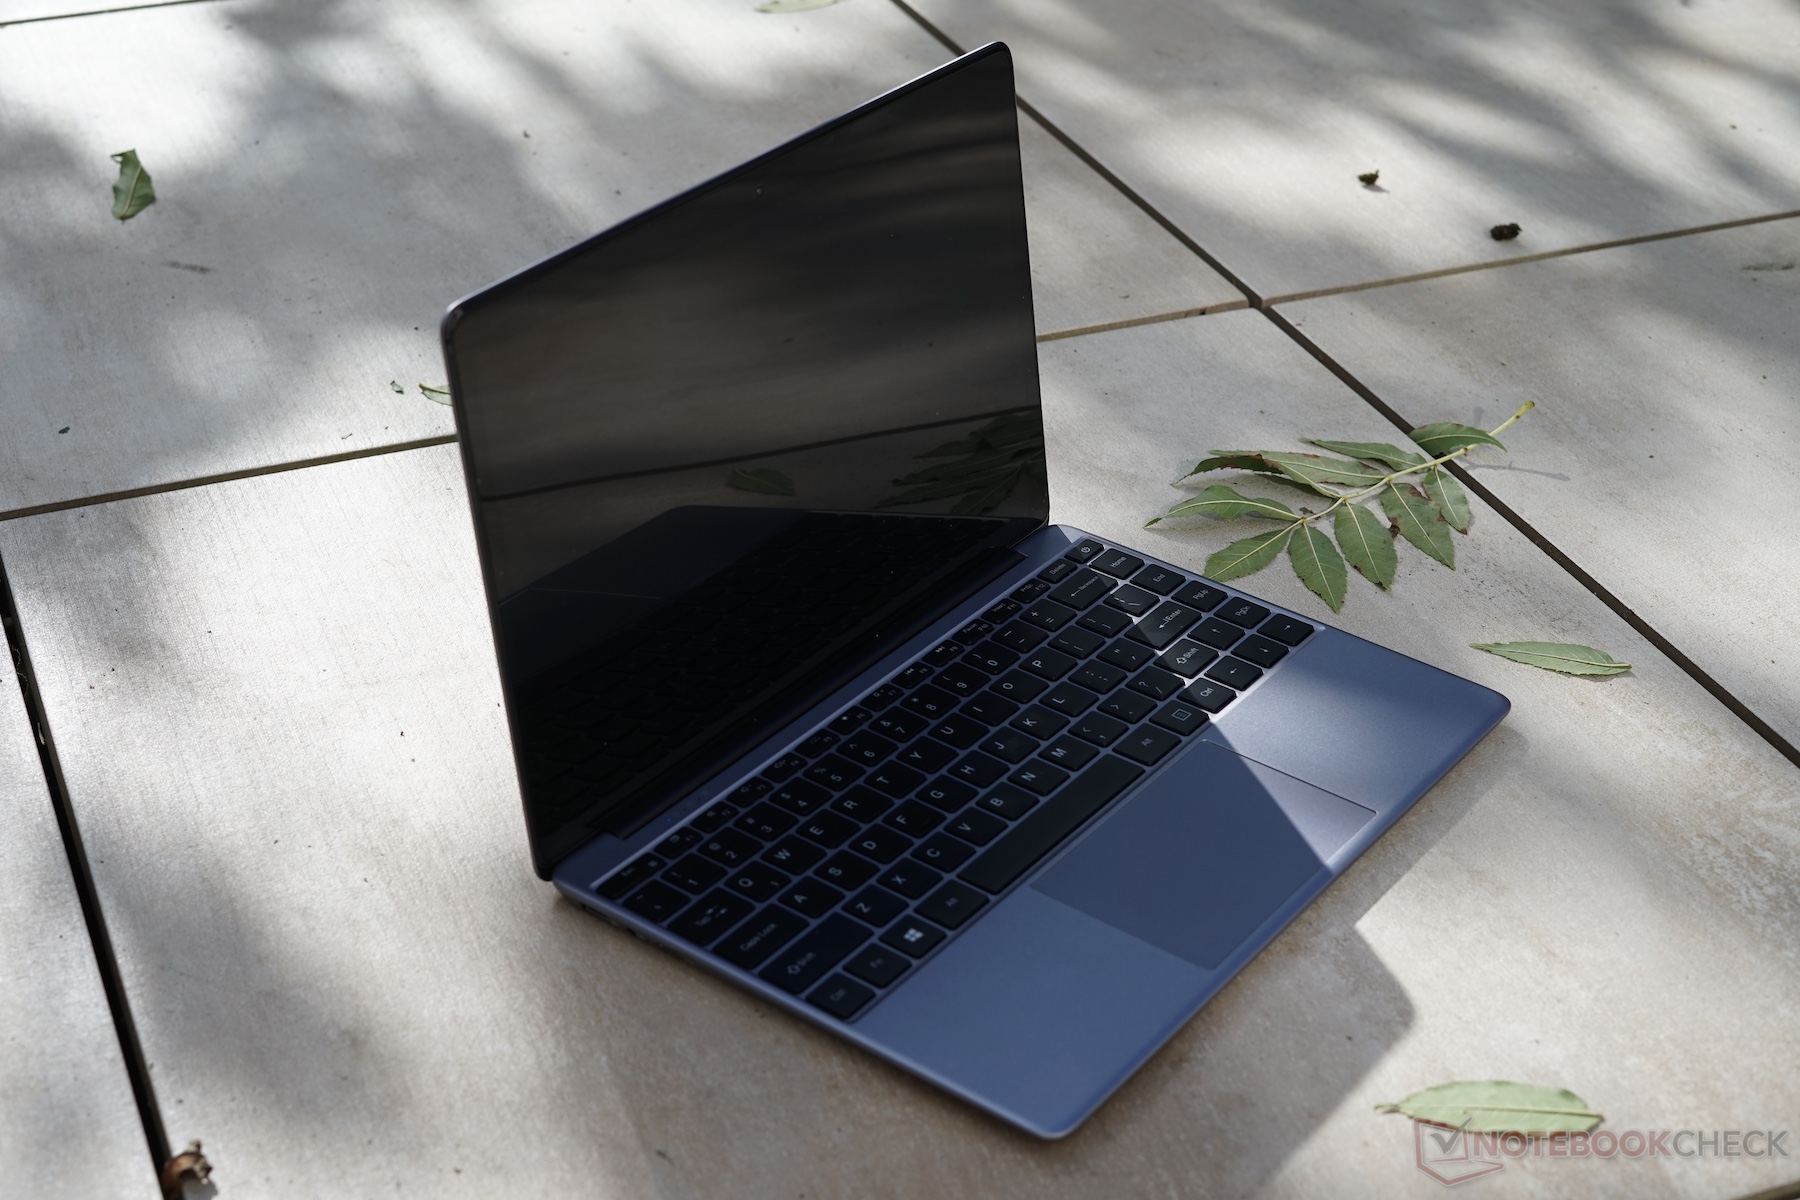
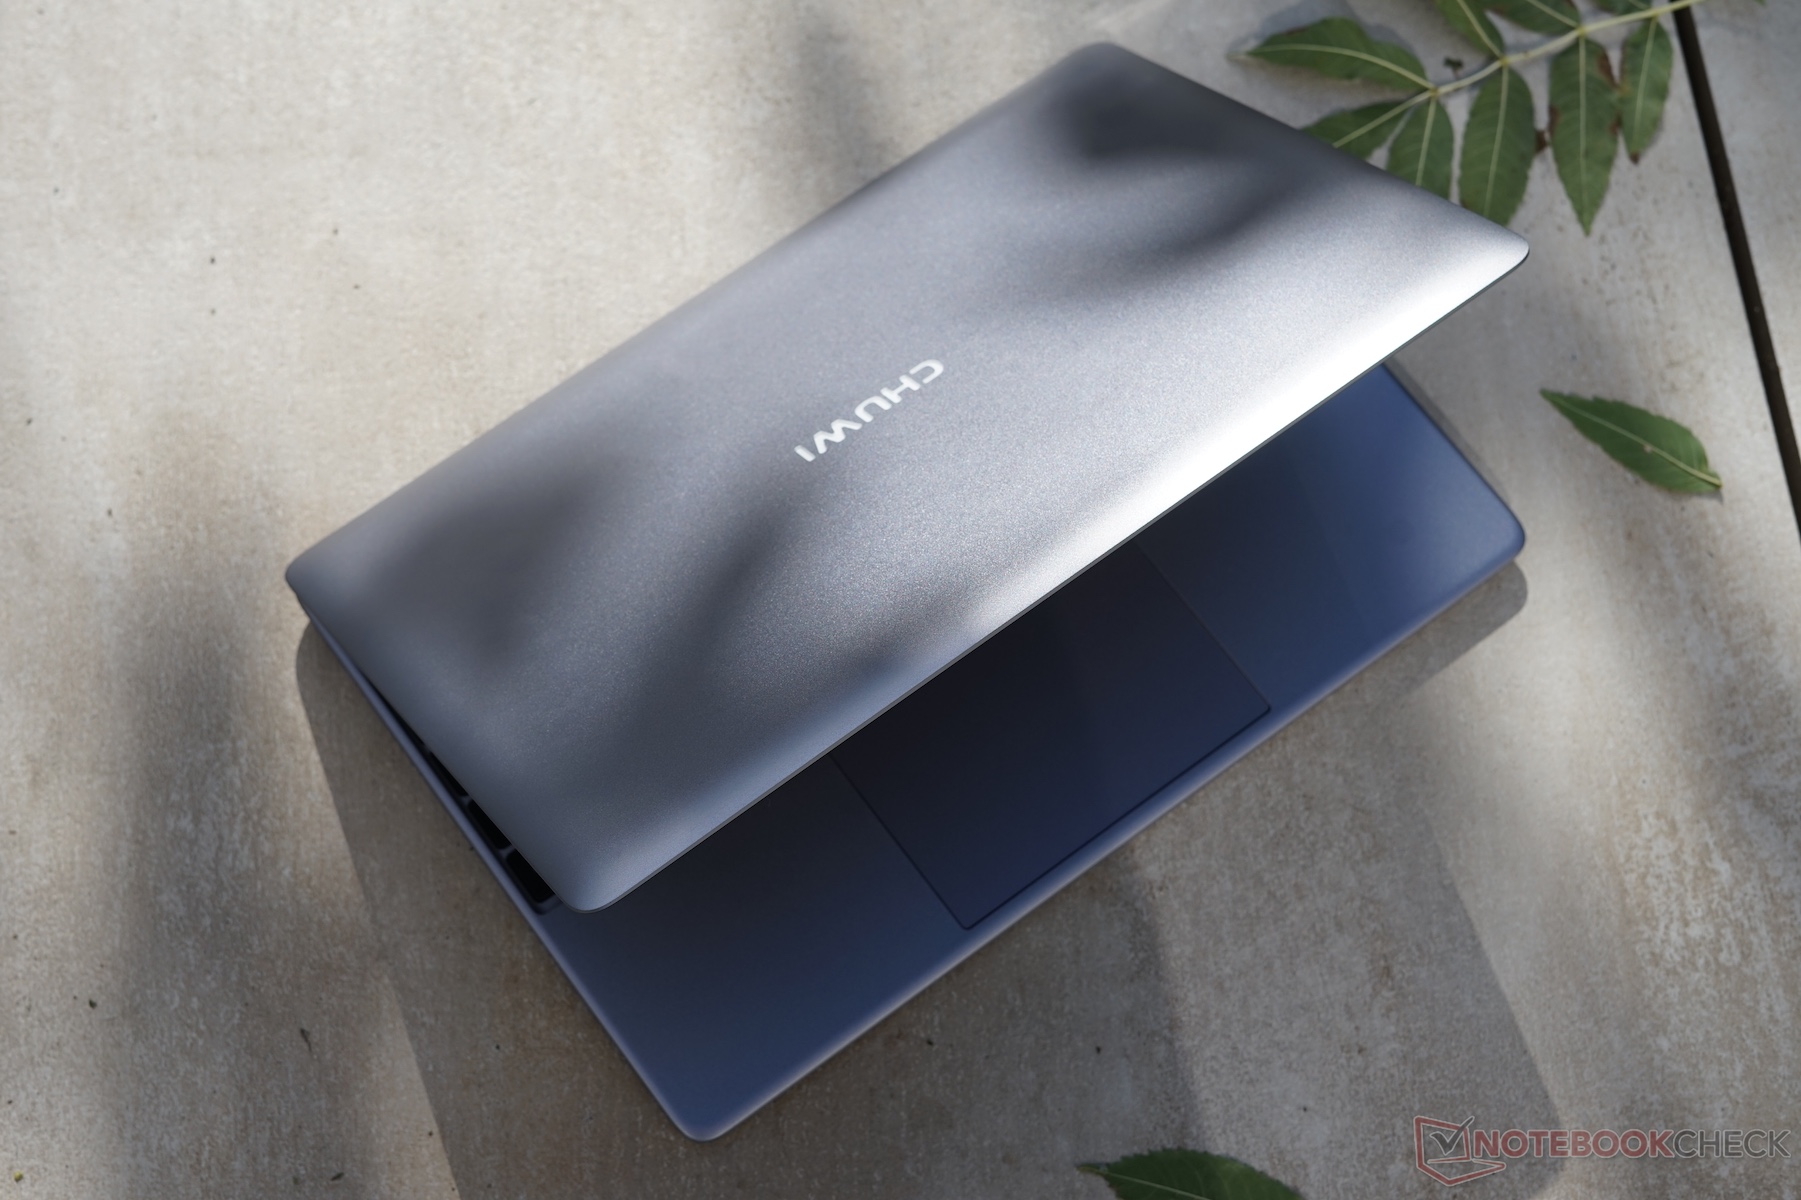
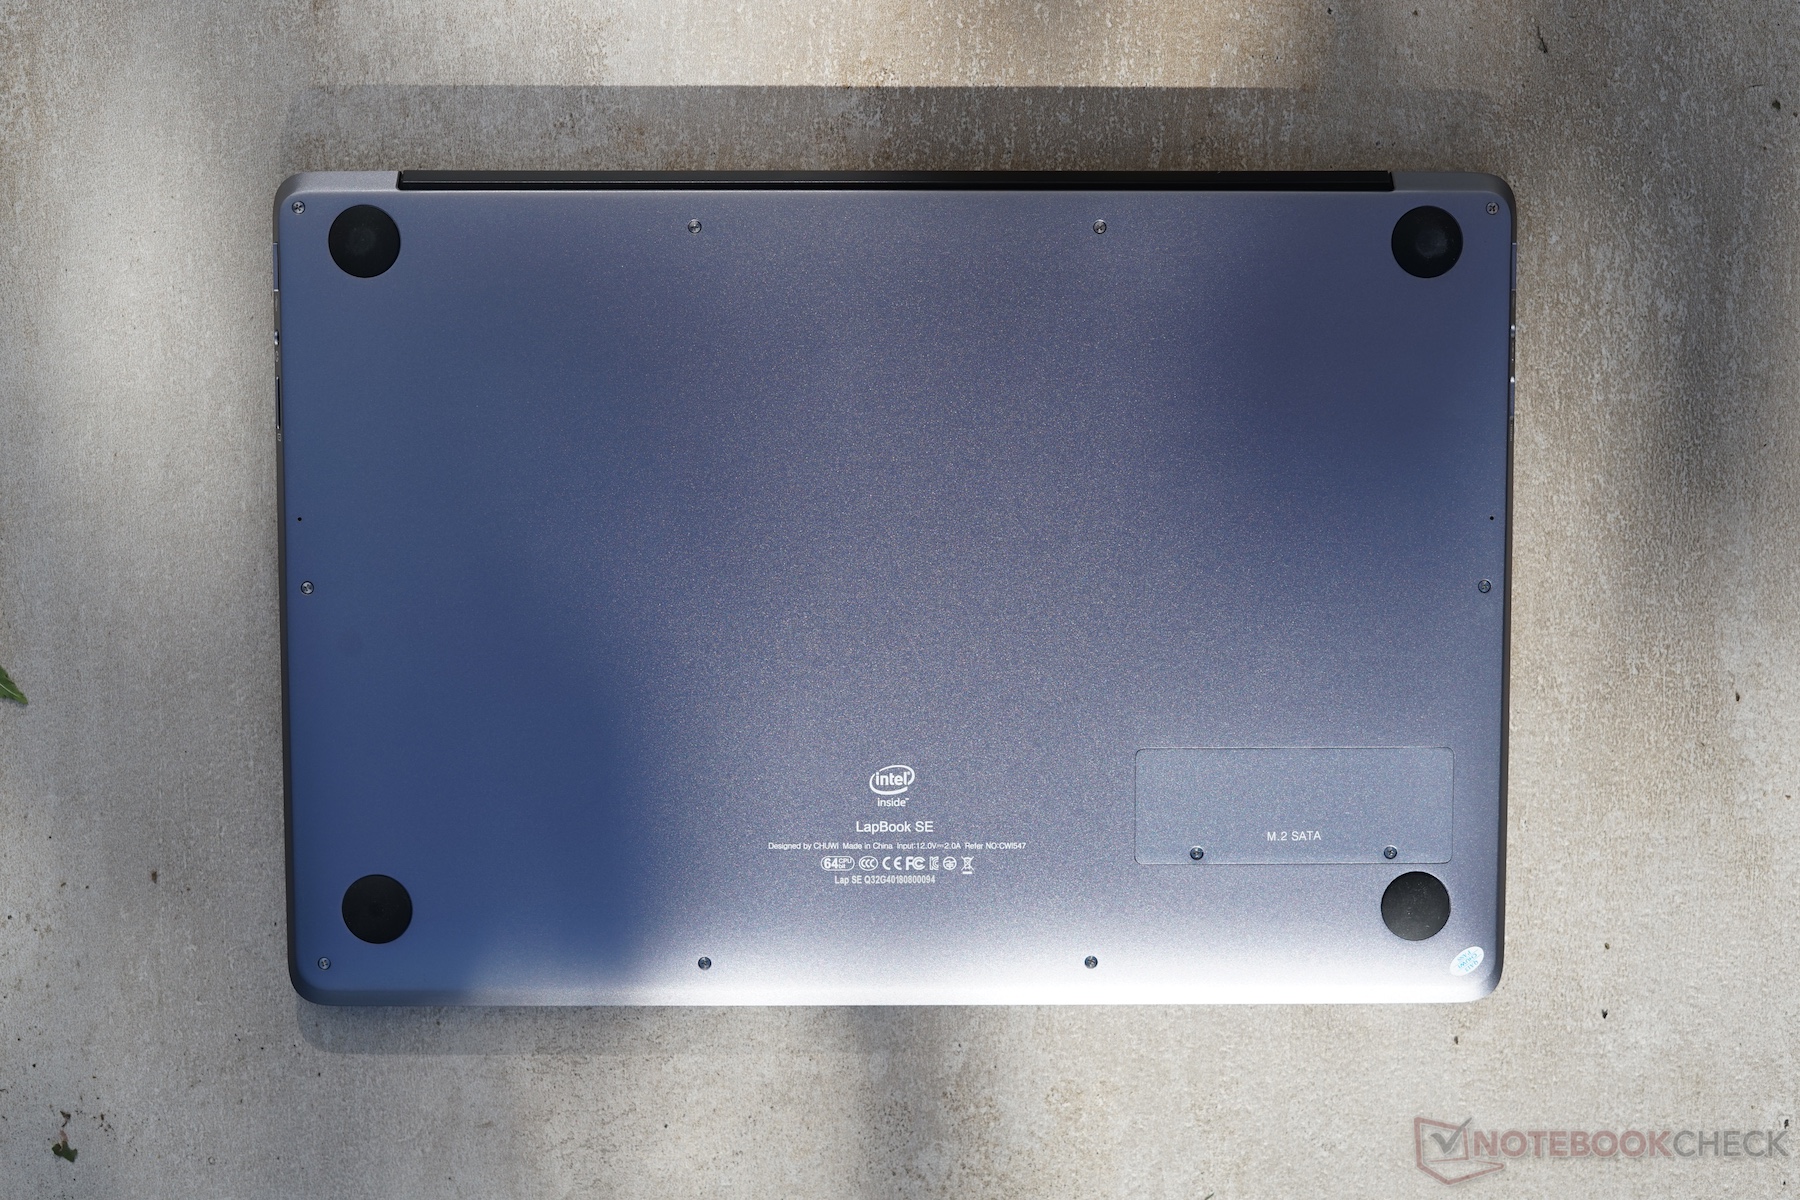
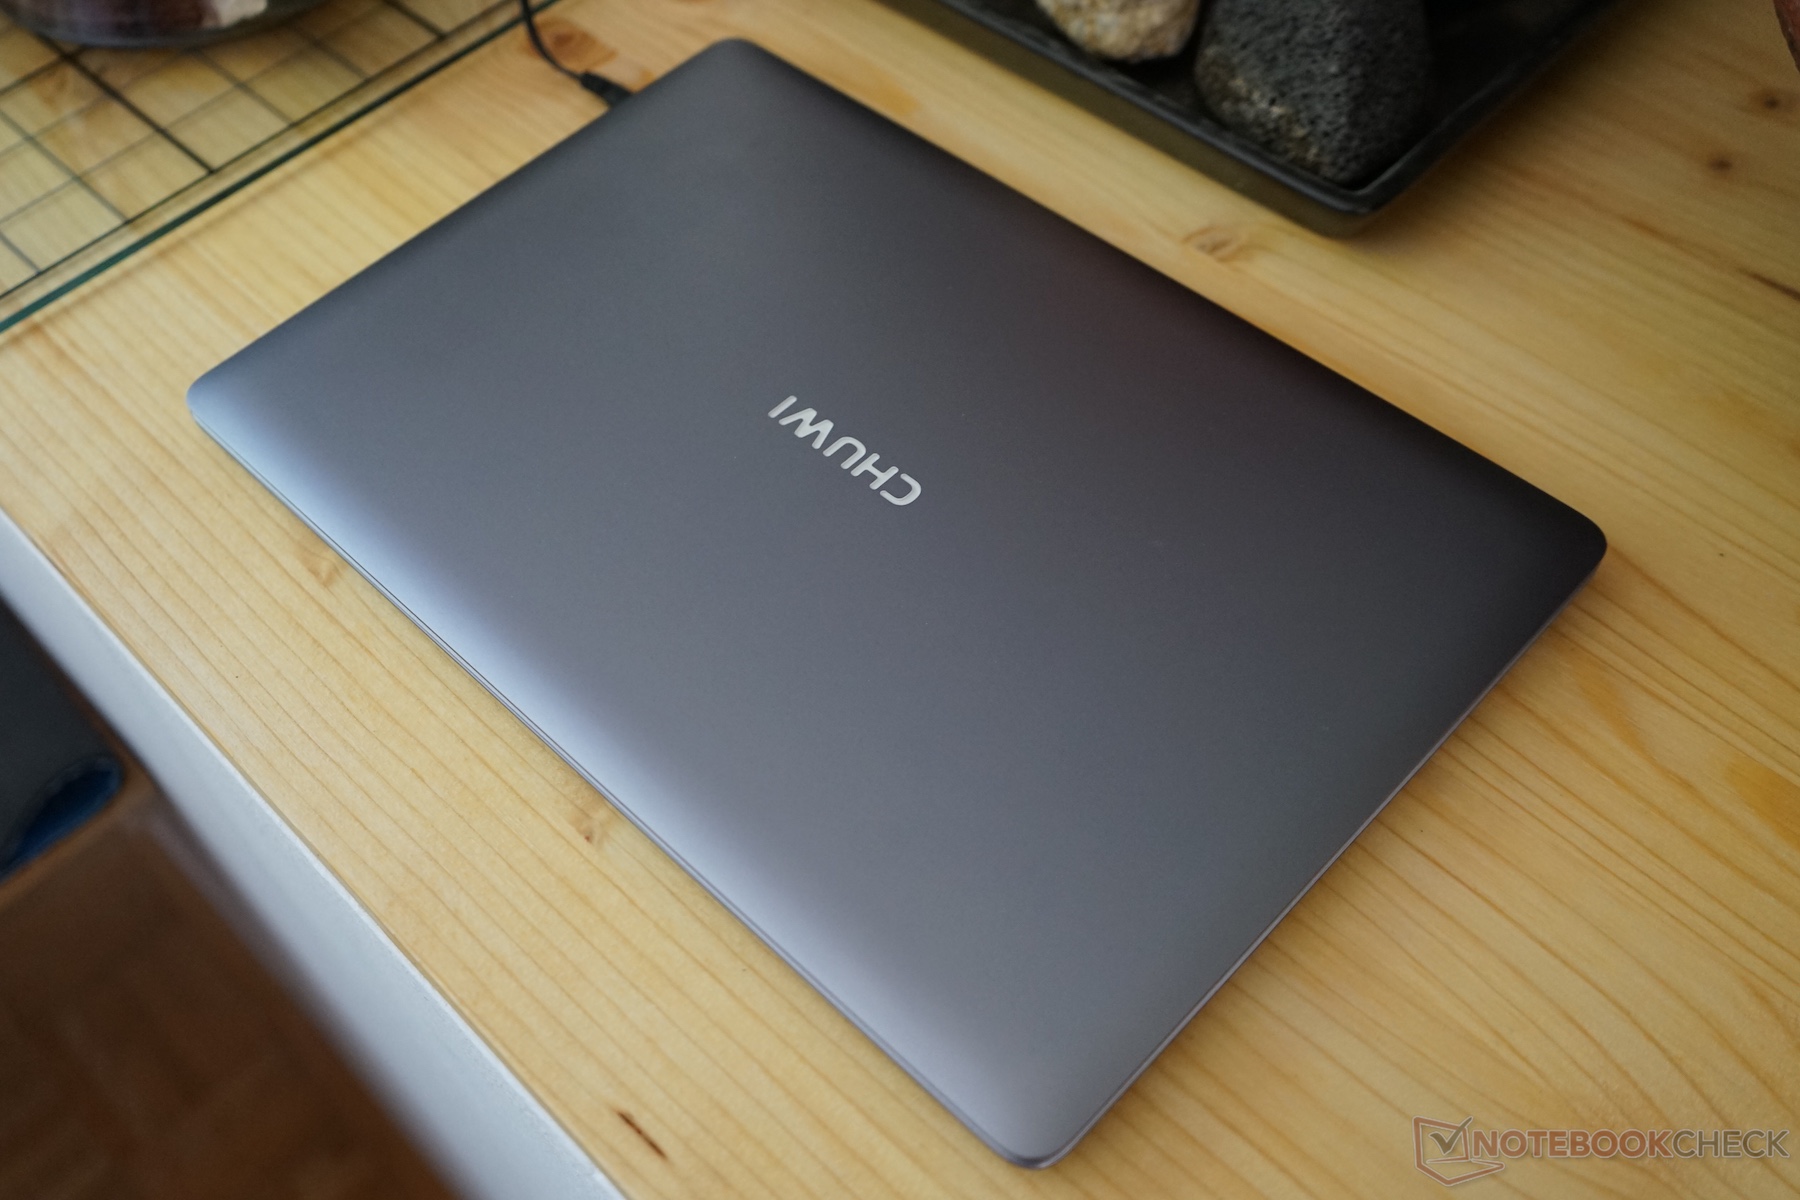
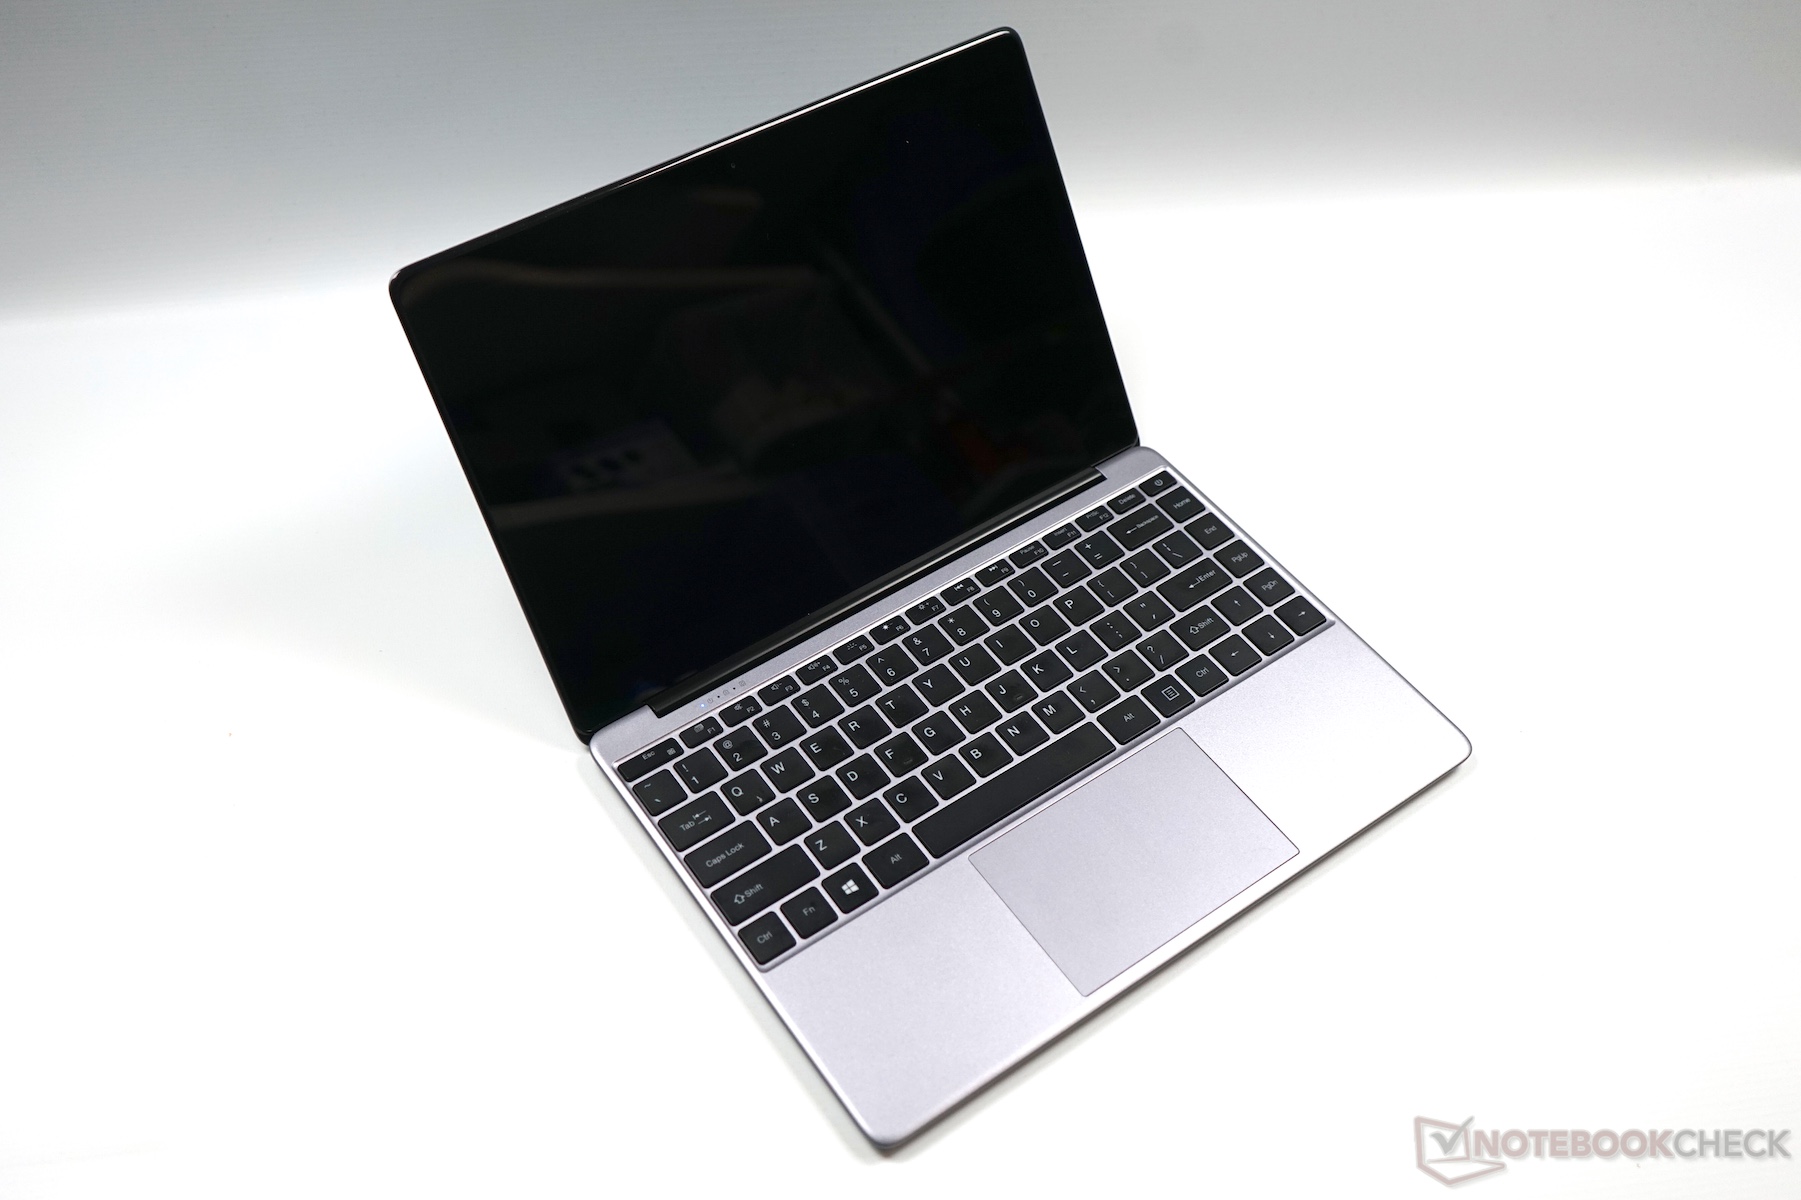
We like the LapBook SE’s case; this is not qualified by the device’s price either. The device has an aluminum case that is reinforced with a metal frame. Our test device weighs 1.4 kg (~3.1 lb), which makes the device not particularly light for its class. The case is robust though and does not creak or deform when we apply pressure to the device. The keyboard deck is made from plastic or a composite material, which feels cheaper than the rest of the device. By contrast, the fit and finish of our test device is impressive with no uneven gaps or other issues. The display has a glossy finish with little space between the glass and the display. The bezels are relatively thick though. We can open our test device with one hand, despite the single centrally mounted hinge being rather stiff.
The design of the LapBook SE takes design cues from the current generation of MacBooks, which is no bad thing. The small subnotebook’s design looks good and is finished to a high standard.
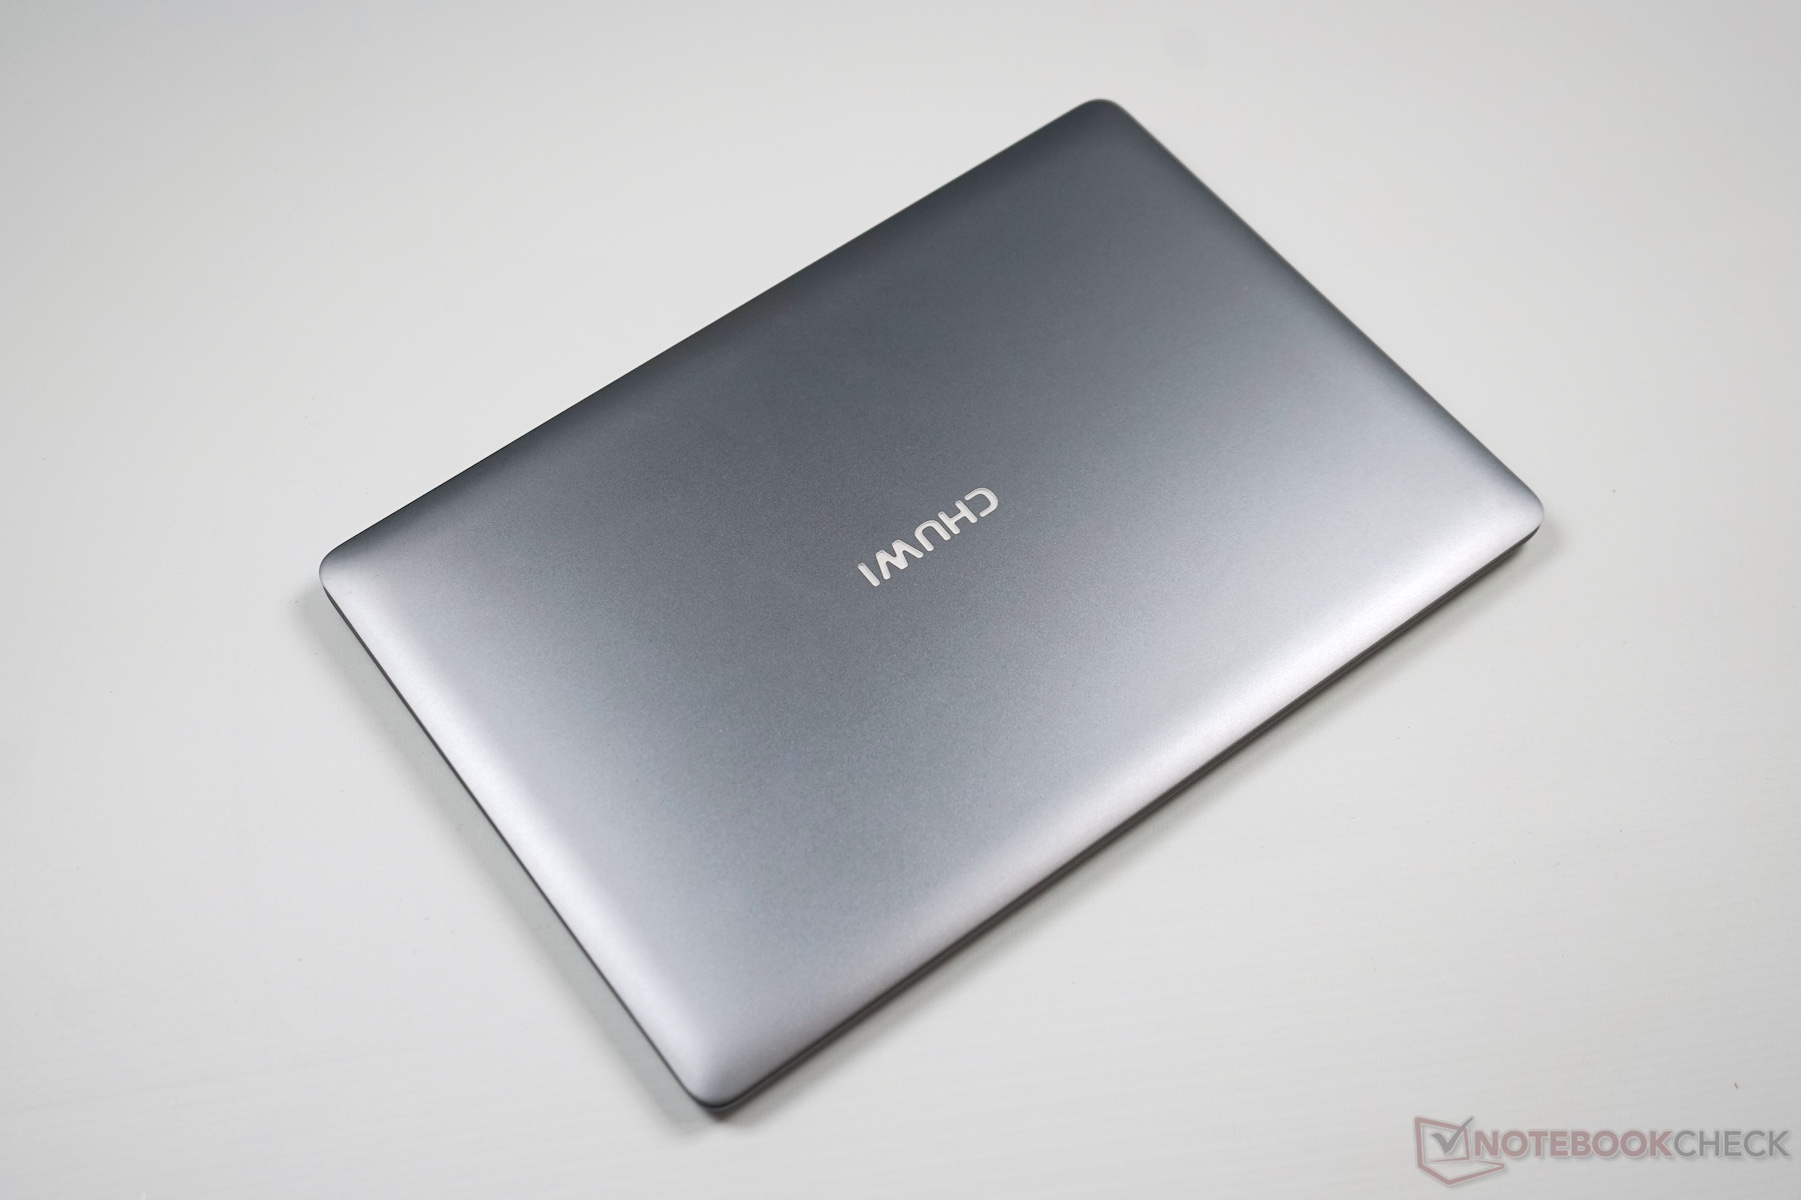
Chuwi base the LapBook SE’s dimensions and weight on the current Apple MacBook Air. The two devices are the same thickness and weigh the same, although the LapBook SE has a smaller overall footprint. The MacBook 12 is considerably smaller than our test device, but the LapBook SE has a 1.3-inch larger display than Apple’s smallest laptop.
Connectivity
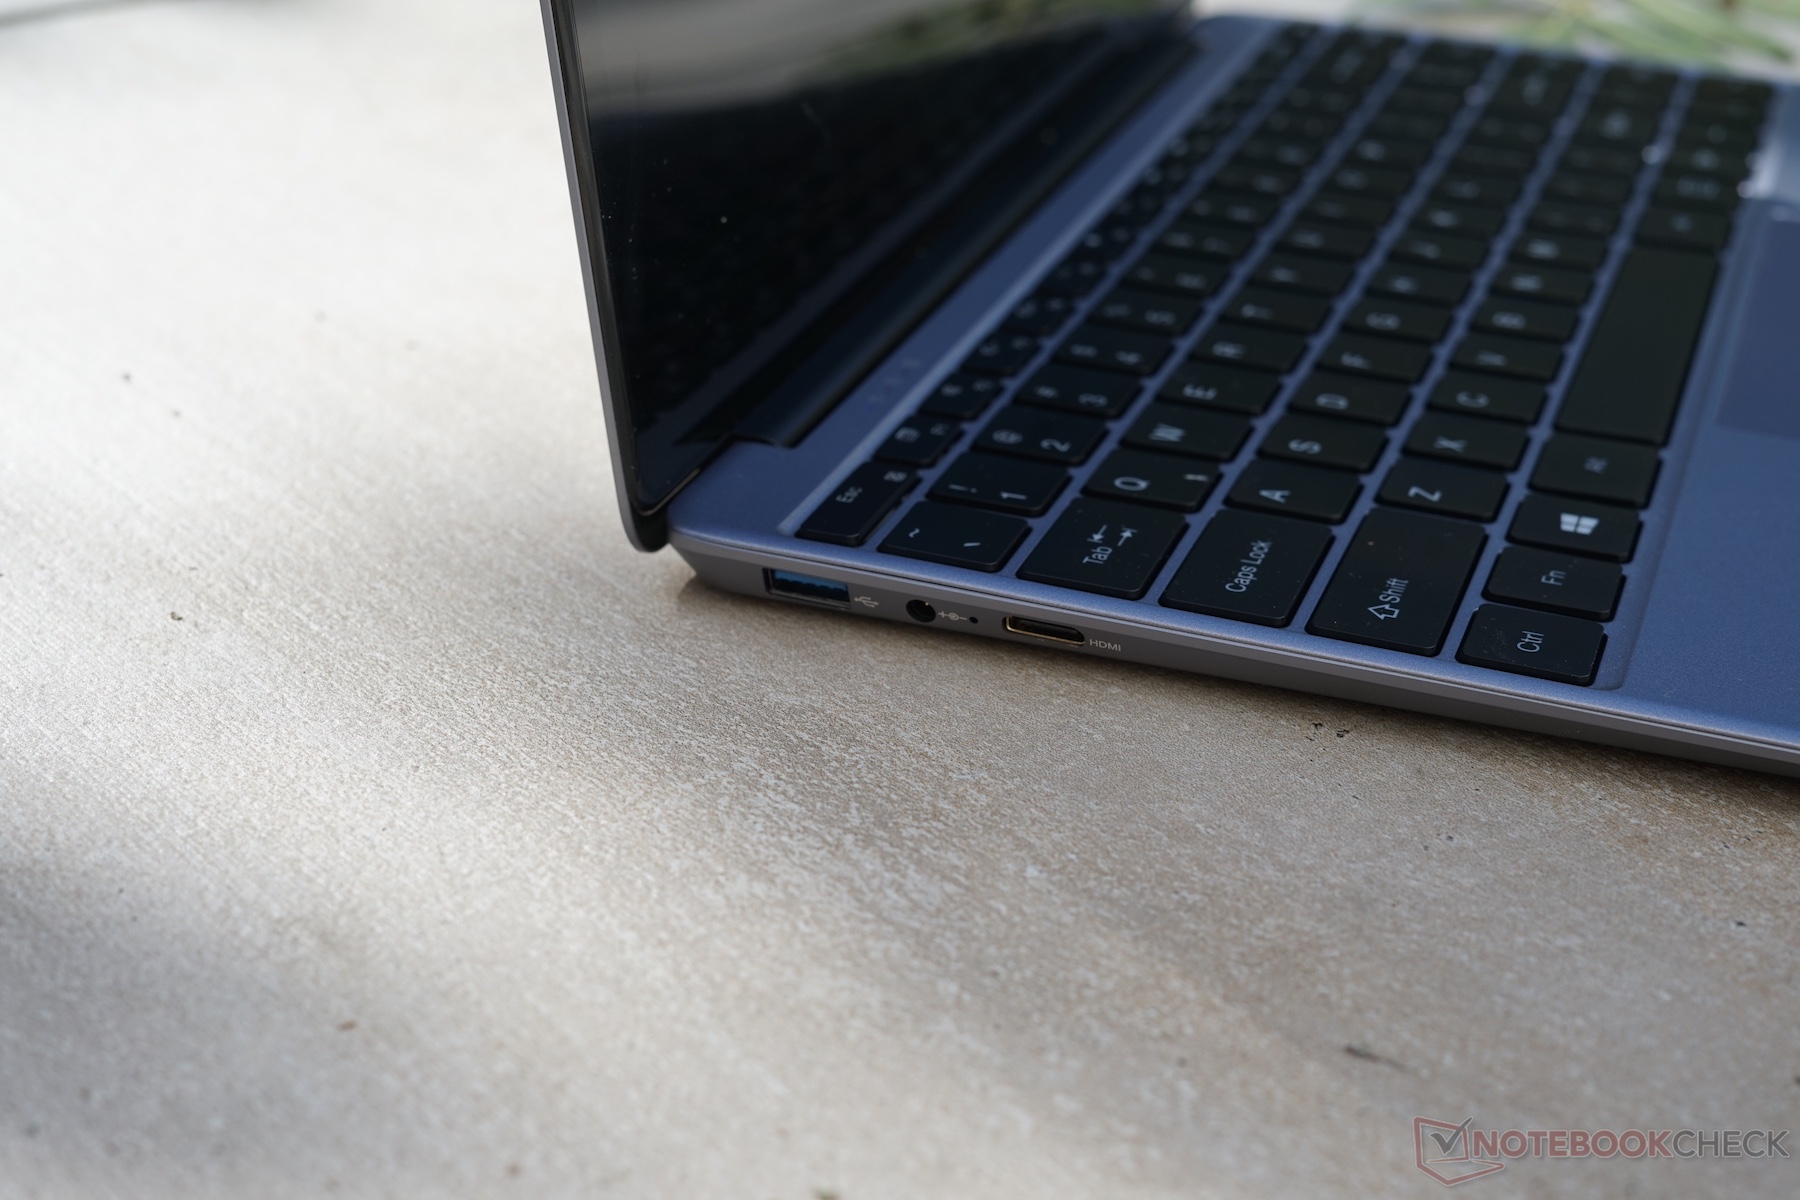
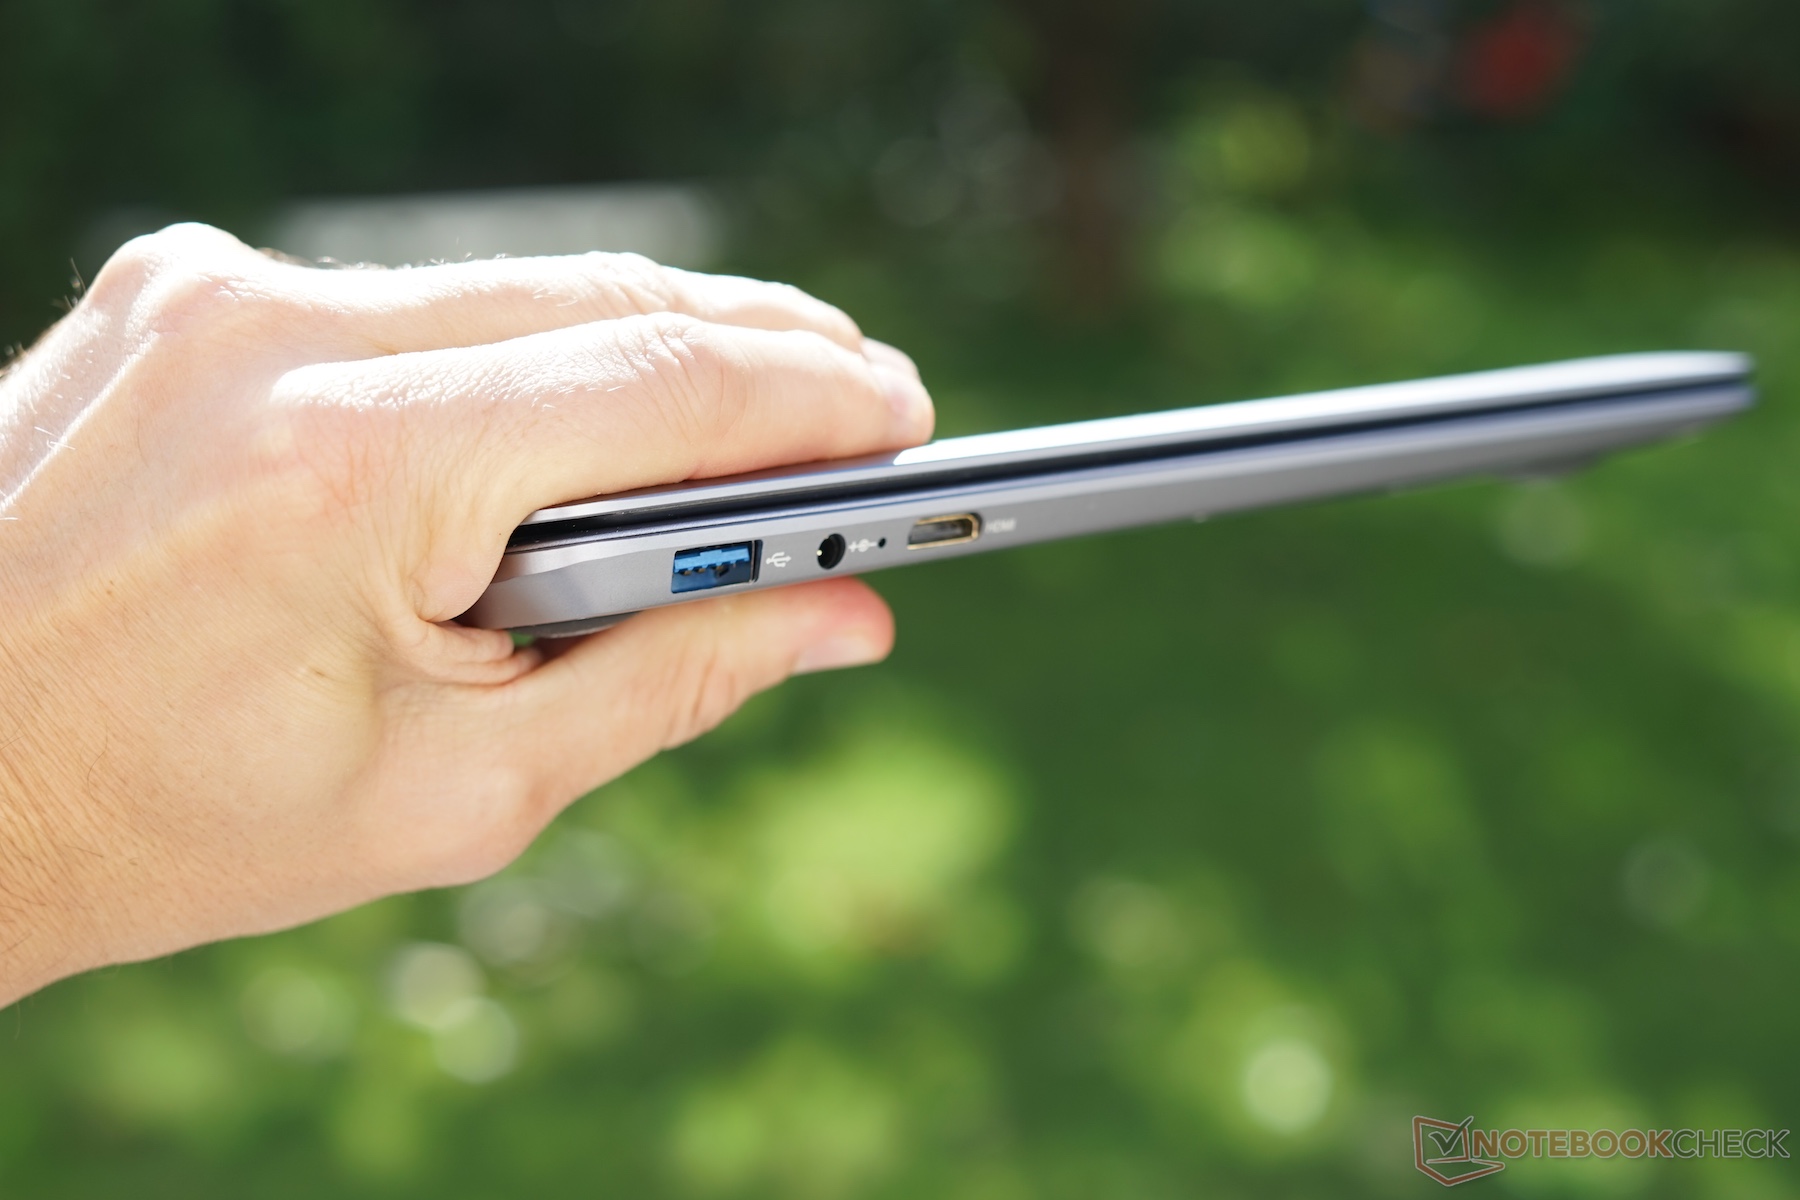
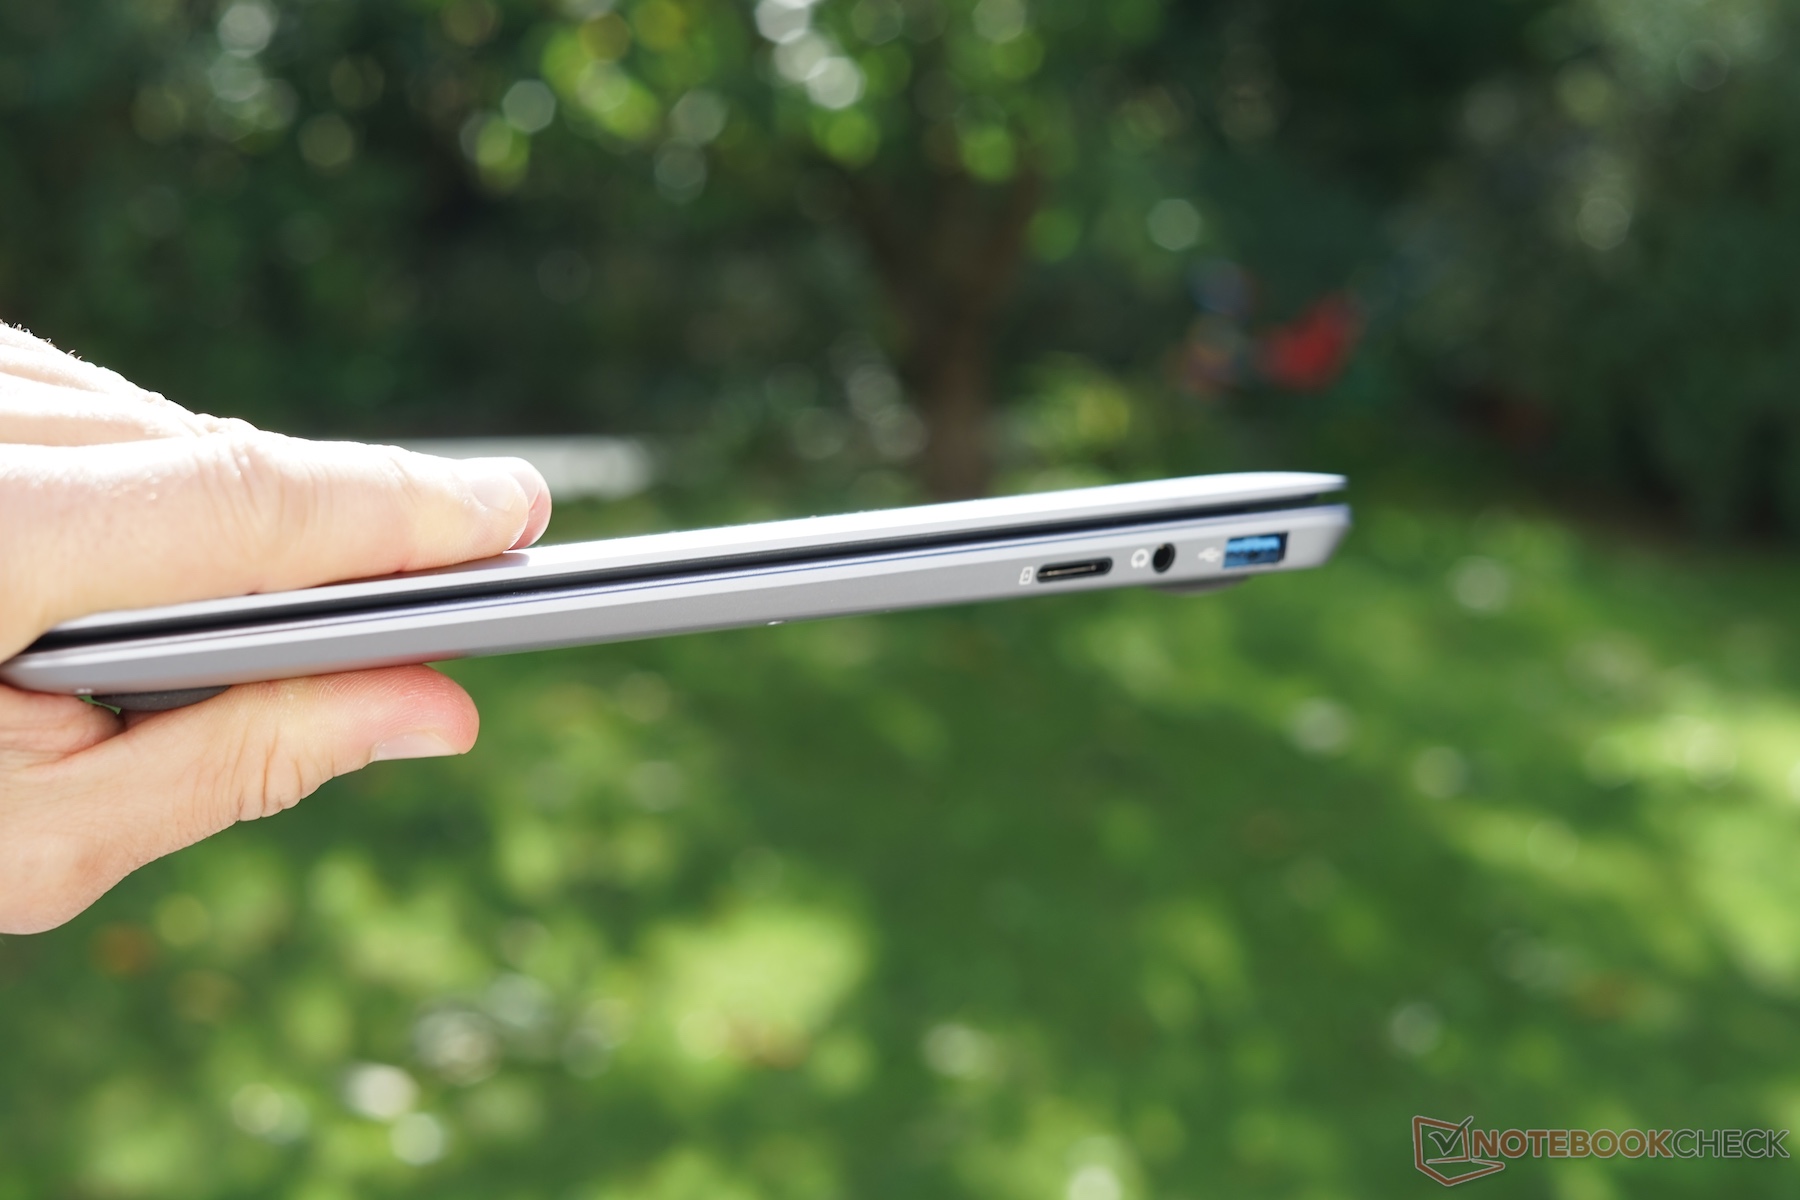
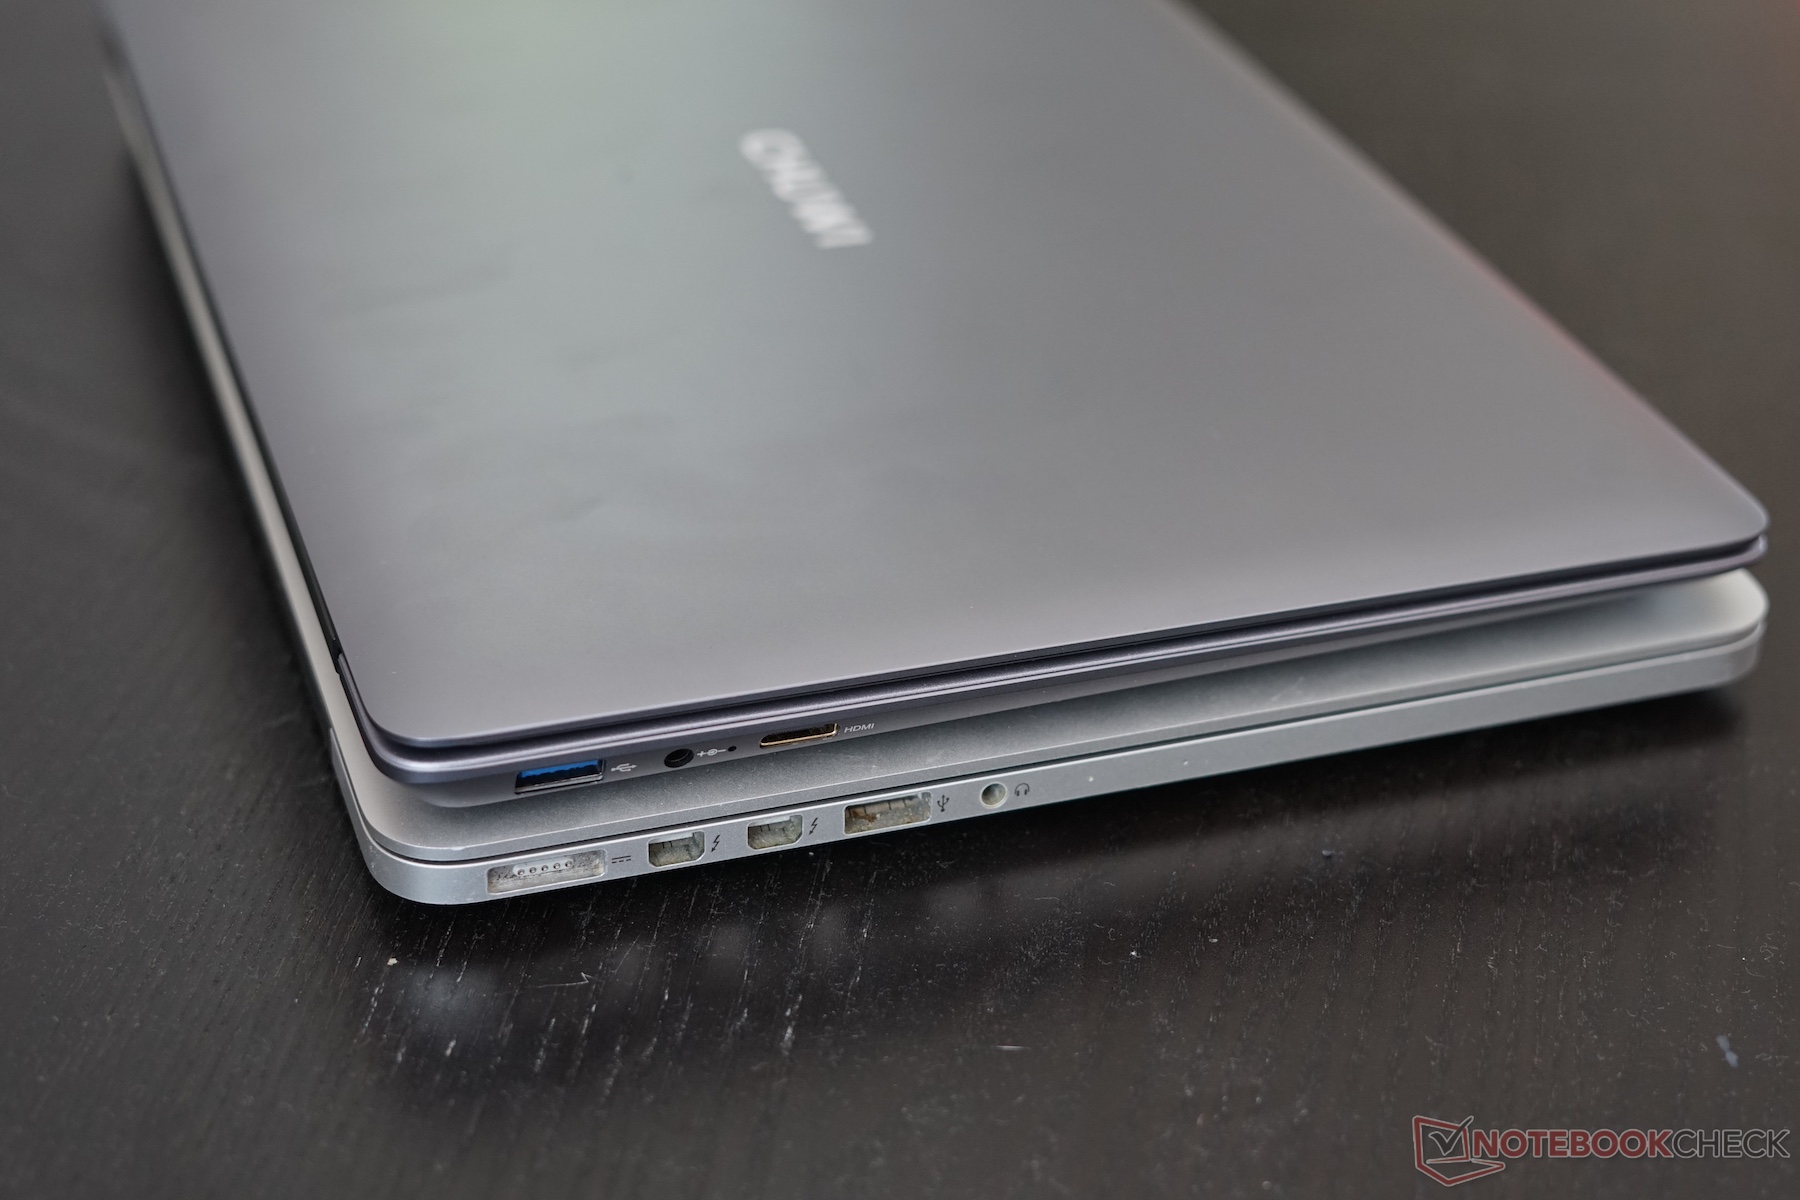
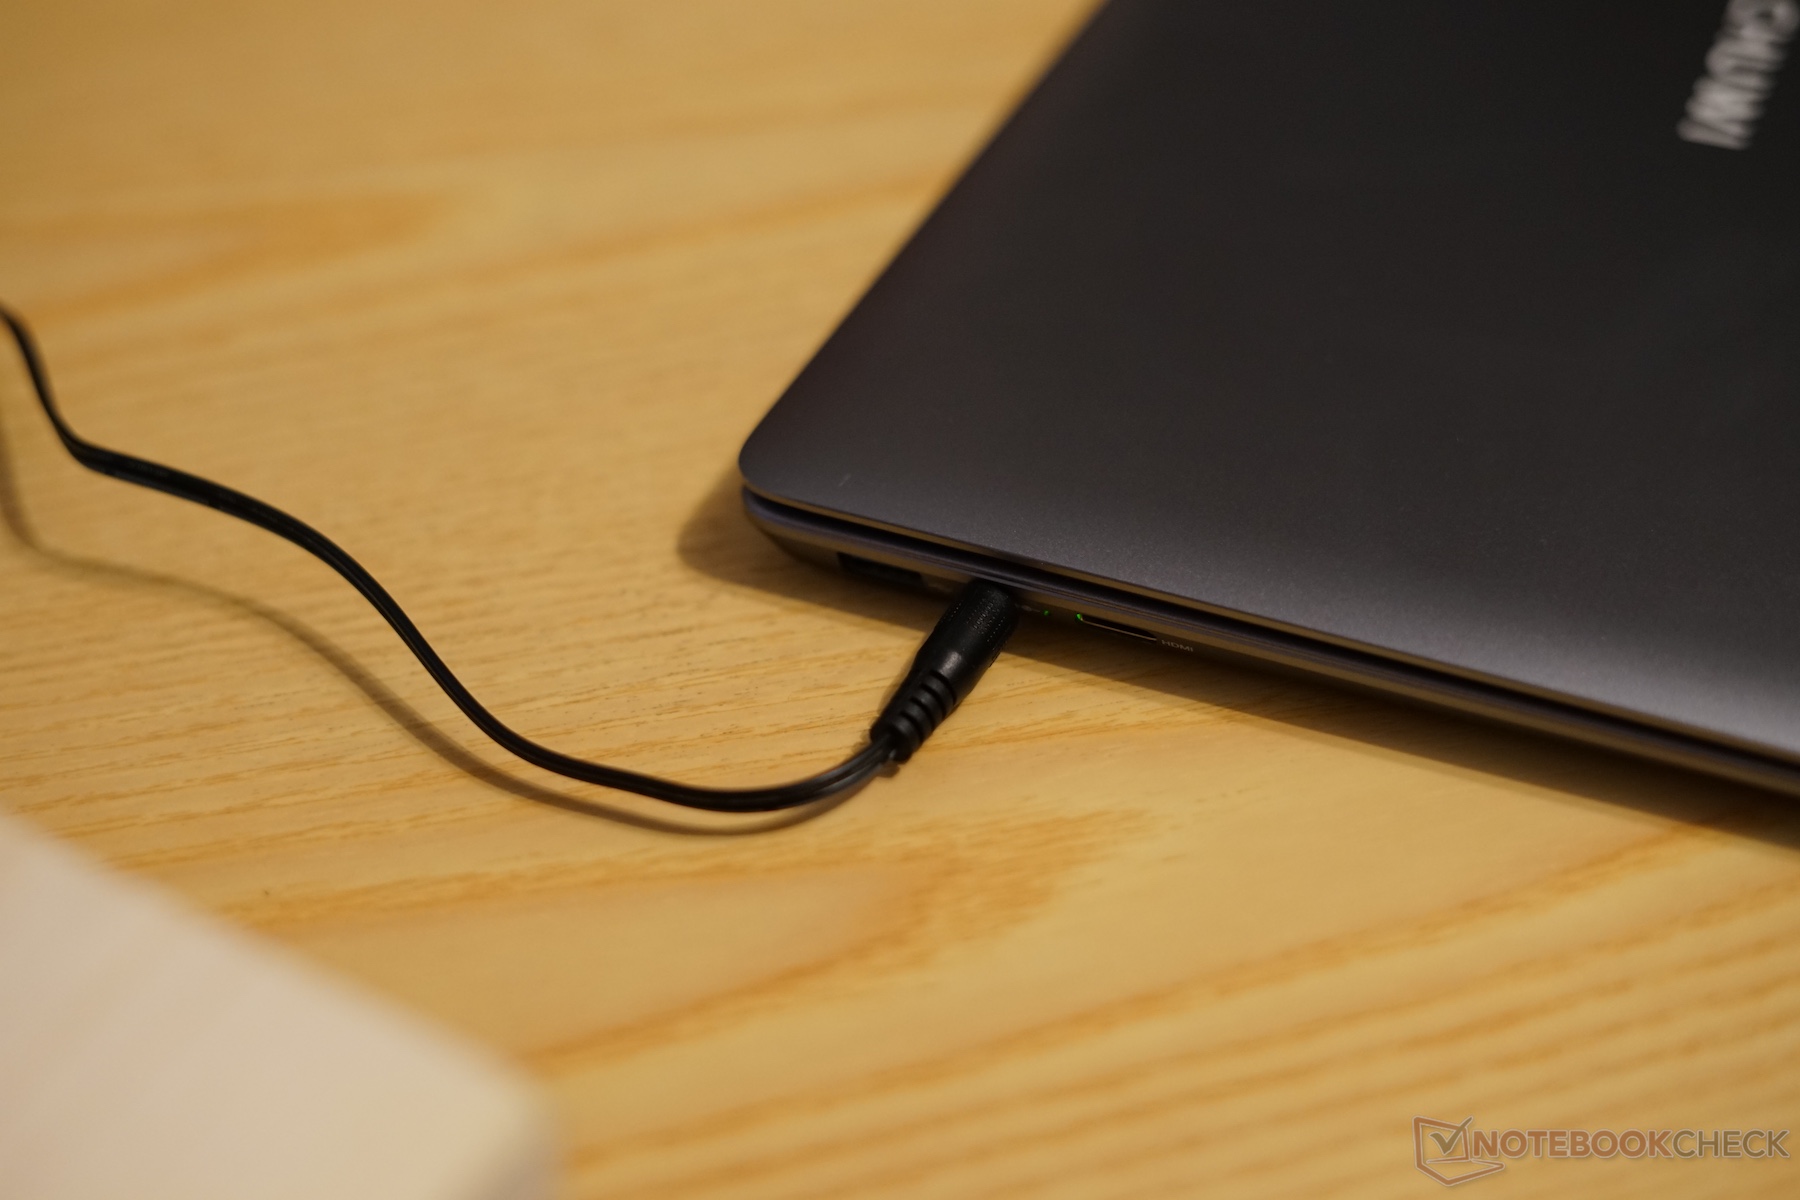
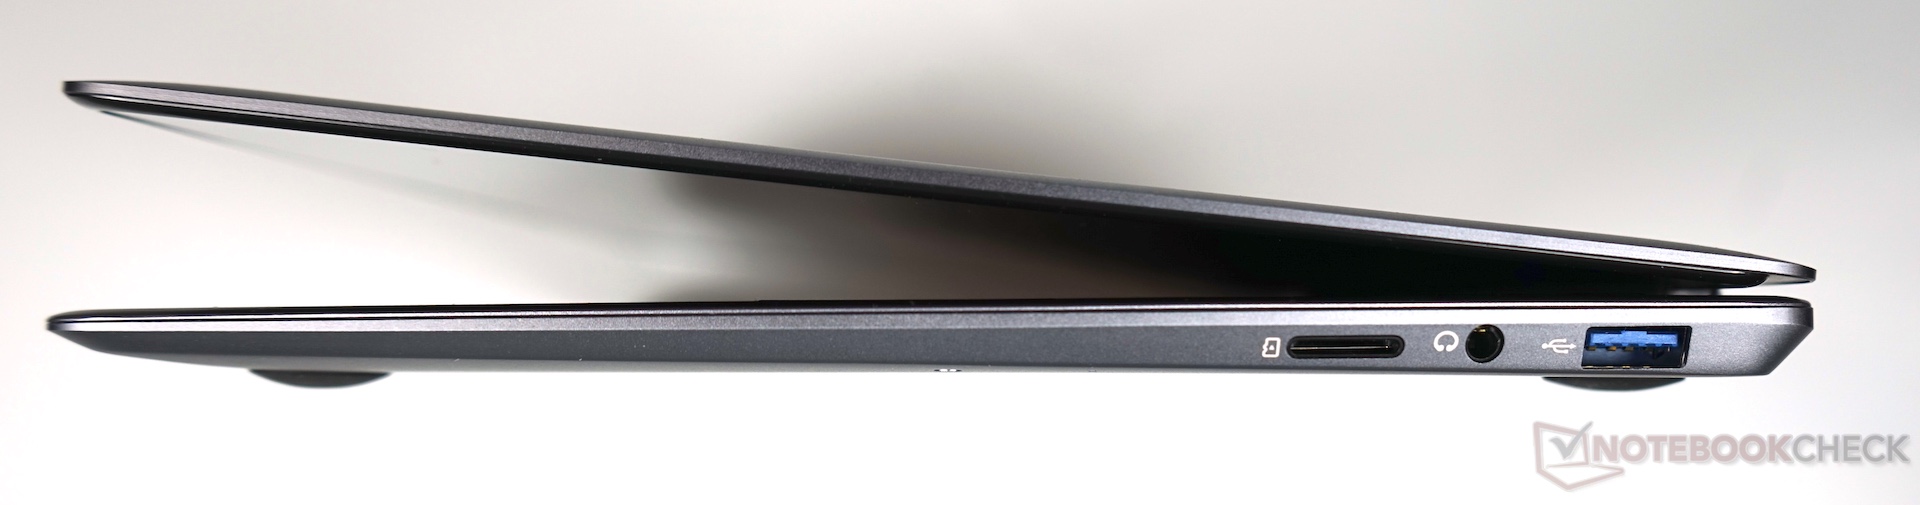
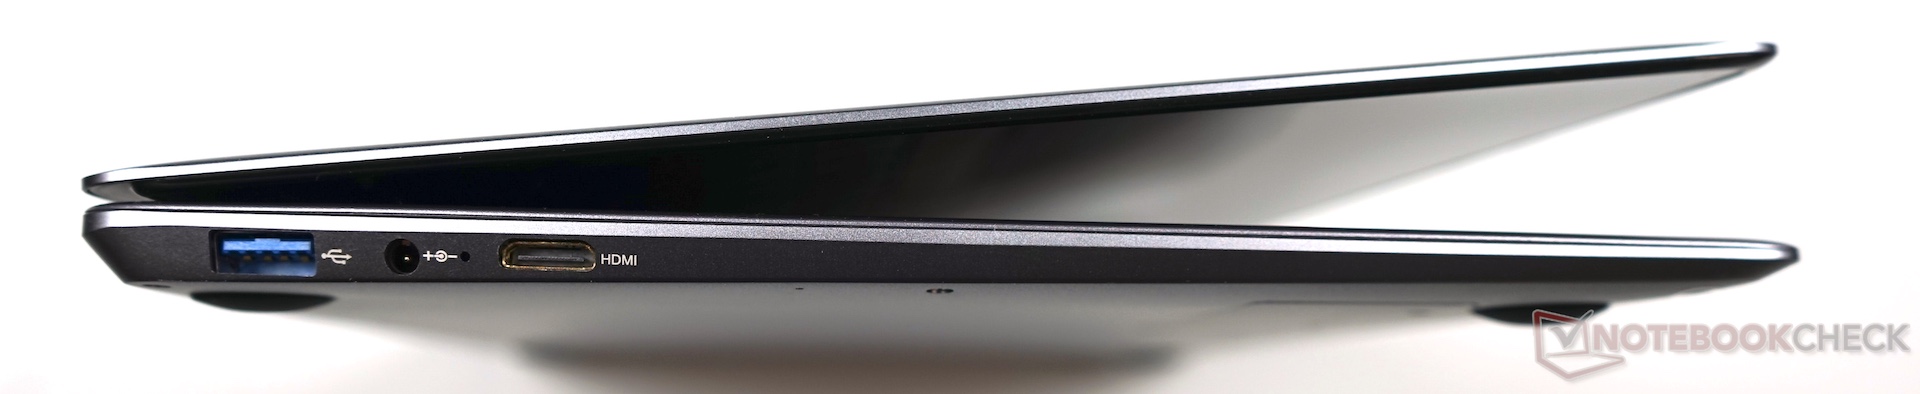
The LapBook SE’s port selection is the first sign of Chuwi’s cost saving. There are no USB Type-C ports, which could charge the device. Chuwi has equipped the device with two USB 3.0 Type-A ports instead. The device has a proprietary barrel-charger too, with a charging LED next to the port. The device is too thin for a full-sized HDMI port, so Chuwi has included a mini HDMI port; the same goes for including a microSD card slot over an SD card slot too. The port ensemble is finished off with a 3.5 mm headphone jack.
SD Card reader
Our test device achieved less than 30 MB/s in both our micro SD card tests, making the LapBook SE slower than most of our comparison devices overall. Transferring large volumes of data, like RAW files from a camera, is not a pleasant experience. While the microSD card disappears completely into the case, the transfer speeds are so slow that we would not recommend using a microSD card to expand the LapBook SE’s storage space. We would only suggest using the microSD card reader with files that do not necessitate high read speeds like movies.
| SD Card Reader | |
| average JPG Copy Test (av. of 3 runs) | |
| Dell XPS 13 9360 QHD+ i7 (Toshiba Exceria Pro SDXC 64 GB UHS-II) | |
| Apple MacBook Air 13.3" 1.8 GHz (2017) (Toshiba Exceria Pro SDXC 64 GB UHS-II) | |
| Average of class Subnotebook (23.7 - 188, n=9, last 2 years) | |
| Chuwi LapBook SE | |
| Chuwi Lapbook 12.3 (Toshiba Exceria Pro M501) | |
| Trekstor Primebook C13 (Toshiba Exceria Pro M501 microSDXC 64GB) | |
| Jumper EZbook 3 | |
| maximum AS SSD Seq Read Test (1GB) | |
| Dell XPS 13 9360 QHD+ i7 (Toshiba Exceria Pro SDXC 64 GB UHS-II) | |
| Average of class Subnotebook (24.9 - 195, n=8, last 2 years) | |
| Apple MacBook Air 13.3" 1.8 GHz (2017) (Toshiba Exceria Pro SDXC 64 GB UHS-II) | |
| Chuwi Lapbook 12.3 (Toshiba Exceria Pro M501) | |
| Trekstor Primebook C13 (Toshiba Exceria Pro M501 microSDXC 64GB) | |
| Jumper EZbook 3 (Toshiba Exceria Pro M401 64 GB) | |
| Chuwi LapBook SE | |
Communication
The LapBook SE uses an Intel Dual Band Wireless-AC 3165 module for Wi-Fi and Bluetooth instead of the Gigabit Wi-Fi that is integrated with the device’s Gemini Lake processor. Our test device maintained a stable Wi-Fi connection throughout our testing, but its network range and transfer speeds could be better. Overall, the LapBook SE has better Wi-Fi performance than other Chinese notebooks that use Realtek chips.
Security
The LapBook SE has a Trusted Platform Module (TPM) 2.0 chip integrated within its processor that Windows 10 uses. There are no other hardware security features though.
Maintenance
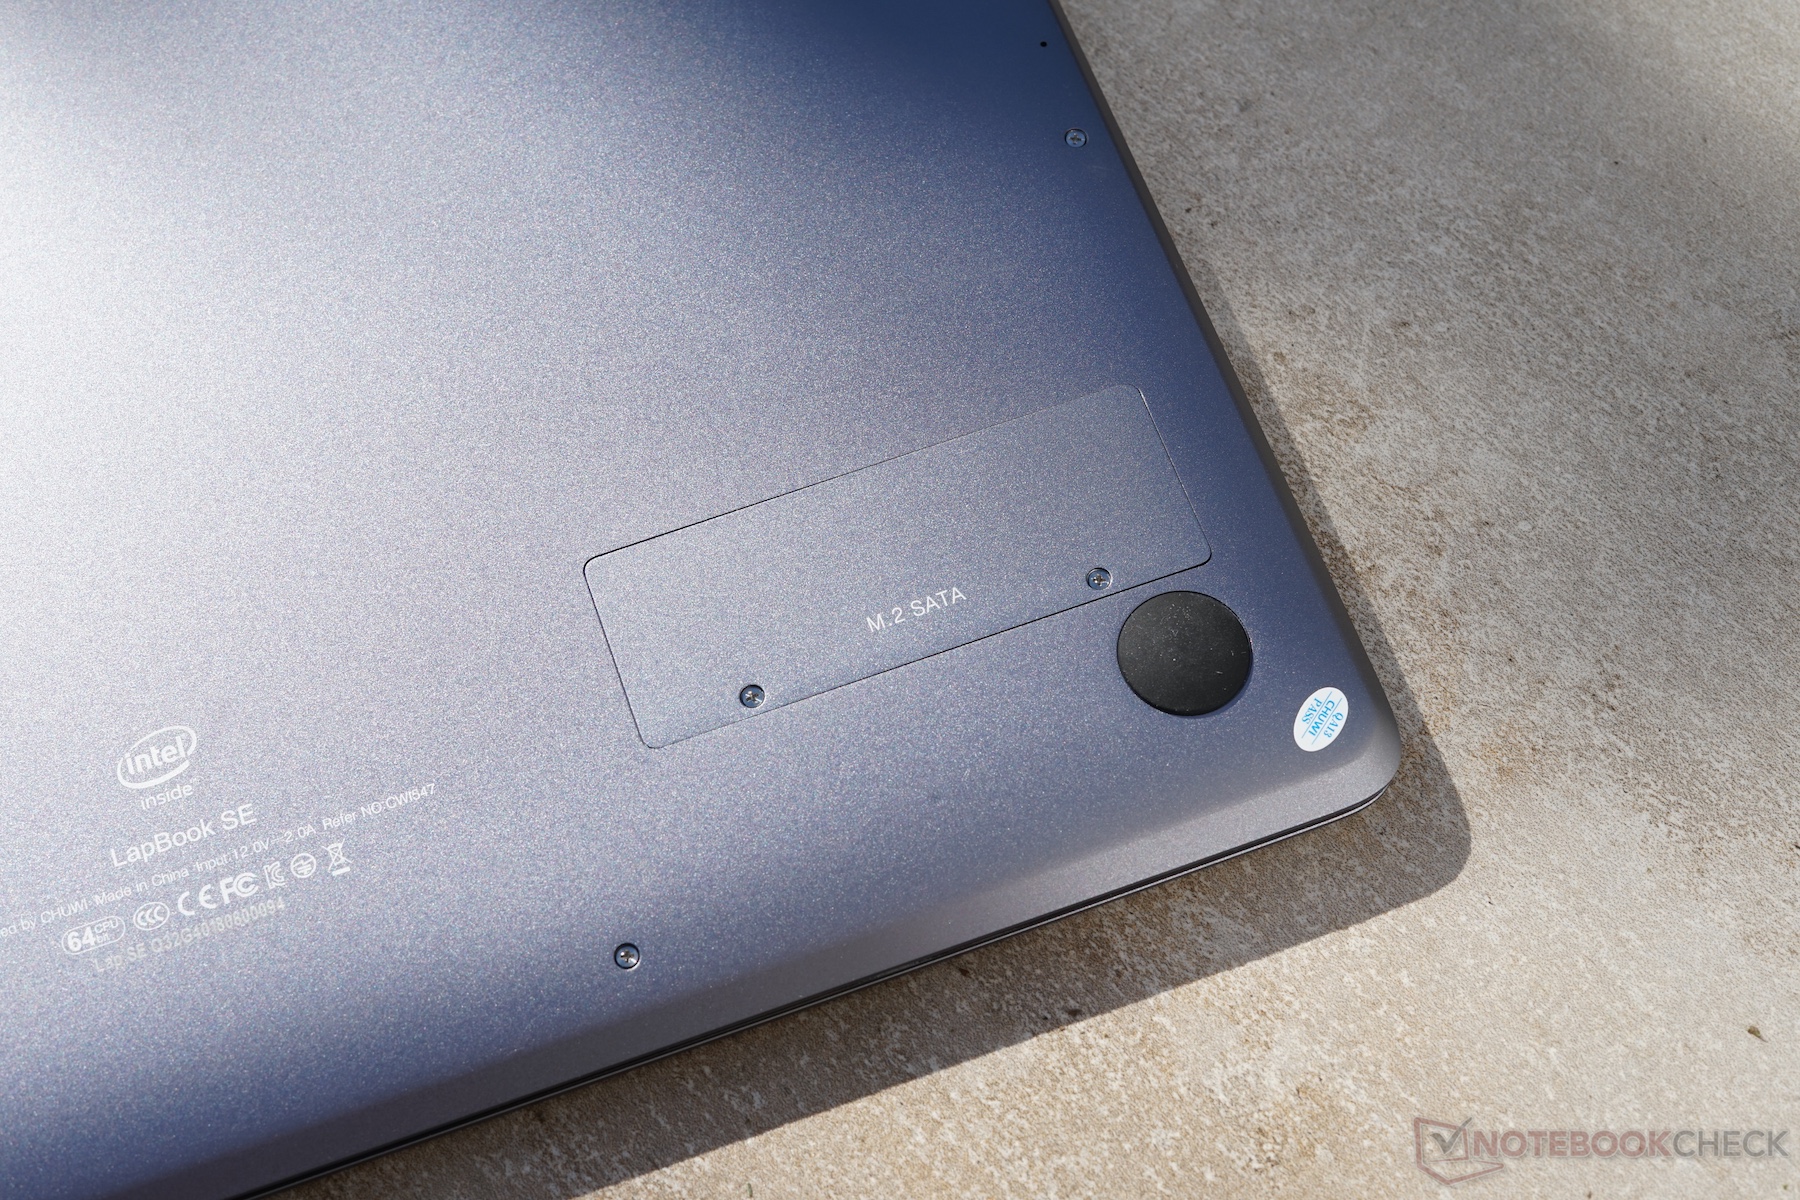
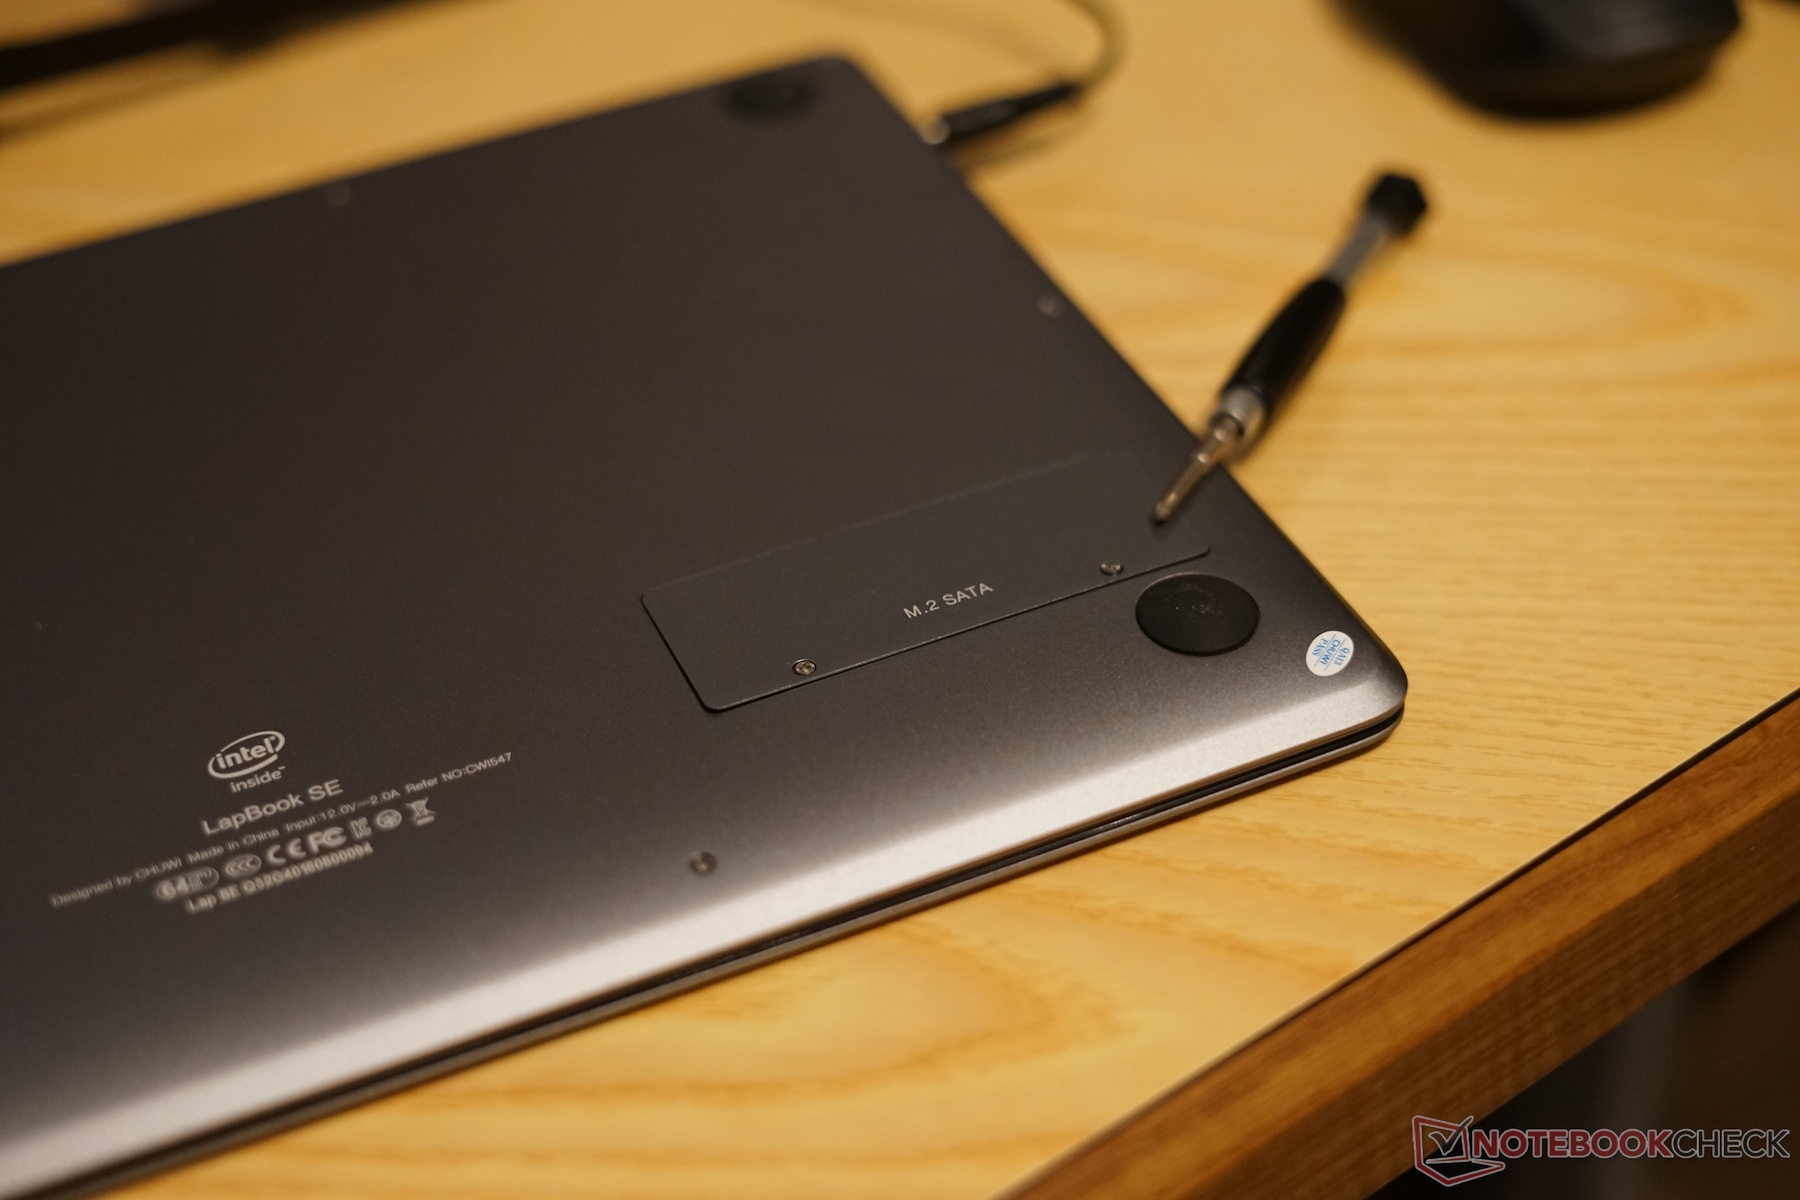
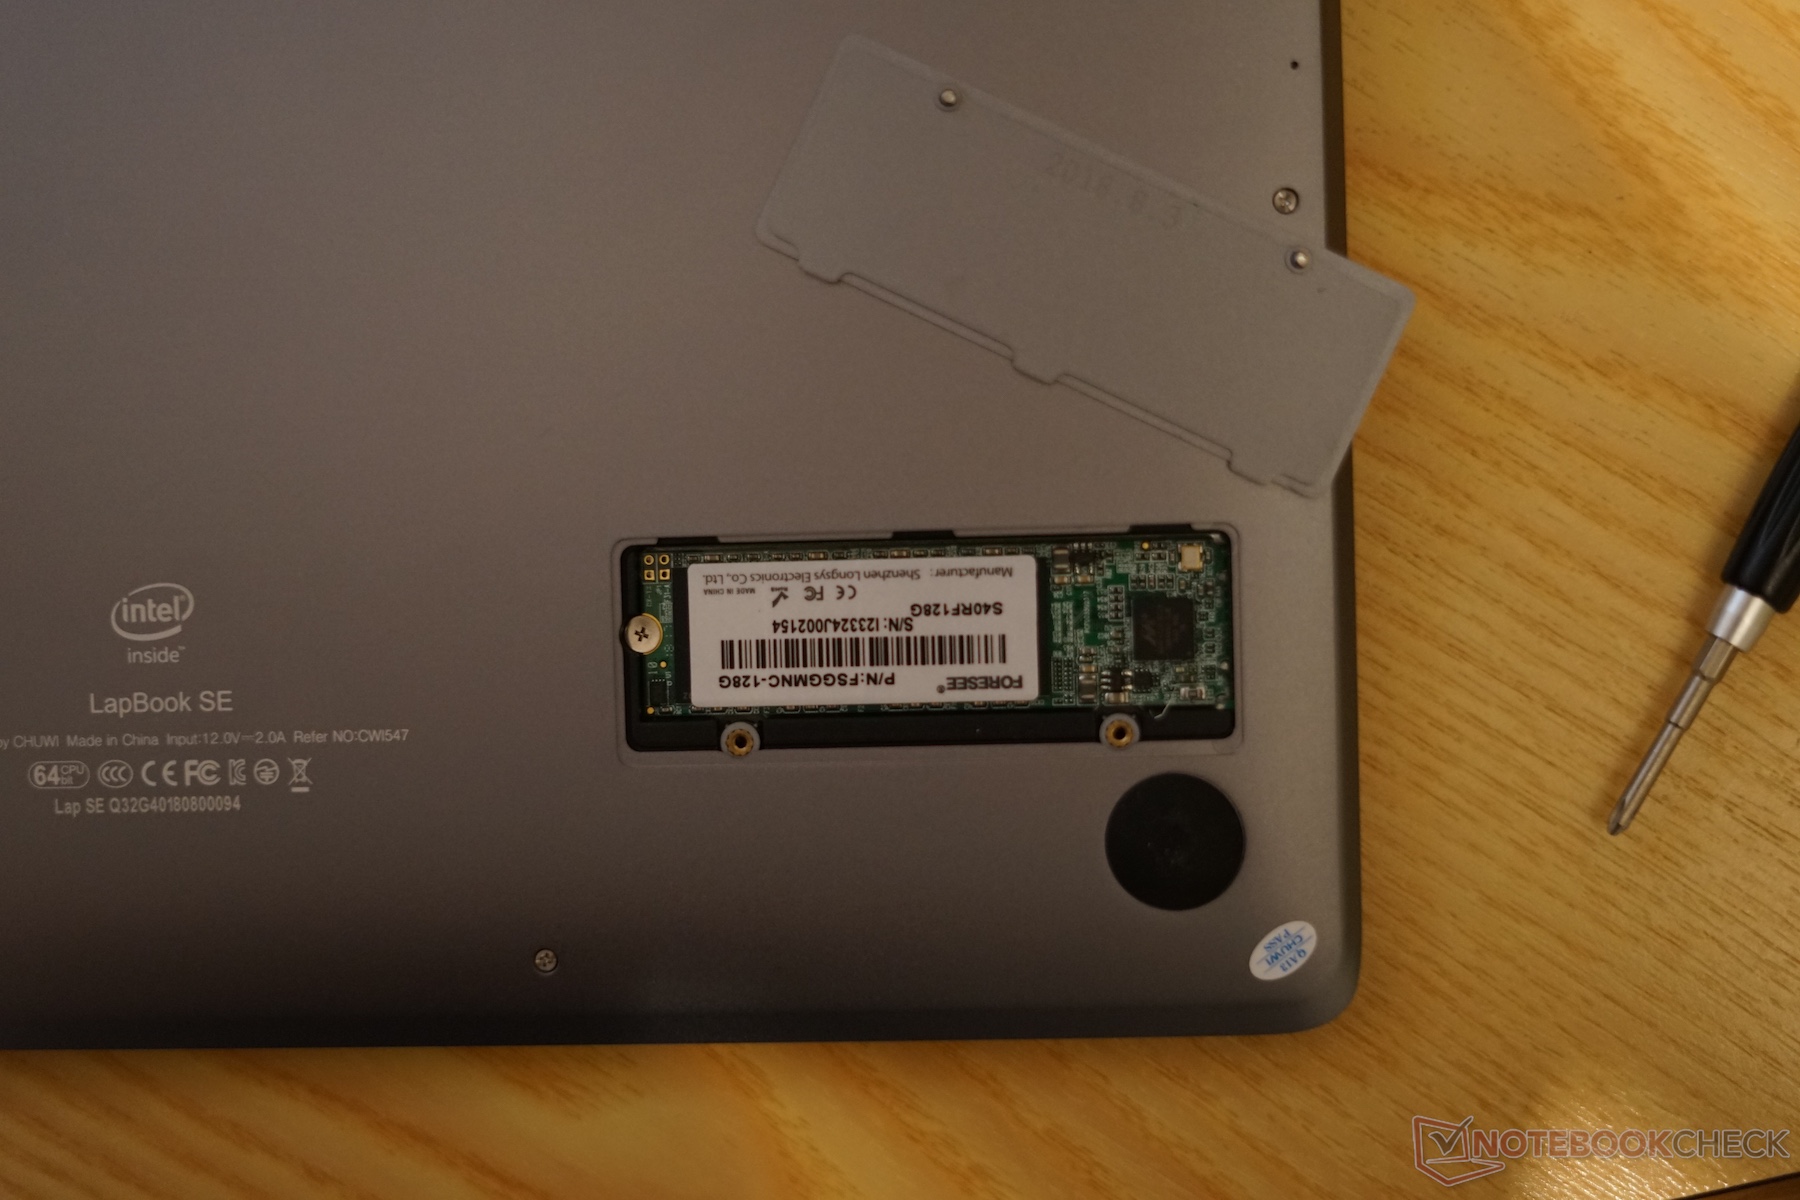
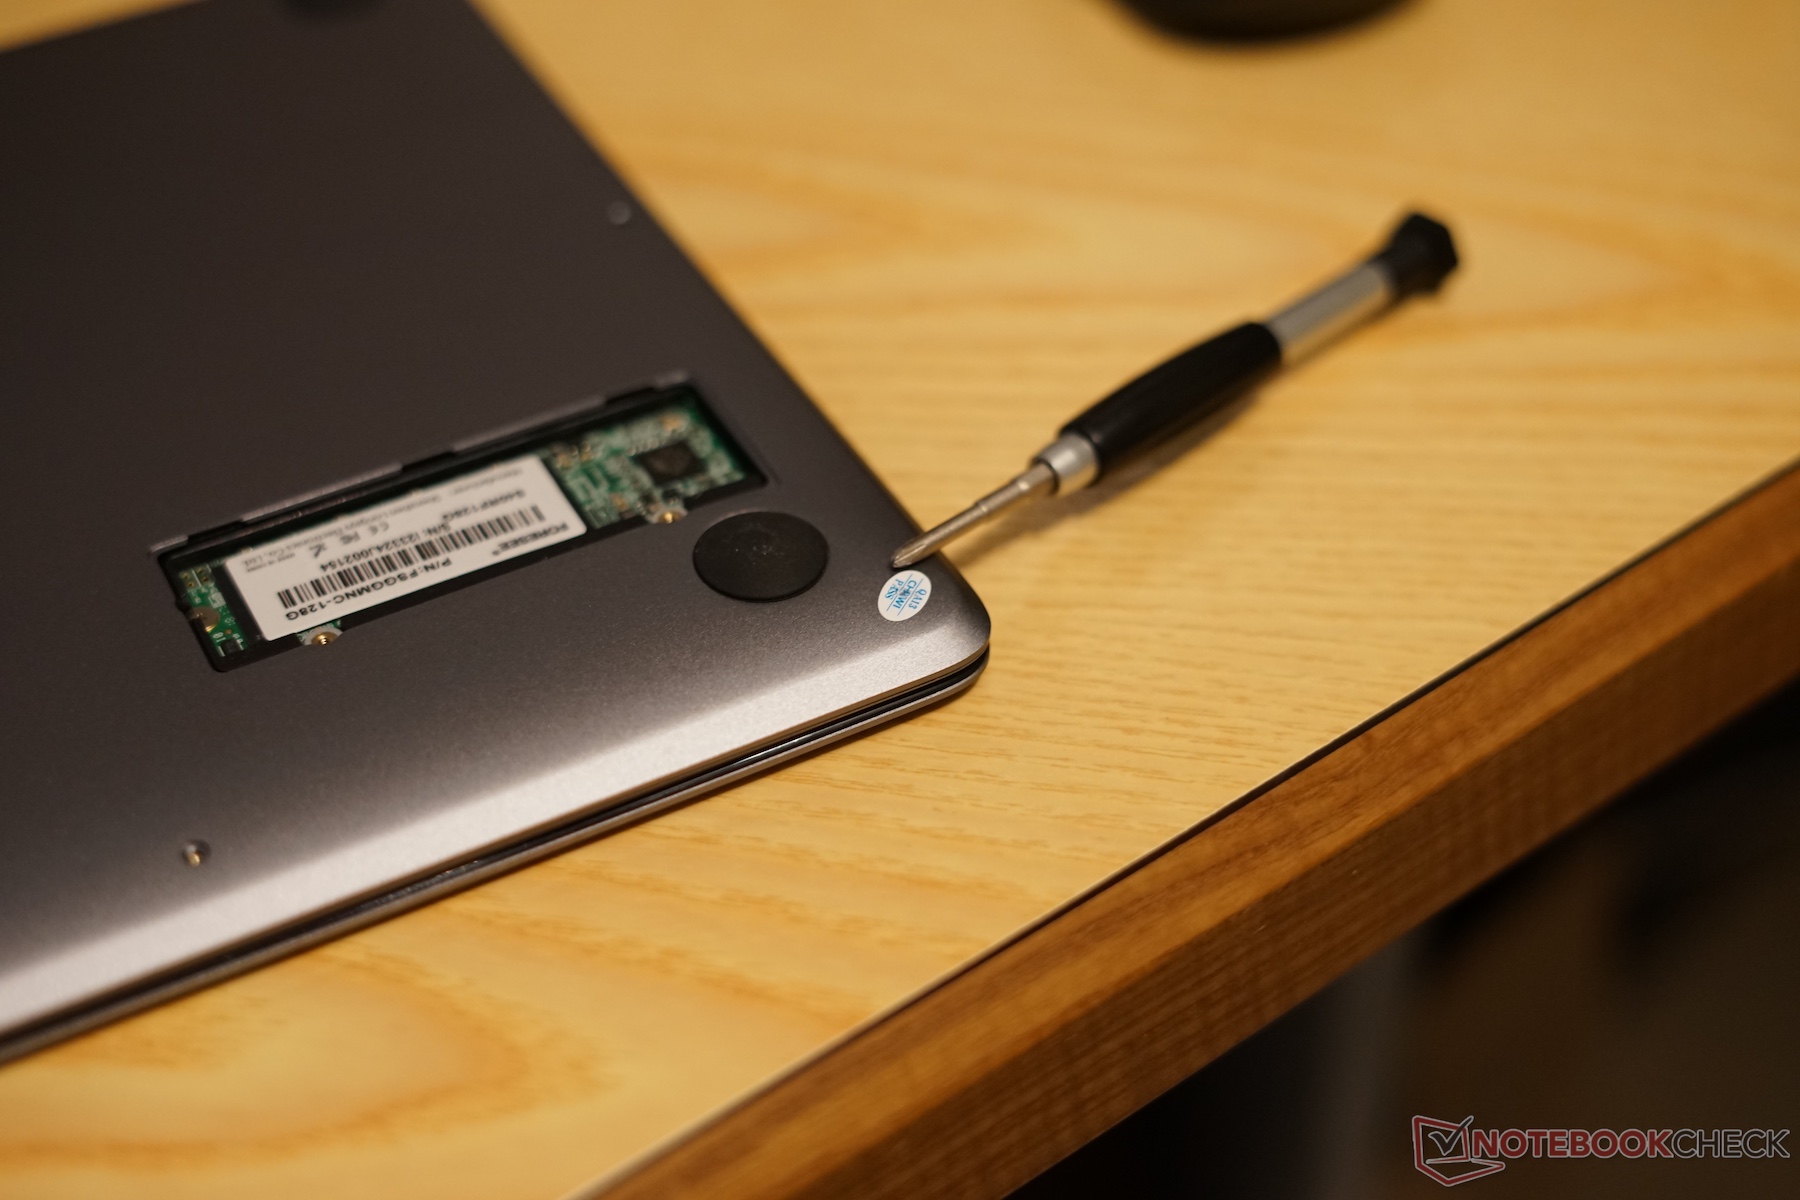
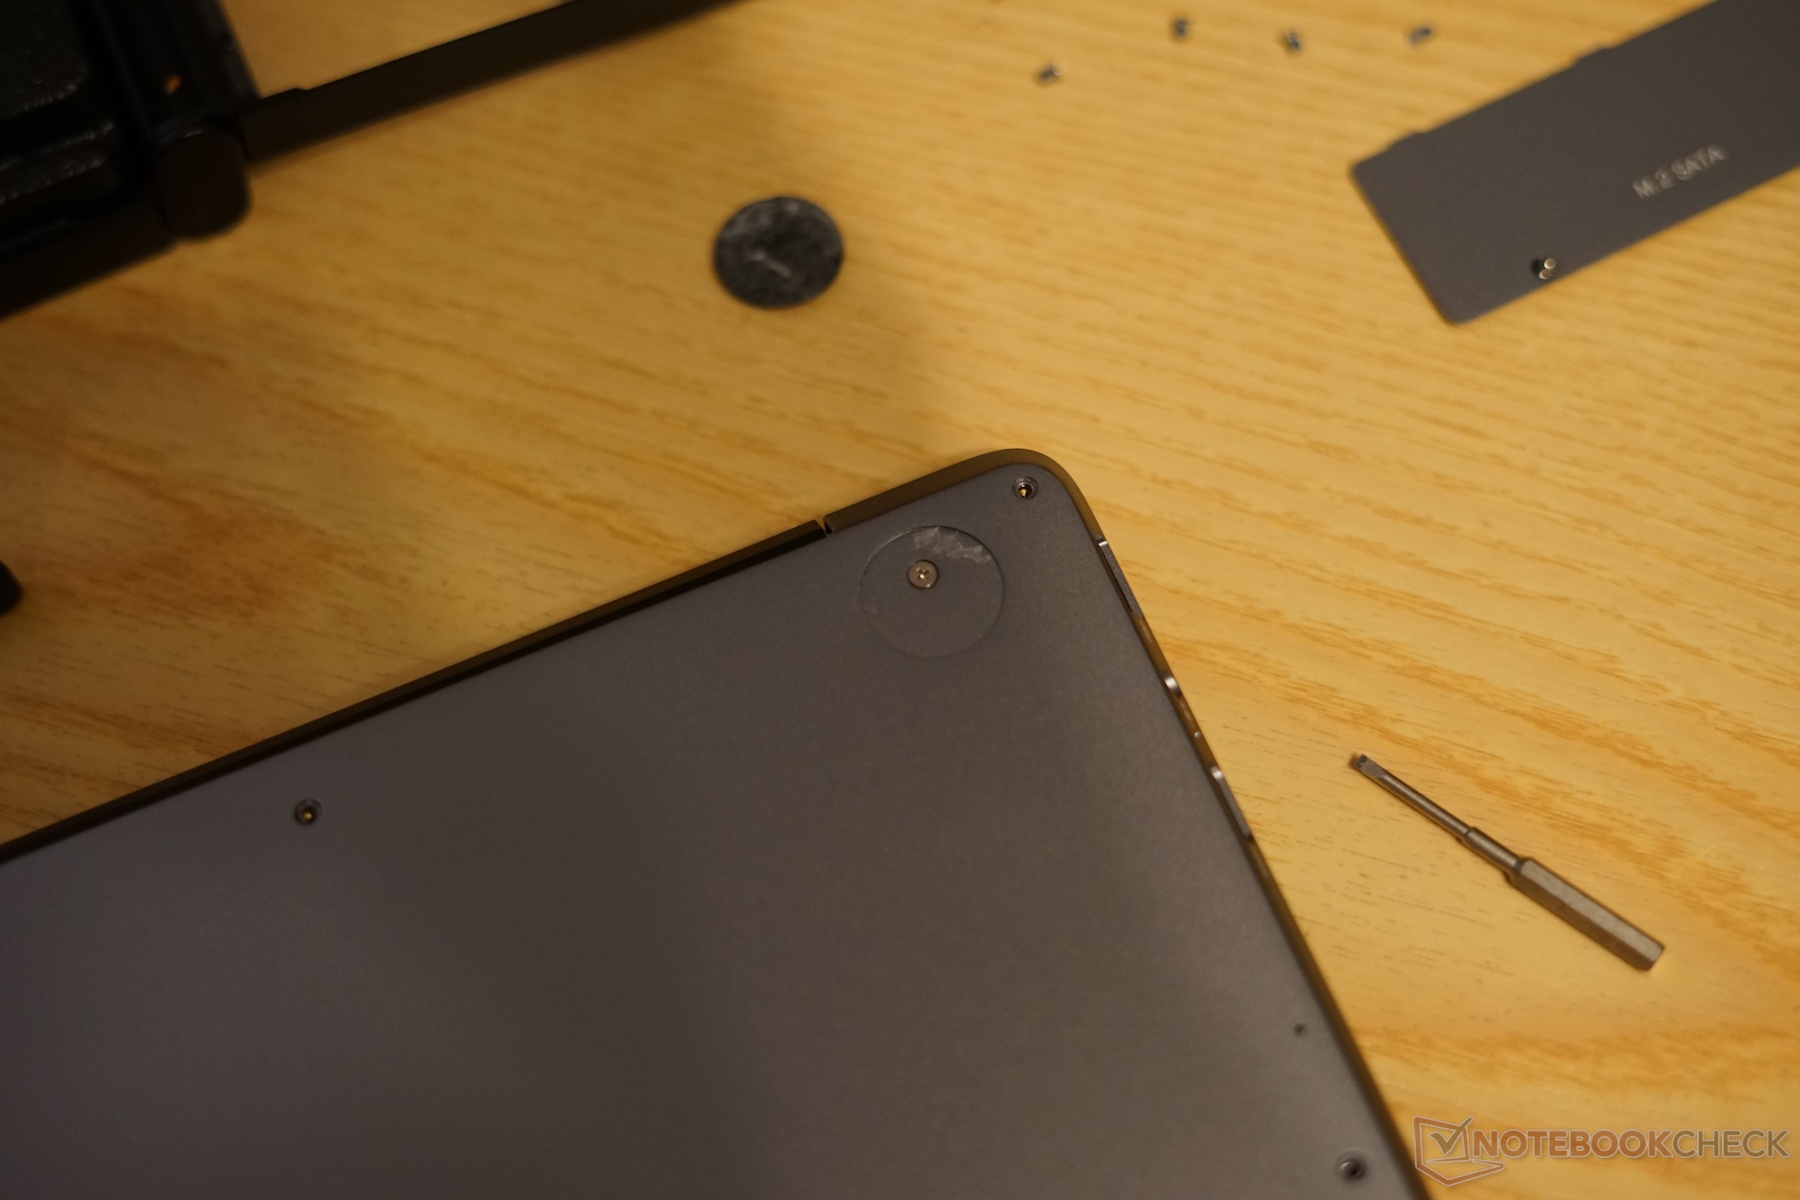
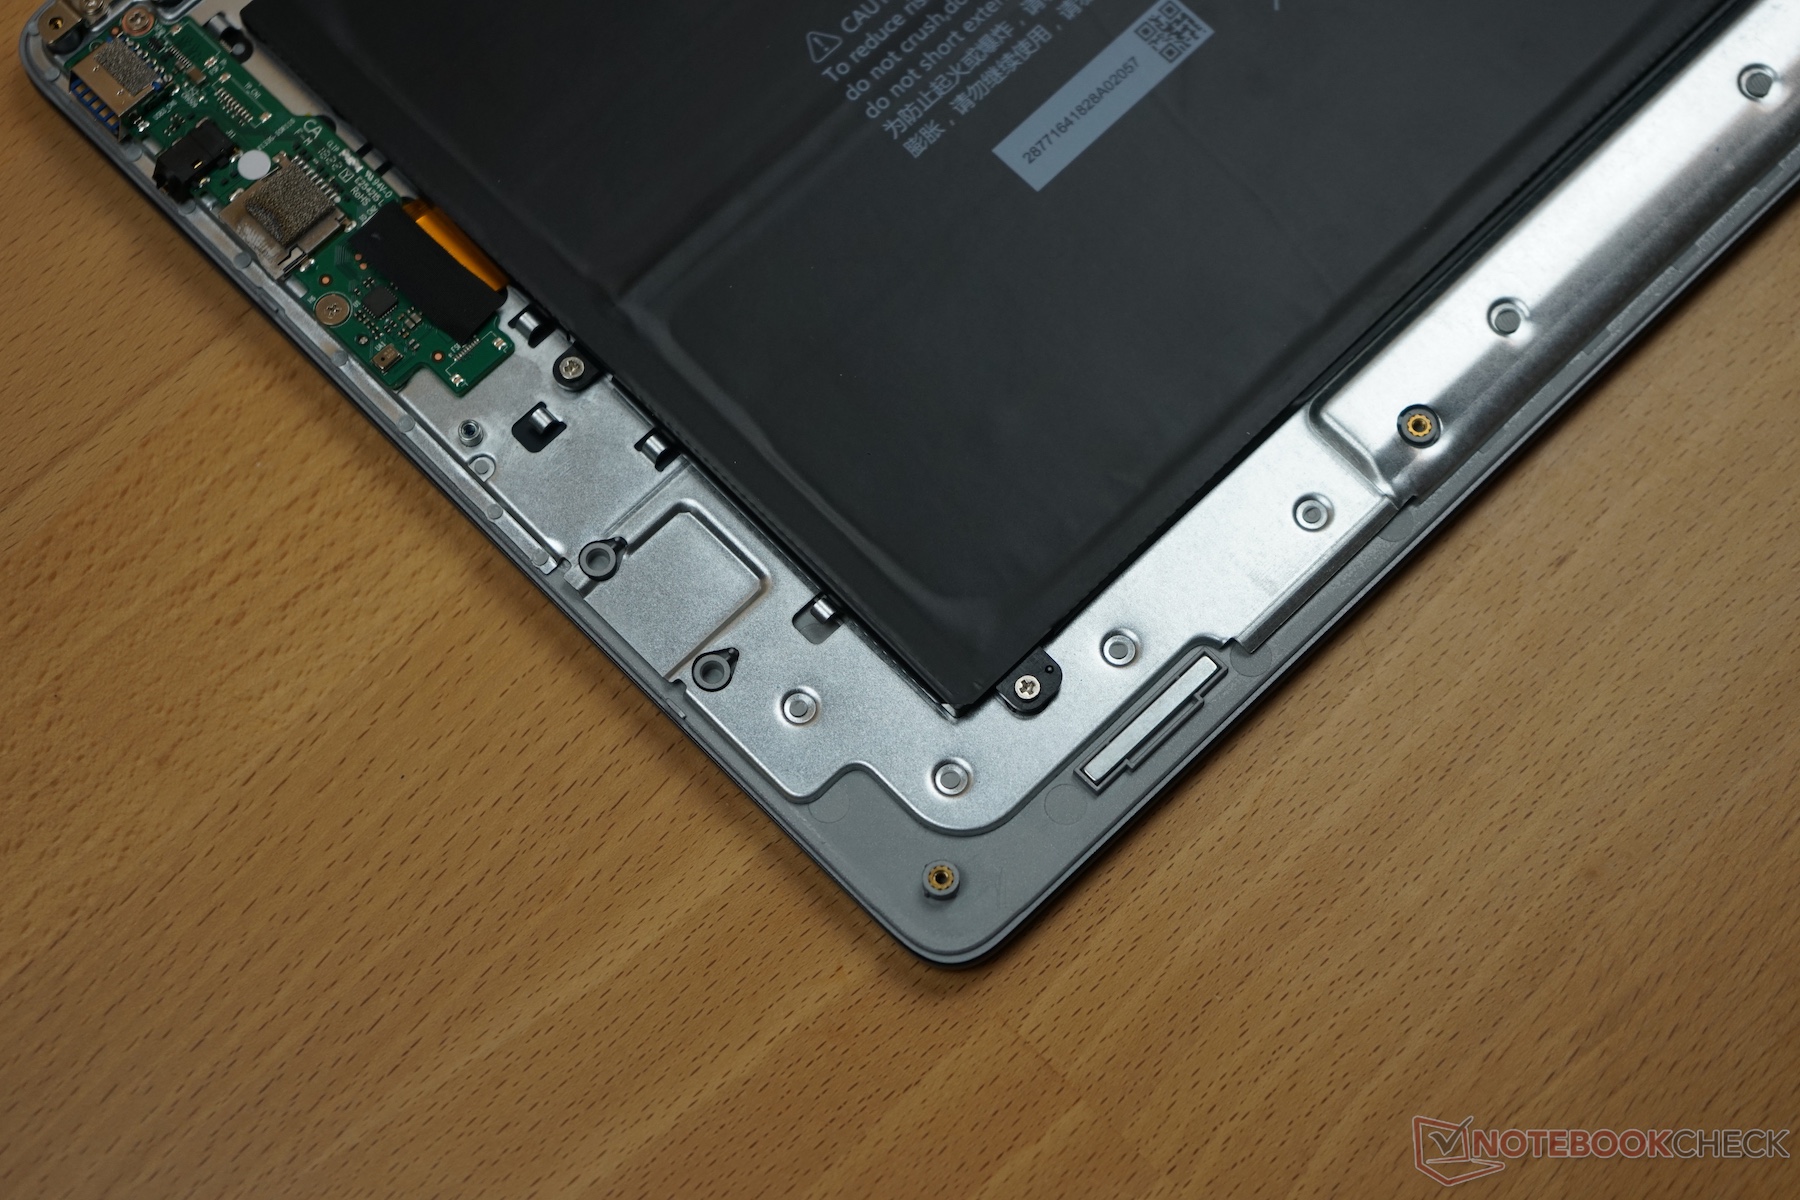
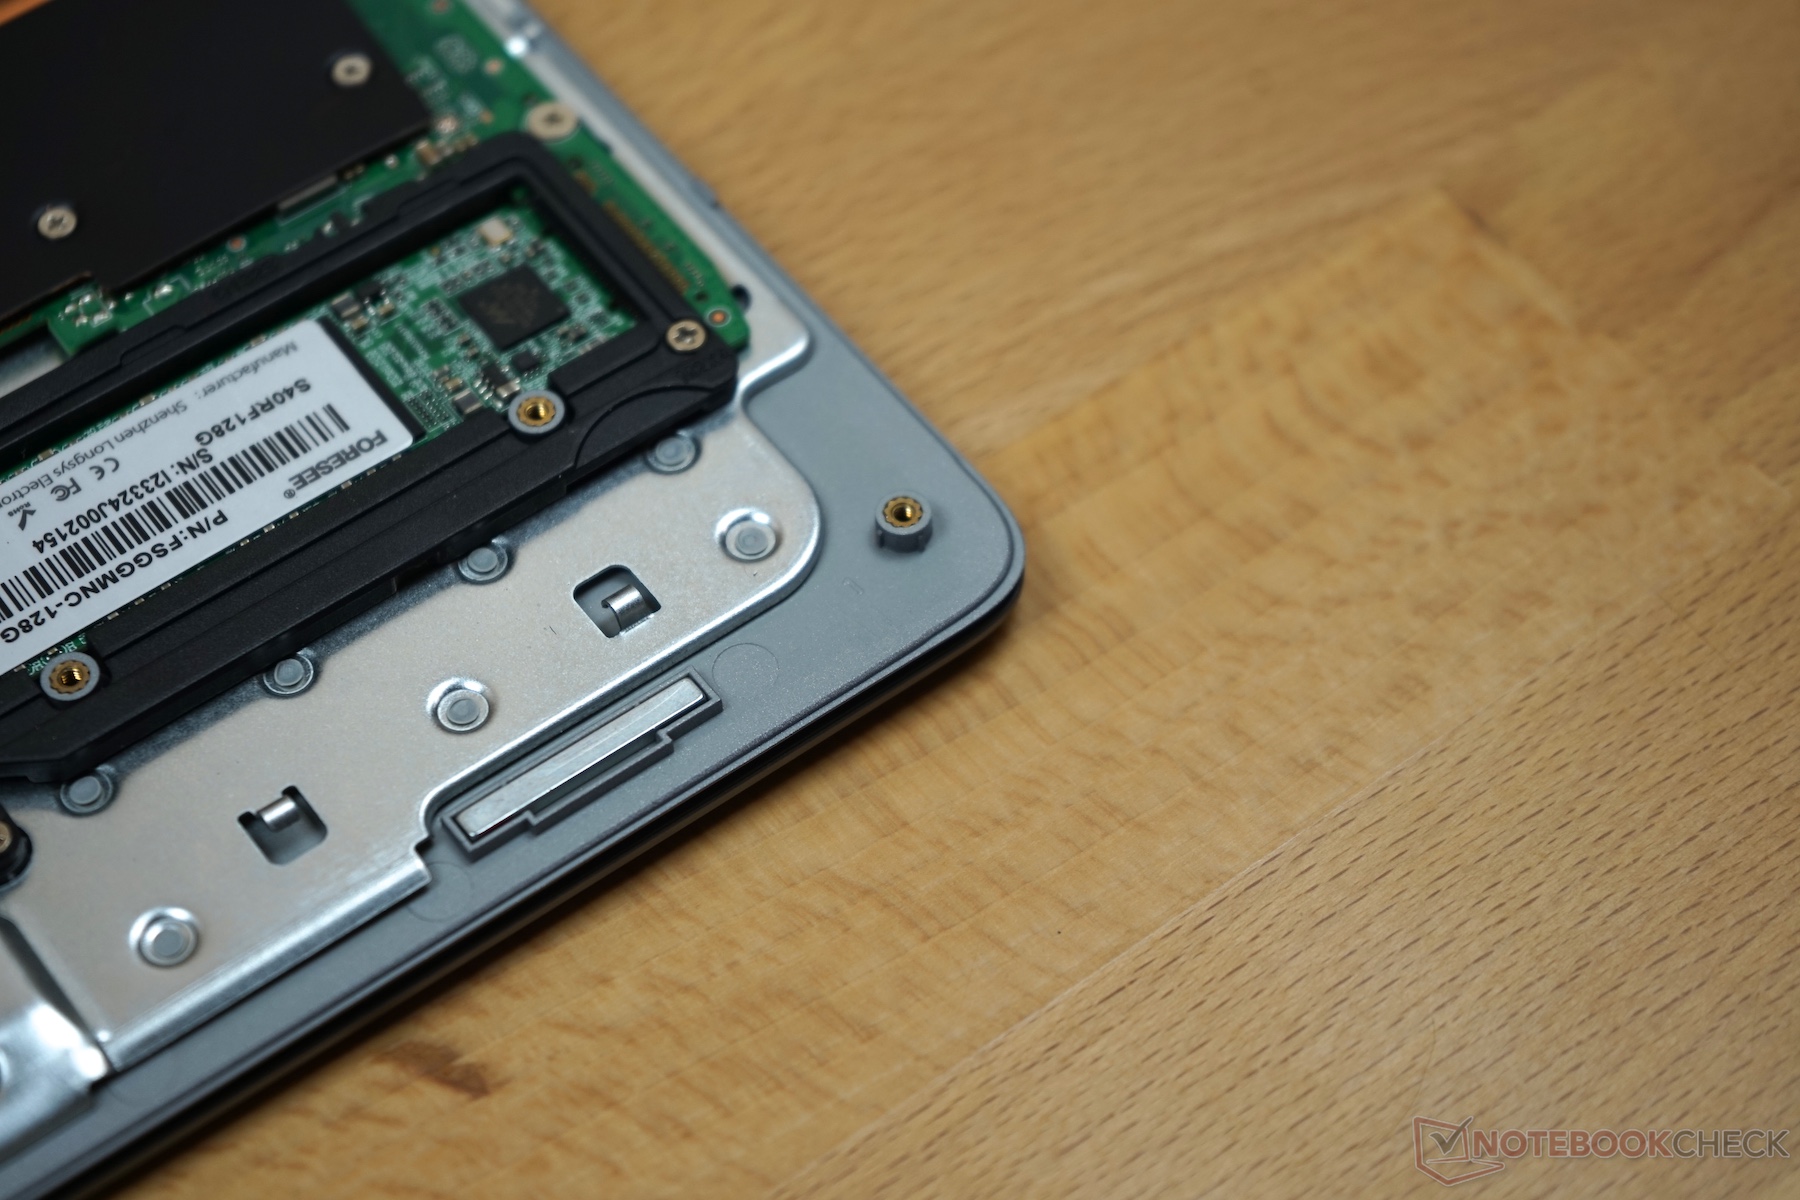
Our test device has a small maintenance flap on its underside labeled “M.2 SATA”, which is secured by two Phillips screws. Removing the flap reveals the device’s M.2 drive bay and the default 128 GB FORESEE SSD, which is quick and easy to remove. The rest of the bottom case is simple to take off too and requires removing twelve other Phillips screws. No spudger is required but be sure to remove the two screws under the rear feet and the one hidden behind the QA sticker.
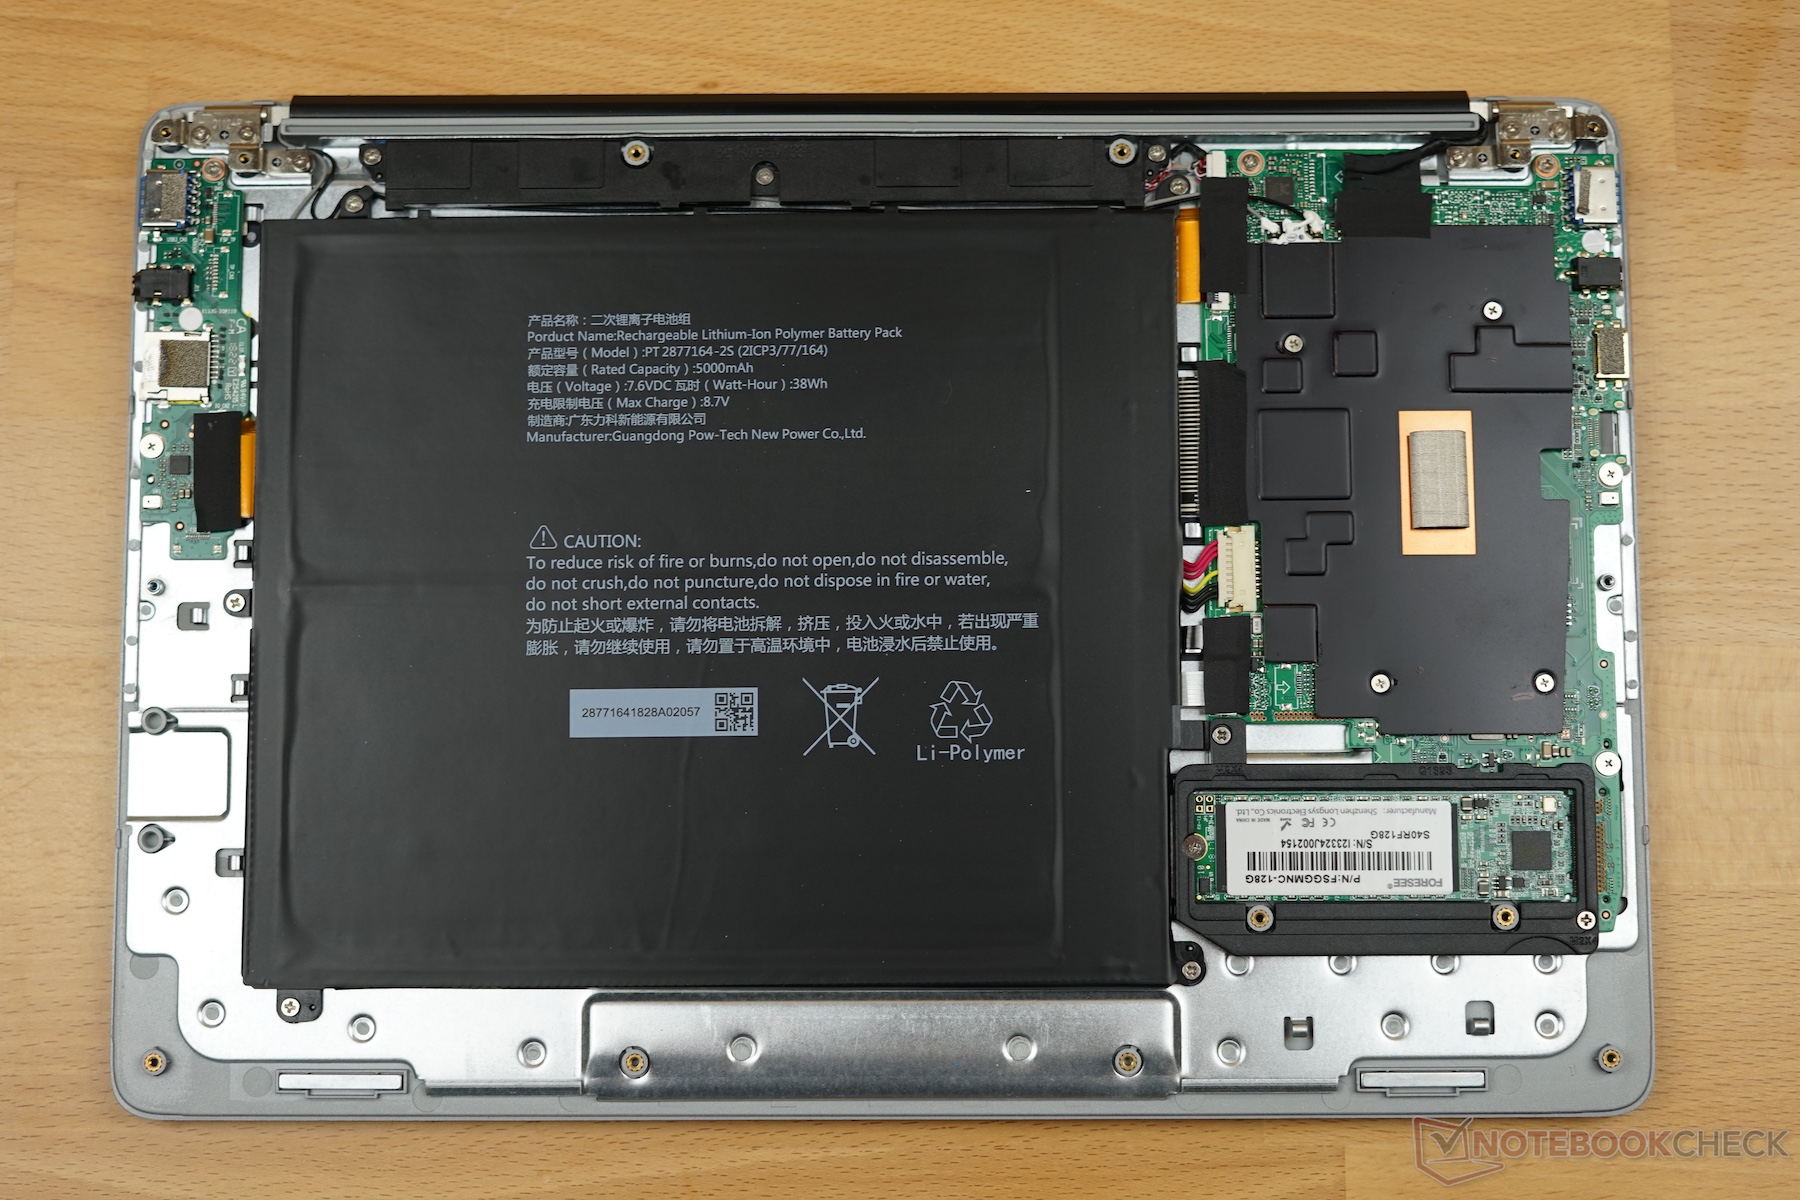
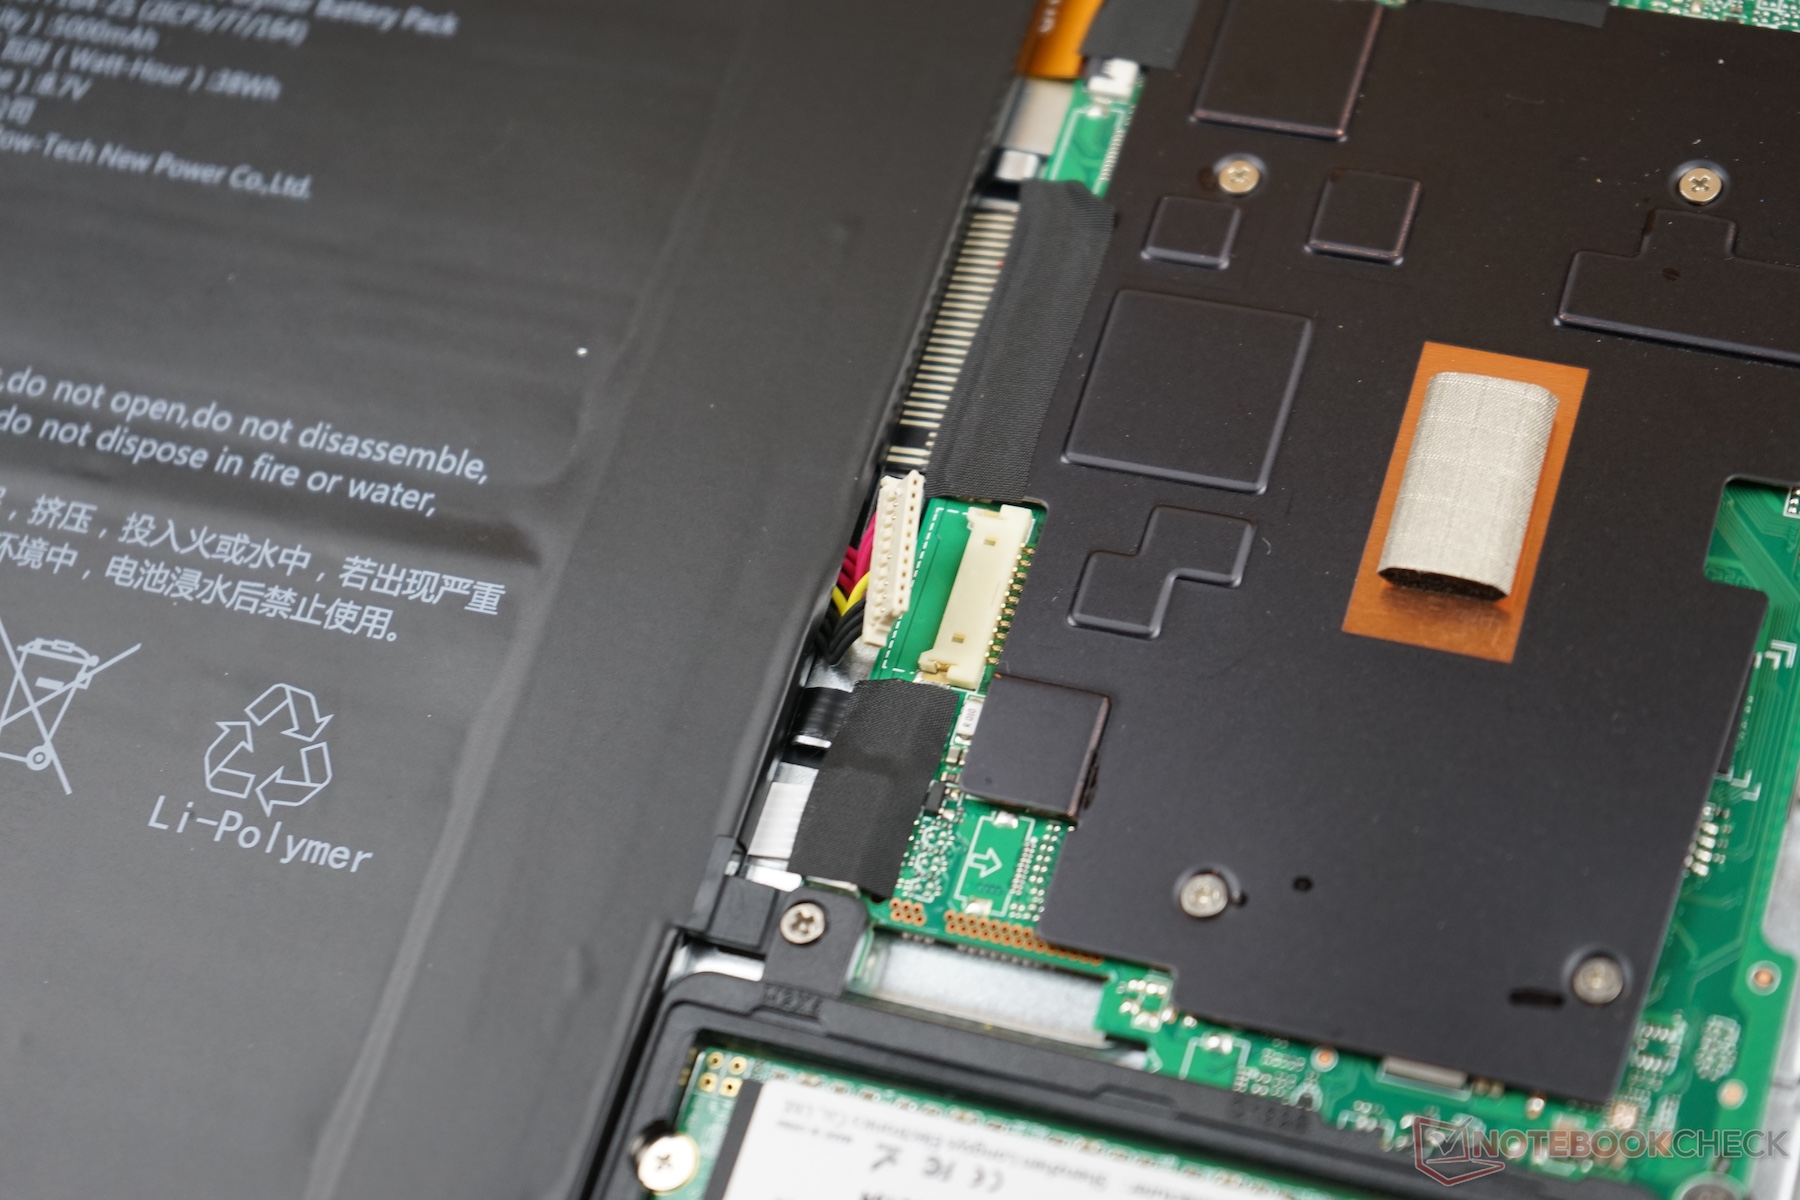
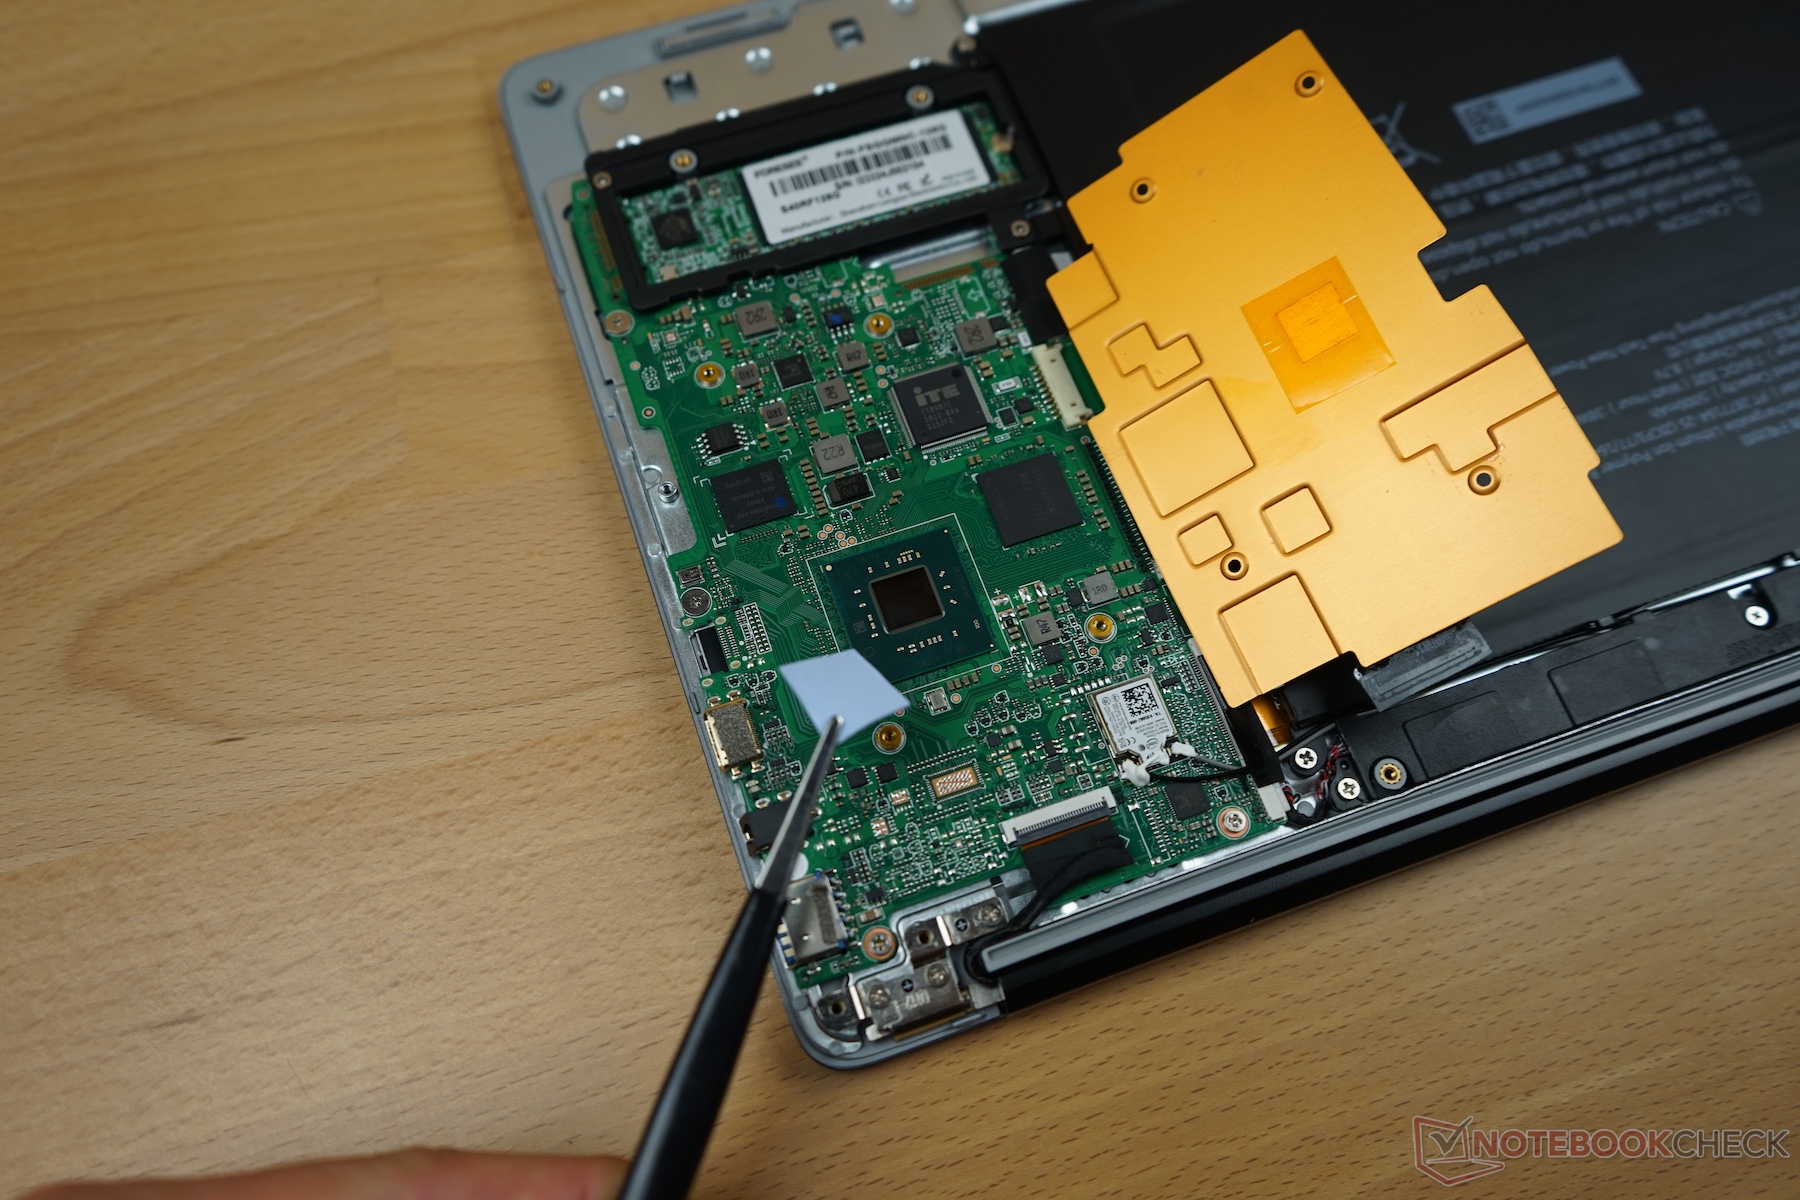
Removing the bottom case reveals the rest of the LapBook SE’s components, but the eMMC memory and RAM are soldered to the motherboard, and the device has no fan to clean. The heatsink is removable too with just four screws holding it to the motherboard. We could not see any way to modify our test device’s cooling solution to dissipate heat onto the aluminum case though.
Warranty
Our test device comes with a one-year limited warranty from Gearbest, but we do not know of any Chuwi warranty. Please see our Guarantees, Return policies and Warranties FAQ for country-specific information.
Input Devices
Keyboard
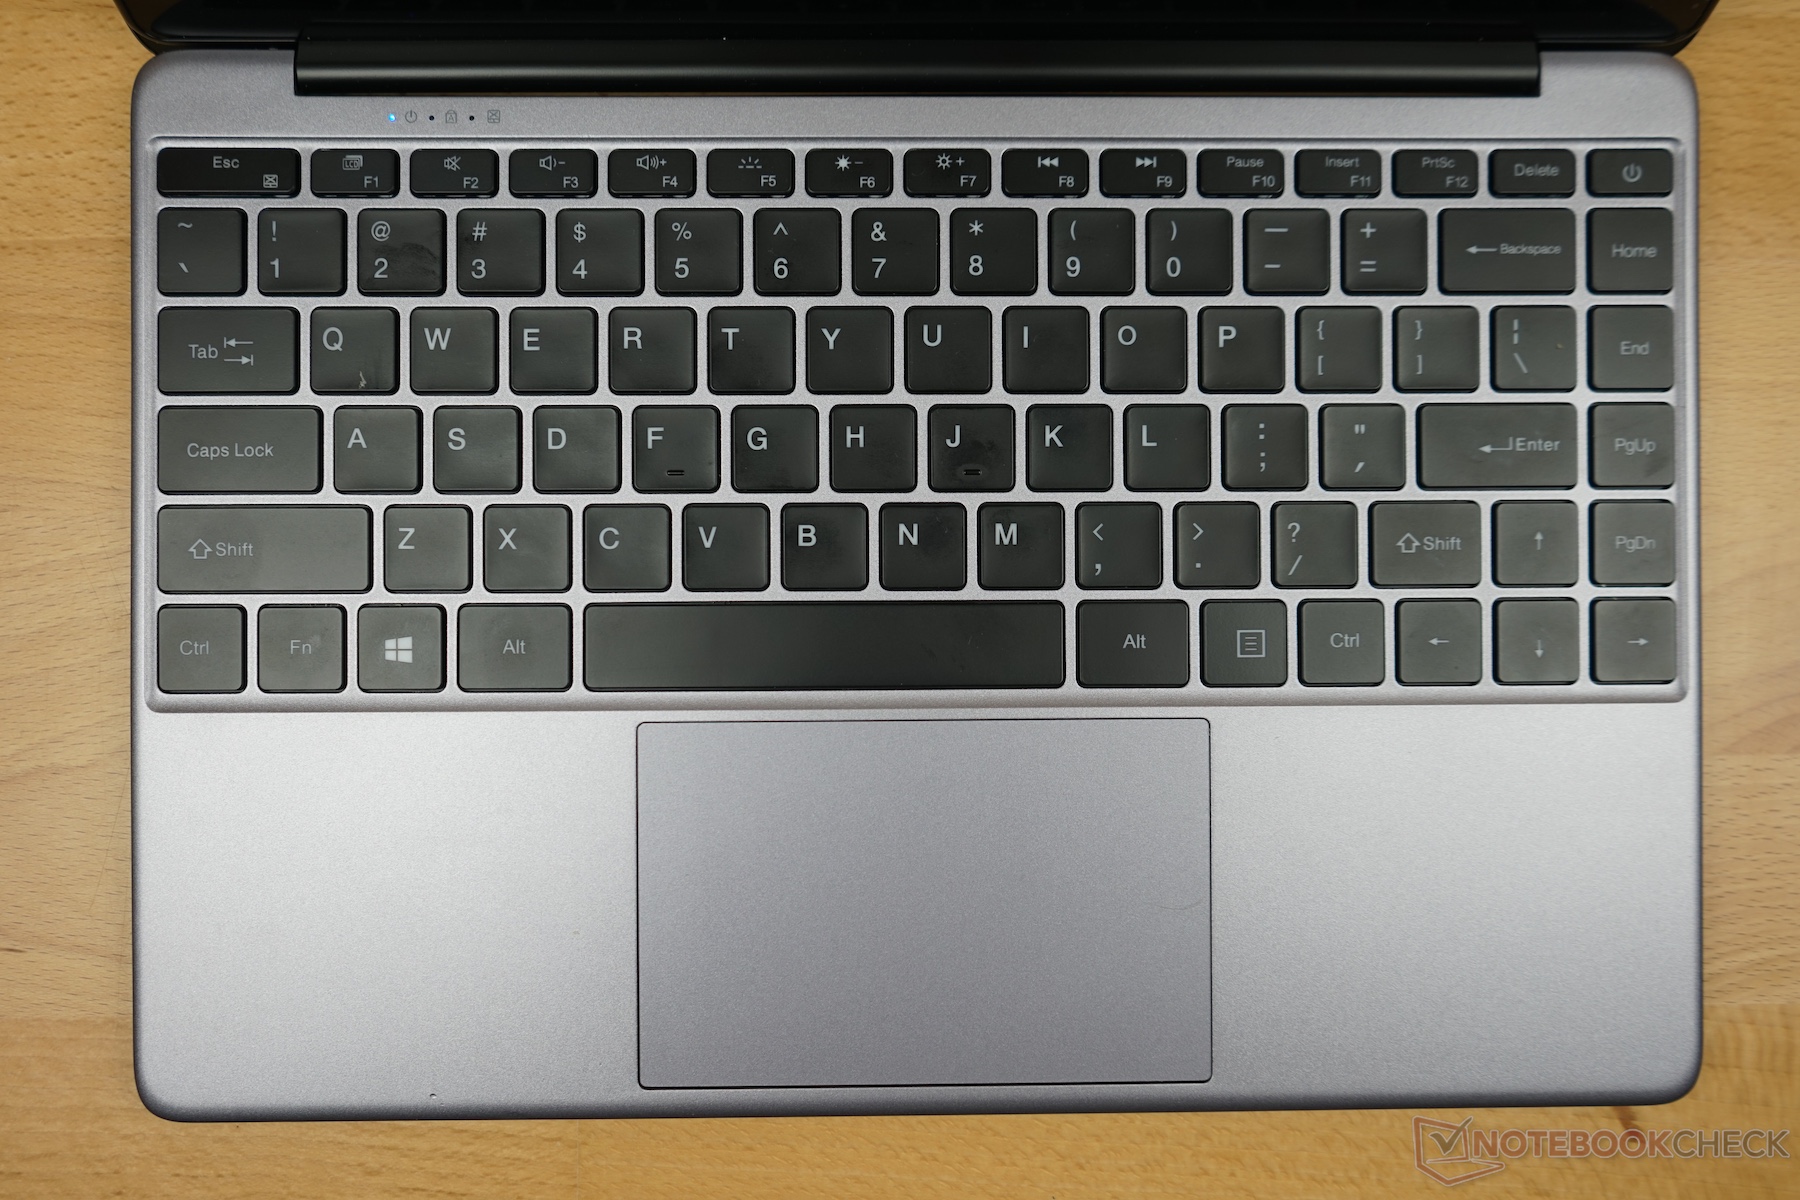
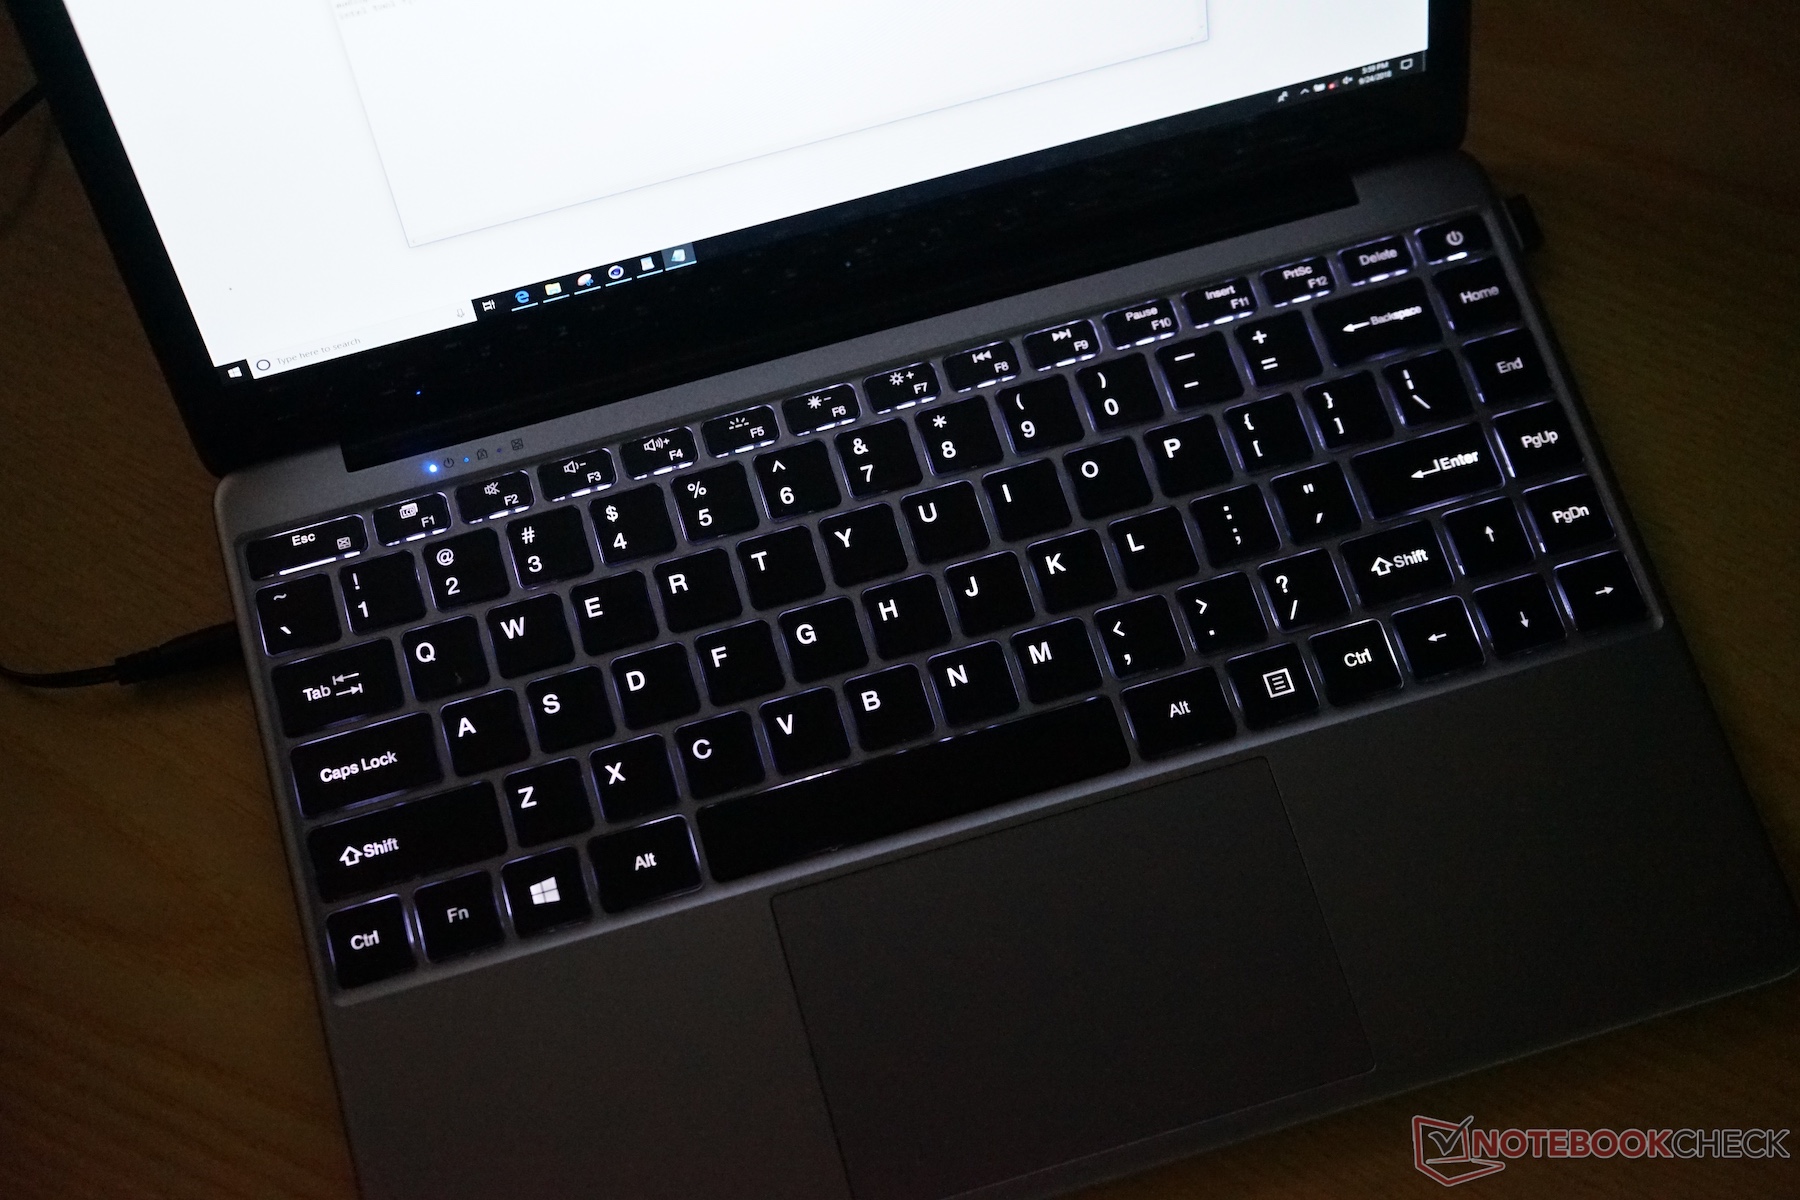
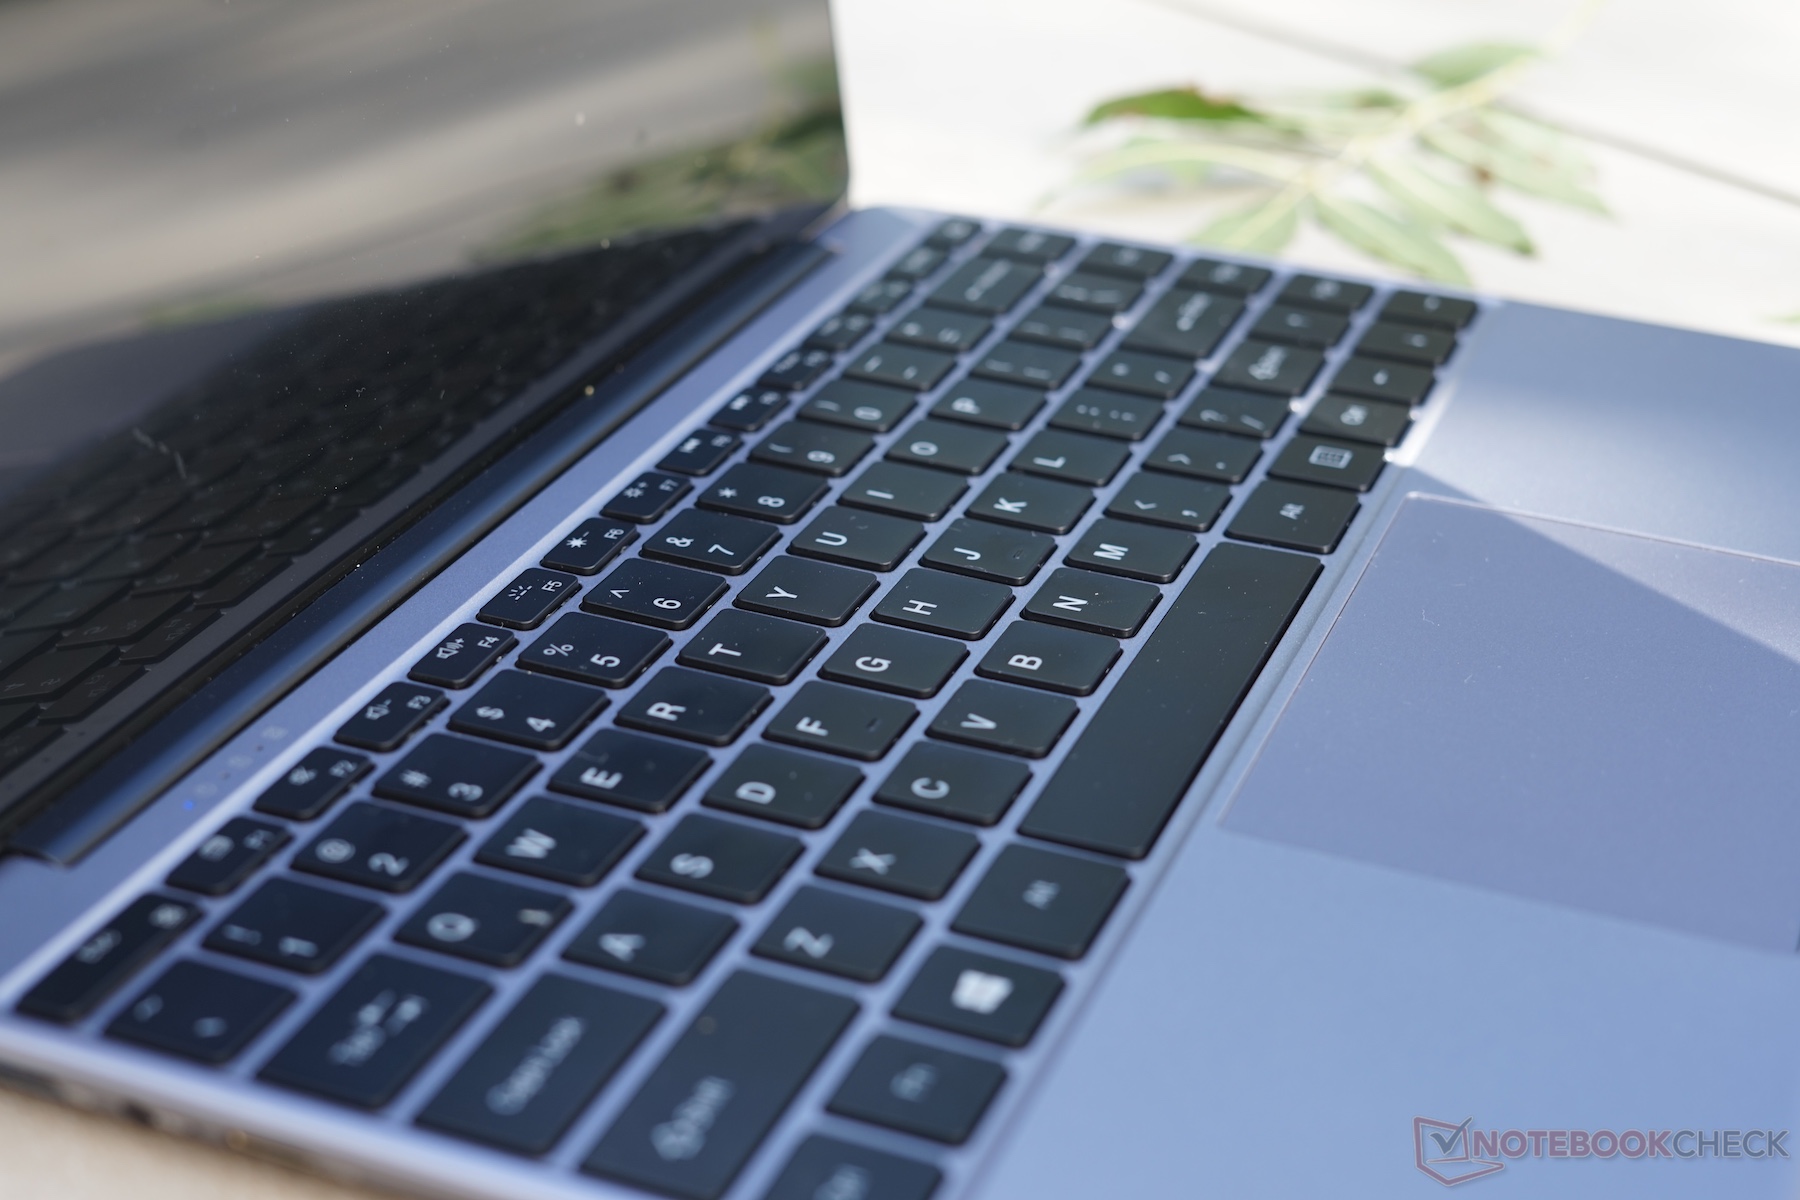
The chiclet keyboard uses the full width of the case and has both a good layout and well-sized keys. The key travel is rather short but is good enough for medium-long typing sessions. The keys look like those used in current MacBooks, but they have a typical scissor switch rather than the butterfly ones that Apples uses. The keyboard has two-stage keyboard backlighting too.
Touchpad
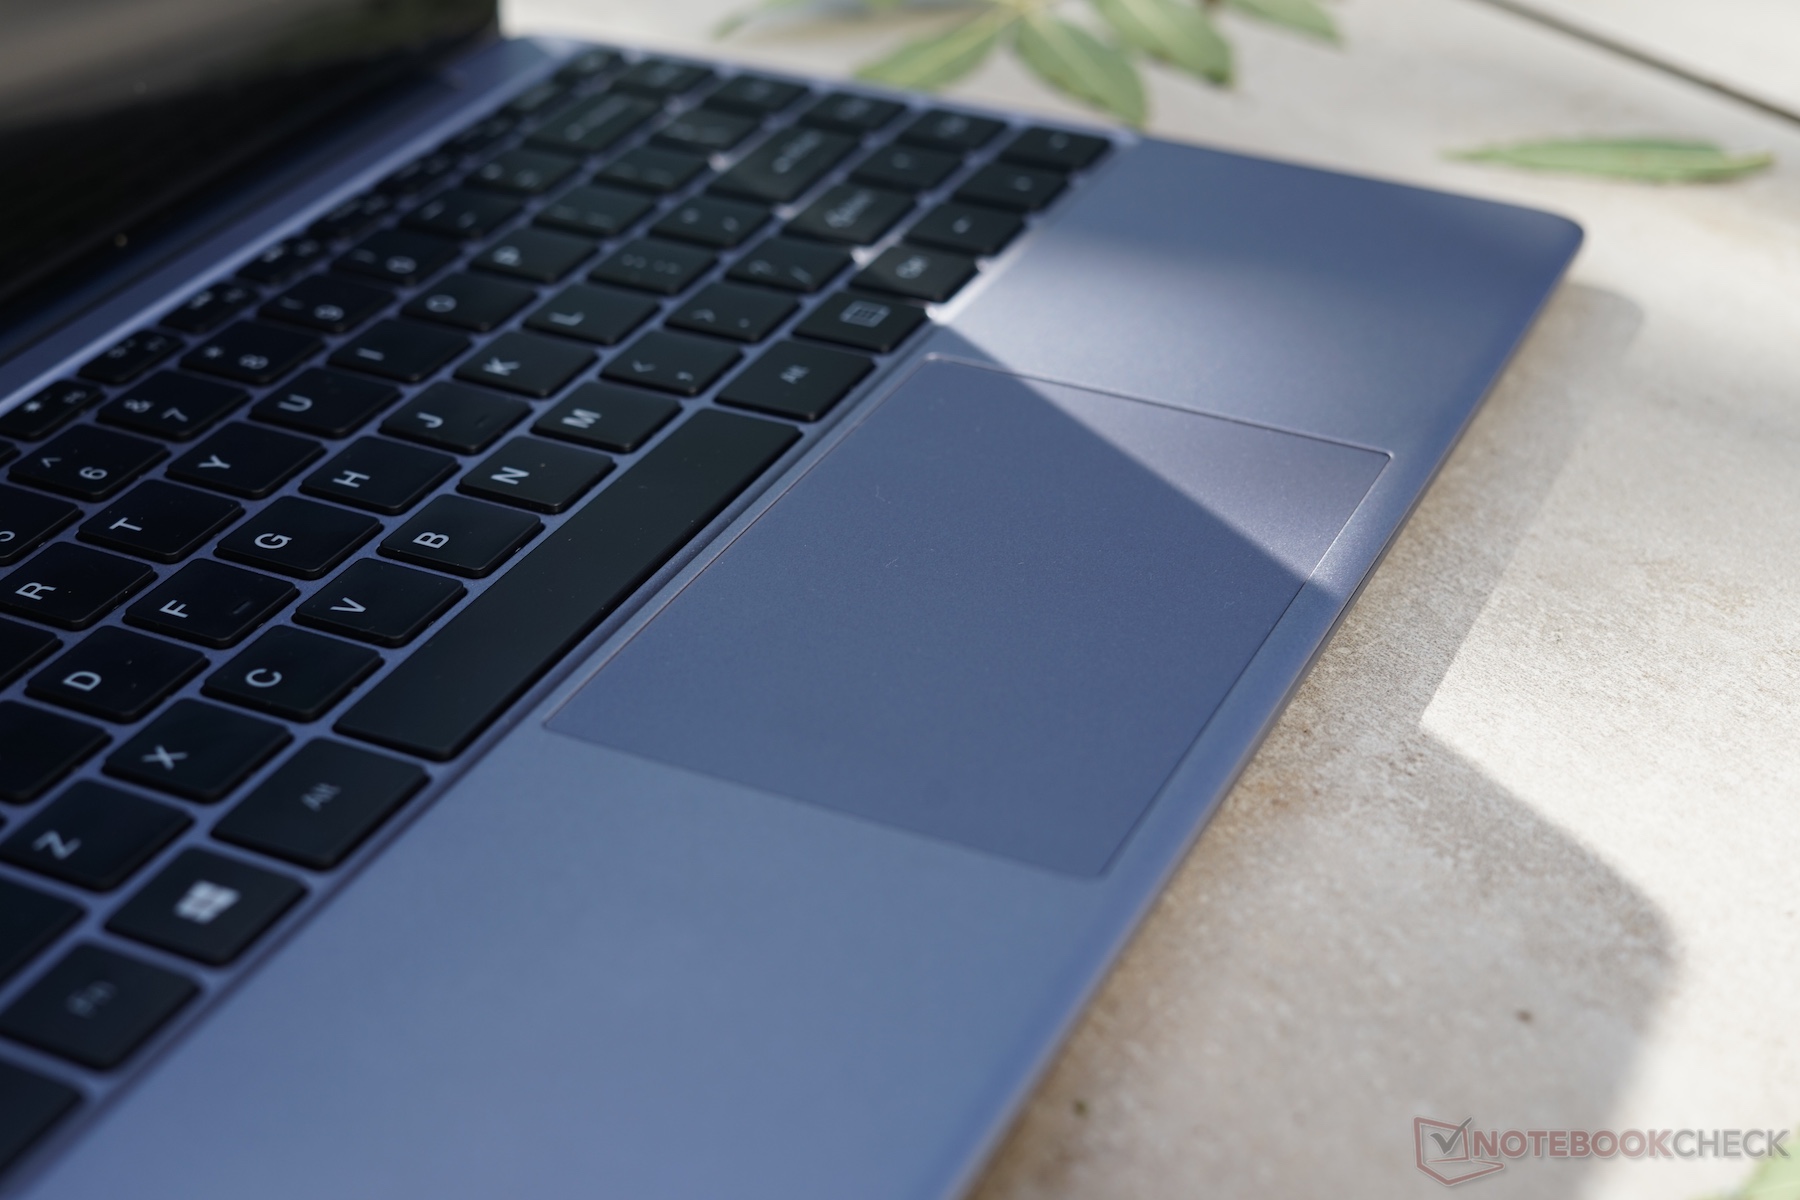
The LapBook SE has a large Windows Precision plastic touchpad that is easy to use, albeit it is not as smooth as glass touchpads. The touchpad has a hinged button mechanism too, which is not as pleasing to use as dedicated buttons or Apple’s Force Touch touchpads. The hinge mechanism is also so stiff that we practically must use two fingers to generate a click. Overall though, Chuwi has done a better job with the LapBook SE’s touchpad than many other Windows 10 OEMs.
Display
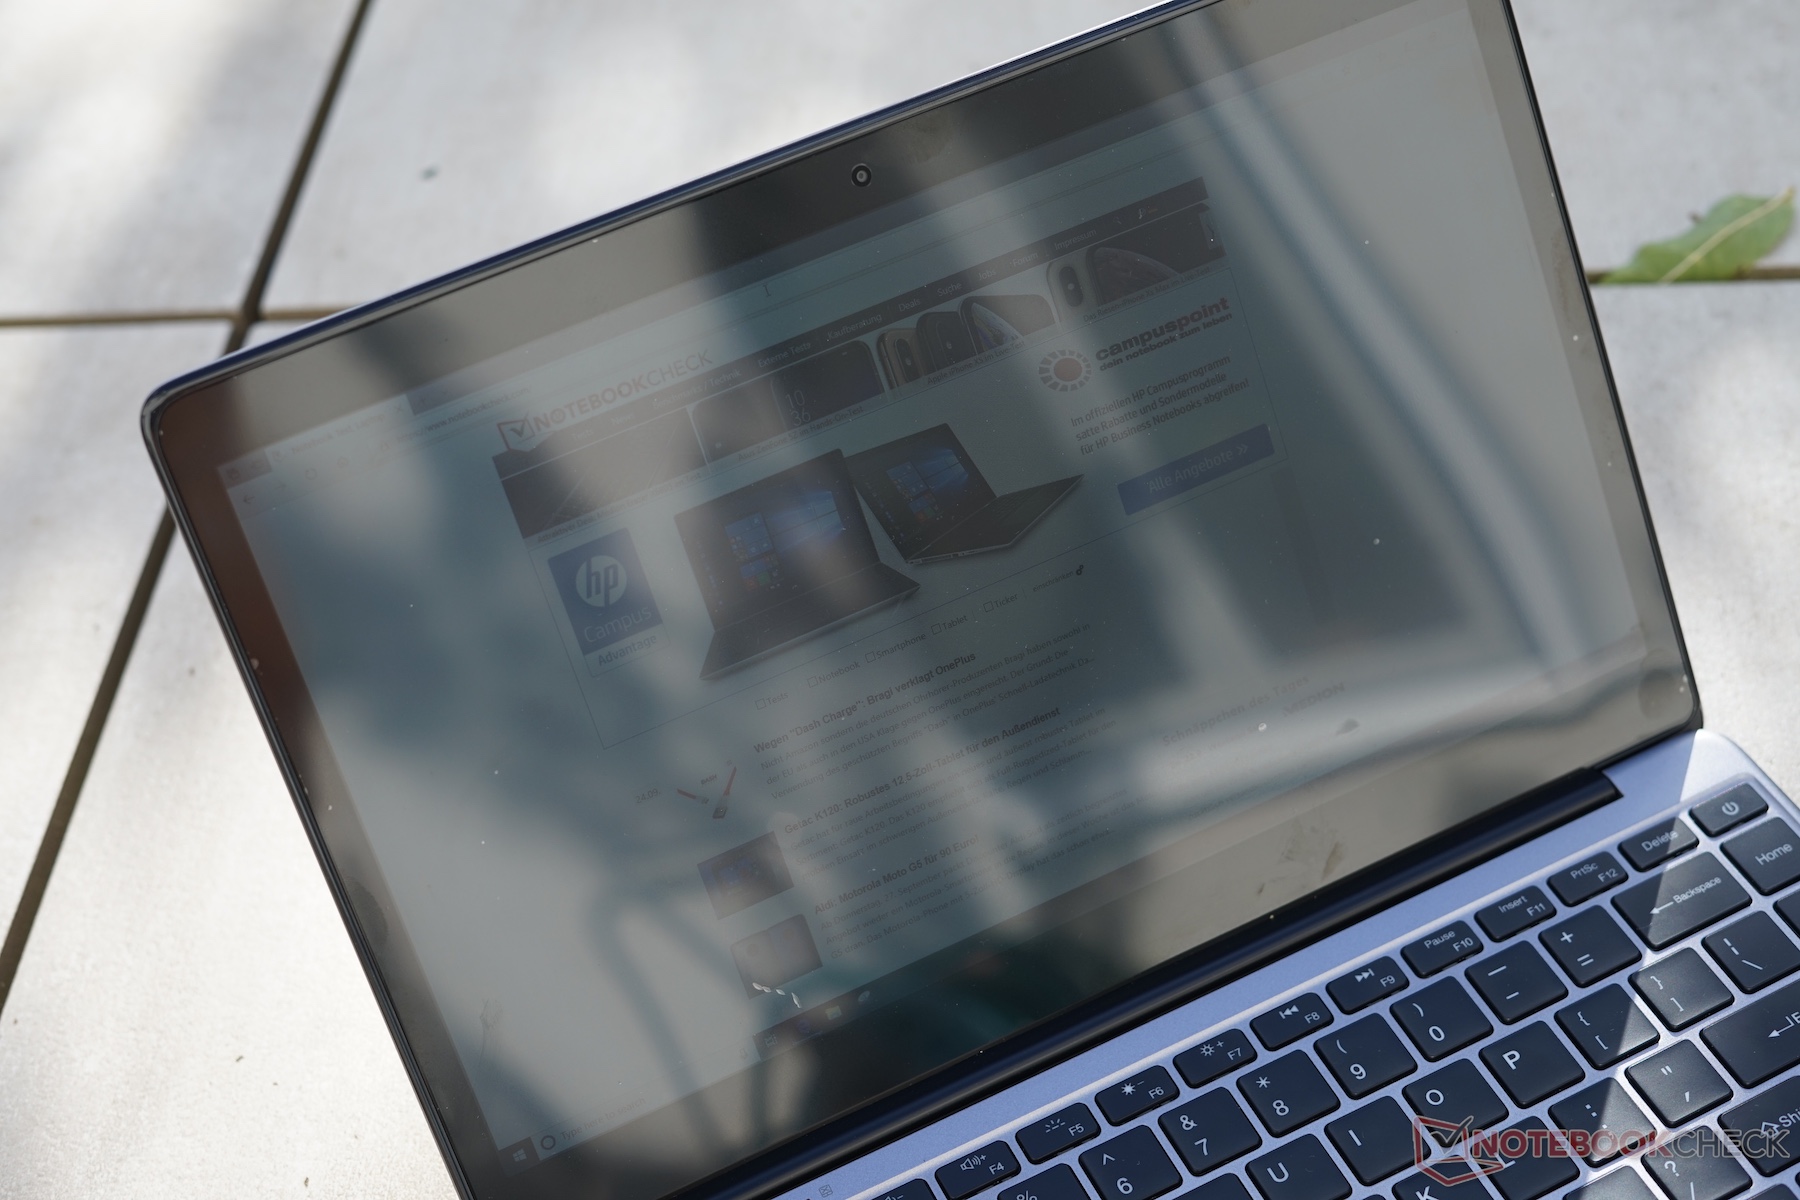
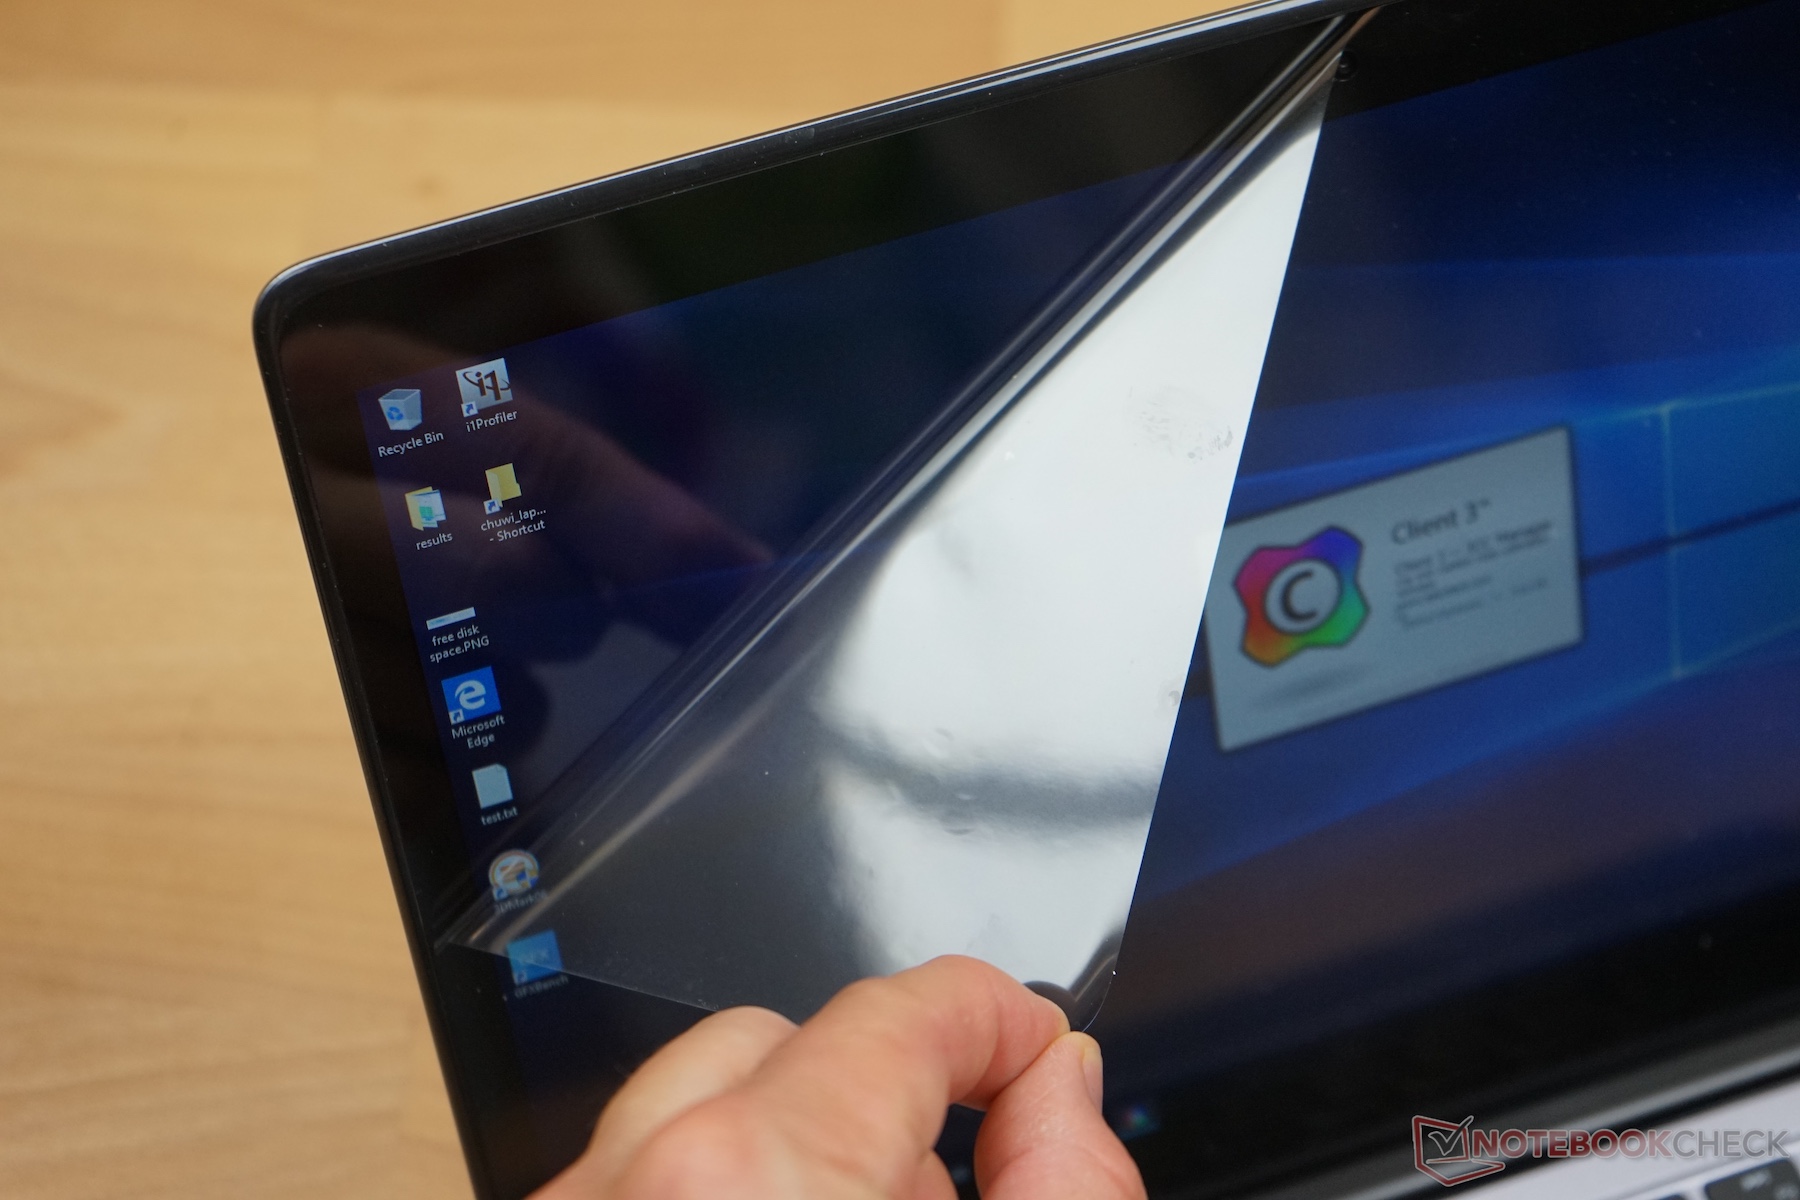
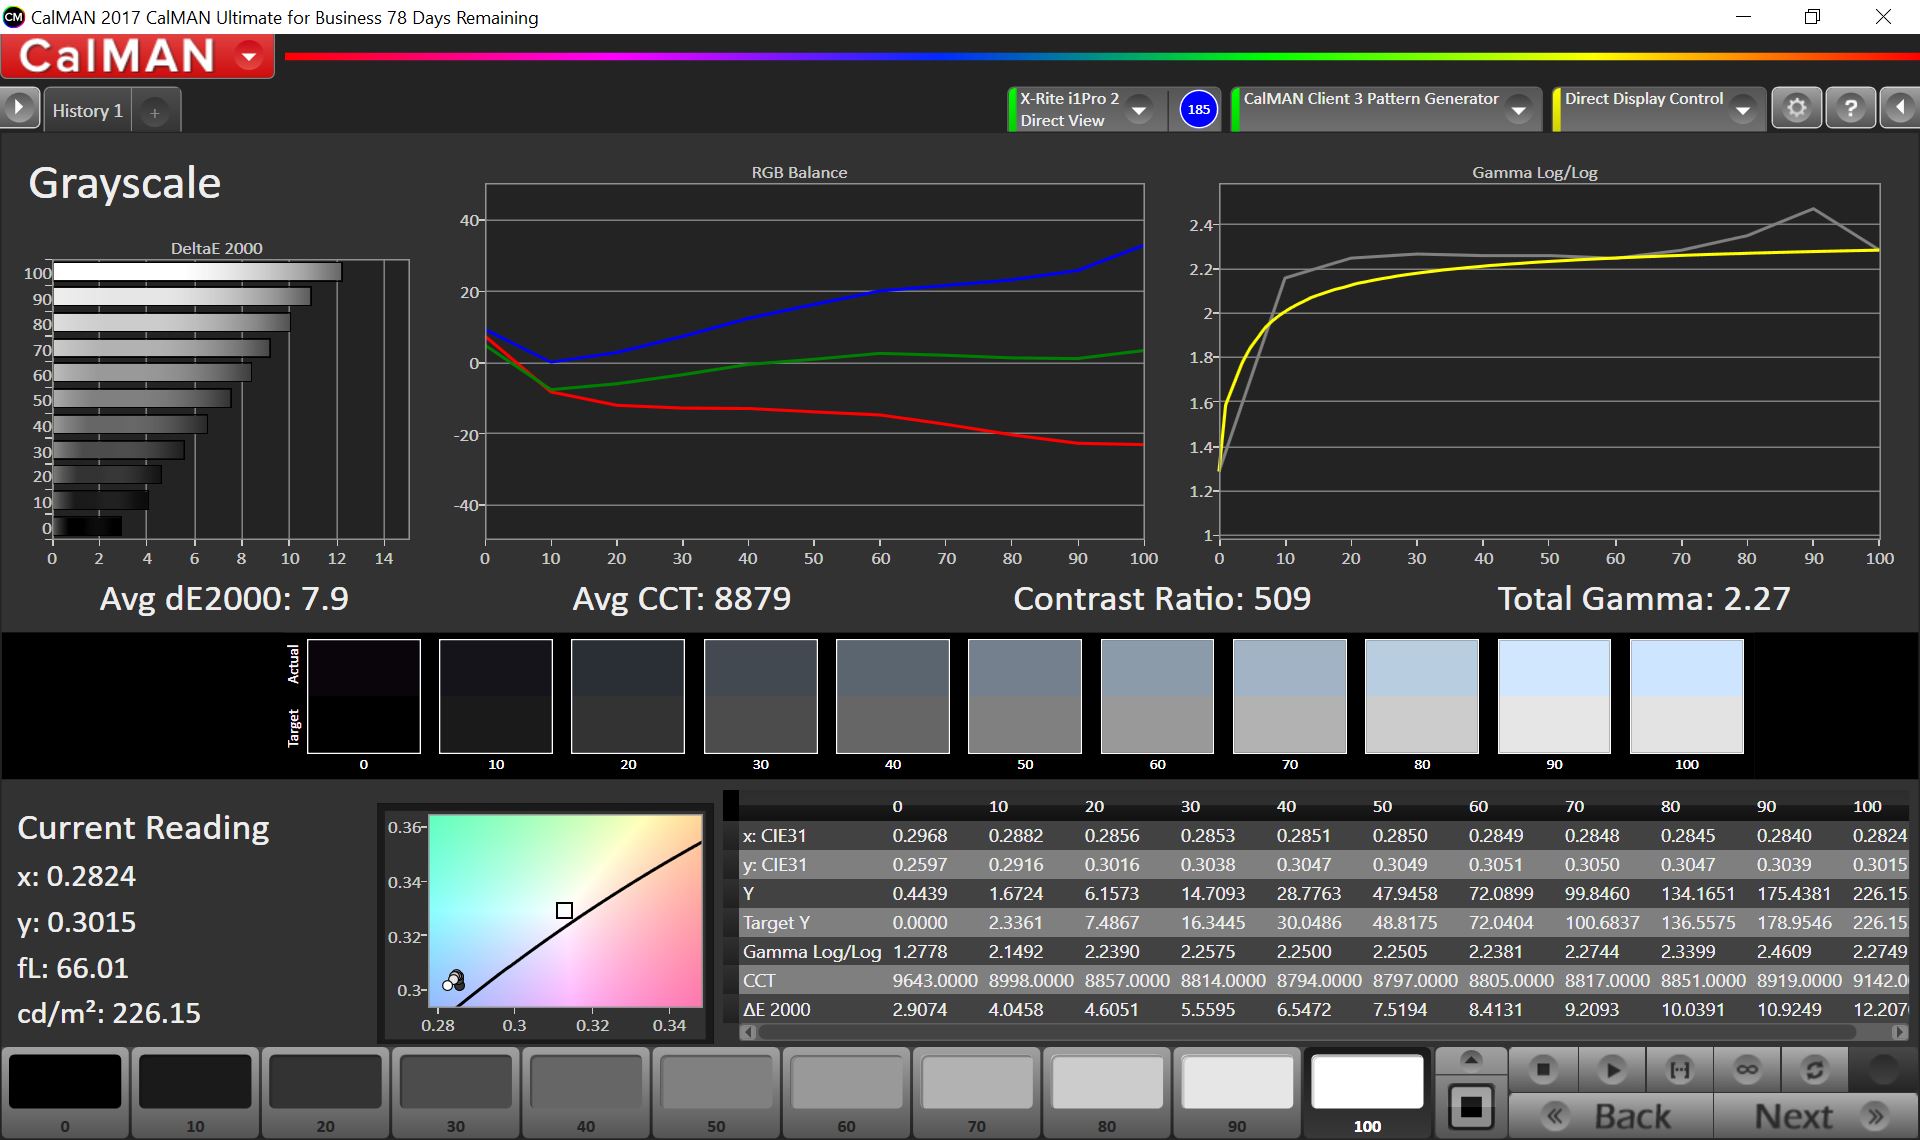
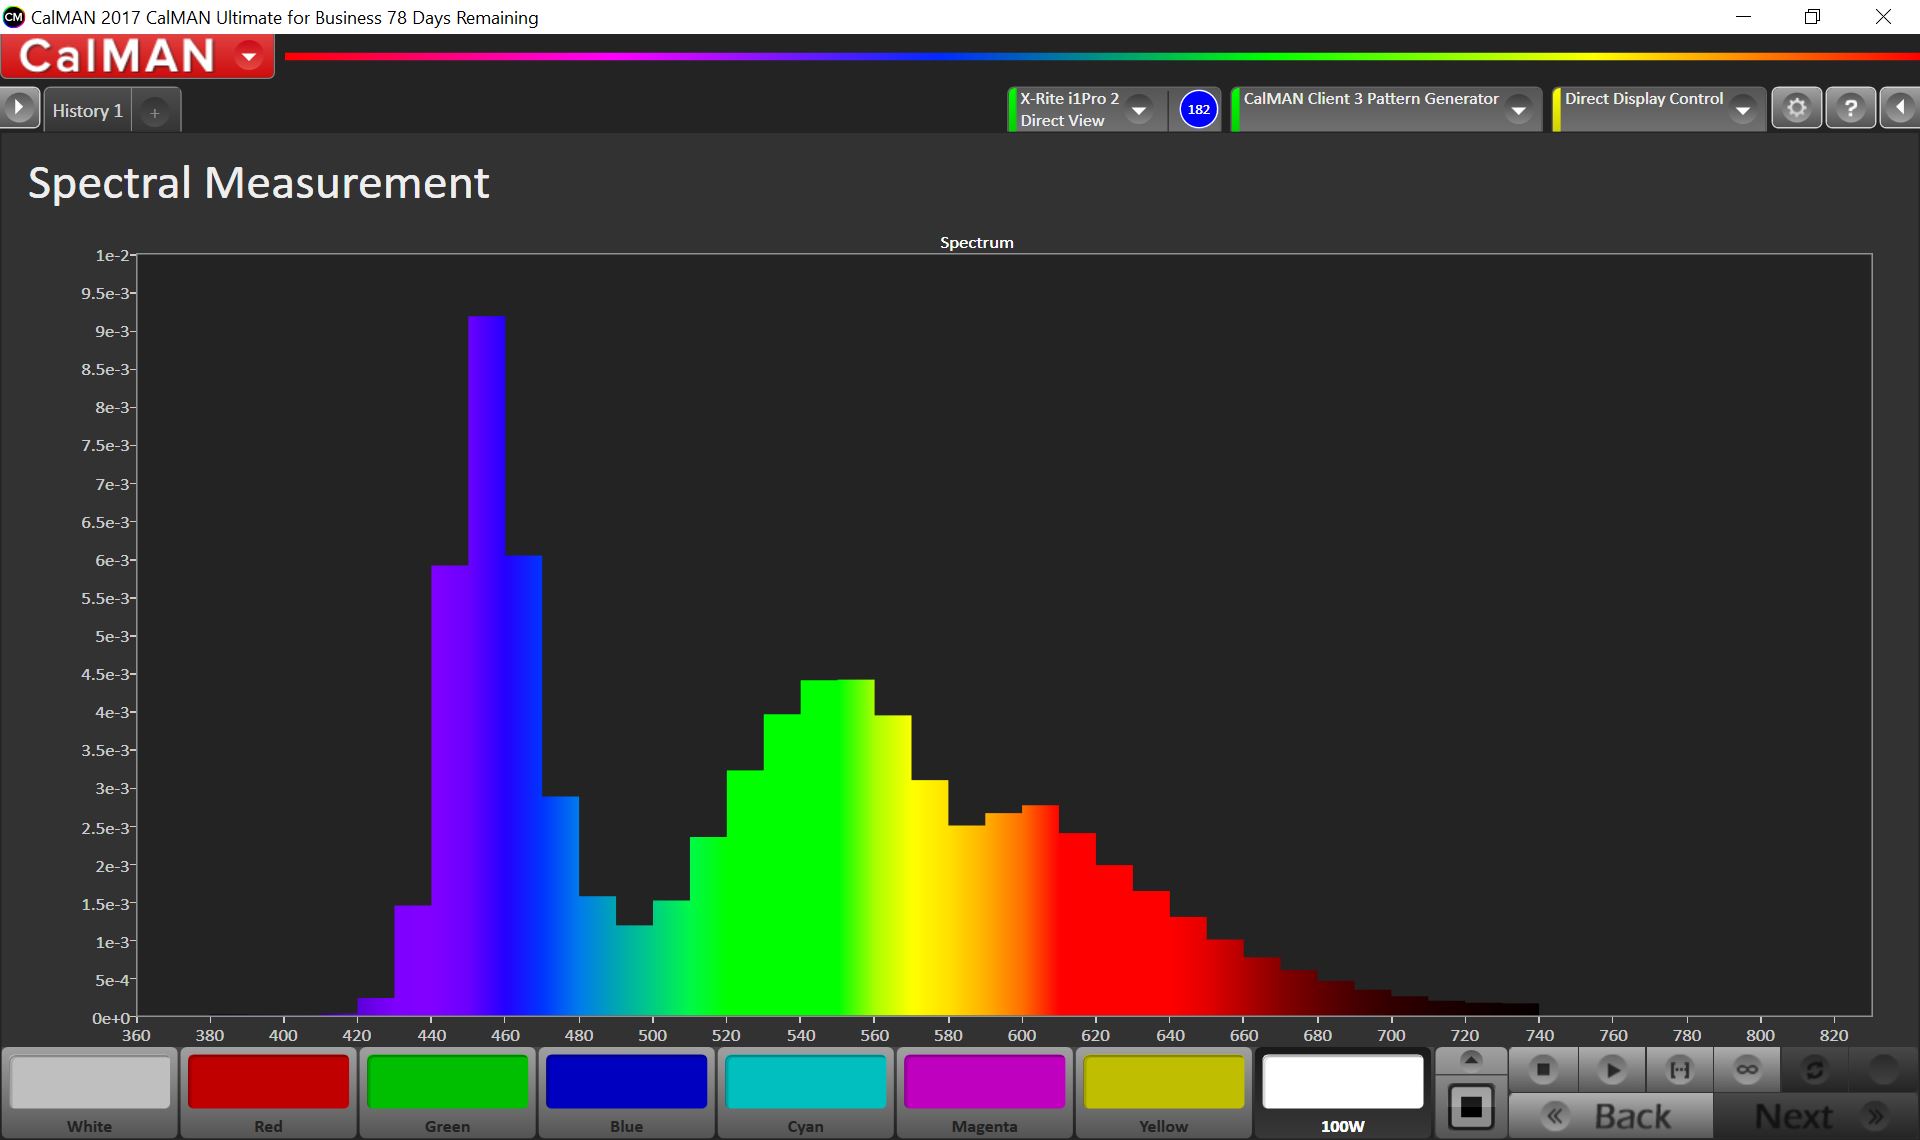
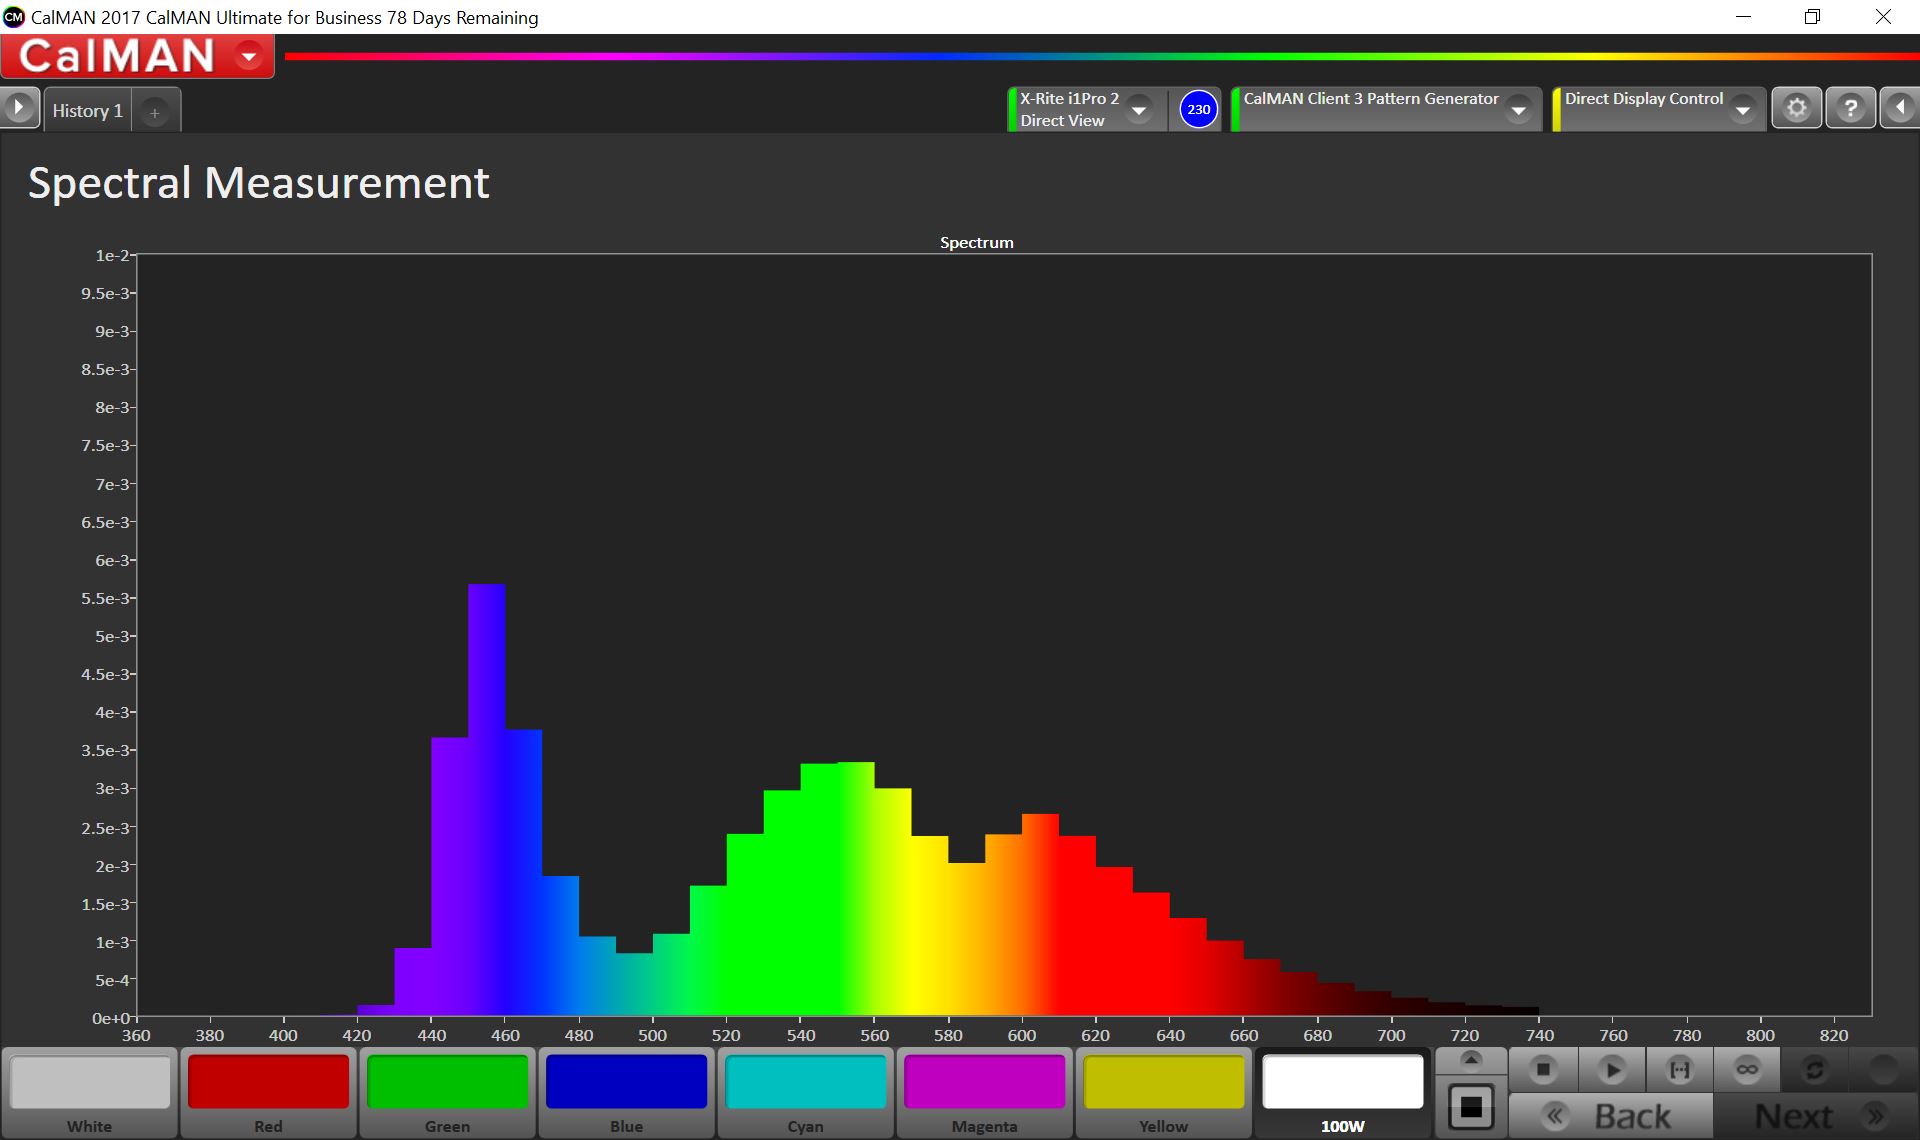
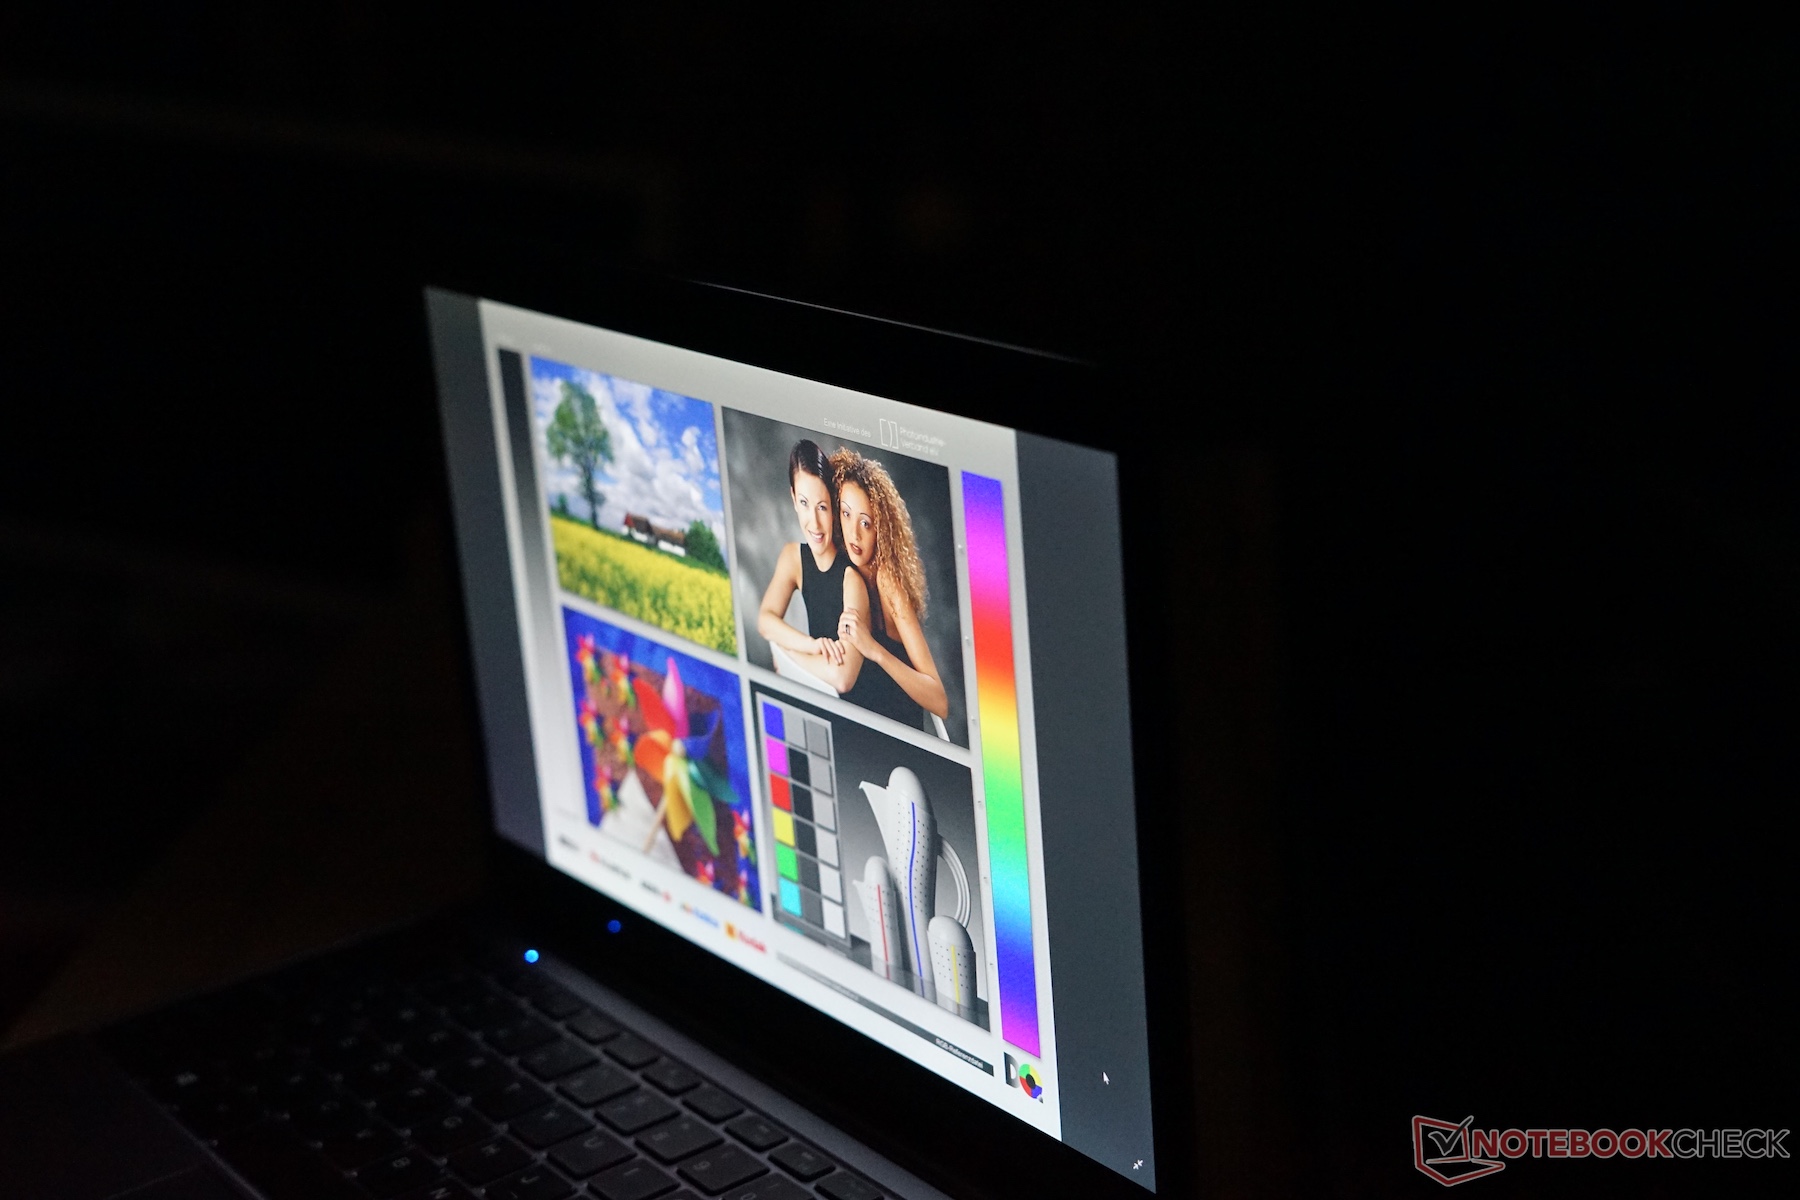
The LapBook SE has a 13.3-inch IPS display by Sharp that Chuwi advertises as being high quality. Our tests suggest otherwise though, particularly as our test device reaches an average maximum brightness of 210 cd/m² and a maximum luminosity of 227 cd/m² at the center of the display. The relatively low maximum brightness and the display’s highly reflective finish make the device usable only indoors.
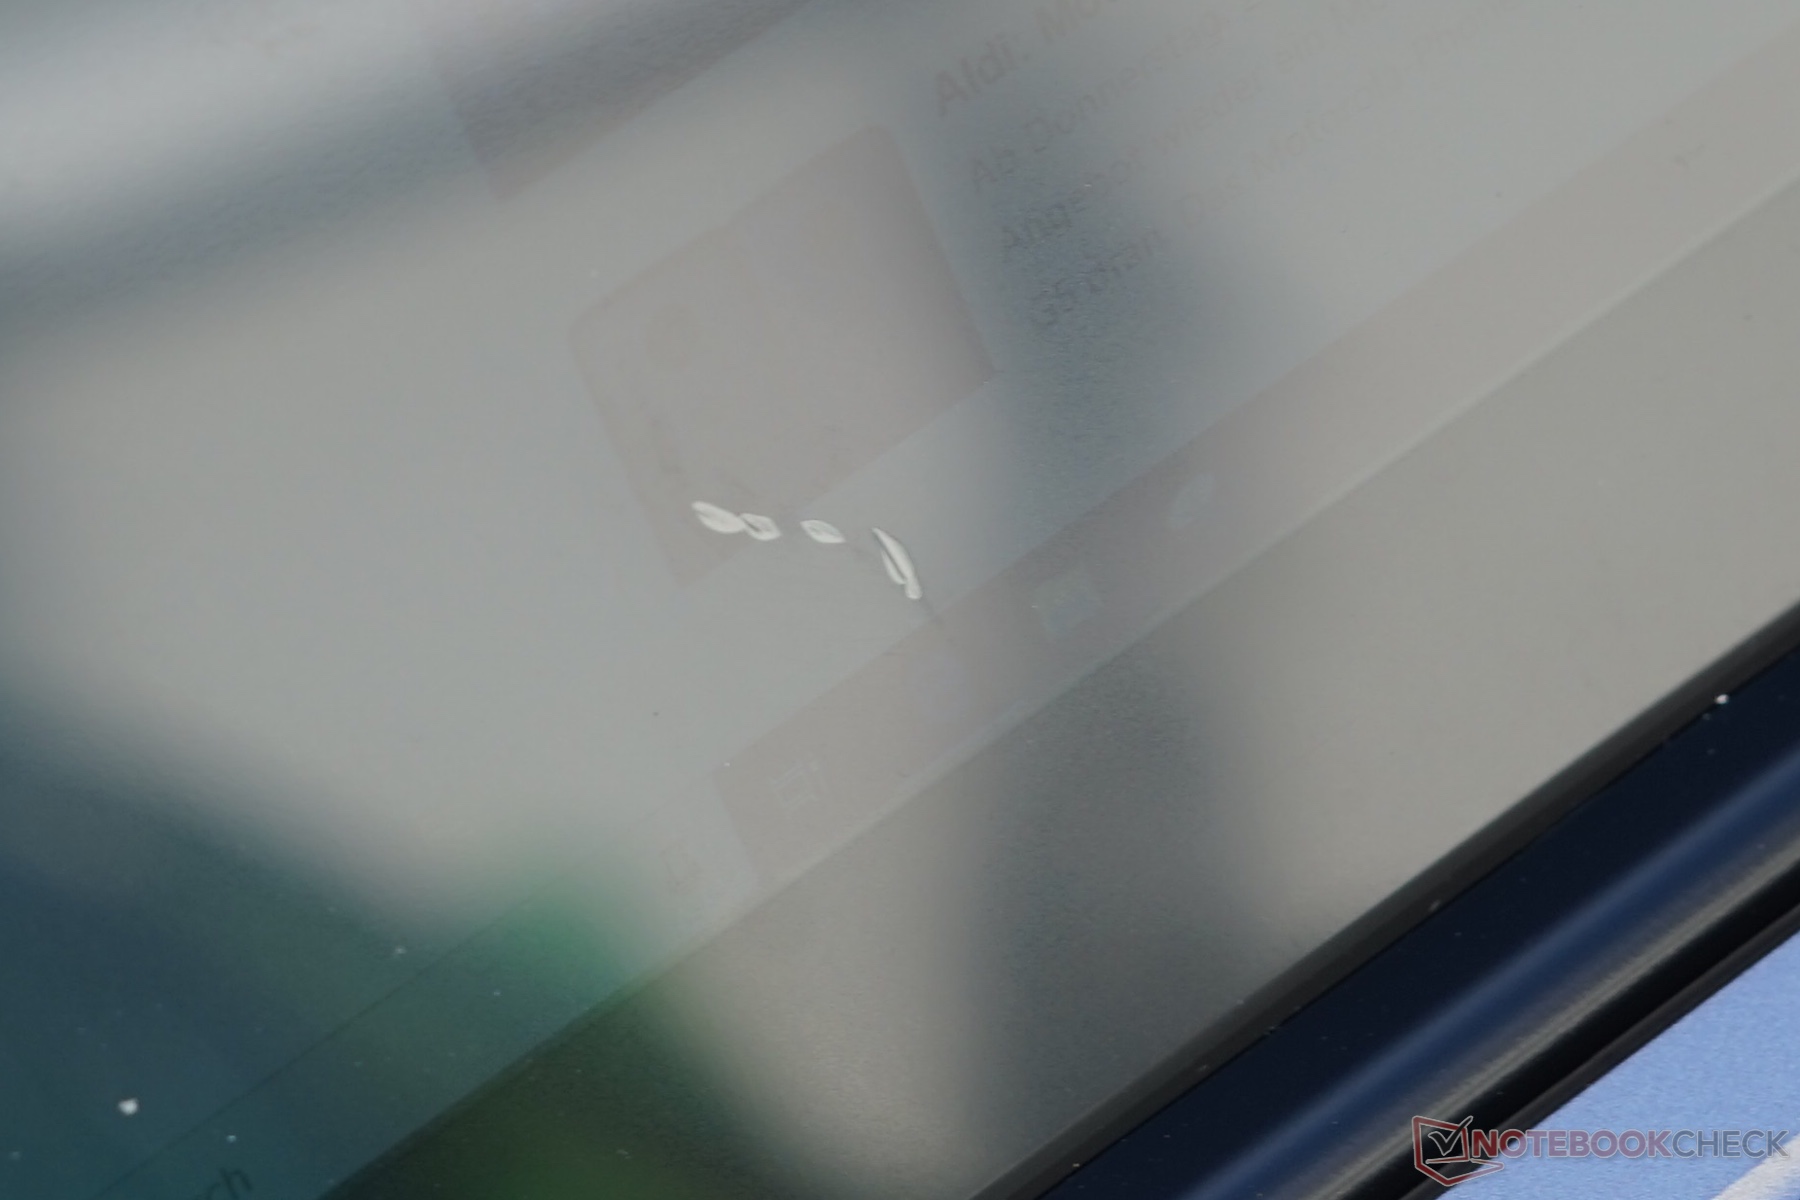
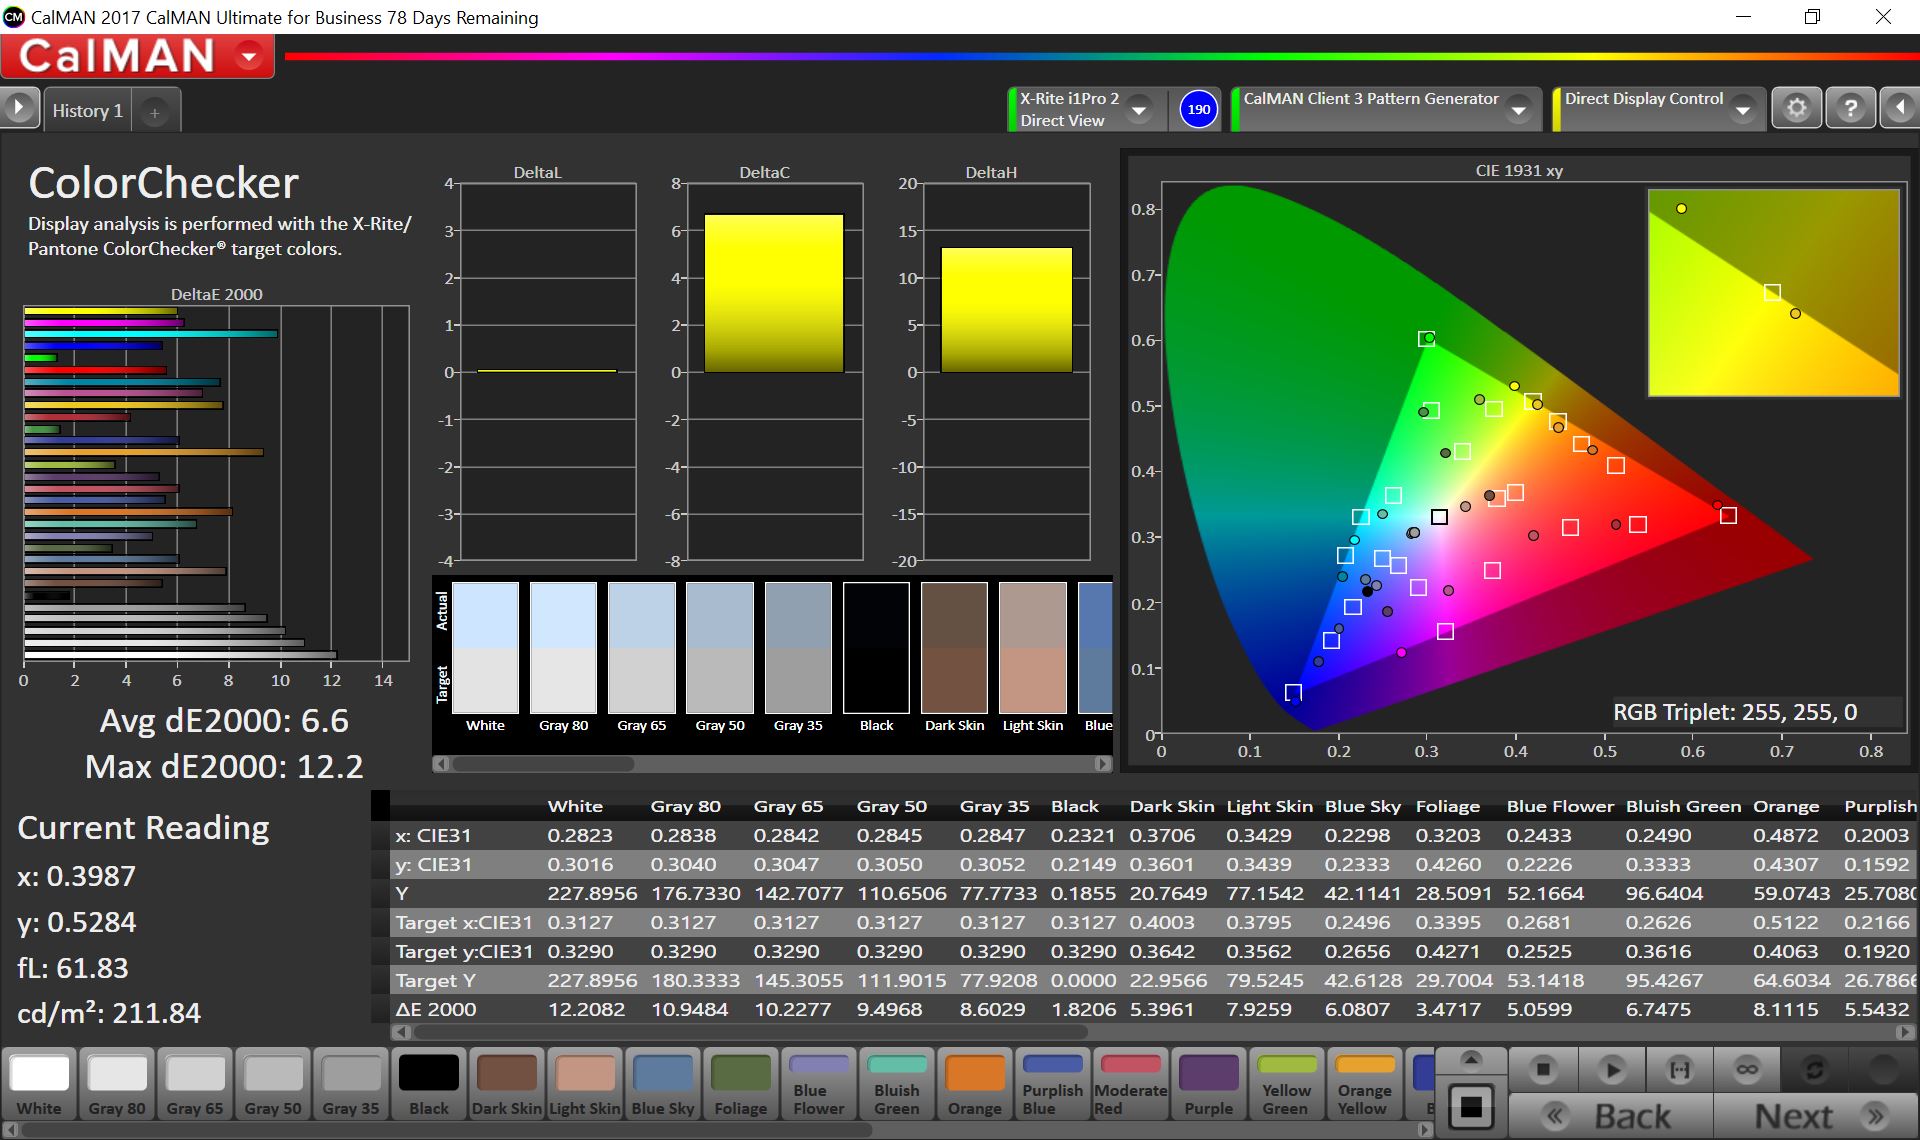
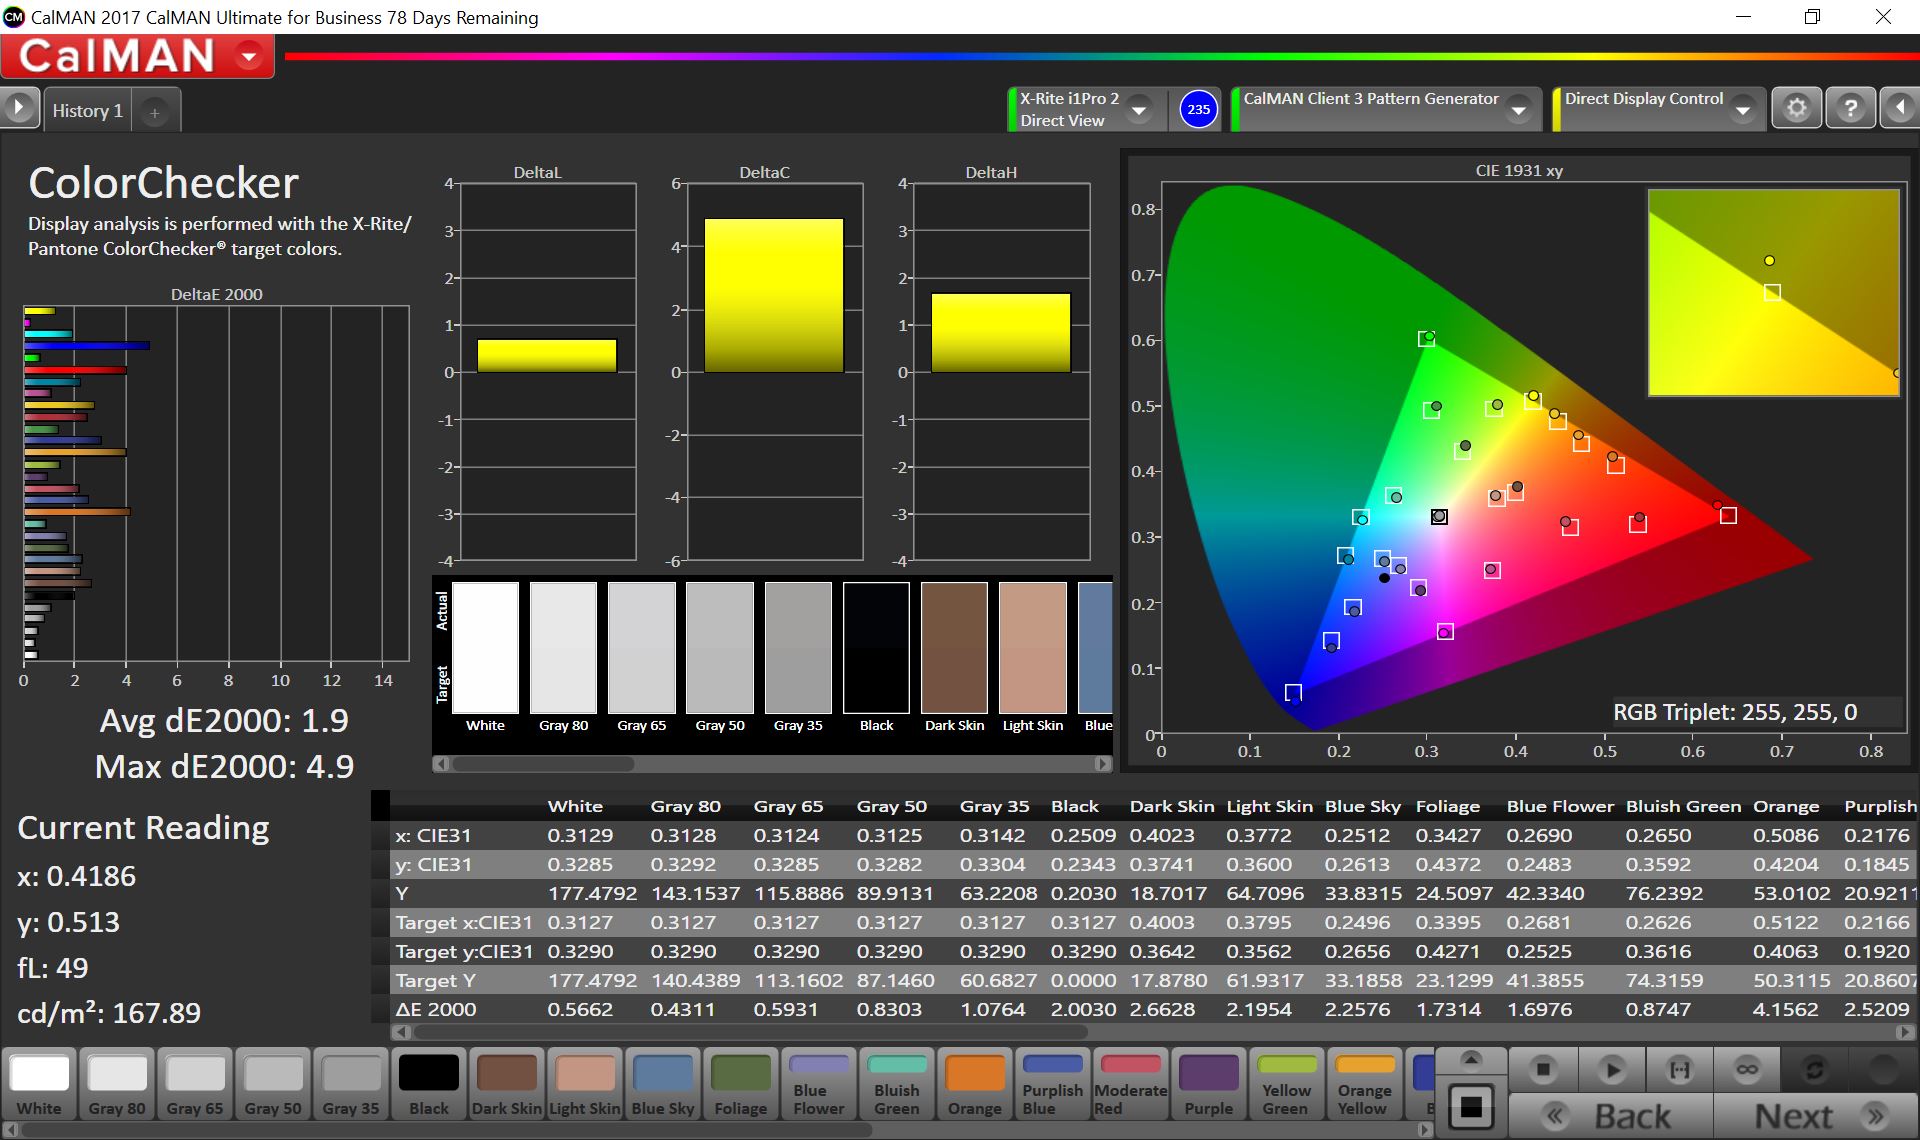
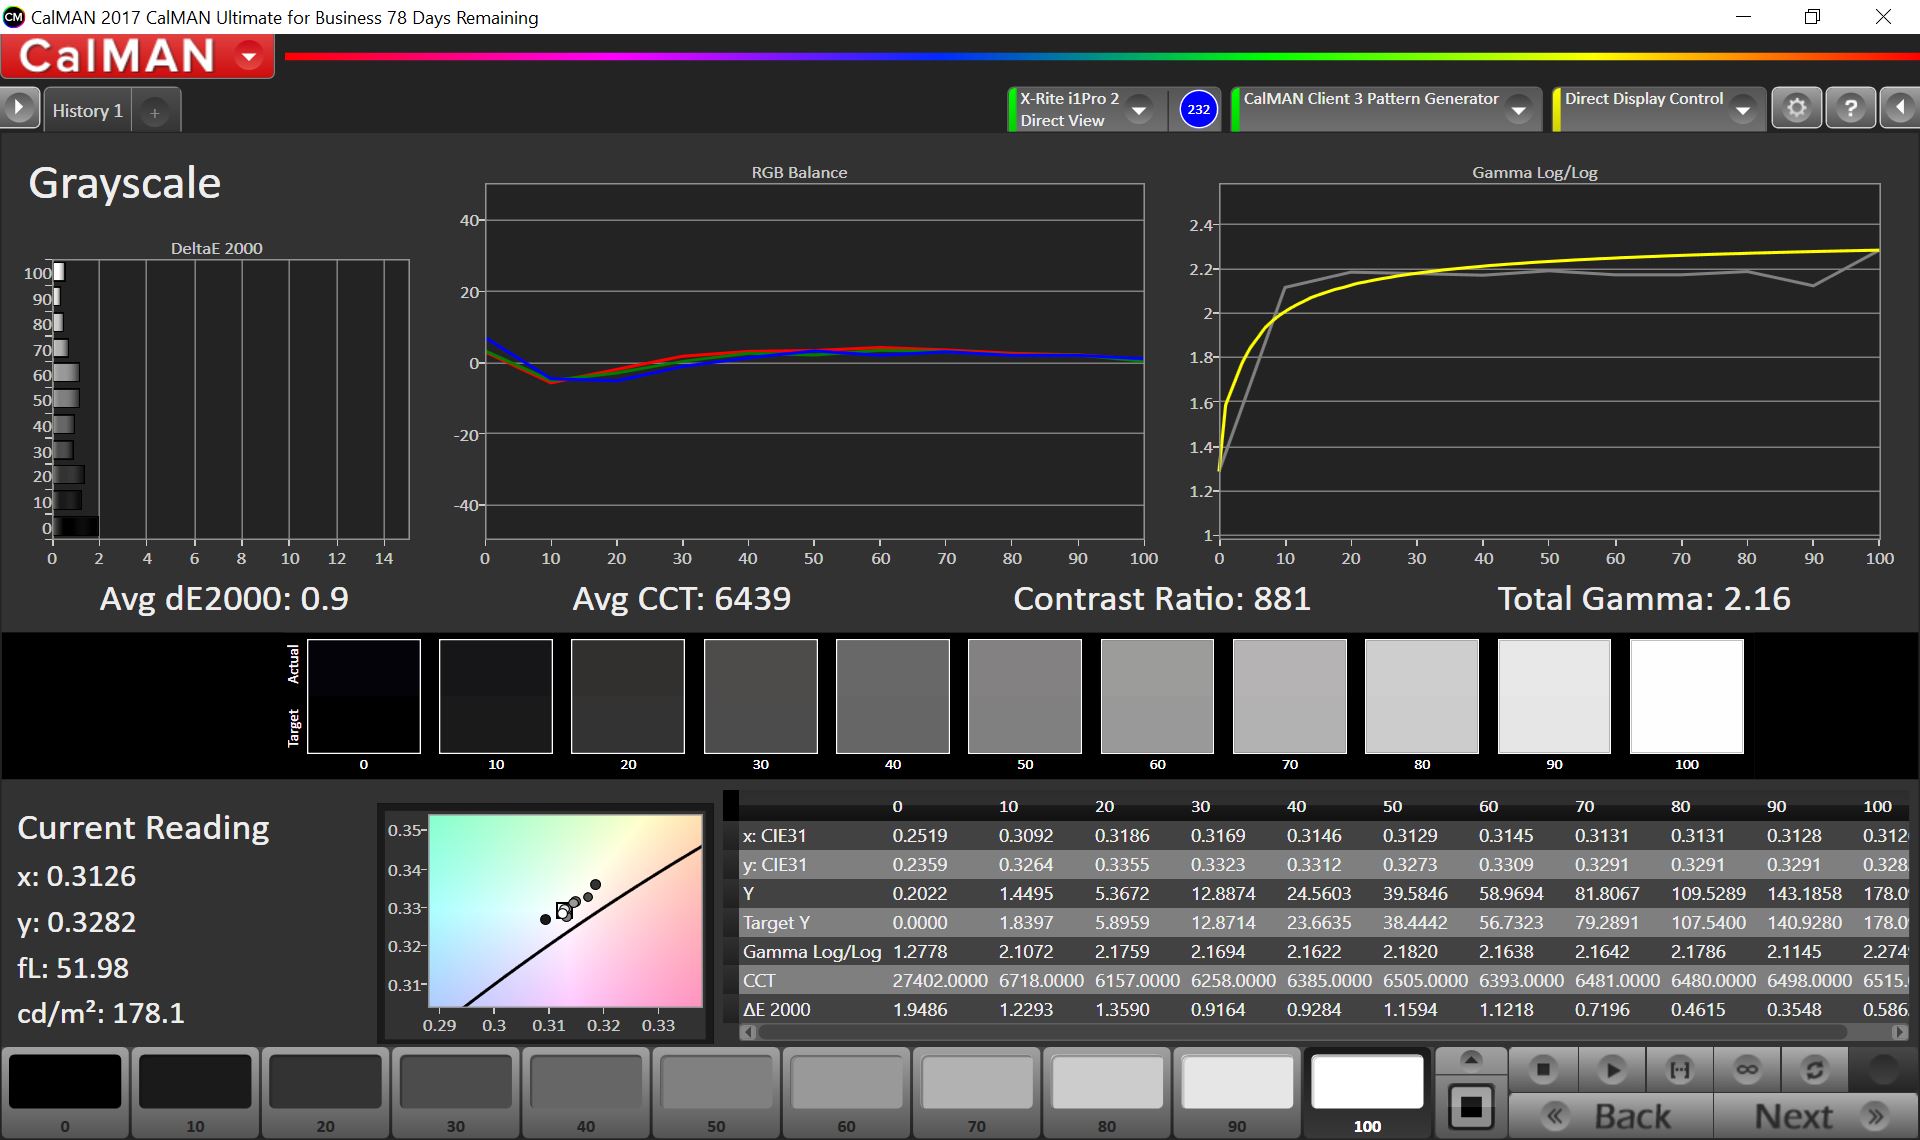
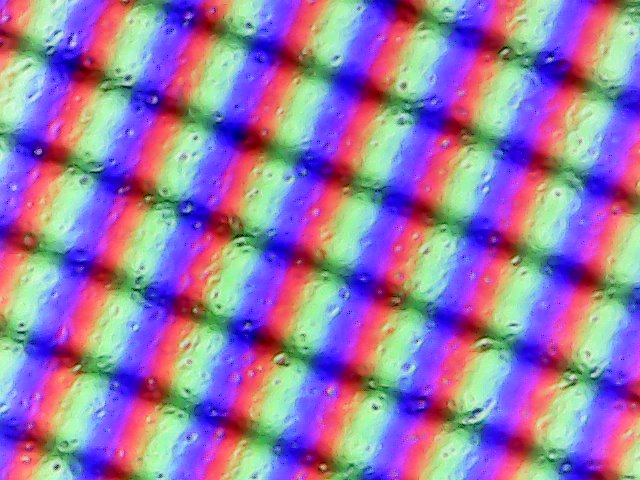
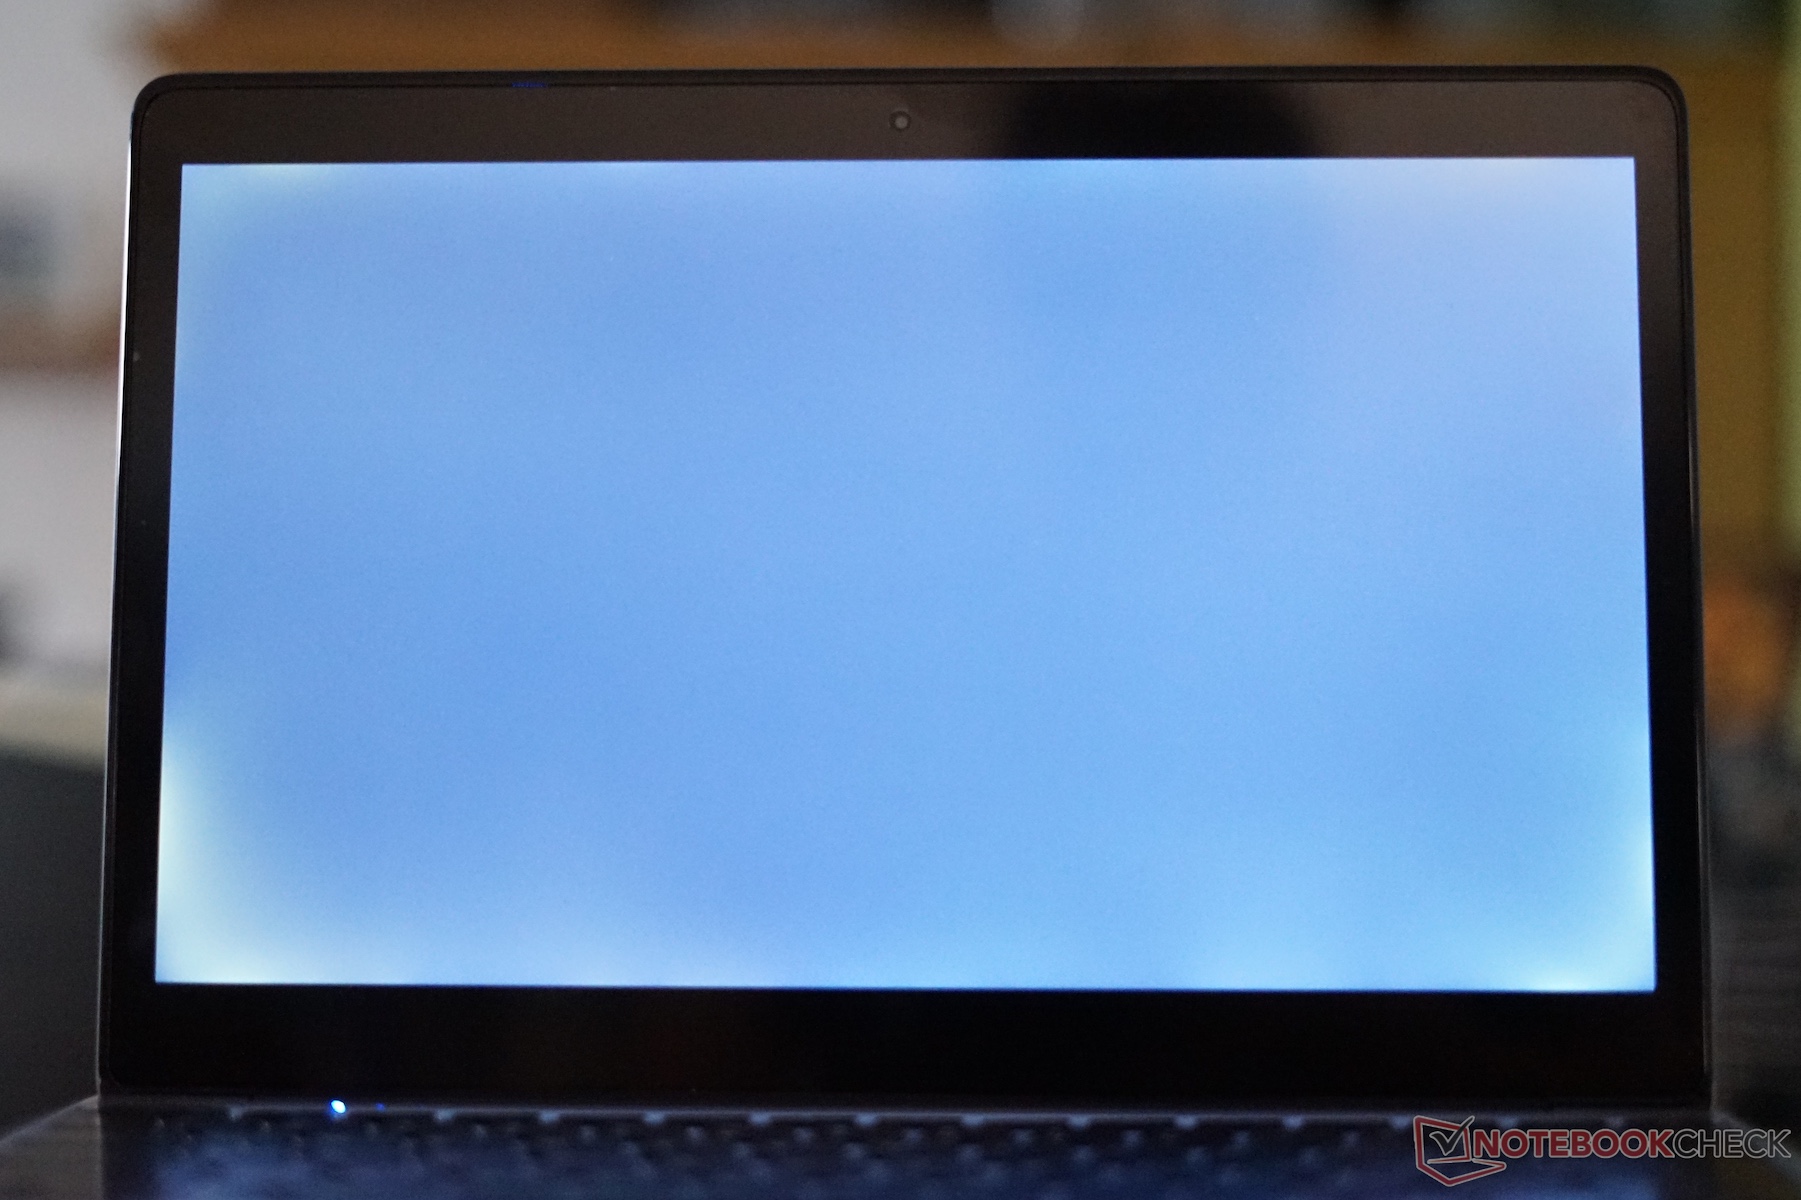
Our test device has comparatively high color space coverage but mediocre color accuracy by default. We improved the display's color accuracy considerably with further calibration; we have included our ICC file should you wish to use it. Our test device has an 89% uniformly lit display, which is on par with the more expensive Microsoft Surface Go and Apple MacBook 12. Unfortunately, our test device has noticeable backlight bleeding across all edges of the display as the included photo demonstrates.
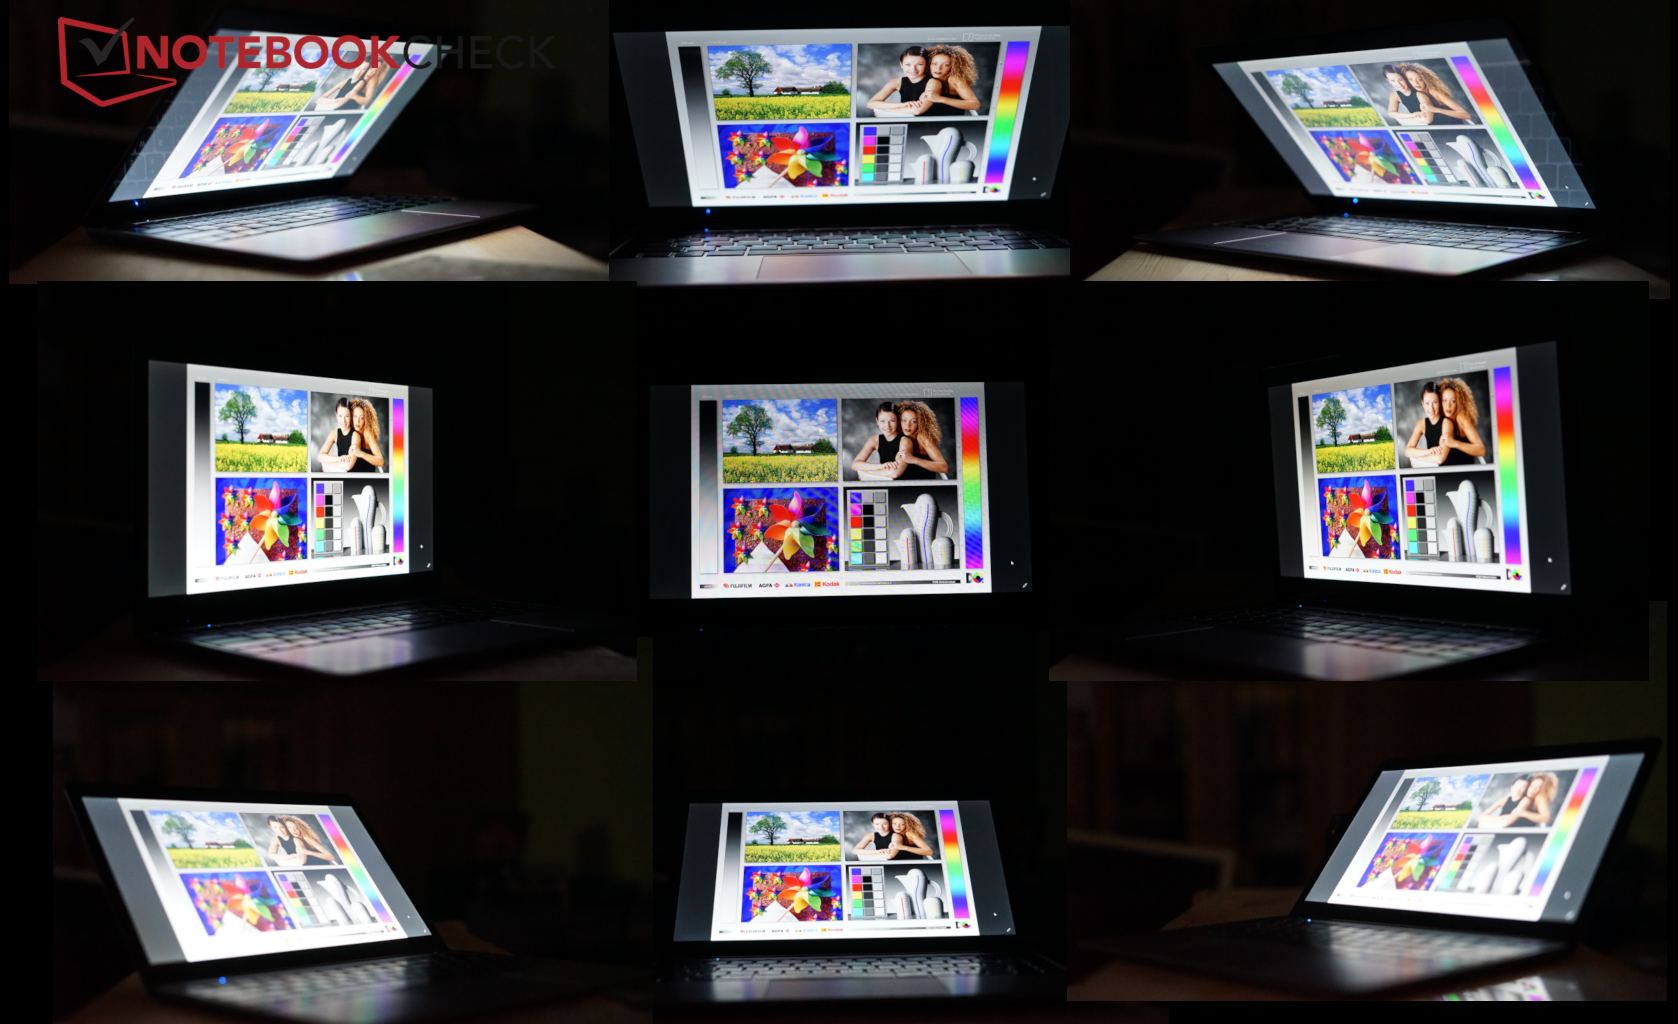
The LapBook SE has good viewing angles though thanks to its IPS panel with little image or brightness distortion even at acute viewing angles. Our test device comes with a screen protector pre-installed too like many other Chinese notebooks, smartphones and tablets.

| |||||||||||||||||||||||||
Brightness Distribution: 89 %
Contrast: 516:1 (Black: 0.44 cd/m²)
ΔE ColorChecker Calman: 6.6 | ∀{0.5-29.43 Ø4.71}
calibrated: 1.9
ΔE Greyscale Calman: 7.9 | ∀{0.09-98 Ø4.96}
95% sRGB (Calman 2D)
66.5% AdobeRGB 1998 (Argyll 3D)
94.8% sRGB (Argyll 3D)
65% Display P3 (Argyll 3D)
Gamma: 2.16
CCT: 8879 K
| Chuwi LapBook SE 1920x1080, 13.3" | Chuwi Lapbook 12.3 SDC8353, , 2736x1824, 12.3" | Jumper EZbook 3 MS_9003, , 1920x1080, 14.1" | Microsoft Surface Go MHN-00003 Sharp SHP14A6, , 1800x1200, 10" | Apple MacBook 12 (Early 2016) 1.1 GHz APPA027, , 2304x1440, 12" | |
|---|---|---|---|---|---|
| Display | 5% | -20% | 2% | 2% | |
| Display P3 Coverage (%) | 65 | 68 5% | 51.6 -21% | 66.5 2% | 66.8 3% |
| sRGB Coverage (%) | 94.8 | 98.4 4% | 77.3 -18% | 97.5 3% | 95.4 1% |
| AdobeRGB 1998 Coverage (%) | 66.5 | 69.5 5% | 53 -20% | 67.5 2% | 68 2% |
| Response Times | -17% | 21% | -2% | -8% | |
| Response Time Grey 50% / Grey 80% * (ms) | 39.2 ? | 48.4 ? -23% | 46 ? -17% | 44 ? -12% | 41.2 ? -5% |
| Response Time Black / White * (ms) | 27.7 ? | 30.8 ? -11% | 11.6 ? 58% | 25.6 ? 8% | 30.4 ? -10% |
| PWM Frequency (Hz) | 200 ? | 200 ? | 1020 ? | ||
| Screen | 63% | -28% | 77% | 53% | |
| Brightness middle (cd/m²) | 227 | 224 -1% | 384 69% | 456 101% | 387 70% |
| Brightness (cd/m²) | 210 | 219 4% | 341 62% | 426 103% | 358 70% |
| Brightness Distribution (%) | 89 | 81 -9% | 76 -15% | 88 -1% | 88 -1% |
| Black Level * (cd/m²) | 0.44 | 0.13 70% | 1.28 -191% | 0.31 30% | 0.47 -7% |
| Contrast (:1) | 516 | 1723 234% | 300 -42% | 1471 185% | 823 59% |
| Colorchecker dE 2000 * | 6.6 | 2.4 64% | 8.7 -32% | 1.3 80% | 1.6 76% |
| Colorchecker dE 2000 max. * | 12.2 | 3.7 70% | 16.7 -37% | 3 75% | 4 67% |
| Colorchecker dE 2000 calibrated * | 1.9 | 1.1 42% | |||
| Greyscale dE 2000 * | 7.9 | 2.5 68% | 11.1 -41% | 1.4 82% | 1 87% |
| Gamma | 2.16 102% | 2.31 95% | 2.2 100% | 2.24 98% | 2.26 97% |
| CCT | 8879 73% | 6869 95% | 12445 52% | 6687 97% | 6680 97% |
| Color Space (Percent of AdobeRGB 1998) (%) | 63.4 | 62.3 | 61.6 | ||
| Color Space (Percent of sRGB) (%) | 98.3 | 96.8 | 82.2 | ||
| Total Average (Program / Settings) | 17% /
37% | -9% /
-19% | 26% /
50% | 16% /
32% |
* ... smaller is better
IPS panels typically have slow reaction times, and the LapBook SE is no different in this regard. Hardcore gamers may notice this when playing fast 3D shooters, albeit old ones.
Chuwi uses pulse-width modulation (PWM) for regulating brightness at and below 29% luminosity, which we measure at 200 Hz. PWM can cause some people to experience headaches and eye-strain, and while the PWM frequency is relatively low, the display is so dark at 29% brightness that most users would not notice the display flickering. We run some of our battery life tests on all devices at 150 cd/m², which equates to 60% luminosity on our test device.
Display Response Times
| ↔ Response Time Black to White | ||
|---|---|---|
| 27.7 ms ... rise ↗ and fall ↘ combined | ↗ 14.8 ms rise | 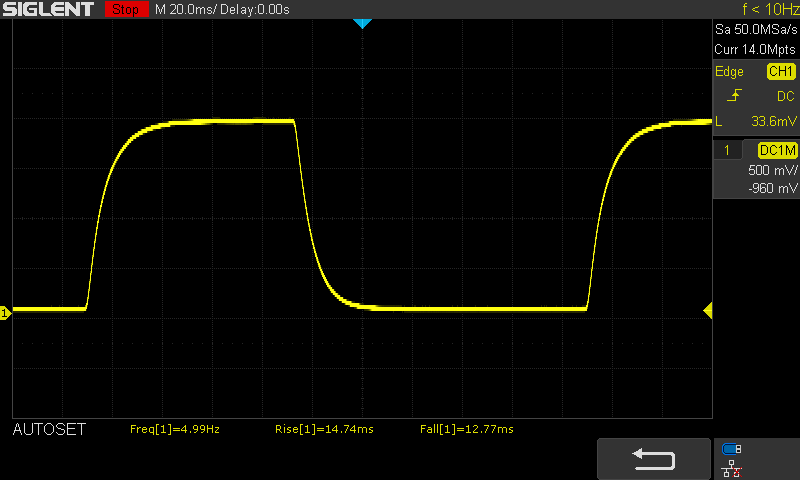 |
| ↘ 12.9 ms fall | ||
| The screen shows relatively slow response rates in our tests and may be too slow for gamers. In comparison, all tested devices range from 0.1 (minimum) to 240 (maximum) ms. » 71 % of all devices are better. This means that the measured response time is worse than the average of all tested devices (19.8 ms). | ||
| ↔ Response Time 50% Grey to 80% Grey | ||
| 39.2 ms ... rise ↗ and fall ↘ combined | ↗ 19.2 ms rise | 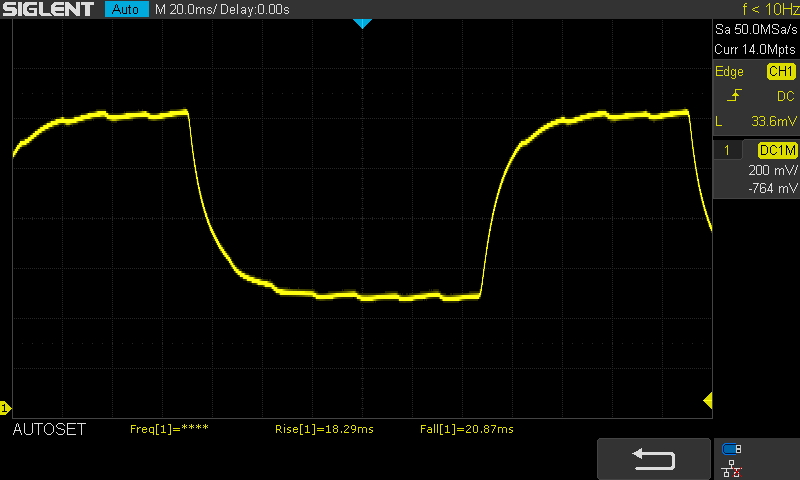 |
| ↘ 20 ms fall | ||
| The screen shows slow response rates in our tests and will be unsatisfactory for gamers. In comparison, all tested devices range from 0.165 (minimum) to 636 (maximum) ms. » 60 % of all devices are better. This means that the measured response time is worse than the average of all tested devices (31 ms). | ||
Screen Flickering / PWM (Pulse-Width Modulation)
| Screen flickering / PWM detected | 200 Hz | ≤ 29 % brightness setting | 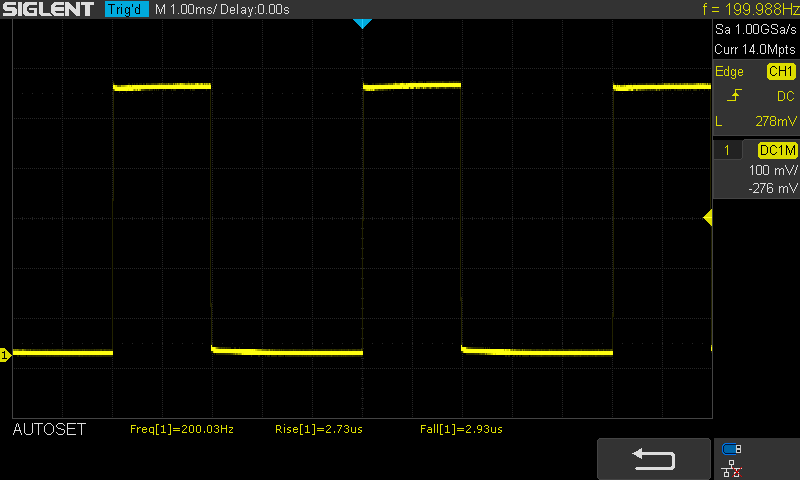 |
The display backlight flickers at 200 Hz (worst case, e.g., utilizing PWM) Flickering detected at a brightness setting of 29 % and below. There should be no flickering or PWM above this brightness setting. The frequency of 200 Hz is relatively low, so sensitive users will likely notice flickering and experience eyestrain at the stated brightness setting and below. In comparison: 52 % of all tested devices do not use PWM to dim the display. If PWM was detected, an average of 7754 (minimum: 5 - maximum: 343500) Hz was measured. | |||
Performance
Chuwi has equipped the LapBook SE with a Gemini Lake processor, 4 GB of RAM and 28 GB of eMMC, the combination of which positions the LapBook as an entry-level device. The Intel Celeron N4100 is a quad-core processor though, which puts the device at an advantage over its equivalently priced competitors. The additional built-in SSD is considerably faster than the eMMC memory too.
Our test device feels noticeably slower than faster mid-range devices when running multiple browser tabs or when loading complex websites. Installing Windows 10 onto the SSD rather than the eMMC memory will help improve system performance, but the fixed 4 GB of RAM will always bottleneck the system. We would recommend limiting the number of apps and browser tabs that you have open when using the LapBook SE.
Processor
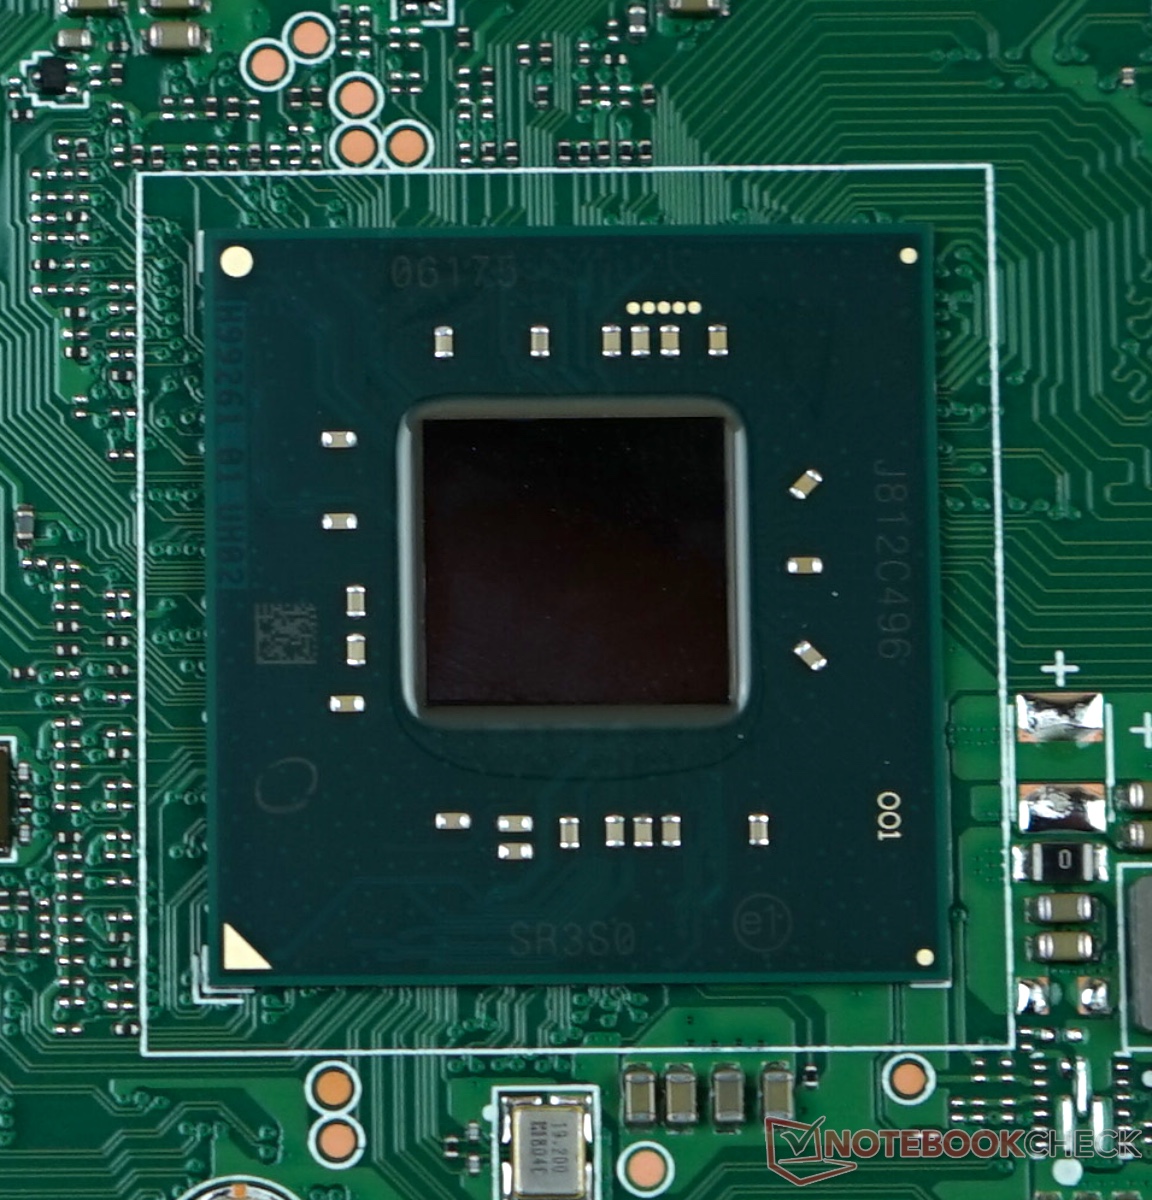
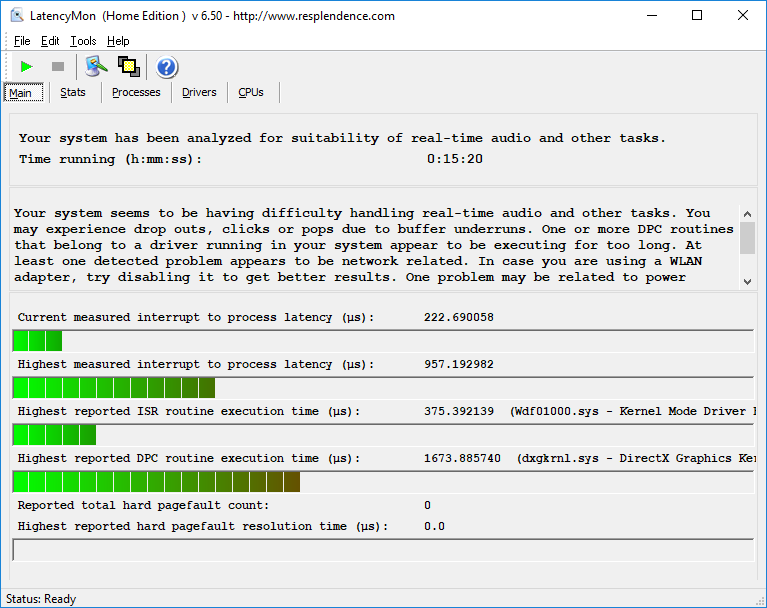
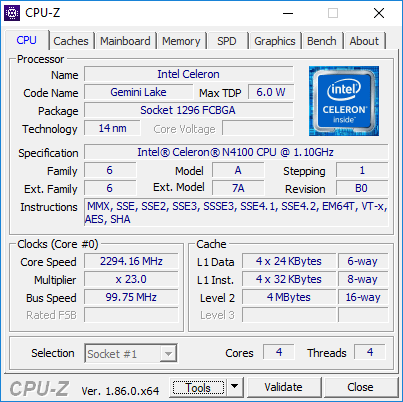
The Celeron N4100 is an economical quad-core 14 nm processor based on Intel’s Gemini Lake architecture. The CPU can clock up to 2.4 GHz, but the LapBook SE struggles to maintain the CPU’s maximum clock speed because of its passive cooling and limited thermal design power (TDP). The N4100 does not support Intel Turbo Boost, Speed Shift or Hyperthreading either; these technologies are used in Intel’s more powerful Core series chips, among others.
Our test device demonstrates its performance limits in Cinebench R15 where the CPU averages 1.5 GHz. The clock speed is higher than the CPU’s 1.1 GHz base clock speed but considerably lower than the chip’s maximum clock speed.
Our test device performed consistently in loops of Cinebench R15 benchmarks despite being passively cooled. We measured only a 2% performance drop from our test device’s initial score to our final run of the benchmark. The CPU could score higher though, as shown by the actively cooled Chuwi GBox, which averaged 9% higher in Cinebench R15’s multi-threaded benchmark. Our test device resoundingly outperforms our comparison devices that are powered by Intel’s older Apollo Lake CPUs though.
System Performance
We conducted our system performance tests using PCMark 8 and 10, which we installed on the SSD because the eMMC memory did not have enough storage space. Our test device outperformed devices equipped with older Intel Celeron CPUs thanks to the N4100’s four cores and its LPDDR4 RAM, even if it is just 4 GB.
However, our Intel Core-powered comparison devices like the Eve V and the MacBook 12 score considerably higher; the difference is noticeable in daily use too. In short, the LapBook SE is powerful enough for undemanding applications like word processors and some light web browsing.
Storage Devices
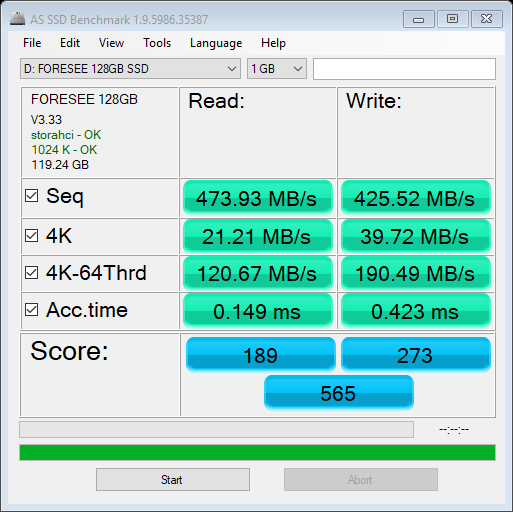
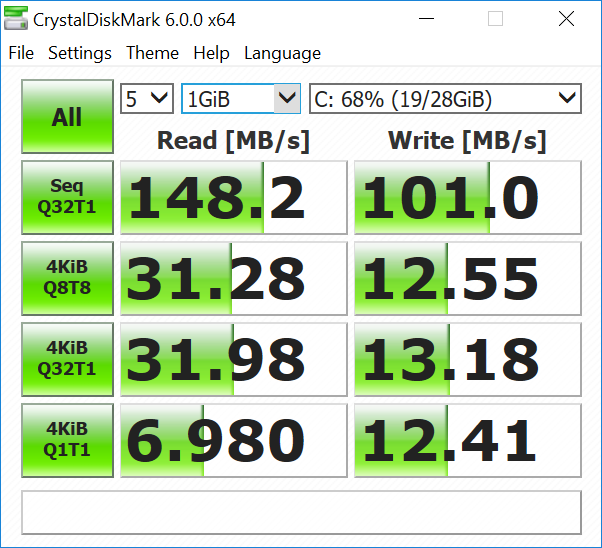
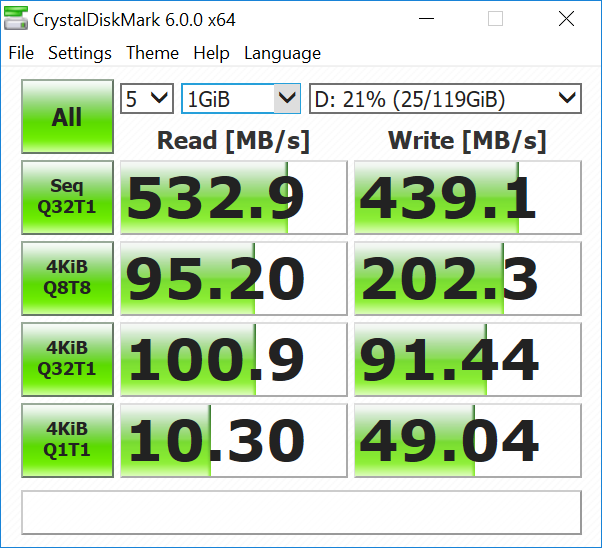
As mentioned earlier, Chuwi has installed Windows 10 on our test device’s slow eMMC memory rather than the faster M.2-2280 SATA SSD. The SanDisk DF4032 eMMC drive has 28 GB of usable memory and achieves sequential read speeds between 264 MB/s and 132 MB/s. Overall, the transfer speeds are good for an eMMC drive, but the FORESEE 128 GB SSD is much faster and averages 422 MB/s in the same test. The included SSD is not particularly quick for a SATA SSD either.

| Chuwi LapBook SE SanDisk DF4032 | Chuwi LapBook SE FORESEE 128GB O1229B | Apple MacBook 12 2017 Apple SSD AP0256 | Microsoft Surface Go MHN-00003 64 GB eMMC Flash | Trekstor Primebook C13 SanDisk DF4064 | Chuwi LapBook 14 inch 2017 SanDisk DF4128 | |
|---|---|---|---|---|---|---|
| CrystalDiskMark 5.2 / 6 | 194% | 536% | 92% | 7% | 26% | |
| Read Seq (MB/s) | 247 | 422 71% | 940 281% | 268 9% | 264.7 7% | 293.6 19% |
| Write Seq (MB/s) | 87.7 | 347 296% | 867 889% | 126.2 44% | 117 33% | 106.1 21% |
| Read 4K (MB/s) | 7.2 | 10.37 44% | 22.8 217% | 19.72 174% | 5.04 -30% | 11.45 59% |
| Write 4K (MB/s) | 11.17 | 52.1 366% | 95.7 757% | 26.91 141% | 13.16 18% | 11.87 6% |

Graphics Card
The Celeron N4100 integrates Intel UHD Graphics 600, which finished behind the older HD Graphics 500 in 3DMark 11. We could not read the GPUs clock speed for some reason, but we suspect that the shared 6 W TDP is the culprit for our test device’s relatively poor graphics performance.
| 3DMark 06 Standard Score | 3279 points | |
| 3DMark 11 Performance | 541 points | |
| 3DMark Cloud Gate Standard Score | 2486 points | |
| 3DMark Time Spy Score | 97 points | |
Help | ||
Gaming Performance
The UHD Graphics 600 is powerful enough for some undemanding games. Our test device averaged 30 FPS on Dota 2 Reborn at lowest graphics settings but could only manage 15 FPS in Path of Exile running at 1280 x 720 with the graphics set to low and to DirectX 11.
| Dota 2 Reborn - 1280x720 min (0/3) fastest | |
| Average of class Subnotebook (33.7 - 183.5, n=60, last 2 years) | |
| HP 15-da0405ng | |
| HP ProBook 645 G4 3UP62EA | |
| Eve-Tech Eve V m3 | |
| Lenovo IdeaPad V110-15IKB 80TH001SGE | |
| HP mt43 | |
| Lenovo Yoga 330-11IGM | |
| Acer Swift 1 SF114-32-P8GG | |
| Chuwi LapBook SE | |
| Jumper EZbook 3 | |
| low | med. | high | ultra | |
|---|---|---|---|---|
| Counter-Strike: GO (2012) | 27.4 | |||
| Dota 2 Reborn (2015) | 30 | 14.4 | 6.5 | 5.9 |
| X-Plane 11.11 (2018) | 0 game wont start | |||
| World of Tanks enCore (2018) | 34.8 | 4.8 | ||
| Forza Horizon 4 (2018) | 0 game wont start (hangs) | |||
| The Division 2 (2019) | 0 game wont start | |||
| League of Legends (2019) | 42.5 | 29.8 | 22 | 19.2 |
Emissions
Fan Noise
The LapBook SE is fanless, hence no fan noise. Moreover, our test device has no coil whine, so it operates silently. The power supply emits a low chirping sound when charging the device.
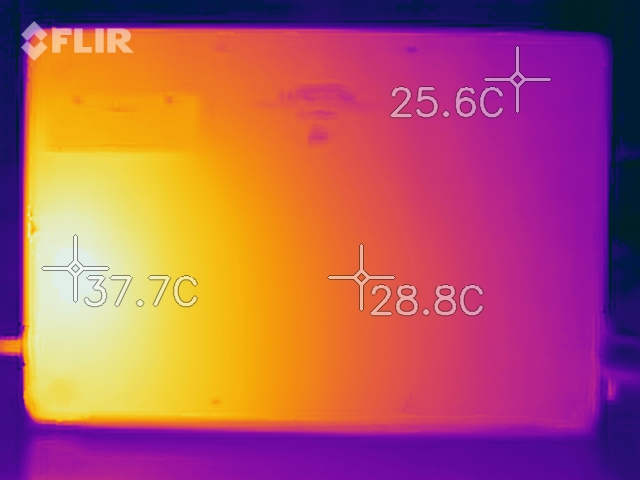
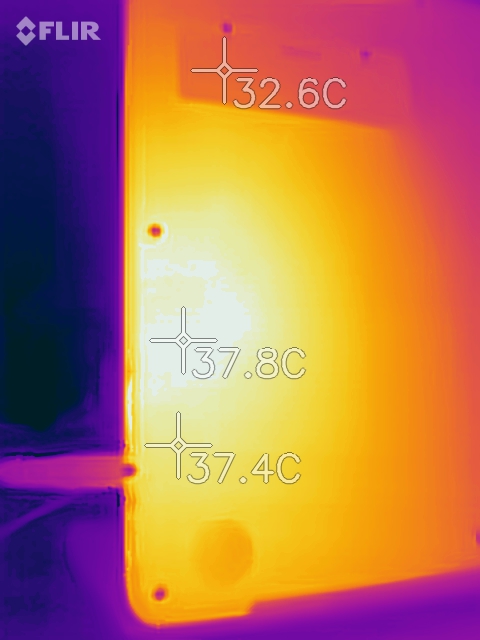
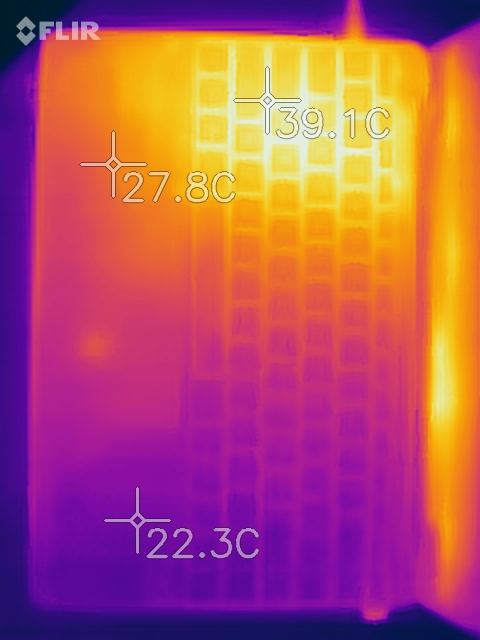
Temperature
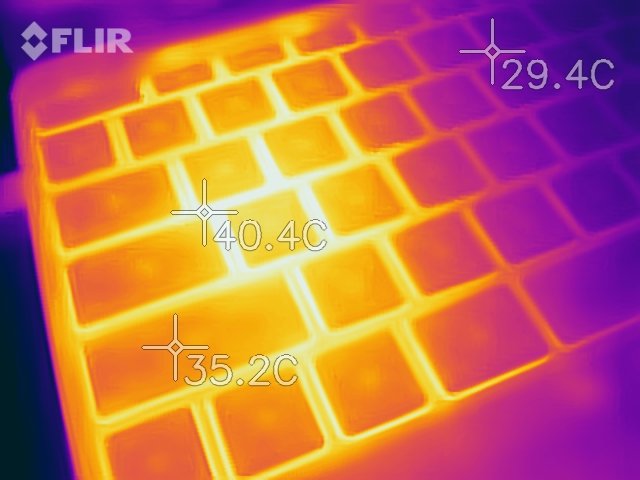
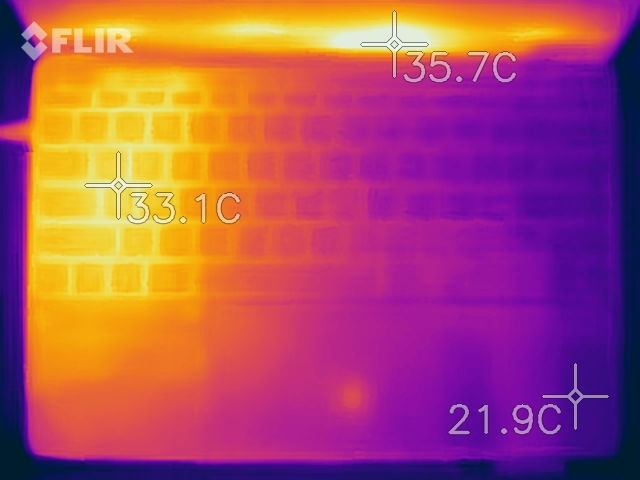
The LapBook SE is a relatively cool device, but predictable surface temperatures get hotter when the device operates under sustained load. Our test device averages 26.2 °C (79.16 °F) at idle and most of the device stays below 30 °C (86 °F) under load. The left-hand side of the top case, the area under which the motherboard sits, reaches a maximum of 37 °C (98.6 °F) though.
(+) The maximum temperature on the upper side is 37 °C / 99 F, compared to the average of 35.9 °C / 97 F, ranging from 21.4 to 59 °C for the class Subnotebook.
(+) The bottom heats up to a maximum of 34 °C / 93 F, compared to the average of 39.2 °C / 103 F
(+) In idle usage, the average temperature for the upper side is 26.2 °C / 79 F, compared to the device average of 30.8 °C / 87 F.
(+) The palmrests and touchpad are reaching skin temperature as a maximum (34 °C / 93.2 F) and are therefore not hot.
(-) The average temperature of the palmrest area of similar devices was 28.2 °C / 82.8 F (-5.8 °C / -10.4 F).
Speakers
The LapBook SE’s stereo speakers are unimpressive. Our test device’s speakers reach a maximum volume of 80.4 dB(A), but the sound quality is so poor that even YouTube videos are hardly fun to watch.
Fortunately, the headphone jack delivers noise-free and sufficiently loud audio playback. Our test device worked without issue with our high-quality AKG K701 headphones.
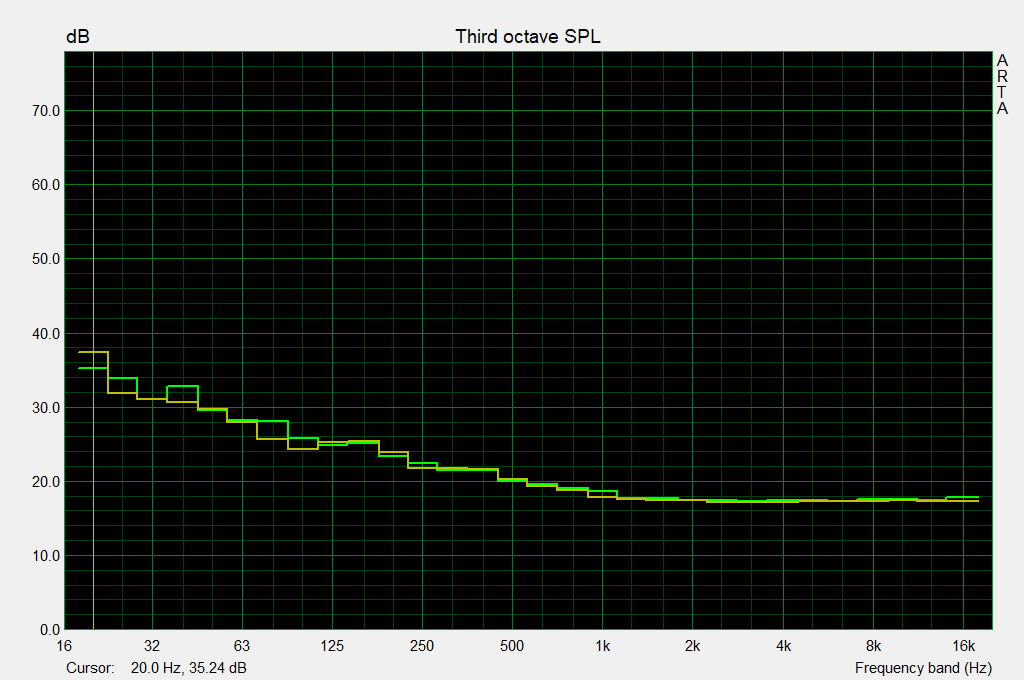
Chuwi LapBook SE audio analysis
(±) | speaker loudness is average but good (80.4 dB)
Bass 100 - 315 Hz
(-) | nearly no bass - on average 31.4% lower than median
(+) | bass is linear (6.3% delta to prev. frequency)
Mids 400 - 2000 Hz
(±) | reduced mids - on average 6.7% lower than median
(±) | linearity of mids is average (7.8% delta to prev. frequency)
Highs 2 - 16 kHz
(±) | higher highs - on average 6.7% higher than median
(+) | highs are linear (5.8% delta to prev. frequency)
Overall 100 - 16.000 Hz
(-) | overall sound is not linear (31.6% difference to median)
Compared to same class
» 93% of all tested devices in this class were better, 2% similar, 5% worse
» The best had a delta of 5%, average was 18%, worst was 53%
Compared to all devices tested
» 91% of all tested devices were better, 2% similar, 8% worse
» The best had a delta of 4%, average was 23%, worst was 134%
Apple MacBook 12 (Early 2016) 1.1 GHz audio analysis
(+) | speakers can play relatively loud (83.6 dB)
Bass 100 - 315 Hz
(±) | reduced bass - on average 11.3% lower than median
(±) | linearity of bass is average (14.2% delta to prev. frequency)
Mids 400 - 2000 Hz
(+) | balanced mids - only 2.4% away from median
(+) | mids are linear (5.5% delta to prev. frequency)
Highs 2 - 16 kHz
(+) | balanced highs - only 2% away from median
(+) | highs are linear (4.5% delta to prev. frequency)
Overall 100 - 16.000 Hz
(+) | overall sound is linear (10.2% difference to median)
Compared to same class
» 7% of all tested devices in this class were better, 2% similar, 90% worse
» The best had a delta of 5%, average was 18%, worst was 53%
Compared to all devices tested
» 5% of all tested devices were better, 1% similar, 94% worse
» The best had a delta of 4%, average was 23%, worst was 134%
Power Management
Power Consumption
The Celeron N4100 shows its strengths here and is comparatively frugal. The LapBook SE scores well when compared to the more powerful MacBook 12 and the Surface Go. Our test device’s average power consumption under load is somewhat misleading though as our comparison devices run the 3DMark 06 at higher CPU frequencies.
| Off / Standby | |
| Idle | |
| Load |
|
Key:
min: | |
| Chuwi LapBook SE Celeron N4100, UHD Graphics 600, SanDisk DF4032, , 1920x1080, 13.3" | Apple MacBook 12 2017 m3-7Y32, HD Graphics 615, Apple SSD AP0256, LED IPS, 2304x1440, 12" | Apple MacBook Air 13.3" 1.8 GHz (2017) 5350U, HD Graphics 6000, Apple SSD SM0128G, TN LED, 1440x900, 13.3" | Chuwi LapBook 14 inch 2017 Celeron N3450, HD Graphics 500, SanDisk DF4128, IPS, 1920x1080, 14.1" | Lenovo Flex 6-11IGM Celeron N4000, UHD Graphics 600, SanDisk DF4064, TN LED, 1366x768, 11.6" | Lenovo Yoga 330-11IGM Pentium N5000, UHD Graphics 605, 128 GB eMMC Flash, TN LED, 1366x768, 11.6" | Microsoft Surface Go MHN-00003 Pentium 4415Y, UHD Graphics 615, 64 GB eMMC Flash, IPS, 1800x1200, 10" | Average Intel UHD Graphics 600 | Average of class Subnotebook | |
|---|---|---|---|---|---|---|---|---|---|
| Power Consumption | -1% | -51% | 4% | 12% | 14% | -3% | 1% | -89% | |
| Idle Minimum * (Watt) | 2.7 | 2 26% | 3.4 -26% | 3.6 -33% | 2.7 -0% | 2.3 15% | 2.88 -7% | 3.47 ? -29% | 3.73 ? -38% |
| Idle Average * (Watt) | 6.3 | 5.4 14% | 6.3 -0% | 6.2 2% | 4.5 29% | 4.2 33% | 4.8 24% | 5.61 ? 11% | 6.51 ? -3% |
| Idle Maximum * (Watt) | 7.6 | 6.6 13% | 7 8% | 6.5 14% | 5.7 25% | 5.4 29% | 7.5 1% | 6.6 ? 13% | 7.88 ? -4% |
| Load Average * (Watt) | 12.6 | 22 -75% | 34.5 -174% | 13.5 -7% | 13.7 -9% | 15.4 -22% | 16.9 -34% | 13.6 ? -8% | 42.3 ? -236% |
| Load Maximum * (Watt) | 24.6 | 20 19% | 40 -63% | 14.3 42% | 20.3 17% | 21.4 13% | 23.8 3% | 20.2 ? 18% | 64.8 ? -163% |
* ... smaller is better
Battery Life
The LapBook SE has a 38 Wh battery, which Chuwi advertises as having eight hours of battery life. Our measurements confirm this, with our test device lasting seven hours and twenty-four minutes in our Wi-Fi battery life test and nine hours and twenty-four minutes in our H.264 video loop battery life test.
Overall, the LapBook SE has good battery life when comparing our test device’s runtimes against our comparison devices.
Our test device performed equally well in 3DMark 11 on battery power as it did on mains power with the Windows 10 power plan set to Best Performance.
| Chuwi LapBook SE Celeron N4100, UHD Graphics 600, 37 Wh | Chuwi LapBook 14 inch 2017 Celeron N3450, HD Graphics 500, 38 Wh | Chuwi Lapbook 12.3 Celeron N3450, HD Graphics 500, 36.48 Wh | Apple MacBook Air 13.3" 1.8 GHz (2017) 5350U, HD Graphics 6000, 54 Wh | Apple MacBook 12 2017 m3-7Y32, HD Graphics 615, 41.4 Wh | Microsoft Surface Go MHN-00003 Pentium 4415Y, UHD Graphics 615, 28 Wh | Average of class Subnotebook | |
|---|---|---|---|---|---|---|---|
| Battery runtime | -30% | -11% | 43% | 22% | -26% | 29% | |
| H.264 (h) | 9.4 | 6.4 -32% | 15.3 ? 63% | ||||
| WiFi v1.3 (h) | 7.4 | 6.2 -16% | 6.6 -11% | 10.6 43% | 9 22% | 7.5 1% | 14 ? 89% |
| Load (h) | 5.8 | 3.3 -43% | 3 -48% | 1.998 ? -66% | |||
| Reader / Idle (h) | 11.6 | 12.9 | 28.6 ? |
Verdict
Pros
Cons
The Chuwi LapBook SE is an affordable Chinese notebook that looks considerably more expensive and premium than it is. The easily swappable SSD is a bonus, but we would have liked to see a USB Type-C port.
The input devices are good too for the money, but the display lets the package down with its poor maximum luminosity. The speakers are another downside too, but fortunately, the headphone jack outputs audio cleanly. Moreover, the quad-core CPU is powerful, but the comparatively weak GPU performance is disheartening.
The Chuwi LapBook SE is an astoundingly good notebook for the money, but it is let down by a dark display, weak speakers and relatively poor GPU performance.
The LapBook SE costs around €245 / $280 including shipping, but not with the customs and taxes associated with importing a device from China. We would recommend researching the risks of importing a device from China too as there is no guarantee of manufacturer’s warranty and there may be additional taxes.
Chuwi LapBook SE
- 10/02/2018 v6 (old)
Klaus Hinum
Price comparison

