HP mt43 (A8-9600B, SSD, FHD) Thin Client Review
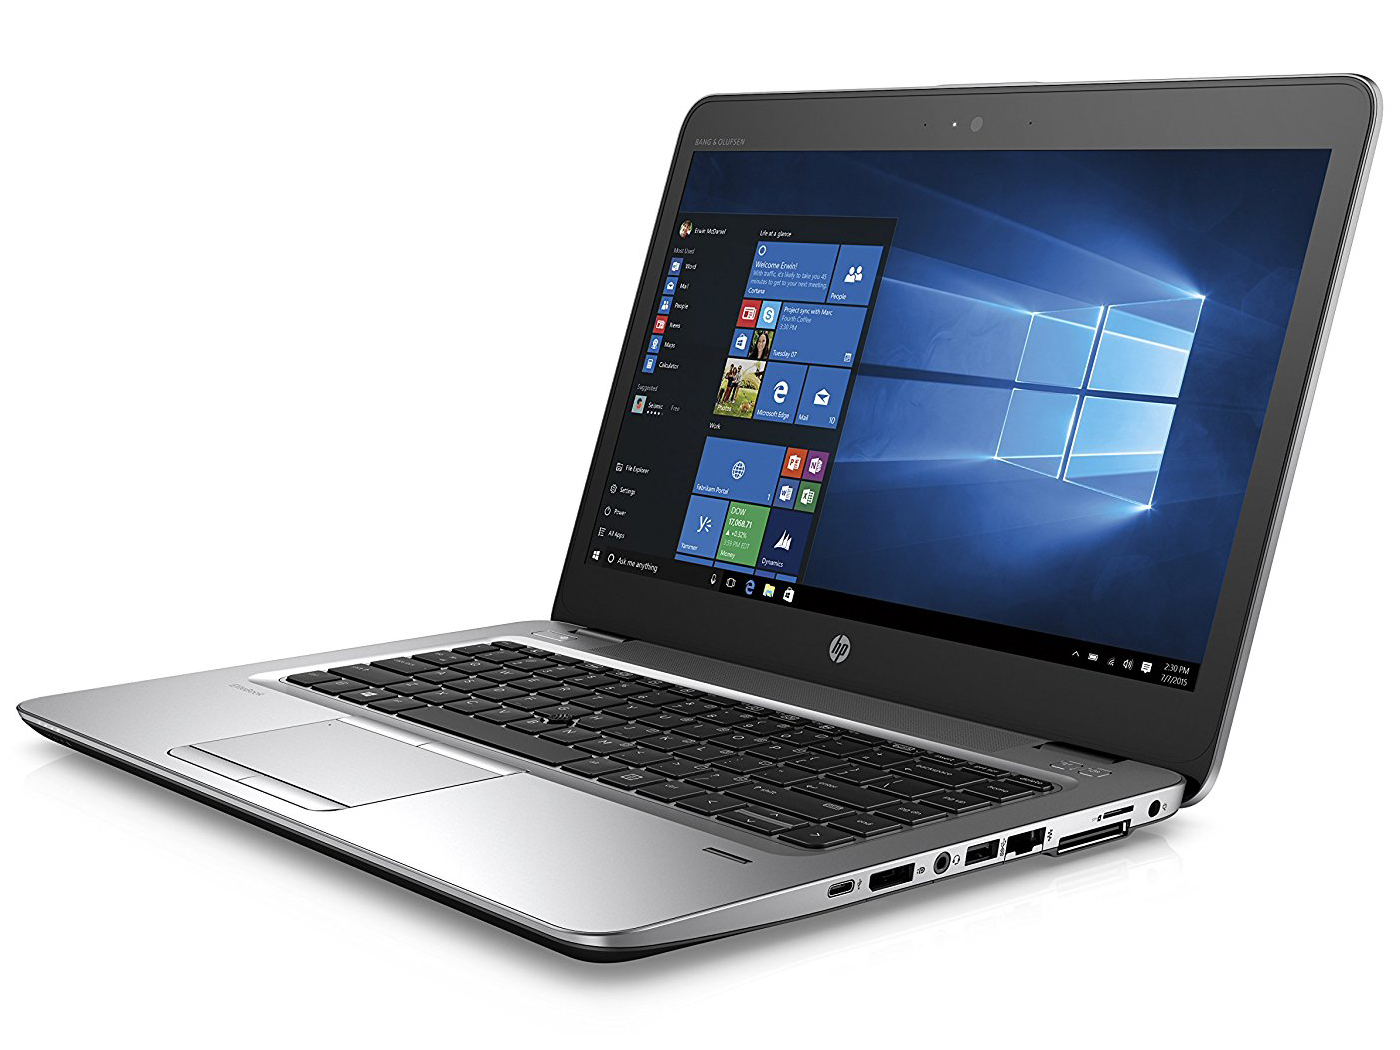
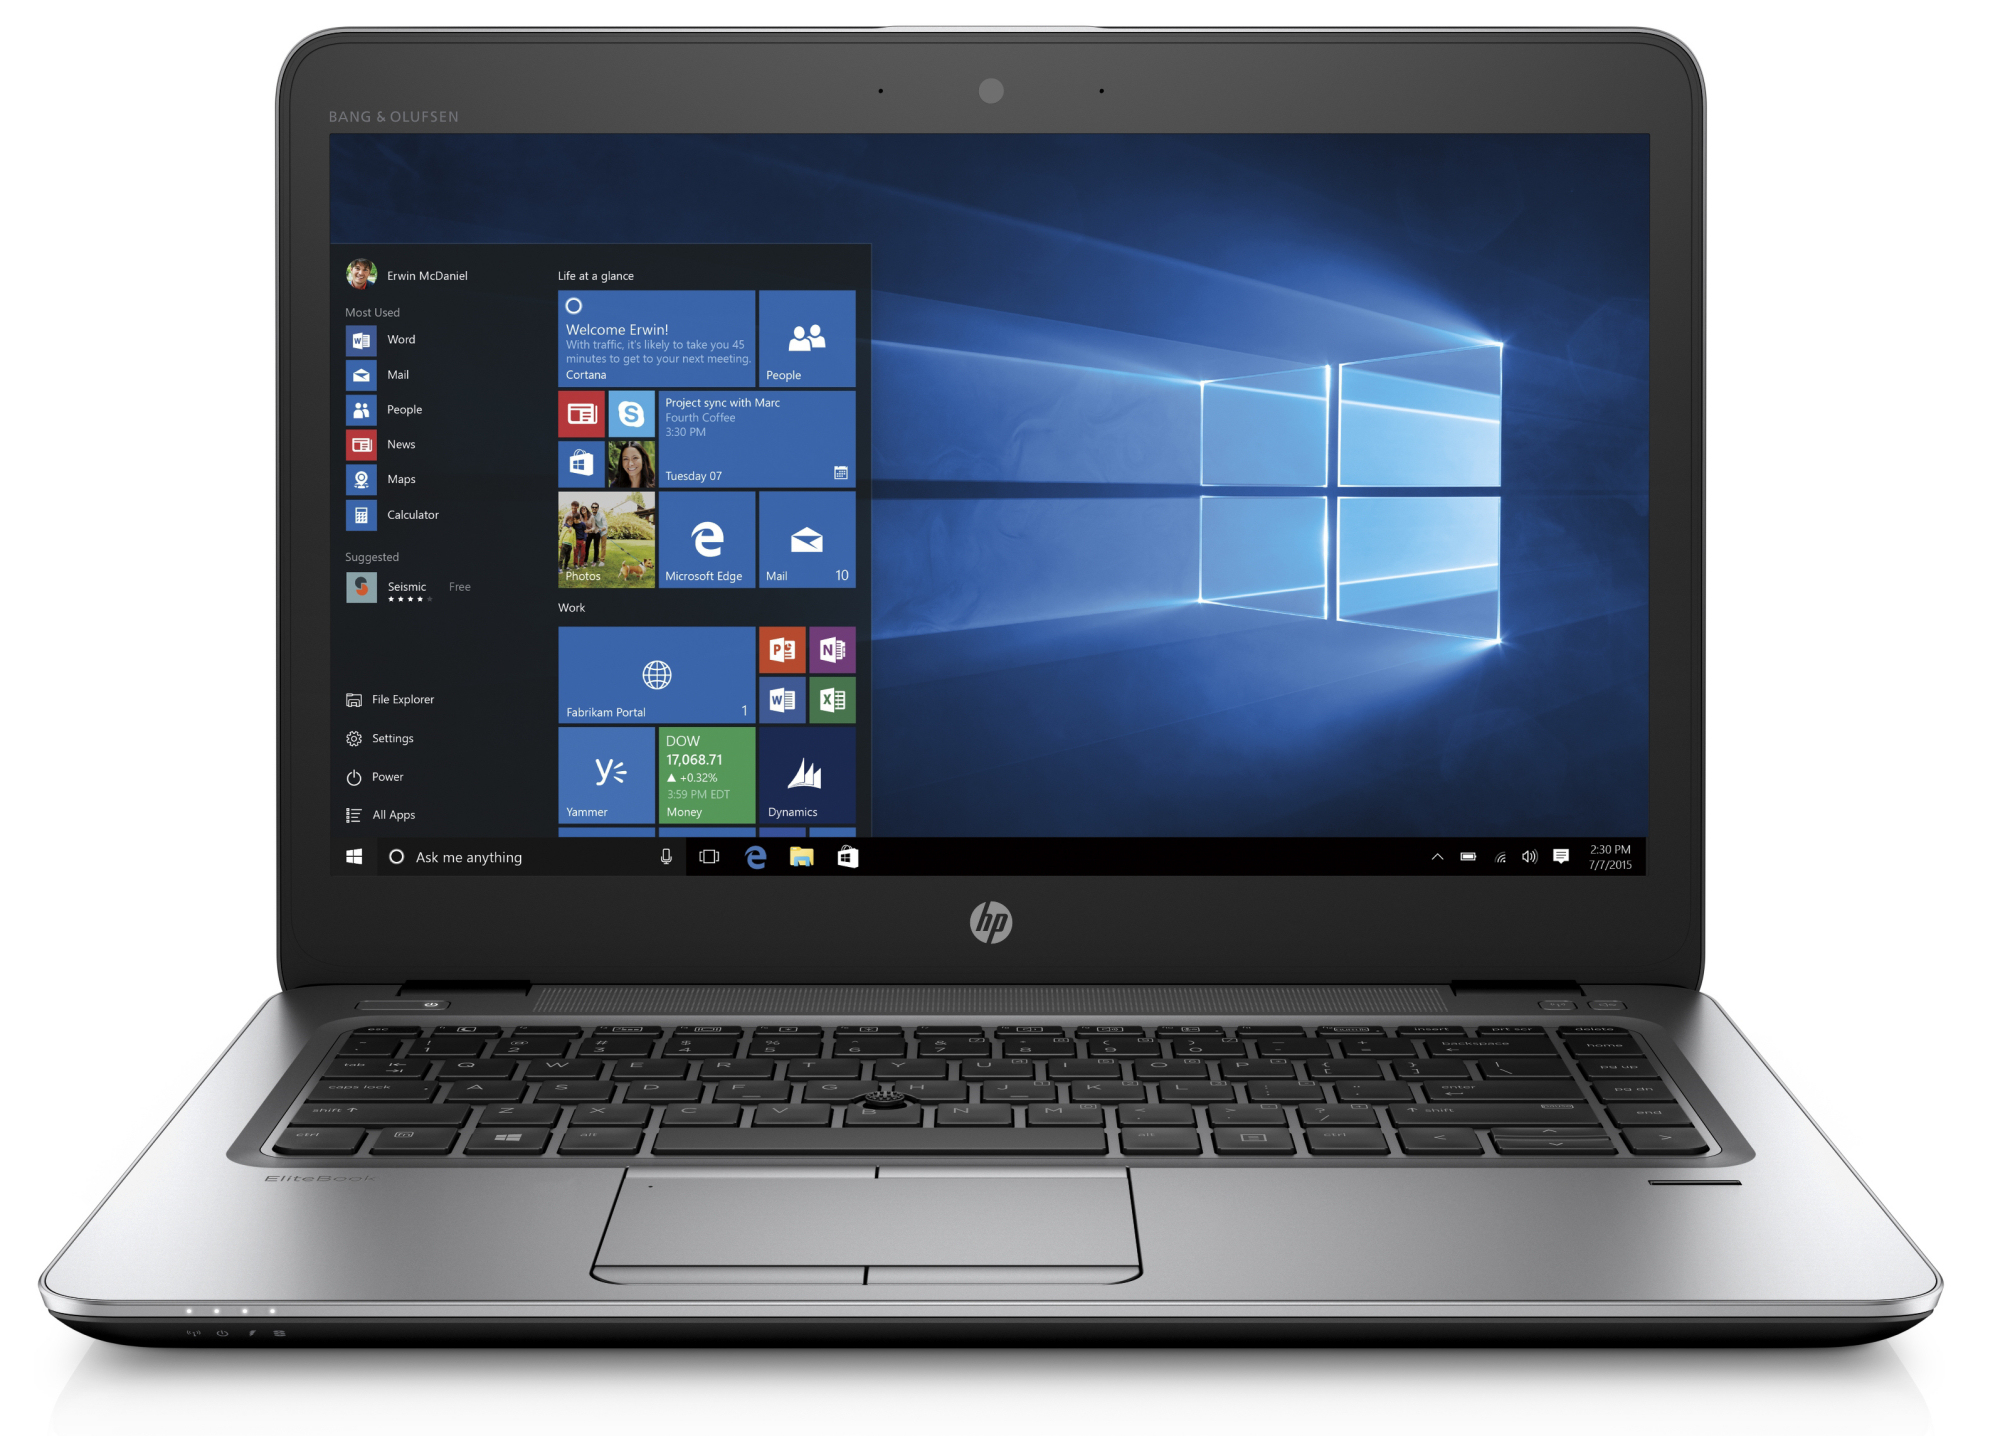
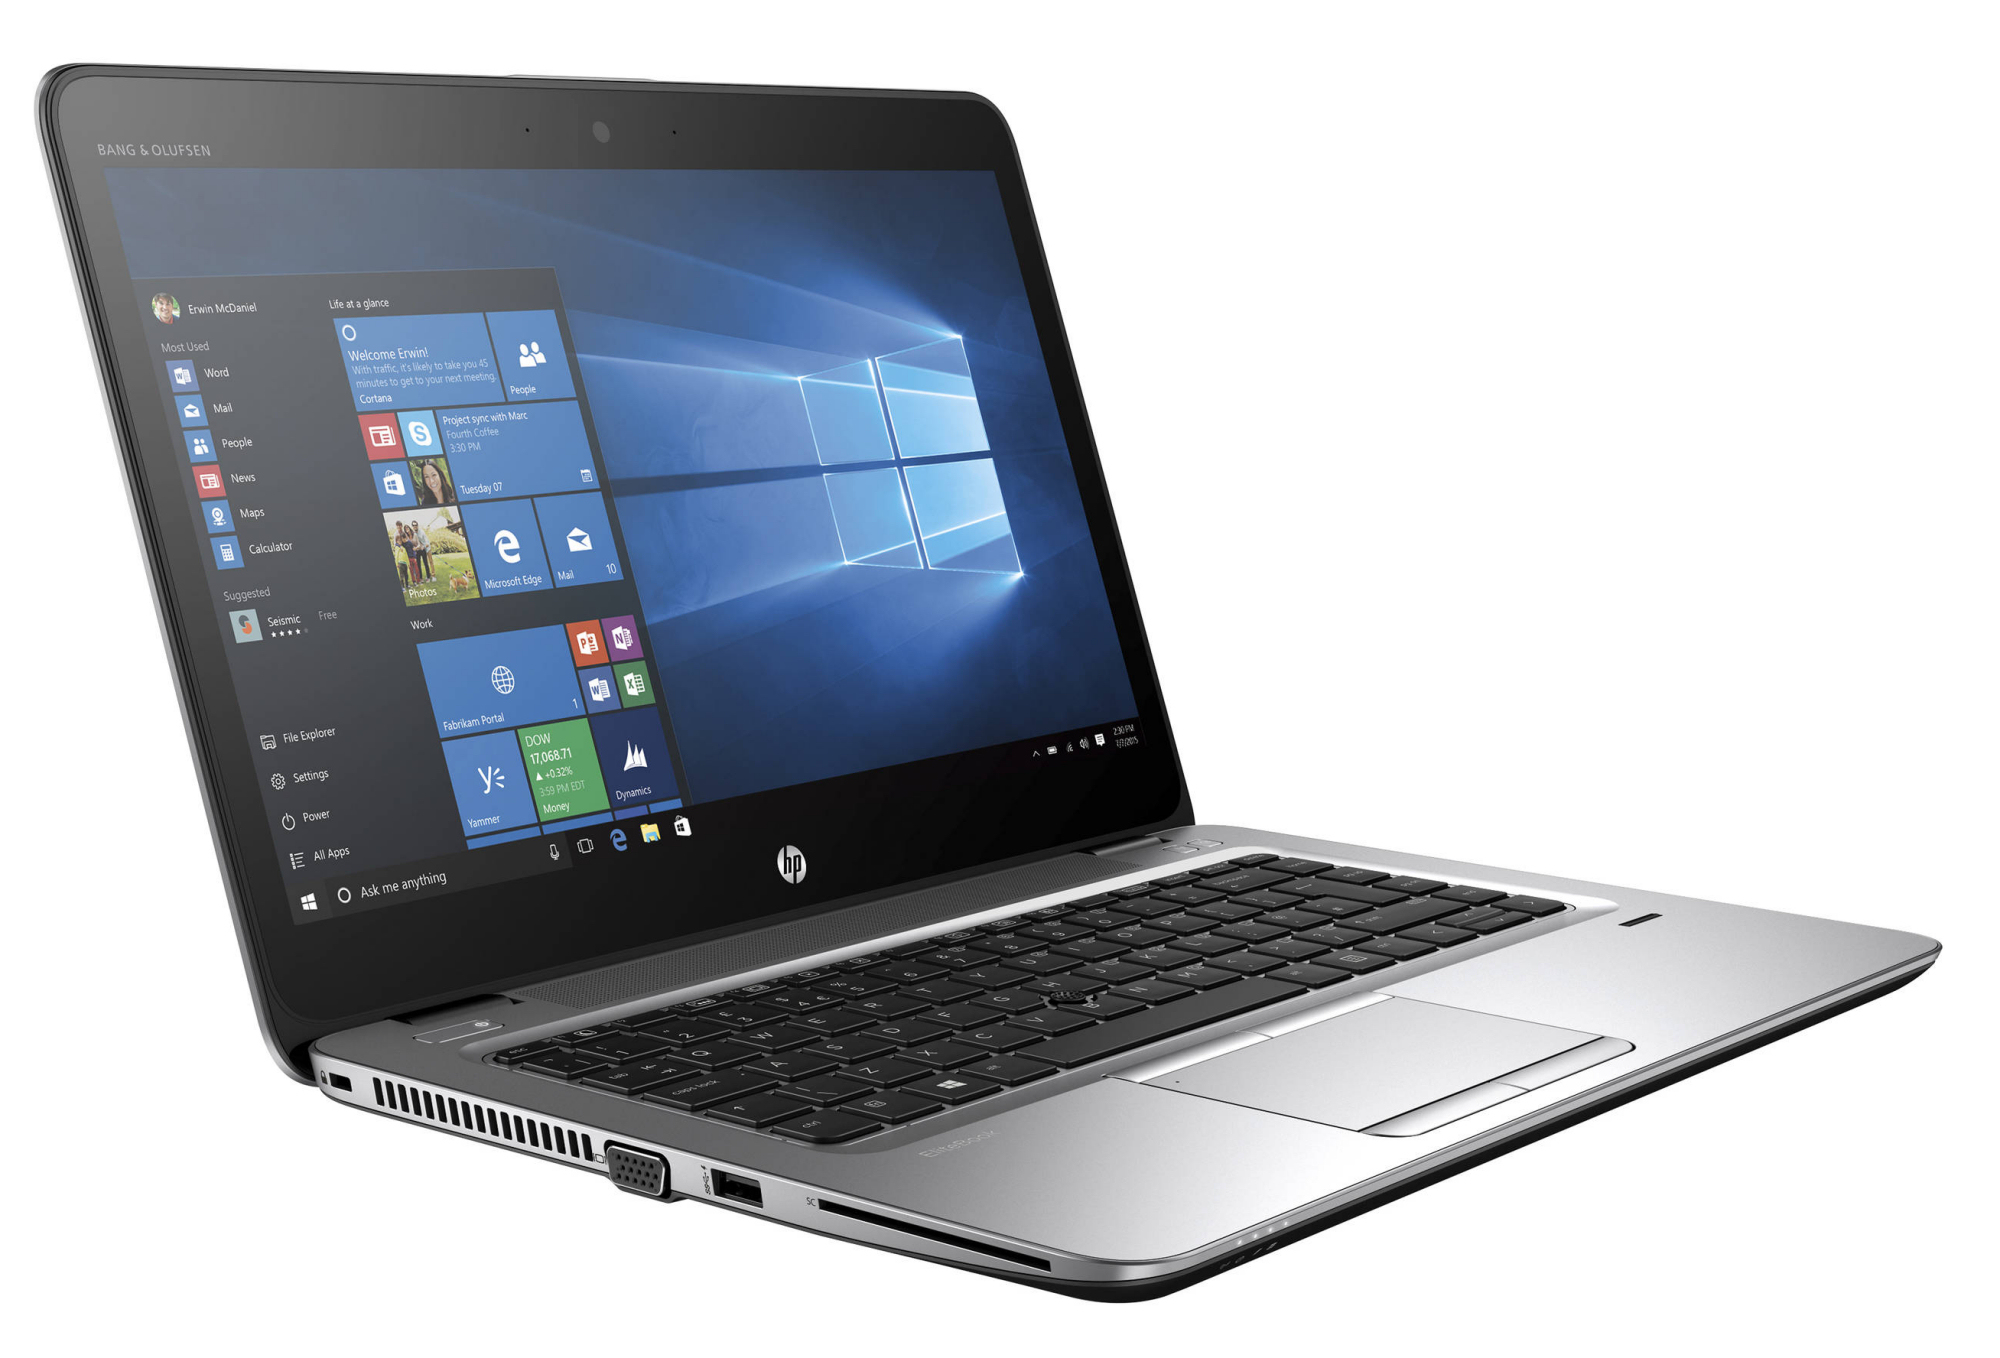
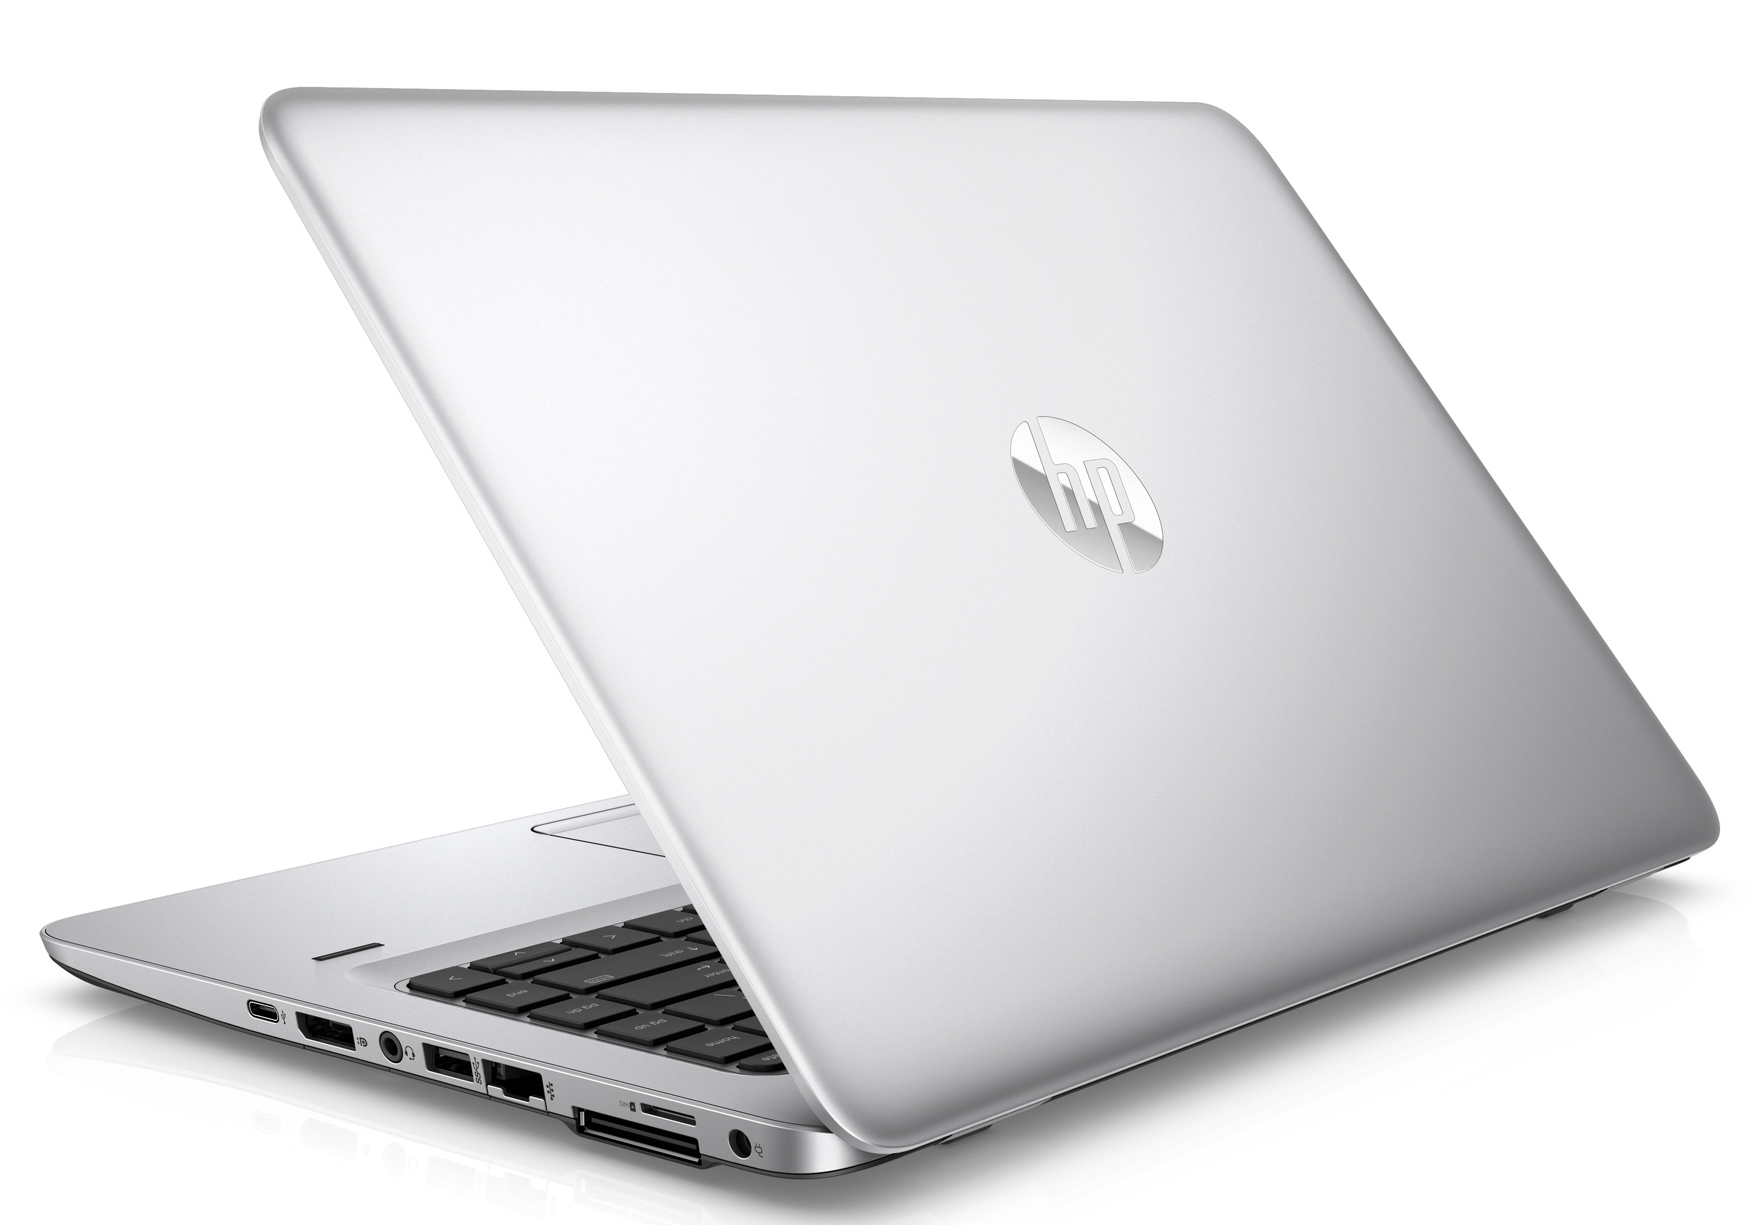
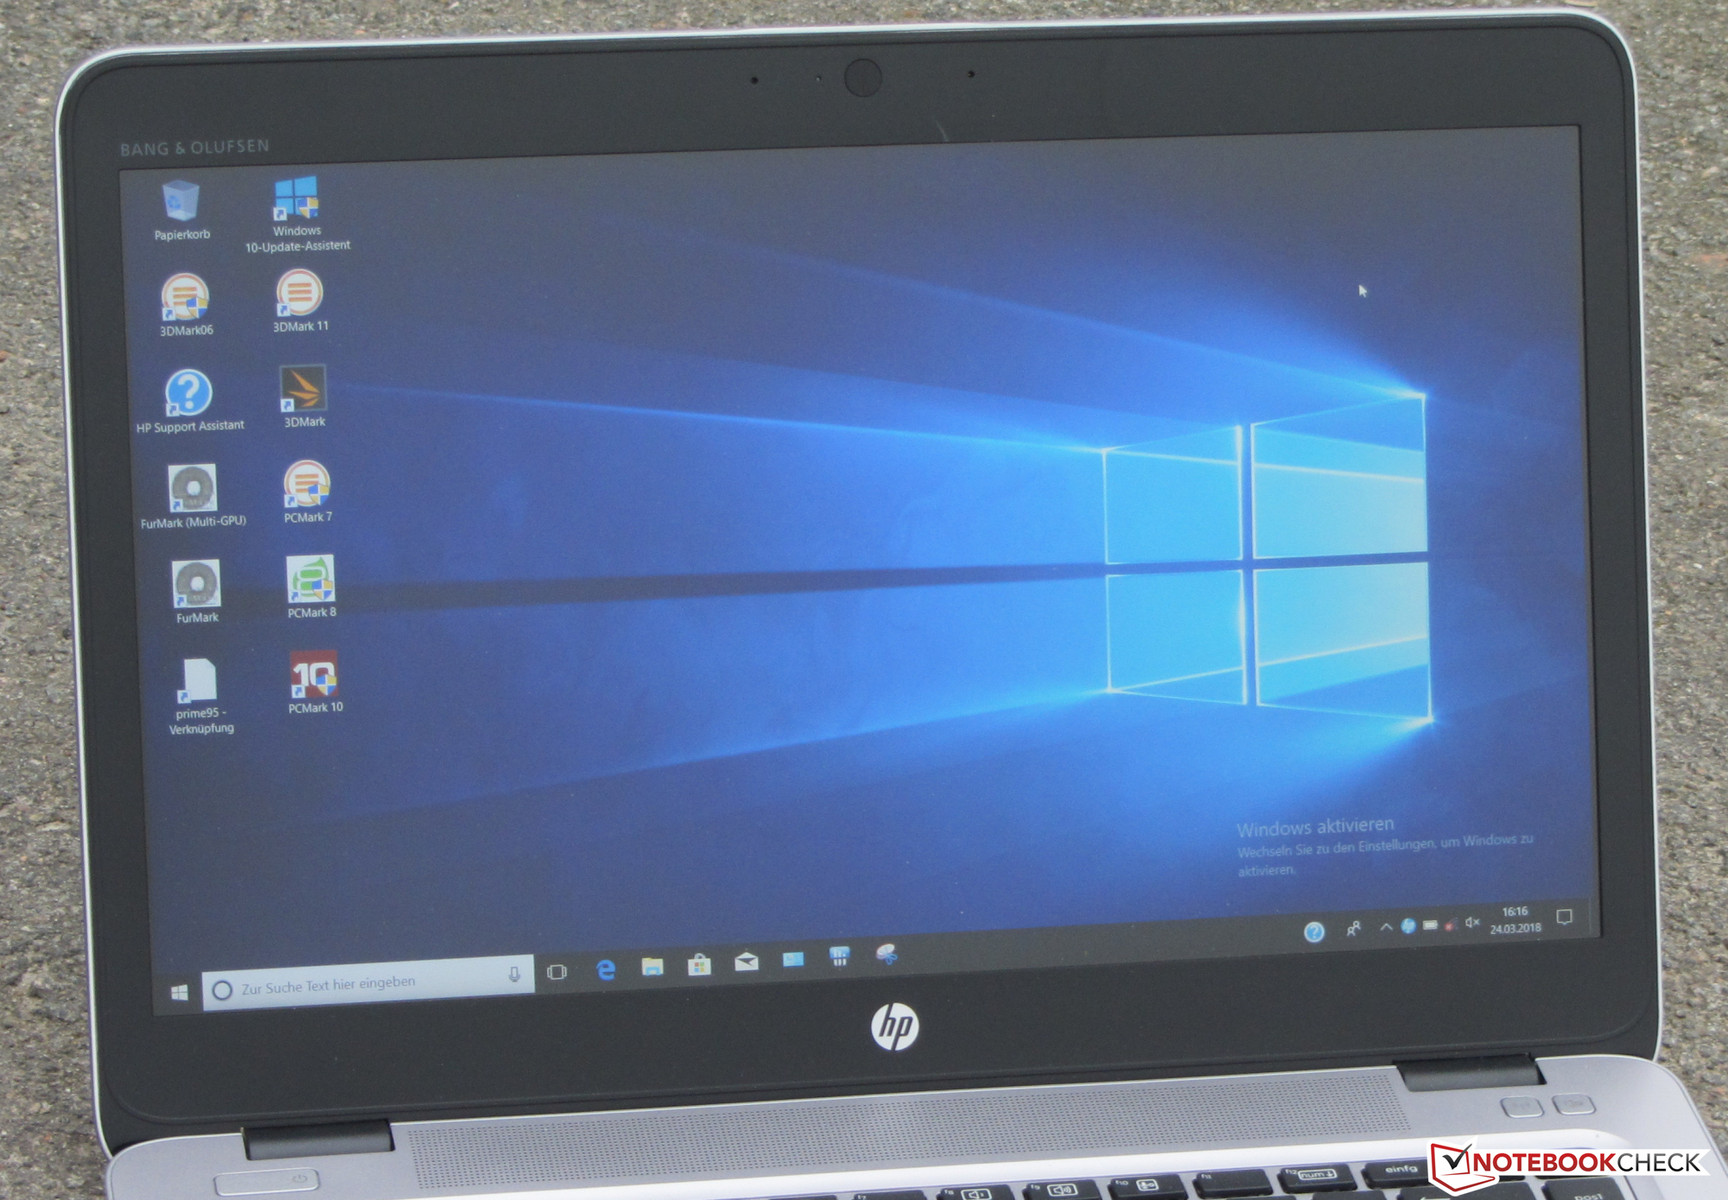
The HP mt43 Mobile Thin Client will look familiar to many readers, since it is a renamed EliteBook 745 G4, which is also identical in construction to the EliteBook 840 G4. The 14-incher is driven by an AMD APU of the Bristol-Ridge generation. Competitors include devices such as the Lenovo ThinkPad T480s, the Dell Latitude 5490-TD70X, the Toshiba Tecra X40-D, and the Acer TravelMate P449-G2-M.
Since the mt43 has an identical construction as the EliteBook 840 G4, we will not discuss the case, connectivity, input devices, or speakers here, and you can find this information in the EliteBook 840 G4 Review.
Note: In order to run our tests, we installed Windows 10 Pro (64 Bit) on the computer. HP delivers the Thin Client with Windows 10 IoT Enterprise for Thin Clients 64.
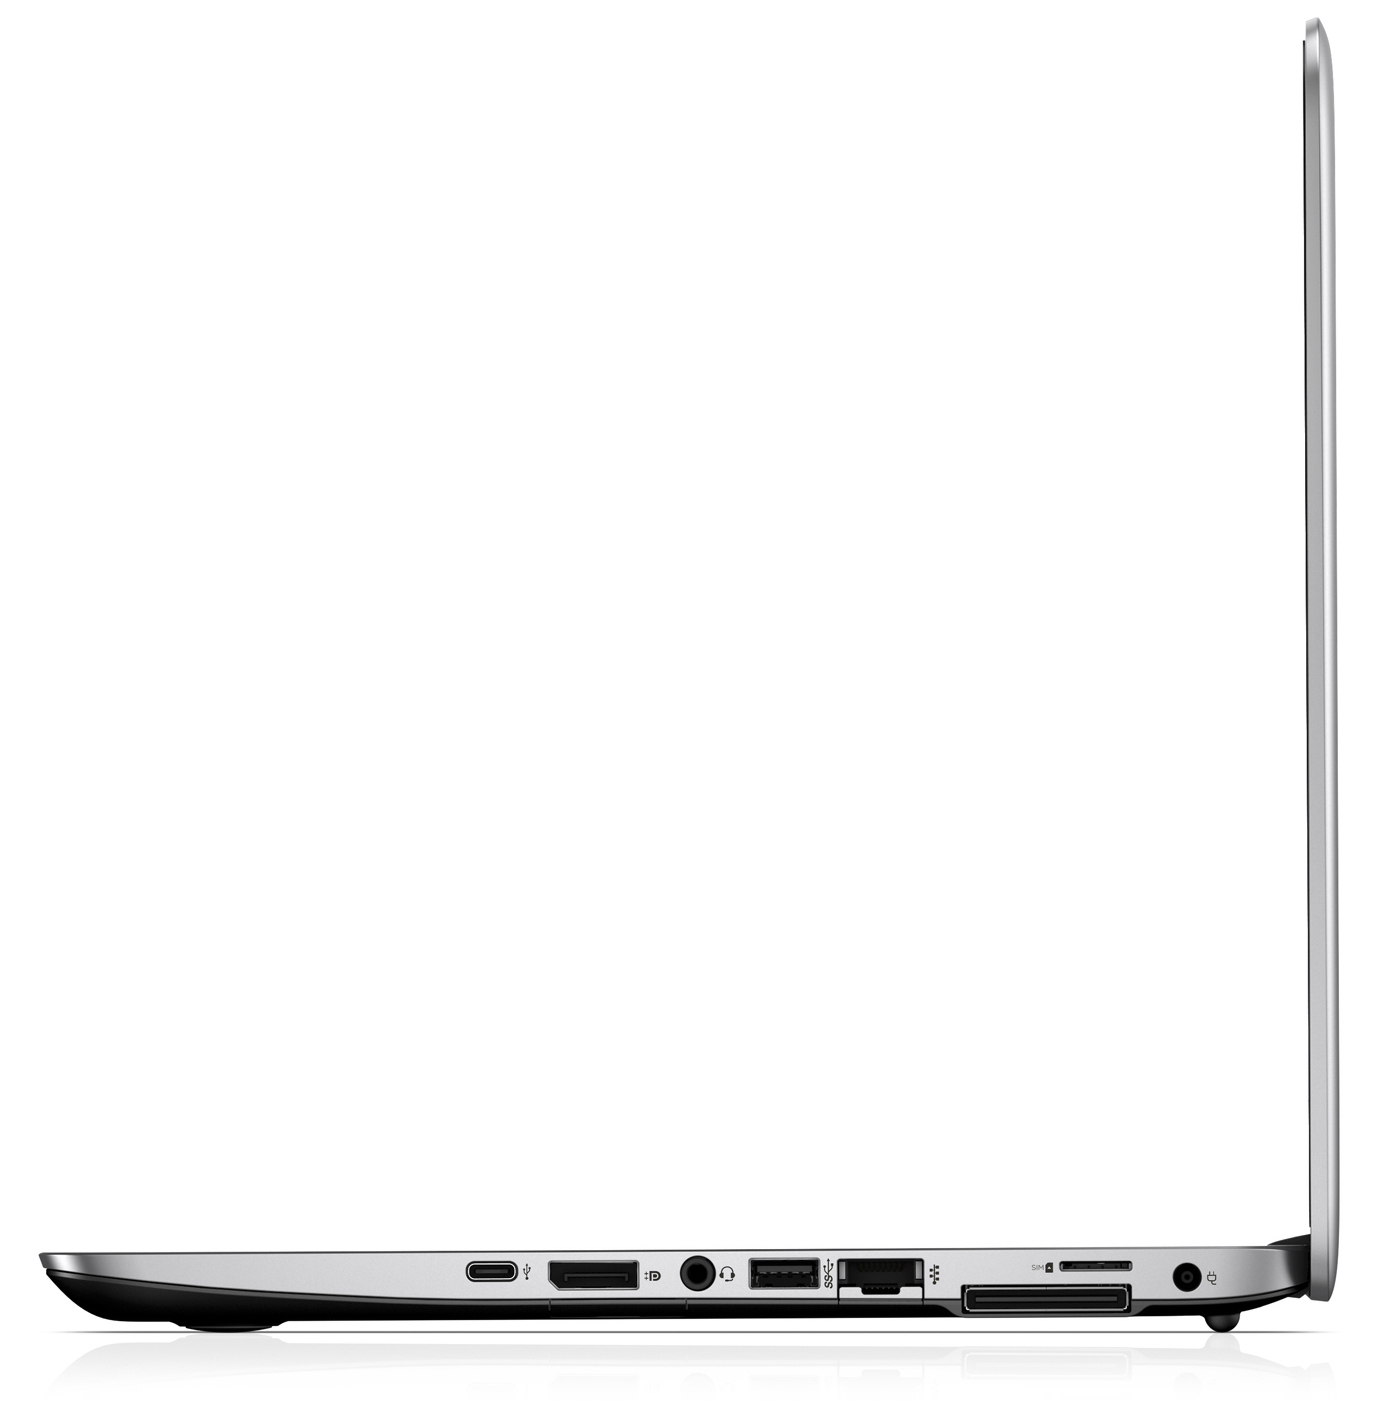
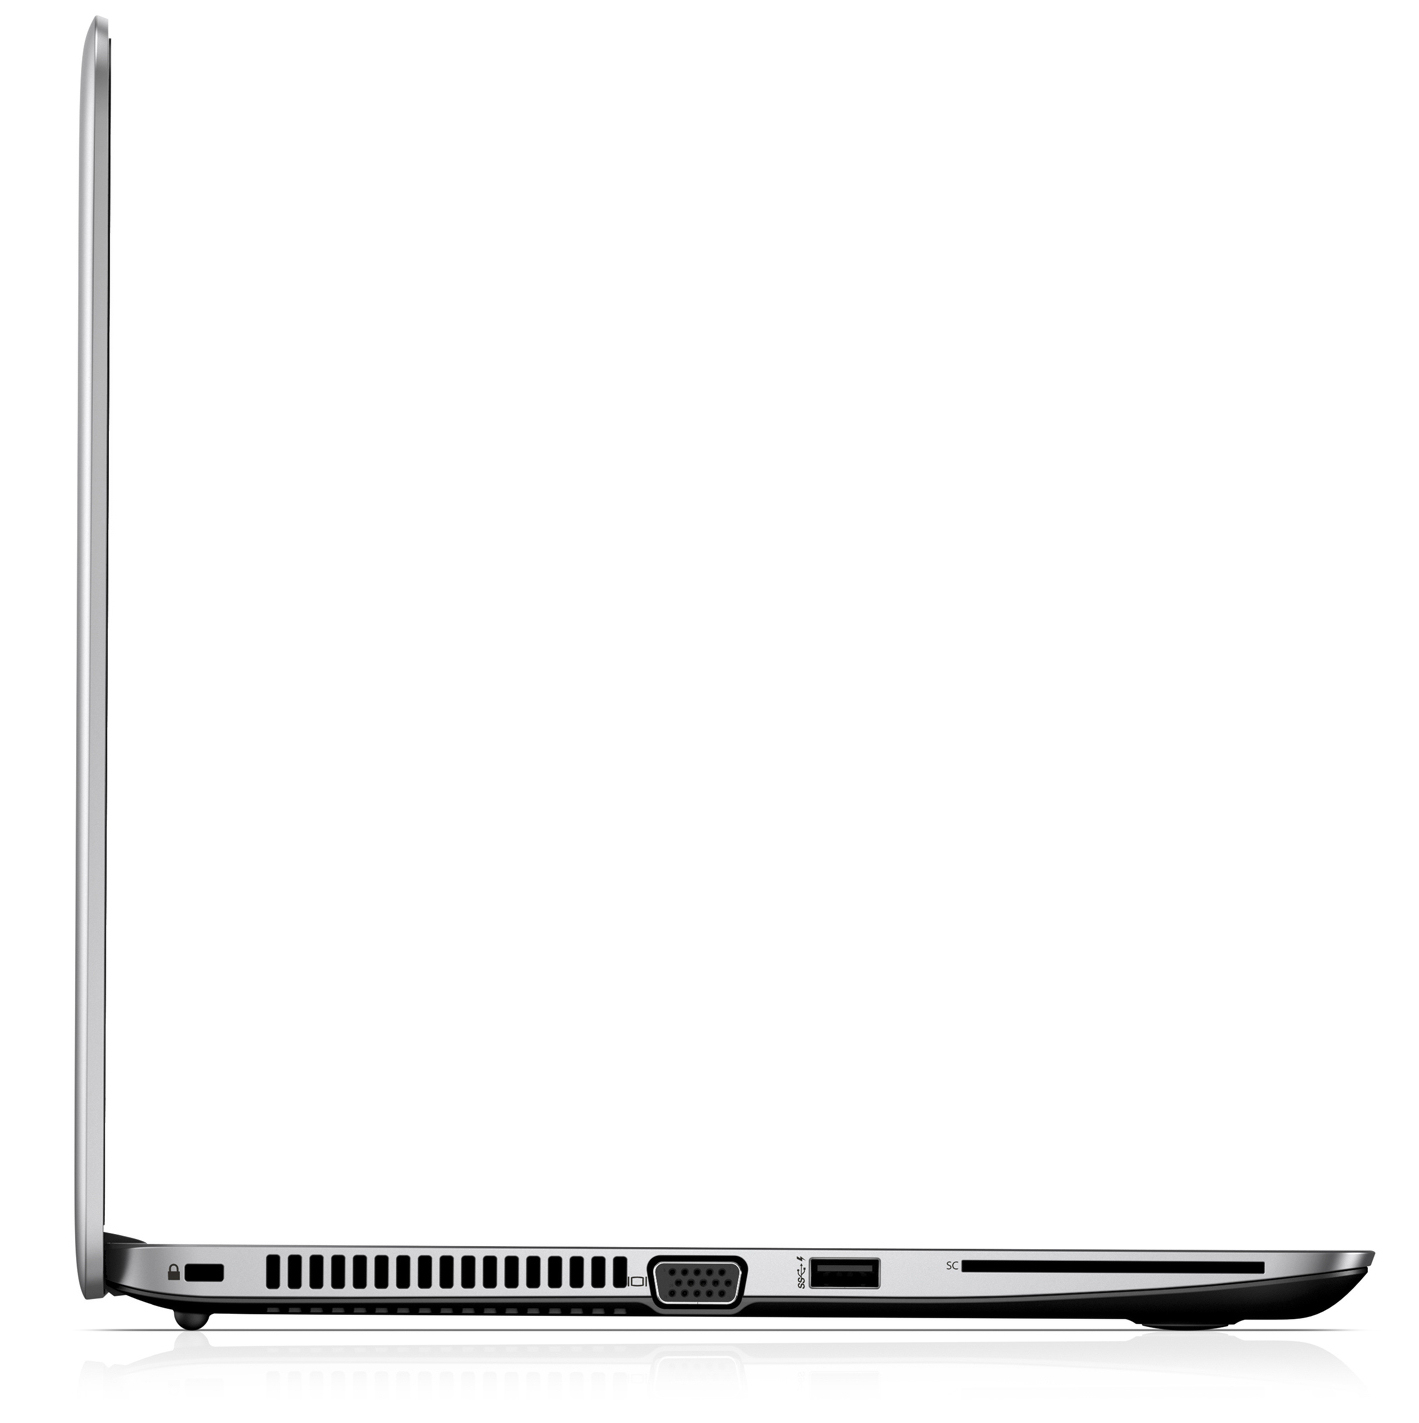
Connections
| SD Card Reader | |
| average JPG Copy Test (av. of 3 runs) | |
| Dell Latitude 5490-TD70X (Toshiba Exceria Pro SDXC 64 GB UHS-II) | |
| Lenovo ThinkPad T480s-20L8S02D00 (Toshiba Exceria Pro SDXC 64 GB UHS-II) | |
| Toshiba Tecra X40-D | |
| HP EliteBook 840 G4-Z2V49ET ABD (Toshiba Exceria Pro SDXC 64 GB UHS-II) | |
| HP mt21 (Toshiba Exceria Pro SDXC 64 GB UHS-II) | |
| HP EliteBook 745 G3 | |
| HP mt43 (Toshiba Exceria Pro SDXC 64 GB UHS-II) | |
| Average of class Office (22.4 - 198.5, n=22, last 2 years) | |
| Acer TravelMate P449-G2-M-56CD (Toshiba Exceria Pro SDXC 64 GB UHS-II) | |
| maximum AS SSD Seq Read Test (1GB) | |
| Dell Latitude 5490-TD70X (Toshiba Exceria Pro SDXC 64 GB UHS-II) | |
| Lenovo ThinkPad T480s-20L8S02D00 (Toshiba Exceria Pro SDXC 64 GB UHS-II) | |
| Toshiba Tecra X40-D | |
| HP mt21 (Toshiba Exceria Pro SDXC 64 GB UHS-II) | |
| HP EliteBook 840 G4-Z2V49ET ABD (Toshiba Exceria Pro SDXC 64 GB UHS-II) | |
| HP EliteBook 745 G3 | |
| HP mt43 (Toshiba Exceria Pro SDXC 64 GB UHS-II) | |
| Average of class Office (27.4 - 249, n=20, last 2 years) | |
| Acer TravelMate P449-G2-M-56CD (Toshiba Exceria Pro SDXC 64 GB UHS-II) | |
Display - The HP Thin Client has a bright display whose viewing angles are not stable
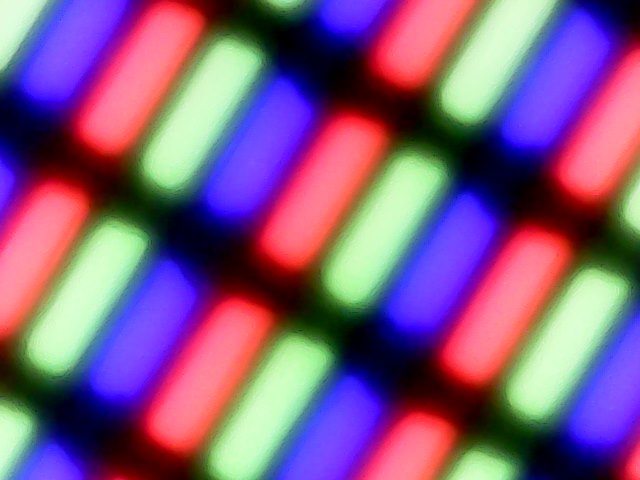
The matte 14-inch display of the mt43 has a native resolution of 1920x1080 pixels. The brightness (357.7 cd/m²) knows how to please. While the contrast (798:1) can be regarded as quite decent, considering the price level of the Thin Client, we would have expected a value beyond 1000:1.
Unfortunately, at brightness levels of 90% and lower, the display shows PWM flickering at a frequency of 1000 Hz. However, at this frequency even sensitive people should be spared headaches or eye troubles.
| |||||||||||||||||||||||||
Brightness Distribution: 84 %
Center on Battery: 282 cd/m²
Contrast: 798:1 (Black: 0.49 cd/m²)
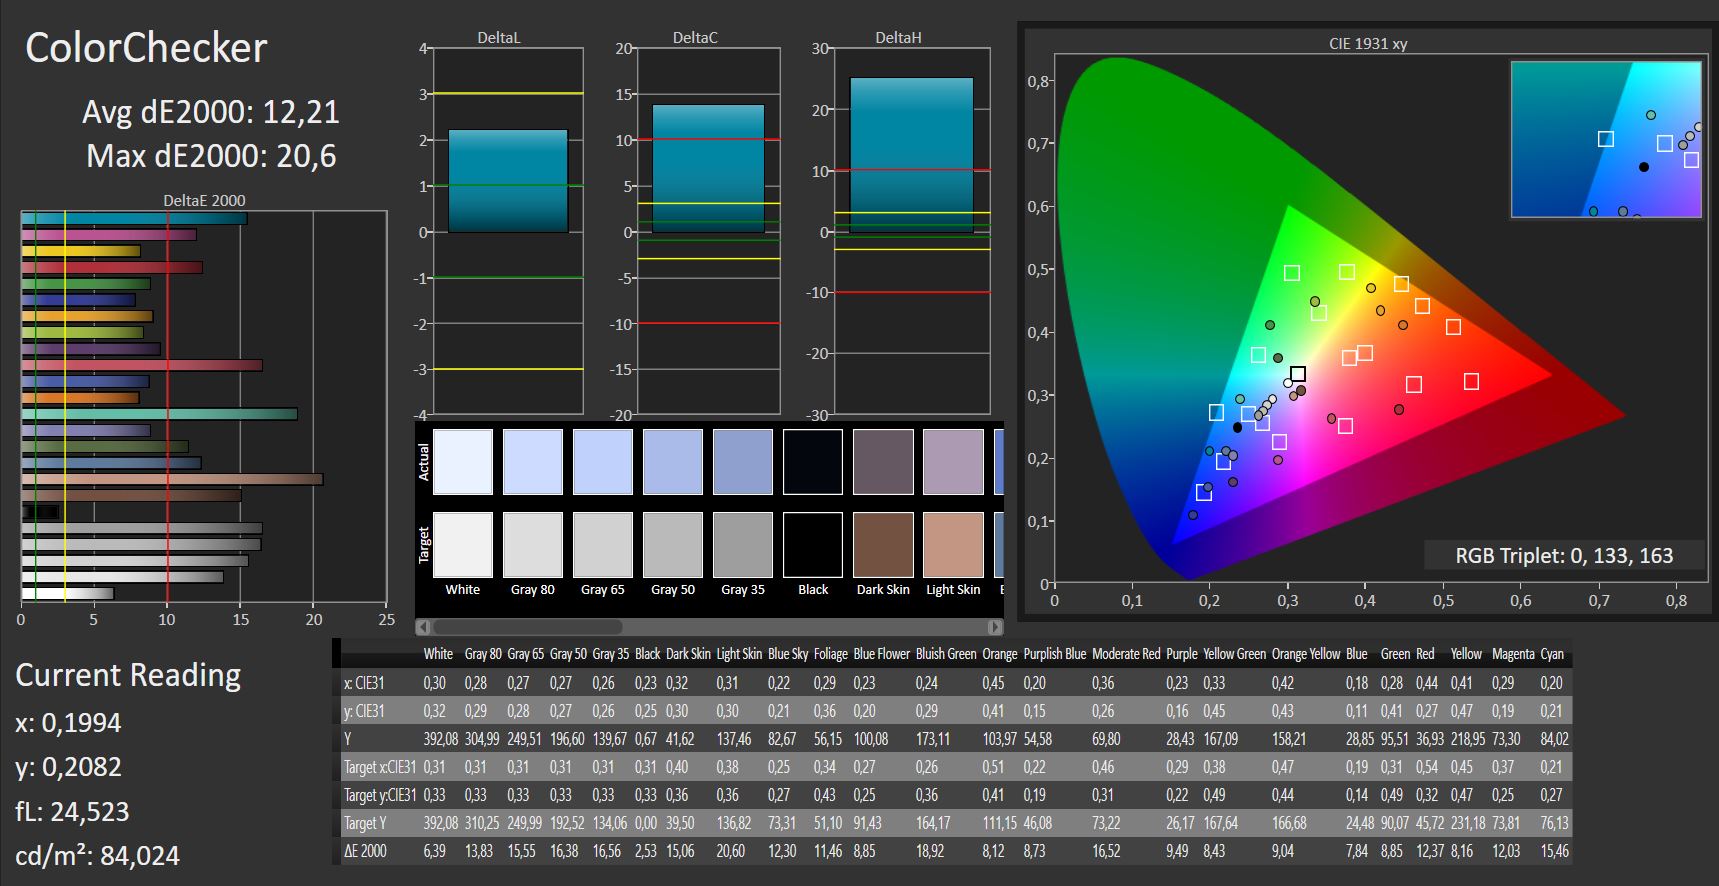
ΔE ColorChecker Calman: 12.21 | ∀{0.5-29.43 Ø4.73}
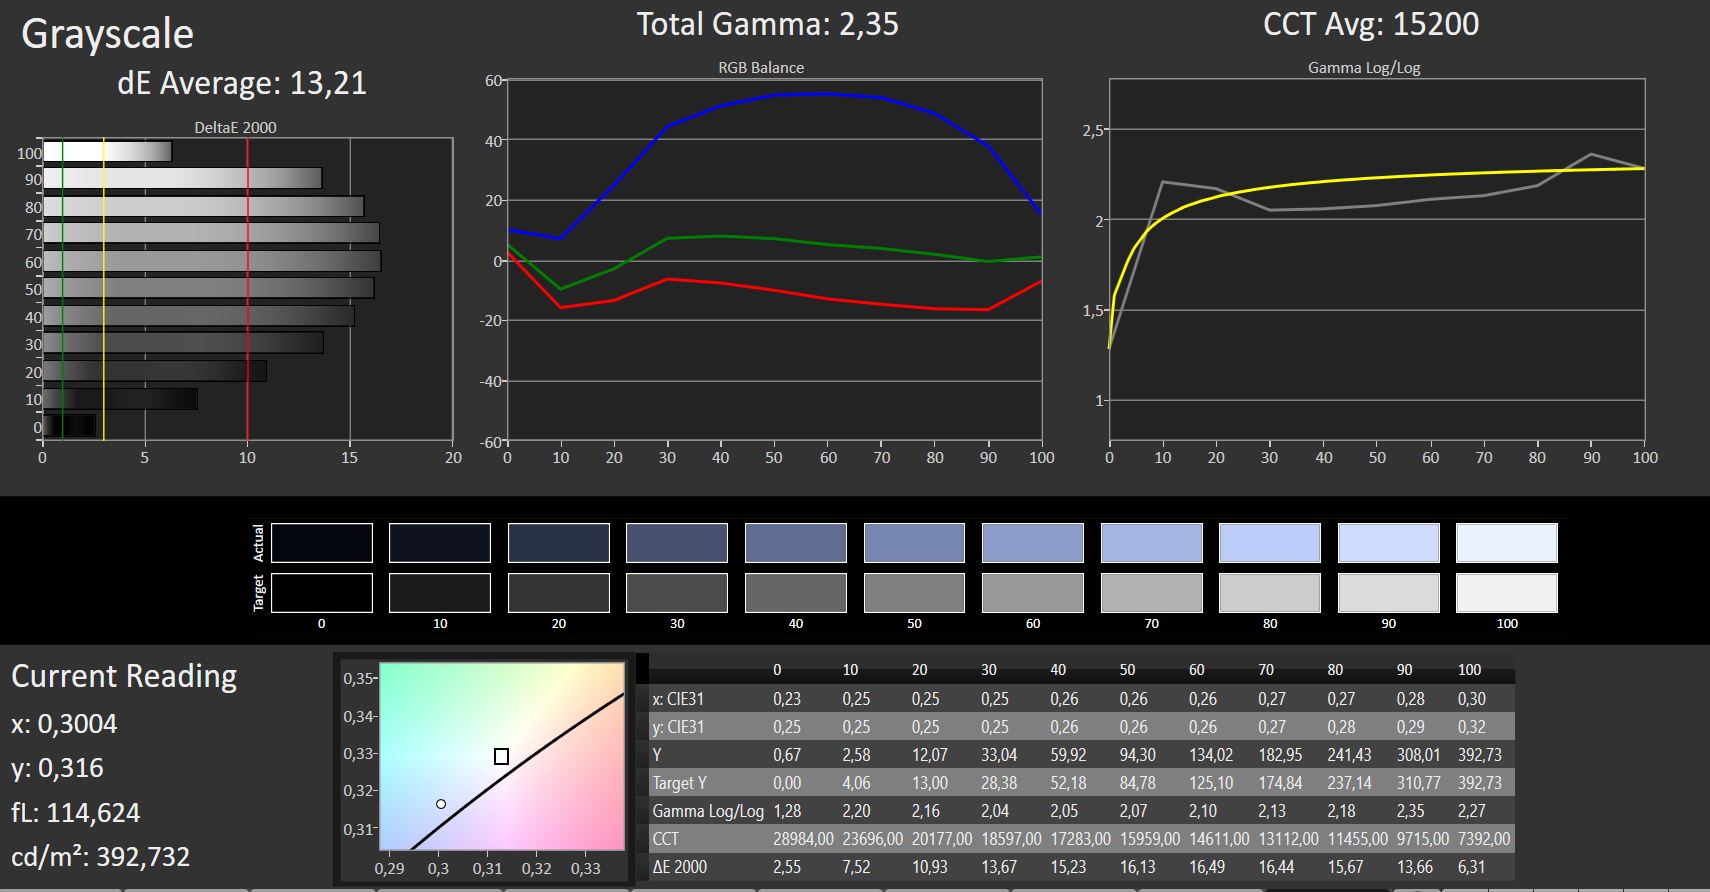
ΔE Greyscale Calman: 13.21 | ∀{0.09-98 Ø4.97}
75% sRGB (Argyll 1.6.3 3D)
48% AdobeRGB 1998 (Argyll 1.6.3 3D)
51.3% AdobeRGB 1998 (Argyll 3D)
74.8% sRGB (Argyll 3D)
49.86% Display P3 (Argyll 3D)
Gamma: 2.35
CCT: 15200 K
| HP mt43 TN LED, 1920x1080, 14" | HP EliteBook 840 G4-Z2V49ET ABD TN, 1920x1080, 14" | HP EliteBook 745 G3 IPS-Panel, 2560x1440, 14" | Lenovo ThinkPad T480s-20L8S02D00 IPS, 2560x1440, 14" | Dell Latitude 5490-TD70X IPS, 1920x1080, 14" | Toshiba Tecra X40-D IPS, 1920x1080, 14" | Acer TravelMate P449-G2-M-56CD IPS, 1920x1080, 14" | |
|---|---|---|---|---|---|---|---|
| Display | 11% | 42% | 40% | -27% | -18% | -18% | |
| Display P3 Coverage (%) | 49.86 | 55.8 12% | 75.7 52% | 72.8 46% | 36.28 -27% | 40.55 -19% | 41.04 -18% |
| sRGB Coverage (%) | 74.8 | 80.7 8% | 95.8 28% | 97.9 31% | 54.6 -27% | 61 -18% | 61.2 -18% |
| AdobeRGB 1998 Coverage (%) | 51.3 | 57.7 12% | 74.5 45% | 74.1 44% | 37.48 -27% | 41.89 -18% | 42.47 -17% |
| Response Times | 15% | 2% | 5% | -10% | 8% | 5% | |
| Response Time Grey 50% / Grey 80% * (ms) | 47 ? | 39 ? 17% | 46.8 ? -0% | 38.4 ? 18% | 46.9 ? -0% | 38 ? 19% | 39 ? 17% |
| Response Time Black / White * (ms) | 26 ? | 23 ? 12% | 25.2 ? 3% | 28.4 ? -9% | 31.2 ? -20% | 26.8 ? -3% | 28 ? -8% |
| PWM Frequency (Hz) | 1000 ? | 20410 ? | 25000 ? | ||||
| Screen | -5% | 21% | 27% | 11% | 11% | 7% | |
| Brightness middle (cd/m²) | 391 | 346 -12% | 319 -18% | 352 -10% | 227 -42% | 283.9 -27% | 271 -31% |
| Brightness (cd/m²) | 358 | 317 -11% | 301 -16% | 343 -4% | 211 -41% | 261 -27% | 256 -28% |
| Brightness Distribution (%) | 84 | 86 2% | 74 -12% | 91 8% | 88 5% | 85 1% | 85 1% |
| Black Level * (cd/m²) | 0.49 | 0.86 -76% | 0.29 41% | 0.46 6% | 0.19 61% | 0.25 49% | 0.43 12% |
| Contrast (:1) | 798 | 402 -50% | 1100 38% | 765 -4% | 1195 50% | 1136 42% | 630 -21% |
| Colorchecker dE 2000 * | 12.21 | 8.64 29% | 7.23 41% | 3.3 73% | 5.6 54% | 6.4 48% | 5.03 59% |
| Colorchecker dE 2000 max. * | 20.6 | 13.58 34% | 7.3 65% | 22.4 -9% | 18.7 9% | 11.9 42% | |
| Greyscale dE 2000 * | 13.21 | 11.24 15% | 6 55% | 5.3 60% | 2.4 82% | 6.3 52% | 4.02 70% |
| Gamma | 2.35 94% | 2.62 84% | 2.14 103% | 2.22 99% | 2.44 90% | 2.39 92% | 2.31 95% |
| CCT | 15200 43% | 12530 52% | 6904 94% | 6452 101% | 6506 100% | 6511 100% | 6659 98% |
| Color Space (Percent of AdobeRGB 1998) (%) | 48 | 52 8% | 65.8 37% | 68.4 43% | 34.5 -28% | 38 -21% | 39 -19% |
| Color Space (Percent of sRGB) (%) | 75 | 80 7% | 95.3 27% | 98 31% | 54.4 -27% | 60 -20% | 61 -19% |
| Total Average (Program / Settings) | 7% /
0% | 22% /
23% | 24% /
27% | -9% /
0% | 0% /
4% | -2% /
1% |
* ... smaller is better
Screen Flickering / PWM (Pulse-Width Modulation)
| Screen flickering / PWM detected | 1000 Hz | ≤ 90 % brightness setting | 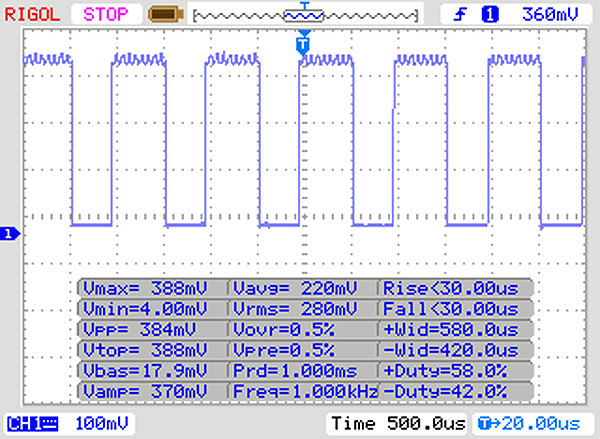 |
The display backlight flickers at 1000 Hz (worst case, e.g., utilizing PWM) Flickering detected at a brightness setting of 90 % and below. There should be no flickering or PWM above this brightness setting. The frequency of 1000 Hz is quite high, so most users sensitive to PWM should not notice any flickering. In comparison: 52 % of all tested devices do not use PWM to dim the display. If PWM was detected, an average of 7798 (minimum: 5 - maximum: 343500) Hz was measured. | |||
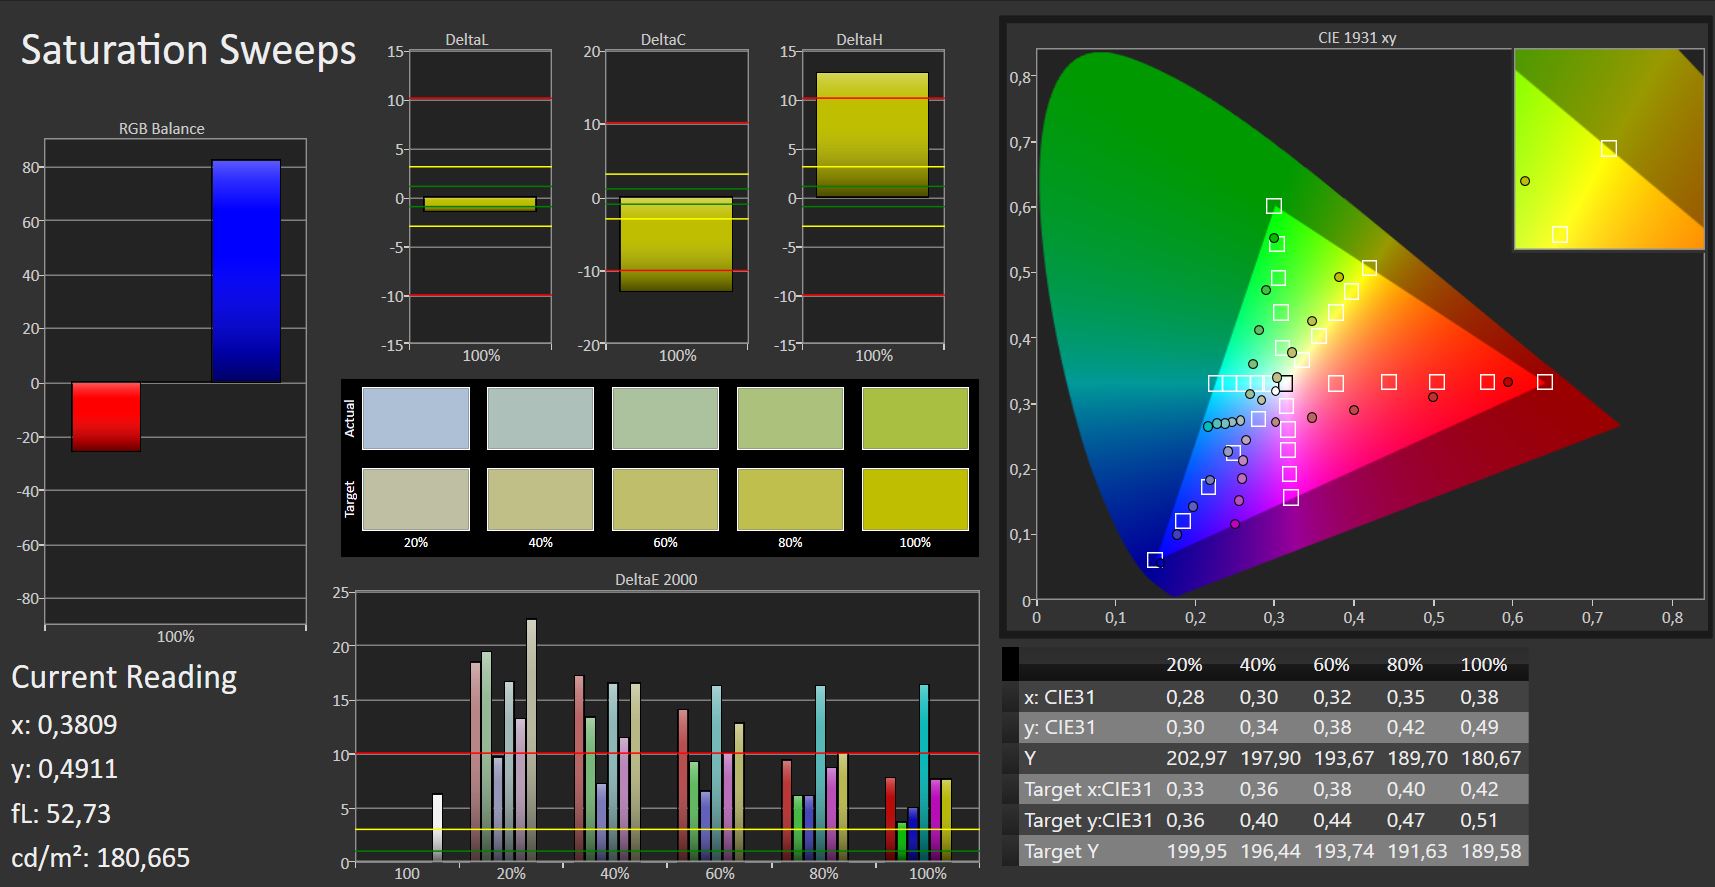
In the state of delivery, the display shows a DeltaE-2000 color deviation of 12.21, which is far from the target range of DeltaE of smaller than 3. In addition, the display suffers from a clear blue tint.
Display Response Times
| ↔ Response Time Black to White | ||
|---|---|---|
| 26 ms ... rise ↗ and fall ↘ combined | ↗ 22 ms rise | 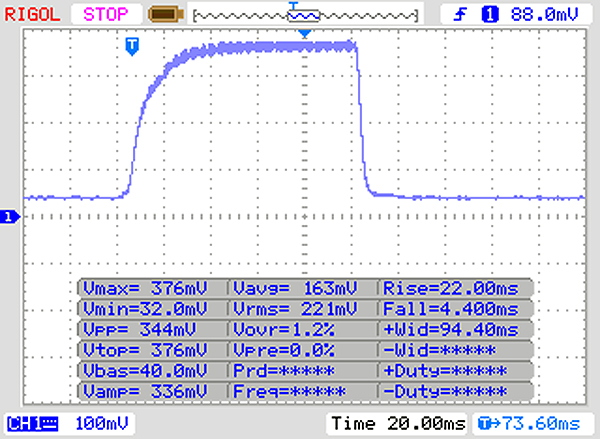 |
| ↘ 4 ms fall | ||
| The screen shows relatively slow response rates in our tests and may be too slow for gamers. In comparison, all tested devices range from 0.1 (minimum) to 240 (maximum) ms. » 62 % of all devices are better. This means that the measured response time is worse than the average of all tested devices (19.9 ms). | ||
| ↔ Response Time 50% Grey to 80% Grey | ||
| 47 ms ... rise ↗ and fall ↘ combined | ↗ 29 ms rise | 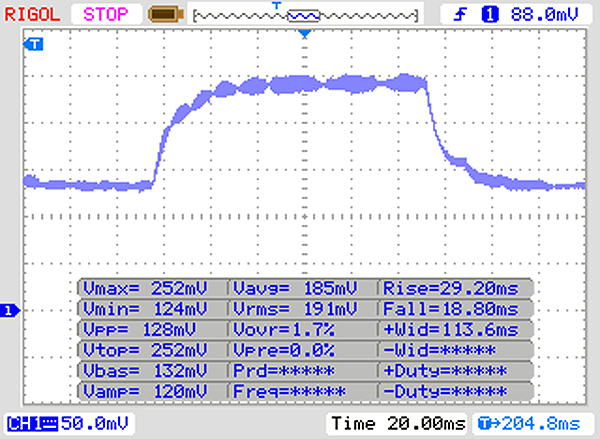 |
| ↘ 18 ms fall | ||
| The screen shows slow response rates in our tests and will be unsatisfactory for gamers. In comparison, all tested devices range from 0.165 (minimum) to 636 (maximum) ms. » 81 % of all devices are better. This means that the measured response time is worse than the average of all tested devices (31.1 ms). | ||
HP has equipped the 14-incher with a TN panel that does not have stable viewing angles, so you cannot read what is on the display from all positions. Thanks to the high brightness of the display, you can use the notebook also outdoors.
AMD's Vari-Bright function is turned on by default. This ensures that the maximum display brightness is lowered to 282 cd/m² in battery operation. If you do not like this adjustment, you need to turn off Vari-Bright, which you can do on the "Display" tab of the "Radeon Settings" software.
Performance - The HP PC does not offer any excess performance
With the mt43, Hewlett Packard offers a mobile Thin Client in the 14-inch format. The device is based on the EliteBook 745 G4 and offers sufficient performance for the envisioned usage scenario. You have to pay between 1100 and 1200 Euros (~$1350-1475; $799 in the US) for the notebook.
Processor
The mt43 uses an AMD Pro A8-9600B (Bristol Ridge) APU. This is an APU for the business segment. AMD warrants a high stability and long availability of the APU. It has the same technical specifications as the A10-9600P APU. At a TDP of 15 watts, the APU ranges at the same level as Intel's ULV processors. The CPU section of the APU consists of a quad-core processor, which runs at a basic clock speed of 2.4 GHz. Via Turbo, this can be increased up to 3.3 GHz.
The single-thread CPU tests we performed ran at 2.6 GHz with one core occasionally being throttled to 2.4 GHz. The multithread tests ran at 2.4 to 2.6 GHz in the beginning, but were throttled rather quickly to 2 - 2.4 GHz. So the Turbo is hardly being used. This looks better in everyday operation, where the maximum speed of 3.3 GHz can often be reached briefly.
We are testing whether the Turbo can be used constantly by running the multithread test of the Cinebench-R15 benchmarks for about 30 minutes in a constant loop. The results drop between the first and third run and then remain at that level. The Turbo is not used.
Since the A8-9600B APU and the A10-9600P APU are identically constructed, the latter can be used to evaluate the performance of the A8-9600B APU. The results of the CPU tests that we ran remain slightly behind the results that are achieved by A10-9600P notebooks. The distance becomes slightly larger in the multithread tests than in the single-thread tests. In other words, the APU built into the mt43 runs at slightly lower speeds on average.
| Geekbench 3 | |
| 32 Bit Multi-Core Score | |
| HP Pavilion 15-aw004ng | |
| HP 17-y044ng | |
| HP mt43 | |
| Average AMD PRO A8-9600B (n=1) | |
| HP EliteBook 745 G3 | |
| HP mt21 | |
| 32 Bit Single-Core Score | |
| HP Pavilion 15-aw004ng | |
| HP 17-y044ng | |
| HP EliteBook 745 G3 | |
| HP mt43 | |
| Average AMD PRO A8-9600B (n=1) | |
| HP mt21 | |
| Geekbench 4.0 | |
| 64 Bit Multi-Core Score | |
| Average of class Office (15873 - 41046, n=4, last 2 years) | |
| HP 17-y044ng | |
| HP mt43 | |
| Average AMD PRO A8-9600B (n=1) | |
| HP mt21 | |
| 64 Bit Single-Core Score | |
| Average of class Office (4598 - 7721, n=4, last 2 years) | |
| HP mt21 | |
| HP 17-y044ng | |
| HP mt43 | |
| Average AMD PRO A8-9600B (n=1) | |
| Geekbench 4.4 | |
| 64 Bit Multi-Core Score | |
| Average of class Office (23754 - 41544, n=9, last 2 years) | |
| Dell Latitude 5490-TD70X | |
| HP mt43 | |
| Average AMD PRO A8-9600B (n=1) | |
| HP mt21 | |
| 64 Bit Single-Core Score | |
| Average of class Office (4564 - 8042, n=9, last 2 years) | |
| Dell Latitude 5490-TD70X | |
| HP mt21 | |
| HP mt43 | |
| Average AMD PRO A8-9600B (n=1) | |
| Octane V2 - Total Score | |
| Average of class Office (49011 - 122119, n=19, last 2 years) | |
| Lenovo ThinkPad T480s-20L8S02D00 (Edge 41.16299.248.0) | |
| Acer TravelMate P449-G2-M-56CD (Edge) | |
| HP Pavilion 15-aw004ng (Edge 25) | |
| HP mt43 (Edge 41) | |
| Average AMD PRO A8-9600B (n=1) | |
| HP mt21 (Edge 41) | |
| HP EliteBook 745 G3 (IE 11) | |
| Mozilla Kraken 1.1 - Total | |
| HP EliteBook 745 G3 (IE 11) | |
| HP mt43 (Edge 41) | |
| Average AMD PRO A8-9600B (n=1) | |
| HP mt21 (Edge 41) | |
| HP Pavilion 15-aw004ng (Edge 25) | |
| Lenovo ThinkPad T480s-20L8S02D00 (Edge 41.16299.248.0) | |
| Acer TravelMate P449-G2-M-56CD (Edge) | |
| Average of class Office (391 - 1297, n=76, last 2 years) | |
| JetStream 1.1 - 1.1 Total | |
| Lenovo ThinkPad T480s-20L8S02D00 (Edge 41.16299.248.0) | |
| Acer TravelMate P449-G2-M-56CD (Edge) | |
| HP Pavilion 15-aw004ng (Edge 25) | |
| HP 17-y044ng (Edge 38) | |
| HP mt21 (Edge 41) | |
| HP mt43 (Edge 41) | |
| Average AMD PRO A8-9600B (n=1) | |
| HP EliteBook 745 G3 (IE 11) | |
* ... smaller is better
System Performance
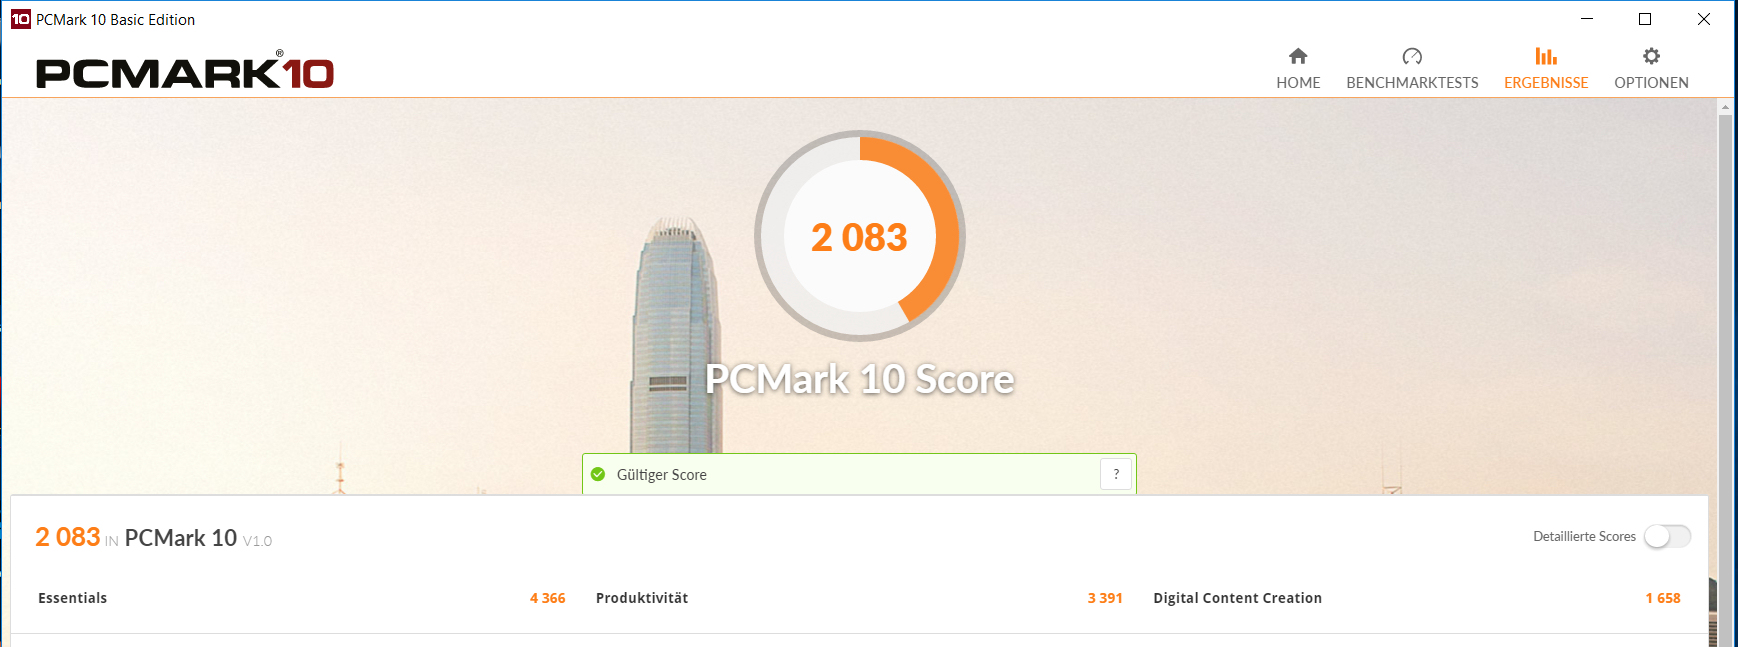
The system runs smoothly and we did not encounter any problems. The APU offers sufficient computing power for applications in the office and internet areas. This is also confirmed by the results in the PC-Mark benchmark. The overall performance cannot be increased, but HP has already maxed out all options.
| PCMark 7 Score | 3945 points | |
| PCMark 8 Home Score Accelerated v2 | 2579 points | |
| PCMark 8 Creative Score Accelerated v2 | 3083 points | |
| PCMark 8 Work Score Accelerated v2 | 3466 points | |
| PCMark 10 Score | 2083 points | |
Help | ||
Storage Solution
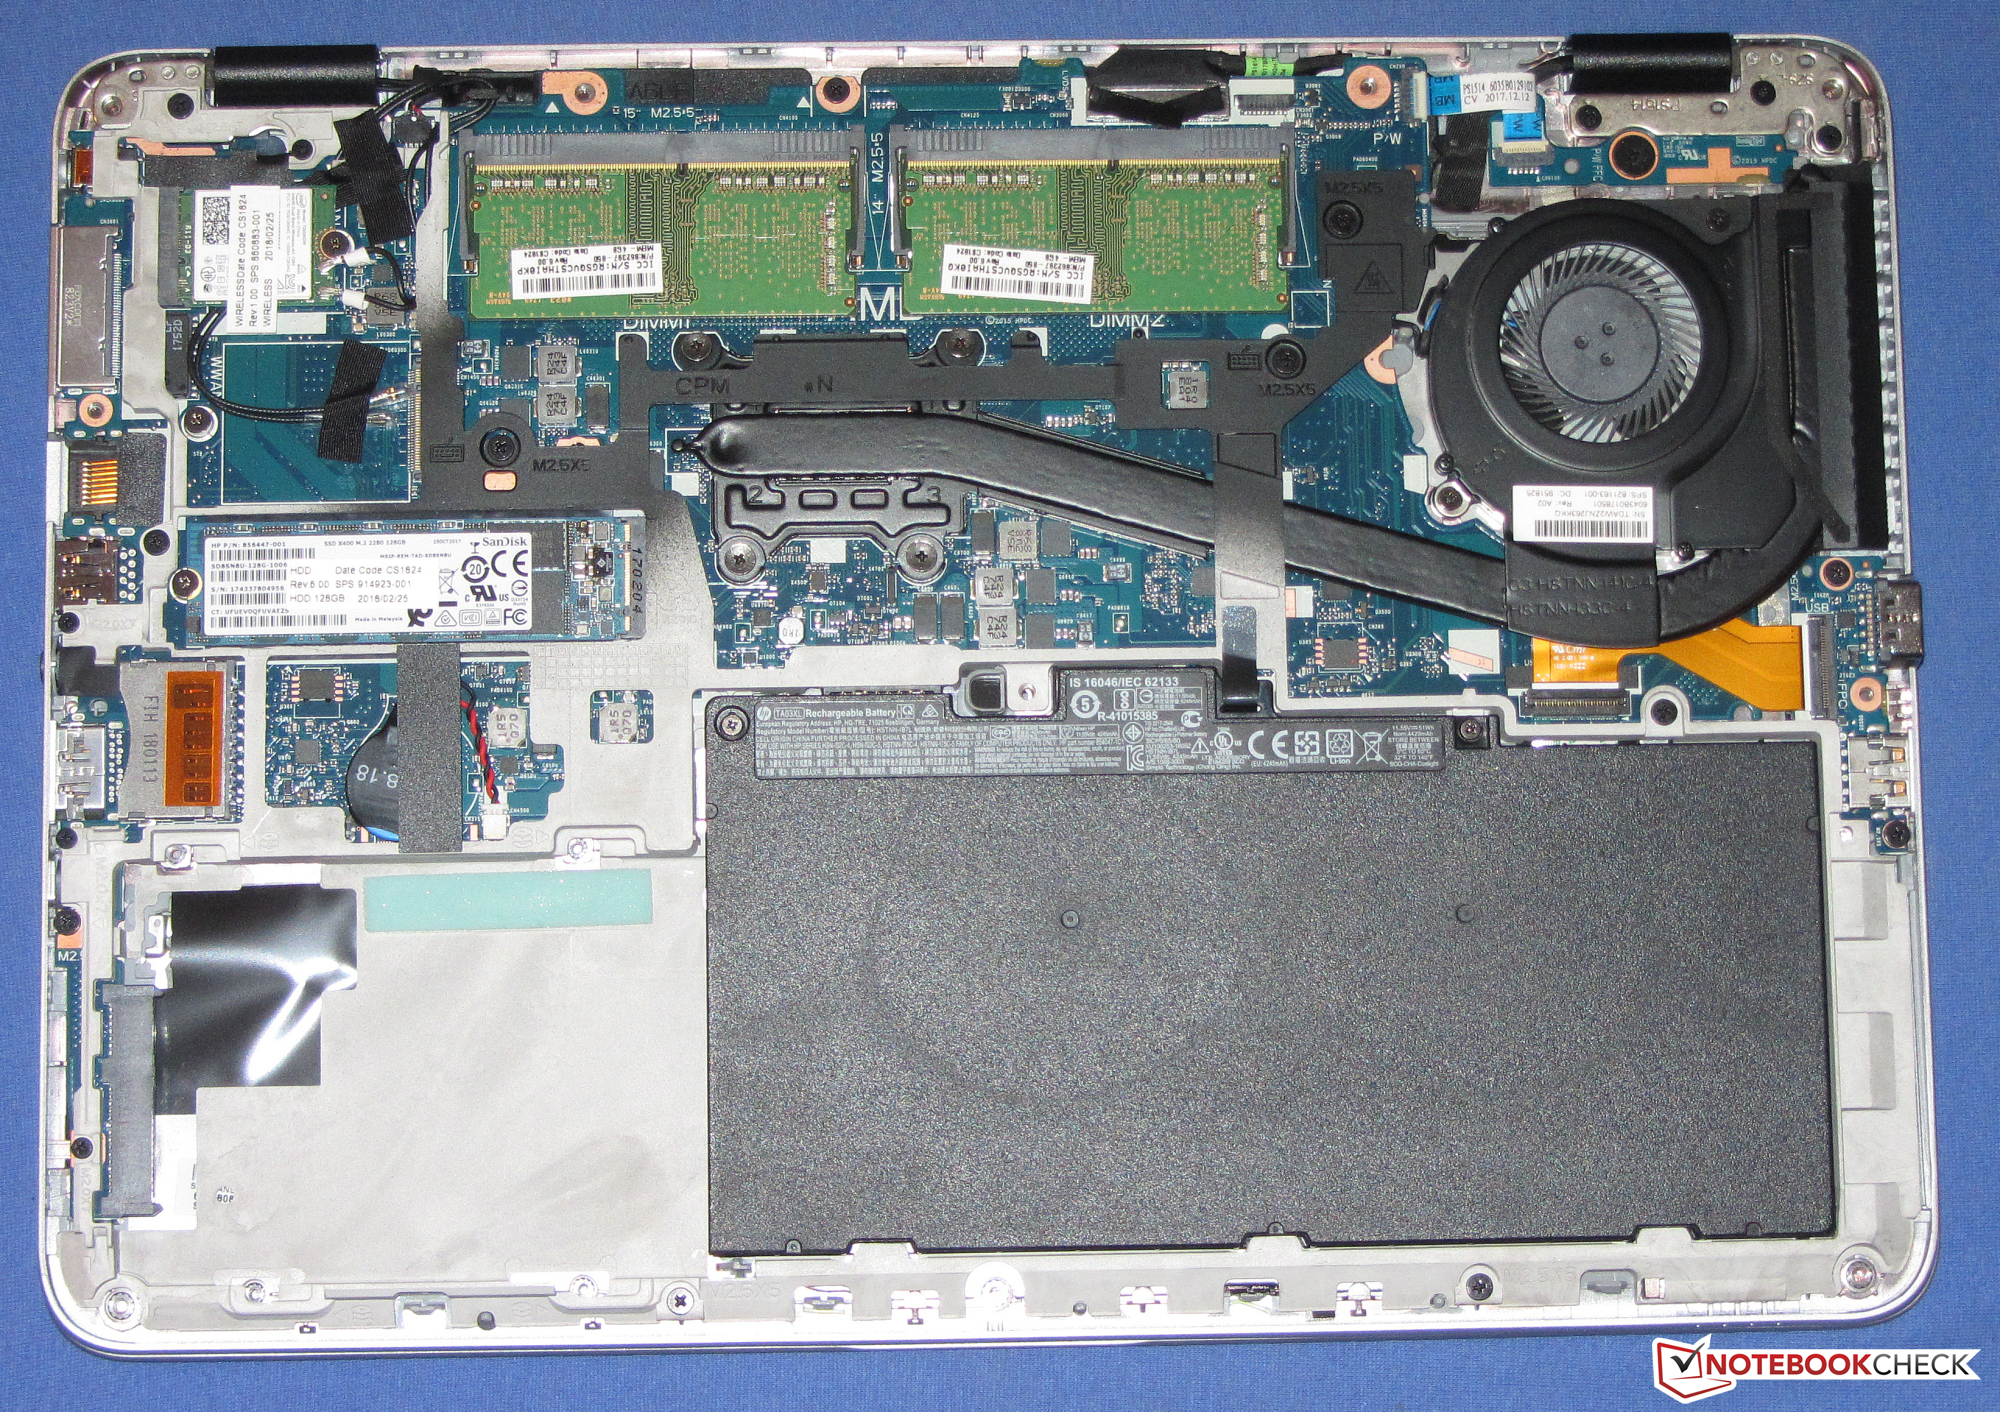
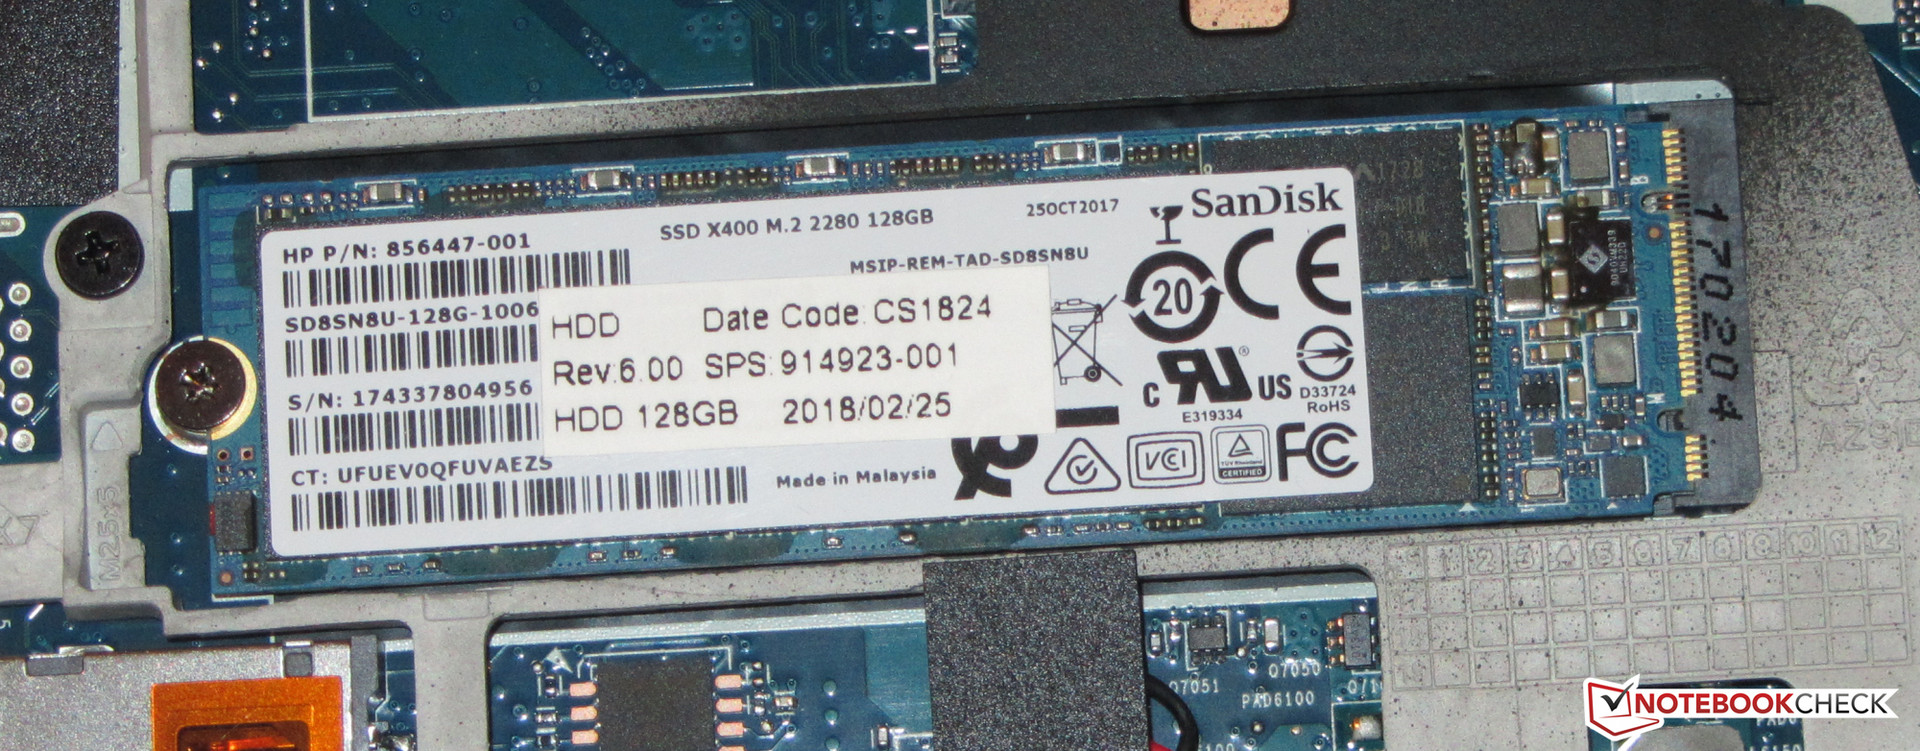
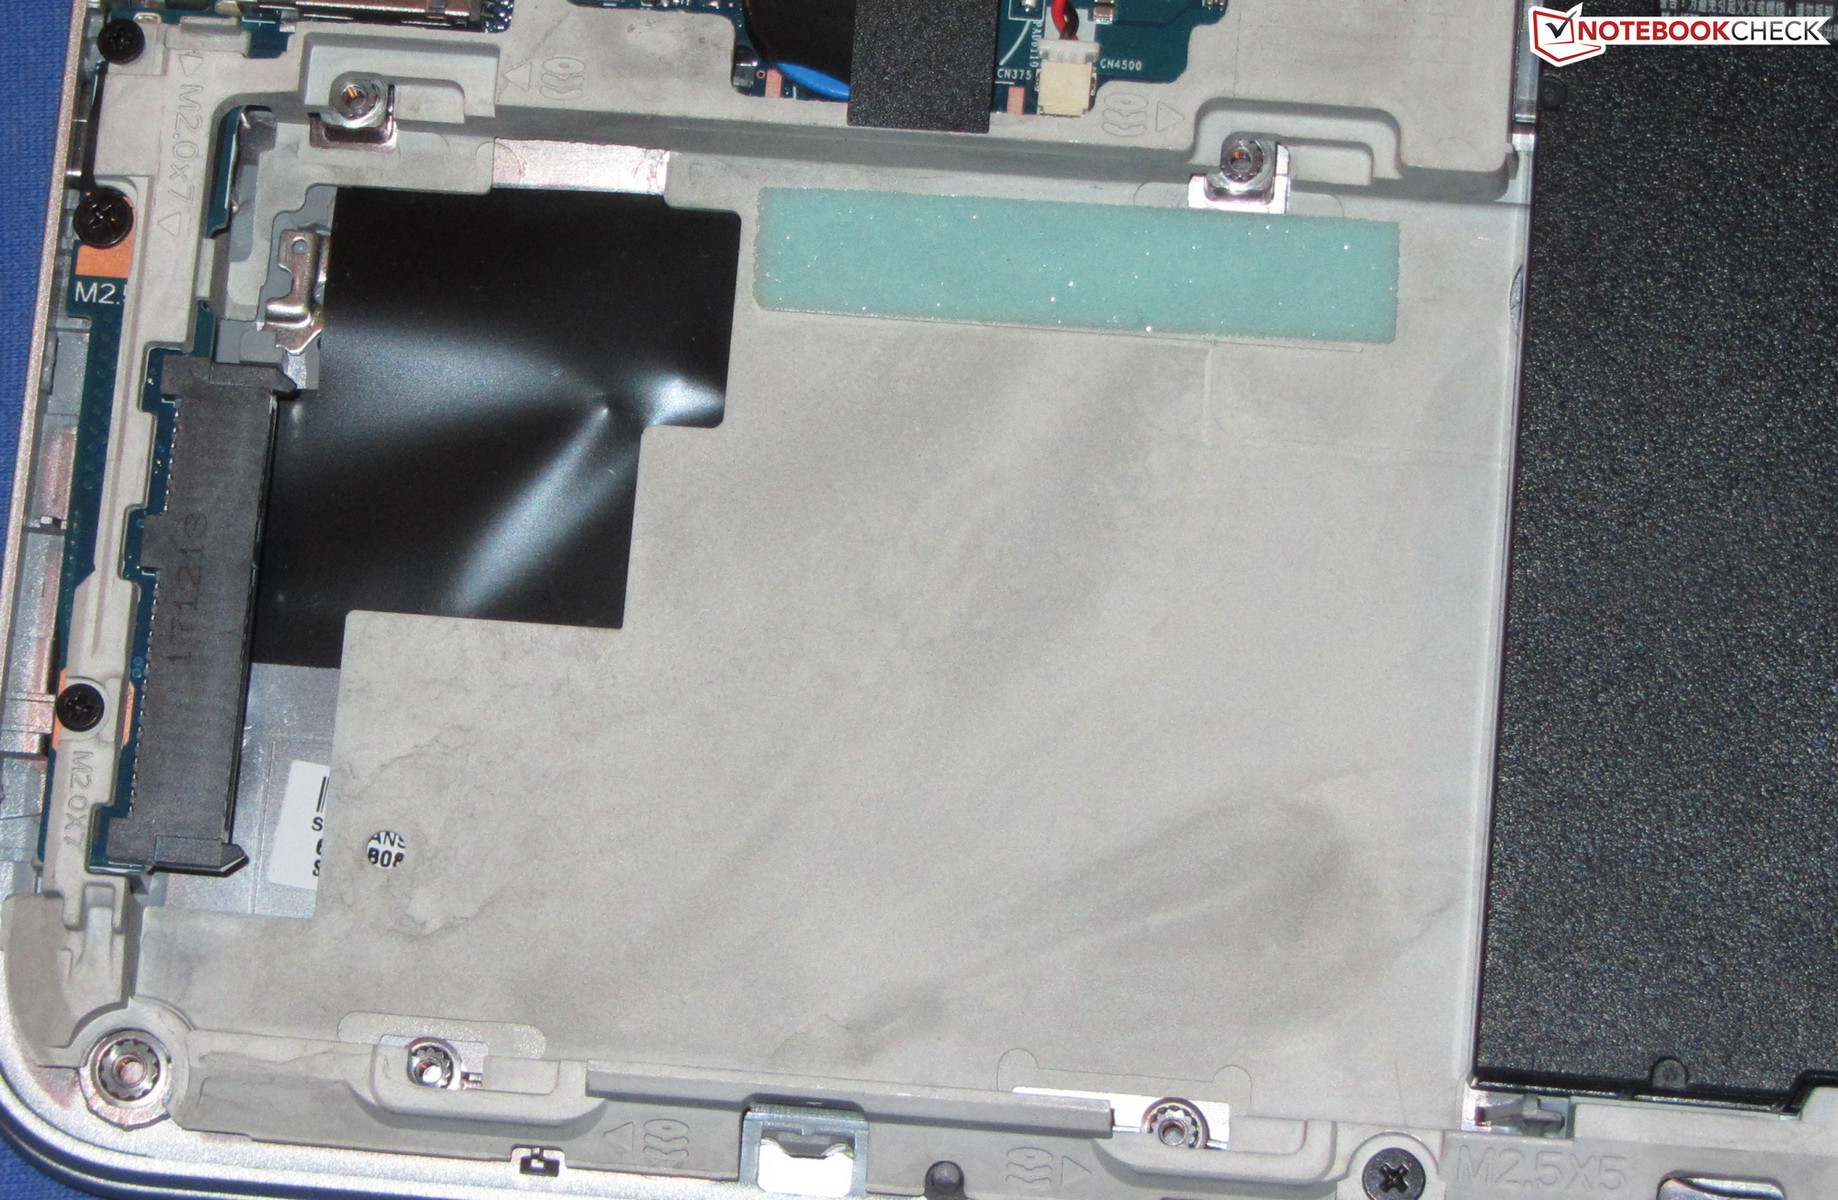
HP has equipped the mt43 with a SATA-III SSD from SanDisk. This is a model in the M.2-2280 format with an overall capacity of 128 GB. The transfer rates turn out good. The mt43 offers an additional empty SATA-III slot which you could occupy with a 2.5-inch hard drive. However, you would need to purchase the installation frame for this separately.

| HP mt43 SanDisk SD8SN8U256G1006 | HP EliteBook 840 G4-Z2V49ET ABD Samsung PM961 MZVLW256HEHP | HP EliteBook 745 G3 Samsung SSD PM851 256 GB MZNTE256HMHP | Lenovo ThinkPad T480s-20L8S02D00 Samsung SSD PM981 MZVLB512HAJQ | Dell Latitude 5490-TD70X Toshiba KSG60ZMV512G | Toshiba Tecra X40-D Samsung PM961 MZVLW256HEHP | Acer TravelMate P449-G2-M-56CD Intel SSD 600p SSDPEKKW512G7 | Average SanDisk SD8SN8U256G1006 | Average of class Office | |
|---|---|---|---|---|---|---|---|---|---|
| CrystalDiskMark 3.0 | 256% | 35% | 311% | 70% | 162% | 26% | 436% | ||
| Read Seq (MB/s) | 464.3 | 1819 292% | 446.1 -4% | 1540 232% | 465.1 0% | 1086 134% | 471 ? 1% | 3104 ? 569% | |
| Write Seq (MB/s) | 309.3 | 1263 308% | 268.9 -13% | 1613 422% | 425 37% | 581 88% | 425 ? 37% | 2916 ? 843% | |
| Read 512 (MB/s) | 370.9 | 922 149% | 361.6 -3% | 835 125% | 410.1 11% | 869 134% | 351 ? -5% | 899 ? 142% | |
| Write 512 (MB/s) | 181.9 | 804 342% | 268.8 48% | 1716 843% | 360.7 98% | 584 221% | 280 ? 54% | 2309 ? 1169% | |
| Read 4k (MB/s) | 28.79 | 61.4 113% | 27.12 -6% | 66.9 132% | 27.34 -5% | 35.89 25% | 25 ? -13% | 54.1 ? 88% | |
| Write 4k (MB/s) | 49.6 | 157.1 217% | 84.4 70% | 160.6 224% | 89 79% | 122.4 147% | 53.9 ? 9% | 114.1 ? 130% | |
| Read 4k QD32 (MB/s) | 115.4 | 513 345% | 239.8 108% | 444.9 286% | 295.6 156% | 462.9 301% | 211 ? 83% | 463 ? 301% | |
| Write 4k QD32 (MB/s) | 106.6 | 410.2 285% | 188.9 77% | 343 222% | 300.2 182% | 370.9 248% | 147.3 ? 38% | 370 ? 247% |
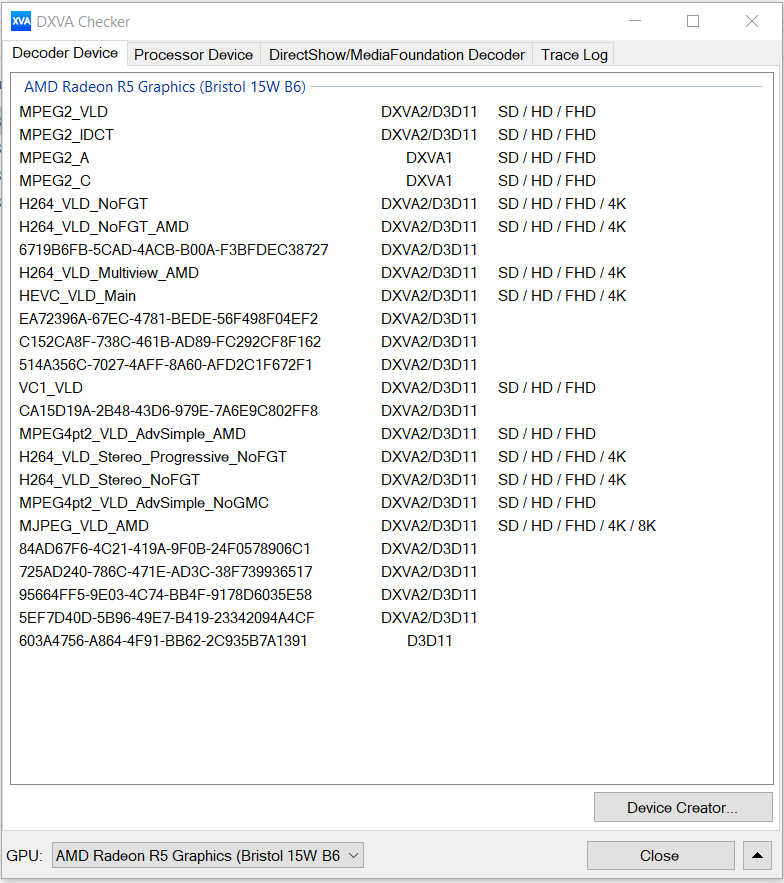
Graphics Card
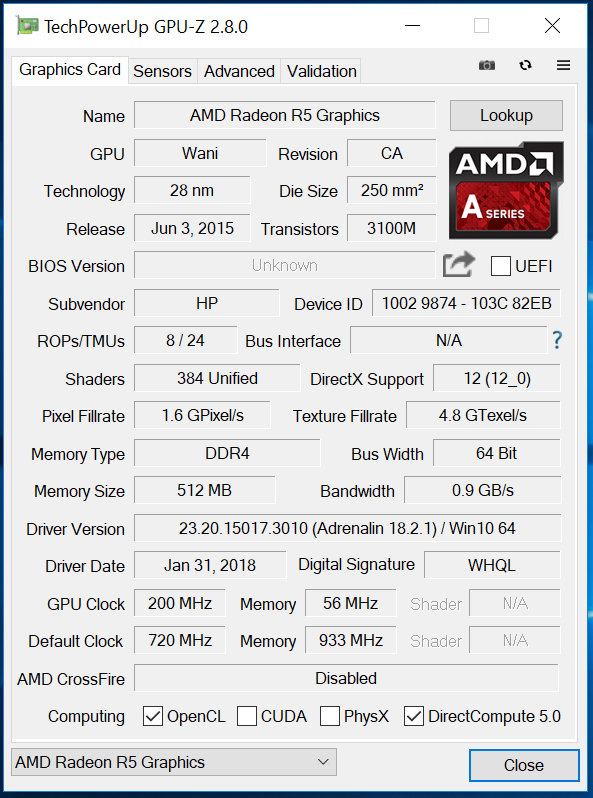
The integrated Radeon R5 (Bristol Ridge) GPU supports DirectX 12 and reaches speeds of up to 720 MHz. The results in the 3DMark benchmarks remain on a normal level for this GPU. It benefits from the working memory running in dual-channel mode, which allows the graphics core to reach its full potential and results in a better performance.
| 3DMark 06 Standard Score | 6431 points | |
| 3DMark 11 Performance | 1672 points | |
| 3DMark Ice Storm Standard Score | 38641 points | |
| 3DMark Cloud Gate Standard Score | 4797 points | |
| 3DMark Fire Strike Score | 994 points | |
Help | ||
Gaming Performance
The APU can certainly bring some games smoothly to the screen. However, this mainly goes for games which do not impose high demands on the hardware or games that have a few years under their belt. Power hungry games such as "Final Fantasy XV" cannot be played under any circumstances. Thanks to the working memory running in dual-channel mode, the frame rates turn out higher than in comparable devices whose working memory runs in single-channel mode.
| low | med. | high | ultra | |
|---|---|---|---|---|
| StarCraft 2 (2010) | 105.8 | 32.1 | 26.2 | 17.2 |
| Deus Ex Human Revolution (2011) | 64.1 | 41.4 | 16.2 | |
| Anno 2070 (2011) | 62.9 | 33.5 | 21.5 | 9.4 |
| Dead Space 3 (2013) | 50.9 | 29.3 | 24.6 | 16.9 |
| Tomb Raider (2013) | 67.4 | 37.4 | 21.1 | 9.9 |
| BioShock Infinite (2013) | 61.1 | 36.3 | 31.2 | 11 |
| GRID: Autosport (2014) | 70.1 | 27.3 | 15.5 | 12.5 |
| Alien: Isolation (2014) | 42.9 | 22.9 | 11.7 | 11.5 |
| Dota 2 Reborn (2015) | 37.9 | 24.1 | 17.7 | 16.7 |
| Hitman 2016 (2016) | 9.4 | 6.1 | ||
| Ashes of the Singularity (2016) | 8 | 5 | ||
| Overwatch (2016) | 32.5 | 29 | 16 | 11.6 |
| For Honor (2017) | 20.8 | 6.8 | ||
| Ghost Recon Wildlands (2017) | 12.7 | 5.6 | ||
| Warhammer 40.000: Dawn of War III (2017) | 13 | 6 | ||
| Prey (2017) | 21 | 10.8 | 8.8 | 5.3 |
| Rocket League (2017) | 61.3 | 22.8 | 14.3 | |
| Dirt 4 (2017) | 39.2 | 12.1 | ||
| Team Fortress 2 (2017) | 38.5 | 38.3 | 31.1 | 21.9 |
| F1 2017 (2017) | 18 | 14 | ||
| Middle-earth: Shadow of War (2017) | 16 | 7 | ||
| ELEX (2017) | 10.7 | 5.8 | ||
| Destiny 2 (2017) | 15.3 | |||
| Assassin´s Creed Origins (2017) | 10 | 6 | ||
| Call of Duty WWII (2017) | 20.7 | 14.2 | ||
| Need for Speed Payback (2017) | 11.2 | 7.9 | ||
| Star Wars Battlefront 2 (2017) | 9 | 6.3 | ||
| Fortnite (2018) | 29.4 | 9 | ||
| Final Fantasy XV Benchmark (2018) | 8 | 4 | ||
| Kingdom Come: Deliverance (2018) | 9.4 | 4.4 | ||
| X-Plane 11.11 (2018) | 12.7 | 8.6 |
Emissions and Power - The Hewlett-Packard laptop lacks endurance
Noise Emissions
During idle operation, the fan can be quiet at times. But usually it is running at very low speeds and can be hardly heard. However, even a small load is sufficient to cause the fan to rev up. The fan produces the most noise during operation under medium loads. It does not need to rev up high under full load (stress test: Prime95 and FurMark run for at least one hour), since then the CPU and GPU only run at their minimum speeds.
Noise level
| Idle |
| 30.4 / 30.6 / dB(A) |
| Load |
| 34.1 / 32.3 dB(A) |
 | ||
30 dB silent 40 dB(A) audible 50 dB(A) loud |
||
min: | ||
Temperature
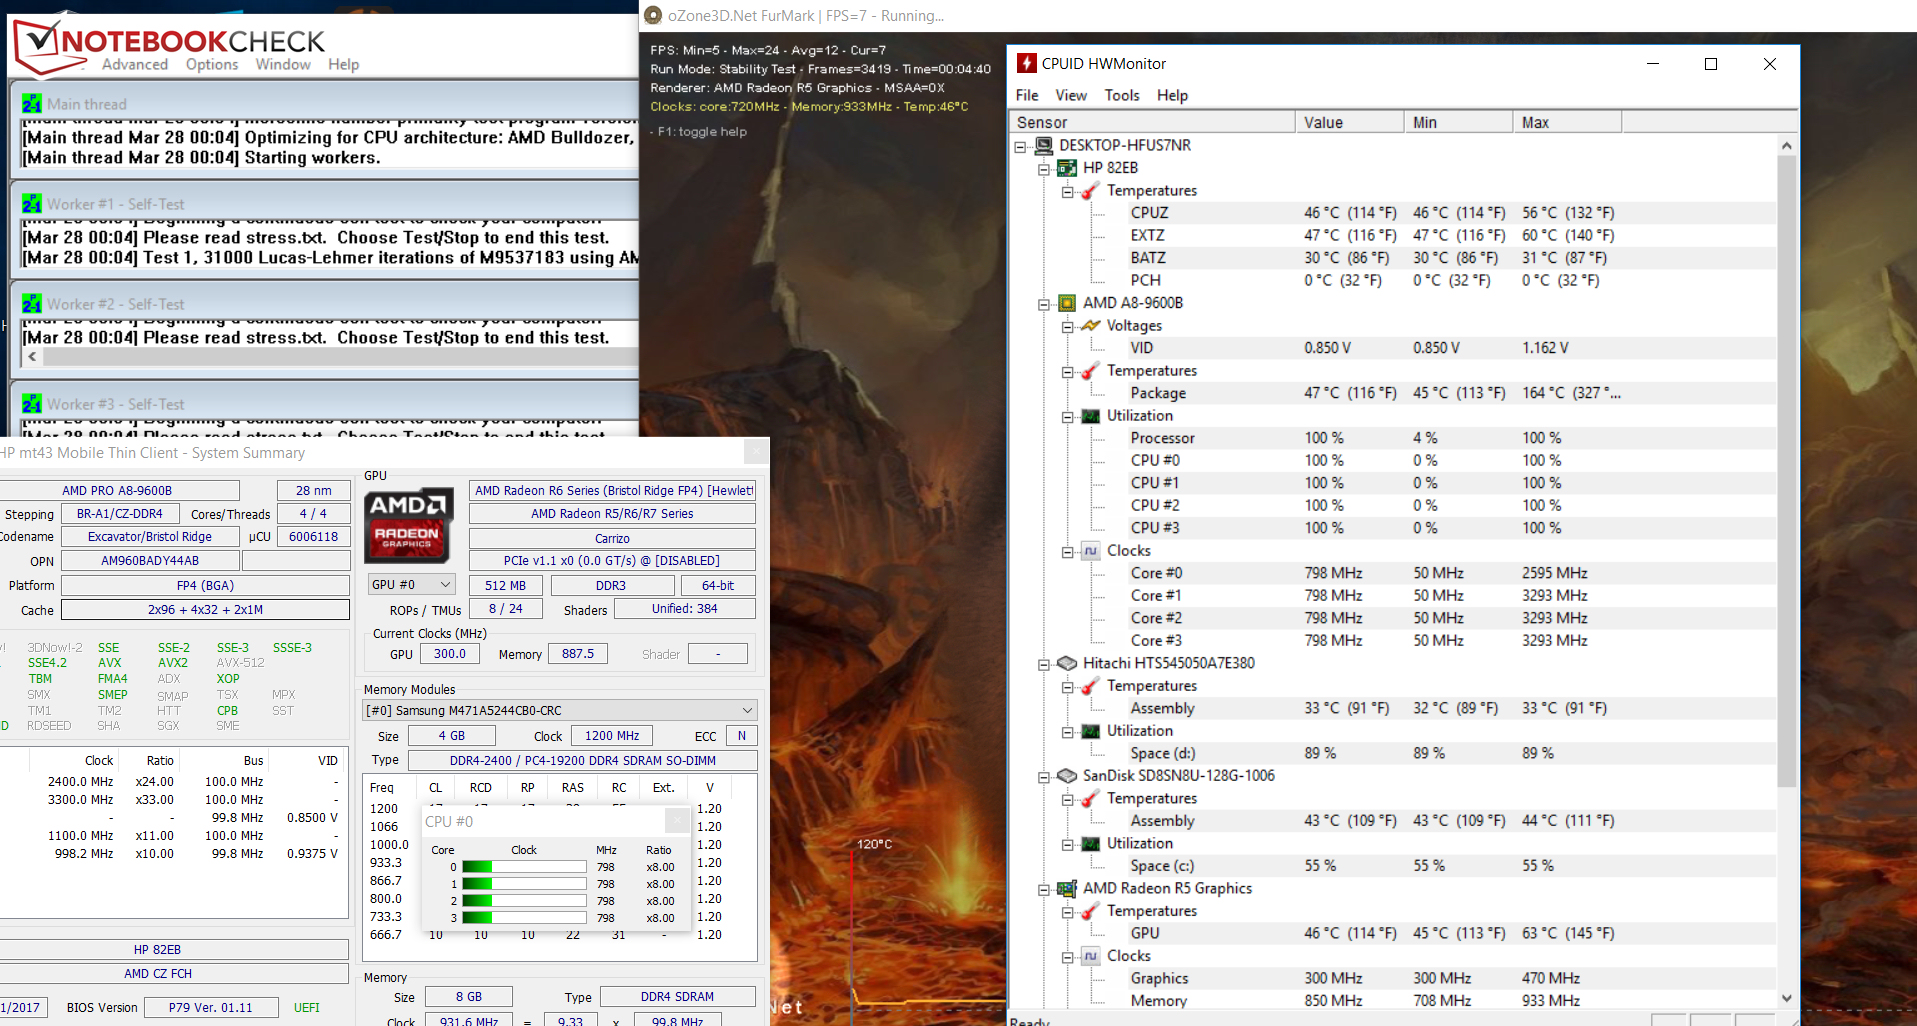
The mt43 runs through our stress test (Prime95 and FurMark run for at least one hour) in the same way in battery and mains operation with the processor (800 MHz) and the graphics core (300 MHz) running at very low speeds.
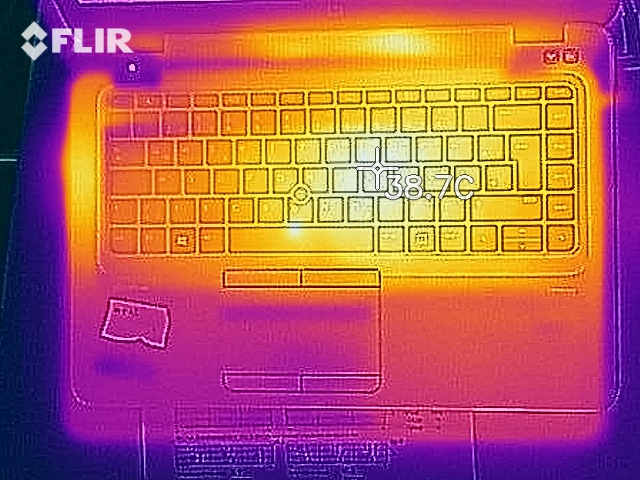
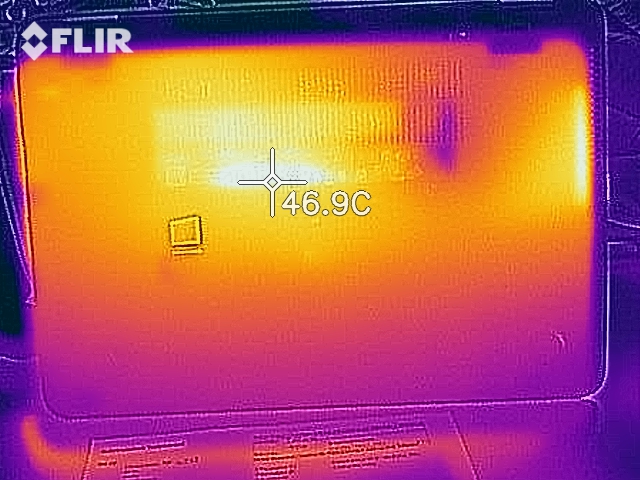
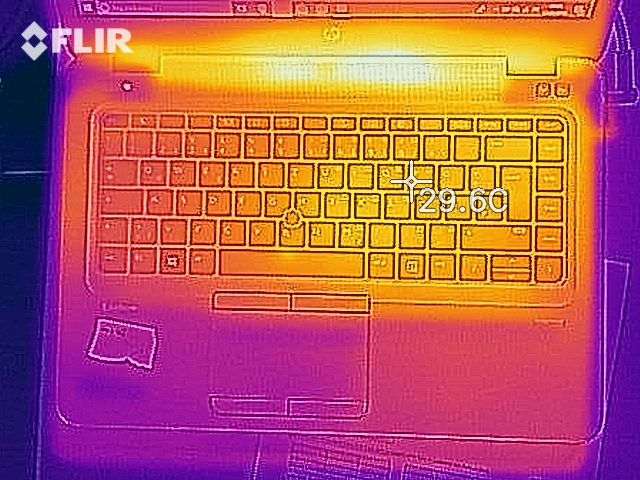
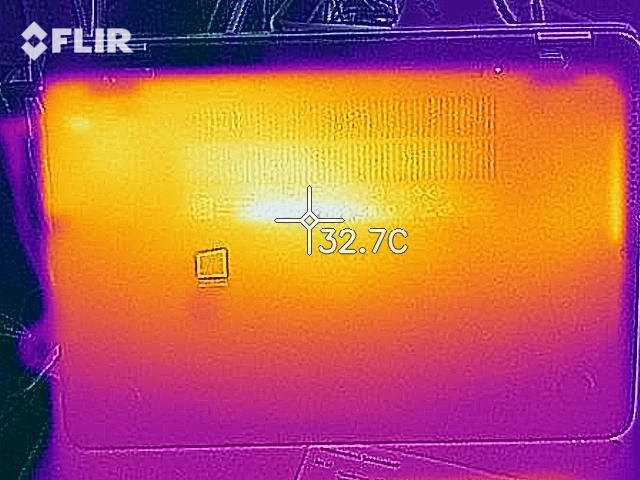
The Thin Client does not get particularly warm. During the stress test, the temperatures remain clearly below 40 °C (104 °F) at all measurement points.
(+) The maximum temperature on the upper side is 33.4 °C / 92 F, compared to the average of 34.3 °C / 94 F, ranging from 21.2 to 62.5 °C for the class Office.
(+) The bottom heats up to a maximum of 36 °C / 97 F, compared to the average of 36.8 °C / 98 F
(+) In idle usage, the average temperature for the upper side is 27 °C / 81 F, compared to the device average of 29.5 °C / 85 F.
(+) The palmrests and touchpad are cooler than skin temperature with a maximum of 27.9 °C / 82.2 F and are therefore cool to the touch.
(±) The average temperature of the palmrest area of similar devices was 27.5 °C / 81.5 F (-0.4 °C / -0.7 F).
Speakers
HP mt43 audio analysis
(±) | speaker loudness is average but good (74.1 dB)
Bass 100 - 315 Hz
(-) | nearly no bass - on average 23.3% lower than median
(±) | linearity of bass is average (10.9% delta to prev. frequency)
Mids 400 - 2000 Hz
(±) | higher mids - on average 5.4% higher than median
(±) | linearity of mids is average (13.4% delta to prev. frequency)
Highs 2 - 16 kHz
(+) | balanced highs - only 1.8% away from median
(+) | highs are linear (4.3% delta to prev. frequency)
Overall 100 - 16.000 Hz
(±) | linearity of overall sound is average (22% difference to median)
Compared to same class
» 57% of all tested devices in this class were better, 8% similar, 35% worse
» The best had a delta of 7%, average was 21%, worst was 53%
Compared to all devices tested
» 63% of all tested devices were better, 6% similar, 30% worse
» The best had a delta of 4%, average was 24%, worst was 134%
Apple MacBook 12 (Early 2016) 1.1 GHz audio analysis
(+) | speakers can play relatively loud (83.6 dB)
Bass 100 - 315 Hz
(±) | reduced bass - on average 11.3% lower than median
(±) | linearity of bass is average (14.2% delta to prev. frequency)
Mids 400 - 2000 Hz
(+) | balanced mids - only 2.4% away from median
(+) | mids are linear (5.5% delta to prev. frequency)
Highs 2 - 16 kHz
(+) | balanced highs - only 2% away from median
(+) | highs are linear (4.5% delta to prev. frequency)
Overall 100 - 16.000 Hz
(+) | overall sound is linear (10.2% difference to median)
Compared to same class
» 7% of all tested devices in this class were better, 2% similar, 91% worse
» The best had a delta of 5%, average was 18%, worst was 53%
Compared to all devices tested
» 5% of all tested devices were better, 1% similar, 94% worse
» The best had a delta of 4%, average was 24%, worst was 134%
Power Consumption
Over the whole range of loads, the power consumption remains at a normal level for the built-in hardware. During idle operation, we measure a maximum power consumption of 9.2 watts. During the stress test, this value rises up to 33 watts. The power supply is rated at 65 watts.
| Off / Standby | |
| Idle | |
| Load |
|
Key:
min: | |
Battery Life
We simulate the load when loading websites with our practically relevant WLAN test. The "Balanced" profile is active and the brightness is adjusted to about 150 cd/m². The mt43 achieves a runtime of 4:59 h, which is not an outstanding value.
Pros
Cons
Verdict - An HP EliteBook as a mobile Thin Client
As a mobile Thin Client, the mt43 does not need to offer an excess of computing power. Accordingly, the built-in AMD APU fulfills the demands. However, despite the rather moderate performance, the computer does not manage to run quietly, and you can clearly hear the fan even with a low load.
Considering the price, the level of features of the HP m43 turns out too meager.
A Solid-State Disk ensures a fast running system. It is possible to replace the SSD. But in order to do that, you would have to remove the bottom of the case. There is an additional space for a 2.5-inch hard drive inside.
The matte 14-inch display offers a high brightness and a very decent contrast. However, considering the price level, this should be larger. We do not understand why HP uses a TN model here whose viewing angles are not stable. The price level demands an IPS model.
The keyboard is very good and also suited for prolific writers. However, HP foregoes a keyboard illumination here. There is an empty slot for an LTE modem inside the mt43. The necessary antennas and a SIM card slot are also there. While HP calls the mt43 a "Mobile Thin Client," the mobility is far from ideal. The computer barely lasts 5 hours in our practically relevant WLAN test. The HP EliteBook 840 G4 sibling model, which is identically constructed, lasts almost twice as long with the same battery.
HP mt43
- 04/04/2018 v6 (old)
Sascha Mölck
Price comparison
