HP mt21 (Celeron 3865U, SSD, HD) Mobile Thin Client Review
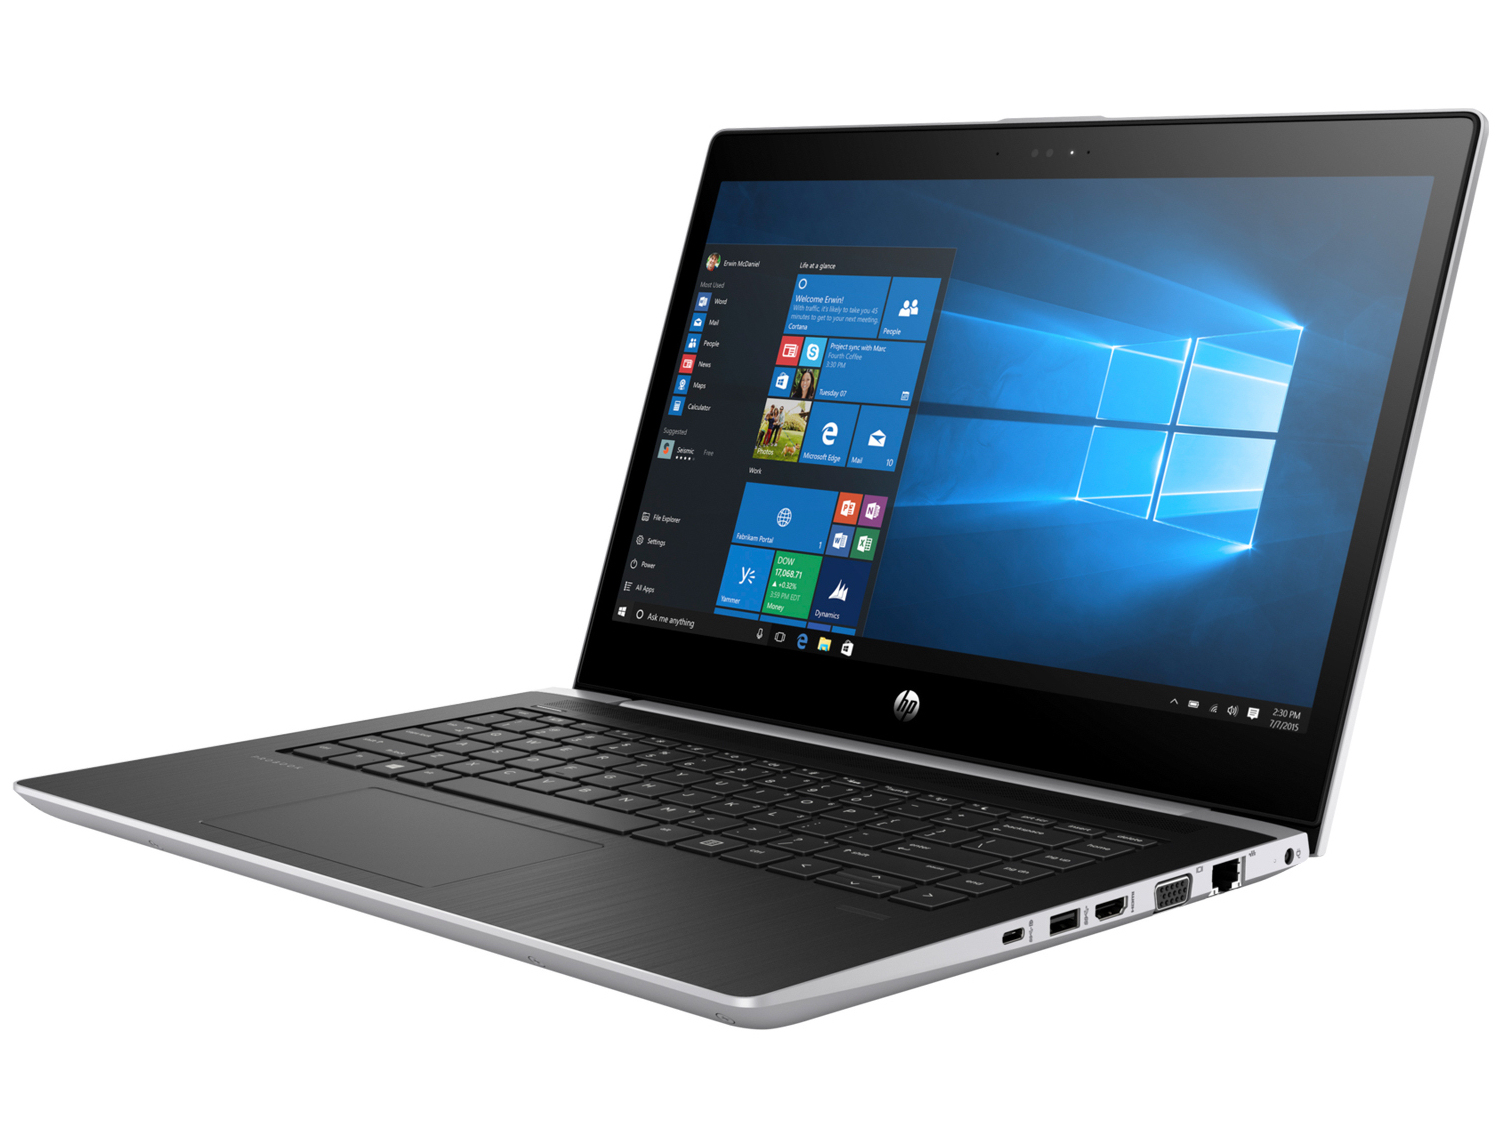
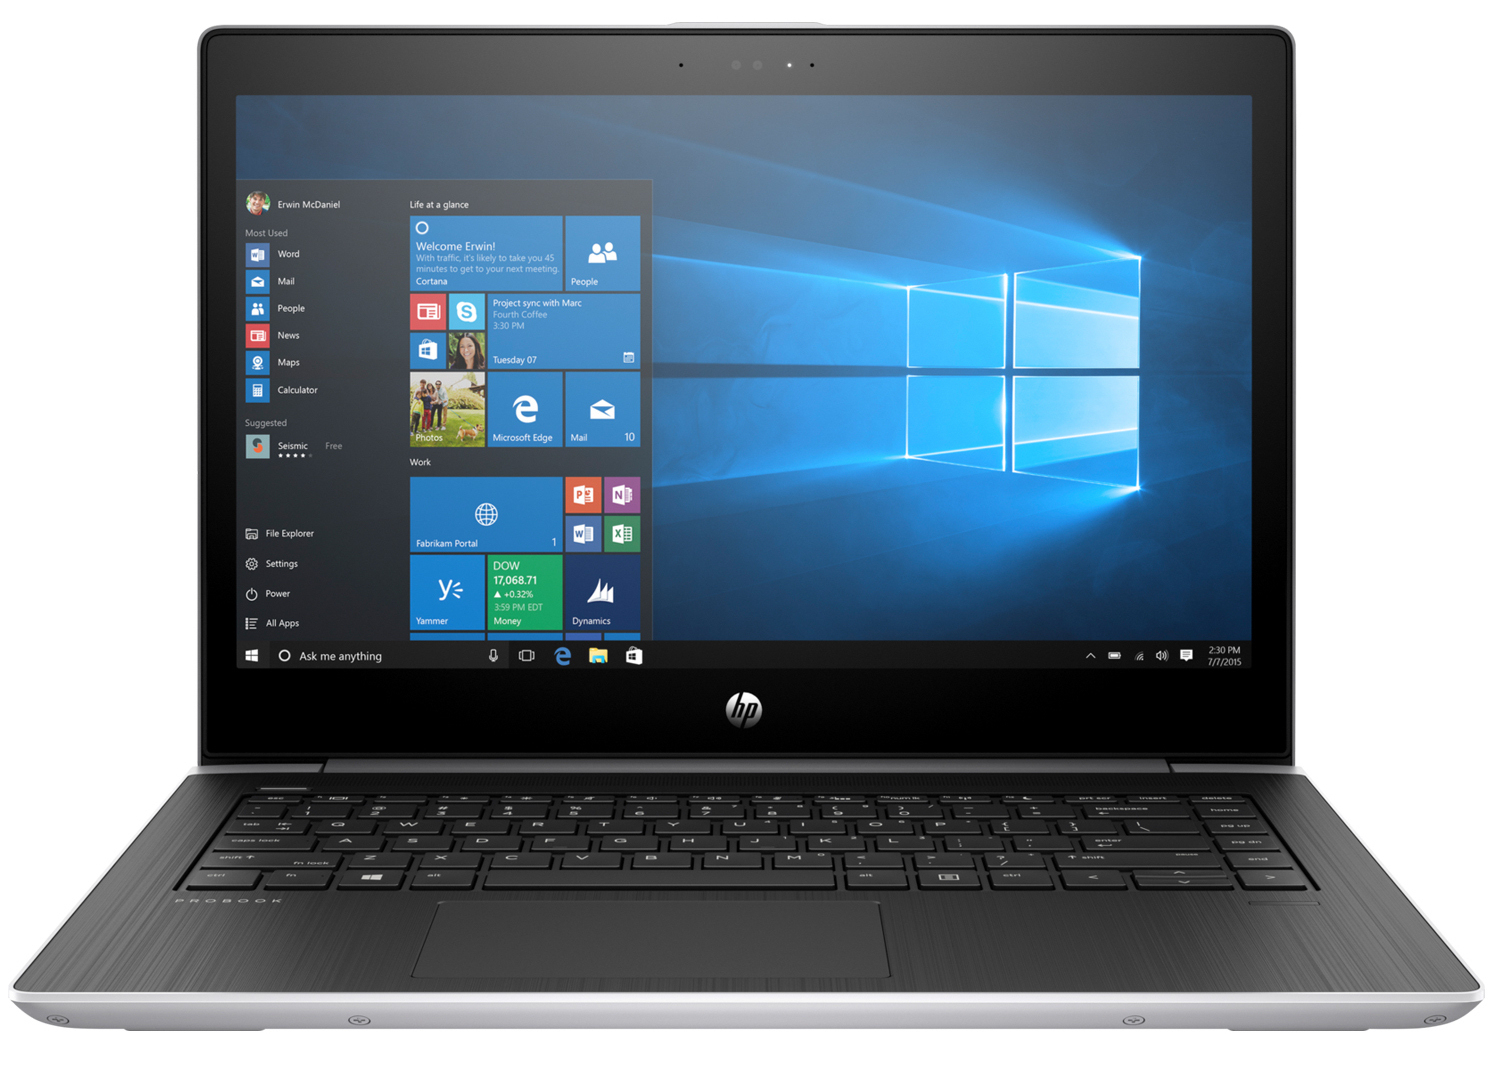
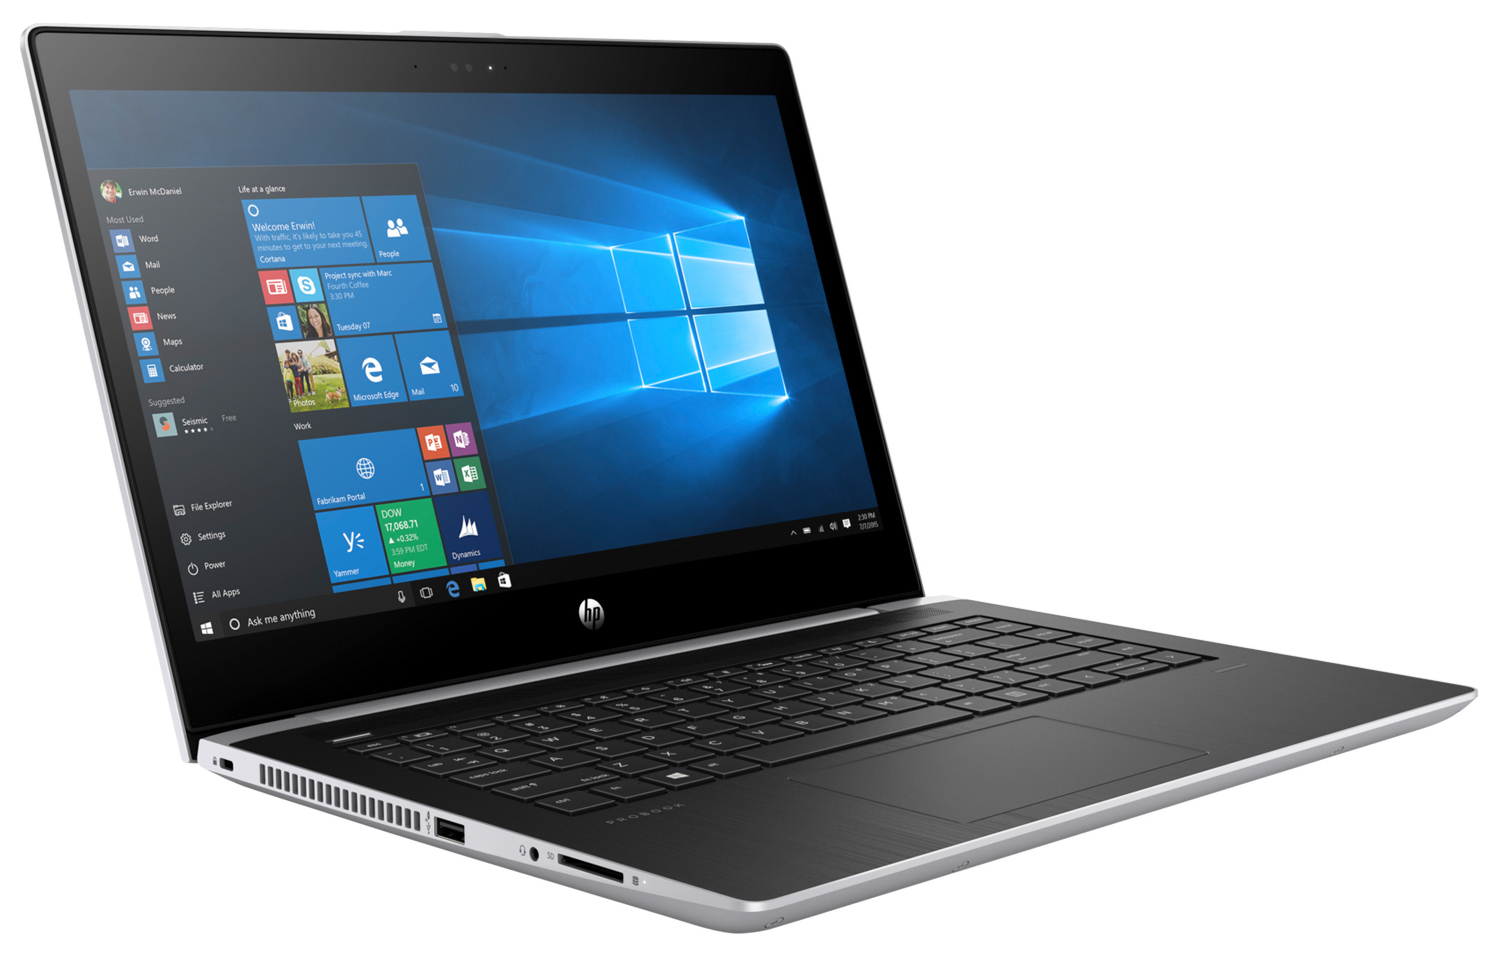
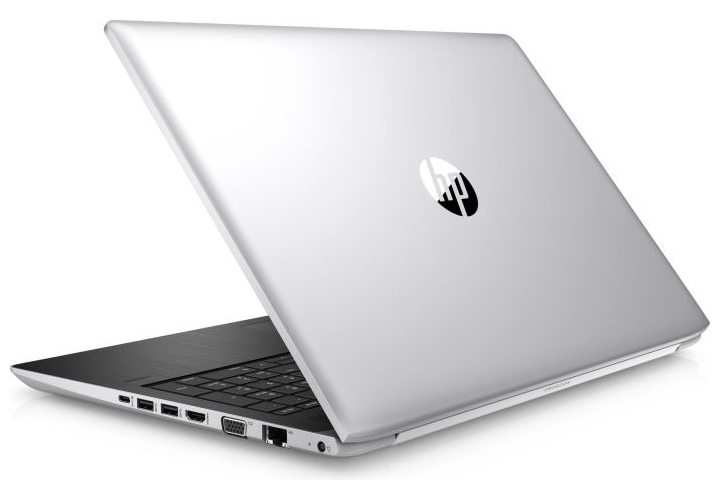
HP has released the mt21, a 14-inch Mobile Thin Client that is based on the HP ProBook 440 G5. The mt21 is powered by an Intel Celeron Kaby Lake generation processor and Intel HD Graphics 610. We will be using the Lenovo ThinkPad L480, Dell Latitude 5490, and the Acer TravelMate P449-G2-M as devices against which we compare the HP mt21. We will not be taking a close look at the mt21’s case, connectivity, input devices, and speakers, as they are identical to those that we have already examined in our HP ProBook 440 G5 review.
We should point out that HP ships the mt21 with Windows 10 IoT Enterprise for Thin Clients 64. We installed Windows 10 Pro (64-bit) to perform our tests to eliminate performance differences between the two versions of Windows 10 when comparing the mt21 with our comparison devices.
Connectivity
| SD Card Reader | |
| average JPG Copy Test (av. of 3 runs) | |
| Dell Latitude 5490-TD70X (Toshiba Exceria Pro SDXC 64 GB UHS-II) | |
| HP ProBook 440 G5-3KX87ES (Toshiba Exceria Pro SDXC 64 GB UHS-II) | |
| Lenovo ThinkPad L480-20LS001AGE (Toshiba Exceria Pro M501 microSDXC 64GB) | |
| HP mt21 (Toshiba Exceria Pro SDXC 64 GB UHS-II) | |
| HP mt43 (Toshiba Exceria Pro SDXC 64 GB UHS-II) | |
| Average of class Office (22.4 - 198.5, n=22, last 2 years) | |
| Fujitsu Lifebook E746 (Toshiba Exceria Pro SDXC 64 GB UHS-II) | |
| Acer TravelMate P449-G2-M-56CD (Toshiba Exceria Pro SDXC 64 GB UHS-II) | |
| maximum AS SSD Seq Read Test (1GB) | |
| Dell Latitude 5490-TD70X (Toshiba Exceria Pro SDXC 64 GB UHS-II) | |
| HP ProBook 440 G5-3KX87ES (Toshiba Exceria Pro SDXC 64 GB UHS-II) | |
| Lenovo ThinkPad L480-20LS001AGE (Toshiba Exceria Pro M501 microSDXC 64GB) | |
| HP mt21 (Toshiba Exceria Pro SDXC 64 GB UHS-II) | |
| HP mt43 (Toshiba Exceria Pro SDXC 64 GB UHS-II) | |
| Average of class Office (27.4 - 249, n=20, last 2 years) | |
| Acer TravelMate P449-G2-M-56CD (Toshiba Exceria Pro SDXC 64 GB UHS-II) | |
Display

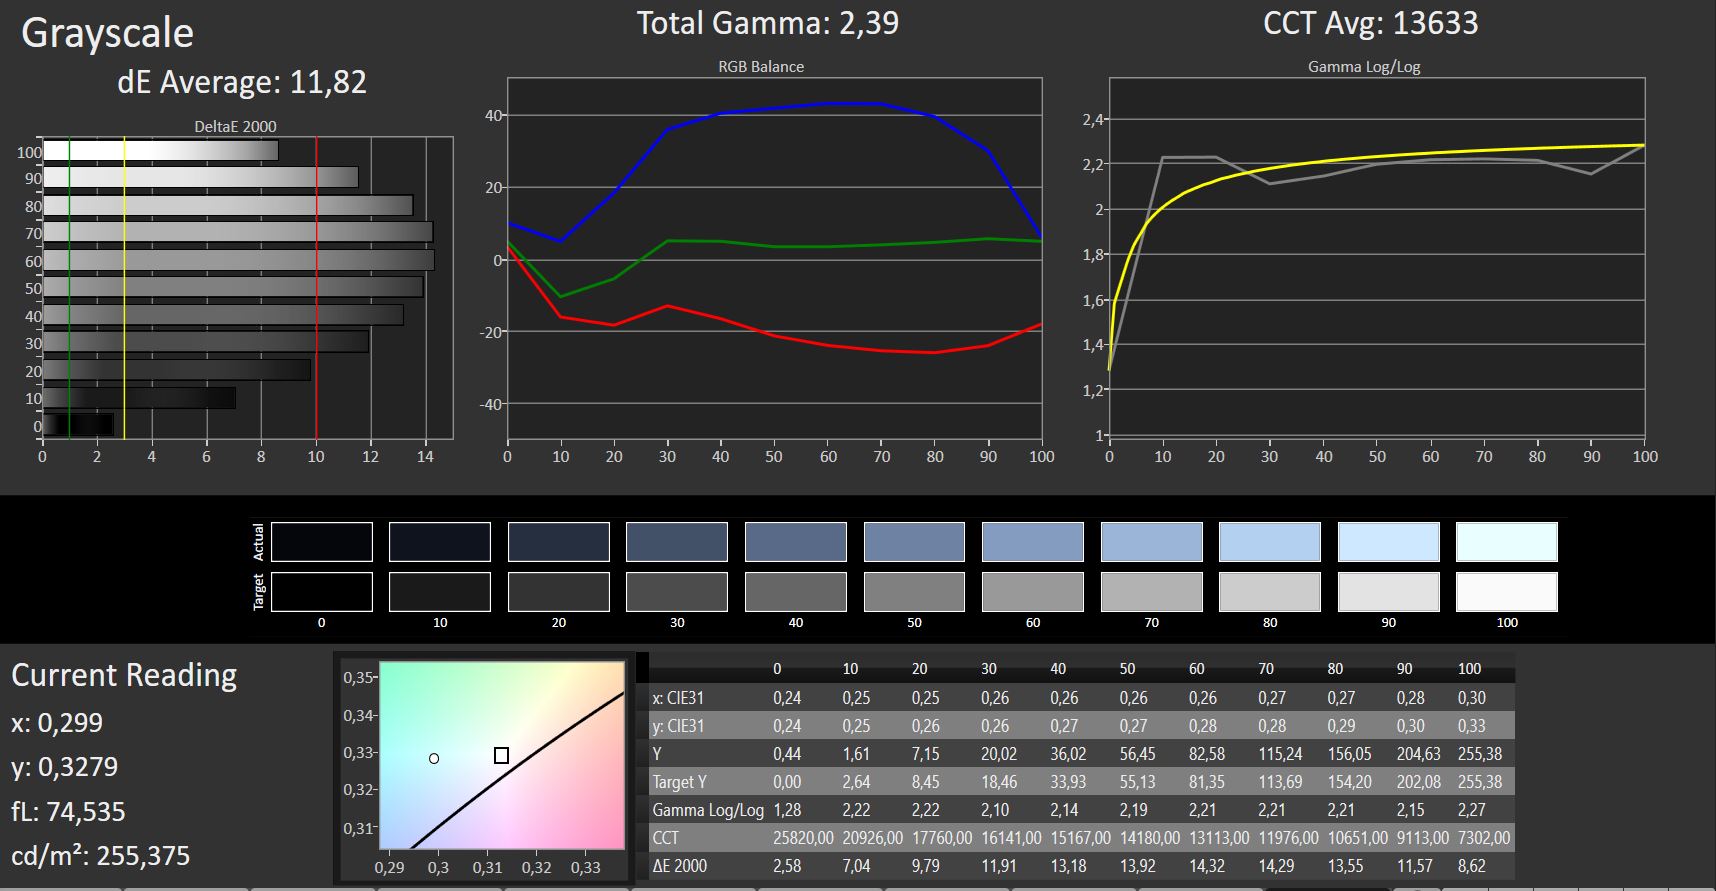
The matte 14-inch display has a 1366x768 native resolution. We measured brightness and contrast levels at 228.2 cd/m² and 564:1 respectively. These are unimpressive values, especially as we would expect values beyond 300 cd/m² and 1000:1.
The display has PWM flicker at 1,000 Hz for brightness levels of 90% and below. Fortunately, this frequency is high enough that even those sensitive to PWM related headaches or eye strain should be able to use the mt21 without issue.
| |||||||||||||||||||||||||
Brightness Distribution: 81 %
Center on Battery: 254 cd/m²
Contrast: 564:1 (Black: 0.45 cd/m²)
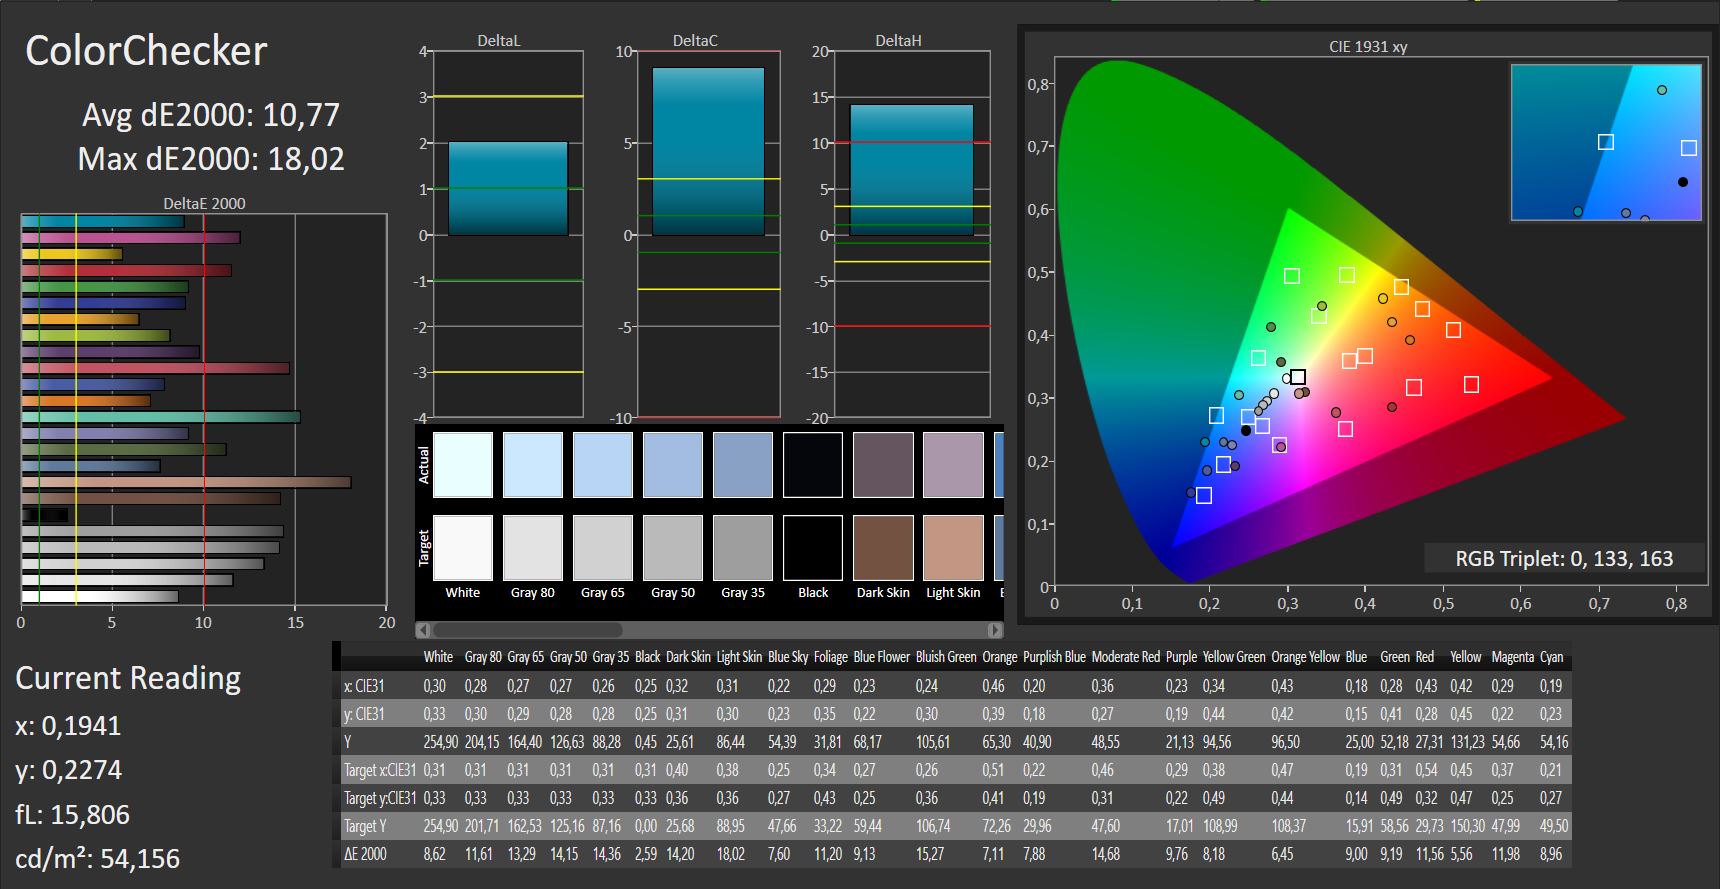
ΔE ColorChecker Calman: 10.77 | ∀{0.5-29.43 Ø4.73}
ΔE Greyscale Calman: 11.82 | ∀{0.09-98 Ø4.97}
63% sRGB (Argyll 1.6.3 3D)
40% AdobeRGB 1998 (Argyll 1.6.3 3D)
43.48% AdobeRGB 1998 (Argyll 3D)
62.8% sRGB (Argyll 3D)
42.06% Display P3 (Argyll 3D)
Gamma: 2.39
CCT: 13633 K
| HP mt21 TN LED, 1366x768, 14" | Lenovo ThinkPad L480-20LS001AGE IPS, 1920x1080, 14" | Fujitsu Lifebook E746 IPS, 1920x1080, 14" | Dell Latitude 5490-TD70X IPS, 1920x1080, 14" | HP ProBook 440 G5-3KX87ES IPS LED, 1920x1080, 14" | Acer TravelMate P449-G2-M-56CD IPS, 1920x1080, 14" | |
|---|---|---|---|---|---|---|
| Display | -14% | 42% | -14% | -6% | -2% | |
| Display P3 Coverage (%) | 42.06 | 36.37 -14% | 64.1 52% | 36.28 -14% | 39.56 -6% | 41.04 -2% |
| sRGB Coverage (%) | 62.8 | 54.7 -13% | 83.9 34% | 54.6 -13% | 59.3 -6% | 61.2 -3% |
| AdobeRGB 1998 Coverage (%) | 43.48 | 37.57 -14% | 61.3 41% | 37.48 -14% | 40.88 -6% | 42.47 -2% |
| Response Times | -95% | -20% | -59% | -43% | -39% | |
| Response Time Grey 50% / Grey 80% * (ms) | 43 ? | 73 ? -70% | 34 ? 21% | 46.9 ? -9% | 40 ? 7% | 39 ? 9% |
| Response Time Black / White * (ms) | 15 ? | 33 ? -120% | 24 ? -60% | 31.2 ? -108% | 28.8 ? -92% | 28 ? -87% |
| PWM Frequency (Hz) | 1000 ? | 21000 ? | 25000 ? | |||
| Screen | 35% | 45% | 24% | 18% | 19% | |
| Brightness middle (cd/m²) | 254 | 222 -13% | 320 26% | 227 -11% | 236 -7% | 271 7% |
| Brightness (cd/m²) | 228 | 209 -8% | 315 38% | 211 -7% | 221 -3% | 256 12% |
| Brightness Distribution (%) | 81 | 73 -10% | 86 6% | 88 9% | 88 9% | 85 5% |
| Black Level * (cd/m²) | 0.45 | 0.17 62% | 0.31 31% | 0.19 58% | 0.26 42% | 0.43 4% |
| Contrast (:1) | 564 | 1306 132% | 1032 83% | 1195 112% | 908 61% | 630 12% |
| Colorchecker dE 2000 * | 10.77 | 3.91 64% | 3.44 68% | 5.6 48% | 5.7 47% | 5.03 53% |
| Colorchecker dE 2000 max. * | 18.02 | 7.74 57% | 9.39 48% | 22.4 -24% | 22 -22% | 11.9 34% |
| Greyscale dE 2000 * | 11.82 | 1.56 87% | 2.31 80% | 2.4 80% | 3.8 68% | 4.02 66% |
| Gamma | 2.39 92% | 2.53 87% | 2.38 92% | 2.44 90% | 2.1 105% | 2.31 95% |
| CCT | 13633 48% | 6701 97% | 6496 100% | 6506 100% | 7318 89% | 6659 98% |
| Color Space (Percent of AdobeRGB 1998) (%) | 40 | 35 -12% | 55 38% | 34.5 -14% | 37.7 -6% | 39 -2% |
| Color Space (Percent of sRGB) (%) | 63 | 55 -13% | 84 33% | 54.4 -14% | 59.2 -6% | 61 -3% |
| Total Average (Program / Settings) | -25% /
8% | 22% /
36% | -16% /
5% | -10% /
5% | -7% /
7% |
* ... smaller is better
Screen Flickering / PWM (Pulse-Width Modulation)
| Screen flickering / PWM detected | 1000 Hz | ≤ 90 % brightness setting | 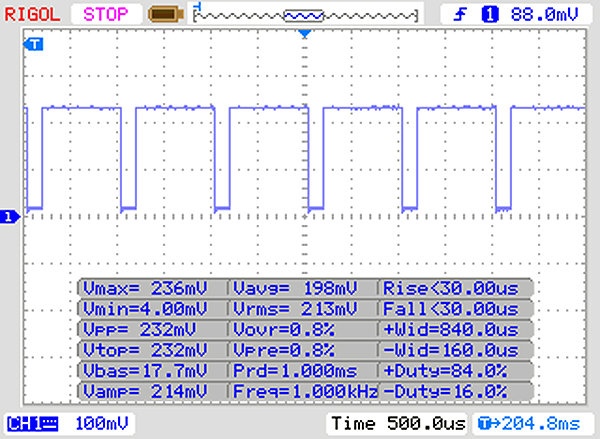 |
The display backlight flickers at 1000 Hz (worst case, e.g., utilizing PWM) Flickering detected at a brightness setting of 90 % and below. There should be no flickering or PWM above this brightness setting. The frequency of 1000 Hz is quite high, so most users sensitive to PWM should not notice any flickering. In comparison: 52 % of all tested devices do not use PWM to dim the display. If PWM was detected, an average of 7801 (minimum: 5 - maximum: 343500) Hz was measured. | |||
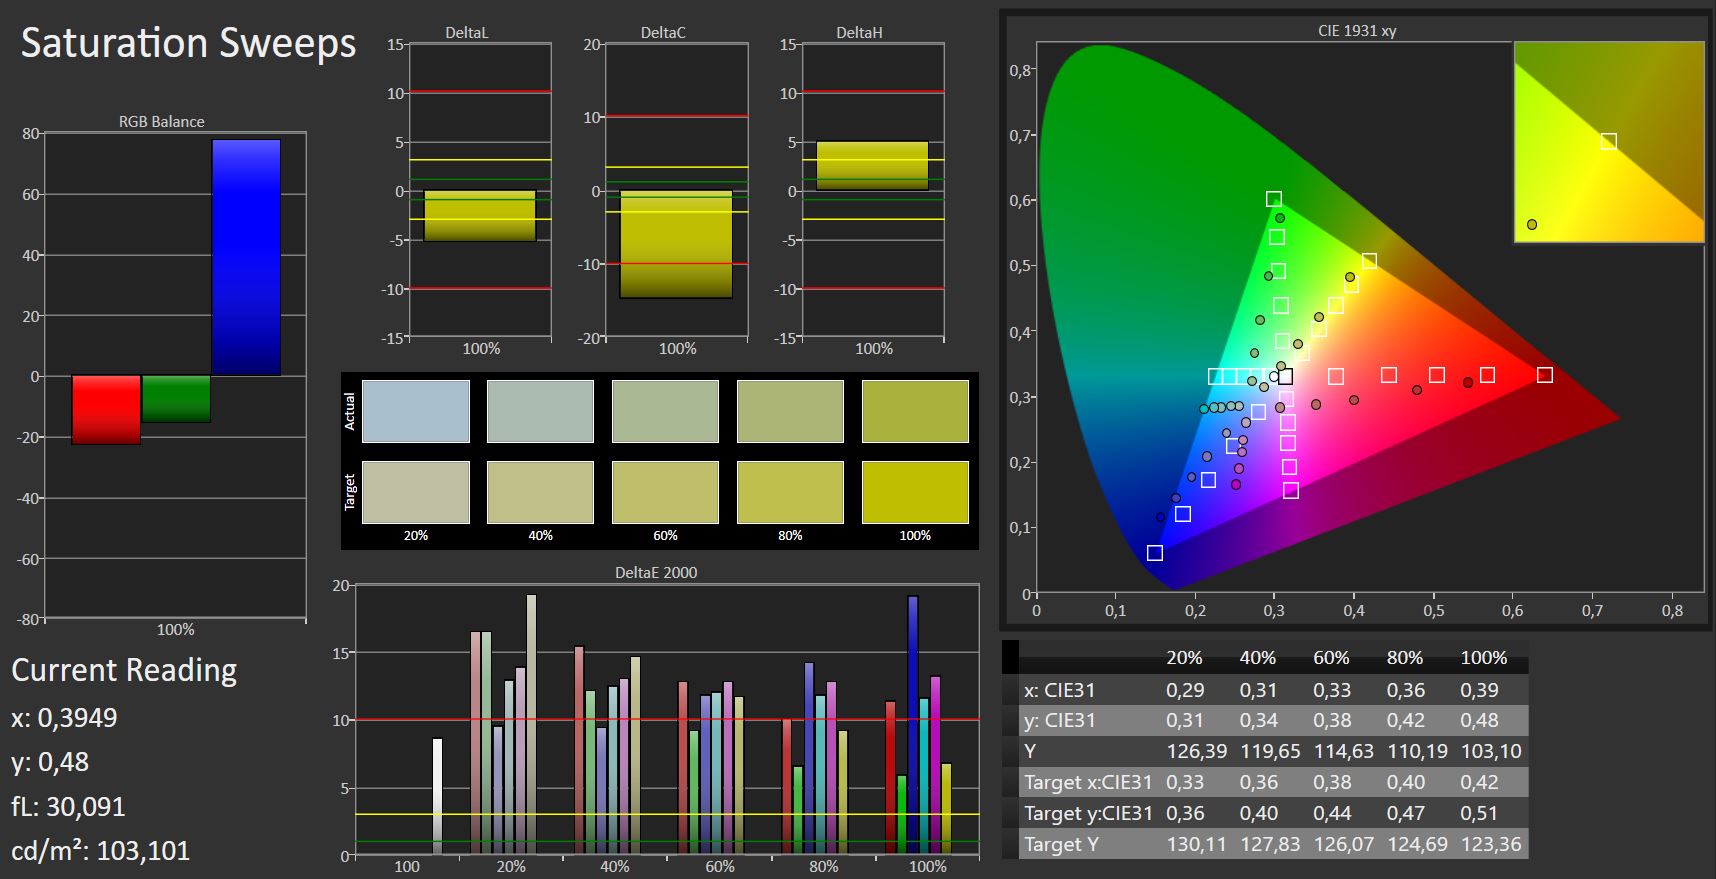
The mt21 has Delta E 2000 color deviations of 10.77. This is far higher than ideal values of less than 3. Additionally, we noticed a clear blue tint to the display during testing.
Display Response Times
| ↔ Response Time Black to White | ||
|---|---|---|
| 15 ms ... rise ↗ and fall ↘ combined | ↗ 10 ms rise | 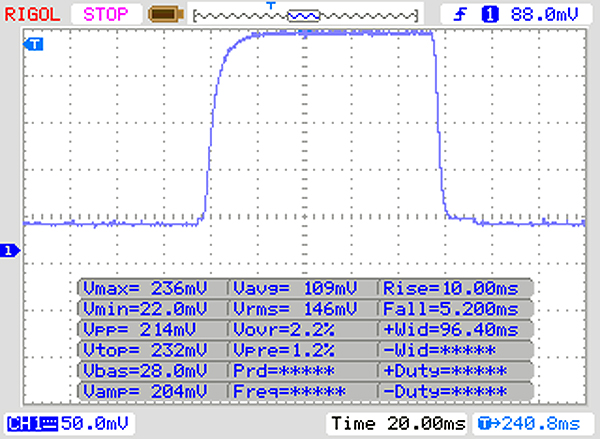 |
| ↘ 5 ms fall | ||
| The screen shows good response rates in our tests, but may be too slow for competitive gamers. In comparison, all tested devices range from 0.1 (minimum) to 240 (maximum) ms. » 36 % of all devices are better. This means that the measured response time is better than the average of all tested devices (19.9 ms). | ||
| ↔ Response Time 50% Grey to 80% Grey | ||
| 43 ms ... rise ↗ and fall ↘ combined | ↗ 24 ms rise | 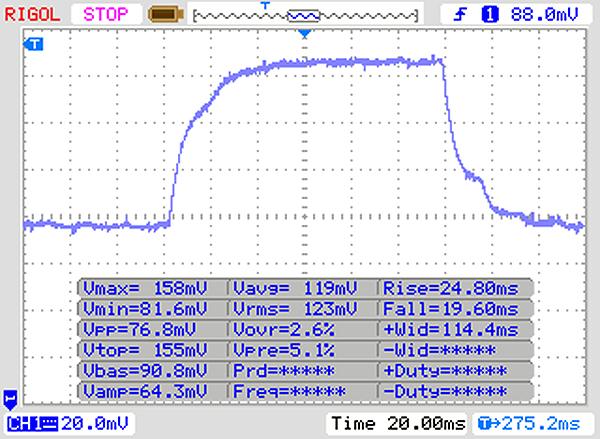 |
| ↘ 19 ms fall | ||
| The screen shows slow response rates in our tests and will be unsatisfactory for gamers. In comparison, all tested devices range from 0.165 (minimum) to 636 (maximum) ms. » 71 % of all devices are better. This means that the measured response time is worse than the average of all tested devices (31.1 ms). | ||
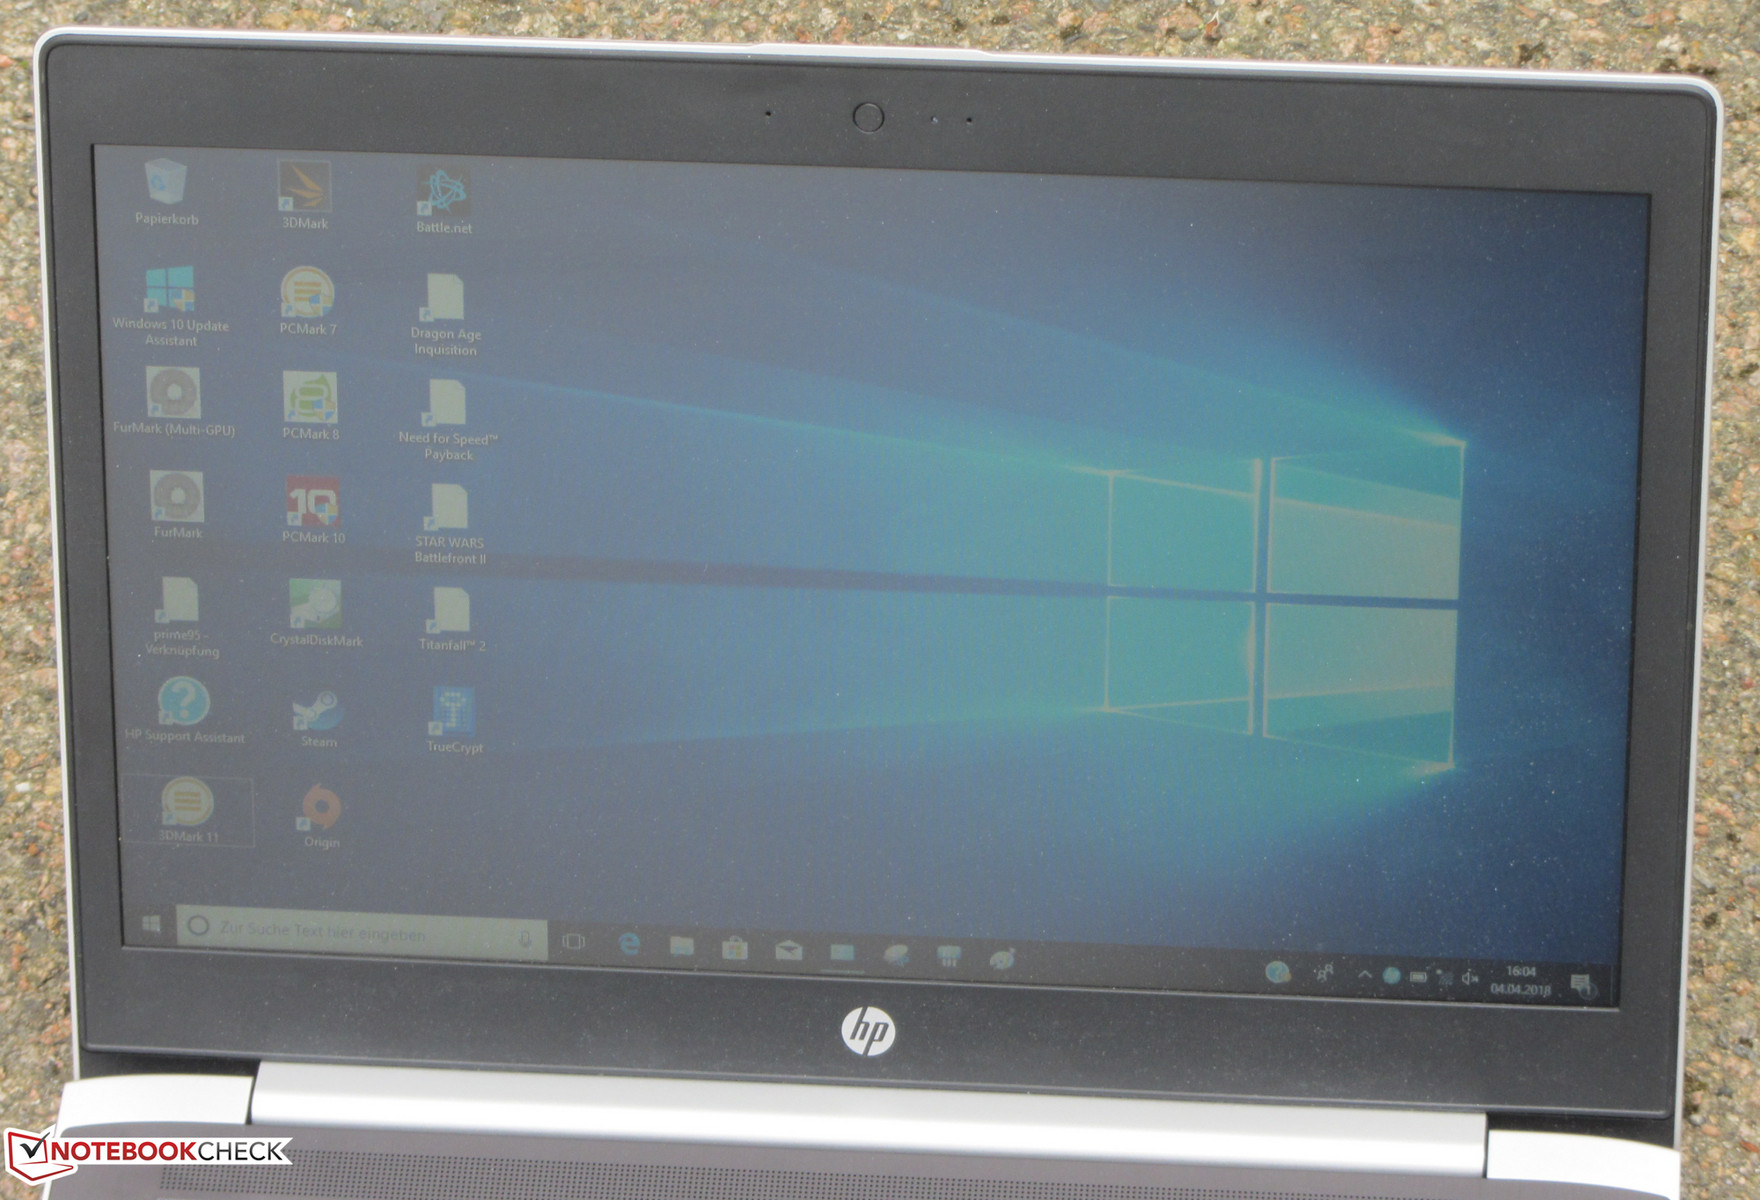
The mt21 has a TN panel with poor viewing angles. Content is unreadable from any angle other than when you are straight in front of the display. The mt21 can be used outdoors, but only when the sun is not too bright.
Performance
The mt21 is a 14-inch device that sits within the HP Thin Client range. The mt21 is based on the ProBook 400 G5 and has enough power for its intended use case. The mt21 is available for between €1,200 to €1,300 (~$1485 to $1609).
Processor
The mt21 is powered by an Intel Celeron 3865U Kaby Lake dual-core processor. This CPU works at a maximum speed of 1.8 GHz and supports neither Intel Turbo Boost nor Intel Hyper-Threading. During our tests, the CPU performed equally fast on battery power as it did on mains power.
We tested the performance of the Celeron 3865U using the Cinebench R15 multi-thread benchmark on a thirty-minute loop. The mt21 performed at the same level consistently with no performance drop even towards the end of the benchmark.
| Geekbench 3 | |
| 32 Bit Multi-Core Score | |
| Lenovo IdeaPad V110-15IKB 80TH001SGE | |
| Asus X510UA-BR305T | |
| HP mt43 | |
| HP 250 G6 2UB93ES | |
| HP mt21 | |
| Average Intel Celeron 3865U (n=1) | |
| 32 Bit Single-Core Score | |
| Lenovo IdeaPad V110-15IKB 80TH001SGE | |
| Asus X510UA-BR305T | |
| HP 250 G6 2UB93ES | |
| HP mt43 | |
| HP mt21 | |
| Average Intel Celeron 3865U (n=1) | |
| Octane V2 - Total Score | |
| Average of class Office (49011 - 122119, n=19, last 2 years) | |
| HP ProBook 440 G5-3KX87ES (Edge) | |
| Acer TravelMate P449-G2-M-56CD (Edge) | |
| Lenovo ThinkPad L480-20LS001AGE (Edge 41.16299.248.0) | |
| Lenovo IdeaPad V110-15IKB 80TH001SGE (Edge 40) | |
| HP mt43 (Edge 41) | |
| HP mt21 (Edge 41) | |
| Average Intel Celeron 3865U (n=1) | |
| Mozilla Kraken 1.1 - Total | |
| HP mt43 (Edge 41) | |
| HP mt21 (Edge 41) | |
| Average Intel Celeron 3865U (n=1) | |
| Lenovo IdeaPad V110-15IKB 80TH001SGE (Edge 40) | |
| Lenovo ThinkPad L480-20LS001AGE (Edge 41.16299.248.0) | |
| Acer TravelMate P449-G2-M-56CD (Edge) | |
| HP ProBook 440 G5-3KX87ES (Edge) | |
| Average of class Office (391 - 1297, n=76, last 2 years) | |
| JetStream 1.1 - 1.1 Total | |
| HP ProBook 440 G5-3KX87ES (Edge) | |
| Lenovo ThinkPad L480-20LS001AGE (Edge 41.16299.248.0) | |
| Acer TravelMate P449-G2-M-56CD (Edge) | |
| Asus X510UA-BR305T (Edge 40) | |
| Lenovo IdeaPad V110-15IKB 80TH001SGE (Edge 40) | |
| Fujitsu Lifebook E746 | |
| HP 250 G6 2UB93ES (Edge 41) | |
| HP mt21 (Edge 41) | |
| Average Intel Celeron 3865U (n=1) | |
| HP mt43 (Edge 41) | |
* ... smaller is better
System Performance
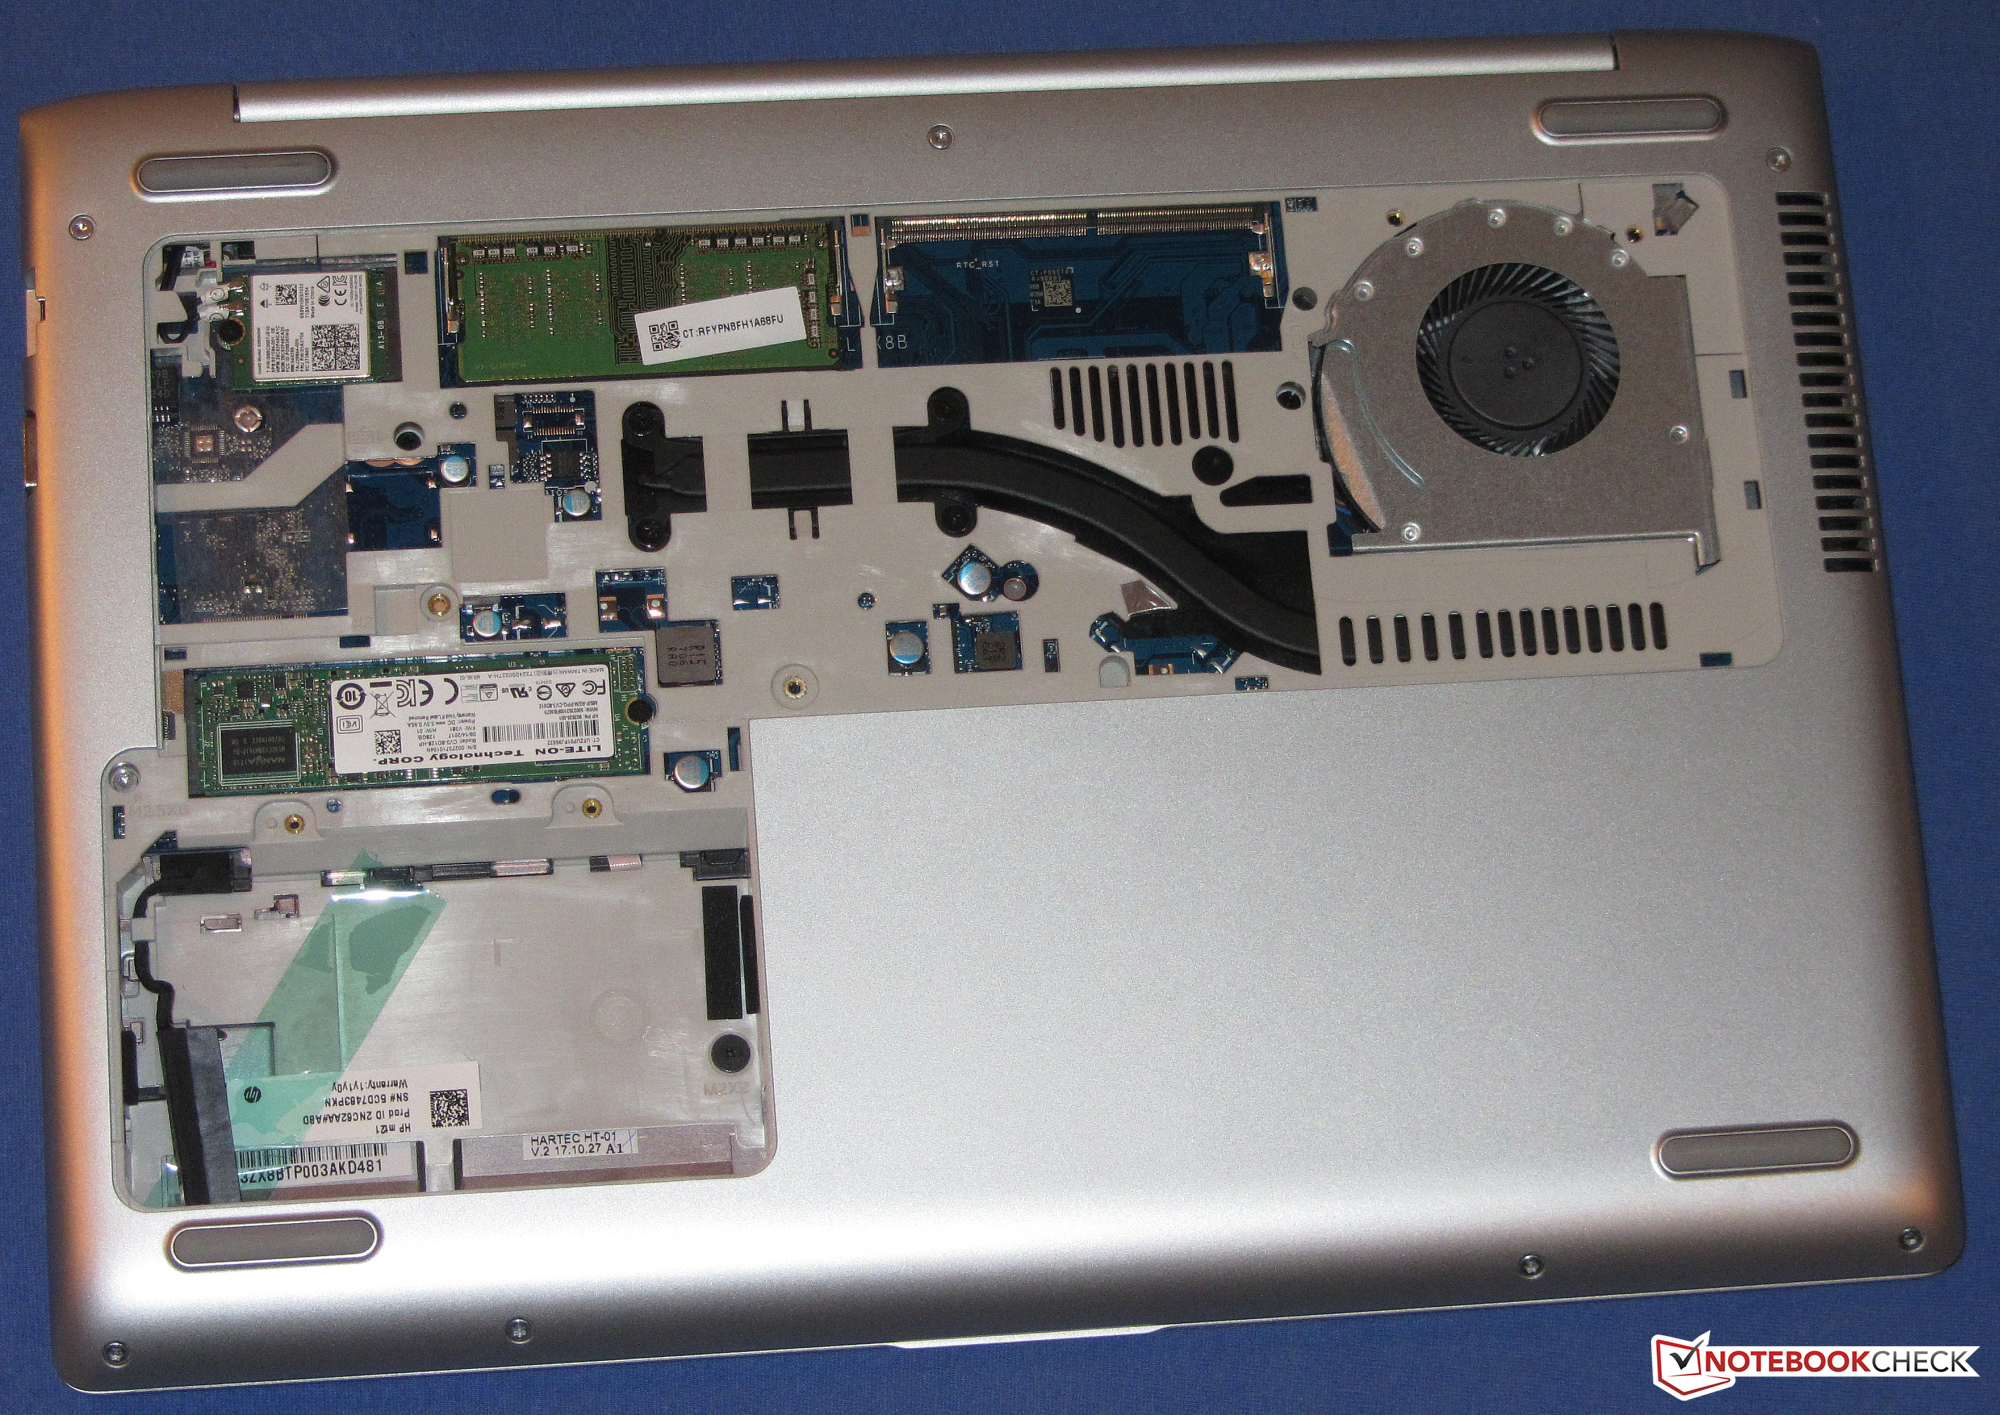
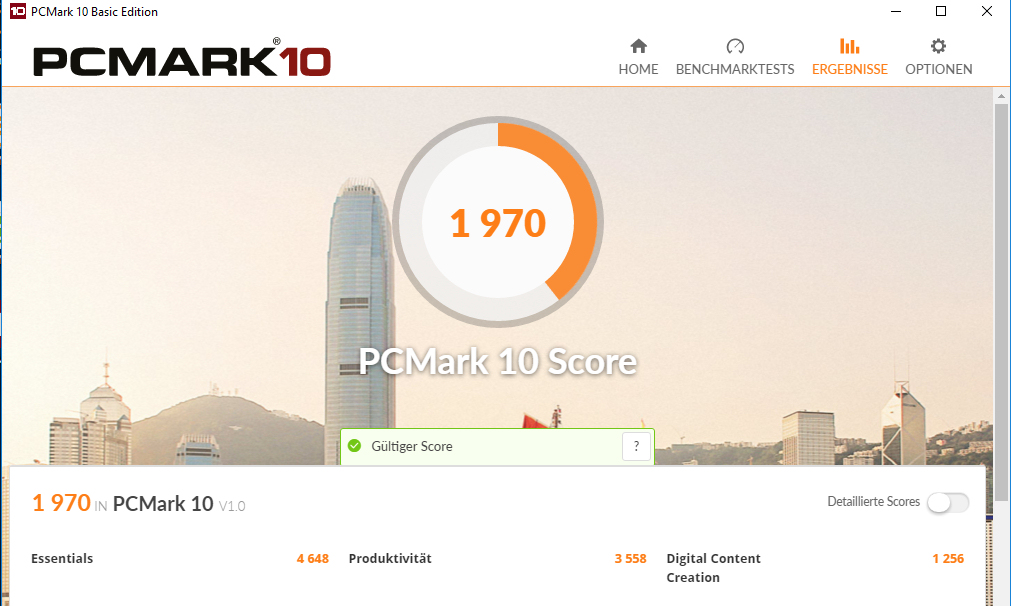
System performance is smooth and responsive. We encountered no problems during our tests. The mt21 is powerful enough for office and Internet applications, which the results from PCMark benchmarks confirm. The mt21 has two RAM slots, of which only one is occupied in our test device. The system runs in single-channel mode, meaning that there is still headroom for a slight boost in performance. Adding a second RAM module would give the mt21 that performance boost by activating dual-channel mode.
| PCMark 7 Score | 3910 points | |
| PCMark 8 Home Score Accelerated v2 | 2629 points | |
| PCMark 8 Creative Score Accelerated v2 | 2775 points | |
| PCMark 8 Work Score Accelerated v2 | 3714 points | |
| PCMark 10 Score | 1970 points | |
Help | ||
Storage Devices
The mt21 has an M.2-2280 SATA III 128 GB by LiteOn. We measured decent transfer speeds. It would also be possible to equip the mt21 with a 2.5-inch secondary hard drive, as there is a SATA III slot available. The mounting frame would need to be bought separately though as HP did not include it with our test device.

| HP mt21 Liteonit CV3-8D128 | Lenovo ThinkPad L480-20LS001AGE Toshiba KXG5AZNV256G | Fujitsu Lifebook E746 Toshiba THNSNK256GCS8 | Dell Latitude 5490-TD70X Toshiba KSG60ZMV512G | HP ProBook 440 G5-3KX87ES Intel SSD 600p SSDPEKKW256G7 | HP mt43 SanDisk SD8SN8U256G1006 | Acer TravelMate P449-G2-M-56CD Intel SSD 600p SSDPEKKW512G7 | Average Liteonit CV3-8D128 | Average of class Office | |
|---|---|---|---|---|---|---|---|---|---|
| CrystalDiskMark 3.0 | 121% | 41% | 55% | 151% | -1% | 146% | -3% | 451% | |
| Read Seq (MB/s) | 488.1 | 1463 200% | 490.6 1% | 465.1 -5% | 1181 142% | 464.3 -5% | 1086 122% | 450 ? -8% | 3104 ? 536% |
| Write Seq (MB/s) | 277.4 | 556 100% | 264.8 -5% | 425 53% | 602 117% | 309.3 11% | 581 109% | 238 ? -14% | 2916 ? 951% |
| Read 512 (MB/s) | 252.9 | 765 202% | 411.6 63% | 410.1 62% | 923 265% | 370.9 47% | 869 244% | 267 ? 6% | 899 ? 255% |
| Write 512 (MB/s) | 154.2 | 351.9 128% | 262.3 70% | 360.7 134% | 600 289% | 181.9 18% | 584 279% | 167 ? 8% | 2309 ? 1397% |
| Read 4k (MB/s) | 26.35 | 33.56 27% | 24.86 -6% | 27.34 4% | 35.48 35% | 28.79 9% | 35.89 36% | 23.3 ? -12% | 54.1 ? 105% |
| Write 4k (MB/s) | 57.5 | 111.7 94% | 110.1 91% | 89 55% | 139.8 143% | 49.6 -14% | 122.4 113% | 55.9 ? -3% | 114.1 ? 98% |
| Read 4k QD32 (MB/s) | 213.8 | 384.6 80% | 383.4 79% | 295.6 38% | 287.8 35% | 115.4 -46% | 462.9 117% | 227 ? 6% | 463 ? 117% |
| Write 4k QD32 (MB/s) | 150 | 351.3 134% | 198.7 32% | 300.2 100% | 417.1 178% | 106.6 -29% | 370.9 147% | 145.9 ? -3% | 370 ? 147% |
Graphics Card
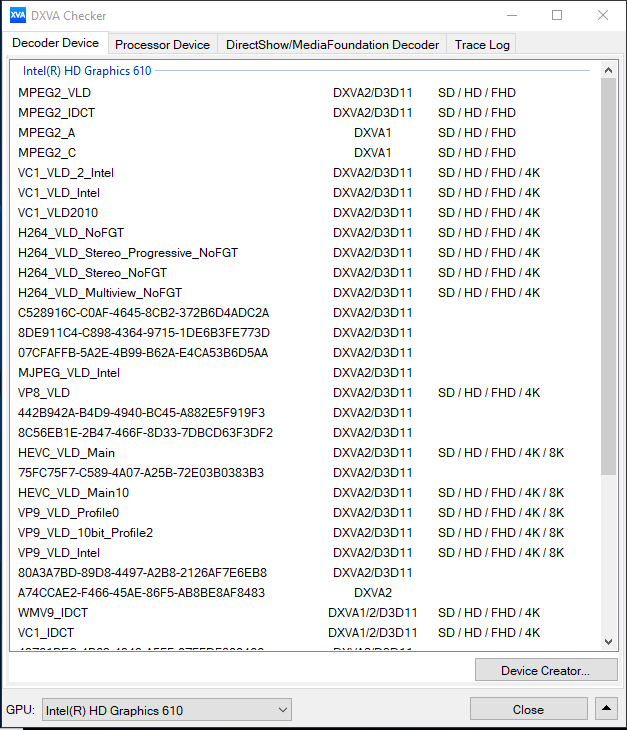
Graphics are handled by the Intel HD Graphics 610 integrated graphics core, which supports DirectX12 and can clock up to 900 MHz. 3DMark benchmark results are typical for an Intel HD Graphics 610 powered device. Dual-channel memory mode would make better use of the GPU and boost graphics performance.
| 3DMark 11 Performance | 885 points | |
| 3DMark Ice Storm Standard Score | 31465 points | |
| 3DMark Cloud Gate Standard Score | 3061 points | |
| 3DMark Fire Strike Score | 496 points | |
Help | ||
Gaming Performance
The mt21 can play some games, but this is limited to those with moderate hardware requirements. Even then, these can only really be played at low resolutions and low-quality settings. While activating dual-channel mode would increase frame rates, it would not make performance hungry games like Kingdom Come: Deliverance playable.
| low | med. | high | ultra | |
|---|---|---|---|---|
| BioShock Infinite (2013) | 30.6 | 16.9 | 14.5 |
Emissions and Energy
Fan Noise
The mt21 remains quiet even under full load. During our stress tests, we measured fan noise at just 31 dB(A). Correspondingly, the fan is either very quiet or off when the mt21 is idling.
Noise level
| Idle |
| 30.4 / 30.4 / 30.4 dB(A) |
| Load |
| 31.4 / 31.4 dB(A) |
 | ||
30 dB silent 40 dB(A) audible 50 dB(A) loud |
||
min: | ||
Temperature
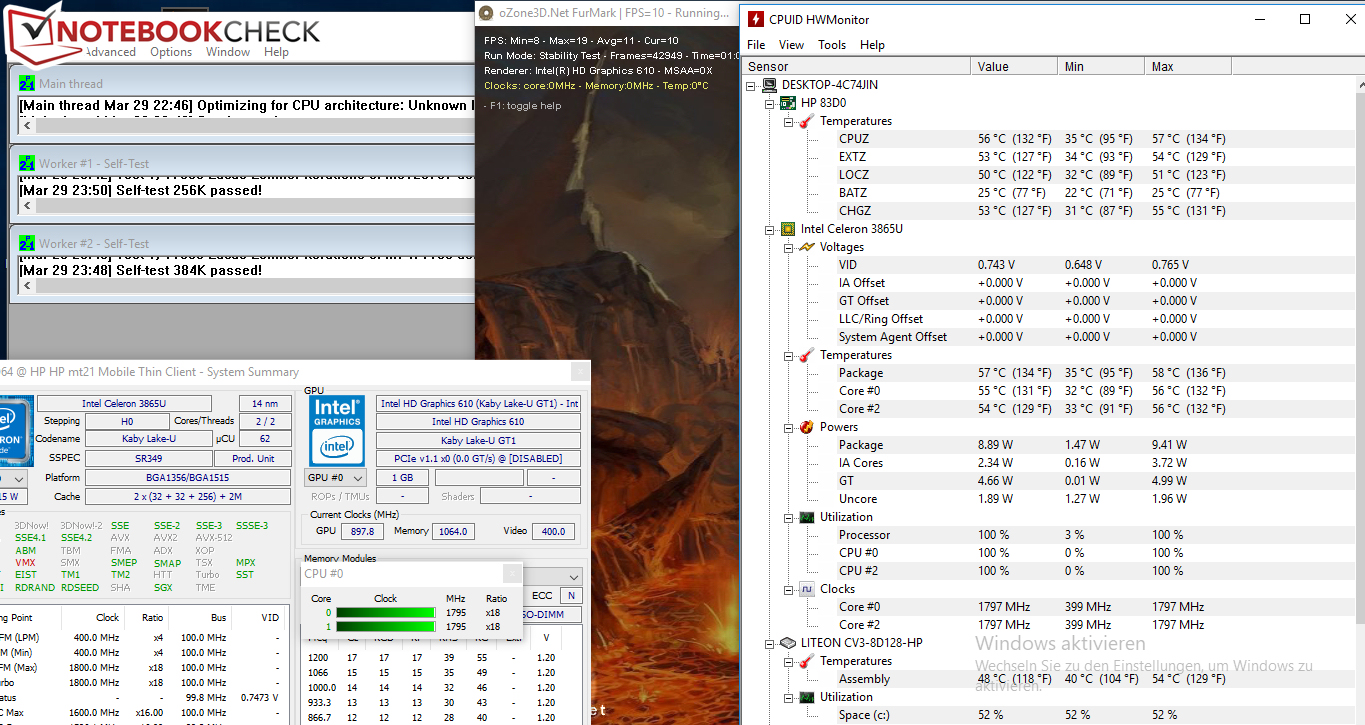
The mt21 performed equally well on battery power as it did on mains power during our one-hour Prime95 and FurMark stress tests. The CPU and GPU ran consistently at their maximum respective speeds of 1.8 GHz and 900 MHz.
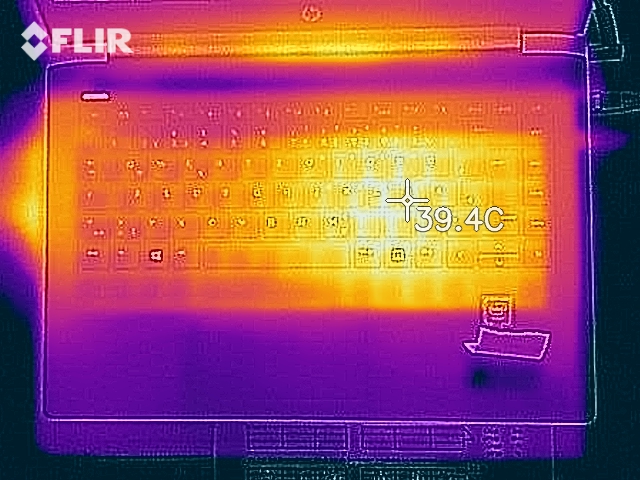
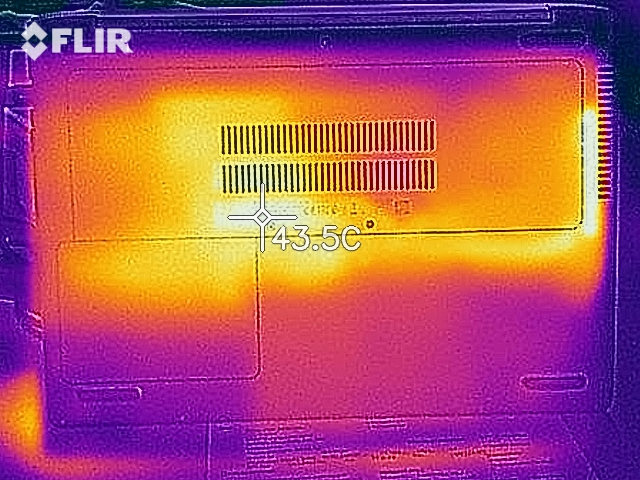
Our test device did not get too hot either. During the stress tests, we measured surface temperatures at well below 40 °C (104 °F) across all points of the device.
(+) The maximum temperature on the upper side is 34 °C / 93 F, compared to the average of 34.3 °C / 94 F, ranging from 21.2 to 62.5 °C for the class Office.
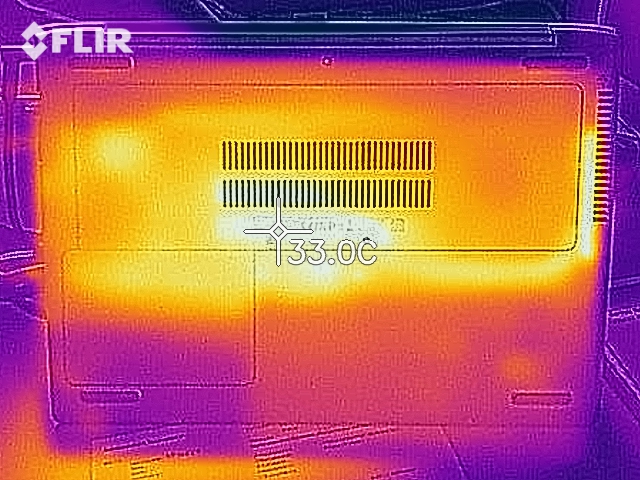
(+) The bottom heats up to a maximum of 34.6 °C / 94 F, compared to the average of 36.8 °C / 98 F
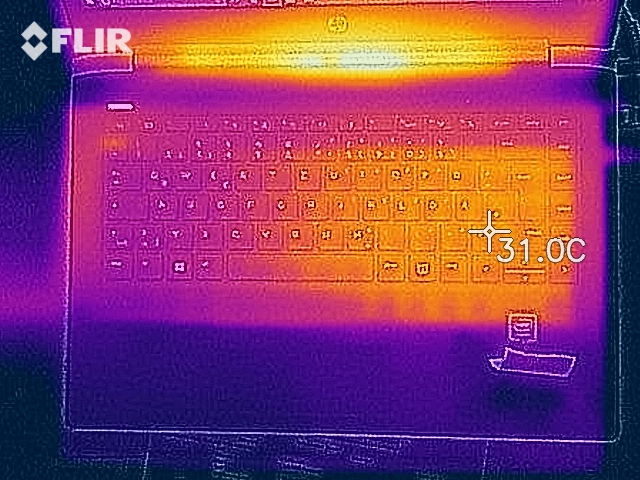
(+) In idle usage, the average temperature for the upper side is 26.5 °C / 80 F, compared to the device average of 29.5 °C / 85 F.
(+) The palmrests and touchpad are cooler than skin temperature with a maximum of 25.2 °C / 77.4 F and are therefore cool to the touch.
(+) The average temperature of the palmrest area of similar devices was 27.5 °C / 81.5 F (+2.3 °C / 4.1 F).
Speakers
HP mt21 audio analysis
(±) | speaker loudness is average but good (72.9 dB)
Bass 100 - 315 Hz
(-) | nearly no bass - on average 25.3% lower than median
(±) | linearity of bass is average (9.9% delta to prev. frequency)
Mids 400 - 2000 Hz
(±) | higher mids - on average 6.6% higher than median
(±) | linearity of mids is average (11.7% delta to prev. frequency)
Highs 2 - 16 kHz
(+) | balanced highs - only 2.3% away from median
(+) | highs are linear (6.6% delta to prev. frequency)
Overall 100 - 16.000 Hz
(±) | linearity of overall sound is average (26.4% difference to median)
Compared to same class
» 81% of all tested devices in this class were better, 7% similar, 13% worse
» The best had a delta of 7%, average was 21%, worst was 53%
Compared to all devices tested
» 81% of all tested devices were better, 4% similar, 15% worse
» The best had a delta of 4%, average was 24%, worst was 134%
Apple MacBook 12 (Early 2016) 1.1 GHz audio analysis
(+) | speakers can play relatively loud (83.6 dB)
Bass 100 - 315 Hz
(±) | reduced bass - on average 11.3% lower than median
(±) | linearity of bass is average (14.2% delta to prev. frequency)
Mids 400 - 2000 Hz
(+) | balanced mids - only 2.4% away from median
(+) | mids are linear (5.5% delta to prev. frequency)
Highs 2 - 16 kHz
(+) | balanced highs - only 2% away from median
(+) | highs are linear (4.5% delta to prev. frequency)
Overall 100 - 16.000 Hz
(+) | overall sound is linear (10.2% difference to median)
Compared to same class
» 7% of all tested devices in this class were better, 2% similar, 91% worse
» The best had a delta of 5%, average was 18%, worst was 53%
Compared to all devices tested
» 5% of all tested devices were better, 1% similar, 94% worse
» The best had a delta of 4%, average was 24%, worst was 134%
Frequency diagram in comparison (checkboxes are de/selectable)
Power Consumption
The mt21 has good power consumption irrespective of load. We measured a maximum draw of 7 W at idle, which increased to 19.2 W at maximum load. The power supply has a 45 W power rating, which will be more than enough to charge the device even when it is operating under maximum load.
| Off / Standby | |
| Idle | |
| Load |
|
Key:
min: | |
Battery Life
We tested the mt21 against our practical Wi-Fi test, which uses a script to simulate the load required to load and render websites. During this test, we set the Windows 10 power mode to Balanced, the display brightness to 150 cd/m², and turned off energy-saving features. The mt21 lasted for 8:45 hours under these conditions.
Pros
Cons
Verdict
A Mobile Thin Client does not need maximum performance, so it does not matter that the processor powering the HP mt21 is one of the least powerful Kaby Lake processors that Intel offers.
This lack of power is a virtue though as it allows the mt21 to run near silently. Additionally, the processor is energy efficient, giving the mt21 good battery life and relatively cool surface temperatures even under extreme simulated load.
With the mt21, HP has delivered a quiet and consistent Mobile Thin Client.
An SSD ensures smooth system performance. The SSD could be swapped out, and there is even room for a 2.5-inch drive if required. Better still, both drive bays are accessible by a maintenance cover, rather than having to remove the bottom case as is the case with other devices. The mt21 has a good keyboard suitable for regular paperwork, although there is no keyboard backlight.
The matte 14-inch display will inspire no one. HP has used a dark, low-contrast TN panel with poor viewing angles. At this price point, we would have expected a brighter, higher-contrast IPS panel instead.
HP mt21
- 04/04/2018 v6 (old)
Sascha Mölck
Price comparison

