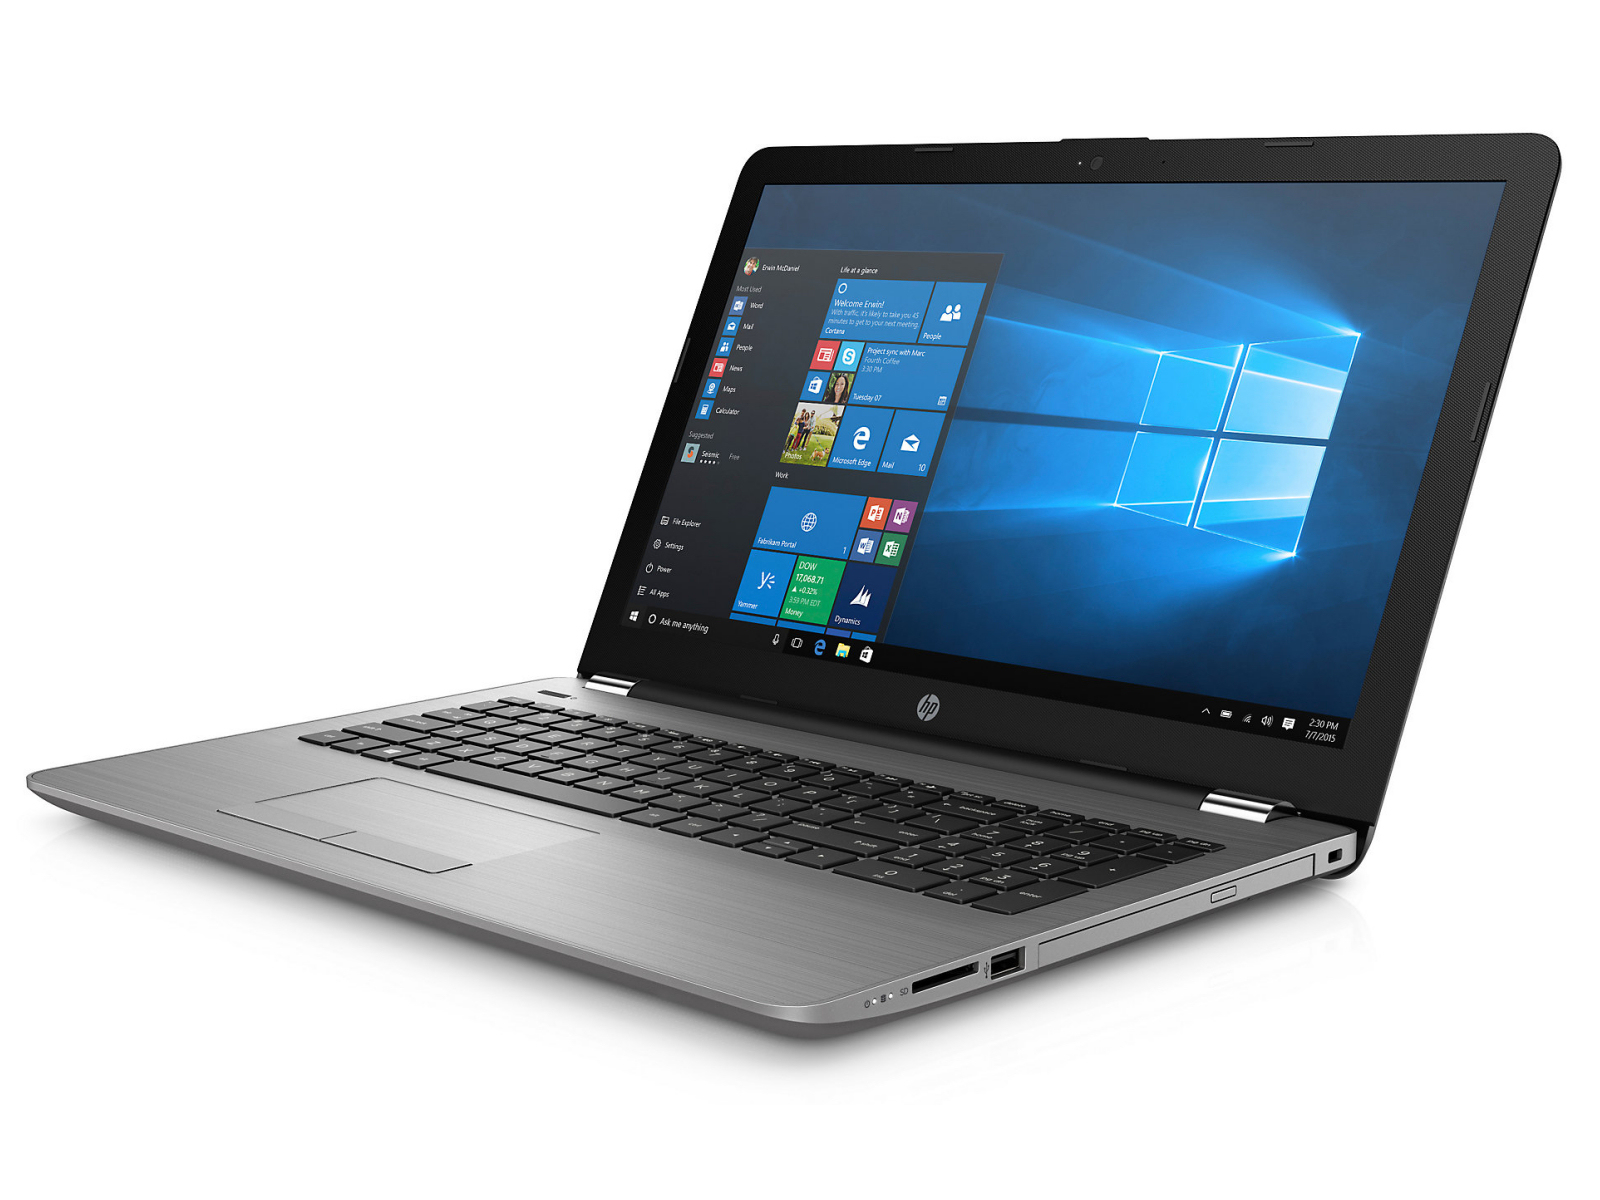
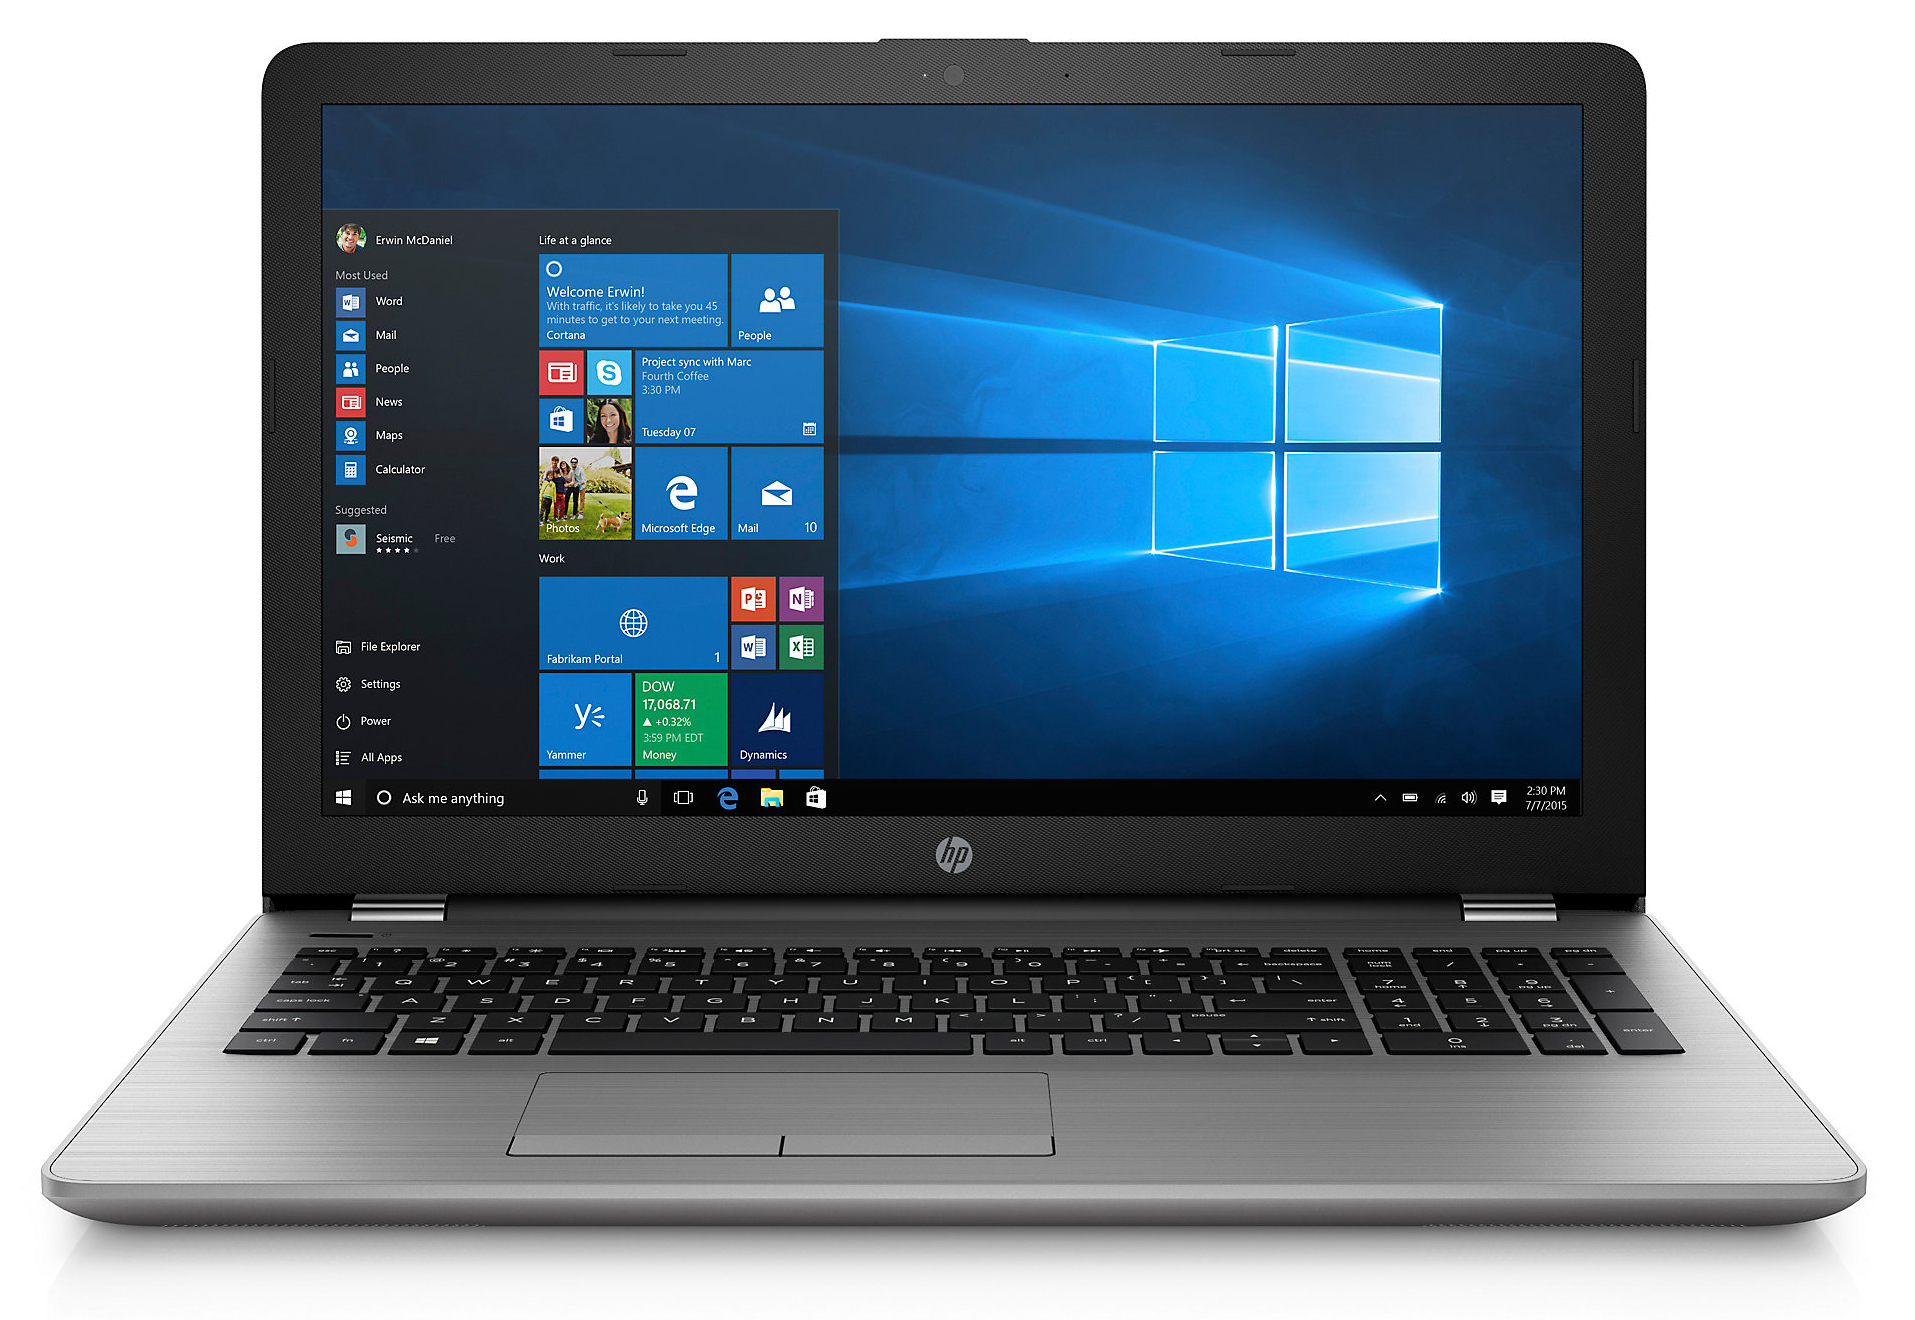
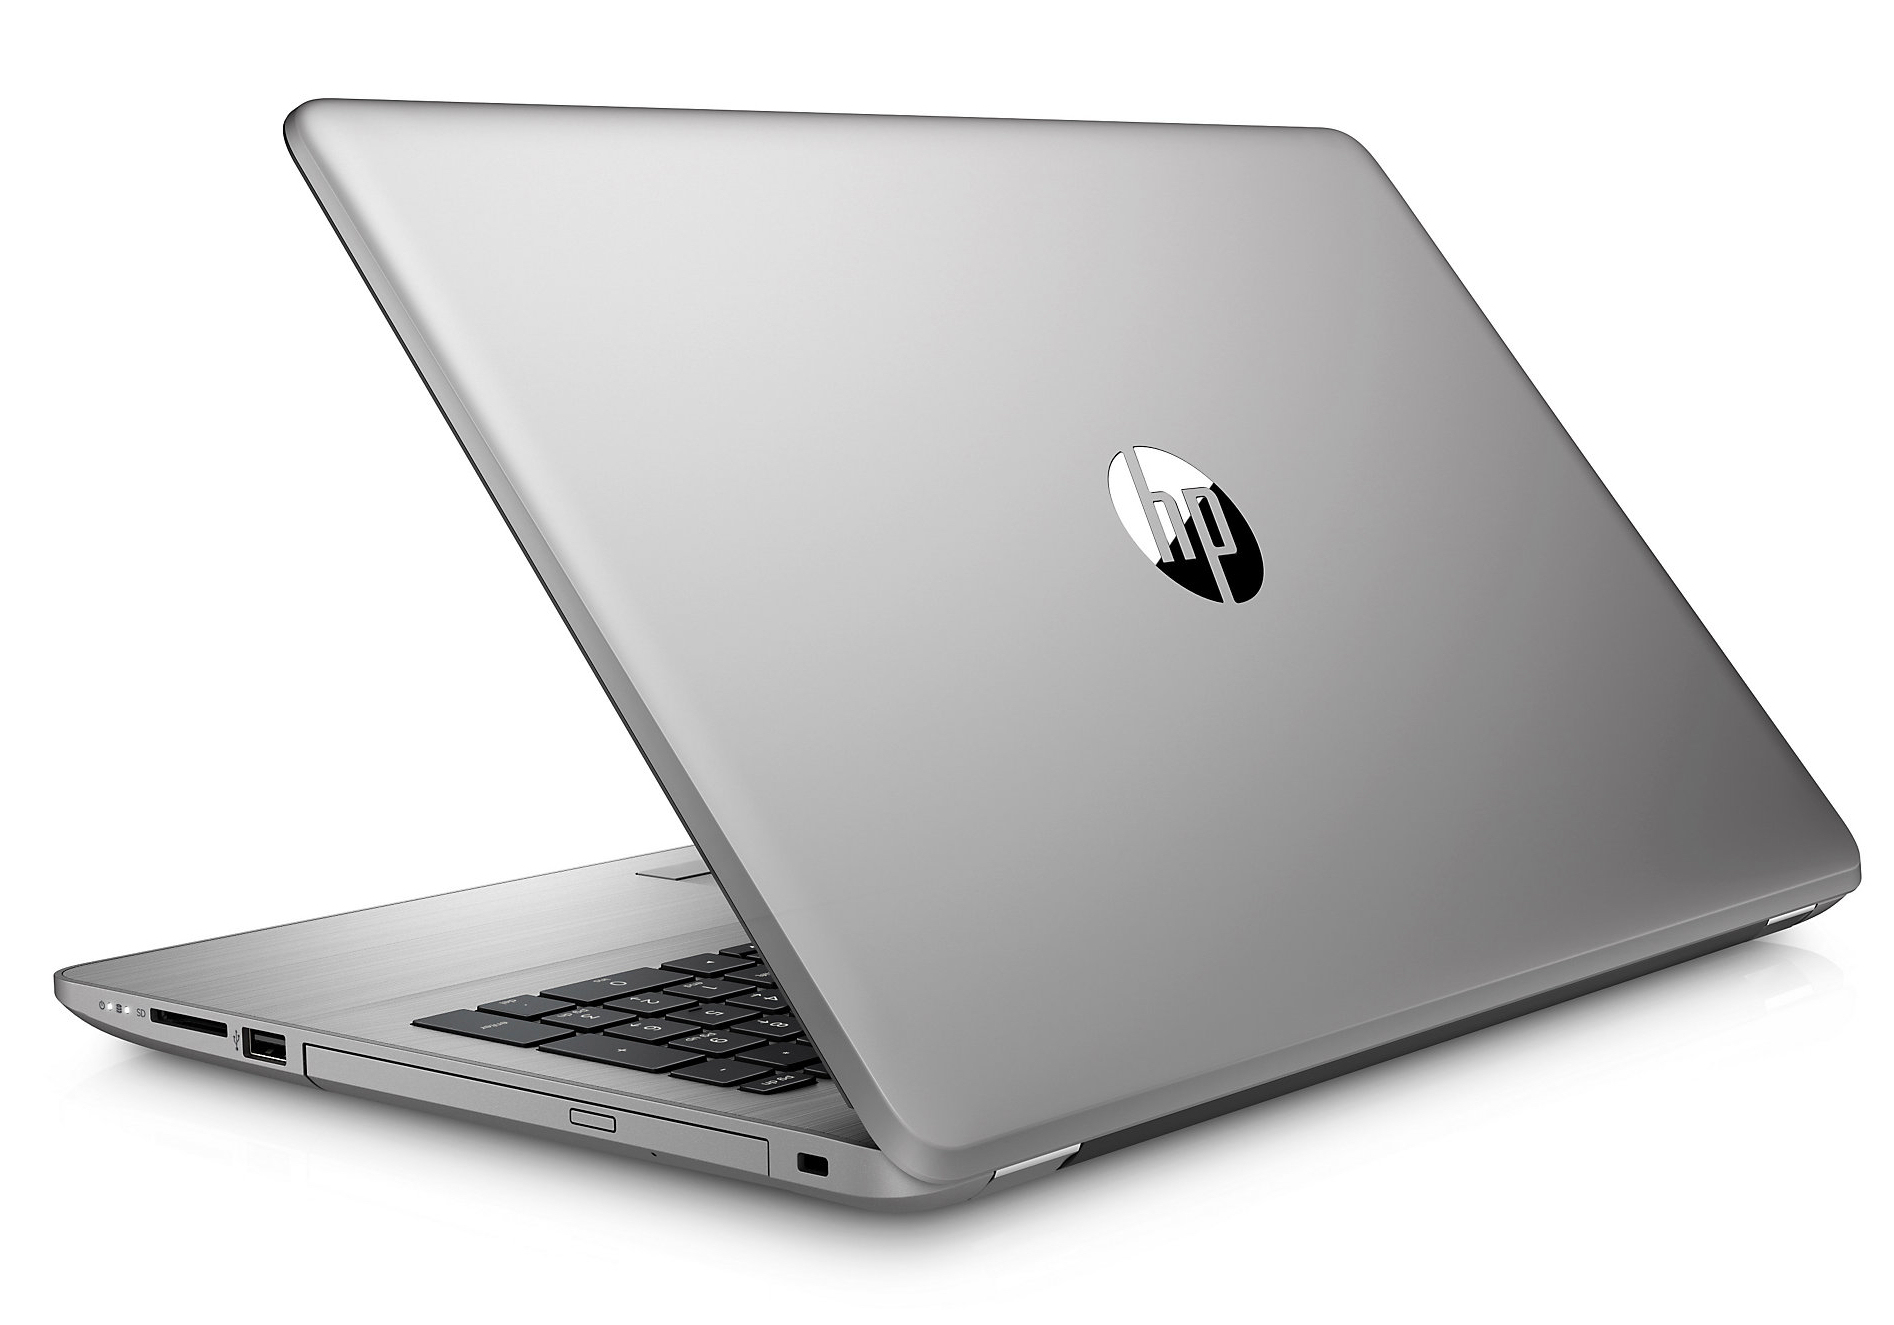
HP 250 G6 (i3-6006U, SSD, FHD) Laptop Review
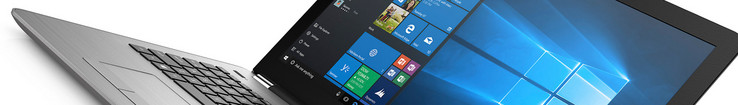
The HP 250 GX series are typically simple 15.6-inch cheap office notebooks. Our test device is powered by a Core i3 processor with 8 GB of RAM and a Full HD display. This notebook is from the sixth generation in the series and is one which we are acquainted with having already reviewed its sibling, the HP 255 G6. We will be using the Acer Aspire 3 A315-51, Asus ASUSPRO P541UA, Lenovo V110-15IKB, and the Acer Extensa 2540-580K as comparison devices.
In this review, we will not be examining the case, connectivity, input devices or speakers as they are physically identical to those found in the already reviewed 255 G6. However, we will cover these areas on matters where the two devices differ.
Update 11.06.2018: HP 250 G6 4BD30ES Kaby Lake version with an Intel Core i3-7020U and SanDisk SSD tested.
The 250-series notebooks are undoubtedly the bread and better for HP. The devices are cheap and there are numerous configurations that are sold globally. The 250 series are solid workhorses for using in and outside of the office. They do their job comfortably without attracting attention; HP has not used any premium materials or components used in these devices.
We also received the Kaby Lake Core i3 version that has a 256 GB M.2 SSD. We have decided to supplement our existing review rather than creating a new article as everything about the two devices is the same except for the display, the processor and the SSD.
The new device has several questions to answer. Can the Core i3 Kaby Lake processor improve on its Skylake sibling? Is the new processor more economical and does it improve battery life? Does the different display and SSD affect the quality or performance of the device overall?
We will answer all these questions in the ensuing sections of this review. We have included an additional conclusion too.
Case
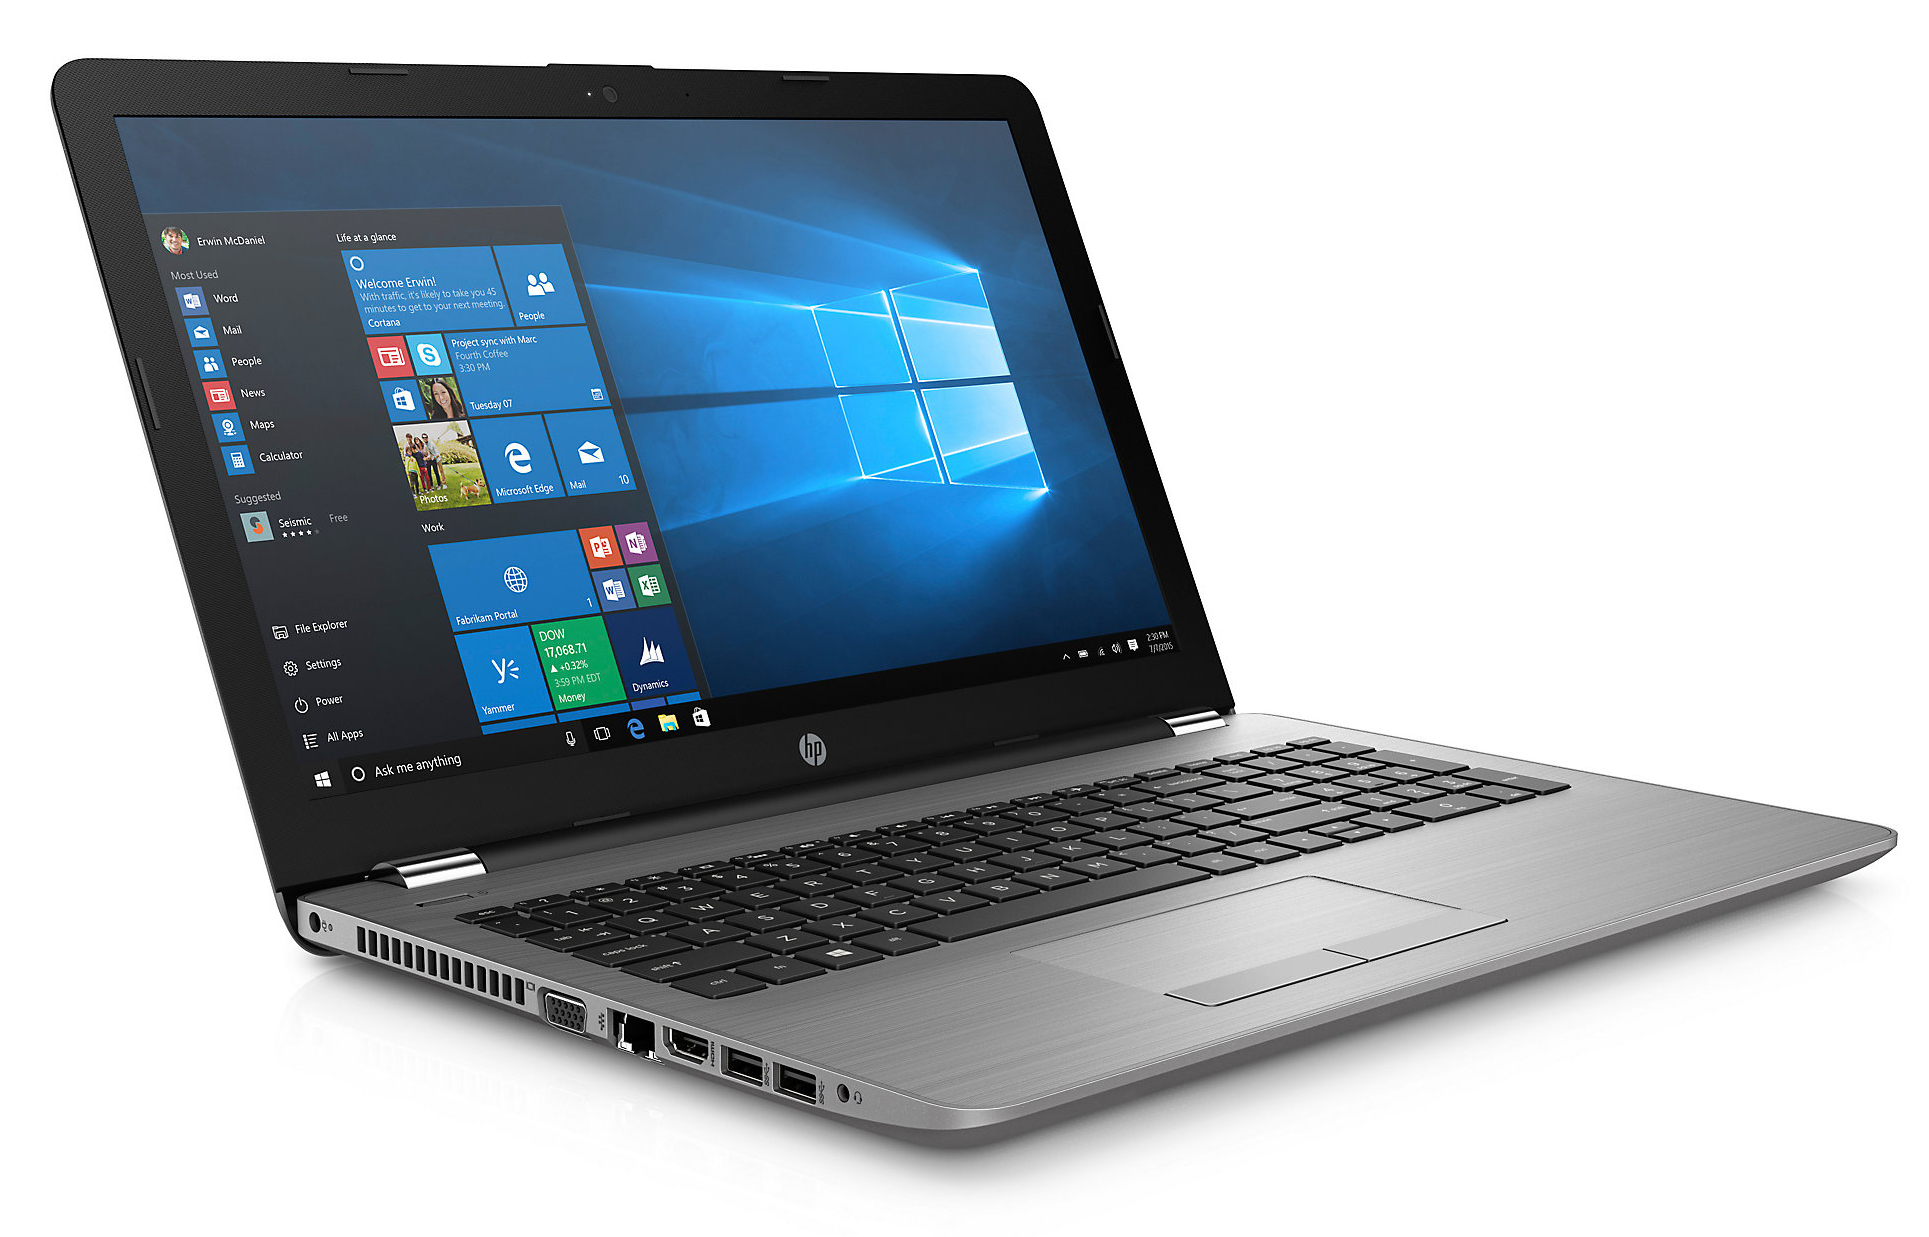
Connectivity
| SD Card Reader | |
| average JPG Copy Test (av. of 3 runs) | |
| Asus ASUSPRO P541UA-GQ1532 (Toshiba Exceria Pro SDXC 64 GB UHS-II) | |
| Acer Aspire 3 A315-51-55E4 (Toshiba Exceria Pro SDXC 64 GB UHS-II) | |
| Acer Aspire 3 A315-51-36YU (Toshiba Exceria Pro SDXC 64 GB UHS-II) | |
| Average of class Office (19.8 - 198.5, n=22, last 2 years) | |
| Lenovo IdeaPad V110-15IKB 80TH001SGE (Toshiba Exceria Pro SDXC 64 GB UHS-II) | |
| Acer Extensa 2540-580K (Toshiba Exceria Pro SDXC 64 GB UHS-II) | |
| HP 250 G6 2UB93ES (Toshiba Exceria Pro SDXC 64 GB UHS-II) | |
| HP 255 G6 (Toshiba Exceria Pro SDXC 64 GB UHS-II) | |
| maximum AS SSD Seq Read Test (1GB) | |
| Acer Aspire 3 A315-51-55E4 (Toshiba Exceria Pro SDXC 64 GB UHS-II) | |
| Average of class Office (27.4 - 249, n=21, last 2 years) | |
| Acer Aspire 3 A315-51-36YU (Toshiba Exceria Pro SDXC 64 GB UHS-II) | |
| HP 250 G6 2UB93ES (Toshiba Exceria Pro SDXC 64 GB UHS-II) | |
| HP 255 G6 (Toshiba Exceria Pro SDXC 64 GB UHS-II) | |
| Lenovo IdeaPad V110-15IKB 80TH001SGE (Toshiba Exceria Pro SDXC 64 GB UHS-II) | |
| Acer Extensa 2540-580K (Toshiba Exceria Pro SDXC 64 GB UHS-II) | |
Maintenance
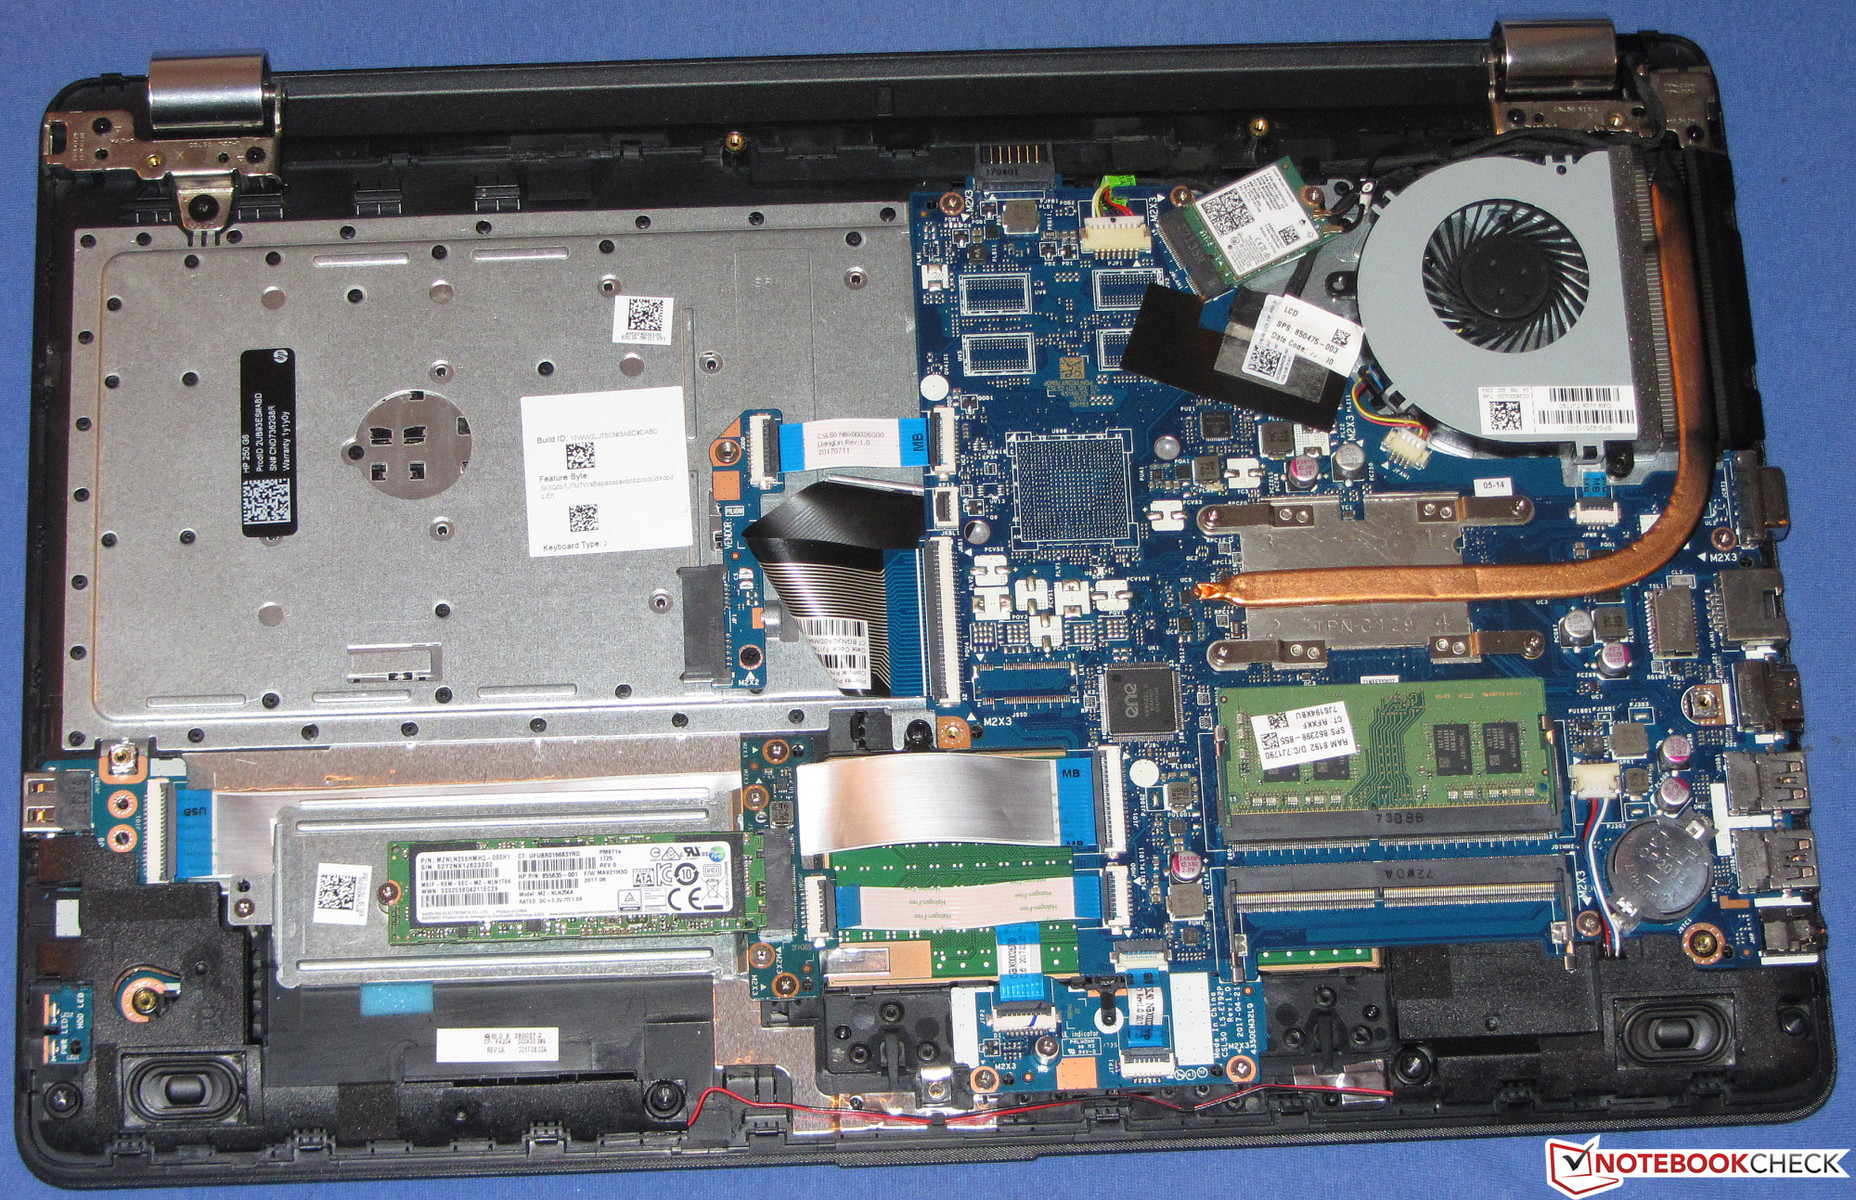
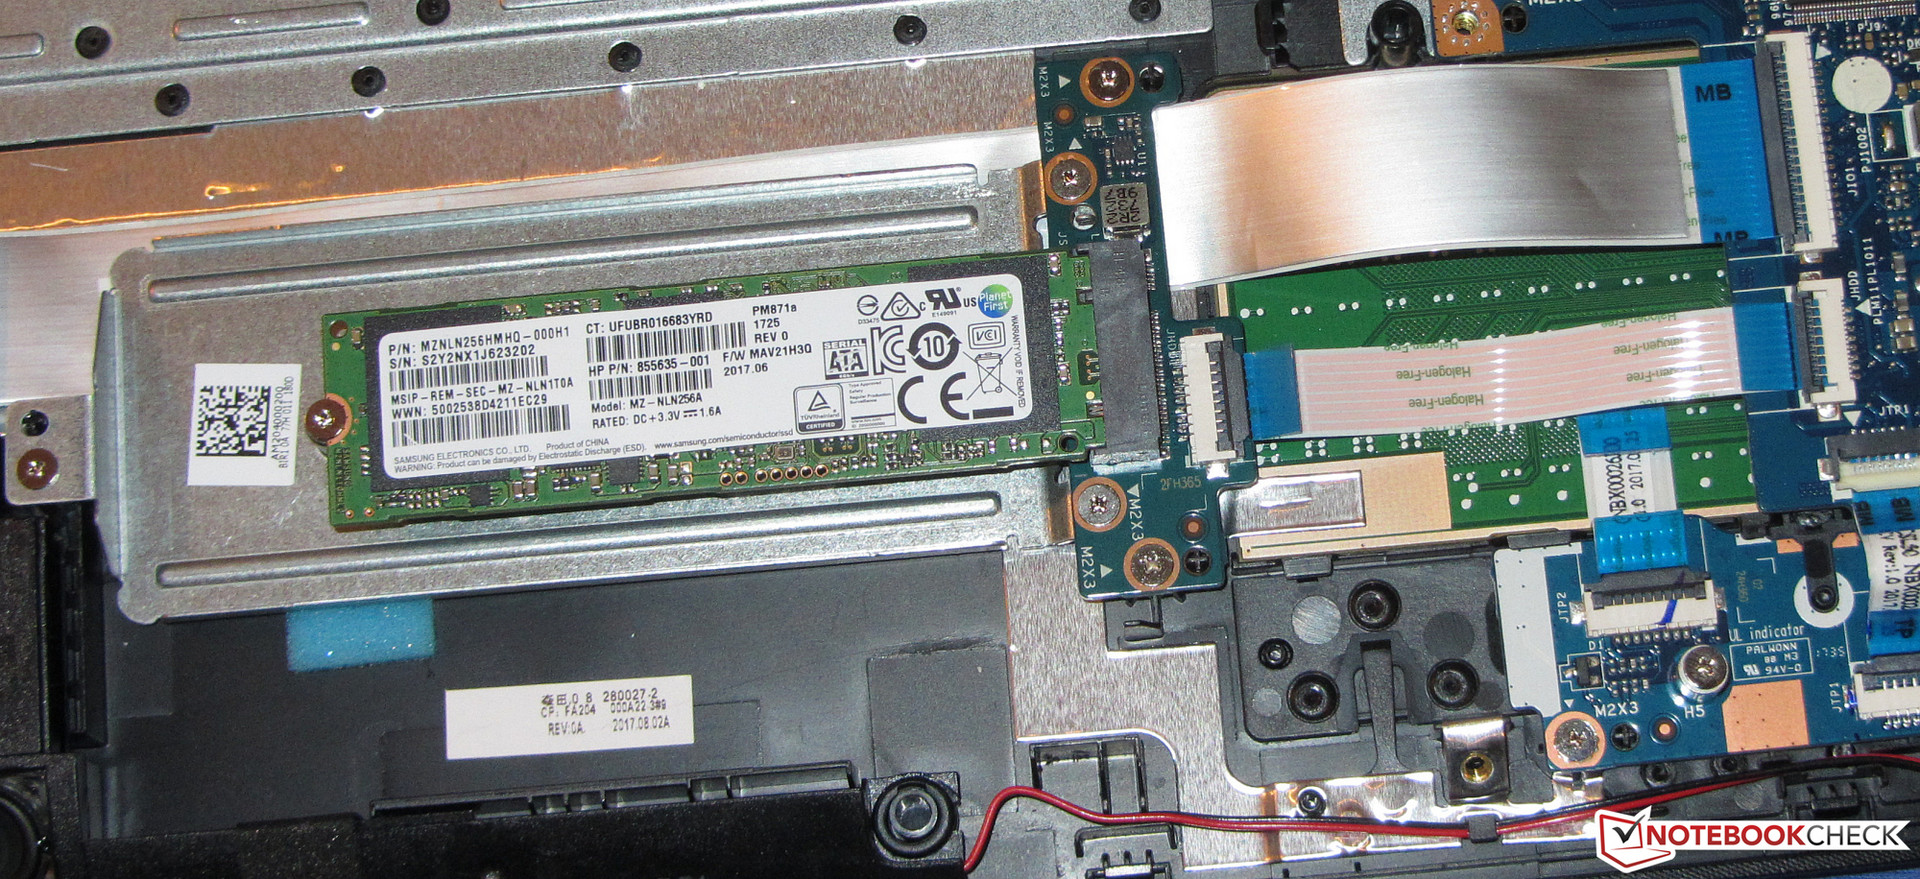
Unlike its sibling, the 250 G6 has no dedicated maintenance cover. This means that to repair and maintain the internal components you will have to remove the base plate as with other laptops. Firstly, remove the battery and the optical drive, followed by the screws on the base plate. HP hides one screw under each rubber foot, be sure to remove these. Once all the screws have been removed, carefully pry the base plate up with something such as a flat plastic spatula to avoid damaging the plastics. Once removed, the internal components will be visible, including the fan, the RAM slots, the SSD, the Wi-Fi module, and the BIOS battery.
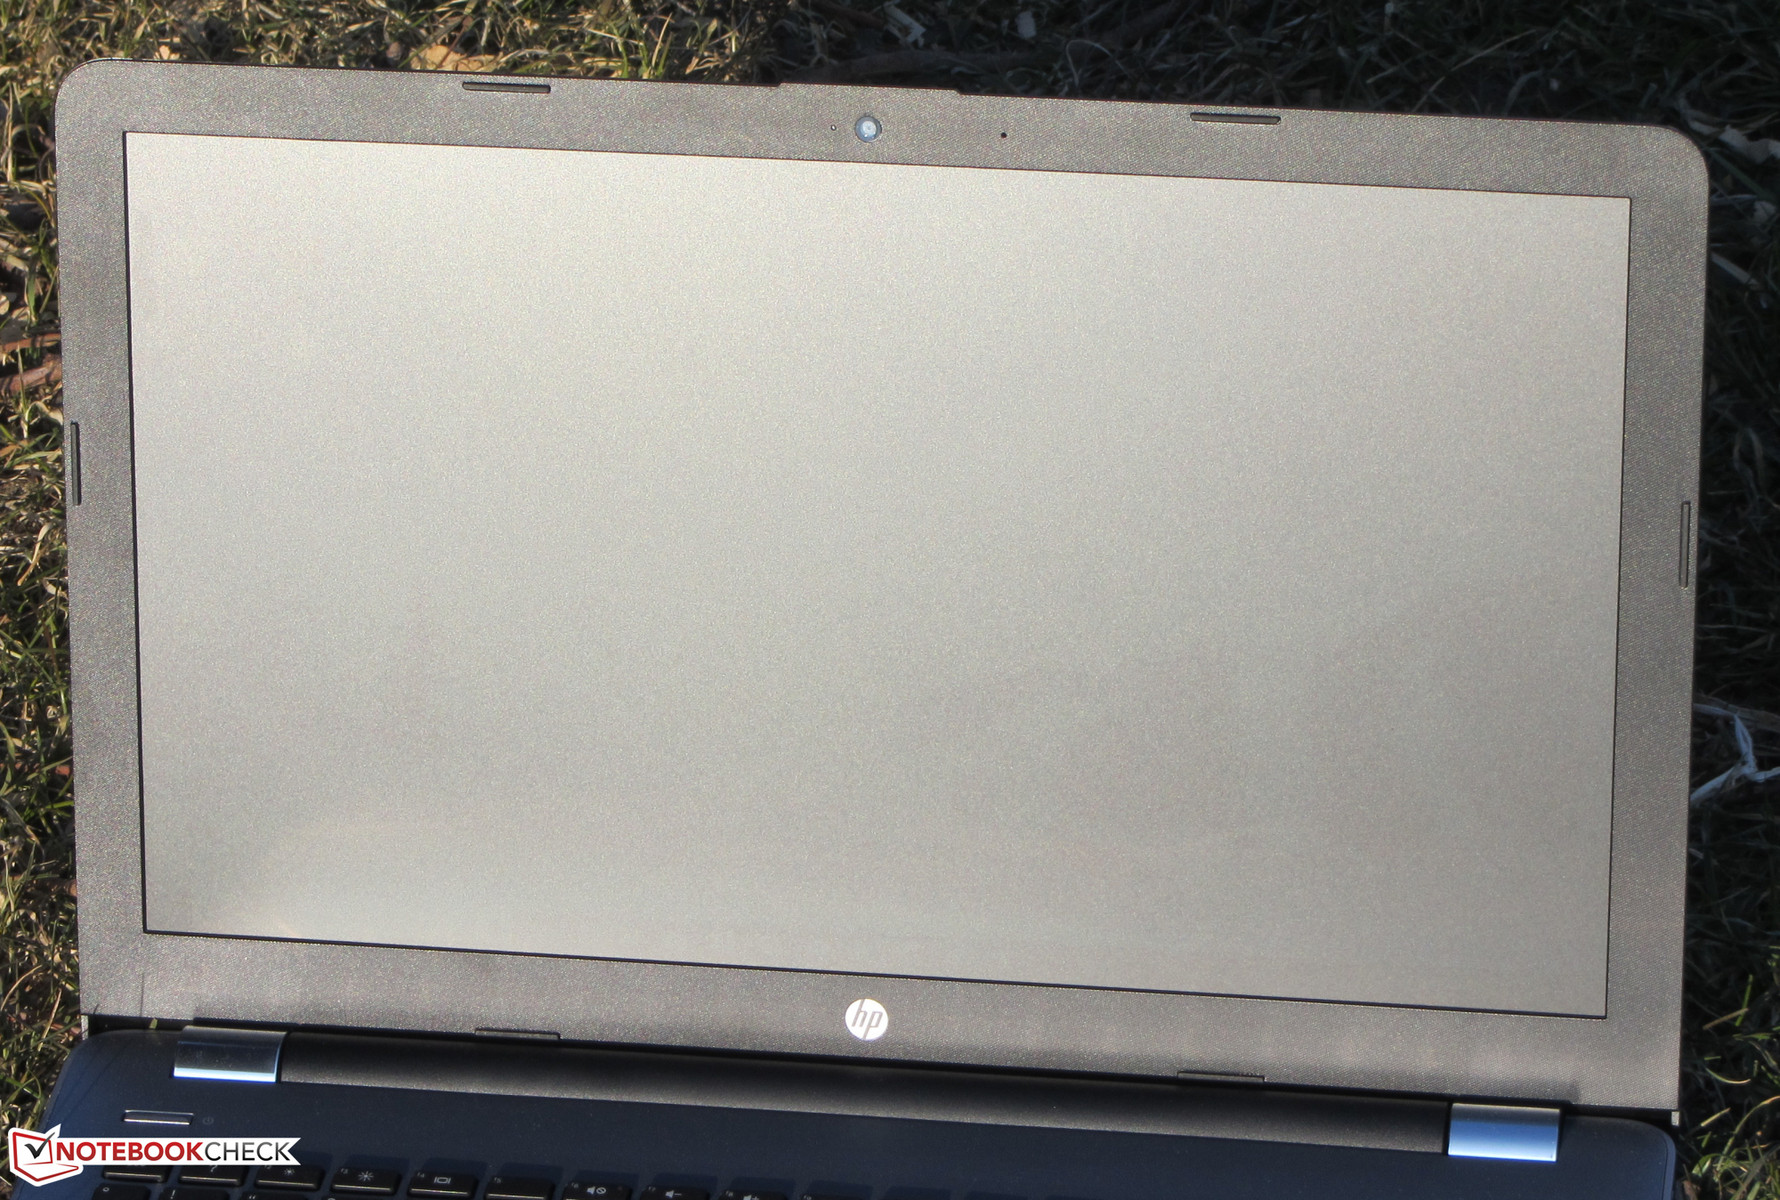
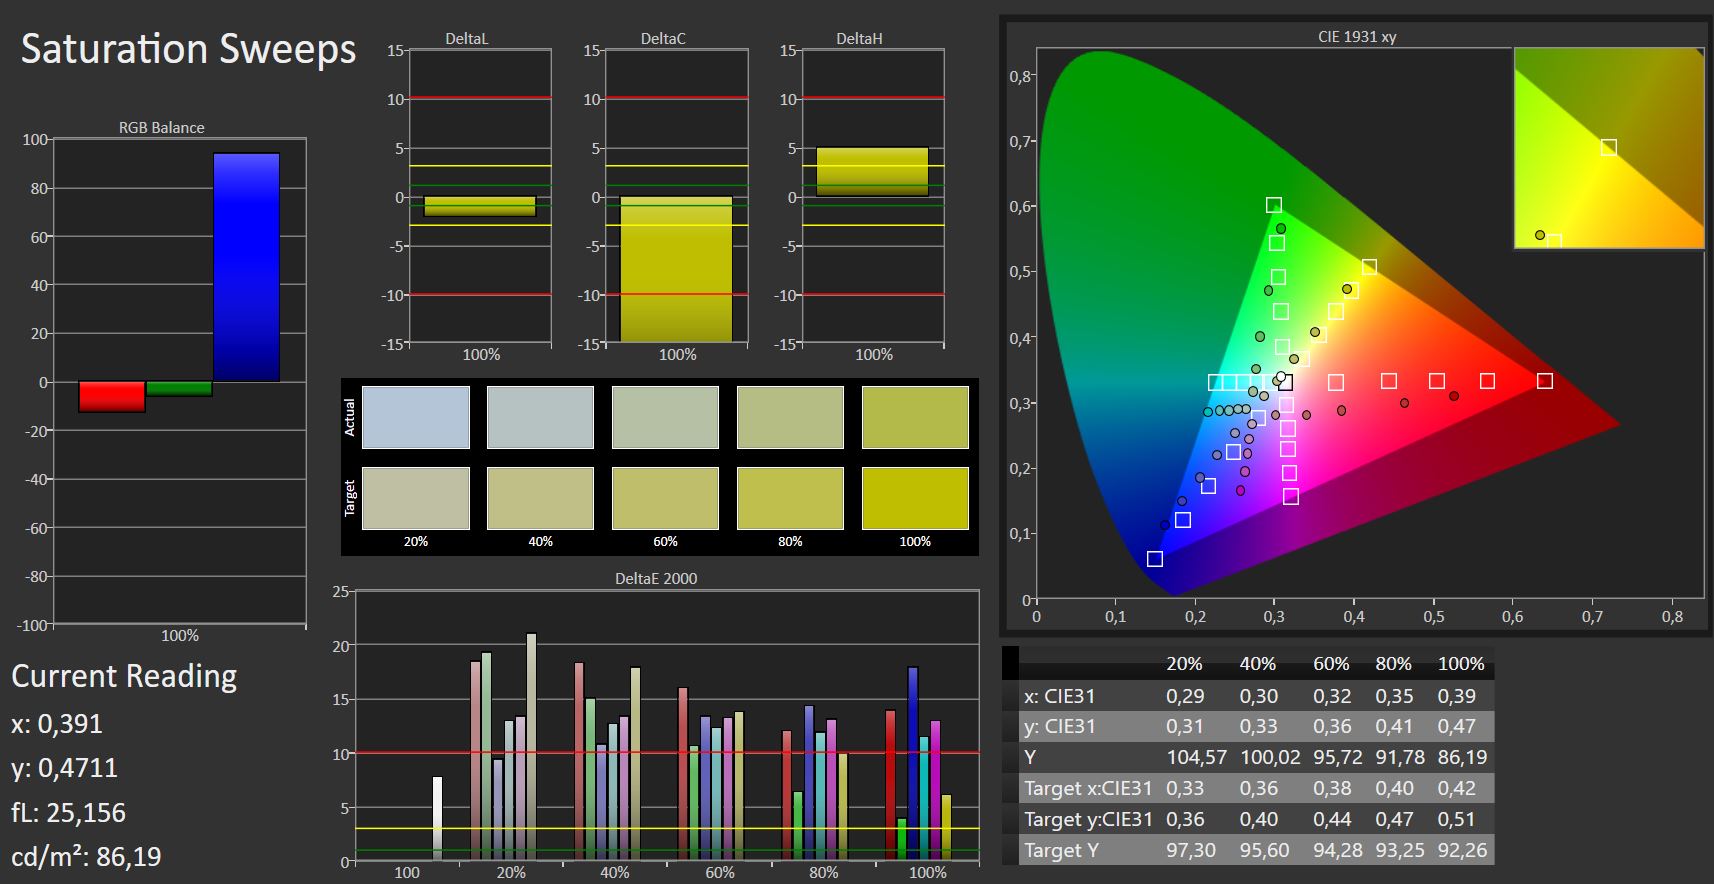
Display - BOE
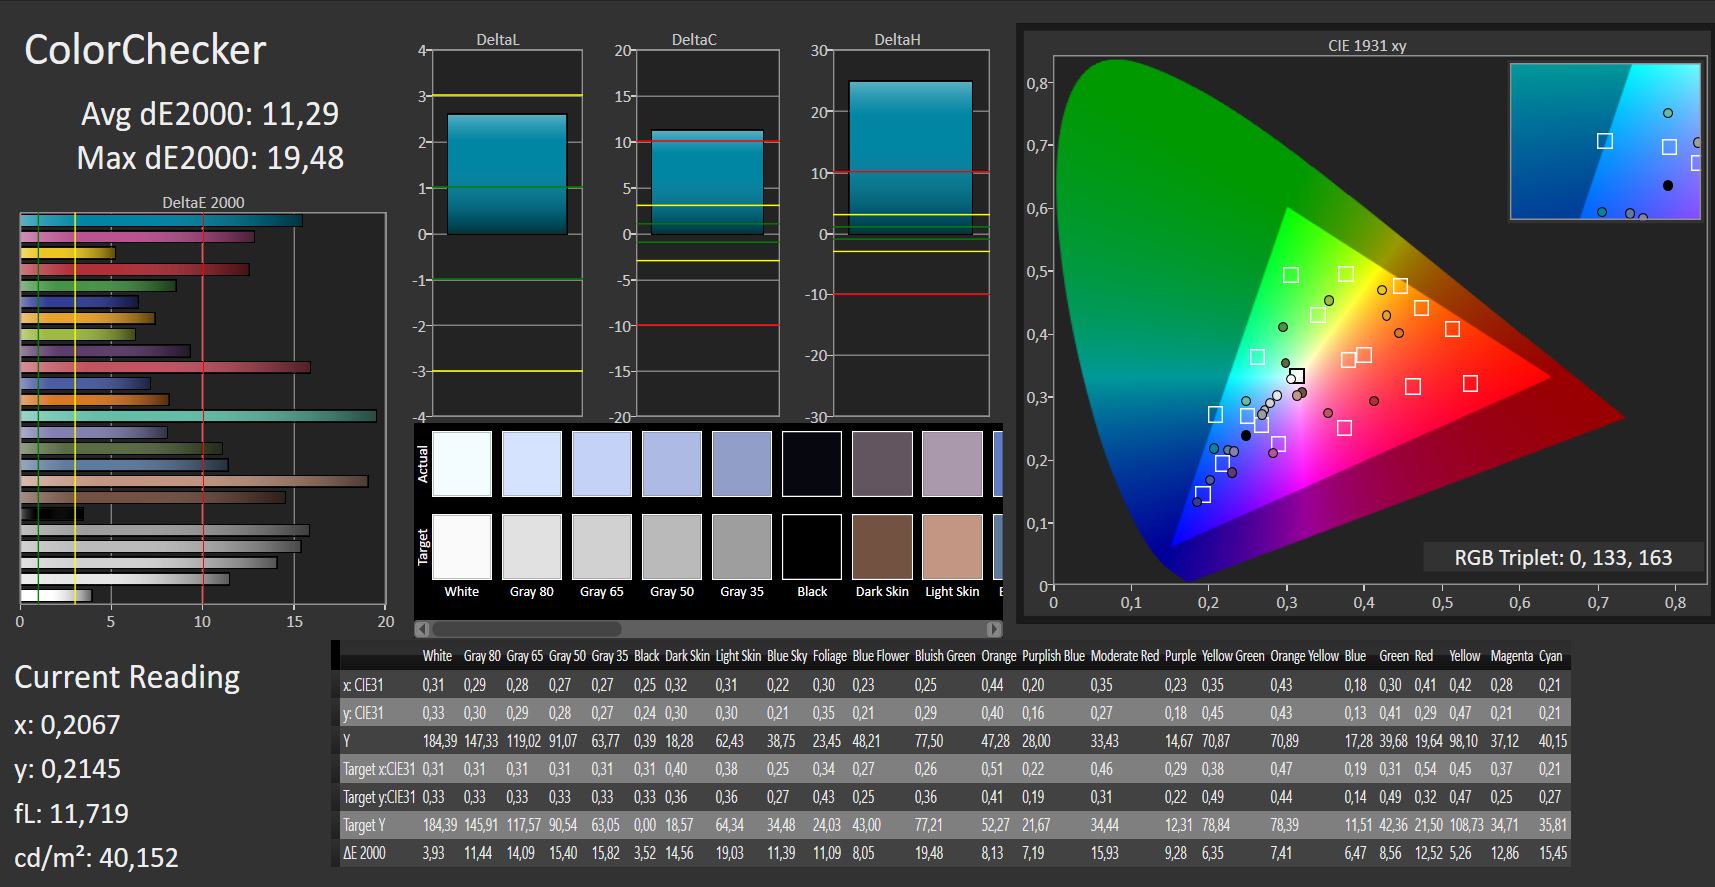
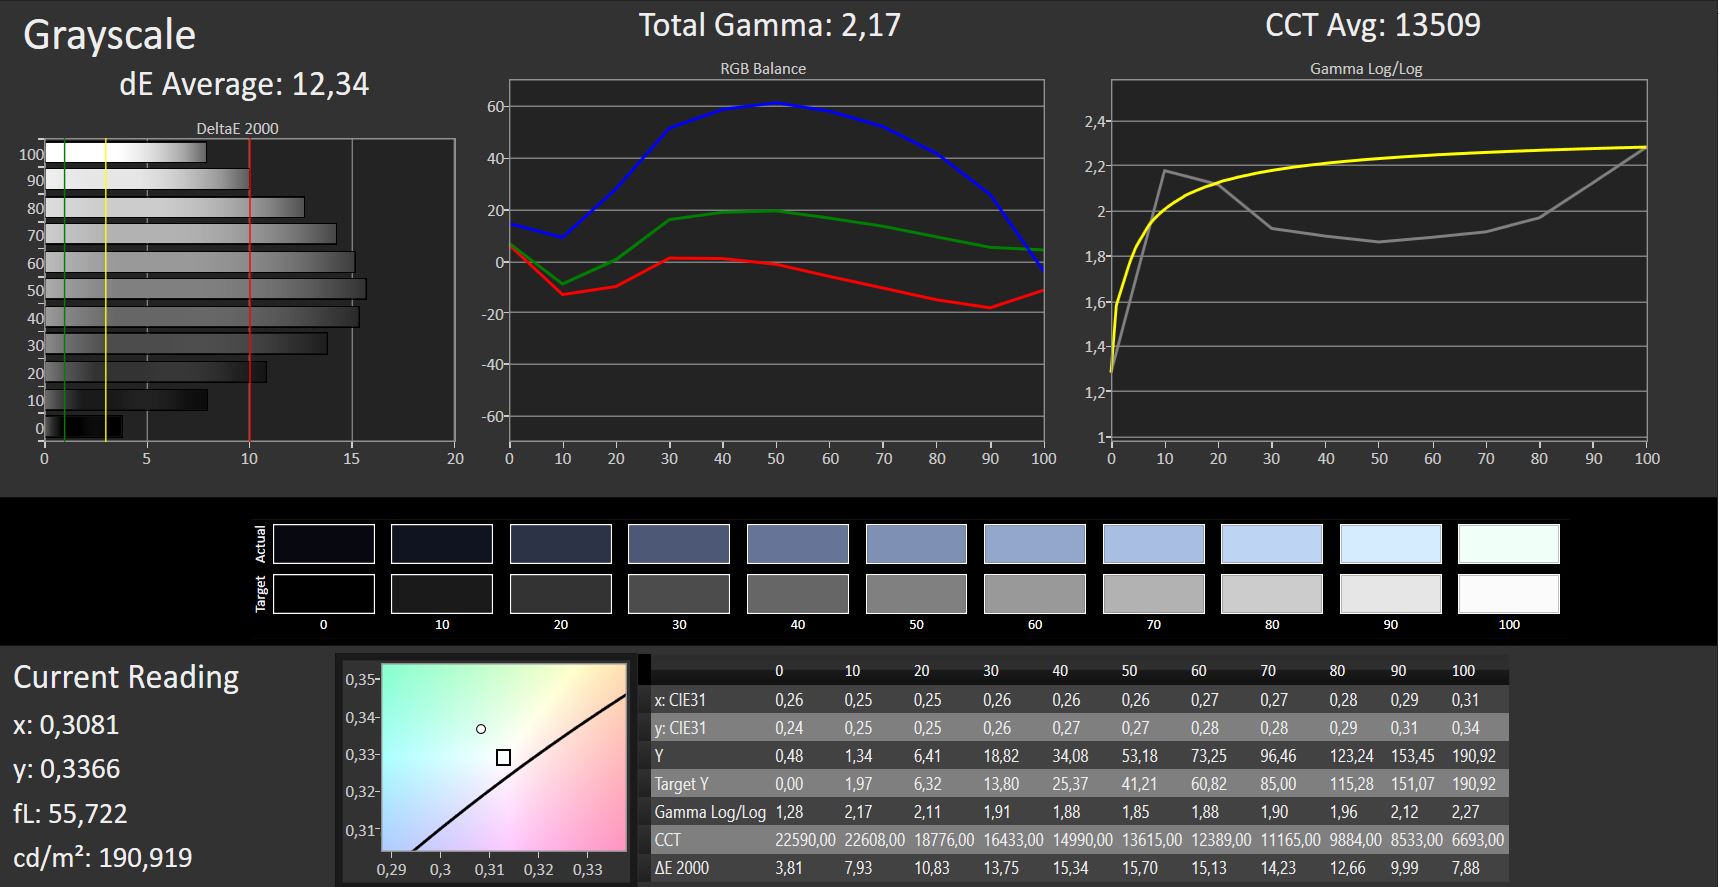
The 250 G6 has a matte 15.6-inch TN display with a 1,920x1,080 native resolution. We measured the contrast at 484:1 and the brightness at 178.4 cd/m², both of which are too low in our opinion and make for a dark display.
Unfortunately, there is PWM display flickering below and including 90% brightness. Fortunately, this is at a high frequency of 2,500 Hz, meaning that those who are sensitive to PWM should be spared headaches and eye strain.
| |||||||||||||||||||||||||
Brightness Distribution: 80 %
Center on Battery: 176 cd/m²
Contrast: 484:1 (Black: 0.38 cd/m²)
ΔE ColorChecker Calman: 11.29 | ∀{0.5-29.43 Ø4.71}
ΔE Greyscale Calman: 12.43 | ∀{0.09-98 Ø4.96}
59% sRGB (Argyll 1.6.3 3D)
37% AdobeRGB 1998 (Argyll 1.6.3 3D)
40.41% AdobeRGB 1998 (Argyll 3D)
58.8% sRGB (Argyll 3D)
39.11% Display P3 (Argyll 3D)
Gamma: 2.34
CCT: 13823 K
Screen Flickering / PWM (Pulse-Width Modulation)
| Screen flickering / PWM detected | 2500 Hz | ≤ 90 % brightness setting | 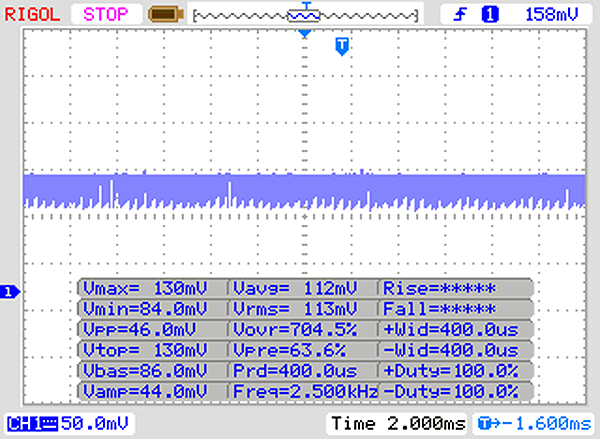 |
The display backlight flickers at 2500 Hz (worst case, e.g., utilizing PWM) Flickering detected at a brightness setting of 90 % and below. There should be no flickering or PWM above this brightness setting. The frequency of 2500 Hz is quite high, so most users sensitive to PWM should not notice any flickering. In comparison: 52 % of all tested devices do not use PWM to dim the display. If PWM was detected, an average of 7741 (minimum: 5 - maximum: 343500) Hz was measured. | |||
| HP 250 G6 2UB93ES TN LED, 1920x1080, 15.6" | Lenovo IdeaPad V110-15IKB 80TH001SGE TN LED, 1366x768, 15.6" | Acer Extensa 2540-580K TN LED, 1920x1080, 15.6" | Acer Aspire 3 A315-51-55E4 TN LED, 1920x1080, 15.6" | Asus ASUSPRO P541UA-GQ1532 TN LED, 1366x768, 15.6" | HP 255 G6 TN LED, 1920x1080, 15.6" | Acer Aspire 3 A315-51-36YU TN-LED, 1366x768, 15.6" | Toshiba Satellite Pro R50-C-16V TN LED, 1366x768, 15.6" | |
|---|---|---|---|---|---|---|---|---|
| Display | -1% | -4% | -8% | 1% | -8% | 4% | ||
| Display P3 Coverage (%) | 39.11 | 38.91 -1% | 37.59 -4% | 35.97 -8% | 39.38 1% | 35.87 -8% | 40.6 4% | |
| sRGB Coverage (%) | 58.8 | 58.6 0% | 56.5 -4% | 54.1 -8% | 59.1 1% | 54 -8% | 61.2 4% | |
| AdobeRGB 1998 Coverage (%) | 40.41 | 40.2 -1% | 38.84 -4% | 37.17 -8% | 40.69 1% | 37.06 -8% | 41.95 4% | |
| Response Times | -20% | -34% | 2% | 2% | -19% | -2% | -81% | |
| Response Time Grey 50% / Grey 80% * (ms) | 42 ? | 39 ? 7% | 41 ? 2% | 44 ? -5% | 47 ? -12% | 48 ? -14% | 47 ? -12% | 68 ? -62% |
| Response Time Black / White * (ms) | 13 ? | 19 ? -46% | 22 ? -69% | 12 ? 8% | 11 ? 15% | 16 ? -23% | 12 ? 8% | 26 ? -100% |
| PWM Frequency (Hz) | 2500 ? | 10000 ? | 27000 ? | 200 ? | 26320 ? | 217 ? | ||
| Screen | 4% | -1% | 26% | 26% | 1% | 7% | 3% | |
| Brightness middle (cd/m²) | 184 | 243 32% | 215 17% | 241 31% | 262 42% | 226 23% | 222 21% | 226 23% |
| Brightness (cd/m²) | 178 | 233 31% | 217 22% | 229 29% | 250 40% | 203 14% | 210 18% | 217 22% |
| Brightness Distribution (%) | 80 | 75 -6% | 92 15% | 87 9% | 83 4% | 77 -4% | 89 11% | 91 14% |
| Black Level * (cd/m²) | 0.38 | 0.45 -18% | 0.68 -79% | 0.46 -21% | 0.47 -24% | 0.34 11% | 0.58 -53% | |
| Contrast (:1) | 484 | 540 12% | 316 -35% | 524 8% | 481 -1% | 653 35% | 390 -19% | |
| Colorchecker dE 2000 * | 11.29 | 11.69 -4% | 9.14 19% | 3.4 70% | 11.78 -4% | 11.6 -3% | 9.84 13% | |
| Colorchecker dE 2000 max. * | 19.48 | 20.08 -3% | 15.46 21% | 7.61 61% | 20.05 -3% | 19.63 -1% | 16.77 14% | |
| Greyscale dE 2000 * | 12.43 | 13.12 -6% | 10.08 19% | 1.7 86% | 10.07 19% | 12.18 2% | 12.63 -2% | 11.1 11% |
| Gamma | 2.34 94% | 2.24 98% | 2.07 106% | 2.36 93% | 2.36 93% | 2.13 103% | 2.13 103% | 2.35 94% |
| CCT | 13823 47% | 16905 38% | 10158 64% | 6750 96% | 10532 62% | 13366 49% | 13294 49% | 11979 54% |
| Color Space (Percent of AdobeRGB 1998) (%) | 37 | 37 0% | 36 -3% | 34 -8% | 38 3% | 34 -8% | 39 5% | |
| Color Space (Percent of sRGB) (%) | 59 | 59 0% | 56 -5% | 54 -8% | 59 0% | 54 -8% | 61 3% | |
| Total Average (Program / Settings) | -6% /
-0% | -13% /
-6% | 7% /
16% | 14% /
18% | -6% /
-2% | -1% /
3% | -25% /
-8% |
* ... smaller is better
Display Response Times
| ↔ Response Time Black to White | ||
|---|---|---|
| 13 ms ... rise ↗ and fall ↘ combined | ↗ 8 ms rise | 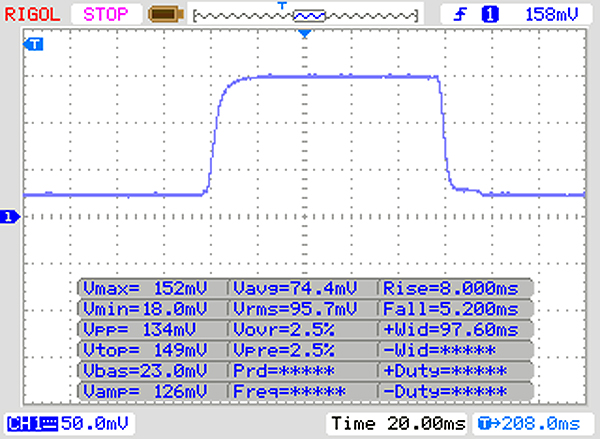 |
| ↘ 5 ms fall | ||
| The screen shows good response rates in our tests, but may be too slow for competitive gamers. In comparison, all tested devices range from 0.1 (minimum) to 240 (maximum) ms. » 33 % of all devices are better. This means that the measured response time is better than the average of all tested devices (19.8 ms). | ||
| ↔ Response Time 50% Grey to 80% Grey | ||
| 42 ms ... rise ↗ and fall ↘ combined | ↗ 23 ms rise | 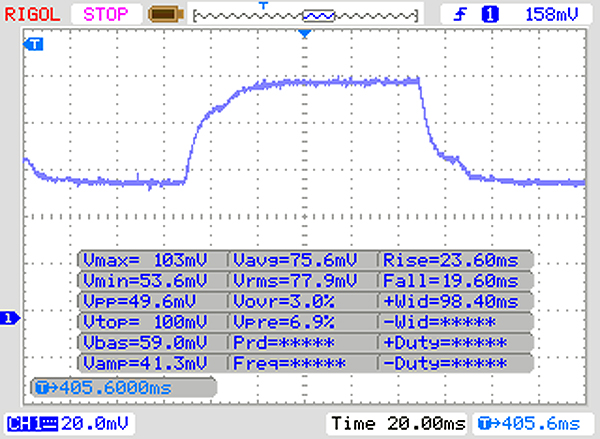 |
| ↘ 19 ms fall | ||
| The screen shows slow response rates in our tests and will be unsatisfactory for gamers. In comparison, all tested devices range from 0.165 (minimum) to 636 (maximum) ms. » 67 % of all devices are better. This means that the measured response time is worse than the average of all tested devices (30.9 ms). | ||
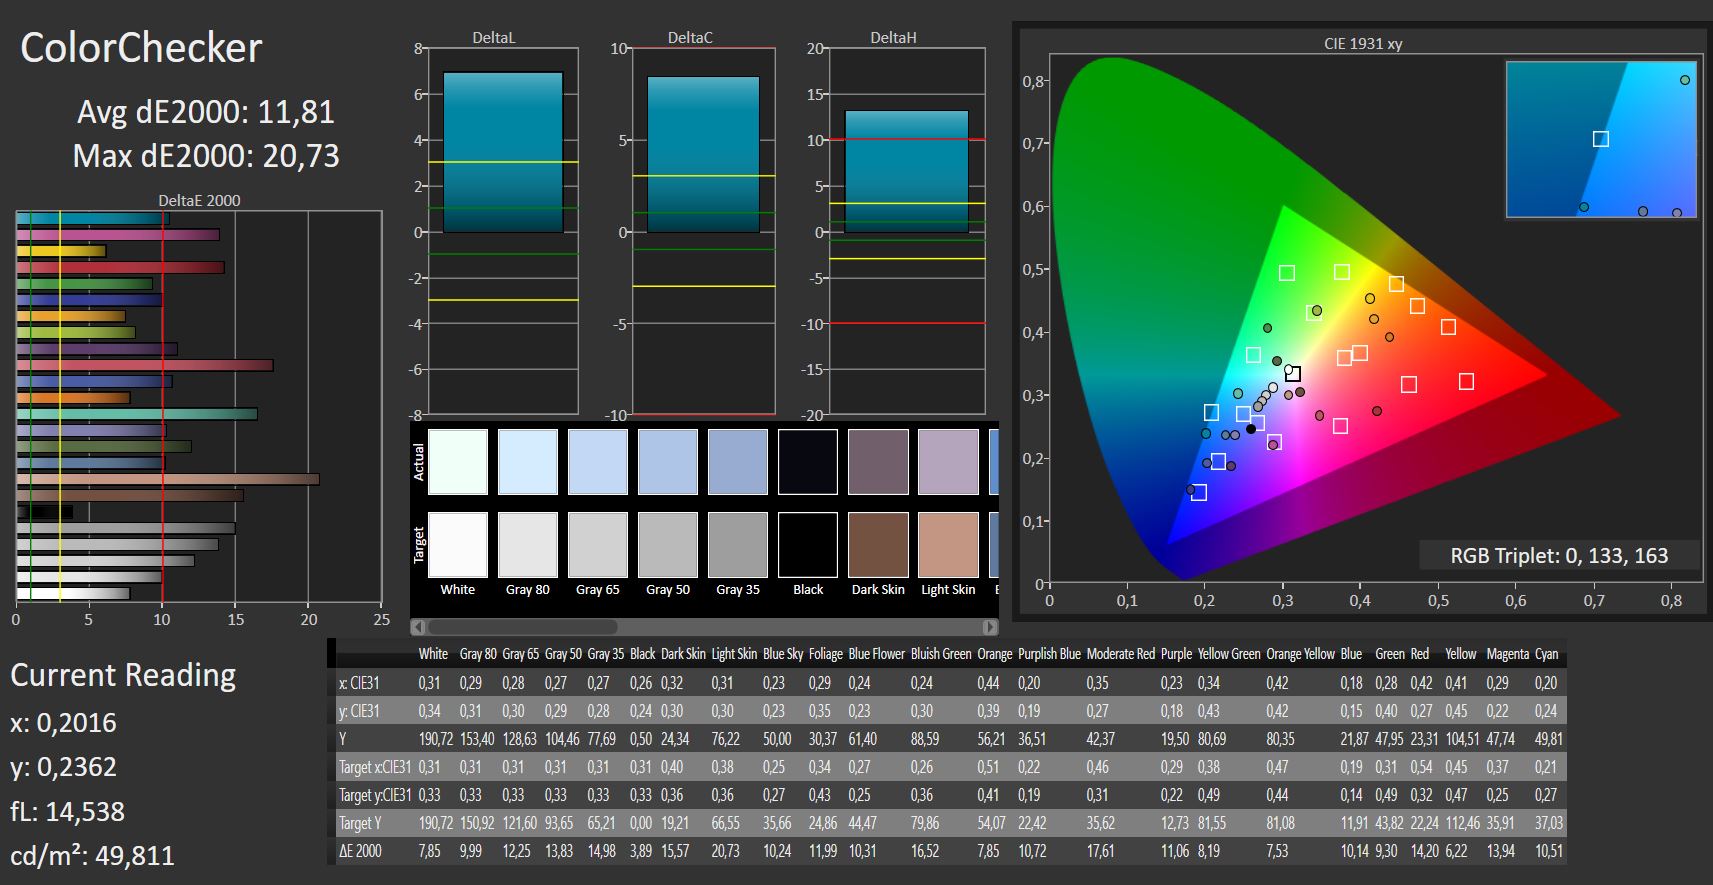
An ideal Delta E 2000 color value is anything less than three. HP has set the value on the 250 G6 far higher, at 11.29. This results in poor color distribution, which is worsened by the strong blue tinge from which the display suffers.

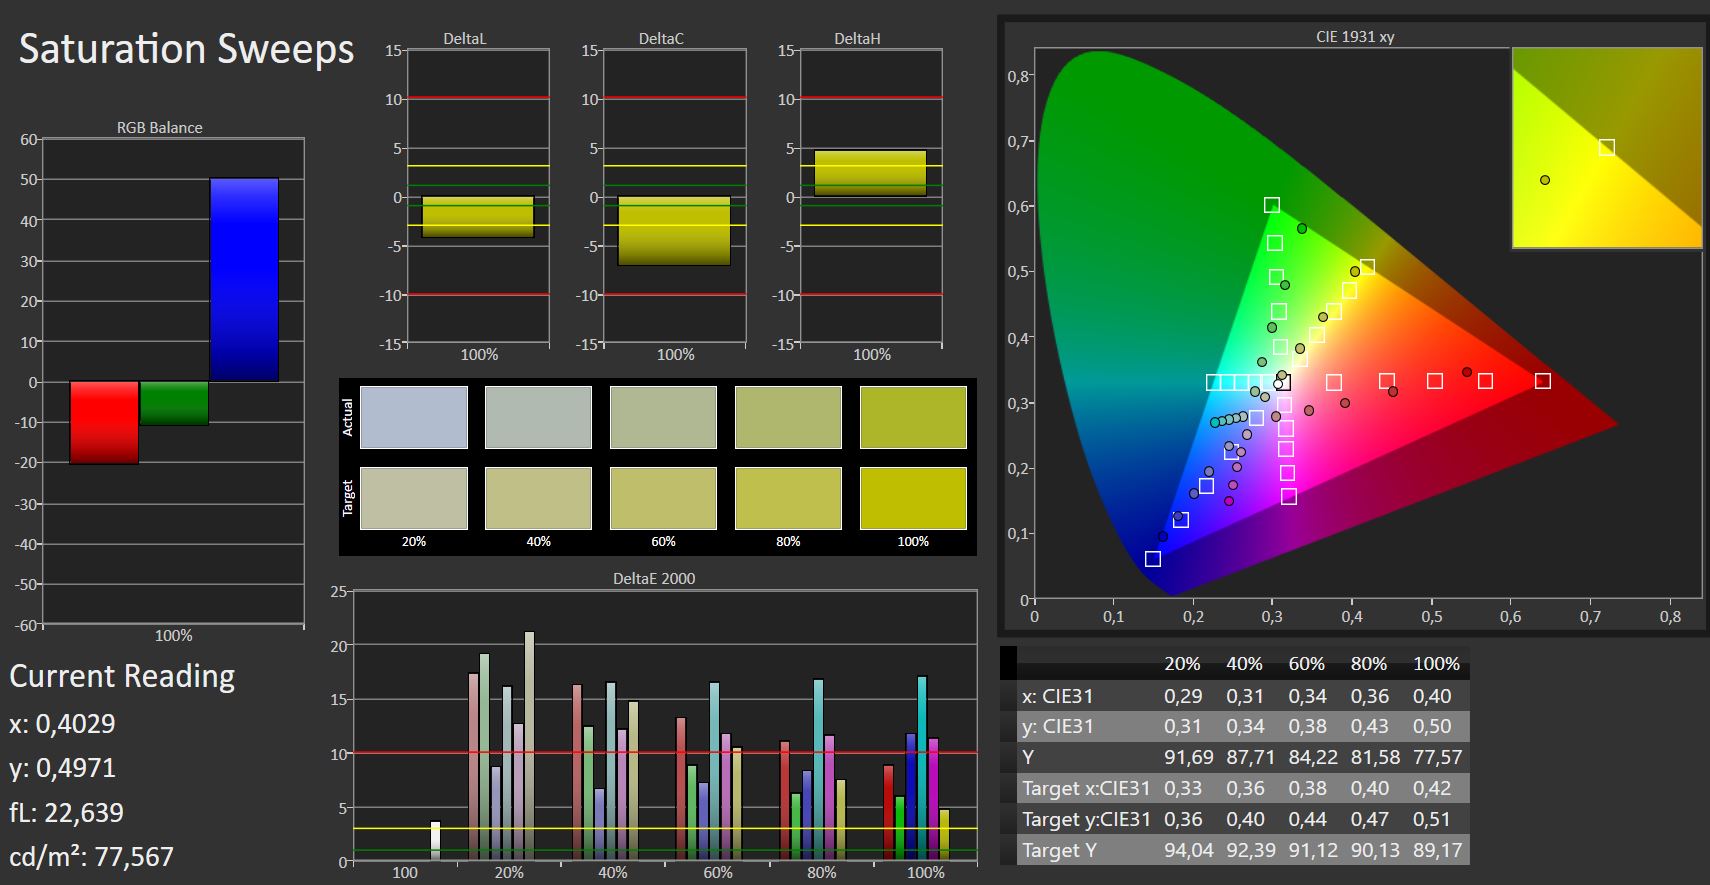
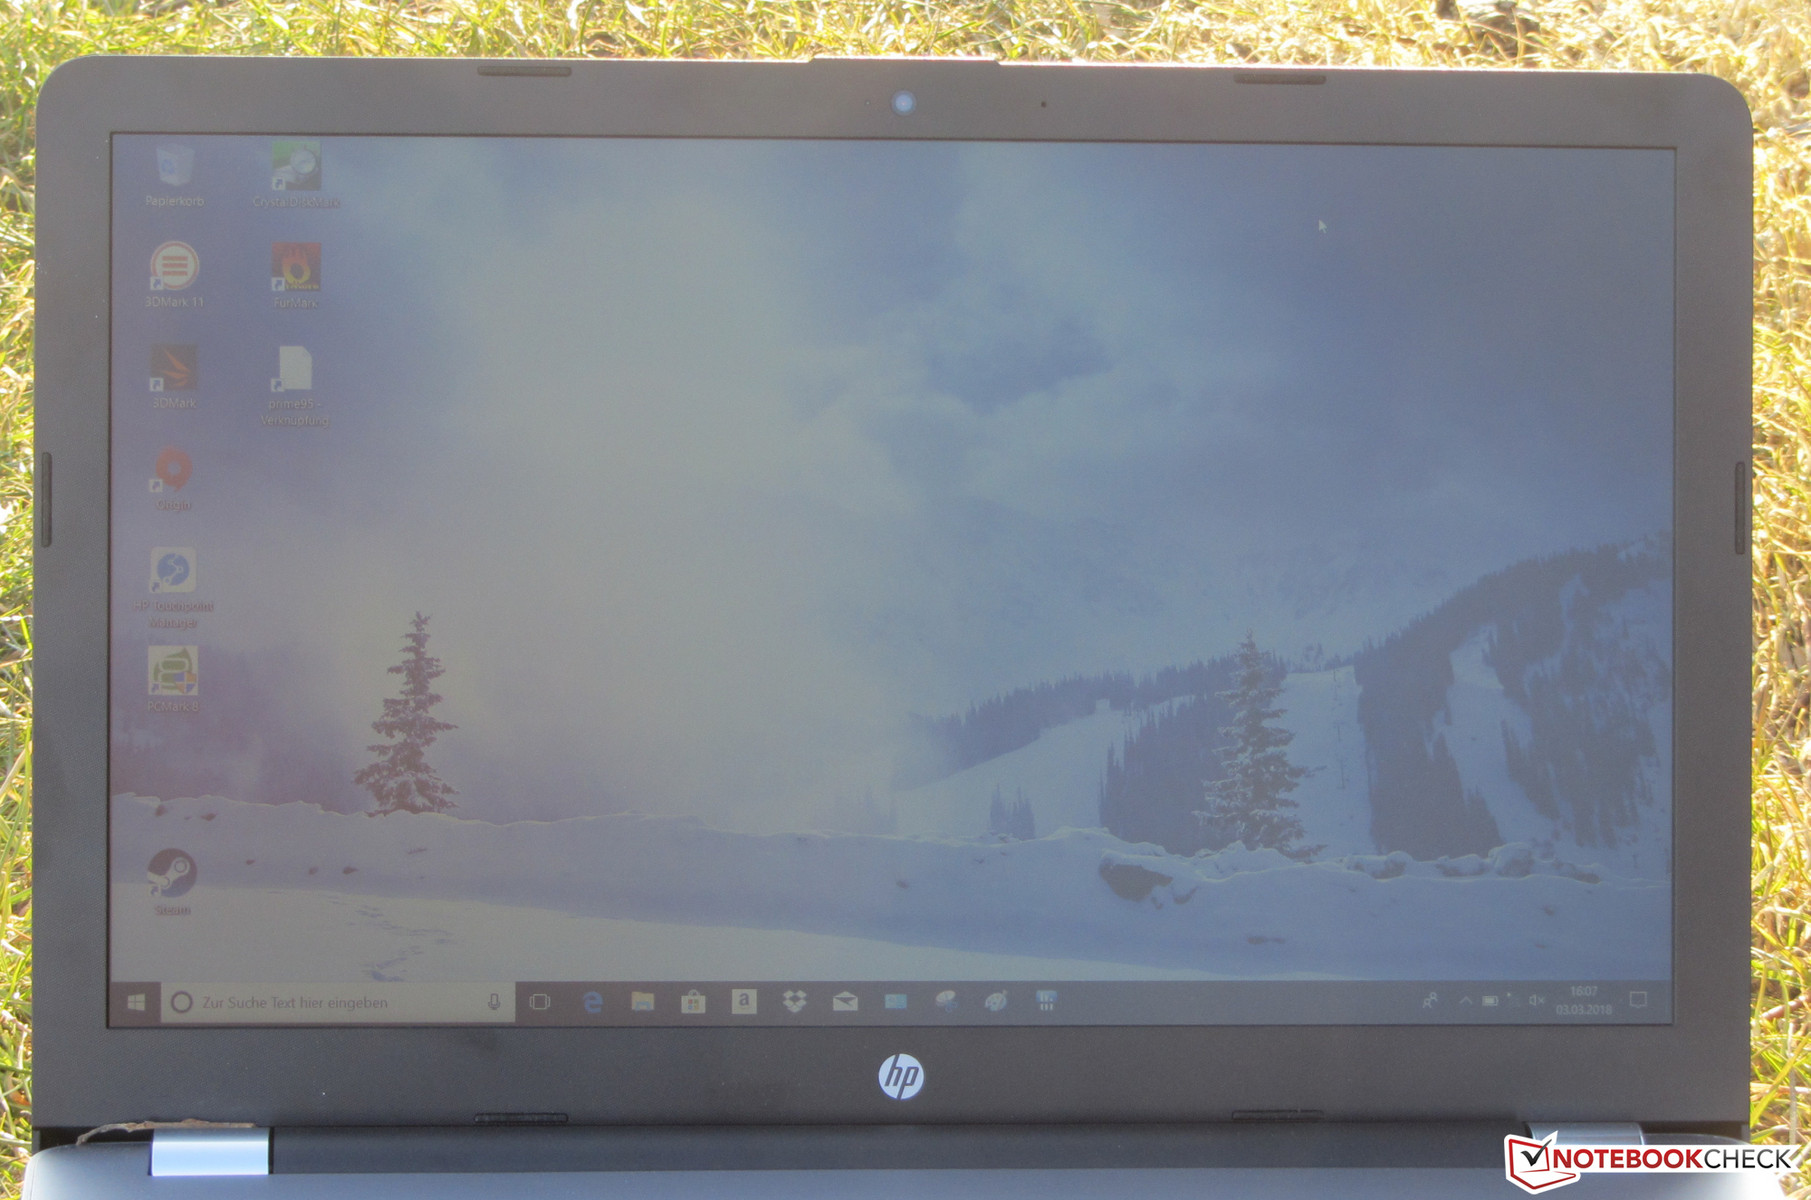
The TN display has poor viewing angles, which means that the 250 G6’s display is practically unreadable from any off-center angle. We found the display to be readable outdoors when the sun was not too bright.
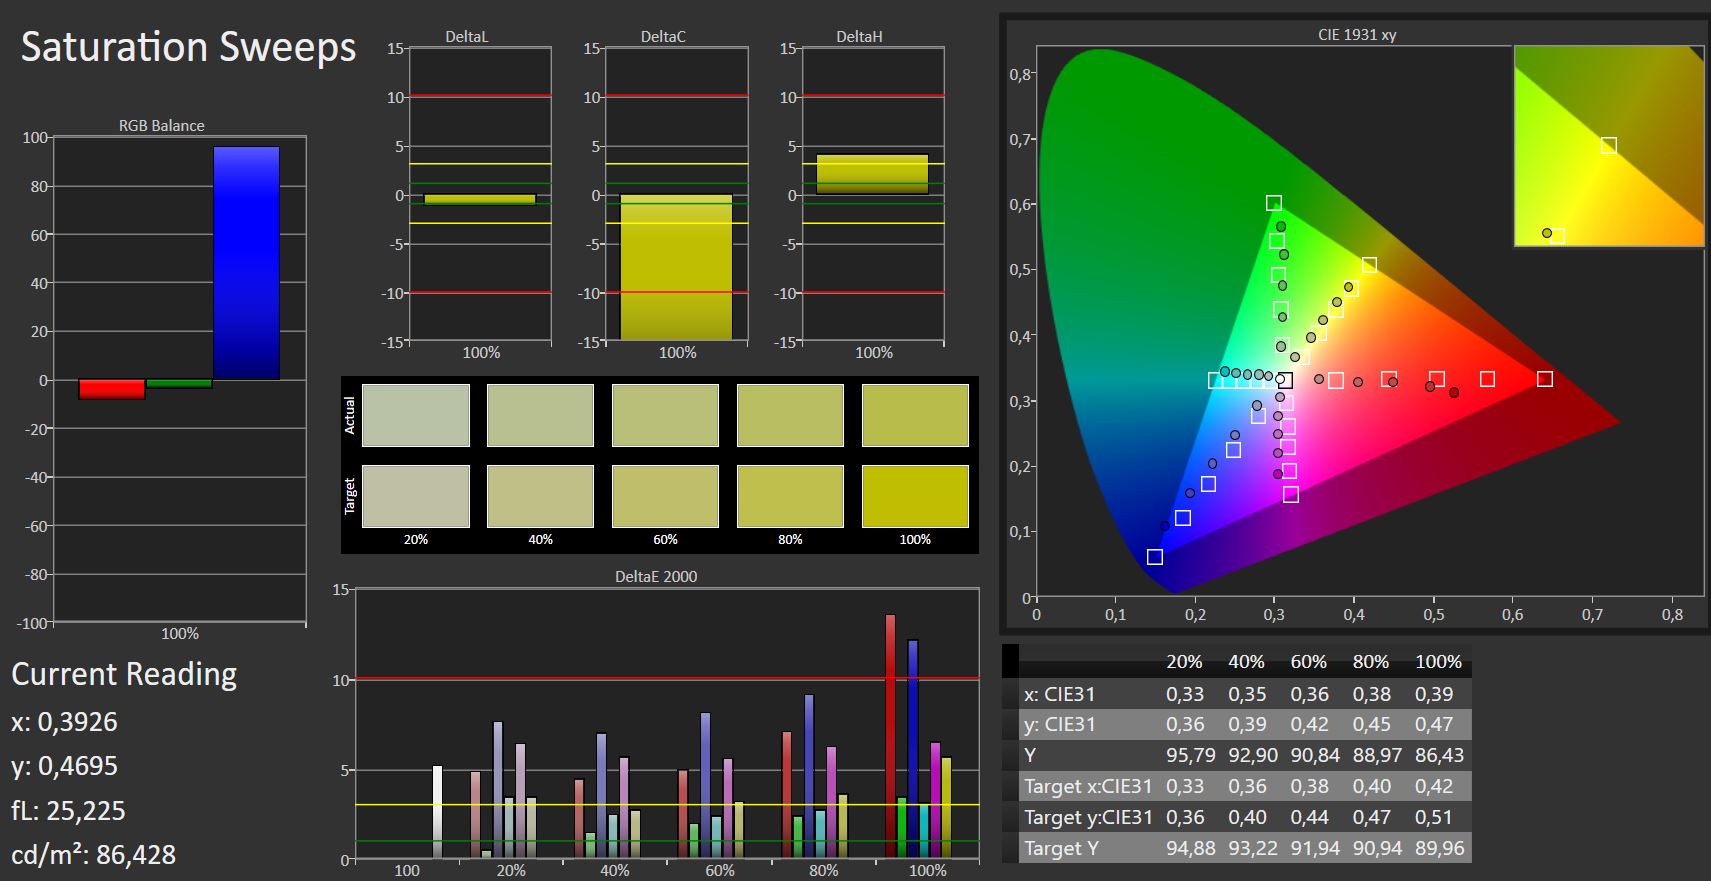
Display - Chi Mei
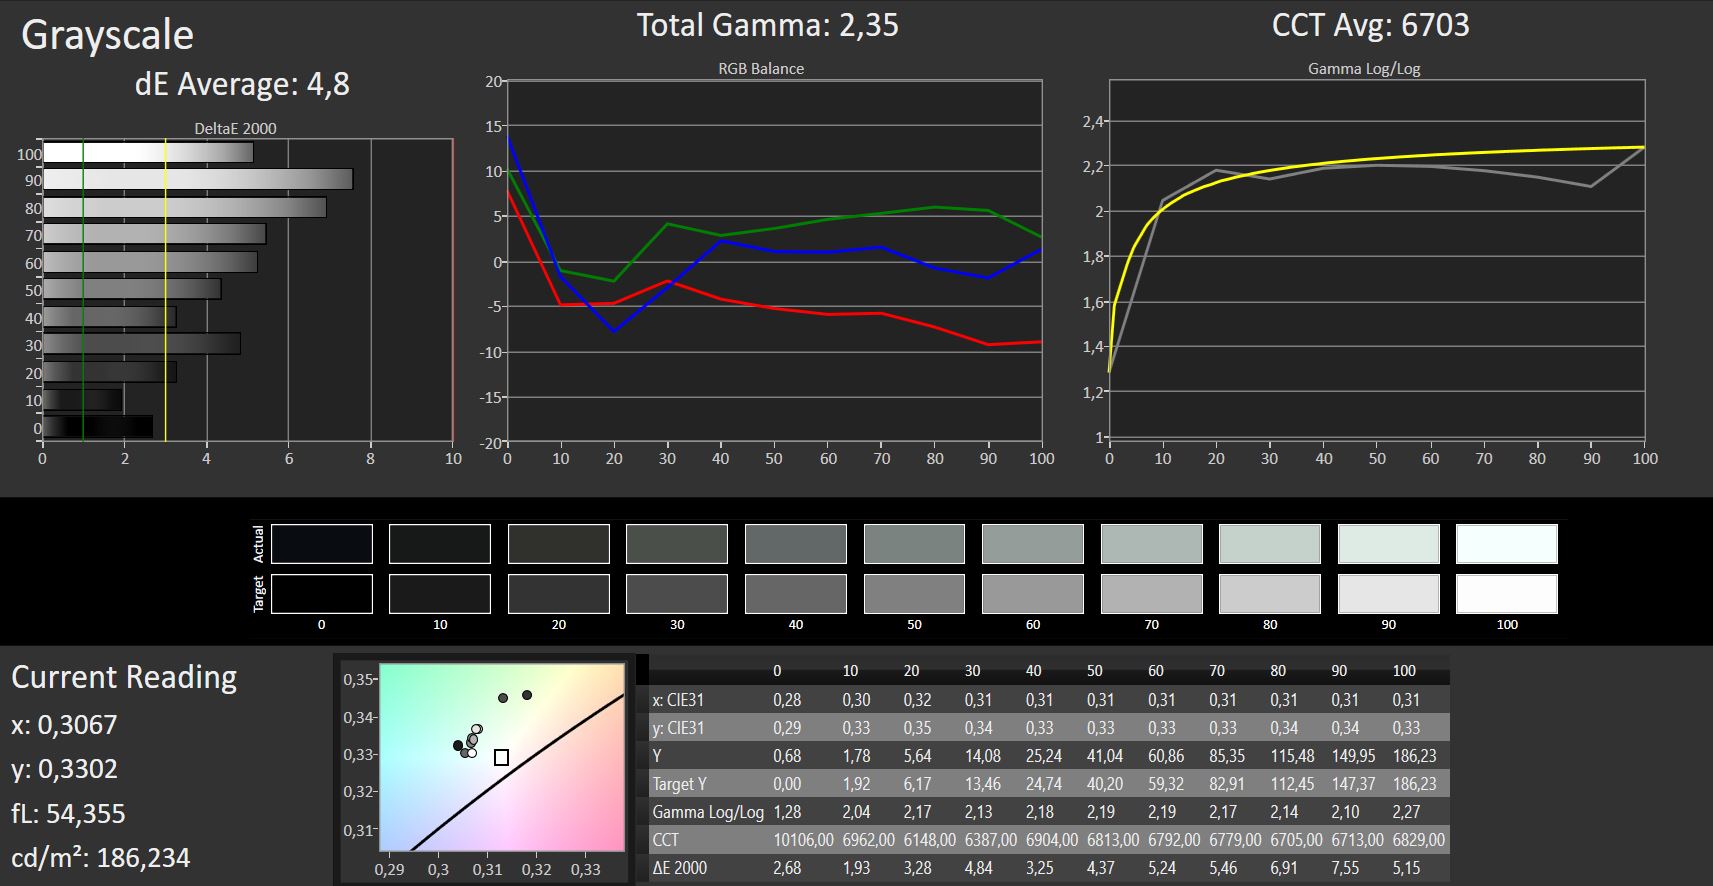
OEMs, HP included, frequently use multiple display partners to equip the same device. Two of the same models can have different displays, which is the case here. Moreover, there is no way of telling which display is in which device without running several tests or by comparing them side by side. Our first test device had a BOE display, but this time we have a Chi Mei display. Our new test device still has a TN, matte and 1080p display, but other values differ slightly. The contrast ratio has dropped from 484:1 to 390:1, both of which are awful. Our new test device has worse viewing angles too.
The Chi Mei display gets slightly brighter than the BOE, but not to the degree that most people would notice. Both displays are difficult to read outside despite their matte finishes. The PWM frequency has decreased to 250 Hz, which may cause more people to suffer from eye strain and headaches, particularly those who are PWM sensitive. No PWM is best, but a higher frequency tends to bother fewer people.
| |||||||||||||||||||||||||
Brightness Distribution: 77 %
Center on Battery: 182 cd/m²
Contrast: 390:1 (Black: 0.49 cd/m²)
ΔE ColorChecker Calman: 11.81 | ∀{0.5-29.43 Ø4.71}
calibrated: 4.91
ΔE Greyscale Calman: 12.34 | ∀{0.09-98 Ø4.96}
55% sRGB (Argyll 1.6.3 3D)
35% AdobeRGB 1998 (Argyll 1.6.3 3D)
Gamma: 2.17
CCT: 13509 K
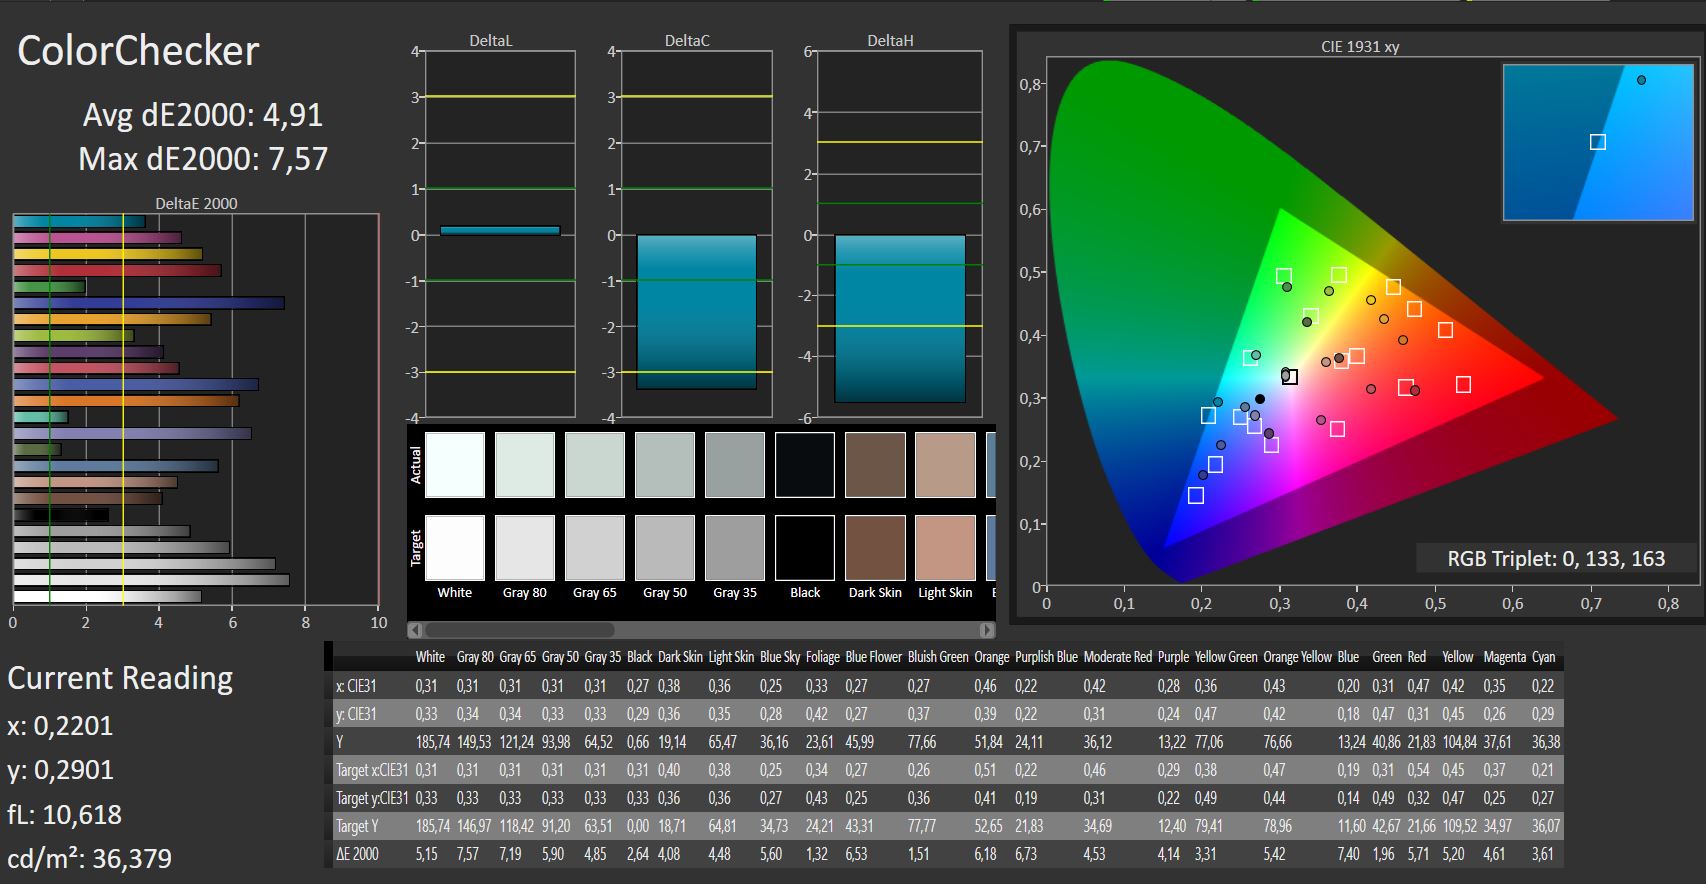
The Chi Mei panel covers just 55% of the sRGB colour space, which is 4% lower than the BOE display manages. CalMAN also demonstrates that the Chi Mei panel has a blue tint to it, but we largely corrected this with further calibration. We have included our calibrated ICC colour profile for the Chi Mei display should you like to use it. Please make sure that your device has a Chi Mei CMN153E display, as applying the colour profile to a different display can worsen its colour accuracy. Calibrating the Chi Mei display reduced greyscale DeltaE divergences from 12 to 5, while it removed most of the blue tint too.
Screen Flickering / PWM (Pulse-Width Modulation)
| Screen flickering / PWM detected | 250 Hz | 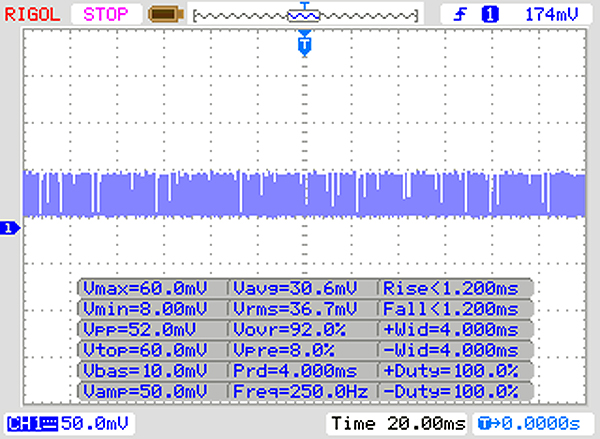 | |
The display backlight flickers at 250 Hz (worst case, e.g., utilizing PWM) . The frequency of 250 Hz is relatively low, so sensitive users will likely notice flickering and experience eyestrain at the stated brightness setting and below. In comparison: 52 % of all tested devices do not use PWM to dim the display. If PWM was detected, an average of 7741 (minimum: 5 - maximum: 343500) Hz was measured. | |||
Display Response Times
| ↔ Response Time Black to White | ||
|---|---|---|
| 14 ms ... rise ↗ and fall ↘ combined | ↗ ms rise |  |
| ↘ ms fall | ||
| The screen shows good response rates in our tests, but may be too slow for competitive gamers. In comparison, all tested devices range from 0.1 (minimum) to 240 (maximum) ms. » 34 % of all devices are better. This means that the measured response time is better than the average of all tested devices (19.8 ms). | ||
| ↔ Response Time 50% Grey to 80% Grey | ||
| 39 ms ... rise ↗ and fall ↘ combined | ↗ ms rise |  |
| ↘ ms fall | ||
| The screen shows slow response rates in our tests and will be unsatisfactory for gamers. In comparison, all tested devices range from 0.165 (minimum) to 636 (maximum) ms. » 59 % of all devices are better. This means that the measured response time is worse than the average of all tested devices (30.9 ms). | ||
Performance
The 250 G6 is a simple 15.6-inch office notebook that has enough performance for office and internet applications. There are several variants of the 250 G6, with prices starting at around €380 (~$468). Our test device is currently available from €480 (~$590).
Processor
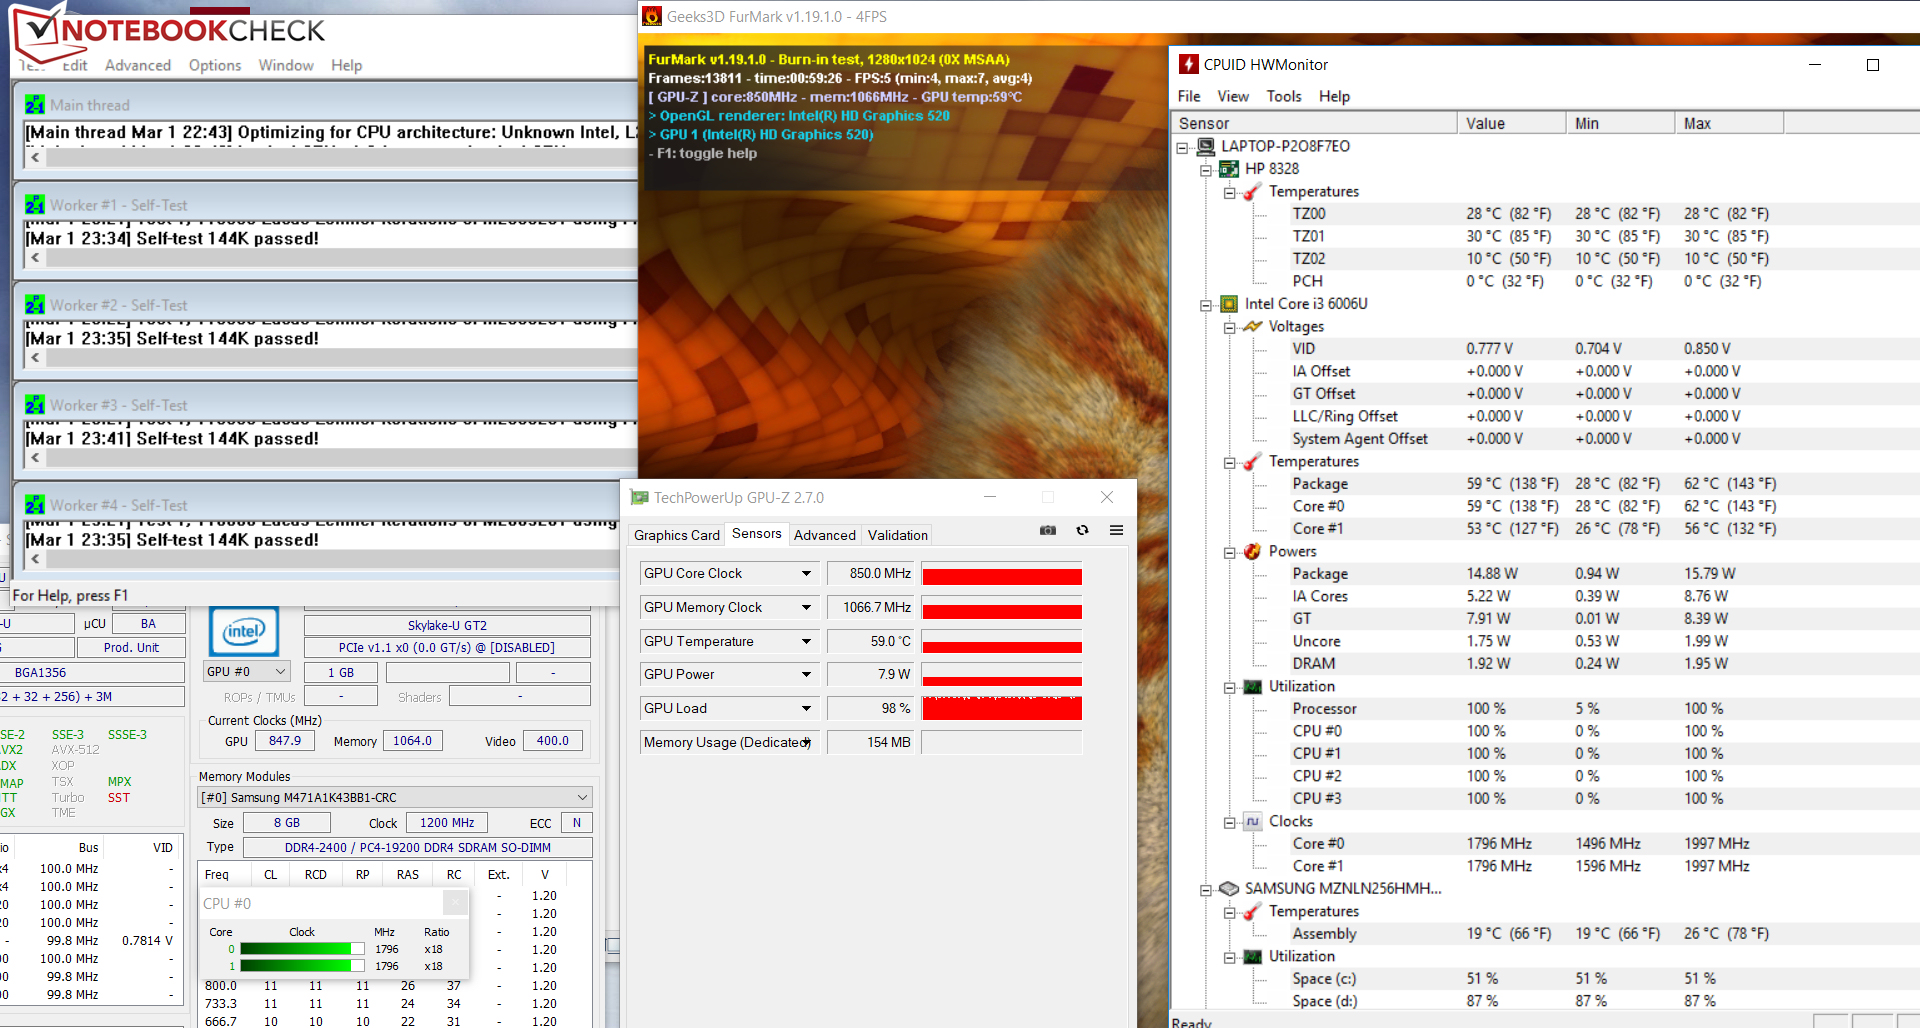
The 250 G6 is powered by an Intel Core i3-6006U Skylake dual-core processor that should provide enough performance for office use. The i3-6006U is an ultra-low voltage (ULV) model that supports hyperthreading, meaning that there are four threads across two cores. The CPU can clock up to 2 GHz and does not support Turbo Boost. The CPU ran at maximum clock speed throughout our CPU tests irrespective of whether it was running on battery or on mains power.
We benchmarked the CPU by running a Cinebench R15 multi-thread test for thirty minutes in a continuous loop. The results demonstrate that the processor maintained its clock speed throughout with thermal throttling.
Equally, we encountered the same experience when we ran Prime95 and FurMark benchmarks on one-hour loops. The CPU maintains clock speeds of between 1.7 and 1.9 GHz, with no performance difference between battery and mains power.
Update 11.6.2018: Core i3-7020U processor
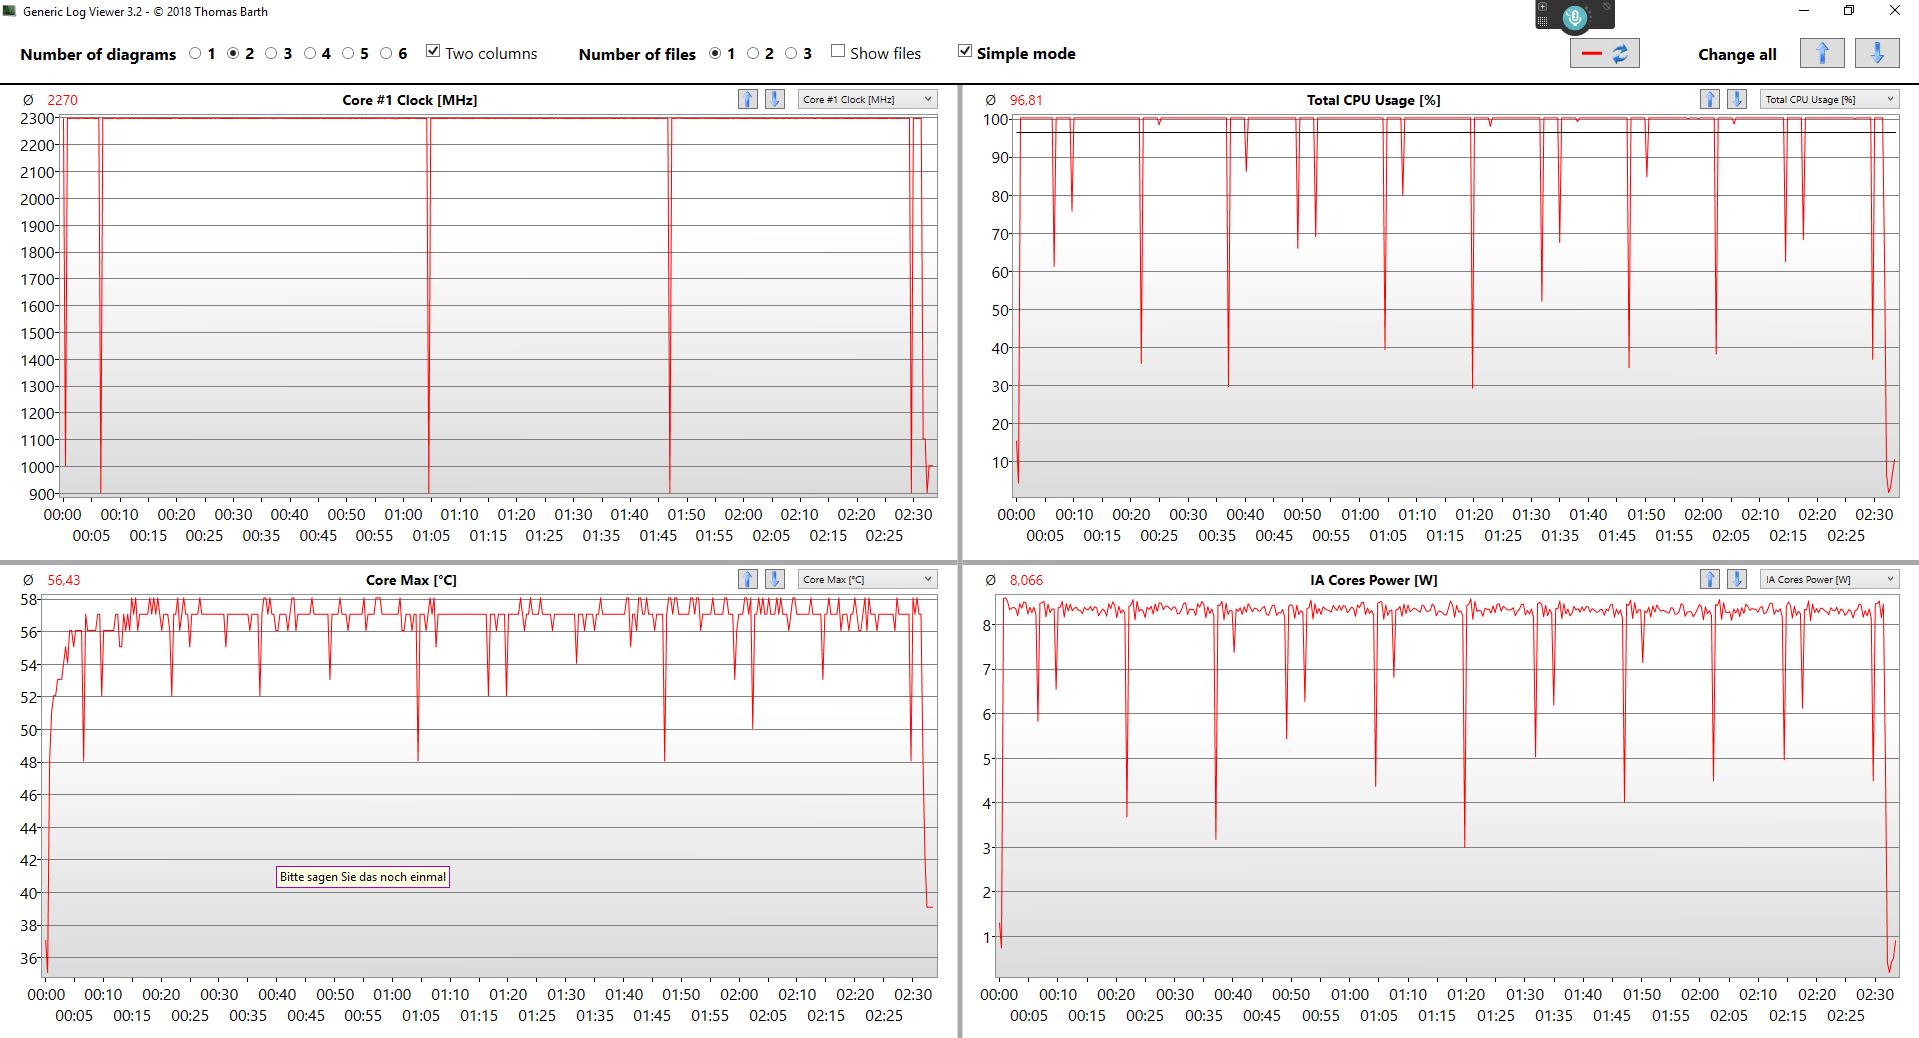
The Core i3-7020U in our new test device operated constantly at 2.3 GHz during a Cinebench R15 multi-core benchmark, the behaviour of which is identical to the Core i3-6006U in our first test device. The Core i3-7020U scored seventeen points more than its Skylake sibling, which is surprising as the Core i3-6006U operates at 300 MHz lower clock speed.
The Core i3-7020U is a dual-core processor that can execute up to four threads simultaneously thanks to Intel Hyper-Threading. However, the CPU does not support Intel Turbo Boost. Positively, the core temperature reached a maximum of 57 °C during our tests, which would indicate that the HP 250 G6 could adequately cool a more powerful processor like a quad-core Kaby Lake R CPU. HWiNFO 64 reports that the HP 250 G6 already supports a Kaby Lake R chipset, so we expect to see the device also configurable with corresponding Intel Core 8xxxU processors soon.
| Cinebench R10 | |
| Rendering Single 32Bit | |
| Average of class Office (4212 - 10817, n=17, last 2 years) | |
| Acer Extensa 2540-580K | |
| Lenovo V110-15IKB 80TH001WGE | |
| Lenovo IdeaPad V110-15IKB 80TH001SGE | |
| Asus ASUSPRO P541UA-GQ1532 | |
| Toshiba Satellite Pro R50-C-16V | |
| Average Intel Core i3-6006U (3203 - 3236, n=3) | |
| HP 250 G6 2UB93ES | |
| Acer Aspire 3 A315-21-651Y | |
| Lenovo V110-15AST | |
| Rendering Multiple CPUs 32Bit | |
| Average of class Office (7657 - 60850, n=17, last 2 years) | |
| Acer Extensa 2540-580K | |
| Lenovo V110-15IKB 80TH001WGE | |
| Lenovo IdeaPad V110-15IKB 80TH001SGE | |
| Toshiba Satellite Pro R50-C-16V | |
| Asus ASUSPRO P541UA-GQ1532 | |
| Average Intel Core i3-6006U (7293 - 7388, n=3) | |
| HP 250 G6 2UB93ES | |
| Acer Aspire 3 A315-21-651Y | |
| Lenovo V110-15AST | |
| Geekbench 3 | |
| 32 Bit Multi-Core Score | |
| Acer Extensa 2540-580K | |
| Lenovo V110-15IKB 80TH001WGE | |
| Lenovo IdeaPad V110-15IKB 80TH001SGE | |
| Asus ASUSPRO P541UA-GQ1532 | |
| HP 250 G6 2UB93ES | |
| Average Intel Core i3-6006U (4265 - 4415, n=3) | |
| Toshiba Satellite Pro R50-C-16V | |
| Acer Aspire 3 A315-21-651Y | |
| Lenovo V110-15AST | |
| 32 Bit Single-Core Score | |
| Acer Extensa 2540-580K | |
| Lenovo V110-15IKB 80TH001WGE | |
| Lenovo IdeaPad V110-15IKB 80TH001SGE | |
| HP 250 G6 2UB93ES | |
| Asus ASUSPRO P541UA-GQ1532 | |
| Average Intel Core i3-6006U (1943 - 2018, n=3) | |
| Toshiba Satellite Pro R50-C-16V | |
| Acer Aspire 3 A315-21-651Y | |
| Lenovo V110-15AST | |
| Geekbench 4.0 | |
| 64 Bit Multi-Core Score | |
| Average of class Office (15873 - 41046, n=4, last 2 years) | |
| Acer Extensa 2540-580K | |
| Lenovo V110-15IKB 80TH001WGE | |
| Lenovo IdeaPad V110-15IKB 80TH001SGE | |
| Asus ASUSPRO P541UA-GQ1532 | |
| Average Intel Core i3-6006U (4723 - 4914, n=3) | |
| HP 250 G6 2UB93ES | |
| Toshiba Satellite Pro R50-C-16V | |
| Acer Aspire 3 A315-21-651Y | |
| Lenovo V110-15AST | |
| 64 Bit Single-Core Score | |
| Average of class Office (4598 - 7721, n=4, last 2 years) | |
| Acer Extensa 2540-580K | |
| Lenovo V110-15IKB 80TH001WGE | |
| Lenovo IdeaPad V110-15IKB 80TH001SGE | |
| Asus ASUSPRO P541UA-GQ1532 | |
| Average Intel Core i3-6006U (2468 - 2593, n=3) | |
| HP 250 G6 2UB93ES | |
| Toshiba Satellite Pro R50-C-16V | |
| Acer Aspire 3 A315-21-651Y | |
| Lenovo V110-15AST | |
| Geekbench 4.4 | |
| 64 Bit Multi-Core Score | |
| Average of class Office (23754 - 44610, n=10, last 2 years) | |
| Acer Extensa 2540-580K | |
| Lenovo V110-15IKB 80TH001WGE | |
| Lenovo IdeaPad V110-15IKB 80TH001SGE | |
| Asus ASUSPRO P541UA-GQ1532 | |
| Average Intel Core i3-6006U (4975 - 5109, n=2) | |
| HP 250 G6 2UB93ES | |
| Acer Aspire 3 A315-21-651Y | |
| Lenovo V110-15AST | |
| 64 Bit Single-Core Score | |
| Average of class Office (4564 - 8042, n=10, last 2 years) | |
| Acer Extensa 2540-580K | |
| Lenovo V110-15IKB 80TH001WGE | |
| Lenovo IdeaPad V110-15IKB 80TH001SGE | |
| Asus ASUSPRO P541UA-GQ1532 | |
| Average Intel Core i3-6006U (2575 - 2639, n=2) | |
| HP 250 G6 2UB93ES | |
| Acer Aspire 3 A315-21-651Y | |
| Lenovo V110-15AST | |
| JetStream 1.1 - 1.1 Total | |
| Acer Extensa 2540-580K (Edge 41) | |
| Lenovo V110-15IKB 80TH001WGE (Edge 41) | |
| Lenovo IdeaPad V110-15IKB 80TH001SGE (Edge 40) | |
| Toshiba Satellite Pro R50-C-16V (Edge 38) | |
| Asus ASUSPRO P541UA-GQ1532 (Edge 40) | |
| HP 250 G6 2UB93ES (Edge 41) | |
| Average Intel Core i3-6006U (97.6 - 142.6, n=5) | |
| Acer Aspire 3 A315-21-651Y (Edge 41) | |
| Acer Aspire 3 A315-51-36YU | |
| Lenovo V110-15AST (Edge 41) | |
| HP 255 G6 | |
System Performance
System performance is smooth with no issues during our tests. The good PCMark benchmark results confirm our impressions that the 250 G6 has enough power for office and internet use. It is worth noting that performance could be increased by adding a second identical RAM module. This would activate dual-channel memory mode, which would boost performance.
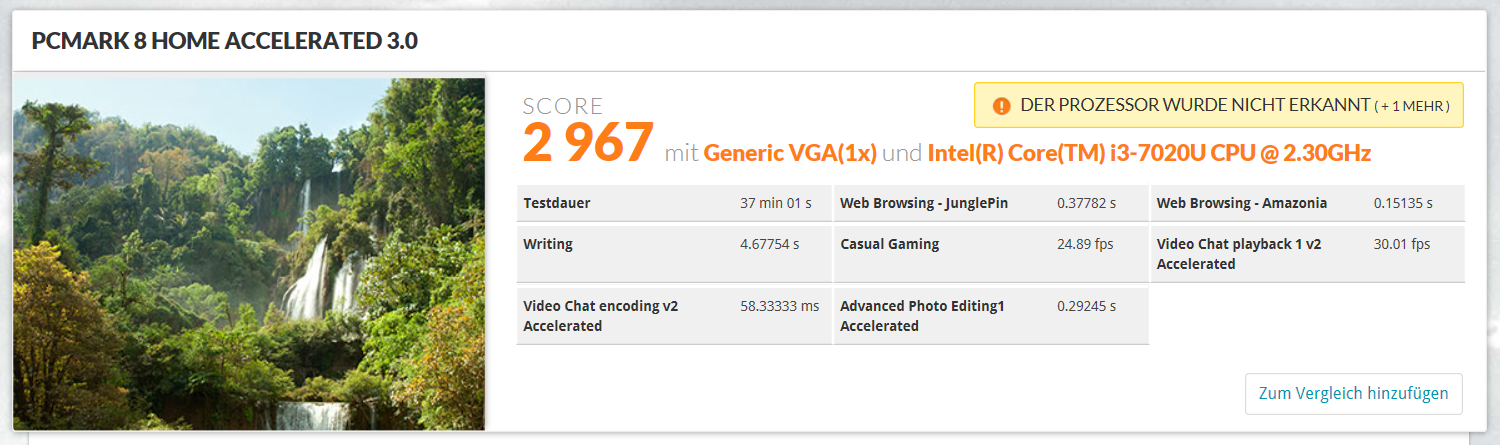
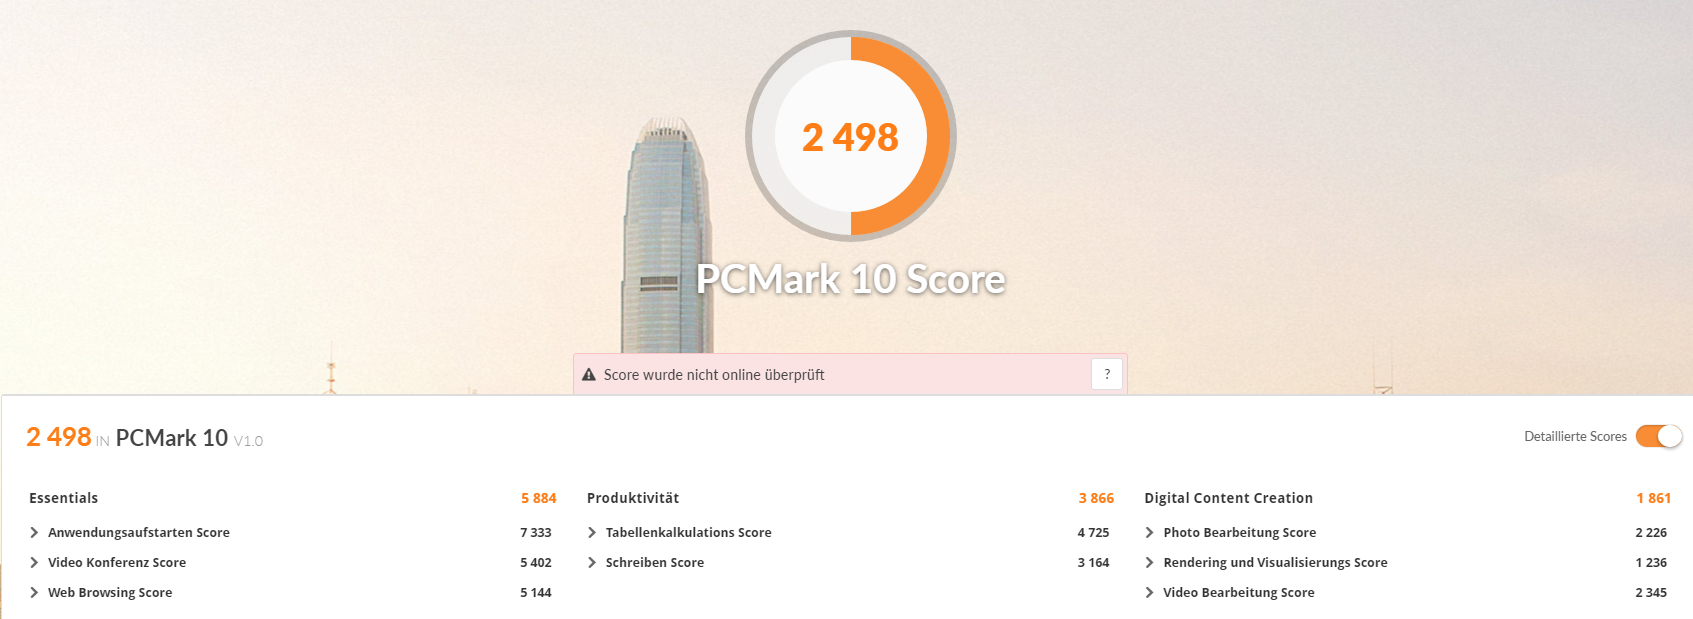
Update 11.6.2018: The Kaby Lake processor is not much of an improvement.
The Core i3-7020U achieves largely the same scores in system performance benchmarks as its Skylake sibling. The Kaby Lake processor scores 4% more in PCMark 8 Home and only 1% more in PCMark 10.
The Core i3-7020U is architecturally different to the Core i3-6006U and runs up to 300 MHz faster too. The Kaby Lake series does not offer a core-count increase as the Kaby Lake R series does, but why is the performance difference so negligible between our two test devices?
| PCMark 8 Home Score Accelerated v2 | 2845 points | |
| PCMark 8 Creative Score Accelerated v2 | 3293 points | |
| PCMark 8 Work Score Accelerated v2 | 3617 points | |
| PCMark 10 Score | 2480 points | |
Help | ||
| PCMark 8 - Home Score Accelerated v2 | |
| Average of class Office (n=1last 2 years) | |
| Acer Extensa 2540-580K | |
| Lenovo V110-15IKB 80TH001WGE | |
| Acer Aspire 3 A315-51-55E4 | |
| Asus ASUSPRO P541UA-GQ1532 | |
| Lenovo IdeaPad V110-15IKB 80TH001SGE | |
| Average Intel Core i3-6006U, Intel HD Graphics 520 (2801 - 3269, n=5) | |
| Toshiba Satellite Pro R50-C-16V | |
| Acer Aspire 3 A315-51-36YU | |
| HP 250 G6 2UB93ES | |
| HP 255 G6 | |
| Acer Aspire 3 A315-21-651Y | |
| Lenovo V110-15AST | |
Storage Devices
The 250 G6 is equipped with a Samsung M.2-2280 SATA III 256 GB SSD, of which 191 GB is usable after installing Windows 10. We measured good transfer speeds.
Update 11.6.2018
The main reason is that our test device has a slower SSD. Our first test device had a Samsung PM871a, while our second HP 250 G6 has a SanDisk SD9SN8W-256G installed. In short, the SanDisk SSD is 27% slower on average in benchmarks than the PM871a. The difference is particularly noticeable when comparing 4K read and write speeds, although the difference between sequential read and write speeds is negligible.
Storage benchmarks Samsung SSD PM871a (unhide)

Storage benchmarks: Sandisk SD9SN8W-256G
| HP 250 G6 2UB93ES Samsung SSD PM871a MZNLN256HMHQ | Lenovo IdeaPad V110-15IKB 80TH001SGE Ramxel S121 RTNRB256RFM4KWDL | Acer Extensa 2540-580K Kingston RBUSC180DS37256GH | Acer Aspire 3 A315-51-55E4 Micron 1100 MTFDDAV256TBN | HP 255 G6 Toshiba MQ01ABD100 | Acer Aspire 3 A315-21-651Y Kingston RBUSNS8180DS3128GH | Lenovo V110-15IKB 80TH001WGE Intel 545s SSDSC2KW256G8L | Lenovo V110-15AST Seagate Mobile HDD 1TB ST1000LM035 | Asus ASUSPRO P541UA-GQ1532 SK Hynix HFS128G32TND | Average Samsung SSD PM871a MZNLN256HMHQ | Average of class Office | |
|---|---|---|---|---|---|---|---|---|---|---|---|
| CrystalDiskMark 3.0 | -16% | 1% | -2% | -92% | 1% | -92% | -28% | 3% | 235% | ||
| Read Seq (MB/s) | 488 | 477.4 -2% | 473.9 -3% | 485.8 0% | 109.2 -78% | 536 10% | 81.6 -83% | 514 5% | 507 ? 4% | 3104 ? 536% | |
| Write Seq (MB/s) | 455 | 284.2 -38% | 467.1 3% | 456.1 0% | 102.8 -77% | 407.3 -10% | 83.6 -82% | 133.5 -71% | 454 ? 0% | 2916 ? 541% | |
| Read 512 (MB/s) | 426.4 | 356.3 -16% | 318.3 -25% | 328 -23% | 36.65 -91% | 393.4 -8% | 28.95 -93% | 333.7 -22% | 444 ? 4% | 899 ? 111% | |
| Write 512 (MB/s) | 390.7 | 282.3 -28% | 441.3 13% | 446.8 14% | 44.97 -88% | 324.7 -17% | 75.6 -81% | 133.7 -66% | 318 ? -19% | 2309 ? 491% | |
| Read 4k (MB/s) | 37.68 | 24.15 -36% | 33.06 -12% | 26.95 -28% | 0.429 -99% | 36.92 -2% | 0.42 -99% | 30.67 -19% | 37 ? -2% | 54.1 ? 44% | |
| Write 4k (MB/s) | 76.9 | 71.9 -7% | 77.7 1% | 86.7 13% | 0.984 -99% | 89.1 16% | 0.209 -100% | 74.7 -3% | 95.1 ? 24% | 114.1 ? 48% | |
| Read 4k QD32 (MB/s) | 286.5 | 283.7 -1% | 310.1 8% | 245.9 -14% | 0.881 -100% | 314.4 10% | 0.972 -100% | 287.2 0% | 311 ? 9% | 463 ? 62% | |
| Write 4k QD32 (MB/s) | 253.1 | 257.3 2% | 317.1 25% | 300.2 19% | 0.952 -100% | 270.1 7% | 0.347 -100% | 134.1 -47% | 256 ? 1% | 370 ? 46% |
Graphics Card
An Intel HD Graphics 520 handles the 250 G6’s graphics. The GPU can clock up to 900 MHz and supports DirectX 12. 3DMark benchmark results are as expected for this GPU given that it is operating with a single-channel RAM. The GPU performance could also be improved by enabling dual-channel mode and adding a second identical RAM module. Doing so would boost the GPU performance.
During our Prime95 and FurMark stress tests, the GPU consistently clocked at 850 MHz irrespective of the 250 G6 being on battery or on mains power.
| 3DMark 11 Performance | 1322 points | |
| 3DMark Cloud Gate Standard Score | 4501 points | |
| 3DMark Fire Strike Score | 699 points | |
Help | ||
| 3DMark 11 - 1280x720 Performance GPU | |
| Average of class Office (2551 - 18313, n=73, last 2 years) | |
| Acer Extensa 2540-580K | |
| Lenovo V110-15IKB 80TH001WGE | |
| Average Intel HD Graphics 520 (1060 - 1520, n=130) | |
| HP 250 G6 2UB93ES | |
| Asus ASUSPRO P541UA-GQ1532 | |
| Toshiba Satellite Pro R50-C-16V | |
| Acer Aspire 3 A315-51-36YU | |
| Acer Aspire 3 A315-51-55E4 | |
| HP 255 G6 | |
| Acer Aspire 3 A315-21-651Y | |
| Lenovo IdeaPad V110-15IKB 80TH001SGE | |
| Lenovo V110-15AST | |
Gaming Performance
The 250 G6 could be used to play games, but only those that have low system requirements. Even then, you would have to be content with playing at low quality and at low resolutions. Frame rates could be improved by activating dual-channel mode, but do not expect performance hungry games such as “Final Fantasy XV” to be playable.
| low | med. | high | ultra | |
|---|---|---|---|---|
| Deus Ex Human Revolution (2011) | 55.4 | 32.7 | 13.2 | |
| The Elder Scrolls V: Skyrim (2011) | 36.3 | 20.1 | 12.3 | 6.1 |
| Anno 2070 (2011) | 74 | 34.4 | 20.5 | 9.5 |
| BioShock Infinite (2013) | 42 | 23.7 | 19.7 | 6.3 |
| Risen 3: Titan Lords (2014) | 24.6 | 16.5 | 5.1 | |
| Dishonored 2 (2016) | 5.6 | 3.1 | ||
| Warhammer 40.000: Dawn of War III (2017) | 18.6 | 6.5 | ||
| Middle-earth: Shadow of War (2017) | 15 | 7 | ||
| The Evil Within 2 (2017) | 9 | 4.6 | ||
| ELEX (2017) | 10.1 | 5.2 | ||
| Destiny 2 (2017) | 9.7 | |||
| Assassin´s Creed Origins (2017) | 8 | 5 | ||
| Call of Duty WWII (2017) | 20.9 | 14.2 | ||
| Need for Speed Payback (2017) | 10.8 | 6.2 | ||
| Star Wars Battlefront 2 (2017) | 14.6 | 4.9 | ||
| Fortnite (2018) | 25.8 | 7.1 | ||
| Final Fantasy XV Benchmark (2018) | 7 | |||
| Kingdom Come: Deliverance (2018) | 10.3 | 5 | ||
| X-Plane 11.11 (2018) | 18.8 | 12.6 |
Emissions
Noise Emissions
The fan is permanently on by default, the cause of which is that HP has set the fan to “always on” in the BIOS. This can be disabled, resulting in a far quieter experience with the fan hardly ramping up under load. During our stress test, we measured maximum fan noise at only 33 dB(A).
Noise level
| Idle |
| 31.6 / 31.6 / 31.7 dB(A) |
| HDD |
| 31.6 dB(A) |
| DVD |
| 38 / dB(A) |
| Load |
| 33.1 / 33 dB(A) |
 | ||
30 dB silent 40 dB(A) audible 50 dB(A) loud |
||
min: | ||
Temperature
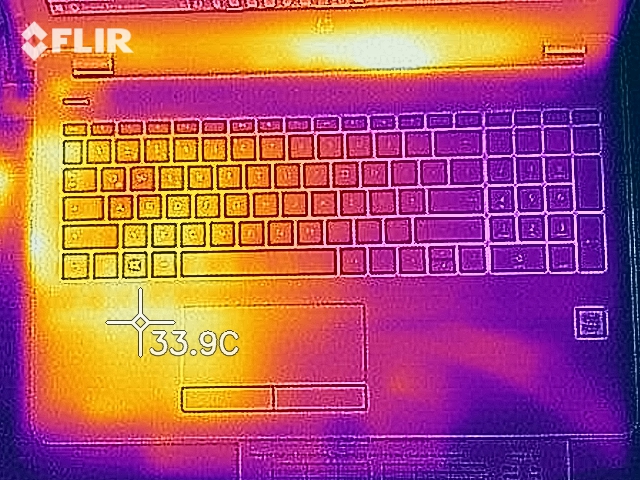
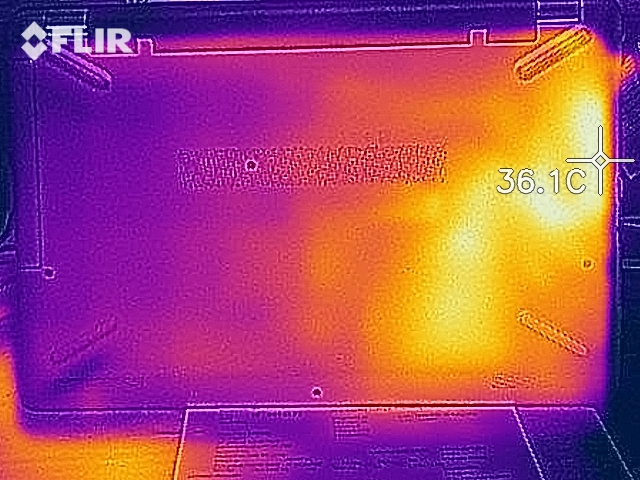
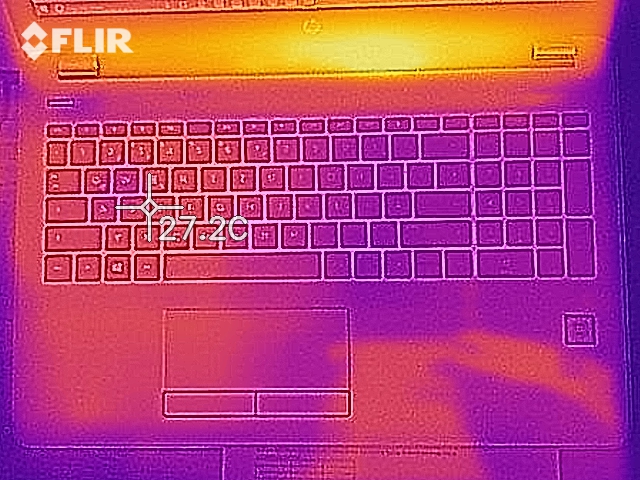
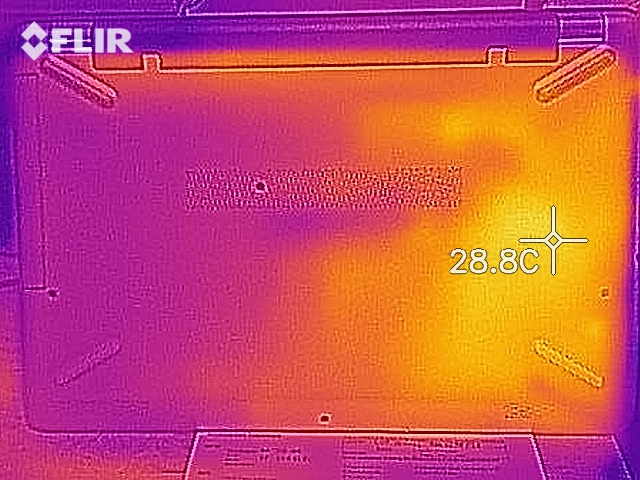
The 250 G6 remains cool even during our stress tests and should pose no problems for working from it on your lap. Under load, surface temperatures reach a maximum of 30 °C (~86 °F) on only two points of the device, with average temperatures under load measuring 26 °C (~79 °F) on the top of the case and 25 °C (~77 °F) on the bottom. At idle we measured average surface temperatures of around 22 °C (~72 °F), and under 24 °C (~75 °F) maximum temperatures.
(+) The maximum temperature on the upper side is 30 °C / 86 F, compared to the average of 34.3 °C / 94 F, ranging from 21.2 to 62.5 °C for the class Office.
(+) The bottom heats up to a maximum of 30.1 °C / 86 F, compared to the average of 36.8 °C / 98 F
(+) In idle usage, the average temperature for the upper side is 21.7 °C / 71 F, compared to the device average of 29.5 °C / 85 F.
(+) The palmrests and touchpad are cooler than skin temperature with a maximum of 28.3 °C / 82.9 F and are therefore cool to the touch.
(±) The average temperature of the palmrest area of similar devices was 27.6 °C / 81.7 F (-0.7 °C / -1.2 F).
Speakers
HP 250 G6 2UB93ES audio analysis
(-) | not very loud speakers (71.3 dB)
Bass 100 - 315 Hz
(-) | nearly no bass - on average 23.1% lower than median
(-) | bass is not linear (15.3% delta to prev. frequency)
Mids 400 - 2000 Hz
(+) | balanced mids - only 3.8% away from median
(±) | linearity of mids is average (7.1% delta to prev. frequency)
Highs 2 - 16 kHz
(+) | balanced highs - only 3.7% away from median
(±) | linearity of highs is average (7.1% delta to prev. frequency)
Overall 100 - 16.000 Hz
(±) | linearity of overall sound is average (20.4% difference to median)
Compared to same class
» 46% of all tested devices in this class were better, 10% similar, 45% worse
» The best had a delta of 7%, average was 21%, worst was 53%
Compared to all devices tested
» 54% of all tested devices were better, 8% similar, 38% worse
» The best had a delta of 4%, average was 23%, worst was 134%
Apple MacBook 12 (Early 2016) 1.1 GHz audio analysis
(+) | speakers can play relatively loud (83.6 dB)
Bass 100 - 315 Hz
(±) | reduced bass - on average 11.3% lower than median
(±) | linearity of bass is average (14.2% delta to prev. frequency)
Mids 400 - 2000 Hz
(+) | balanced mids - only 2.4% away from median
(+) | mids are linear (5.5% delta to prev. frequency)
Highs 2 - 16 kHz
(+) | balanced highs - only 2% away from median
(+) | highs are linear (4.5% delta to prev. frequency)
Overall 100 - 16.000 Hz
(+) | overall sound is linear (10.2% difference to median)
Compared to same class
» 7% of all tested devices in this class were better, 2% similar, 90% worse
» The best had a delta of 5%, average was 18%, worst was 53%
Compared to all devices tested
» 5% of all tested devices were better, 1% similar, 94% worse
» The best had a delta of 4%, average was 23%, worst was 134%
Frequency diagram in comparison (checkboxes are de/selectable)
Power Consumption
The 250 G6 is energy efficient, thanks to its Core i3 processor. At idle, we measured a maximum power draw of 6.3 W, which rose to 24.3 W during our stress tests. The 45 W rated power supply will therefore, provide enough power to charge the device even when it is under maximum load.
| Off / Standby | |
| Idle | |
| Load |
|
Key:
min: | |
Battery Life
The 250 G6 has surprisingly good battery life. We measure the battery runtime with our practical Wi-Fi test which simulates the load of loading websites. We set the battery profile at “Balanced” with the display at 150 cd/m² and energy saving features turned off. The 250 G6 lasted six hours and forty-nine minutes in this test, easily beating its sister model. The 250 G6 has a longer runtime thanks to its better energy efficiency and larger battery capacity, with the 250 G6 having a 41 Wh battery capacity compared with 255 G6’s 31 Wh capacity.
Update 11.6.2018
Our second test device also has a 42 Wh battery. However, the Core i3-7020U powered device has 30% worse battery life than its Core i3-6006U powered sibling. Our first 250 G6 test device lasted six hours and forty-nine minutes in our Wi-Fi battery life, while our new device runs out of battery after only four hours and forty-five minutes. Our new test device lasts for one hour and forty-nine minutes in a Battery Eater Classic battery life test. We did not run the same test on our first test device though.
Pros
Cons
Verdict
HP has delivered a simple 15.6-inch office laptop. While the Core i3 processor will not break any performance records, it does provide enough performance for office and internet applications. Better still, the device remains cool and quiet throughout.
The HP 250 G6 is a well-rounded office notebook.
The SSD ensures fast and smooth system performance. It would have been better had HP included a maintenance hatch rather than having to remove the entire base plate for general maintenance and repairs. The battery life and keyboard are decent though.
The Full HD display will win no prizes, as it is very dark, with low contrast and poor viewing angles. There are cheaper devices with better displays than the one in the 250 G6. Furthermore, the Wi-Fi transfer speeds are average and HP offers only a one-year warranty.
If the price is a concern, then HP offers an identically equipped variant named the 2UB92ES. This variant is available for between €50 and €80 (~$62 - ~$98 less than our test device and only lacks a Windows 10 licence. With a used licence being available for between €5 and €10 (~$6 - ~$12), there is money to be saved.

Update 11.6.2018:
The new Kaby Lake version is disappointing. The Kaby Lake processor is slightly faster, but the slower SanDisk SSD all but eradicates any performance gains. Our second test device also has 30% worse battery life, which is surprising.
The HP 250 G6 (Core i3-6006U, SSD, FHD) costs around €450 (~ $515) at the time of writing. By contrast, its sister model costs around €30 (~ $35) more for comparable performance and third the battery life.
The display is made by Chi Mei rather than BOE, but they are both equally bad. We would recommend choosing the Core i3-6006U HP 250 G6 if it is cheaper than the Core i3-7020U model. However, HP may equip the former with the same Chi Mei display and slow SanDisk SSD as they did in our second test device. Unfortunately, there is no way to tell what hardware each device has until it has been opened.
HP 250 G6 2UB93ES
- 03/12/2018 v6 (old)
Sascha Mölck
Price comparison

