Acer Aspire 3 (7200U, HD 620) Laptop Review

For the original German version, click here.
Acer's Aspire series offers both affordable entry-level devices and expensive high-performance notebooks. The Aspire 3 is one of the entry-level devices, but offers good value for the money. The various configurations enable users to adapt the Aspire 3 to their own needs and possibilities. For this review, we have chosen several similarly equipped notebooks as our comparison devices: the HP Pavilion 14-al103ng, Lenovo's ThinkPad E570, Fujitsu's LifeBook A557, and Dell's Latitude 5580.
Case
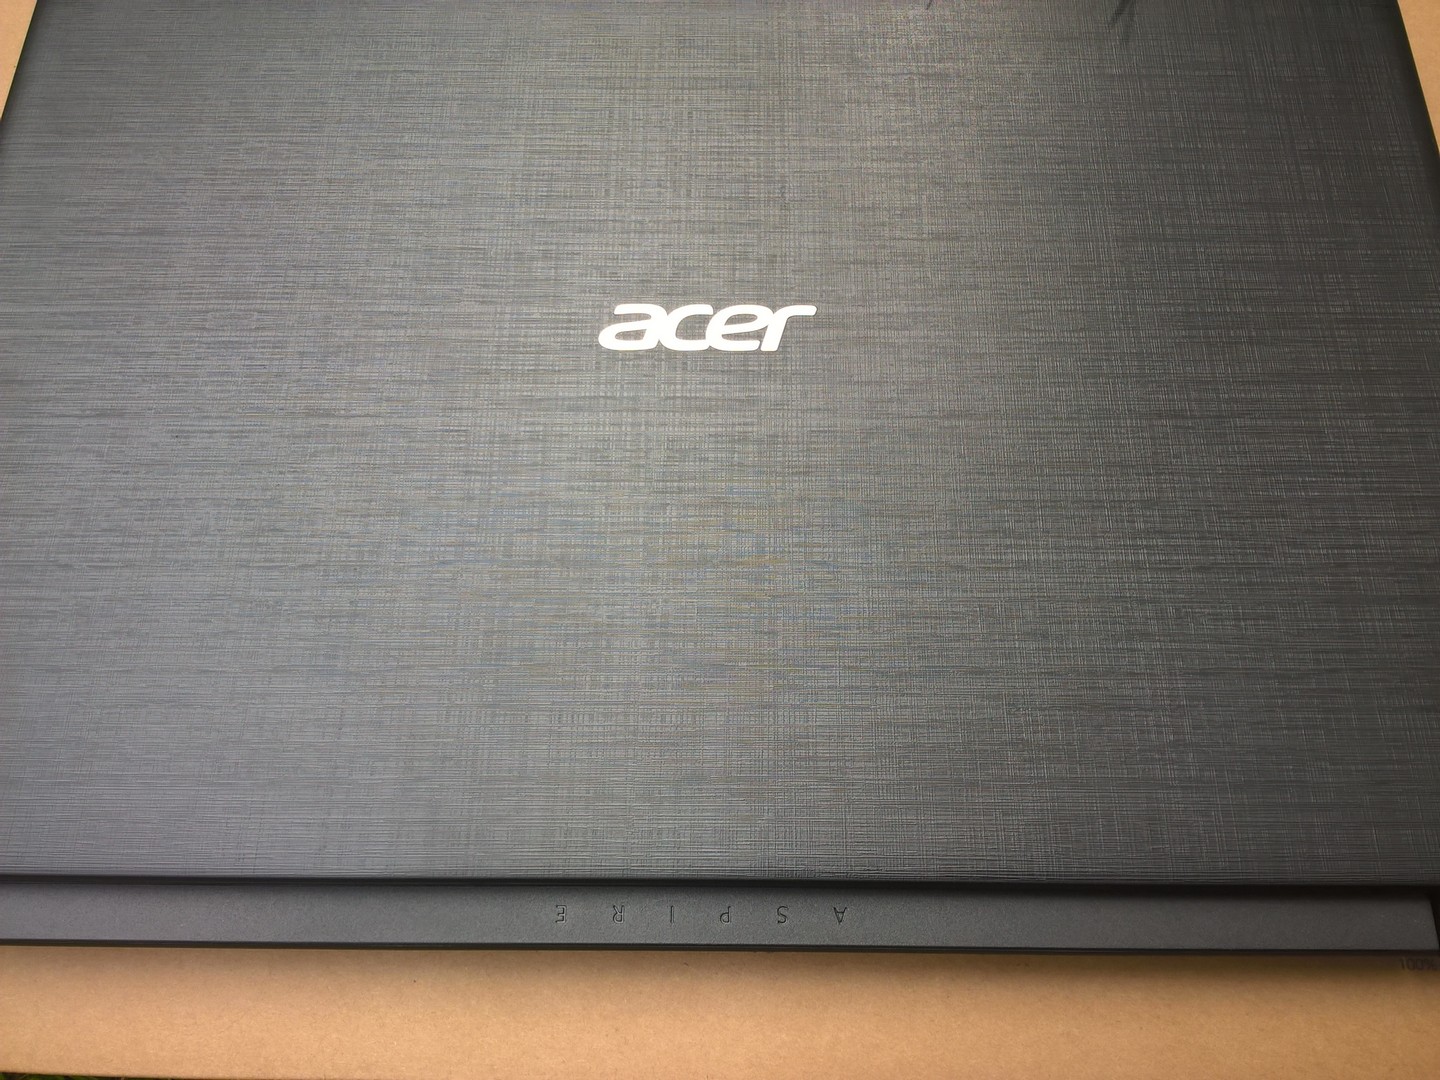
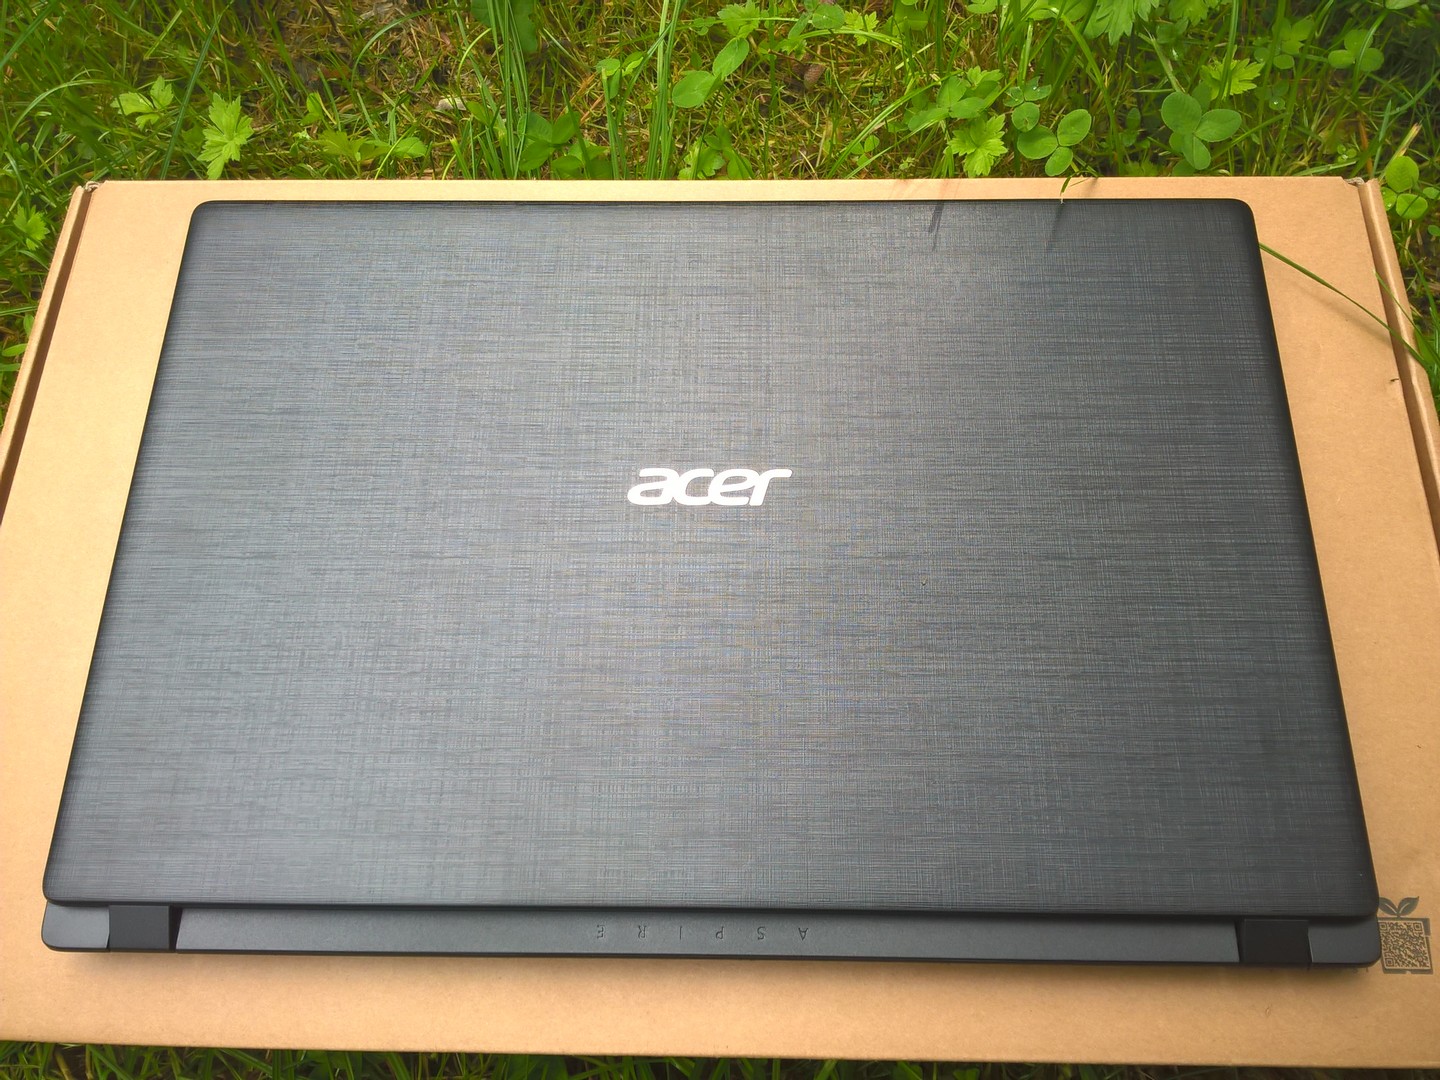
The case of the Aspire 3 is made of simple, brushed plastic. The surface does not feel cheap and the looks are further improved by its color - "Obsidian Black". The base unit seems to be very stable and there were no creaking sounds or large gaps. The display cover is also well made, but is rather thin and made of light plastic, which means it is easy to warp.
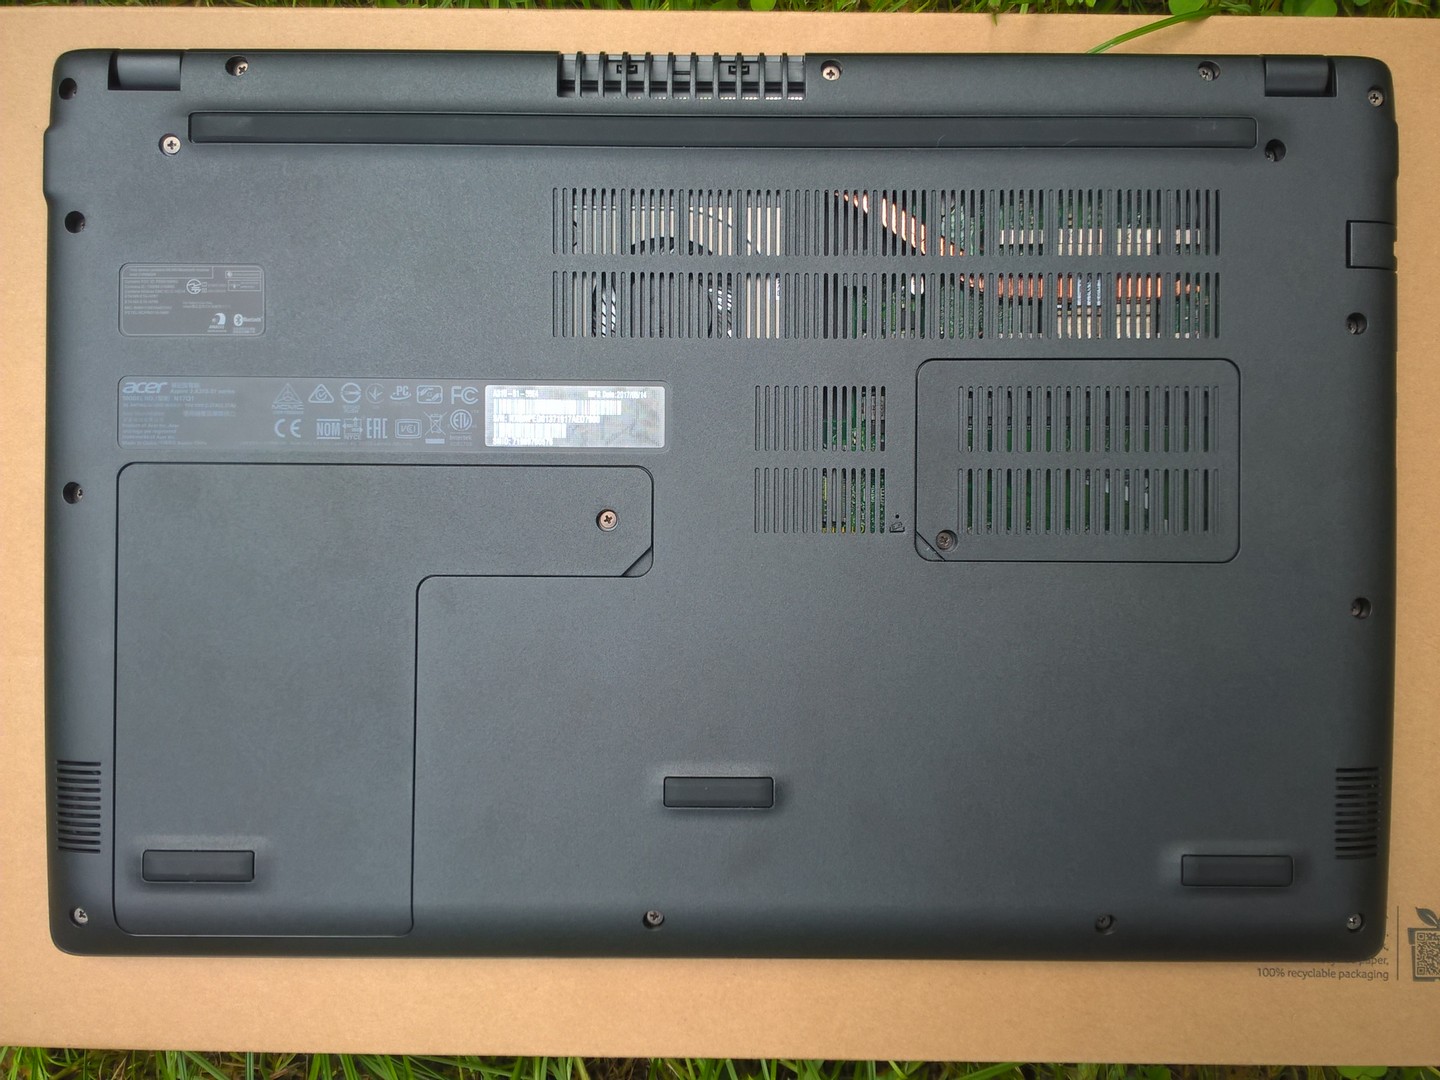
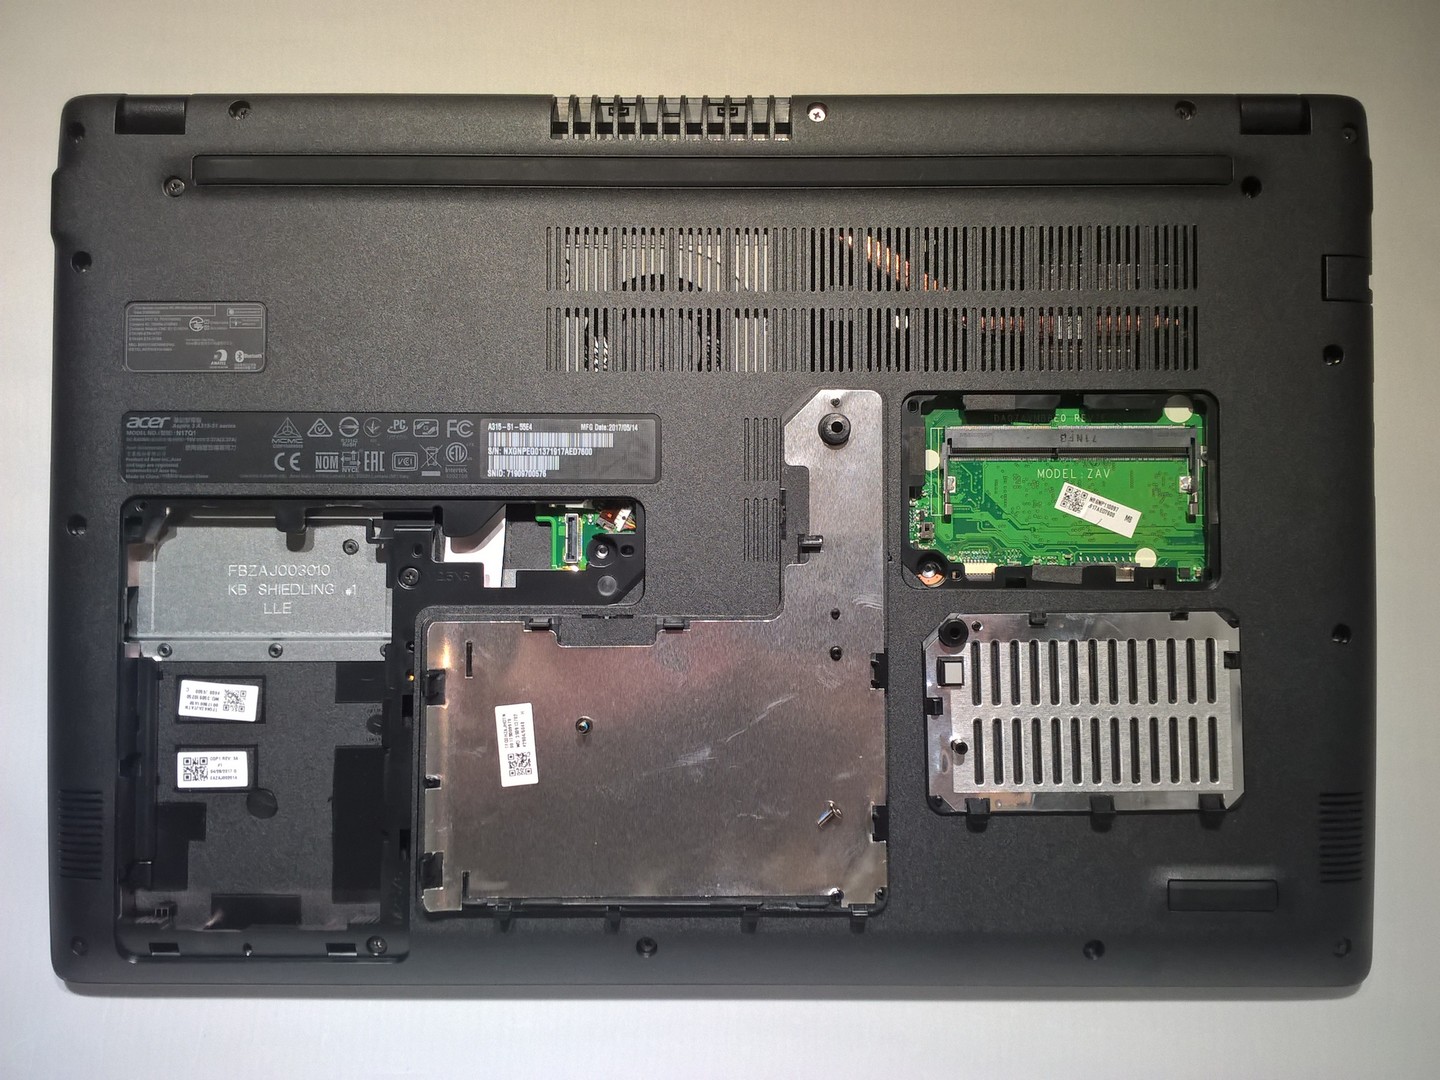
There are two maintenance hatches on the bottom of the notebook. The smaller one leads to a free RAM slot, while the larger covers up a drive bay. In our test unit, this bay is empty and offers space for a 2.5-inch drive. Both maintenance hatches are secured with one screw each.
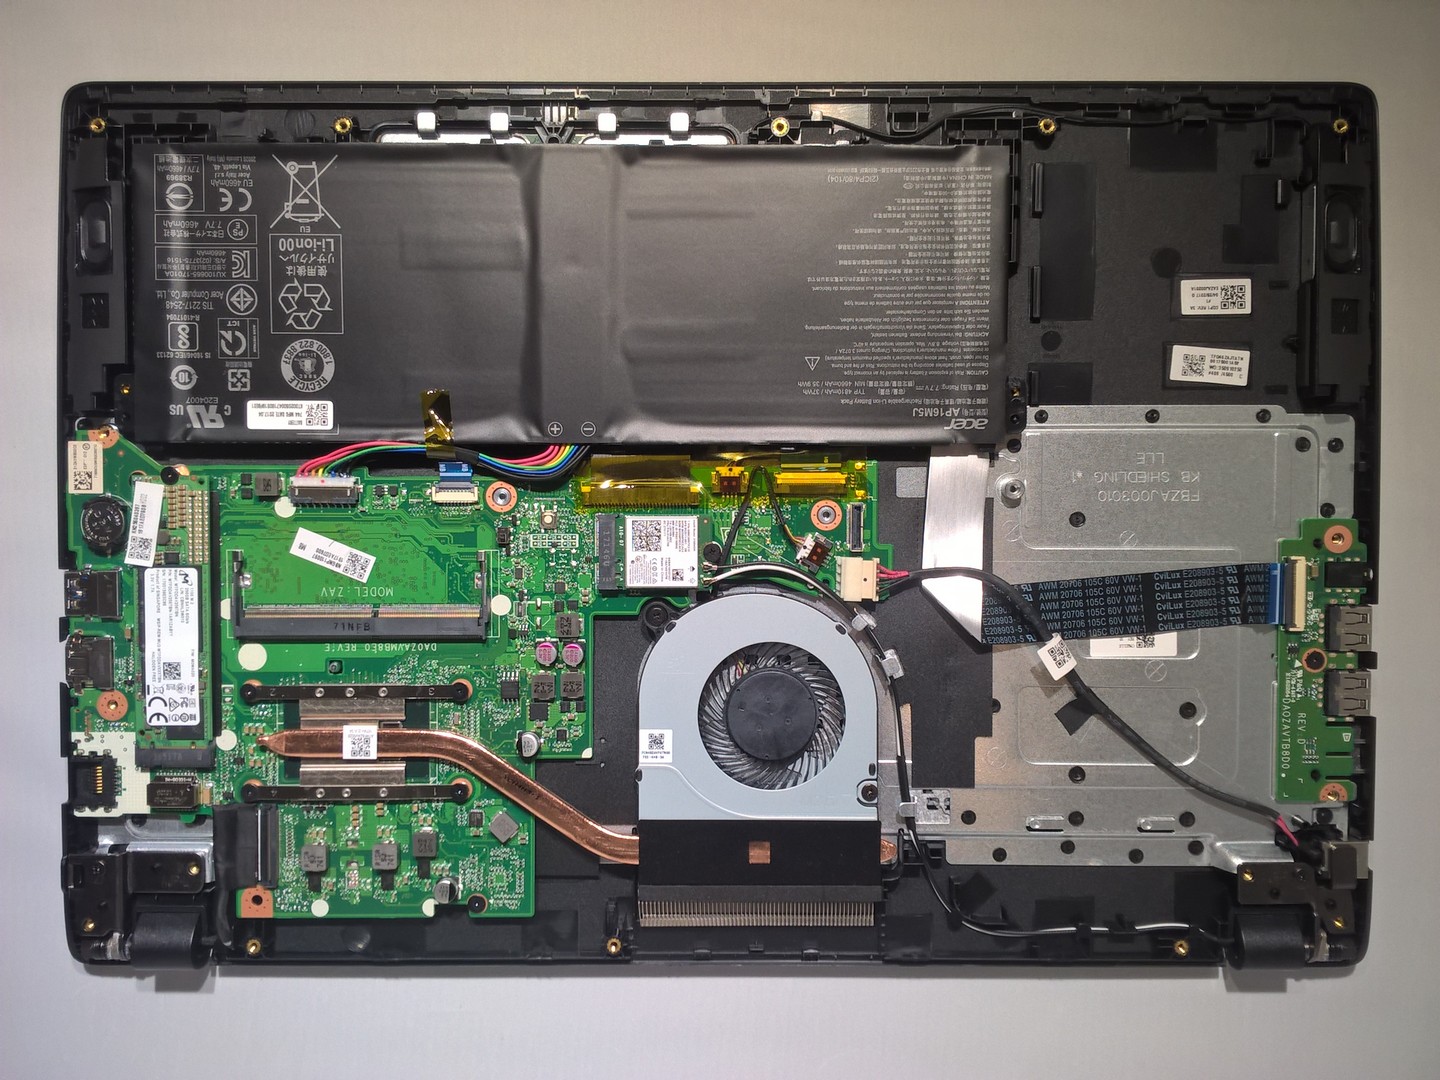
A few more screws (17 in total) have to be removed in order to lift off the bottom cover, which is additionally secured with plastic clips, so caution is needed when removing the cover. Once the bottom cover is removed, all components of the Aspire 3 can be accessed. The cooling fan and SSD are freely accessible. You need to be particularly careful when opening the base unit because the battery is not really fixed into the case. The screws that hold the battery in place get removed when unscrewing the bottom cover.
The Aspire 3 is a little larger and heavier than its comparison devices, but does not seem unwieldy. The weight is still low enough for the notebook to be easily portable.
Connectivity
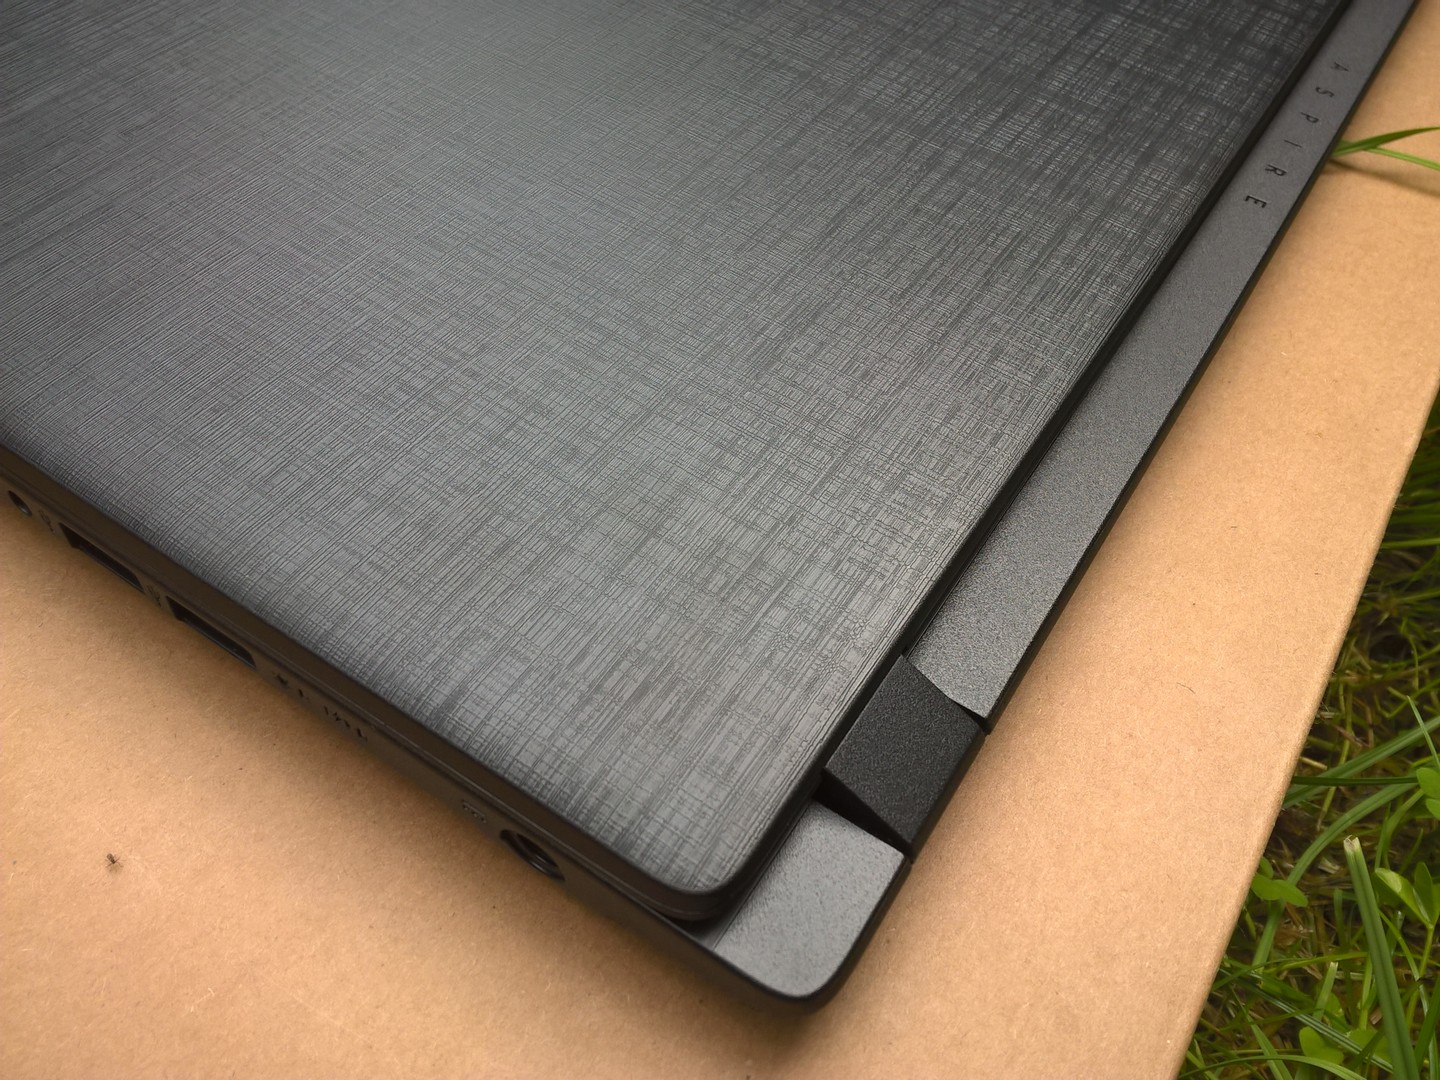
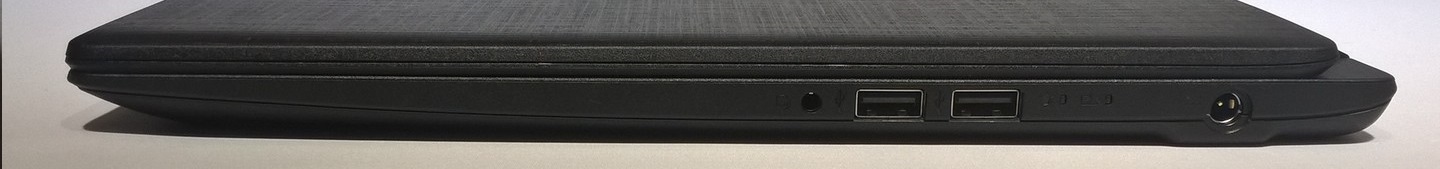
All ports of the Aspire 3 are positioned towards the back on the left and right sides, so connected devices should not get in the way. The power supply is stable enough to stay in place even when sitting cross-legged on the sofa. The SD card reader only takes half of the memory card, so it stands out by about 1.5 cm (~0.6 in).
Acer was a little sparing with its connectivity features. The similarly priced Fujitsu LifeBook A557 offers several USB 3.0 and 3.1 ports. Acer could have easily inverted the ratio of two 2.0 ports to one 3.0 port.
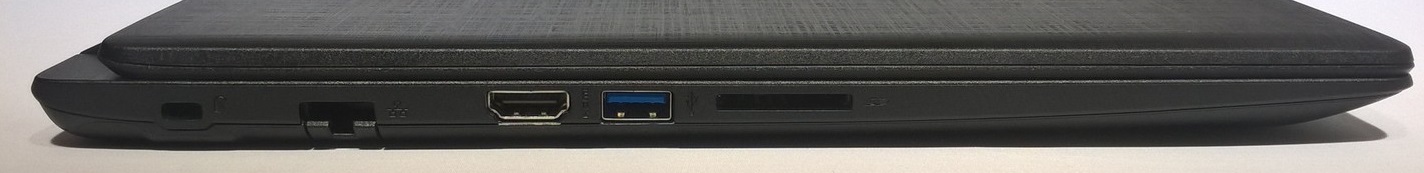
SD card reader
The SD card reader in the Aspire 3 has average read and write rates compared to its competitors. We used our reference card, the Toshiba Exceria Pro SDXC 64 GB UHS II, and our test unit copied data with a speed of 77 MB/s and read them with 86 MB/s. This makes the Aspire 3 faster than the card reader in the Lenovo ThinkPad E570-20H6S00000.
| SD Card Reader | |
| average JPG Copy Test (av. of 3 runs) | |
| Fujitsu Lifebook A557 (Toshiba Exceria Pro SDXC 64 GB UHS-II) | |
| Dell Latitude 5580 (Toshiba Exceria Pro SDXC 64 GB UHS-II) | |
| Acer Aspire 3 A315-51-55E4 (Toshiba Exceria Pro SDXC 64 GB UHS-II) | |
| Lenovo ThinkPad E570-20H6S00000 (Toshiba Exceria Pro SDXC 64 GB UHS-II) | |
| HP Pavilion 14-al103ng (Toshiba Exceria Pro SDXC 64 GB UHS-II) | |
| maximum AS SSD Seq Read Test (1GB) | |
| Dell Latitude 5580 (Toshiba Exceria Pro SDXC 64 GB UHS-II) | |
| Fujitsu Lifebook A557 (Toshiba Exceria Pro SDXC 64 GB UHS-II) | |
| HP Pavilion 14-al103ng (Toshiba Exceria Pro SDXC 64 GB UHS-II) | |
| Acer Aspire 3 A315-51-55E4 (Toshiba Exceria Pro SDXC 64 GB UHS-II) | |
| Lenovo ThinkPad E570-20H6S00000 (Toshiba Exceria Pro SDXC 64 GB UHS-II) | |
Communication
The Acer Aspire 3 has an Intel Dual-Band Wireless AC3168 module with Bluetooth 4.2. The transfer rates place our test unit in the lower mid-range of our comparison devices. We noticed no abnormalities during everyday use.
Security
Apart from the Kensington lock, the Aspire 3 offers no security components.
Accessories
No particular accessories are available for the Aspire 3.
Maintenance
There are two maintenance hatches at the bottom of the Aspire 3, both secured with a screw. The smaller hatch covers the free RAM slot, with which working memory can be expanded to up to 12 GB. The second maintenance hatch is for an empty drive bay, which can be filled with a conventional 2.5-inch drive.
If you remove the bottom cover, you can see all the components. The SSD can be exchanged and the cooling fan is freely accessible for cleaning. The bottom cover and maintenance hatches have to be removed carefully as the plastic clips on the hatches catch easily and can break off. The battery is secured with only one screw that is removed when unscrewing the bottom cover. Therefore, the battery "falls" out of the device when you open it.
Warranty
Acer offers a 24-month warranty for the Aspire 3. This can be expanded to three years for about $50. It includes sending the device from and to the manufacturer as well as a one-year travel warranty. Please see our Guarantees, Return policies and Warranties FAQ for country-specific information.
Input Devices
Keyboard
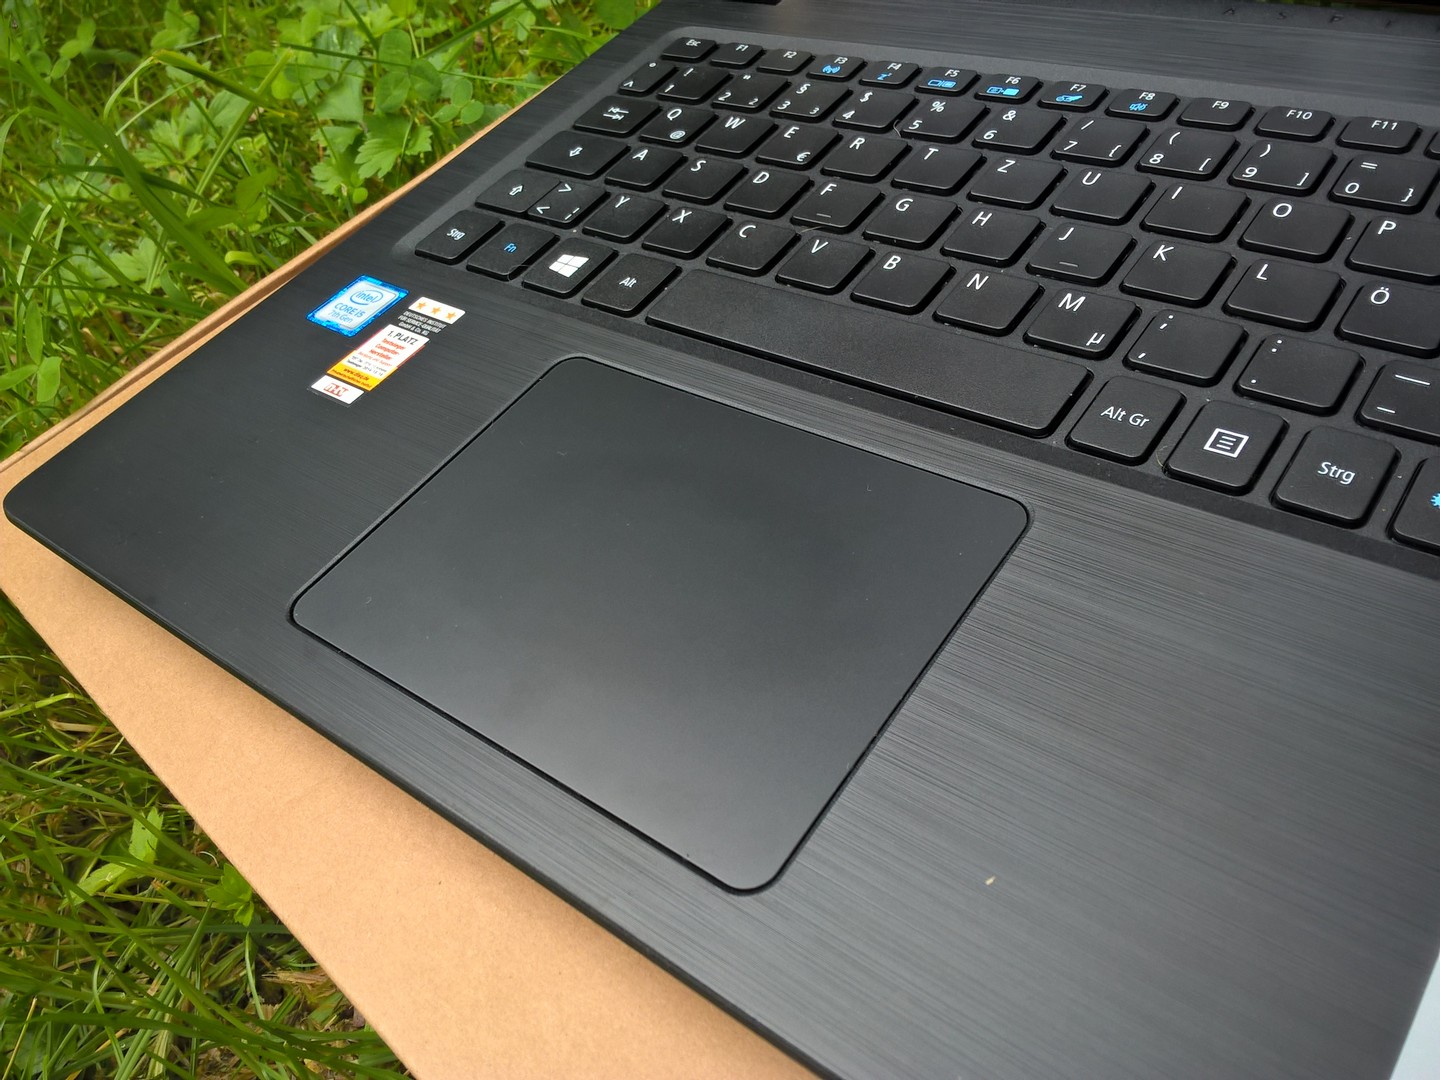
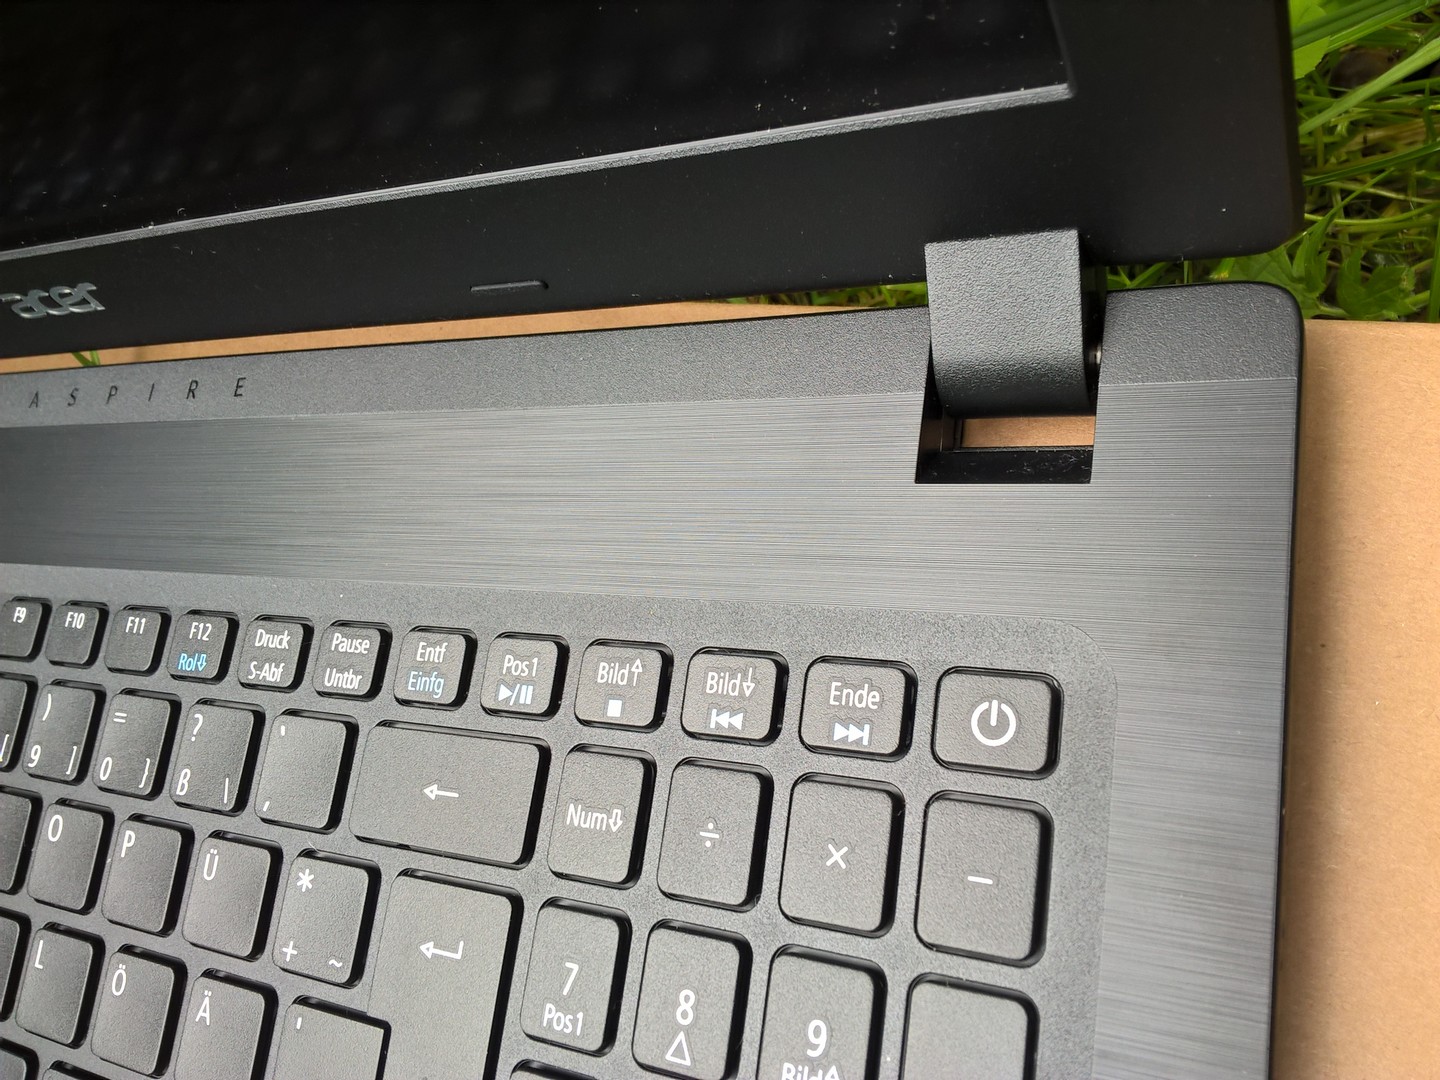
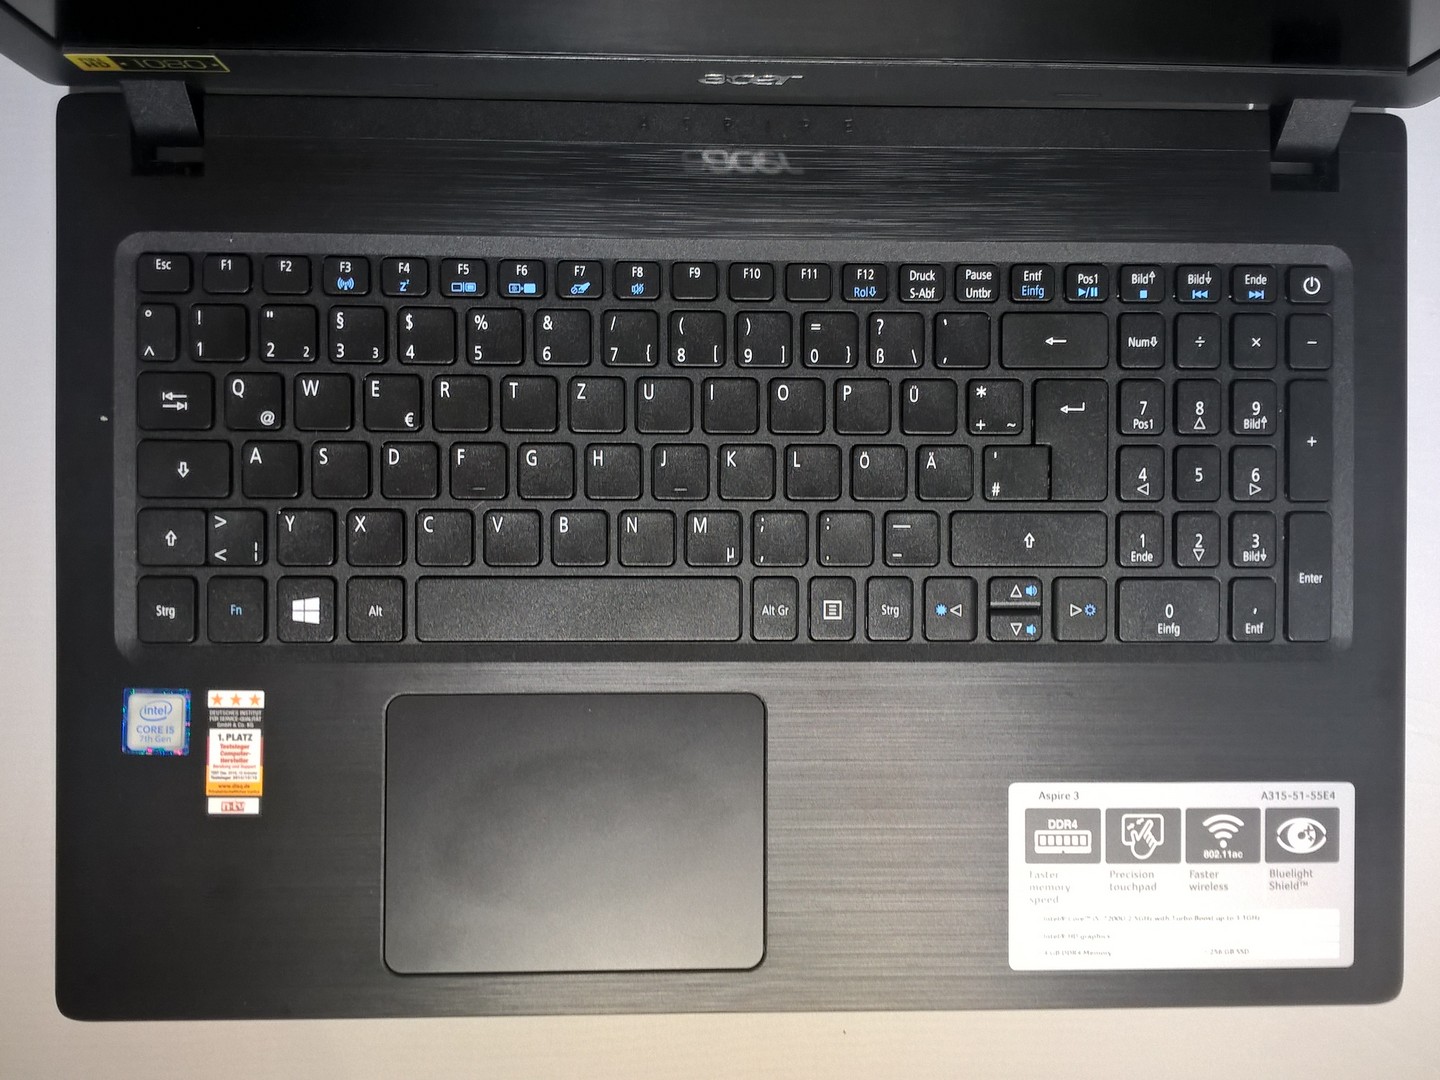
The keyboard of the Aspire 3 has a comfortable size. The keys have a nice grip and fingers do not slide off them. The pressure point is soft, but noticeable. While letter and number keys are easy to reach, hitting the special keys can become difficult. The arrow keys, "delete" and the number block are all very small and two keys are often pressed at the same time by accident.
Touchpad
Acer has chosen a ClickPad as a mouse replacement. The surface of the pad is very smooth and the cursor can be moved in every corner and at the edges. It only registers input as a right mouse click in a one-centimeter (~0.4 in) strip that goes from the bottom right towards the middle. The pad registers a left click when you put pressure on any spot outside this area - even at the top of the pad, although the pressure has to be very strong there.
Display
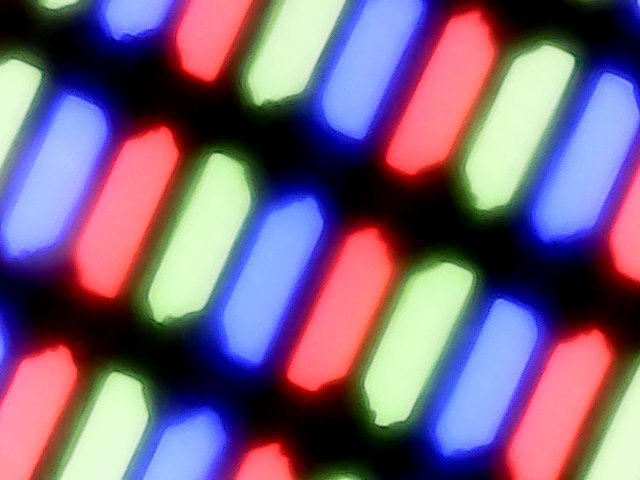
Acer has equipped our test unit with a TN LED panel that has a resolution of 1920x1080p. The viewing angles are not particularly good. There is a slightly cheaper version of the Aspire 3 with a resolution of 1366x768p available as well.
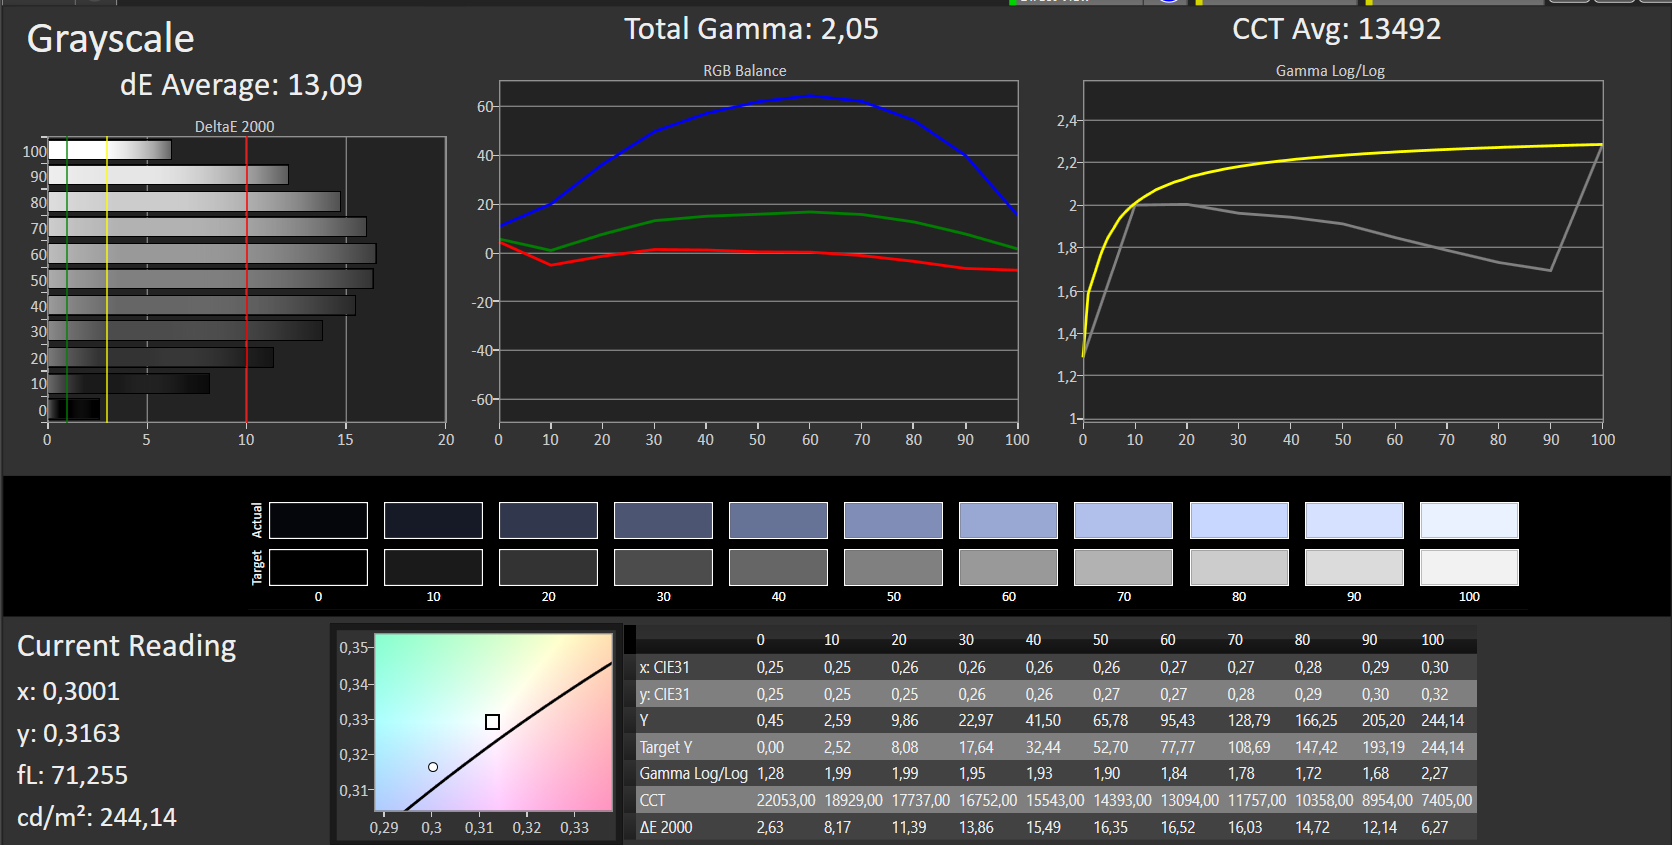
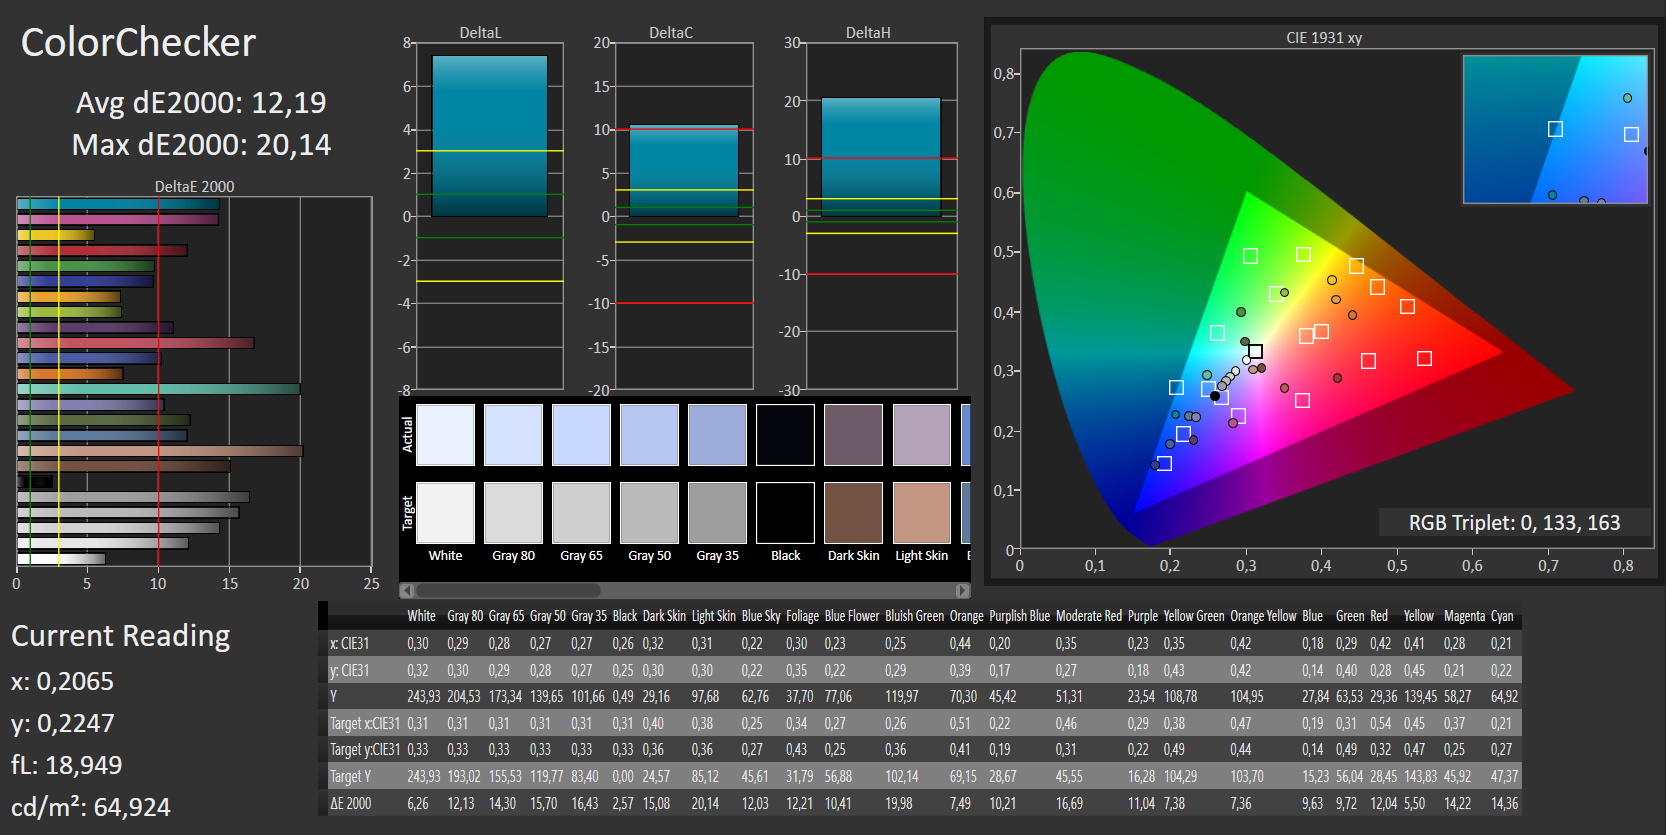
Compared to its competition, display brightness and response times are slightly above average. The similarly affordable Fujitsu LifeBook A557 in particular has noticeable differences and our test unit can even stand up against more expensive comparison devices. We did not measure any PWM flickering.
| |||||||||||||||||||||||||
Brightness Distribution: 87 %
Center on Battery: 241 cd/m²
Contrast: 524:1 (Black: 0.46 cd/m²)
ΔE ColorChecker Calman: 3.4 | ∀{0.5-29.43 Ø4.72}
ΔE Greyscale Calman: 1.7 | ∀{0.09-98 Ø4.97}
54% sRGB (Argyll 1.6.3 3D)
34% AdobeRGB 1998 (Argyll 1.6.3 3D)
37.17% AdobeRGB 1998 (Argyll 3D)
54.1% sRGB (Argyll 3D)
35.97% Display P3 (Argyll 3D)
Gamma: 2.36
CCT: 6750 K
| Acer Aspire 3 A315-51-55E4 AU Optronics AUO38ED, , 1920x1080, 15.6" | Dell Latitude 5580 1366x768, 15.6" | Fujitsu Lifebook A557 BOE NV156FHM-N42, , 1920x1080, 15.6" | Lenovo ThinkPad E570-20H6S00000 AUO B156HAN04.4, , 1920x1080, 15.6" | HP Pavilion 14-al103ng AU Optronics, , 1920x1080, 14" | |
|---|---|---|---|---|---|
| Display | 12% | 16% | 7% | 2% | |
| Display P3 Coverage (%) | 35.97 | 40.13 12% | 41.85 16% | 38.65 7% | 36.58 2% |
| sRGB Coverage (%) | 54.1 | 60 11% | 62.9 16% | 58 7% | 54.9 1% |
| AdobeRGB 1998 Coverage (%) | 37.17 | 41.5 12% | 43.24 16% | 39.94 7% | 37.79 2% |
| Response Times | -58% | -109% | -58% | -73% | |
| Response Time Grey 50% / Grey 80% * (ms) | 44 ? | 30 ? 32% | 55 ? -25% | 44.8 ? -2% | 53 ? -20% |
| Response Time Black / White * (ms) | 12 ? | 29.6 ? -147% | 35 ? -192% | 25.6 ? -113% | 27 ? -125% |
| PWM Frequency (Hz) | 201.6 ? | 200 ? | |||
| Screen | -113% | 17% | -2% | -1% | |
| Brightness middle (cd/m²) | 241 | 238 -1% | 287 19% | 242 0% | 200 -17% |
| Brightness (cd/m²) | 229 | 216 -6% | 260 14% | 243 6% | 191 -17% |
| Brightness Distribution (%) | 87 | 83 -5% | 83 -5% | 75 -14% | 90 3% |
| Black Level * (cd/m²) | 0.46 | 0.53 -15% | 0.22 52% | 0.24 48% | 0.14 70% |
| Contrast (:1) | 524 | 449 -14% | 1305 149% | 1008 92% | 1429 173% |
| Colorchecker dE 2000 * | 3.4 | 10.8 -218% | 4.21 -24% | 4.65 -37% | 5.06 -49% |
| Colorchecker dE 2000 max. * | 7.61 | 29.3 -285% | 8.81 -16% | 9.64 -27% | 10.91 -43% |
| Greyscale dE 2000 * | 1.7 | 12.1 -612% | 2.68 -58% | 3.39 -99% | 3.94 -132% |
| Gamma | 2.36 93% | 2.25 98% | 2.5 88% | 2.7 81% | 2.41 91% |
| CCT | 6750 96% | 14344 45% | 6066 107% | 6246 104% | 6159 106% |
| Color Space (Percent of AdobeRGB 1998) (%) | 34 | 38.3 13% | 40 18% | 36.69 8% | 35 3% |
| Color Space (Percent of sRGB) (%) | 54 | 59.9 11% | 63 17% | 57.66 7% | 55 2% |
| Total Average (Program / Settings) | -53% /
-81% | -25% /
-0% | -18% /
-7% | -24% /
-10% |
* ... smaller is better
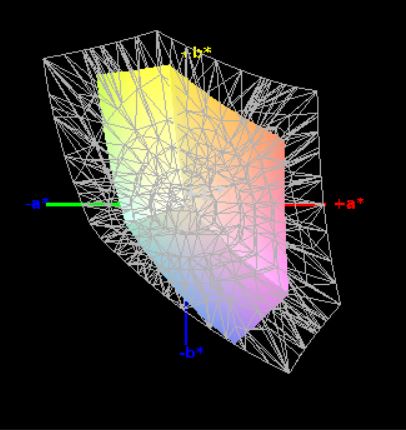

The black value has a deviation of about 50% from the optimal value. Other devices of the same range have significantly better results. Color space coverage could be better too. Competition is ahead both in the AdobeRGB (34%) and the sRGB color space (54%). The Aspire 3's display has a blue cast, although this can be reduced with our calibrated profile. You can find a link to this profile in the box above.

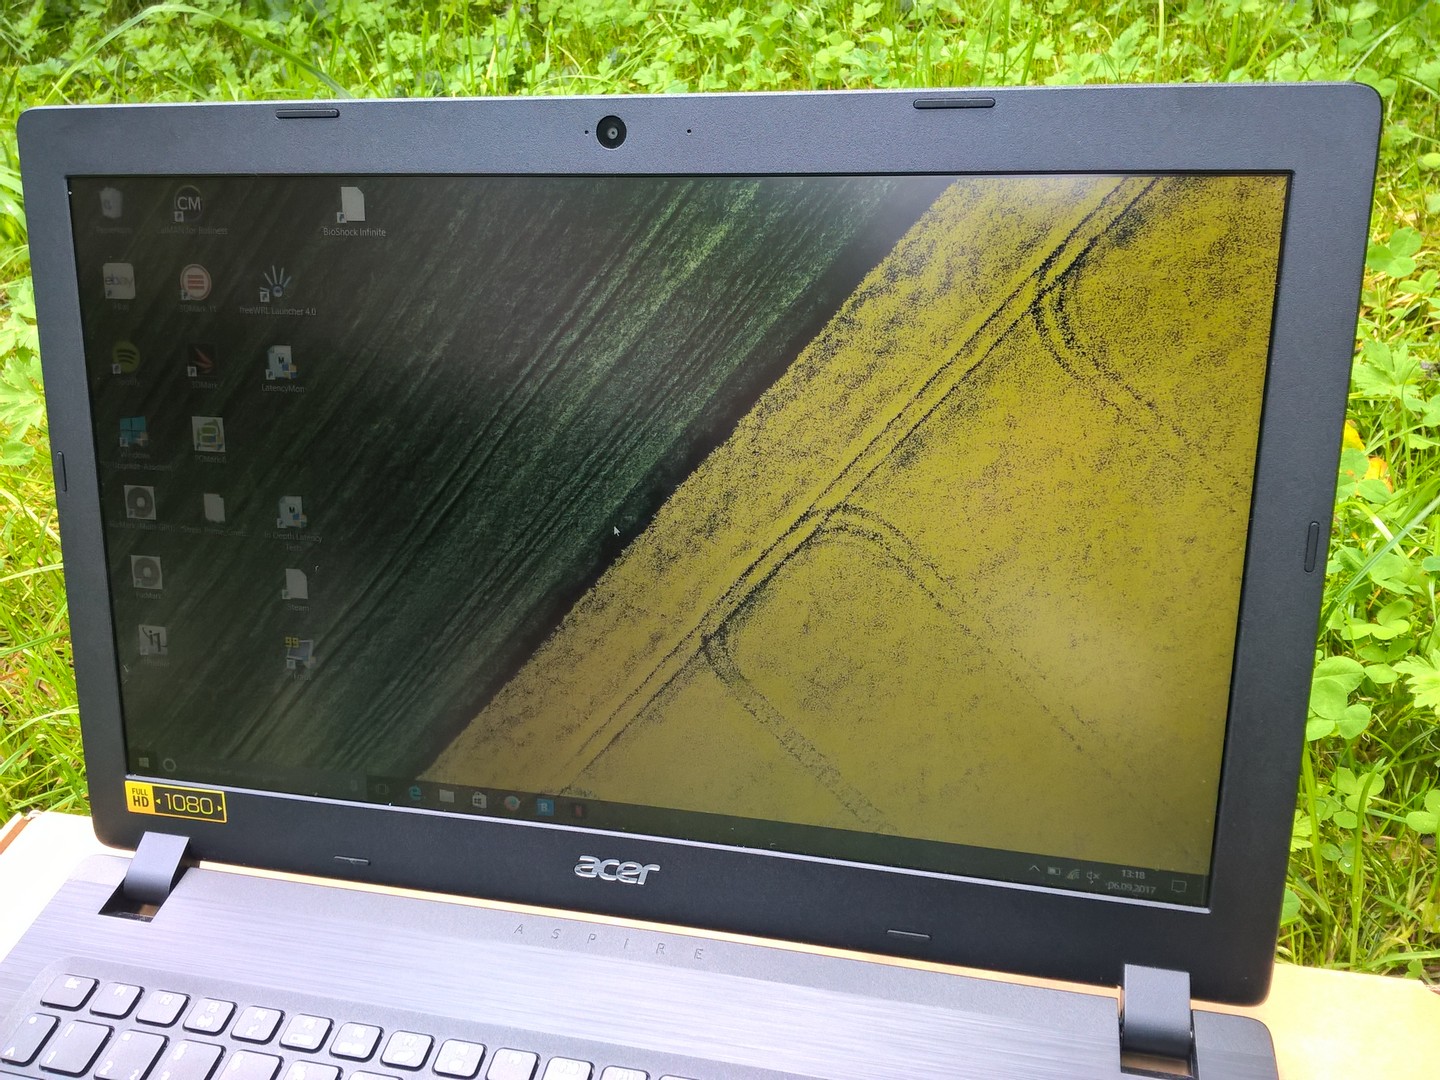
Content can only just be read outdoors. In the shade, it is difficult to work for prolonged periods of time. This only gets worse in direct sunlight and reading the screen becomes very tiring for your eyes.
Display Response Times
| ↔ Response Time Black to White | ||
|---|---|---|
| 12 ms ... rise ↗ and fall ↘ combined | ↗ 8 ms rise | 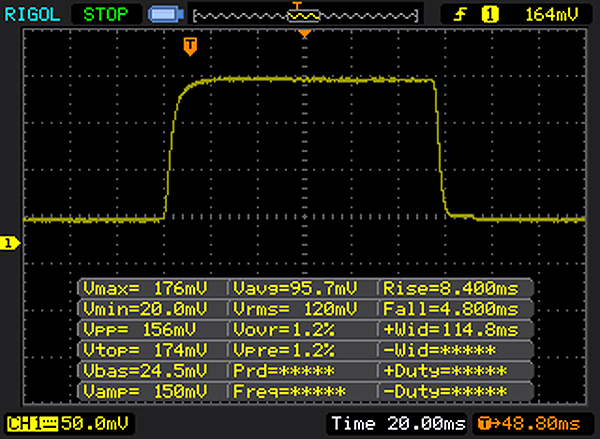 |
| ↘ 4 ms fall | ||
| The screen shows good response rates in our tests, but may be too slow for competitive gamers. In comparison, all tested devices range from 0.1 (minimum) to 240 (maximum) ms. » 32 % of all devices are better. This means that the measured response time is better than the average of all tested devices (19.8 ms). | ||
| ↔ Response Time 50% Grey to 80% Grey | ||
| 44 ms ... rise ↗ and fall ↘ combined | ↗ 22 ms rise | 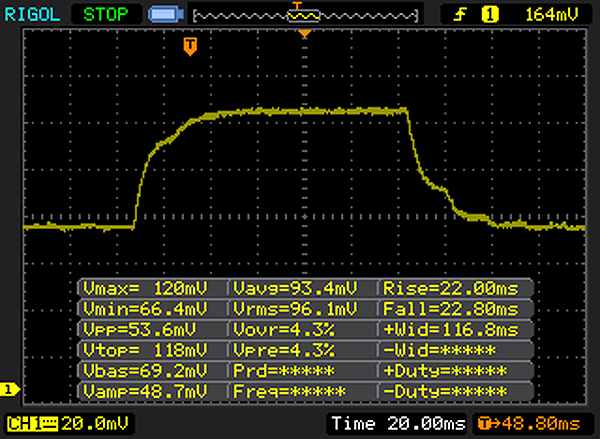 |
| ↘ 22 ms fall | ||
| The screen shows slow response rates in our tests and will be unsatisfactory for gamers. In comparison, all tested devices range from 0.165 (minimum) to 636 (maximum) ms. » 73 % of all devices are better. This means that the measured response time is worse than the average of all tested devices (31 ms). | ||
Screen Flickering / PWM (Pulse-Width Modulation)
| Screen flickering / PWM not detected | ||
In comparison: 52 % of all tested devices do not use PWM to dim the display. If PWM was detected, an average of 7753 (minimum: 5 - maximum: 343500) Hz was measured. | ||

Content begins to be unstable from a viewing angle of 45 degrees. How unstable it is depends on where you are looking from. The viewing angle is more stable from the left and right than it is from the top and below. Users who look at the screen directly from the front have no problems.
Performance
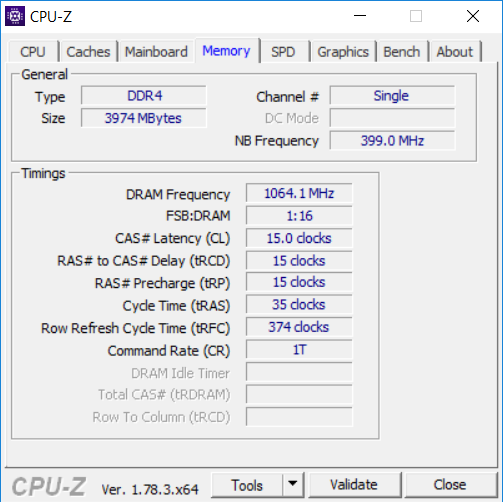
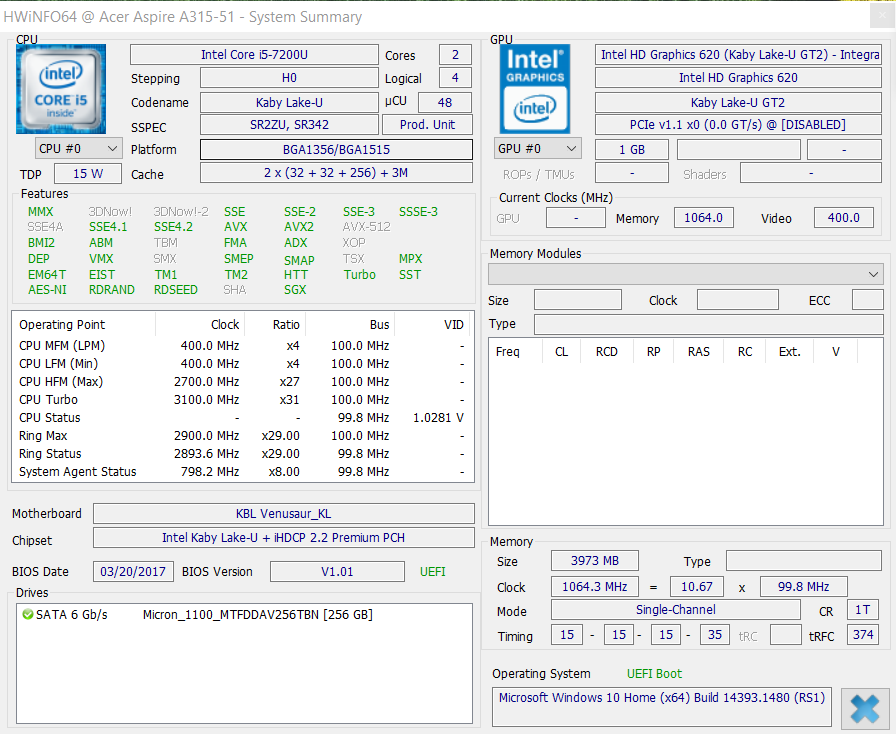
Our test unit is equipped with an Intel Core i5-7200U CPU that clocks at up to 3.1 GHz. Combined with the integrated HD Graphics 620 and 4 GB of RAM, the Aspire 3 can even handle more demanding activities (in this configuration).
The Core i5 CPU is the fastest Intel processor the Aspire 3 is currently available with. Other models have various processors all the way down to Intel's Celeron N3450. The size of the RAM varies as well, as does the storage capacity. Acer also offers the Aspire 3 with two AMD processors - the AMD A6-9220 and the AMD A9-9420.
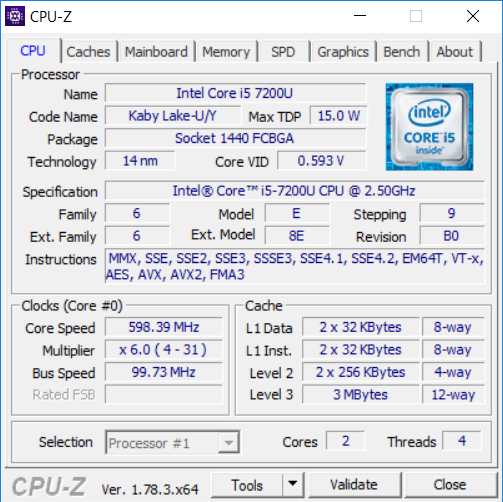
Processor
The Intel Core i5-7200U CPU is a fast and energy-efficient processor based on Kaby Lake architecture. It supports H.265/HEVC Main10 profile in hardware with 10 bit colors as well as Google's VP9 codec. For more information about this CPU, please click here.
The Aspire 3 kept up a constant performance during the entire testing period of our Cinebench R15 benchmark. We did not notice a drop in performance on battery. The comparison devices that are also equipped with the i5-7200 CPU all did a little better than the Aspire 3. The difference was particularly striking in single-core mode: Here, the competition was faster by almost 20%. The difference went down to 3 to 4% in the multi-core test.
System Performance
The results of the PCMark 3 benchmark place the Aspire 3 right in between the other comparison devices. Its performance is as expected and subjectively, our test unit worked quickly and smoothly. Programs started up quickly and we felt no limitations during everyday use.
You can find out how comparable devices with similar configurations fare in our benchmark database.
| PCMark 8 | |
| Home Score Accelerated v2 | |
| Fujitsu Lifebook A557 | |
| Lenovo ThinkPad E570-20H6S00000 | |
| Dell Latitude 5580 | |
| Acer Aspire 3 A315-51-55E4 | |
| HP Pavilion 14-al103ng | |
| Work Score Accelerated v2 | |
| Fujitsu Lifebook A557 | |
| Lenovo ThinkPad E570-20H6S00000 | |
| Acer Aspire 3 A315-51-55E4 | |
| Dell Latitude 5580 | |
| PCMark 8 Home Score Accelerated v2 | 3295 points | |
| PCMark 8 Work Score Accelerated v2 | 4541 points | |
Help | ||
Storage Devices
Acer has equipped the Aspire 3 with a Micron 1100 SSD. It has 256 GB and offers sufficient space for programs, data and the operating system. If you need more storage space, you can insert an additional drive into the empty drive bay. Acer also offers models with two drives ex-works.
The read and write rates are good, but not quite as good as the results of the Samsung and Toshiba SSDs in our comparison devices. Find out how the Micron 1100 fares compared to other SSDs in our HDD/SSD benchmark list.
| Acer Aspire 3 A315-51-55E4 Micron 1100 MTFDDAV256TBN | Dell Latitude 5580 Seagate ST500LM021-1KJ15 | Fujitsu Lifebook A557 Samsung MZ7TN512HDHP-00000 | Lenovo ThinkPad E570-20H6S00000 Toshiba THNSF5256GPUK | HP Pavilion 14-al103ng Western Digital Scorpio Blue WD5000LPCX-24C6HT0 | |
|---|---|---|---|---|---|
| CrystalDiskMark 3.0 | -90% | 8% | 57% | -91% | |
| Read Seq (MB/s) | 485.8 | 132.3 -73% | 504 4% | 1140 135% | 113.3 -77% |
| Write Seq (MB/s) | 456.1 | 131.1 -71% | 503 10% | 468.1 3% | 110.2 -76% |
| Read 512 (MB/s) | 328 | 27.04 -92% | 393.6 20% | 759 131% | 30.83 -91% |
| Write 512 (MB/s) | 446.8 | 56.6 -87% | 413.6 -7% | 414 -7% | 47.13 -89% |
| Read 4k (MB/s) | 26.95 | 0.459 -98% | 36.98 37% | 34.3 27% | 0.34 -99% |
| Write 4k (MB/s) | 86.7 | 0.812 -99% | 92.1 6% | 123.4 42% | 0.981 -99% |
| Read 4k QD32 (MB/s) | 245.9 | 1.1 -100% | 277.6 13% | 530 116% | 0.72 -100% |
| Write 4k QD32 (MB/s) | 300.2 | 0.828 -100% | 250.6 -17% | 319.2 6% | 1.026 -100% |

Graphics
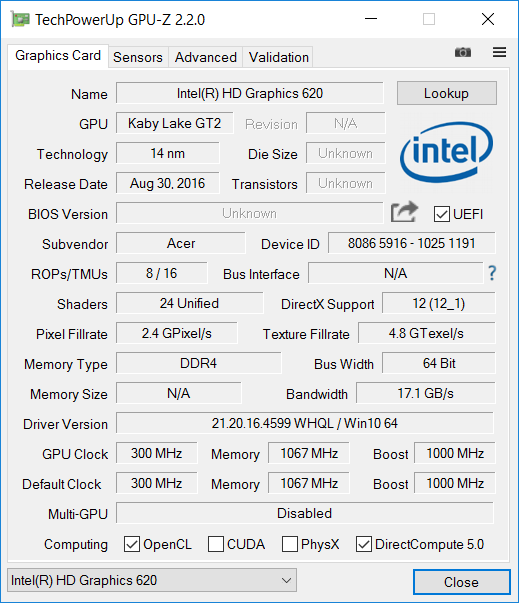
The Acer Aspire 3 has an integrated graphics unit. The HD Graphics 620 is integrated in the i5-7200U CPU and kept up with a dedicated Nvidia GeForce 920M in our tests. For a more detailed comparison, see our benchmark list.
As with the processor performance, the graphics performance was below that of our comparison devices. They were between 10 and 30% better. The test unit could keep up its full performance on battery, but you can notice the missing dual-channel RAM.
| 3DMark 11 - 1280x720 Performance GPU | |
| Lenovo ThinkPad E570-20H6S00000 | |
| Fujitsu Lifebook A557 | |
| HP Pavilion 14-al103ng | |
| Dell Latitude 5580 | |
| Acer Aspire 3 A315-51-55E4 | |
| 3DMark | |
| 1280x720 Cloud Gate Standard Graphics | |
| Lenovo ThinkPad E570-20H6S00000 | |
| Fujitsu Lifebook A557 | |
| Dell Latitude 5580 | |
| Acer Aspire 3 A315-51-55E4 | |
| 1920x1080 Fire Strike Graphics | |
| Lenovo ThinkPad E570-20H6S00000 | |
| Fujitsu Lifebook A557 | |
| Dell Latitude 5580 | |
| Acer Aspire 3 A315-51-55E4 | |
| 3DMark 11 Performance | 1146 points | |
| 3DMark Cloud Gate Standard Score | 5046 points | |
| 3DMark Fire Strike Score | 566 points | |
Help | ||
Gaming Performance
The Aspire 3 is not suitable for PC games. The four-year-old "BioShock Infinite" can only run smoothly on the lowest settings. Performance is not sufficient for modern games. However, you can find a lot of good casual games that run on the Aspire 3 in the Windows Store.
None of our comparison devices do a lot better in this category. Although their performance is a little higher, it is not enough for a better gaming experience. The graphics solution just does not offer enough performance for gaming.
| BioShock Infinite | |
| 1920x1080 Ultra Preset, DX11 (DDOF) | |
| HP Pavilion 14-al103ng | |
| Fujitsu Lifebook A557 | |
| Acer Aspire 3 A315-51-55E4 | |
| 1366x768 High Preset | |
| HP Pavilion 14-al103ng | |
| Fujitsu Lifebook A557 | |
| Acer Aspire 3 A315-51-55E4 | |
| 1366x768 Medium Preset | |
| Dell Latitude 5580 | |
| Fujitsu Lifebook A557 | |
| HP Pavilion 14-al103ng | |
| Acer Aspire 3 A315-51-55E4 | |
| 1280x720 Very Low Preset | |
| Dell Latitude 5580 | |
| HP Pavilion 14-al103ng | |
| Fujitsu Lifebook A557 | |
| Acer Aspire 3 A315-51-55E4 | |
| Thief | |
| 1920x1080 Very High Preset AA:FXAA & High SS AF:8x | |
| Acer Aspire 3 A315-51-55E4 | |
| 1366x768 High Preset AA:FXAA & Low SS AF:4x | |
| Acer Aspire 3 A315-51-55E4 | |
| 1366x768 Normal Preset AA:FX | |
| Acer Aspire 3 A315-51-55E4 | |
| 1024x768 Very Low Preset | |
| Acer Aspire 3 A315-51-55E4 | |
| Rise of the Tomb Raider | |
| 1920x1080 Very High Preset AA:FX AF:16x | |
| Acer Aspire 3 A315-51-55E4 | |
| 1920x1080 High Preset AA:FX AF:4x | |
| Fujitsu Lifebook A557 | |
| Acer Aspire 3 A315-51-55E4 | |
| 1366x768 Medium Preset AF:2x | |
| Dell Latitude 5580 | |
| Fujitsu Lifebook A557 | |
| Acer Aspire 3 A315-51-55E4 | |
| 1024x768 Lowest Preset | |
| Dell Latitude 5580 | |
| Acer Aspire 3 A315-51-55E4 | |
| Fujitsu Lifebook A557 | |
| low | med. | high | ultra | |
|---|---|---|---|---|
| BioShock Infinite (2013) | 34.63 | 20.7 | 16.76 | 5.46 |
| Thief (2014) | 16.6 | 9.9 | 8.3 | 3.8 |
| Rise of the Tomb Raider (2016) | 15.84 | 8.94 | 4.64 | 3.61 |
Emissions
System Noise
The cooling fan of the Aspire 3 is very quiet. We hardly heard it during the entire testing period. It did become a little louder during the benchmarks or when we had several programs running simultaneously, but it was never bothersome. The volume measurement confirmed that the cooling fan drowned out surrounding noises only very slightly when under load.
Noise level
| Idle |
| 30.2 / 30.2 / 31.2 dB(A) |
| HDD |
| 0 dB(A) |
| Load |
| 34.5 / 34.5 dB(A) |
 | ||
30 dB silent 40 dB(A) audible 50 dB(A) loud |
||
min: | ||
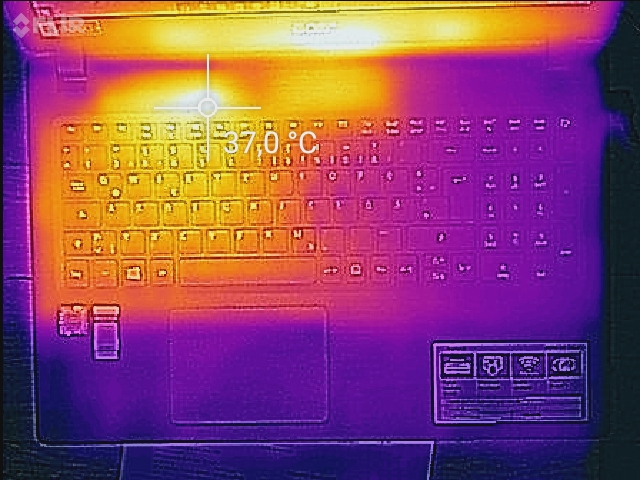
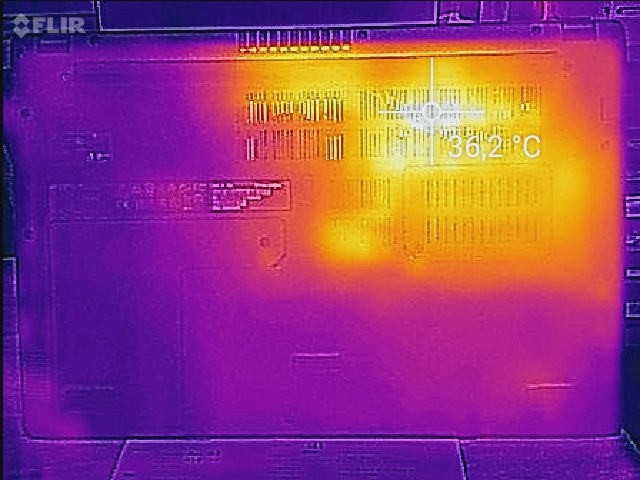
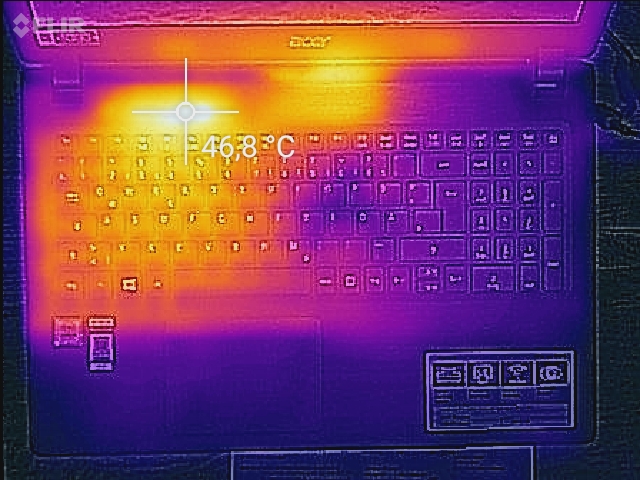
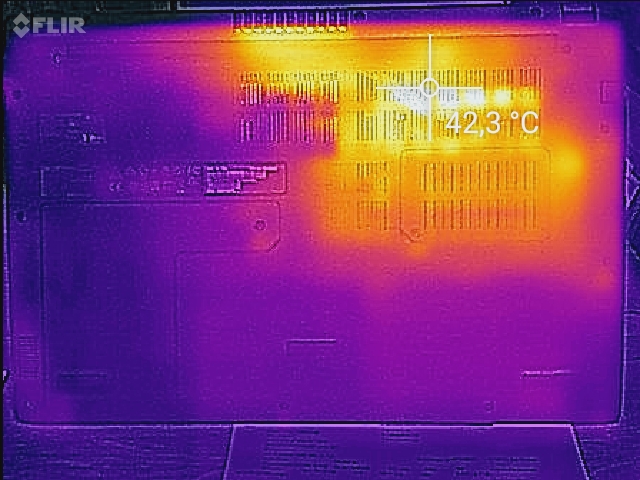
Temperature
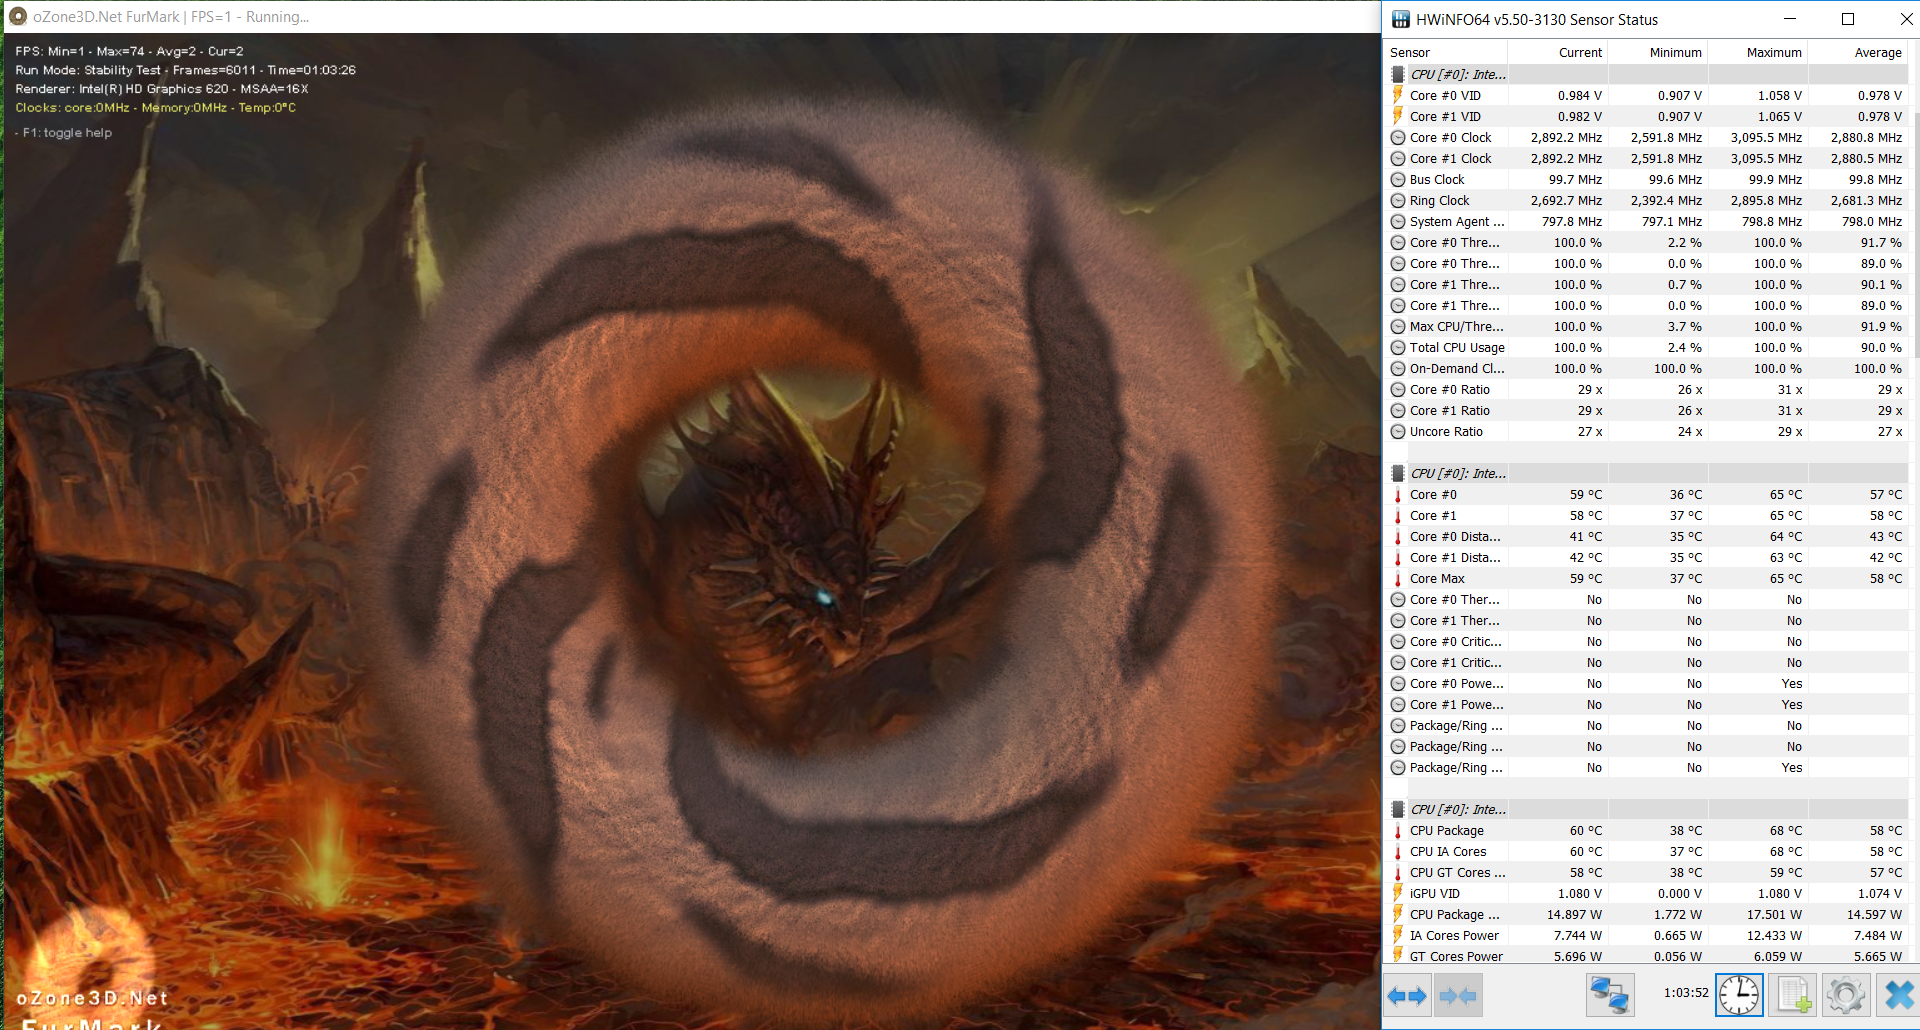
The Aspire 3 managed to keep up its boost clock rate of 3.1 GHz for about 15 minutes during our stress test. After that, the frequency dropped to 2.5 GHz, the base clock rate of the CPU. This frequency was then constant for the remainder of the test, which was about 45 minutes. The processor cores did not heat up above 65 °C (~149°C). We ran a 3DMark benchmark right after the stress test and the results were only minimally lower than when we did the test before. There should be no limitations in everyday use.
(+) The maximum temperature on the upper side is 37.7 °C / 100 F, compared to the average of 34.3 °C / 94 F, ranging from 21.2 to 62.5 °C for the class Office.
(+) The bottom heats up to a maximum of 35.4 °C / 96 F, compared to the average of 36.8 °C / 98 F
(+) In idle usage, the average temperature for the upper side is 24.9 °C / 77 F, compared to the device average of 29.5 °C / 85 F.
(+) The palmrests and touchpad are cooler than skin temperature with a maximum of 23.2 °C / 73.8 F and are therefore cool to the touch.
(+) The average temperature of the palmrest area of similar devices was 27.5 °C / 81.5 F (+4.3 °C / 7.7 F).
Speakers
The Aspire 3 lacks bass in low areas and the highs are not very clear. Nonetheless, our test unit's sound is sufficient for Skype, watching films and listening to music. But, do not have too high expectations. The sound is average compared to our test unit's direct competitors.
There is a combined audio jack with which you can connect external speakers, headphones or a microphone.
Acer Aspire 3 A315-51-55E4 audio analysis
(±) | speaker loudness is average but good (72 dB)
Bass 100 - 315 Hz
(-) | nearly no bass - on average 23.3% lower than median
(±) | linearity of bass is average (9.3% delta to prev. frequency)
Mids 400 - 2000 Hz
(±) | higher mids - on average 7.4% higher than median
(±) | linearity of mids is average (13.3% delta to prev. frequency)
Highs 2 - 16 kHz
(+) | balanced highs - only 3.6% away from median
(±) | linearity of highs is average (7.5% delta to prev. frequency)
Overall 100 - 16.000 Hz
(±) | linearity of overall sound is average (27.9% difference to median)
Compared to same class
» 87% of all tested devices in this class were better, 3% similar, 10% worse
» The best had a delta of 7%, average was 21%, worst was 53%
Compared to all devices tested
» 85% of all tested devices were better, 3% similar, 12% worse
» The best had a delta of 4%, average was 23%, worst was 134%
Apple MacBook 12 (Early 2016) 1.1 GHz audio analysis
(+) | speakers can play relatively loud (83.6 dB)
Bass 100 - 315 Hz
(±) | reduced bass - on average 11.3% lower than median
(±) | linearity of bass is average (14.2% delta to prev. frequency)
Mids 400 - 2000 Hz
(+) | balanced mids - only 2.4% away from median
(+) | mids are linear (5.5% delta to prev. frequency)
Highs 2 - 16 kHz
(+) | balanced highs - only 2% away from median
(+) | highs are linear (4.5% delta to prev. frequency)
Overall 100 - 16.000 Hz
(+) | overall sound is linear (10.2% difference to median)
Compared to same class
» 7% of all tested devices in this class were better, 2% similar, 91% worse
» The best had a delta of 5%, average was 18%, worst was 53%
Compared to all devices tested
» 5% of all tested devices were better, 1% similar, 94% worse
» The best had a delta of 4%, average was 23%, worst was 134%
Lenovo ThinkPad E570-20H6S00000 audio analysis
(±) | speaker loudness is average but good (80.7 dB)
Bass 100 - 315 Hz
(-) | nearly no bass - on average 16.8% lower than median
(-) | bass is not linear (16.4% delta to prev. frequency)
Mids 400 - 2000 Hz
(±) | higher mids - on average 5.1% higher than median
(±) | linearity of mids is average (9.5% delta to prev. frequency)
Highs 2 - 16 kHz
(+) | balanced highs - only 2.7% away from median
(+) | highs are linear (6.5% delta to prev. frequency)
Overall 100 - 16.000 Hz
(±) | linearity of overall sound is average (19.6% difference to median)
Compared to same class
» 64% of all tested devices in this class were better, 7% similar, 29% worse
» The best had a delta of 5%, average was 17%, worst was 45%
Compared to all devices tested
» 49% of all tested devices were better, 7% similar, 44% worse
» The best had a delta of 4%, average was 23%, worst was 134%
HP Pavilion 14-al103ng audio analysis
(±) | speaker loudness is average but good (72 dB)
Bass 100 - 315 Hz
(-) | nearly no bass - on average 29.2% lower than median
(±) | linearity of bass is average (7.9% delta to prev. frequency)
Mids 400 - 2000 Hz
(+) | balanced mids - only 2.1% away from median
(+) | mids are linear (6.2% delta to prev. frequency)
Highs 2 - 16 kHz
(±) | higher highs - on average 5.3% higher than median
(±) | linearity of highs is average (7.9% delta to prev. frequency)
Overall 100 - 16.000 Hz
(±) | linearity of overall sound is average (24.5% difference to median)
Compared to same class
» 71% of all tested devices in this class were better, 8% similar, 21% worse
» The best had a delta of 7%, average was 21%, worst was 53%
Compared to all devices tested
» 74% of all tested devices were better, 6% similar, 20% worse
» The best had a delta of 4%, average was 23%, worst was 134%
Fujitsu Lifebook A557 audio analysis
(-) | not very loud speakers (67 dB)
Bass 100 - 315 Hz
(-) | nearly no bass - on average 26.8% lower than median
(+) | bass is linear (6.2% delta to prev. frequency)
Mids 400 - 2000 Hz
(±) | higher mids - on average 6.8% higher than median
(-) | mids are not linear (15% delta to prev. frequency)
Highs 2 - 16 kHz
(+) | balanced highs - only 3.5% away from median
(±) | linearity of highs is average (8.7% delta to prev. frequency)
Overall 100 - 16.000 Hz
(-) | overall sound is not linear (33.6% difference to median)
Compared to same class
» 96% of all tested devices in this class were better, 2% similar, 3% worse
» The best had a delta of 7%, average was 21%, worst was 53%
Compared to all devices tested
» 92% of all tested devices were better, 1% similar, 6% worse
» The best had a delta of 4%, average was 23%, worst was 134%
Dell Latitude 5580 audio analysis
(-) | not very loud speakers (70.2 dB)
Bass 100 - 315 Hz
(±) | reduced bass - on average 12.5% lower than median
(±) | linearity of bass is average (10.4% delta to prev. frequency)
Mids 400 - 2000 Hz
(+) | balanced mids - only 4.6% away from median
(±) | linearity of mids is average (8.9% delta to prev. frequency)
Highs 2 - 16 kHz
(±) | higher highs - on average 5.1% higher than median
(±) | linearity of highs is average (9.9% delta to prev. frequency)
Overall 100 - 16.000 Hz
(±) | linearity of overall sound is average (24.6% difference to median)
Compared to same class
» 73% of all tested devices in this class were better, 7% similar, 21% worse
» The best had a delta of 7%, average was 21%, worst was 53%
Compared to all devices tested
» 75% of all tested devices were better, 5% similar, 20% worse
» The best had a delta of 4%, average was 23%, worst was 134%
Frequency diagram in comparison (check boxes can be turned on/off!)
Energy Management
Power Supply
The Aspire 3 consumed just under 9 watts while idling and about 38 watts under load. These results are similar to its comparison devices. The supplied 45-watt power supply is definitely large enough for the device's needs.
| Off / Standby | |
| Idle | |
| Load |
|
Key:
min: | |
| Acer Aspire 3 A315-51-55E4 i5-7200U, HD Graphics 620, Micron 1100 MTFDDAV256TBN, TN LED, 1920x1080, 15.6" | Dell Latitude 5580 i5-7200U, HD Graphics 620, Seagate ST500LM021-1KJ15, TN LED, 1366x768, 15.6" | Fujitsu Lifebook A557 i5-7200U, HD Graphics 620, Samsung MZ7TN512HDHP-00000, a-Si TFT-LCD , LCM, 1920x1080, 15.6" | Lenovo ThinkPad E570-20H6S00000 i5-7200U, GeForce GTX 950M, Toshiba THNSF5256GPUK, IPS LED, 1920x1080, 15.6" | HP Pavilion 14-al103ng i5-7200U, HD Graphics 620, Western Digital Scorpio Blue WD5000LPCX-24C6HT0, IPS, 1920x1080, 14" | |
|---|---|---|---|---|---|
| Power Consumption | 7% | 10% | -32% | -10% | |
| Idle Minimum * (Watt) | 4.1 | 3.5 15% | 2.9 29% | 2.8 32% | 5.5 -34% |
| Idle Average * (Watt) | 7.5 | 6 20% | 6.4 15% | 6.3 16% | 8.2 -9% |
| Idle Maximum * (Watt) | 8.9 | 7.3 18% | 6.9 22% | 6.9 22% | 8.9 -0% |
| Load Average * (Watt) | 28.1 | 30.8 -10% | 31.8 -13% | 51.6 -84% | 29.1 -4% |
| Load Maximum * (Watt) | 28.3 | 31 -10% | 29 -2% | 69.7 -146% | 29.4 -4% |
* ... smaller is better
Battery Runtime
The maximum battery runtime that we measured during our test was 14:50 h. For this measurement, we turned on the Windows power-saving mode, set the display brightness to the lowest level and deactivated all communication modules. Naturally, this is not a practically-oriented test, but it shows what our device can do.
Our Wi-Fi test is a lot more realistic. The Aspire 3 can run for about 5:50 h with a brightness of about 150 cd/m2 while surfing via Wi-Fi. This is not quite what the manufacturer promised (6:30h), but this runtime should be reachable at the lowest brightness level. Compared to the other devices, the Aspire 3 has the shortest battery runtime.
| Acer Aspire 3 A315-51-55E4 i5-7200U, HD Graphics 620, 37 Wh | Dell Latitude 5580 i5-7200U, HD Graphics 620, 68 Wh | Fujitsu Lifebook A557 i5-7200U, HD Graphics 620, 49 Wh | Lenovo ThinkPad E570-20H6S00000 i5-7200U, GeForce GTX 950M, 41 Wh | |
|---|---|---|---|---|
| Battery runtime | 62% | 34% | 31% | |
| Reader / Idle (h) | 14.3 | 18.4 29% | 16.5 15% | 14.7 3% |
| WiFi v1.3 (h) | 5.8 | 11.6 100% | 8.8 52% | 7.7 33% |
| Load (h) | 1.4 | 2.2 57% | 1.9 36% | 2.2 57% |
| H.264 (h) | 7.6 |
Verdict
Pros
Cons
Acer's Aspire 3 is a good entry-level device that can manage more than just simple processes in everyday use and knows how to handle multi-tasking. It can even be used for some simple image processing, but apart from that you must not expect too much from the notebook. We liked the upgrade possibilities that the maintenance hatches for storage device and RAM provide, but the battery should not "fall" out of the case when you remove the bottom cover. This can quickly create damages on or within the device.
The Aspire 3 is a good entry-level device that is suited to most everyday activities.
The Aspire 3 is a suitable candidate for anyone who is looking for an affordable 15-inch notebook with sufficient performance and upgrade potential. If you will use your device a lot away from a power supply or when travelling, you might have some problems with the short battery runtime.
Acer Aspire 3 A315-51-55E4
- 09/06/2017 v6 (old)
Mike Wobker
Price comparison
