Dell Latitude 5580 (i5-7200U, HD) Laptop Review
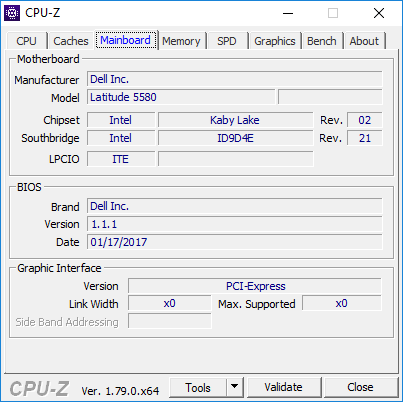
After two generations of no major design changes between the Latitude E5550 and E5570, the Latitude 5580 comes in with rearranged ports and a marginally lighter chassis than its predecessors. Internals have been revised to support both Kaby Lake 15 W U-class and 45 W HQ-class CPU options, which is uncommon on consumer designs. Consequently, prices for the 5580 can vary wildly from as low as $770 USD with the Core i3-7100U, 500 GB HDD, 768p display and 4 GB DDR4 RAM to as high as $1750 USD with the Core i7-7820HQ, 256 GB SSD, 8 GB DDR4 RAM, 1080p display, and all extras including NFC, Smart Card, WWAN, fingerprint reader, and Thunderbolt 3.
We recommend checking out our existing reviews on the Latitude E5550 and E5570 for more information on the series since the 5580 shares many similarities with its predecessors. Direct competitors in the 15-inch business notebook space are plentiful with the most notable being the Lenovo T560/T570, ThinkPad L560/L570, HP EliteBook 850 G3/850 G4, ProBook 650 G2/650 G3, and Acer TravelMate P259/P658 series.
Case
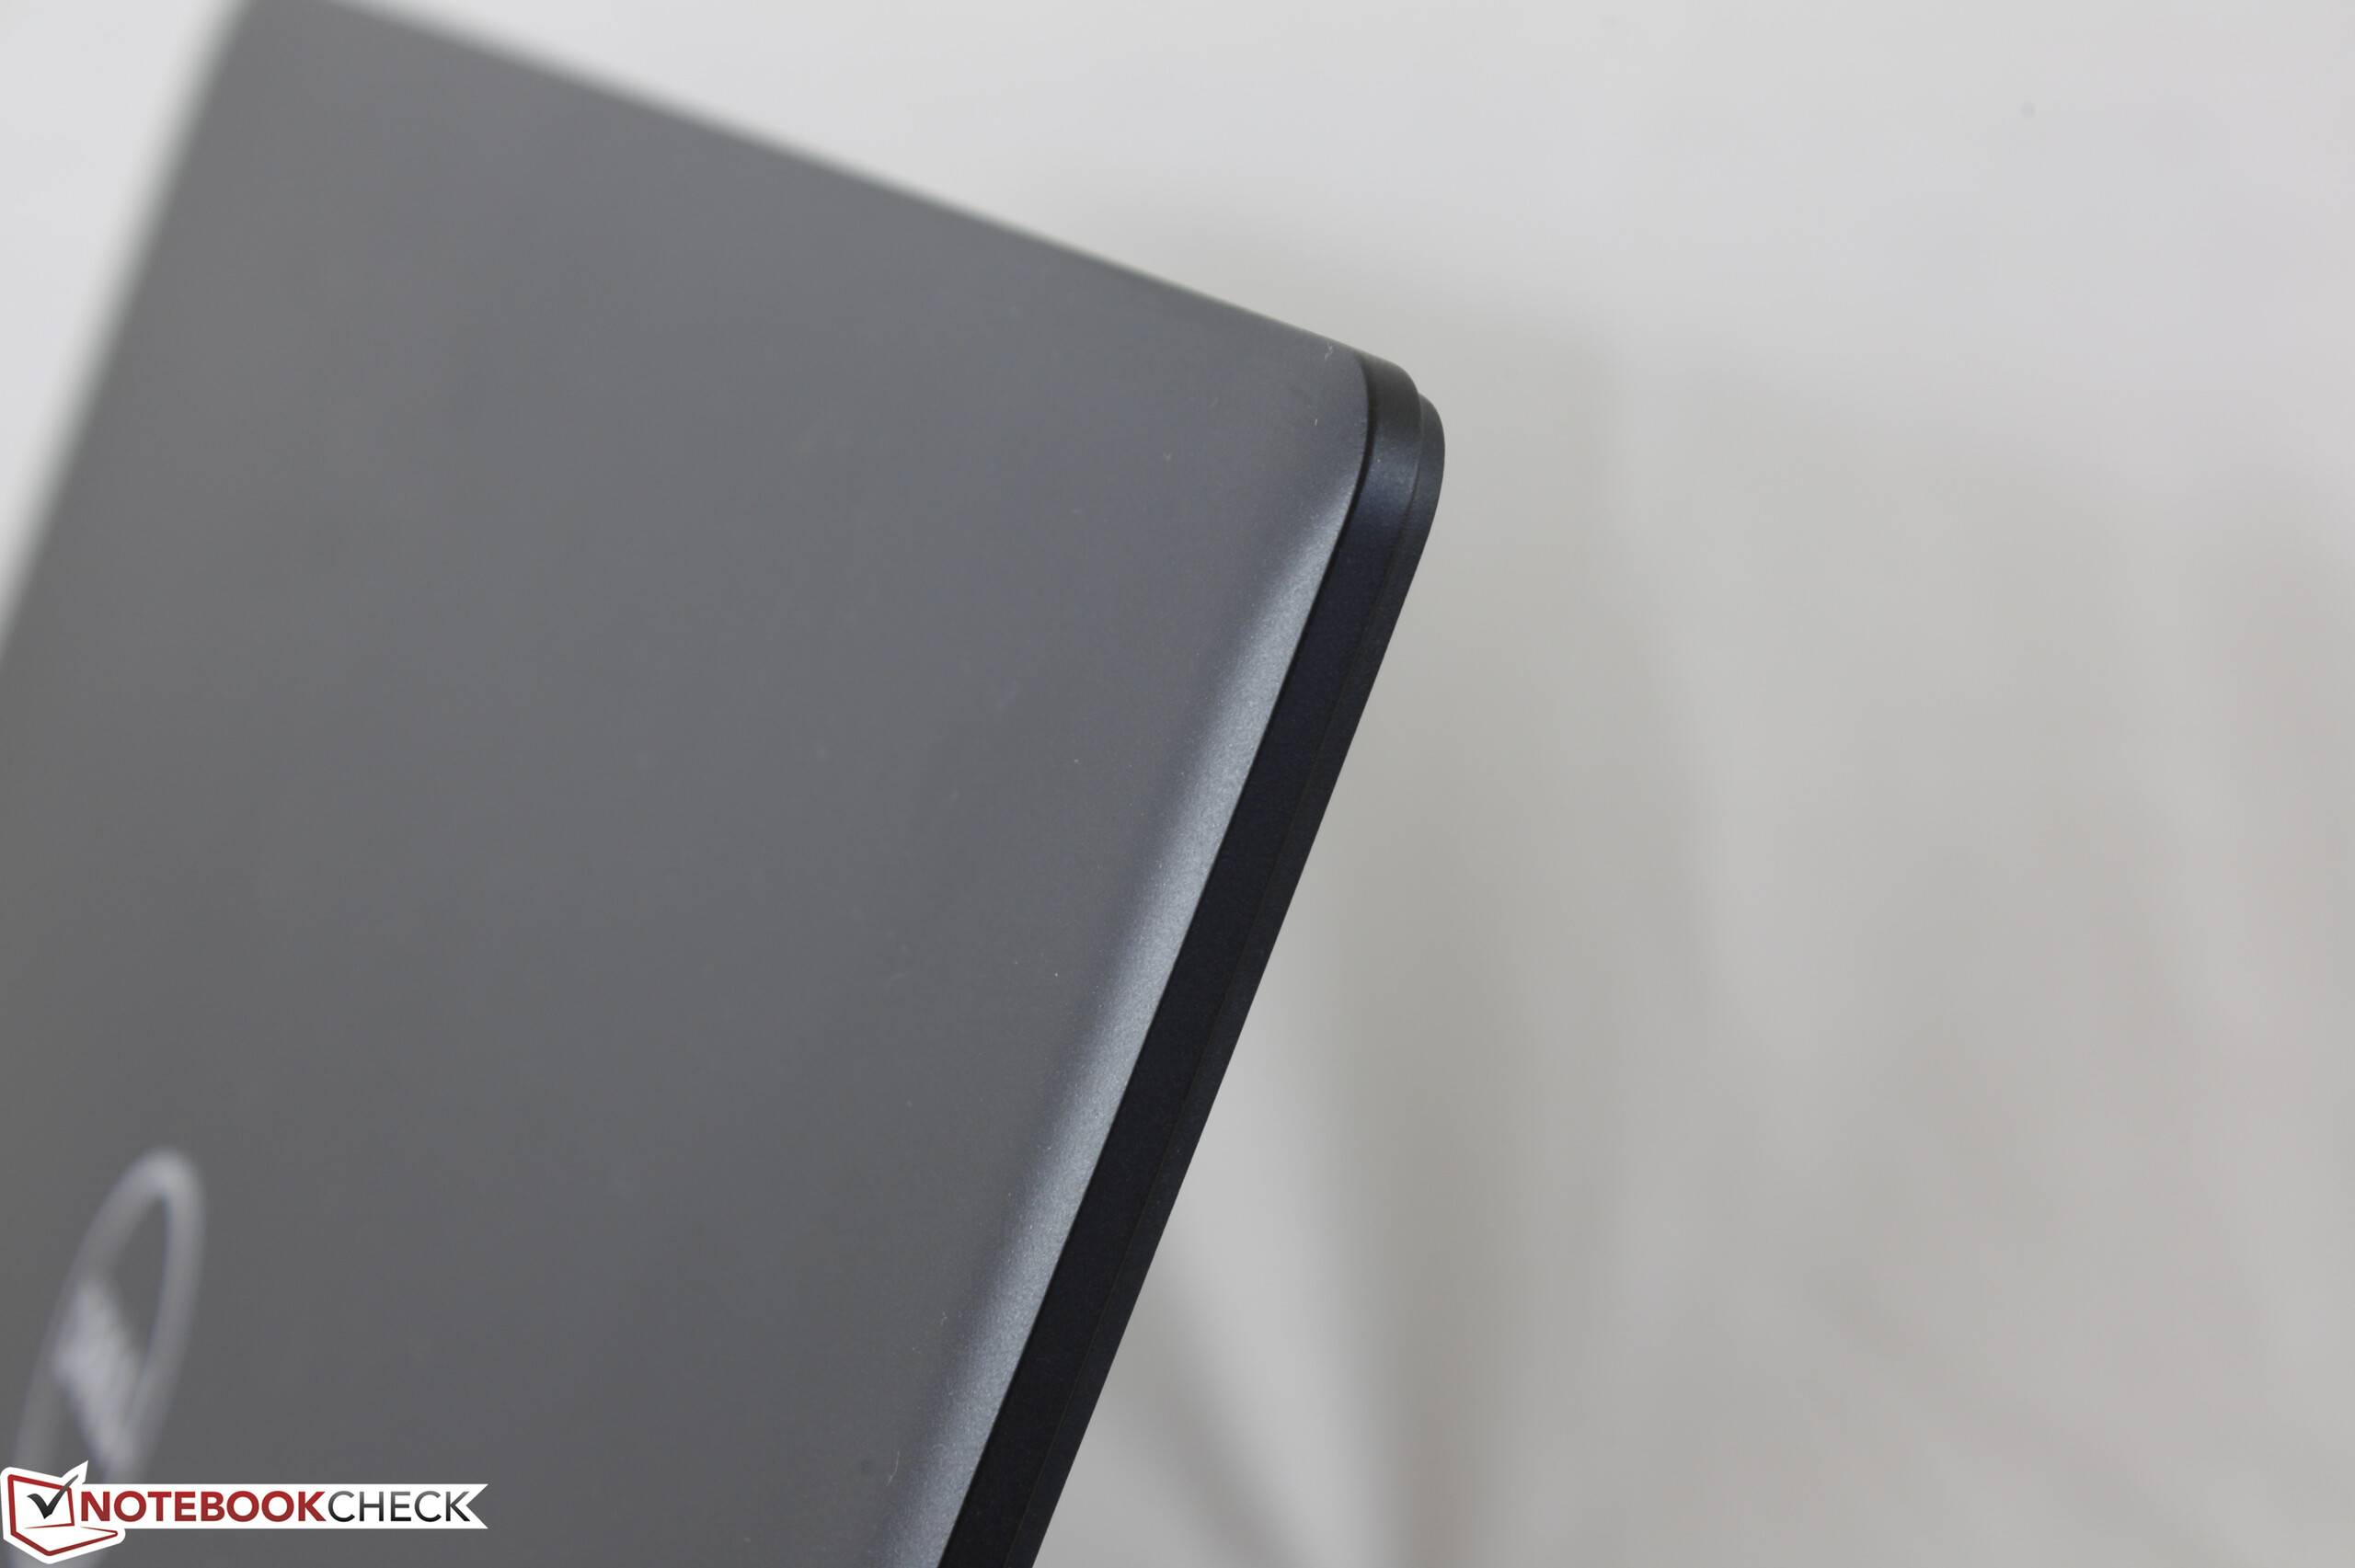
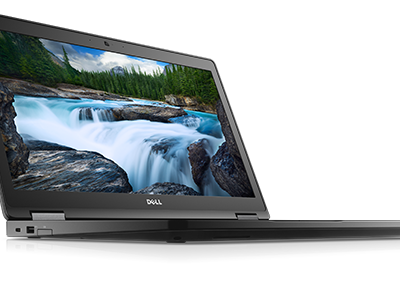
Beyond some internal changes, the outward appearance of the 5580 remains faithful to its predecessors. Users can expect the same matte black chassis tested against MIL STD 810G standards for resistance to certain levels of shock, dust, and temperature ranges.
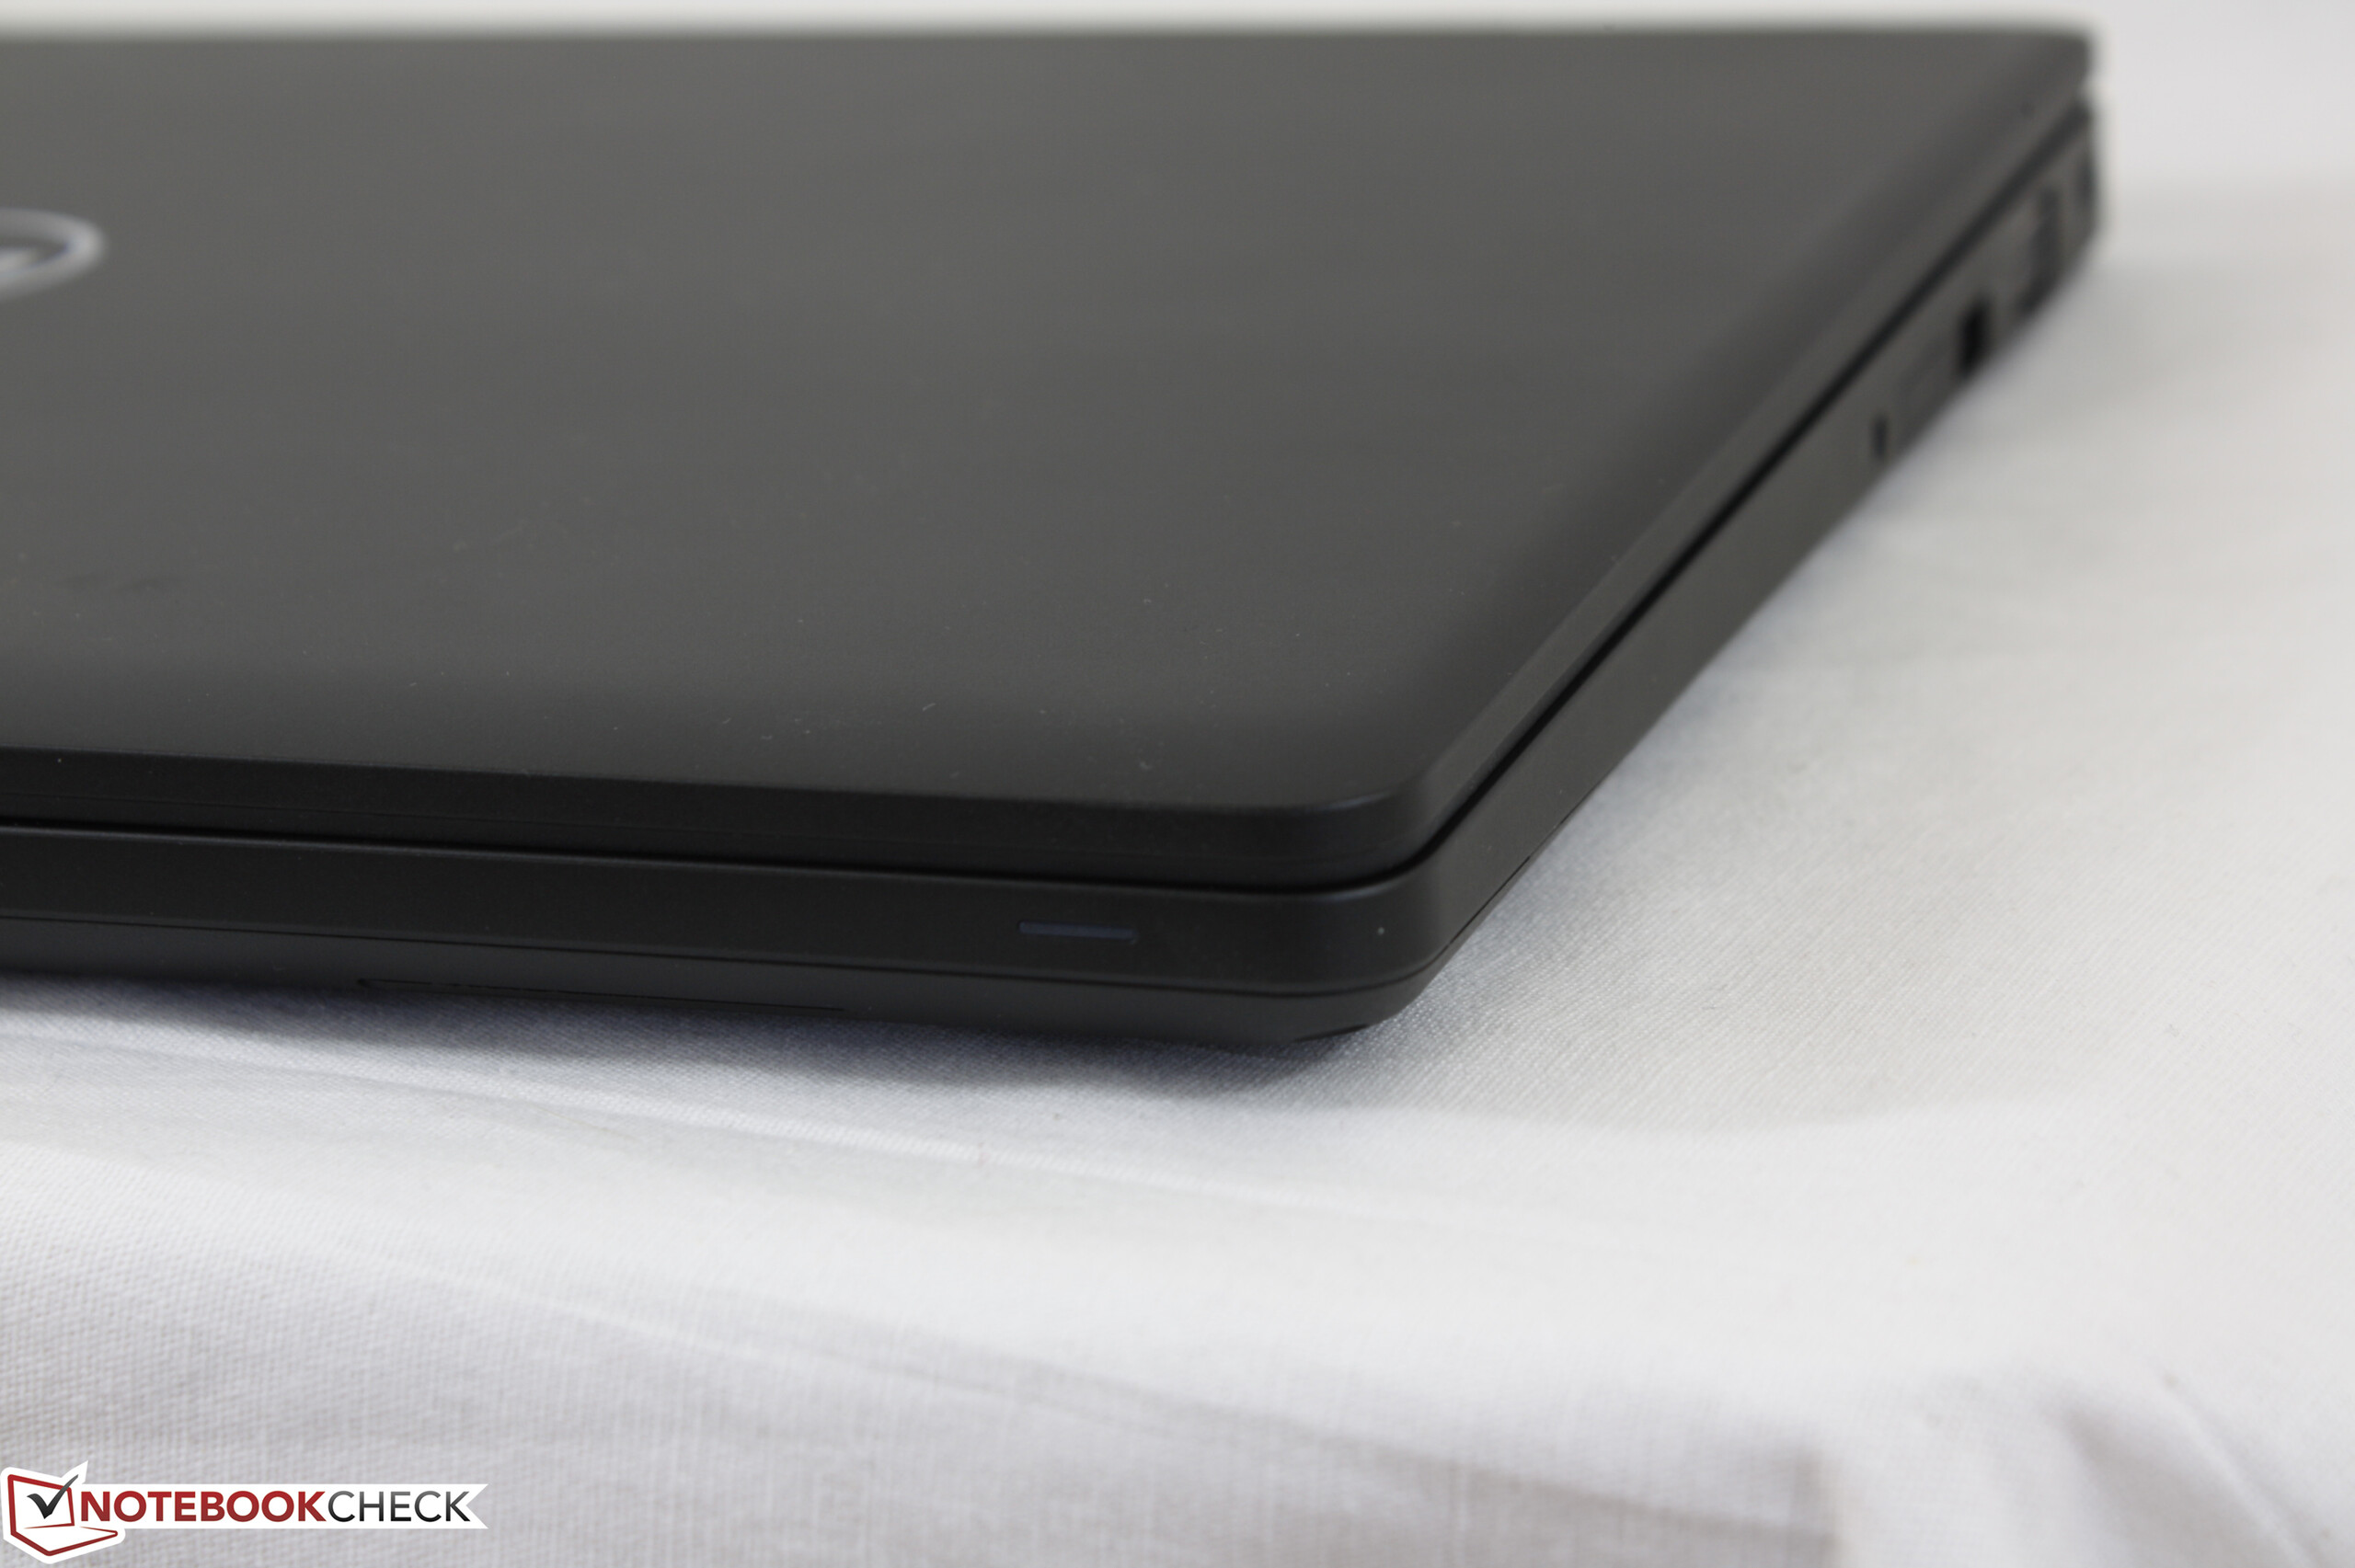
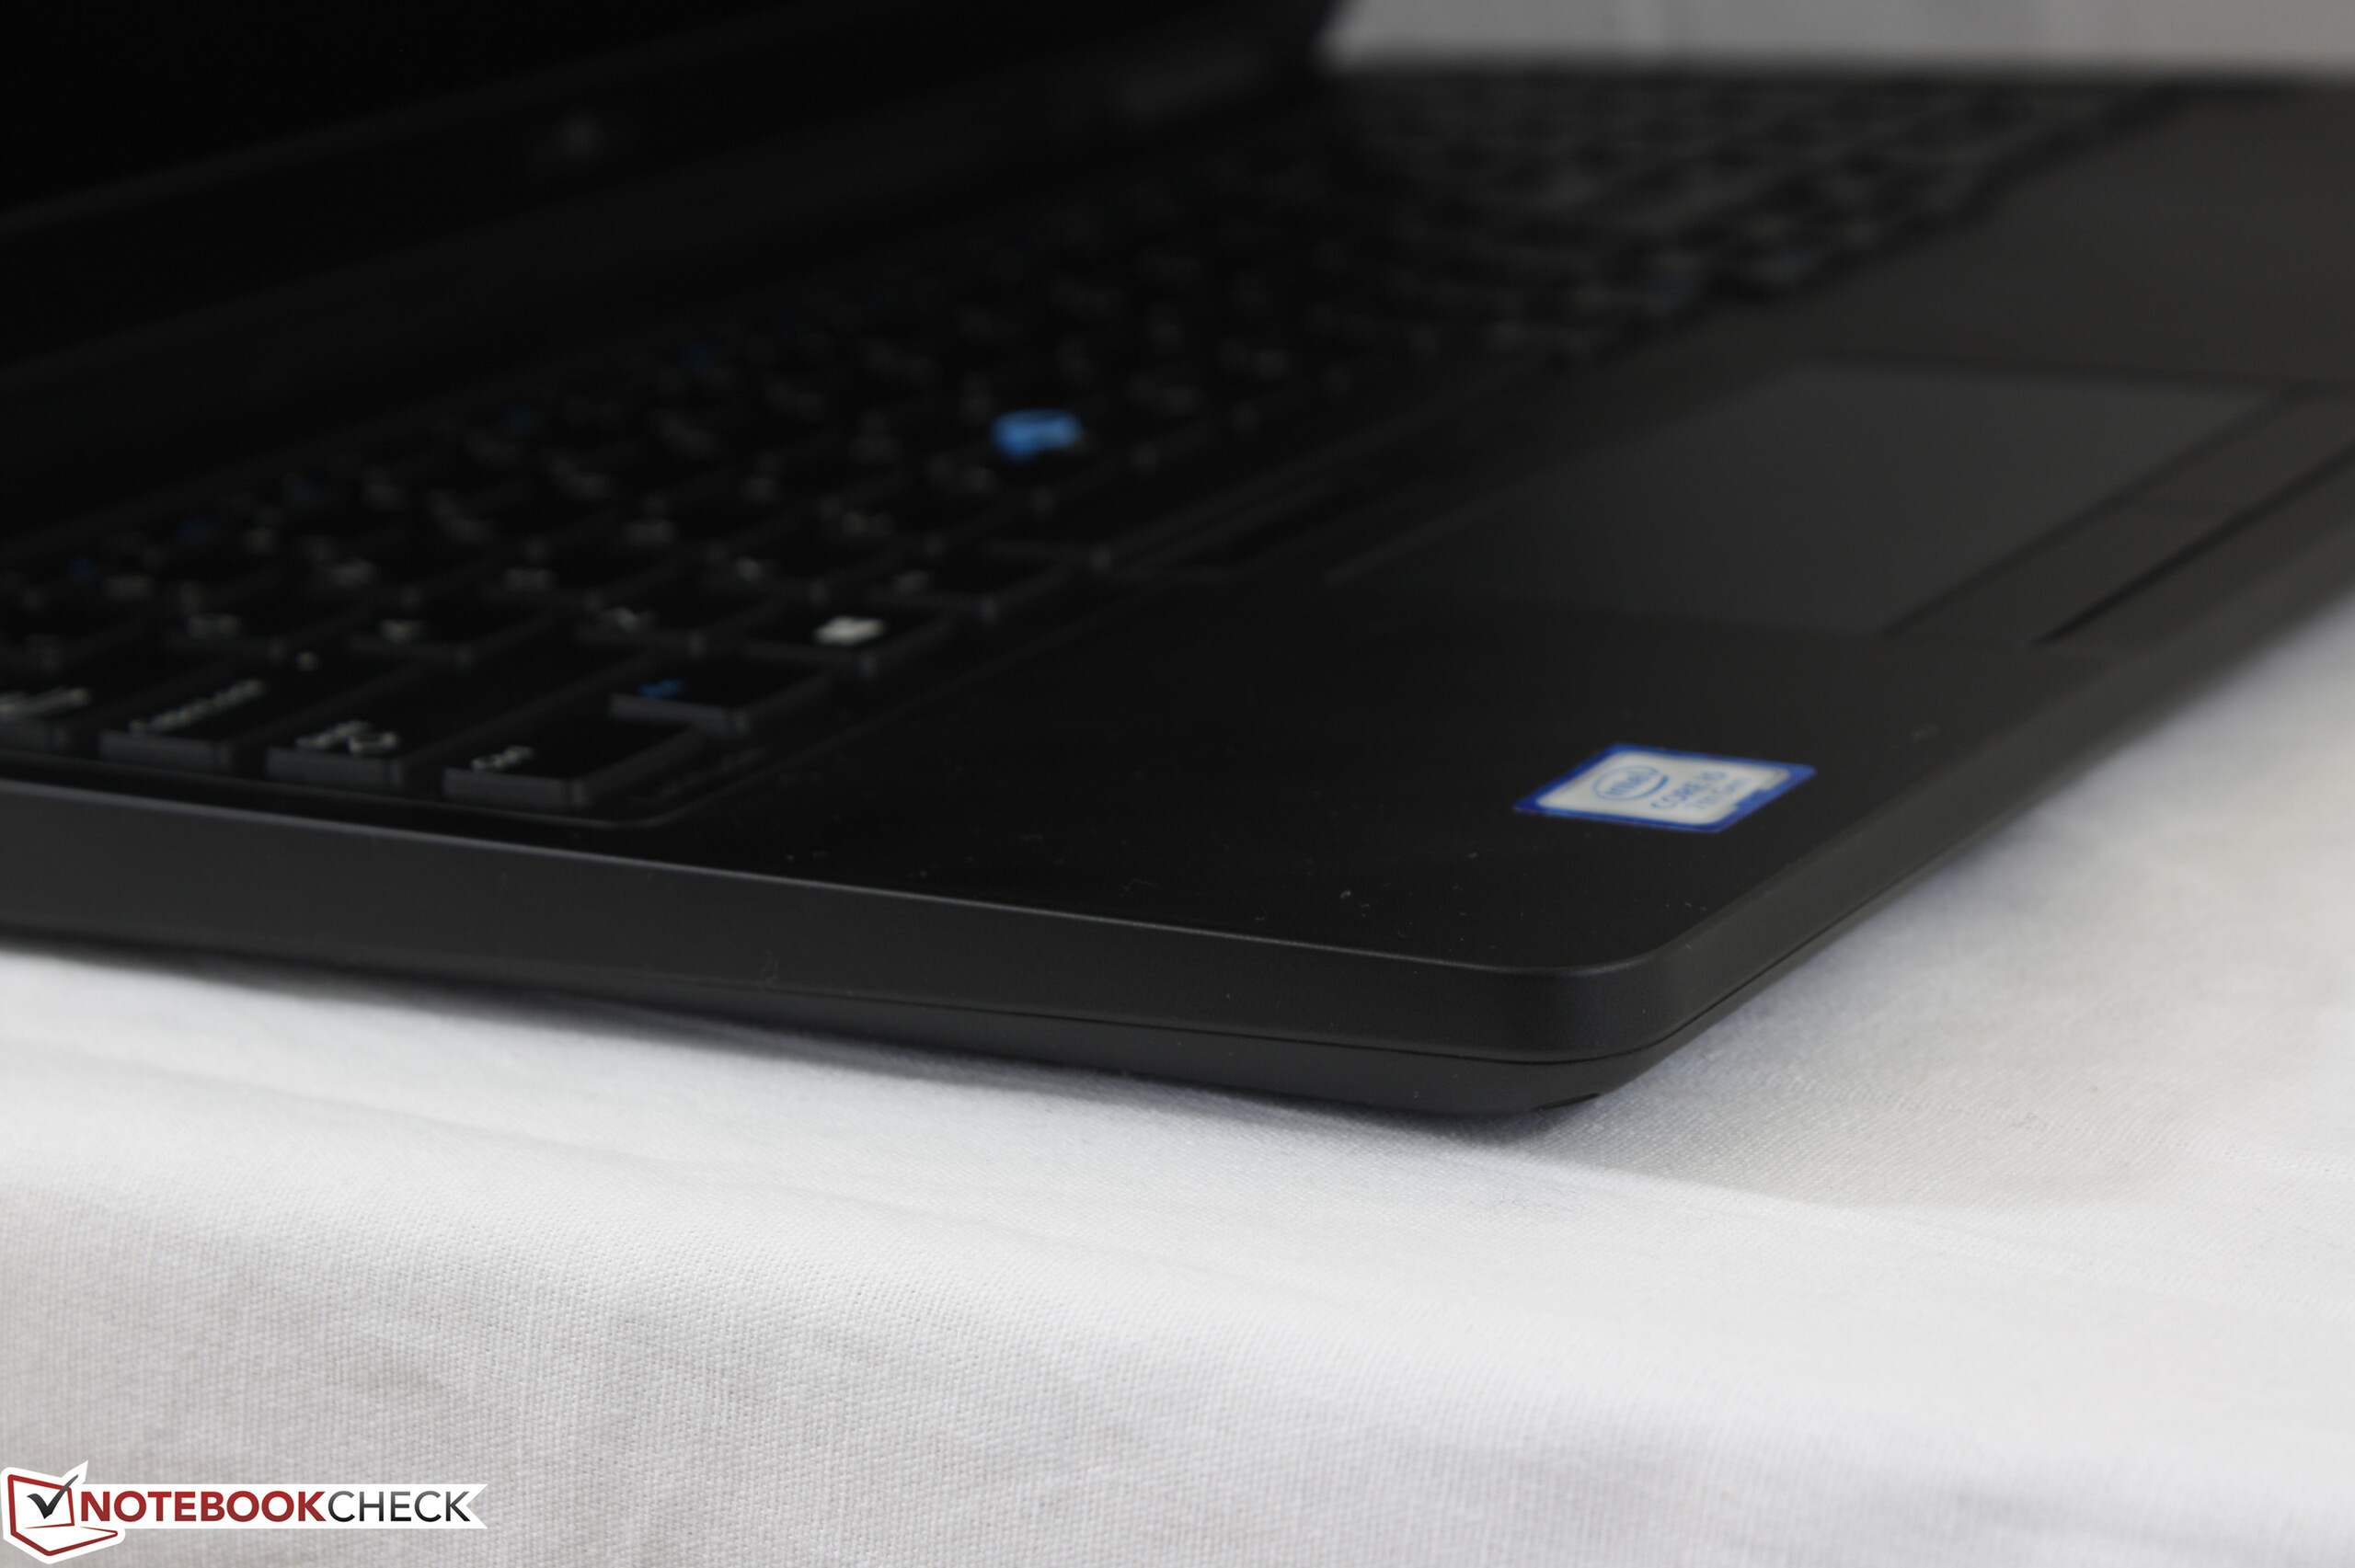
Rigidity of the base has not improved from the outgoing E5570. The base can twist side-to-side just slightly and its surfaces around the palm rests and keyboard base will still visibly flex when applying pressure. Slight creaking can also be heard, but this is fortunately nowhere near significant enough to be of any concern. In these cases, the base of the 5580 feels just a tad more flexible than what the ThinkPad T570 has to offer.
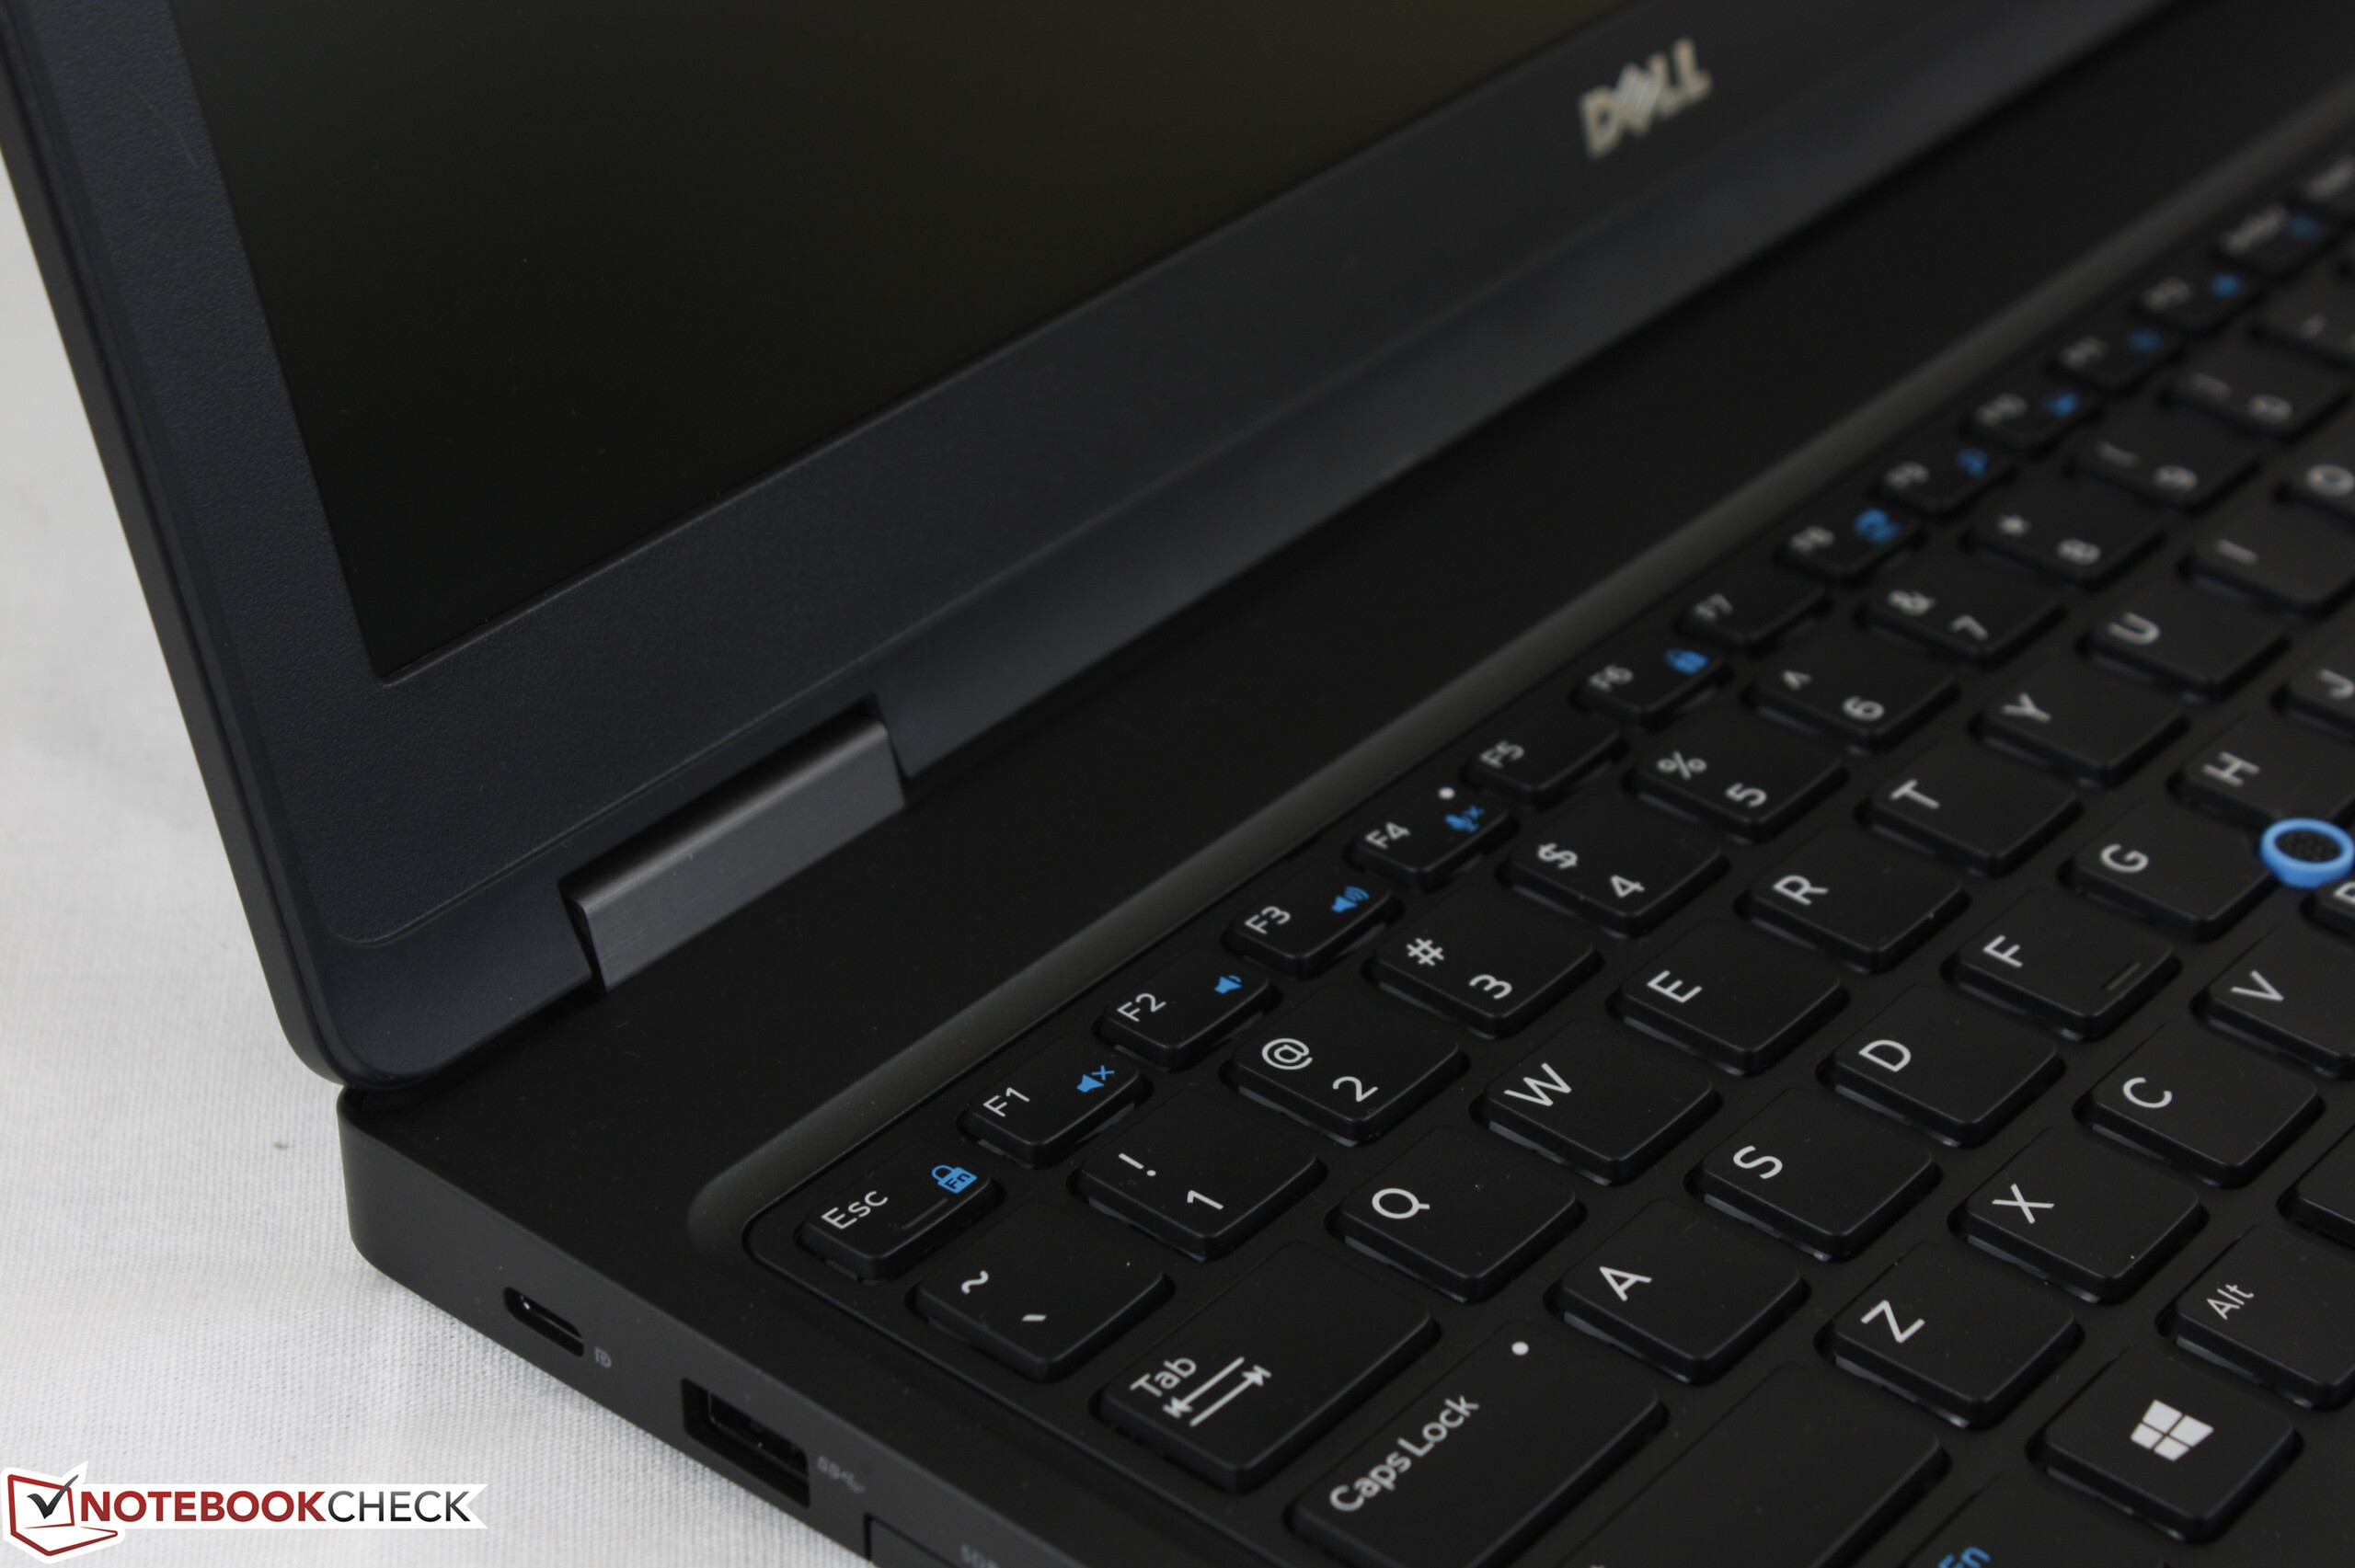
The thick lid has above average resistance to twisting and flexing especially down the center where notebooks tend to be most flexible. Attempting to warp the lid will not result in notable degradation of onscreen colors or contrast. The two hinges are also firm up to the maximum 180-degree angle with virtually no teetering while typing. Thus, while the base of the 5580 may be marginally weaker than on the ThinkPad T570, its lid and hinges feel more solid to compensate. Workmanship is excellent with no major defects or gaps including the inner bezel around the screen. Slight unevenness between materials can be spotted on the rear of our specific test unit, but its occurrence is insignificant and only superficial. We can't help but to have expected at least some improvement over its immediate predecessor in this regard.
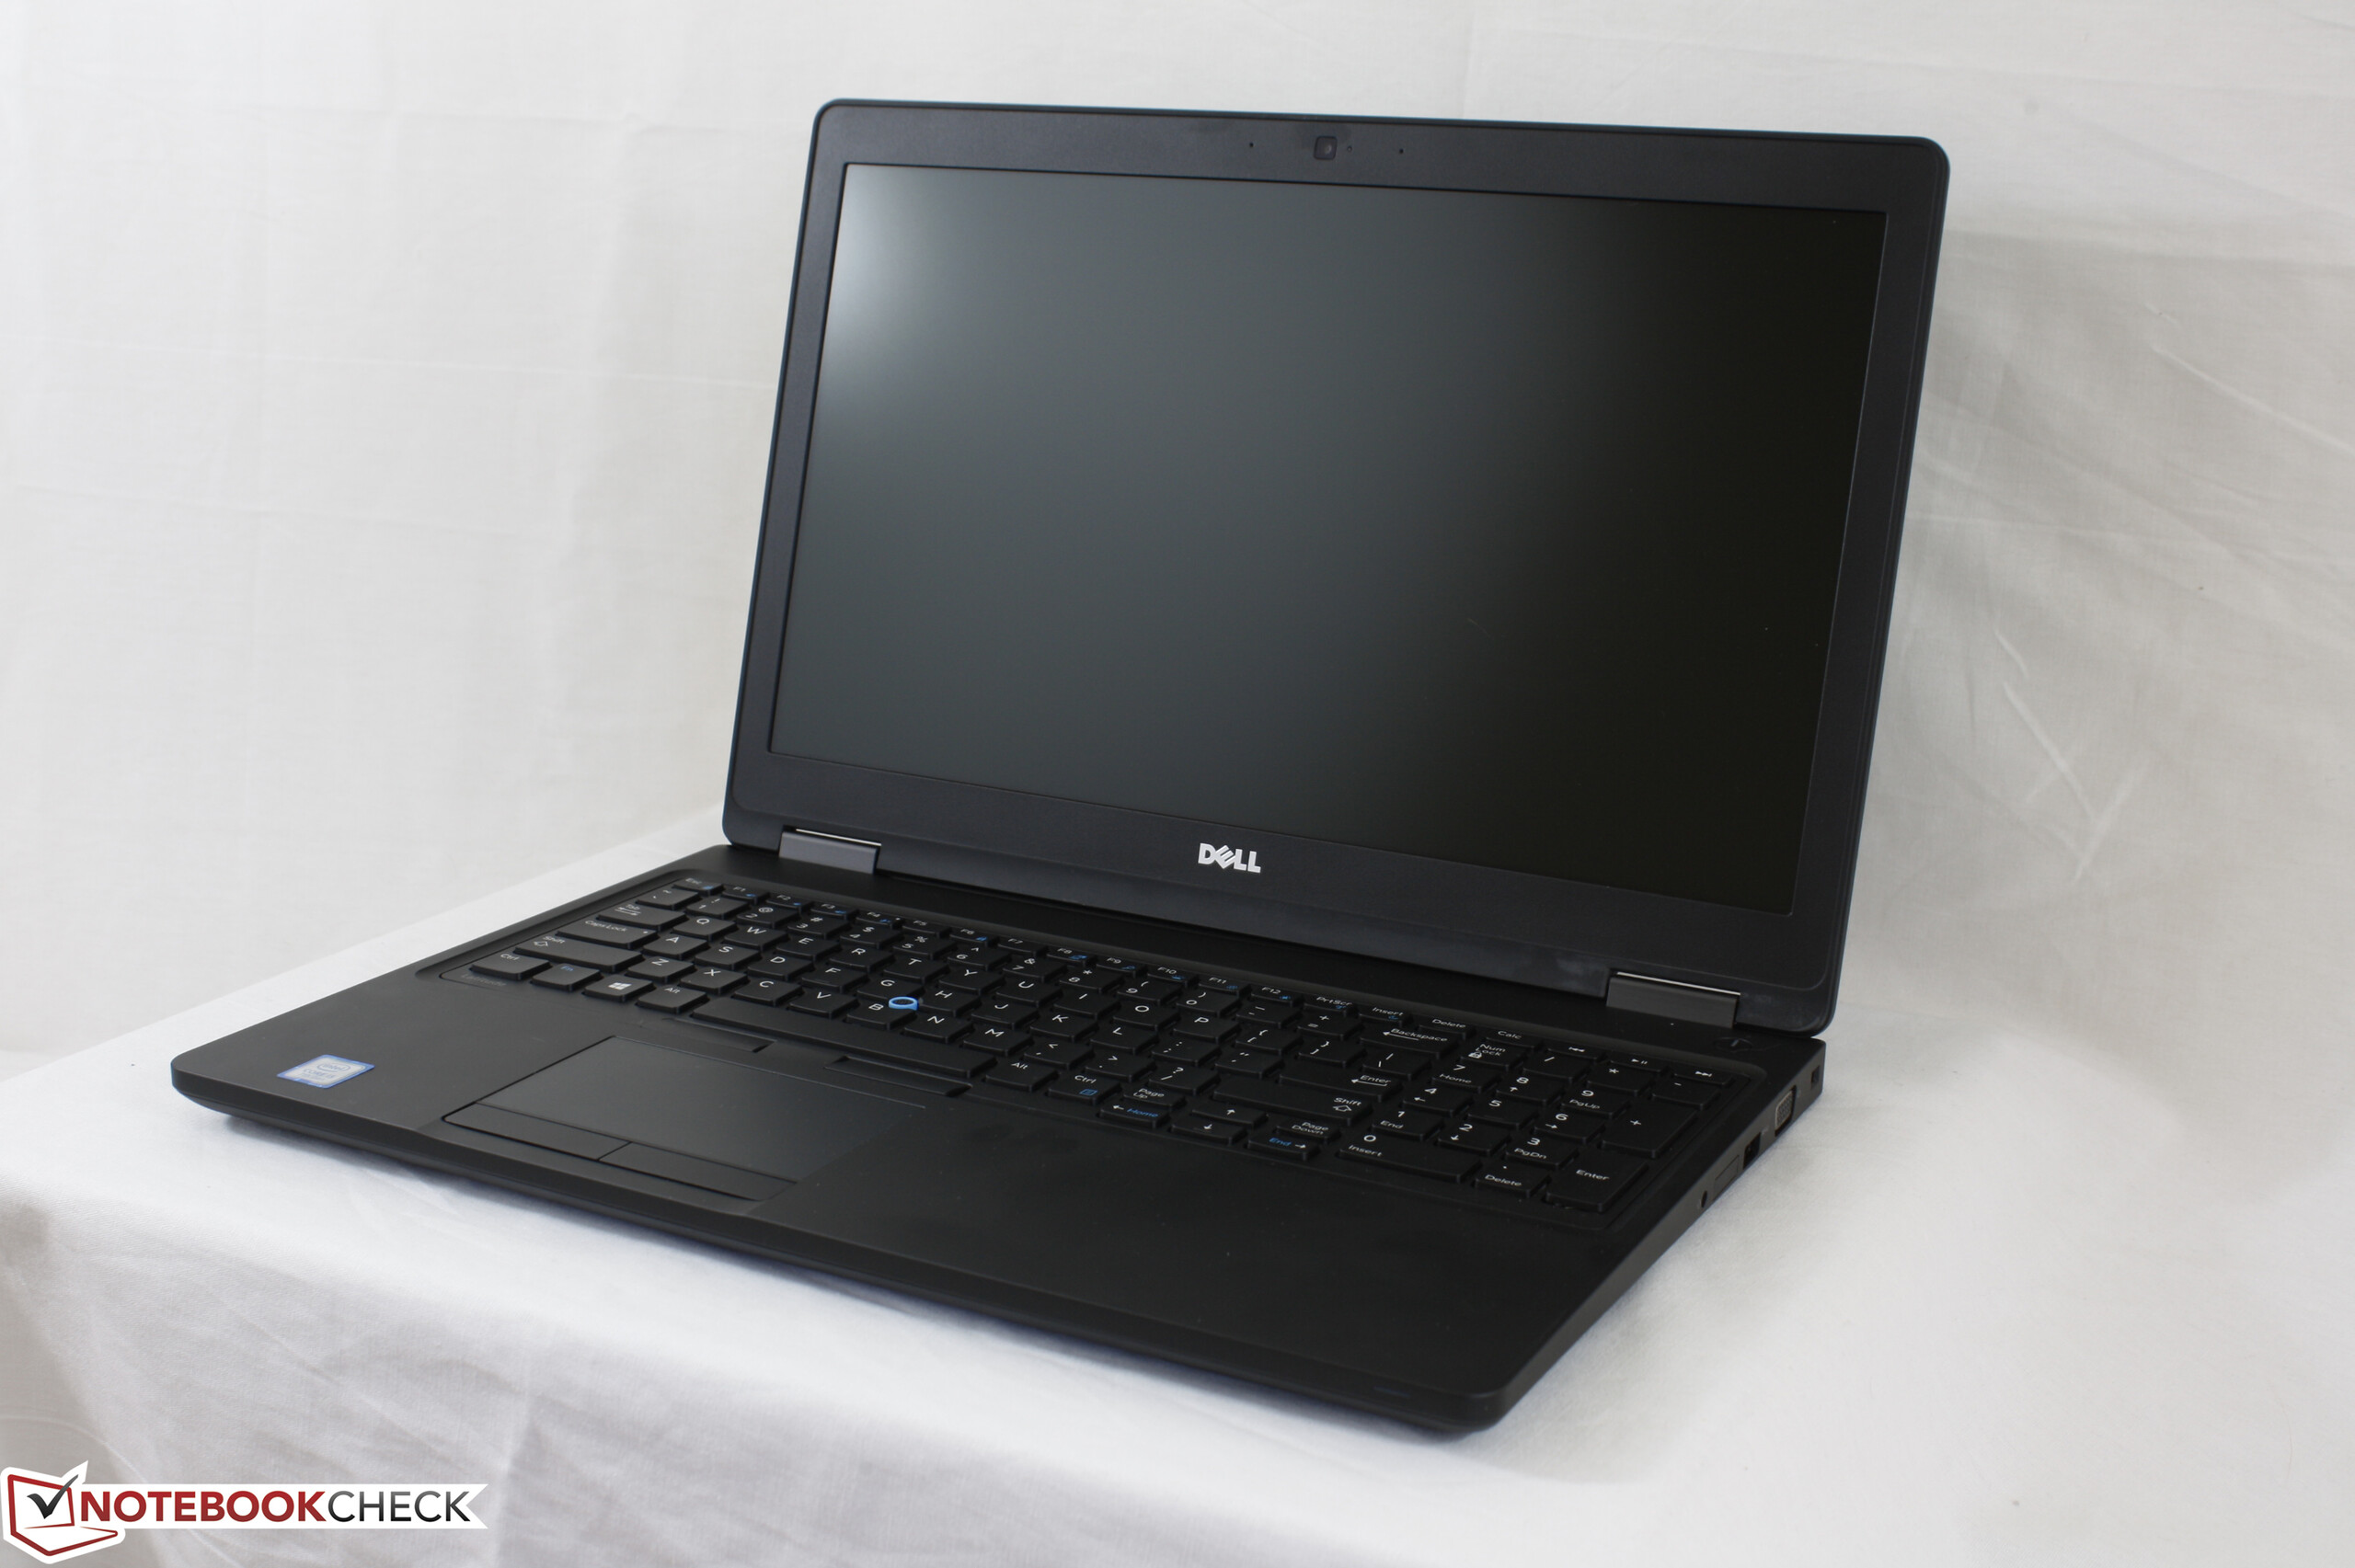
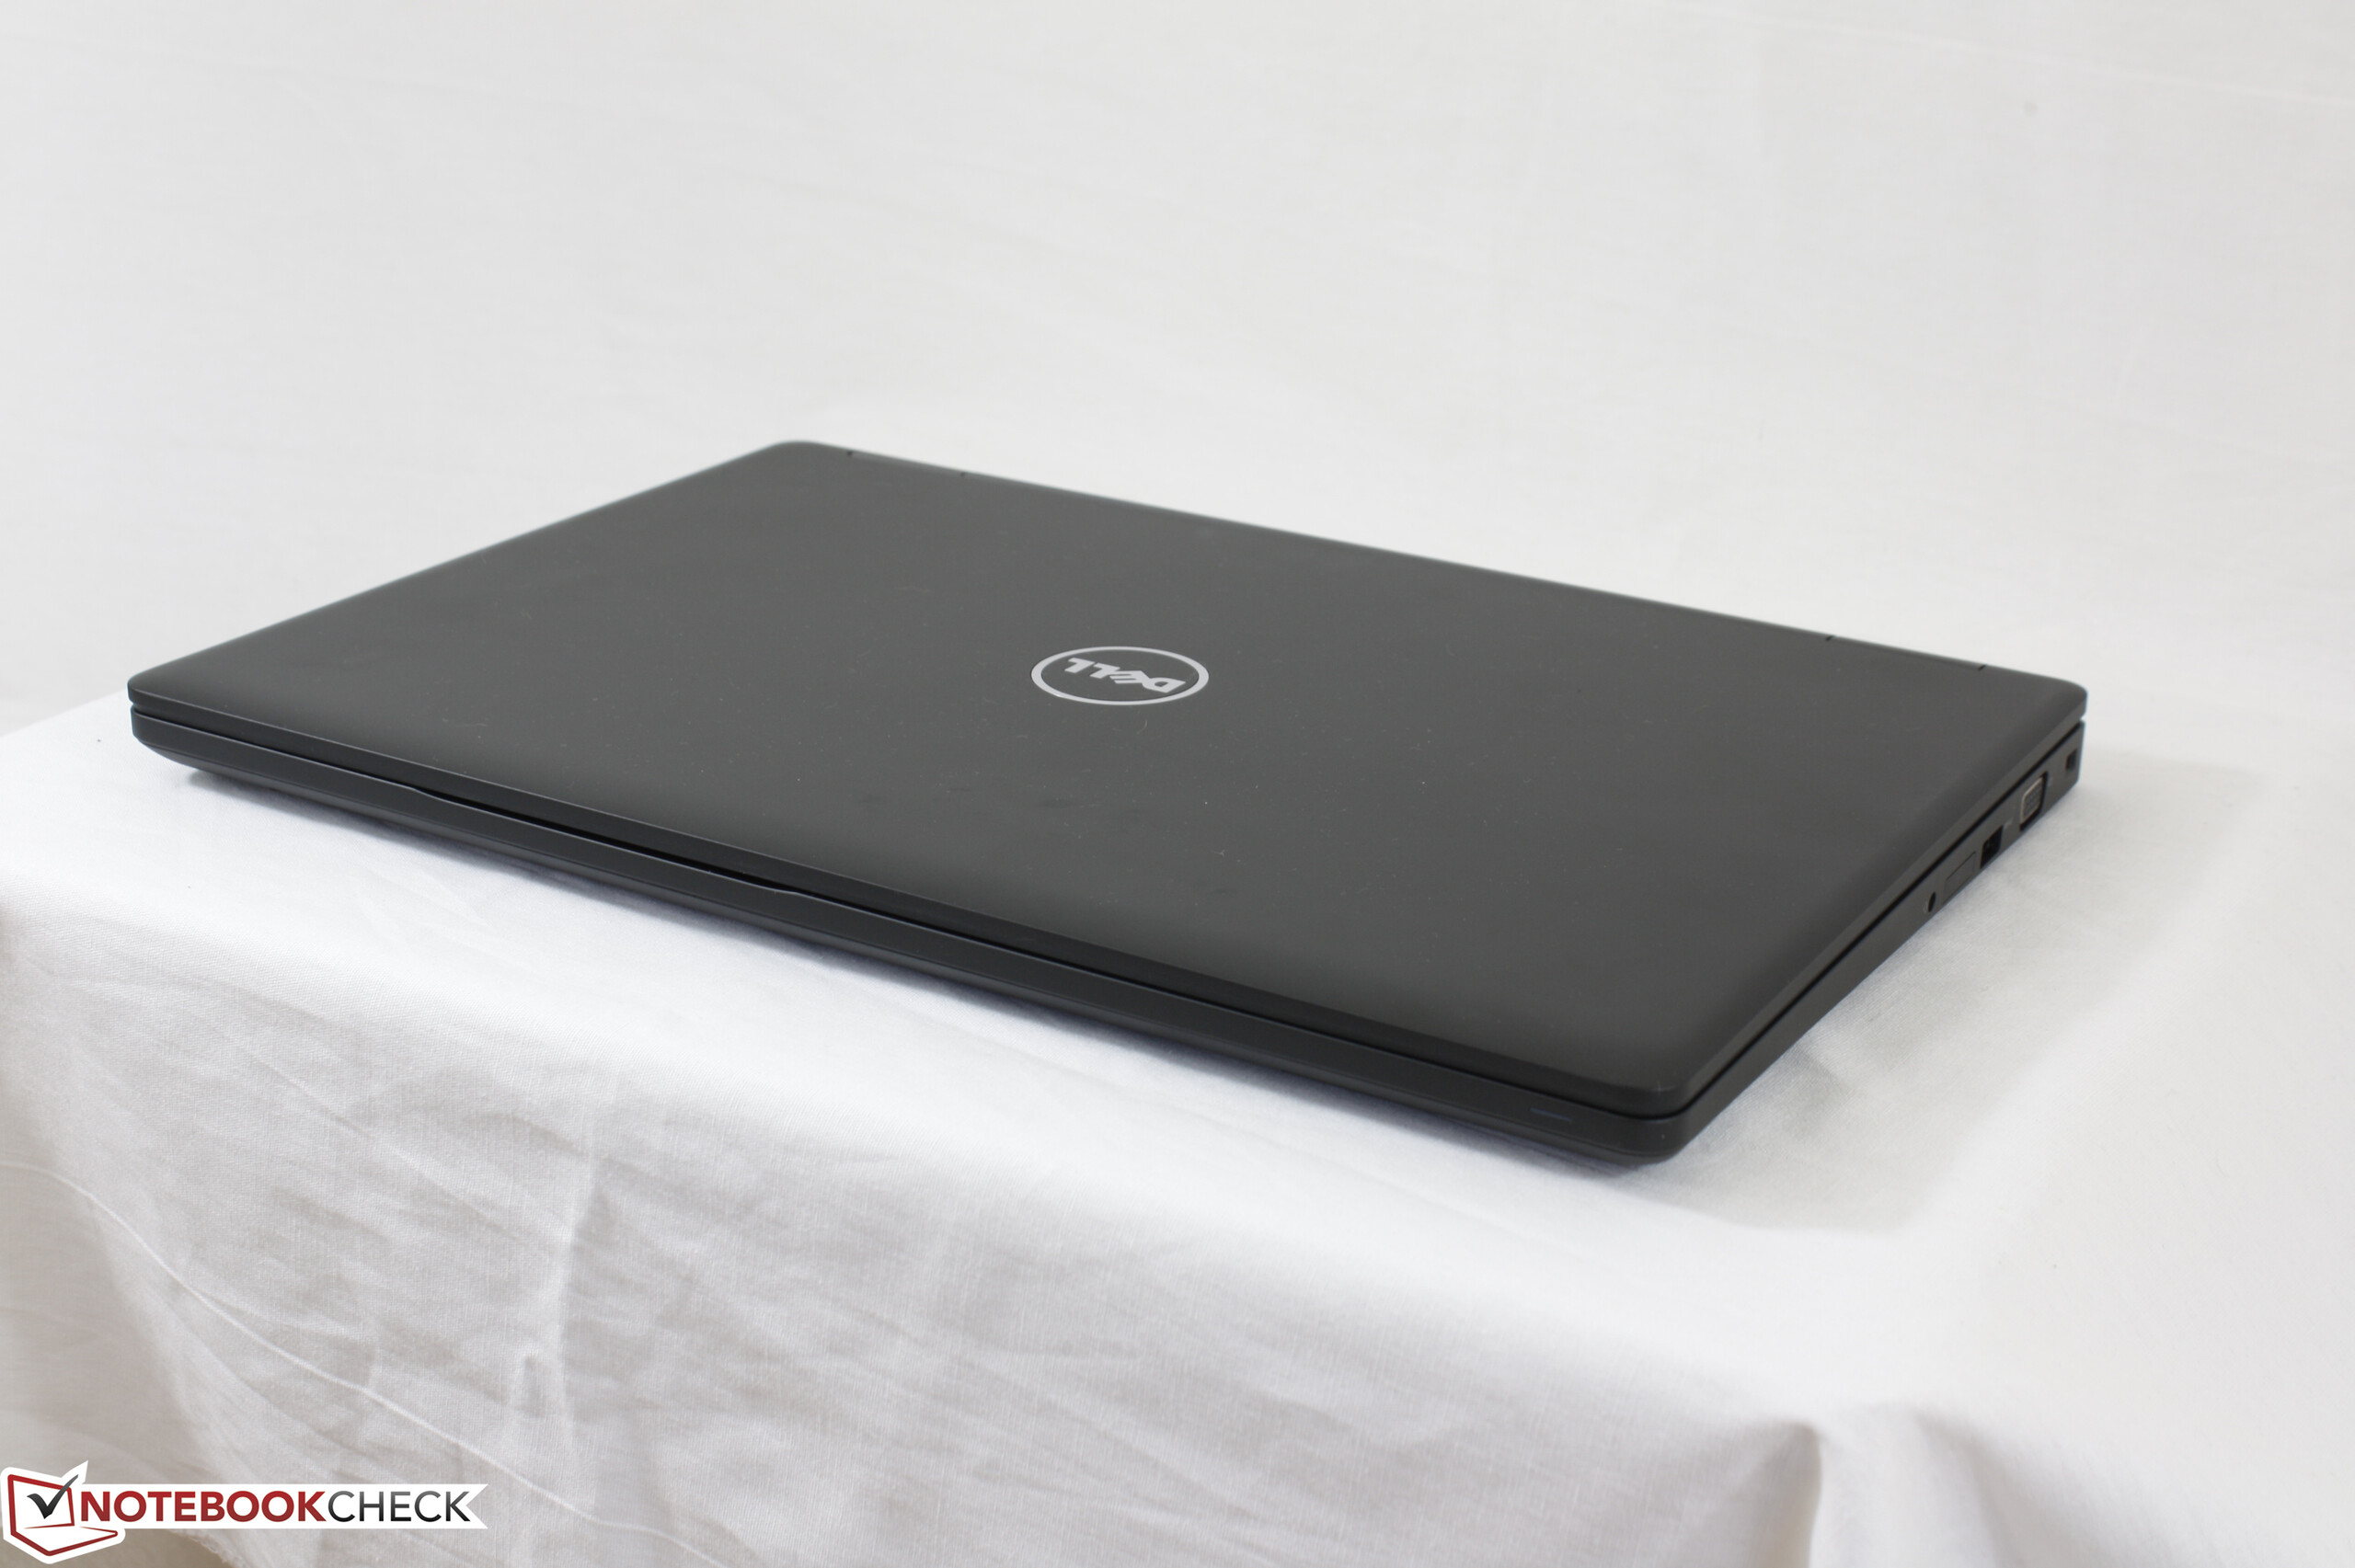
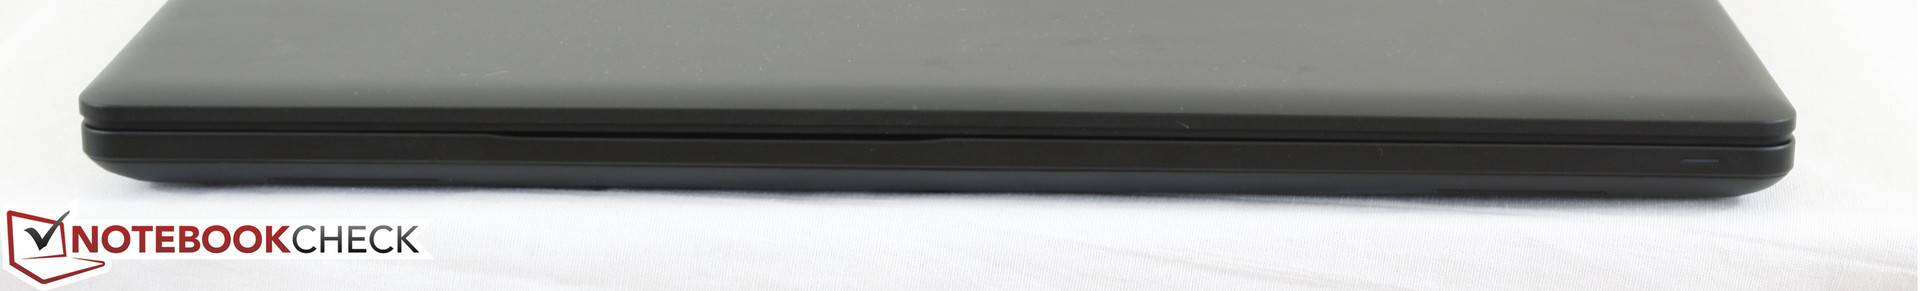
In terms of size and weight, the Latitude 5580 is not significantly larger or heavier than its closest competitors. This is generally expected from a business notebook as the design is not a race to the thinnest or lightest, but to the most functional and unyielding. Overall dimensions have changed very little from the outgoing Latitude E5570 while managing to shave off about 100 g to 200 g due partly to the removal of the proprietary docking port.
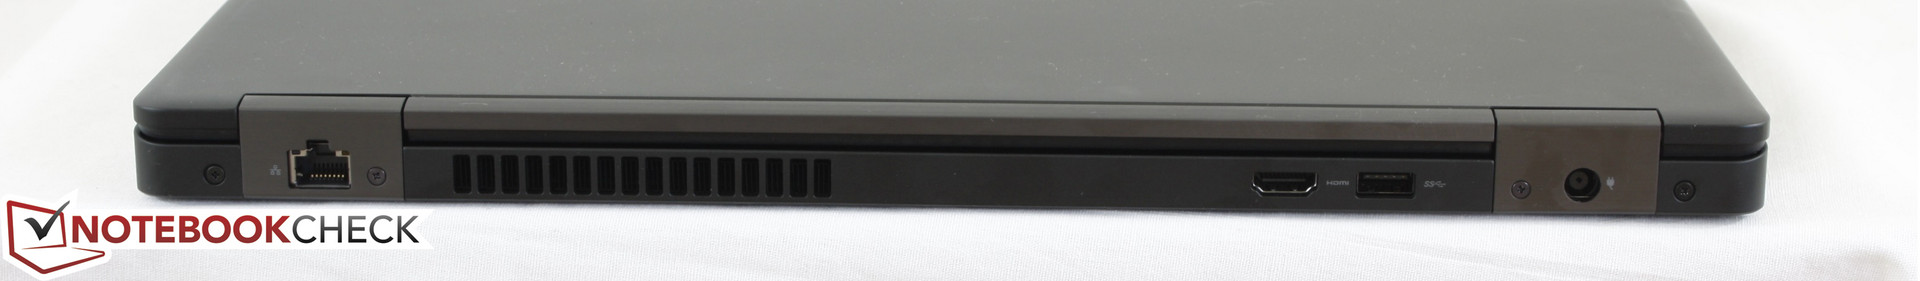
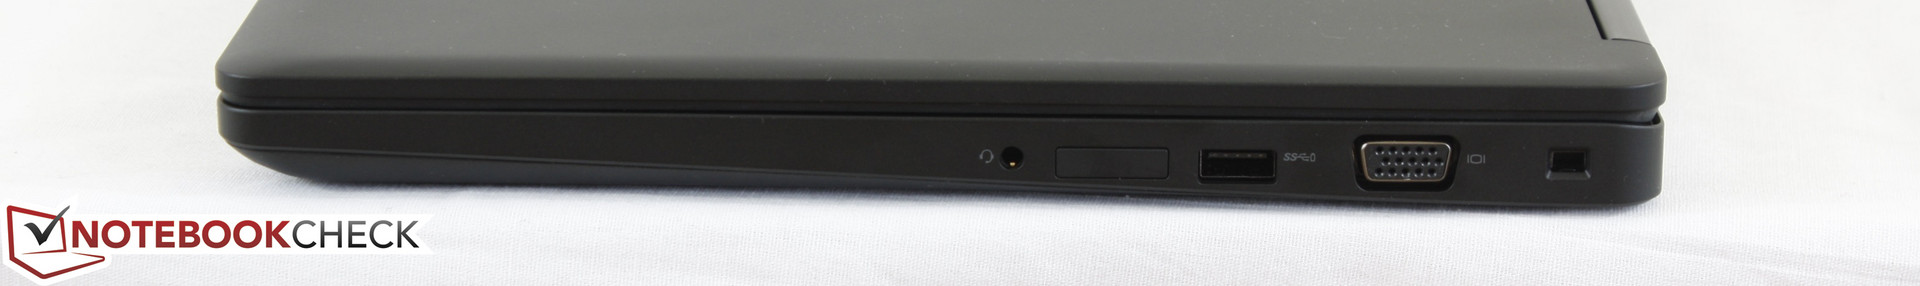
Connectivity
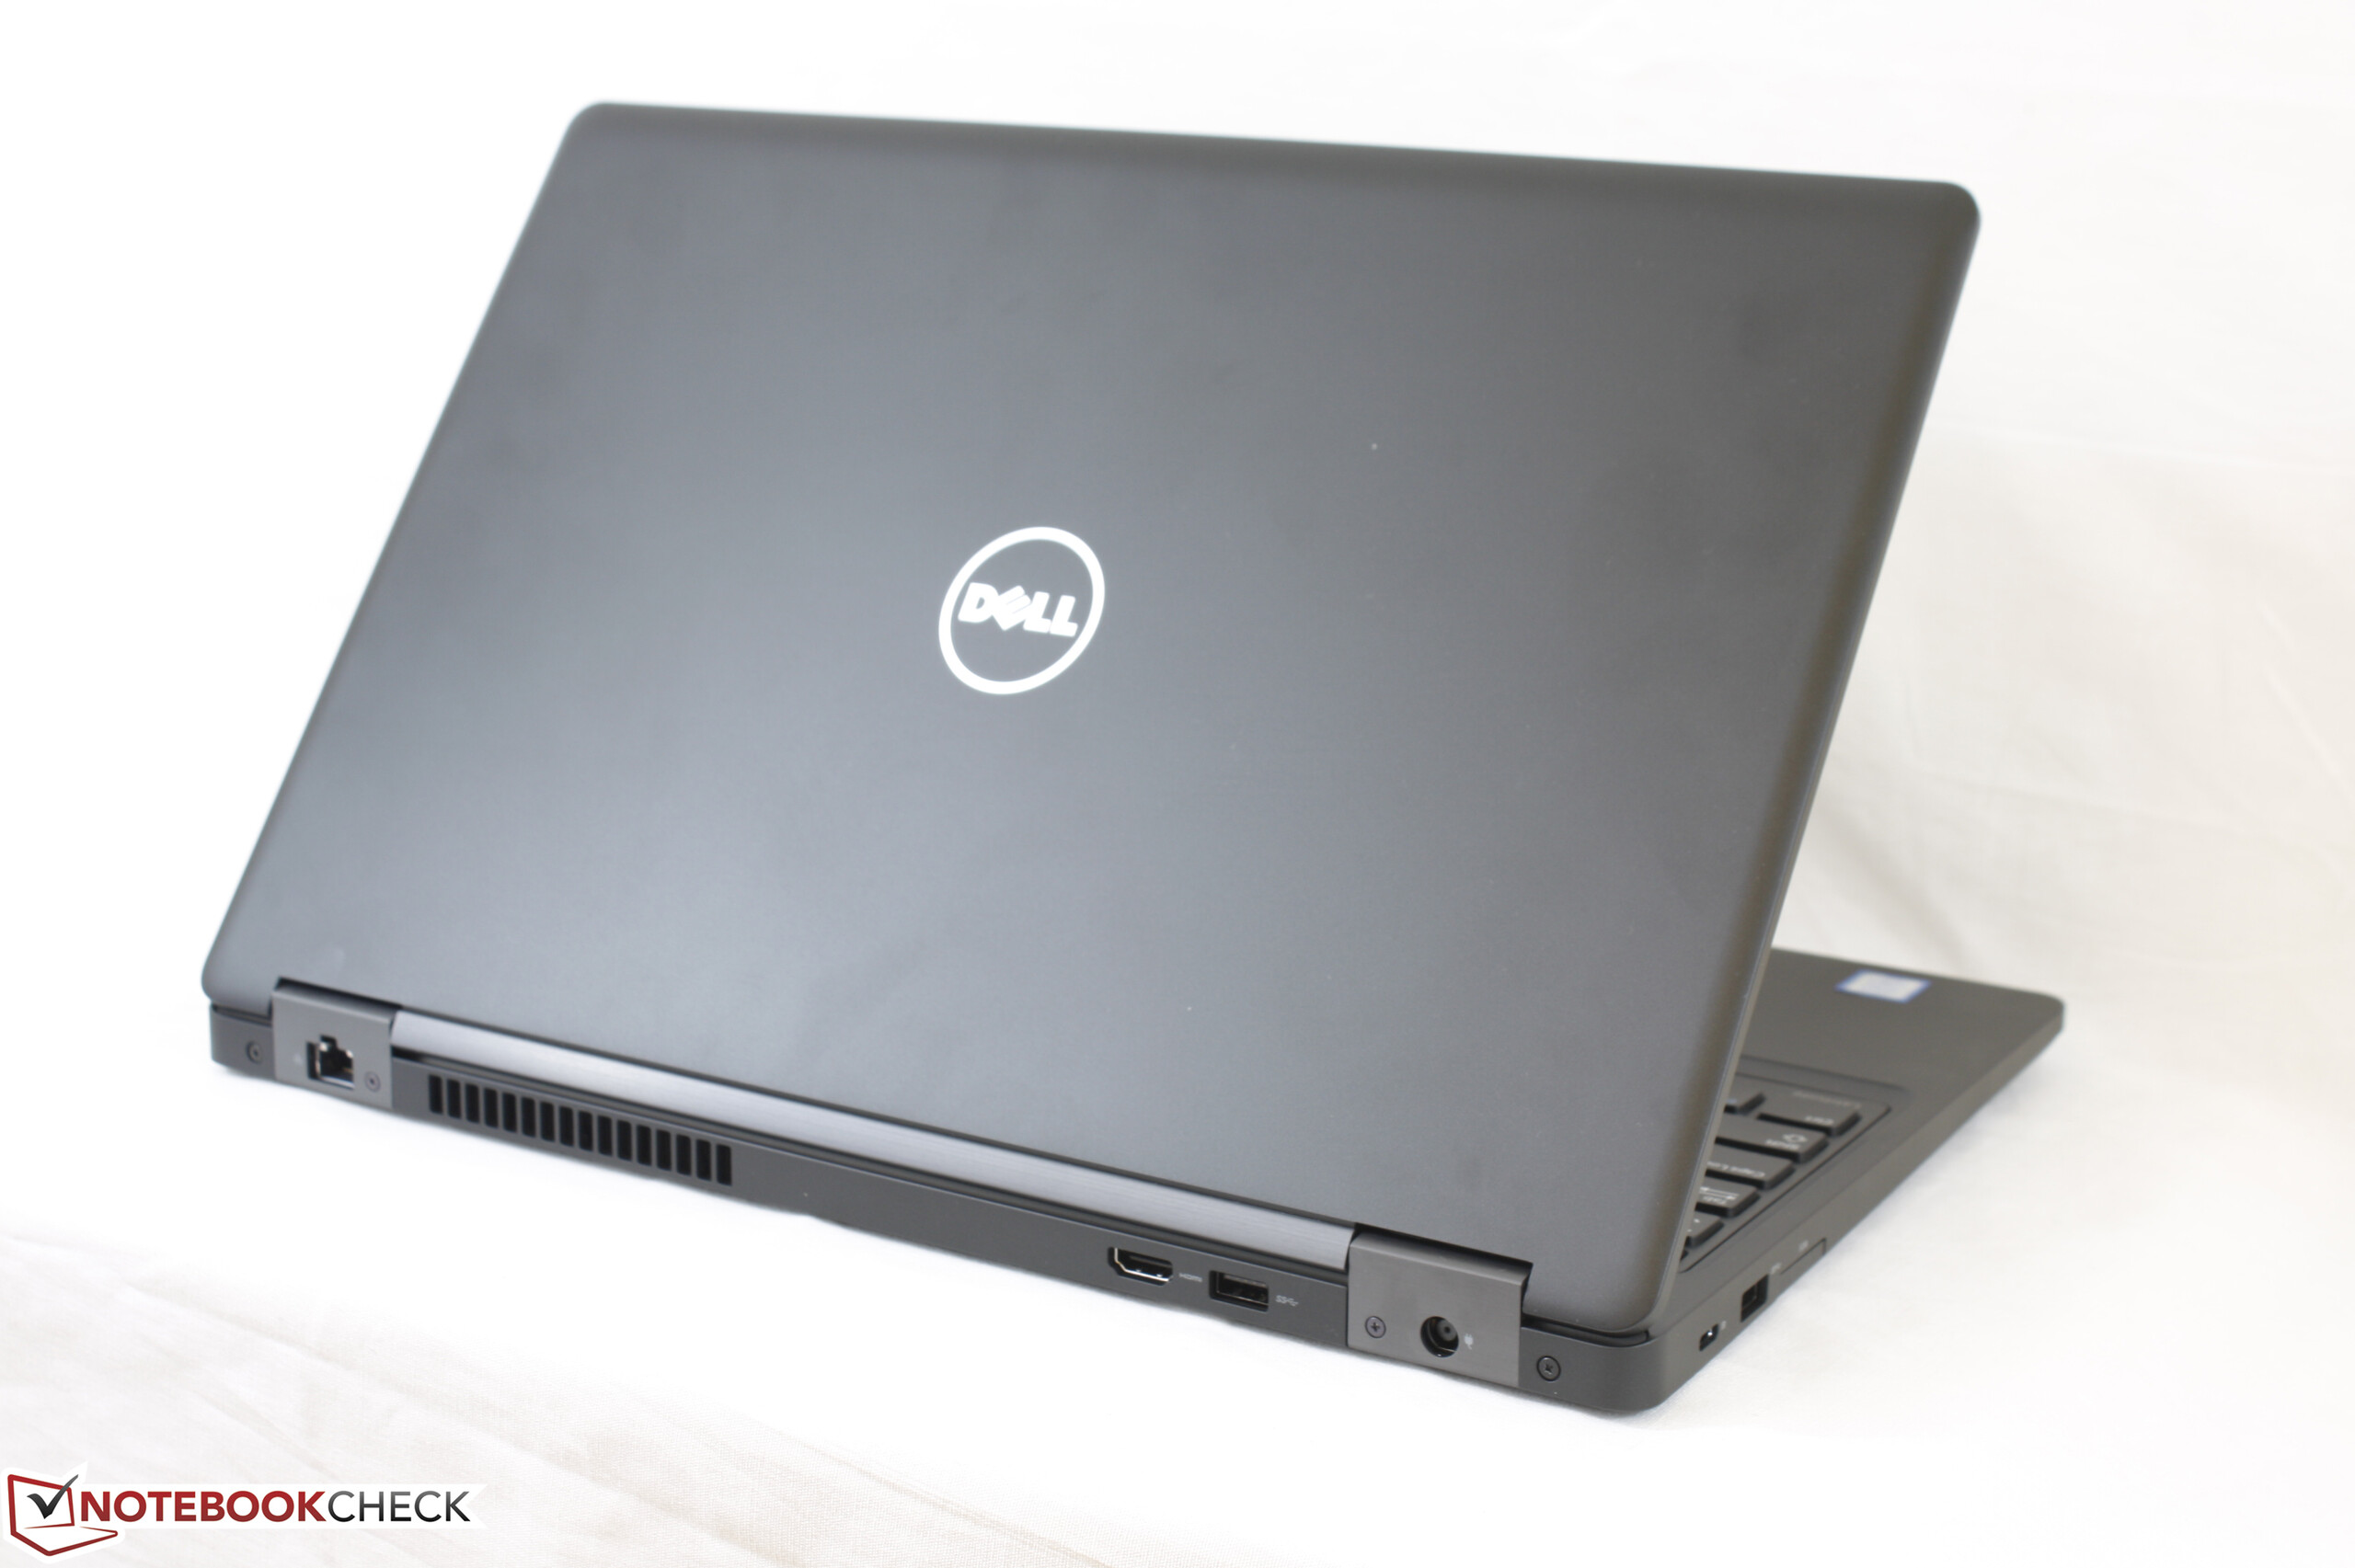
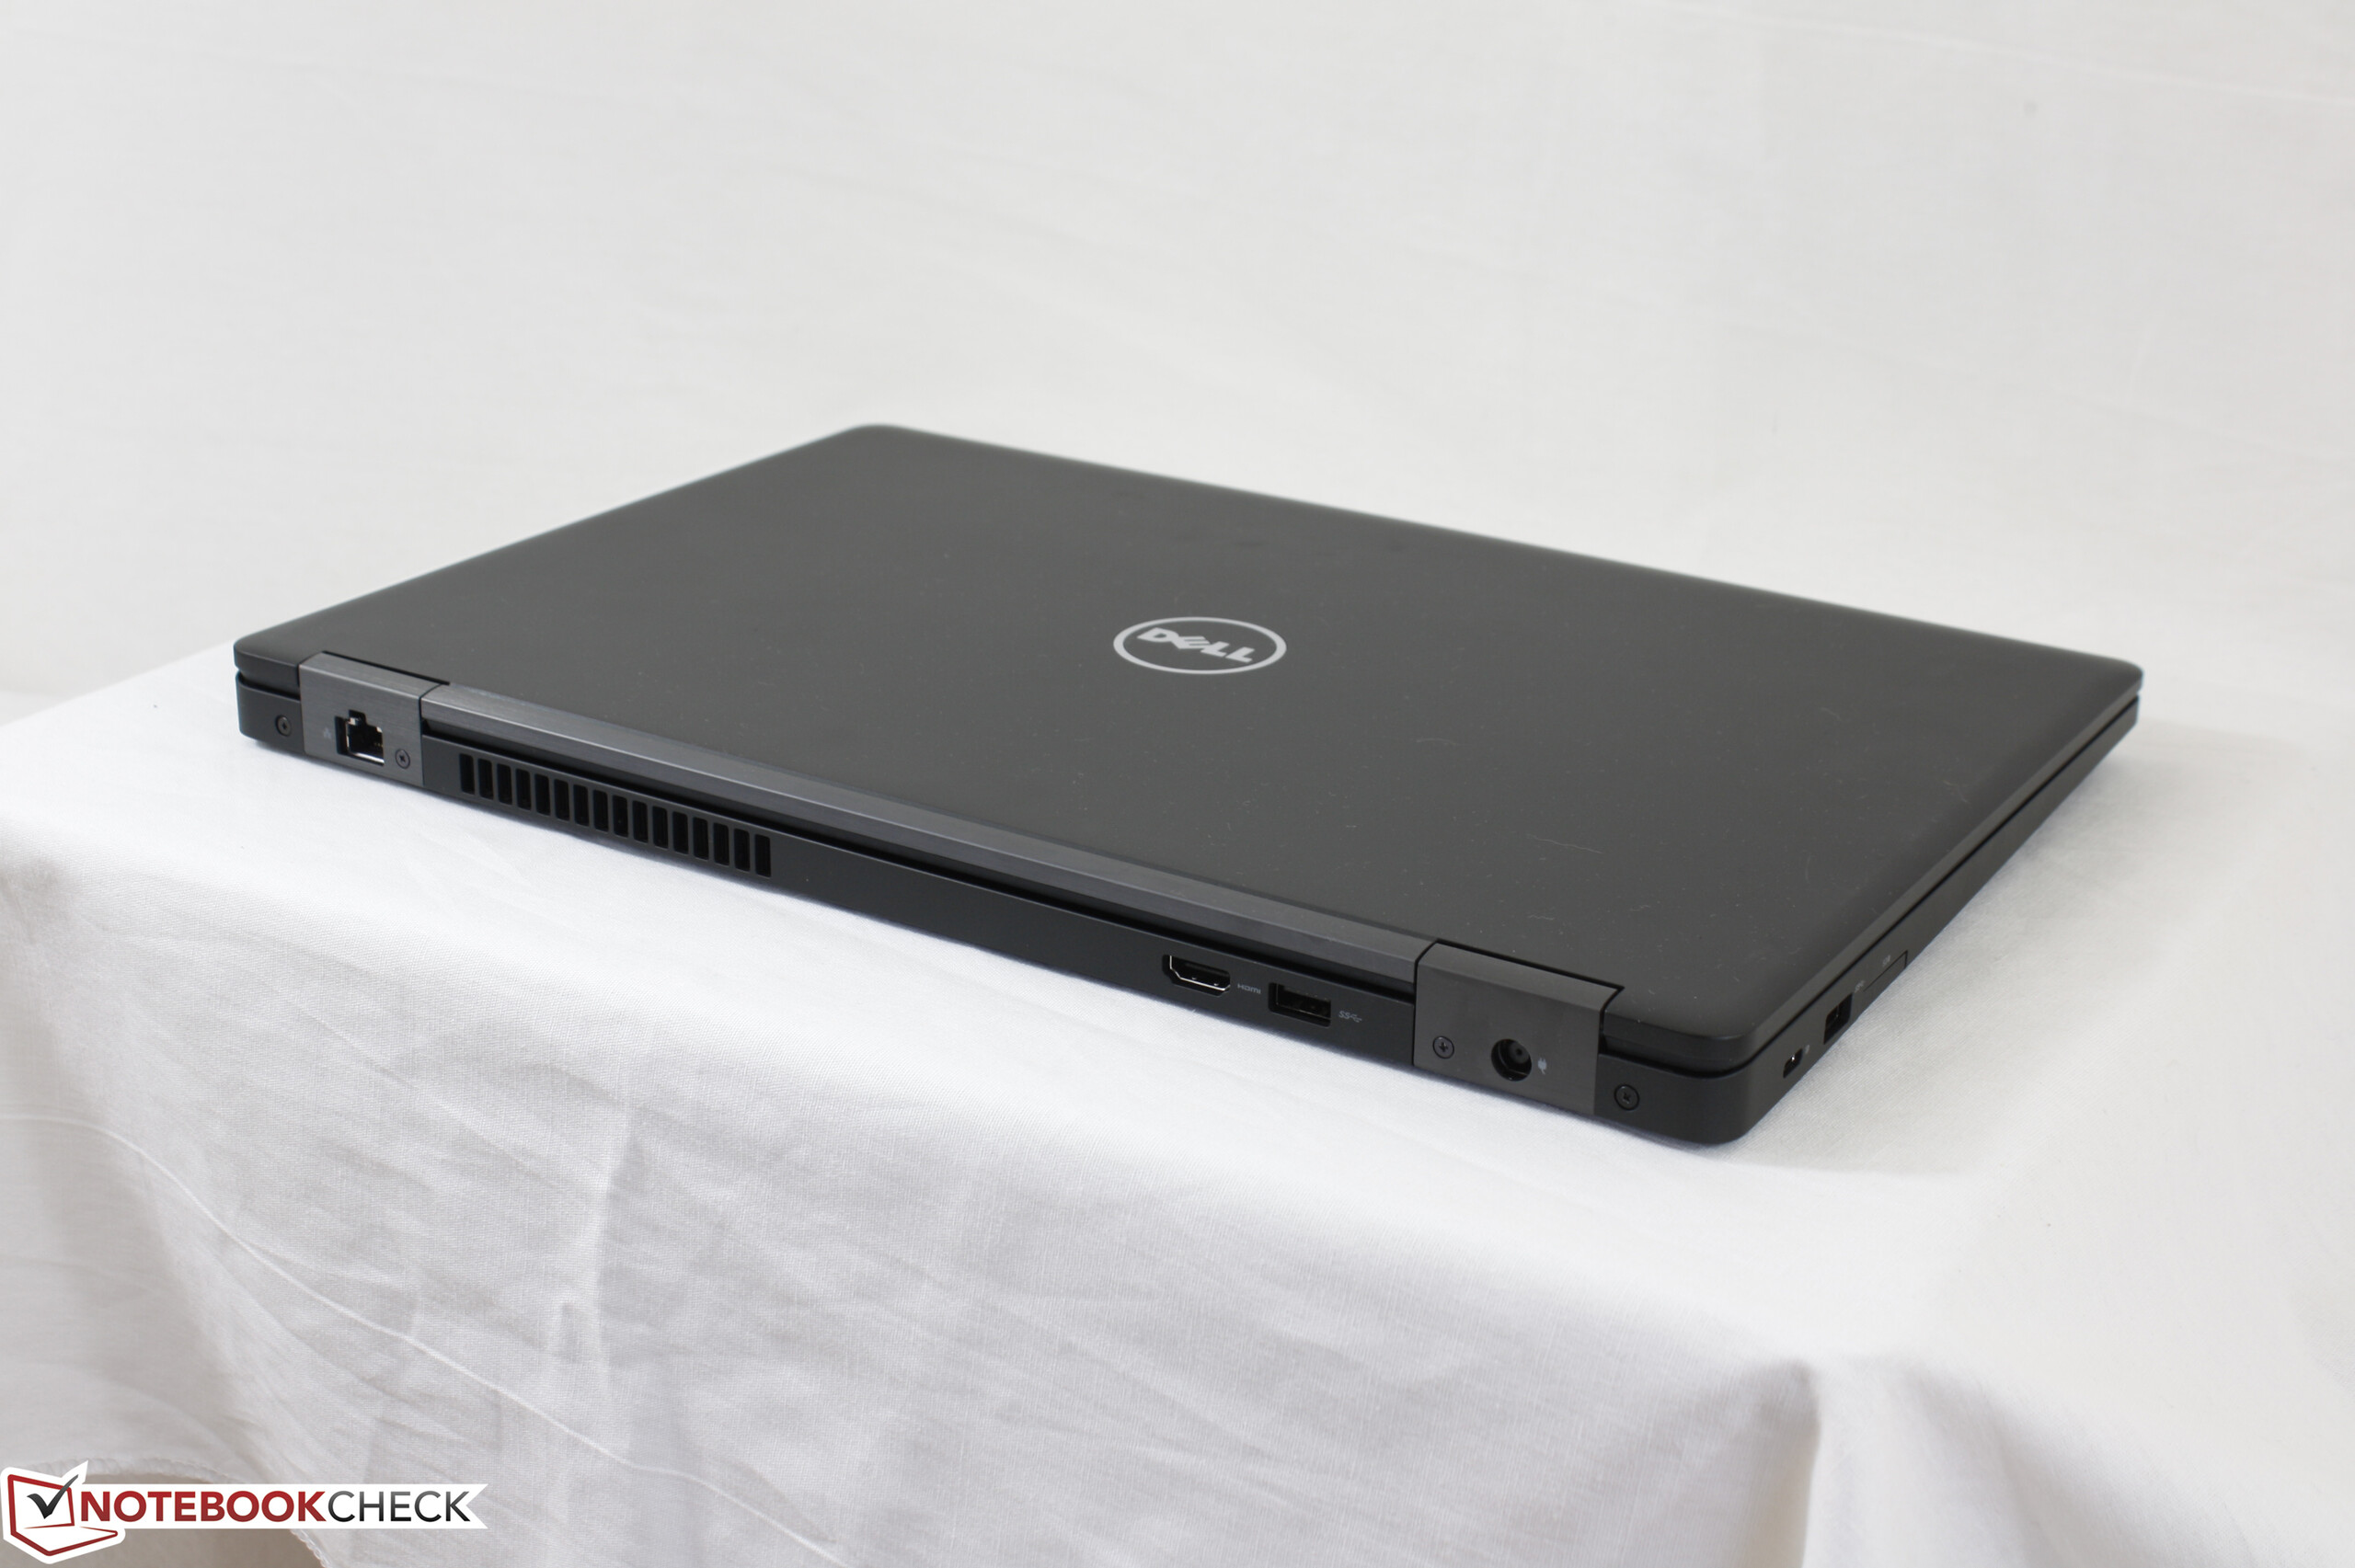
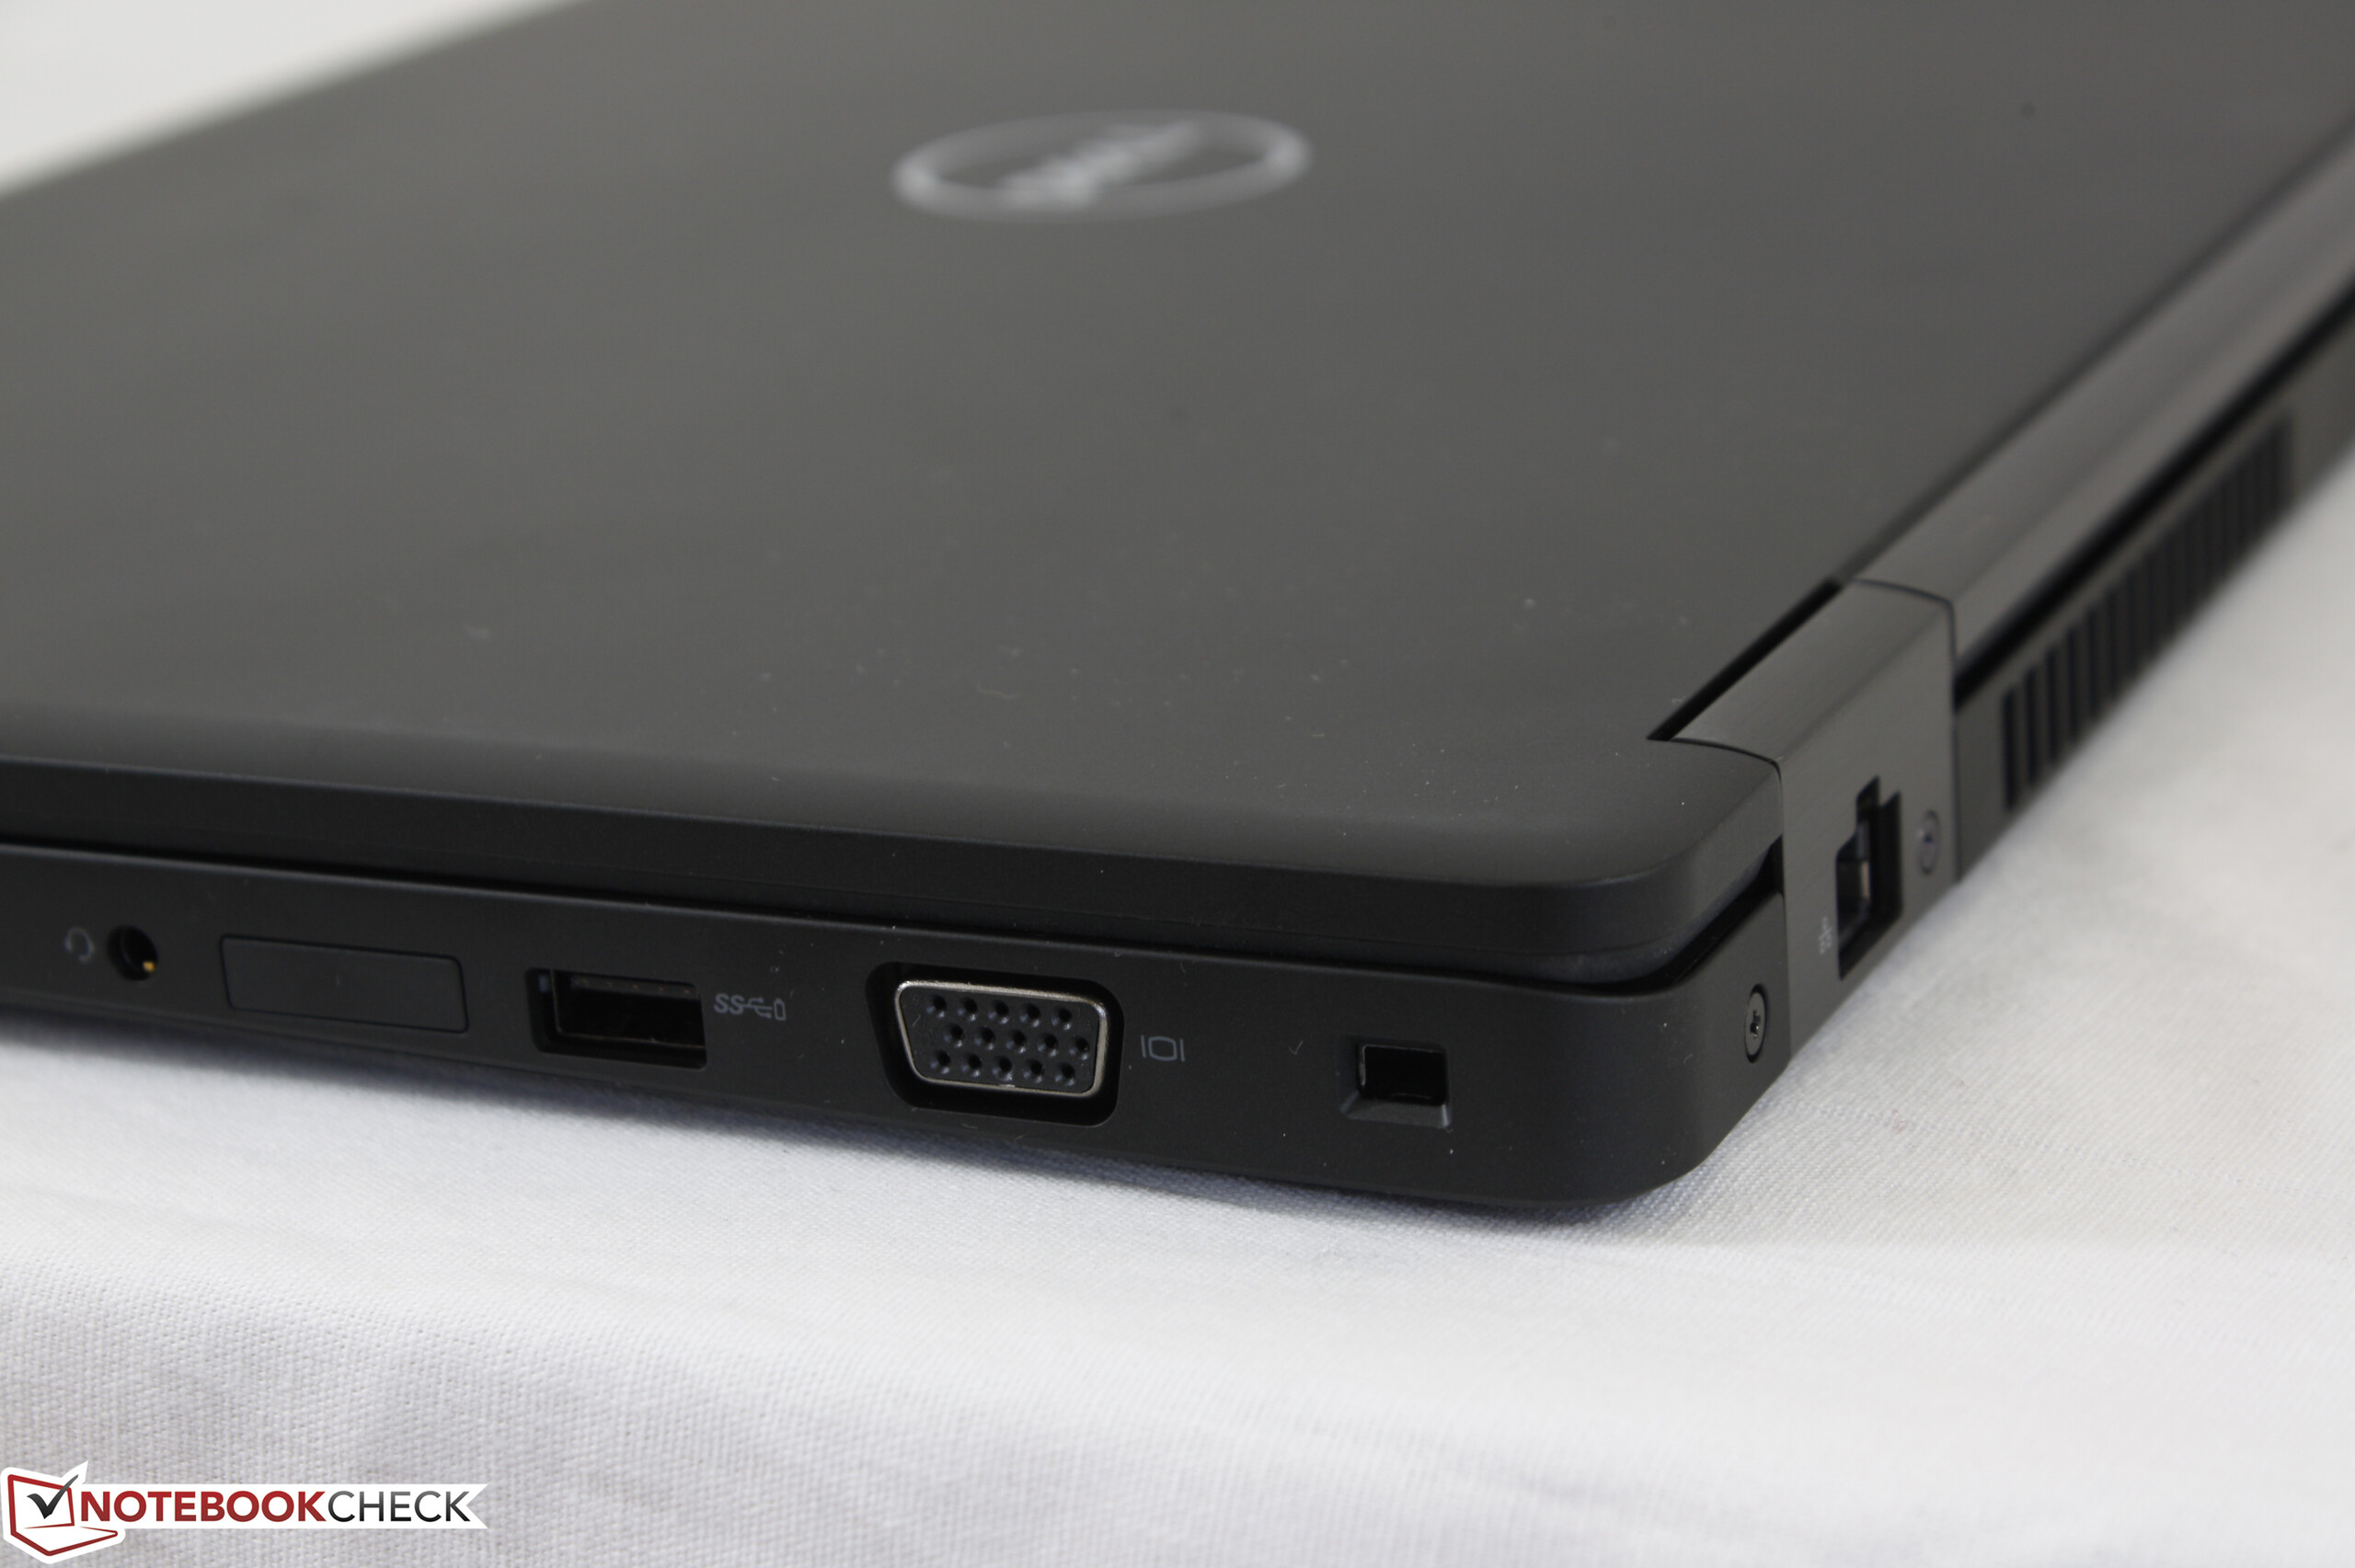
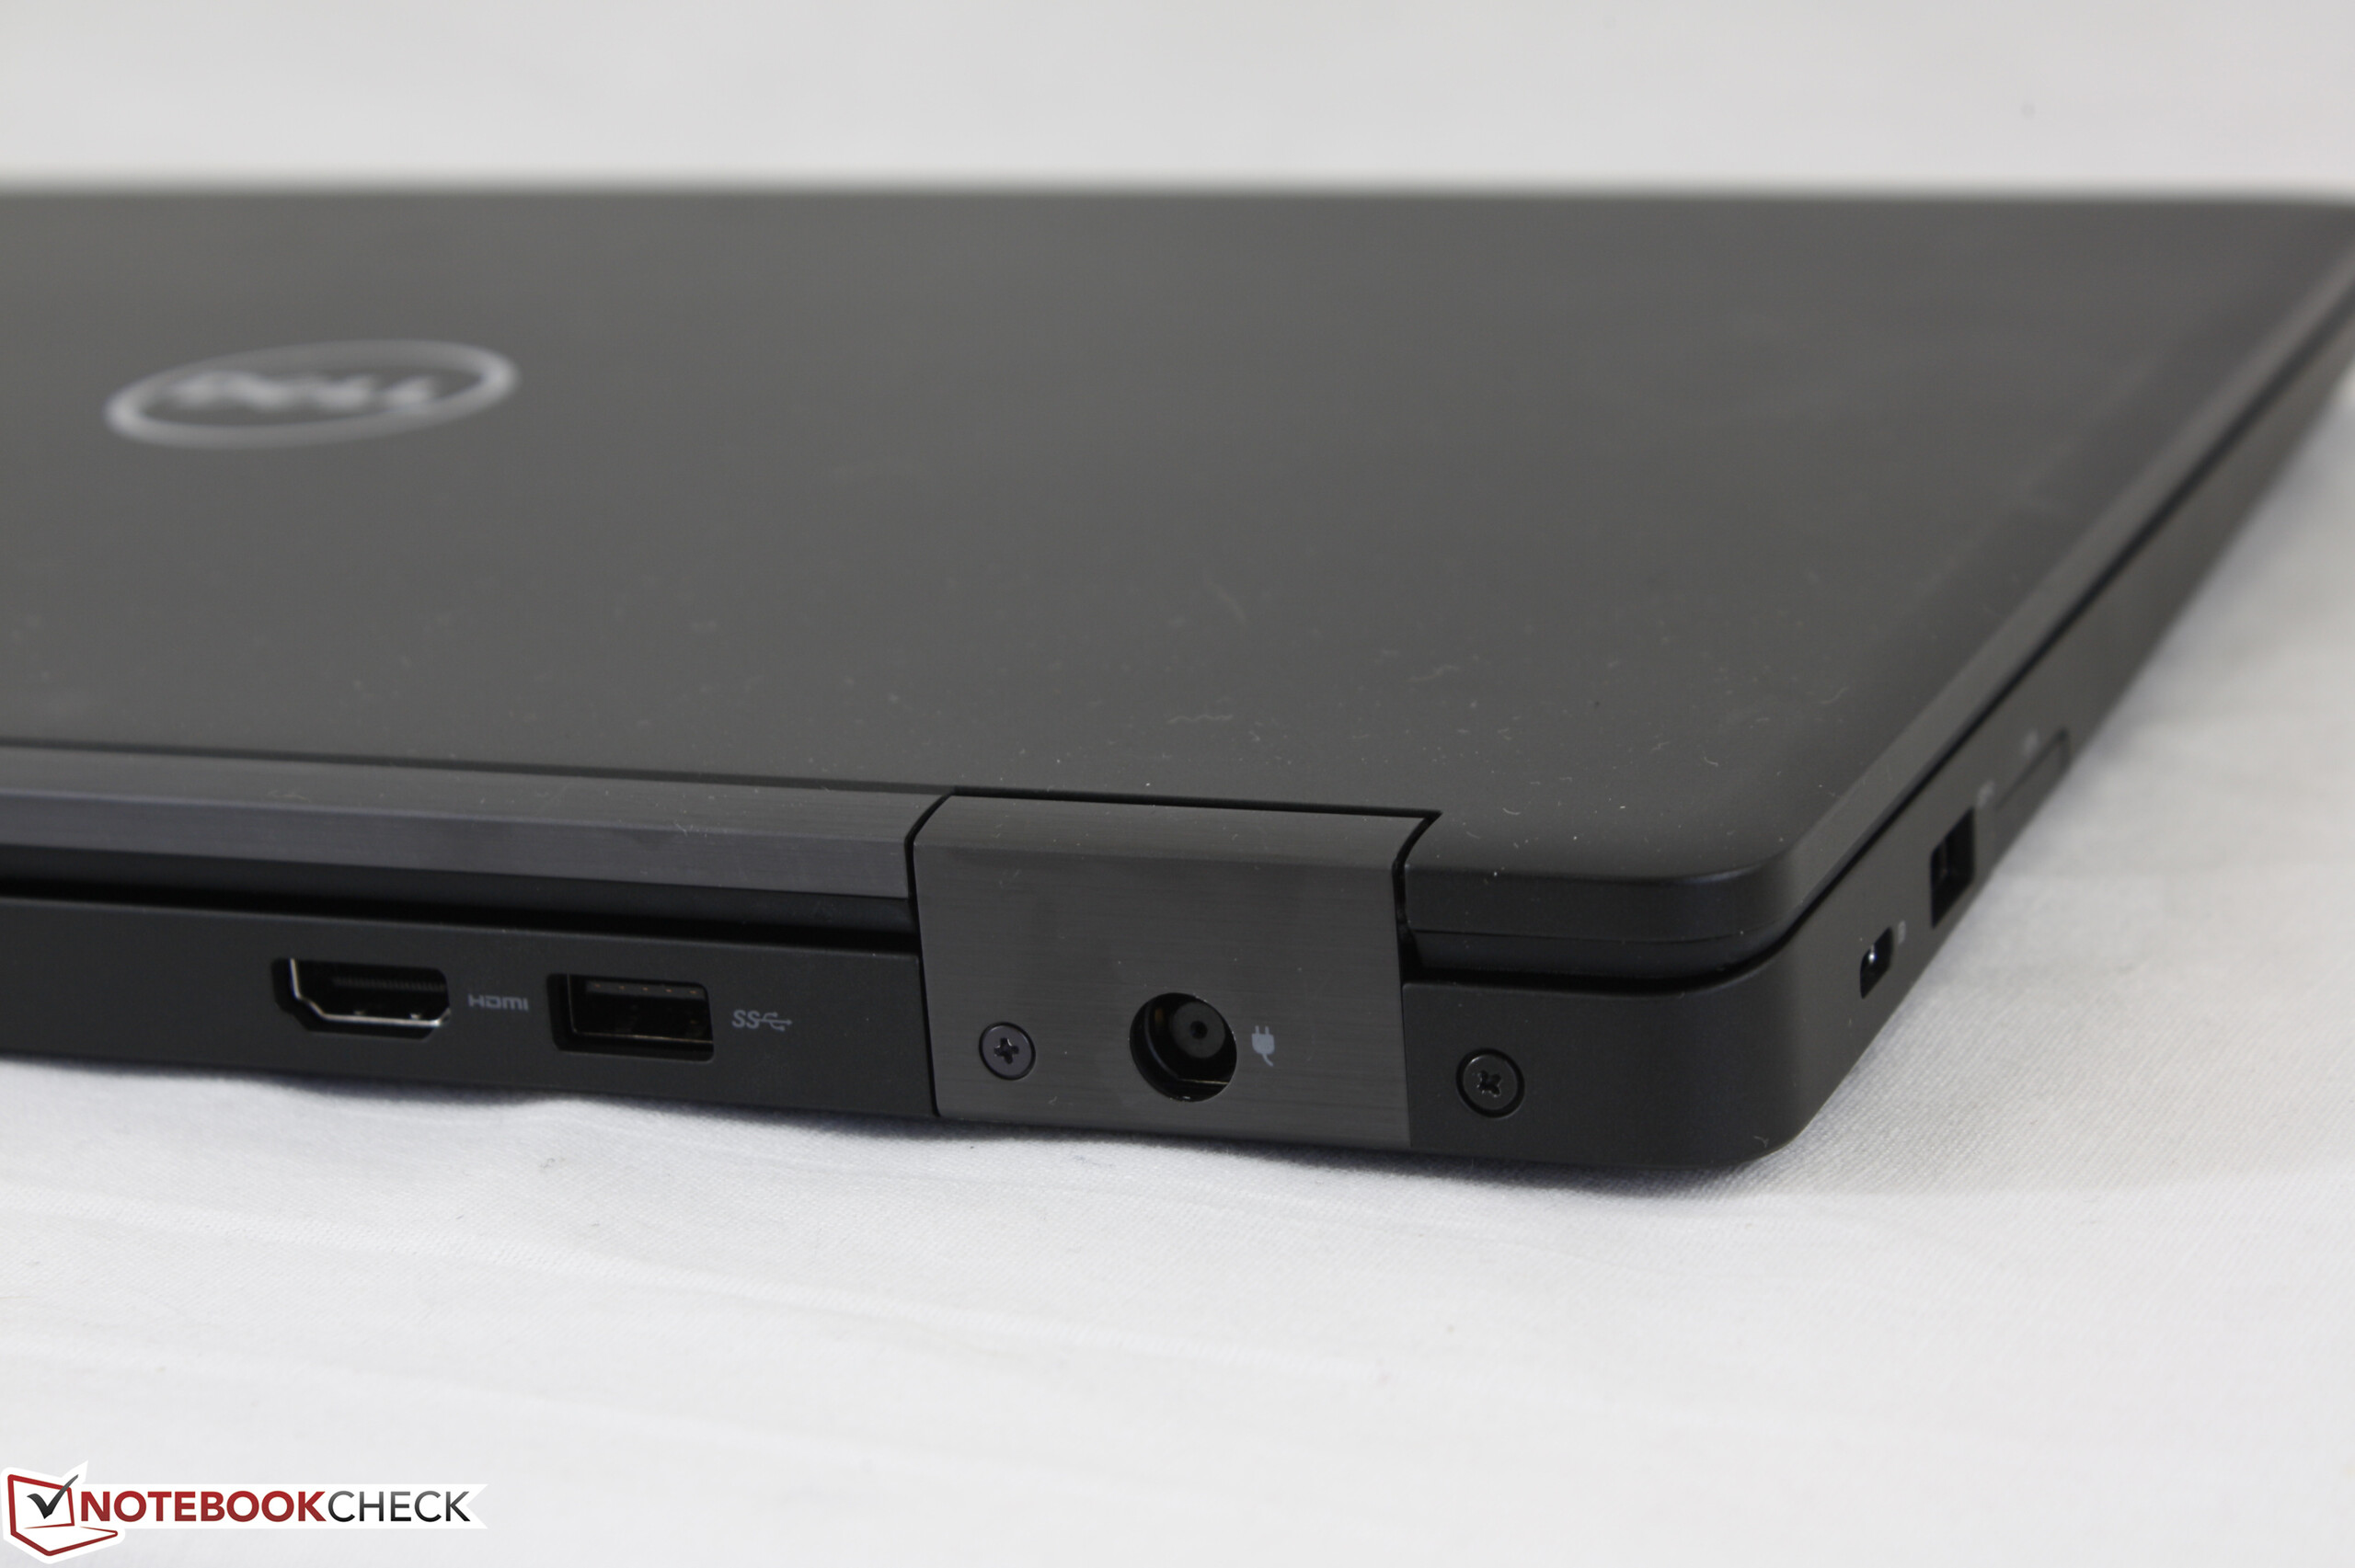
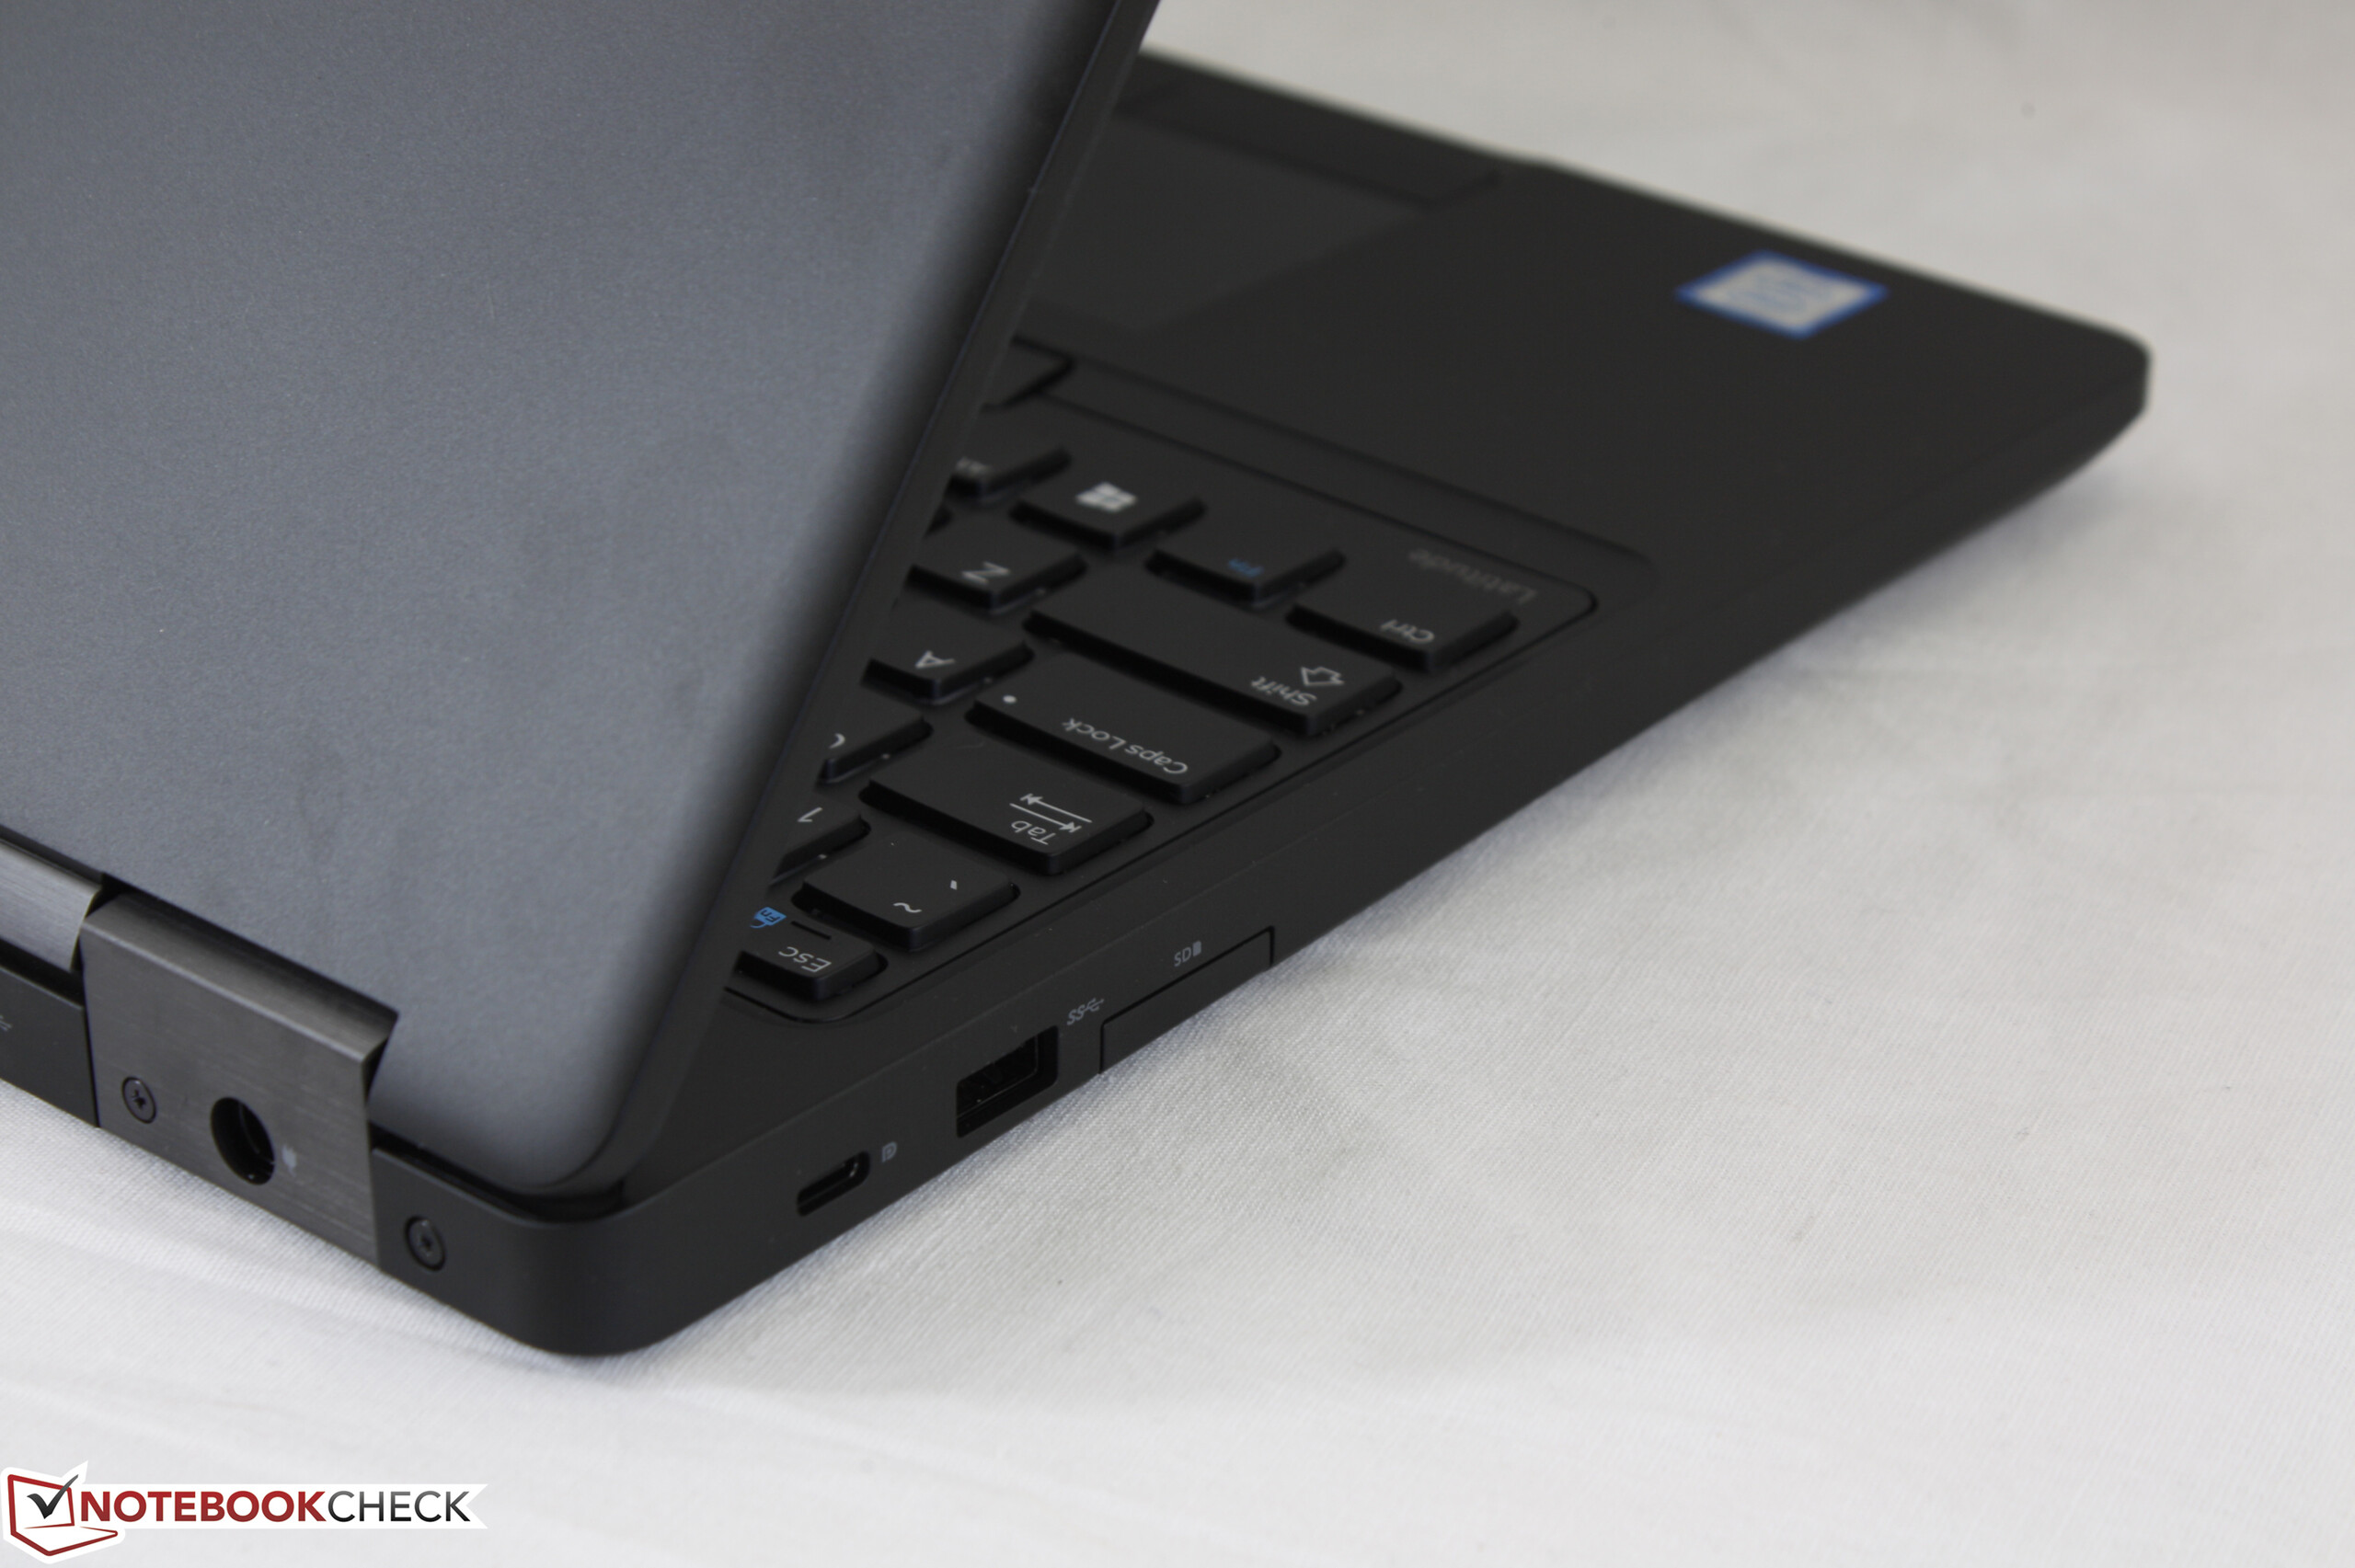
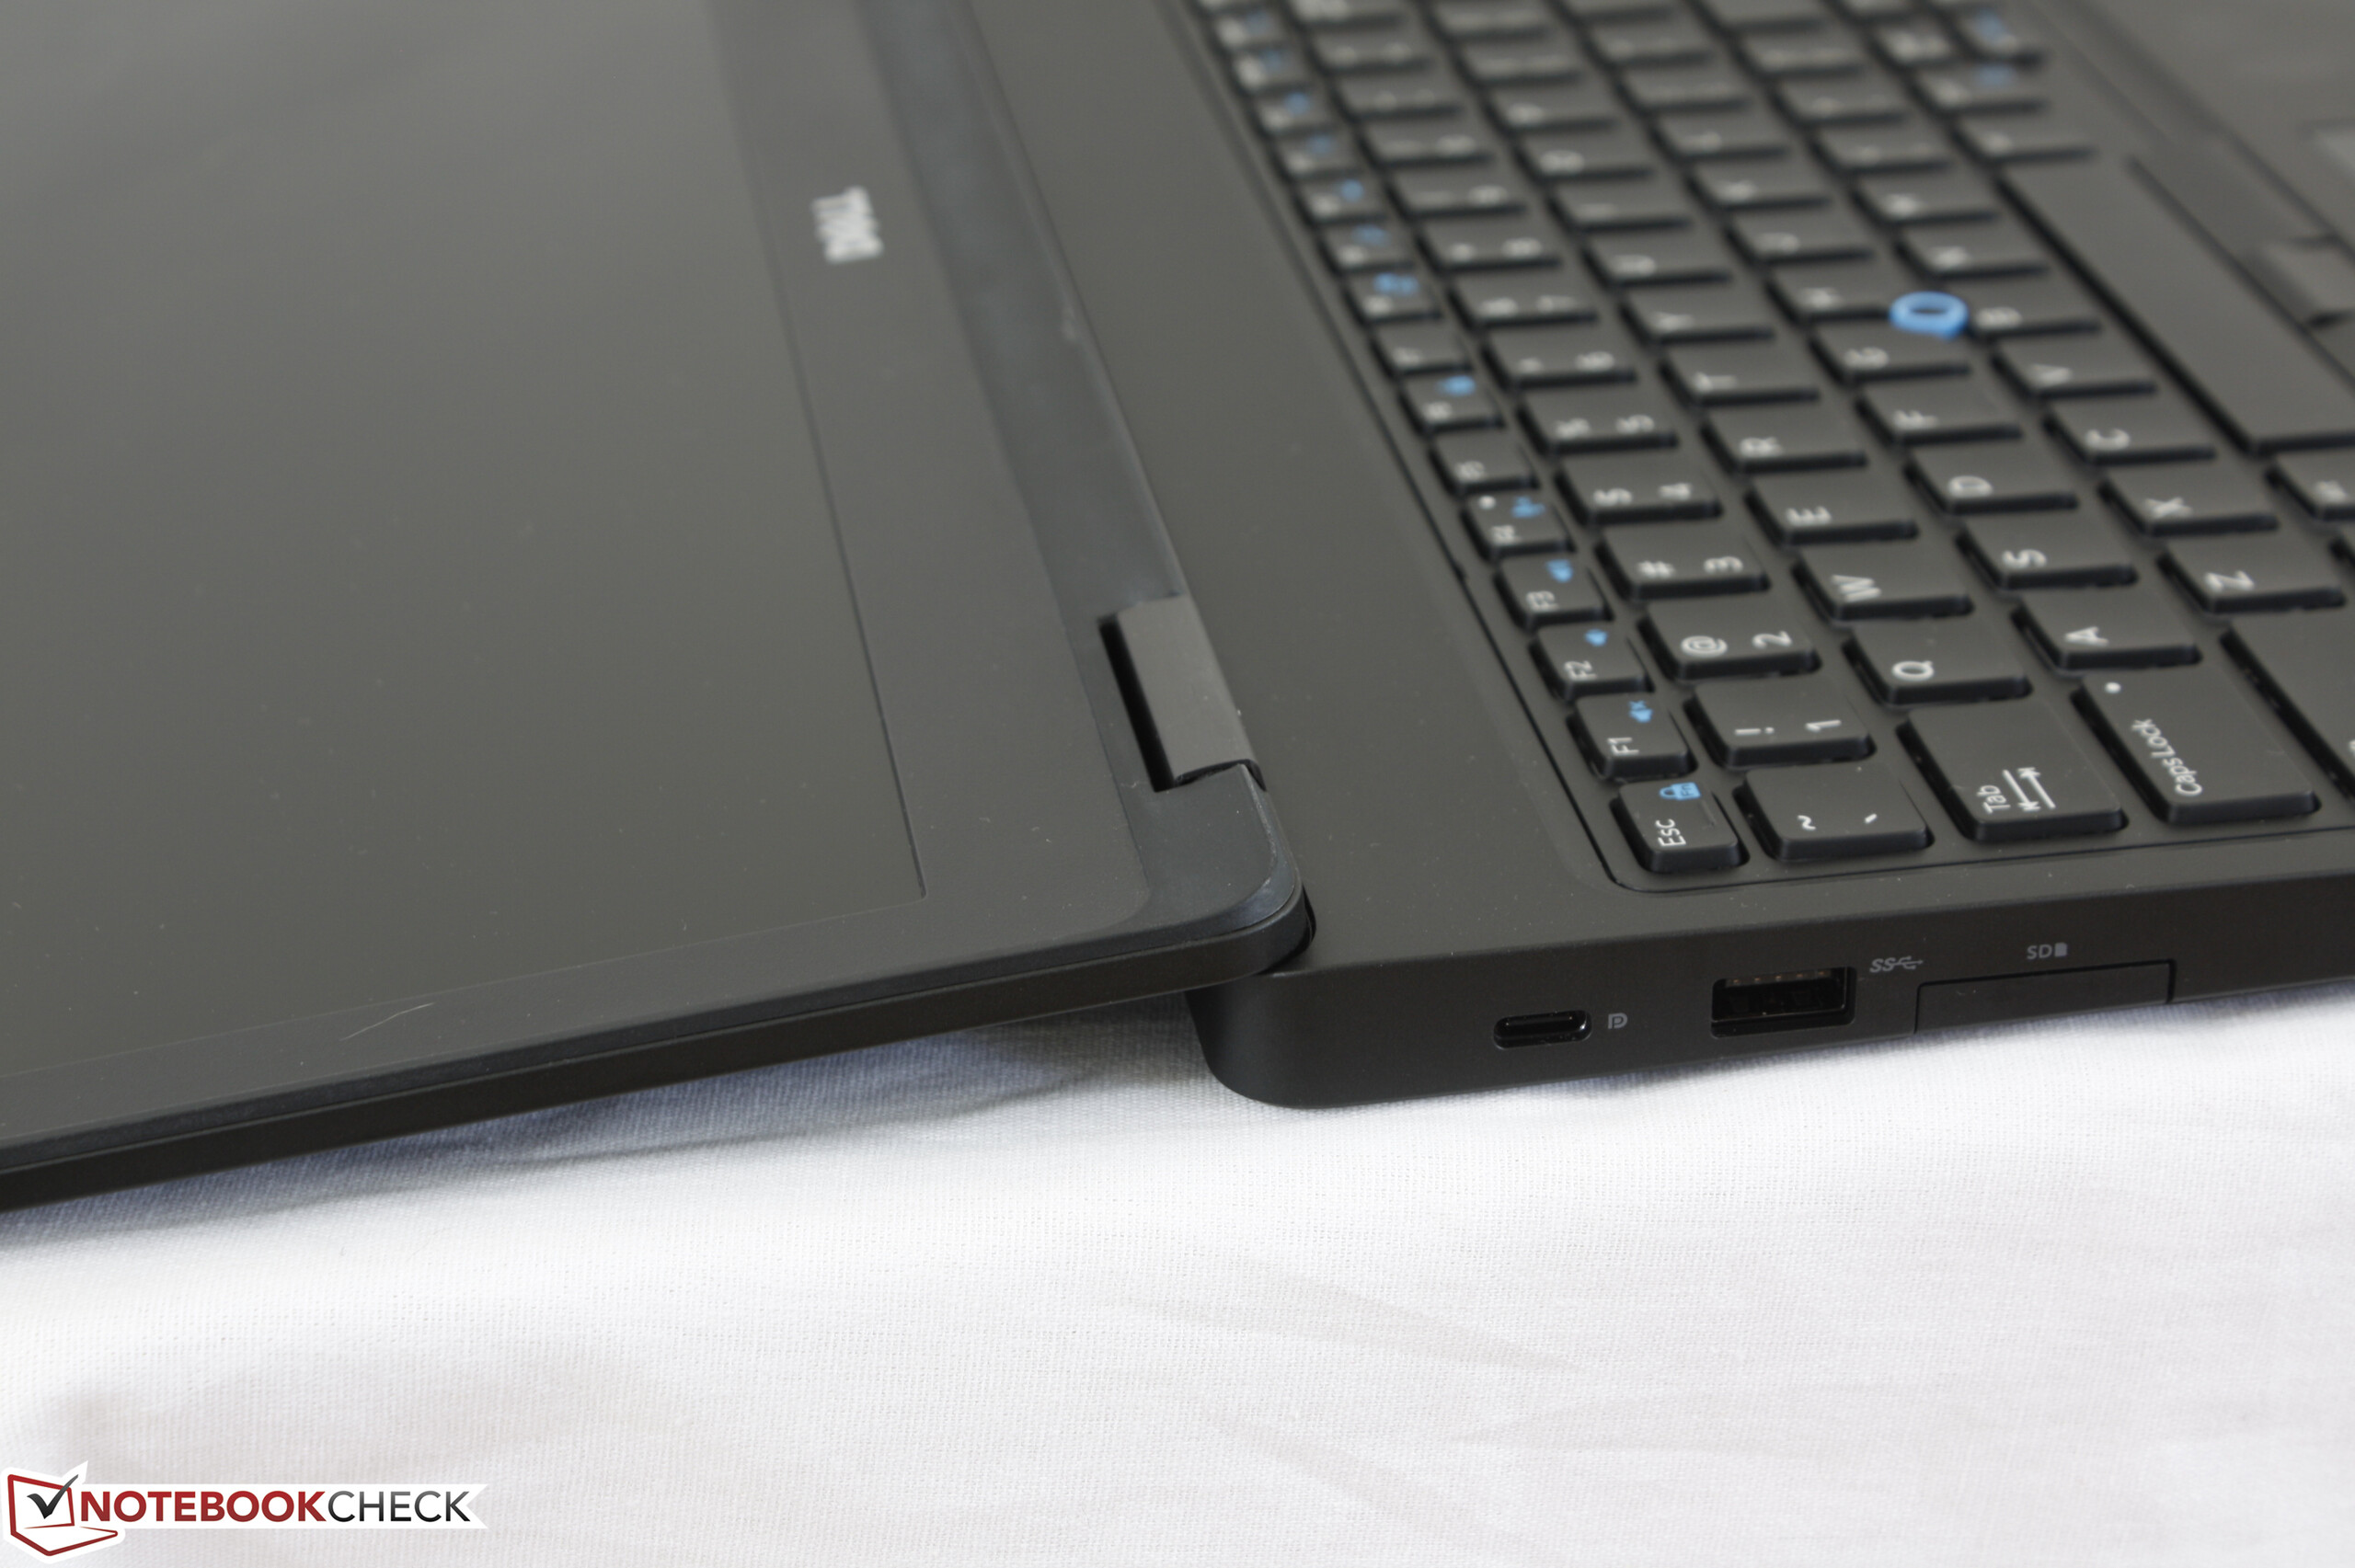
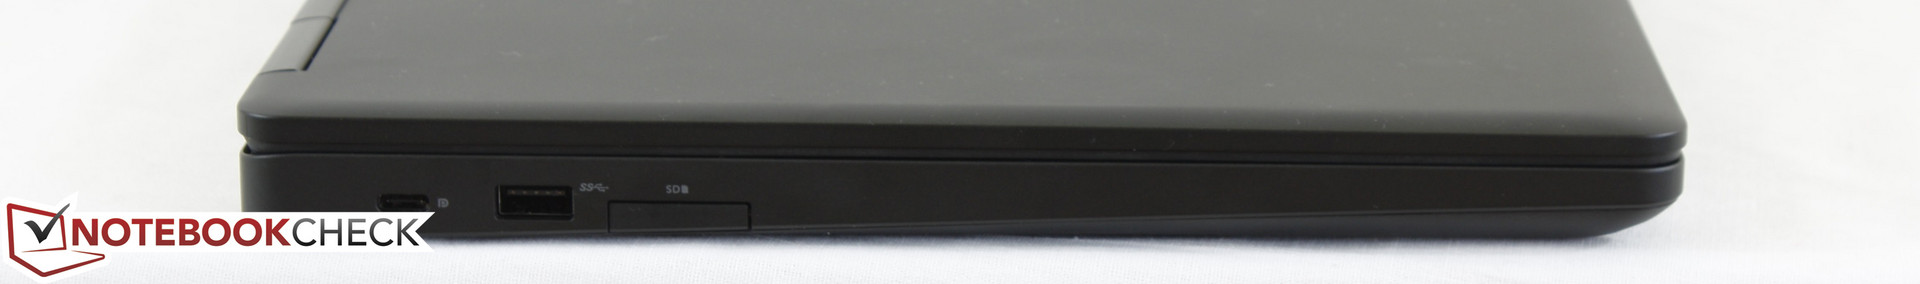
Ports are evenly distributed around the three edges of the notebook with one USB 3.0 port on each side. VGA, HDMI, and DisplayPort over USB Type-C all come standard for a wide variety of display output options. In comparison, the ThinkPad T570 has omitted VGA while the Satellite Pro R50-C includes more USB Type-A ports and an integrated optical drive. Thunderbolt 3 support is optional but recommended to further increase the versatility of the notebook.
SD Card Reader
Dell has equipped the system with a very fast SD reader capable of transfer rates of around 250 MB/s from our UHS-II test card. In comparison, most Ultrabooks are limited to transfer rates of under 100 MB/s. Nonetheless, transferring 1 GB worth of data from our SD card to desktop will still take about 12 seconds since the mechanical drive is a bottleneck to write speeds.
An inserted SD card sits flush against the notebook edge to allow safe carrying without damaging or bending the card.
| SD Card Reader | |
| average JPG Copy Test (av. of 3 runs) | |
| Dell XPS 15 9560 (i7-7700HQ, UHD) | |
| Dell Latitude 5580 | |
| Lenovo ThinkPad T570-20H90002GE | |
| maximum AS SSD Seq Read Test (1GB) | |
| Dell Latitude 5580 | |
| Dell XPS 15 9560 (i7-7700HQ, UHD) | |
| Lenovo ThinkPad T570-20H90002GE | |
Communication
Compatibility with 802.11ac networks is standard across all SKUs. Our test unit comes equipped with the Intel 8265 capable of theoretical transfer rates of up to 867 Mbps. A real-world test standing one meter away from our Linksys EA8500 router returns a transfer rate of 655 Mbps and we experienced no connectivity issues during our time with the unit.
Both WWAN and NFC are optional depending on the SKU. Wigig, however, is not compatible with the Intel 8265.
| Networking | |
| iperf3 transmit AX12 | |
| Asus AsusPro P4540UQ-FY0056R | |
| Lenovo ThinkPad T570-20H90002GE | |
| Dell Latitude 5580 | |
| iperf3 receive AX12 | |
| Dell Latitude 5580 | |
| Lenovo ThinkPad T570-20H90002GE | |
| Asus AsusPro P4540UQ-FY0056R | |
Security
Both Dell and HP have been pushing multi-factor authentication to make unauthorized entries more difficult. Intel vPro, Dell ControlVault, and optional fingerprint, Smart Card, and NFC readers all make their return.
Accessories
No included extras are in the box outside of a Quick Start guide and AC adapter. Users may want to consider configuring with Thunderbolt 3 compatibility in order to utilize external docking stations and 4K monitors since the Latitude 5580 has dropped the dedicated E-port found on the older E5570.
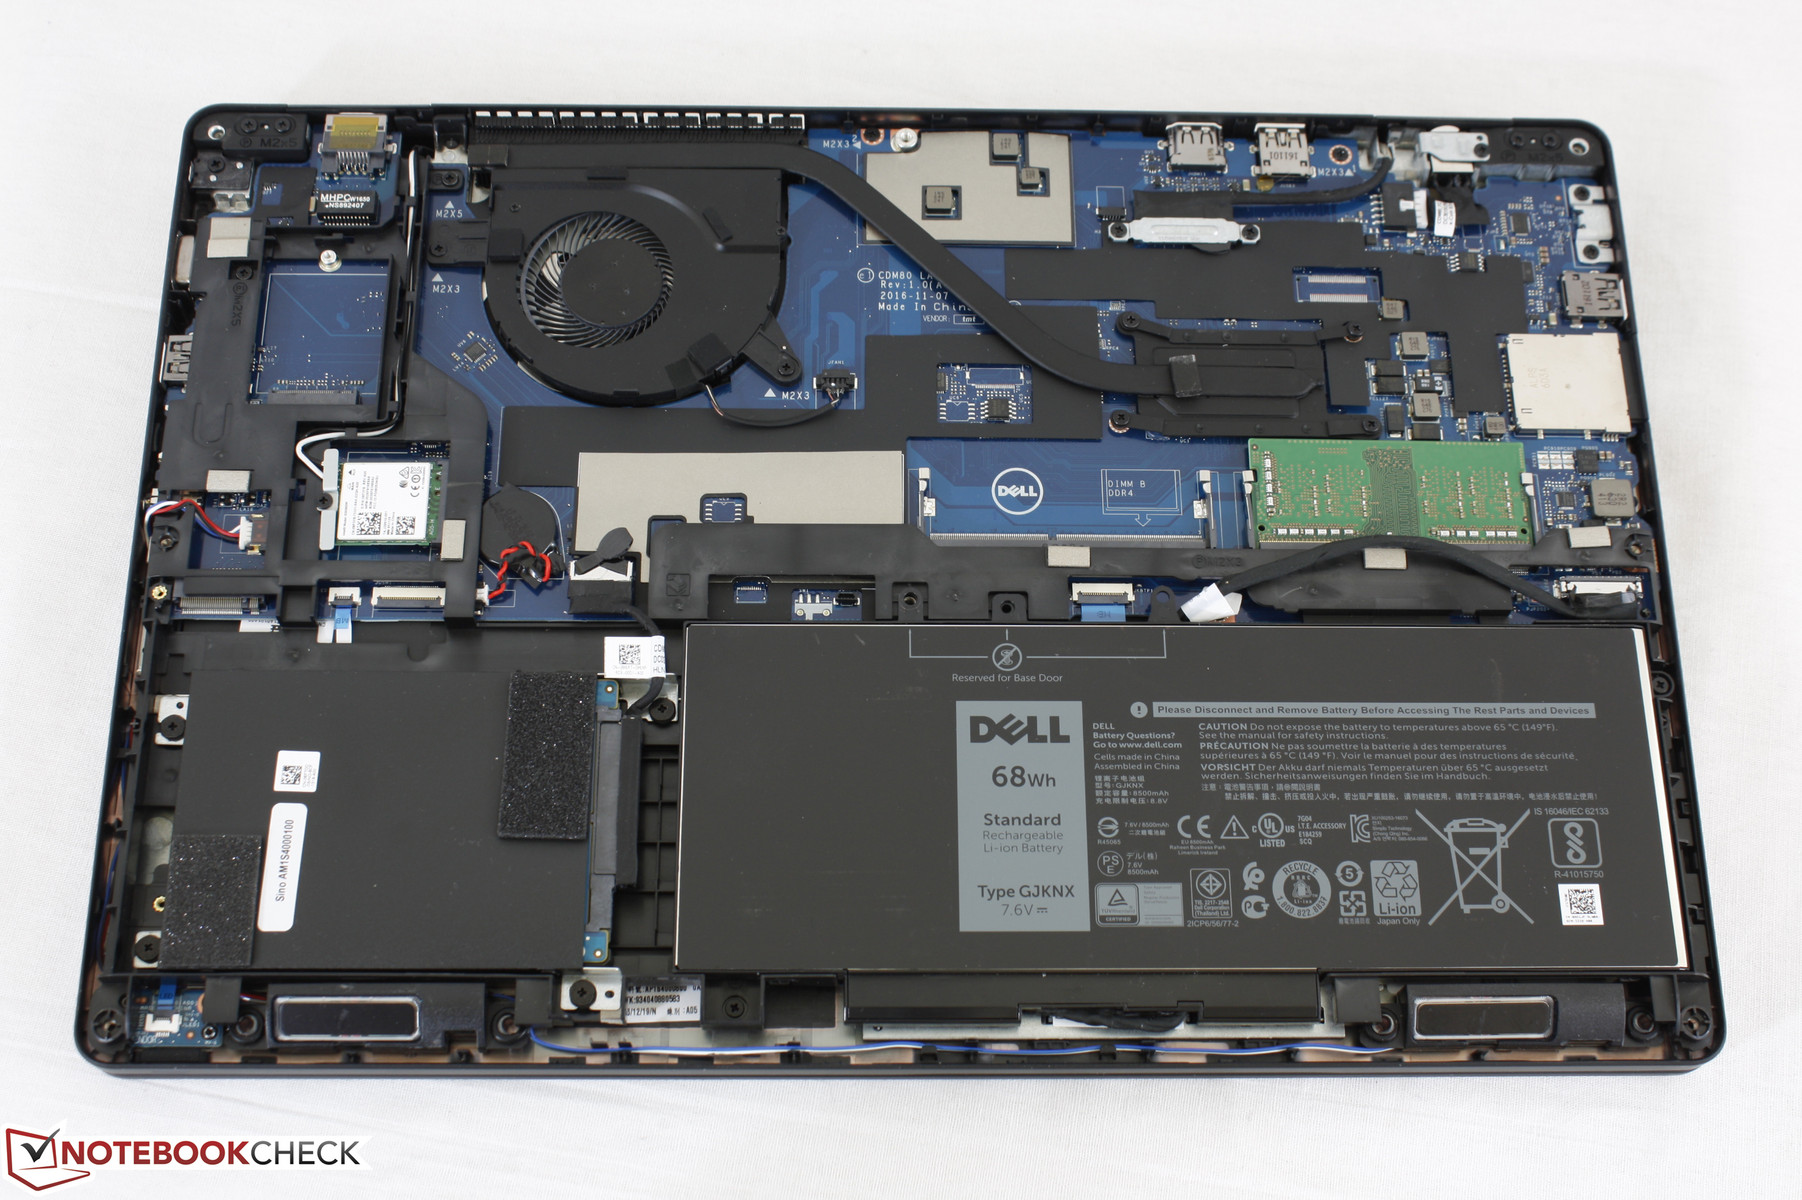
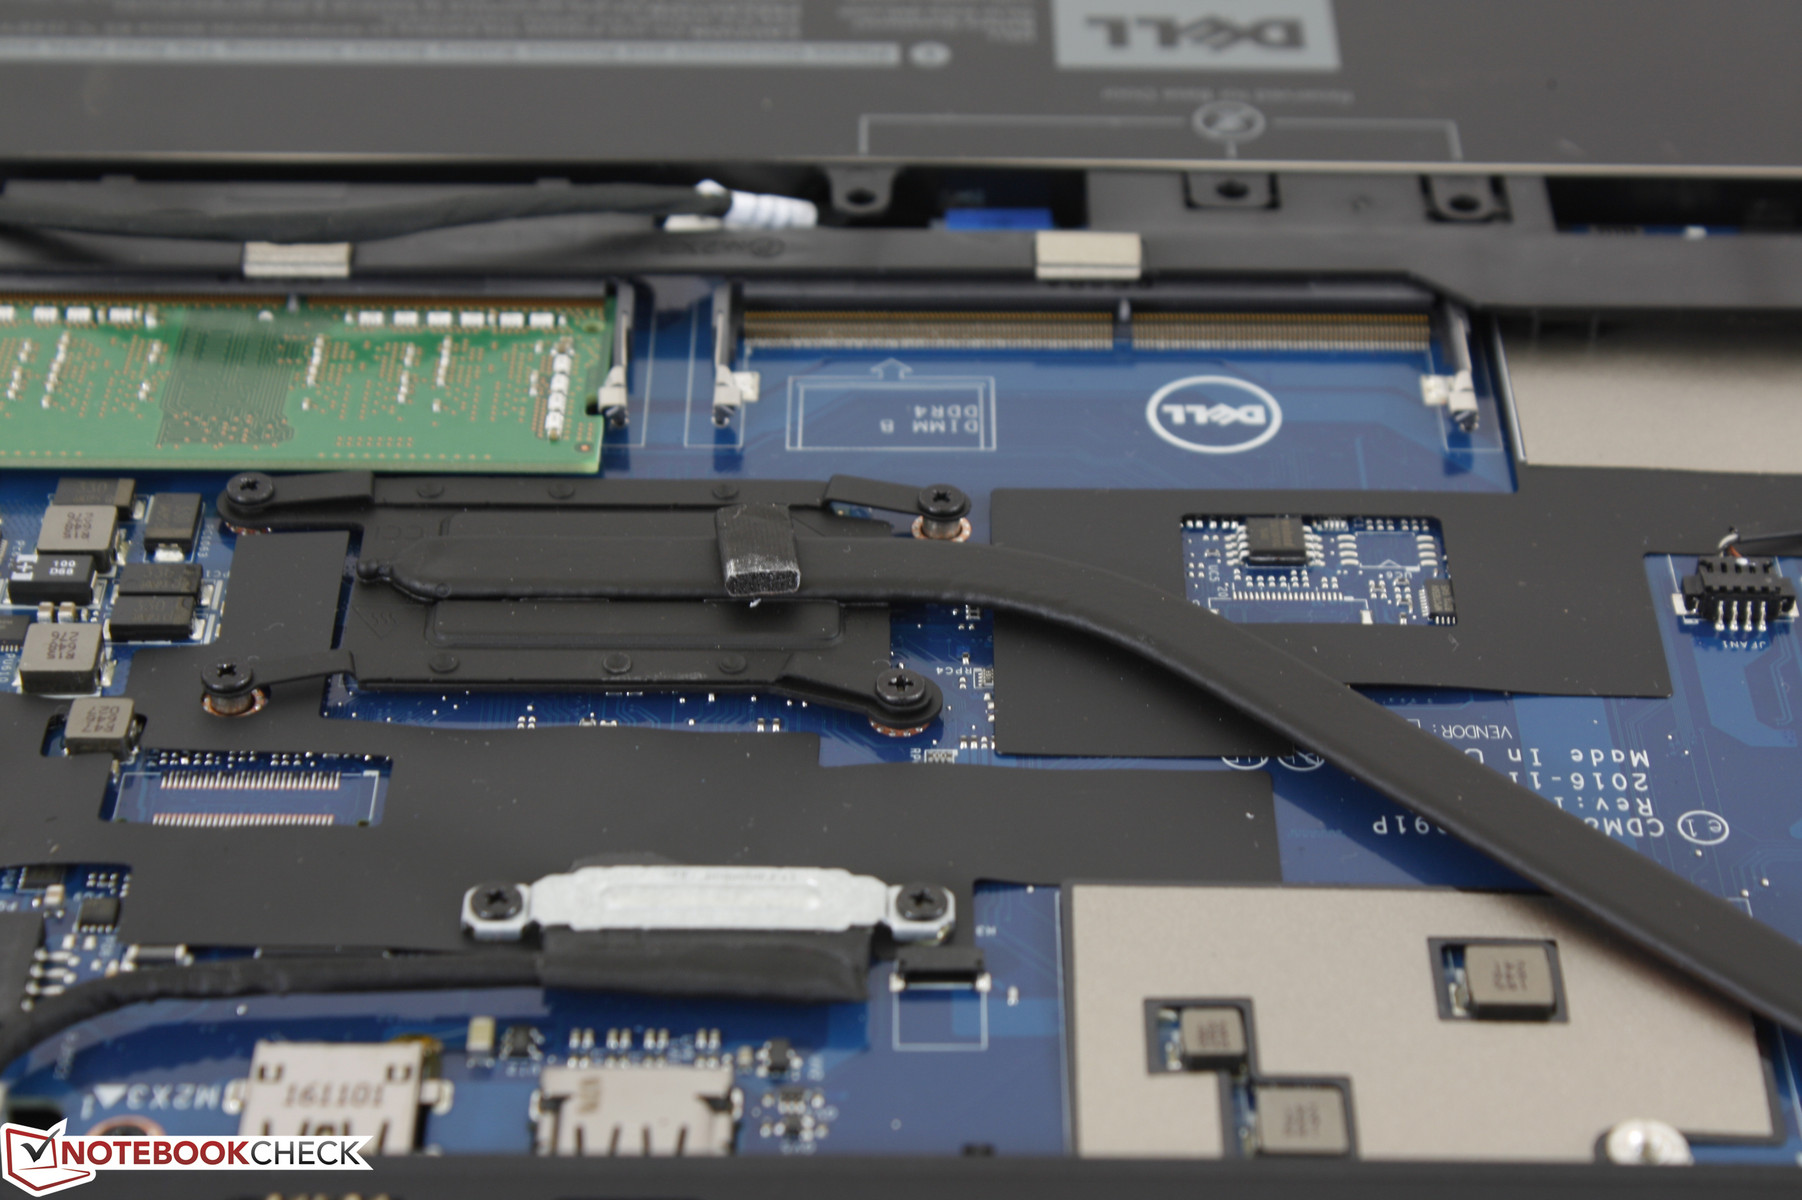
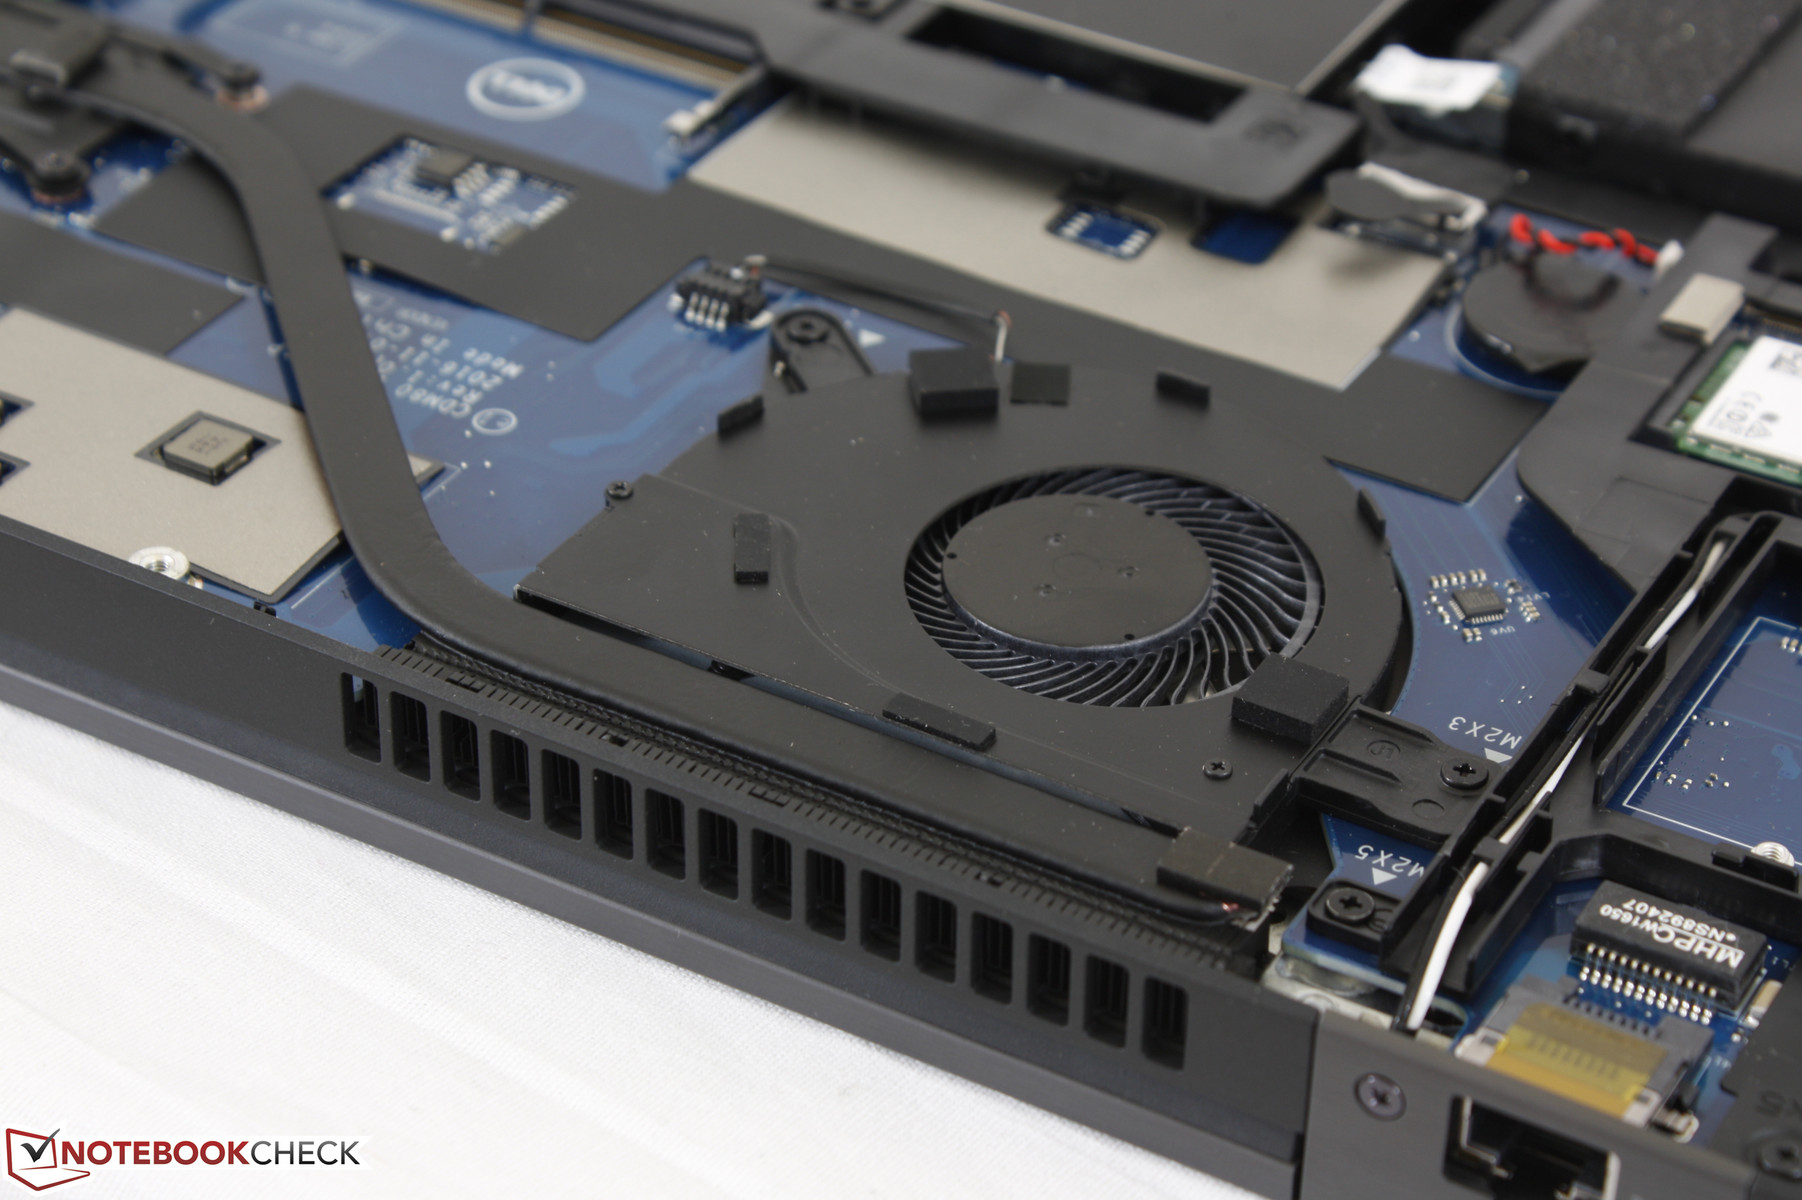
Maintenance
Serviceability is straightforward as the bottom panel comes off easily with only a Philips screwdriver. Users are granted direct access to the system fan, all three storage bays, both SODIMM slots, WLAN module, and the internal battery. When compared to the E5570, the 5580 has relocated its ventilation grilles to the rear where of the unit where exhaust will be less noticeable. Dell provides a handy manual for users who wish to disassemble the notebook further.
Warranty
As usual, Dell offers extensive warranty options for its business-class products. The standard one-year limited warranty can be extended to up to five years with optional data protection software and accidental damage protection. Please see our Guarantees, Return policies and Warranties FAQ for country-specific information.
Input Devices
Keyboard
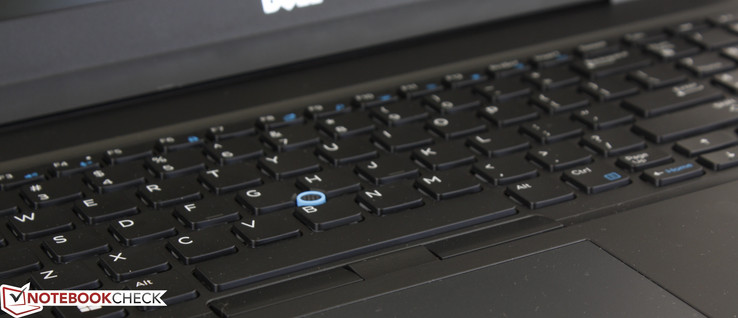
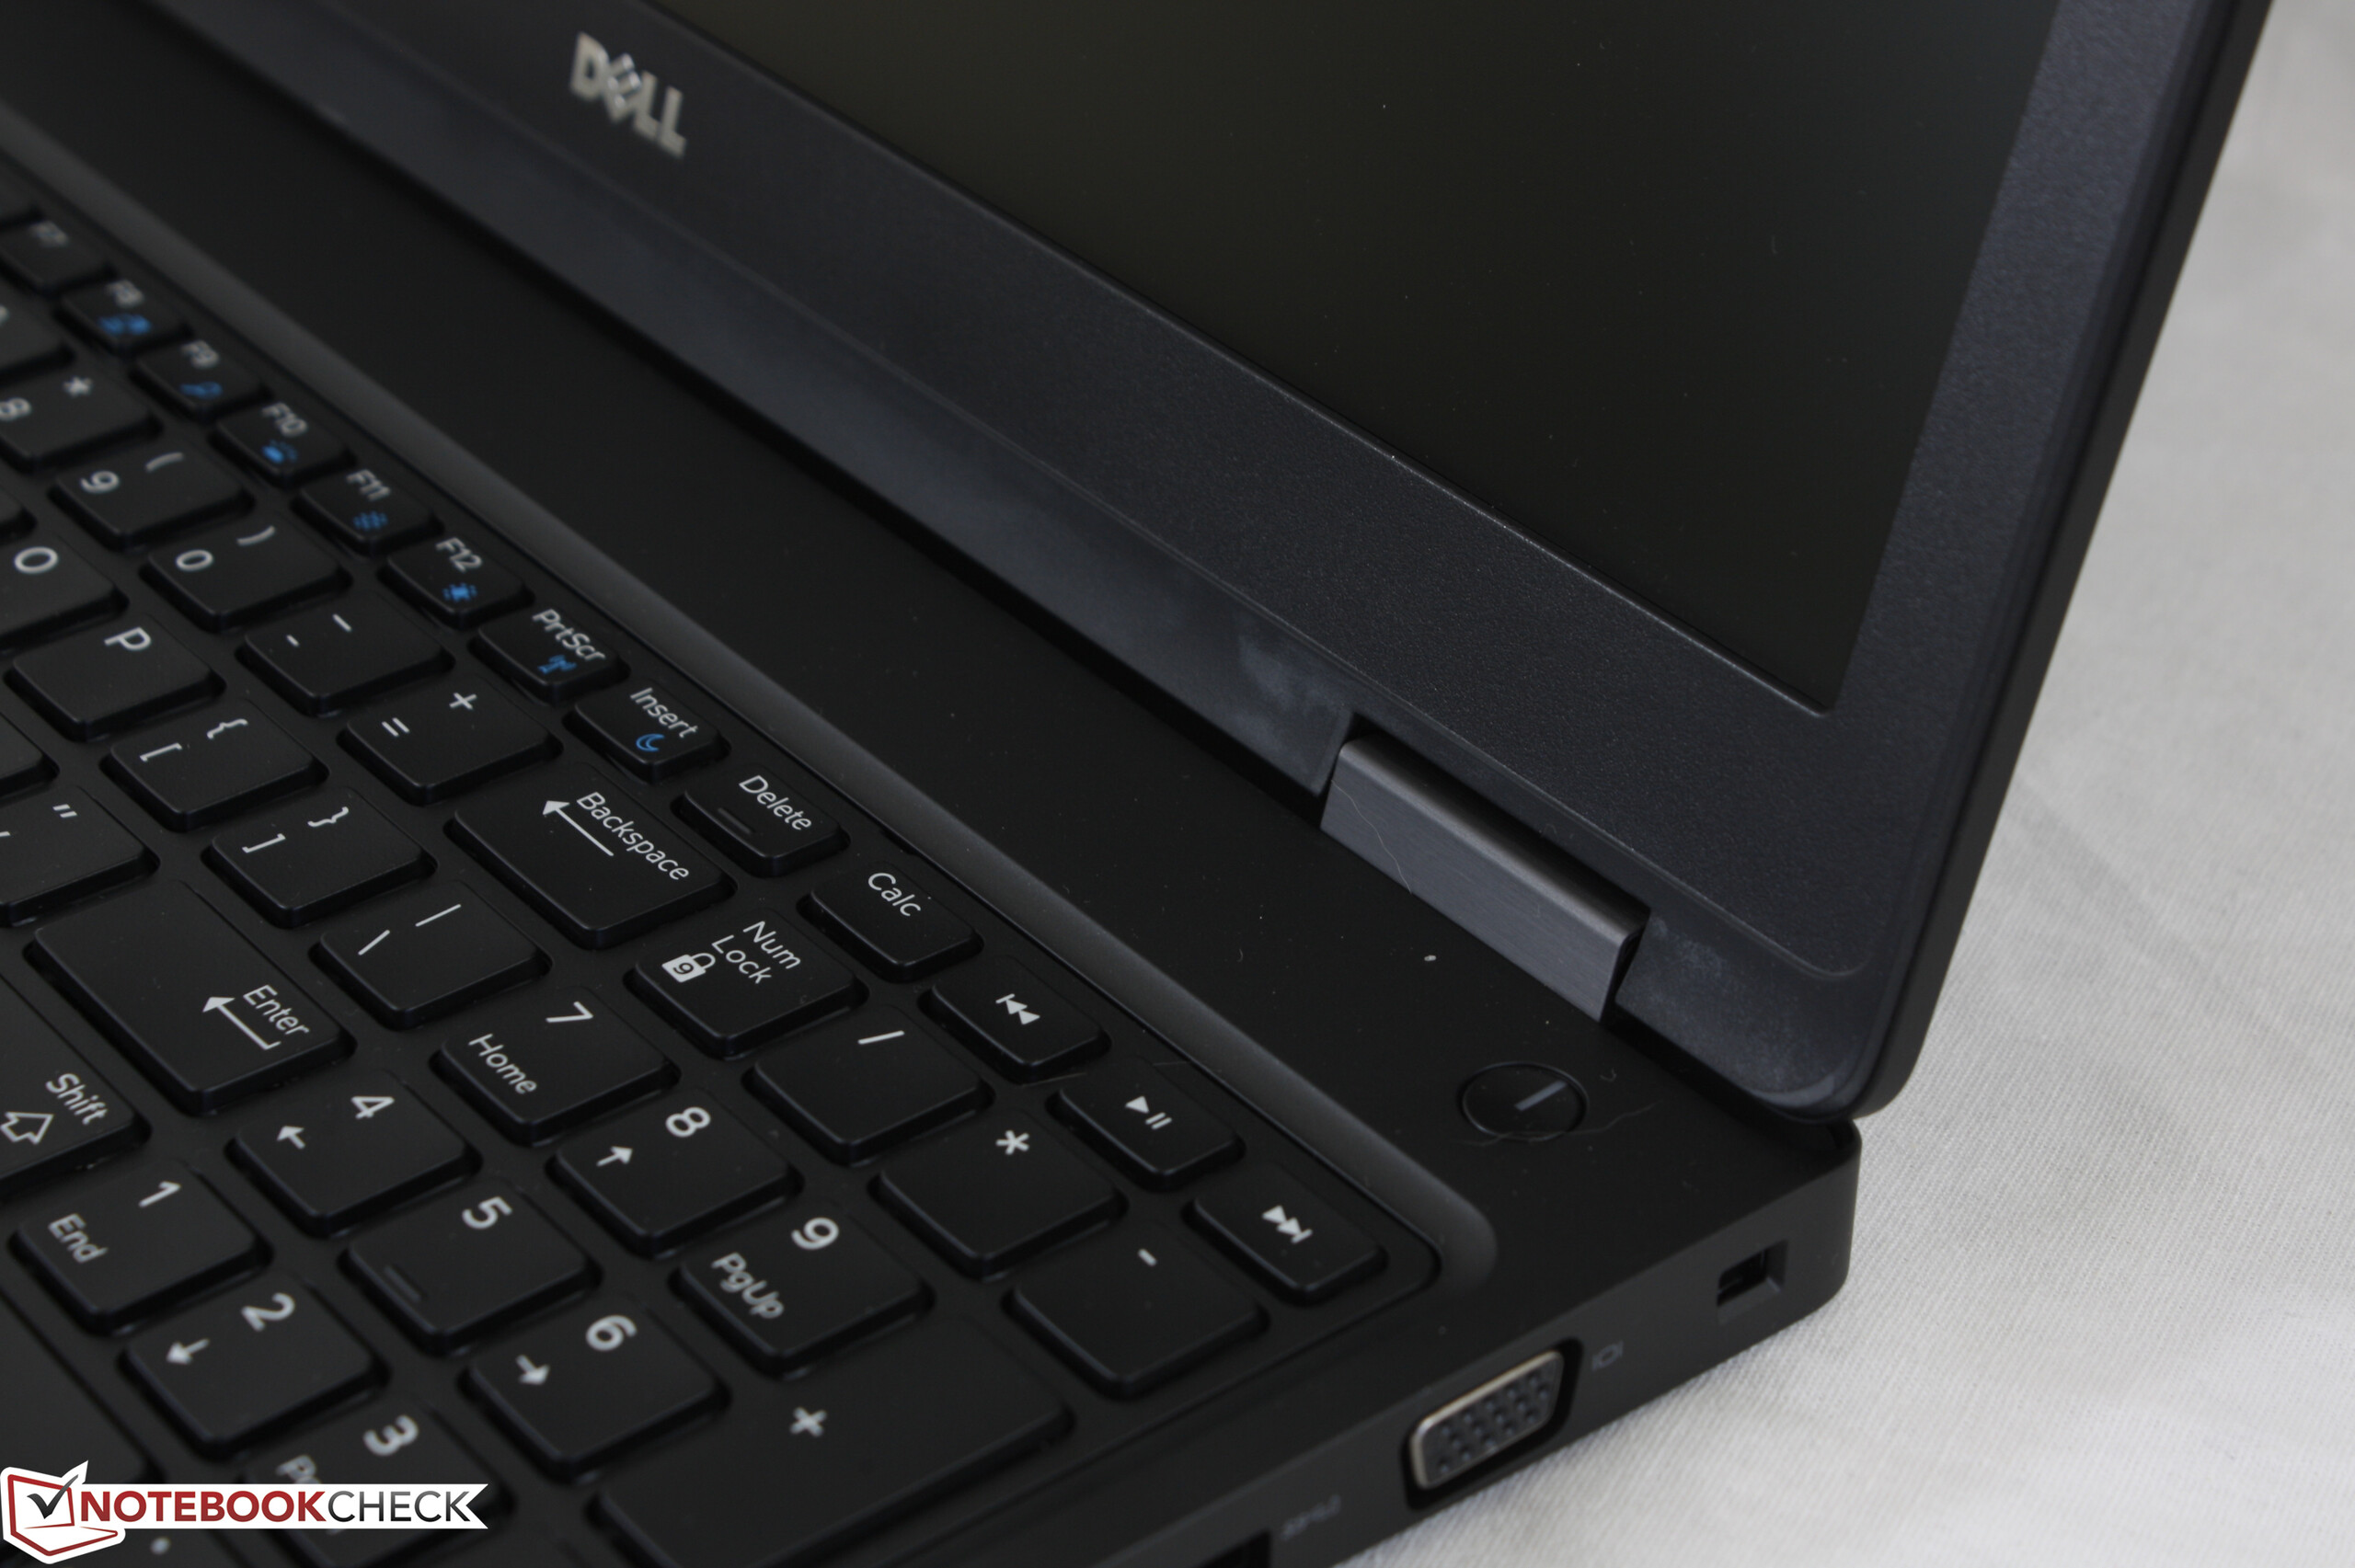
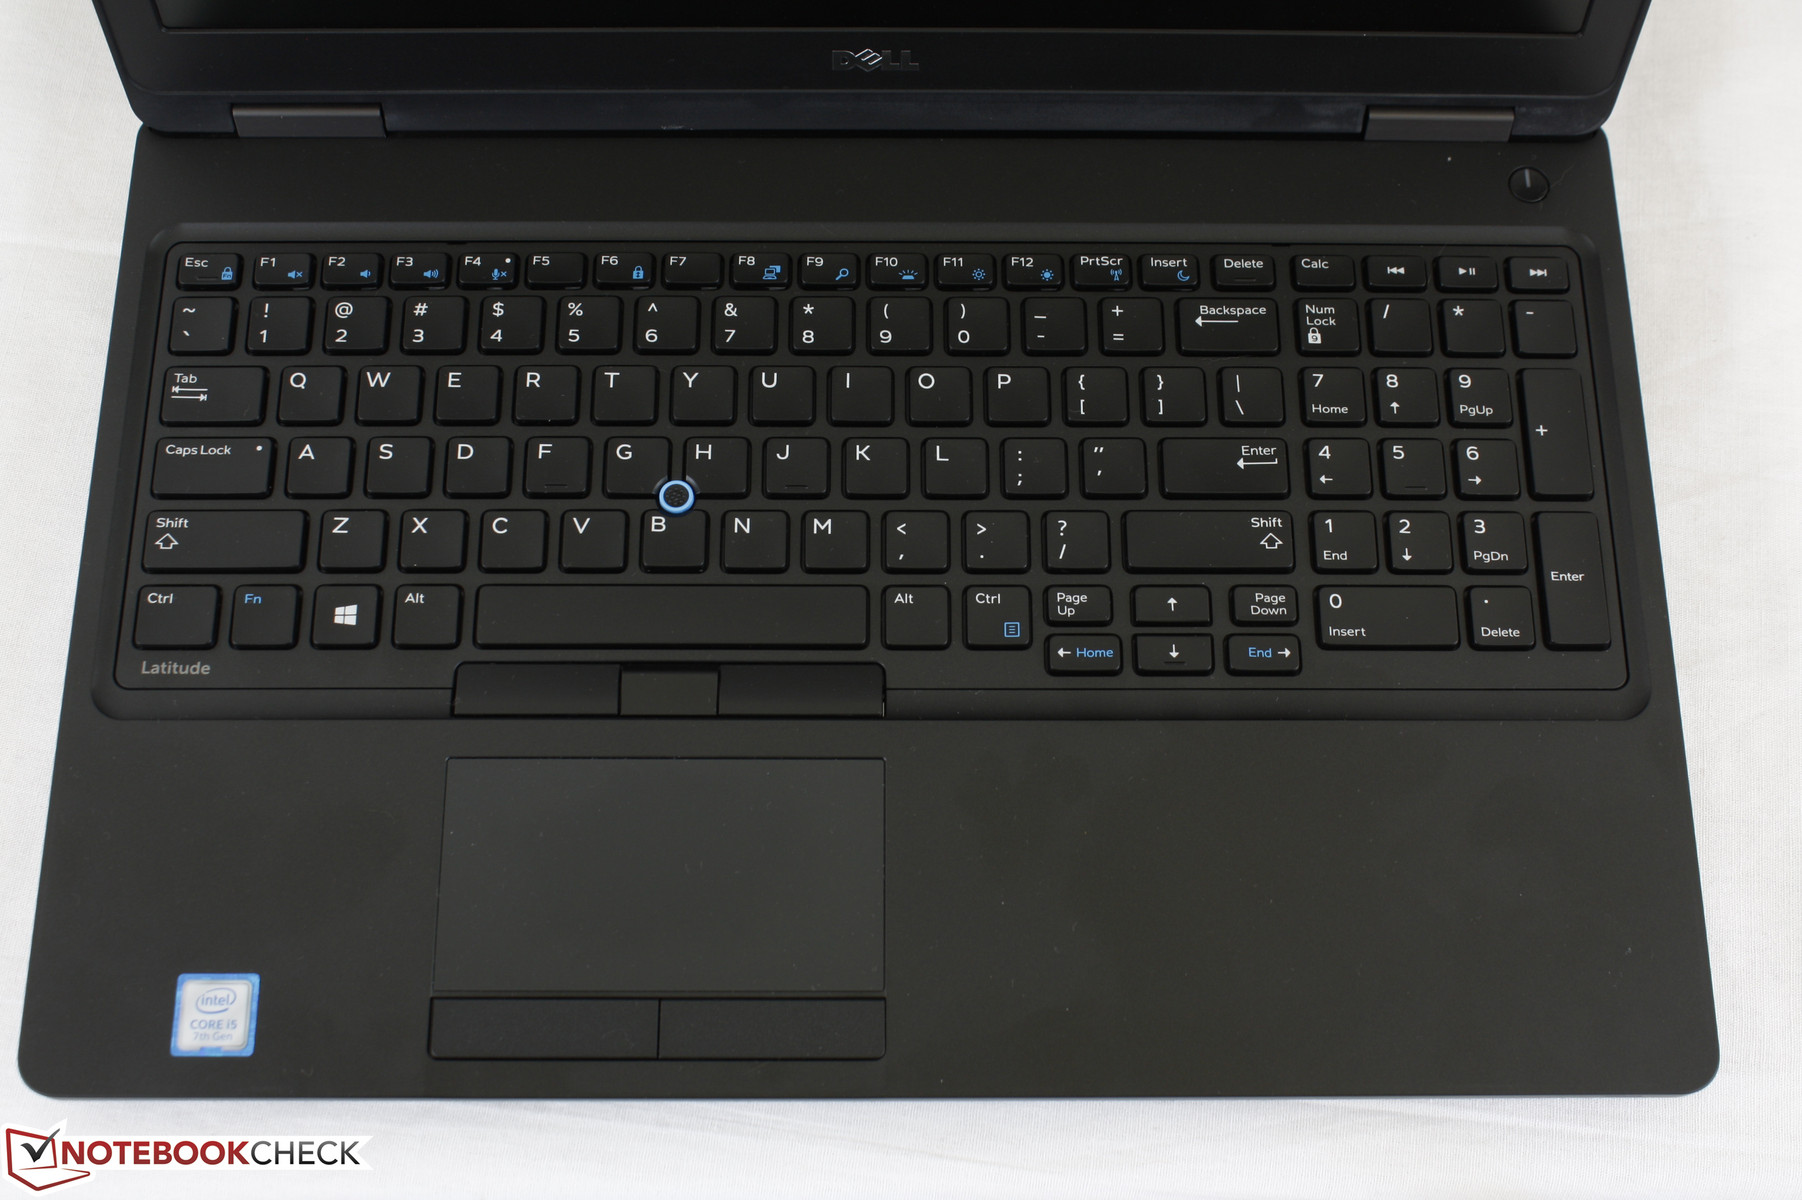
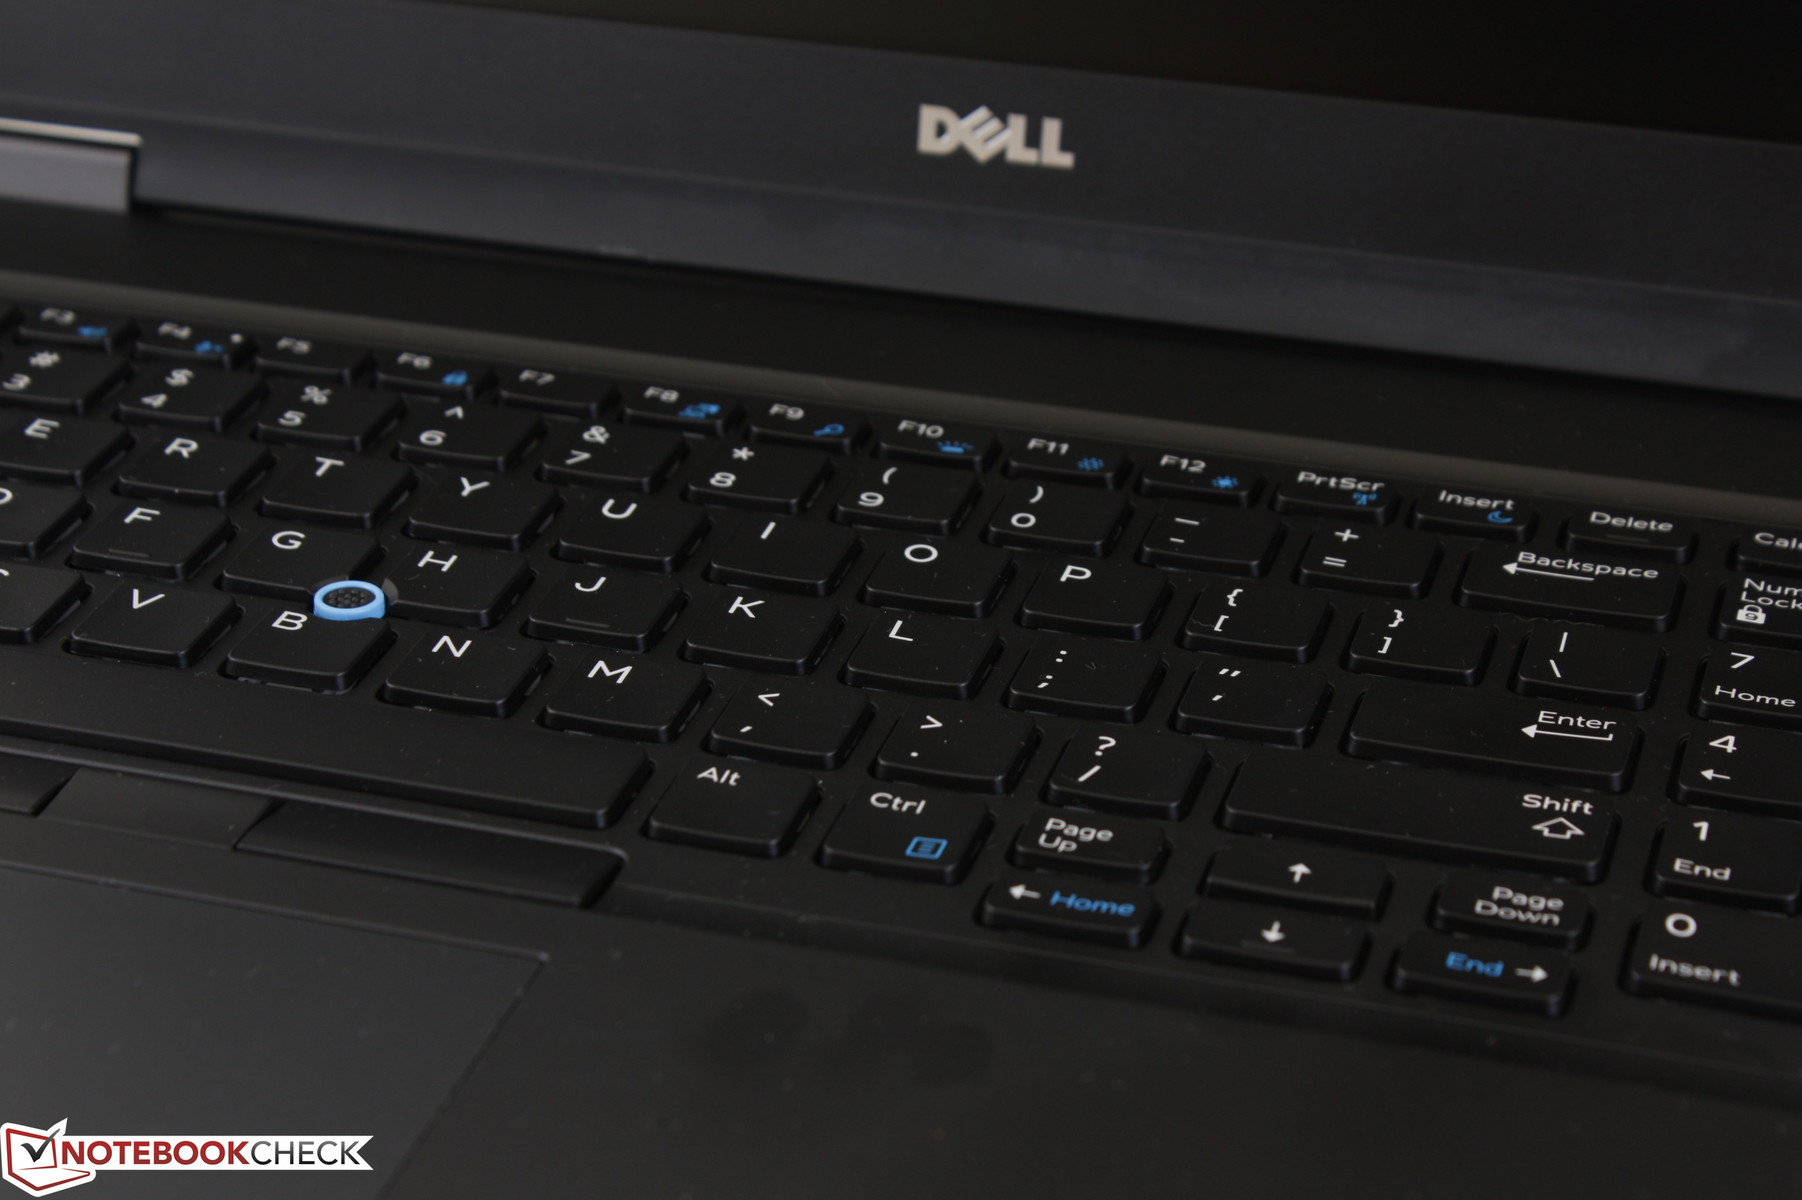
Both the layout and feel of the keyboard keys are untouched from previous iterations. This is far from being a complaint, however, as we've always found the keyboards on the Latitude 55x0 series to be firm with solid feedback. This includes the smaller Arrow and Function keys that can sometimes be spongier in feedback than the main QWERTY keys on other notebooks. Clatter is relatively quiet and the keys themselves are rigid and do not wiggle in place. When comparing directly to the keyboard of the XPS 15 9560, the one on the Latitude offers deeper travel, lower-pitched clatter, and stronger tactile feedback when pressed. Users who are frequently typing long emails should find the Latitude 5580 to be very comfortable to use.
A two-level white backlight comes standard across all SKUs. Backlighting is even from one corner to the other with no dead zones. Some more dedicated hotkeys catered to Skype such as camera toggling or ending/initiating calls with just one click would have been neat additions.
Touchpad
The firm trackpad (10.0 x 5.3 cm) works as expected with responsive cursor control and no jitters even when gliding slowly across its slightly roughened surface. Multi-touch inputs are reliable and applying pressure on the trackpad will not significantly warp its surface. The familiar pointing stick is still available should users prefer it.
The five dedicated mouse keys surrounding the touchpad are not as impressive. While feedback is very quiet, the keys feel spongy to press. The front two keys in particular wiggle in place more than we would like and feel cheap compared to the rest of the notebook.
Display
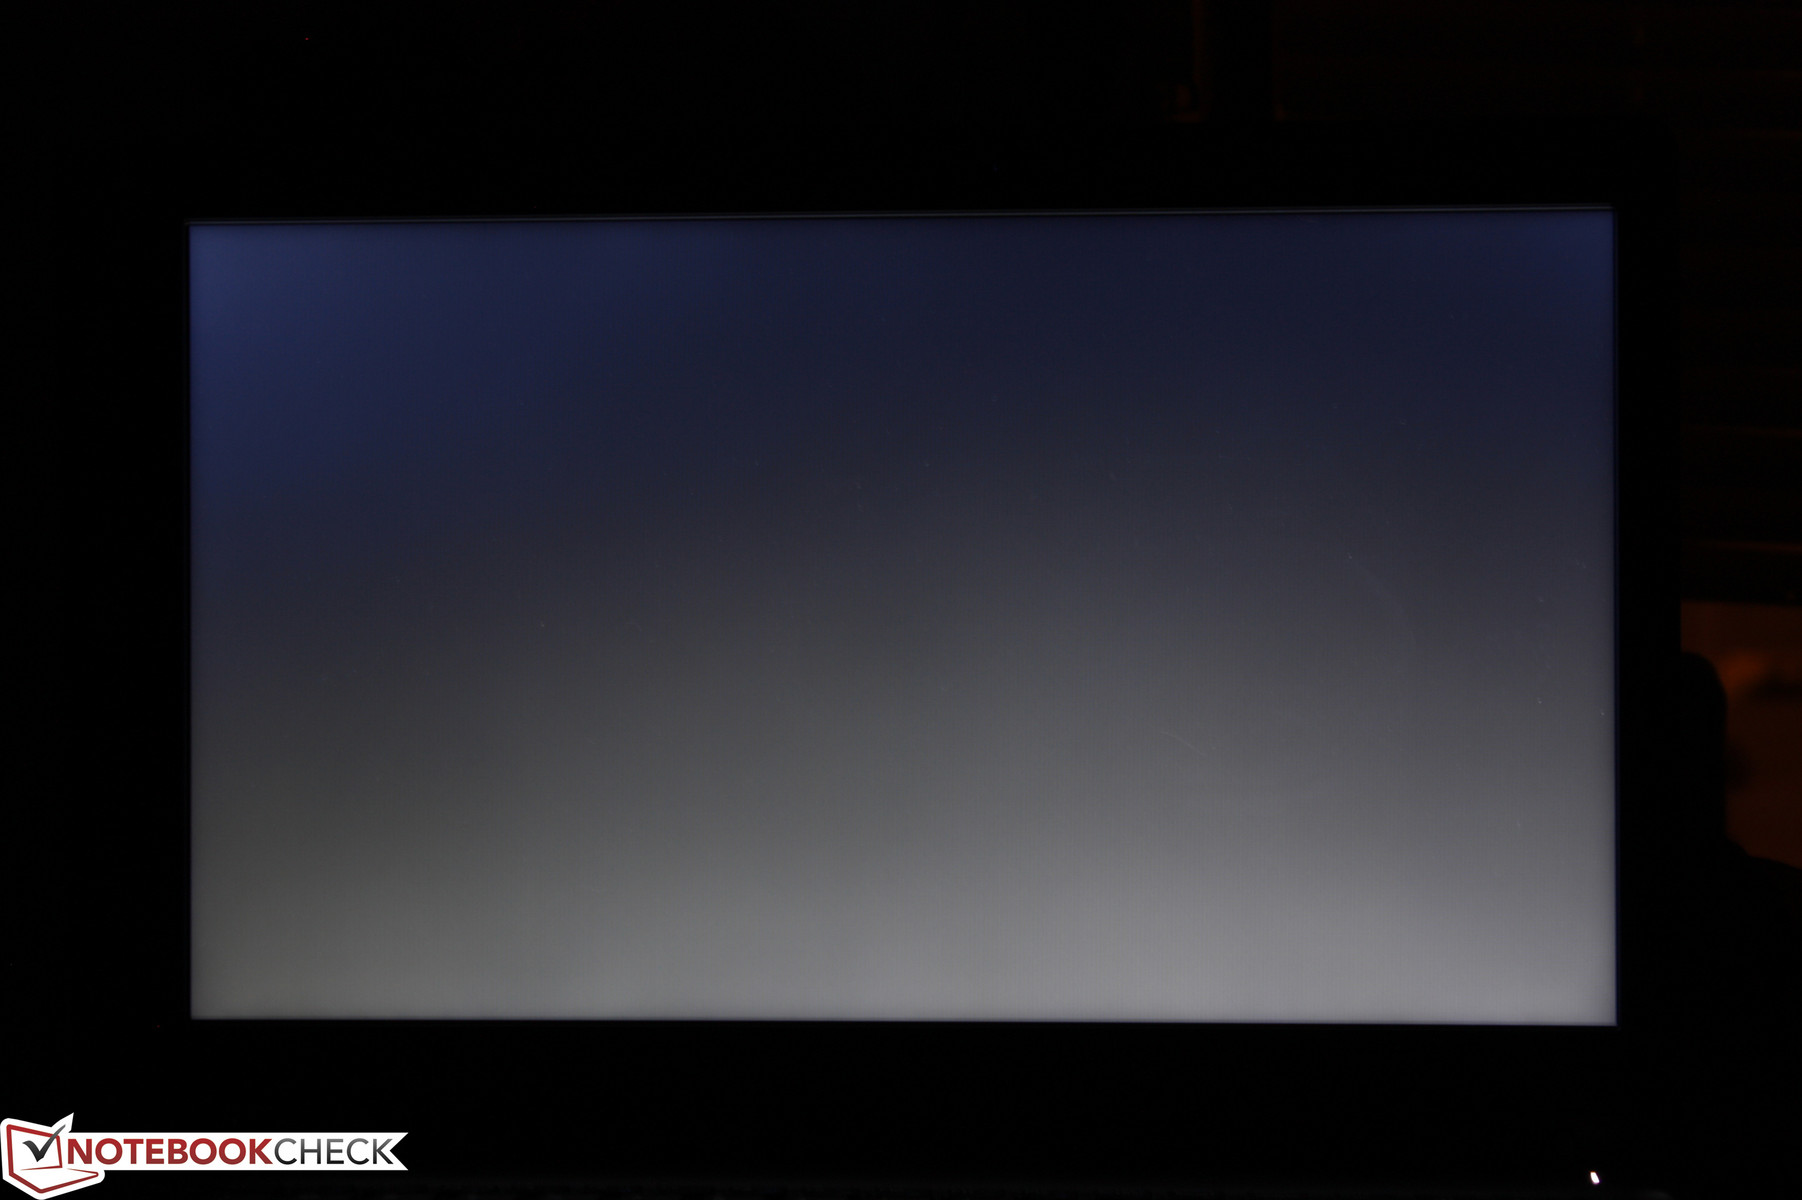
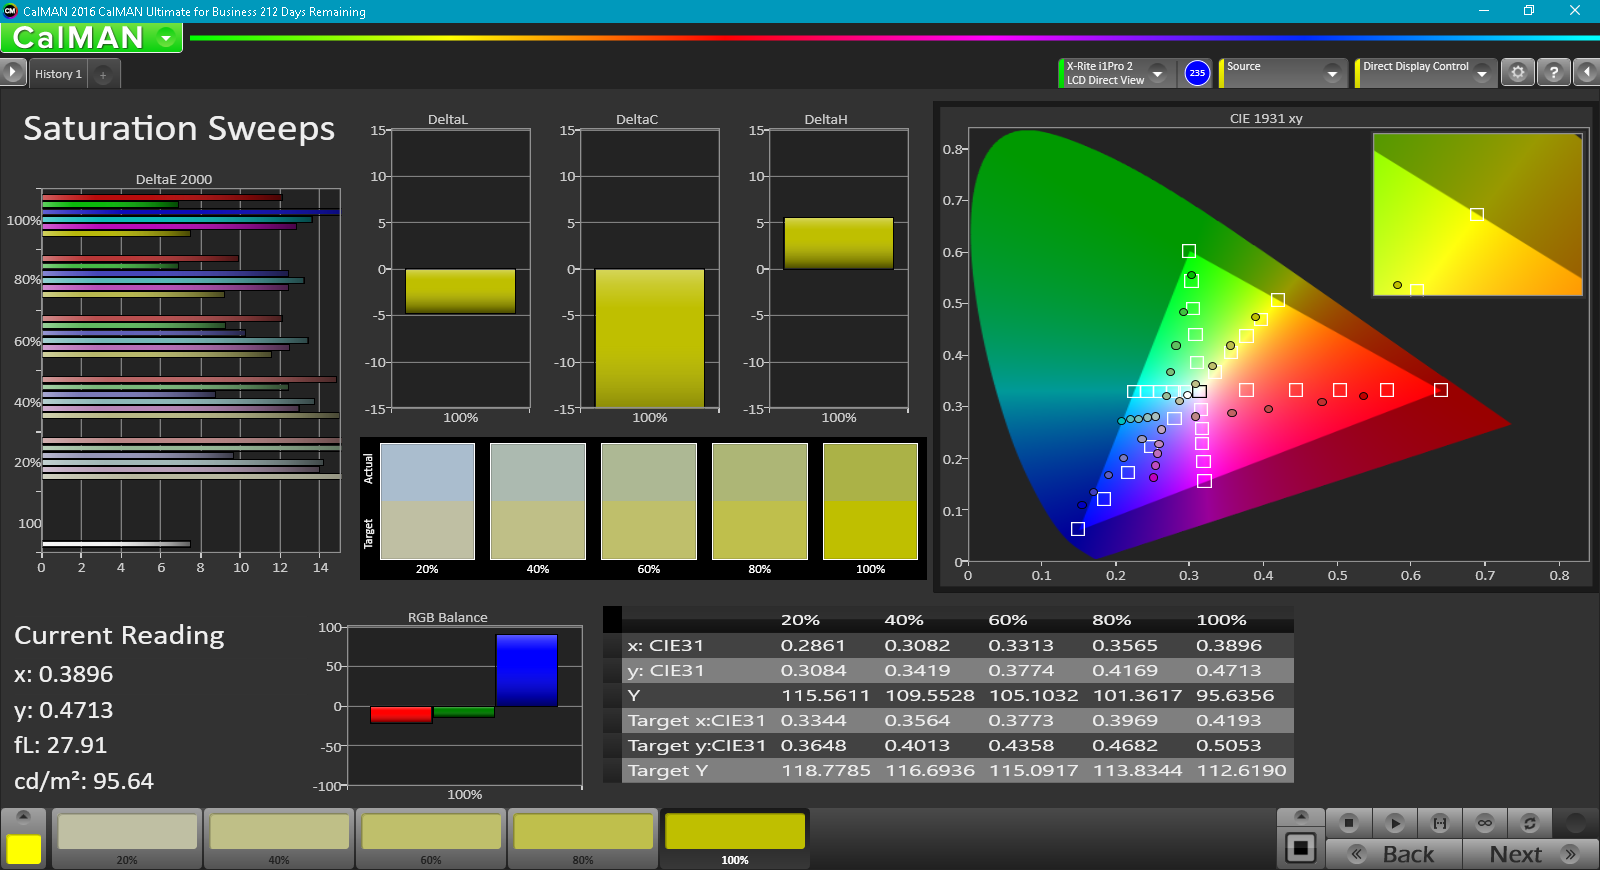
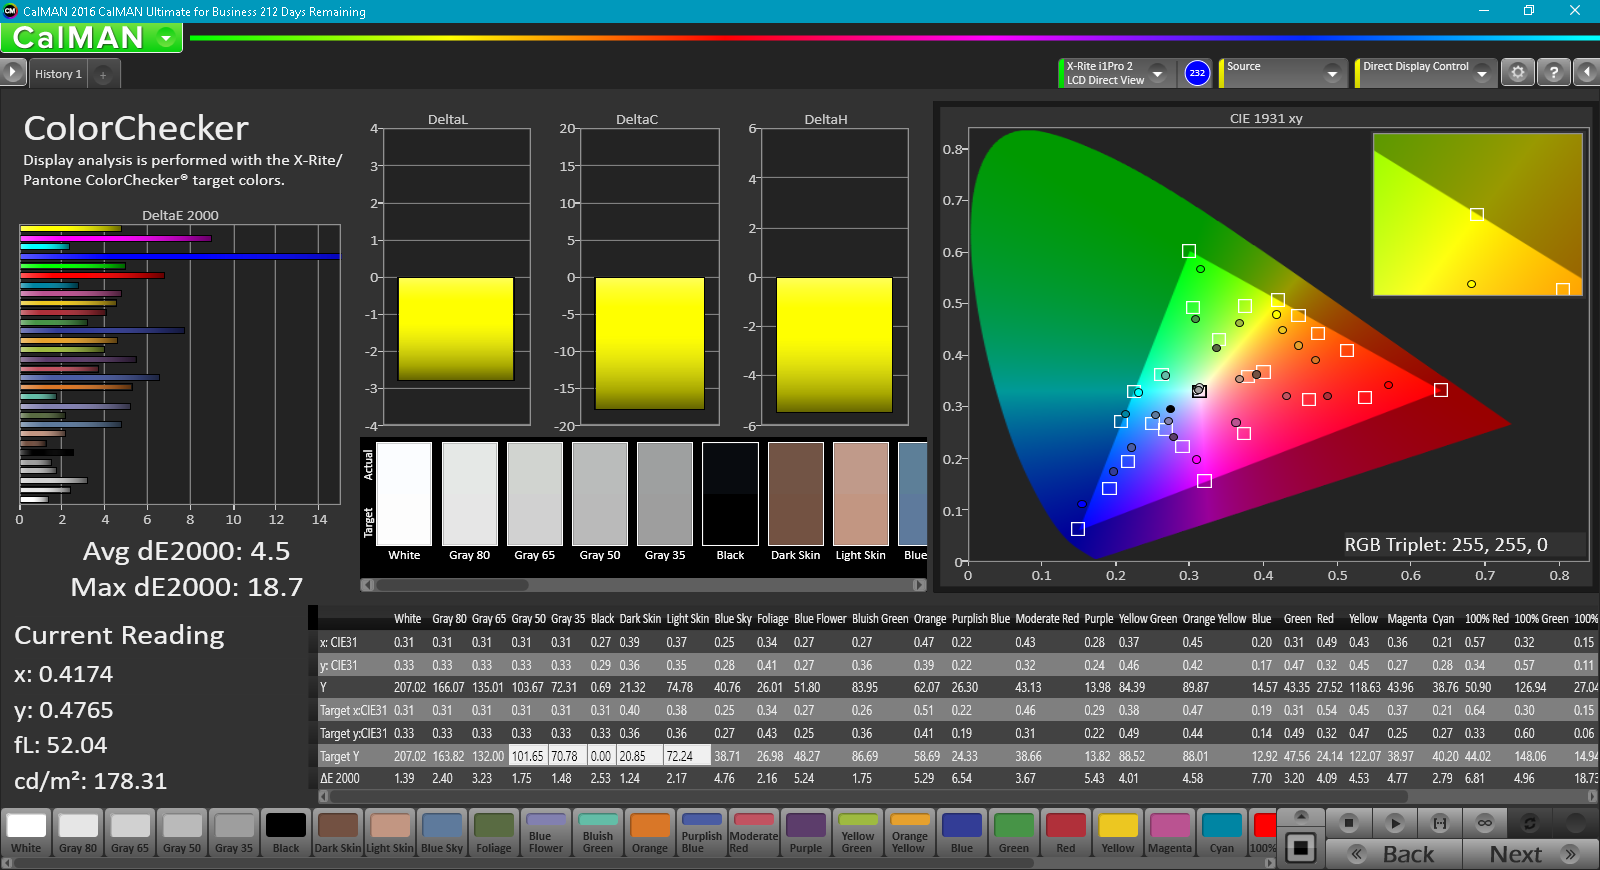
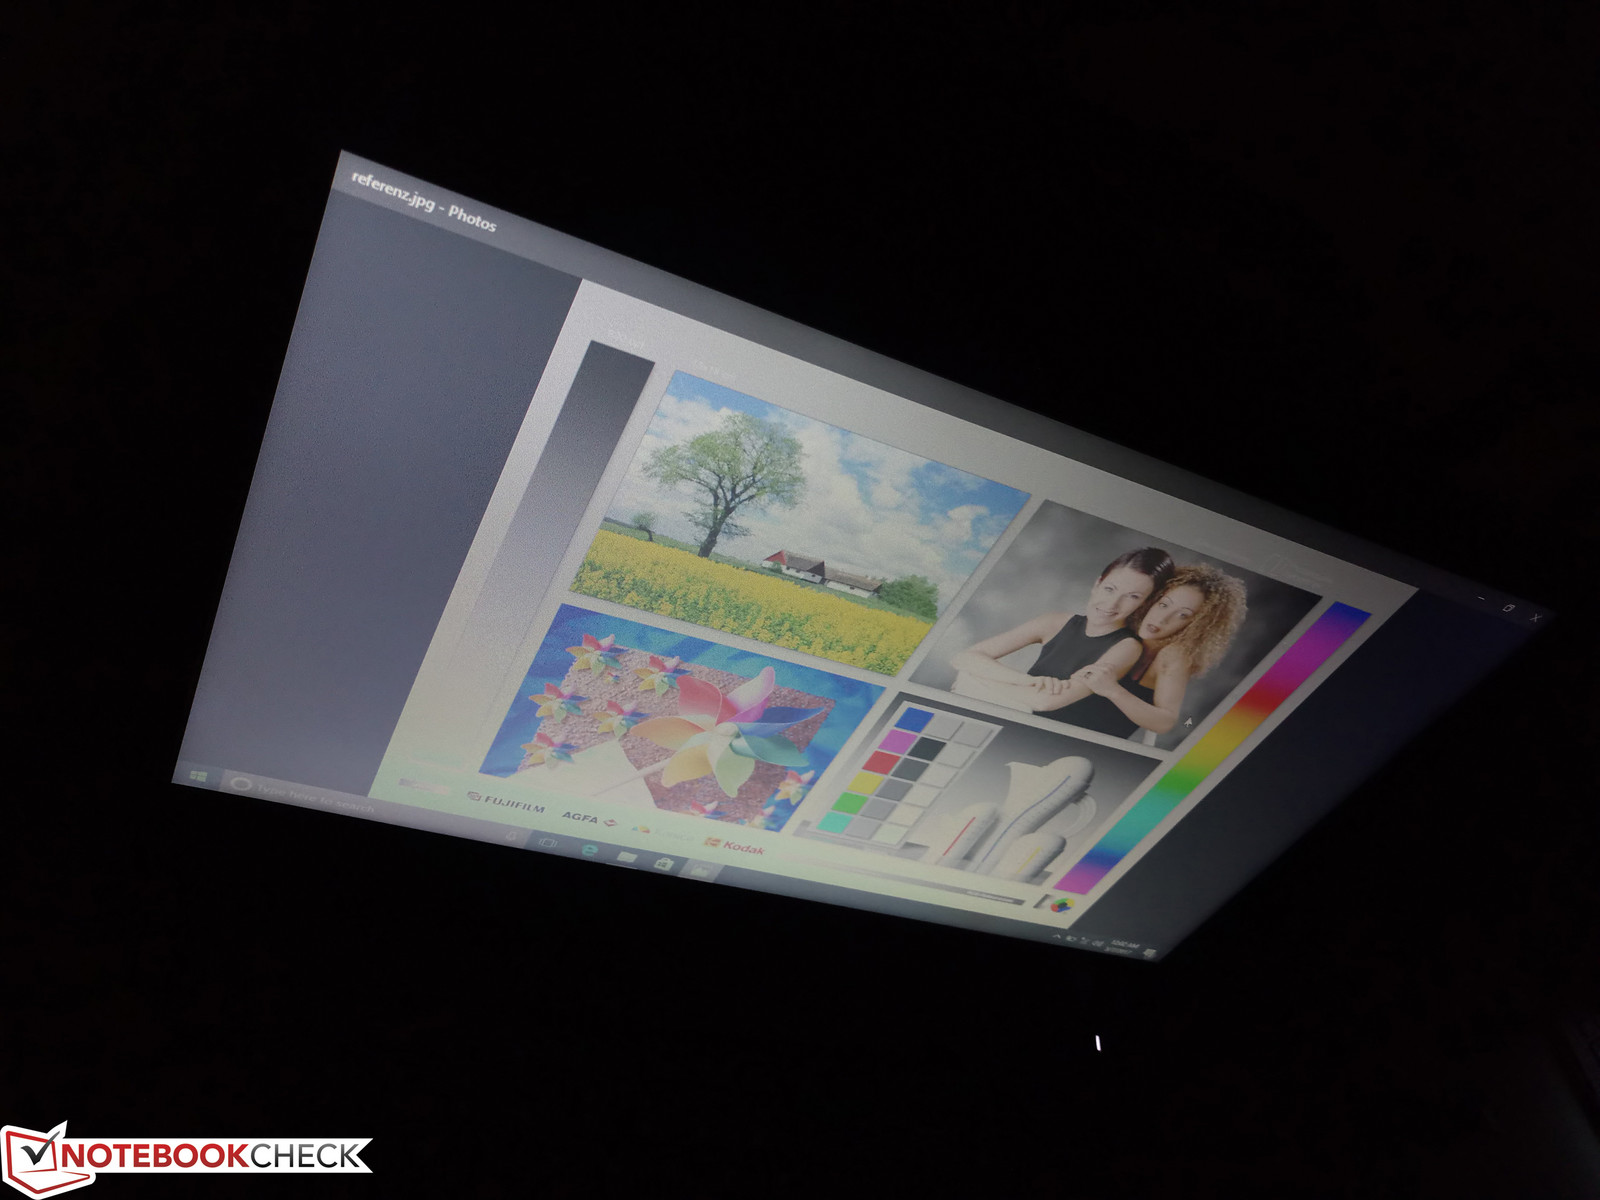
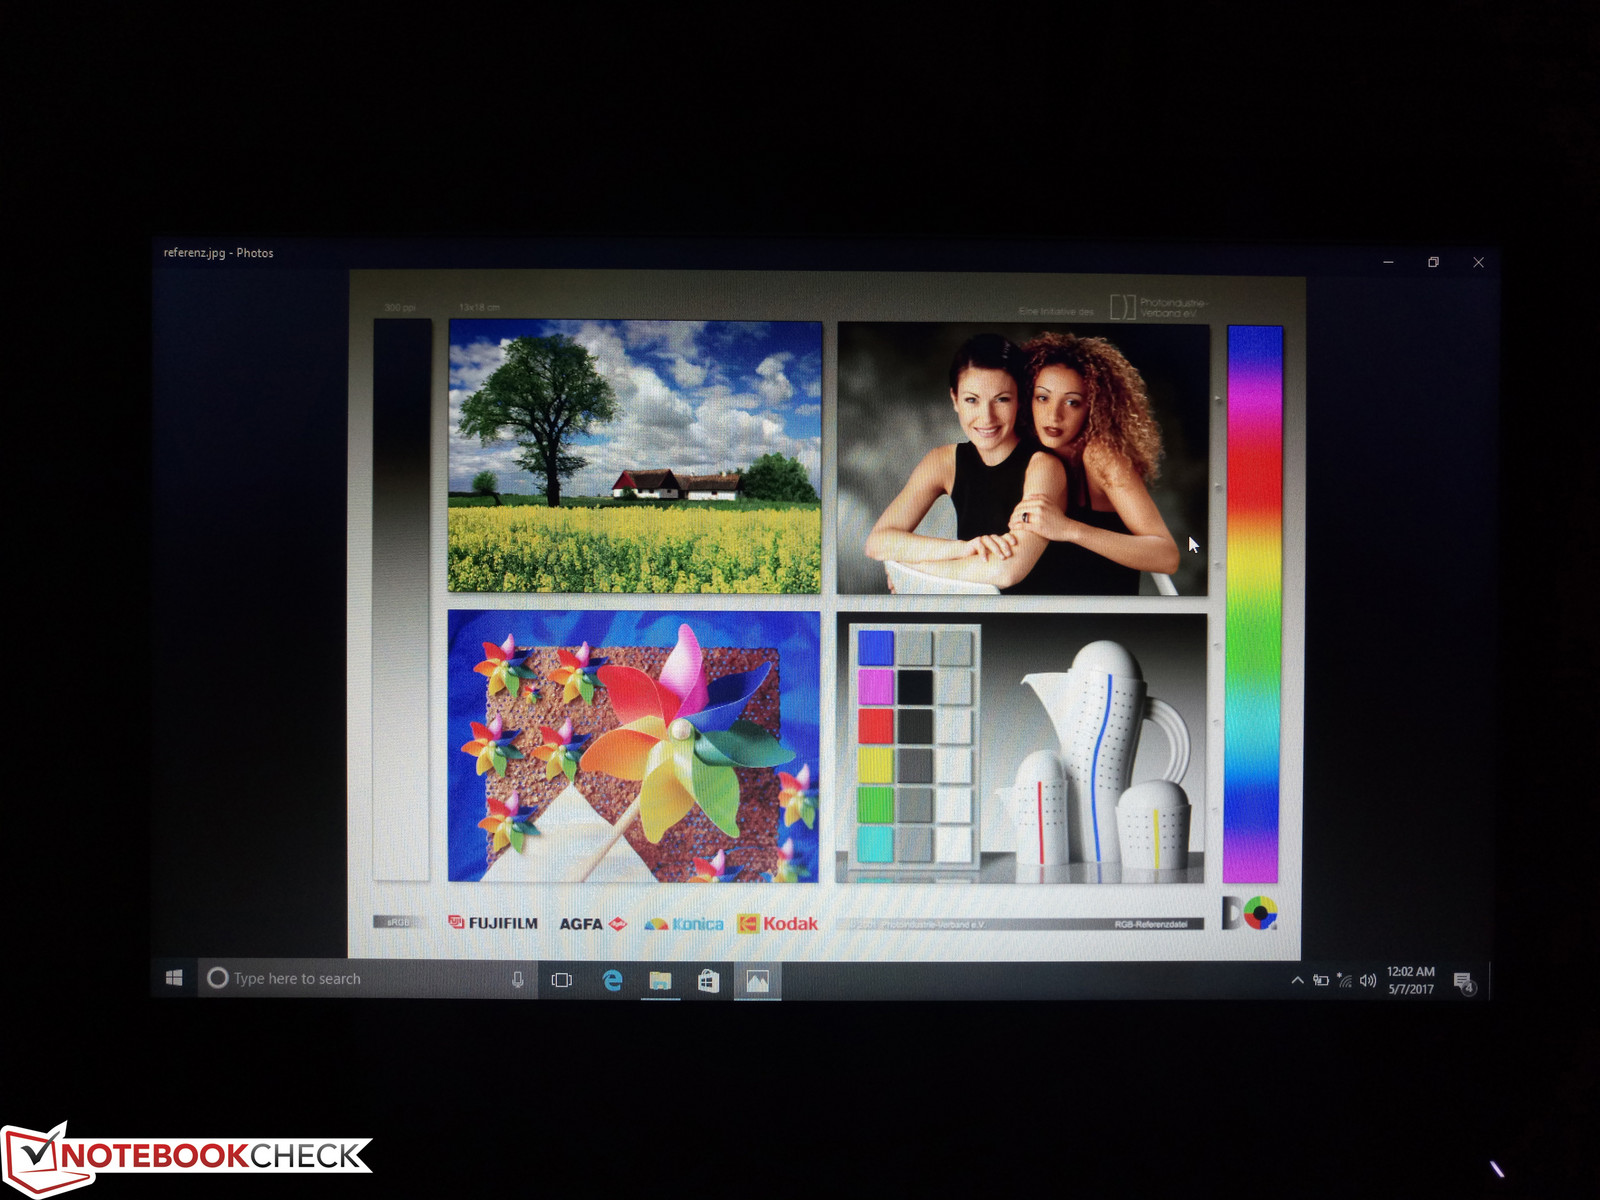
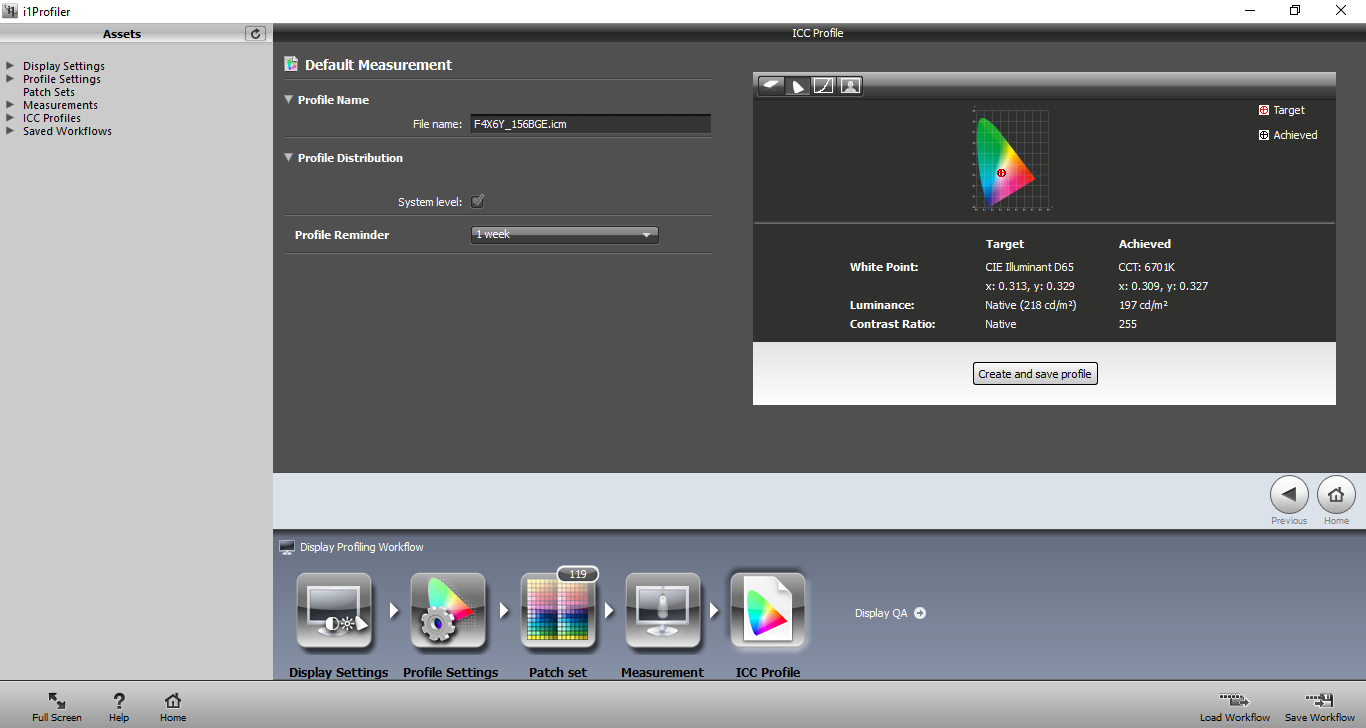
HD and FHD resolutions are available on the Latitude 5580 with no QHD/4K or touchscreen options. Our test unit uses a Chi Mei CMN15C5 HD matte panel that can be found on no other notebook currently in our database. Unfortunately, we cannot recommend this particular panel if display quality is an important part of the purchase. Contrast is low, backlight is merely average, and colors are poor. Even subjectively we can tell that the panel is in dire need of calibration with its shallow colors, overly cool color temperature, and muddy blacks. We can't speak for the Latitude 5580 SKUs with the FHD option, however, so hopefully these drawbacks are limited to just the HD SKUs.
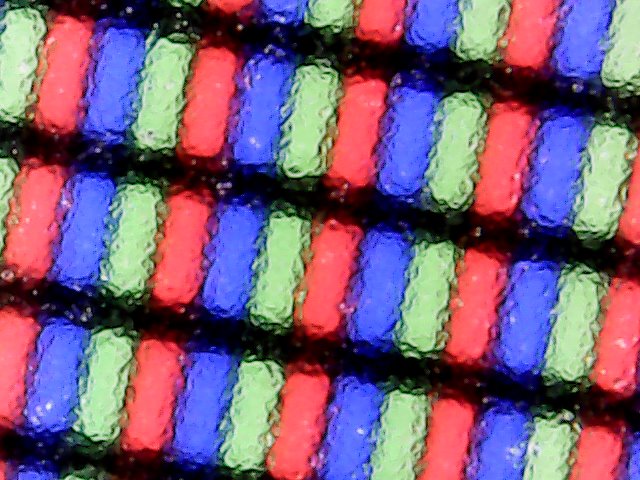
The HD display has only minor graininess issues that are often present on matte panels. Pulse-width modulation is detectable on all brightness levels except maximum and so users sensitive to onscreen flickering may want to consider running the notebook permanently on its maximum brightness setting or purchase another notebook entirely.
| |||||||||||||||||||||||||
Brightness Distribution: 83 %
Center on Battery: 238 cd/m²
Contrast: 449:1 (Black: 0.53 cd/m²)
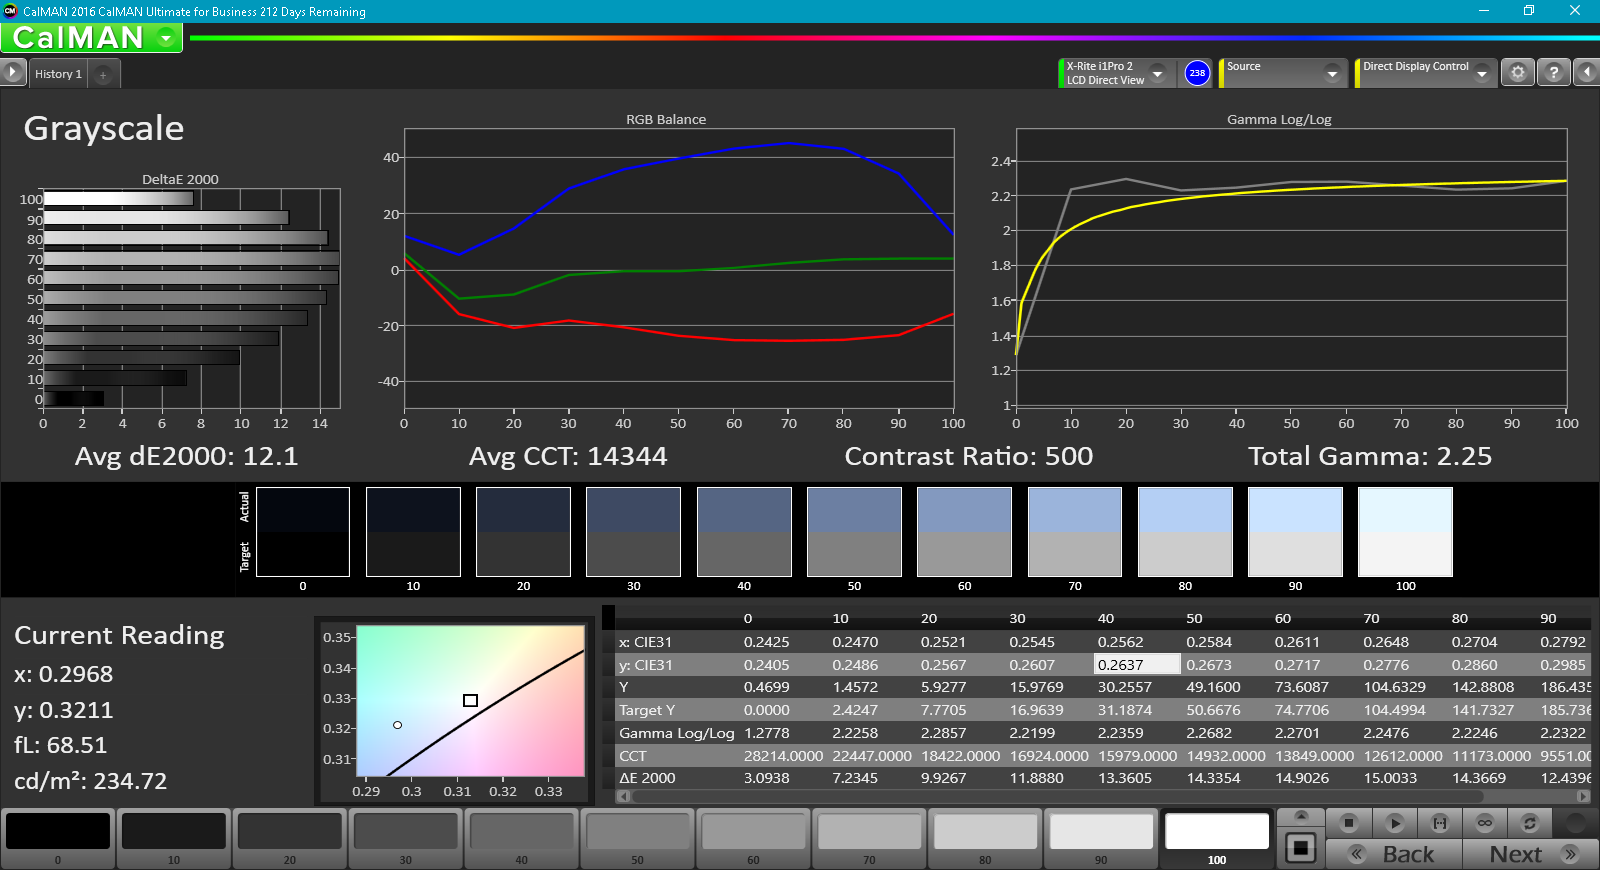
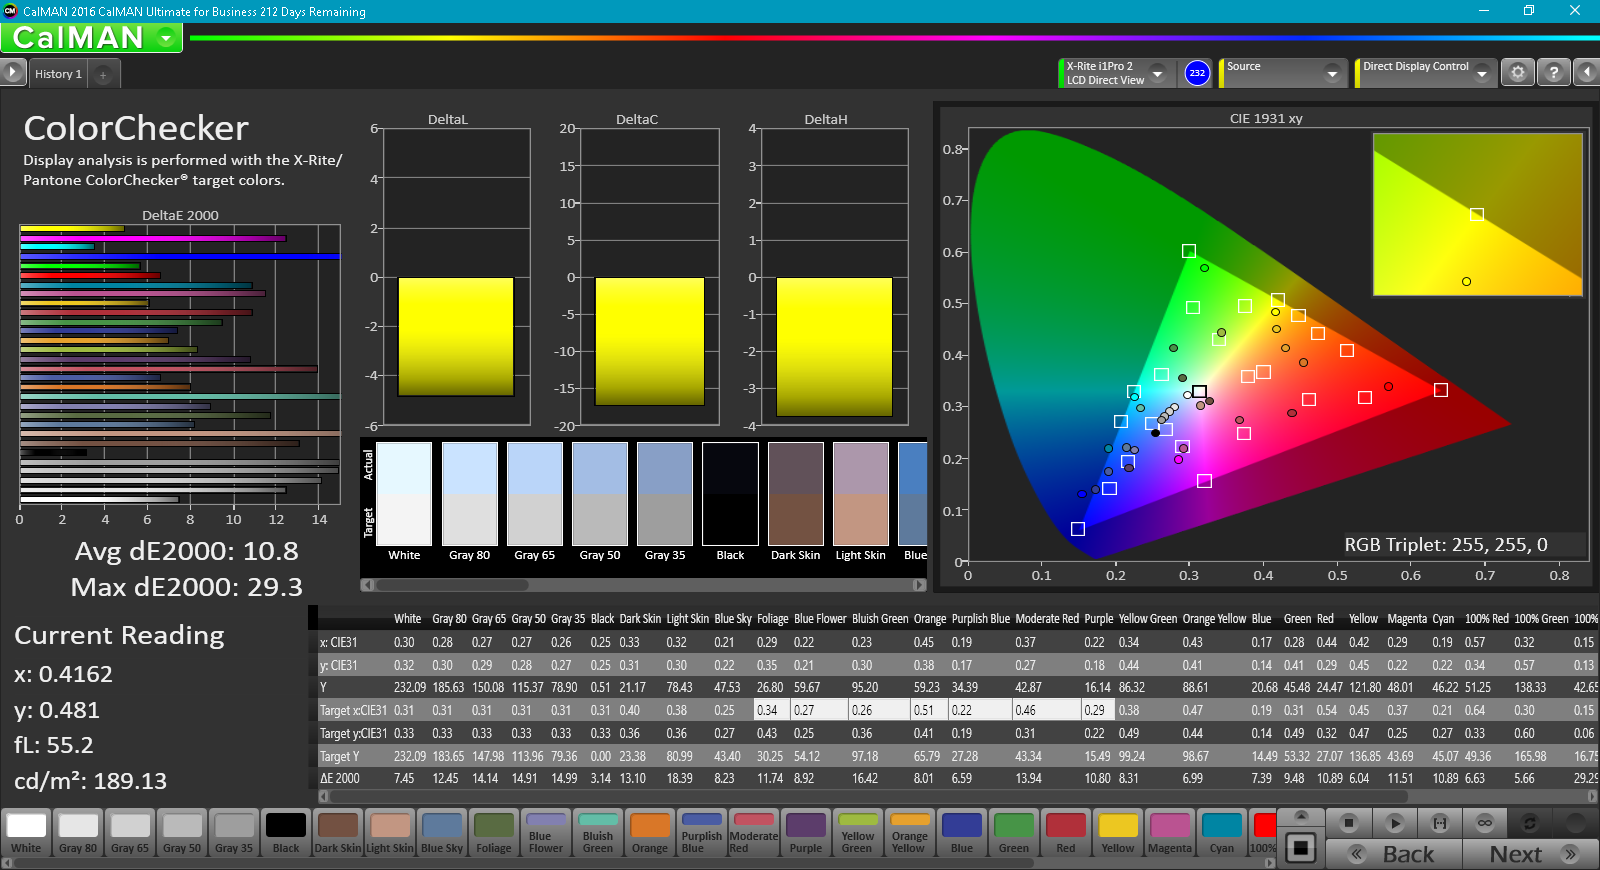
ΔE ColorChecker Calman: 10.8 | ∀{0.5-29.43 Ø4.71}
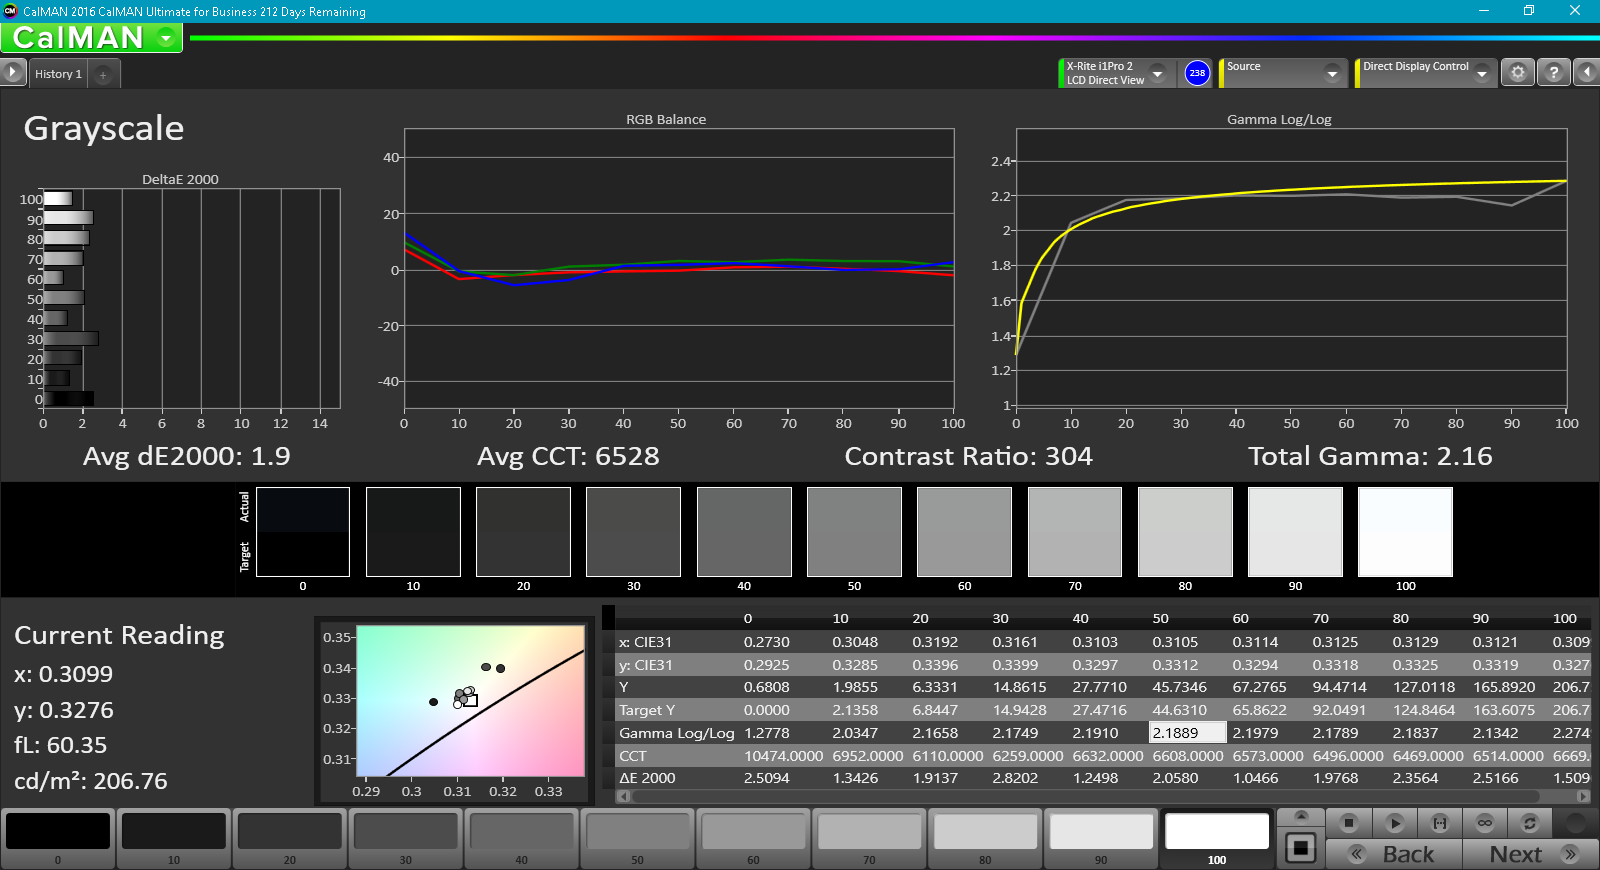
ΔE Greyscale Calman: 12.1 | ∀{0.09-98 Ø4.96}
59.9% sRGB (Argyll 1.6.3 3D)
38.3% AdobeRGB 1998 (Argyll 1.6.3 3D)
41.5% AdobeRGB 1998 (Argyll 3D)
60% sRGB (Argyll 3D)
40.13% Display P3 (Argyll 3D)
Gamma: 2.25
CCT: 14344 K
| Dell Latitude 5580 TN LED, 15.6", 1366x768 | Lenovo ThinkPad T570-20H90002GE N156HCA-EAA, IPS, 15.6", 1920x1080 | Asus AsusPro P4540UQ-FY0056R LG Philips LP156WF6-SPB6, IPS, 15.6", 1920x1080 | Toshiba Satellite Pro R50-C-16V Toshiba, TN LED, 15.6", 1366x768 | HP Probook 650 G3 Z2W44ET AU Optronics, TN LED, 15.6", 1920x1080 | |
|---|---|---|---|---|---|
| Display | 10% | 48% | 1% | 37% | |
| Display P3 Coverage (%) | 40.13 | 44.08 10% | 63.3 58% | 40.6 1% | 55.2 38% |
| sRGB Coverage (%) | 60 | 65.6 9% | 83.6 39% | 61.2 2% | 81.1 35% |
| AdobeRGB 1998 Coverage (%) | 41.5 | 45.66 10% | 61.1 47% | 41.95 1% | 57 37% |
| Response Times | -5% | -13% | -58% | -9% | |
| Response Time Grey 50% / Grey 80% * (ms) | 30 ? | 41.6 ? -39% | 38 ? -27% | 68 ? -127% | 38 ? -27% |
| Response Time Black / White * (ms) | 29.6 ? | 20.8 ? 30% | 29 ? 2% | 26 ? 12% | 27 ? 9% |
| PWM Frequency (Hz) | 201.6 ? | 26040 ? | 21000 ? | 217 ? | 200 ? |
| Screen | 44% | 52% | 5% | 22% | |
| Brightness middle (cd/m²) | 238 | 262 10% | 276 16% | 226 -5% | 351 47% |
| Brightness (cd/m²) | 216 | 245 13% | 283 31% | 217 0% | 345 60% |
| Brightness Distribution (%) | 83 | 89 7% | 85 2% | 91 10% | 95 14% |
| Black Level * (cd/m²) | 0.53 | 0.24 55% | 0.27 49% | 0.58 -9% | 0.65 -23% |
| Contrast (:1) | 449 | 1092 143% | 1022 128% | 390 -13% | 540 20% |
| Colorchecker dE 2000 * | 10.8 | 4.5 58% | 3.92 64% | 9.84 9% | 11.02 -2% |
| Colorchecker dE 2000 max. * | 29.3 | 10.5 64% | 9.13 69% | 16.77 43% | 17.68 40% |
| Greyscale dE 2000 * | 12.1 | 3.5 71% | 2.6 79% | 11.1 8% | 13.14 -9% |
| Gamma | 2.25 98% | 2.32 95% | 2.53 87% | 2.35 94% | 2.7 81% |
| CCT | 14344 45% | 6524 100% | 6561 99% | 11979 54% | 16626 39% |
| Color Space (Percent of AdobeRGB 1998) (%) | 38.3 | 42.04 10% | 54.5 42% | 39 2% | 52 36% |
| Color Space (Percent of sRGB) (%) | 59.9 | 65.4 9% | 83.7 40% | 61 2% | 81 35% |
| Total Average (Program / Settings) | 16% /
31% | 29% /
43% | -17% /
-4% | 17% /
21% |
* ... smaller is better
Color coverage is narrow at just under 60 percent of sRGB and 38 percent of AdobeRGB. This is comparable to most TN panels found on cheap laptops and netbooks whereas modern Ultrabooks tend to cover a wider range of the sRGB standard for deeper and more accurate colors. The entry-level Latitude 5580 configuration is definitely not recommended for digital graphics work.
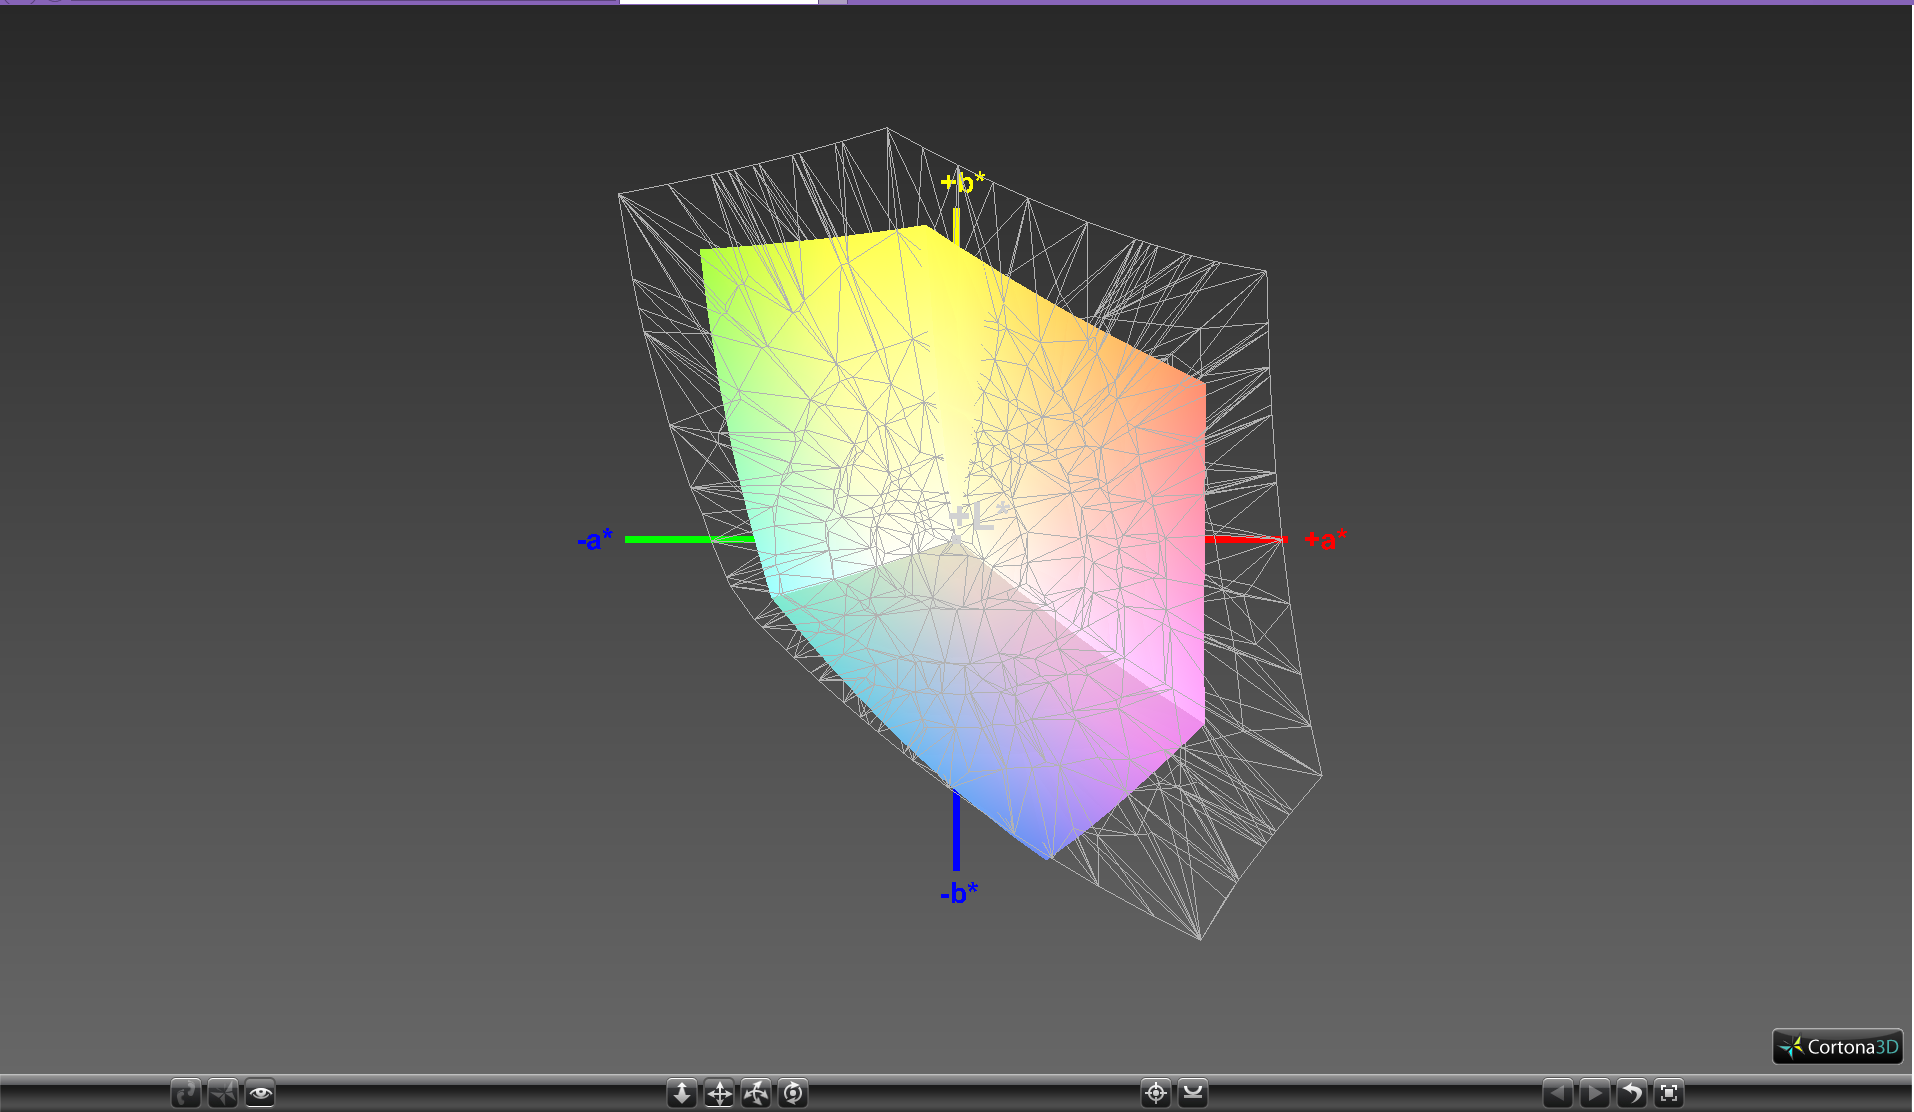
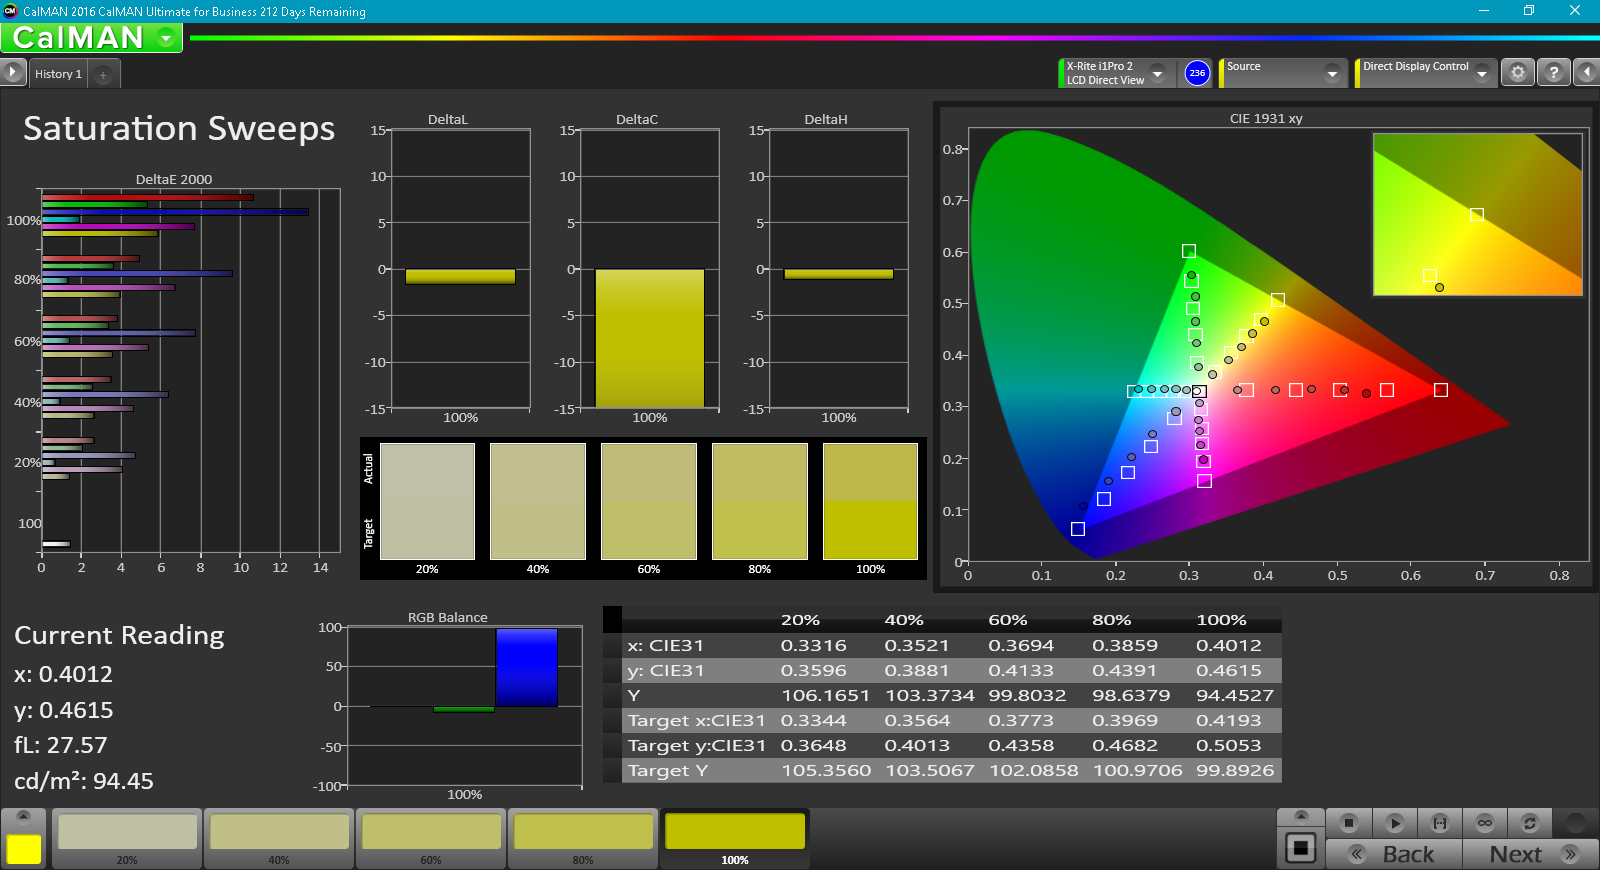
Further display measurements with an X-Rite spectrophotometer reveal very inaccurate colors and gayscale out of the box. Color temperature in particular is much too cool, which is common amongst inexpensive TN panels. A calibration improves both colors and grayscale dramatically as shown by our results below. Blue, unfortunately, remains very inaccurate and will appear more violet than it should despite our calibration efforts. Colors will become increasingly inaccurate the higher the saturation level due to the panel's imperfect sRGB coverage.
Display Response Times
| ↔ Response Time Black to White | ||
|---|---|---|
| 29.6 ms ... rise ↗ and fall ↘ combined | ↗ 21.2 ms rise | 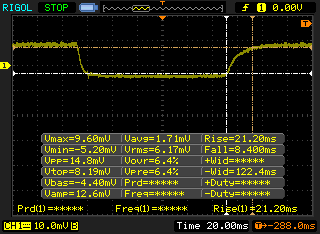 |
| ↘ 8.4 ms fall | ||
| The screen shows relatively slow response rates in our tests and may be too slow for gamers. In comparison, all tested devices range from 0.1 (minimum) to 240 (maximum) ms. » 79 % of all devices are better. This means that the measured response time is worse than the average of all tested devices (19.8 ms). | ||
| ↔ Response Time 50% Grey to 80% Grey | ||
| 30 ms ... rise ↗ and fall ↘ combined | ↗ 19.2 ms rise | 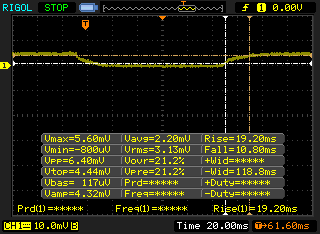 |
| ↘ 10.8 ms fall | ||
| The screen shows slow response rates in our tests and will be unsatisfactory for gamers. In comparison, all tested devices range from 0.165 (minimum) to 636 (maximum) ms. » 40 % of all devices are better. This means that the measured response time is similar to the average of all tested devices (30.9 ms). | ||
Screen Flickering / PWM (Pulse-Width Modulation)
| Screen flickering / PWM detected | 201.6 Hz | ≤ 99 % brightness setting | 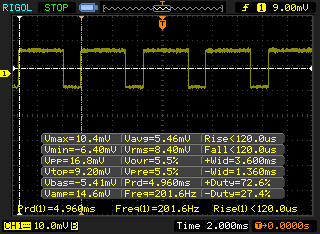 |
The display backlight flickers at 201.6 Hz (worst case, e.g., utilizing PWM) Flickering detected at a brightness setting of 99 % and below. There should be no flickering or PWM above this brightness setting. The frequency of 201.6 Hz is relatively low, so sensitive users will likely notice flickering and experience eyestrain at the stated brightness setting and below. In comparison: 52 % of all tested devices do not use PWM to dim the display. If PWM was detected, an average of 7744 (minimum: 5 - maximum: 343500) Hz was measured. | |||
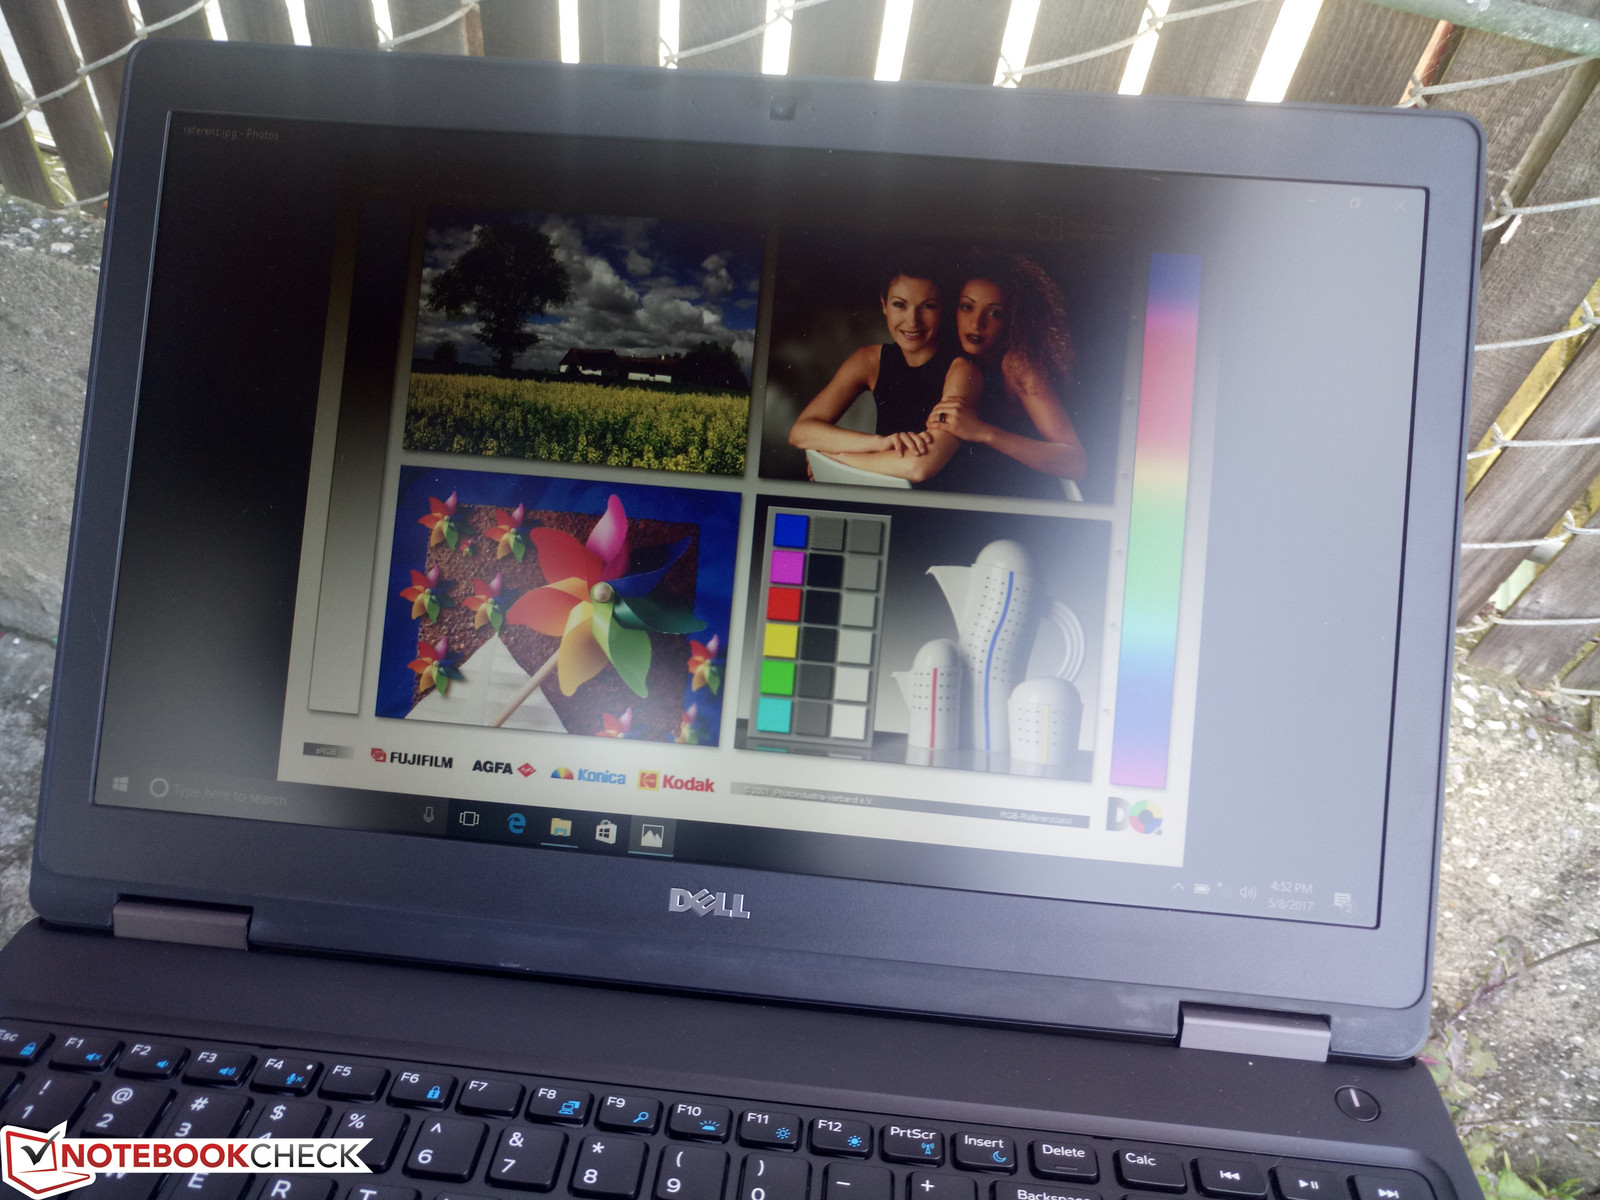
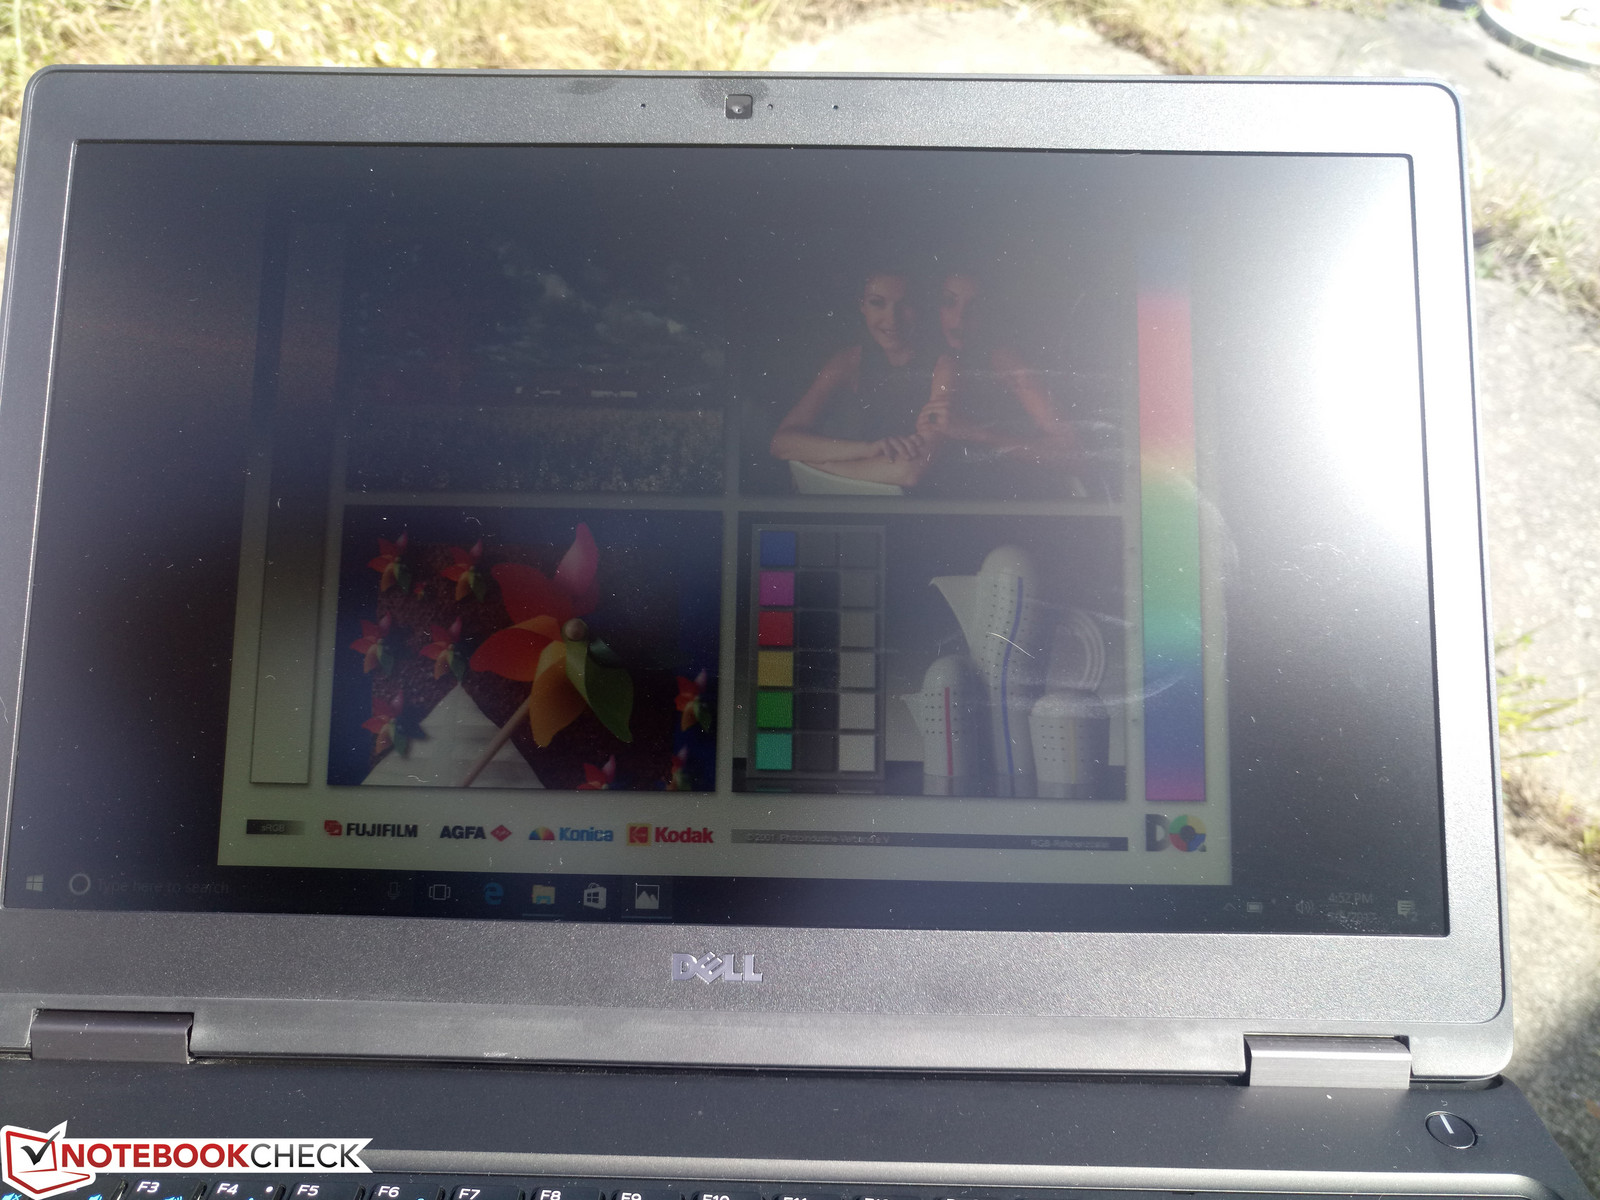
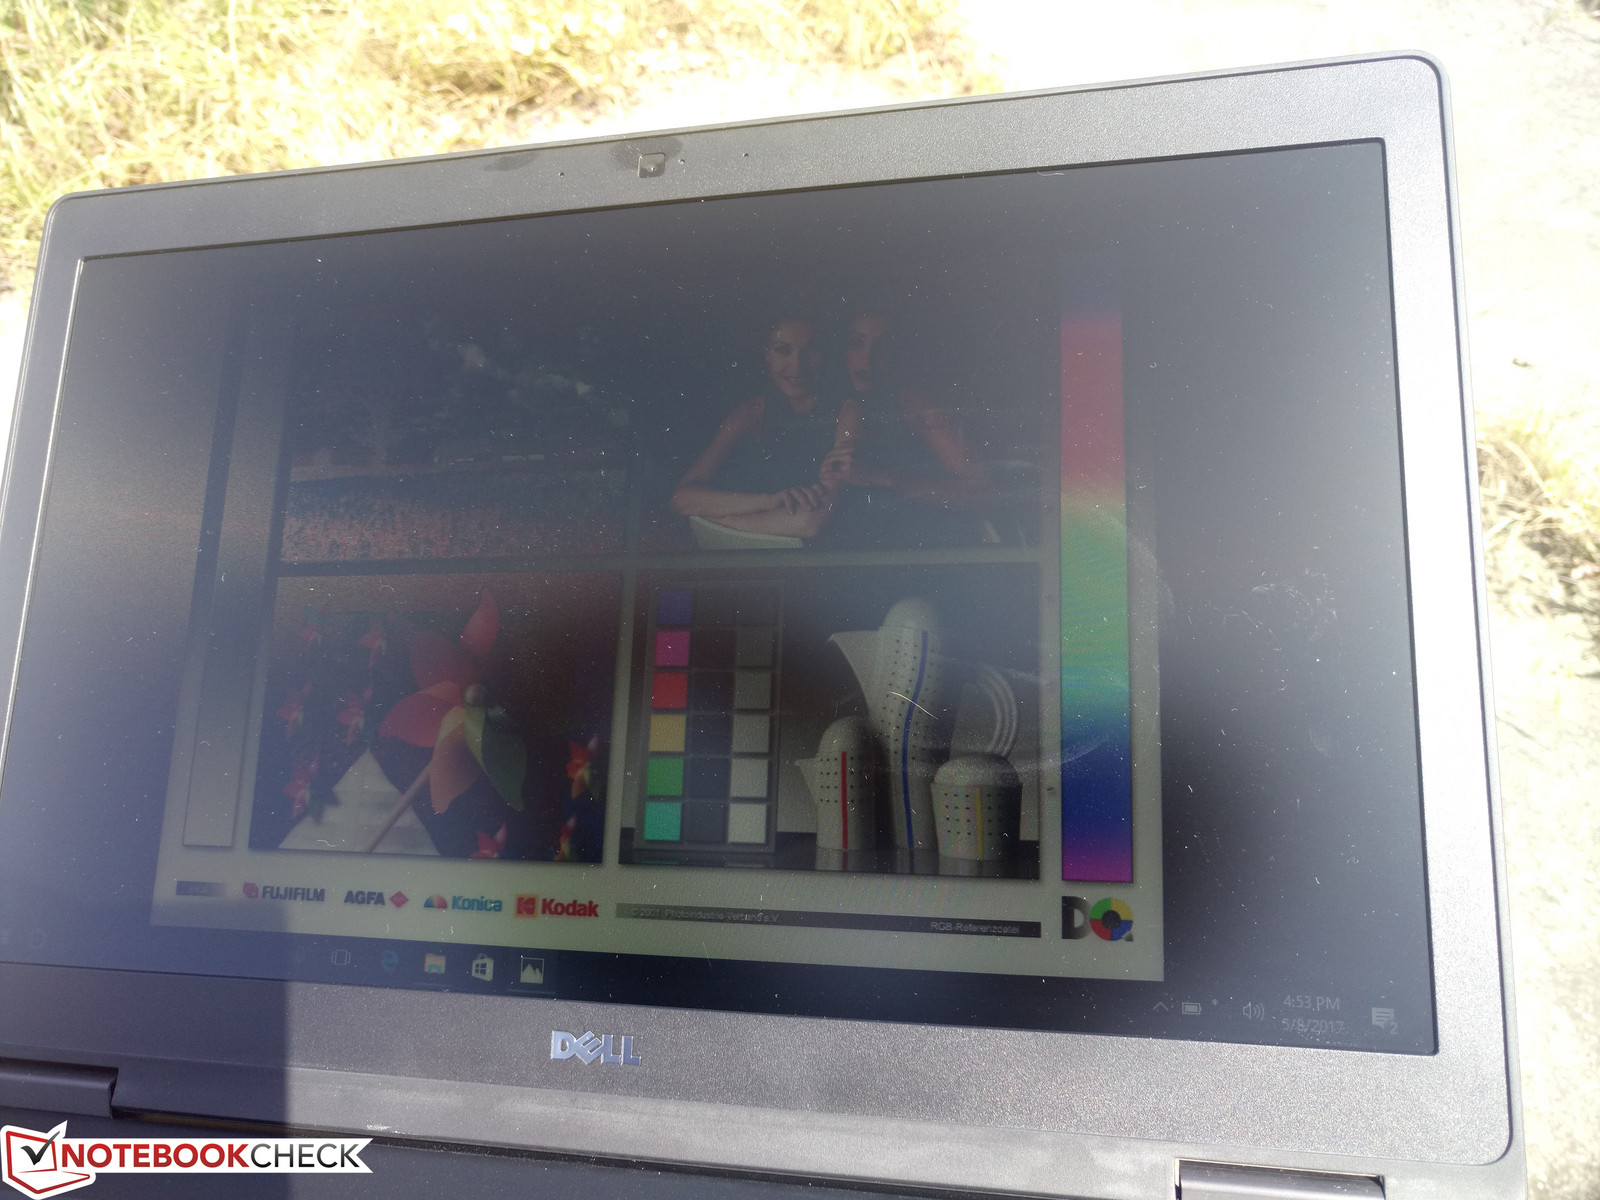
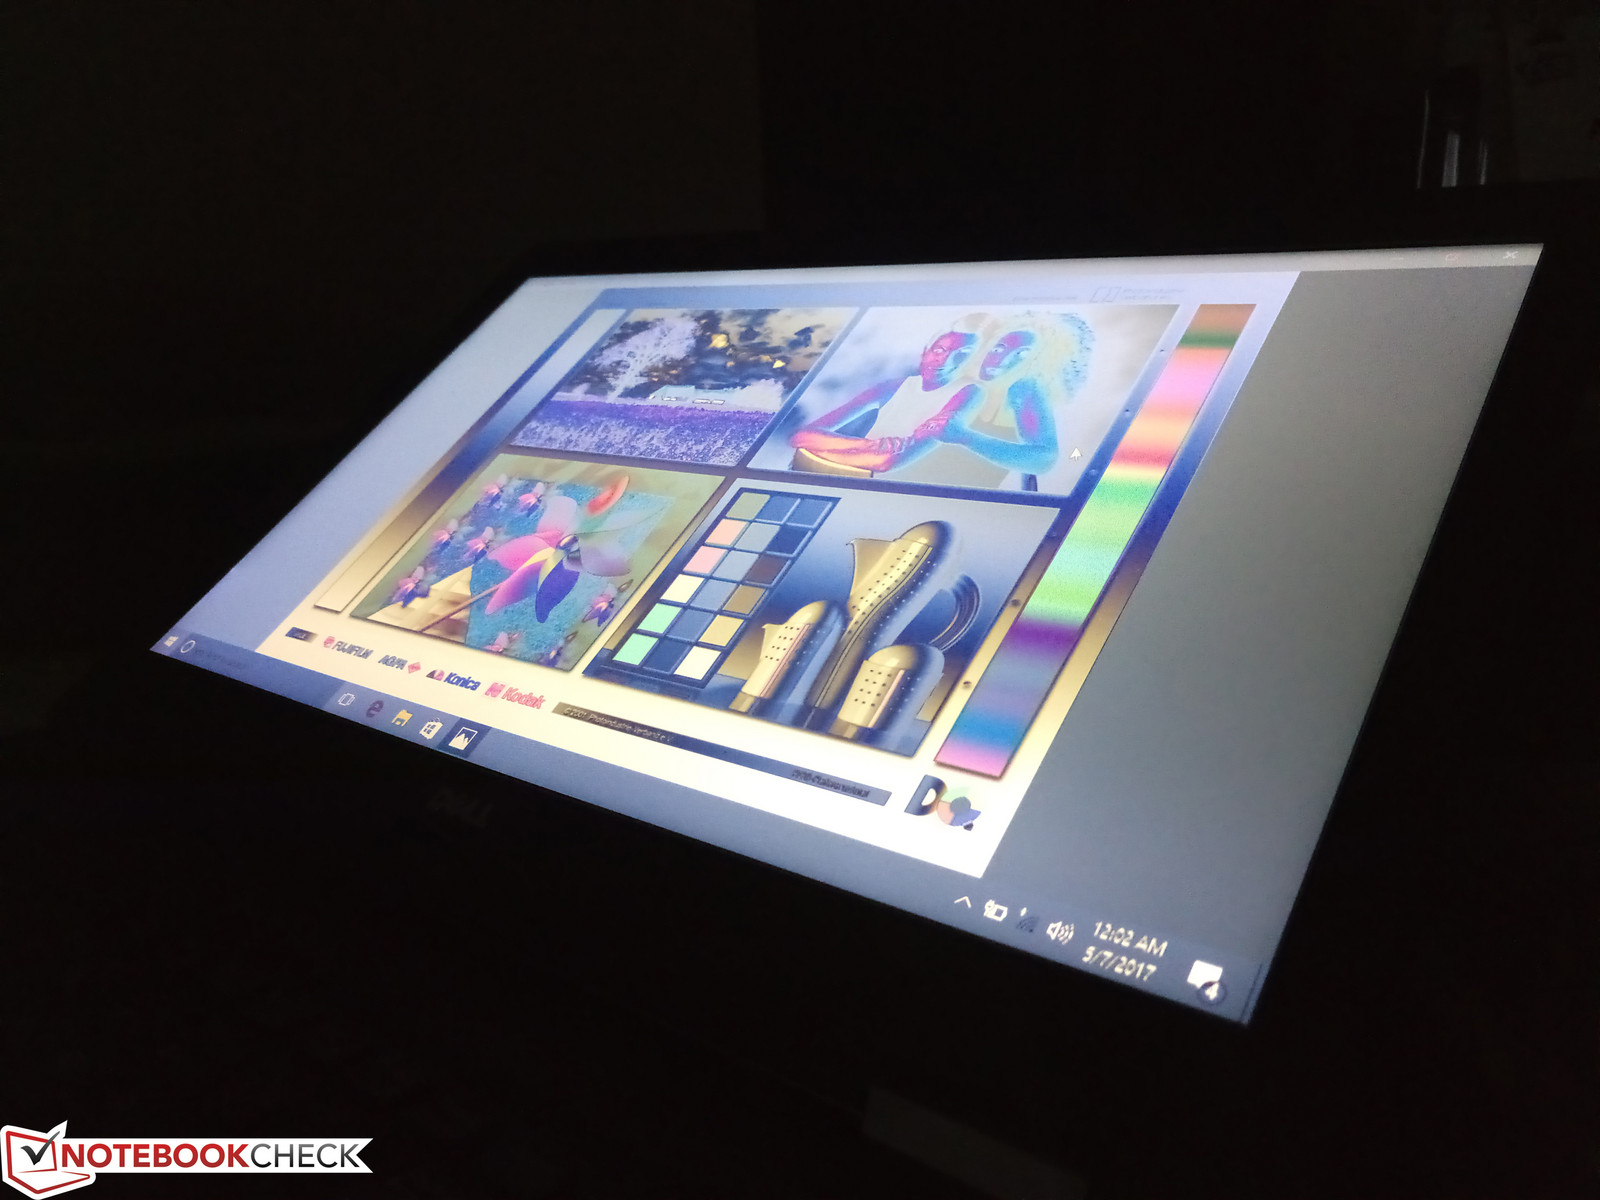
Outdoor visibility is poor because of the combination of a dim backlight and low contrast ratio. Texts and images appear washed out even if working under shade let alone on an overcast day or under direct sunlight. Likewise, the limited TN viewing angles make it more difficult to reduce glare without impacting color quality. While Dell does not specify on its product page, we can only assume that SKUs with the 1080p panel will be brighter than the 768p SKU we have on hand.
Performance
Processor options range from Kaby Lake 15 W U-class solutions commonly found on most newer Ultrabooks up to the 35 W i5-7440HQ, i5-7300HQ or i7-7820HQ found on many gaming notebooks. The performance gap between these two processor classes is significant especially for multi-threaded loads, so users intending to purchase the 5580 for anything other than word processing, streaming, or conferencing may want to consider a HQ-class CPU for faster performance if running more demanding applications.
No discrete graphics options are available whereas the ThinkPad T570 and Acer TravelMate P259 can carry the GeForce 940MX for better graphics performance.
Processor
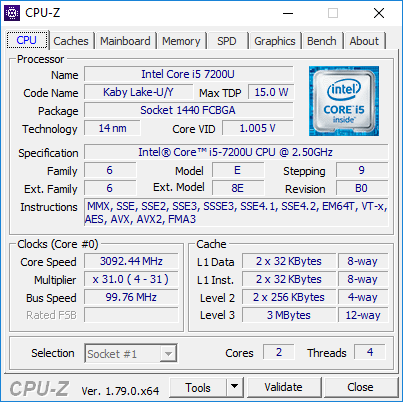
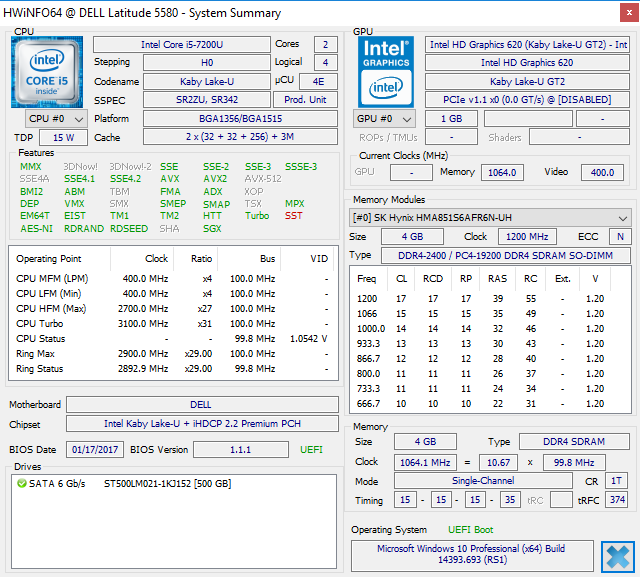
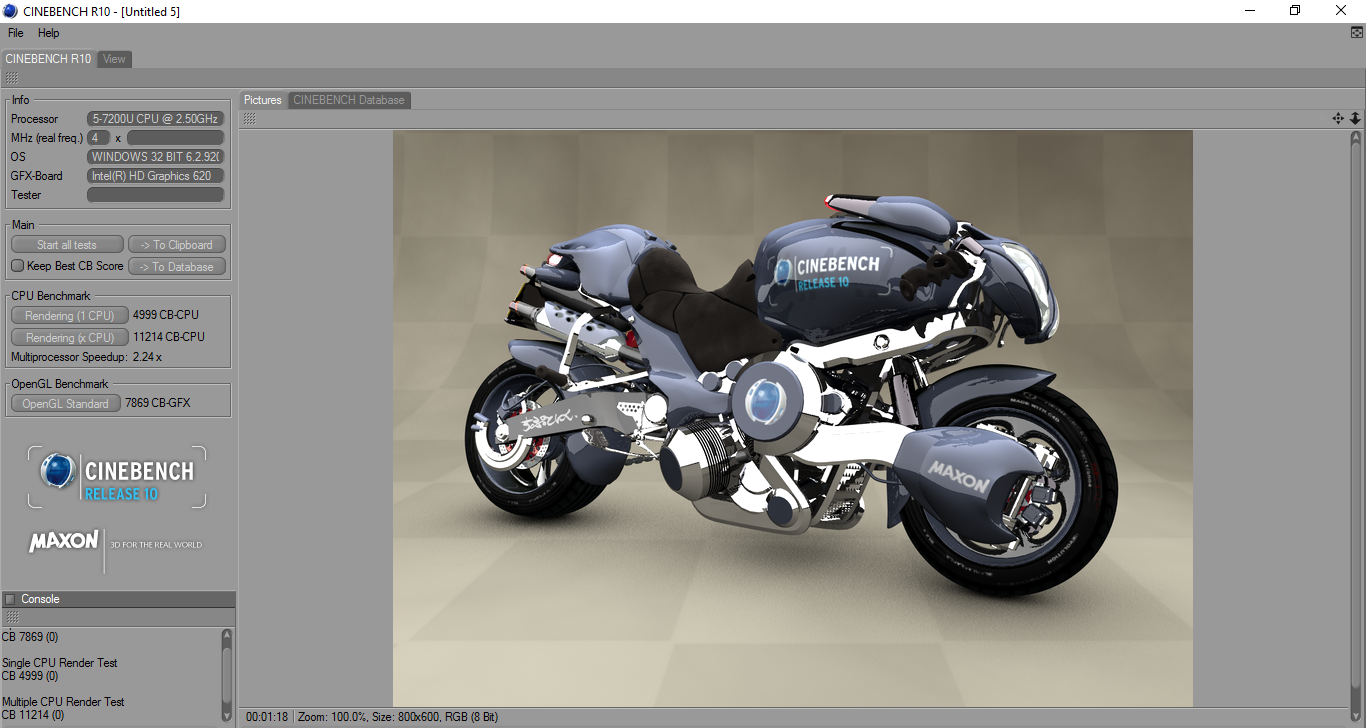
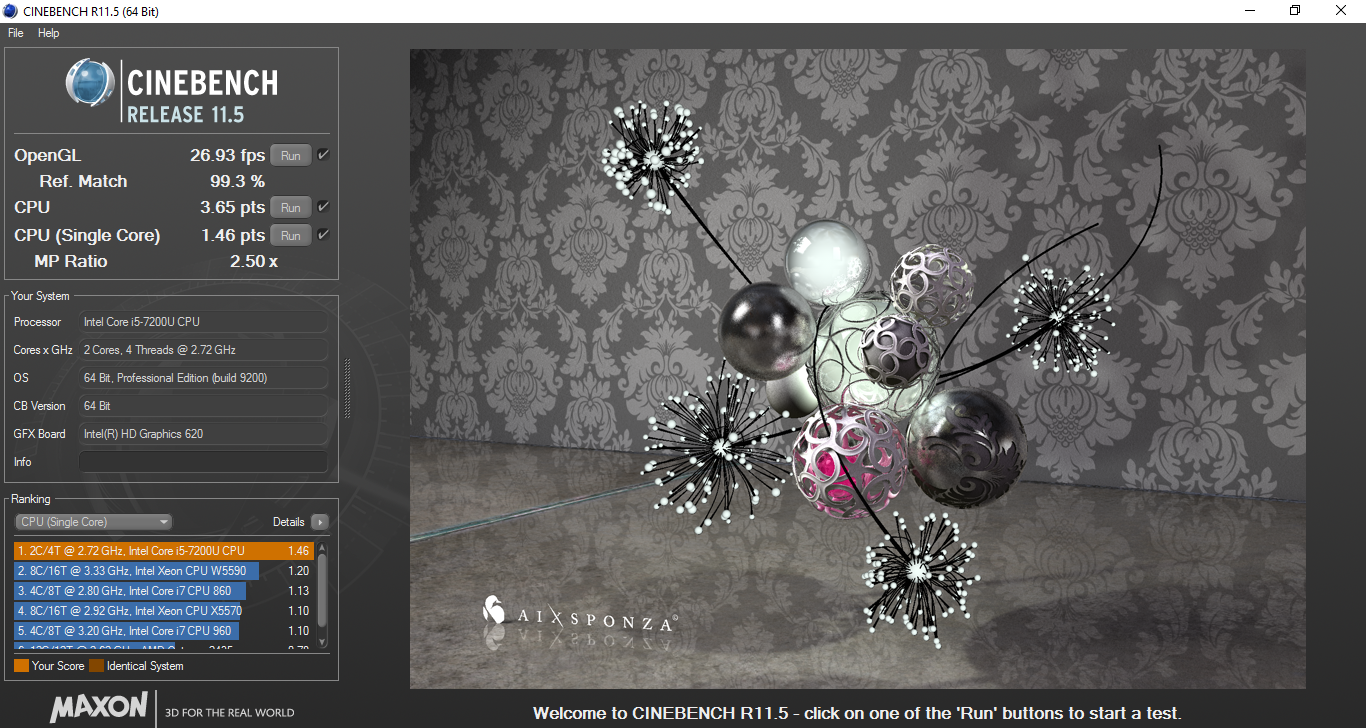
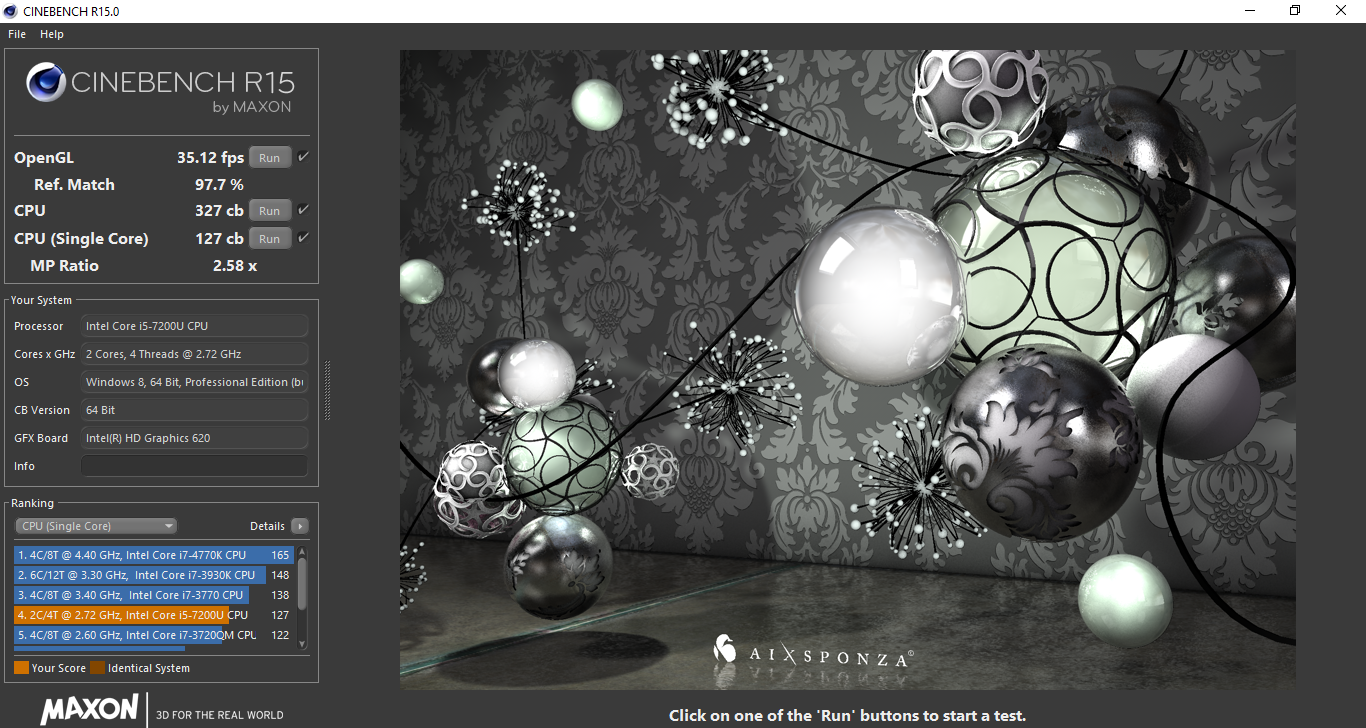
CPU performance from the i5-7200U is in line with other notebooks equipped with the same CPU, so there is no manufacturer-imposed throttling to limit raw processing performance. The CPU is about 10 percent faster than the Skylake i5-6200U in both single- and multi-threaded workloads according to CineBench benchmarks. Moving up to the i5-7300U or i7-7500U will only bring about minimal performance boosts especially in multi-threaded workloads.
Since we currently have no notebook in our database with the i7-7820HQ, we've included the similar i7-6820HQ from the MacBook Pro 15 in the comparison below. Users who opt in for the highest-end Latitude 5580 SKU with the i7-7820HQ CPU should expect a performance boost of more than 110 percent over the i5-7200U in multi-threaded workloads.
Running CineBench in a loop results in no CPU performance degradation over time as shown by our graph below. Scores remain steady and anything otherwise would have left us very disappointed since this is an entry-level low-power configuration.
See our dedicated CPU page on the i5-7200U for more technical information and benchmark comparisons.
| wPrime 2.10 - 1024m | |
| Lenovo Thinkpad 13-20J1001BUS | |
| Dell Latitude 7480 | |
| Dell Latitude 5580 | |
| Lenovo ThinkPad T470s-20HF0012US | |
| Apple MacBook Pro 15 2016 (2.7 GHz, 455) | |
* ... smaller is better
System Performance
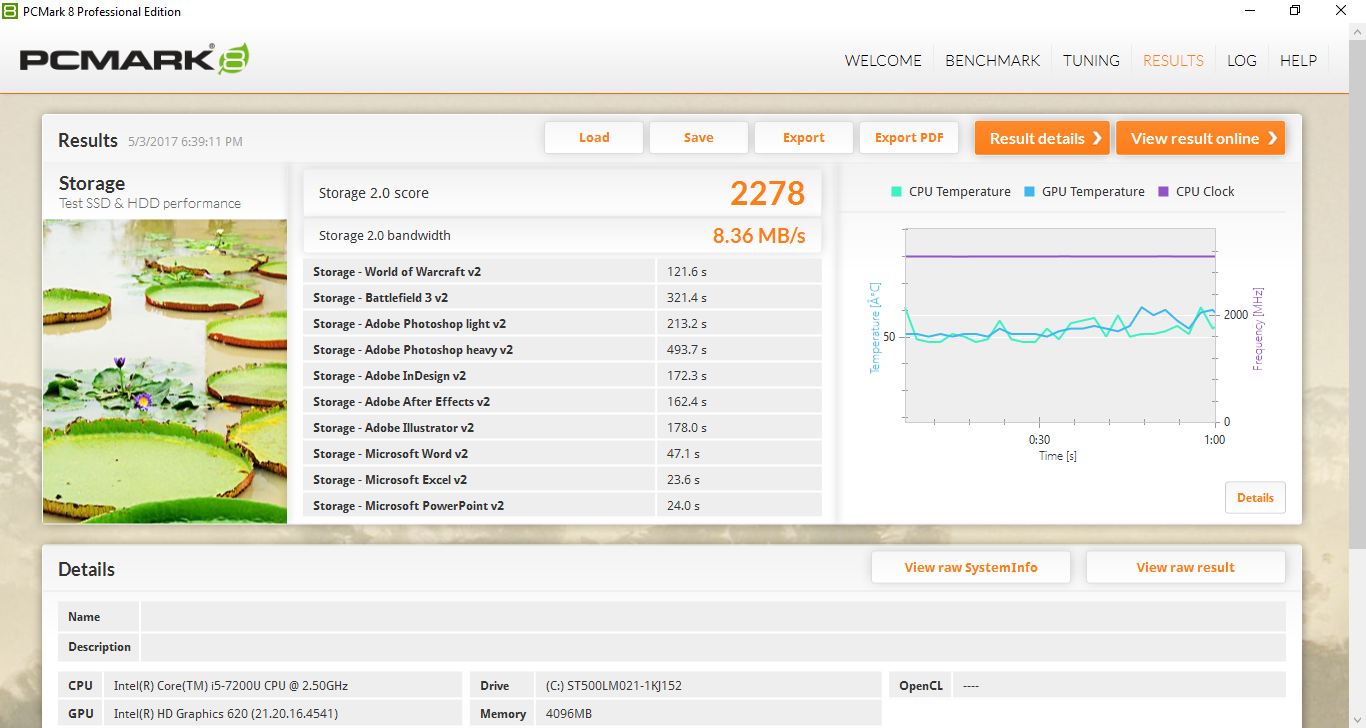
PCMark ranks our Dell configuration in the same ballpark as its closest competitors without any notable discrepancies in final scores. We experienced no software or hardware hitches during our time with the test unit.
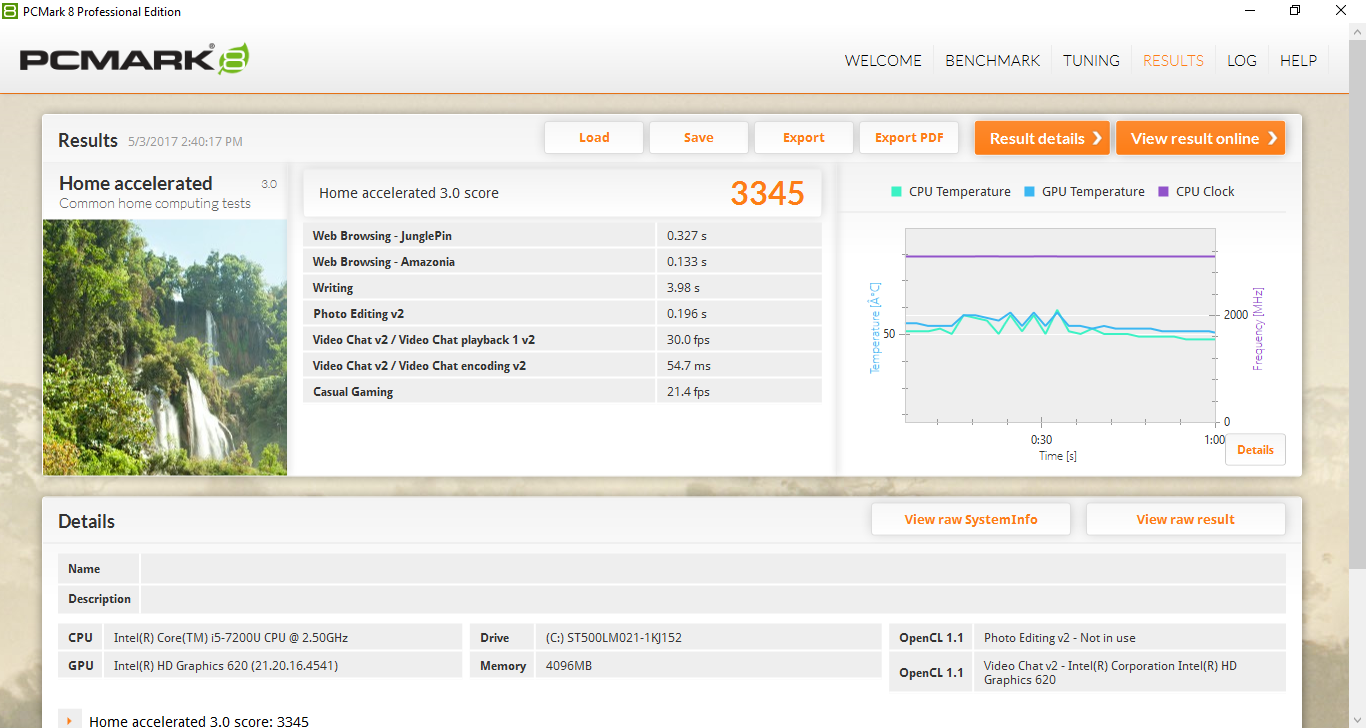
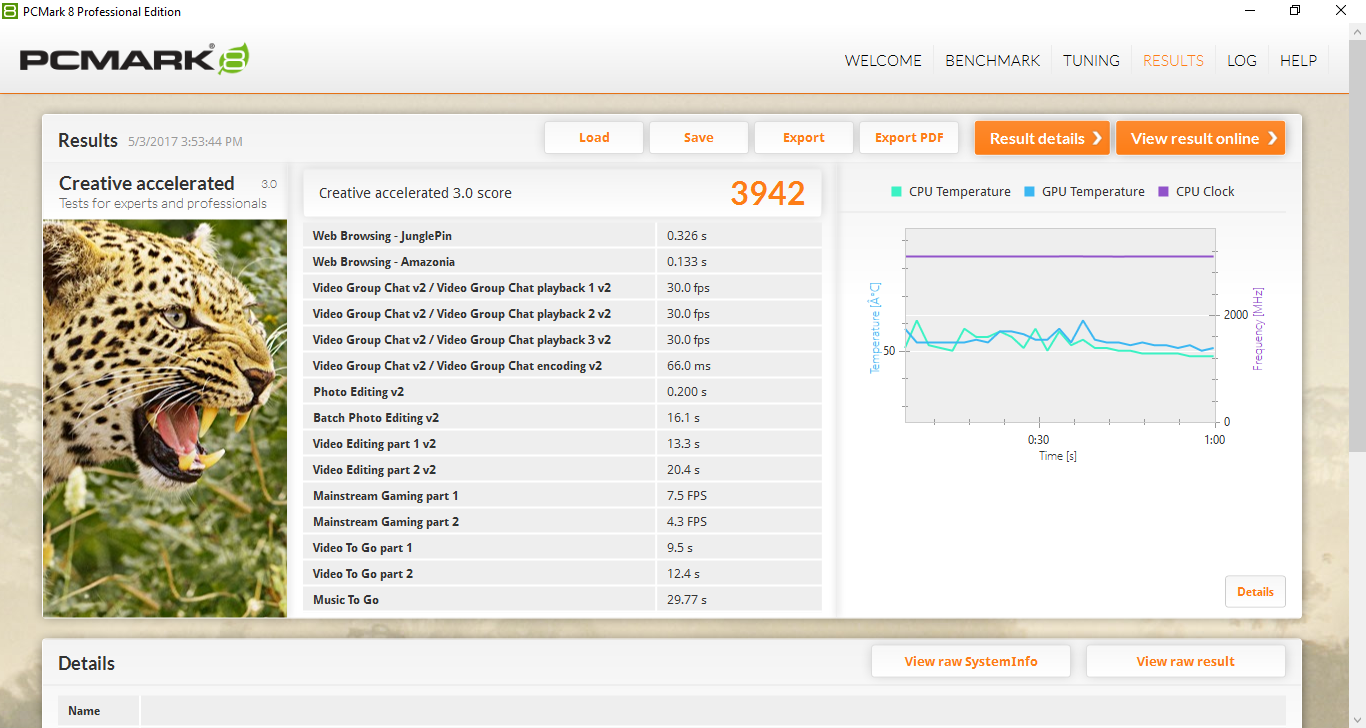
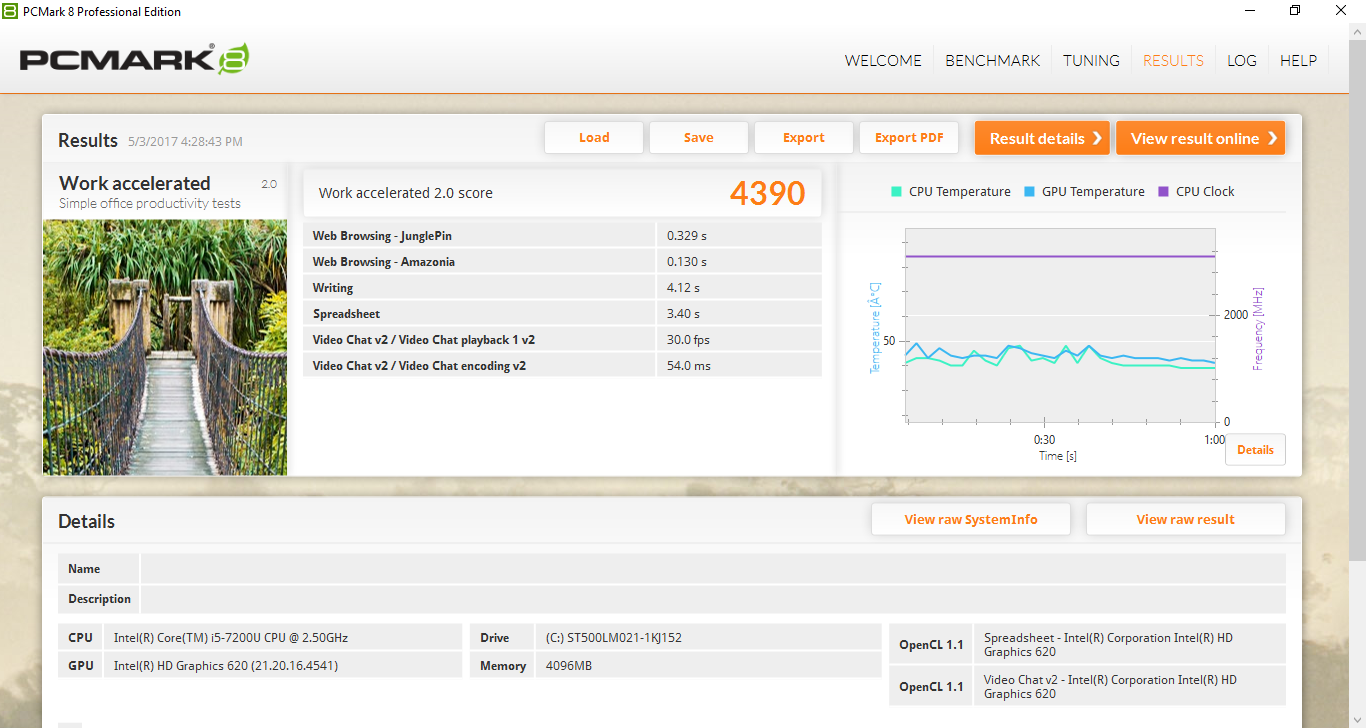
| PCMark 8 Home Score Accelerated v2 | 3345 points | |
| PCMark 8 Creative Score Accelerated v2 | 3942 points | |
| PCMark 8 Work Score Accelerated v2 | 4390 points | |
Help | ||
Storage Devices
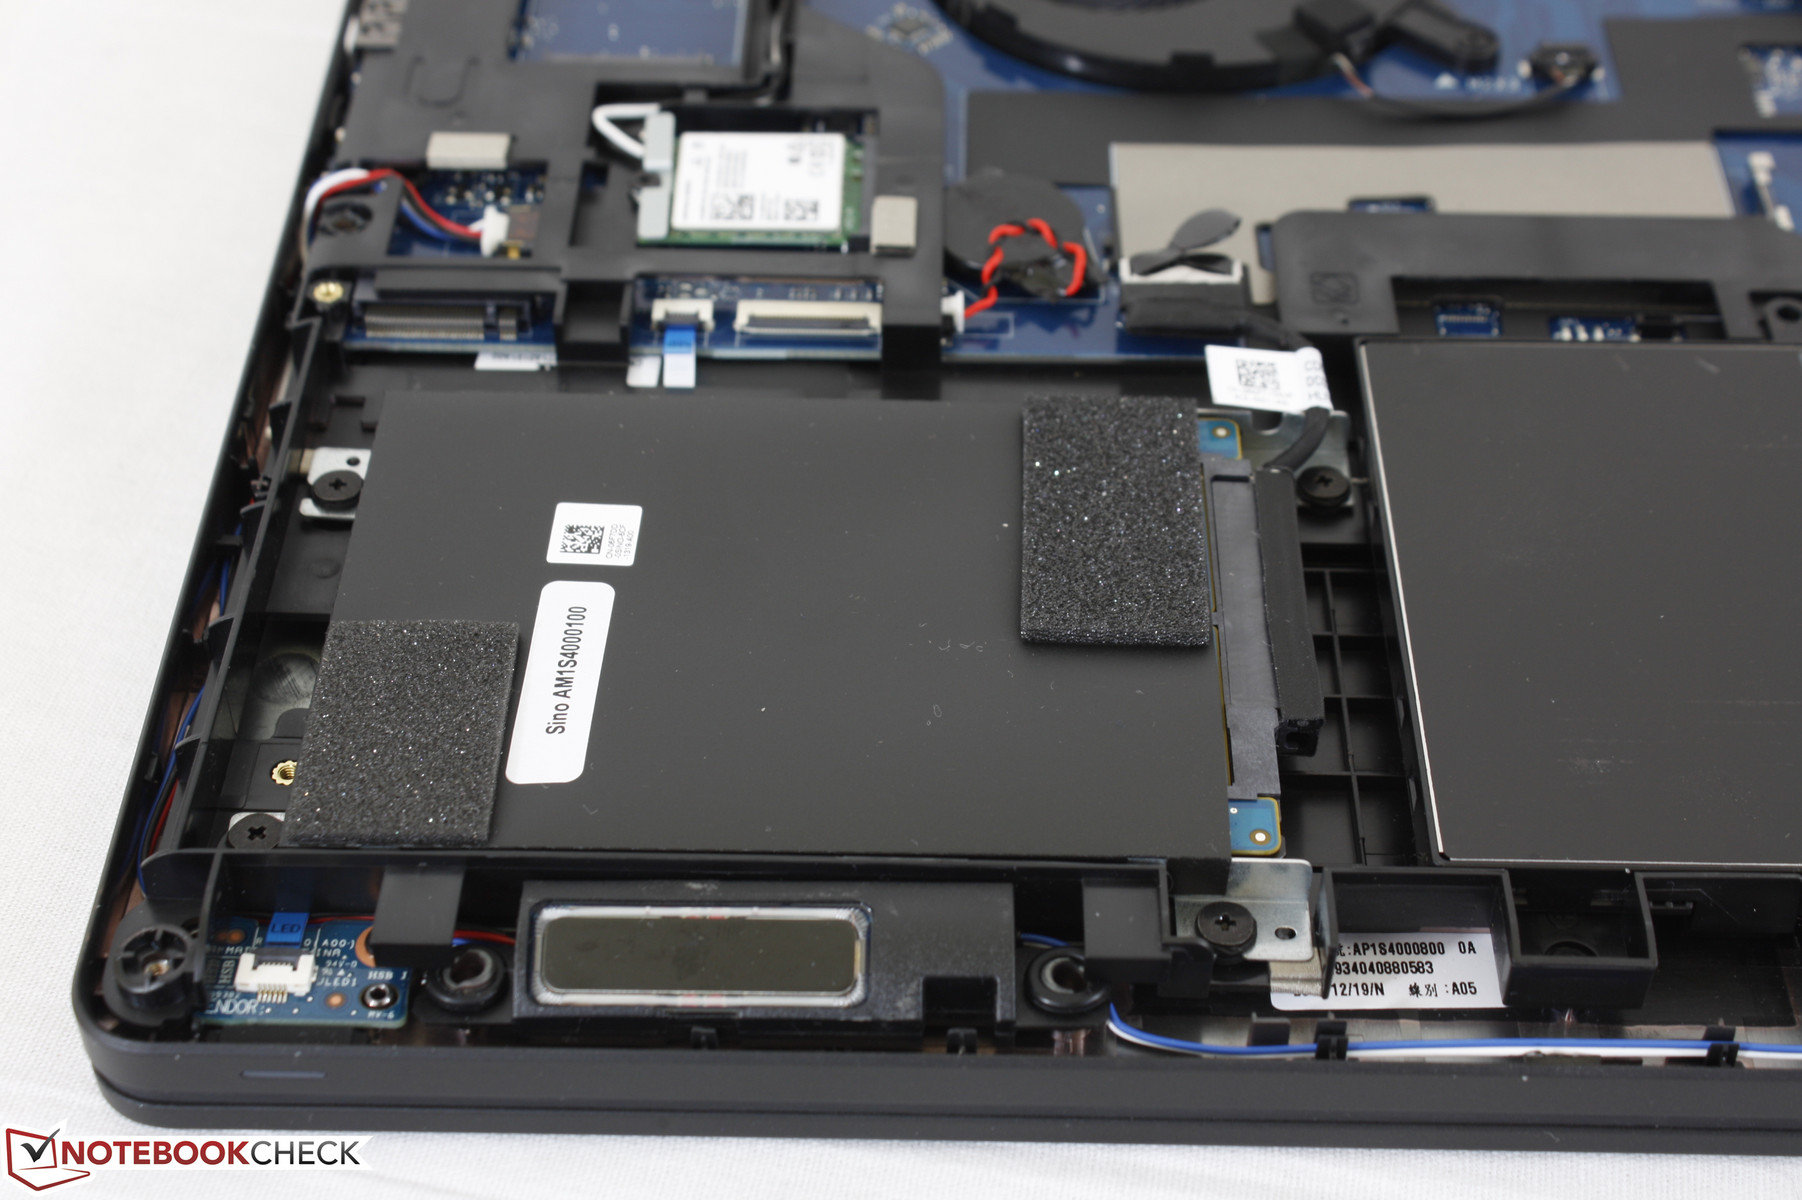
A total of three internal storage bays are available in the form a 2.5-inch SATA III bay, an M.2 2280 slot with NVMe support, and an uncommon M.2 2242 slot. Note that the M.2 2280 slot is hidden underneath the 2.5-inch bay, so access to this slot requires removing the 2.5-inch HDD or SSD first in a change from the previous generation. The 2.5-inch SATA III bay should be able to support both 7 mm and 9.5 mm thick drives given the clearance above it.
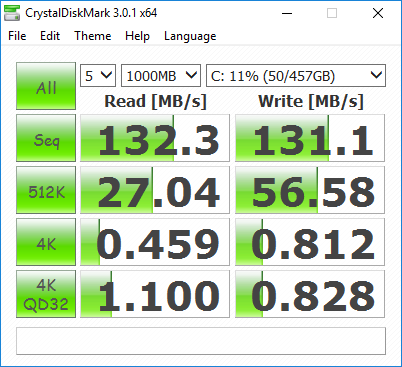
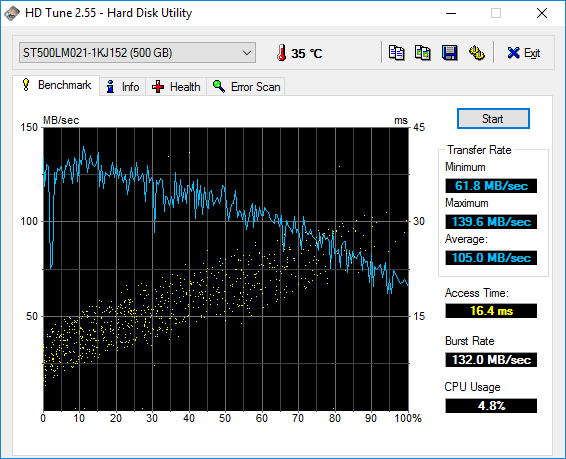
Our test unit houses just a single 500 GB Seagate ST500LM021-1KJ15 mechanical drive. Transfer rates are where we expect a 7200 RPM drive to perform at around 105 MB/s according to HD Tune. This is orders of magnitude slower than SATA III SSDs and NVMe solutions, so users should definitely consider higher-end SKUs of the Latitude 5580 or simply upgrade the storage on their own.
See our growing list of HDDs and SSDs for more benchmark comparisons.
| Dell Latitude 5580 Seagate ST500LM021-1KJ15 | Lenovo ThinkPad T570-20H90002GE Samsung PM961 MZVLW256HEHP | Asus AsusPro P4540UQ-FY0056R SK Hynix HFS256G39TND-N210A | Toshiba Satellite Pro R50-C-16V TOSHIBA MQ01ABD075 | HP ProBook 650 G3 Z2N47EA Samsung SSD 850 EVO 250GB | |
|---|---|---|---|---|---|
| CrystalDiskMark 3.0 | 16541% | 10100% | -30% | 7088% | |
| Read Seq (MB/s) | 132.3 | 1318 896% | 498.4 277% | 96.5 -27% | 506 282% |
| Write Seq (MB/s) | 131.1 | 1166 789% | 257.1 96% | 77.9 -41% | 475.2 262% |
| Read 512 (MB/s) | 27.04 | 933 3350% | 309.3 1044% | 20.82 -23% | 435.9 1512% |
| Write 512 (MB/s) | 56.6 | 860 1419% | 264.2 367% | 19.83 -65% | 367.2 549% |
| Read 4k (MB/s) | 0.459 | 56.6 12231% | 30.6 6567% | 0.342 -25% | 41.78 9002% |
| Write 4k (MB/s) | 0.812 | 130.6 15984% | 77.3 9420% | 0.836 3% | 86.1 10503% |
| Read 4k QD32 (MB/s) | 1.1 | 510 46264% | 357.4 32391% | 0.595 -46% | 263.2 23827% |
| Write 4k QD32 (MB/s) | 0.828 | 426.4 51398% | 254.5 30637% | 0.706 -15% | 90 10770% |

GPU Performance
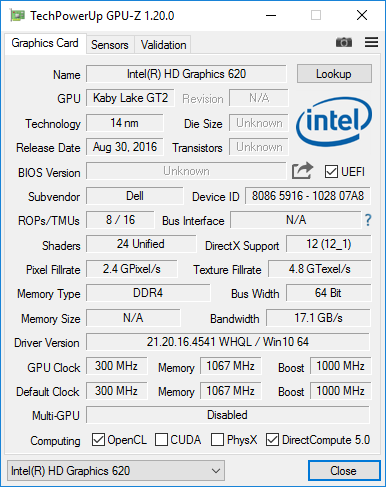
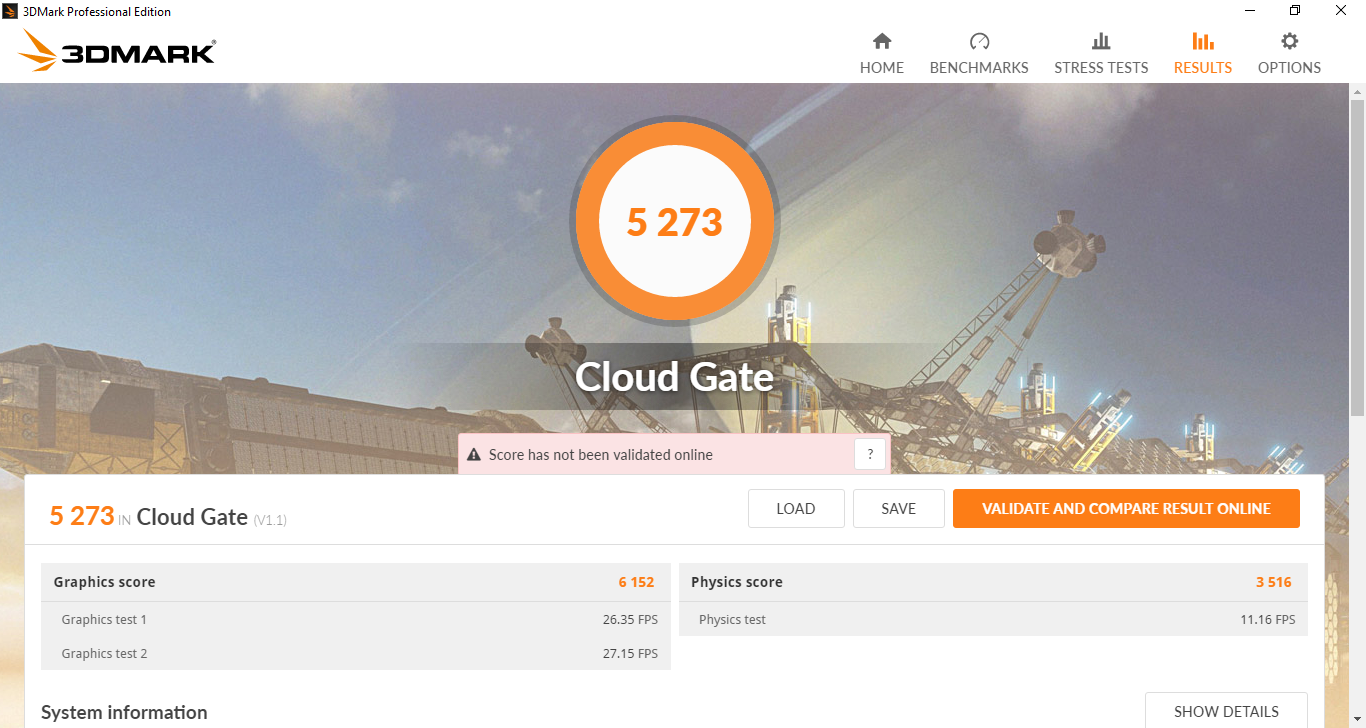
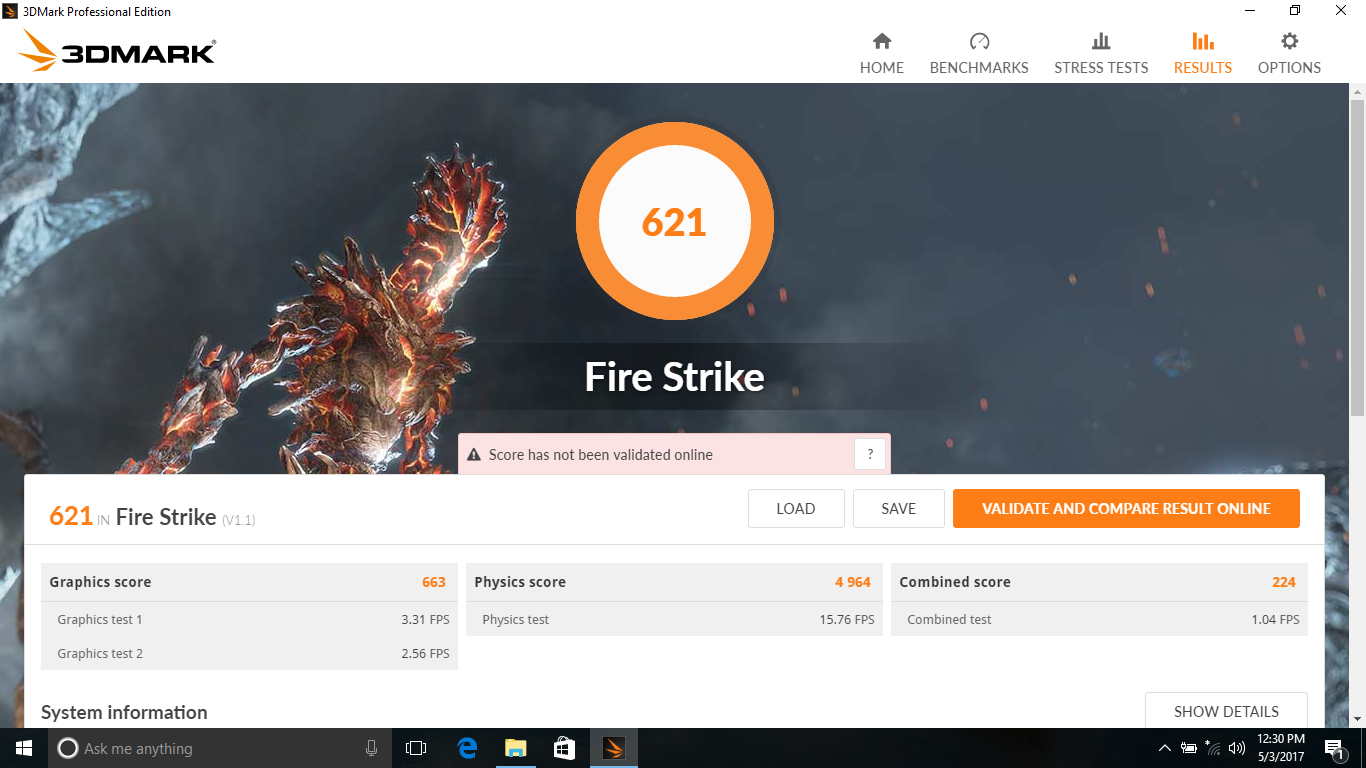
According to 3DMark, the integrated HD Graphics 620 in the Dell performs about the same as the ThinkPad T470s with its slightly faster i5-7300U CPU. Performance is also not significantly better than the last generation HD Graphics 520 in the Miix 510 Pro, so users shouldn't expect any notable leaps in gaming performance when jumping from Skylake to Kaby Lake integrated graphics. Nonetheless, the GPU will still handily outperform integrated GPUs associated with passively-cooled processors such as the Celeron N3050 or Core m-6Y75.
See our dedicated GPU page on the HD Graphics 620 for more technical information and benchmark comparisons.
| 3DMark 11 | |
| 1280x720 Performance GPU | |
| Dell Latitude 12 5285 2-in-1 | |
| Lenovo ThinkPad T470s-20HF0012US | |
| Dell Latitude 5480 N005L548014EMEA | |
| Lenovo Miix 510 Pro 80U10006GE | |
| Dell Latitude 5580 | |
| Toshiba Portege Z20t-C-121 | |
| Asus Vivobook F556UQ-XO626D | |
| Asus PU551LA-XO359G | |
| Acer Aspire One Cloudbook 14 AO1-431-C6QM | |
| 1280x720 Performance Combined | |
| Dell Latitude 5480 N005L548014EMEA | |
| Lenovo ThinkPad T470s-20HF0012US | |
| Dell Latitude 12 5285 2-in-1 | |
| Lenovo Miix 510 Pro 80U10006GE | |
| Asus Vivobook F556UQ-XO626D | |
| Dell Latitude 5580 | |
| Asus PU551LA-XO359G | |
| Toshiba Portege Z20t-C-121 | |
| Acer Aspire One Cloudbook 14 AO1-431-C6QM | |
| 3DMark | |
| 1280x720 Cloud Gate Standard Graphics | |
| Dell Latitude 12 5285 2-in-1 | |
| Dell Latitude 5480 N005L548014EMEA | |
| Lenovo ThinkPad T470s-20HF0012US | |
| Lenovo Miix 510 Pro 80U10006GE | |
| Dell Latitude 5580 | |
| Asus Vivobook F556UQ-XO626D | |
| Acer Aspire One Cloudbook 14 AO1-431-C6QM | |
| 1920x1080 Fire Strike Graphics | |
| Dell Latitude 12 5285 2-in-1 | |
| Dell Latitude 5480 N005L548014EMEA | |
| Lenovo ThinkPad T470s-20HF0012US | |
| Dell Latitude 5580 | |
| Asus PU551LA-XO359G | |
| Asus Vivobook F556UQ-XO626D | |
| Acer Aspire One Cloudbook 14 AO1-431-C6QM | |
| 1280x720 Ice Storm Standard Graphics | |
| Dell Latitude 5480 N005L548014EMEA | |
| Lenovo ThinkPad T470s-20HF0012US | |
| Asus Vivobook F556UQ-XO626D | |
| Asus PU551LA-XO359G | |
| Dell Latitude 5580 | |
| Acer Aspire One Cloudbook 14 AO1-431-C6QM | |
| Dell Latitude 12 5285 2-in-1 | |
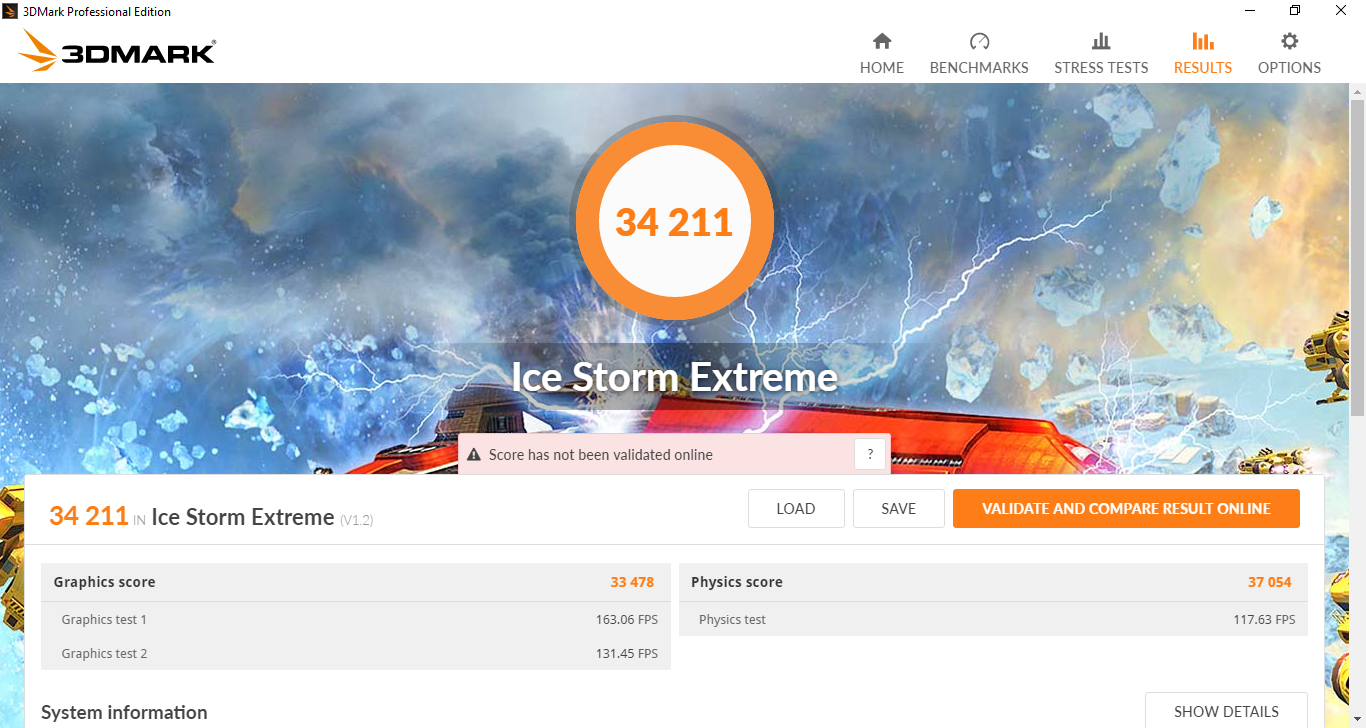
| 1920x1080 Ice Storm Extreme Graphics | |
| Dell Latitude 5480 N005L548014EMEA | |
| Dell Latitude 12 5285 2-in-1 | |
| Dell Latitude 5580 | |
| Asus PU551LA-XO359G | |
| Asus Vivobook F556UQ-XO626D | |
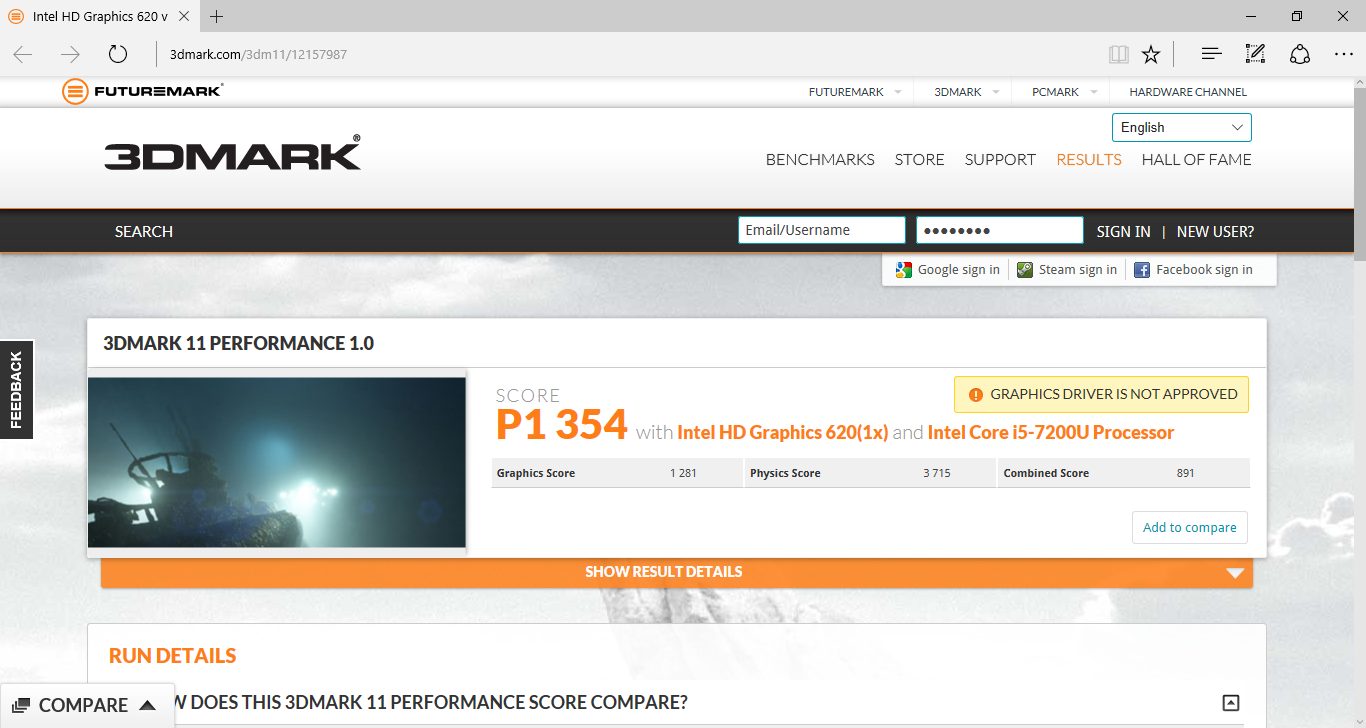
| 3DMark 11 Performance | 1354 points | |
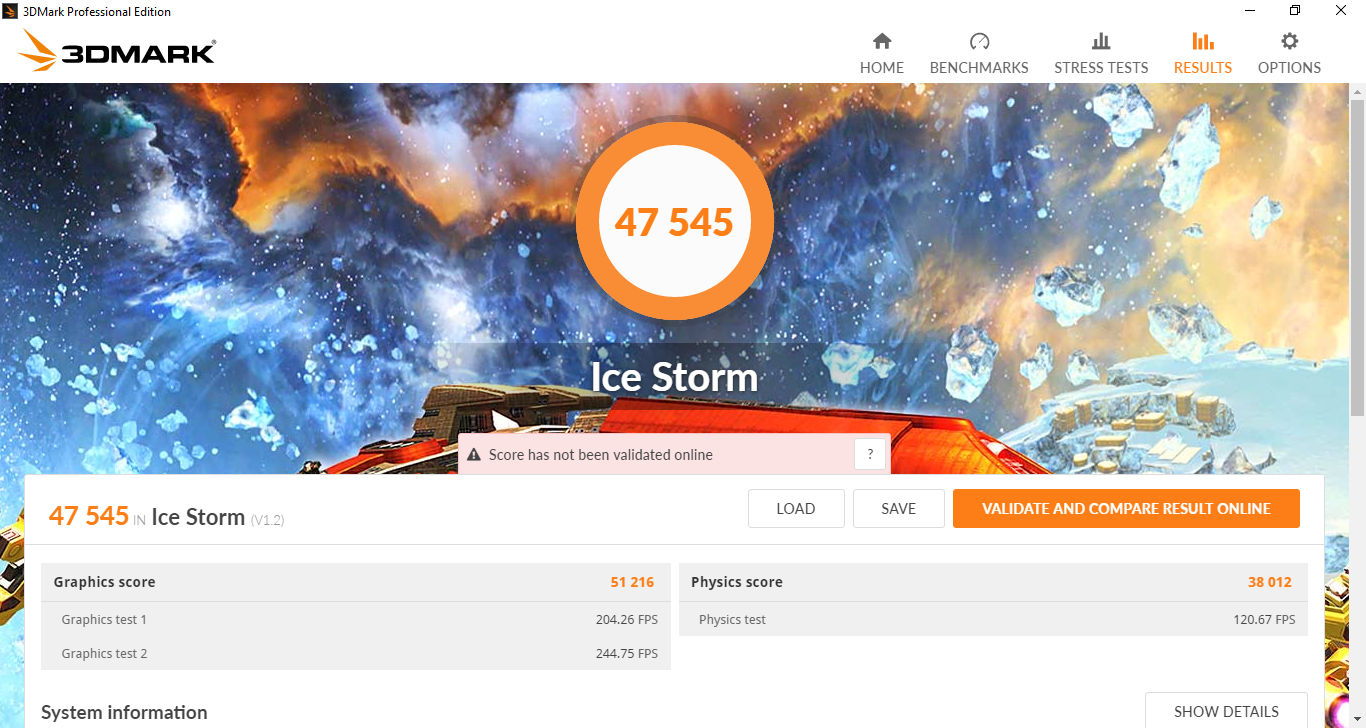
| 3DMark Ice Storm Standard Score | 47545 points | |
| 3DMark Cloud Gate Standard Score | 5273 points | |
| 3DMark Fire Strike Score | 621 points | |
Help | ||
| low | med. | high | ultra | |
|---|---|---|---|---|
| BioShock Infinite (2013) | 52 | 29 | ||
| Rise of the Tomb Raider (2016) | 19.1 | 11.2 |
Stress Test
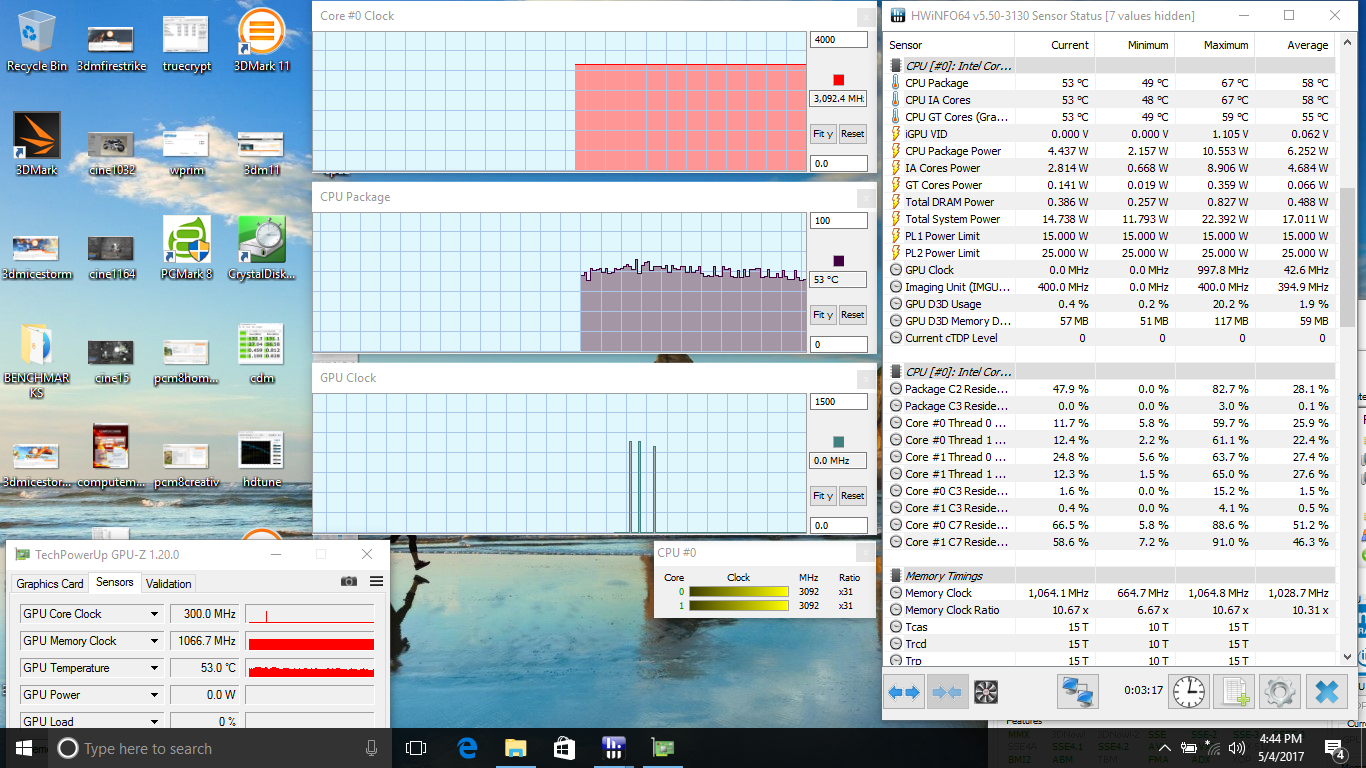
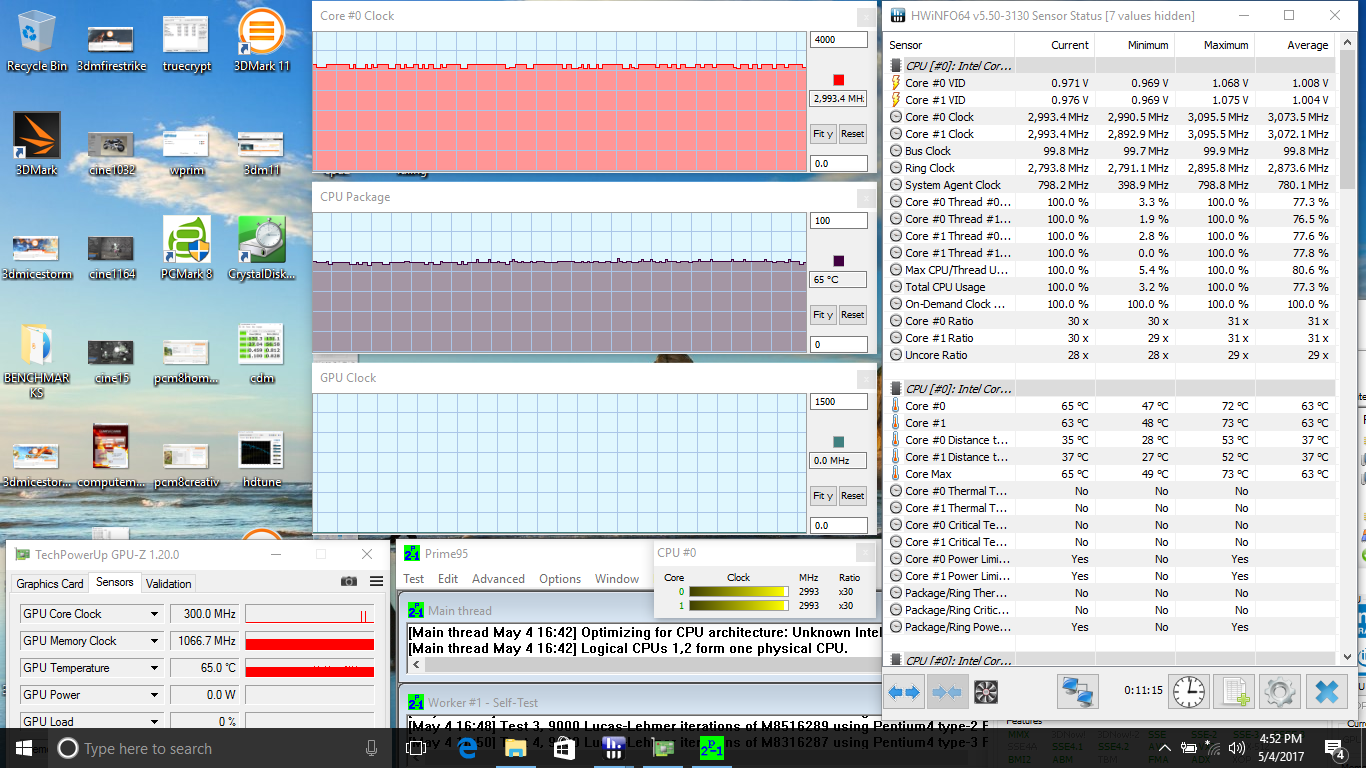
We stress the notebook with unrealistically high processing loads to identify for any potential throttling issues. When under Prime95 load, the CPU is able to maintain a clock rate of 3.0 GHz or 500 MHz above its base. This drop to 2.3 GHz if running both Prime95 and FurMark simultaneously, so the notebook is unable to maintain its base clock rate of 2.5 GHz if under extreme CPU and GPU processing conditions. The GPU, however, runs stably at 998 MHz no matter the load. Core temperature appears to plateau at a relatively cool 65 C and never any higher.
It would be interesting to see if SKUs with the faster quad-core i7-7820HQ will also plateau at a core temperature in the 65 C range. If so, this could potentially have a negative impact on the Turbo Boost performance of the Latitude 5580.
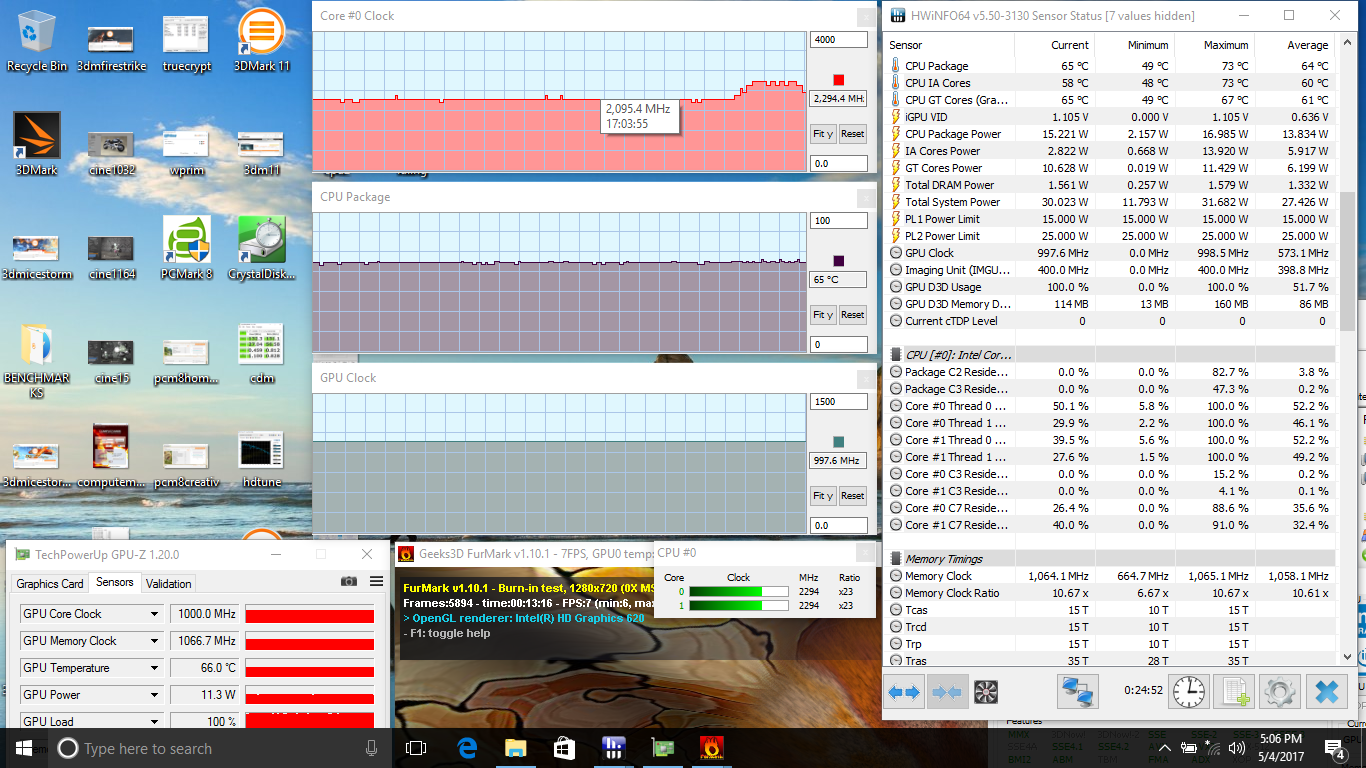
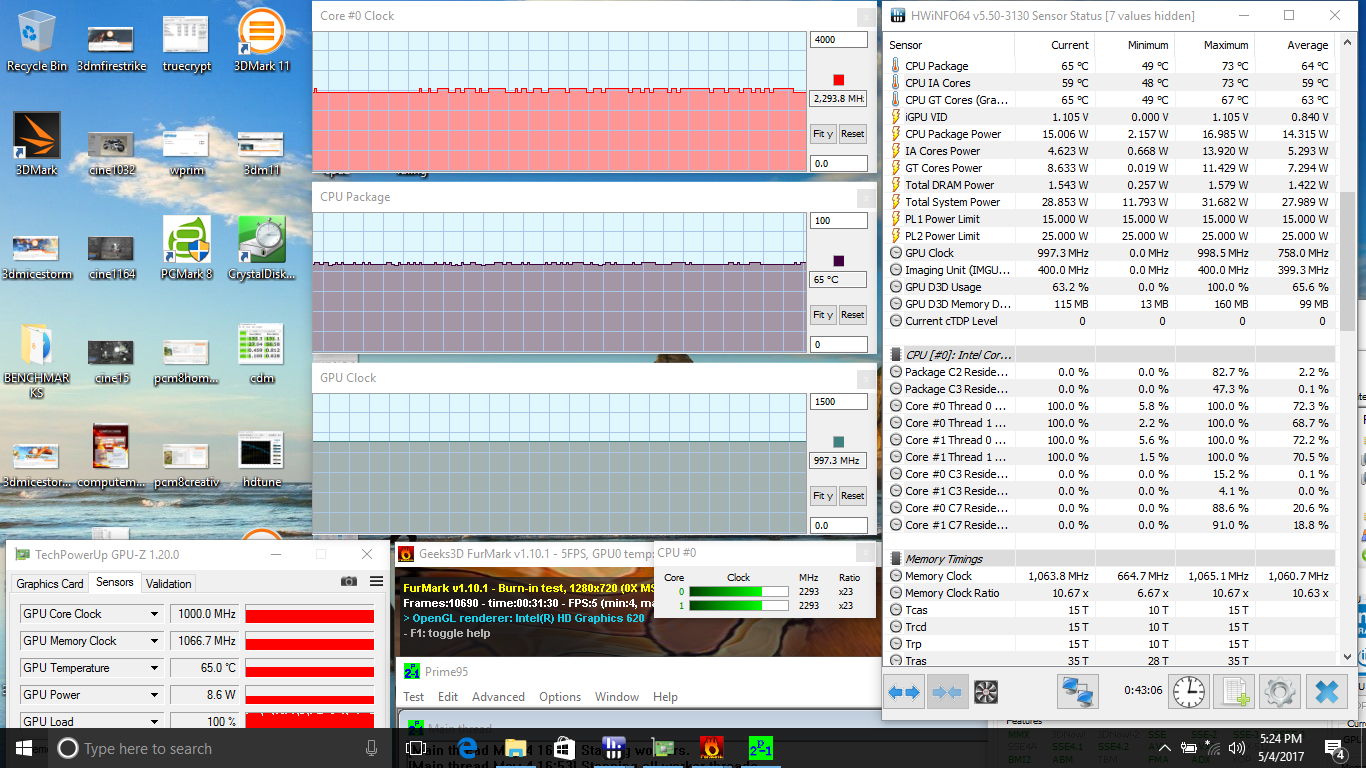
| CPU Clock (GHz) | GPU Clock (MHz) | Average CPU Temperature (°C) | |
| Prime95 Stress | 3.0 | -- | 65 |
| FurMark Stress | -- | 998 | 65 |
| Prime95 + FurMark Stress | 2.3 | 998 | 65 |
Emissions
System Noise
A single ~50 mm fan and heat pipe make up the cooling solution for the system. The fan is always active during low loads at around 32 dB(A), which is still quiet enough to be tolerable in a home or office setting. The mechanical hard drive, however, runs more loudly than even the fans at around 33 dB(A) in our particular test unit. A proper SSD is definitely desirable to reduce noise and power consumption in addition to its faster performance. A proper hotkey for toggling the fan to "silent mode" would have been useful even if it meant temporarily under-clocking the CPU.
Higher loads with 3DMark06 and Prime95+FurMark will induce a fan noise of 33.5 dB(A) and 34.7 dB(A), respectively. The Latitude 5580 is generally quieter than most Ultrabooks when under stress, though this may change if configuring with the higher-end i5-7440HQ or i7-7820HQ.
We can notice no distracting coil whine on our particular test unit.
Noise level
| Idle |
| 32.6 / 32.6 / 32.8 dB(A) |
| HDD |
| 33.2 dB(A) |
| Load |
| 33.5 / 34.7 dB(A) |
 | ||
30 dB silent 40 dB(A) audible 50 dB(A) loud |
||
min: | ||
| Dell Latitude 5580 HD Graphics 620, i5-7200U, Seagate ST500LM021-1KJ15 | Lenovo ThinkPad T570-20H90002GE HD Graphics 620, i5-7200U, Samsung PM961 MZVLW256HEHP | Asus AsusPro P4540UQ-FY0056R GeForce 940MX, i5-7200U, SK Hynix HFS256G39TND-N210A | Toshiba Satellite Pro R50-C-16V HD Graphics 520, 6006U, TOSHIBA MQ01ABD075 | HP ProBook 650 G3 Z2N47EA HD Graphics 620, i5-7200U, Samsung SSD 850 EVO 250GB | |
|---|---|---|---|---|---|
| Noise | 1% | 0% | 2% | -7% | |
| off / environment * (dB) | 28.2 | 29.3 -4% | 30.3 -7% | 30.4 -8% | |
| Idle Minimum * (dB) | 32.6 | 29.3 10% | 30.3 7% | 31.8 2% | 32.5 -0% |
| Idle Average * (dB) | 32.6 | 29.3 10% | 30.3 7% | 31.8 2% | 33.1 -2% |
| Idle Maximum * (dB) | 32.8 | 31.2 5% | 30.3 8% | 31.8 3% | 33.7 -3% |
| Load Average * (dB) | 33.5 | 35.1 -5% | 35.4 -6% | 31.9 5% | 37 -10% |
| Load Maximum * (dB) | 34.7 | 38.7 -12% | 37.2 -7% | 31.8 8% | 42.5 -22% |
* ... smaller is better
Temperature
Surface temperatures are flat when idling or during very low loads. The right palm rest can become noticeably warmer than the rest of the notebook since the 2.5-inch SATA III bay is directly underneath, but configurations equipped with primary SSDs will not likely notice significant temperature changes.
Very high processing loads will warm the left side of the notebook much more than the right due to the positioning of the processor and heat pipe. At worst, we can record a surface temperature of just over 36 C on the keyboard as shown by our temperature maps below. It's not warm enough to be uncomfortable if typing, but the bottom can reach well over 40 C in comparison. Working on a table is recommended if running more demanding applications.
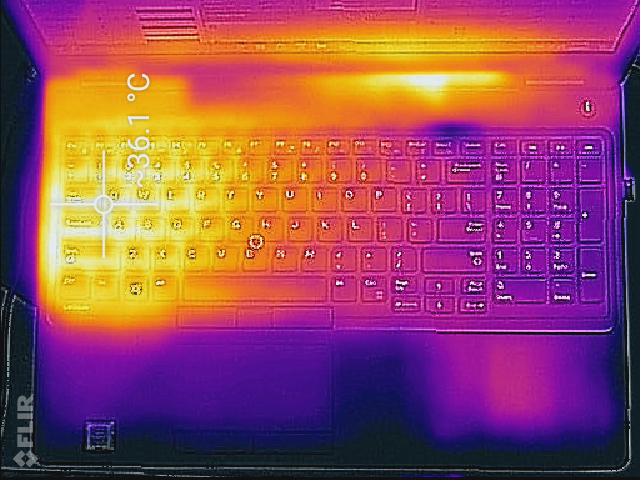
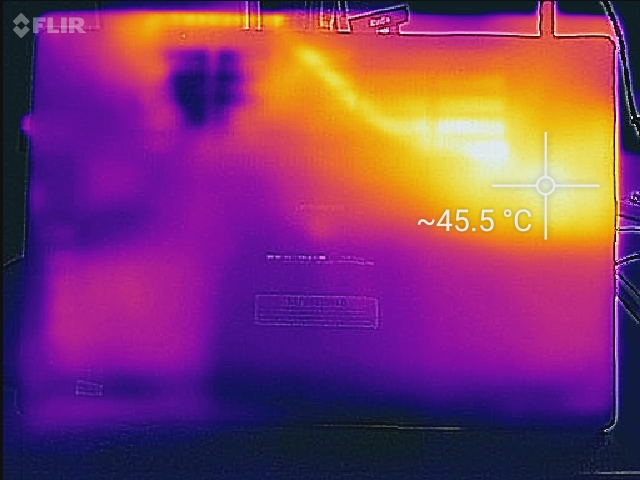
(+) The maximum temperature on the upper side is 36.2 °C / 97 F, compared to the average of 34.3 °C / 94 F, ranging from 21.2 to 62.5 °C for the class Office.
(-) The bottom heats up to a maximum of 45.6 °C / 114 F, compared to the average of 36.8 °C / 98 F
(+) In idle usage, the average temperature for the upper side is 25 °C / 77 F, compared to the device average of 29.5 °C / 85 F.
(+) The palmrests and touchpad are cooler than skin temperature with a maximum of 27.2 °C / 81 F and are therefore cool to the touch.
(±) The average temperature of the palmrest area of similar devices was 27.6 °C / 81.7 F (+0.4 °C / 0.7 F).
Speakers

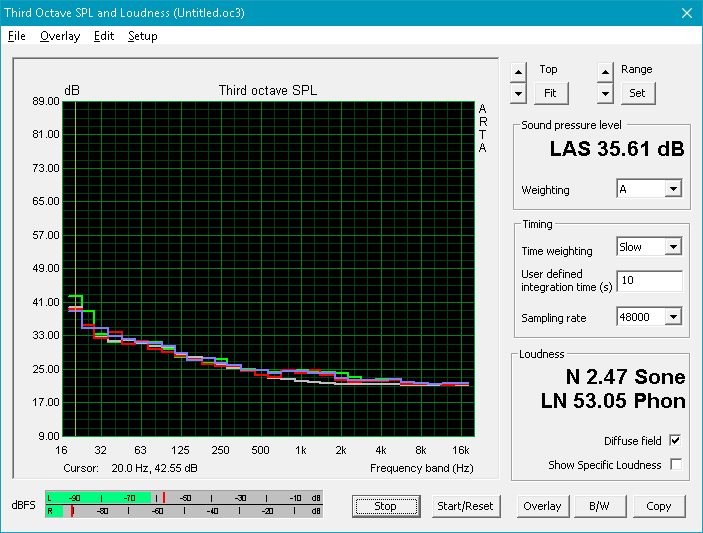
The internal stereo speakers are unchanged from the E5550/E5570 with above average sound quality for a business notebook. In fact, its pink noise curve is quite similar to that of the XPS 15 9560 with a relatively stable reproduction of treble frequencies and hints of bass. The system ships with the same MaxxAudio software from Waves as well to allow for equalizer adjustments and quick changes to bass and treble. Maximum volume is sufficiently loud for a small room and introduces no static or major reverberations.
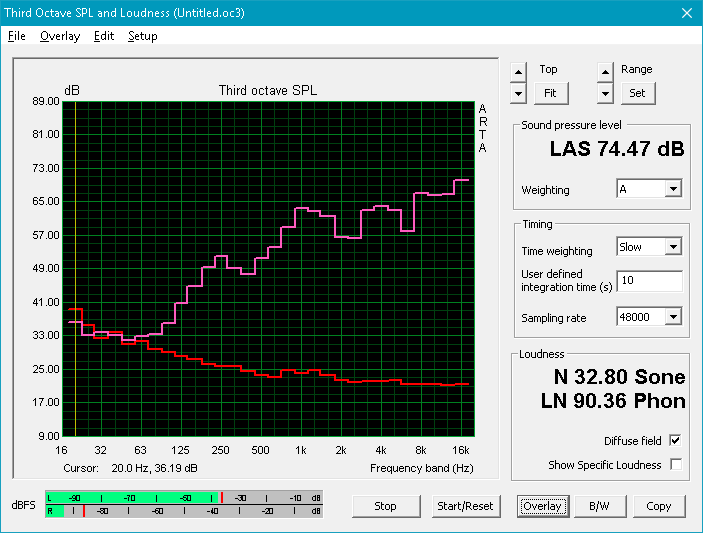
Dell Latitude 5580 audio analysis
(-) | not very loud speakers (70.2 dB)
Bass 100 - 315 Hz
(±) | reduced bass - on average 12.5% lower than median
(±) | linearity of bass is average (10.4% delta to prev. frequency)
Mids 400 - 2000 Hz
(+) | balanced mids - only 4.6% away from median
(±) | linearity of mids is average (8.9% delta to prev. frequency)
Highs 2 - 16 kHz
(±) | higher highs - on average 5.1% higher than median
(±) | linearity of highs is average (9.9% delta to prev. frequency)
Overall 100 - 16.000 Hz
(±) | linearity of overall sound is average (24.6% difference to median)
Compared to same class
» 73% of all tested devices in this class were better, 7% similar, 20% worse
» The best had a delta of 7%, average was 21%, worst was 53%
Compared to all devices tested
» 75% of all tested devices were better, 5% similar, 20% worse
» The best had a delta of 4%, average was 23%, worst was 134%
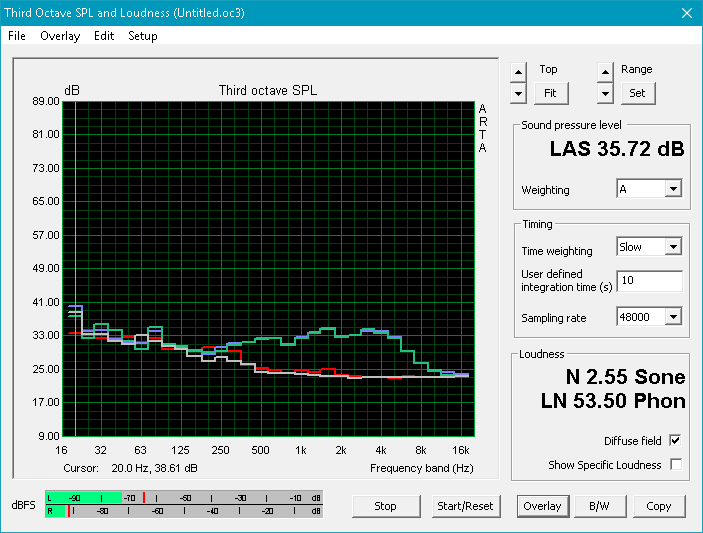
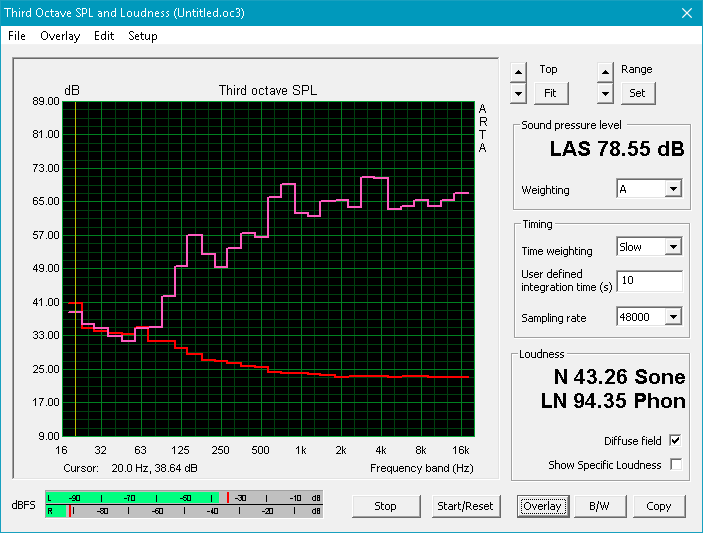
Apple MacBook 12 (Early 2016) 1.1 GHz audio analysis
(+) | speakers can play relatively loud (83.6 dB)
Bass 100 - 315 Hz
(±) | reduced bass - on average 11.3% lower than median
(±) | linearity of bass is average (14.2% delta to prev. frequency)
Mids 400 - 2000 Hz
(+) | balanced mids - only 2.4% away from median
(+) | mids are linear (5.5% delta to prev. frequency)
Highs 2 - 16 kHz
(+) | balanced highs - only 2% away from median
(+) | highs are linear (4.5% delta to prev. frequency)
Overall 100 - 16.000 Hz
(+) | overall sound is linear (10.2% difference to median)
Compared to same class
» 7% of all tested devices in this class were better, 2% similar, 90% worse
» The best had a delta of 5%, average was 18%, worst was 53%
Compared to all devices tested
» 5% of all tested devices were better, 1% similar, 94% worse
» The best had a delta of 4%, average was 23%, worst was 134%
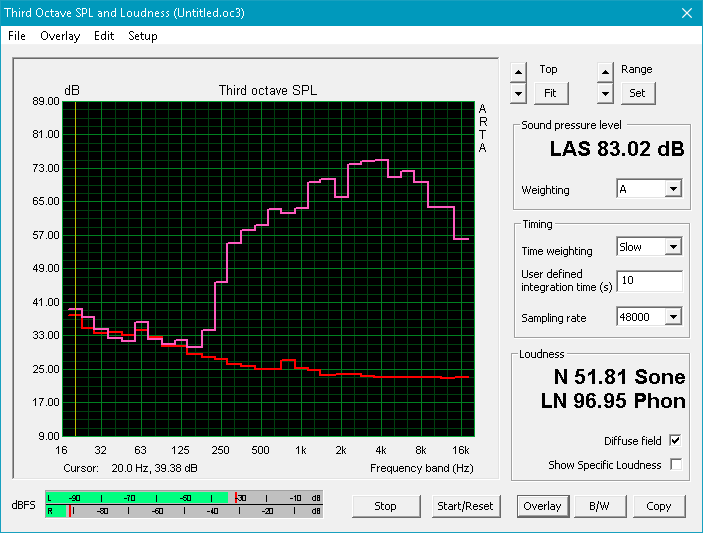
Frequency Comparison (Checkbox selectable!)
Graph 1: Pink Noise 100% Vol.; Graph 2: Audio off
Energy Management
Power Consumption
Our particular Latitude 5580 configuration is measurably more power efficient than other 15-inch business notebooks with Intel U-class processors. Expect a power draw of only 30 W when gaming or when running very demanding loads compared to over 45 W on the ThinkPad T570. We suspect that SKUs with HQ-class processors and FHD display options will likely draw more power than our entry-level test unit.
Dell ships the same small (~10.5 x 6.5 x 2.5 cm) 65 W AC adapter across all Latitude 5580 SKUs.
| Off / Standby | |
| Idle | |
| Load |
|
Key:
min: | |
| Dell Latitude 5580 i5-7200U, HD Graphics 620, Seagate ST500LM021-1KJ15, TN LED, 1366x768, 15.6" | Lenovo ThinkPad T570-20H90002GE i5-7200U, HD Graphics 620, Samsung PM961 MZVLW256HEHP, IPS, 1920x1080, 15.6" | Asus AsusPro P4540UQ-FY0056R i5-7200U, GeForce 940MX, SK Hynix HFS256G39TND-N210A, IPS, 1920x1080, 15.6" | Toshiba Satellite Pro R50-C-16V 6006U, HD Graphics 520, TOSHIBA MQ01ABD075, TN LED, 1366x768, 15.6" | HP ProBook 650 G3 Z2N47EA i5-7200U, HD Graphics 620, Samsung SSD 850 EVO 250GB, podświetlanie diodami LED, 1920x1080, 15.6" | |
|---|---|---|---|---|---|
| Power Consumption | -18% | -54% | -16% | -40% | |
| Idle Minimum * (Watt) | 3.5 | 3.6 -3% | 4.9 -40% | 6 -71% | 7 -100% |
| Idle Average * (Watt) | 6 | 7.7 -28% | 8.1 -35% | 8.7 -45% | 9.2 -53% |
| Idle Maximum * (Watt) | 7.3 | 8.2 -12% | 9.4 -29% | 9.2 -26% | 10.3 -41% |
| Load Average * (Watt) | 30.8 | 30.8 -0% | 50 -62% | 18.6 40% | 25.8 16% |
| Load Maximum * (Watt) | 31 | 46.1 -49% | 63.7 -105% | 23.8 23% | 37.5 -21% |
* ... smaller is better
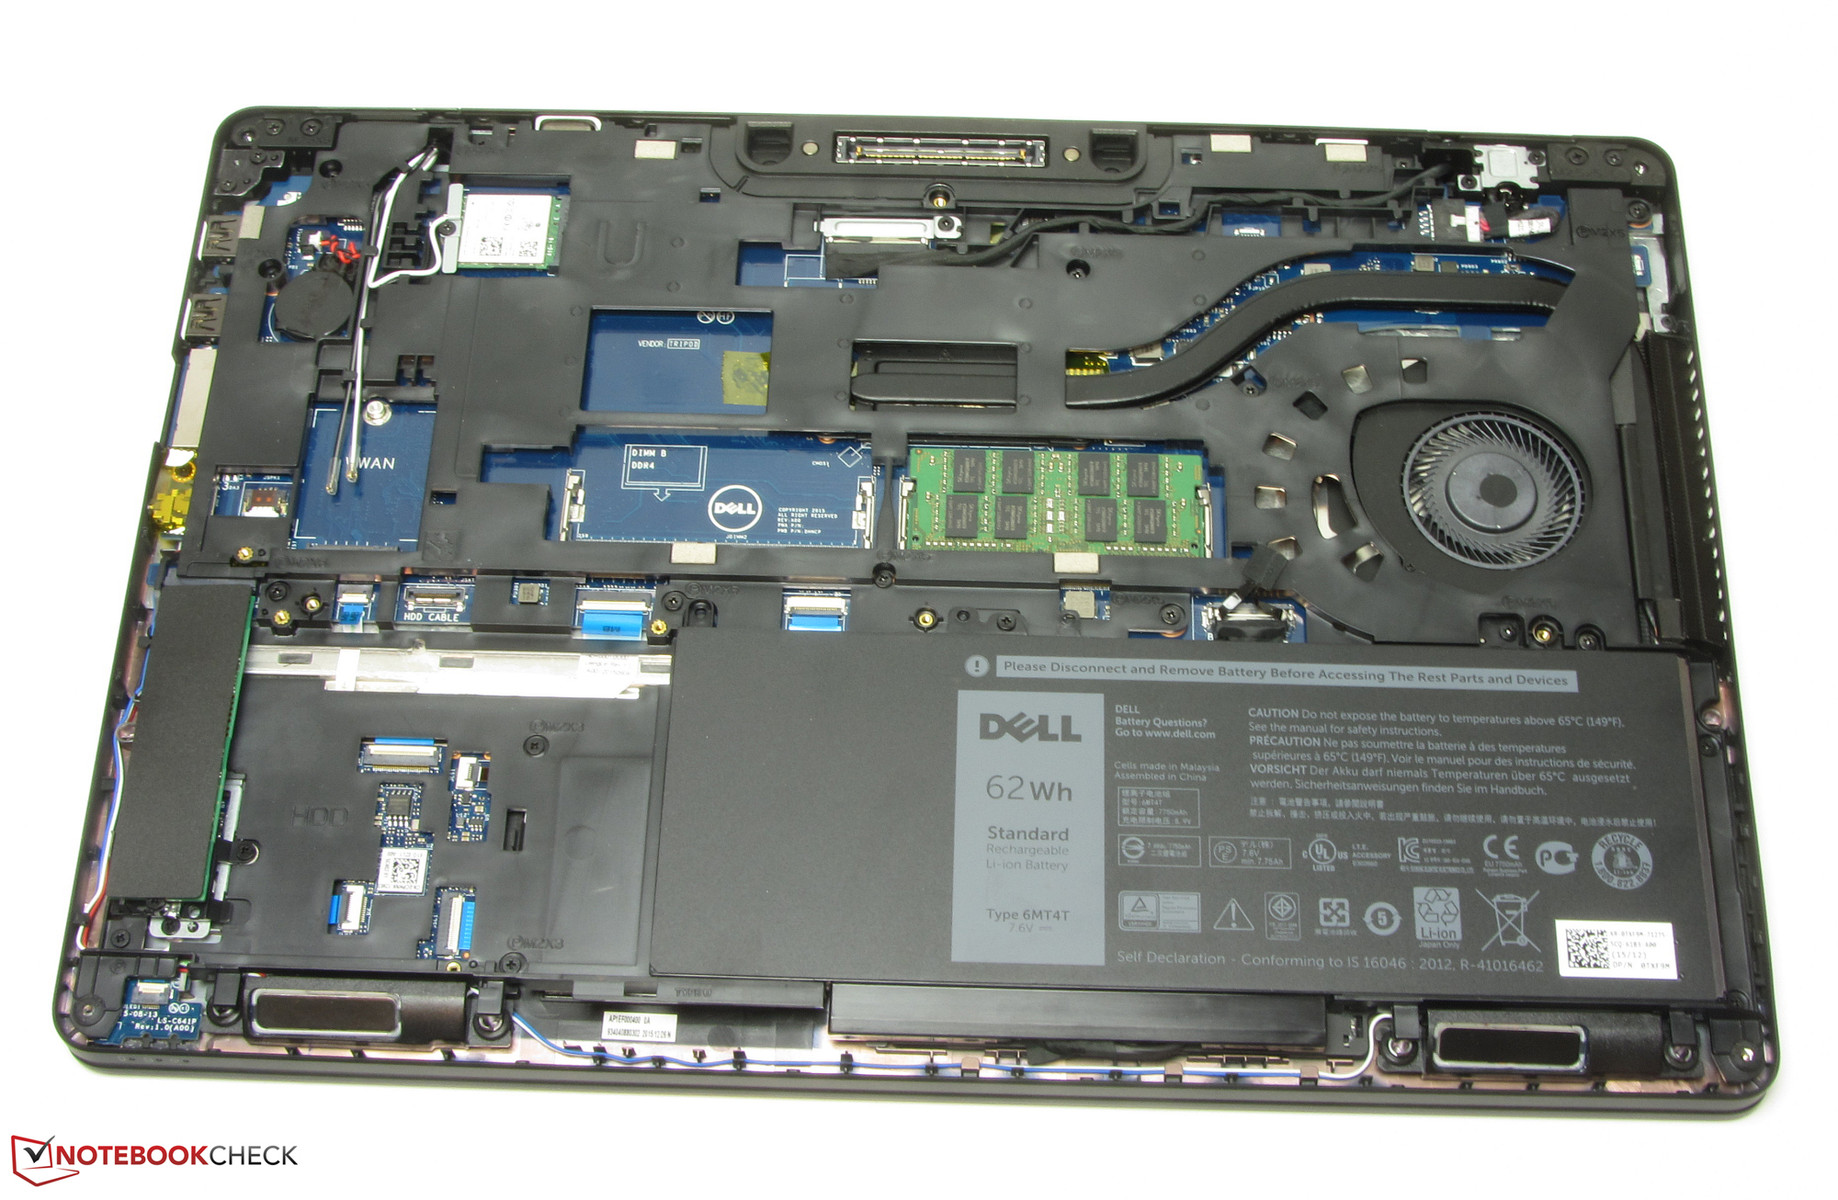
Battery Life
The 62 Wh internal battery of the E5570 is already quite large considering the notebook class, but Dell has upped the capacity even further to 68 Wh for the Latitude 5580. Runtimes are very impressive at over 11.5 hours of real-world WLAN use compared to "only" eight hours on the HP ProBook 650 G3 with the same CPU and integrated GPU. Idling on desktop with no programs running will last for over 18 hours before automatic shutdown.
Charging from near empty to full capacity will take just under two hours with the included AC adapter.
| Dell Latitude 5580 i5-7200U, HD Graphics 620, 68 Wh | Lenovo ThinkPad T570-20H90002GE i5-7200U, HD Graphics 620, 56 Wh | Asus AsusPro P4540UQ-FY0056R i5-7200U, GeForce 940MX, 72 Wh | Toshiba Satellite Pro R50-C-16V 6006U, HD Graphics 520, 44 Wh | HP Probook 650 G3 Z2W44ET i5-7200U, HD Graphics 620, 48 Wh | |
|---|---|---|---|---|---|
| Battery runtime | 9% | -1% | -49% | -9% | |
| Reader / Idle (h) | 18.4 | 19.5 6% | 12.8 -30% | ||
| WiFi v1.3 (h) | 11.6 | 7.6 -34% | 11.5 -1% | 5.9 -49% | 7.8 -33% |
| Load (h) | 2.2 | 3.4 55% | 3 36% |
Pros
Cons
Verdict
There isn't anything particularly special about that Latitude 5580 that we haven't already mentioned on our existing E5550/E5570 pages. Its long battery life, easy maintenance, very wide range of options, Linux certification, and comfortable keyboard all make for an attractive and very versatile business notebook for most types of office work.
Price is the main sticking point for the 5580. While entry-level configurations like ours can start in the $700 USD range, valuable business features like Smart Card, Thunderbolt 3, WWAN, NFC, and fingerprint reader will bump starting prices to well over $1000 USD. Furthermore, we recommend avoiding the horrid HD display and to instead invest in FHD, but the FHD SKU alone already starts at $1100 USD. Configurations with the faster HQ-class CPU start at $1000 USD and includes just 4 GB of RAM, the aforementioned HD display, and not even an SSD. Be prepared to pay much more than the castrated entry-level SKU in order to get the most out of what the Latitude 5580 chassis has to offer.
We will likely check out a higher-end SKU of the Latitude 5580 in the near future to get a better sense of what the family has to offer. An HQ-class CPU is over twice the TDP of a U-class CPU and the FHD panel will almost surely offer a better experience. How these more demanding components can impact battery life, fan noise, and performance is certainly deserving of another close look.
Avoid the baseline SKUs as they ship with below average HD displays and are almost feature-less. Both Thunderbolt 3 and the FHD panel are vital for a better experience and to make up for the lack of an E-port.
Dell Latitude 5580
- 05/11/2017 v6 (old)
Allen Ngo
Price comparison
