Lenovo ThinkPad T470s (7300U, FHD) Laptop Review
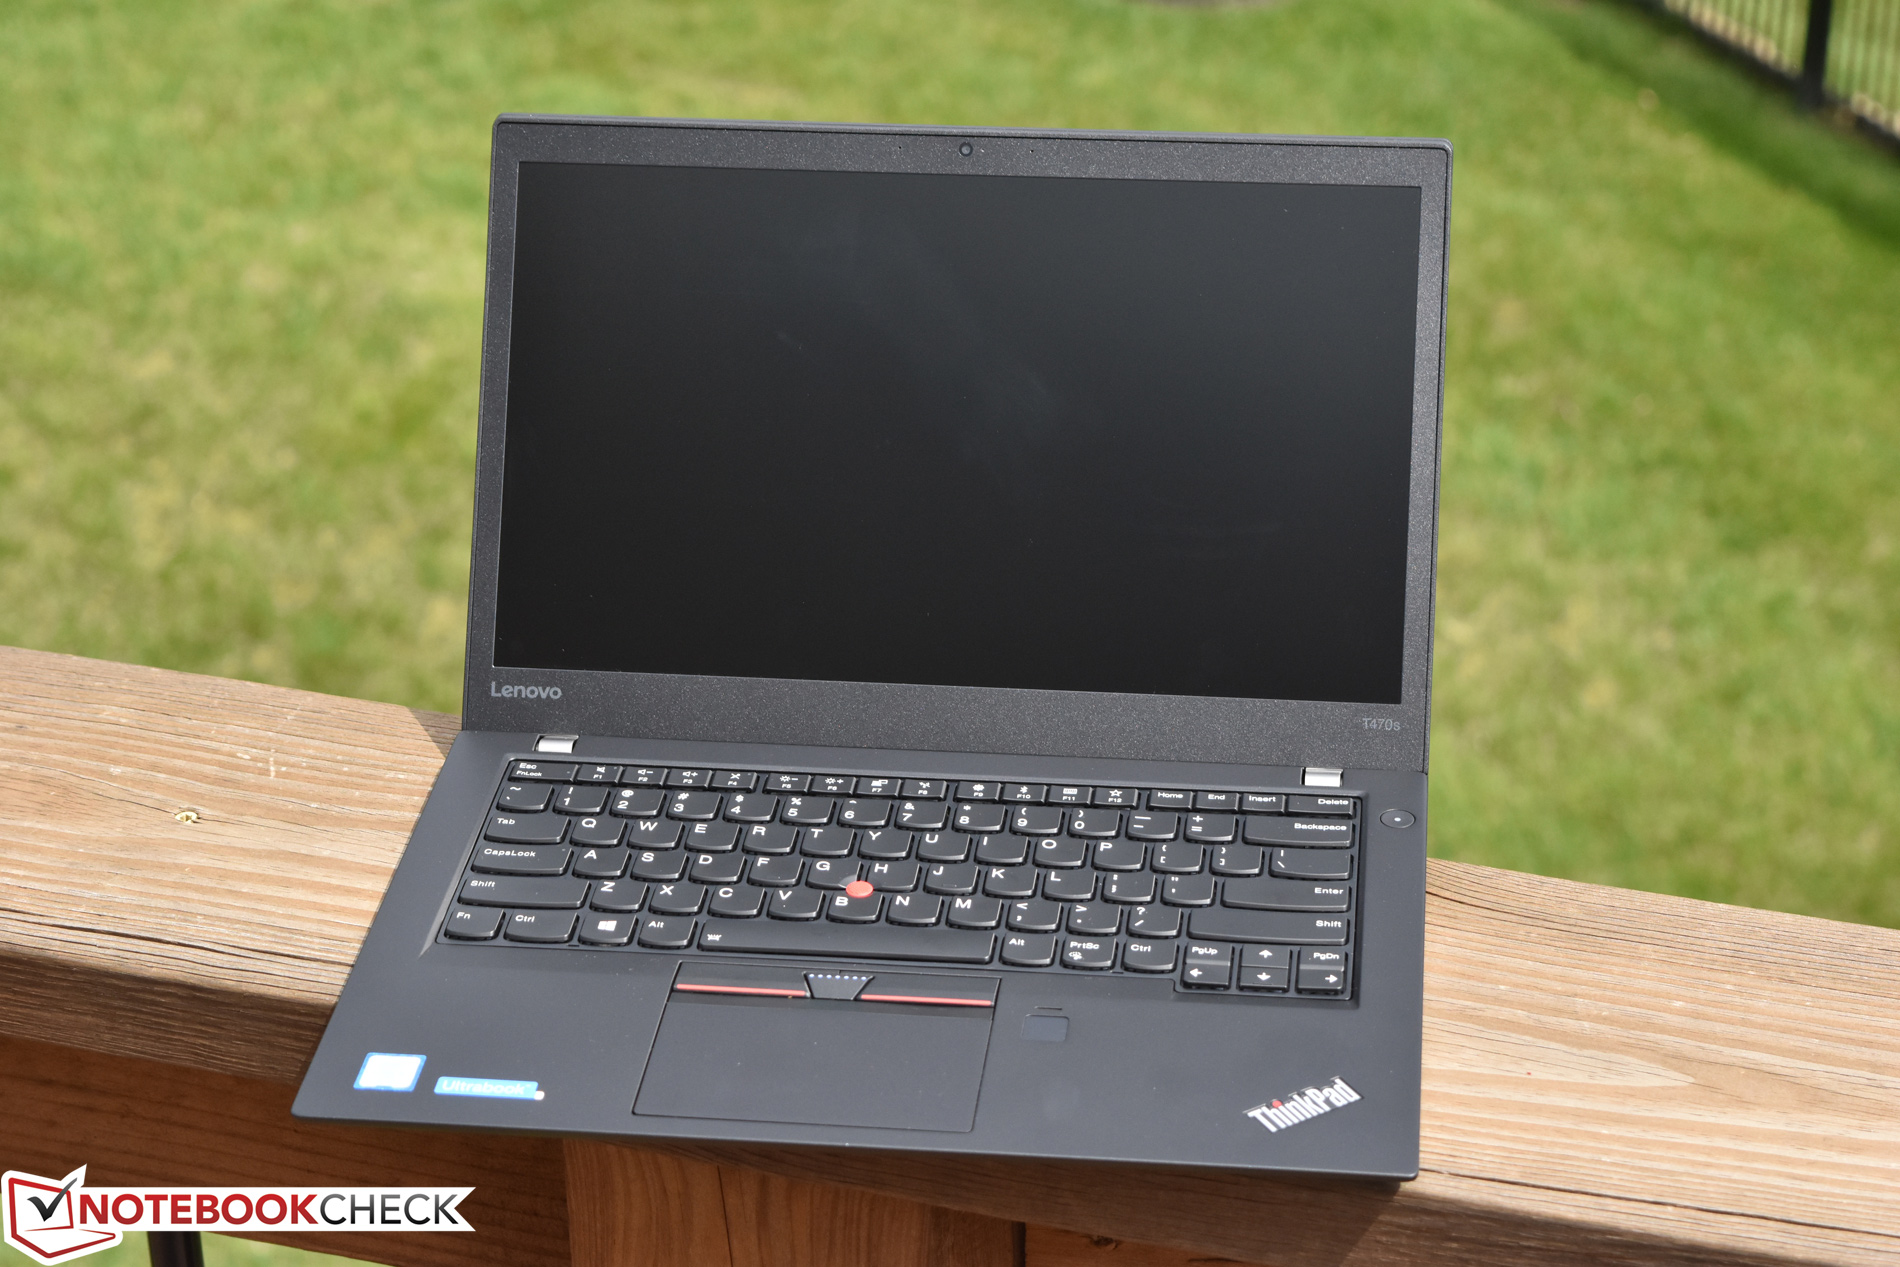
It’s been a couple of months since we initially reviewed the Lenovo T470s, but we left our first encounter already mostly impressed. At under 1.4 kg, it’s a remarkably portable 14-inch machine—but at the same time, thanks to the high-quality construction materials, it’s quite sturdy. The machine is loaded with connectivity options and future-proofed with a USB-C/Thunderbolt 3 port, it features excellent battery life, and of course, a terrific keyboard. However, we did have a few reservations: specifically, high temperatures during any sort of heavy CPU usage and the resulting limitations on CPU Turbo performance, as well as the very high price.
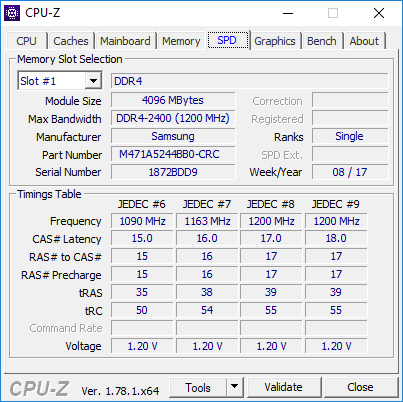
Today’s configuration may, in fact, address both of these complaints. It exchanges the Core i7 CPU (which never saw full utilization in the previous unit thanks to thermal limitations) for a Core i5. The massive 1 TB NVMe SSD has been reduced to a much more affordable 256 GB counterpart. The WQHD display panel is traded for an FHD touchscreen, still with anti-glare coating. And rather than 16 GB of RAM, we’re now supplied with 8 GB—but it remains dual-channel (and it should still be plenty for the average user).
With these modifications comes a welcomed reduction in price to $1,649. We also should hopefully see even better battery life thanks to the lower-resolution display, and perhaps the Core i5 can be fully tapped for a change. Our ever-evolving review process will reveal all of this and more.
Preliminary Notes
Since the basic design and some other aspects of the ThinkPad T470s we’re reviewing today remain identical to that of the previous configuration, we will be skipping over some of the introductory sections of this review, such as Case, Connectivity, and Input Devices. However, we will quickly summarize our thoughts on those items here as an introduction.
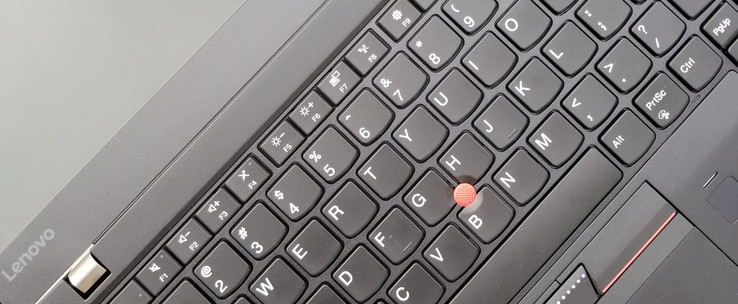
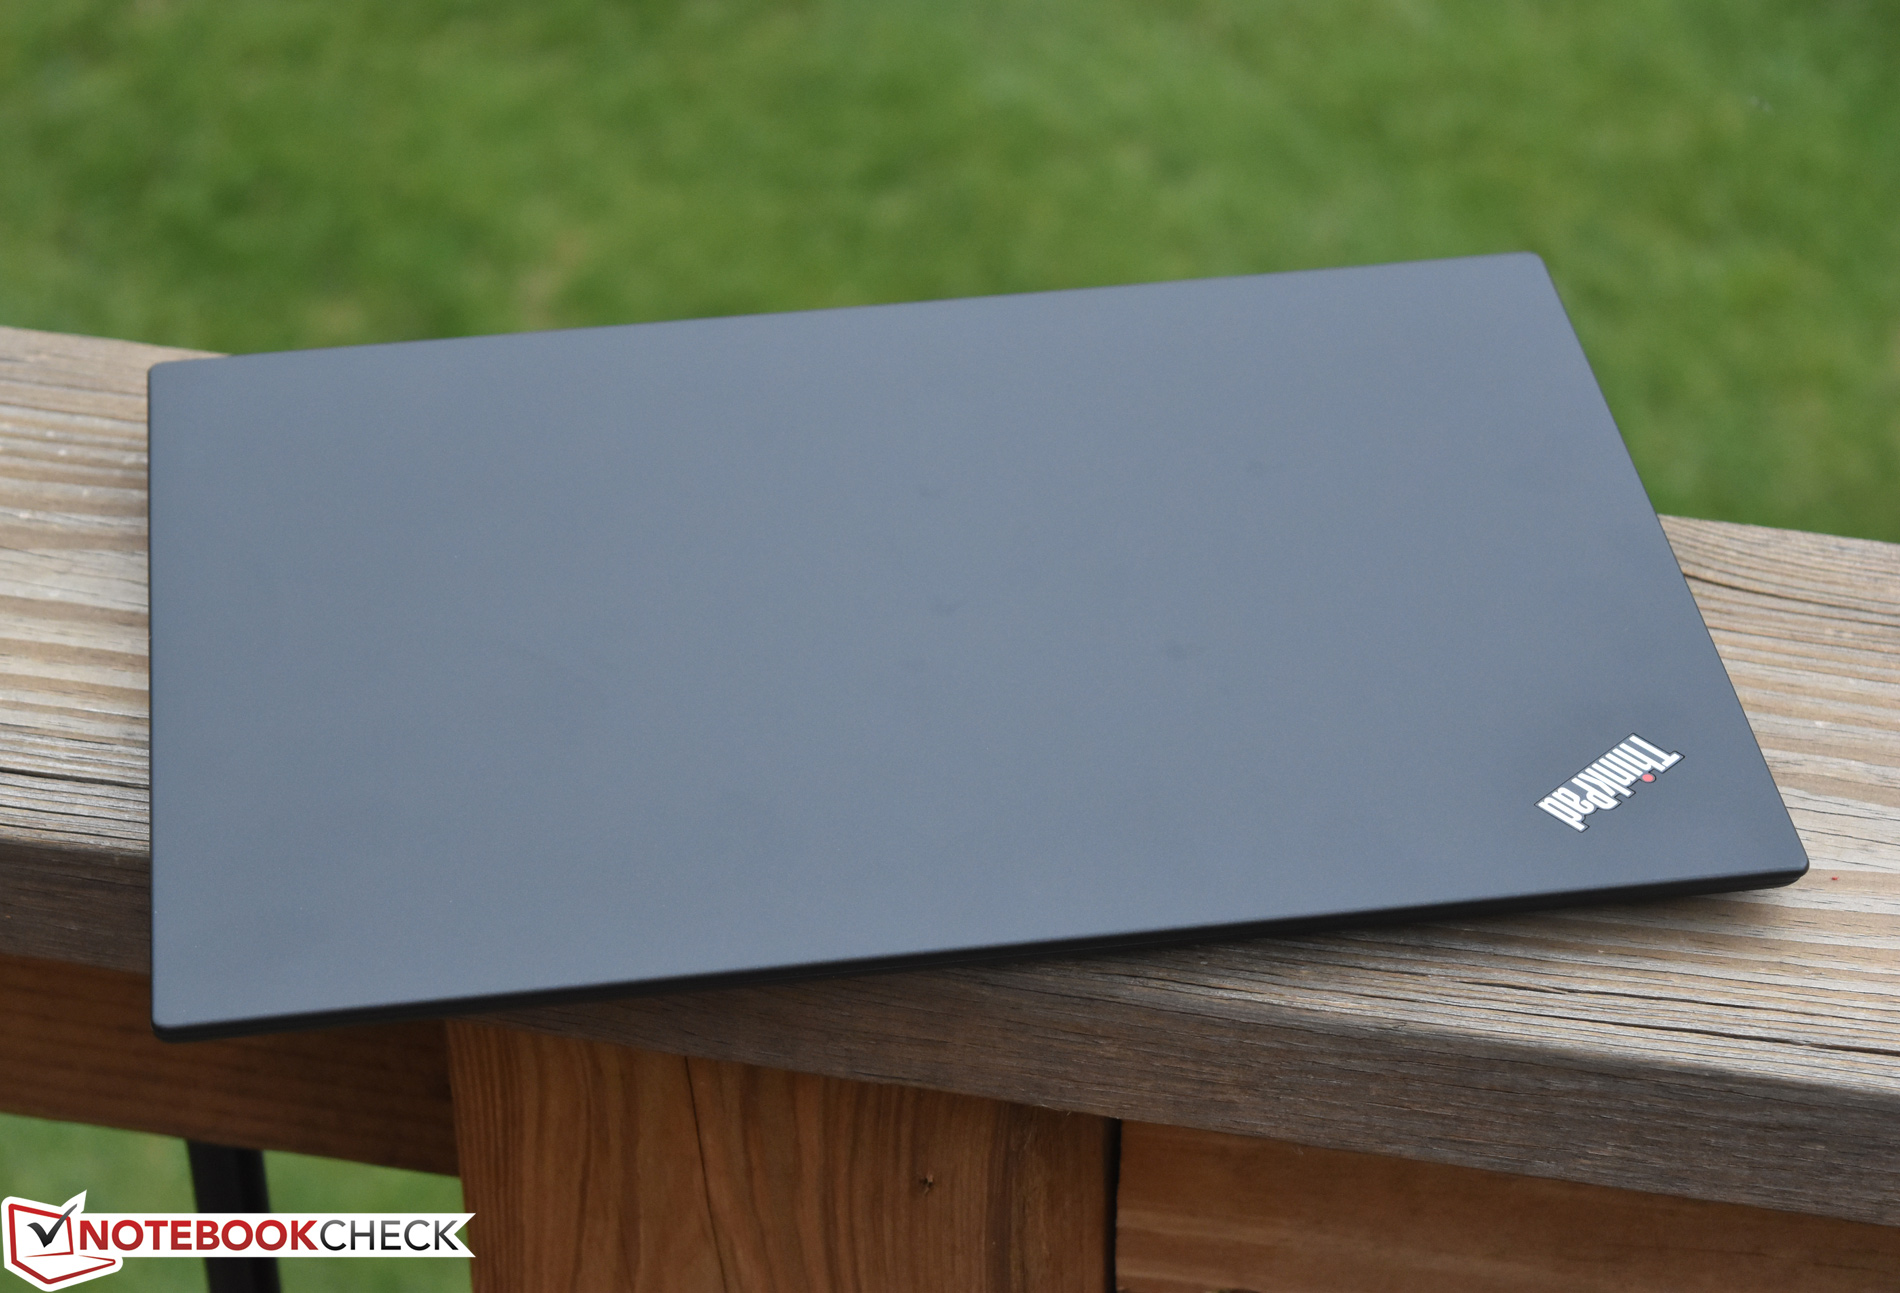
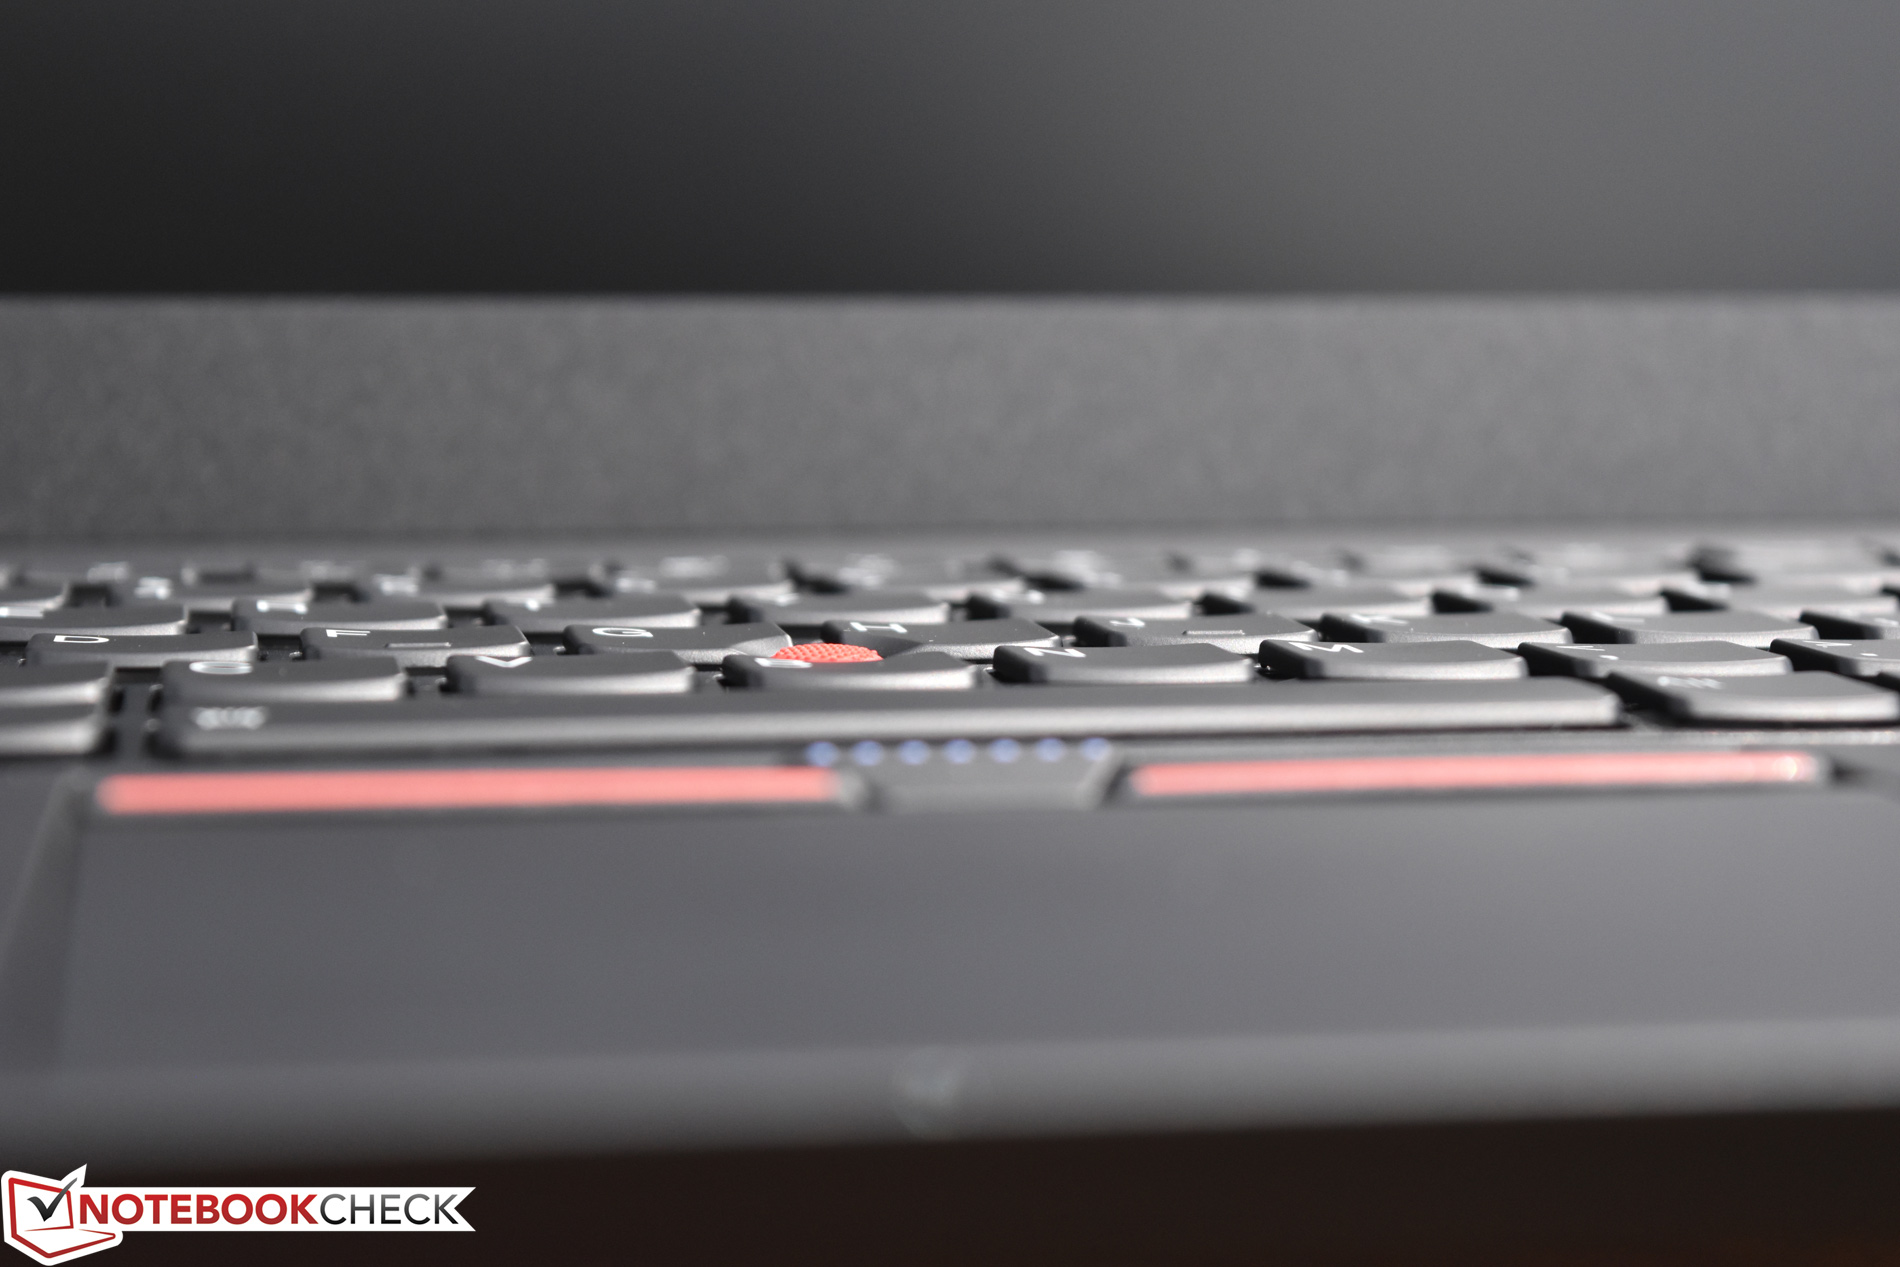
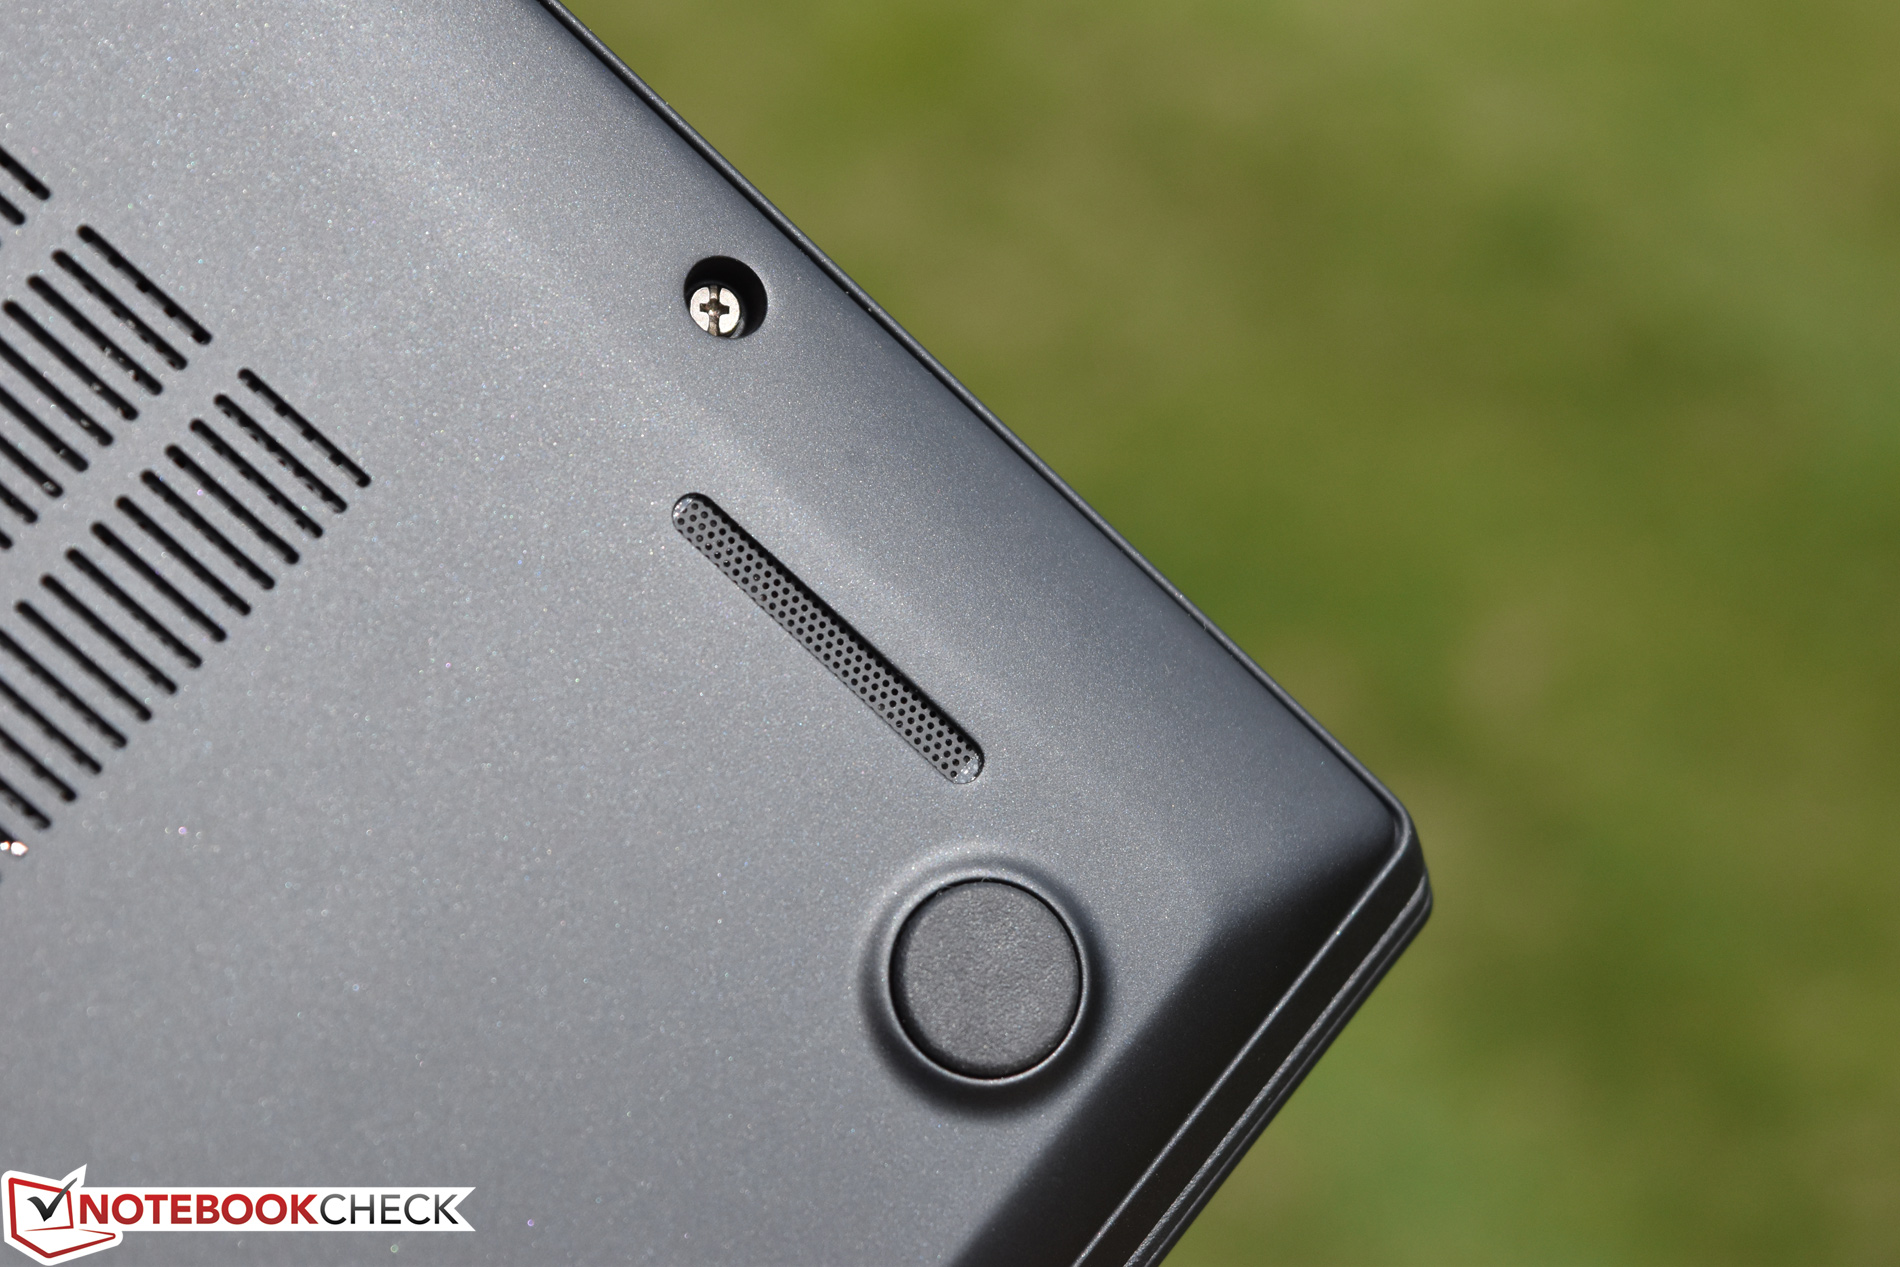
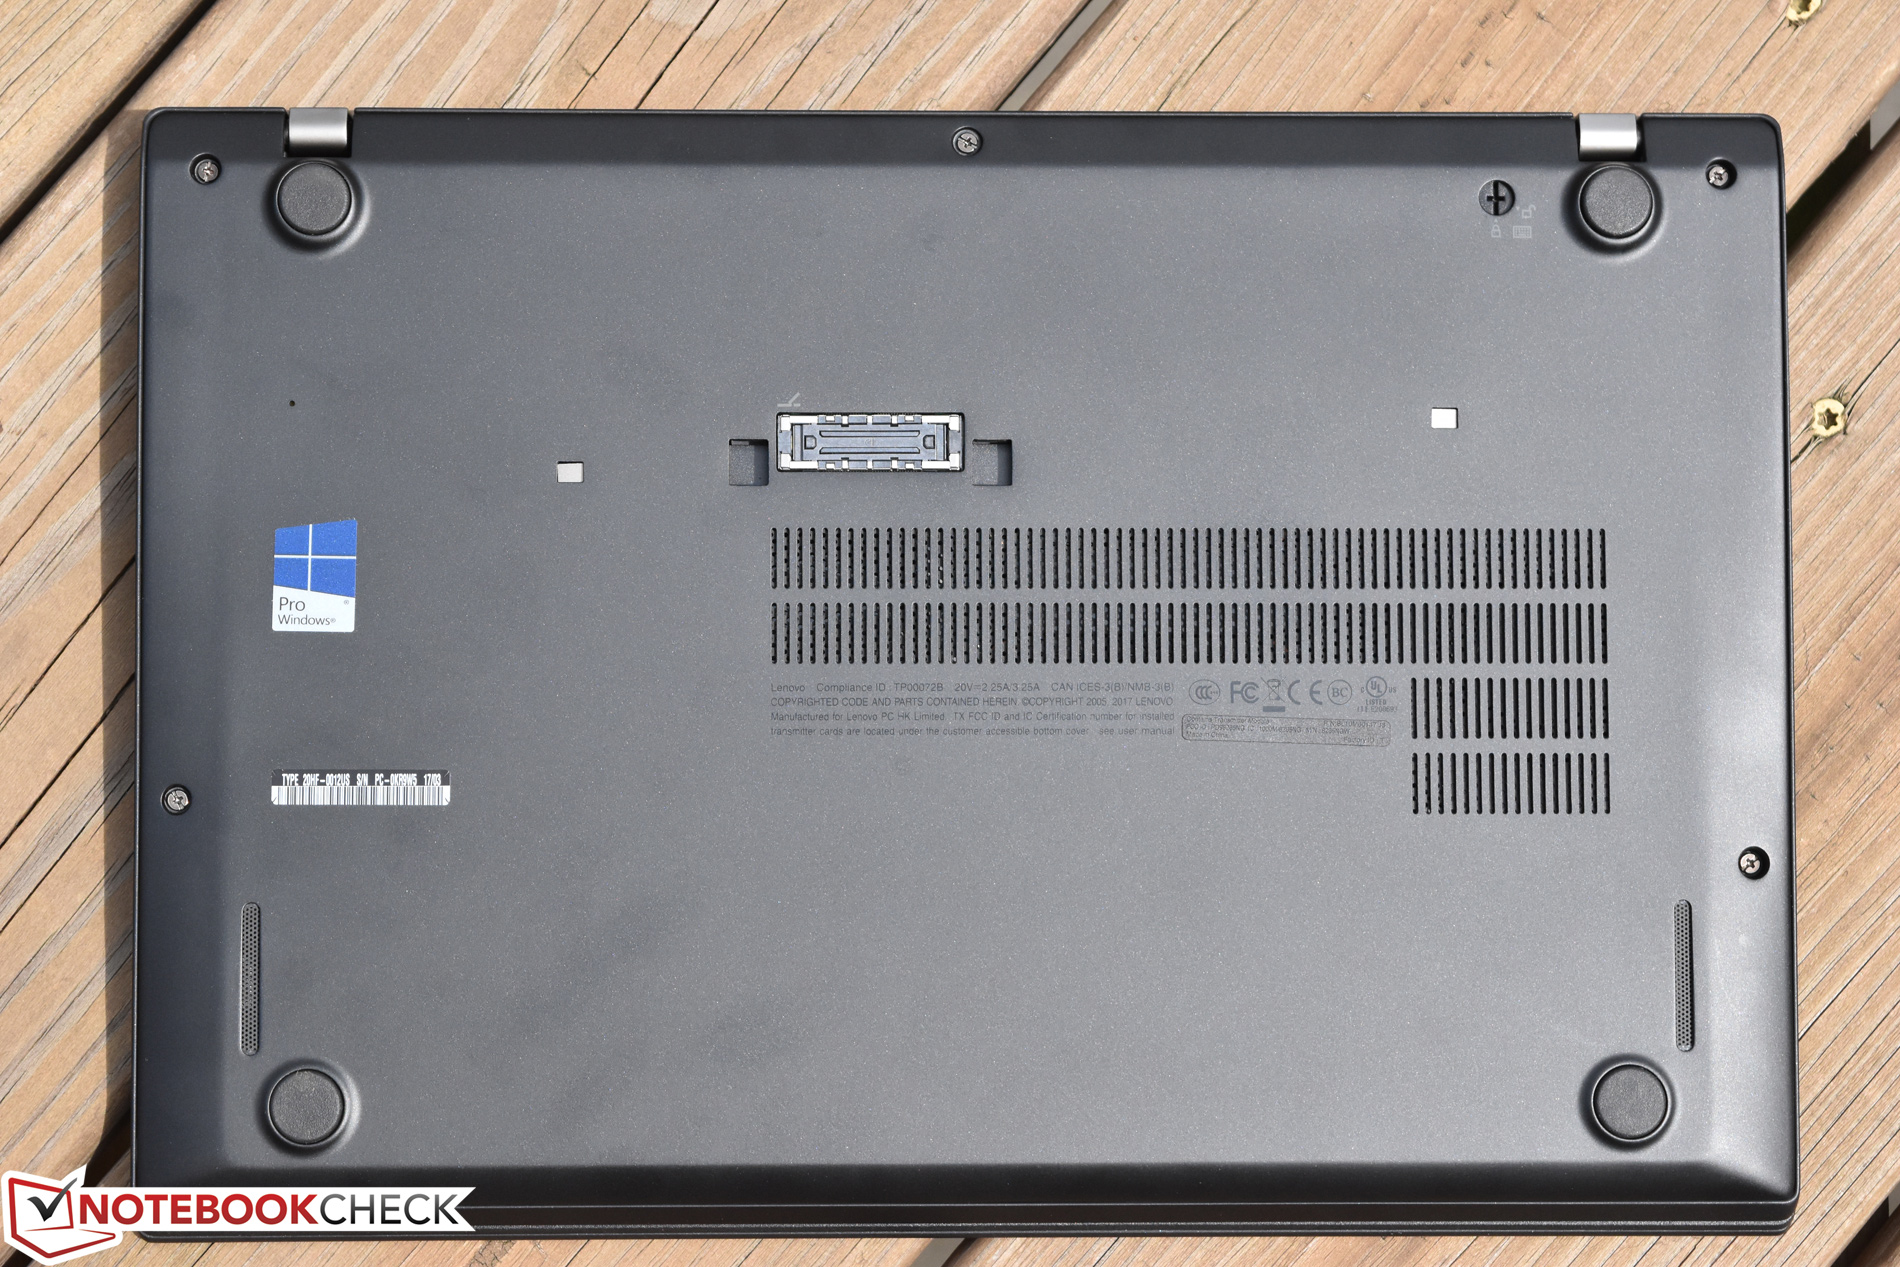
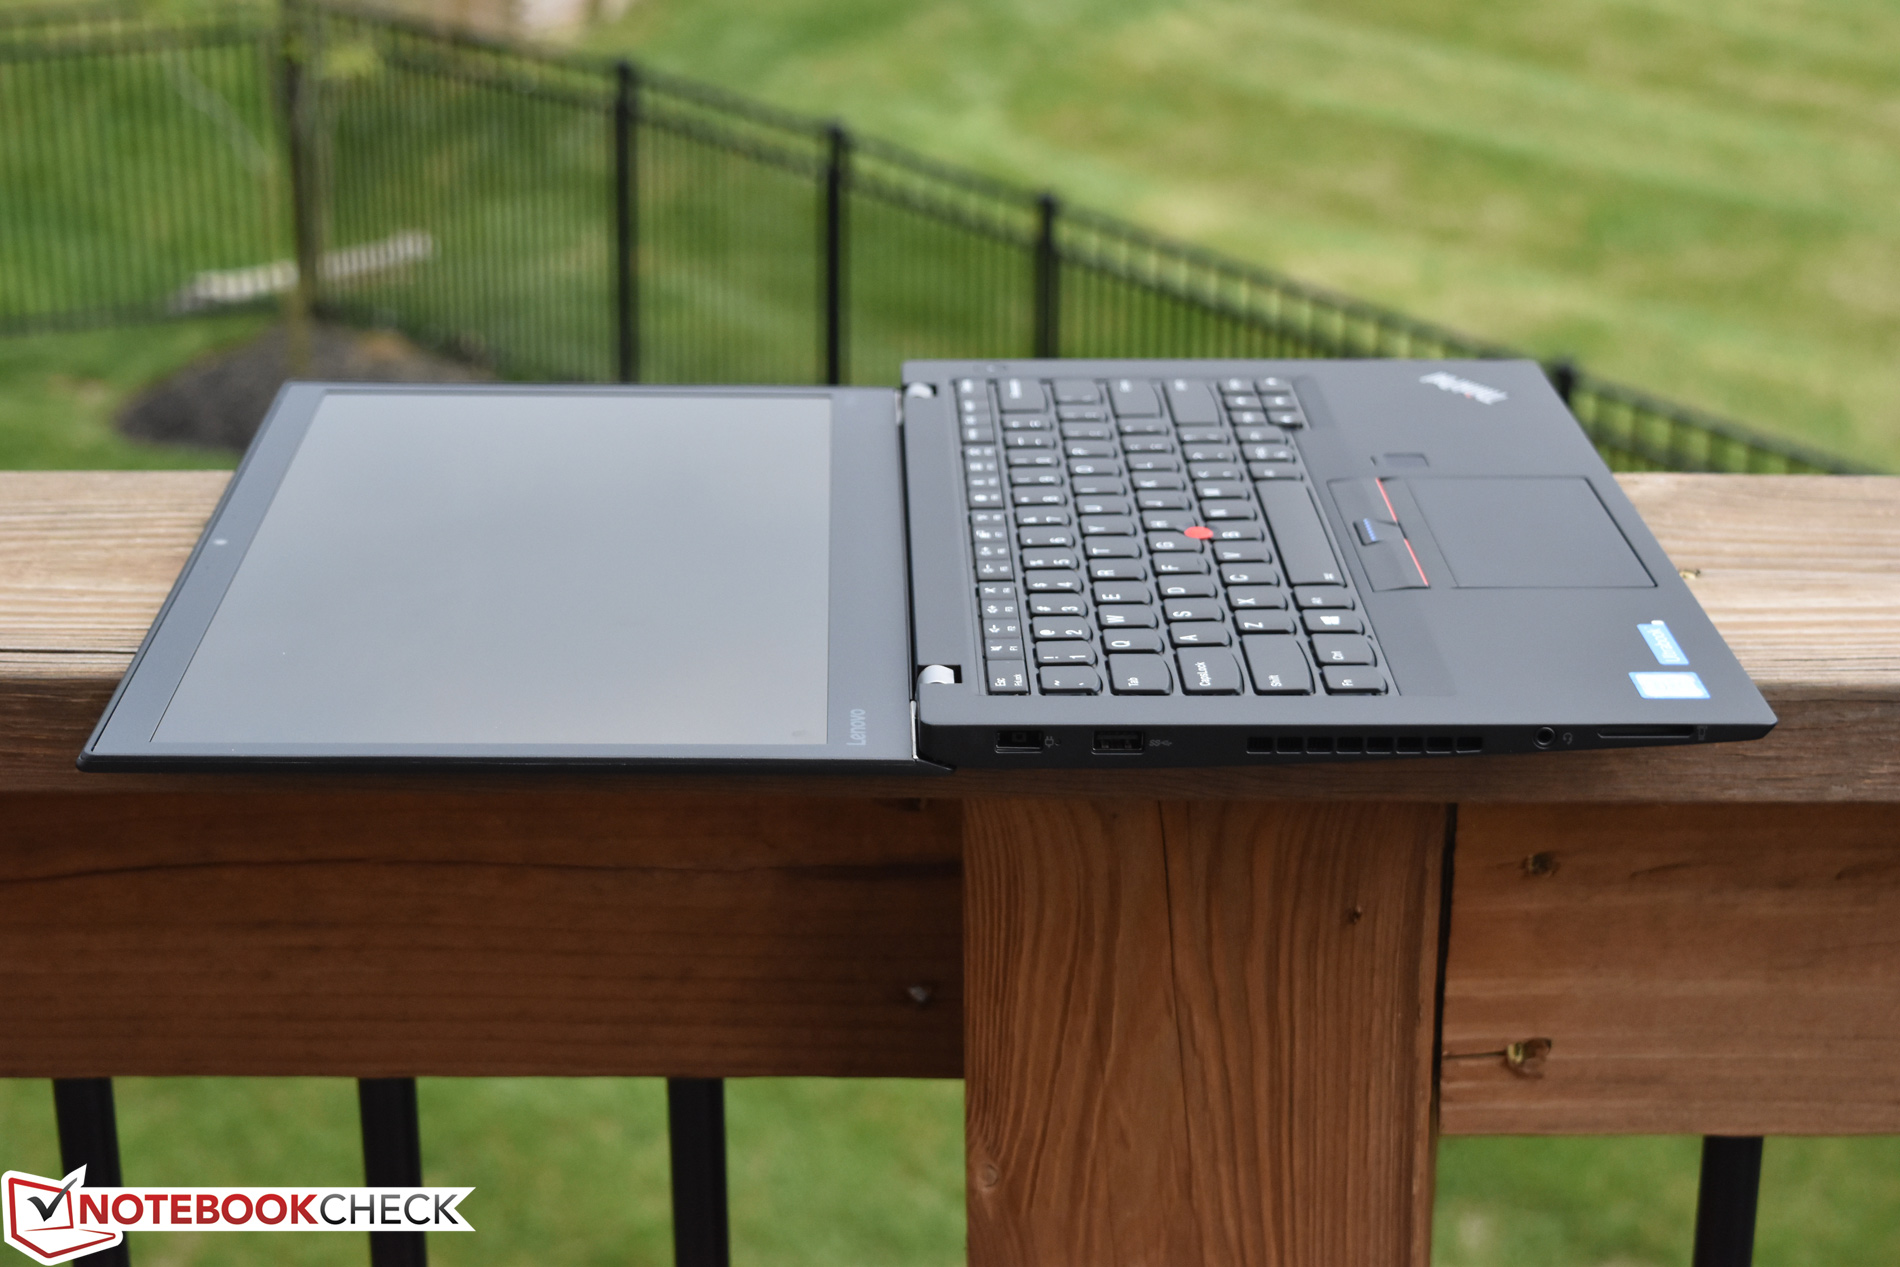
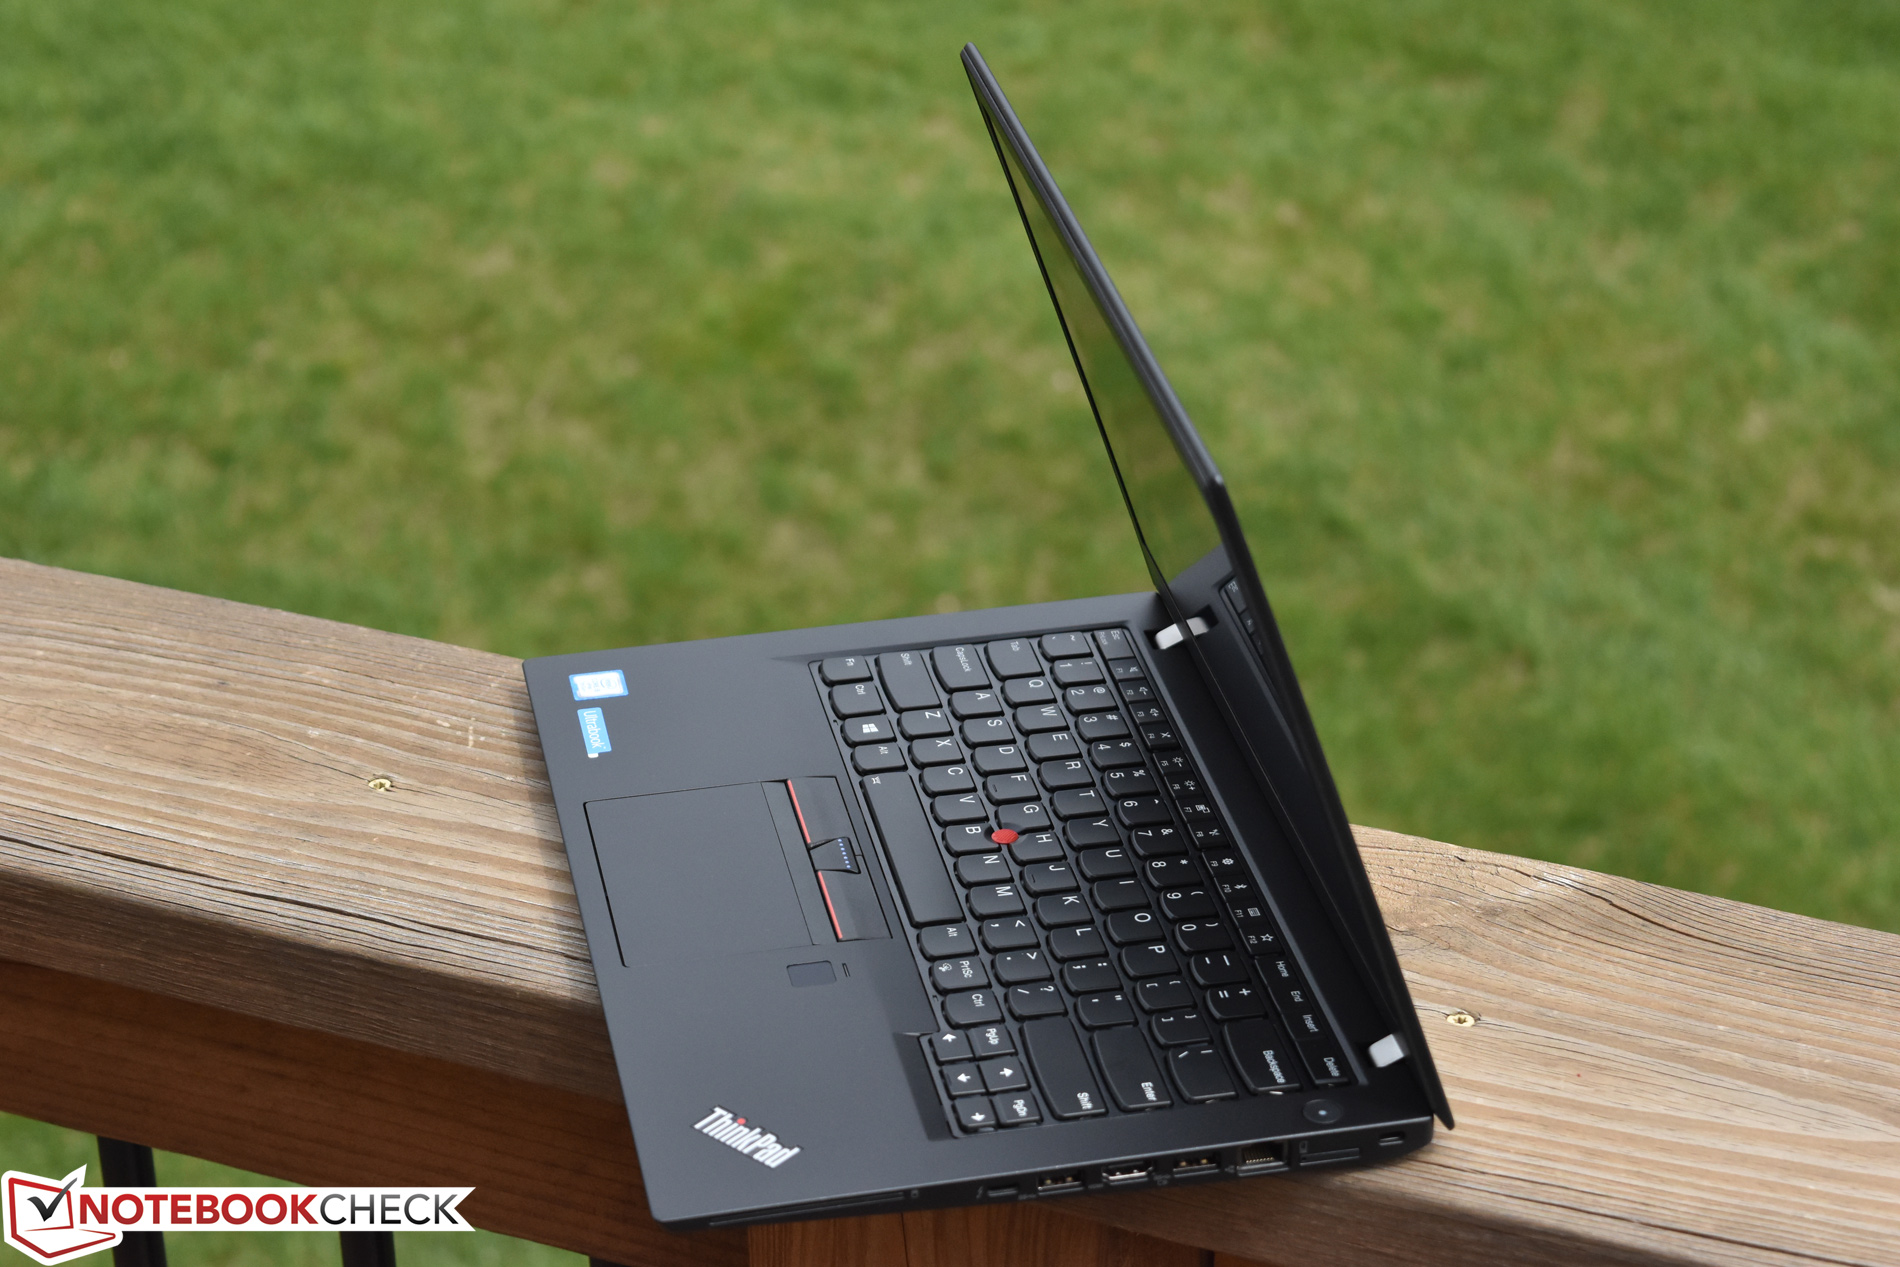
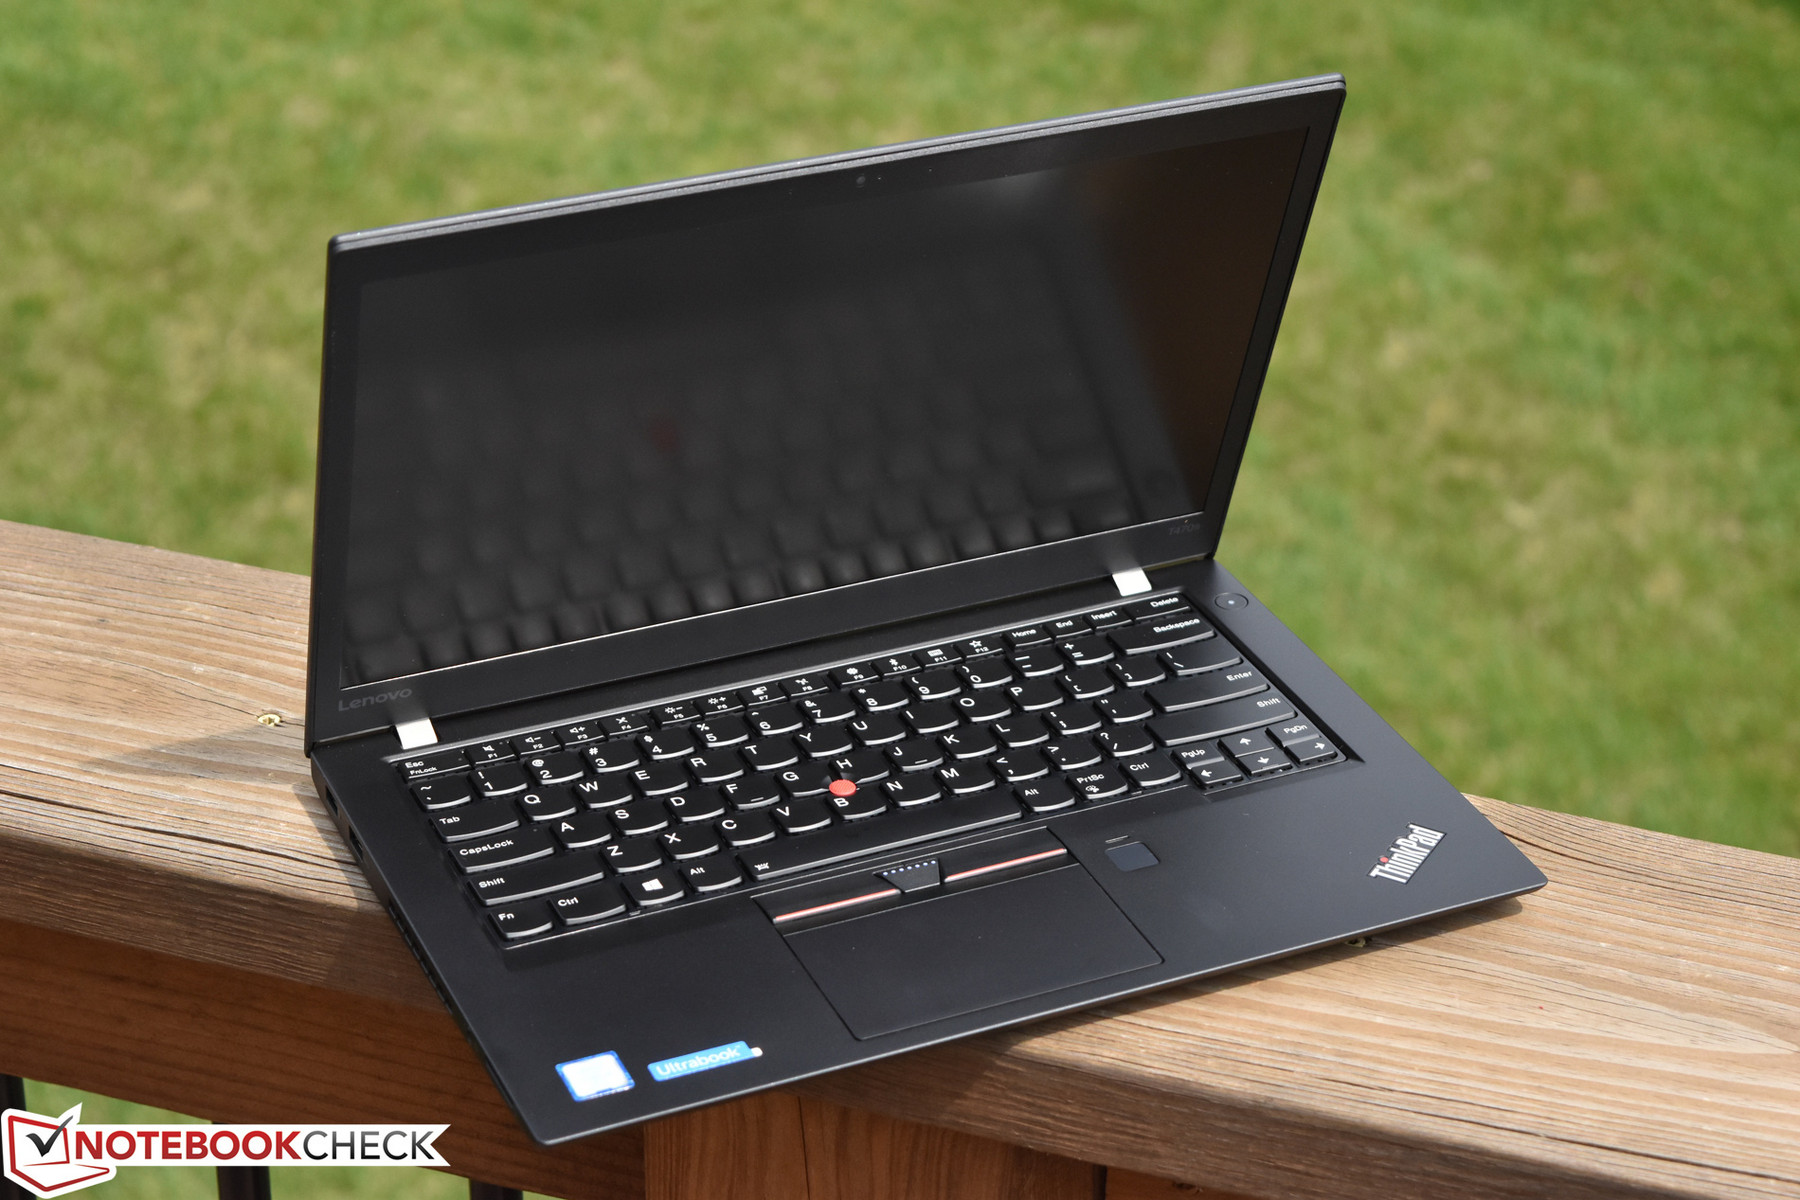
The T470s features a simultaneously lightweight and relatively sturdy build, thanks almost entirely to the high-quality magnesium unibody construction. The carbon fiber hybrid lid is a bit more flexible than the strongest aluminum or magnesium varieties, but all in all, the device feels reassuringly solid. It packs plenty of ports, including a USB-C/Thunderbolt 3 port which helps to future-proof the machine and which can also be used to charge the notebook in conjunction with Lenovo’s protective “Anti-Fry” charging technology. The input devices remain some of the best on a device of this class, and the new Precision touchpad provides better Windows 10 functionality than previous implementations. Finally, maintenance is easy, with the entire bottom panel removable by way of just a handful of Phillips-head screws.
For much more details about any of these items and some other introductory impressions, don’t miss our previous review of the T470s.


SD Card Reader
The integrated SD Card Reader in the ThinkPad T470s does not accept the full SD card, so it is only suitable for temporary transfer purposes. The speeds we received from our benchmarks (using the Toshiba Exceria Pro SDXC 64 GB UHS-II card) were merely average, roughly on par with those of other competing notebooks. Some machines such as many workstations manage transfer speeds multiple times as fast.
| SD Card Reader | |
| average JPG Copy Test (av. of 3 runs) | |
| Lenovo ThinkPad T470s-20HGS00V00 | |
| Lenovo ThinkPad T470-20HD002HGE | |
| Dell Latitude 7480 | |
| Lenovo ThinkPad T470s-20HF0012US | |
| Lenovo ThinkPad X1 Carbon 2017-20HQS03P00 | |
| maximum AS SSD Seq Read Test (1GB) | |
| Dell Latitude 7480 | |
| Lenovo ThinkPad T470s-20HF0012US | |
| Lenovo ThinkPad T470s-20HGS00V00 | |
| Lenovo ThinkPad T470-20HD002HGE | |
| Lenovo ThinkPad X1 Carbon 2017-20HQS03P00 | |
Communication
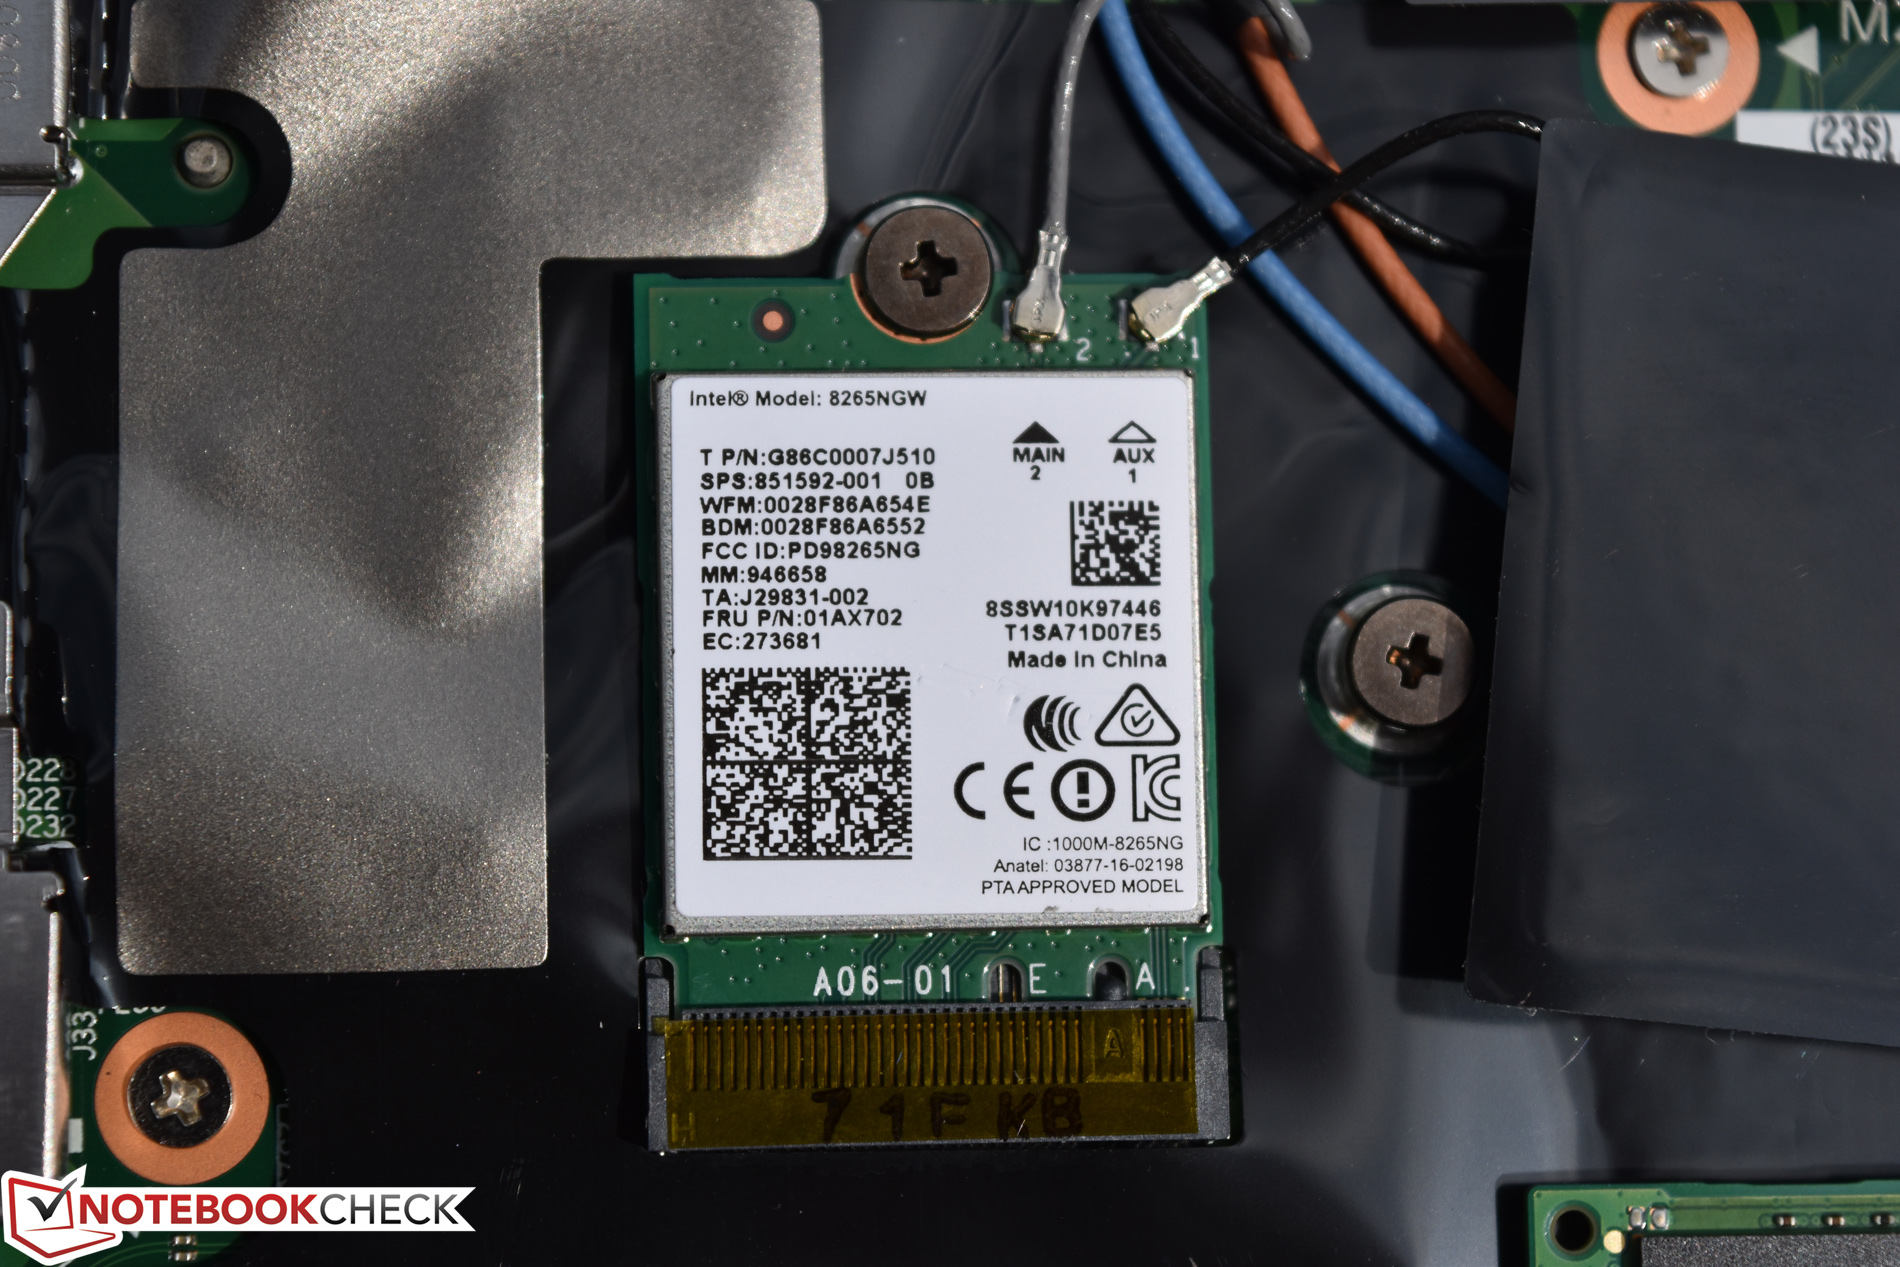
The T470s does a fine job receiving at high speeds over wireless (today's configuration still leverages the same Intel Dual Band Wireless-AC 8265 adpater), but transmission speeds (while higher than our previous measurements) are still quite a bit below that of the latest X1 Carbon.
Display
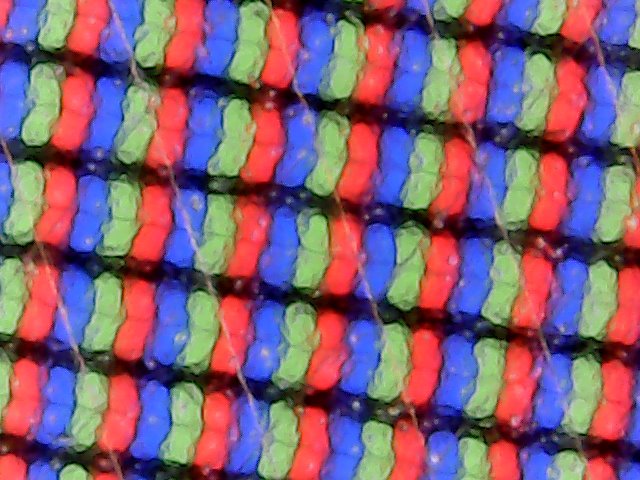
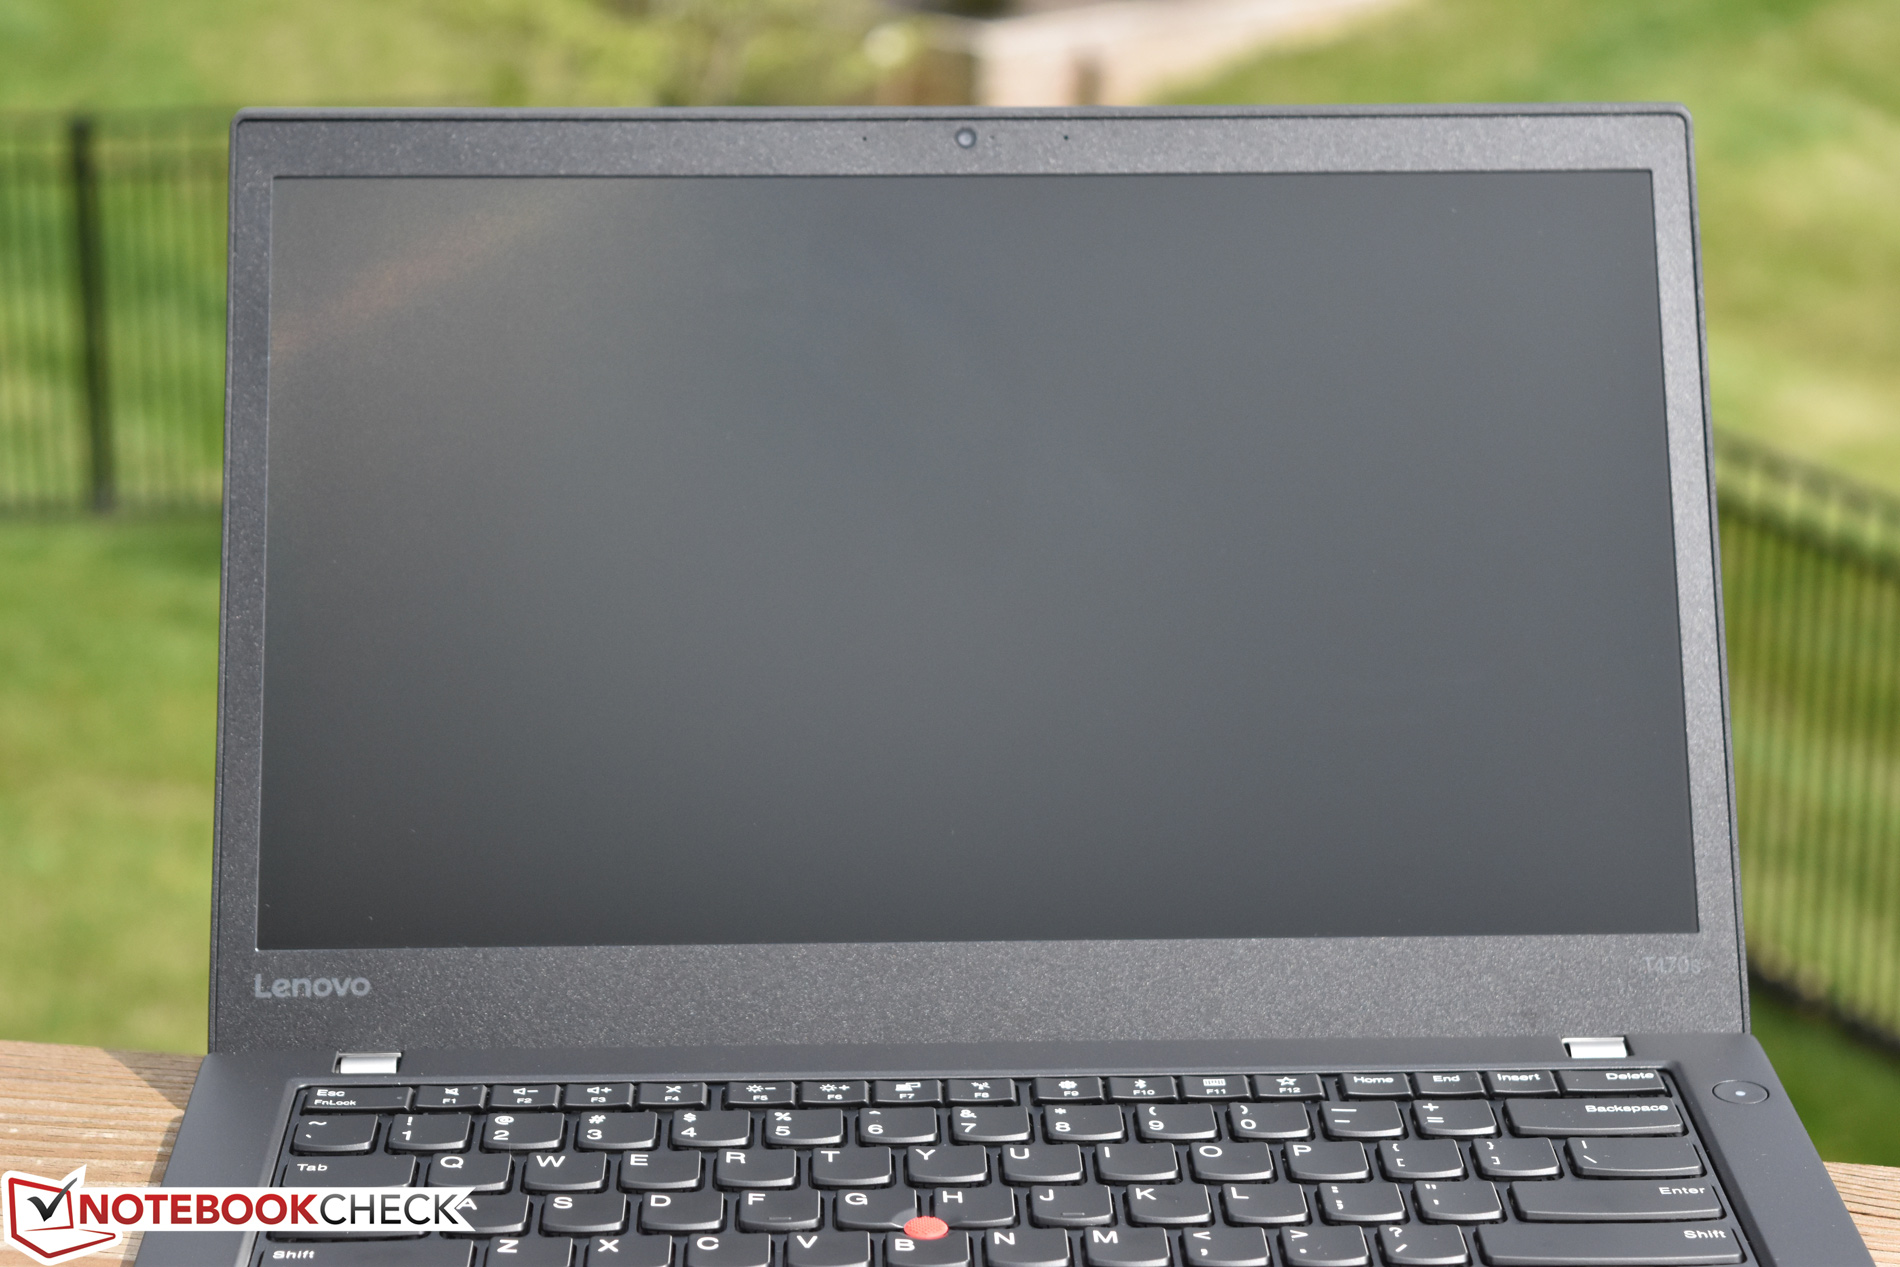
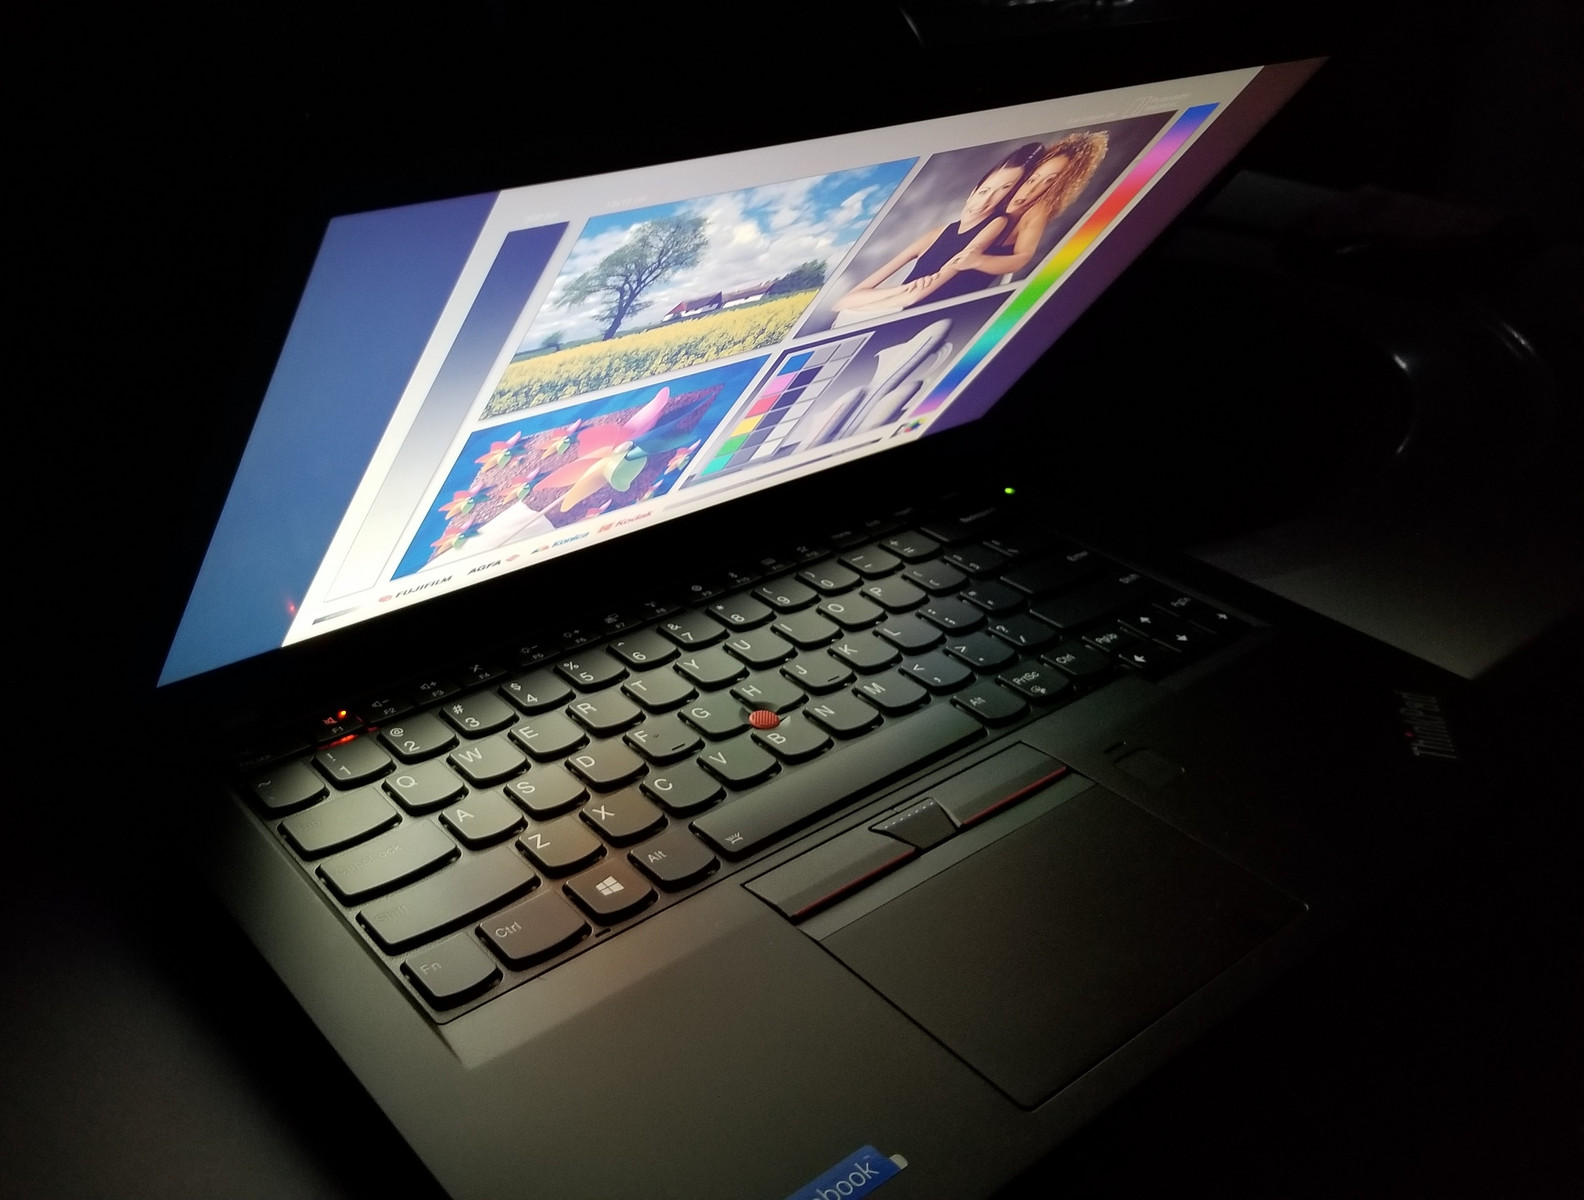
Let’s jump right into the first major difference of today’s configuration. Whereas our previous unit featured a WQHD panel, today we have a FHD (1920x1080) touchscreen—and still with a matte finish, to boot. It’s still impressive how Lenovo is able to effectively cover these ultra-thin touchscreens with a matte coating that is also relatively fingerprint resistant without a noticeable effect on the quality of the picture. The touchscreen matrix is visible on our T470s unit, but only from a specific angle in bright light (see the photo of the subpixel arrangement to the right, as well as our photo in the viewing angles section, as evidence of its visibility). Backlight bleeding was not apparent on our review unit.
| |||||||||||||||||||||||||
Brightness Distribution: 88 %
Center on Battery: 271.6 cd/m²
Contrast: 1132:1 (Black: 0.24 cd/m²)
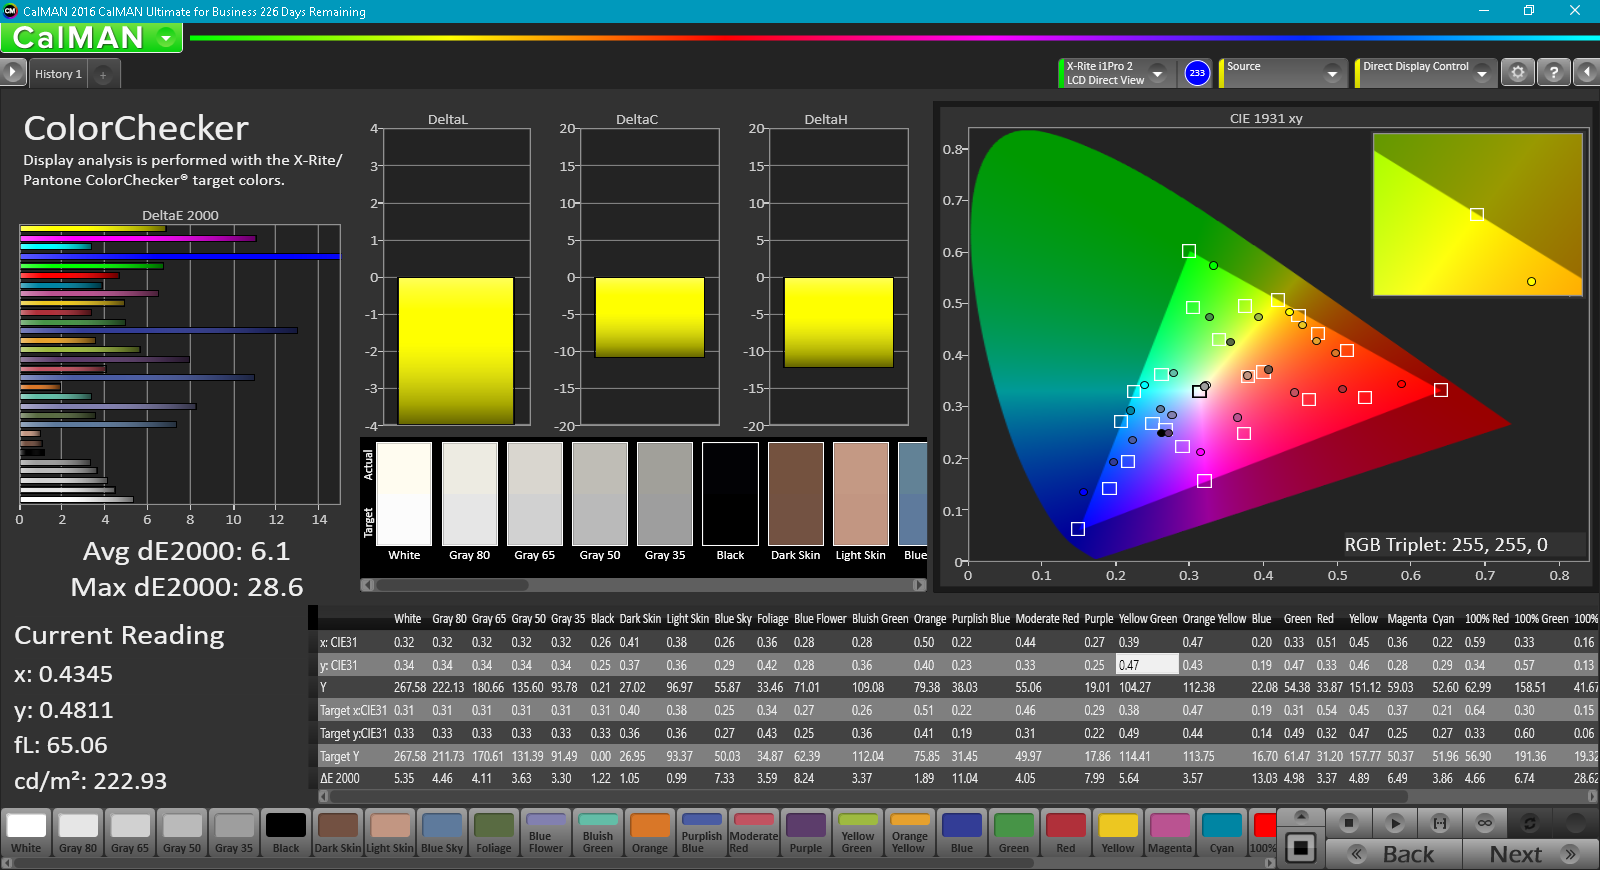
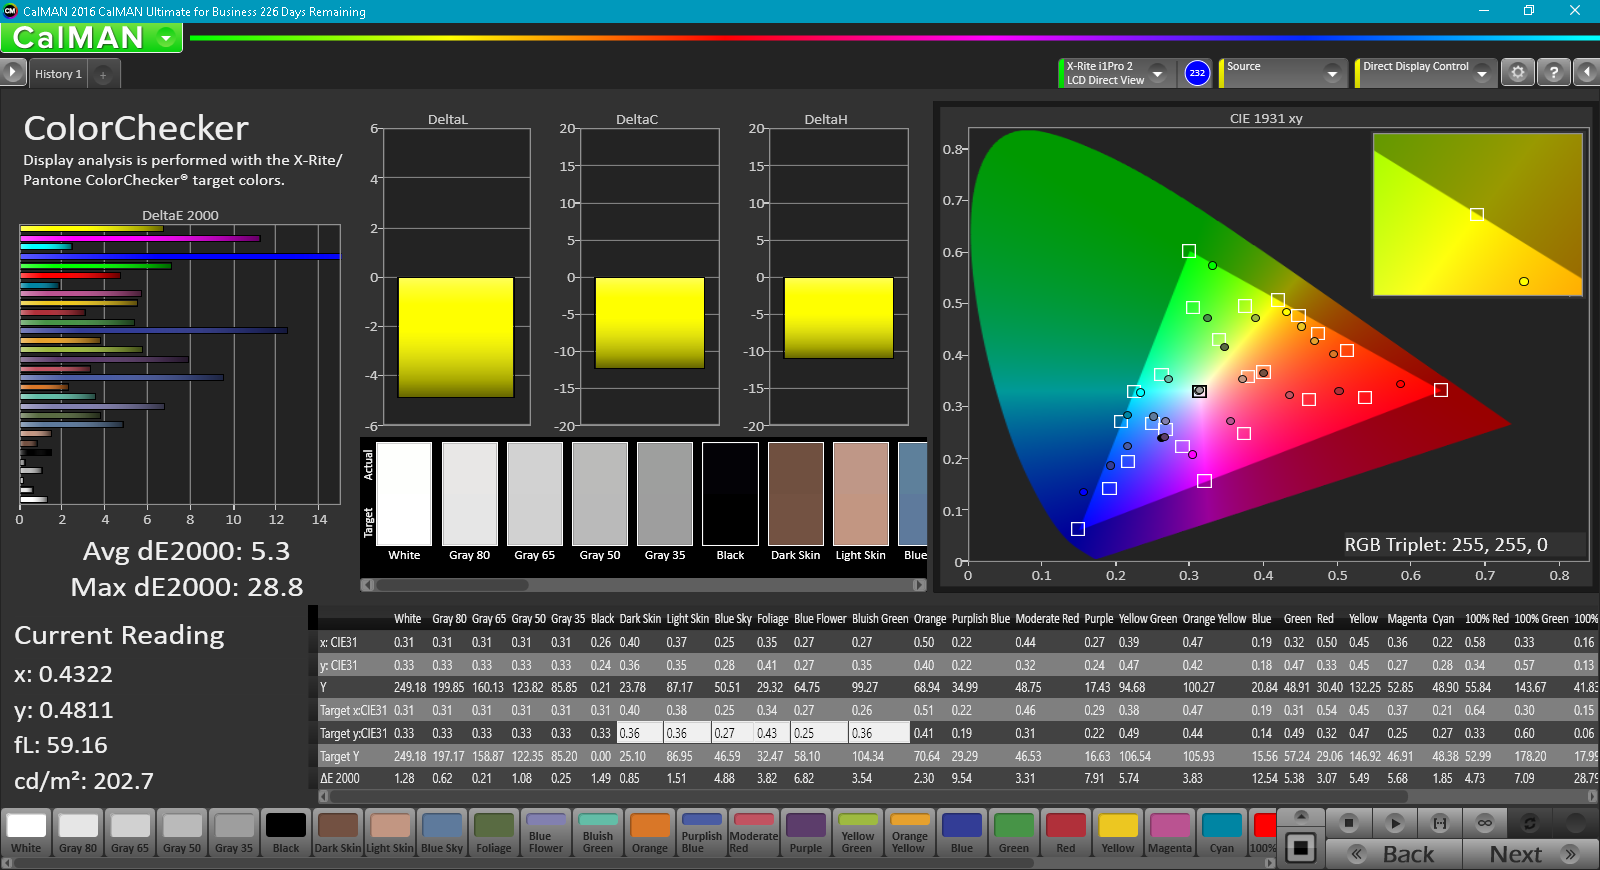
ΔE ColorChecker Calman: 6.1 | ∀{0.5-29.43 Ø4.72}
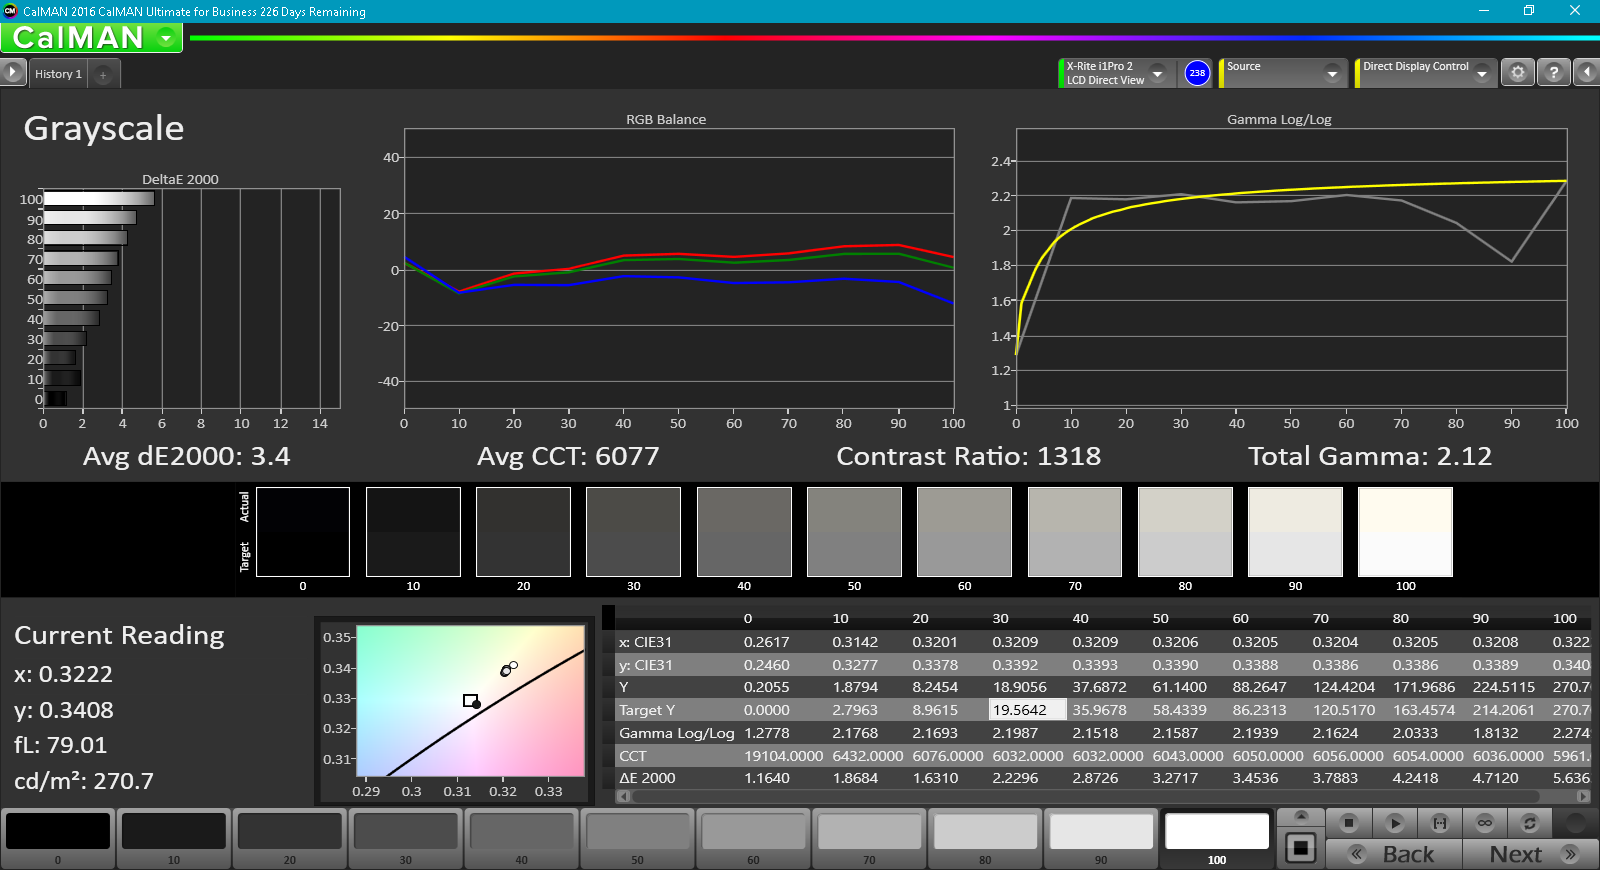
ΔE Greyscale Calman: 3.4 | ∀{0.09-98 Ø4.97}
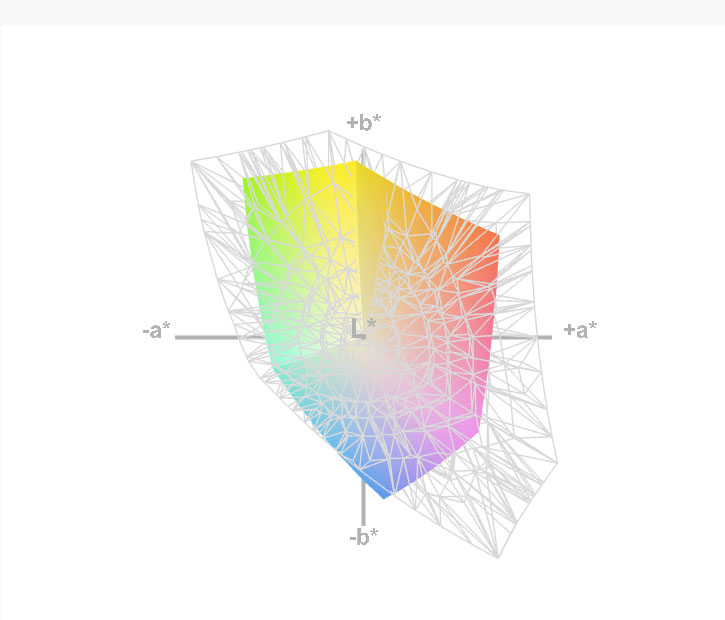
60% sRGB (Argyll 1.6.3 3D)
38% AdobeRGB 1998 (Argyll 1.6.3 3D)
41.72% AdobeRGB 1998 (Argyll 3D)
60.3% sRGB (Argyll 3D)
40.35% Display P3 (Argyll 3D)
Gamma: 2.12
CCT: 6077 K
| Lenovo ThinkPad T470s-20HF0012US LEN40A9 (R140NWF5 R1), IPS, 14", 1920x1080 | Lenovo ThinkPad T470s-20HGS00V00 B140QAN01.5, IPS, 14", 2560x1440 | Dell Latitude 7480 LG Philips LGD0557, IPS, 14", 1920x1080 | Lenovo ThinkPad T470-20HD002HGE N140HCA-EAB, IPS, 14", 1920x1080 | Lenovo ThinkPad X1 Carbon 2017-20HQS03P00 B140HAN03_1, IPS, 14", 1920x1080 | |
|---|---|---|---|---|---|
| Display | 65% | 58% | 3% | 48% | |
| Display P3 Coverage (%) | 40.35 | 69 71% | 65.4 62% | 41.6 3% | 61.4 52% |
| sRGB Coverage (%) | 60.3 | 95.1 58% | 92.3 53% | 61.9 3% | 85.9 42% |
| AdobeRGB 1998 Coverage (%) | 41.72 | 69.6 67% | 65.8 58% | 43.06 3% | 62.4 50% |
| Response Times | -7% | -4% | -10% | -6% | |
| Response Time Grey 50% / Grey 80% * (ms) | 40.8 ? | 46.4 ? -14% | 40.8 ? -0% | 41.6 ? -2% | 41.6 ? -2% |
| Response Time Black / White * (ms) | 28.8 ? | 28.8 ? -0% | 31.2 ? -8% | 34 ? -18% | 31.6 ? -10% |
| PWM Frequency (Hz) | 219.3 ? | ||||
| Screen | 7% | 29% | -3% | 12% | |
| Brightness middle (cd/m²) | 271.6 | 327 20% | 344 27% | 306 13% | 311 15% |
| Brightness (cd/m²) | 264 | 311 18% | 321 22% | 287 9% | 288 9% |
| Brightness Distribution (%) | 88 | 88 0% | 85 -3% | 88 0% | 85 -3% |
| Black Level * (cd/m²) | 0.24 | 0.25 -4% | 0.32 -33% | 0.3 -25% | 0.24 -0% |
| Contrast (:1) | 1132 | 1308 16% | 1075 -5% | 1020 -10% | 1296 14% |
| Colorchecker dE 2000 * | 6.1 | 6.1 -0% | 2.6 57% | 6.2 -2% | 5.5 10% |
| Colorchecker dE 2000 max. * | 28.6 | 12.2 57% | 7.8 73% | 13.6 52% | 9 69% |
| Greyscale dE 2000 * | 3.4 | 8.8 -159% | 2.6 24% | 5.8 -71% | 6.2 -82% |
| Gamma | 2.12 104% | 2.18 101% | 2.28 96% | 2.04 108% | 2.02 109% |
| CCT | 6077 107% | 6172 105% | 7050 92% | 6277 104% | 5950 109% |
| Color Space (Percent of AdobeRGB 1998) (%) | 38 | 61.56 62% | 65.82 73% | 39.62 4% | 55.96 47% |
| Color Space (Percent of sRGB) (%) | 60 | 94.88 58% | 92.27 54% | 61.44 2% | 85.77 43% |
| Total Average (Program / Settings) | 22% /
17% | 28% /
30% | -3% /
-3% | 18% /
17% |
* ... smaller is better
It’s immediately obvious that the FHD screen lacks the saturation and brightness of the WQHD panel, and even the latter was merely acceptable in these categories. Our measurements reinforce these observations; we recorded just 264 cd/m² on average (with a maximum of 277 cd/m² in the upper left quadrant), along with a brightness distribution of 88% (the two bottom corners are slightly dimmer than the rest of the screen, but this isn’t really noticeable in daily use). Meanwhile, thanks to a low black level of 0.24 cd/m², we measured a good contrast ratio of 1132:1.
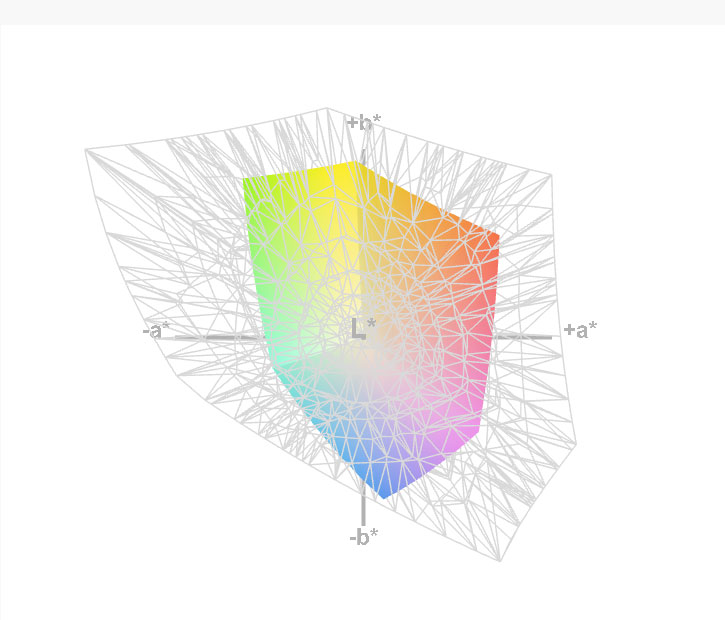
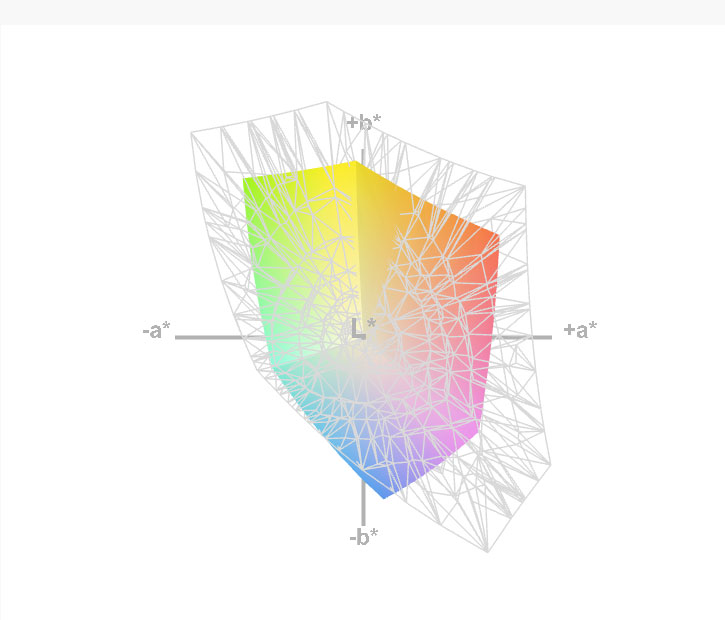
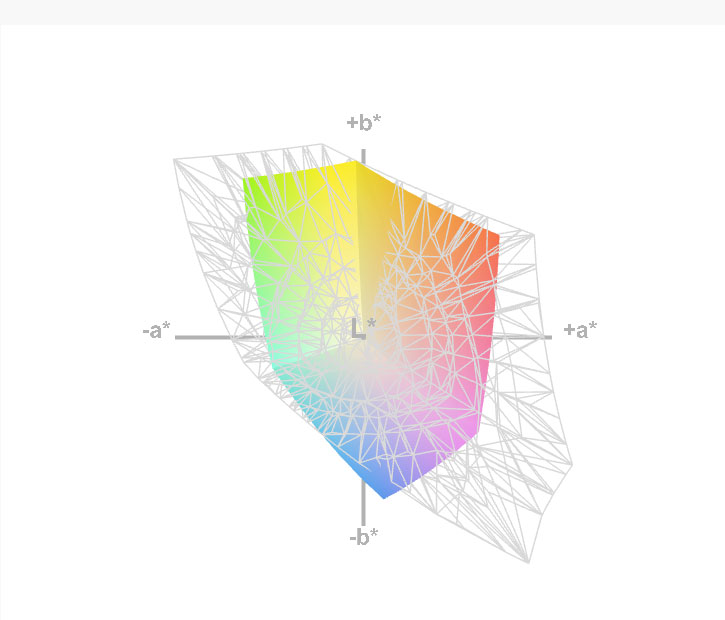
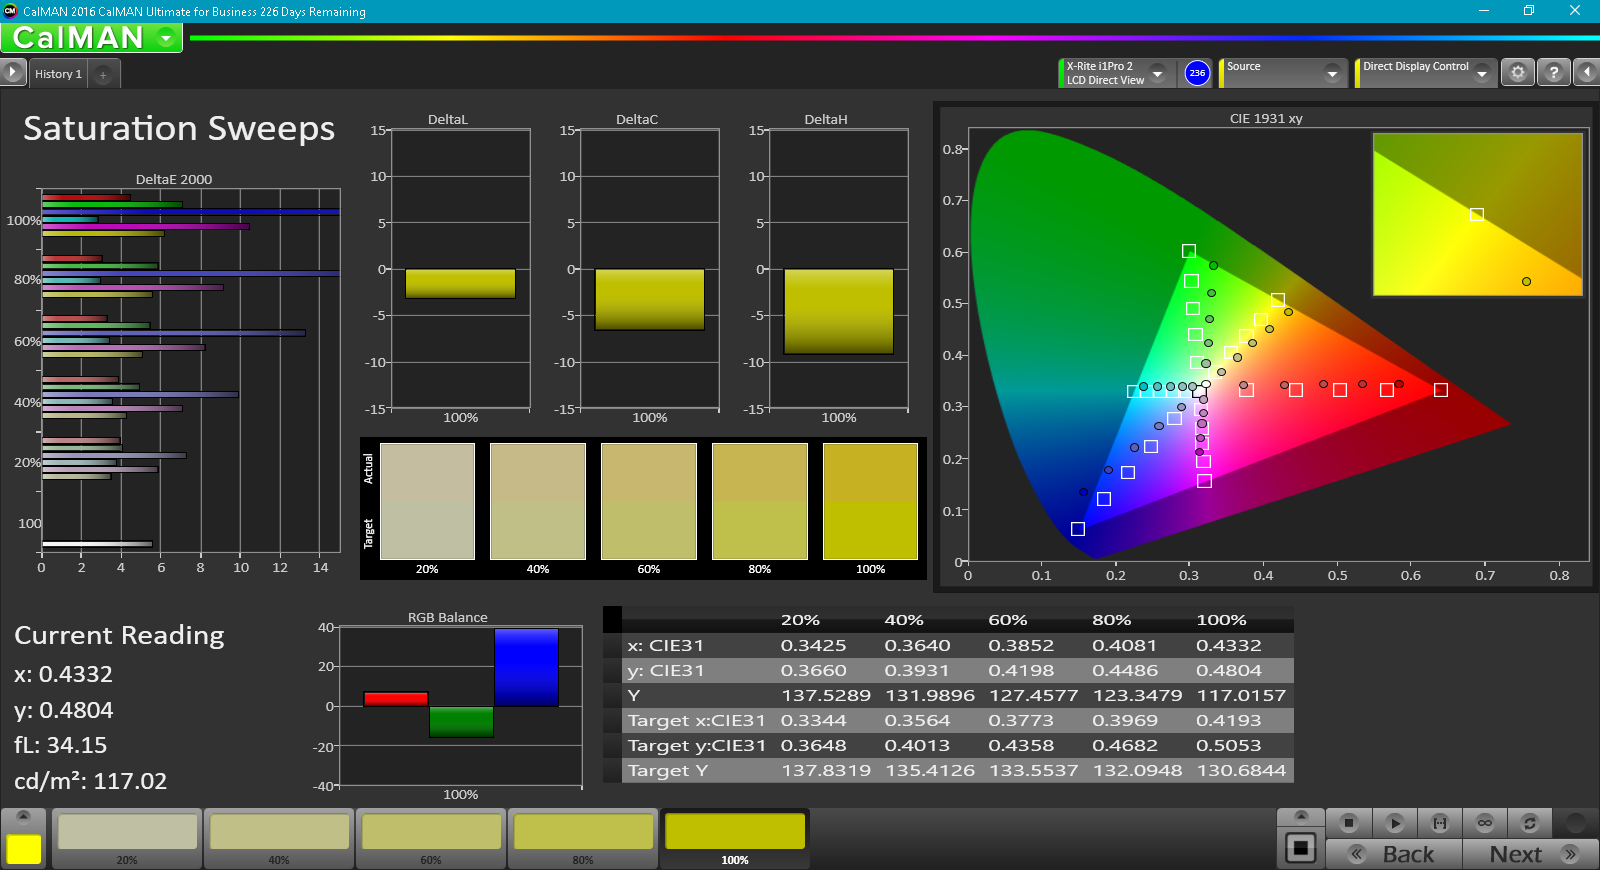
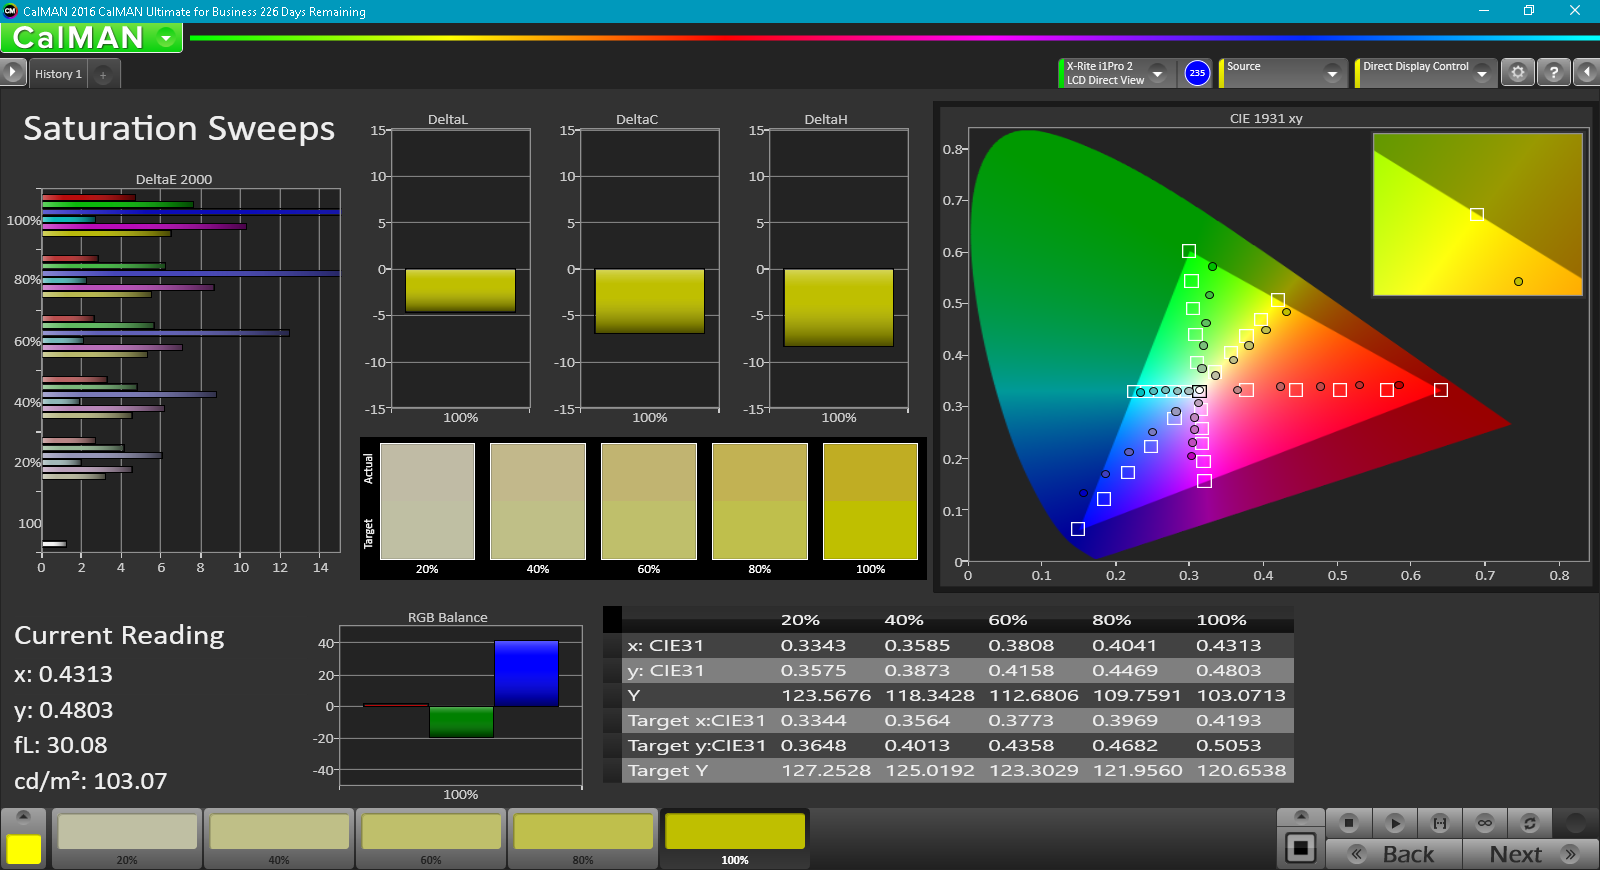
Color reproduction analysis revealed that just 60 percent of the sRGB spectrum is covered by the panel, with only 38 percent of AdobeRGB displayed. These figures suggest a dreary, washed-out picture quality, and that’s mostly what we perceived while working with the T470s. It’s not unacceptable for a business machine, but it absolutely will not get the job done for anyone looking to dabble in regular photo editing or graphic design work. Compared with the rest of the field, including the X1 Carbon FHD panel (56 percent AdobeRGB) and Latitude 7480 FHD panel (66 percent AdobeRGB), it’s the worst of the bunch. This is one reason why, even if resolution isn’t a concern, the T470s WQHD panel may prove a better choice for some users: with 61 percent AdobeRGB coverage, its overall picture quality is quite a bit nicer.
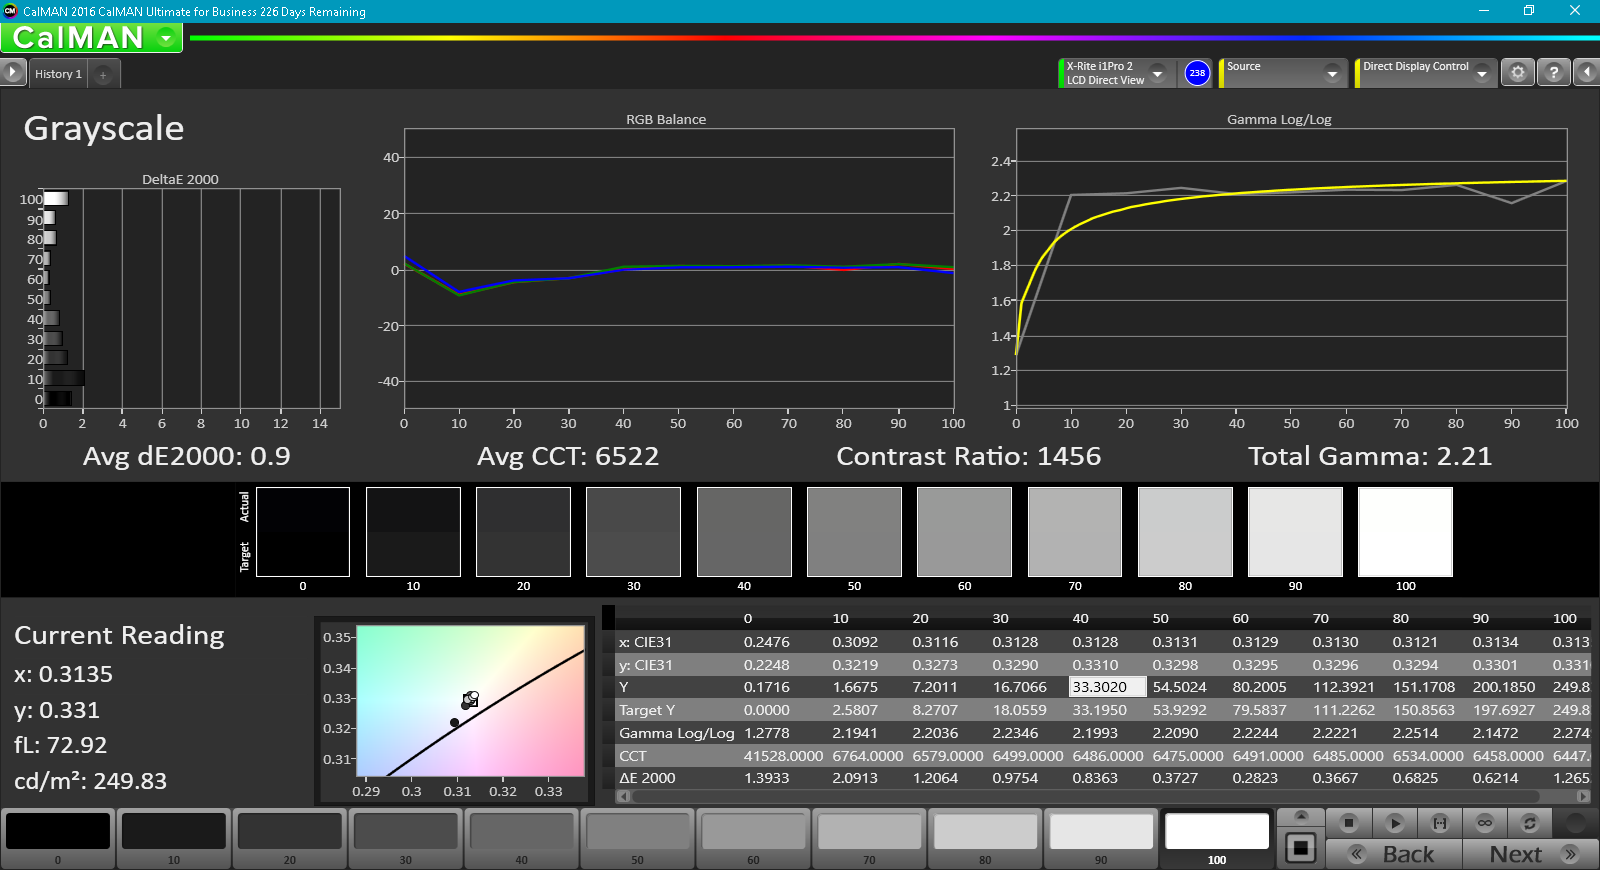
CalMAN measurements were a bit more positive. We recorded a Greyscale DeltaE2000 of 3.4, much lower than the WQHD panel’s 8.8. The Colorchecker DeltaE was consistent at 6.1, which isn’t great, but isn’t terrible, either. This value is driven quite a bit higher by wayward blue and magenta values; most of the rest of the colors are much closer to normal. The Total Gamma value of 2.12 isn’t too far off the mark (ideal: 2.4), and the panel color temperature of 6077K is just a bit on the warm side (ideal: 6500K).
Display Response Times
| ↔ Response Time Black to White | ||
|---|---|---|
| 28.8 ms ... rise ↗ and fall ↘ combined | ↗ 14.8 ms rise | 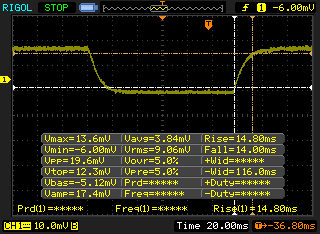 |
| ↘ 14 ms fall | ||
| The screen shows relatively slow response rates in our tests and may be too slow for gamers. In comparison, all tested devices range from 0.1 (minimum) to 240 (maximum) ms. » 76 % of all devices are better. This means that the measured response time is worse than the average of all tested devices (19.9 ms). | ||
| ↔ Response Time 50% Grey to 80% Grey | ||
| 40.8 ms ... rise ↗ and fall ↘ combined | ↗ 22.8 ms rise | 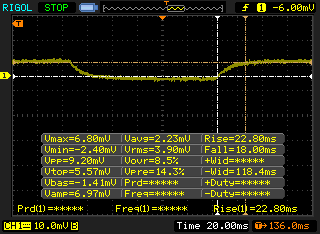 |
| ↘ 18 ms fall | ||
| The screen shows slow response rates in our tests and will be unsatisfactory for gamers. In comparison, all tested devices range from 0.165 (minimum) to 636 (maximum) ms. » 64 % of all devices are better. This means that the measured response time is worse than the average of all tested devices (31.1 ms). | ||
Screen Flickering / PWM (Pulse-Width Modulation)
| Screen flickering / PWM detected | 219.3 Hz | ≤ 99 % brightness setting | 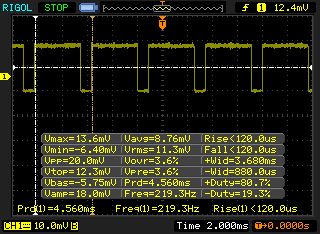 |
The display backlight flickers at 219.3 Hz (worst case, e.g., utilizing PWM) Flickering detected at a brightness setting of 99 % and below. There should be no flickering or PWM above this brightness setting. The frequency of 219.3 Hz is relatively low, so sensitive users will likely notice flickering and experience eyestrain at the stated brightness setting and below. In comparison: 52 % of all tested devices do not use PWM to dim the display. If PWM was detected, an average of 7784 (minimum: 5 - maximum: 343500) Hz was measured. | |||
We were distraught to discover that the FHD panel leverages PWM to manage brightness at all levels below maximum—a disappointing deficiency for a ThinkPad. Because of this, combined with the previously-mentioned brightness and color shortcomings, the WQHD model may make more sense to many users (provided the cost isn’t an issue).
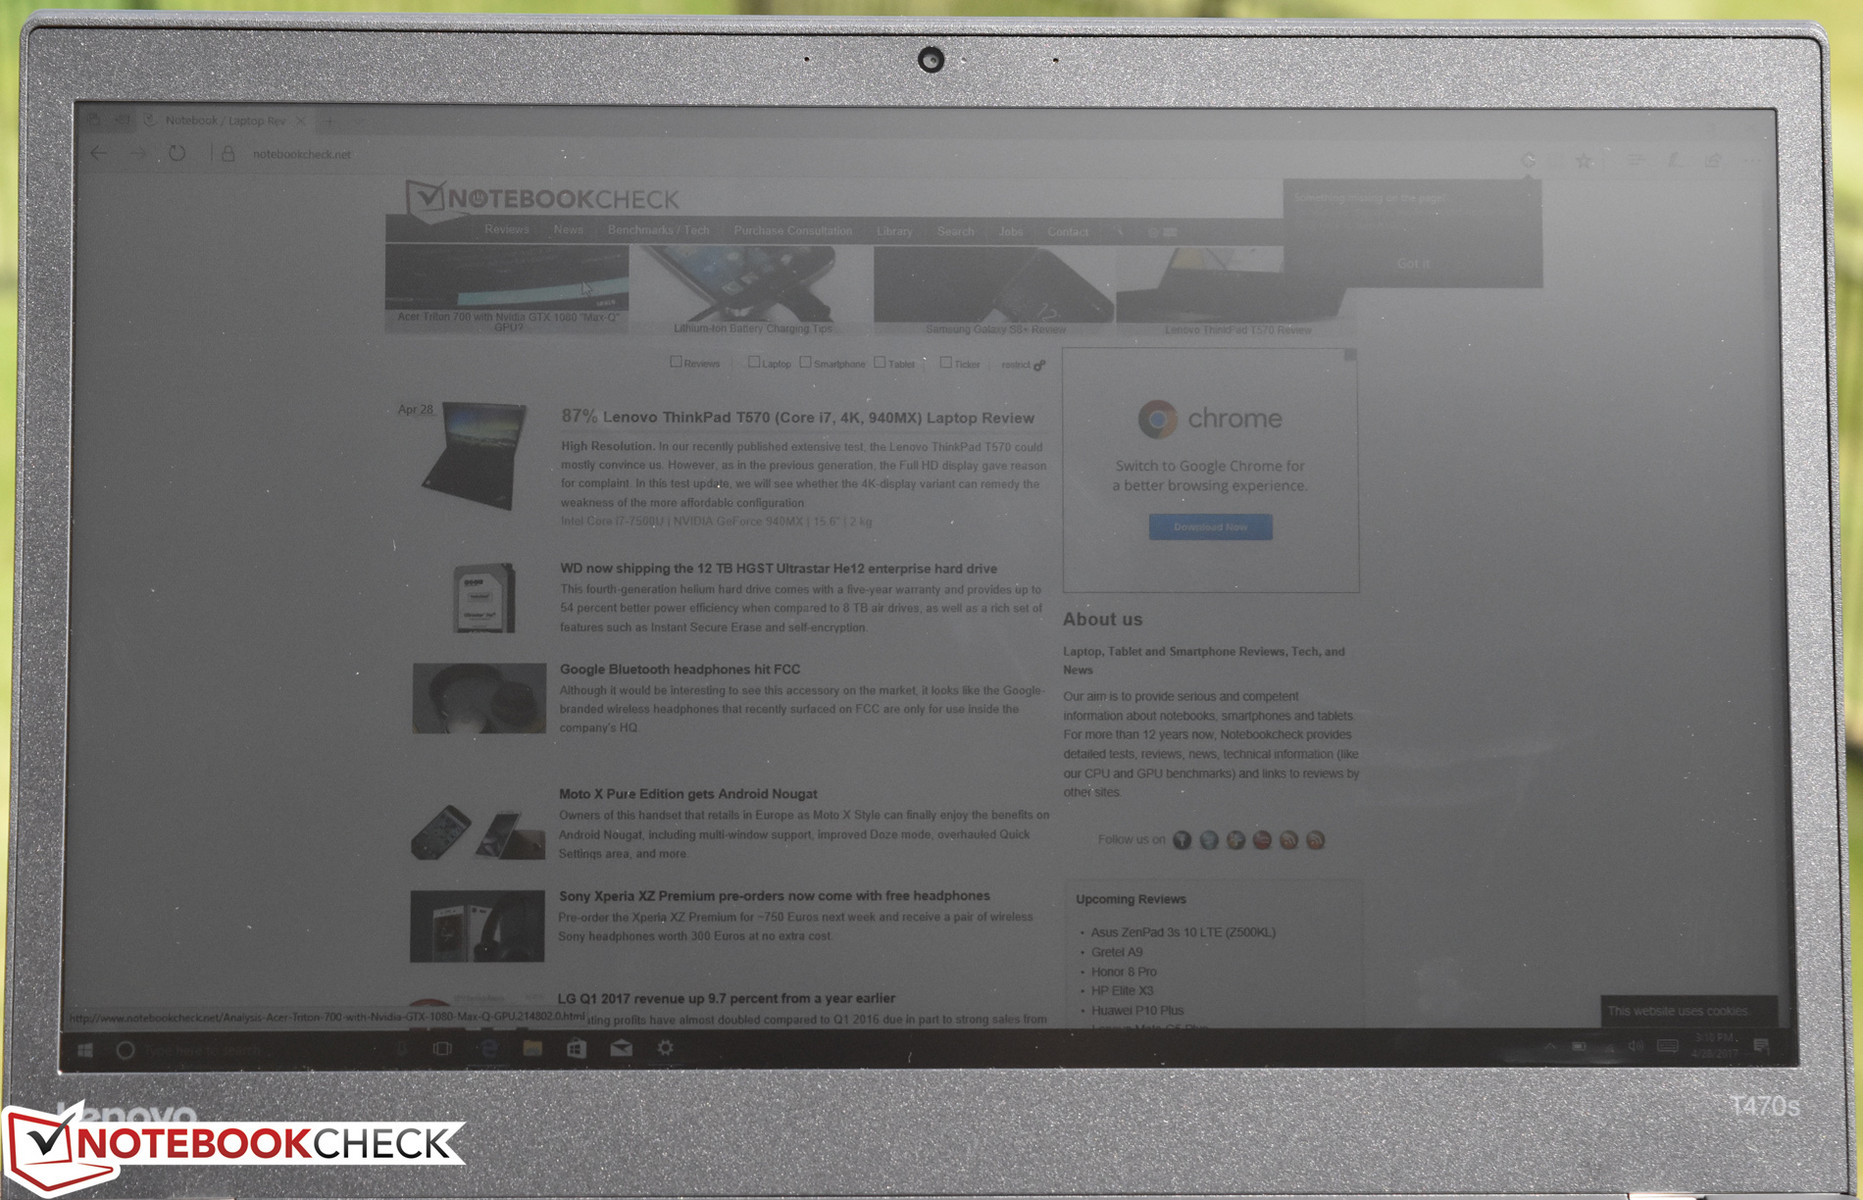
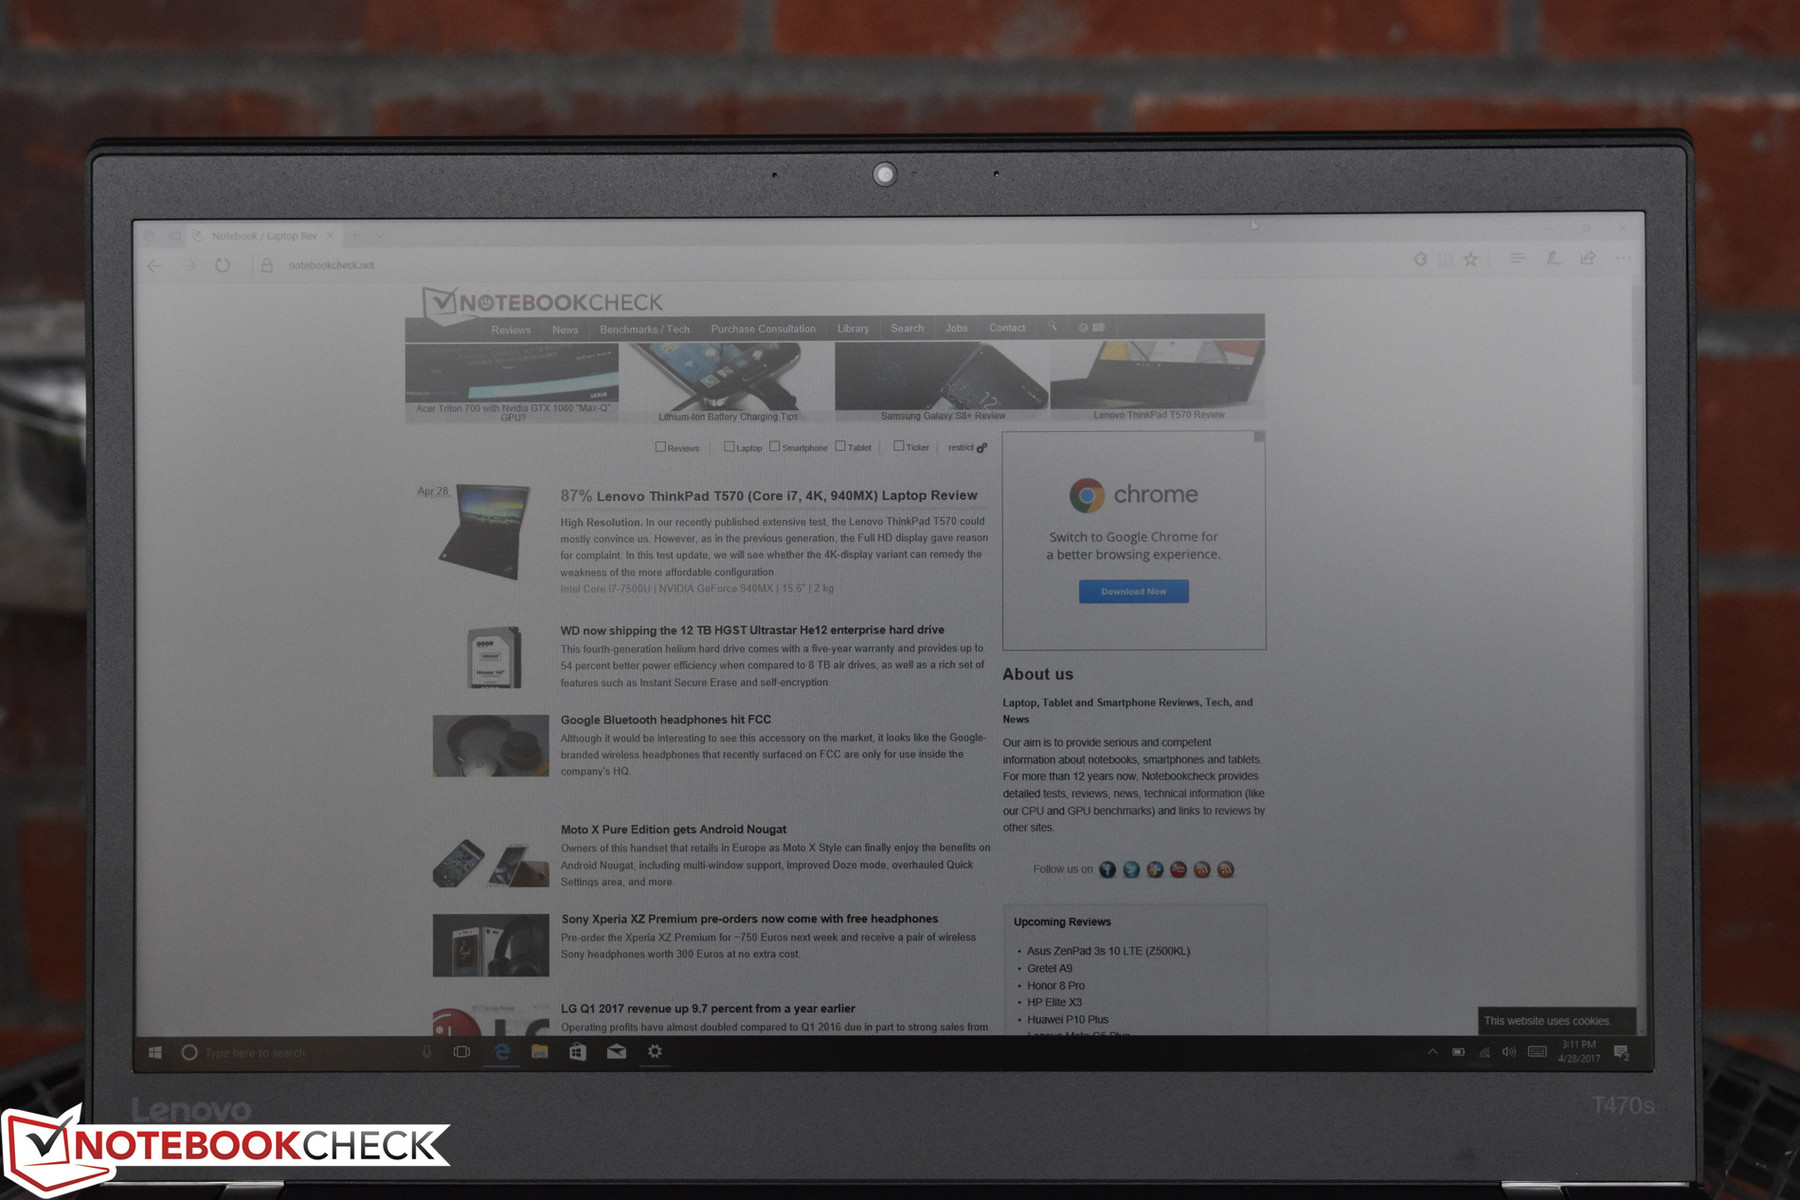
Outdoors, the screen is relatively comfortable in the shade. In sunnier environments, the weak brightness combined with the touchscreen matrix (only visible in very bright light and from specific angles) makes usage more difficult. Regardless, viewing angles in all but the brightest of environments are still as good as just about any other IPS display.

Performance
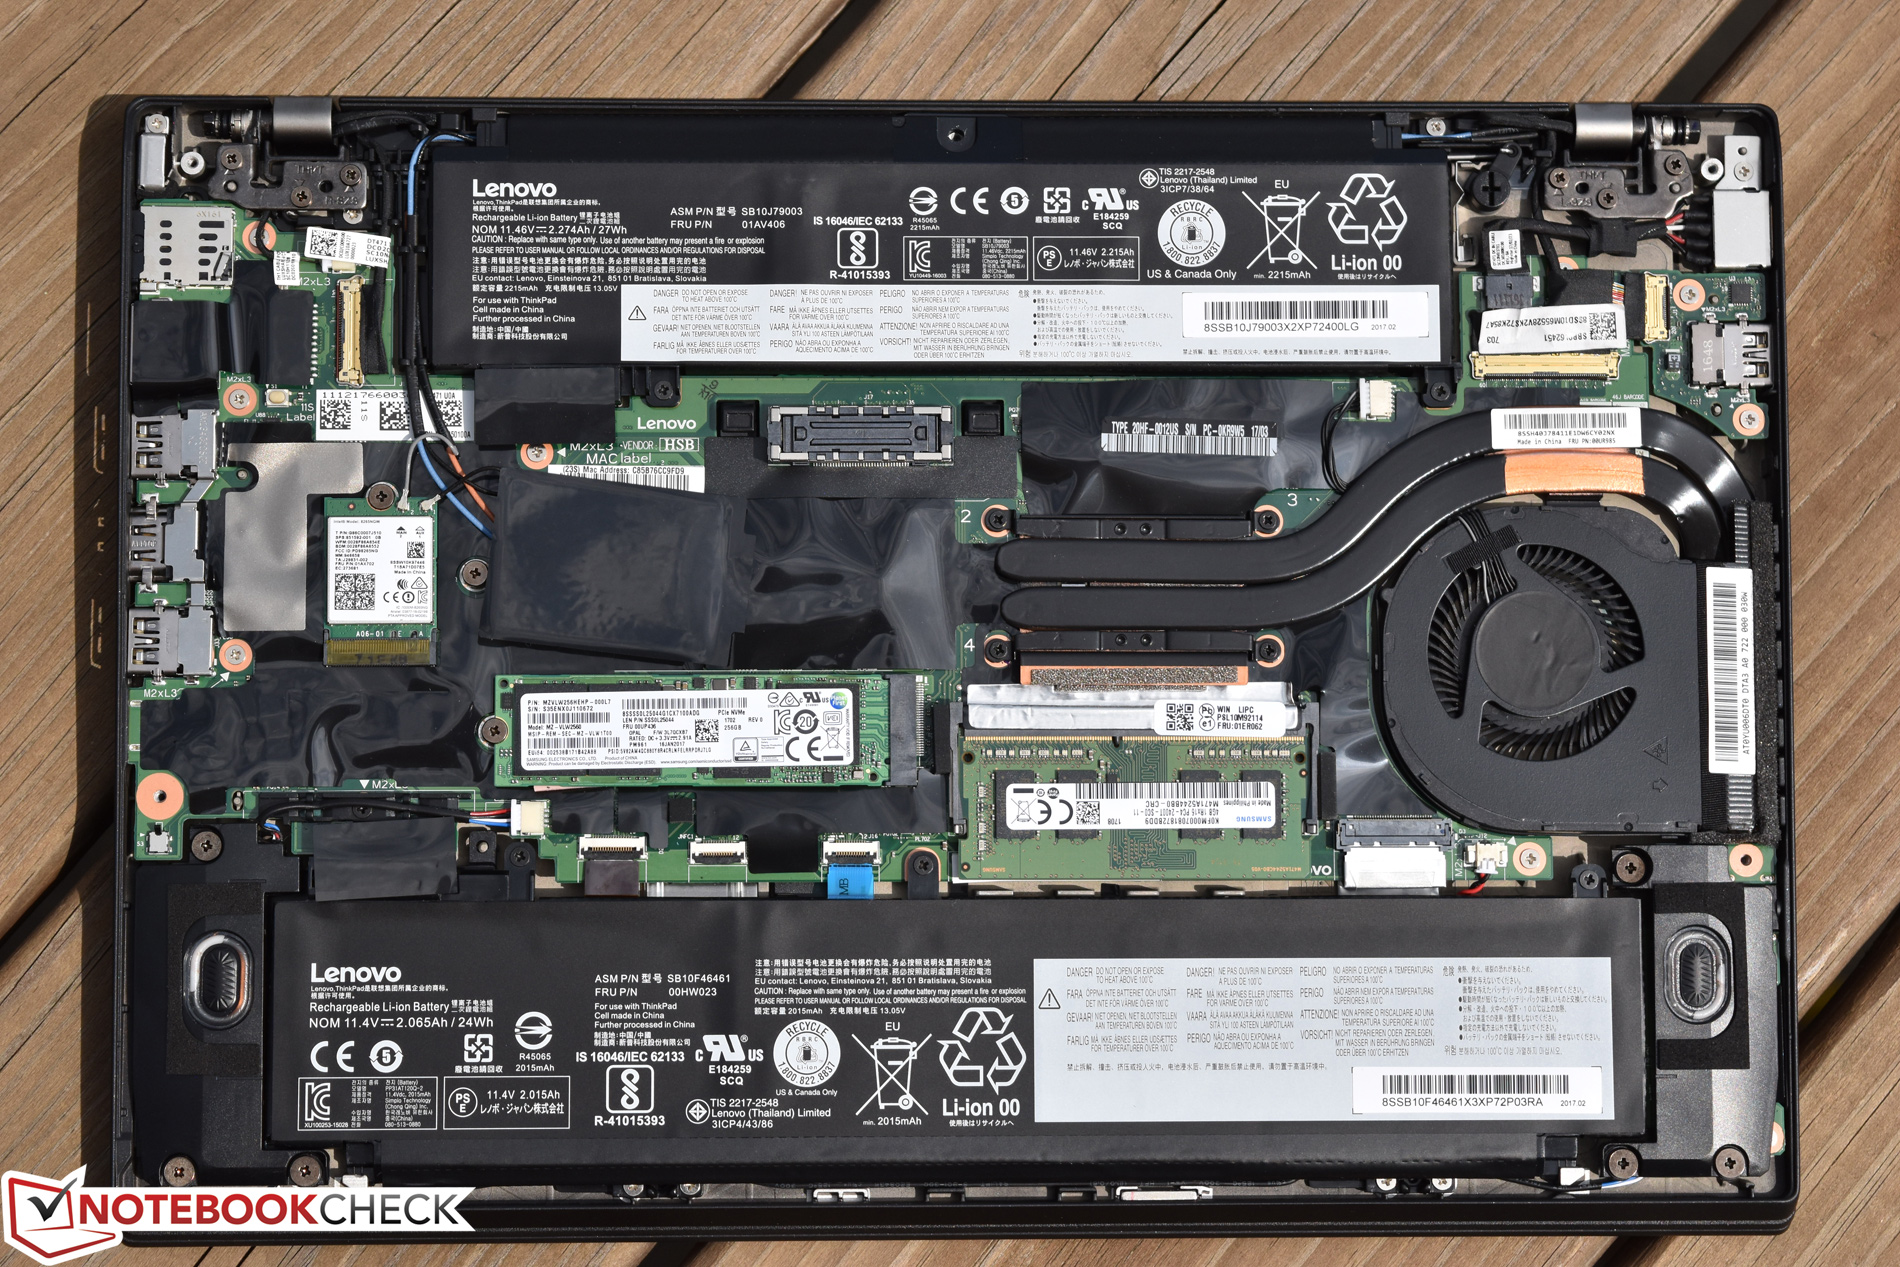
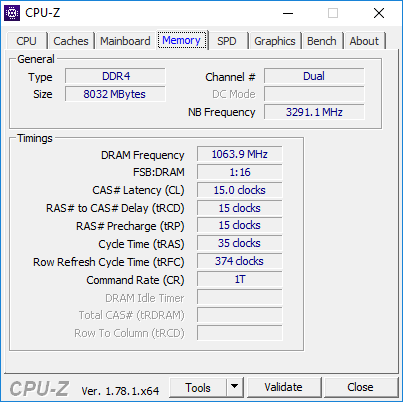
A range of 7th-generation Intel Kaby Lake CPUs are available in the T470s, along with up to 16 GB of RAM and a variety of solid-state storage options. While our previous review unit was decked out with the top-of-the-line Core i7 CPU, 16 GB of RAM, and a massive 1 TB NVMe SSD, today’s configuration features a much more modest Core i5, 8 GB of dual-channel memory, and a 256 GB NVMe SSD. This configuration is perfectly adequate for the average user (and should remain so for the reasonable life of the machine). However, it is worth noting that if it’s ever a possibility that more RAM might be desirable down the road, it would be a good idea to preconfigure this from the factory; since one of the two SODIMMs is permanently soldered to the board, the maximum amount of memory (and especially the maximum possible for dual-channel operation) is directly determined by the configuration that the user selects upon initial purchase.
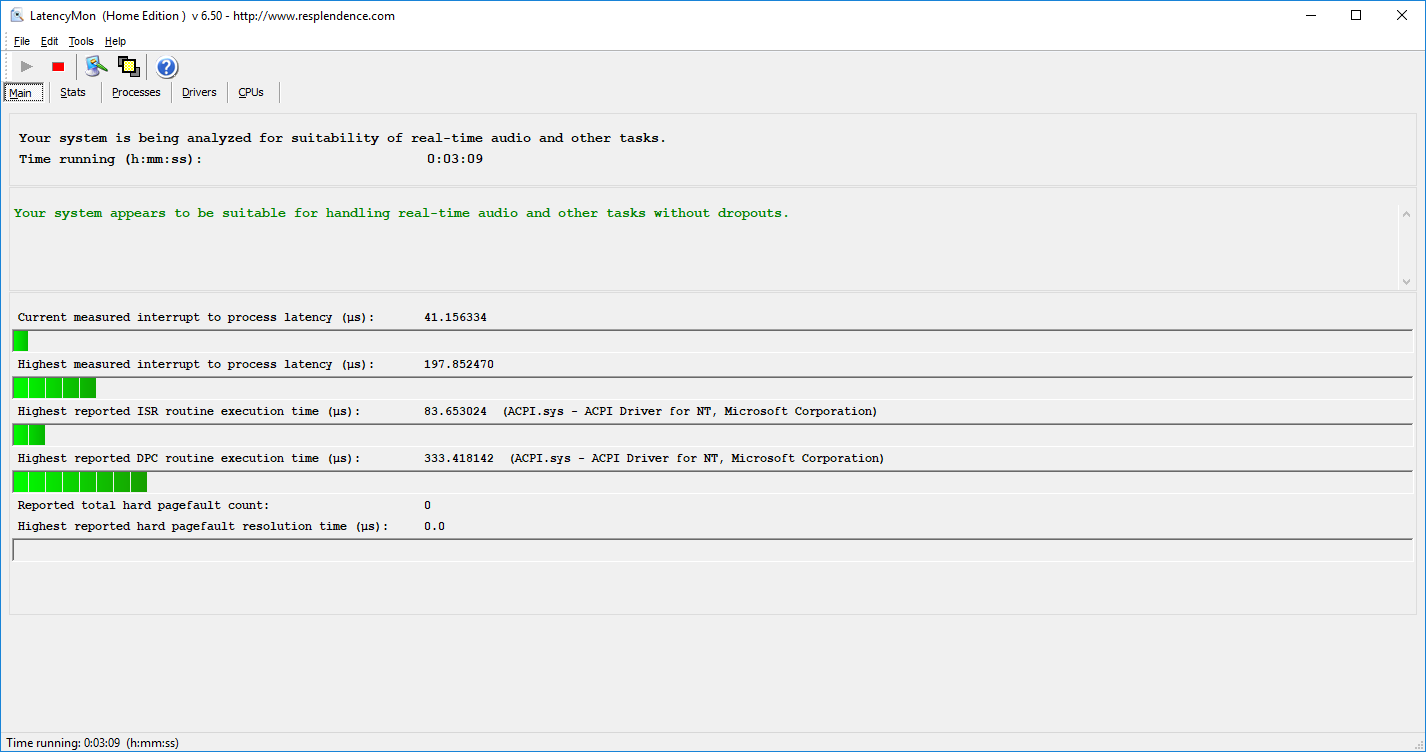
Performance while operating on battery power remains appreciably lower; we recorded a score of 1080 in 3DMark 11 (versus 1578 while plugged in). LatencyMon reports no problems with DPC latencies, suggesting that real-time audio and video streaming should be possible on this machine without any issues.
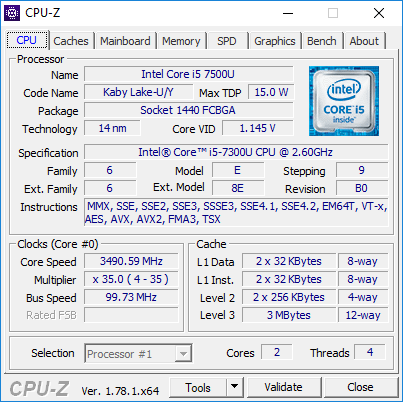
Processor
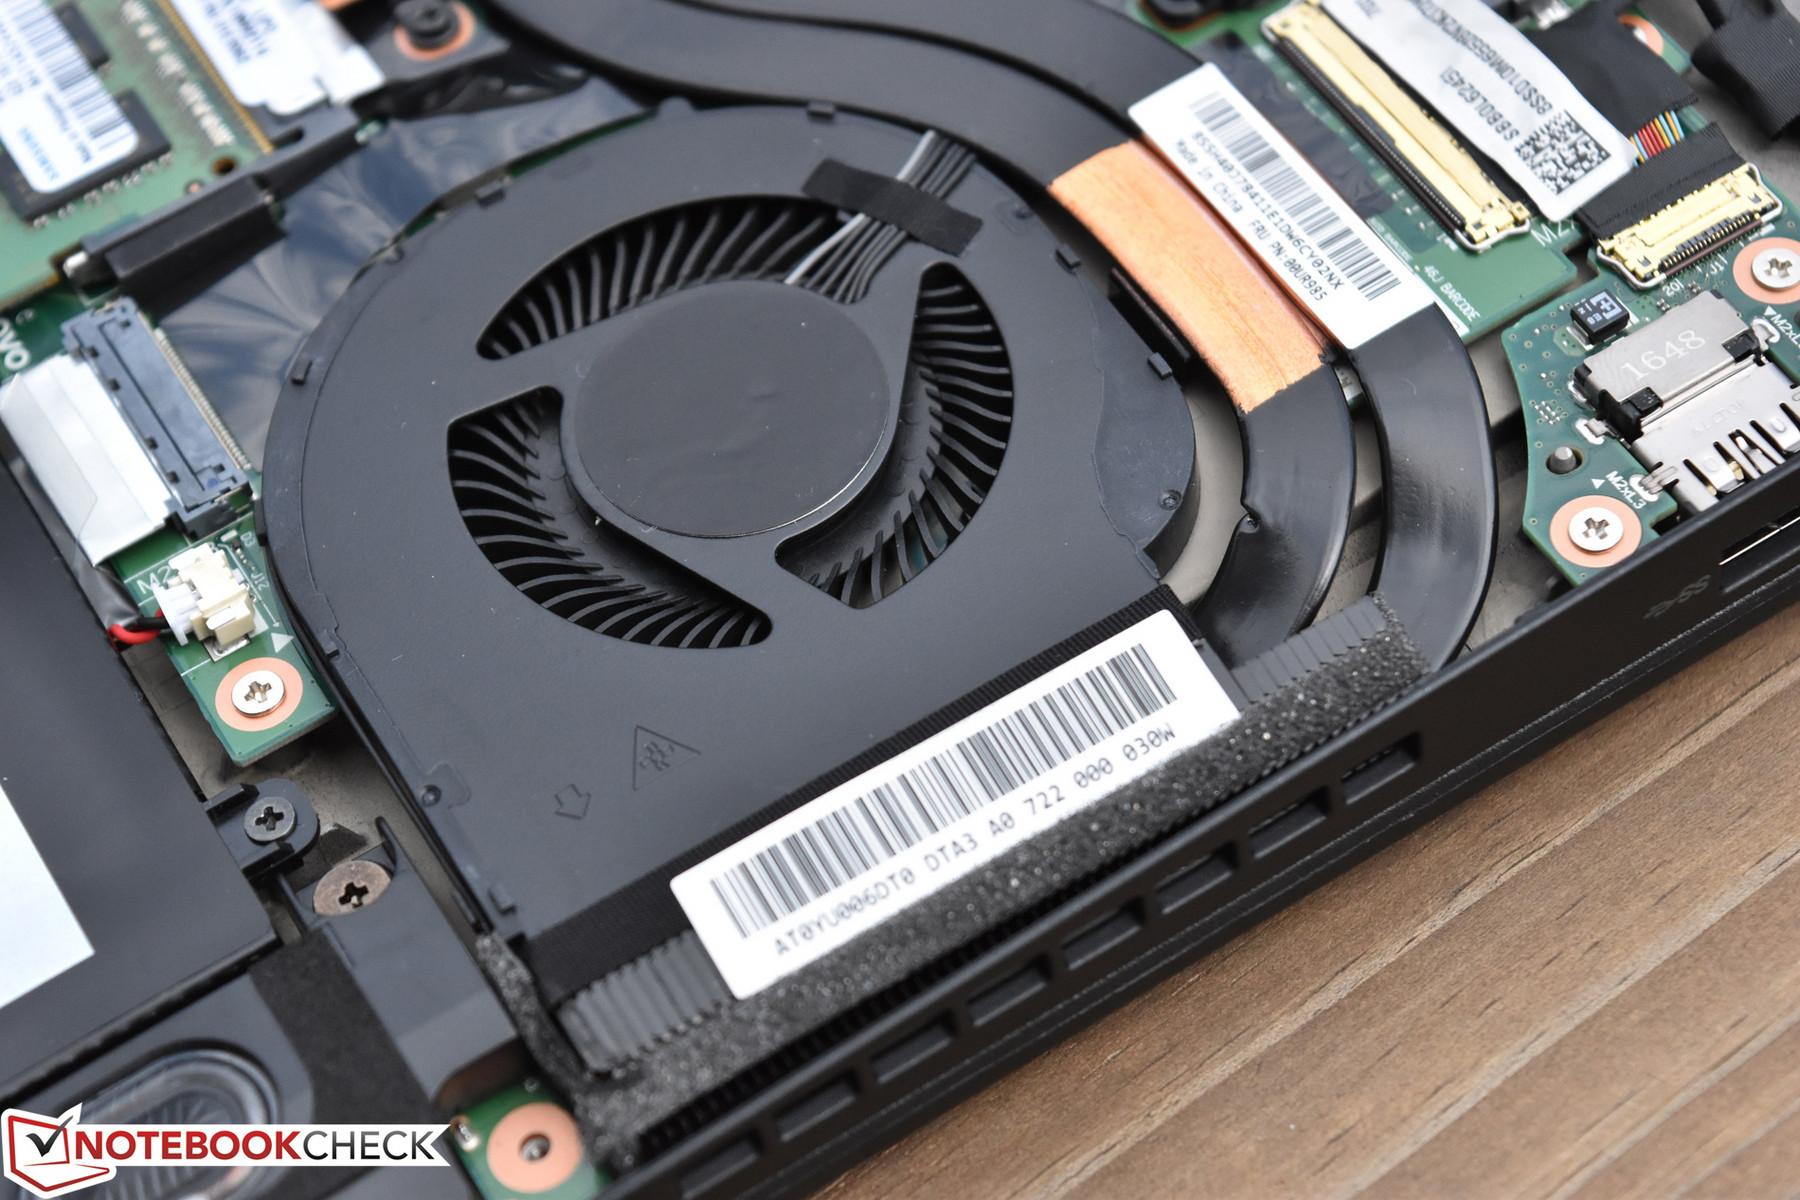
While we lamented the inability of our previous T470s to exploit the full potential of the Core i7 CPU’s Turbo frequencies, its performance was still very good overall considering its size. The limiting factor was operating temperatures, hamstrung by a relatively weak cooling system and compounded by conservative thermal limits set in the firmware. We have no reason to expect that this has changed with the Intel Core i5-7300U installed in today’s review unit, but perhaps the gap between the two CPUs isn’t as pronounced as one might expect given the thermal constraints.
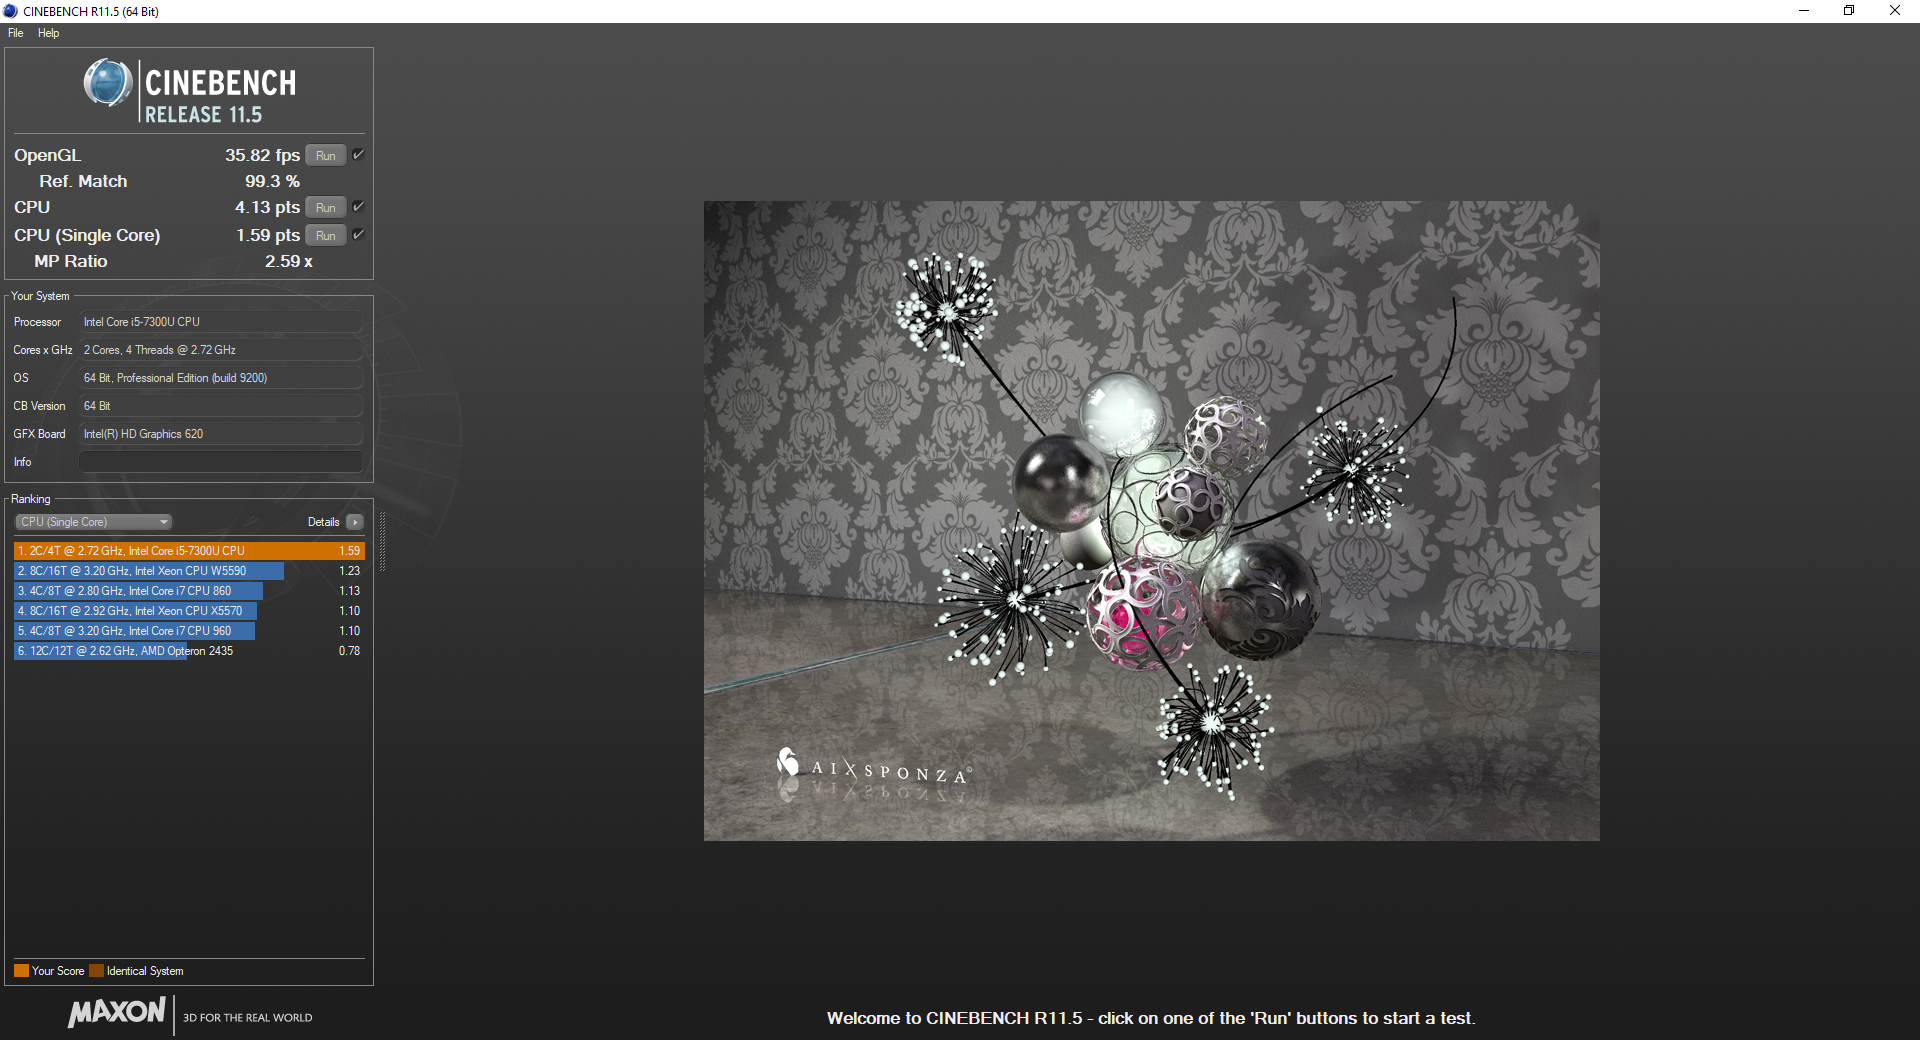
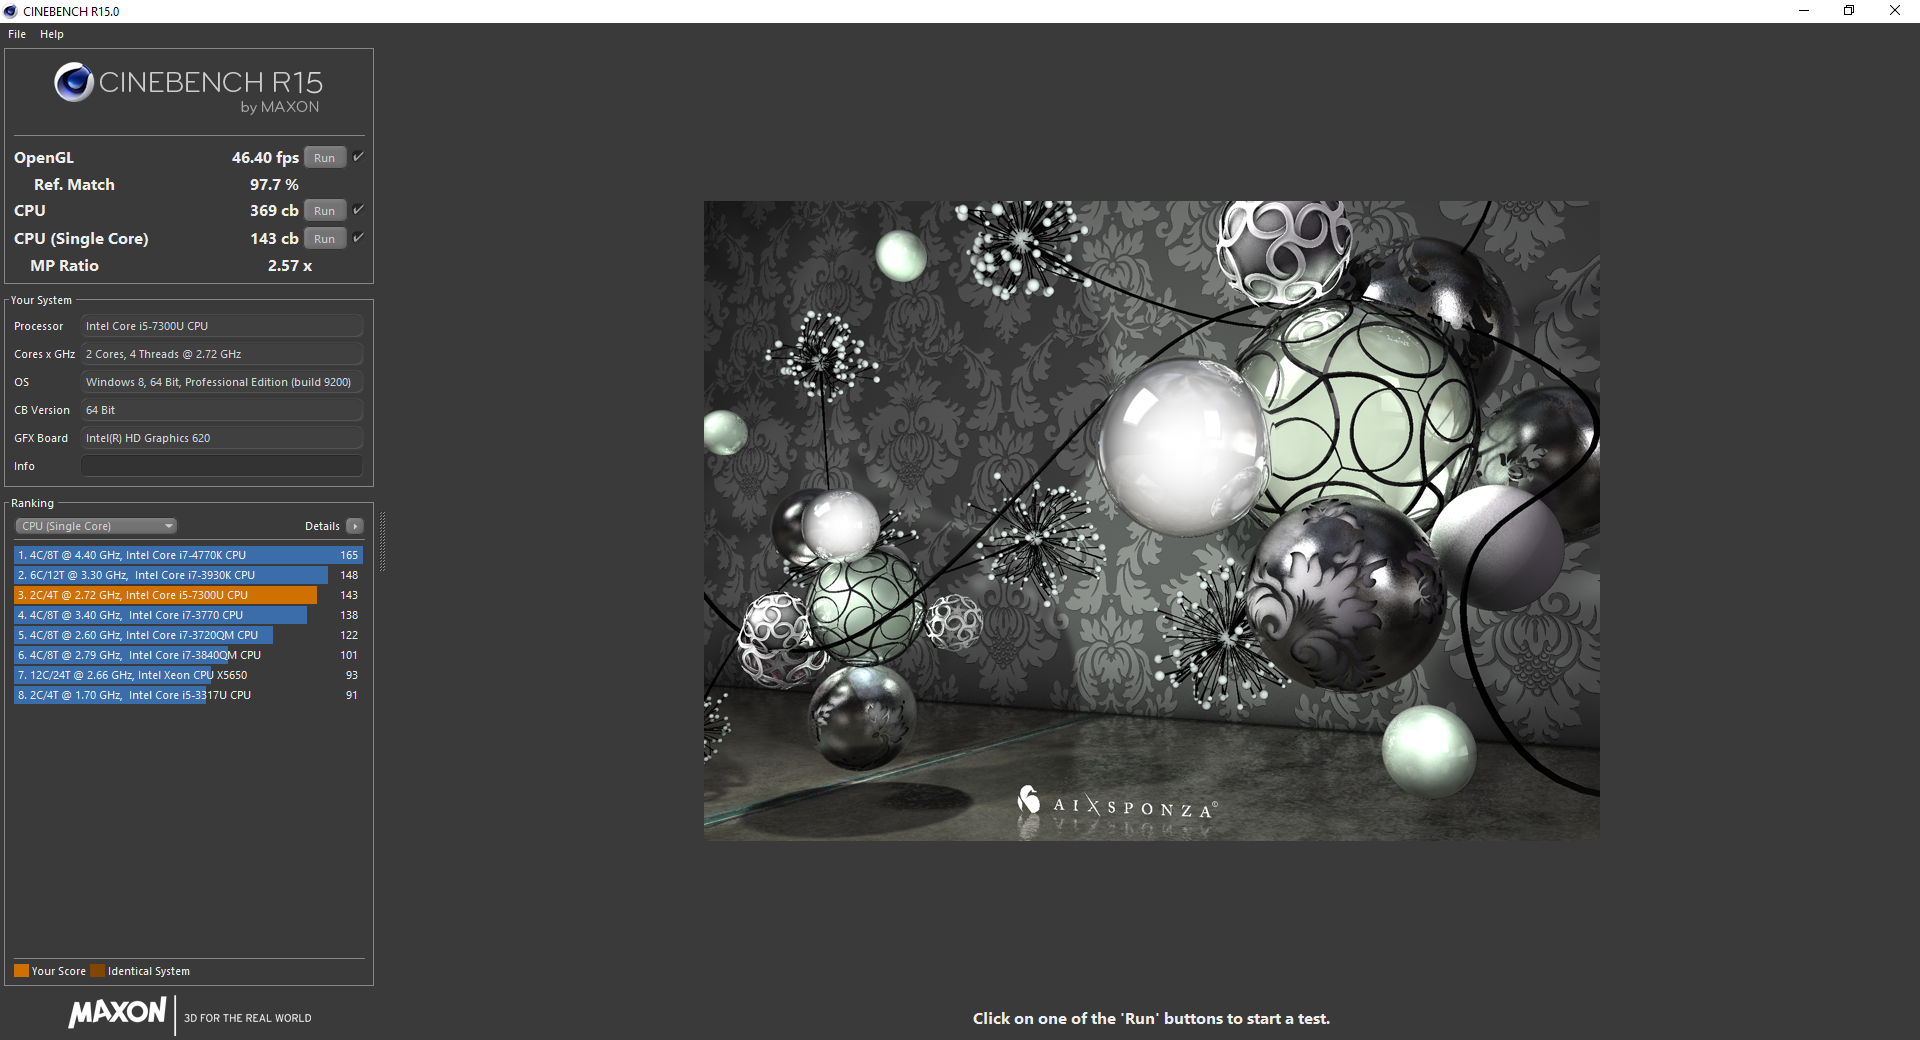
And, as it turns out, this is precisely the case. Although the Core i7 still wins out in shorter-term single-core tests (such as the Cinebench R11.5/R15 single-core CPU benchmark), the Core i5 actually completed the lengthier Super Pi benchmark 4 seconds ahead of the Core i7. Multi-core tests are just as illuminating: in both Cinebench R11.5 and R15 multi-CPU, the two T470s models are within 1 percent of each other in terms of overall performance.
What this means is precisely what we had theorized before: for most people, the Core i7 option in the T470s really doesn’t add much raw performance—again, thanks to the thermal constraints and the conservative limitations imposed on the CPU by the firmware. The Core i5-7300U in today’s review unit provides a much more affordable and balanced option.
Our Cinebench loop test (a relatively new addition to our repertoire) revealed no significant drops in performance over a long period of time (a series of several dozen consecutive runs of Cinebench R15 multi-CPU). This suggests that, unlike the Core i7-equipped T470s we reviewed previously, this configuration should have no problems maintaining CPU performance in real-world applications over a sustained period.
On the other hand, performance while operating unplugged is considerably below that while connected to an outlet. This problem is not as severe as it was on the WQHD model we reviewed, but it still exists: we recorded roughly 2.4 to 2.6 GHz while running CB R15 multi-CPU. It doesn’t appear that the CPU ever reaches anything above base frequency (2.6 GHz). However it also isn’t far below it (we saw 2.3 GHz once for a moment, but for the most part it’s close to 2.6 GHz). In single-CPU it does go above 2.6 GHz momentarily on occasion, to 2.7 GHz and even very briefly to 3.1 GHz. But it’s still by and large at or around 2.6 GHz.
| wPrime 2.10 - 1024m | |
| Dell Latitude 7480 | |
| Lenovo ThinkPad T470s-20HF0012US | |
| Lenovo ThinkPad T470s-20HGS00V00 | |
* ... smaller is better
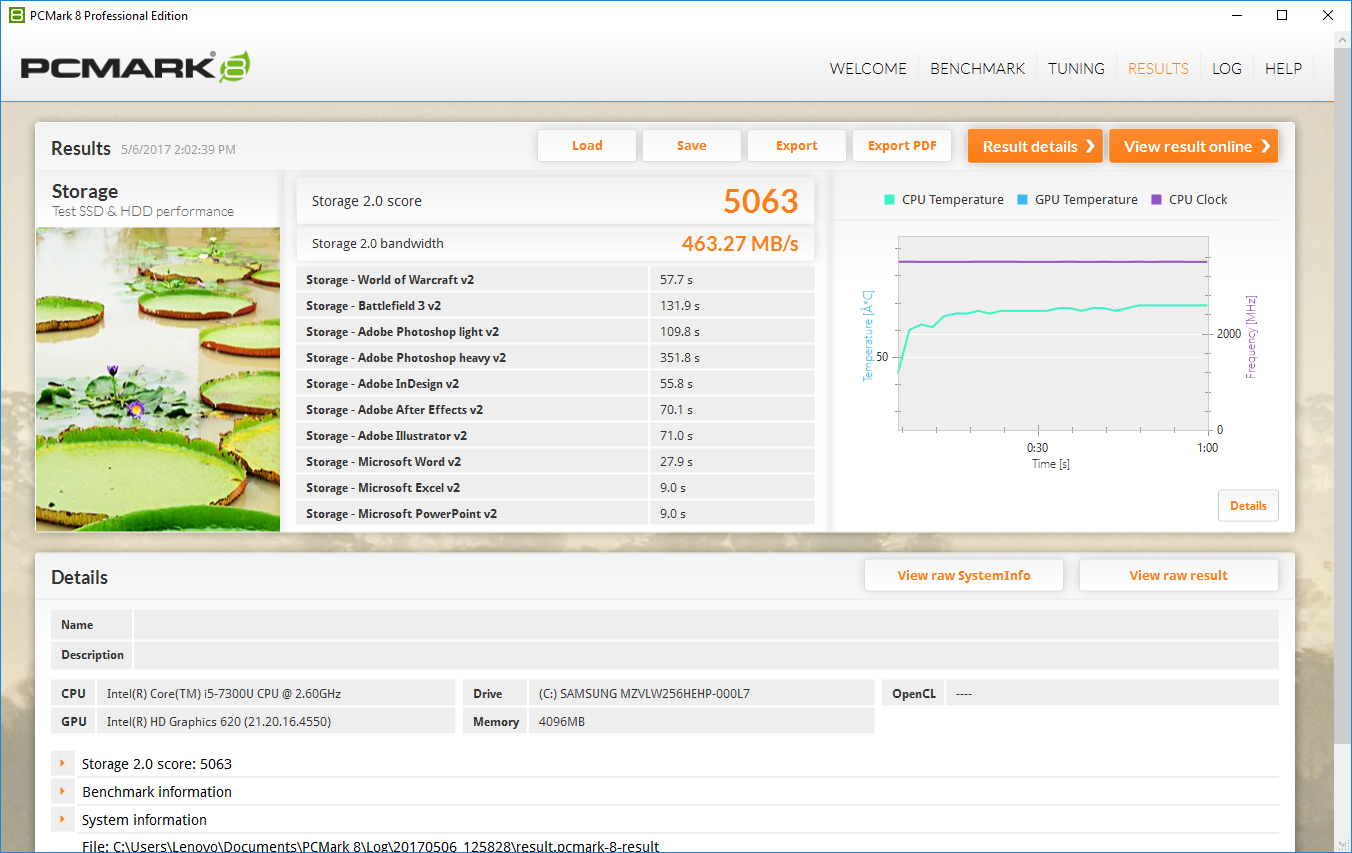
System Performance
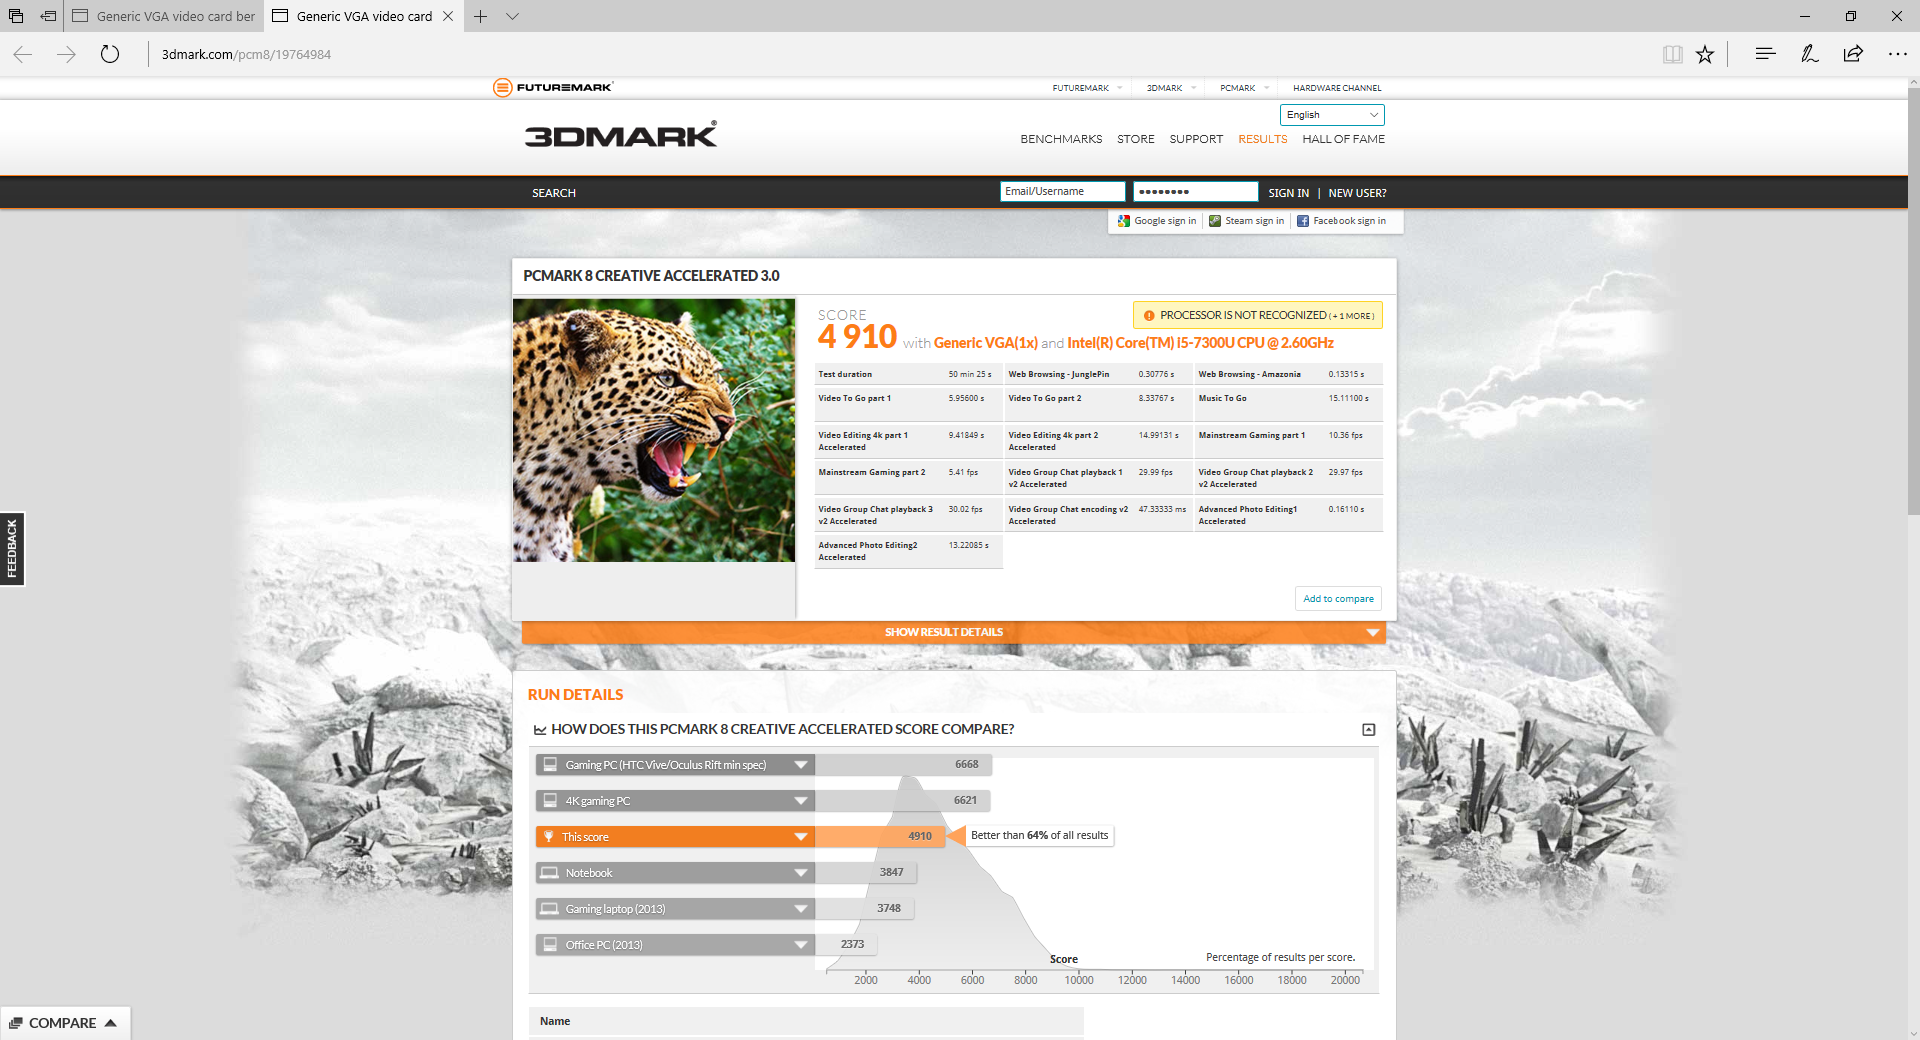
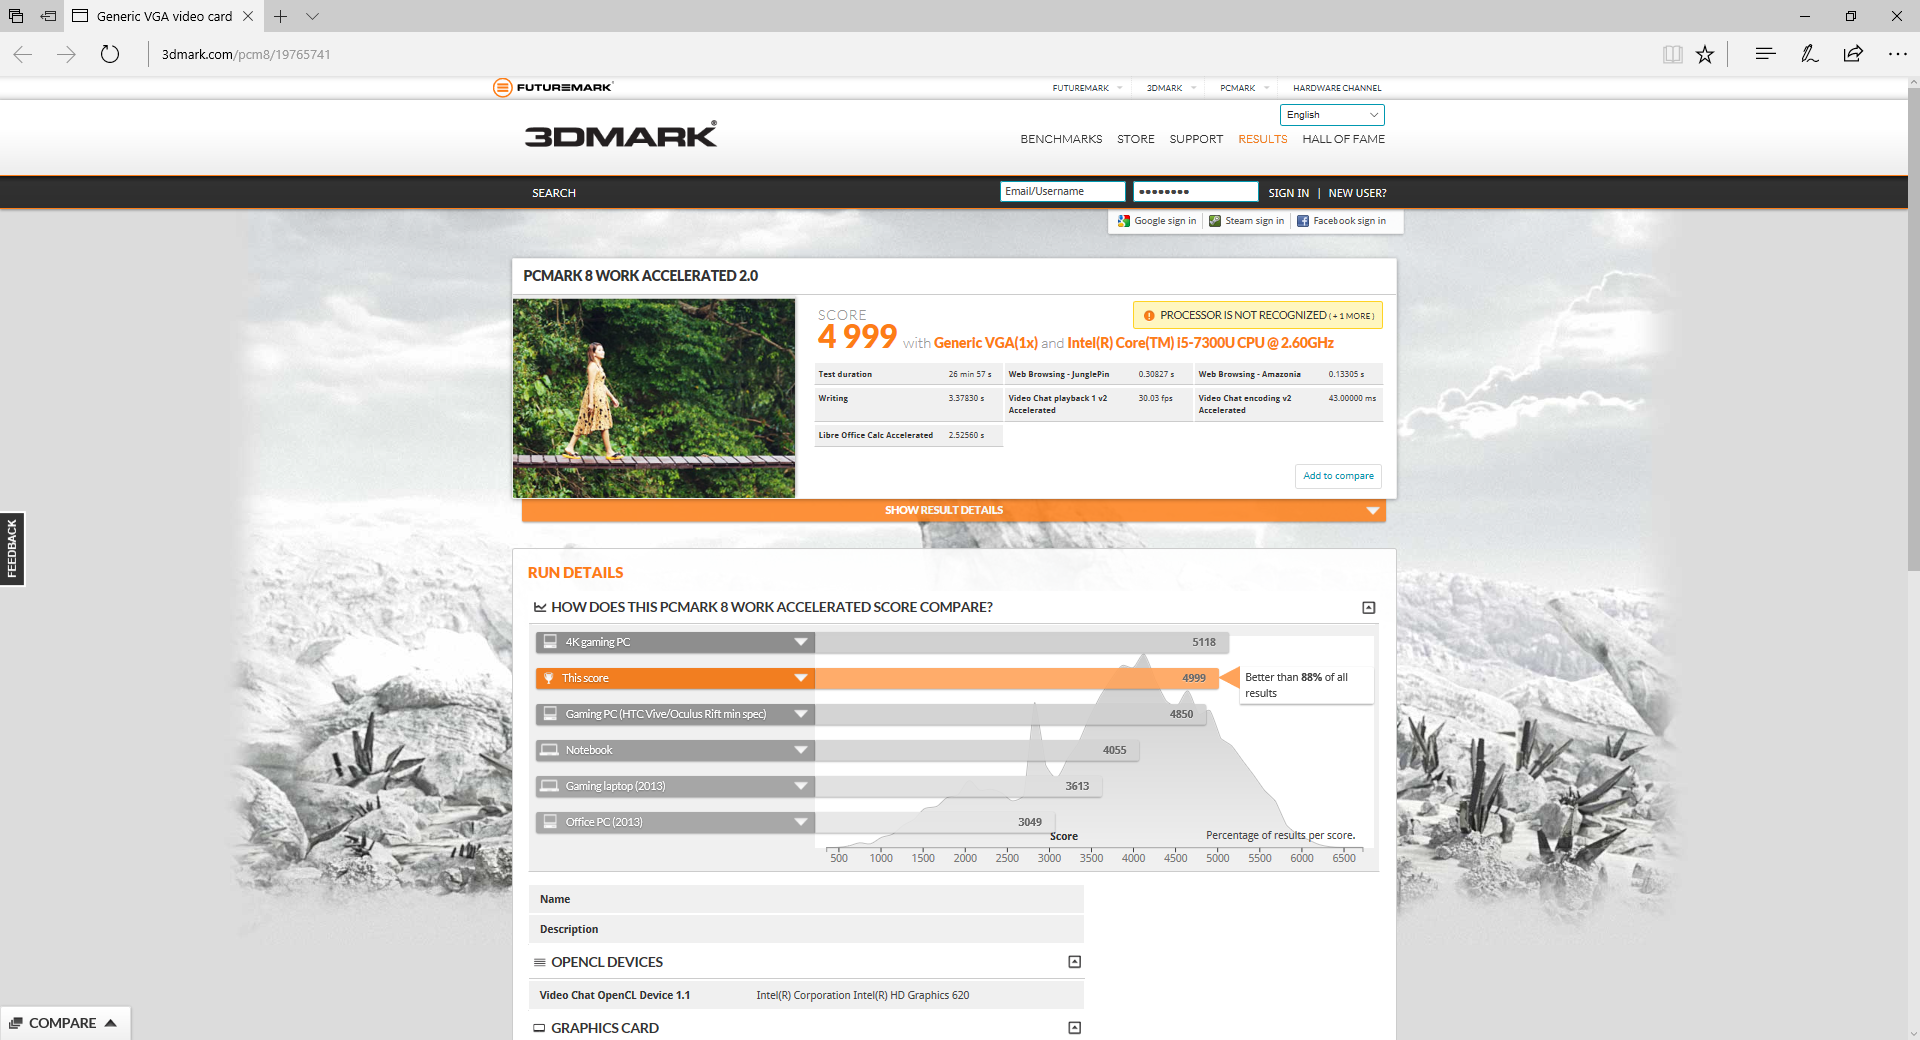
The ThinkPad T470s FHD posts strong numbers across the board in our PCMark 8 System Performance tests, within a few percentage points of the top in every scenario. Subjectively, it certainly feels fast, too: we never encountered stutters, hiccups, or any sort of unexpected hangs, applications invariably launched within seconds, and boot times were lightning quick.
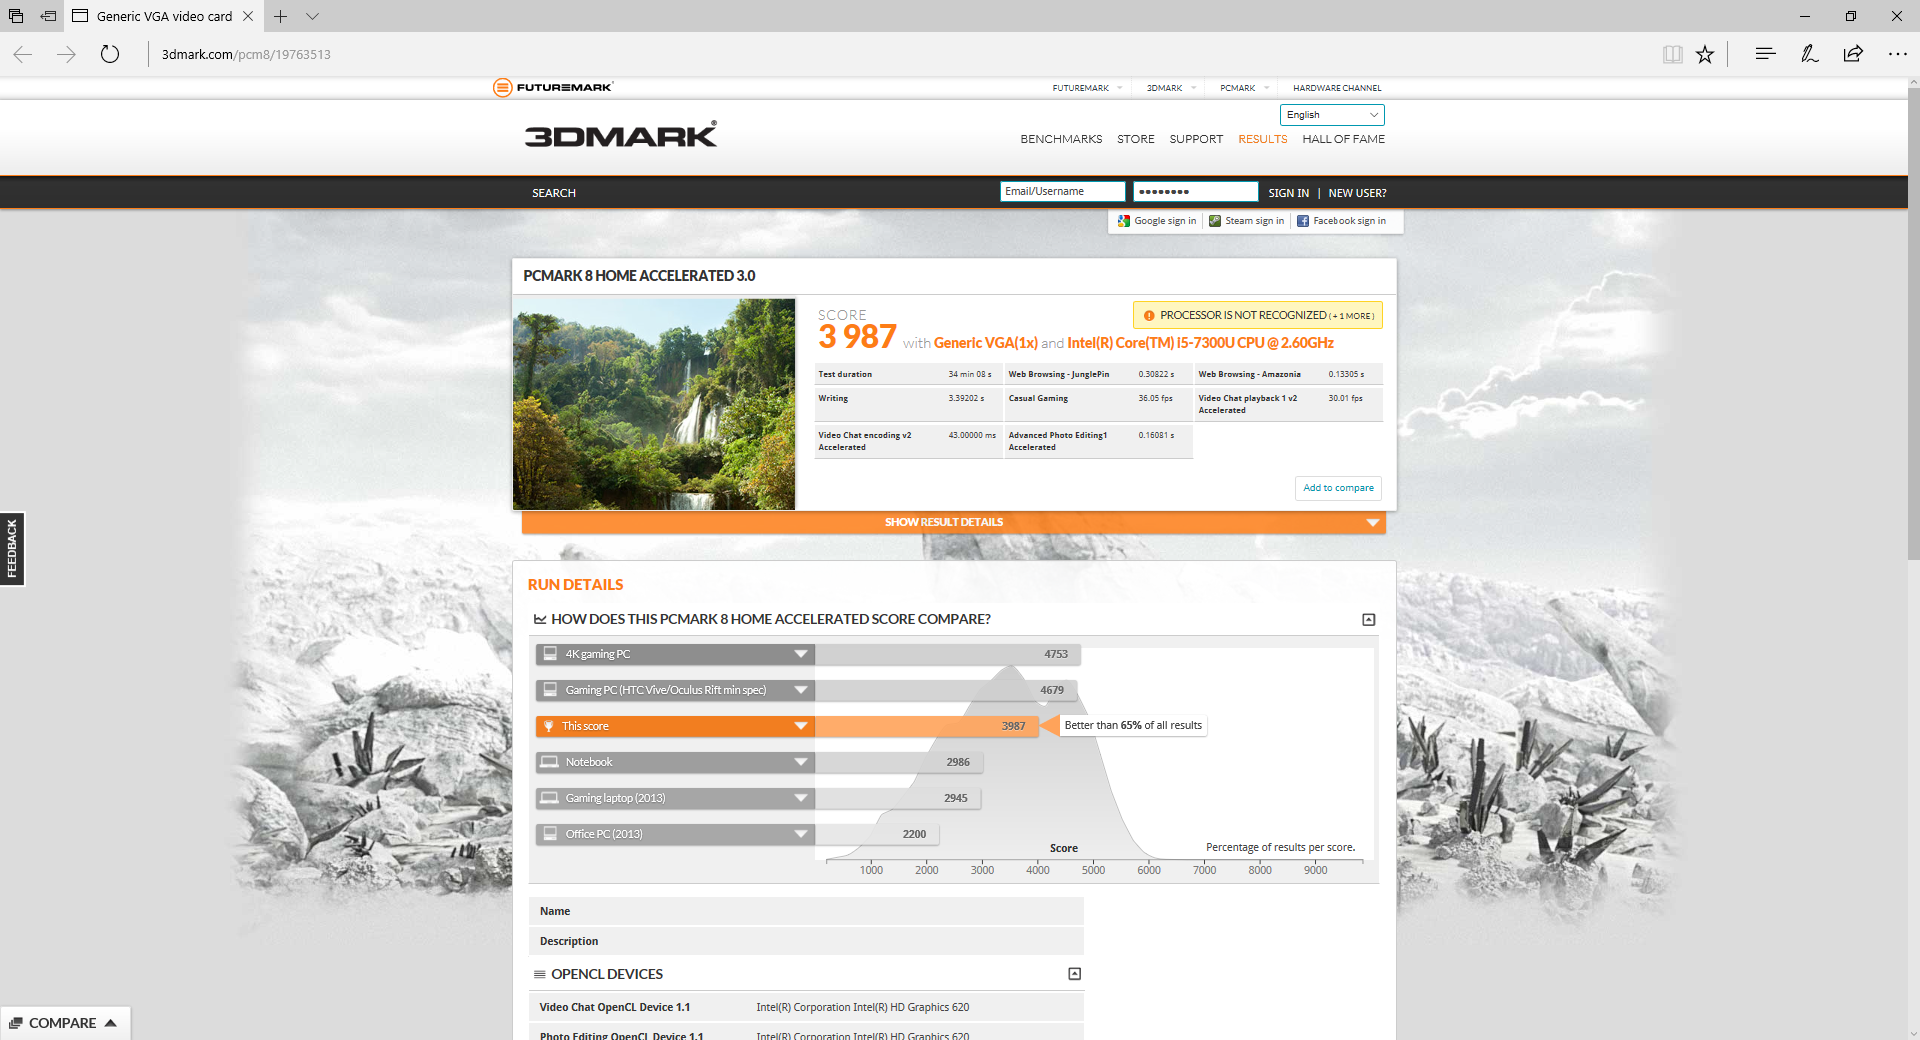
| PCMark 8 Home Score Accelerated v2 | 3987 points | |
| PCMark 8 Creative Score Accelerated v2 | 4910 points | |
| PCMark 8 Work Score Accelerated v2 | 4999 points | |
Help | ||
Storage Devices
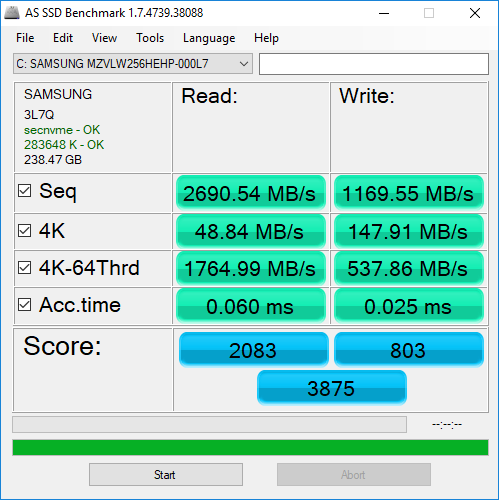
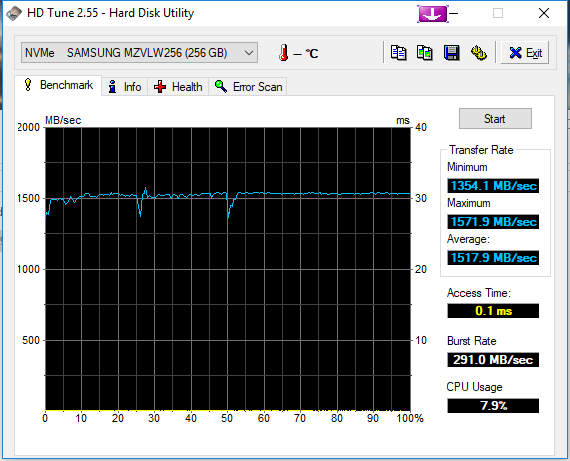
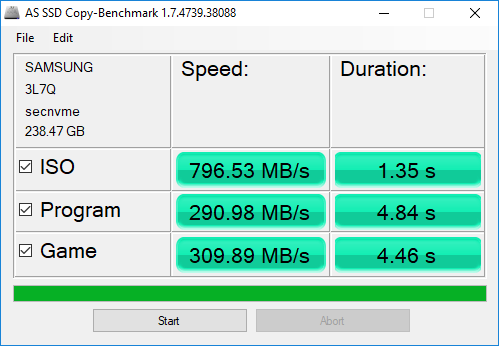
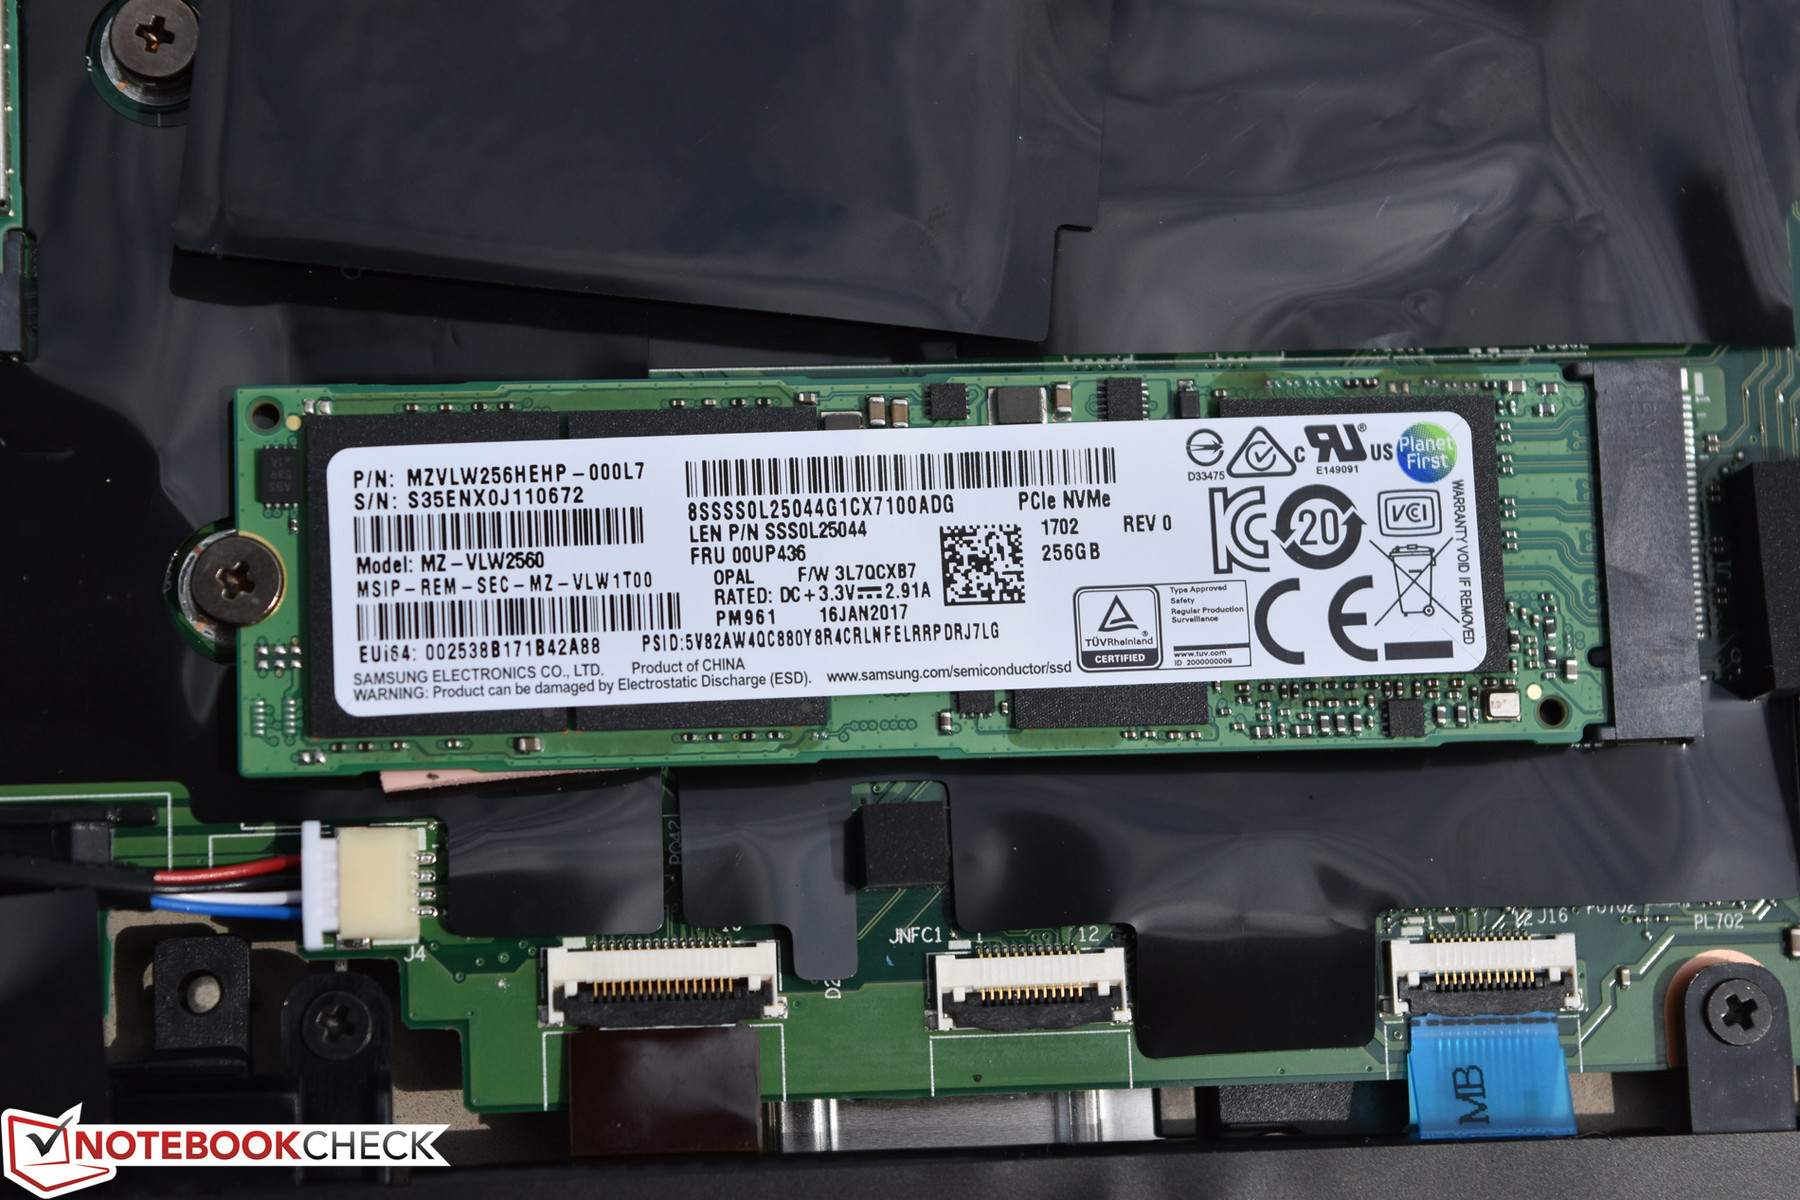
Our T470s configuration today includes a 256 GB NVMe SSD, 75% smaller than the massive 1 TB option we received in our first review candidate. The drive is still a Samsung PM961 model, and its performance is comparable as well. As usual, in order to provoke accurate values in AS SSD especially, we were forced to manually download and upgrade the storage driver to the Samsung NVMe driver (version 2.2).
The internal SSD can be easily replaced later following the removal of just the bottom cover. For much more information on maintenance and upgrades for the T470s, don’t miss our previous review, where we covered these items in depth.
| Lenovo ThinkPad T470s-20HF0012US Samsung PM961 MZVLW256HEHP | Lenovo ThinkPad T470s-20HGS00V00 Samsung SSD PM961 1TB M.2 PCIe 3.0 x4 NVMe (MZVLW1T0) | Dell Latitude 7480 Intel SSDSCKKF256H6 | Lenovo ThinkPad T470-20HD002HGE Samsung PM961 NVMe MZVLW512HMJP | Lenovo ThinkPad X1 Carbon 2017-20HQS03P00 Samsung PM961 NVMe MZVLW512HMJP | |
|---|---|---|---|---|---|
| CrystalDiskMark 3.0 | 12% | -56% | -10% | 10% | |
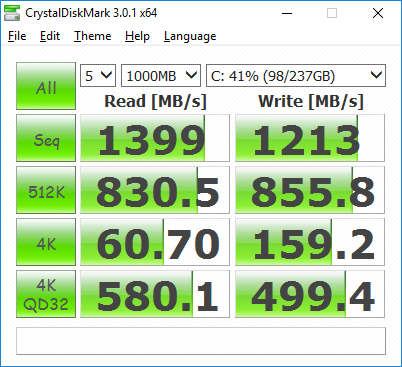
| Read Seq (MB/s) | 1399 | 1760 26% | 486.5 -65% | 1155 -17% | 1827 31% |
| Write Seq (MB/s) | 1213 | 1666 37% | 418.6 -65% | 1076 -11% | 1383 14% |
| Read 512 (MB/s) | 831 | 832 0% | 354.3 -57% | 811 -2% | 814 -2% |
| Write 512 (MB/s) | 856 | 1064 24% | 306.8 -64% | 862 1% | 1098 28% |
| Read 4k (MB/s) | 60.7 | 53.2 -12% | 29.25 -52% | 55.5 -9% | 61 0% |
| Write 4k (MB/s) | 159.2 | 167.4 5% | 90.5 -43% | 134.6 -15% | 172.2 8% |
| Read 4k QD32 (MB/s) | 580 | 630 9% | 280.2 -52% | 496.2 -14% | 601 4% |
| Write 4k QD32 (MB/s) | 499.4 | 533 7% | 252.8 -49% | 425.4 -15% | 495.6 -1% |

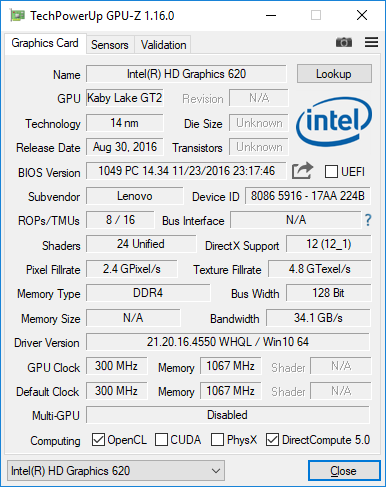
GPU Performance
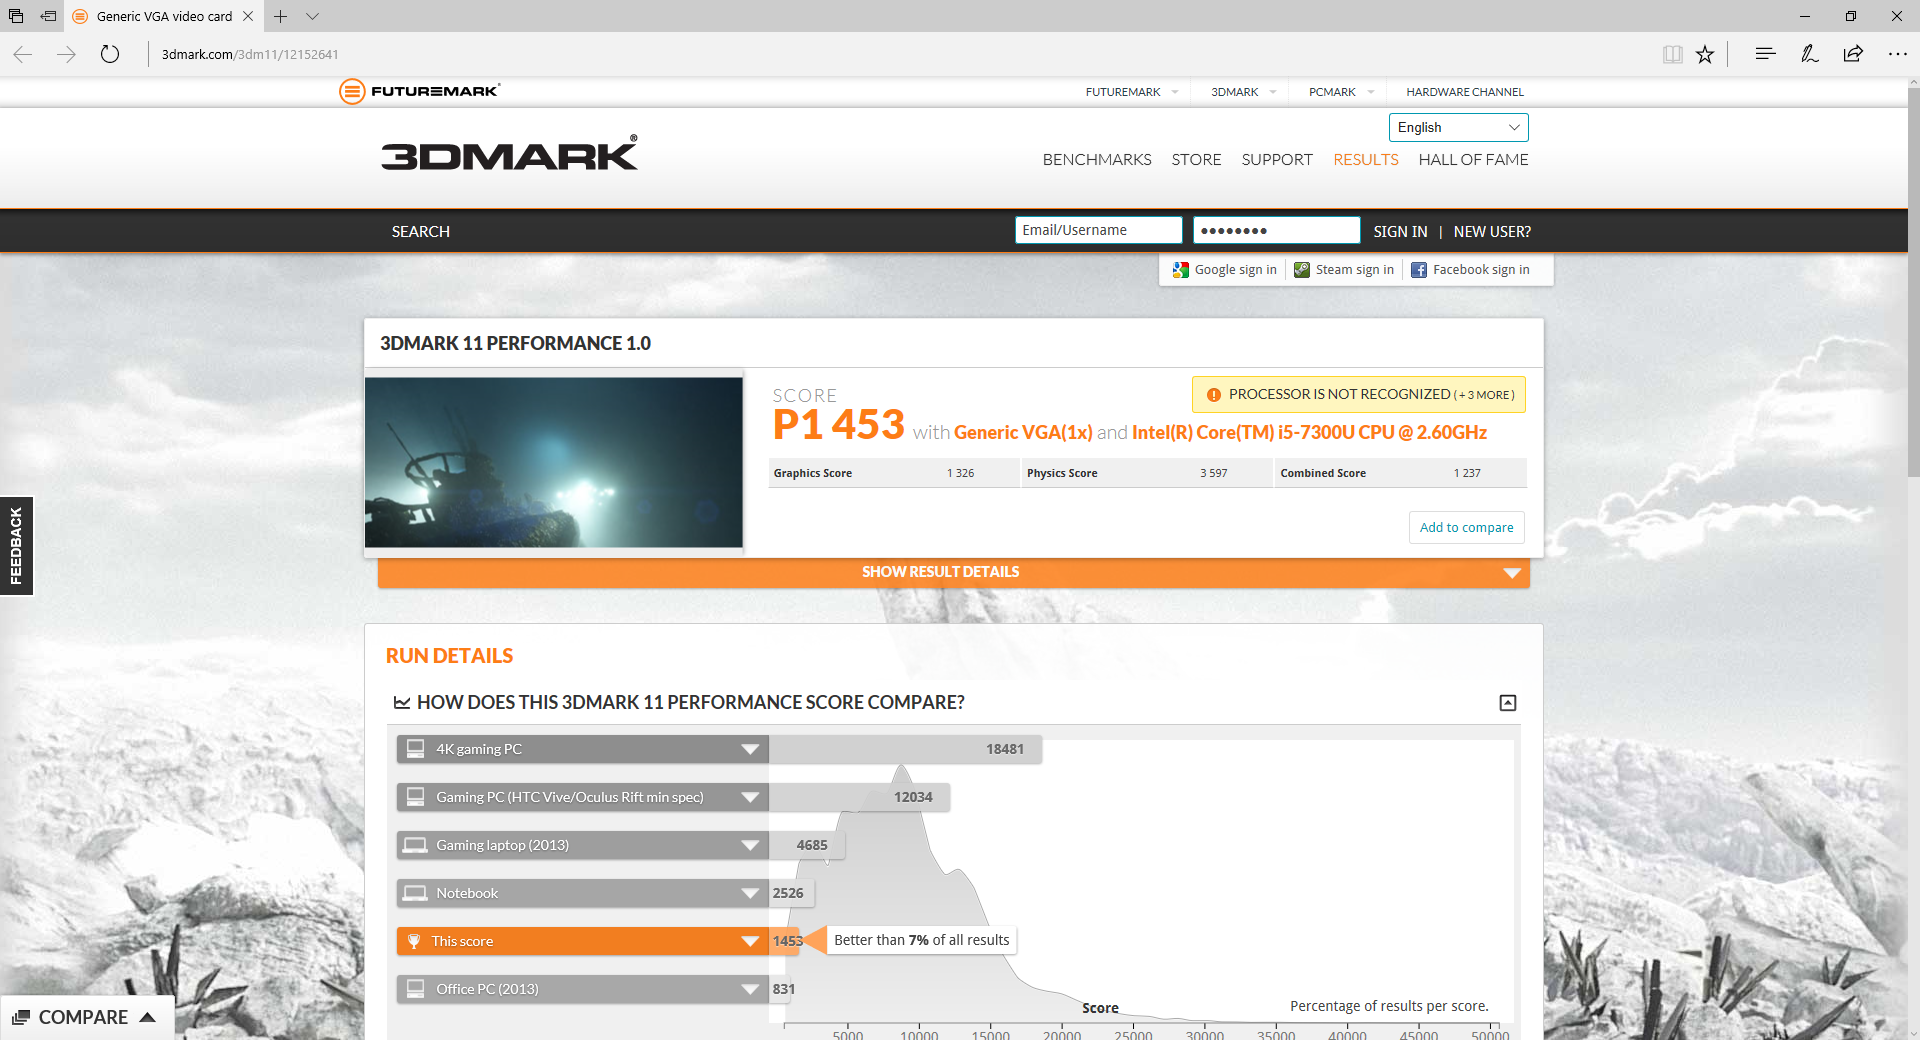
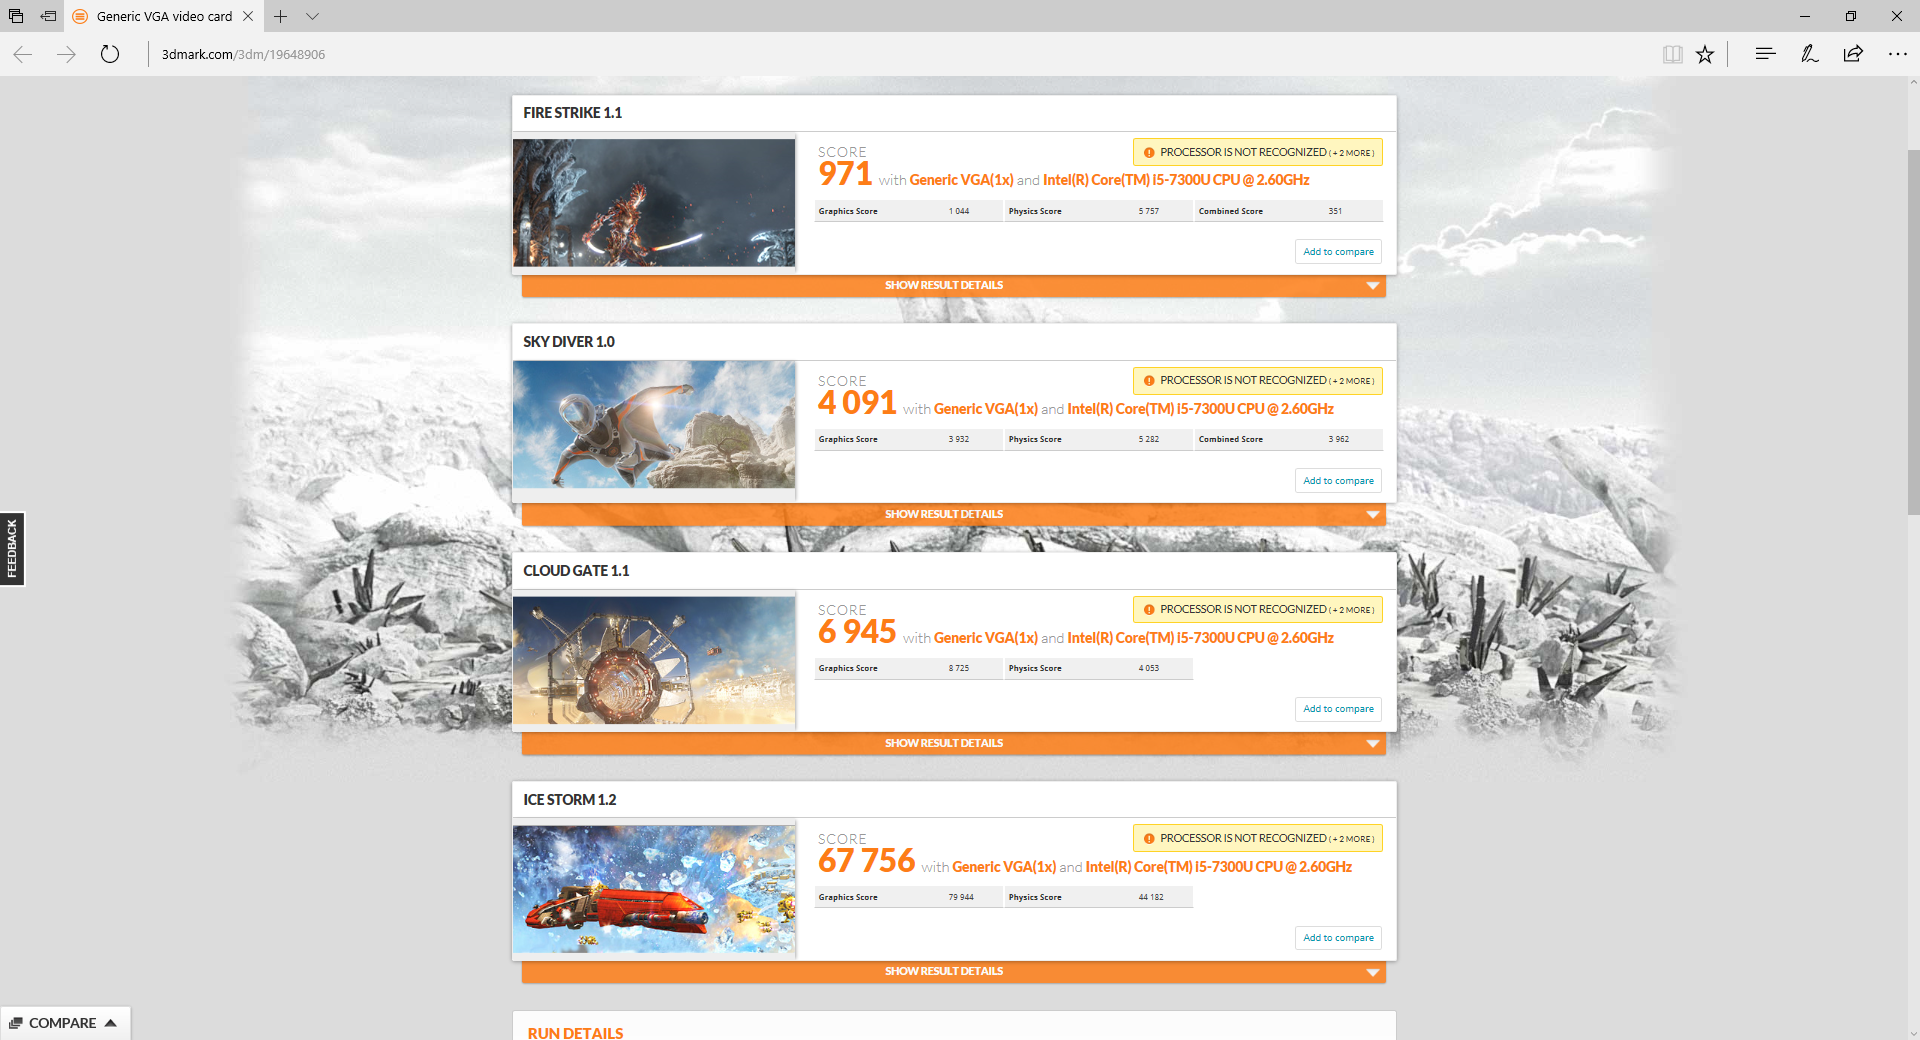
The ThinkPad T470s only offers integrated GPU options—specifically, Intel HD Graphics 620, which is a part of the ULV Kaby Lake CPU package which powers all of the possible configurations. Unlike the CPU performance idiosyncrasies, however, GPU performance is one area in which the more power Core i7 CPU does seem to provide tangible benefits with few strings attached. In 3DMark 11 Performance GPU, the Core i7 T470s musters a 13% higher score of 1777 points (versus today’s Core i5 model, for which we recorded 1578 points). This helps the former to a 21% victory margin over the Core i5-7300U configuration’s 1494 in Performance Combined. In 3DMark Fire Strike, once again, a gap of 13% separates the two competitors, along with a 10% difference in Cloud Gate.
| 3DMark | |
| 1280x720 Cloud Gate Standard Graphics | |
| Lenovo ThinkPad T470s-20HGS00V00 | |
| Lenovo ThinkPad X1 Carbon 2017-20HQS03P00 | |
| Lenovo ThinkPad T470s-20HF0012US | |
| Dell Latitude 7480 | |
| Lenovo ThinkPad T470-20HD002HGE | |
| 1920x1080 Fire Strike Graphics | |
| Lenovo ThinkPad T470s-20HGS00V00 | |
| Lenovo ThinkPad X1 Carbon 2017-20HQS03P00 | |
| Lenovo ThinkPad T470s-20HF0012US | |
| Dell Latitude 7480 | |
| Lenovo ThinkPad T470-20HD002HGE | |
| 1920x1080 Ice Storm Extreme Graphics | |
| Dell Latitude 7480 | |
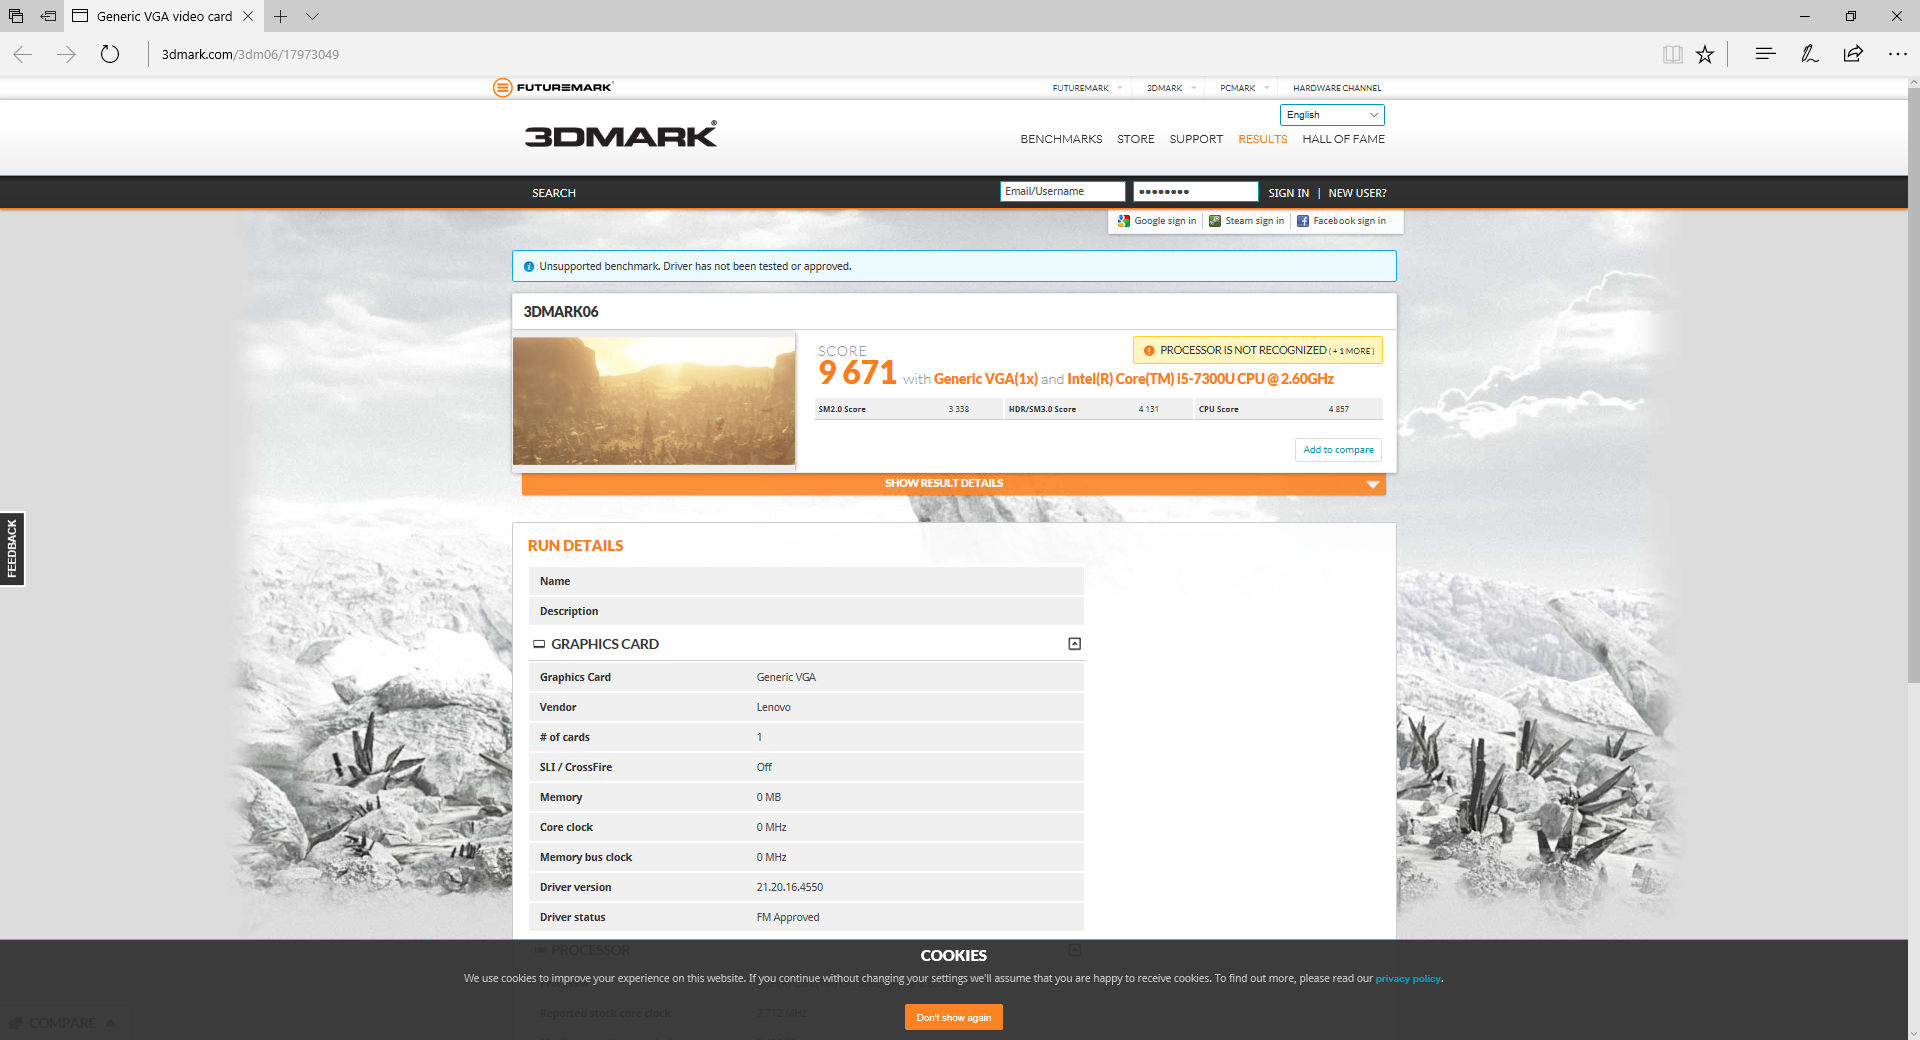
| 3DMark 06 Standard Score | 9671 points | |
| 3DMark 11 Performance | 1741 points | |
| 3DMark Ice Storm Standard Score | 67756 points | |
| 3DMark Cloud Gate Standard Score | 6945 points | |
| 3DMark Fire Strike Score | 971 points | |
Help | ||
Gaming Performance
The T470s fares a bit better on our actual gaming performance tests, with a 54.6 fps recorded at low settings in BioShock Infinite. However, it’s important to keep in mind that this is a game from 2011, and that the Low settings also imply a resolution of 1280x720. Newer games or higher resolutions and settings will quickly overwhelm the T470s and its integrated ULV GPU.
| low | med. | high | ultra | |
|---|---|---|---|---|
| BioShock Infinite (2013) | 54.6 | 31.7 | 26 | 8.2 |
Stress Test
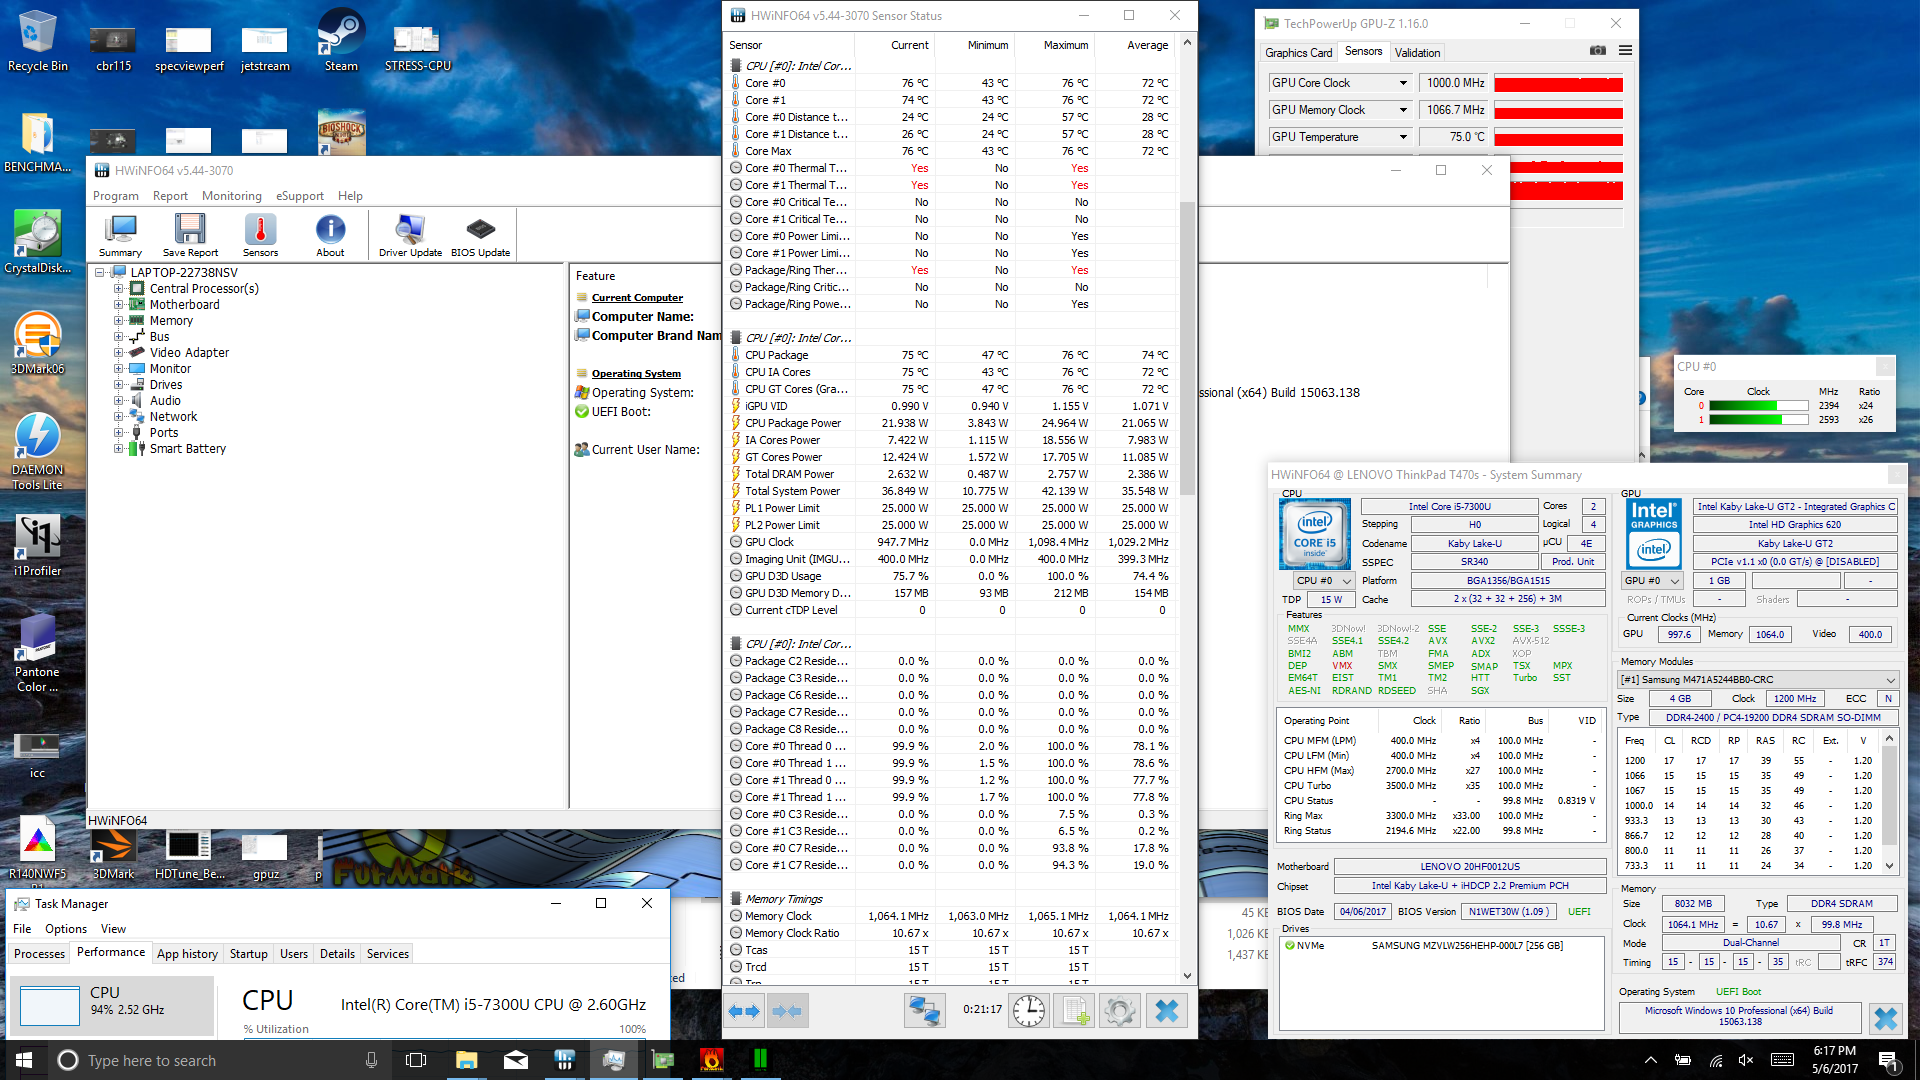
During our stress testing, we encountered the same firmware-dictated 75 °C thermal limit that afflicted the T470s WQHD review unit. However, unlike in that situation, the CPU in our FHD review unit did exceed 3.0 GHz under synthetic stress—we witnessed it at 3.2 to 3.4 GHz during CPU stress alone, though it did drop to between 2.5 and 2.6 GHz with combined GPU stress. In the latter scenario, the GPU posted a solid 1 GHz clock rate, though when stressed independently of the CPU it held closer to 1050—1100 MHz. In all scenarios, temperatures were consistently 75 °C. To check whether this throttling affects real-world performance, we performed a secondary run of 3DMark 06 immediately following full system stress; the result was virtually unchanged, confirming that the system quickly returns to normal in such situations.
| CPU Clock (GHz) | GPU Clock (MHz) | Average CPU Temperature (°C) | Average GPU Temperature (°C) | |
| Prime95 Stress | 3.2 - 3.4 | - | 75 | - |
| FurMark Stress | - | 1050 - 1100 | - | 75 |
| Prime95 + FurMark Stress | 2.5 - 2.6 | 1000 | 75 | 75 |
Emissions
System Noise
Like many business notebooks, the T470s is essentially silent while idle or during light workloads. But even during heavier operation, the machine rarely becomes obtrusive. We measured a median noise level of 34.8 dB(A), which is a bit lower than the WQHD/Core i7-equipped version of the machine. Apart from the reading we received during max load—42 dB(A)—it’s right in line with all of the other notebooks in our comparison field… which is to say, it’s relatively quiet.
Noise level
| Idle |
| 27.8 / 27.8 / 27.8 dB(A) |
| Load |
| 34.8 / 42 dB(A) |
 | ||
30 dB silent 40 dB(A) audible 50 dB(A) loud |
||
min: | ||
| Lenovo ThinkPad T470s-20HF0012US HD Graphics 620, i5-7300U, Samsung PM961 MZVLW256HEHP | Lenovo ThinkPad T470s-20HGS00V00 HD Graphics 620, i7-7600U, Samsung SSD PM961 1TB M.2 PCIe 3.0 x4 NVMe (MZVLW1T0) | Dell Latitude 7480 HD Graphics 620, i7-7600U, Intel SSDSCKKF256H6 | Lenovo ThinkPad T470-20HD002HGE HD Graphics 620, i5-7200U, Samsung PM961 NVMe MZVLW512HMJP | Lenovo ThinkPad X1 Carbon 2017-20HQS03P00 HD Graphics 620, i7-7500U, Samsung PM961 NVMe MZVLW512HMJP | |
|---|---|---|---|---|---|
| Noise | -4% | 6% | 3% | -4% | |
| off / environment * (dB) | 27.8 | 28.9 -4% | 28 -1% | 29.3 -5% | |
| Idle Minimum * (dB) | 27.8 | 28.9 -4% | 28.6 -3% | 28 -1% | 29.3 -5% |
| Idle Average * (dB) | 27.8 | 28.9 -4% | 28.6 -3% | 28 -1% | 29.3 -5% |
| Idle Maximum * (dB) | 27.8 | 30.1 -8% | 28.6 -3% | 29.4 -6% | 32.2 -16% |
| Load Average * (dB) | 34.8 | 39.2 -13% | 30.2 13% | 31.4 10% | 34.3 1% |
| Witcher 3 ultra * (dB) | 42 | ||||
| Load Maximum * (dB) | 42 | 39.2 7% | 31.2 26% | 34.6 18% | 39.3 6% |
* ... smaller is better
Temperature
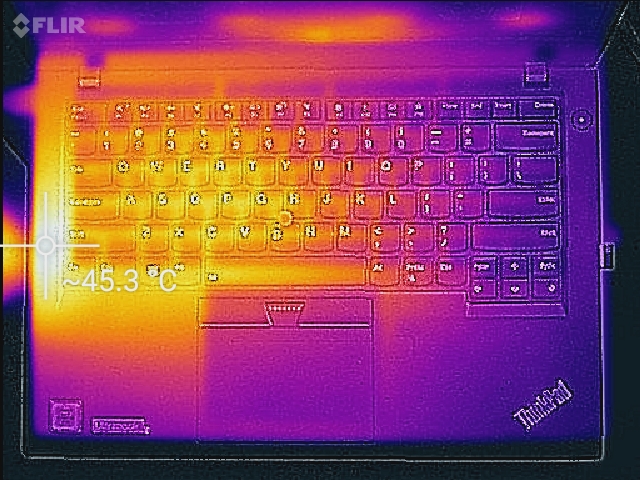
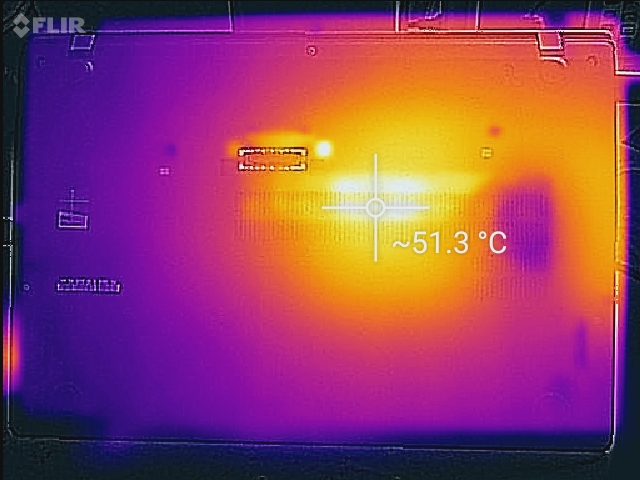
Similar to its noise profile, the T470s FHD isn’t much warmer than room temperature while idling (24 °C / 24.9 °C on top/bottom versus 21 °C room temperature). Under synthetic stress, the machine’s temperatures rise considerably (and rather quickly) to 34.2 °C / 37.1 °C with notable hot spots in the center-left and center quadrants on top/bottom, respectively. Also worth mentioning is that the left side of the machine (the “right” side when flipped) posts temperatures that are some 10 °C above those on the opposite side, so heavier use while on the lap is not exactly comfortable. The same is true of the top of the base unit, where most of the heat is concentrated in the keyboard.
(-) The maximum temperature on the upper side is 45.4 °C / 114 F, compared to the average of 34.3 °C / 94 F, ranging from 21.2 to 62.5 °C for the class Office.
(-) The bottom heats up to a maximum of 51.2 °C / 124 F, compared to the average of 36.8 °C / 98 F
(+) In idle usage, the average temperature for the upper side is 24 °C / 75 F, compared to the device average of 29.5 °C / 85 F.
(+) The palmrests and touchpad are reaching skin temperature as a maximum (33.8 °C / 92.8 F) and are therefore not hot.
(-) The average temperature of the palmrest area of similar devices was 27.5 °C / 81.5 F (-6.3 °C / -11.3 F).
Speakers

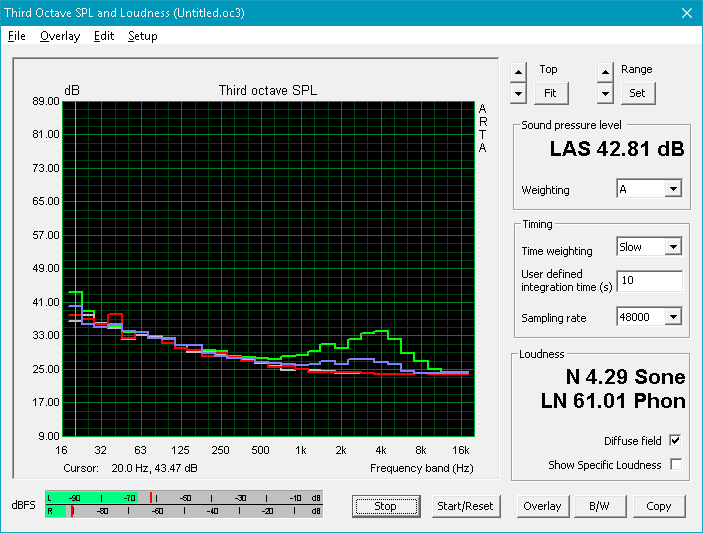
We measured a maximum volume of 72 dB(A) from the two down-firing stereo speakers, which isn’t particularly loud. However, the sound is relatively balanced overall apart from the lack of bass.
Lenovo ThinkPad T470s-20HF0012US audio analysis
(±) | speaker loudness is average but good (72 dB)
Bass 100 - 315 Hz
(-) | nearly no bass - on average 15.3% lower than median
(±) | linearity of bass is average (14.1% delta to prev. frequency)
Mids 400 - 2000 Hz
(+) | balanced mids - only 3.2% away from median
(±) | linearity of mids is average (11% delta to prev. frequency)
Highs 2 - 16 kHz
(+) | balanced highs - only 4.4% away from median
(±) | linearity of highs is average (12.5% delta to prev. frequency)
Overall 100 - 16.000 Hz
(±) | linearity of overall sound is average (24.8% difference to median)
Compared to same class
» 73% of all tested devices in this class were better, 7% similar, 20% worse
» The best had a delta of 7%, average was 21%, worst was 53%
Compared to all devices tested
» 76% of all tested devices were better, 5% similar, 19% worse
» The best had a delta of 4%, average was 24%, worst was 134%
Dell Latitude 7480 audio analysis
(±) | speaker loudness is average but good (75 dB)
Bass 100 - 315 Hz
(±) | reduced bass - on average 11.9% lower than median
(±) | linearity of bass is average (10.6% delta to prev. frequency)
Mids 400 - 2000 Hz
(+) | balanced mids - only 3.8% away from median
(±) | linearity of mids is average (7.8% delta to prev. frequency)
Highs 2 - 16 kHz
(±) | higher highs - on average 6.6% higher than median
(+) | highs are linear (6.3% delta to prev. frequency)
Overall 100 - 16.000 Hz
(±) | linearity of overall sound is average (23.2% difference to median)
Compared to same class
» 65% of all tested devices in this class were better, 8% similar, 27% worse
» The best had a delta of 7%, average was 21%, worst was 53%
Compared to all devices tested
» 69% of all tested devices were better, 5% similar, 25% worse
» The best had a delta of 4%, average was 24%, worst was 134%
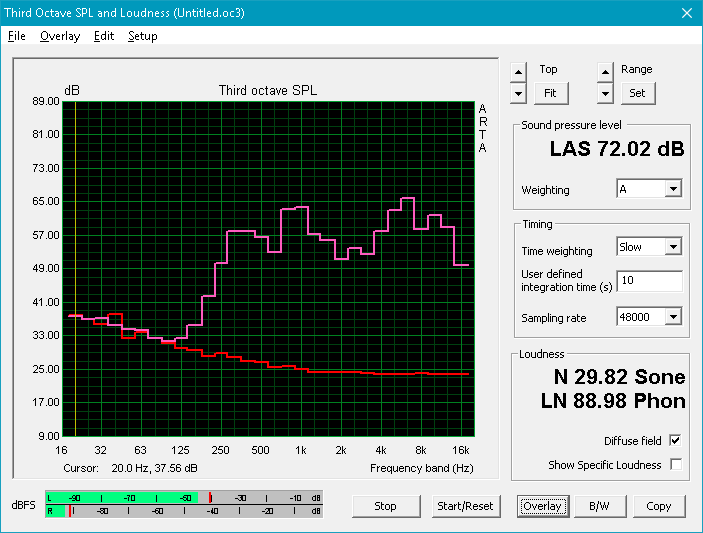
Frequency Comparison (Checkbox selectable!)
Graph 1: Pink Noise 100% Vol.; Graph 2: Audio off
Energy Management
Power Consumption
The FHD T470s configuration averages a few watts lower overall than its WQHD cousin, with an average of 6.6 W while idle and 39.2 W under load. We measured as high as 44.8 W at the extreme (as compared to 47.3 W on the WQHD unit). The load values are considerably higher than those of the T470 and Dell Latitude 7480, but idle readings were right in line.
| Off / Standby | |
| Idle | |
| Load |
|
Key:
min: | |
| Lenovo ThinkPad T470s-20HF0012US i5-7300U, HD Graphics 620, Samsung PM961 MZVLW256HEHP, IPS, 1920x1080, 14" | Lenovo ThinkPad T470s-20HGS00V00 i7-7600U, HD Graphics 620, Samsung SSD PM961 1TB M.2 PCIe 3.0 x4 NVMe (MZVLW1T0), IPS, 2560x1440, 14" | Dell Latitude 7480 i7-7600U, HD Graphics 620, Intel SSDSCKKF256H6, IPS, 1920x1080, 14" | Lenovo ThinkPad T470-20HD002HGE i5-7200U, HD Graphics 620, Samsung PM961 NVMe MZVLW512HMJP, IPS, 1920x1080, 14" | Lenovo ThinkPad X1 Carbon 2017-20HQS03P00 i7-7500U, HD Graphics 620, Samsung PM961 NVMe MZVLW512HMJP, IPS, 1920x1080, 14" | |
|---|---|---|---|---|---|
| Power Consumption | -15% | 16% | 19% | -3% | |
| Idle Minimum * (Watt) | 4.8 | 4.64 3% | 4.32 10% | 3.21 33% | 3.84 20% |
| Idle Average * (Watt) | 6.6 | 8.93 -35% | 6.27 5% | 6.15 7% | 6.3 5% |
| Idle Maximum * (Watt) | 7 | 9.12 -30% | 6.35 9% | 6.82 3% | 8.6 -23% |
| Load Average * (Watt) | 39.2 | 42.2 -8% | 29.82 24% | 28.5 27% | 41.9 -7% |
| Load Maximum * (Watt) | 44.8 | 47.3 -6% | 30.64 32% | 34.5 23% | 48.7 -9% |
* ... smaller is better
Battery Life
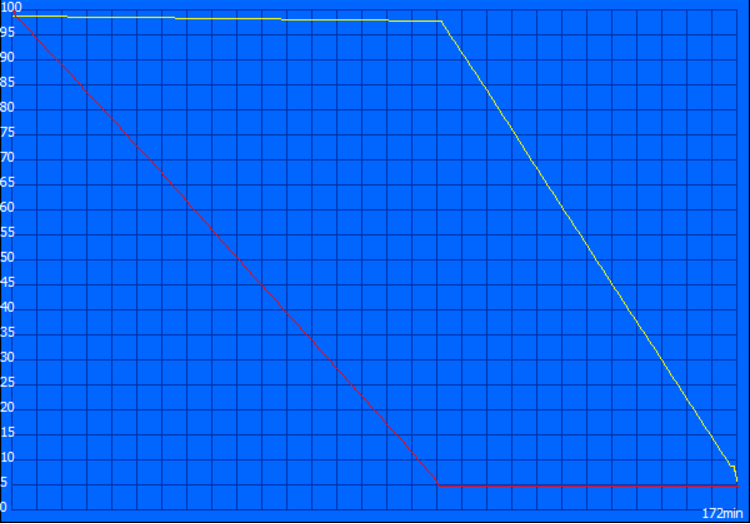
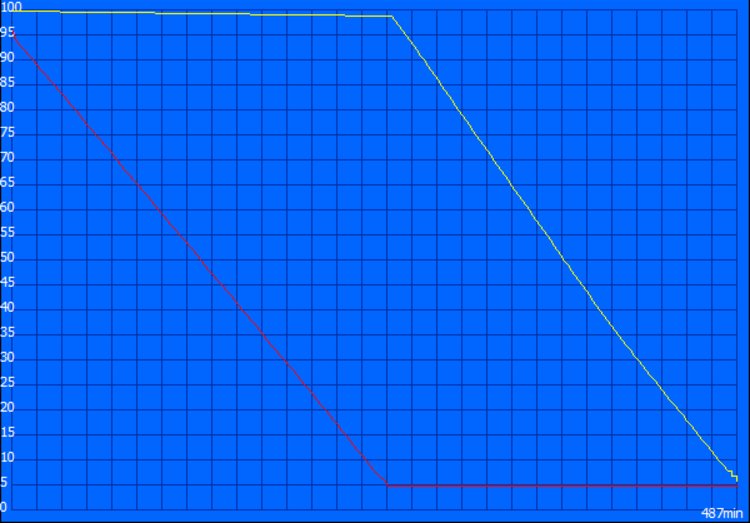
The ThinkPad T470s FHD managed 8 hours and 7 minutes in our Wi-Fi Surfing benchmark, some 14 percent higher than the i7/WQHD-equipped model (417 minutes). This is a very good result overall, and it should translate to all-day battery life for most business professionals. Only the Dell Latitude 7480 posts a notably higher result (nearly 12 hours, which is borderline nuts), thanks in part to its large 60 Wh battery.
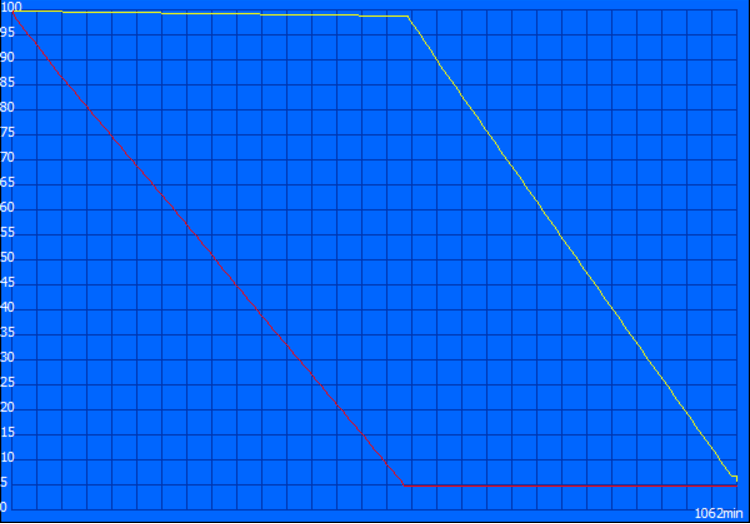
Our Battery Eater Readers and Classic tests also produced good results (17:42 / 2:52, respectively)—both of which were, again, quite a bit longer runtimes than those of the WQHD configuration. If battery life is of paramount importance, the FHD model looks like a winner.
| Lenovo ThinkPad T470s-20HF0012US i5-7300U, HD Graphics 620, 51 Wh | Lenovo ThinkPad T470s-20HGS00V00 i7-7600U, HD Graphics 620, 51 Wh | Dell Latitude 7480 i7-7600U, HD Graphics 620, 60 Wh | Lenovo ThinkPad T470-20HD002HGE i5-7200U, HD Graphics 620, 48 Wh | Lenovo ThinkPad X1 Carbon 2017-20HQS03P00 i7-7500U, HD Graphics 620, 57 Wh | |
|---|---|---|---|---|---|
| Battery runtime | -28% | 35% | -24% | -6% | |
| Reader / Idle (h) | 17.7 | 13.1 -26% | 27.7 56% | 20.9 18% | |
| WiFi v1.3 (h) | 8.1 | 7 -14% | 12 48% | 7.3 -10% | 8.3 2% |
| Load (h) | 2.9 | 1.6 -45% | 2.9 0% | 1.8 -38% | 1.8 -38% |
Pros
Cons
Verdict
With a featherweight build that’s equal parts portable and durable (thanks to high-end magnesium and carbon fiber hybrid construction), terrific battery life, and excellent input devices for which the ThinkPad brand has long been known, the Lenovo ThinkPad T470s FHD already ought to have the attention of business professionals looking for their next daily driver. But pile onto that the blazing application performance (made possible by a very fast Samsung NVMe SSD), solid CPU performance from the Core i5 chip, and easy maintenance, and this is a difficult device to turn down.
Negatives? Yes, there are a few. For starters, the screen isn’t nearly as impressive as that of many competitors, and a considerable step down from the WQHD model not only in terms of resolution but also brightness, contrast, and color reproduction. We detected PWM at all brightness levels except maximum, which is a disappointment for a ThinkPad. And finally, the device does heat up very quickly, soon reaching bothersome case temperatures (under load), especially while in use on the lap.
Apart from the unfortunate PWM flicker, pedestrian display quality, and a bit of unwelcomed heat during heavier workloads, the Lenovo ThinkPad T470s FHD is an excellent choice.
If the user doesn’t mind a slightly lower (but still very good) battery runtime and a higher price, we’d strongly recommend taking a look at the T470s WQHD model we recently reviewed, as its display not only features better brightness and color but also does not resort to PWM to manage brightness reductions. However, the Core i5 CPU we reviewed in today’s configuration seems like a more rational investment considering the excellent performance and relative stability versus the i7 of the WQHD configuration we evaluated. The Dell Latitude 7480 is also a terrific choice—or, if budget permits, the ThinkPad X1 Carbon. But apart from the display issues, provided the user doesn’t mind a bit of heat during heavier workloads, the T470s FHD is an immediate contender for one of the best 14-inch business notebooks on the market today.
Lenovo ThinkPad T470s-20HF0012US
- 05/13/2017 v6 (old)
Steve Schardein
Price comparison
