Lenovo ThinkPad 13 (Core i3-7100U, Full HD) Laptop Review
Introduced last year, Lenovo's ThinkPad 13 brought features commonly found in the venerable ThinkPad line without the typically restrictive ThinkPad pricing. While the notebook makes some compromises (like the lack of a keyboard backlight), it offers an excellent package at an affordable price. Just like its other lines, Lenovo has brought the latest and greatest from Intel to the ThinkPad 13. The 7th generation Kaby Lake CPUs are available in several flavors, although choice is limited to the low-voltage "U" class reserved for ultrabooks.
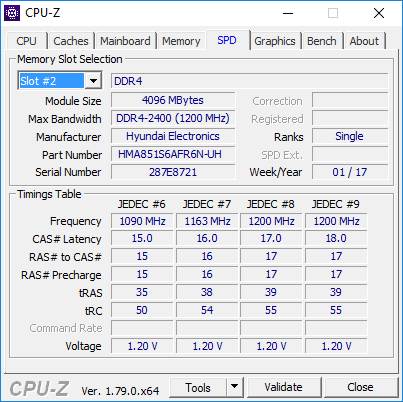
Our review model is a base-level model. It sports an Intel Core i3-7100U, Intel HD Graphics 620, 4 GB of DDR4 RAM, and a 128 GB M.2 SATA SSD. Aside from the internal components, nothing has changed from last year's model. The excellent keyboard (still sans backlighting), ample port selection, and lightweight MIL-STD-810G rated chassis remain the same. As such, we will forego detailed looks at the case, maintenance, and input devices. Further detail on these parts of the notebook experience can be found in our 2016 ThinkPad 13 (Core i5-6200U) review.
This review will be primarily concerned with the performance changes brought by Kaby Lake. We will compare the previous ThinkPad 13 model (though it sports a more powerful Core i5-6200U CPU) as well as two business notebooks equipped with the last generation's Skylake Core i3-6100U, the Lenovo ThinkPad E560 and Dell Latitude 14 3470.
Despite its entry-level configuration, our ThinkPad 13 is still relatively pricey at USD $1069. Both the E560 and Dell are available with similar specs for almost half the cost (~$600 and ~$550, respectively). The older ThinkPad 13 can be found at retailers for a lower price as well. Also, keep in mind that Lenovo frequently has sales on their site; the newest ThinkPad 13 models could be purchased at a discount if timed correctly.
SD Card Reader
The SD Card Reader is slightly improved from last year's model, hitting 11% transfer speeds using out Toshiba Exceria Pro SDXC 64 GB UHS-II reference card. Speeds are still disappointing, reaching only 28 MB/s in our JPG copy test and ~33 MB/s in our AS SSD read test. These speeds are sufficient for small file transfers but will present an annoying bottleneck when transferring large sets of photos or documents via SD card. Users should opt for the USB ports when transferring files instead.
| SD Card Reader | |
| average JPG Copy Test (av. of 3 runs) | |
| Lenovo ThinkPad E560 20EV000MGE | |
| Lenovo Thinkpad 13-20J1001BUS | |
| Lenovo ThinkPad 13-20GKS01100 | |
| Dell Latitude 14 3470 | |
| maximum AS SSD Seq Read Test (1GB) | |
| Lenovo Thinkpad 13-20J1001BUS | |
| Lenovo ThinkPad 13-20GKS01100 | |
| Dell Latitude 14 3470 | |
Communication
WiFi speeds are impressive thanks to the updated Intel 8265 Dual-Band WiFi module. This module appeared in an earlier review of the Thinkpad 13 with the Core i7-7500U, and we see similar speeds in our Core i3 model. Transmit speeds of 517 Mb/s and receiving speeds of 658 Mb/s are more than enough for casual and business use. These speeds are nice to see, as the lack of a dedicated LAN port may be restrictive in some business settings. Connections to our home router were solid with no interruptions.
| Networking | |
| iperf3 transmit AX12 | |
| Lenovo Thinkpad 13-20J1001BUS | |
| Lenovo ThinkPad 13-20J2S00G00 | |
| iperf3 receive AX12 | |
| Lenovo Thinkpad 13-20J1001BUS | |
| Lenovo ThinkPad 13-20J2S00G00 | |
Security (business devices)
Our updated Thinkpad 13 retains the security features from last year's model (TPM, self-encrypting SSD). The inclusion of a fingerprint sensor is a nice addition. While it uses the dated "swipe" design, it is fast and accurate. The reader registers our fingerprint every time and ties in with Windows Hello for easy logins.
The USB Type-C port on our device is also equipped with Lenovo's "Anti-Fry Protection" technology. While the USB-C port is listed as able to charge the device, electrical damage could be possible if a poorly made USB Type-C cable is used. Anti-Fry Protection is engineered to prevent incorrect voltages from being sent through the port. No word on if this protects against the many iterations of "USB Killer" devices that have recently surfaced online. We did not get the opportunity to test the Anti-Fry technology during our review time.
Input Devices
Keyboard, Touchpad, and Trackpoint
The keyboard, touchpad, and TrackPoint unchanged. While the keyboard has that venerable ThinkPad quality, the lack of backlighting persists and hurts the overall experience. Lenovo does offer a blacklight option for an additional $40 through their online store.
For further details on these input devices, be sure to check our 2016 ThinkPad 13 (Core i5-6200U, Full HD) review here.
Touchscreen
With the update to modern internals comes a modern interface: the ThinkPad 13 now features a touchscreen on the Full HD models. Touch input is accurate and quick, and the matte finish on the display keeps fingerprints at bay. While the addition of third pointer input alongside the excellent touchpad and TrackPoint may be overkill, but the touchscreen doesn't detract from the overall experience. It's nice to have the option of touch input, but users may or may not find it useful.
Display
Like last year, the Thinkpad 13 can be purchased with either a 1366x768 TN or 1920x1080 IPS display panel. Both have a matte finish and are rated at 250 nits of brightness. That rating is fairly accurate; our FHD model hit an average of 249.6 cd/m2 across the display. This is a bit brighter than the previous ThinkPad 13 (~227 cd/m2). PWM is not present when the screen's brightness is lowered, and the display gets dim enough for comfortable use in dark environments.
The panel is largely unchanged from last year's. The updated display is slightly brighter and has marginal improvements in color accuracy and color space, but for the most part, the viewing experience is similar. Compared to the cheaper and lower-resolution TN panels in the competing ThinkPad E560 and Latitude 14 3470, the ThinkPad 13 panel offers much greater color accuracy, better viewing angles, and a significantly higher contrast ratio. The Dell and Lenovo rivals also offer slower response times, which is odd. The main benefit of a TN display is its quicker response times, but the E560 and Dell 3470 have notably slower Grey 50% / Grey 80% response times. Black / White response is much quicker in the less expensive models, however.
| |||||||||||||||||||||||||
Brightness Distribution: 88 %
Center on Battery: 266.4 cd/m²
Contrast: 859:1 (Black: 0.31 cd/m²)
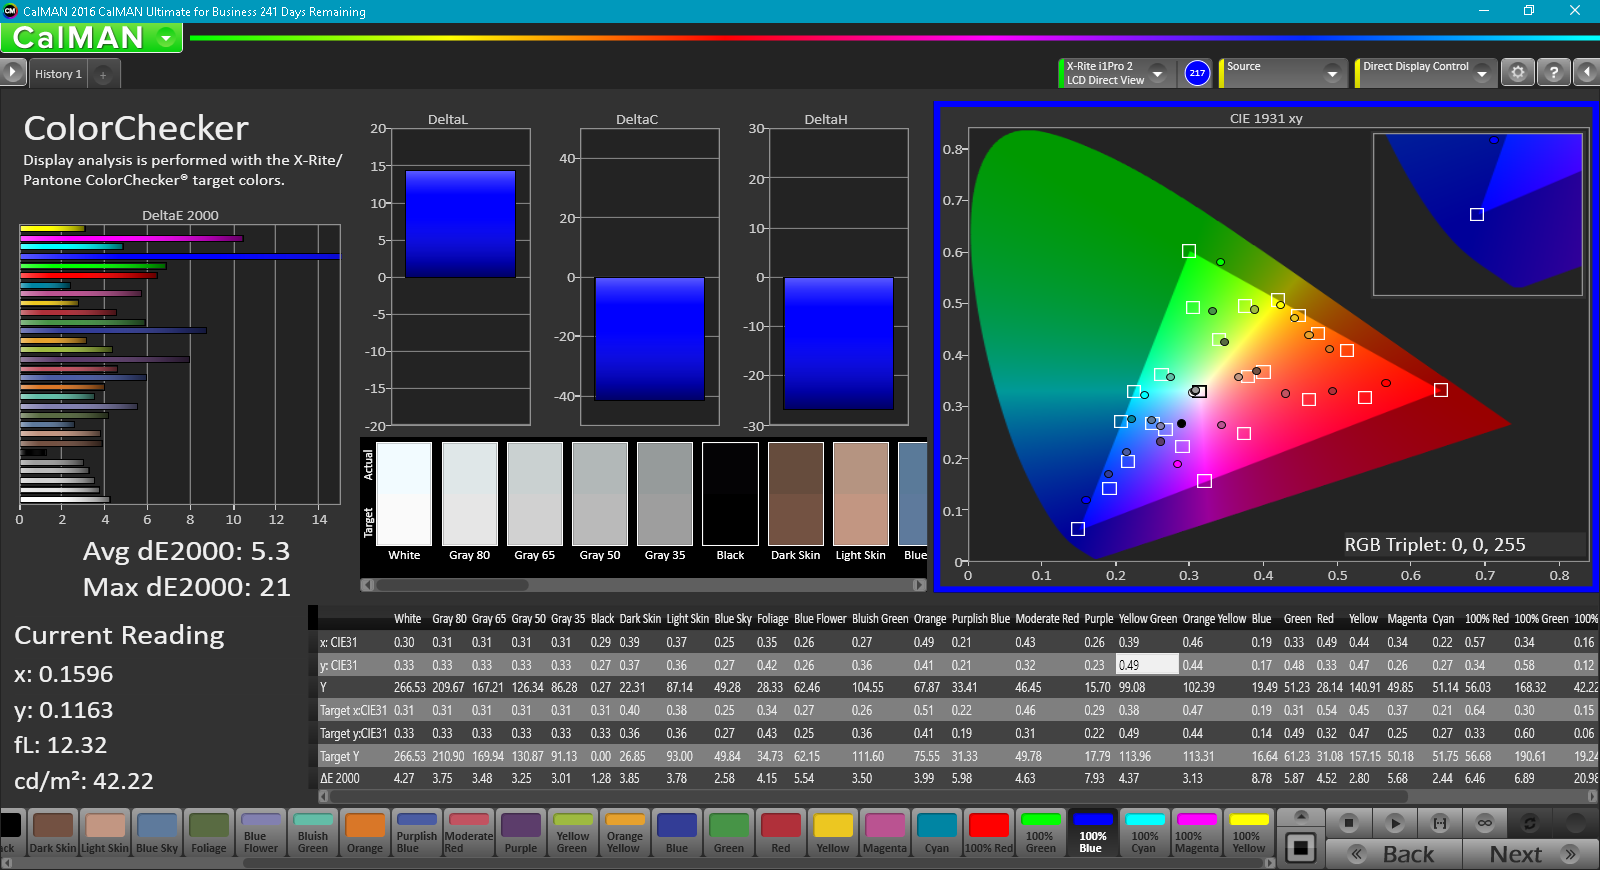
ΔE ColorChecker Calman: 5.3 | ∀{0.5-29.43 Ø4.72}
ΔE Greyscale Calman: 3.3 | ∀{0.09-98 Ø4.97}
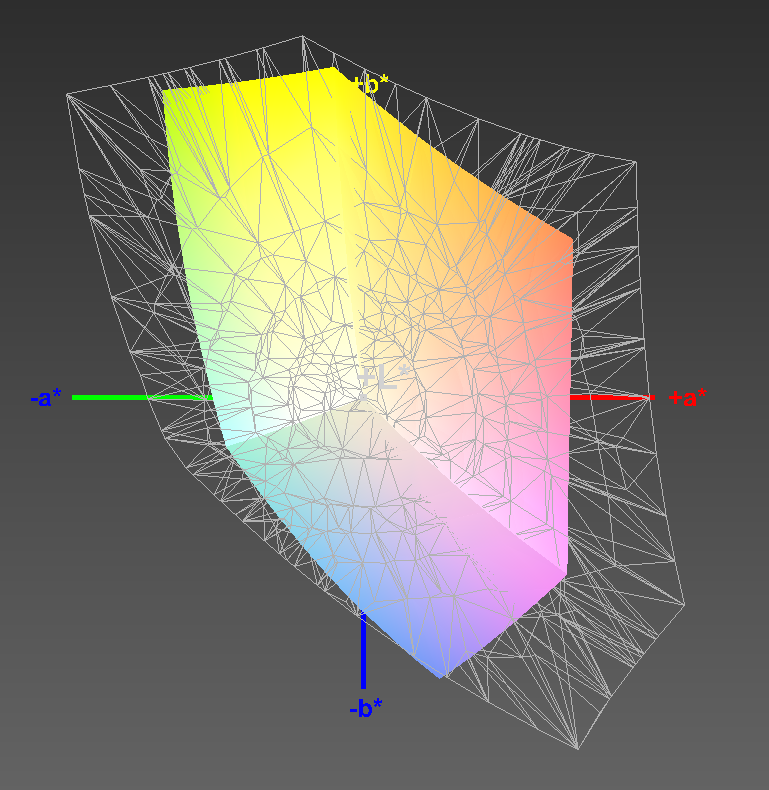
60% sRGB (Argyll 1.6.3 3D)
38% AdobeRGB 1998 (Argyll 1.6.3 3D)
41.92% AdobeRGB 1998 (Argyll 3D)
60.7% sRGB (Argyll 3D)
40.57% Display P3 (Argyll 3D)
Gamma: 2.36
CCT: 6843 K
| Lenovo Thinkpad 13-20J1001BUS Lenovo LEN4094, IPS, 13.3", 1920x1080 | Lenovo ThinkPad 13-20GKS01100 LP133WF2-SPL1, , 13.3", 1920x1080 | Lenovo ThinkPad E560 20EV000MGE Lenovo N156B6-L07, TN LED, 15.6", 1366x768 | Dell Latitude 14 3470 Innolux N140BGE, TN LED, 14", 1366x768 | |
|---|---|---|---|---|
| Display | -5% | -7% | -1% | |
| Display P3 Coverage (%) | 40.57 | 38.35 -5% | 37.63 -7% | 40.21 -1% |
| sRGB Coverage (%) | 60.7 | 57.4 -5% | 56.7 -7% | 60.5 0% |
| AdobeRGB 1998 Coverage (%) | 41.92 | 39.66 -5% | 38.88 -7% | 41.55 -1% |
| Response Times | -5% | -10% | -10% | |
| Response Time Grey 50% / Grey 80% * (ms) | 32.8 ? | 43.2 ? -32% | 50 ? -52% | 47 ? -43% |
| Response Time Black / White * (ms) | 34.4 ? | 26.8 ? 22% | 23 ? 33% | 26 ? 24% |
| PWM Frequency (Hz) | ||||
| Screen | 3% | -56% | -50% | |
| Brightness middle (cd/m²) | 266.4 | 233 -13% | 241 -10% | 206 -23% |
| Brightness (cd/m²) | 250 | 227 -9% | 226 -10% | 193 -23% |
| Brightness Distribution (%) | 88 | 86 -2% | 89 1% | 87 -1% |
| Black Level * (cd/m²) | 0.31 | 0.22 29% | 0.48 -55% | 0.48 -55% |
| Contrast (:1) | 859 | 1059 23% | 502 -42% | 429 -50% |
| Colorchecker dE 2000 * | 5.3 | 5.41 -2% | 12.43 -135% | 11 -108% |
| Colorchecker dE 2000 max. * | 21 | 13.61 35% | 21.03 -0% | 19.57 7% |
| Greyscale dE 2000 * | 3.3 | 4.15 -26% | 13.24 -301% | 11.51 -249% |
| Gamma | 2.36 93% | 2.45 90% | 2.61 84% | 2.23 99% |
| CCT | 6843 95% | 6773 96% | 15733 41% | 13671 48% |
| Color Space (Percent of AdobeRGB 1998) (%) | 38 | 36.52 -4% | 36 -5% | 38.46 1% |
| Color Space (Percent of sRGB) (%) | 60 | 57.16 -5% | 57 -5% | 60.61 1% |
| Total Average (Program / Settings) | -2% /
0% | -24% /
-40% | -20% /
-35% |
* ... smaller is better
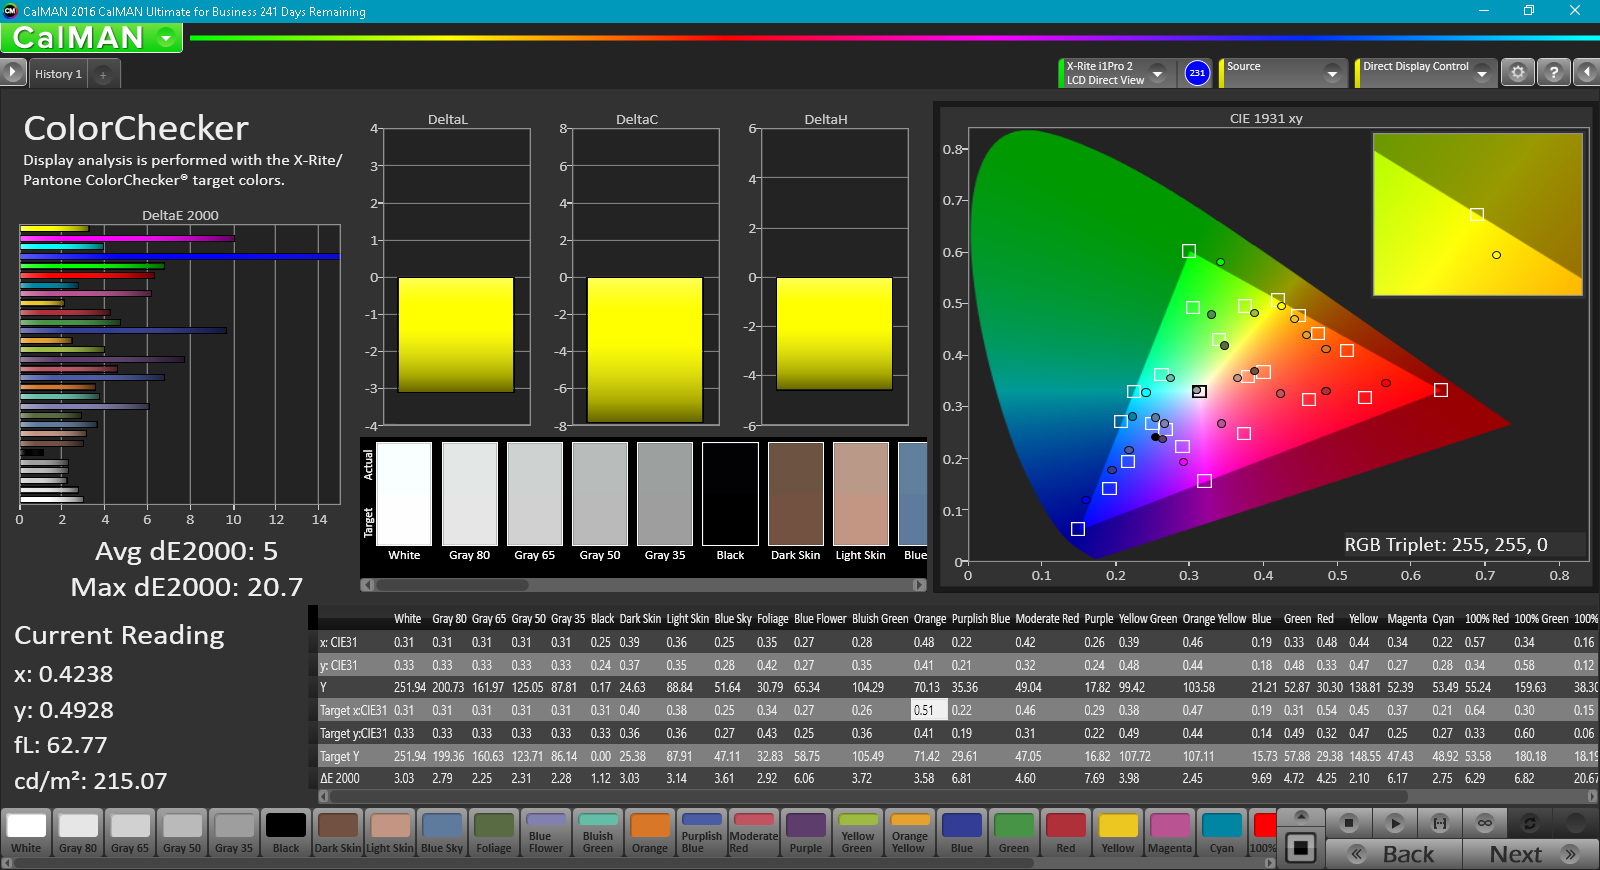
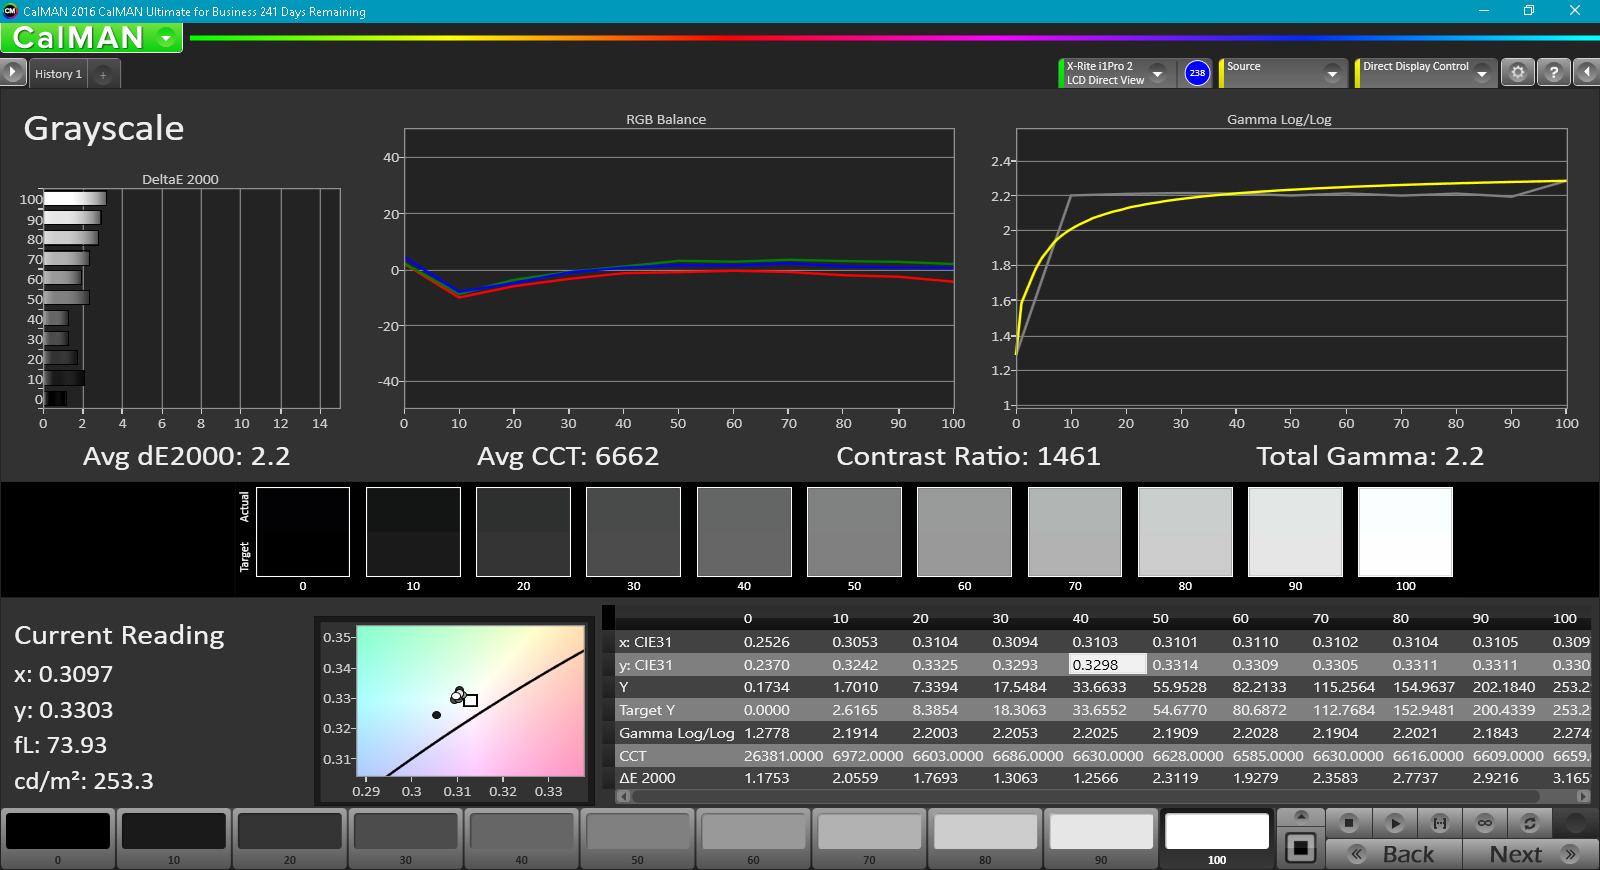
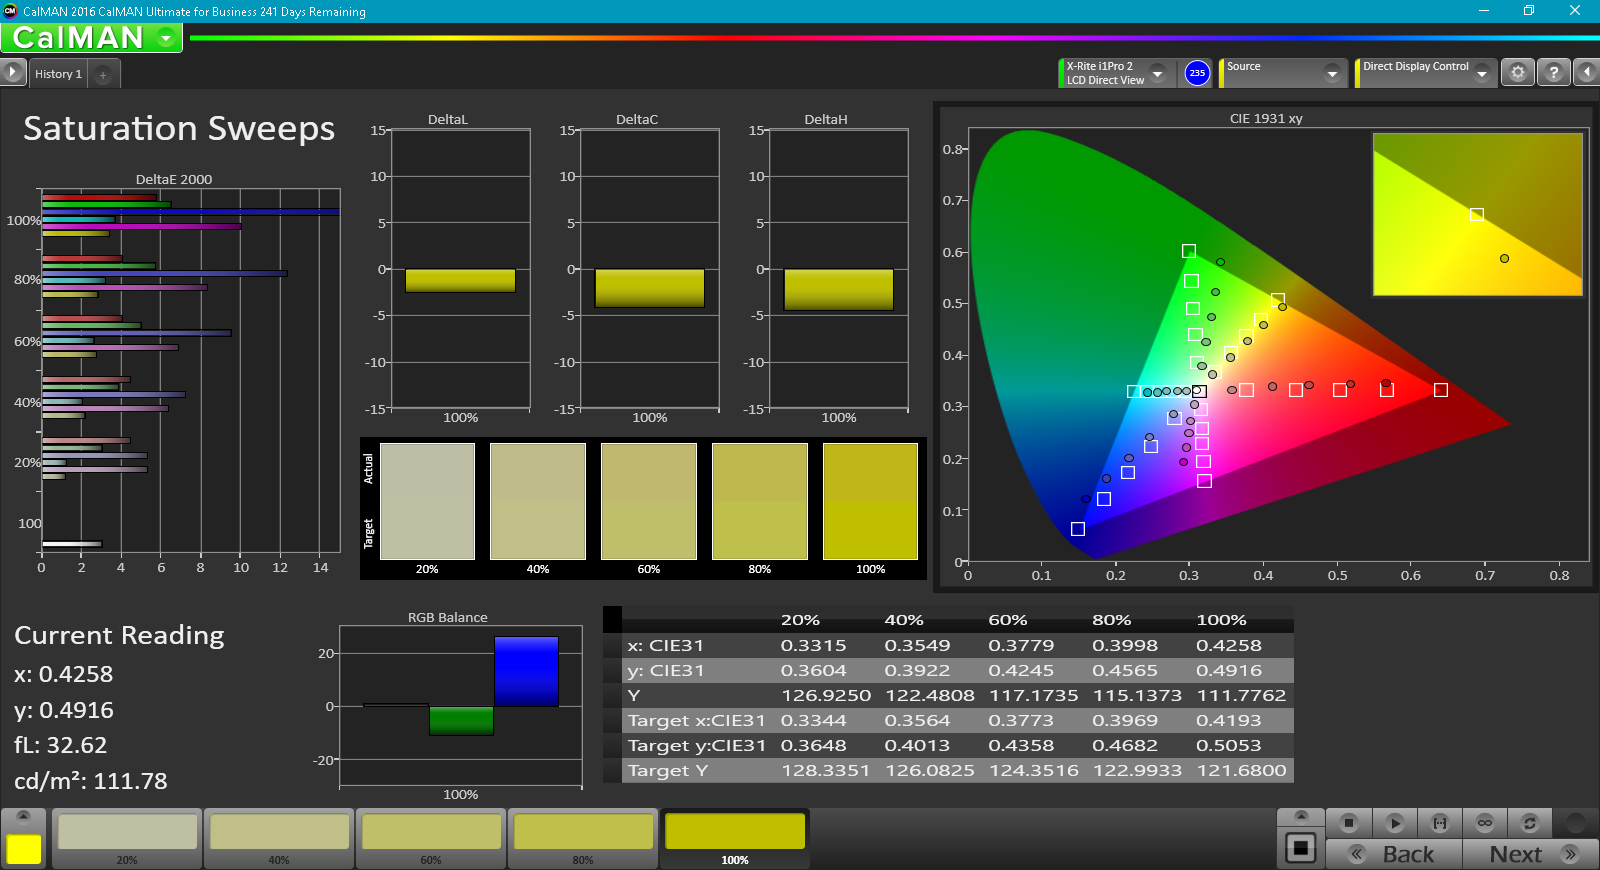
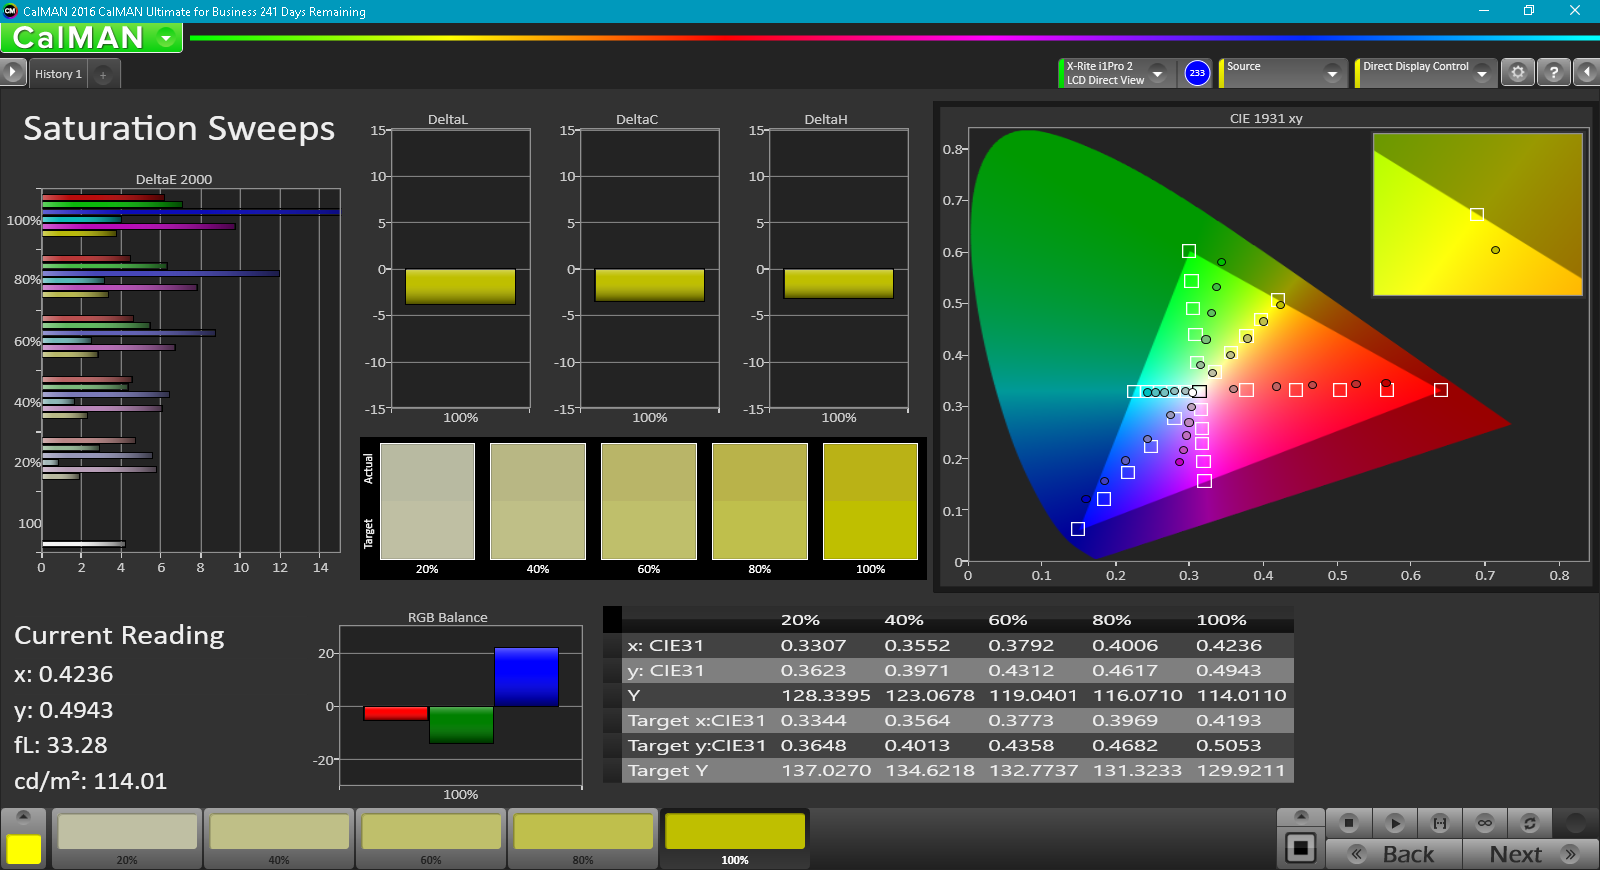
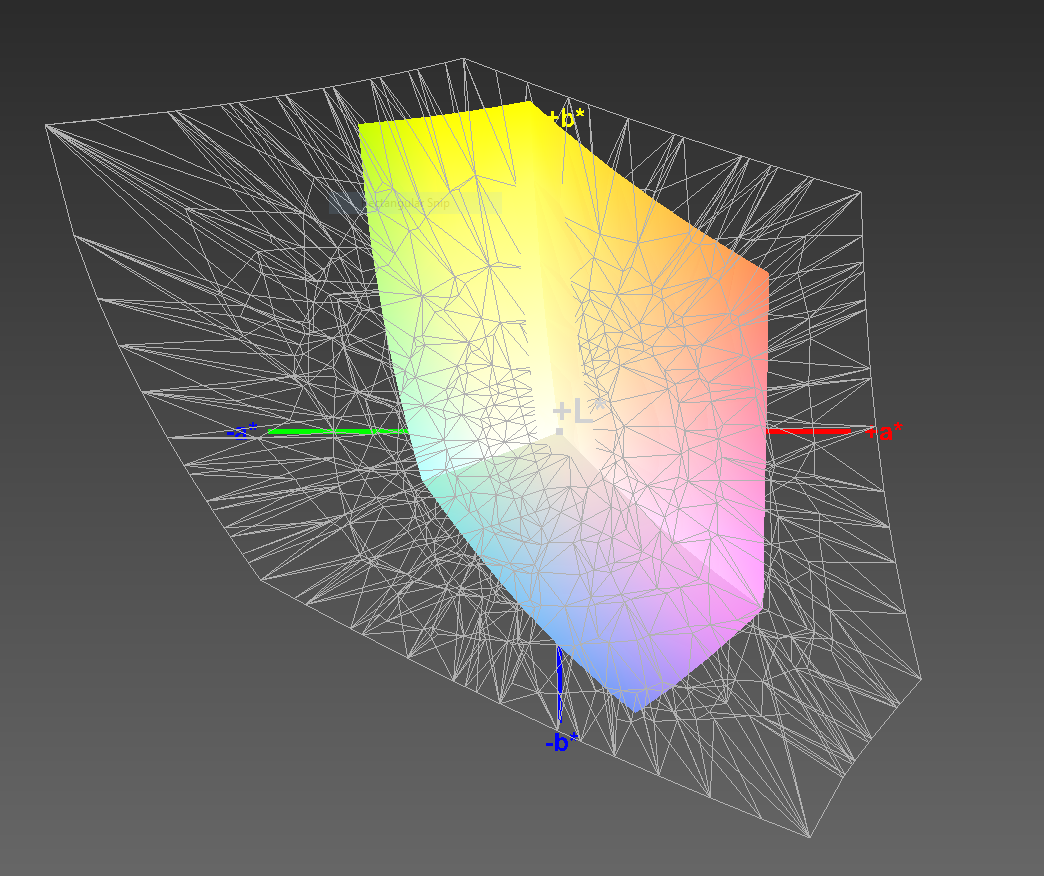
While the color gamut has widened in our updated ThinkPad 13, it's still not terribly impressive. 60% sRGB and 38% AdobeRGB coverage are usable for office and home use, but professionals that work with color should definitely look at other notebooks with better color options. Colors are fairly accurate; the Colorchecker delta and Greyscale delta are 5.3 and 3.3, respectively. Anything under 3 is generally considered accurate enough for professional use, so our ThinkPad 13 is again not suitable for professional use. Calibration brings these deltas down to 5 and 2.2, which is an improvement (though not enough to move the display into professional territory).

The matte finish on the display greatly reduces glare, and the updated panel is bright enough for outdoor use. Direct sunlight still presents a problem, so shade should be sought. Viewing angles are indiscernible from last year's model; the IPS panel can be easily viewed when off-center. For photos of viewing angles, check out the display section of our 2016 ThinkPad 13 review here.
In sum, the display experience is very similar to that of the previous ThinkPad 13. We recommend the Full HD IPS model to prospective buyers; though it is $120 more at checkout, the cost is well worth the improved brightness and viewing angles.
Display Response Times
| ↔ Response Time Black to White | ||
|---|---|---|
| 34.4 ms ... rise ↗ and fall ↘ combined | ↗ 21.2 ms rise | 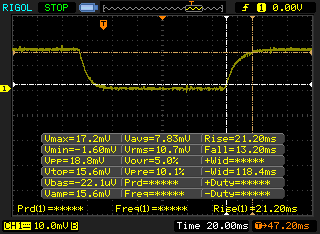 |
| ↘ 13.2 ms fall | ||
| The screen shows slow response rates in our tests and will be unsatisfactory for gamers. In comparison, all tested devices range from 0.1 (minimum) to 240 (maximum) ms. » 92 % of all devices are better. This means that the measured response time is worse than the average of all tested devices (19.8 ms). | ||
| ↔ Response Time 50% Grey to 80% Grey | ||
| 32.8 ms ... rise ↗ and fall ↘ combined | ↗ 18 ms rise | 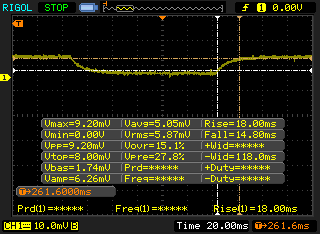 |
| ↘ 14.8 ms fall | ||
| The screen shows slow response rates in our tests and will be unsatisfactory for gamers. In comparison, all tested devices range from 0.165 (minimum) to 636 (maximum) ms. » 44 % of all devices are better. This means that the measured response time is similar to the average of all tested devices (31 ms). | ||
Screen Flickering / PWM (Pulse-Width Modulation)
| Screen flickering / PWM not detected | 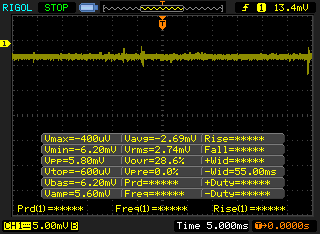 | ||
In comparison: 52 % of all tested devices do not use PWM to dim the display. If PWM was detected, an average of 7763 (minimum: 5 - maximum: 343500) Hz was measured. | |||
Performance
We now arrive at the meat of this review. The ThinkPad 13 has followed suit with its Lenovo brethren and is now available with the latest Intel Kaby Lake processors. SKUs are available with Intel Core i3-7100U, Core i5-7200U, and Core i5-7300U processors. A lower-priced and lower-powered Intel Celeron 3865U CPU is also available.
The three Core processors are low-voltage (ULV) dual-core CPUs with hyperthreading. The main difference is the presence of Intel's Turbo Boost in the Core i5 models. As such, the 7200U and 7300U can achieve much higher clocks on a single core under demanding loads. Otherwise, Kaby Lake brings marginal improvements over the previous generation Skylake processors, focusing instead on power and battery efficiency. In benchmarks and real world use, the Intel Core i5-6200U present in our 2016 ThinkPad 13 is very similar to the updated Core i5-7200U model. The 2016 ThinkPad 13 will give us a good idea of the performance differences between our 2017 Core i3 ThinkPad and the more powerful (and expensive) SKUs available.
Processor
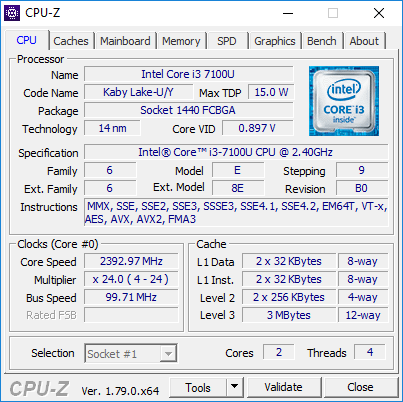
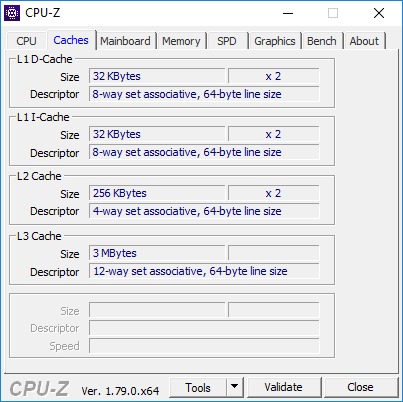
The Core i3-7100U (2.4 GHz, 3 MB Cache) is the latest low-tiered ULV processor from Intel based on the 14 nm Kaby Lake platform. Powered by two hyperthreaded cores, the 15 W processor is a capable CPU for business and home use. The low power draw of the CPU belies its potential; most casual users will find the 7100U to be more than adequate for office work, web browsing, and even moderately demanding computing tasks.
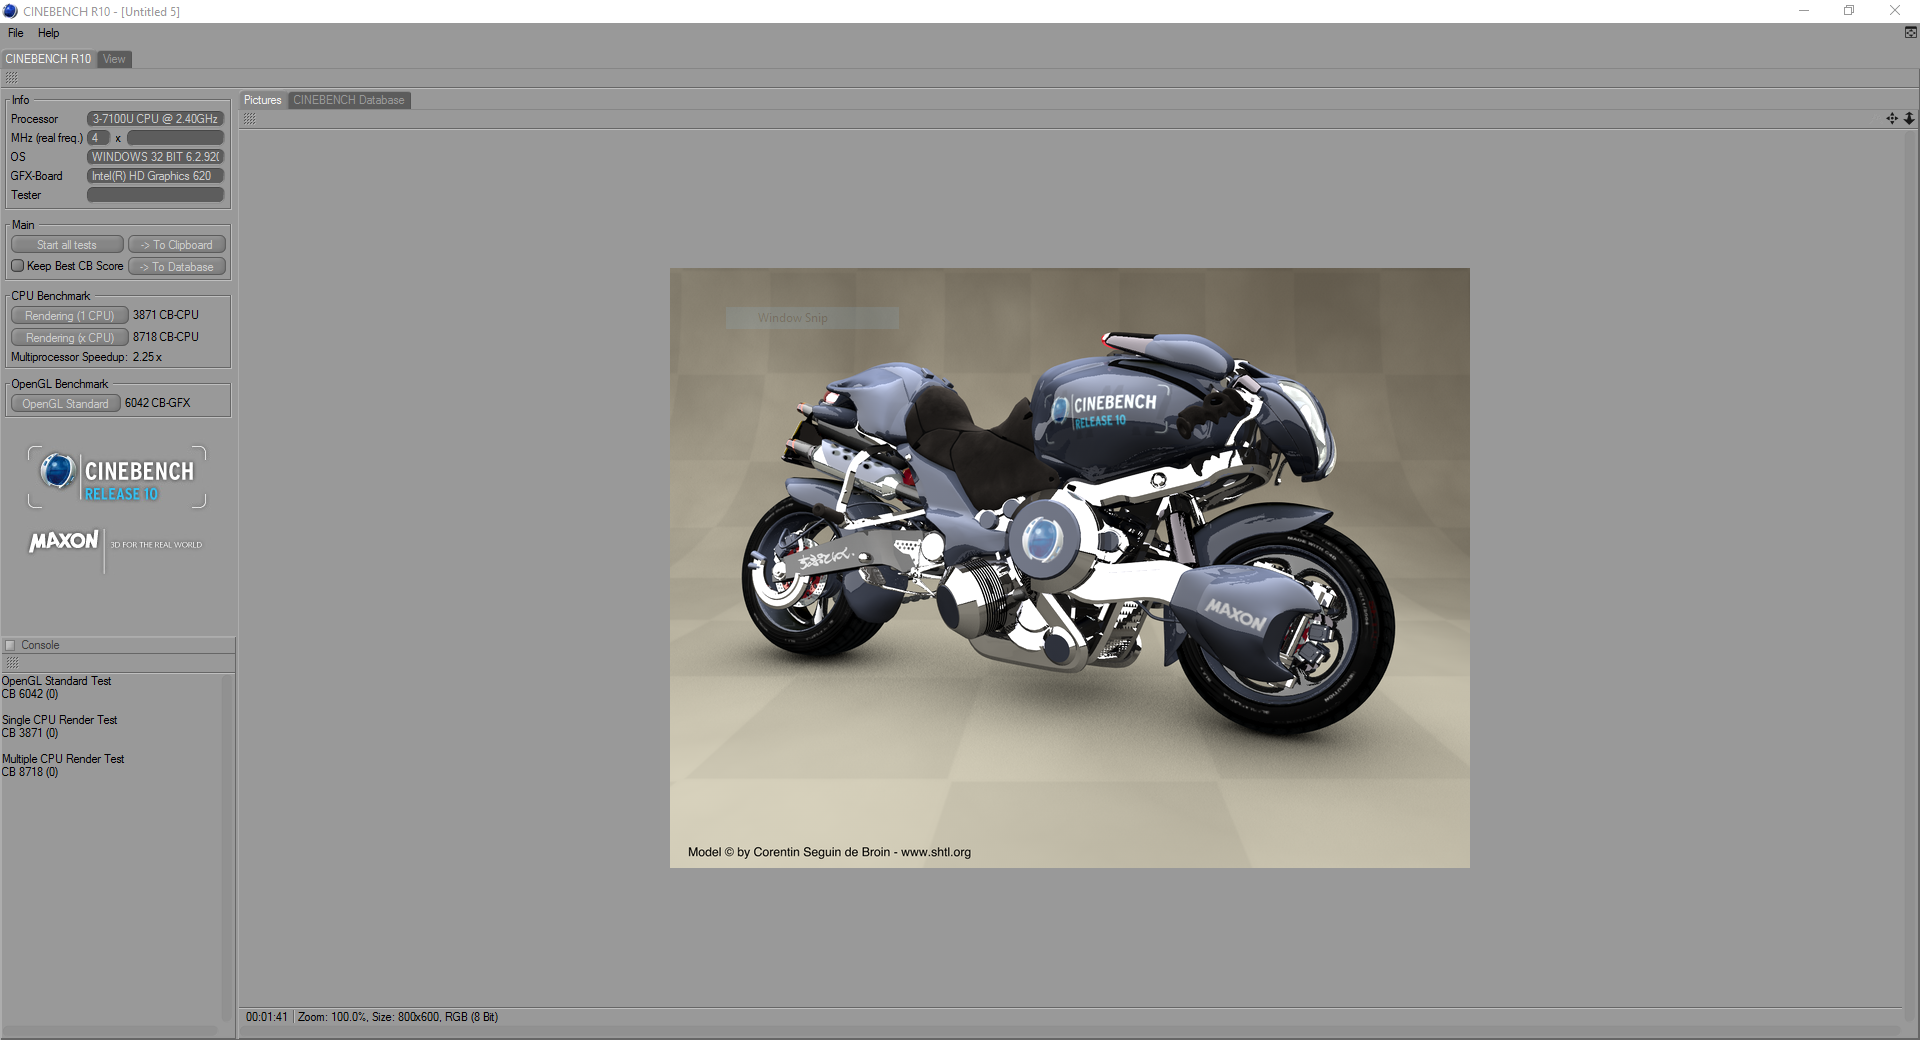
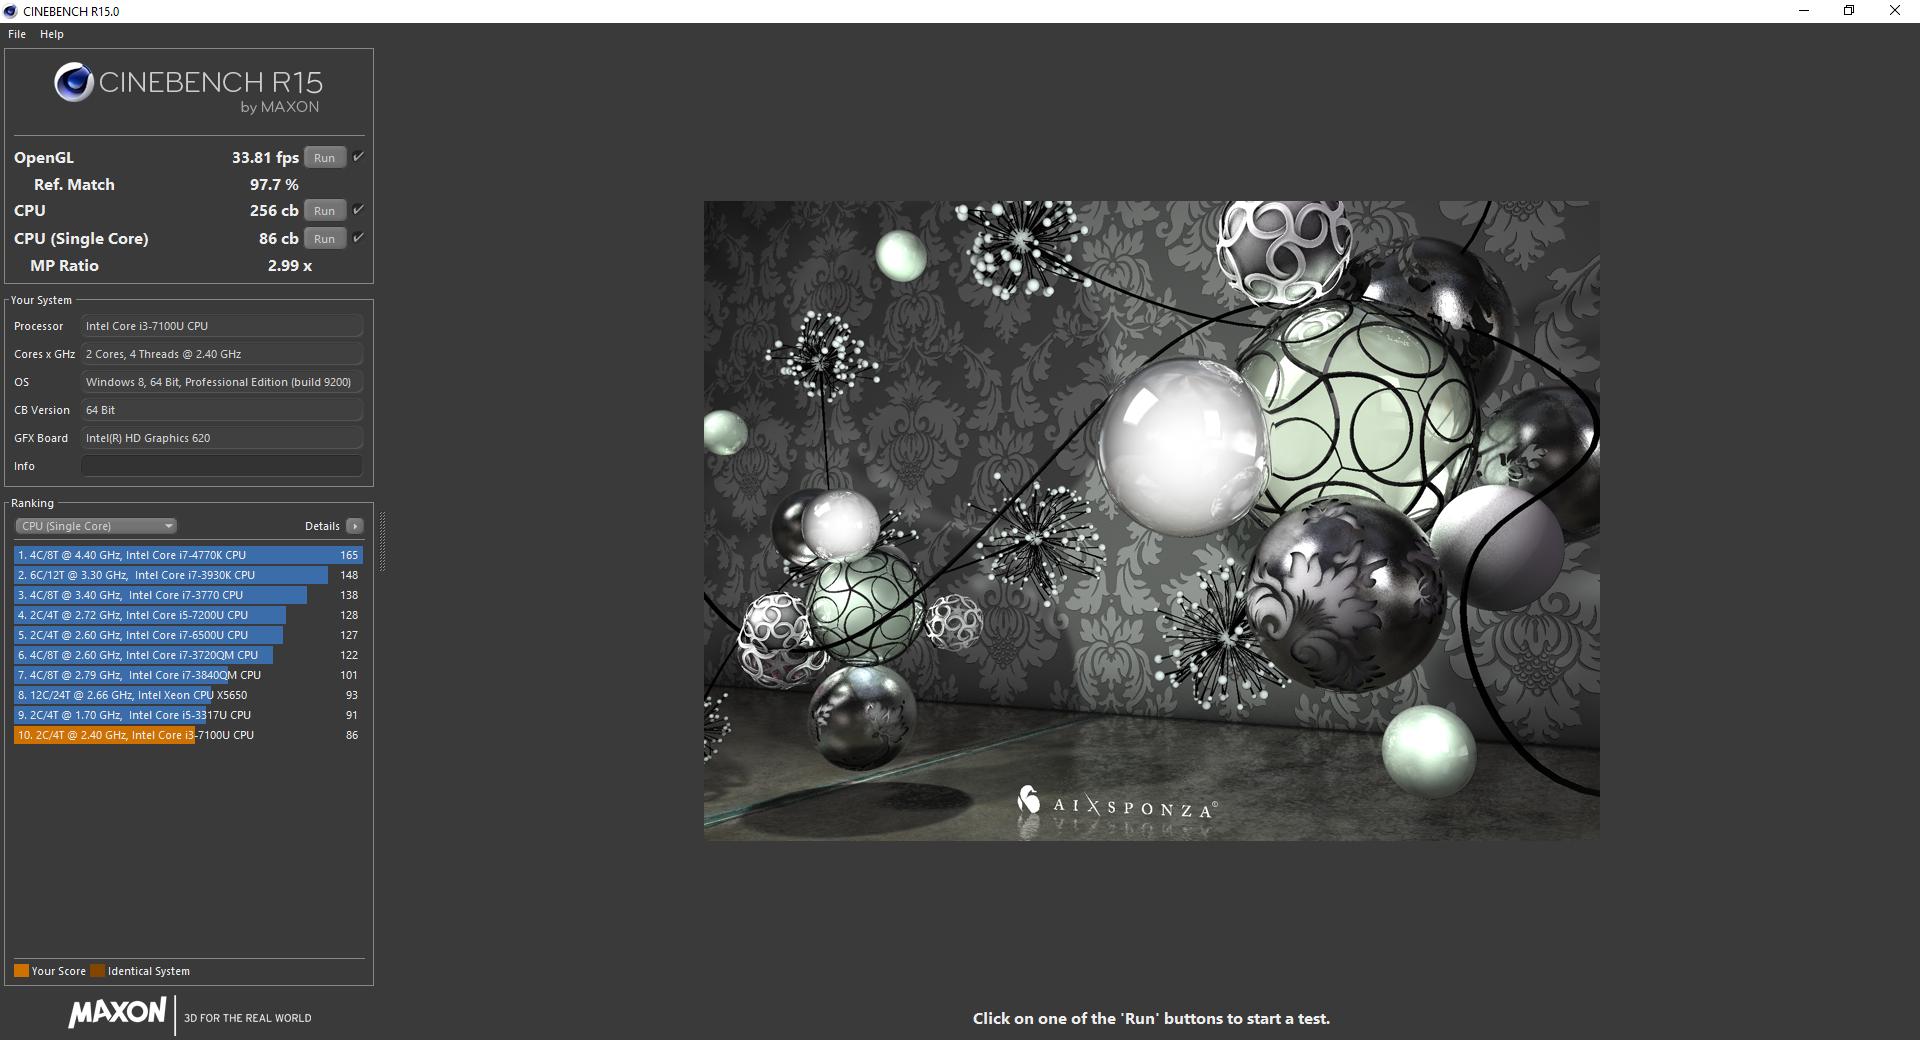
The Core i3-7100U doesn't offer any significant advantage over last year's Skylake Core i3-6100U; our Lenovo ThinkPad 13 kept pace with its rivals in Cinebench R15 and R11.5. Interestingly, while the Core i5-6200U in last year's ThinkPad 13 was 35% faster than our Core i3 model in single core performance, the gap closed to only 13% in the i5's favor in the multithreaded test. The single core disparity is likely due to the Core i5's inclusion of Turbo Boost, which can temporarily push clock speeds higher. The Core i3-7100U's lack of Turbo Boost may help with battery life and heat management, but the inability to push instructions out faster can hurt in heavy workloads. Those interested in upgrading to the i5-7200U model can see that similar notebooks, the Dell Latitude 5280 and Lenovo ThinkPad L470, bested our ThinkPad 13 by 30% in single core performance and 25-30% in multicore performance. The i5 may be a worthwhile option for power users.
On battery, the Lenovo ThinkPad operates at a similar capacity. There is no noticeable downgrade in processing power when the device is unplugged.

| Cinebench R15 | |
| CPU Single 64Bit | |
| Dell Latitude 5280 N014L528012QG45 | |
| Lenovo ThinkPad L470-20J5S00C00 | |
| Lenovo ThinkPad 13-20GKS01100 | |
| Lenovo ThinkPad E560 20EV000MGE | |
| Lenovo Thinkpad 13-20J1001BUS | |
| CPU Multi 64Bit | |
| Dell Latitude 5280 N014L528012QG45 | |
| Lenovo ThinkPad L470-20J5S00C00 | |
| Lenovo ThinkPad 13-20GKS01100 | |
| Lenovo Thinkpad 13-20J1001BUS | |
| Lenovo ThinkPad E560 20EV000MGE | |
| Cinebench R11.5 | |
| CPU Single 64Bit | |
| Lenovo ThinkPad E560 20EV000MGE | |
| Lenovo Thinkpad 13-20J1001BUS | |
| CPU Multi 64Bit | |
| Lenovo Thinkpad 13-20J1001BUS | |
| Lenovo ThinkPad E560 20EV000MGE | |
| Cinebench R10 | |
| Rendering Multiple CPUs 32Bit | |
| Lenovo Thinkpad 13-20J1001BUS | |
| Lenovo ThinkPad E560 20EV000MGE | |
| Rendering Single 32Bit | |
| Lenovo Thinkpad 13-20J1001BUS | |
| Lenovo ThinkPad E560 20EV000MGE | |
| wPrime 2.10 - 1024m | |
| Lenovo Thinkpad 13-20J1001BUS | |
| Dell Latitude 5280 N014L528012QG45 | |
* ... smaller is better
Our new Cinebench R15 loop benchmark gives an idea of how consistent the Core i3-7100U in this model is. Even after running Cinebench 50 times in a succession, the ThinkPad 13 hit a score between 250 and 260 cb every time. Based on these findings, users can expect rock solid performance from the CPU over long workloads.
System Performance
Overall system performance gives us a better picture of everyday task management. The improved power efficiency of Kaby Lake coupled with an improved integrated GPU place our ThinkPad on top of the competition, including the Core i5-equipped 2016 ThinkPad 13. However, this victory should be taken with a grain of salt as the differences are marginal at best. What is notable is that our Core i3 ThinkPad 13 is a very capable machine for business and home use. It can even keep up with the ThinkPad L470, despite the latter's more powerful Core i5-7200U. Overall system performance should be a bit better on the Core i5 ThinkPad 13, but most users won't notice much difference. In everyday use, system performance is snappy and responsive. Apps open fairly quickly thanks to the m.2 SSD, and most casual tasks run without a hitch.
| PCMark 8 | |
| Home Score Accelerated v2 | |
| Lenovo ThinkPad L470-20J5S00C00 | |
| Lenovo Thinkpad 13-20J1001BUS | |
| Lenovo ThinkPad 13-20GKS01100 | |
| Lenovo ThinkPad E560 20EV000MGE | |
| Work Score Accelerated v2 | |
| Lenovo Thinkpad 13-20J1001BUS | |
| Lenovo ThinkPad L470-20J5S00C00 | |
| Lenovo ThinkPad 13-20GKS01100 | |
| Lenovo ThinkPad E560 20EV000MGE | |
| Creative Score Accelerated v2 | |
| Lenovo ThinkPad L470-20J5S00C00 | |
| Lenovo Thinkpad 13-20J1001BUS | |
| Lenovo ThinkPad 13-20GKS01100 | |
| Lenovo ThinkPad E560 20EV000MGE | |
| PCMark 7 Score | 3294 points | |
| PCMark 8 Home Score Accelerated v2 | 3163 points | |
| PCMark 8 Creative Score Accelerated v2 | 3886 points | |
| PCMark 8 Work Score Accelerated v2 | 4139 points | |
Help | ||
Storage Devices
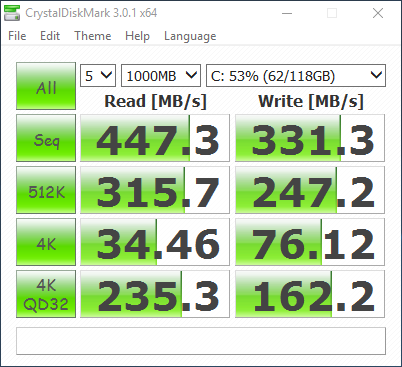
The SSD in our 2017 ThinkPad 13 is very similar to last year's Samsung model. While nothing spectacular, the M.2 SSD opens applications and moves files quickly. Our base model is equipped with a paltry 128 GB, but the ThinkPad 13 can be configured with up to 256 GB of storage through Lenovo's U.S. online store. Other markets fare better in this regard, as Lenovo offers higher capacity PCIe NVMe SSDs outside of the States.
Speeds are adequate. CrystalDiskMark measures the SSD at 447.3 MB/s when reading files and 331.3 MB/s when writing. This is comparable to last year's model and much faster than the mechanical HDDs found in the competition. Business professionals will appreciate the faster load times brought by an SSD, but enthusiasts may crave something faster. Daring users can open the chassis to change out the SATA SSD with a speedy NVMe drive, as the M.2 slot supports the faster protocol.

| Lenovo Thinkpad 13-20J1001BUS | Lenovo ThinkPad 13-20GKS01100 Samsung SSD PM871 MZNLN256HCHP | Lenovo ThinkPad E560 20EV000MGE Western Digital WD Black Mobile 500GB (WD5000LPLX) | Dell Latitude 14 3470 Toshiba MQ01ACF050 | HP ProBook 440 G4 Z2Y47ES Samsung CM871a MZNTY256HDHP | |
|---|---|---|---|---|---|
| CrystalDiskMark 3.0 | 16% | -87% | -90% | 25% | |
| Read Seq (MB/s) | 447.3 | 461.7 3% | 120.4 -73% | 108.9 -76% | 524 17% |
| Write Seq (MB/s) | 331.3 | 297.8 -10% | 123.1 -63% | 103.2 -69% | 466.9 41% |
| Read 512 (MB/s) | 315.7 | 351.6 11% | 34.31 -89% | 404 28% | |
| Write 512 (MB/s) | 247.2 | 298.4 21% | 66.8 -73% | 292.5 18% | |
| Read 4k (MB/s) | 34.46 | 31.85 -8% | 0.373 -99% | 0.362 -99% | 33.08 -4% |
| Write 4k (MB/s) | 76.1 | 68.5 -10% | 1.29 -98% | 0.946 -99% | 80.2 5% |
| Read 4k QD32 (MB/s) | 235.3 | 360.9 53% | 0.976 -100% | 0.721 -100% | 379.4 61% |
| Write 4k QD32 (MB/s) | 162.2 | 276.2 70% | 1.285 -99% | 0.901 -99% | 216.2 33% |

GPU Performance
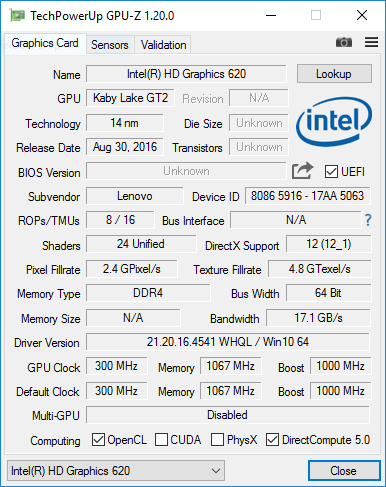
The Intel HD Graphics 620 integrated GPU offers very similar performance to last year's Intel HD Graphics 520. Current Intel integrated GPUs aren't meant for demanding 3D tasks, and HD Graphics 620 is no exception to this. While it can power through light graphical loads (such as 3D Mark's Ice Storm benchmark), heavier modeling work brings the chip to its knees. The amount of RAM makes a huge difference, as integrated graphics are highly dependent on system memory. While the ThinkPad L470 and Latitude 5280 do have more powerful Core i5-7200U processor's, the integrated graphics are boosted more by the higher amounts of RAM. The L470's 8 GB of RAM and the 5280's 16 GB help the Intel HD Graphics 620 chips post huge improvements in Cloud Gate (22% and 56%, respectively).
The good news for business users is that the Intel HD Graphics 620 GPU, coupled with the Core i3-7100U, can support an external 4K display at 60 Hz (according to Intel's Ark page). Using the proper adapters, the laptop should be able to connect and output to a total of 3 displays, though not at 4K.
| 3DMark | |
| 1280x720 Cloud Gate Standard Graphics | |
| Dell Latitude 5280 N014L528012QG45 | |
| Lenovo ThinkPad L470-20J5S00C00 | |
| Lenovo ThinkPad 13-20GKS01100 | |
| Lenovo Thinkpad 13-20J1001BUS | |
| Lenovo ThinkPad E560 20EV000MGE | |
| Dell Latitude 14 3470 | |
| 1920x1080 Ice Storm Extreme Graphics | |
| Dell Latitude 5280 N014L528012QG45 | |
| Lenovo ThinkPad L470-20J5S00C00 | |
| Lenovo Thinkpad 13-20J1001BUS | |
| 3DMark Ice Storm Standard Score | 34539 points | |
| 3DMark Cloud Gate Standard Score | 4409 points | |
Help | ||
Gaming Performance
The Intel HD Graphics 620 chipset is certainly not meant for gaming. Gaming isn't off the table entirely, so long as expectations are adjusted accordingly. Older, well-optimized titles like Bioshock Infinite can be played at low resolutions and the lowest settings. Lighter titles, such as Minecraft, Stardew Valley, or other non-demanding games run well and are enjoyable. However, as shown by Ashes of the Singularity (a title that is fairly GPU and CPU intensive), AAA gaming is still out of reach.
Our testing shows that the Intel HD Graphics 620 bring almost imperceptible improvements over the older Intel Graphics HD 520. The new integrated graphics card should not be considered in upgrade decisions. However, users that want to enjoy better gaming performance should consider upgrading to the Core i5-7200U and adding more RAM. The ThinkPad L470 with 8 GB of RAM was able to outperform the ThinkPad 13 in Bioshock Infinite by 18% and 5% at Low and Medium presets, respectively. The Latitude 5280, which has 16 GB RAM in a dual-channel configuration, handily beat the ThinkPad 13 at these settings (68% at Low and 41% at Medium). Note that Lenovo currently does not offer a model shipped with 16 GB of RAM, so this will require an upgrade on the user's part.
| BioShock Infinite | |
| 1920x1080 Ultra Preset, DX11 (DDOF) (sort by value) | |
| Lenovo Thinkpad 13-20J1001BUS | |
| Lenovo ThinkPad L470-20J5S00C00 | |
| 1366x768 Medium Preset (sort by value) | |
| Lenovo Thinkpad 13-20J1001BUS | |
| Lenovo ThinkPad 13-20GKS01100 | |
| Lenovo ThinkPad E560 20EV000MGE | |
| Dell Latitude 5280 N014L528012QG45 | |
| Lenovo ThinkPad L470-20J5S00C00 | |
| 1280x720 Very Low Preset (sort by value) | |
| Lenovo Thinkpad 13-20J1001BUS | |
| Lenovo ThinkPad 13-20GKS01100 | |
| Lenovo ThinkPad E560 20EV000MGE | |
| Dell Latitude 5280 N014L528012QG45 | |
| Lenovo ThinkPad L470-20J5S00C00 | |
| Ashes of the Singularity - 1280x768 low (sort by value) | |
| Lenovo Thinkpad 13-20J1001BUS | |
| low | med. | high | ultra | |
|---|---|---|---|---|
| BioShock Infinite (2013) | 35 | 22 | 11 | |
| Ashes of the Singularity (2016) | 8.9 |
Stress Test
The Core i3-7100U may not be able to boost under stress, but it can definitely keep its cool. Using Prime95 to tax the CPU to its utmost, we see the chip stay at its maximum clock of 2.4 GHz while only reaching 67º C at its hottest. The Intel HD Graphics 620 GPU tells much the same story; when stressed by FurMark for an hour, the graphics chip stayed at its maximum clock speed of 1000 MHz while only reaching 76º C. Running both Prime95 and FurMark still couldn't stop the package. Both the CPU and GPU operated at their maximum speeds for about 100 minutes, but only reached 78° C. As we will discuss later, fan noise remains unobtrusive despite this intense load.


Stress Test
| CPU Clock (GHz) | GPU Clock (MHz) | Average CPU Temperature (°C) | Average GPU Temperature (°C) | |
| Prime95 Stress | 2.4 | - | 63 | 63 |
| FurMark Stress | 2.4 | 994 | 73 | 73 |
| Prime95 + FurMark Stress | 2.4 | 992 | 76 | 76 |
Emissions
System Noise
The benefit of a low-powered CPU is seen (or perhaps heard) in system emissions. Fan noise is among the quietest in its class and is barely audible above environmental noise. Fan noise is about 10% quieter than the competitors and about the same as the older ThinkPad 13. Despite its low volume, the fan is high-pitched and creates an annoying whine when under load. This only happens under extreme workloads like the stress test we discussed in the previous section.
Coil whine is also present, but falls underneath ambient sounds. In quiet settings, however, a slight high-pitched hum can be heard from the back left corner of the device. Coil whine isn't jarring and won't be noticed in everyday use. All said, system noise is excellent.
Noise level
| Idle |
| 28.7 / 28.7 / 28.7 dB(A) |
| Load |
| 31.2 / 35.9 dB(A) |
 | ||
30 dB silent 40 dB(A) audible 50 dB(A) loud |
||
min: | ||
| Lenovo Thinkpad 13-20J1001BUS HD Graphics 620, i3-7100U | Lenovo ThinkPad 13-20GKS01100 HD Graphics 520, 6200U, Samsung SSD PM871 MZNLN256HCHP | Lenovo ThinkPad E560 20EV000MGE HD Graphics 520, 6100U, Western Digital WD Black Mobile 500GB (WD5000LPLX) | Dell Latitude 14 3470 HD Graphics 520, 6100U, Toshiba MQ01ACF050 | HP ProBook 440 G4 Z2Y47ES HD Graphics 620, i3-7100U, Samsung CM871a MZNTY256HDHP | Acer Spin 5 SP513-51 HD Graphics 520, 6100U, Hynix HFS128G39TND | |
|---|---|---|---|---|---|---|
| Noise | 0% | -12% | -7% | -10% | -5% | |
| off / environment * (dB) | 28.7 | 29.1 -1% | 31.2 -9% | 29.2 -2% | 30.9 -8% | 30.5 -6% |
| Idle Minimum * (dB) | 28.7 | 29.1 -1% | 32.3 -13% | 32.3 -13% | 30 -5% | 30.5 -6% |
| Idle Average * (dB) | 28.7 | 29.1 -1% | 32.3 -13% | 32.3 -13% | 31.8 -11% | 30.5 -6% |
| Idle Maximum * (dB) | 28.7 | 29.1 -1% | 32.5 -13% | 32.3 -13% | 33.5 -17% | 30.6 -7% |
| Load Average * (dB) | 31.2 | 31.5 -1% | 36 -15% | 33.3 -7% | 35.7 -14% | 31 1% |
| Load Maximum * (dB) | 35.9 | 33.5 7% | 38.8 -8% | 33.4 7% | 38.5 -7% | 36.8 -3% |
* ... smaller is better
Temperature
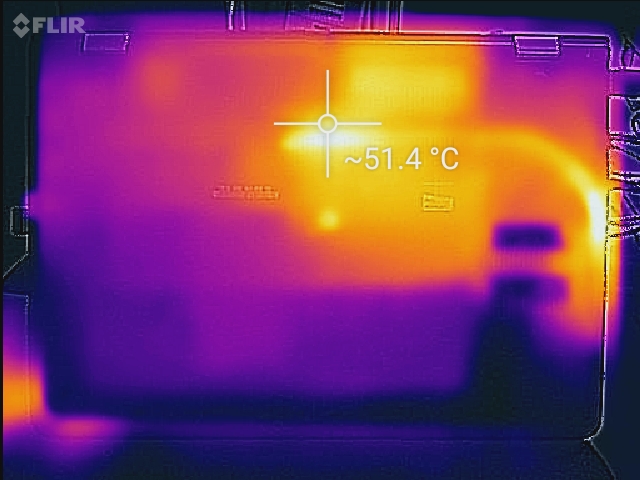
One of the common consequences of low fan speeds and noise is often a higher chassis temperature. This is certainly the case with the updated ThinkPad 13. The thin chassis gets very warm under load, specifically on the underside next to the CPU and heat exhaust vent. The bottom center hits about 55° C, which in turn make the notebook uncomfortable to use in the lap. It should be noted that these high temperatures only occur under extreme synthetic load; in real world use, the notebook should stay substantially cooler. The wrist rests also remain cool, even under maximum load.
At idle, the chassis stays cool at about 26-27° C. Under light loads (like those typically found in office work), the device remains cool to the touch.
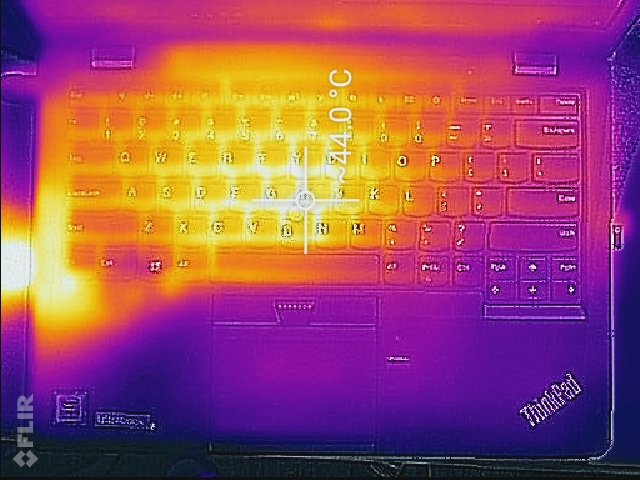
(±) The maximum temperature on the upper side is 44.4 °C / 112 F, compared to the average of 34.3 °C / 94 F, ranging from 21.2 to 62.5 °C for the class Office.
(-) The bottom heats up to a maximum of 55.4 °C / 132 F, compared to the average of 36.8 °C / 98 F
(+) In idle usage, the average temperature for the upper side is 25.8 °C / 78 F, compared to the device average of 29.5 °C / 85 F.
(+) The palmrests and touchpad are cooler than skin temperature with a maximum of 26.2 °C / 79.2 F and are therefore cool to the touch.
(±) The average temperature of the palmrest area of similar devices was 27.5 °C / 81.5 F (+1.3 °C / 2.3 F).
Speakers

The speakers are decidedly "laptop quality." Bass is almost absent, but mids and highs are decent. Music and media sound empty and hollow. On the plus, vocals are clear, and the speakers do well with voice calling and podcasts. As this machine is meant for business use, vocal clarity was likely a top concern. In this regard, the speakers are acceptable.
Lenovo Thinkpad 13-20J1001BUS audio analysis
(±) | speaker loudness is average but good (75.1 dB)
Bass 100 - 315 Hz
(-) | nearly no bass - on average 16.8% lower than median
(±) | linearity of bass is average (14.7% delta to prev. frequency)
Mids 400 - 2000 Hz
(+) | balanced mids - only 2.1% away from median
(+) | mids are linear (6.3% delta to prev. frequency)
Highs 2 - 16 kHz
(+) | balanced highs - only 2.5% away from median
(±) | linearity of highs is average (8.4% delta to prev. frequency)
Overall 100 - 16.000 Hz
(±) | linearity of overall sound is average (18.4% difference to median)
Compared to same class
» 33% of all tested devices in this class were better, 7% similar, 60% worse
» The best had a delta of 7%, average was 21%, worst was 53%
Compared to all devices tested
» 41% of all tested devices were better, 8% similar, 51% worse
» The best had a delta of 4%, average was 23%, worst was 134%
Lenovo ThinkPad 13-20GKS01100 audio analysis
(±) | speaker loudness is average but good (78.4 dB)
Bass 100 - 315 Hz
(±) | reduced bass - on average 11.8% lower than median
(-) | bass is not linear (15.4% delta to prev. frequency)
Mids 400 - 2000 Hz
(±) | higher mids - on average 6.8% higher than median
(+) | mids are linear (4.5% delta to prev. frequency)
Highs 2 - 16 kHz
(+) | balanced highs - only 2.7% away from median
(+) | highs are linear (6.6% delta to prev. frequency)
Overall 100 - 16.000 Hz
(±) | linearity of overall sound is average (19.6% difference to median)
Compared to same class
» 40% of all tested devices in this class were better, 8% similar, 52% worse
» The best had a delta of 7%, average was 21%, worst was 53%
Compared to all devices tested
» 49% of all tested devices were better, 7% similar, 44% worse
» The best had a delta of 4%, average was 23%, worst was 134%
Frequency Comparison (Checkbox selectable!)
Graph 1: Pink Noise 100% Vol.; Graph 2: Audio off
Energy Management
Power Consumption
Due primarily to the ultra-low voltage CPU and SSD, our ThinkPad 13 sips power from the wall. Even under load, we never see more than 28.5 Watts pulled from the outlet, which is a result of the improved power efficiency of the Kaby Lake platform. The 2017 ThinkPad pulls about 12% less power than the Core i3-6100U powered Dell Latitude 14 3470 under extreme load. At idle, our ThinkPad also uses about 20-25% less power than the competition on average. This might be due to a combination of the less efficient Skylake chips and mechanical HDDs found in the rivals.
The 45 W power supply can easily supply power to the 2017 ThinkPad with more than enough headroom.
| Off / Standby | |
| Idle | |
| Load |
|
Key:
min: | |
| Lenovo Thinkpad 13-20J1001BUS i3-7100U, HD Graphics 620, , IPS, 1920x1080, 13.3" | Lenovo ThinkPad 13-20GKS01100 6200U, HD Graphics 520, Samsung SSD PM871 MZNLN256HCHP, , 1920x1080, 13.3" | Lenovo ThinkPad E560 20EV000MGE 6100U, HD Graphics 520, Western Digital WD Black Mobile 500GB (WD5000LPLX), TN LED, 1366x768, 15.6" | Dell Latitude 14 3470 6100U, HD Graphics 520, Toshiba MQ01ACF050, TN LED, 1366x768, 14" | HP ProBook 440 G4 Z2Y47ES i3-7100U, HD Graphics 620, Samsung CM871a MZNTY256HDHP, TN, 1920x1080, 14" | Acer Spin 5 SP513-51 6100U, HD Graphics 520, Hynix HFS128G39TND, IPS LED, 1920x1080, 13.3" | |
|---|---|---|---|---|---|---|
| Power Consumption | -1% | -19% | -25% | -20% | -8% | |
| Idle Minimum * (Watt) | 3.5 | 3.1 11% | 5.2 -49% | 5 -43% | 5.7 -63% | 4.1 -17% |
| Idle Average * (Watt) | 5.7 | 5.5 4% | 7.25 -27% | 6.8 -19% | 6.8 -19% | 6.8 -19% |
| Idle Maximum * (Watt) | 6.2 | 6 3% | 7.9 -27% | 8.9 -44% | 7.8 -26% | 7.9 -27% |
| Load Average * (Watt) | 24.1 | 25.8 -7% | 25.1 -4% | 26.2 -9% | 20.2 16% | 20.4 15% |
| Load Maximum * (Watt) | 28.5 | 33.6 -18% | 25.1 12% | 31.8 -12% | 30.6 -7% | 26.8 6% |
* ... smaller is better
Battery Life
Again, the lower powered specs in our ThinkPad 13 have some benefits. Battery life is nothing short of spectacular, hitting over 9 and a half hours in our WiFi battery test (Balanced setting, 150 nit brightness, loading a new web page every 30 seconds). This machine can comfortably get business professionals through a full work day with some charge to spare for the train ride home. Under the best power settings (Airplane mode, minimum brightness), the notebook could easily last a transoceanic flight and while still getting some simple work done.
| Lenovo Thinkpad 13-20J1001BUS i3-7100U, HD Graphics 620, 42 Wh | Lenovo ThinkPad 13-20GKS01100 6200U, HD Graphics 520, 42 Wh | Lenovo ThinkPad E560 20EV000MGE 6100U, HD Graphics 520, 48 Wh | Dell Latitude 14 3470 6100U, HD Graphics 520, 41 Wh | HP ProBook 440 G4 Z2Y47ES i3-7100U, HD Graphics 620, 48 Wh | Acer Spin 5 SP513-51 6100U, HD Graphics 520, 45 Wh | |
|---|---|---|---|---|---|---|
| Battery runtime | -8% | 8% | -22% | 22% | -10% | |
| Reader / Idle (h) | 16.5 | 15.7 -5% | 14.8 -10% | 11.1 -33% | 20.2 22% | 12.5 -24% |
| WiFi v1.3 (h) | 9.7 | 6.2 -36% | 9.4 -3% | 4.6 -53% | 7.7 -21% | |
| Load (h) | 1.9 | 2.2 16% | 2.6 37% | 2.3 21% | 2.2 16% | |
| WiFi (h) | 10.1 |
Pros
Cons
Verdict
The ThinkPad 13 sits in a good spot. The feature set retains many outstanding points of its more mature ThinkPad brothers, the T and X series. The keyboard is among the best available, the battery life is good enough for a full work day, and performance is adequate, if not a bit underwhelming. However, there are some definite corners that were cut to keep the price down. The keyboard lacks backlighting, hurting an otherwise excellent typing experience, and the lack of Thunderbolt 3 severely limits connectivity options.
Perhaps the biggest downside here is the price. For a system that costs over $1000, our ThinkPad 13 offers some fairly lackluster specs. Even the base model of the ThinkPad 13 equipped with an Intel Celeron 3865U (1.8 GHz, 2 MB Cache) and a 1366x768 TN display starts at $700 at the time of this review. Several devices with better internals are widely available at much lower prices. Though we did not include them in our comparisons, both the Asus Zenbook UX305UA and Dell XPS 13 (2016) can be configured with double the RAM and storage as well as a Core i5 ULV CPU for about the same price as our review model (and sometimes lower).
Overall, the ThinkPad 13 is a compelling package for business users who need something in between Lenovo's 12.5-inch X series and 14-inch T series. The long battery life and stellar input devices offset some of the compromises that were made. However, the upgrade to Kaby Lake currently isn't worth the steep price of admission. As such, we suggest users either wait for Lenovo to offer the device on sale or find a cheaper 2016 ThinkPad 13 with a last generation Skylake processor.
Lenovo Thinkpad 13-20J1001BUS
- 04/28/2017 v6 (old)
Sam Medley
Price comparison
