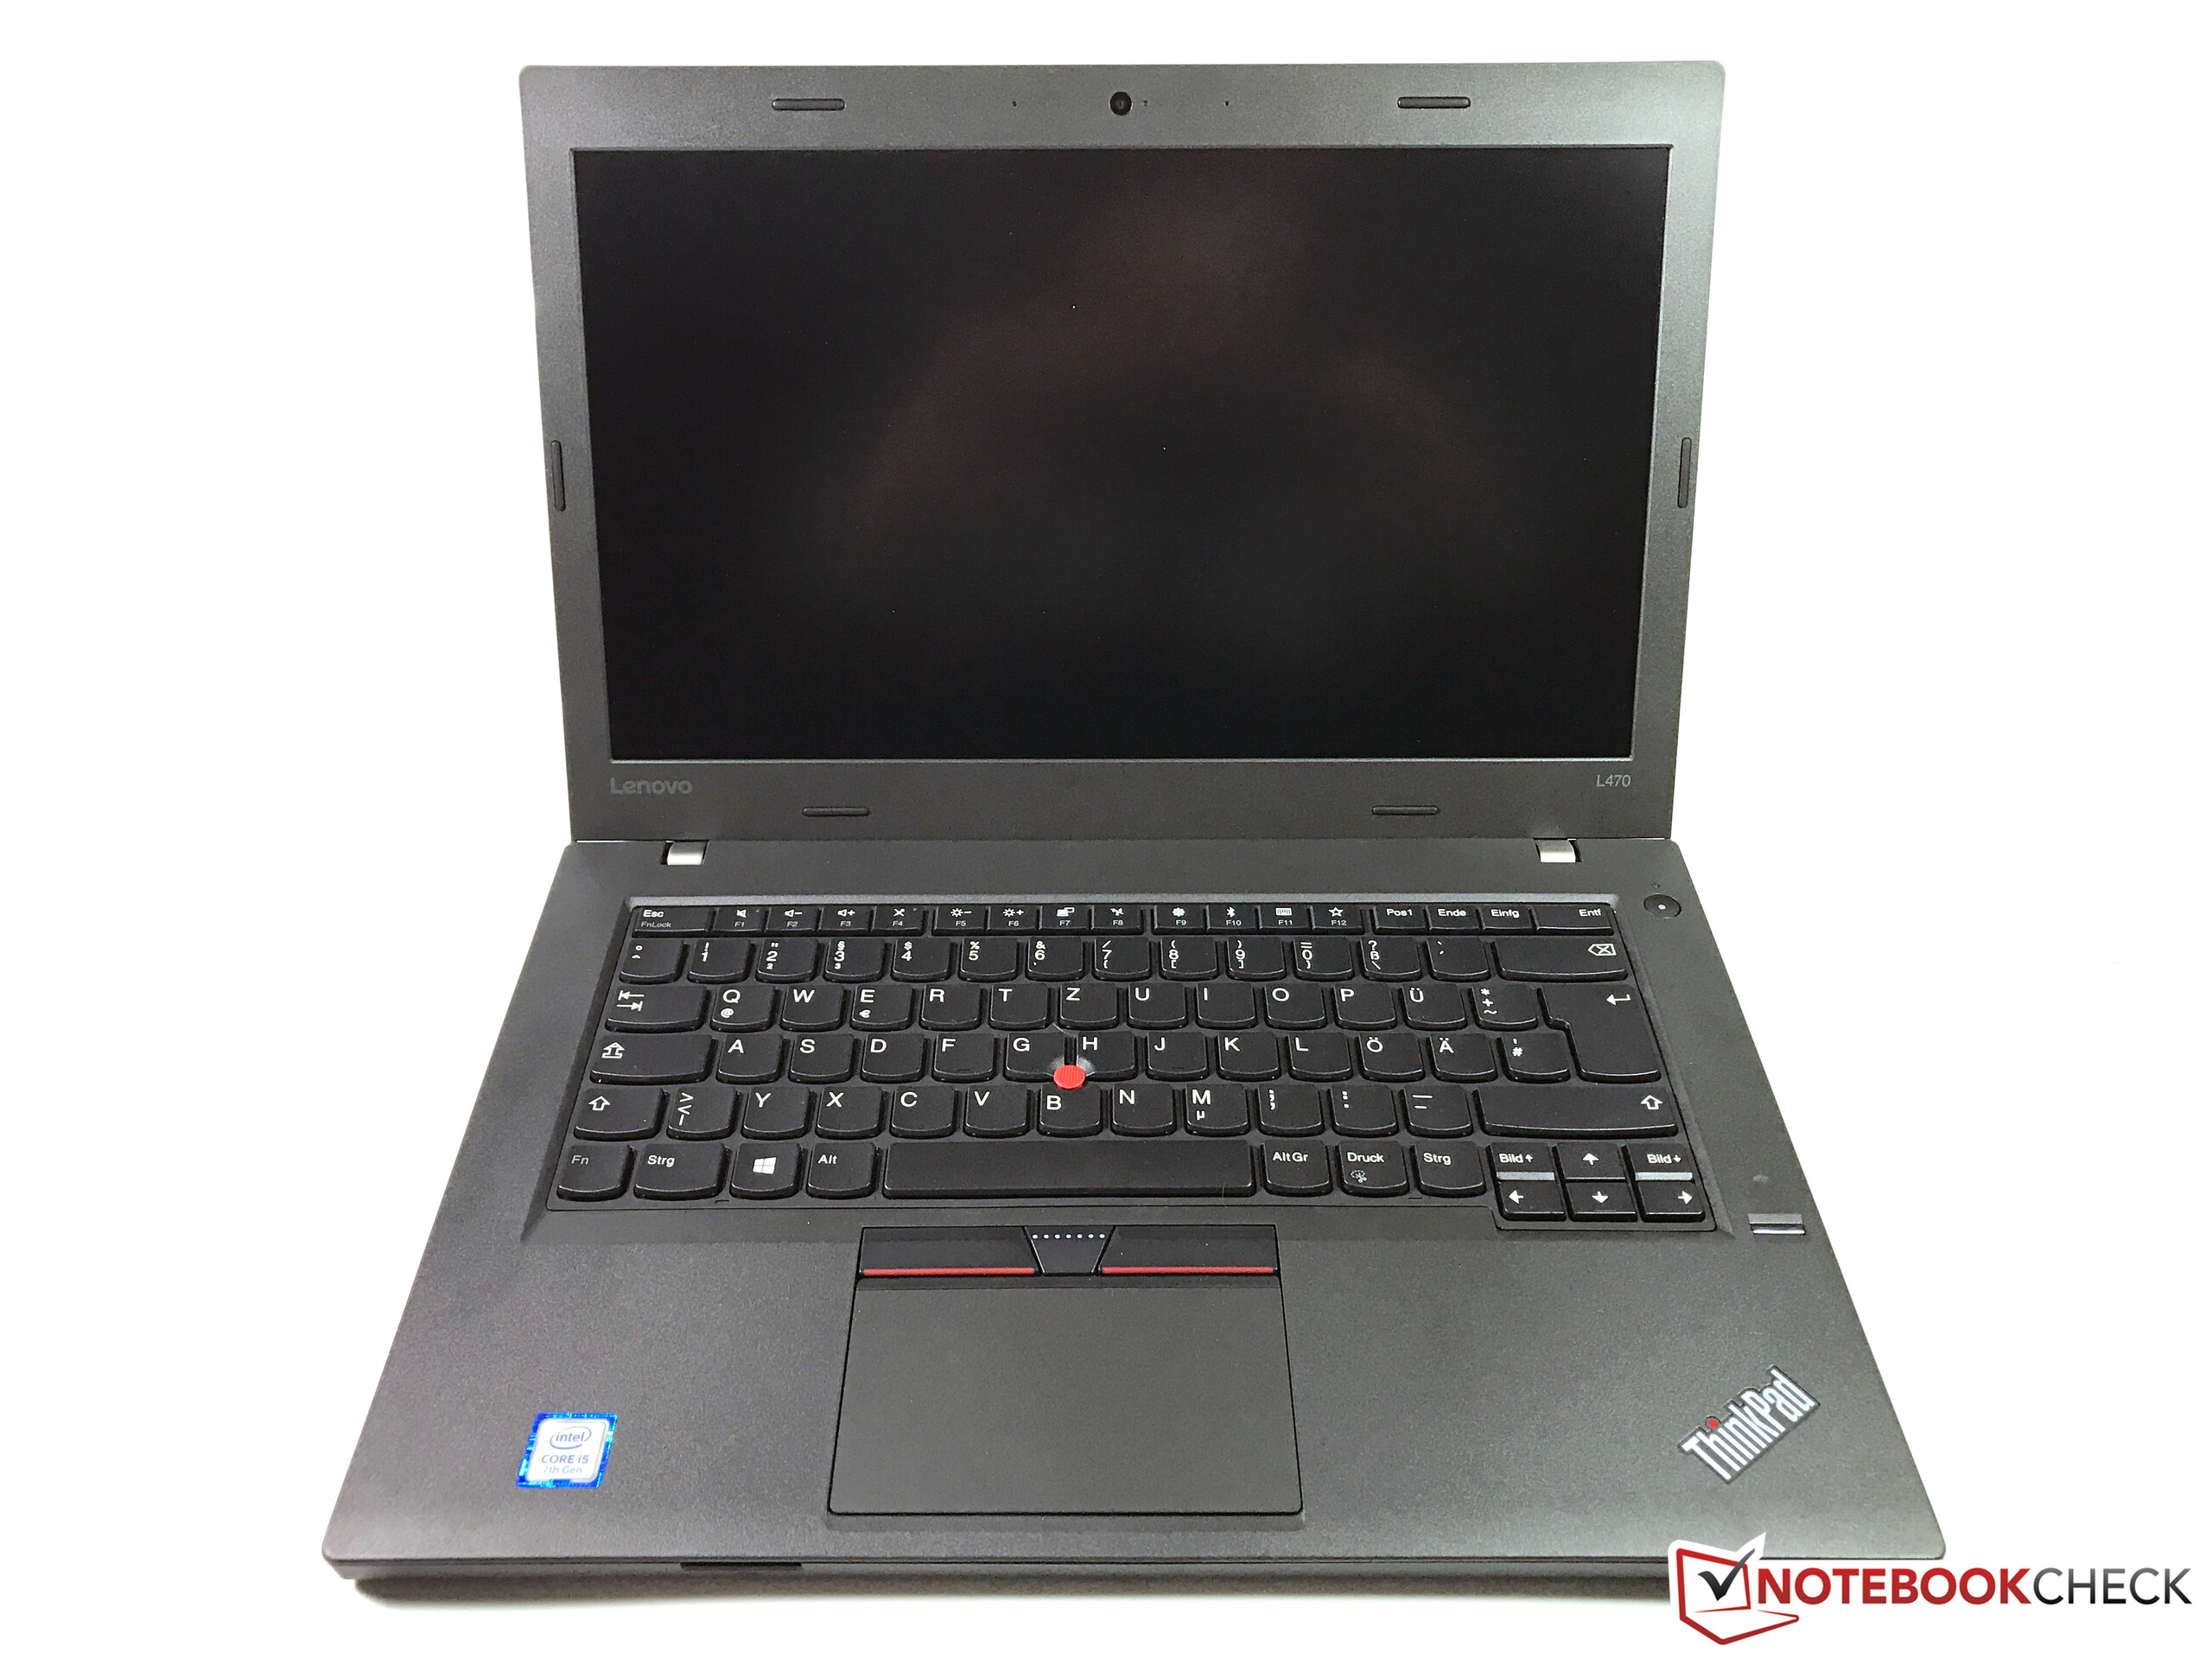
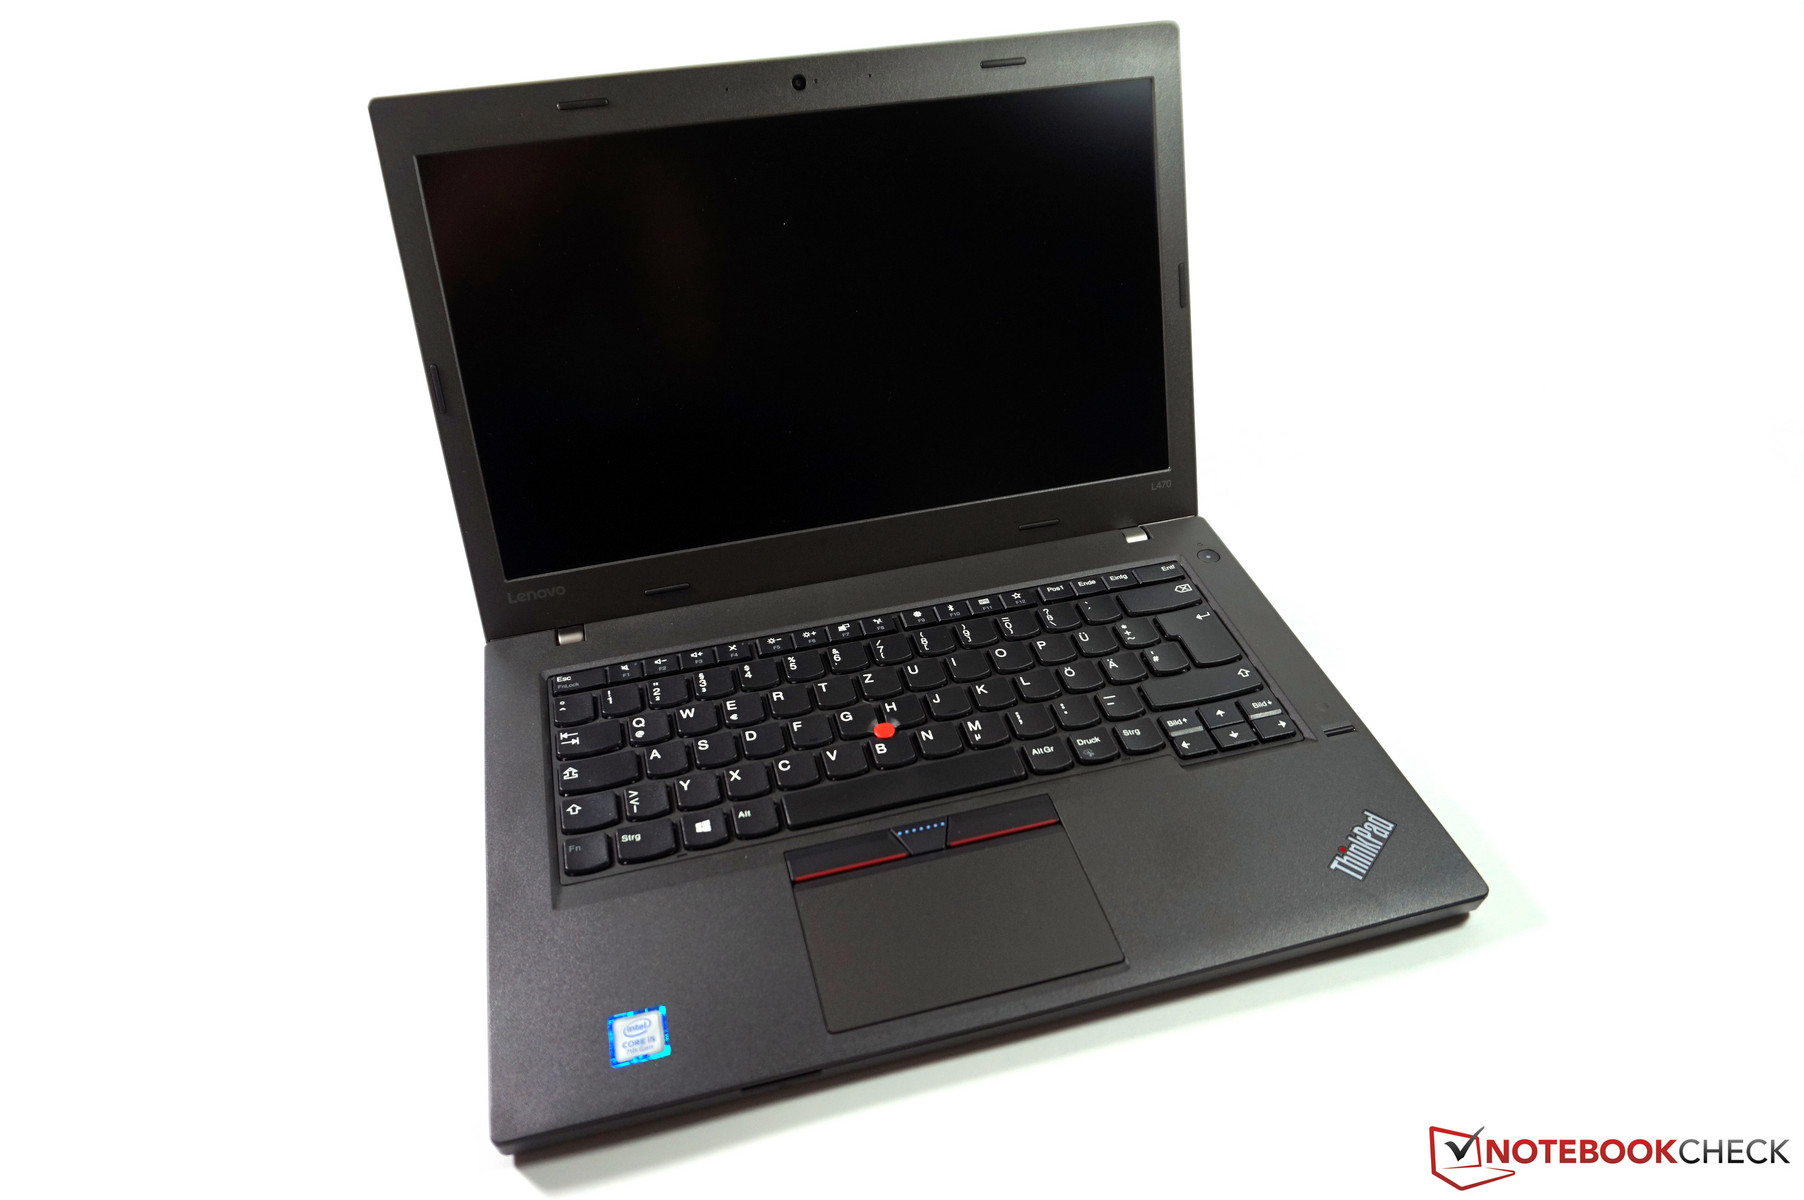
Lenovo ThinkPad L470 (i5-7200U, FHD-IPS) Laptop Review
For the original German review, click here.
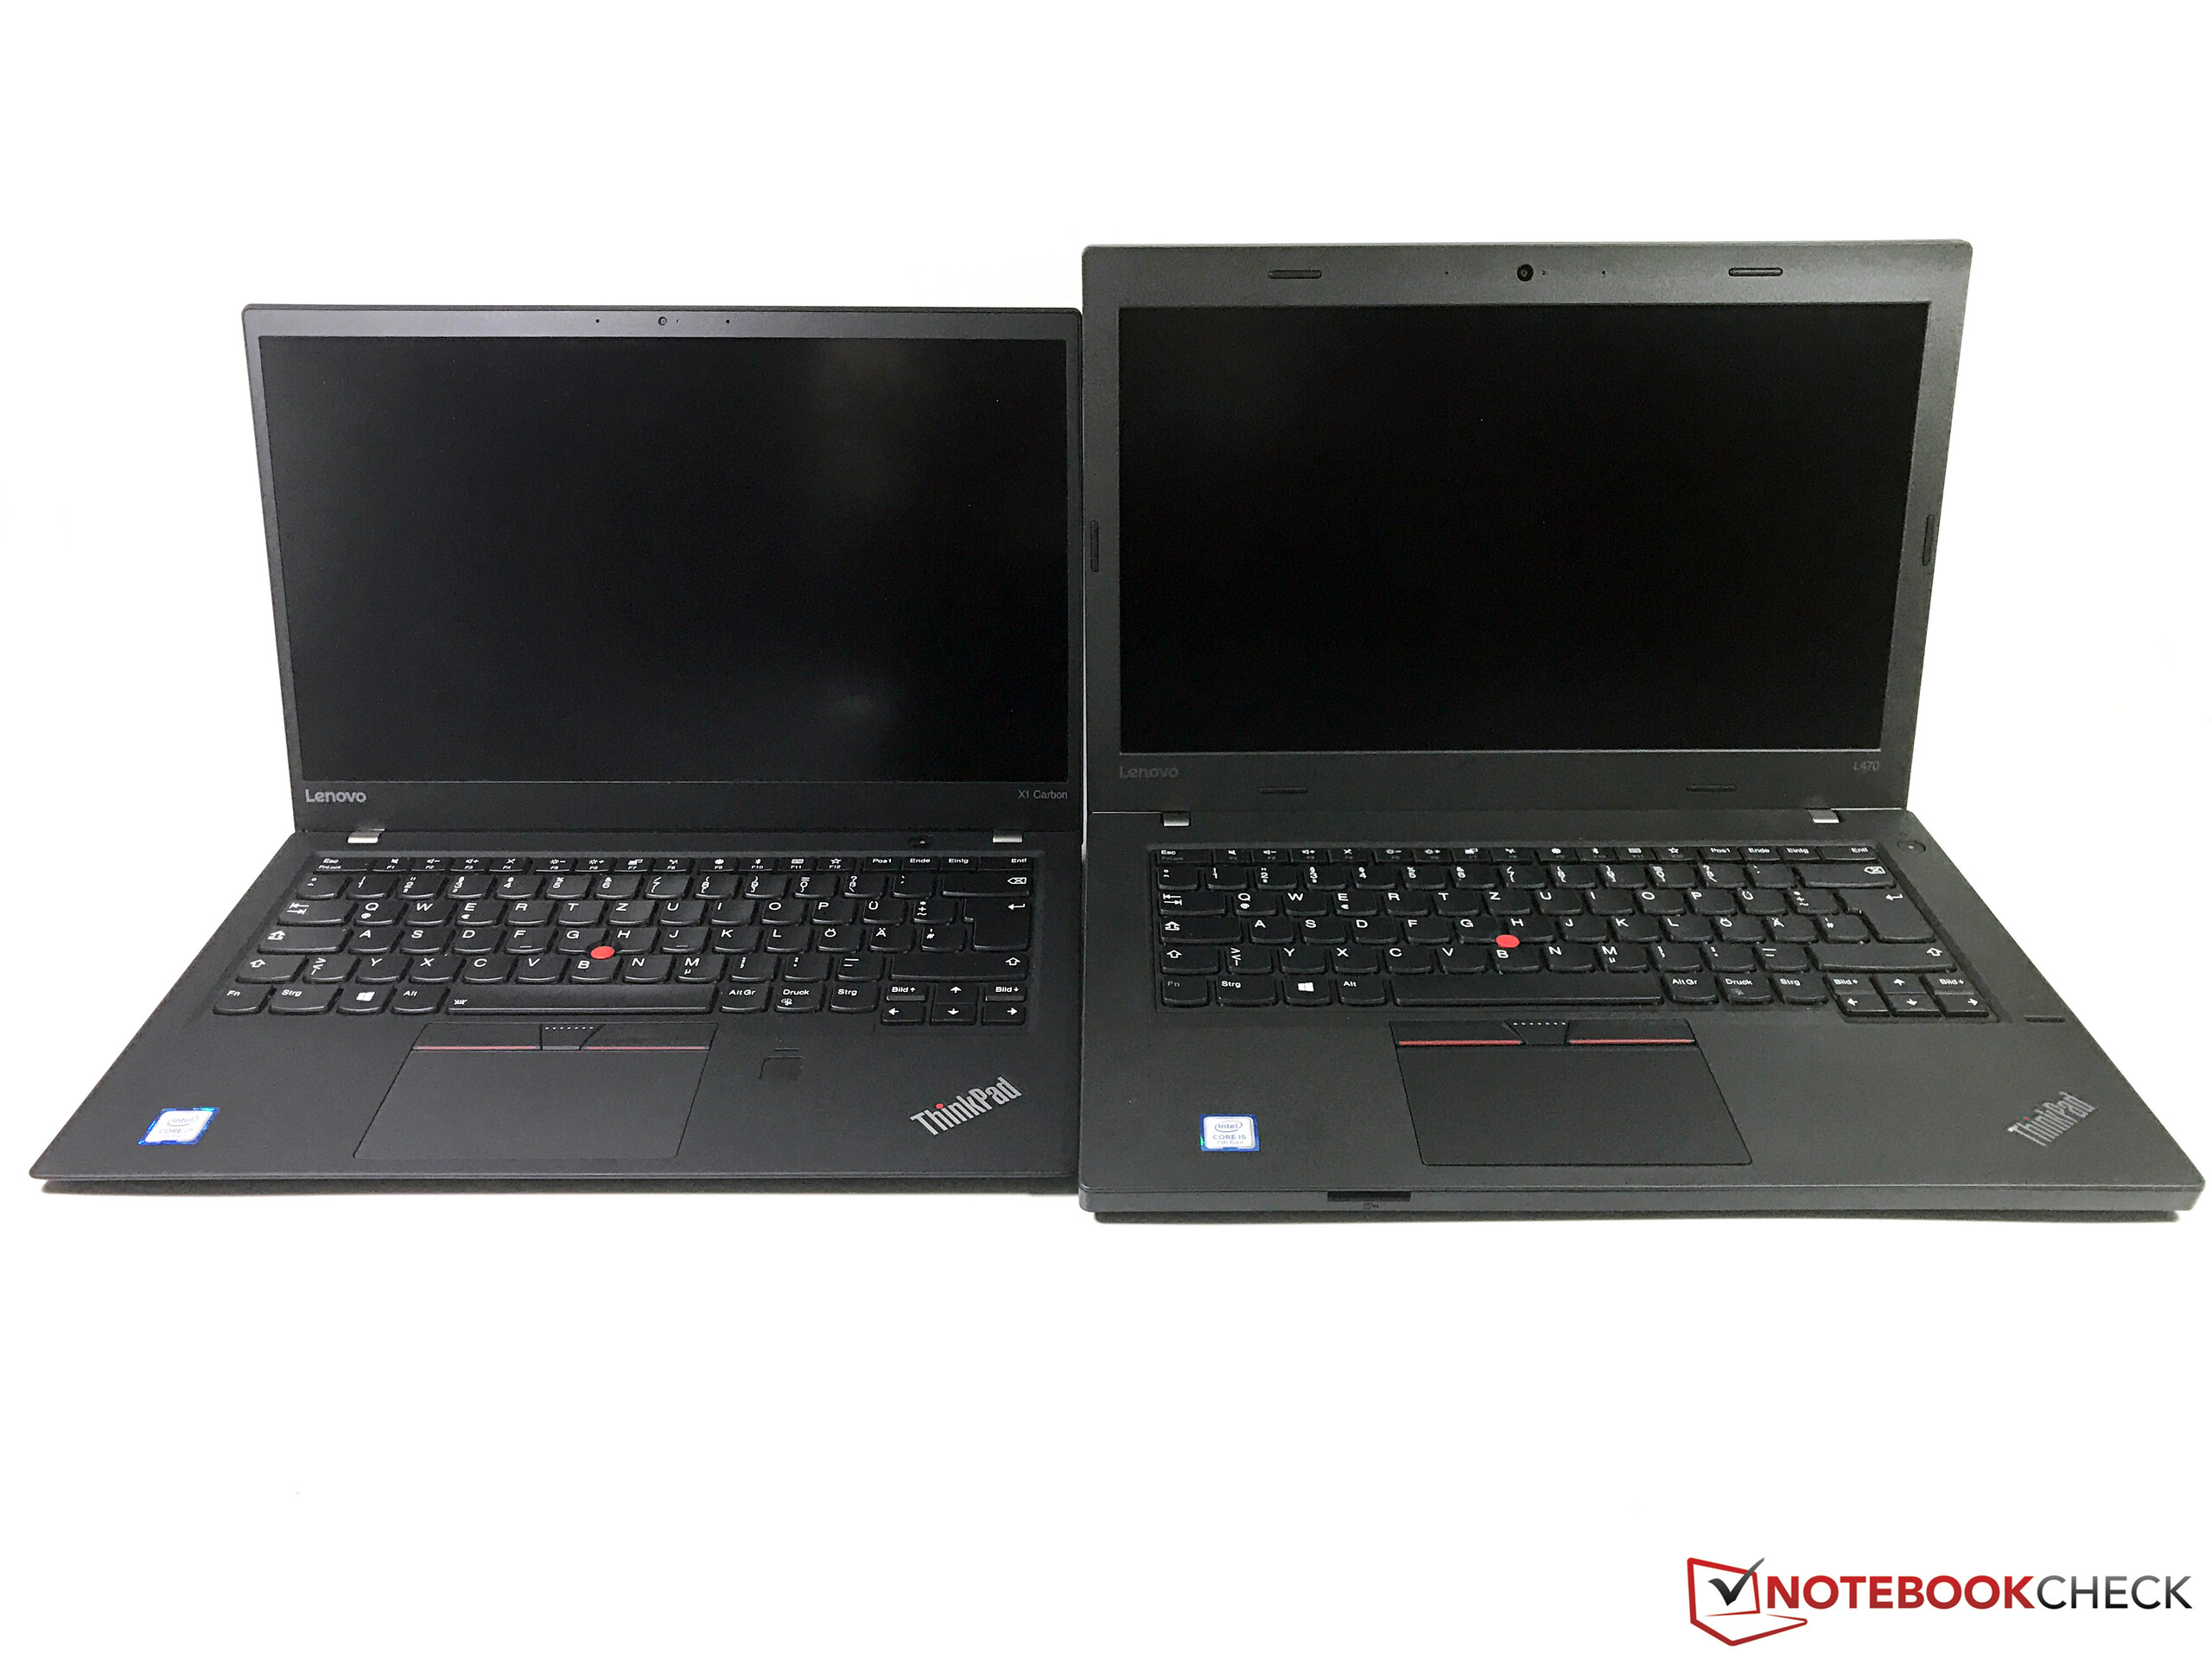
However, for certain firms and organizations, such as schools and public administration, the most important criterion is the lowest price possible. Here the ThinkPad L series comes into play, which has a significantly lower price than the T series. We have already reviewed the 15.6-inch sister model L570, and today we shall examine the smaller L470.
Our review model comes with a Kaby Lake i5 CPU, 256 GB SSD, 8 GB of RAM and costs 700 Euros (~$814) without Windows 10. In order to buy this model, one must sign up for Lenovo’s Campus Program. A comparable non-campus-program model with Windows 10 (20J4000LGE) costs 850 Euros (~$988). The immediate competitors of the L470 are the HP ProBook 440 G4, the HP ProBook 640 G3 and the Dell Latitude 5480. In terms of in-house competition, there is also the ThinkPad E470.
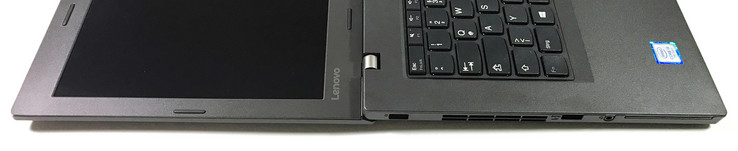
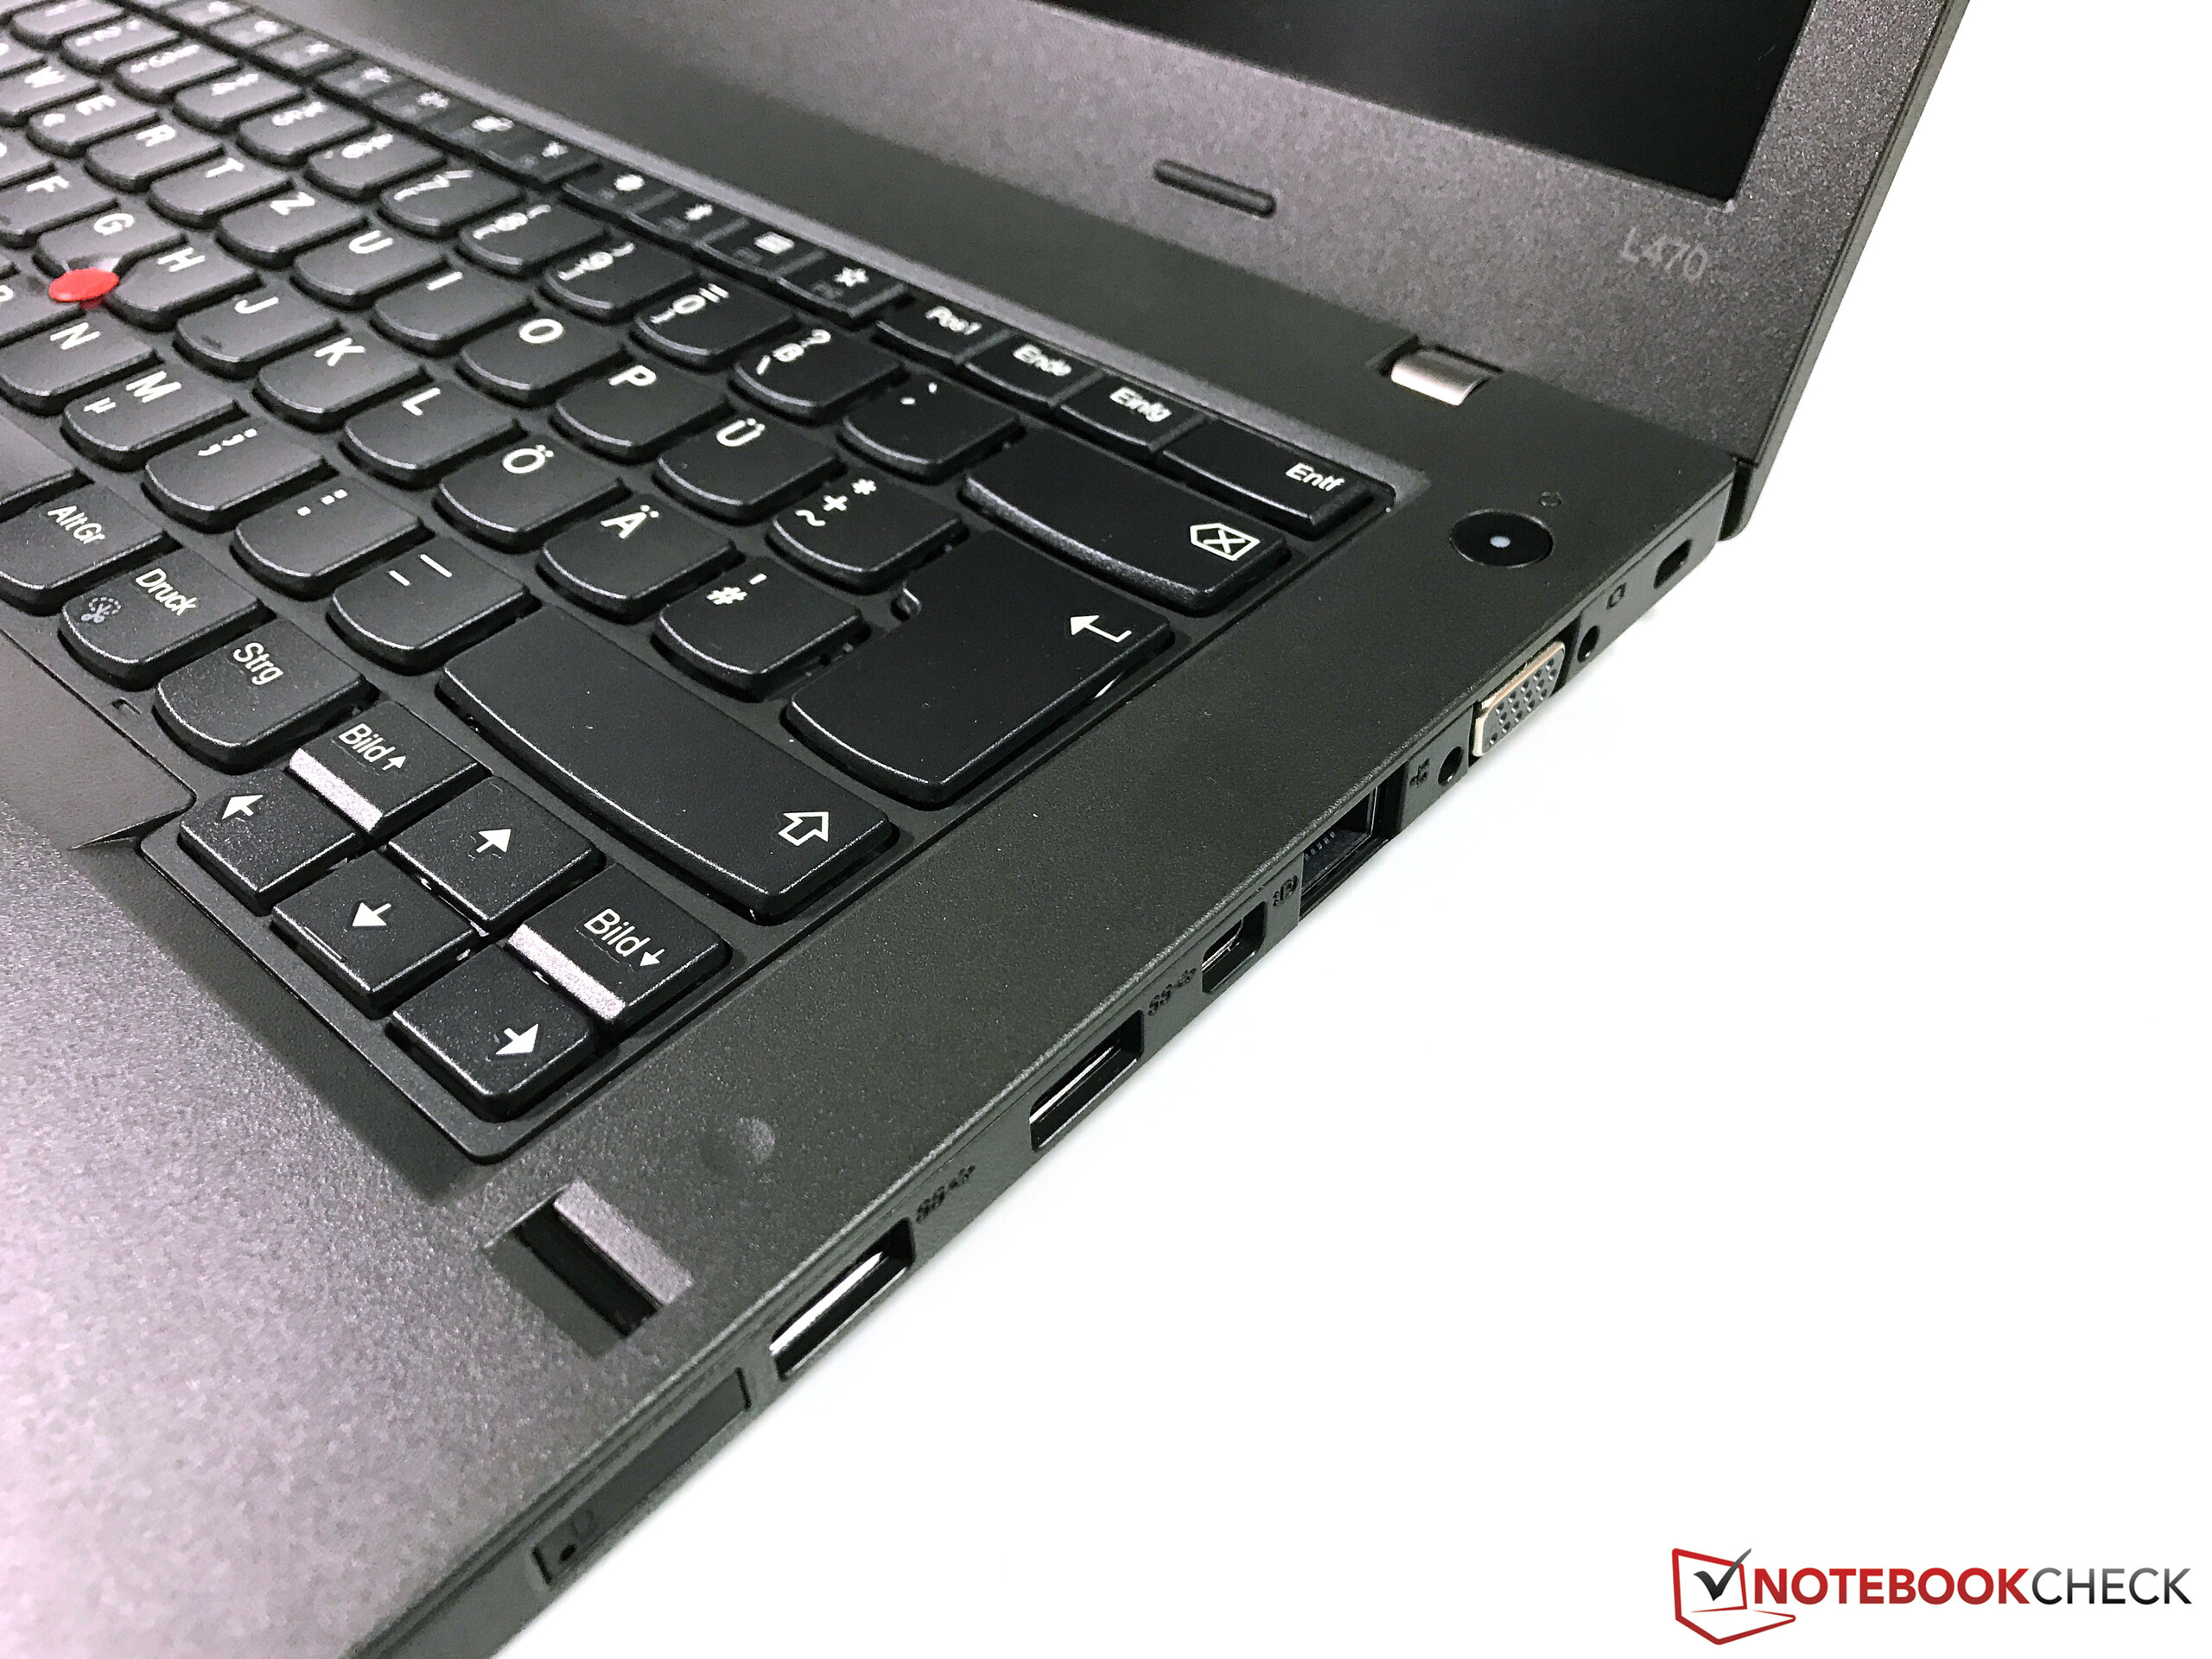
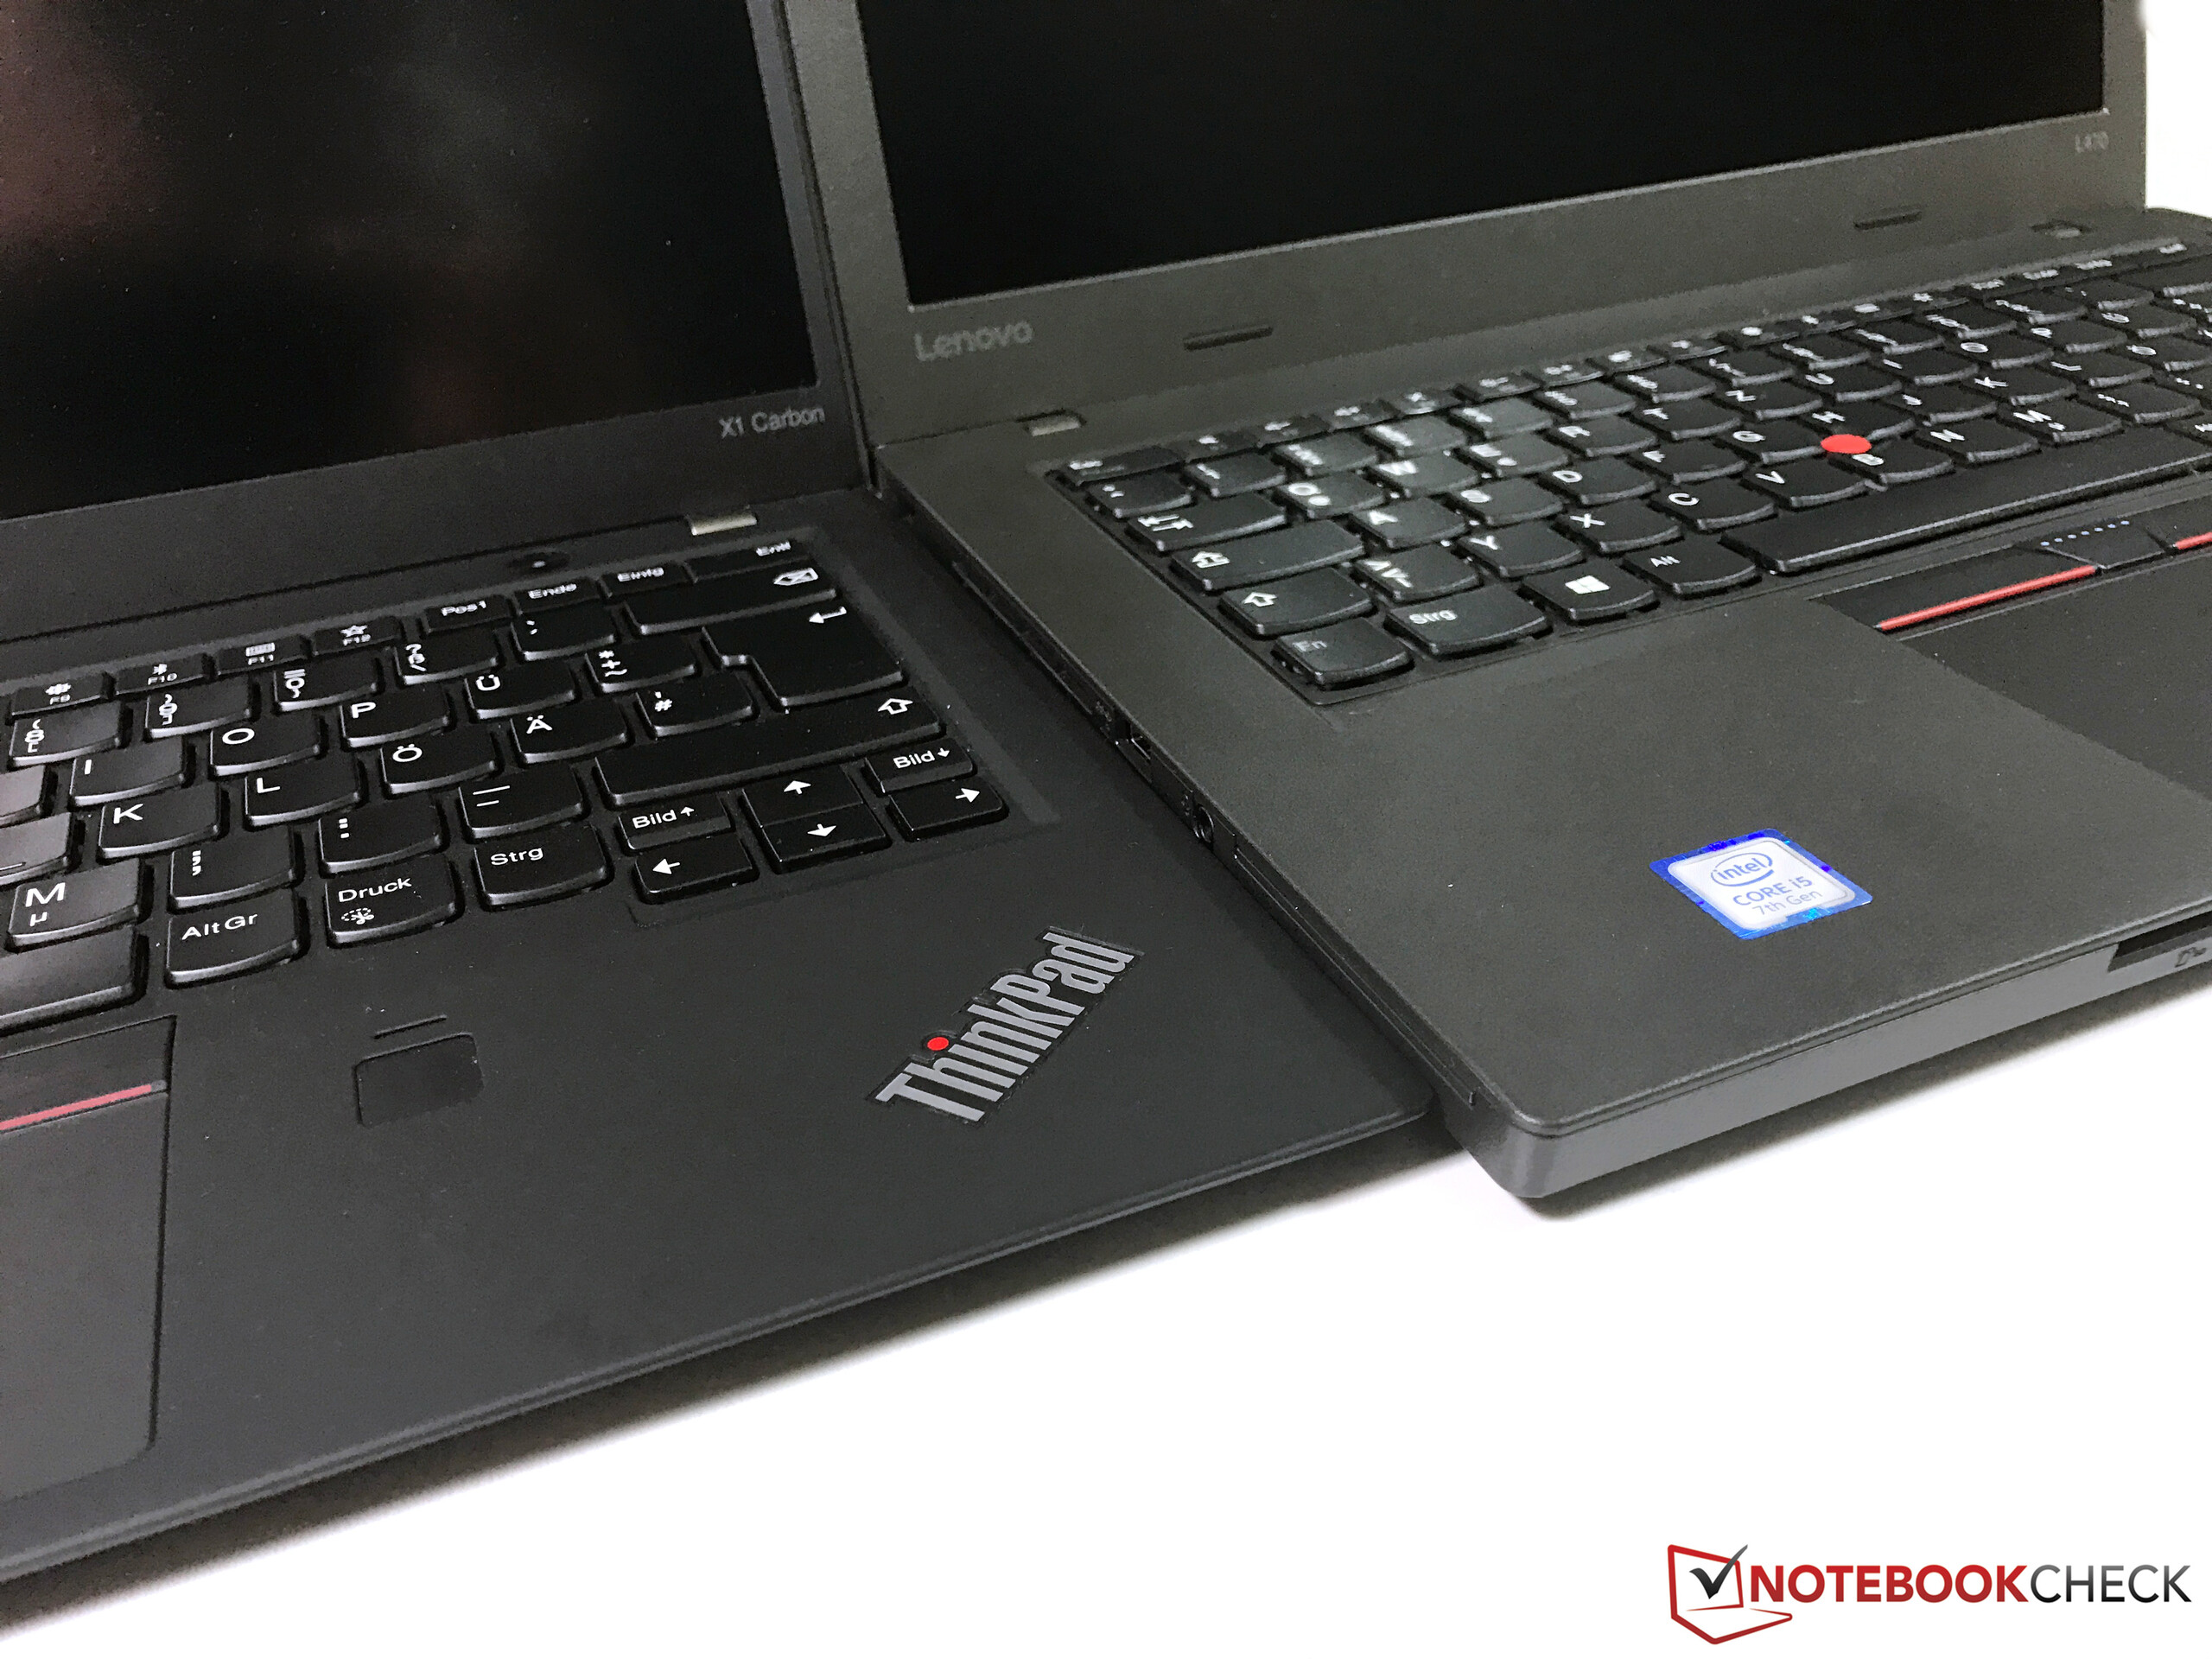
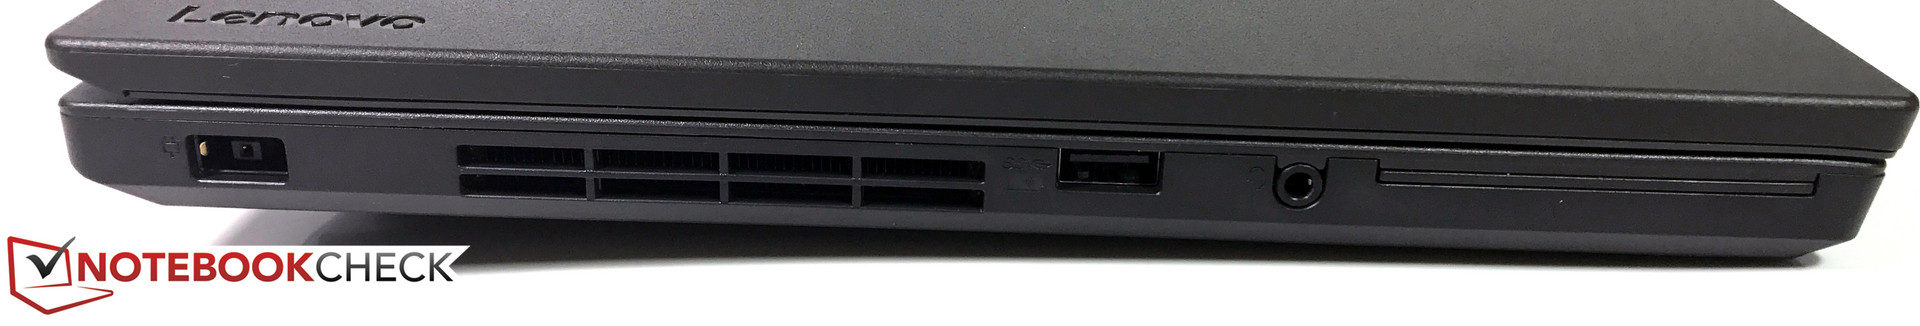
Because Lenovo kept the L460 and L450 predecessors design, we shall skip the sections regarding the case, the interfaces and the input devices and start with the display right away. For information contained in the skipped sections, we recommend looking at the reviews of both devices.

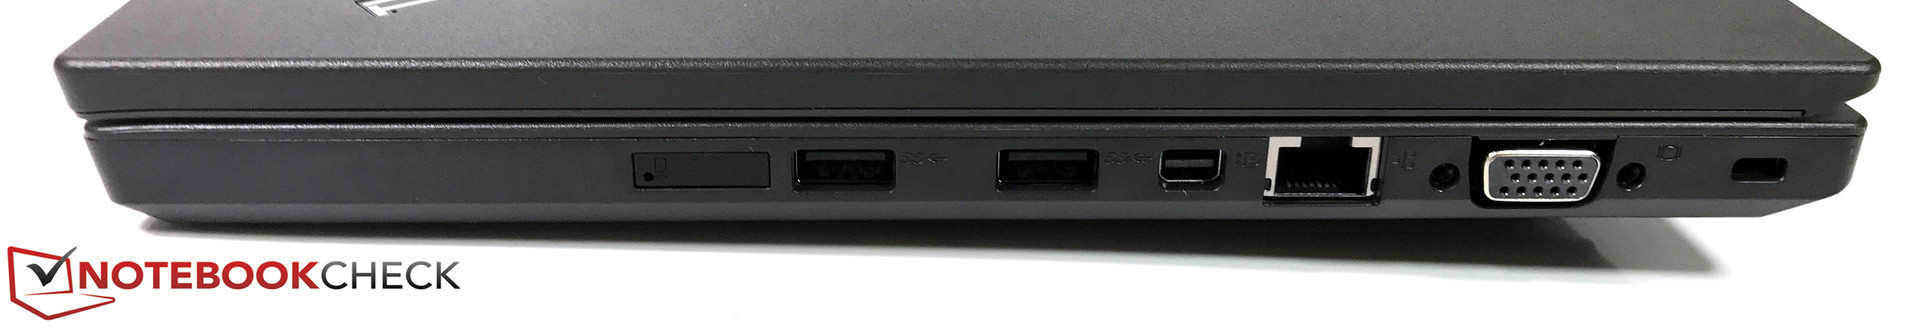
Connectivity
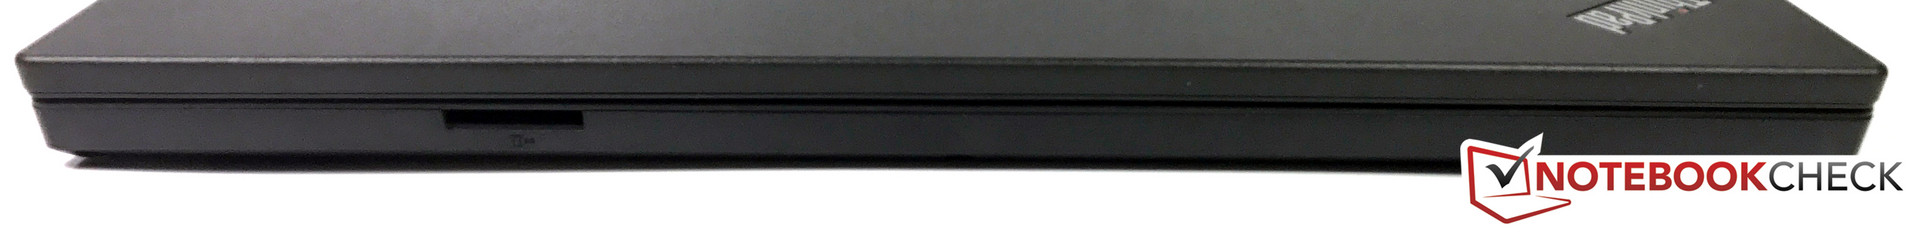
| SD Card Reader | |
| average JPG Copy Test (av. of 3 runs) | |
| Dell Latitude 5480 | |
| Lenovo ThinkPad L470-20J5S00C00 | |
| HP ProBook 440 G4-Y8B51EA | |
| HP ProBook 640 G3 Z2W33ET | |
| Lenovo ThinkPad E470-20H2S00400 | |
| Lenovo ThinkPad L460-20FVS01400 | |
| maximum AS SSD Seq Read Test (1GB) | |
| Dell Latitude 5480 | |
| HP ProBook 440 G4-Y8B51EA | |
| Lenovo ThinkPad L470-20J5S00C00 | |
| Lenovo ThinkPad L460-20FVS01400 | |
| Lenovo ThinkPad E470-20H2S00400 | |
| HP ProBook 640 G3 Z2W33ET | |
Communication
There is a small update to the Wi-Fi module to report. Instead of the Intel Wireless 8260 (which was used in the L460), Lenovo uses the 8265. For the user, this makes only a tiny difference, because both Wi-Fi modules are very similar. Both support AC-Wireless and come as 2x2 wireless cards.
| Networking | |
| iperf3 transmit AX12 | |
| HP ProBook 640 G3 Z2W33ET (jseb) | |
| Lenovo ThinkPad L470-20J5S00C00 | |
| Lenovo ThinkPad E470-20H2S00400 | |
| Dell Latitude 5480 | |
| iperf3 receive AX12 | |
| Lenovo ThinkPad L470-20J5S00C00 | |
| Dell Latitude 5480 | |
| Lenovo ThinkPad E470-20H2S00400 | |
| HP ProBook 640 G3 Z2W33ET (jseb) | |
Display


The L470 is offered with the same display options as the T470 and the E470. An HD display (1366x768) and a Full HD display (1920x1080) are available for the base configuration. The similarities between both displays: Both are matte and 14 inches in size. The difference: The HD screen is a TN panel, whereas the Full HD display is based on IPS technology. Fortunately, our review device comes equipped with the Full HD IPS display. One can learn how a typical HD TN panel performs in this E470 review update.
The comparison with the other ThinkPads is particularly exciting because Lenovo has put the same LCD panel from the manufacturer Innolux in all three devices. Even though, all three panels have the same model number, the contrast ratio and brightness vary from device to device significantly. The display of the T470 has a brightness of almost 290 cd/m², whereas the LCD panel in the E470 barely cracks the 230-cd/m² mark. The same panel in the L470, with an average brightness of 256 cd/m², lies squarely in between, the same can be said about the contrast ratio.
When compared to its own predecessor, the L460, the display brightness has improved, however the contrast ratio has gotten worse. The screens in the HP ProBook 440 G4 and the Dell Latitude 5480 are 50 cd/m² dimmer. By contrast, the Full HD TN panel in the ProBook 640 G3 is 80 cd/m² brighter than the Innolux display in the L470. However, what we are dealing with here is a TN panel.
The Innolux panel does not use PWM and, therefore, exhibits strong backlight bleeding, which is amplified by the IPS glow effect.
| |||||||||||||||||||||||||
Brightness Distribution: 85 %
Center on Battery: 273 cd/m²
Contrast: 783:1 (Black: 0.35 cd/m²)
ΔE ColorChecker Calman: 6.1 | ∀{0.5-29.43 Ø4.71}
ΔE Greyscale Calman: 5.7 | ∀{0.09-98 Ø4.96}
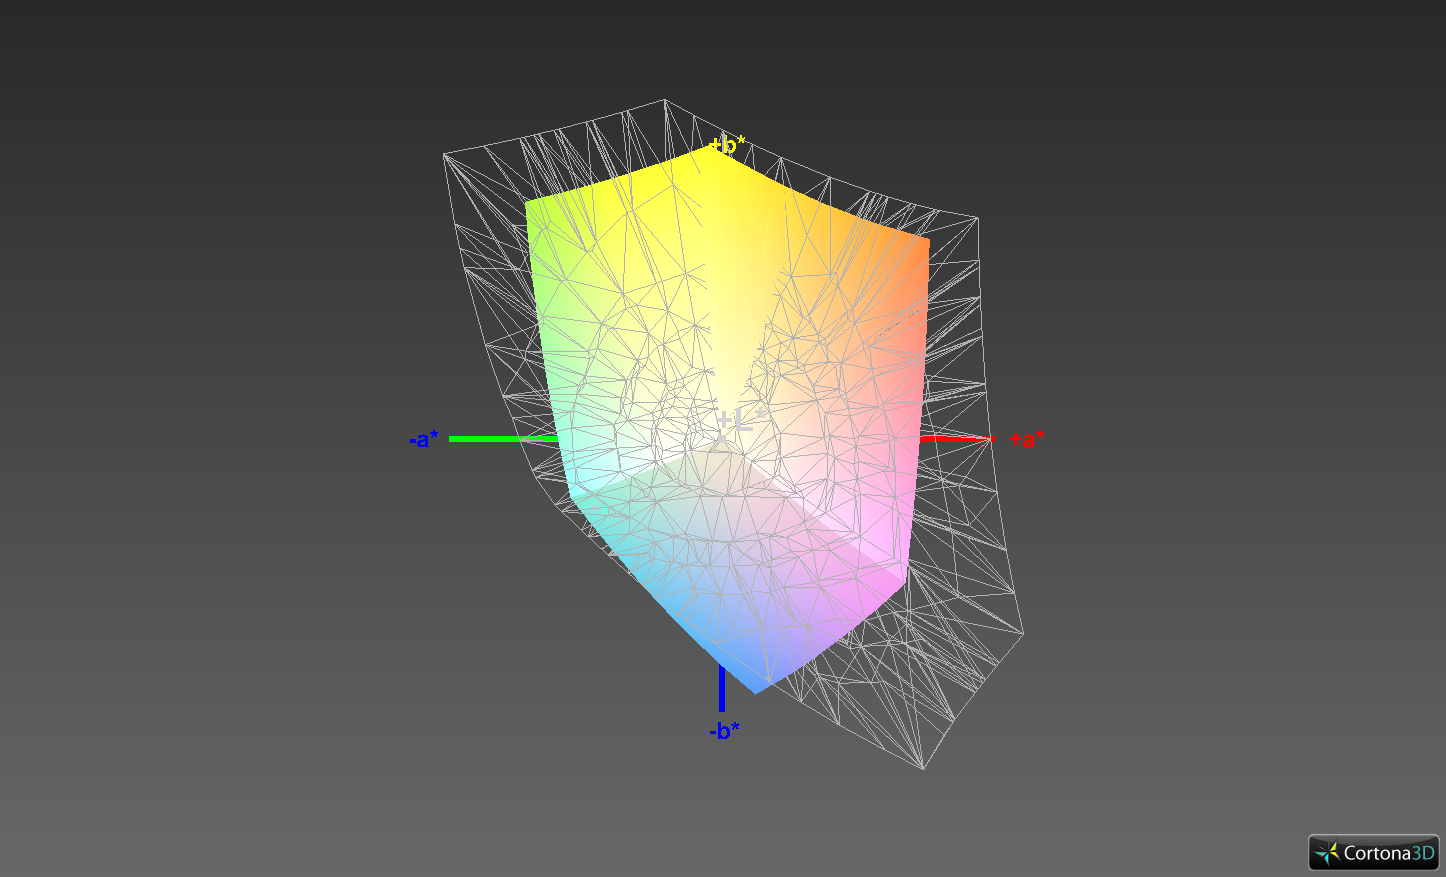
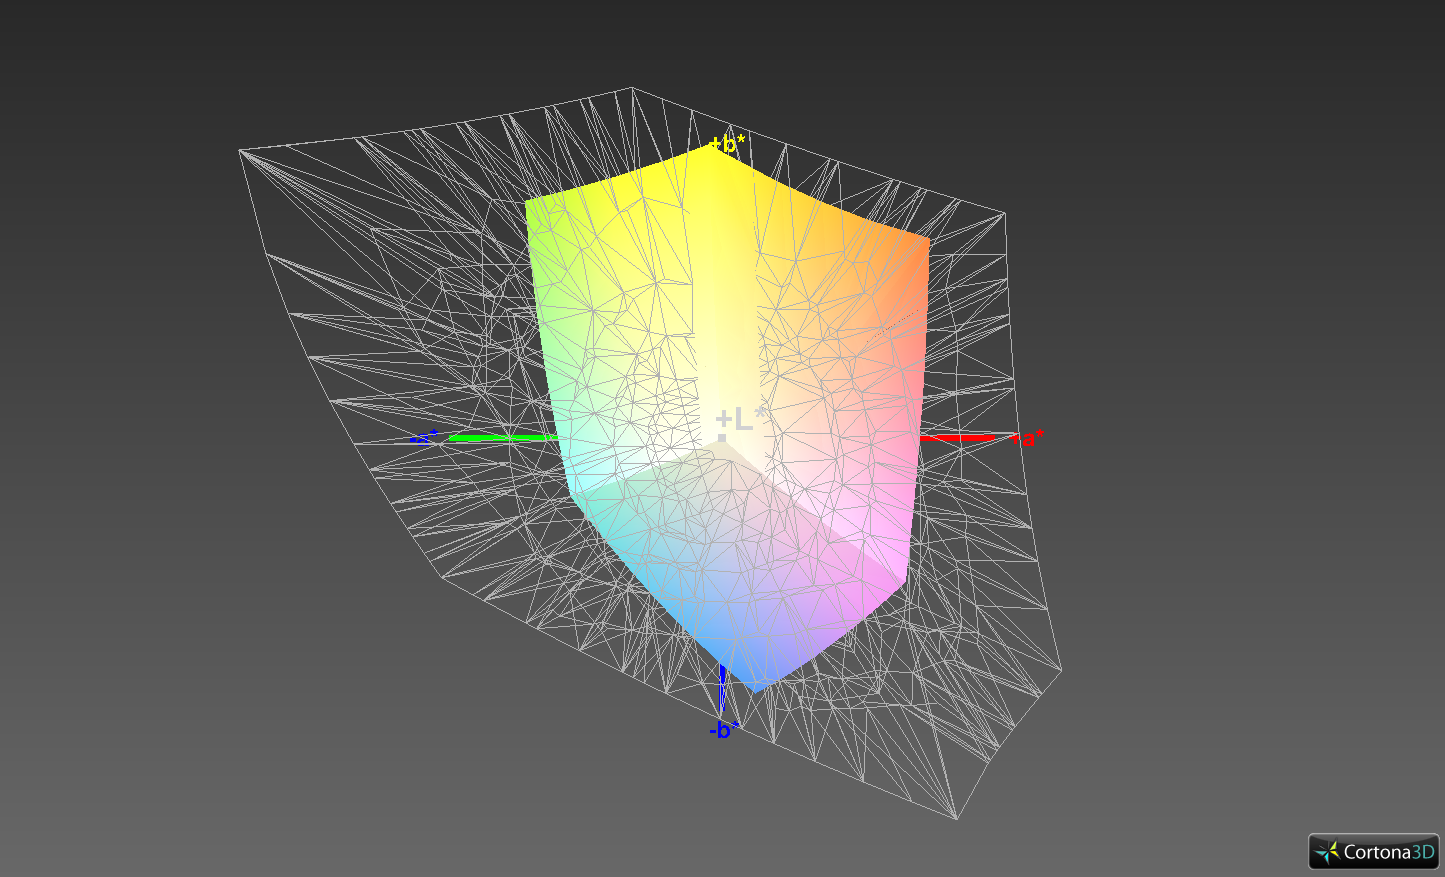
62.4% sRGB (Argyll 1.6.3 3D)
40.2% AdobeRGB 1998 (Argyll 1.6.3 3D)
43.71% AdobeRGB 1998 (Argyll 3D)
62.7% sRGB (Argyll 3D)
42.21% Display P3 (Argyll 3D)
Gamma: 2.11
CCT: 6419 K
| Lenovo ThinkPad L470-20J5S00C00 N140HCA-EAB, , 1920x1080, 14" | Lenovo ThinkPad T470-20HD002HGE N140HCA-EAB, , 1920x1080, 14" | Lenovo ThinkPad E470-20H2S00400 N140HCA-EAB, , 1920x1080, 14" | HP ProBook 440 G4-Y8B51EA AUO1E3D, , 1920x1080, 14" | HP ProBook 640 G3 Z2W33ET Chi Mei, , 1920x1080, 14" | Dell Latitude 5480 LG Philips LGD0553, , 1920x1080, 14" | Lenovo ThinkPad L460-20FVS01400 Lenovo N140HCE-EAA, , 1920x1080, 14" | |
|---|---|---|---|---|---|---|---|
| Display | -1% | -2% | -11% | 18% | -3% | -0% | |
| Display P3 Coverage (%) | 42.21 | 41.6 -1% | 41.23 -2% | 37.6 -11% | 49.46 17% | 40.62 -4% | 42.2 0% |
| sRGB Coverage (%) | 62.7 | 61.9 -1% | 61.4 -2% | 56.6 -10% | 74.5 19% | 61.2 -2% | 62.3 -1% |
| AdobeRGB 1998 Coverage (%) | 43.71 | 43.06 -1% | 42.67 -2% | 38.85 -11% | 51.1 17% | 41.96 -4% | 43.72 0% |
| Response Times | 4% | 10% | 18% | 11% | 25% | 8% | |
| Response Time Grey 50% / Grey 80% * (ms) | 50.4 ? | 41.6 ? 17% | 40.8 ? 19% | 43.2 ? 14% | 41 ? 19% | 32.8 ? 35% | 44.4 ? 12% |
| Response Time Black / White * (ms) | 30.8 ? | 34 ? -10% | 30.4 ? 1% | 24.4 ? 21% | 30 ? 3% | 26.4 ? 14% | 29.6 ? 4% |
| PWM Frequency (Hz) | 192 ? | ||||||
| Screen | 7% | -5% | -26% | -17% | 6% | -2% | |
| Brightness middle (cd/m²) | 274 | 306 12% | 244 -11% | 216 -21% | 343 25% | 215.9 -21% | 245 -11% |
| Brightness (cd/m²) | 256 | 287 12% | 231 -10% | 203 -21% | 332 30% | 205 -20% | 225 -12% |
| Brightness Distribution (%) | 85 | 88 4% | 89 5% | 83 -2% | 88 4% | 90 6% | 83 -2% |
| Black Level * (cd/m²) | 0.35 | 0.3 14% | 0.37 -6% | 0.47 -34% | 0.69 -97% | 0.22 37% | 0.24 31% |
| Contrast (:1) | 783 | 1020 30% | 659 -16% | 460 -41% | 497 -37% | 981 25% | 1021 30% |
| Colorchecker dE 2000 * | 6.1 | 6.2 -2% | 6.41 -5% | 8.98 -47% | 9.06 -49% | 5.1 16% | 6.89 -13% |
| Colorchecker dE 2000 max. * | 13.8 | 13.6 1% | 13.4 3% | 14.07 -2% | 14.84 -8% | 15.6 -13% | 17.62 -28% |
| Greyscale dE 2000 * | 5.7 | 5.8 -2% | 5.94 -4% | 9.61 -69% | 9.87 -73% | 4 30% | 6.45 -13% |
| Gamma | 2.11 104% | 2.04 108% | 2.28 96% | 2.63 84% | 2.5 88% | 2.41 91% | 2.46 89% |
| CCT | 6419 101% | 6277 104% | 6101 107% | 11265 58% | 11115 58% | 6856 95% | 6857 95% |
| Color Space (Percent of AdobeRGB 1998) (%) | 40.2 | 39.62 -1% | 39.3 -2% | 35.9 -11% | 47 17% | 41.96 4% | 40.1 0% |
| Color Space (Percent of sRGB) (%) | 62.4 | 61.44 -2% | 61.1 -2% | 56.7 -9% | 75 20% | 61.15 -2% | 61.8 -1% |
| Total Average (Program / Settings) | 3% /
5% | 1% /
-2% | -6% /
-17% | 4% /
-6% | 9% /
7% | 2% /
-0% |
* ... smaller is better

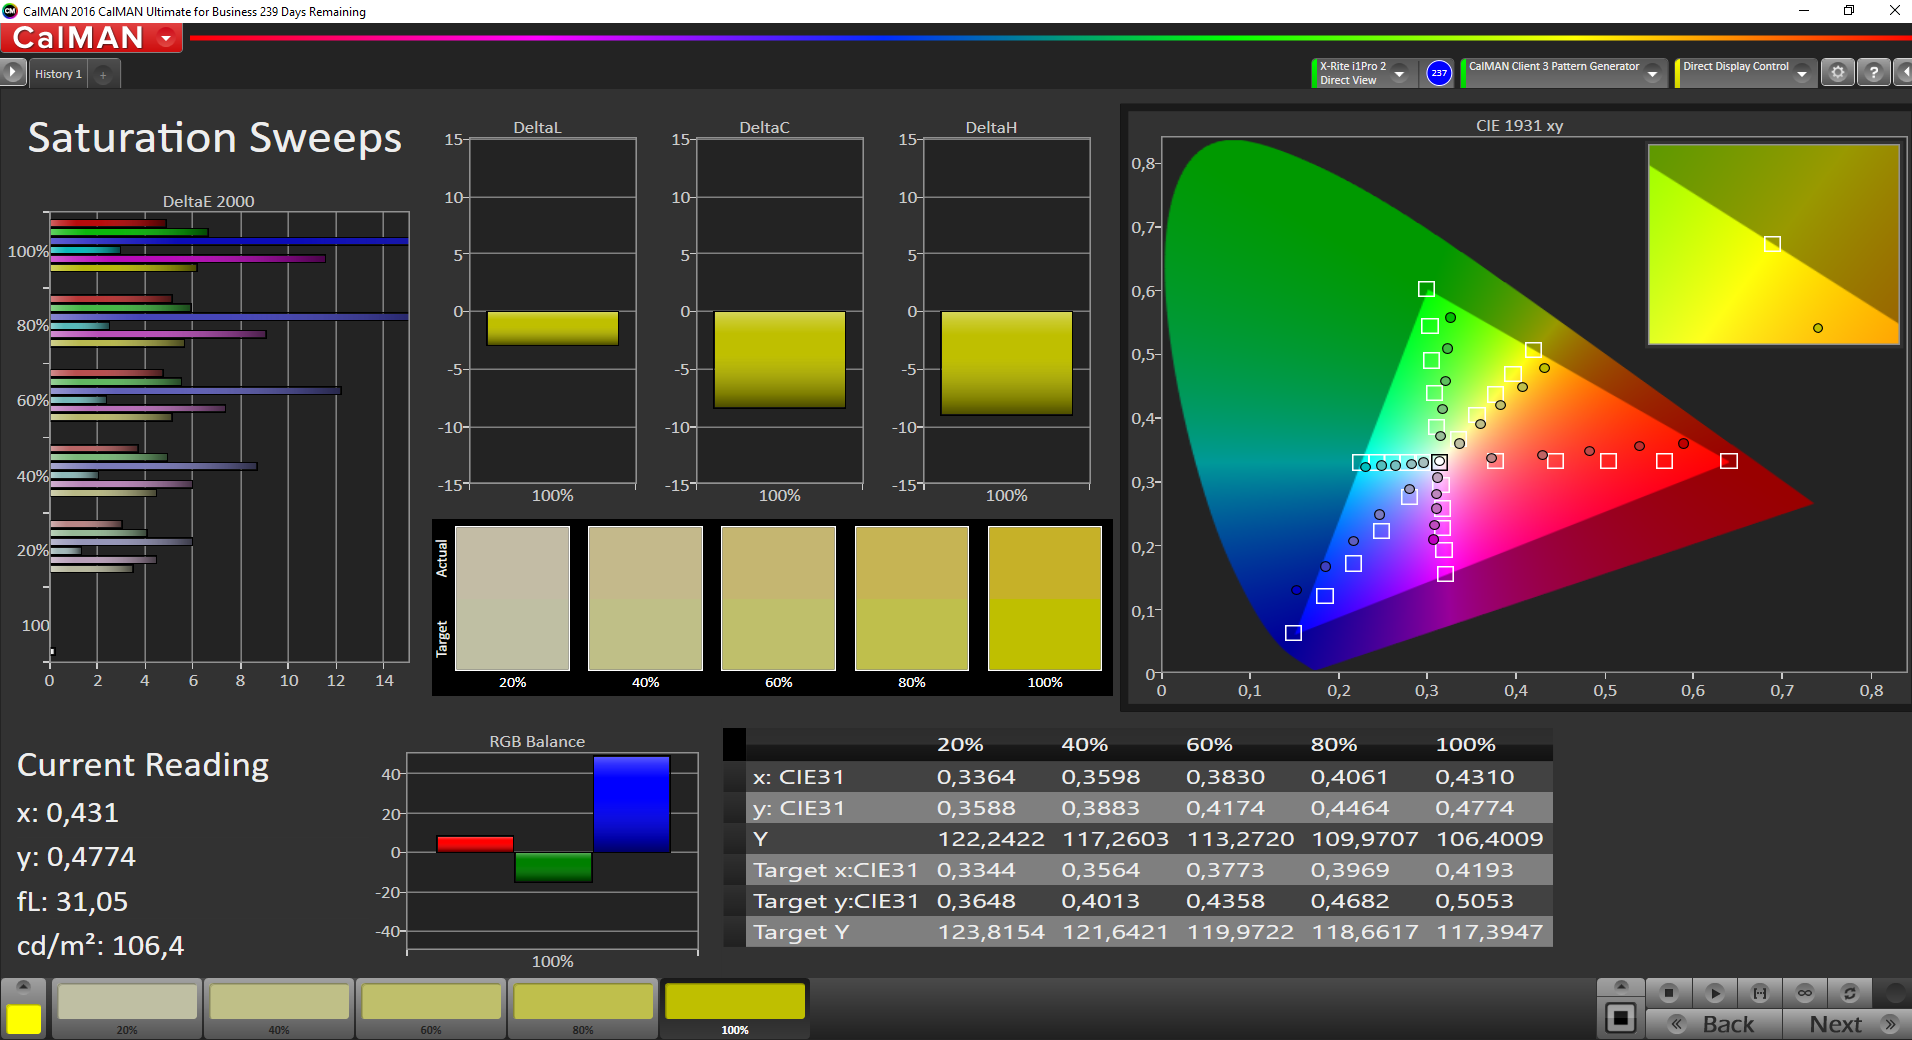
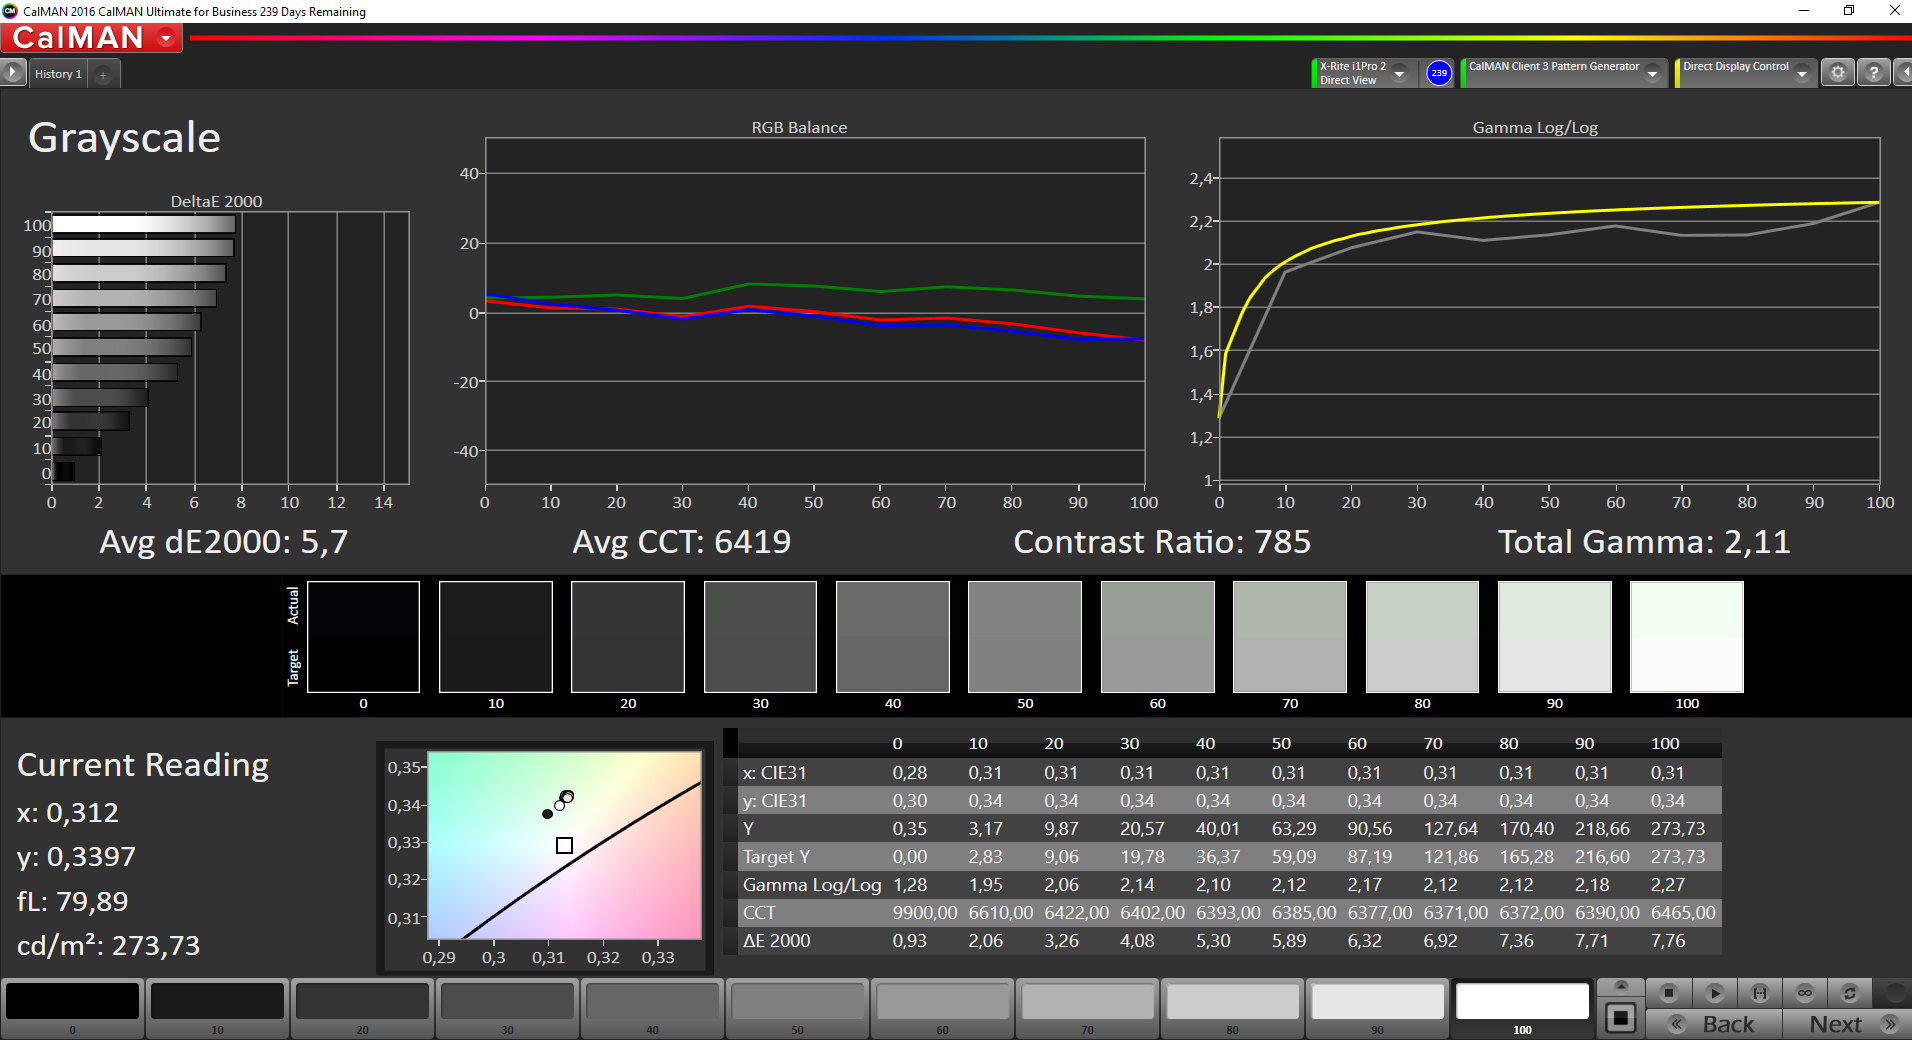


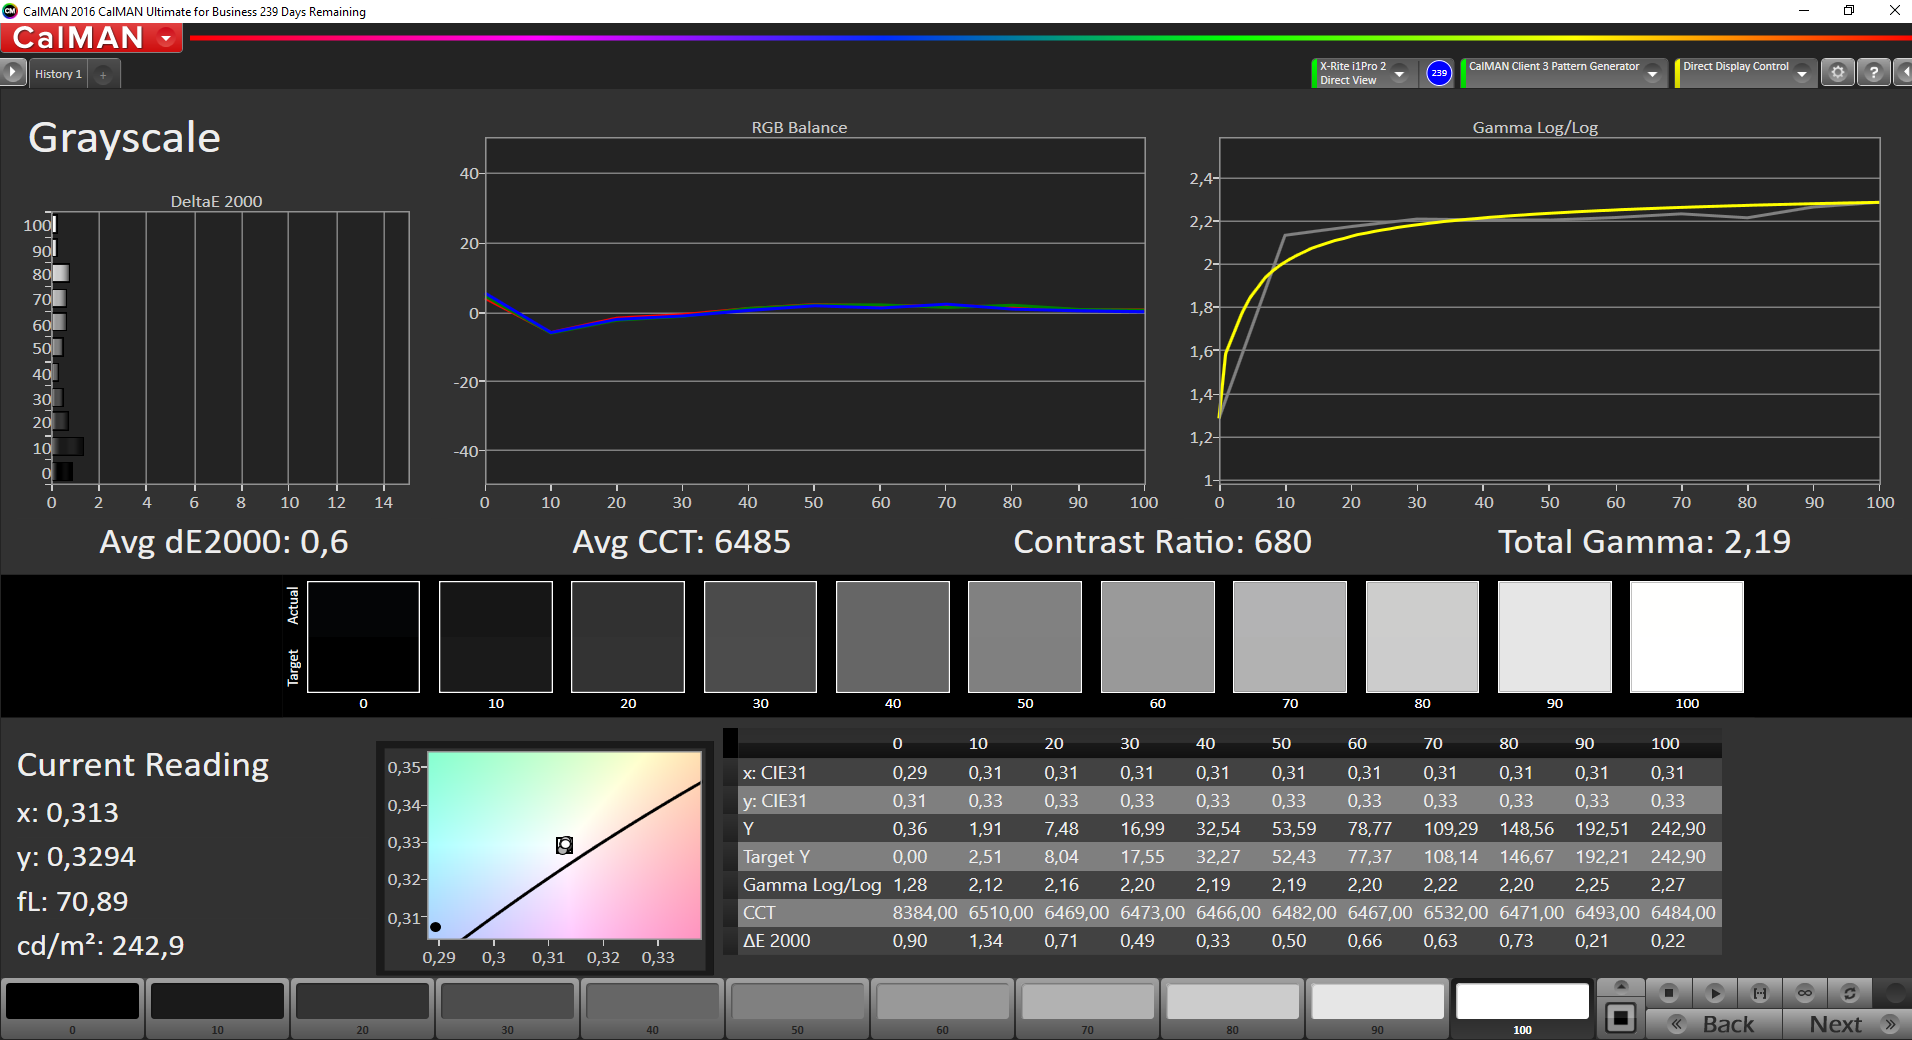
The contrast ratio of 783:1 is considerably better than what competing models with TN panels can offer. However, in the broader field of the IPS displays, this result is average. Straight out of the box, the panel has a slight green cast, which can be remedied by way of calibration. For this, you can use our ICC profile, which can be downloaded for free.
The color reproduction of the display should suffice for office use, however one can forget about image editing: 62.4% of the sRGB color space is a weak result, and the screen reveals itself to be an IPS panel of the cheaper sort.
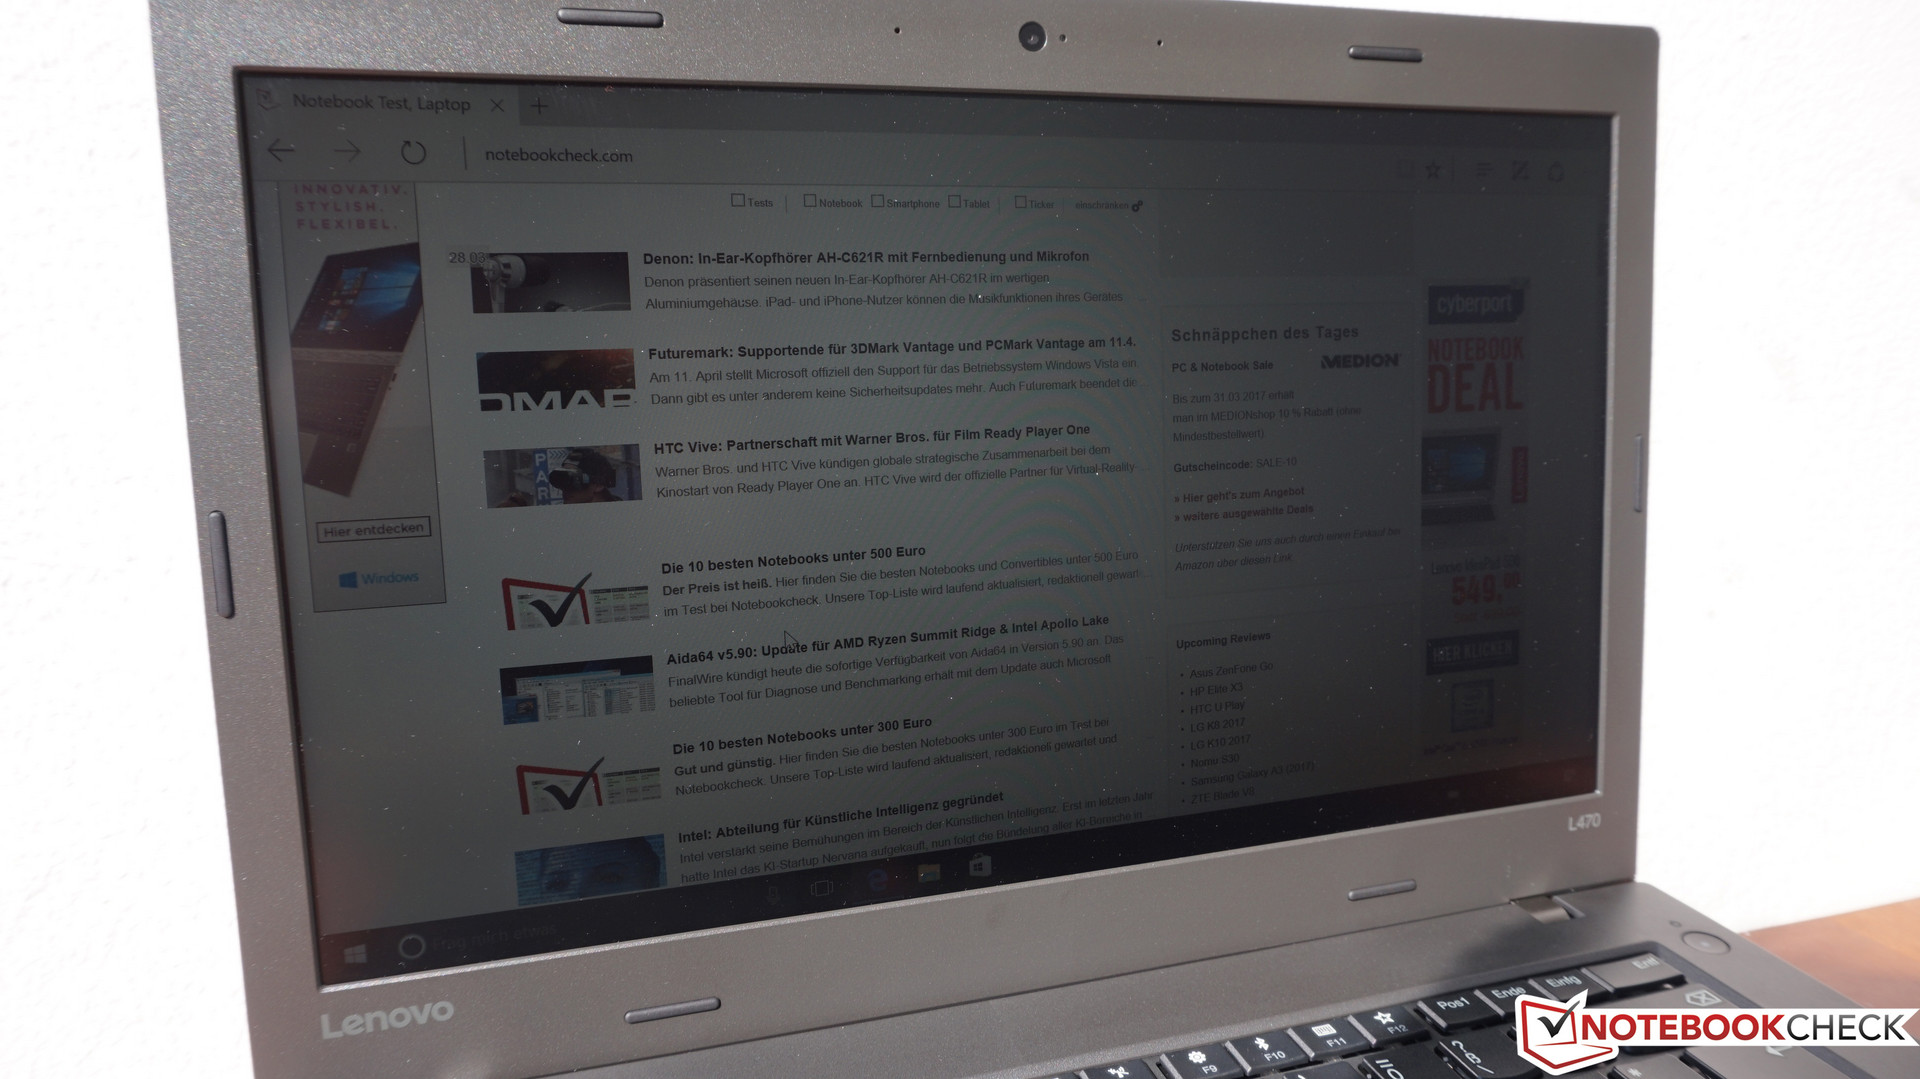
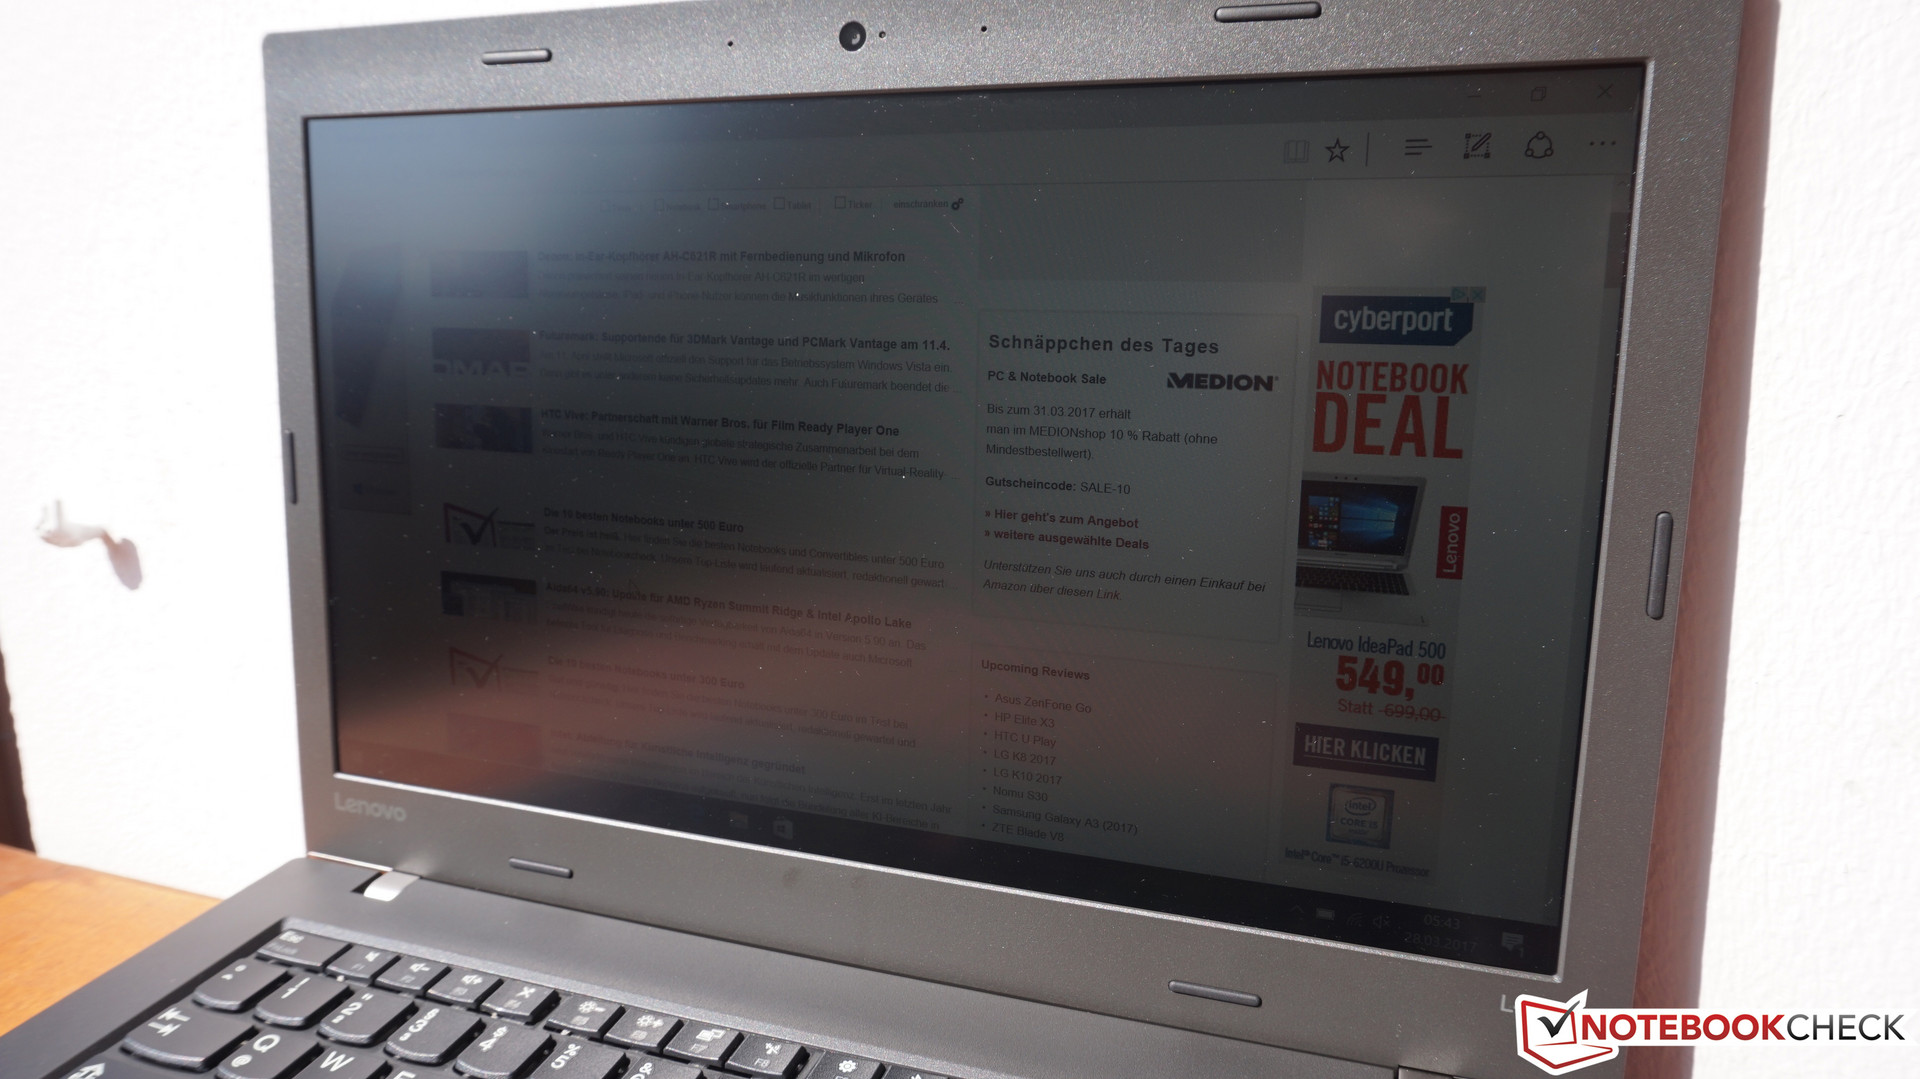
For outdoor use, 250 cd/m² is just enough, and the matte surface of the display helps as well. In the shade, the screen can be read with ease, however one should avoid direct sunlight whenever possible. The panel is not bright enough to be able to cope with it.
Display Response Times
| ↔ Response Time Black to White | ||
|---|---|---|
| 30.8 ms ... rise ↗ and fall ↘ combined | ↗ 16.4 ms rise | 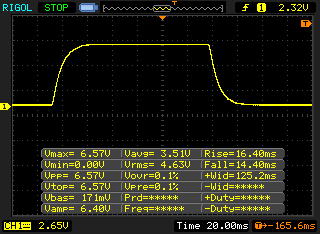 |
| ↘ 14.4 ms fall | ||
| The screen shows slow response rates in our tests and will be unsatisfactory for gamers. In comparison, all tested devices range from 0.1 (minimum) to 240 (maximum) ms. » 83 % of all devices are better. This means that the measured response time is worse than the average of all tested devices (19.8 ms). | ||
| ↔ Response Time 50% Grey to 80% Grey | ||
| 50.4 ms ... rise ↗ and fall ↘ combined | ↗ 27.6 ms rise | 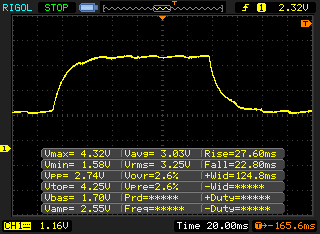 |
| ↘ 22.8 ms fall | ||
| The screen shows slow response rates in our tests and will be unsatisfactory for gamers. In comparison, all tested devices range from 0.165 (minimum) to 636 (maximum) ms. » 87 % of all devices are better. This means that the measured response time is worse than the average of all tested devices (30.9 ms). | ||
Screen Flickering / PWM (Pulse-Width Modulation)
| Screen flickering / PWM not detected | 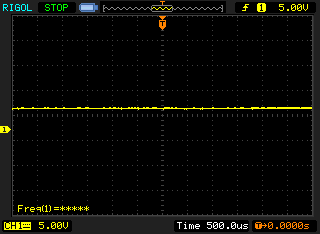 | ||
In comparison: 52 % of all tested devices do not use PWM to dim the display. If PWM was detected, an average of 7741 (minimum: 5 - maximum: 343500) Hz was measured. | |||
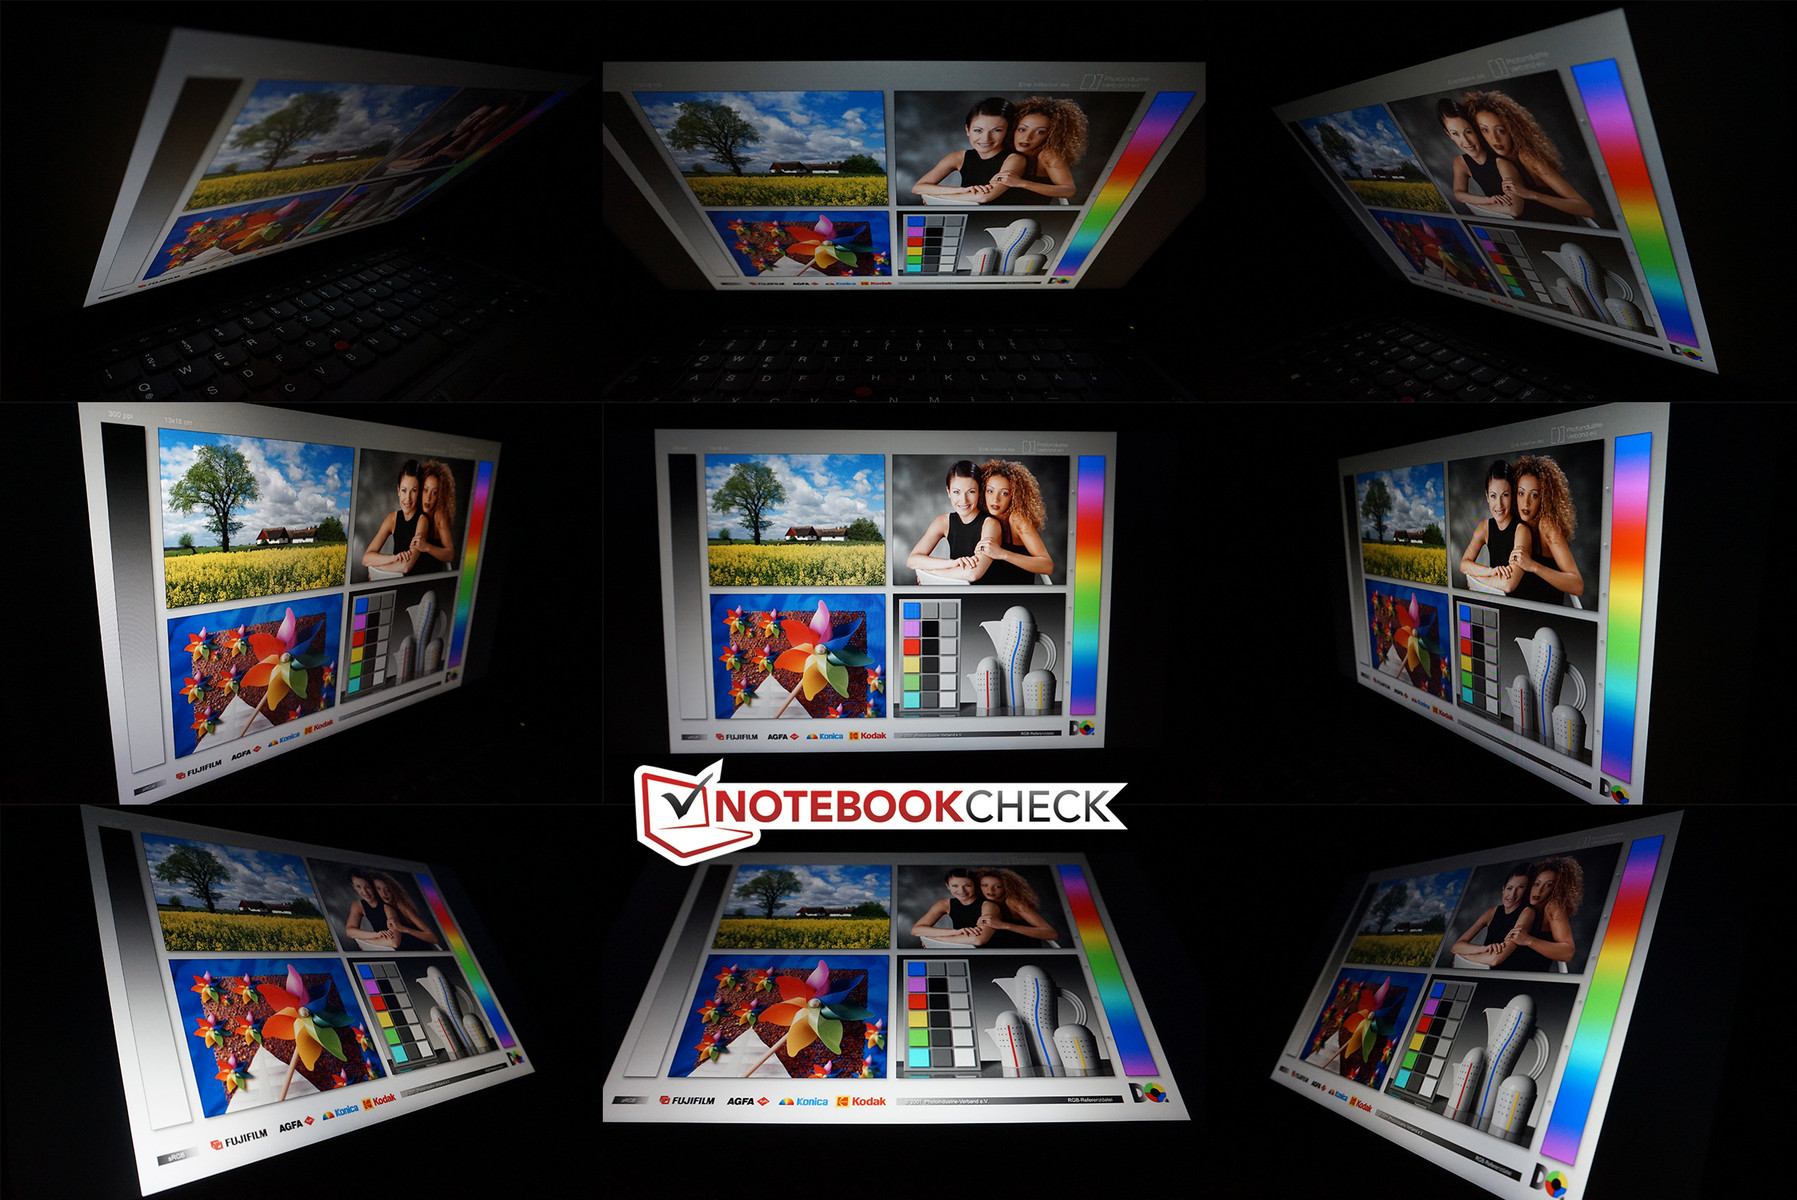
Unlike with a TN display, the colors do not get inverted on IPS screens. The brightness falls considerably at extreme angles, which is apparently the case with the L470. There are significantly better IPS panels out there, however the display of the L470 is more than fit for work despite its brightness drops.
Performance
Lenovo offers its ThinkPads both as pre-configured models in various retail stores and as configurable laptops on its website (one can configure one’s own laptop in the configurator on Lenovo’s website). If one wishes to get the lowest-priced configuration of the L470, then one must order it directly from Lenovo. In this lowest configuration (Intel Celeron 3965U, 500 GB HDD, HD LCD display, 4 GB of RAM), it costs 540 Euros (~$628). The best possible configuration is comprised of a 512 GB PCIe SSD, 16 GB of DDR4 2133 RAM (expandable up to 32 GB), the Intel Core i7-7500U, LTE in the form of the Qualcomm Snapdragon X7 LTE modem as well as the AMD Radeon M430 (2GB) GPU and the Full HD IPS panel. In such a configuration, the L470 costs 1400 Euros (~$1628). As previously mentioned, our review device, with a regular price of 850 Euros (~$988), finds its place in the middle of the field.
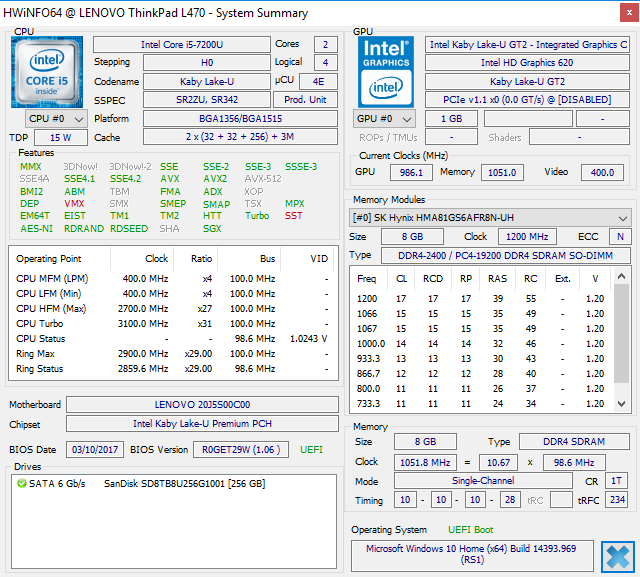
Processor
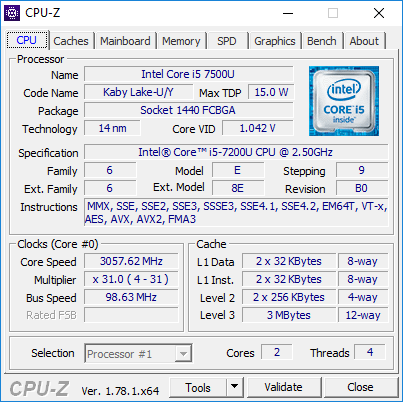
The Intel Core i5-7200U is a widespread ultra-low-voltage CPU with two cores and a maximum TDP of 15 watts. Both cores (four threads thanks to Hyperthreading) operate at 2.5 GHz (base clock) and 3.1 GHz (boost clock). For comparisons with other CPUs, look at the “CPU Benchmarks” section.
We simulate a continuous load for the CPU via a Cinebench loop by running the Cinebench R15 Multi-Core CPU benchmark for 30 minutes. During this stress test, we have not observed any drops in performance; the L470 consistently delivers a result of some 317 points.
The maximum result that we have measured in one Cinebench R15 Multi-Core benchmark run was 320 points – not perfect for the Core i5-7200U, which has the potential to reach some 330 points, but it is not too bad, either.
When running on battery power, the CPU can achieve the same performance as when the notebook is plugged in.
System Performance
In the PCMark benchmarks that we use to evaluate the overall system performance, our review device does not do particularly well, when compared to the competition. However, these small differences do not amount to much in everyday use.
| PCMark 8 Home Score Accelerated v2 | 3294 points | |
| PCMark 8 Creative Score Accelerated v2 | 4172 points | |
| PCMark 8 Work Score Accelerated v2 | 4111 points | |
Help | ||
Storage Devices
The supplied SATA III SSD from the manufacturer SanDisk is an unequivocal representative of the low-priced flash-based storage devices. We have already tested the SSD with the model number X400 in our review of the E470, where it delivered similar results. The Samsung PCIe SSD P961, which can be found in the ThinkPad T470, is significantly faster.
The L470 also offers optional PCIe SSDs – an advantage over the E470, which is limited only to SATA III. However, it should be noted that the SSDs are connected via PCIe x2, which can lead to limited performance with very fast PCIe NVMe SSDs that use PCIe x4, if one puts one of those SSDs in the L470 afterwards.
For comparisons with other SATA III SSDs, PCIe SSDs and hard drives, take a look at our “SSD/HDD Benchmarks” section.
| Lenovo ThinkPad L470-20J5S00C00 SanDisk X400 256GB, SATA (SD8SB8U-256G) | Lenovo ThinkPad T470-20HD002HGE Samsung PM961 NVMe MZVLW512HMJP | Lenovo ThinkPad E470-20H2S00400 SanDisk X400 SED 256GB, SATA (SD8TB8U-256G) | HP ProBook 440 G4-Y8B51EA SanDisk SD8SNAT256G1002 | HP ProBook 640 G3 Z2W33ET Samsung PM951 NVMe MZVLV256 | Dell Latitude 5480 Toshiba SG5 256GB THNSNK256GVN8 | Lenovo ThinkPad L460-20FVS01400 Toshiba HG6 THNSFJ256GCSU | |
|---|---|---|---|---|---|---|---|
| CrystalDiskMark 3.0 | 116% | -2% | -14% | 57% | 3% | -7% | |
| Read Seq (MB/s) | 495.2 | 1155 133% | 476.5 -4% | 491.2 -1% | 1285 159% | 469.4 -5% | 480.9 -3% |
| Write Seq (MB/s) | 485.7 | 1076 122% | 458.7 -6% | 322.2 -34% | 283.6 -42% | 264.8 -45% | 426.4 -12% |
| Read 512 (MB/s) | 323.4 | 811 151% | 346.4 7% | 310.1 -4% | 679 110% | 408.1 26% | 361.8 12% |
| Write 512 (MB/s) | 291.5 | 862 196% | 291.1 0% | 276 -5% | 300.8 3% | 265.5 -9% | 220.9 -24% |
| Read 4k (MB/s) | 34.2 | 55.5 62% | 35.15 3% | 19.57 -43% | 41.79 22% | 24.66 -28% | 21.51 -37% |
| Write 4k (MB/s) | 74.3 | 134.6 81% | 78.8 6% | 77.8 5% | 138.6 87% | 114.8 55% | 71.5 -4% |
| Read 4k QD32 (MB/s) | 321.3 | 496.2 54% | 276 -14% | 146.3 -54% | 507 58% | 380.3 18% | 277.6 -14% |
| Write 4k QD32 (MB/s) | 188 | 425.4 126% | 178.3 -5% | 241.4 28% | 293.3 56% | 207.2 10% | 230.4 23% |

Graphics Card
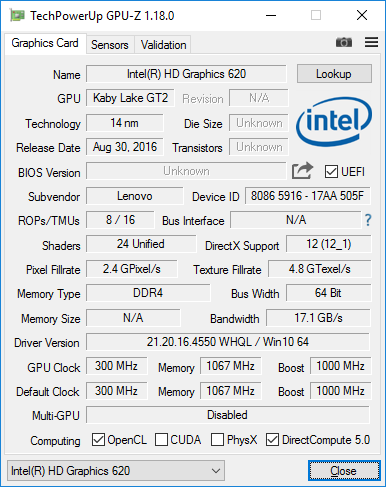
There is an optional dedicated GPU, in the form of the AMD Radeon R5 M430, for the L470, however our review device comes equipped with the integrated Intel HD Graphics 620. As an iGPU, the HD 620 has to rely on the RAM; the graphics chip itself has 24 executive units at its disposal. As the standard graphics unit of the 7th generation of the Intel Core i CPUs, the HD 620 is one of the most often tested GPUs on Notebookcheck. Our “GPU Benchmarks” section enables one to compare the HD 620 GPU with many other graphics chips.
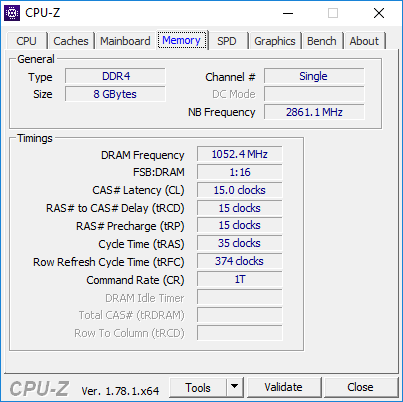
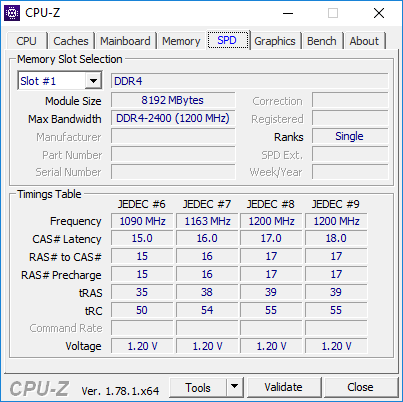
The GPU benchmark results of our review device are below those of many competitors. This can be explained easily, Lenovo equips our review device with 8 GB of RAM in the form of a single memory module. Therefore, the system runs in slower single channel mode, which means that the GPU, which has to rely on the RAM, is correspondingly slower. A small increase in performance is possible if one installs another RAM module.
Unlike the CPU, the GPU is limited when running on battery power. With 730 points, it achieves only half of the score it reached when the device was plugged in.
| 3DMark 11 Performance | 1540 points | |
| 3DMark Ice Storm Standard Score | 55477 points | |
| 3DMark Cloud Gate Standard Score | 5839 points | |
| 3DMark Fire Strike Score | 771 points | |
Help | ||
Gaming Performance
iGPUs, such as the Intel HD Graphics 620, are not intended for PC games, just like the L470 itself. Therefore, the poor results in the gaming benchmarks are not surprising. With a second RAM module, the result can be potentially improved. However, even the entry-level graphics card AMD Radeon R5 M430 will not turn the L470 into a gaming notebook.
| low | med. | high | ultra | |
|---|---|---|---|---|
| BioShock Infinite (2013) | 41.4 | 23.1 | 19.6 | 6.5 |
| Battlefield 4 (2013) | 30.4 | 24.7 | 16.1 | |
| The Witcher 3 (2015) | 13.4 |
Emissions
System Noise
At idle, the fan of the review device is turned off, however it is not silent. Unfortunately, the L470 joins the ranks of the devices that suffer from coil whine, which is especially annoying here.
When utilizing both the CPU and the GPU, the fan begins to spin, however, with 35.4 dB(A), it is not excessively loud. Interestingly enough, it works louder under pure CPU load with Prime95, where it reaches 37.5 dB(A). However, this is also well within reasonable bounds.
Noise level
| Idle |
| 29.3 / 29.3 / 29.3 dB(A) |
| Load |
| 33.8 / 37.5 dB(A) |
 | ||
30 dB silent 40 dB(A) audible 50 dB(A) loud |
||
min: | ||
Temperature
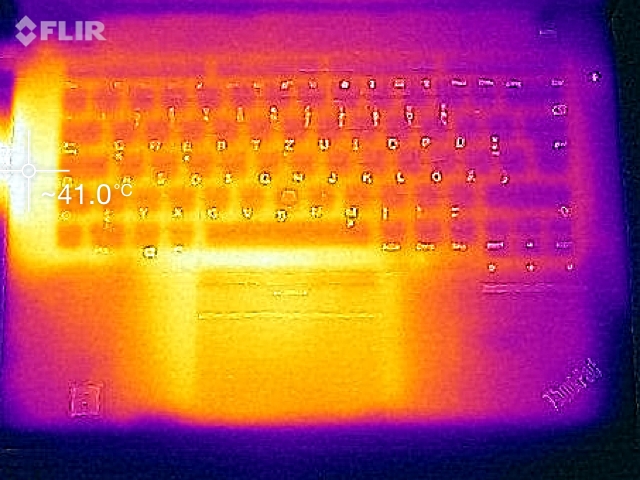
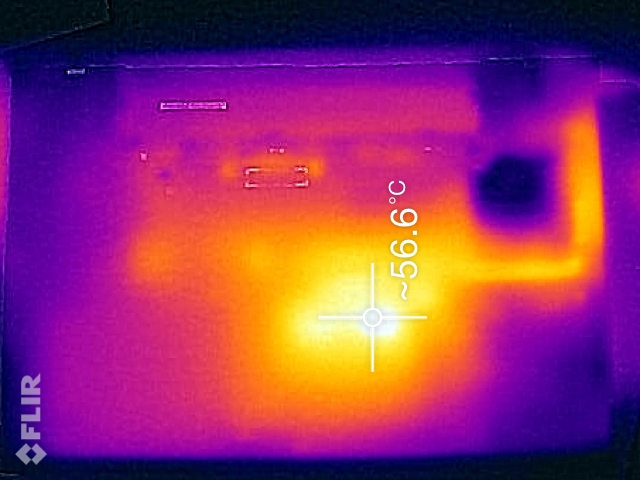
At idle, the case does not heat up, however under load it can get noticeably hot. Above all, keeping the device in one’s lap can become uncomfortable, because here the temperatures exceed the 50 °C mark (122 °F). We have measured the maximum temperature of 56.6 °C (~134 °F) at the fan vents.
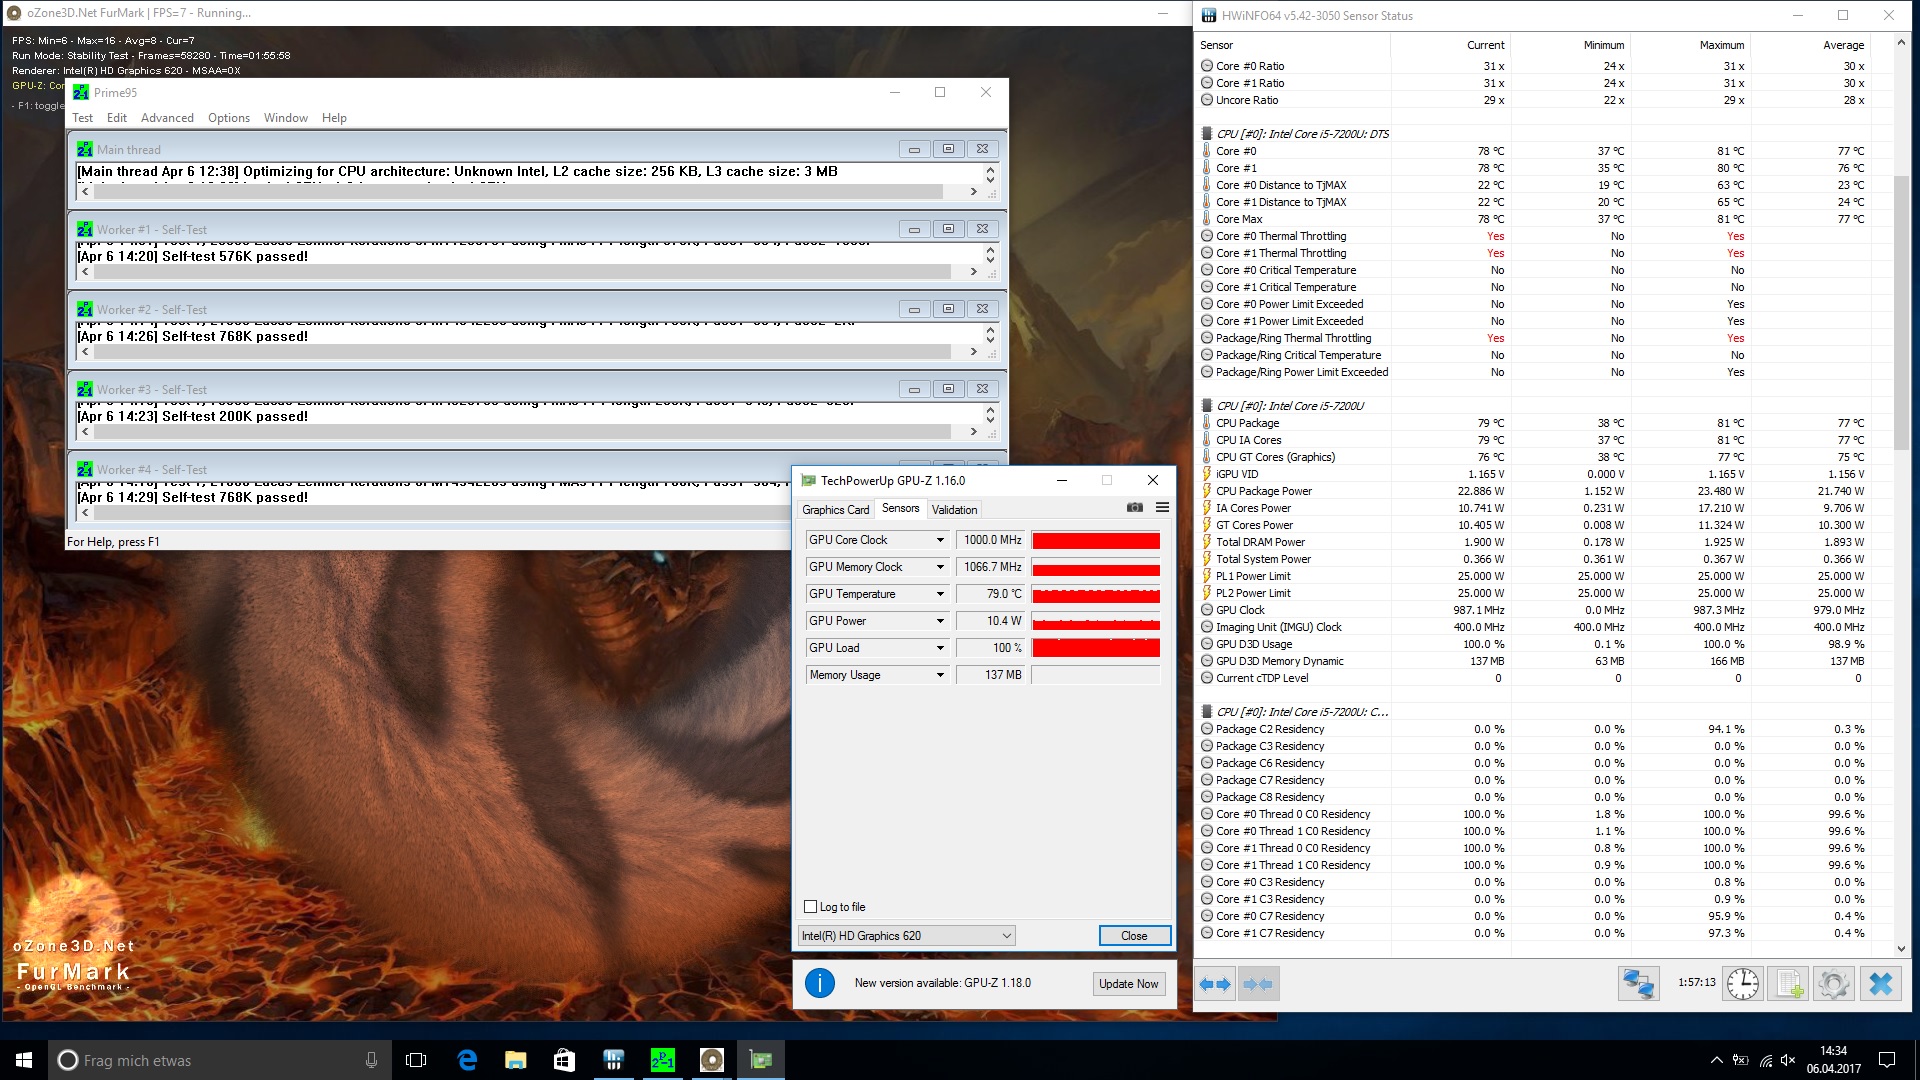
We conduct our stress test with Prime95 and FurMark. Under simultaneous CPU and GPU load, the system draws 22.5 watts, which is possible, given that Lenovo has specified a maximum TDP of 25 watts. Therefore, our review device can continuously maintain its full performance, with one limitation: After 30 minutes the CPU temperatures reach 80 °C (176 °F). At this point, the CPU throttles down to 2.4 GHz and a power draw of 17.2 watts, until it cools down and then operates at 3.1 GHz again. This sequence repeats itself until the end of the stress test.
The 3DMark11 benchmark that we ran right after the stress test handed in normal results.
(±) The maximum temperature on the upper side is 40.1 °C / 104 F, compared to the average of 34.3 °C / 94 F, ranging from 21.2 to 62.5 °C for the class Office.
(-) The bottom heats up to a maximum of 51 °C / 124 F, compared to the average of 36.8 °C / 98 F
(+) In idle usage, the average temperature for the upper side is 21.6 °C / 71 F, compared to the device average of 29.5 °C / 85 F.
(±) The palmrests and touchpad can get very hot to the touch with a maximum of 37.2 °C / 99 F.
(-) The average temperature of the palmrest area of similar devices was 27.6 °C / 81.7 F (-9.6 °C / -17.3 F).
Speakers
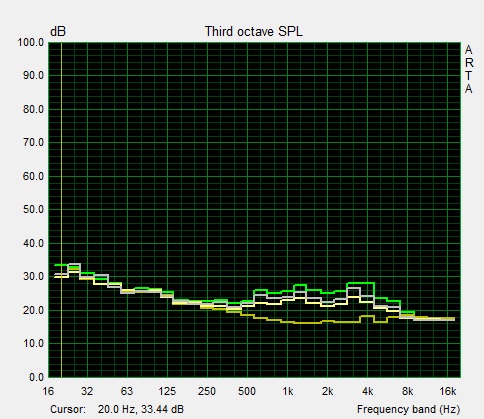
With an office/business notebook, the speakers are not the focus. Windows sounds and video conferences are presumably what these speakers, which are located on the underside, were intended for. These speakers have poor sound and are not fit for listening to music because the bass is missing completely and the speakers are not particularly loud.
While the built-in speakers can serve as a stop-gap solution when trying to listen to music, the 3.5-mm audio jack delivers an impeccable sound to a pair of external speakers or headphones.
Lenovo ThinkPad L470-20J5S00C00 audio analysis
(±) | speaker loudness is average but good (80 dB)
Bass 100 - 315 Hz
(-) | nearly no bass - on average 15.9% lower than median
(±) | linearity of bass is average (10% delta to prev. frequency)
Mids 400 - 2000 Hz
(±) | higher mids - on average 5.6% higher than median
(±) | linearity of mids is average (8.6% delta to prev. frequency)
Highs 2 - 16 kHz
(+) | balanced highs - only 1.9% away from median
(+) | highs are linear (5% delta to prev. frequency)
Overall 100 - 16.000 Hz
(±) | linearity of overall sound is average (18.8% difference to median)
Compared to same class
» 35% of all tested devices in this class were better, 7% similar, 58% worse
» The best had a delta of 7%, average was 21%, worst was 53%
Compared to all devices tested
» 44% of all tested devices were better, 8% similar, 49% worse
» The best had a delta of 4%, average was 23%, worst was 134%
Lenovo ThinkPad T470-20HD002HGE audio analysis
(±) | speaker loudness is average but good (80.4 dB)
Bass 100 - 315 Hz
(-) | nearly no bass - on average 16.6% lower than median
(±) | linearity of bass is average (8.8% delta to prev. frequency)
Mids 400 - 2000 Hz
(+) | balanced mids - only 4.3% away from median
(+) | mids are linear (6.7% delta to prev. frequency)
Highs 2 - 16 kHz
(±) | higher highs - on average 5.4% higher than median
(±) | linearity of highs is average (13.3% delta to prev. frequency)
Overall 100 - 16.000 Hz
(±) | linearity of overall sound is average (18.7% difference to median)
Compared to same class
» 35% of all tested devices in this class were better, 6% similar, 59% worse
» The best had a delta of 7%, average was 21%, worst was 53%
Compared to all devices tested
» 43% of all tested devices were better, 8% similar, 49% worse
» The best had a delta of 4%, average was 23%, worst was 134%
frequency diagram in comparison (checkboxes can be checked and unchecked!)
Energy Management
Energy Consumption
In terms of energy consumption, the L470 beats every device that we have selected for comparison purposes, except for the HP ProBook 640 G3. The ProBook performs better in every category, whether it is under load or at idle. All in all, Lenovo seems to have done a great job optimizing the L470 for low energy consumption, because its predecessor L460 draws more power both while idling and when under load (which can be attributed to a dedicated GPU).
With 45 watts, the AC adapter can supply the device with enough power without any problems.
| Off / Standby | |
| Idle | |
| Load |
|
Key:
min: | |
| Lenovo ThinkPad L470-20J5S00C00 i5-7200U, HD Graphics 620, SanDisk X400 256GB, SATA (SD8SB8U-256G), IPS, 1920x1080, 14" | Lenovo ThinkPad L460-20FVS01400 6500U, Radeon R5 M330, Toshiba HG6 THNSFJ256GCSU, IPS, 1920x1080, 14" | Lenovo ThinkPad E470-20H2S00400 i5-7200U, GeForce 940MX, SanDisk X400 SED 256GB, SATA (SD8TB8U-256G), IPS, 1920x1080, 14" | HP ProBook 440 G4-Y8B51EA i7-7500U, GeForce 930MX, SanDisk SD8SNAT256G1002, TN, 1920x1080, 14" | HP ProBook 640 G3 Z2W33ET i5-7200U, HD Graphics 620, Samsung PM951 NVMe MZVLV256, TN LED, 1920x1080, 14" | Dell Latitude 5480 i7-7600U, HD Graphics 620, Toshiba SG5 256GB THNSNK256GVN8, IPS, 1920x1080, 14" | Lenovo ThinkPad T470-20HD002HGE i5-7200U, HD Graphics 620, Samsung PM961 NVMe MZVLW512HMJP, IPS, 1920x1080, 14" | |
|---|---|---|---|---|---|---|---|
| Power Consumption | -14% | -18% | -13% | 18% | -31% | 0% | |
| Idle Minimum * (Watt) | 2.6 | 3.1 -19% | 2.7 -4% | 3 -15% | 2.3 12% | 6.64 -155% | 3.21 -23% |
| Idle Average * (Watt) | 6.3 | 6.3 -0% | 5.5 13% | 5.4 14% | 5.2 17% | 6.67 -6% | 6.15 2% |
| Idle Maximum * (Watt) | 7 | 7.9 -13% | 6.5 7% | 6.3 10% | 5.6 20% | 7.78 -11% | 6.82 3% |
| Load Average * (Watt) | 29.1 | 29.5 -1% | 44.2 -52% | 37.5 -29% | 27.2 7% | 30.83 -6% | 28.5 2% |
| Load Maximum * (Watt) | 42.3 | 57.3 -35% | 65.2 -54% | 61.1 -44% | 28.7 32% | 31.7 25% | 34.5 18% |
* ... smaller is better
Battery Life
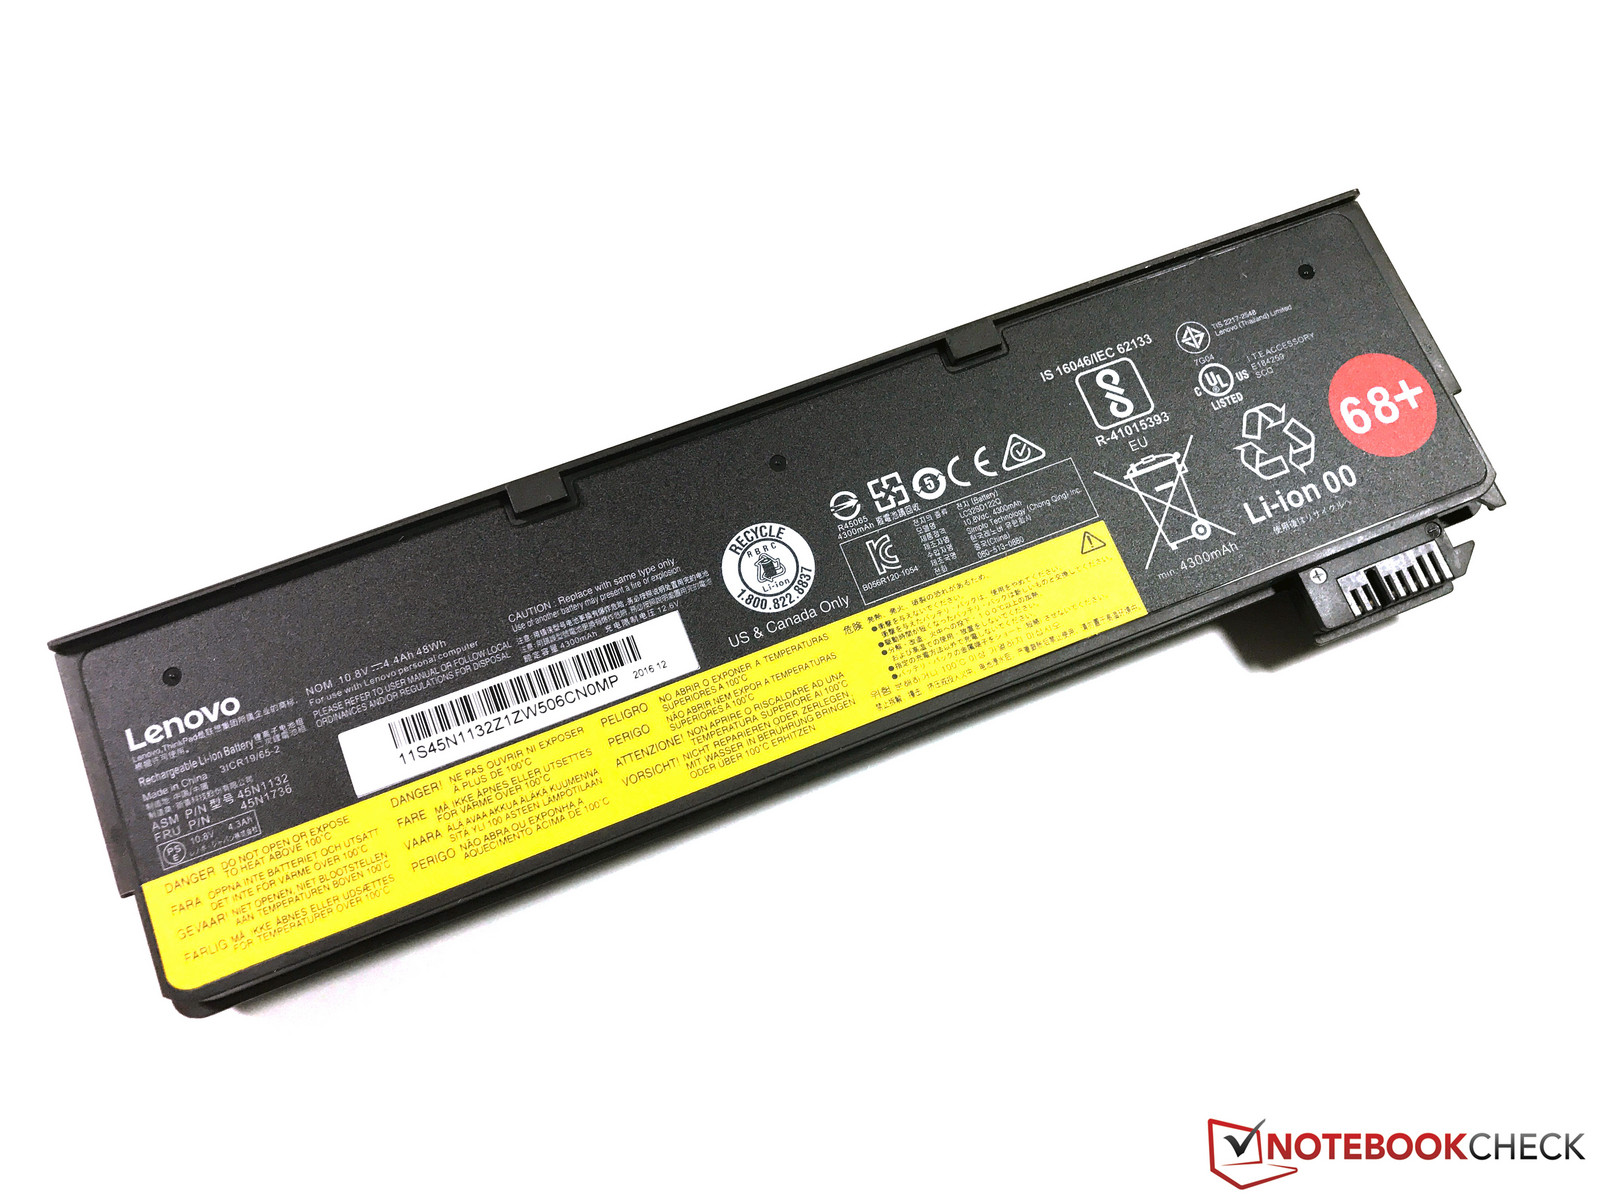
The battery configuration is one of the most important differences between the E470, the T470 and the L470. The E470 has the worst configuration with an internal battery with 45 Wh. The T470 has the best configuration: One small internal battery (23 Wh) that can be combined with an optional (non-protruding) external 23-Wh battery or two larger batteries (48 or 72 Wh) that protrude from the case. Therefore, the T470 can offer up to 95 Wh.
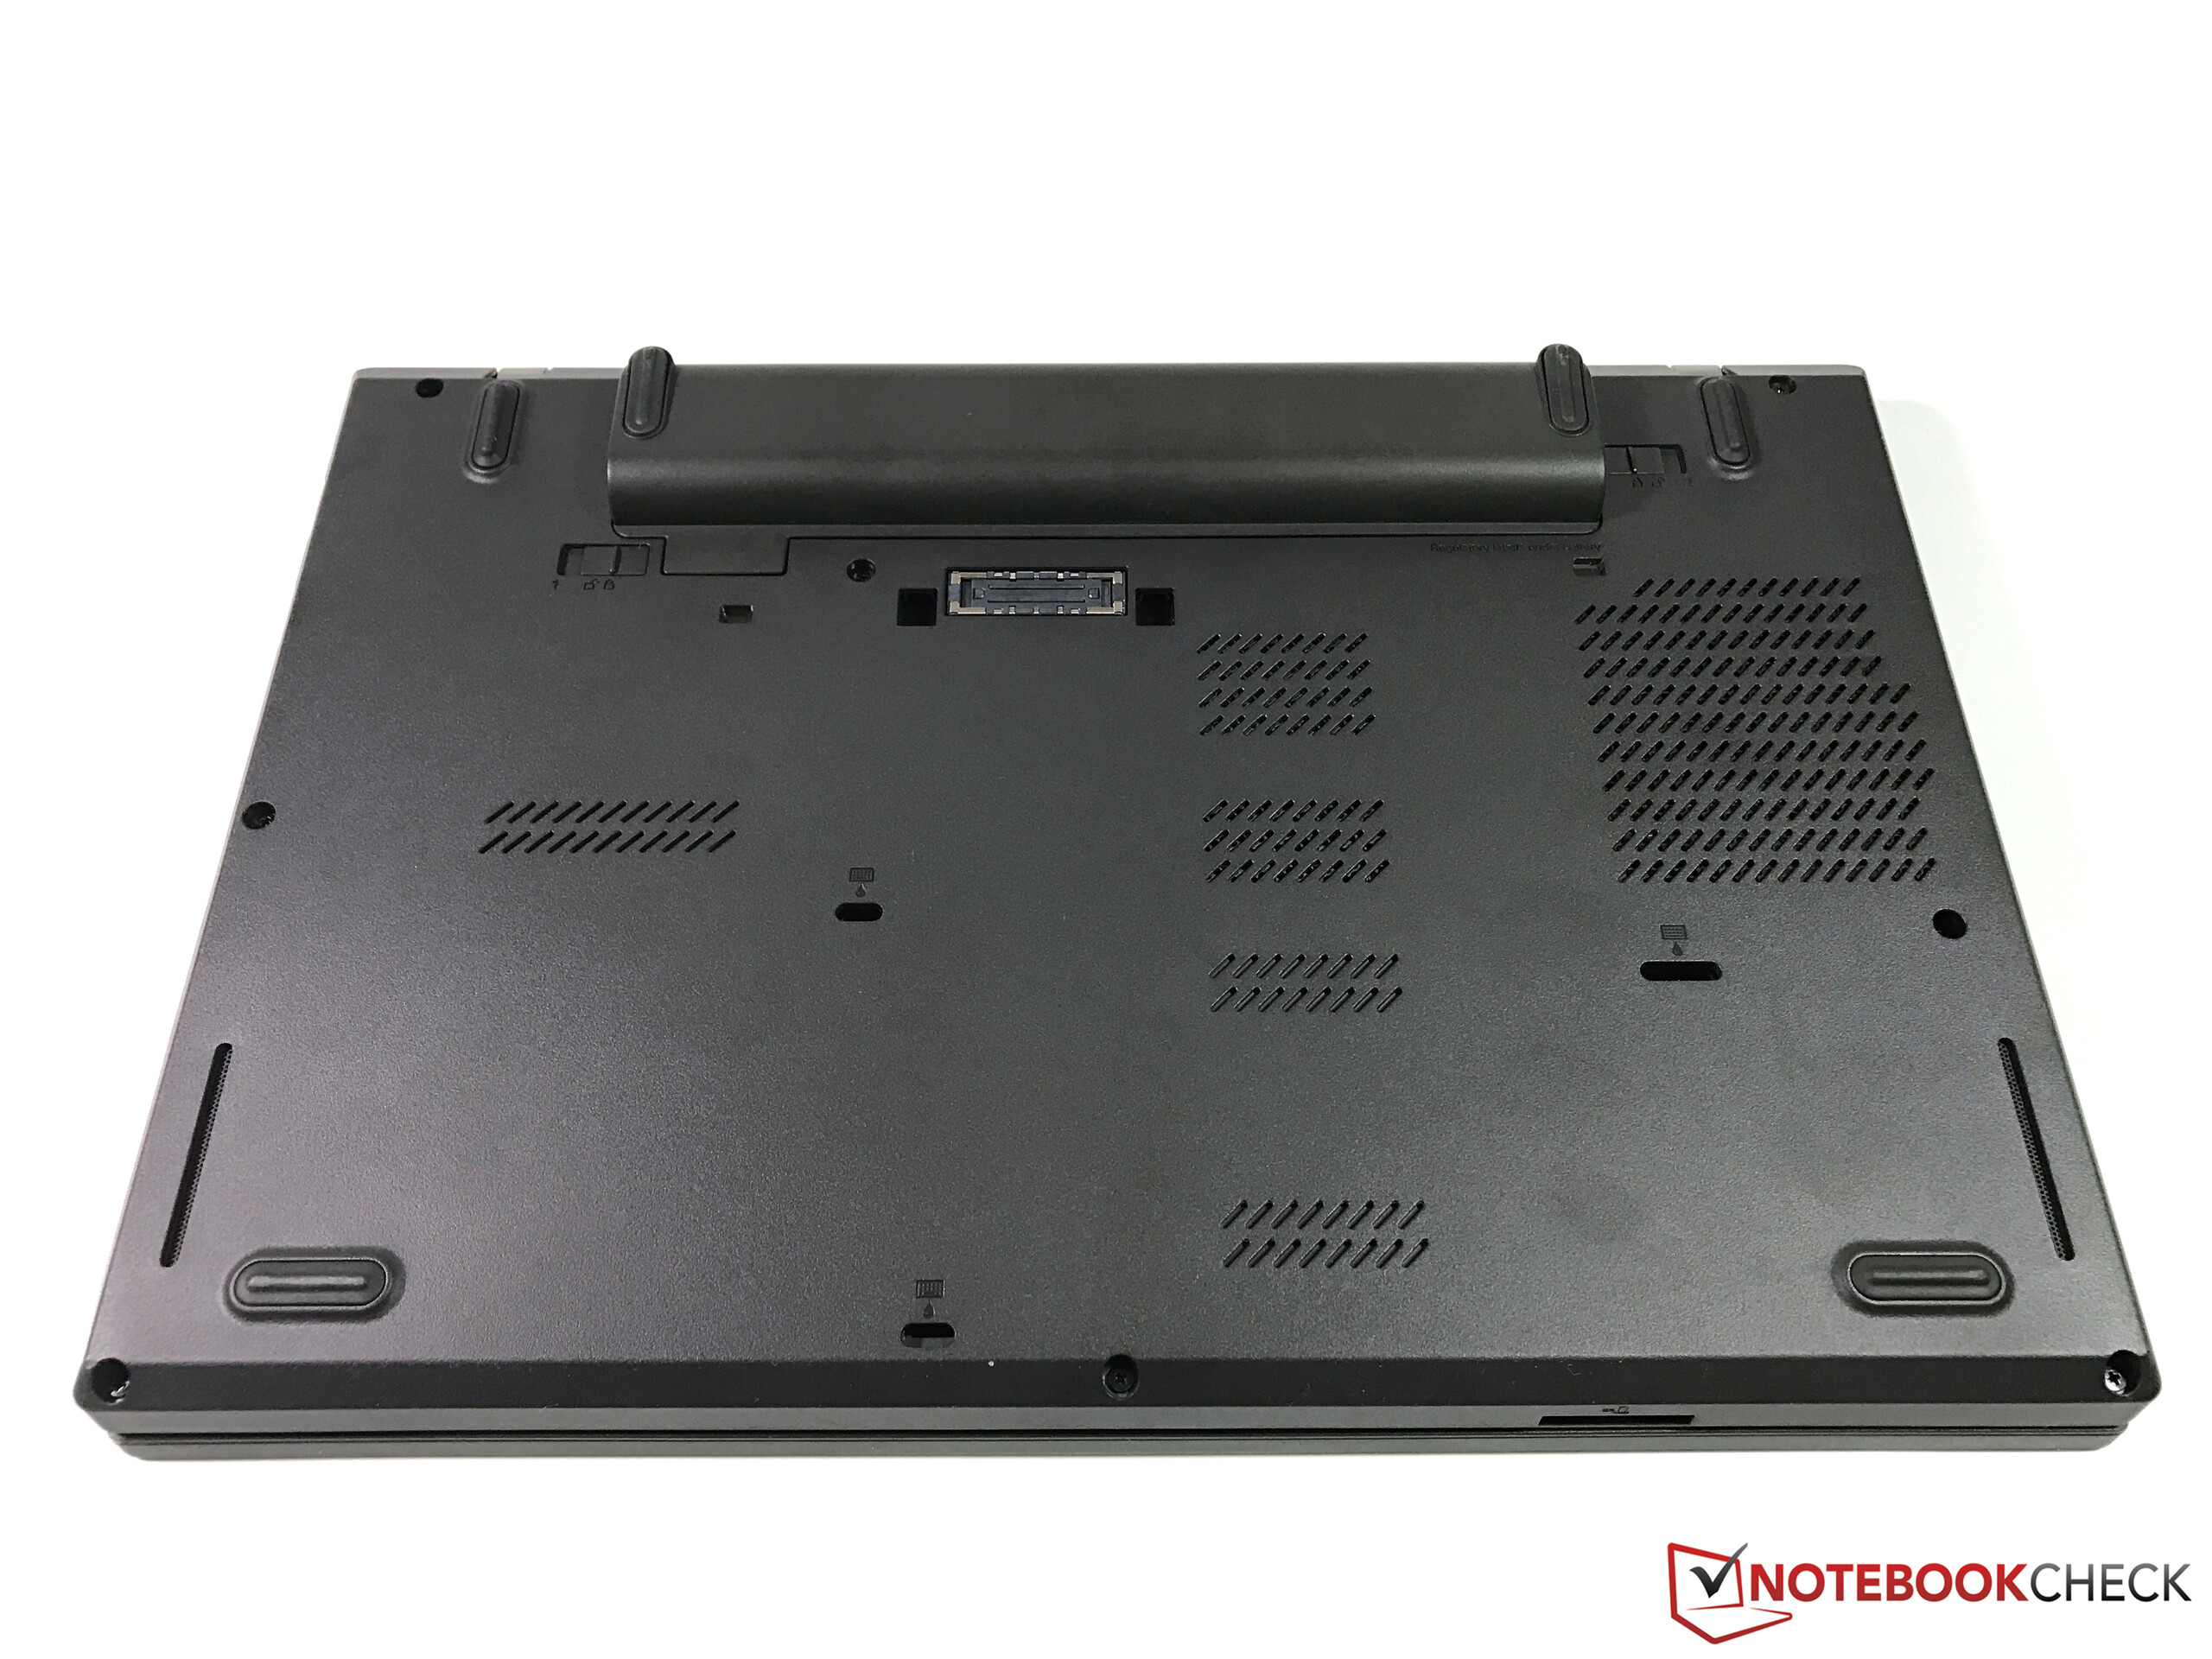
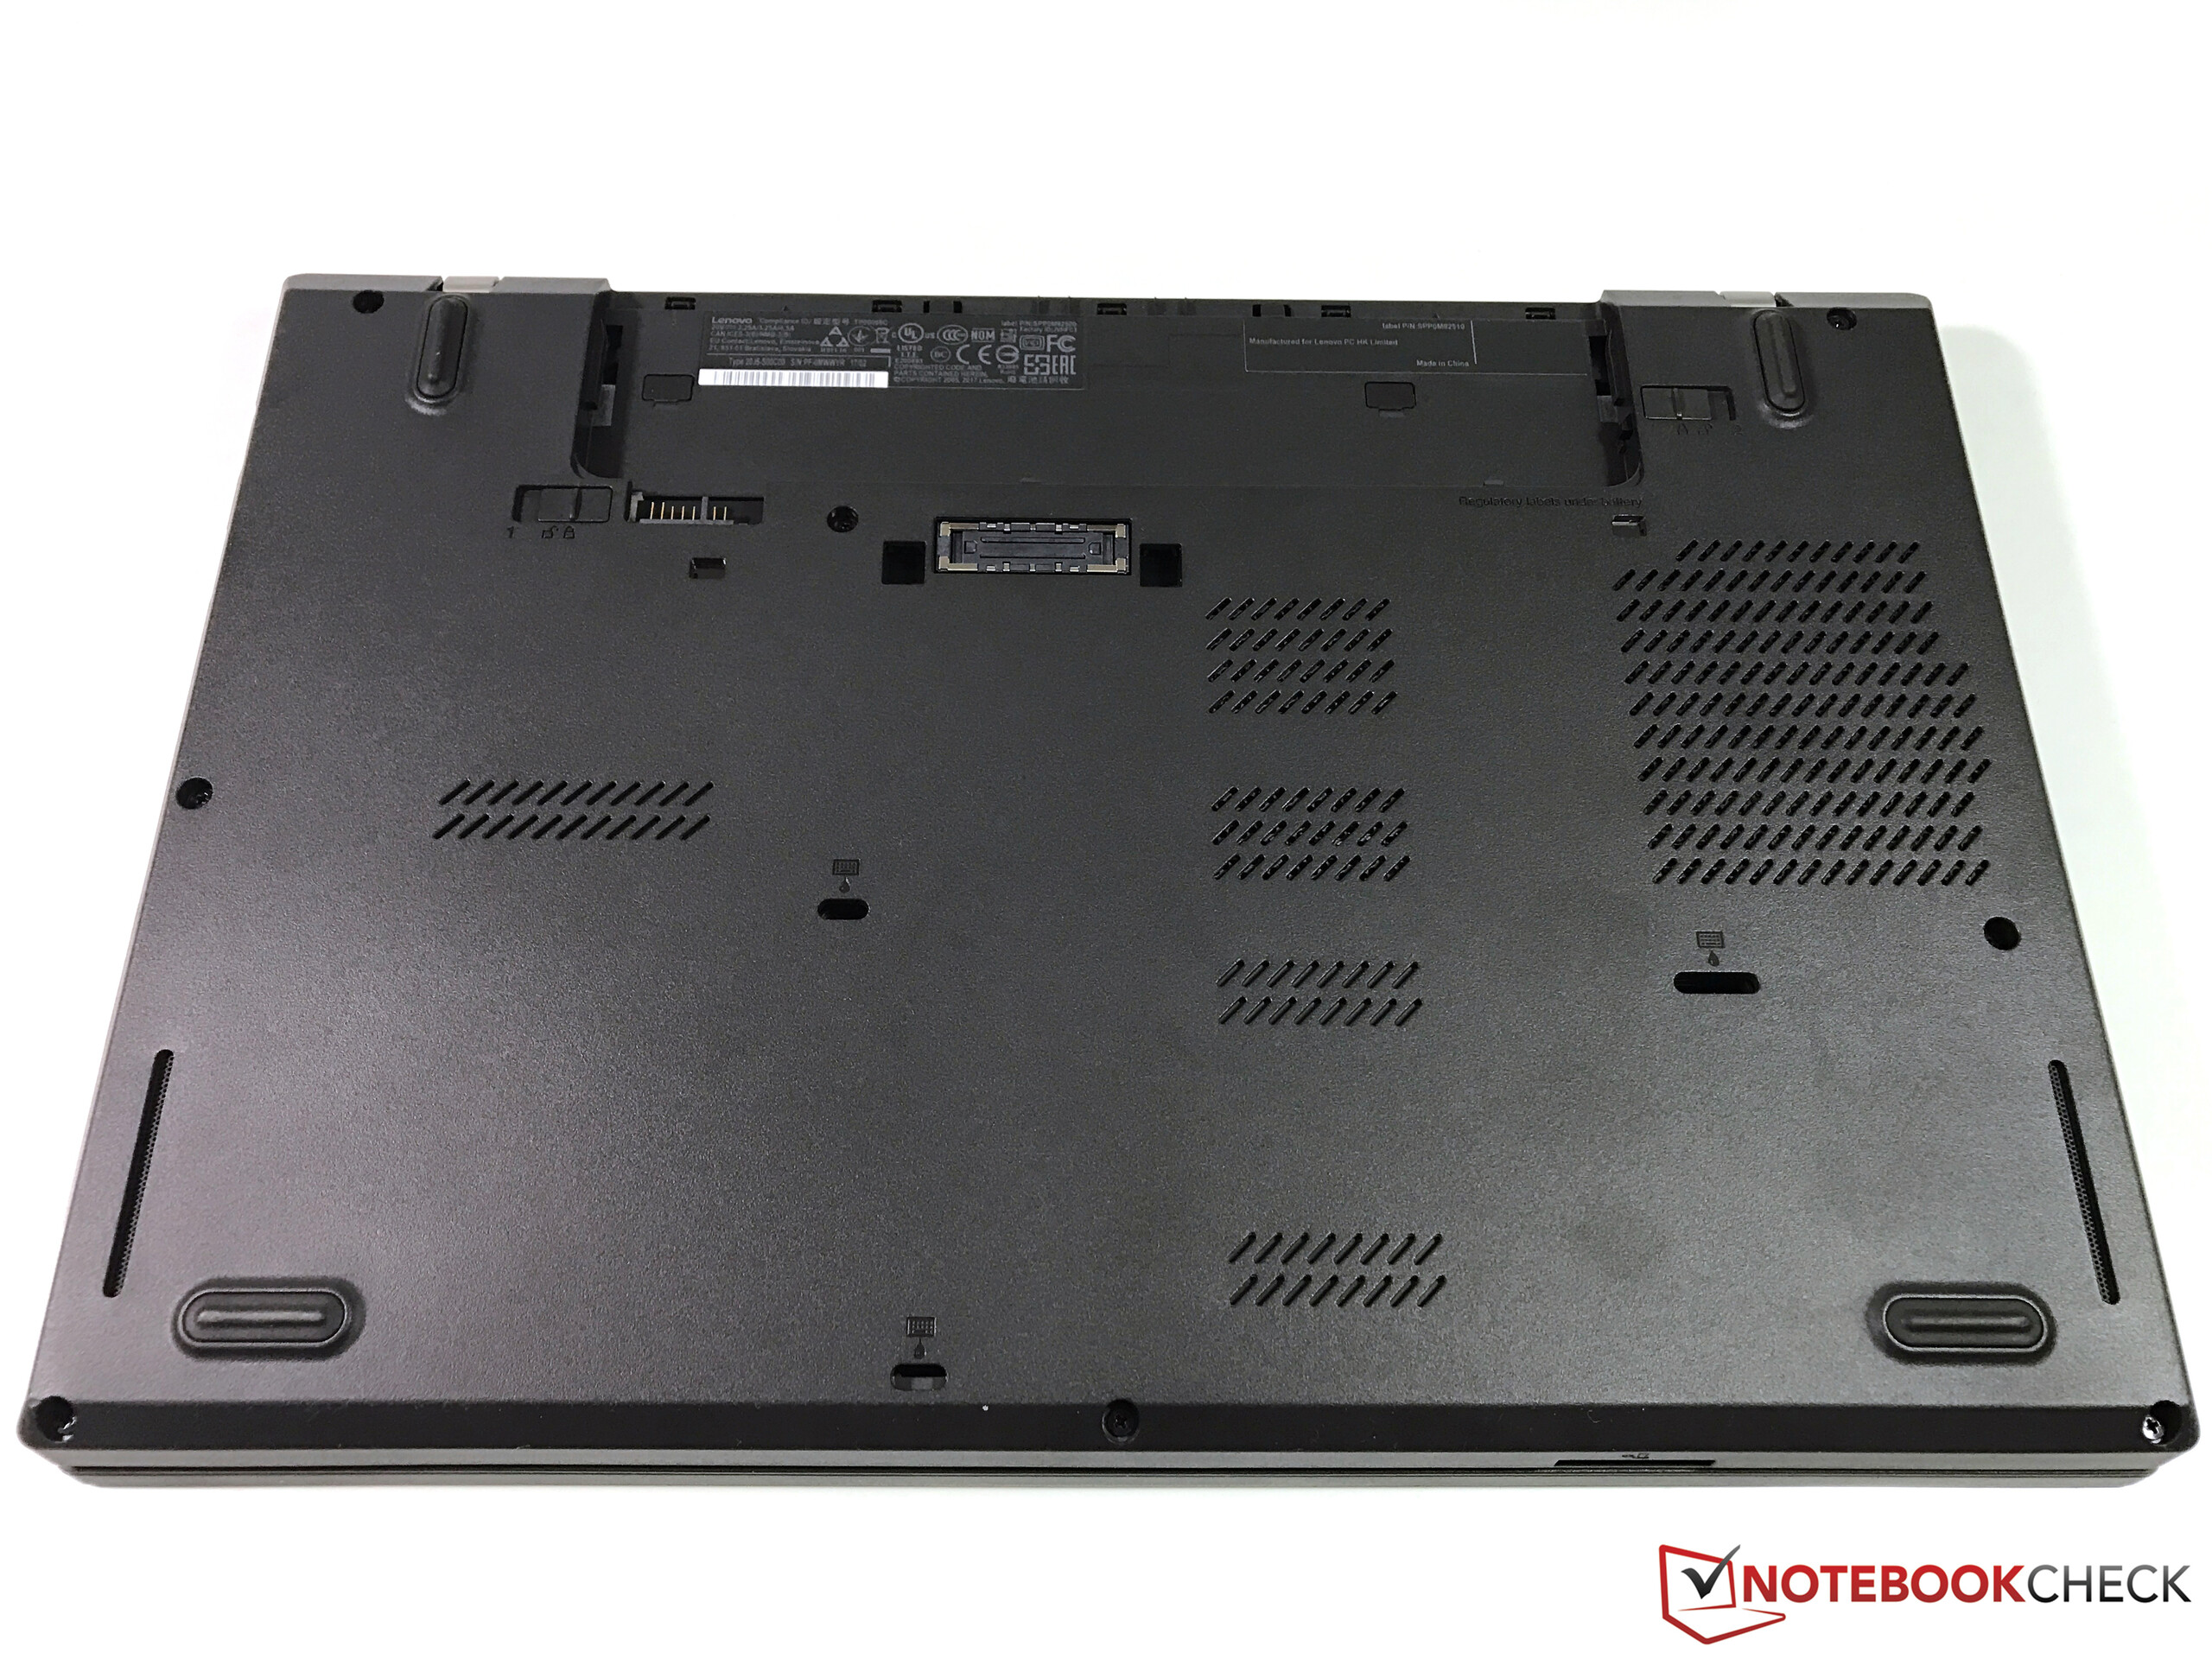
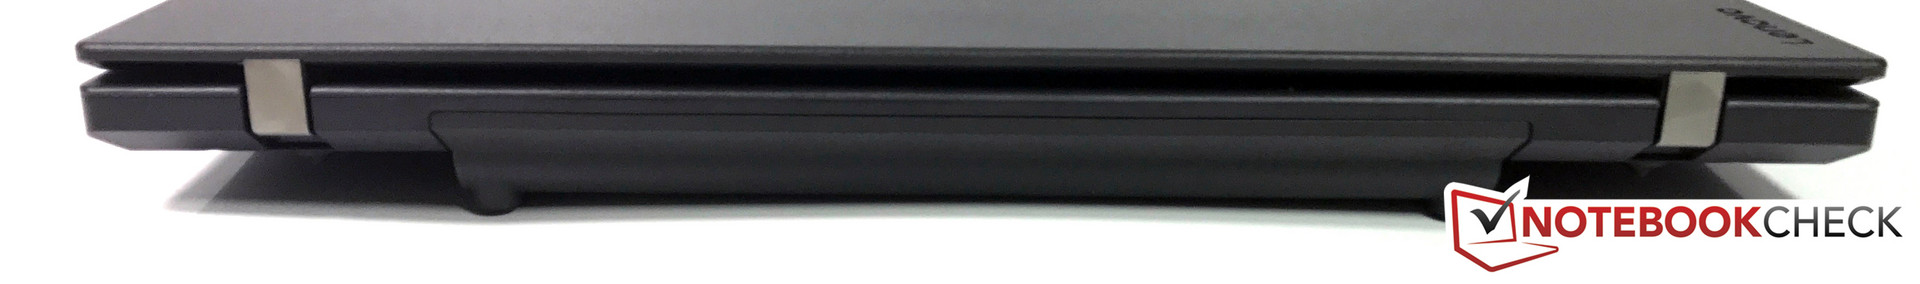
The L470 finds its place in between the other ThinkPads. However, it lacks the internal battery that the T470 enjoys. Instead, it has only the external battery. Therefore, it is significantly more flexible than the E470, however one will have to learn to live with a battery that raises the case by 1.5 cm (~0.6 in). With 23 Wh, the only non-protruding battery is simply too small to deliver usable battery run times. Our review device is equipped with a Lithium-ion battery with a capacity of 48 Wh.
Due to the low energy consumption, the L470 delivers good battery run times in all the tests. Only the HP ProBook 640 G3 and the Dell Latitude 5480 hand in better results (the former thanks to the low power consumption, the latter thanks to the larger battery). However, as already mentioned, one can put an optional 72 Wh battery into the L470.
In order to charge the battery, the system needs 148 minutes, this translates to almost 2.5 hours.


| Lenovo ThinkPad L470-20J5S00C00 i5-7200U, HD Graphics 620, 48 Wh | Lenovo ThinkPad L460-20FVS01400 6500U, Radeon R5 M330, 48 Wh | Lenovo ThinkPad T470-20HD002HGE i5-7200U, HD Graphics 620, 48 Wh | Lenovo ThinkPad E470-20H2S00400 i5-7200U, GeForce 940MX, 45 Wh | HP ProBook 440 G4-Y8B51EA i7-7500U, GeForce 930MX, 48 Wh | HP ProBook 640 G3 Z2W33ET i5-7200U, HD Graphics 620, 46 Wh | Dell Latitude 5480 i7-7600U, HD Graphics 620, 68 Wh | |
|---|---|---|---|---|---|---|---|
| Battery runtime | -22% | -10% | -21% | -9% | 8% | 42% | |
| Reader / Idle (h) | 23.3 | 19.2 -18% | 17.4 -25% | 18.1 -22% | 24.6 6% | 24.1 3% | |
| H.264 (h) | 10.8 | 7.2 -33% | 10.4 -4% | 8.4 -22% | 9.5 -12% | 8.7 -19% | |
| WiFi v1.3 (h) | 8 | 7.1 -11% | 7.3 -9% | 5.4 -32% | 6.9 -14% | 8.7 9% | 16.1 101% |
| Load (h) | 2.2 | 1.6 -27% | 1.8 -18% | 2.1 -5% | 2.5 14% | 3 36% | 2.7 23% |
Verdict
Pros
Cons
With the L470, Lenovo delivers a budget-oriented ThinkPad that, above all, should be interesting for students and firms.
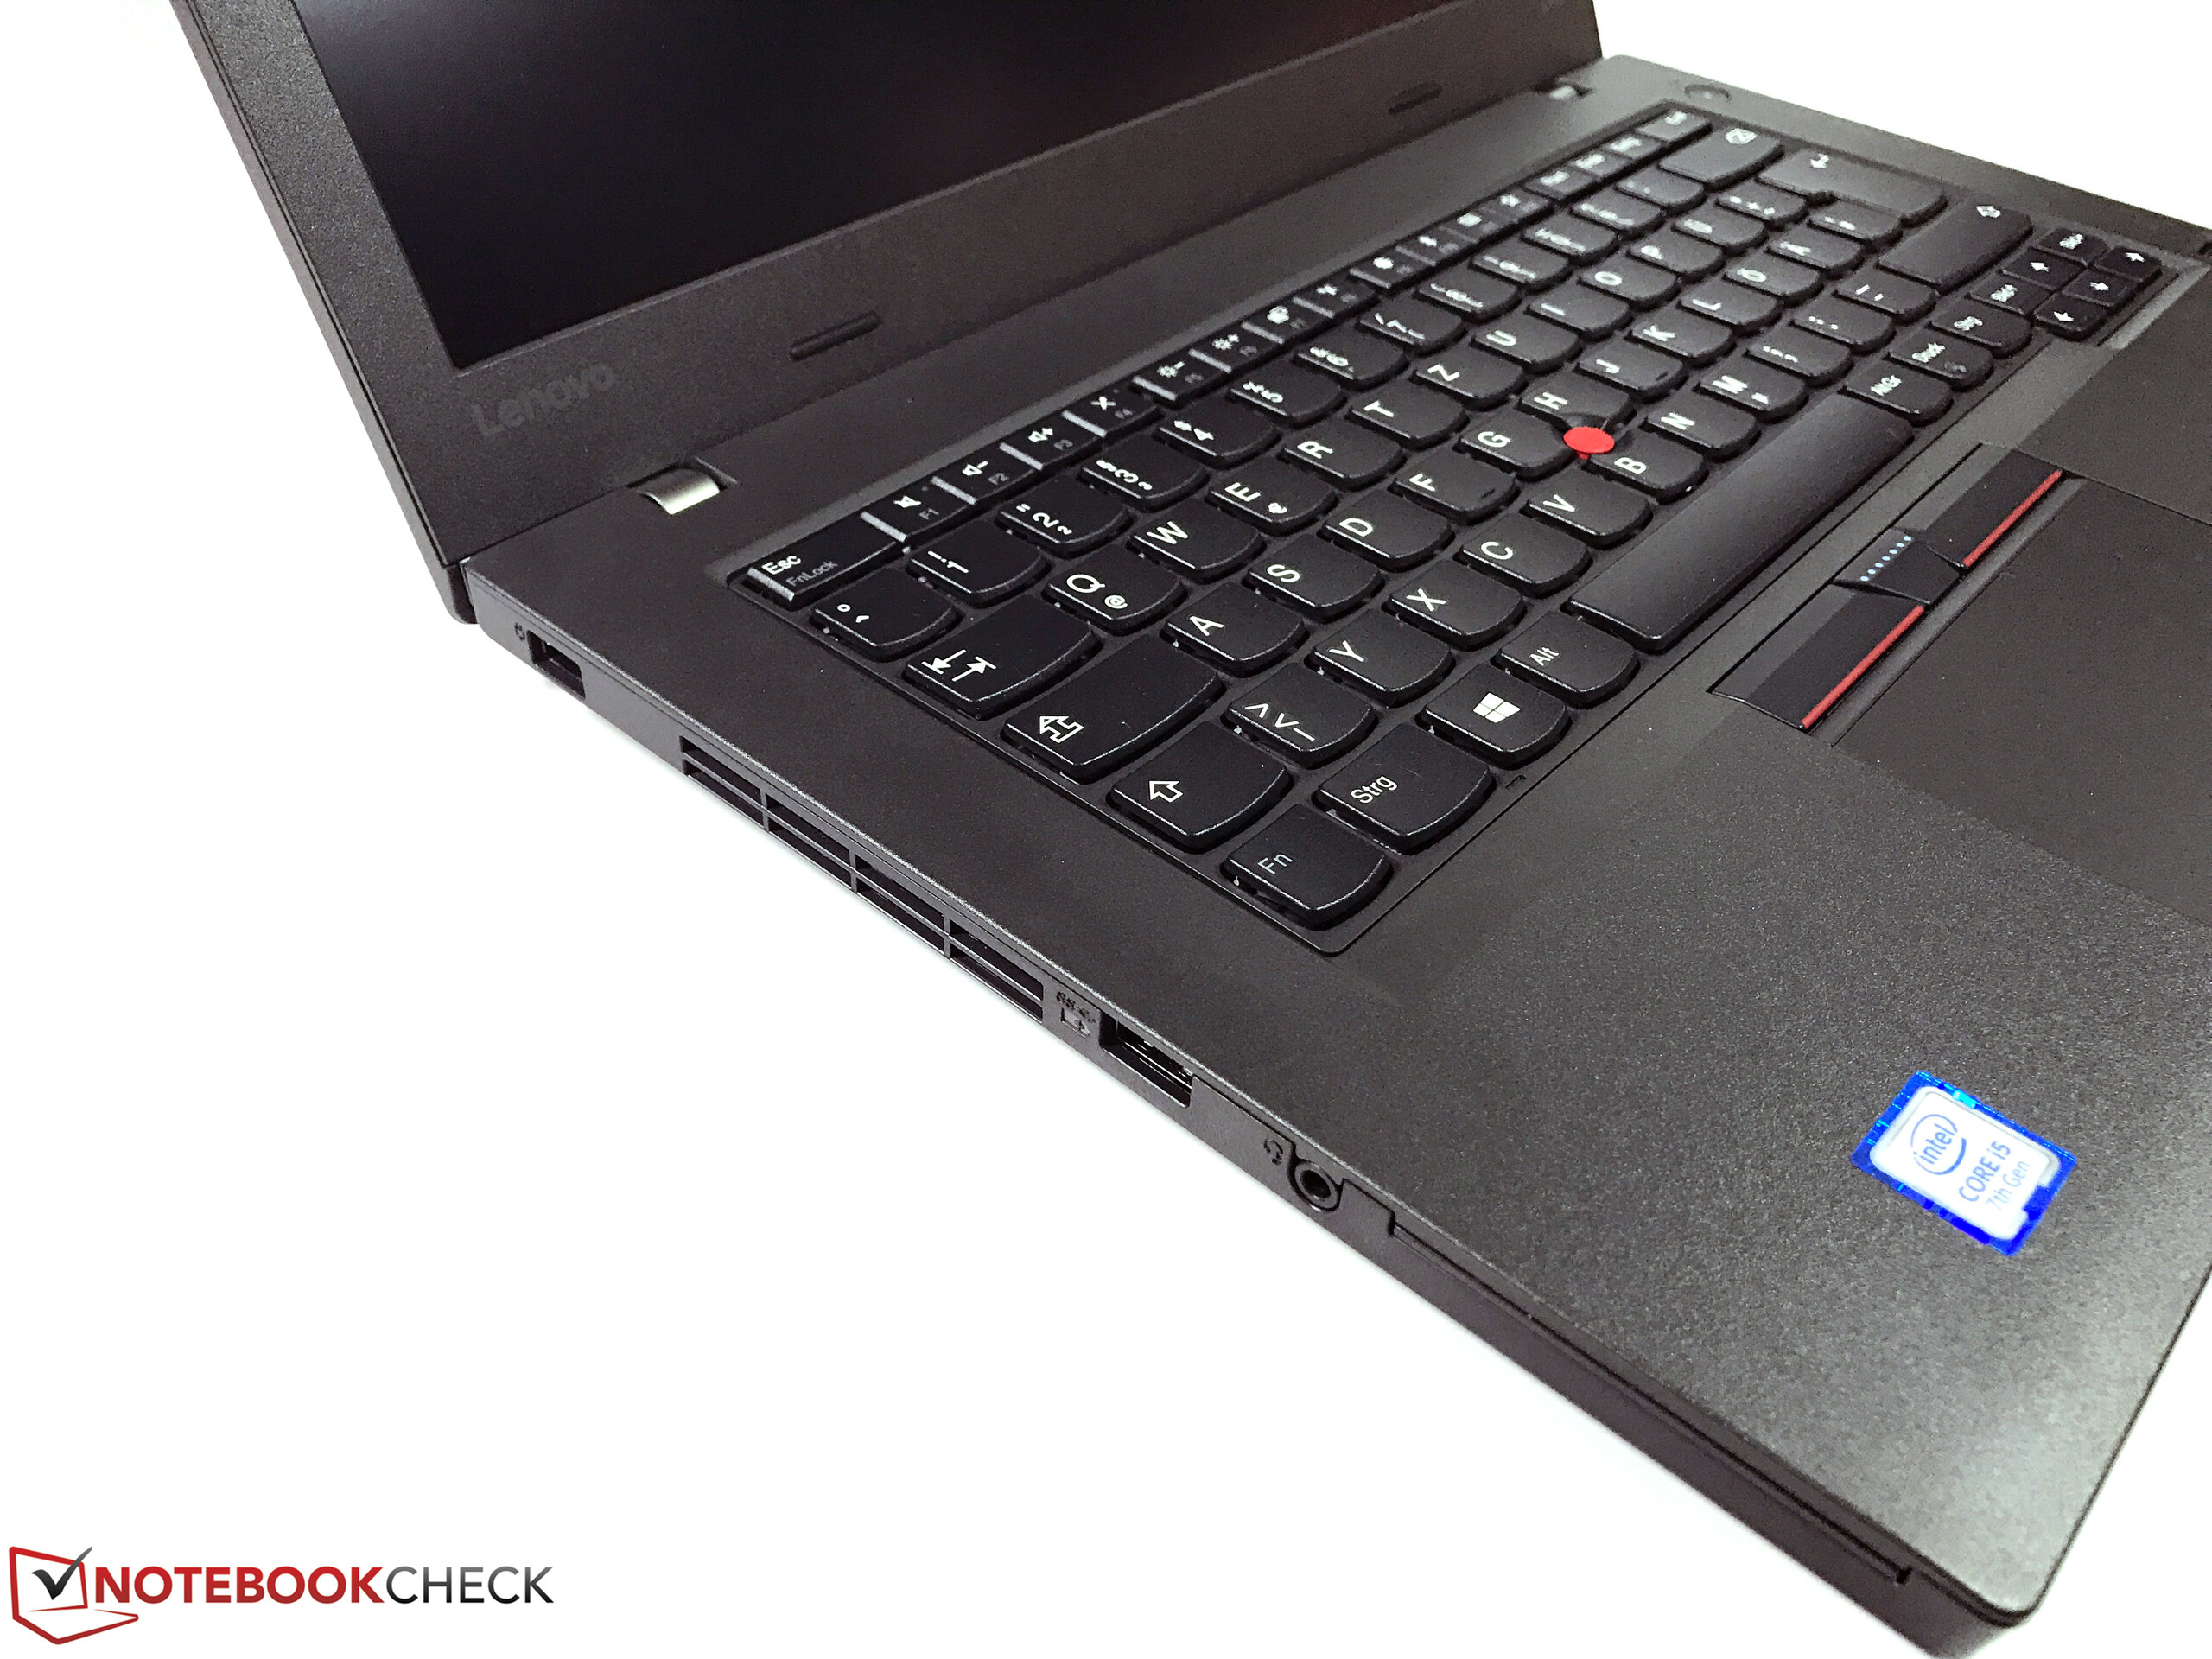
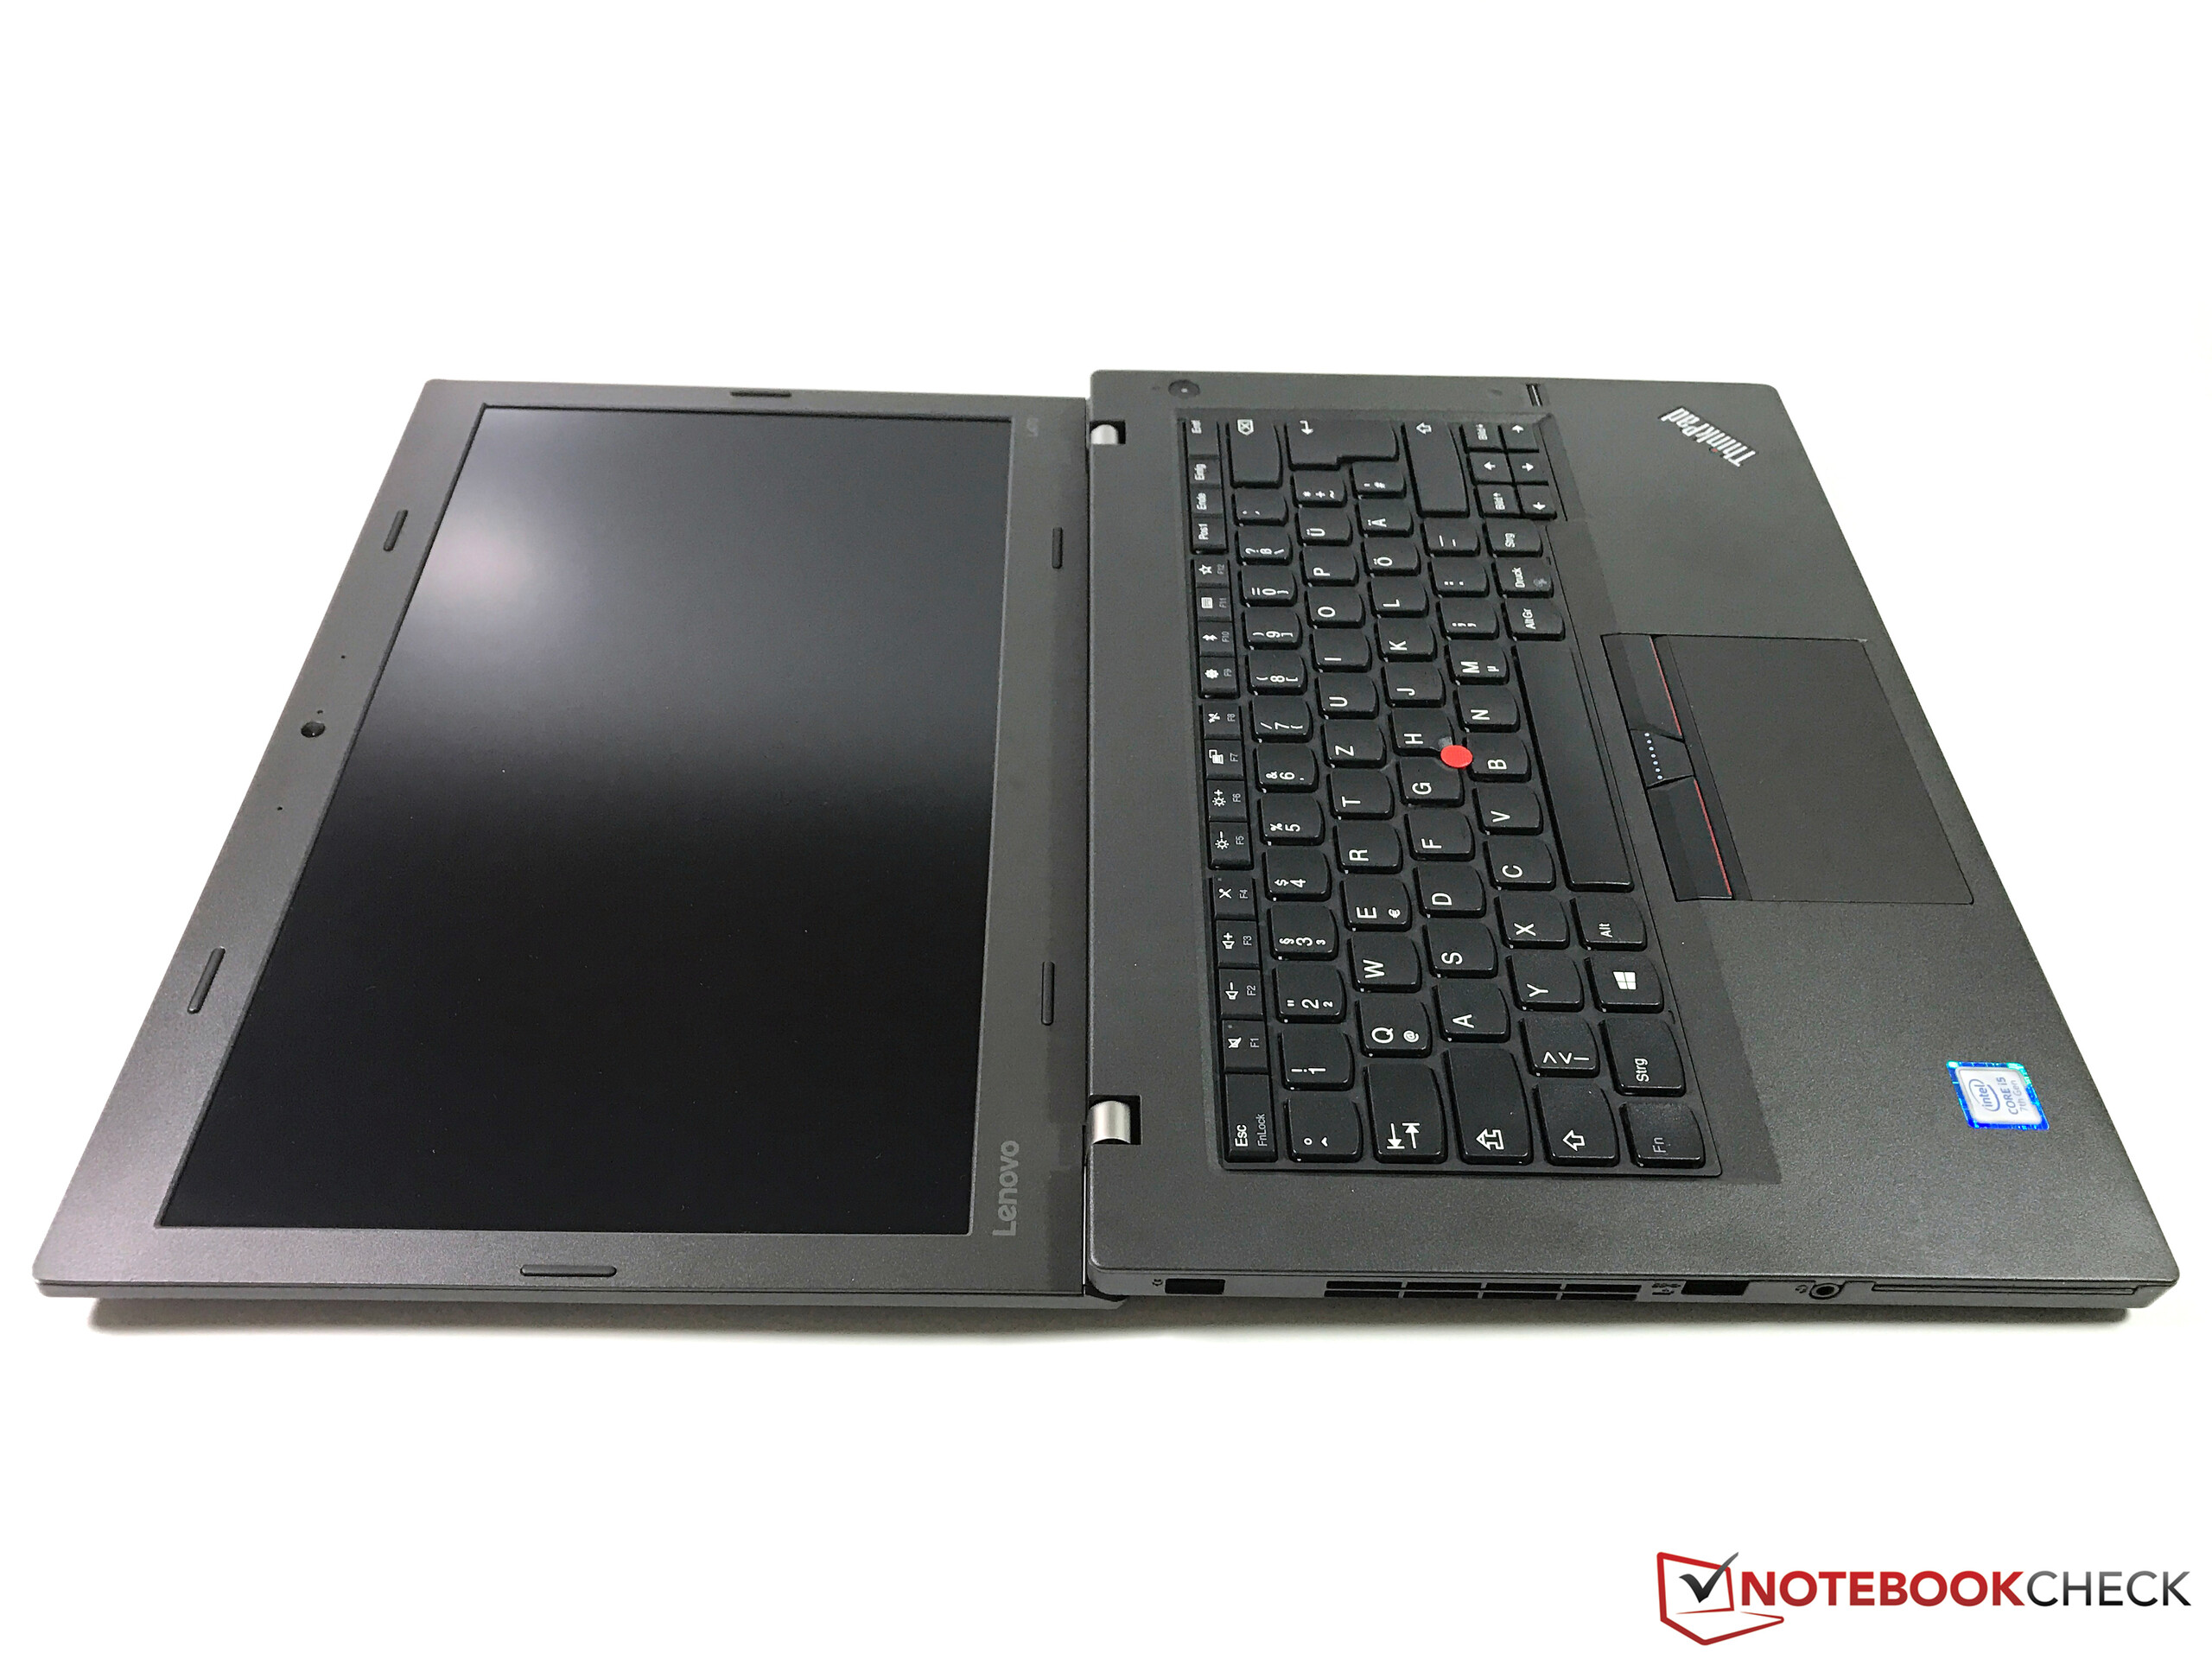
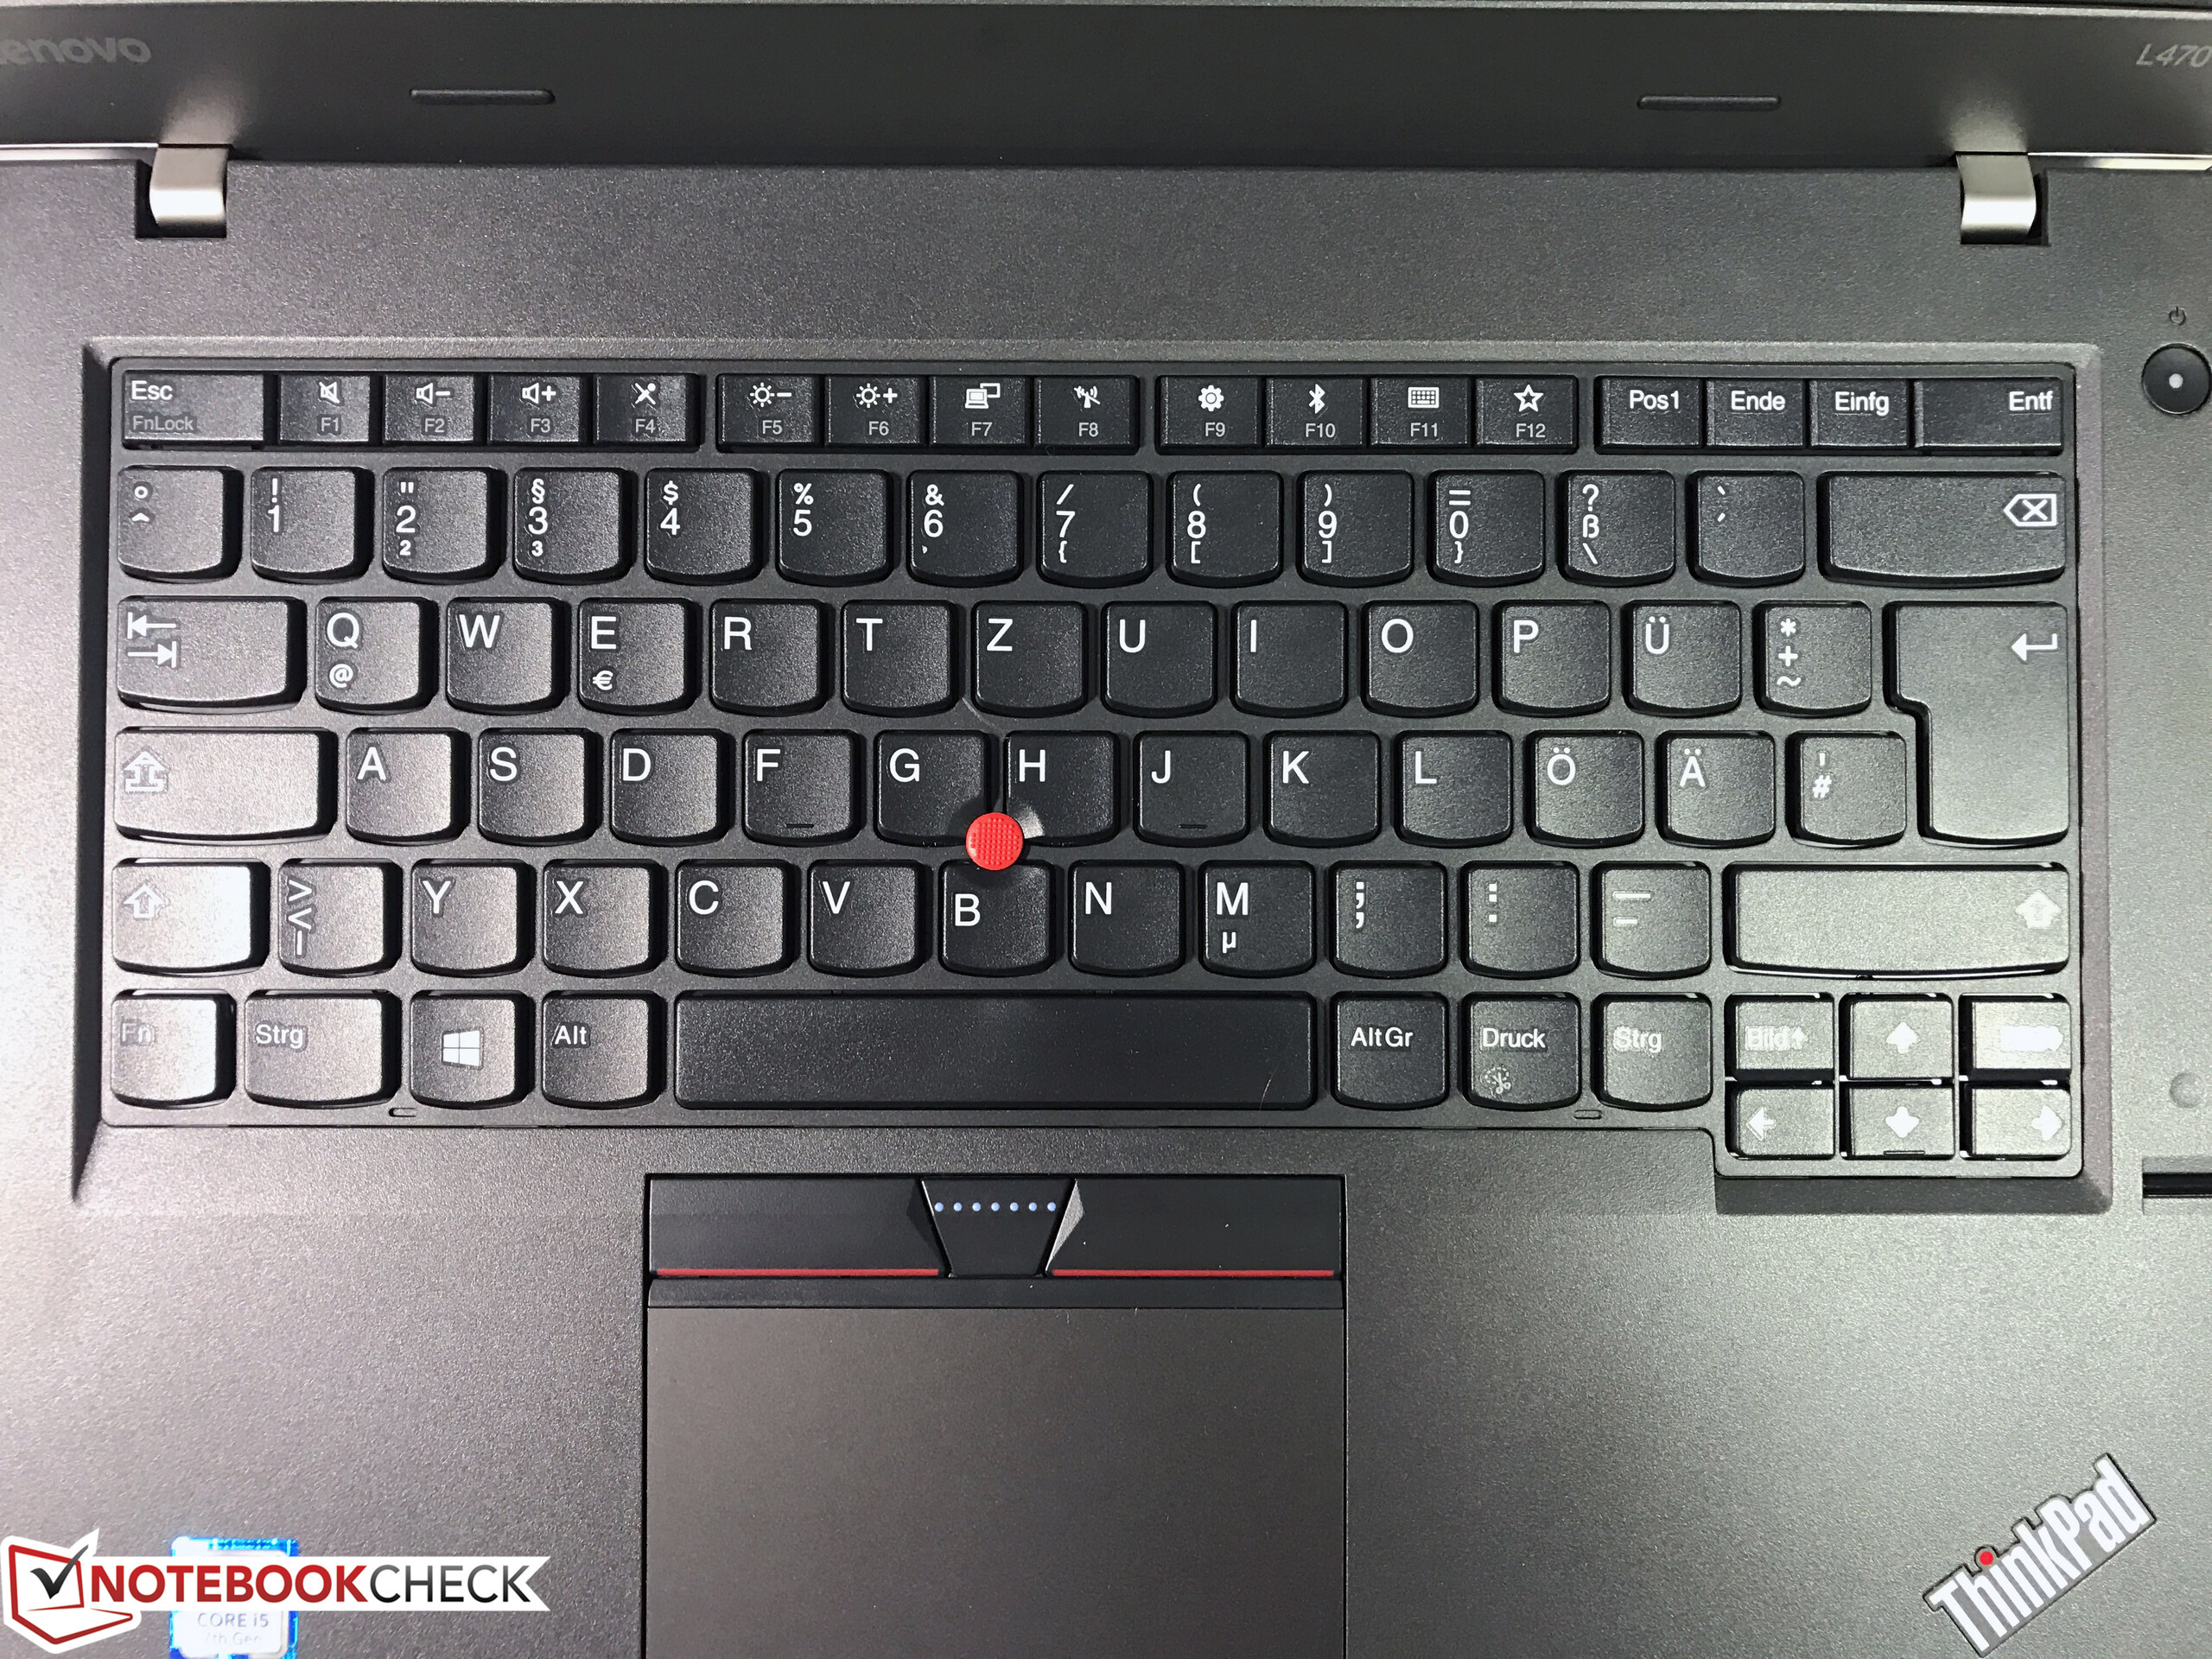
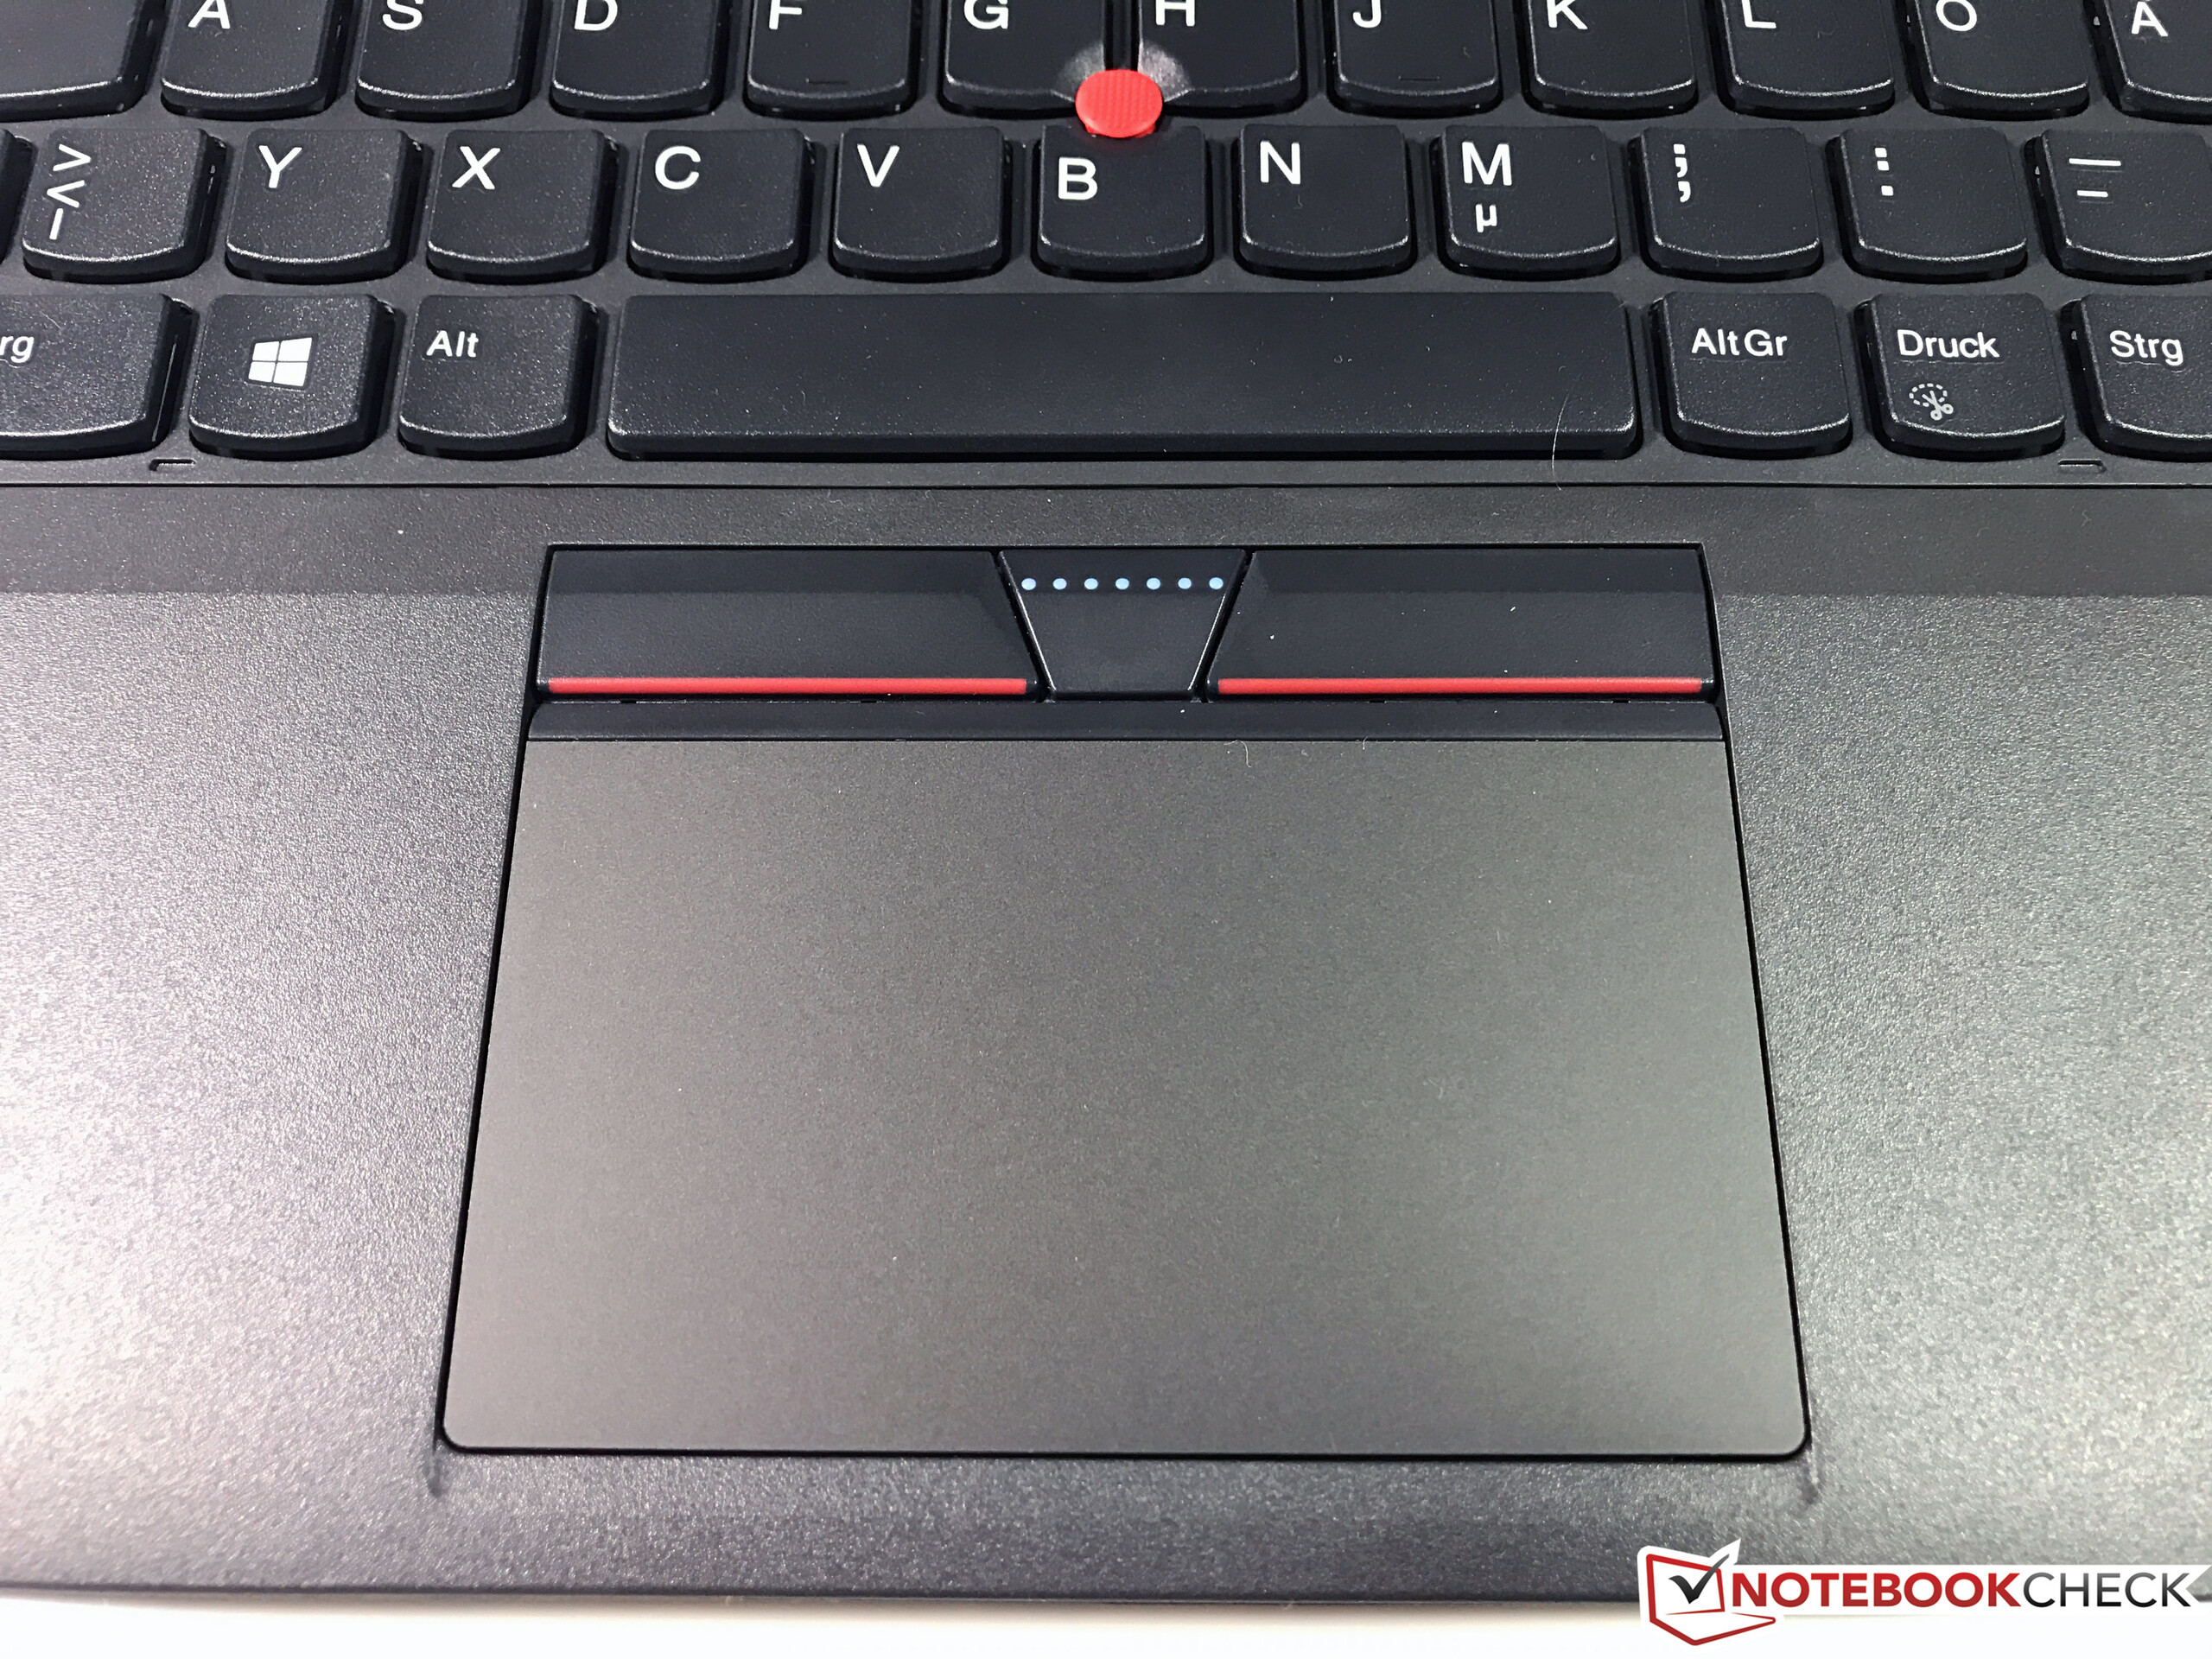
For a relatively low price, the L470 offers the well-known, superb ThinkPad keyboard, including the TrackPoint. Also in the box: A Full HD IPS display, which cannot be taken for granted in this price category. The plastic case does not feel very high-value, however it feels quite robust and has durable hinges. As a business notebook, the L470 offers a good array of ports. Here one must lament the lack of a USB Type-C port, however this is somewhat offset by the fact that Lenovo still integrates a dedicated docking port. Therefore, one is not dependent on USB Type-C docking stations. What is also good is that Lenovo still equips the L470 with a VGA port, which is a unique feature among the current ThinkPads. For schools, universities and businesses that still use old projectors, this is an important selling point. In this case, the good battery life and the flexibility of a replaceable battery should be appreciated, even if it does raise the device somewhat.
Lenovo does not make any big mistakes. The most regrettable shortcoming is the annoying coil whine, which is a great pity, because otherwise the device would have been completely silent during idle operation. The GPU throttling, when running on battery power, is understandable. The low color space coverage of the display should not be viewed too negatively with a device intended for business use, but it should be mentioned, nevertheless. Finally, one must criticize the standard warranty period; one year is just not enough.
The price/performance winner: With a low price and legacy features, such as a VGA port, and a replaceable battery, the L470 is an interesting 14-inch business notebook.
Despite these drawbacks, the L470 deserves a recommendation as an attractive price/performance package. Against its closest in-house competitor, the E470, the somewhat more expensive L470 can distinguish itself through a dedicated docking station port, a VGA port and the replaceable battery. However, with the Nvidia GeForce 940MX, the E470 is more interesting for casual gamers. Above all, the L470 beats the HP 440 and 640 ProBooks thanks to the IPS display, because both Probooks come with TN screens. The toughest competitor is the Dell Latitude 5480, which, in terms of price, competes more with the ThinkPad T470 than the L470.
Lenovo ThinkPad L470-20J5S00C00
- 11/02/2017 v6 (old)
Benjamin Herzig
Price comparison
