Lenovo ThinkPad E470 (HD-Display, HD 620) Laptop Review
For the original German article, see here.
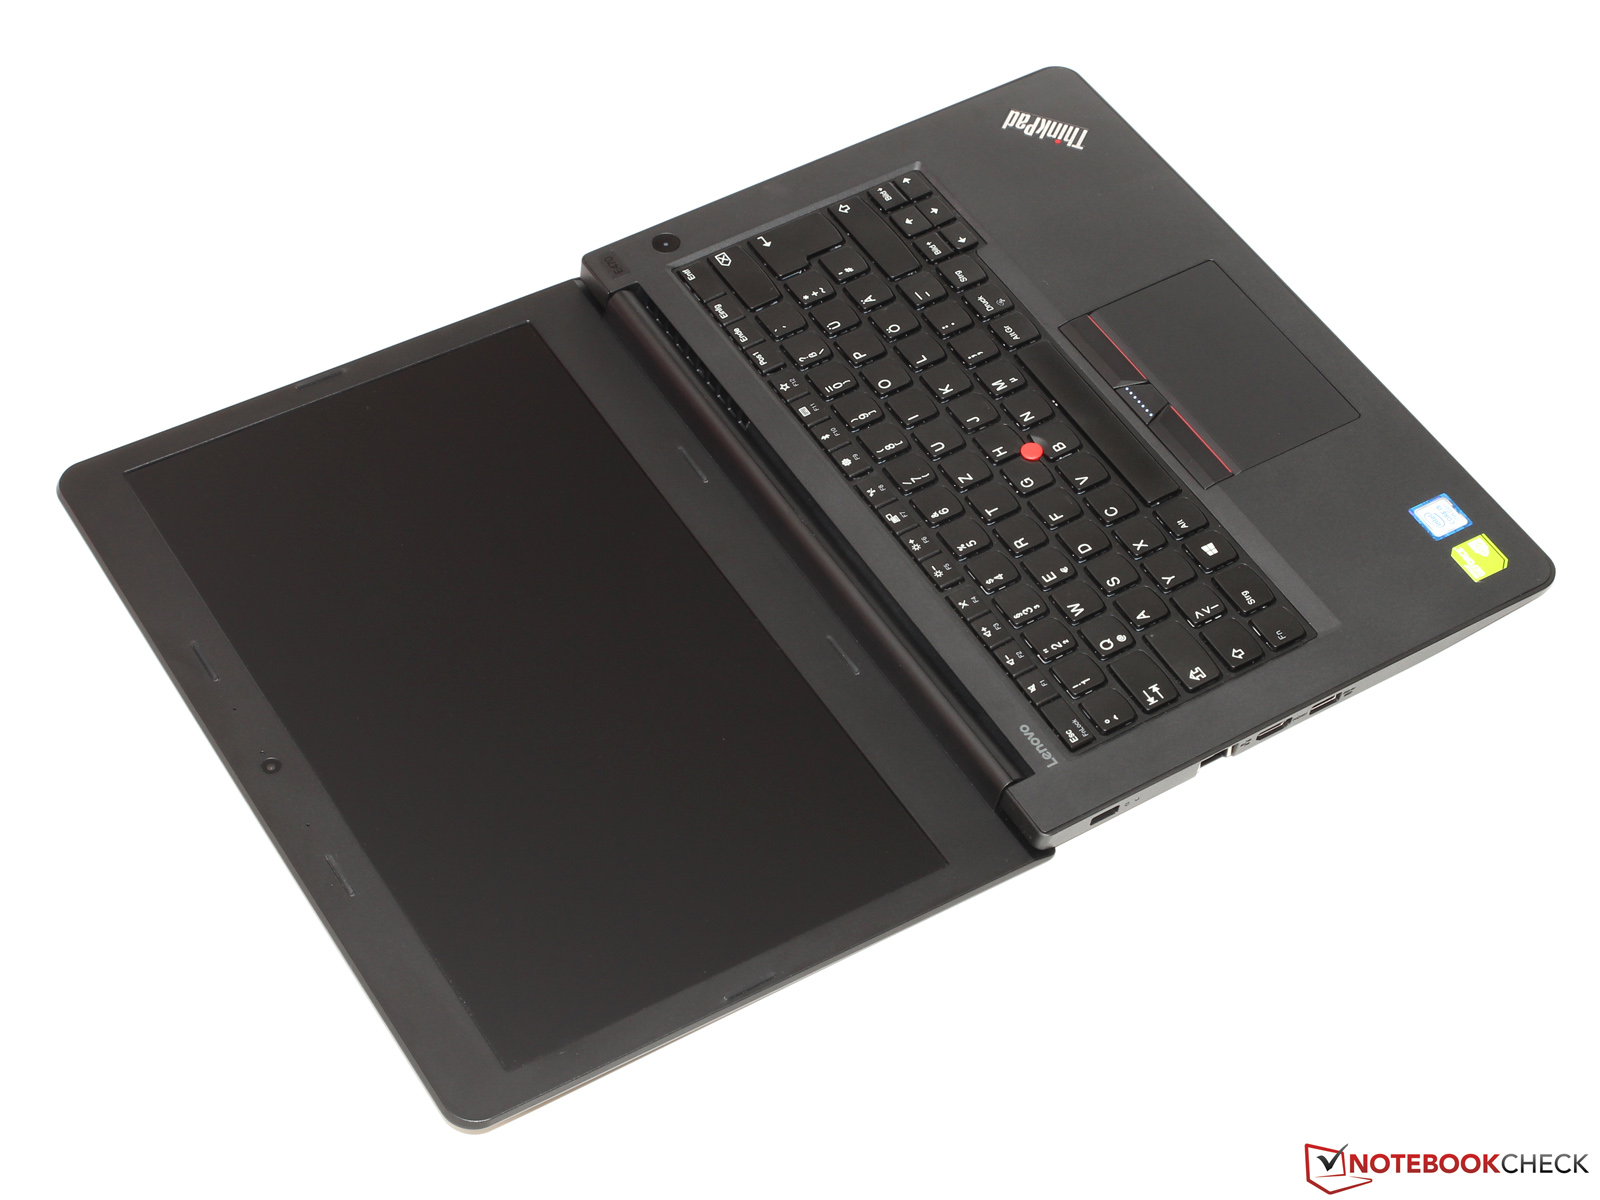
Earlier this year we had the ThinkPad E470 under review. Back then it was the first ThinkPad featuring the brand-new Kaby Lake microprocessors. Our verdict was that not only it works surprisingly well as an affordable office and business notebook, but it is also capable of running games thanks to its GeForce 940MX GPU. Today, we are reviewing a different SKU with much slower hardware. Instead of a GeForce GPU and a FHD display today’s review unit features only Intel’s integrated Intel HD Graphics 620 and an HD panel.
As well as the other E470 SKU we have also decided to include the more expensive ThinkPad T470, the HP ProBook 440 G4, the Dell Latitude 14 3470, and the Acer TravelMate P249-M in this comparison. Lenovo does not sell this particular configuration as preconfigured SKU, but a similarly customized model would set you back around $800 in the US.
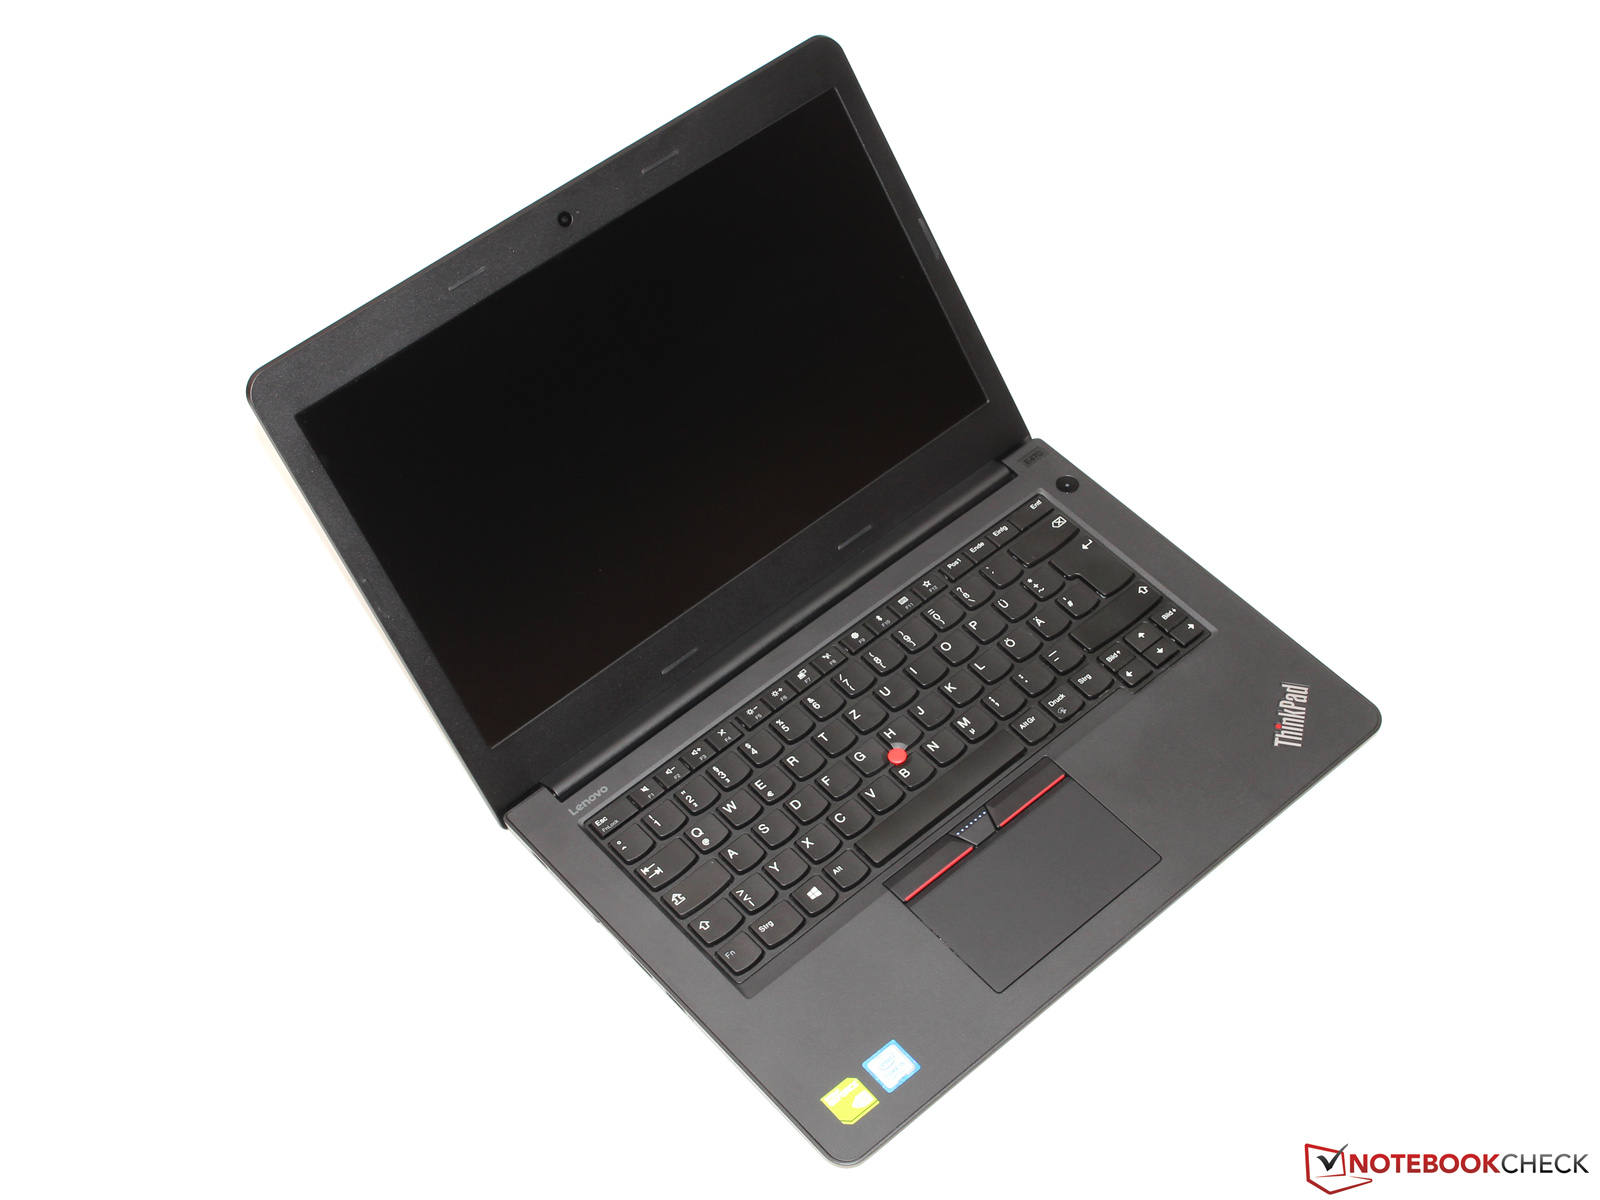
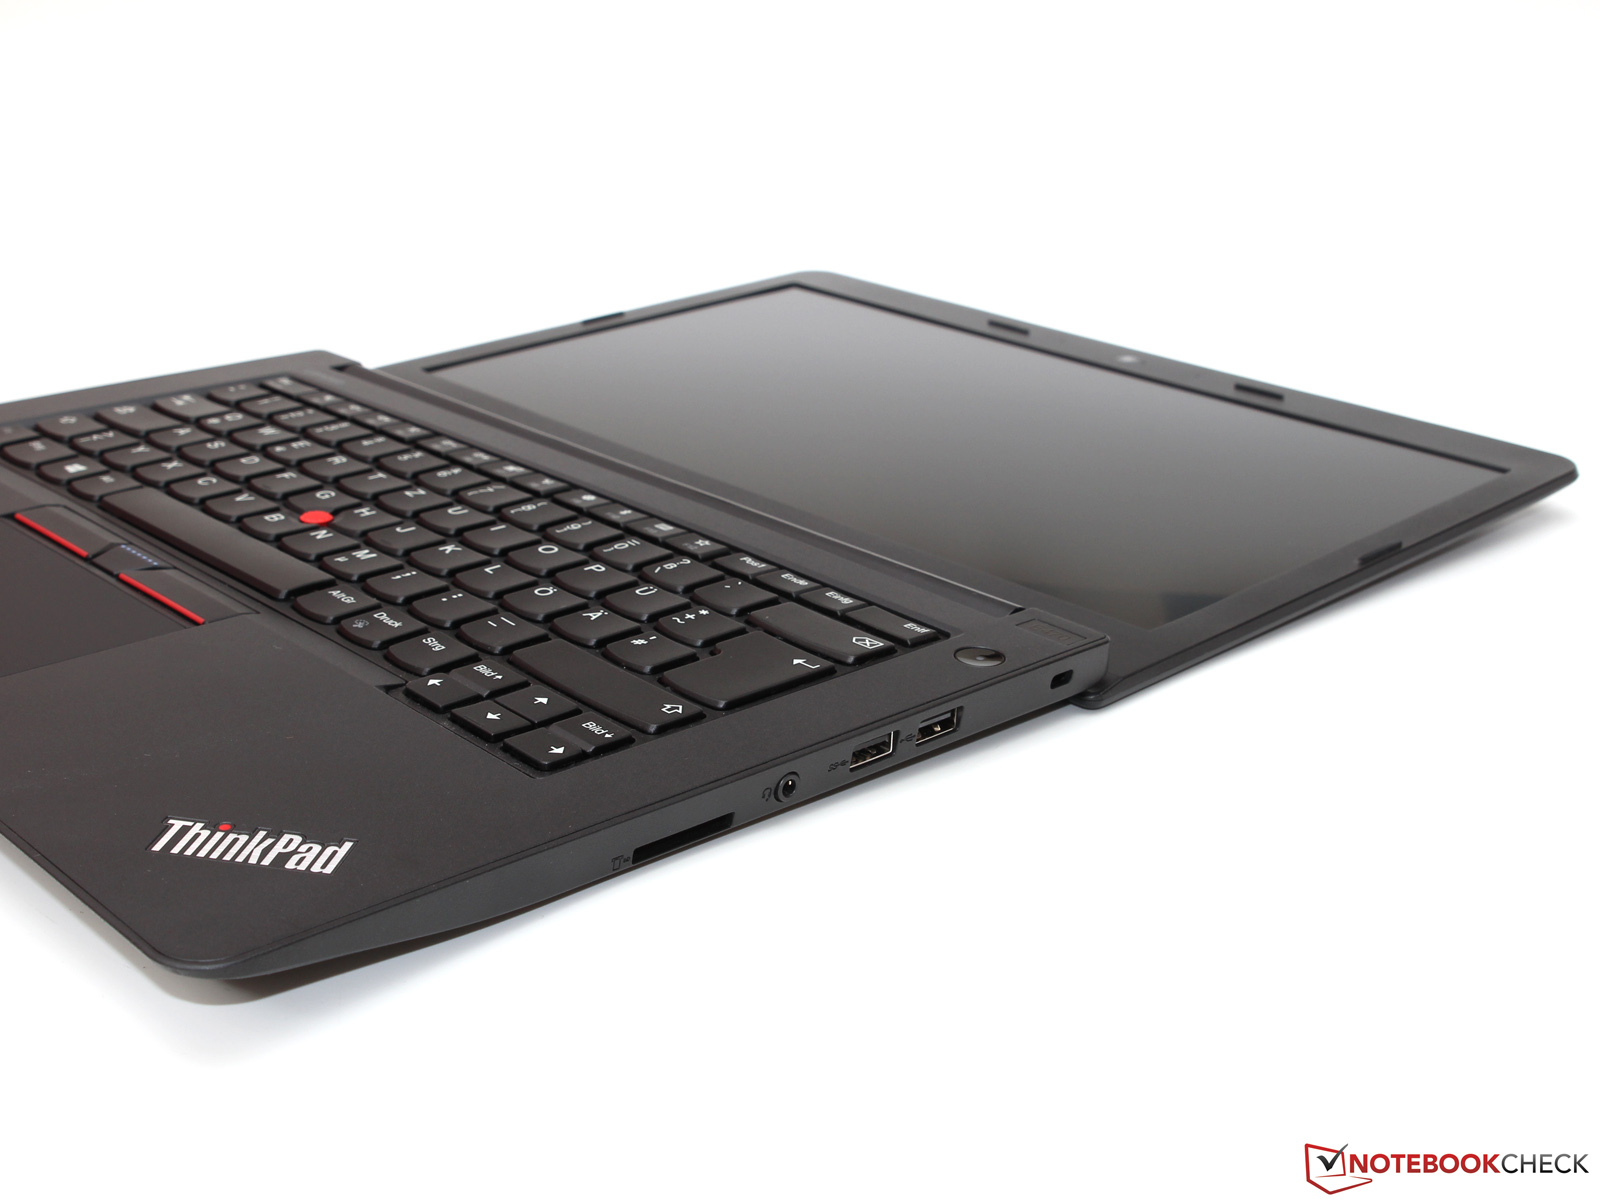
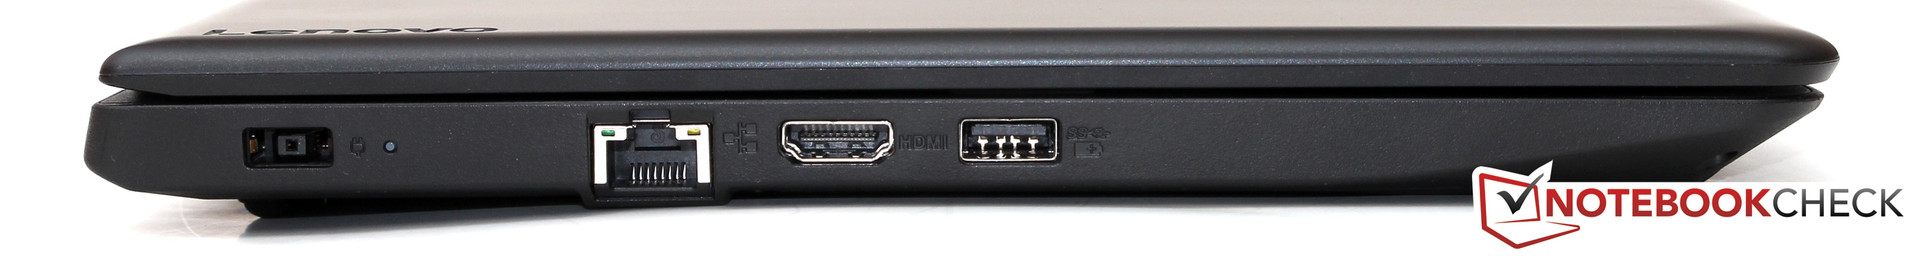
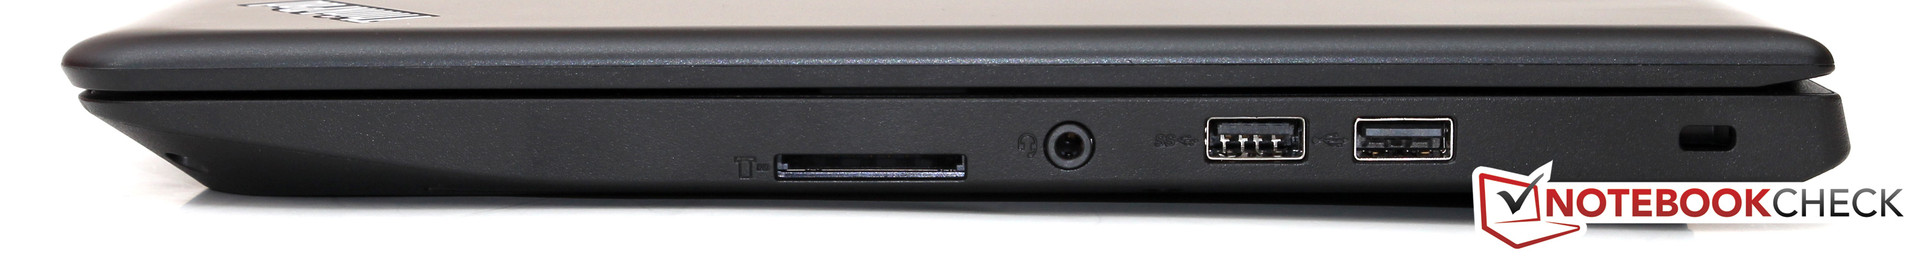
Details regarding case, connectivity, and input devices can be found in our previous E470 review.
Connectivity
| Networking | |
| iperf3 transmit AX12 | |
| Lenovo ThinkPad E470 | |
| Lenovo ThinkPad E470-20H2S00400 | |
| iperf3 receive AX12 | |
| Lenovo ThinkPad E470-20H2S00400 | |
| Lenovo ThinkPad E470 | |
Display

The display is the most obvious difference between the two E470 models reviewed by us. Lenovo sells the E470 with two different panels: a FHD IPS panel (1920x1080) and an HD TN panel (1366x768). Both displays are matte.
According to Lenovo’s specification sheet, the HD display is supposed to deliver 220 nits, and while strictly speaking, it only got that bright in a single spot on the left side of the display. On average, the BOE panel reached only 208 nits - despite the fact that it was not the worst display in our test group it was still pretty poor. The FHD equipped E470 was almost 30 nits brighter.
A TN panels biggest (and arguably only) advantage is its complete lack of backlight bleeding. This is also true of the E470’s HD TN display; we did however find a different and more serious problem: PWM flickering at a low frequency of only 200 Hz for all brightness levels below 90%. Thus, the display is not only too dim, but can potentially also cause major headaches. Literally.
| |||||||||||||||||||||||||
Brightness Distribution: 81 %
Center on Battery: 215 cd/m²
Contrast: 360:1 (Black: 0.58 cd/m²)
ΔE ColorChecker Calman: 8.12 | ∀{0.5-29.43 Ø4.71}
ΔE Greyscale Calman: 9.86 | ∀{0.09-98 Ø4.96}
58% sRGB (Argyll 1.6.3 3D)
37% AdobeRGB 1998 (Argyll 1.6.3 3D)
40.43% AdobeRGB 1998 (Argyll 3D)
58.3% sRGB (Argyll 3D)
39.13% Display P3 (Argyll 3D)
Gamma: 2.37
CCT: 10218 K
| Lenovo ThinkPad E470 NT140WHM-N41, , 1366x768, 14" | Lenovo ThinkPad E470-20H2S00400 N140HCA-EAB, , 1920x1080, 14" | HP ProBook 440 G4-Y8B51EA AUO1E3D, , 1920x1080, 14" | Acer TravelMate P249-M-5452 Chi Mei N140HGE-EAA, , 1920x1080, 14" | Dell Latitude 14 3470 Innolux N140BGE, , 1366x768, 14" | Lenovo ThinkPad T470-20HD002HGE N140HCA-EAB, , 1920x1080, 14" | |
|---|---|---|---|---|---|---|
| Display | 5% | -4% | -3% | 3% | 6% | |
| Display P3 Coverage (%) | 39.13 | 41.23 5% | 37.6 -4% | 38.15 -3% | 40.21 3% | 41.6 6% |
| sRGB Coverage (%) | 58.3 | 61.4 5% | 56.6 -3% | 56.7 -3% | 60.5 4% | 61.9 6% |
| AdobeRGB 1998 Coverage (%) | 40.43 | 42.67 6% | 38.85 -4% | 39.48 -2% | 41.55 3% | 43.06 7% |
| Response Times | -55% | -36% | -7% | -47% | -69% | |
| Response Time Grey 50% / Grey 80% * (ms) | 44 ? | 40.8 ? 7% | 43.2 ? 2% | 44 ? -0% | 47 ? -7% | 41.6 ? 5% |
| Response Time Black / White * (ms) | 14 ? | 30.4 ? -117% | 24.4 ? -74% | 16 ? -14% | 26 ? -86% | 34 ? -143% |
| PWM Frequency (Hz) | 200 ? | 50 ? | ||||
| Screen | 24% | 4% | 13% | -4% | 41% | |
| Brightness middle (cd/m²) | 209 | 244 17% | 216 3% | 249 19% | 206 -1% | 306 46% |
| Brightness (cd/m²) | 208 | 231 11% | 203 -2% | 238 14% | 193 -7% | 287 38% |
| Brightness Distribution (%) | 81 | 89 10% | 83 2% | 87 7% | 87 7% | 88 9% |
| Black Level * (cd/m²) | 0.58 | 0.37 36% | 0.47 19% | 0.41 29% | 0.48 17% | 0.3 48% |
| Contrast (:1) | 360 | 659 83% | 460 28% | 607 69% | 429 19% | 1020 183% |
| Colorchecker dE 2000 * | 8.12 | 6.41 21% | 8.98 -11% | 9.09 -12% | 11 -35% | 6.2 24% |
| Colorchecker dE 2000 max. * | 15.18 | 13.4 12% | 14.07 7% | 14.64 4% | 19.57 -29% | 13.6 10% |
| Greyscale dE 2000 * | 9.86 | 5.94 40% | 9.61 3% | 9.92 -1% | 11.51 -17% | 5.8 41% |
| Gamma | 2.37 93% | 2.28 96% | 2.63 84% | 2.42 91% | 2.23 99% | 2.04 108% |
| CCT | 10218 64% | 6101 107% | 11265 58% | 11177 58% | 13671 48% | 6277 104% |
| Color Space (Percent of AdobeRGB 1998) (%) | 37 | 39.3 6% | 35.9 -3% | 36.5 -1% | 38.46 4% | 39.62 7% |
| Color Space (Percent of sRGB) (%) | 58 | 61.1 5% | 56.7 -2% | 56.7 -2% | 60.61 5% | 61.44 6% |
| Total Average (Program / Settings) | -9% /
10% | -12% /
-3% | 1% /
7% | -16% /
-8% | -7% /
20% |
* ... smaller is better
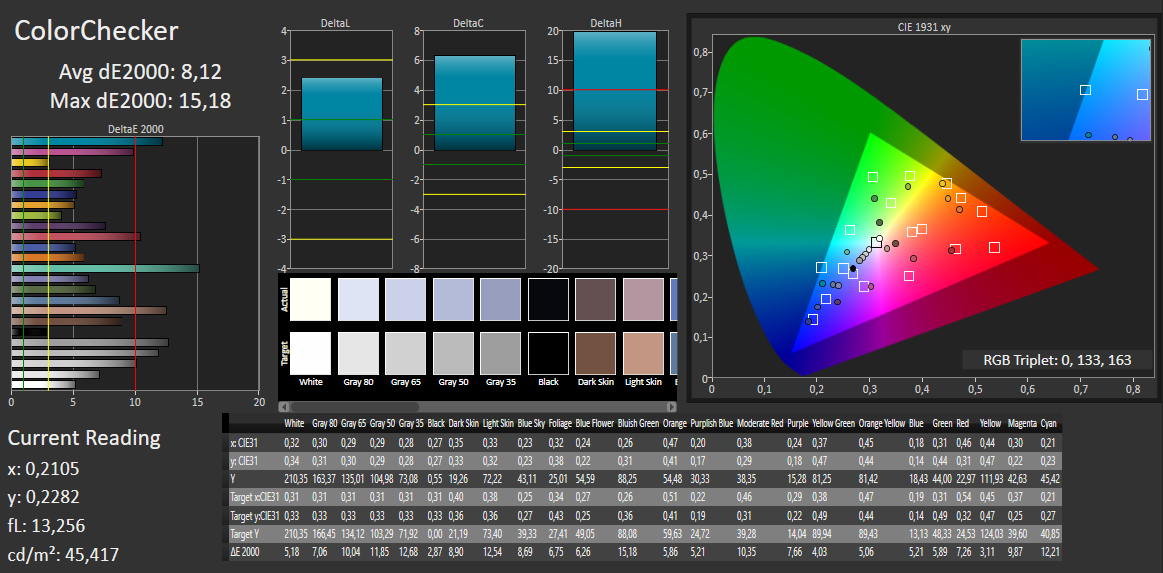
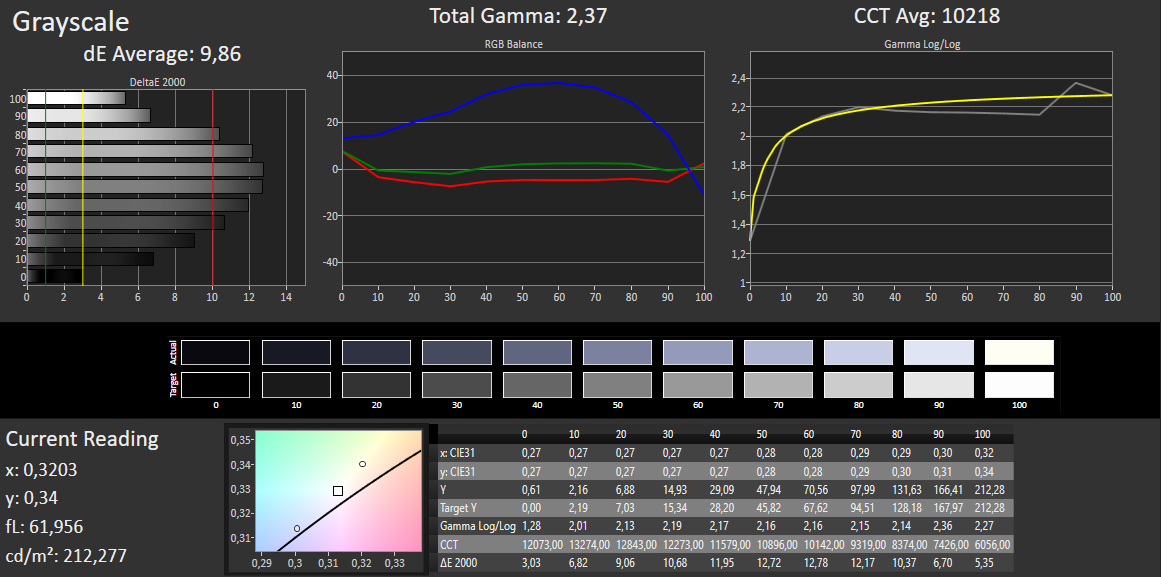
The display’s high black level of 0.58 nits and its low contrast ratio of only 360:1 are proof that Lenovo went for a rather cheap TN panel here. Accordingly, blacks are gray instead, overall image quality seems somewhat blurry due to the display’s low resolution, and as is quite common for TN panels it also suffers from a noticeable blue tint.
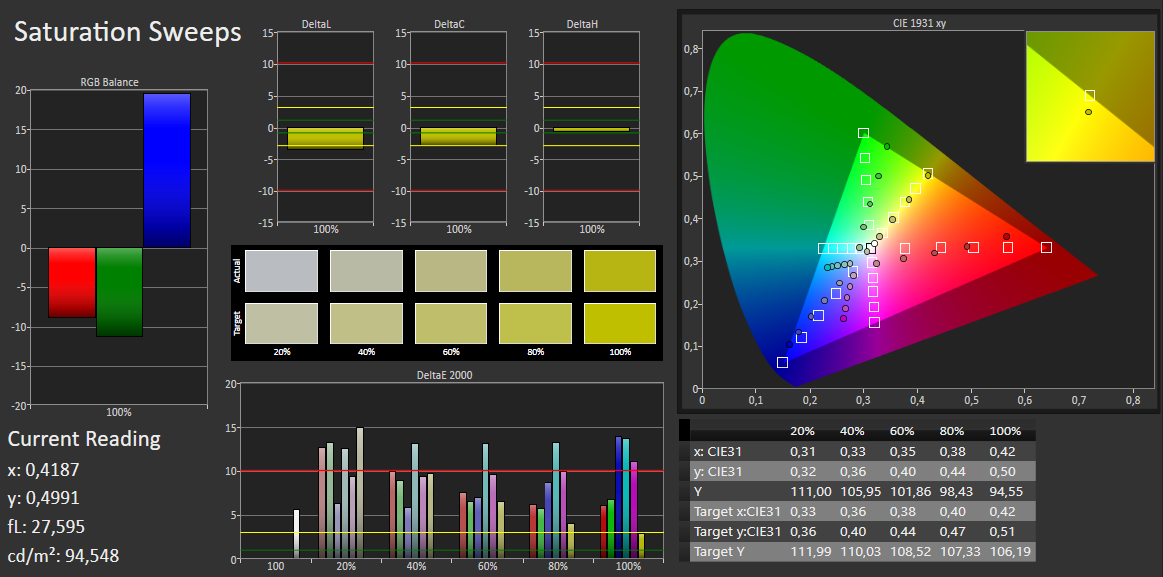
As expected, sRGB and AdobeRGB color space coverage is very poor, and the display is not suitable for any kind of work where color accuracy is the key.


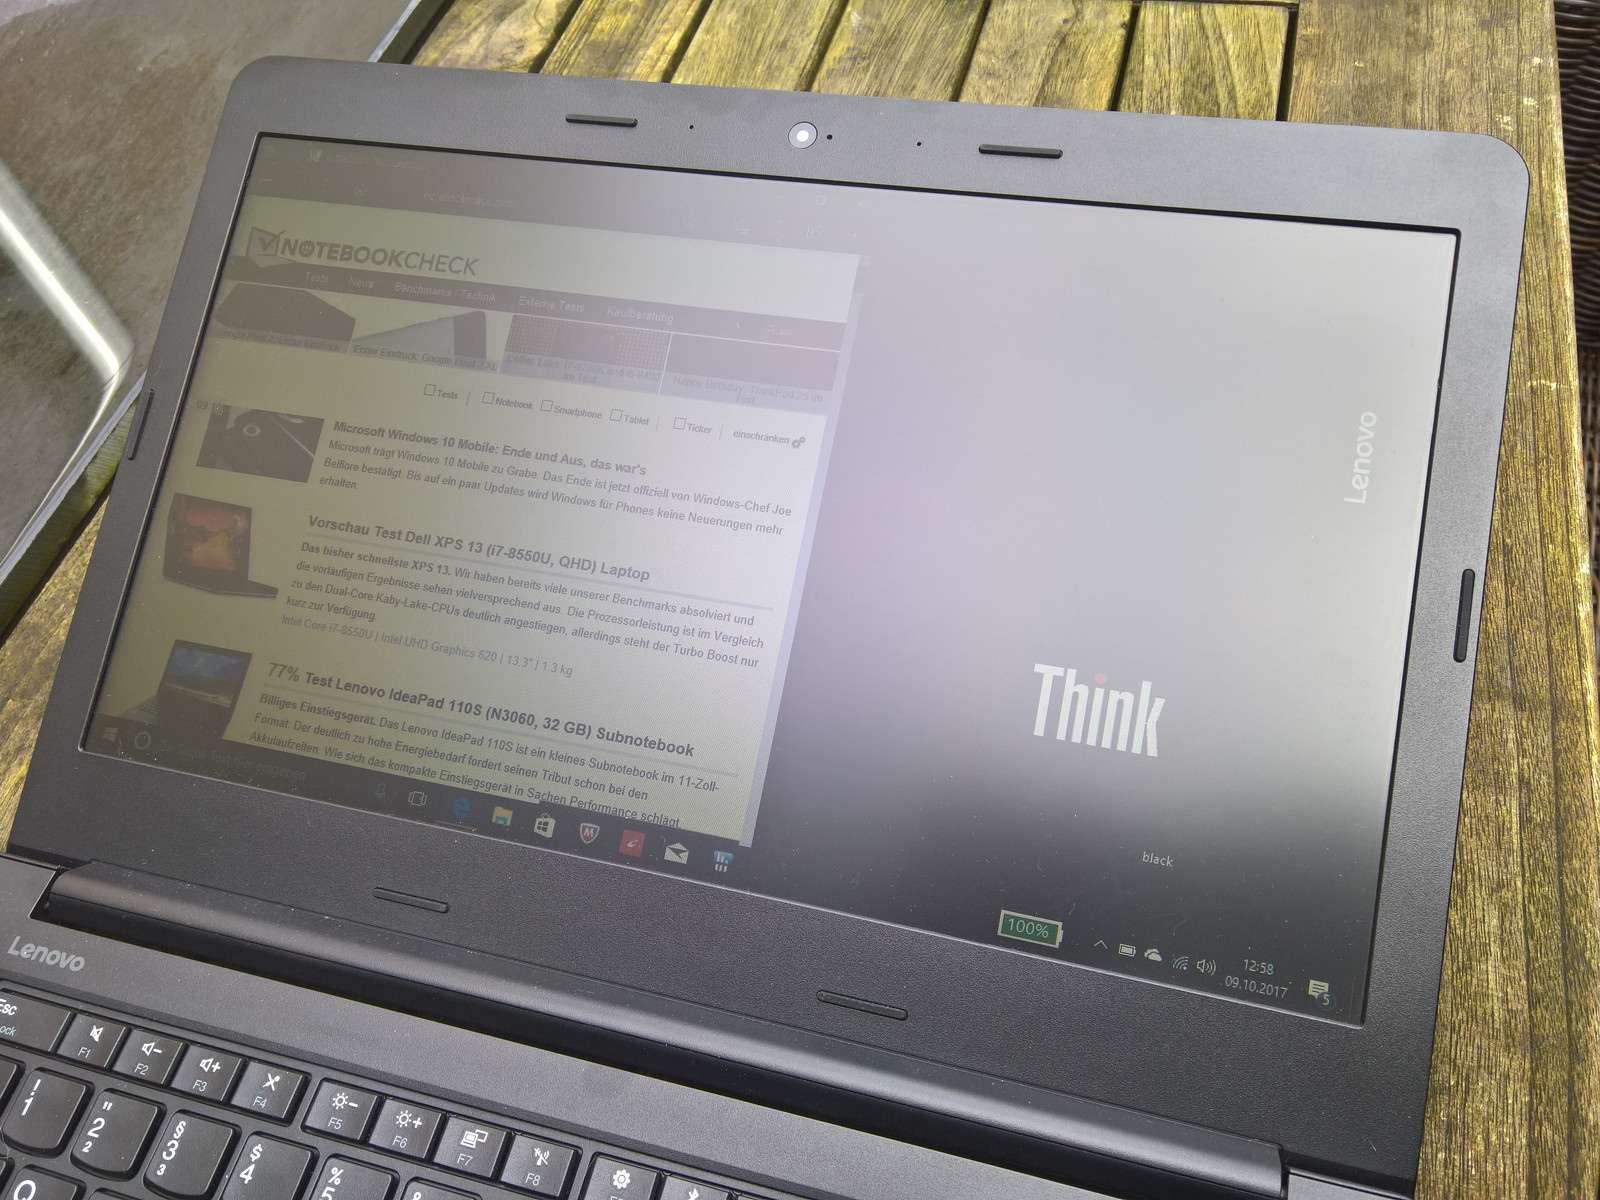
We consider 200 nits the absolute minimum for a display to be usable outdoors. The E470’s panel barely hits that mark, but thanks to its matte surface is therefore somewhat usable outdoors. However, it is uncomfortably dark, even in the shade, and do not even think about ever using it in the sun.
Display Response Times
| ↔ Response Time Black to White | ||
|---|---|---|
| 14 ms ... rise ↗ and fall ↘ combined | ↗ 8 ms rise | 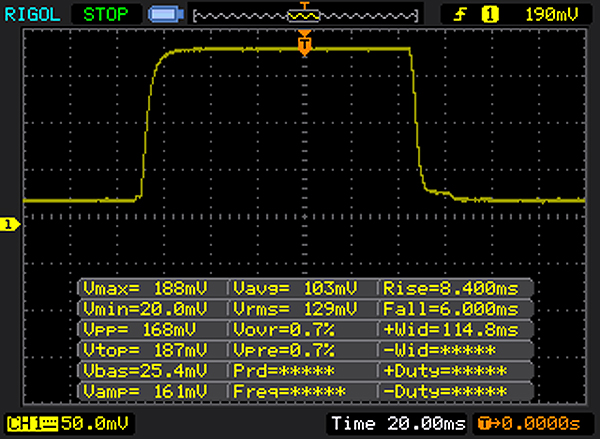 |
| ↘ 6 ms fall | ||
| The screen shows good response rates in our tests, but may be too slow for competitive gamers. In comparison, all tested devices range from 0.1 (minimum) to 240 (maximum) ms. » 34 % of all devices are better. This means that the measured response time is better than the average of all tested devices (19.8 ms). | ||
| ↔ Response Time 50% Grey to 80% Grey | ||
| 44 ms ... rise ↗ and fall ↘ combined | ↗ 22 ms rise | 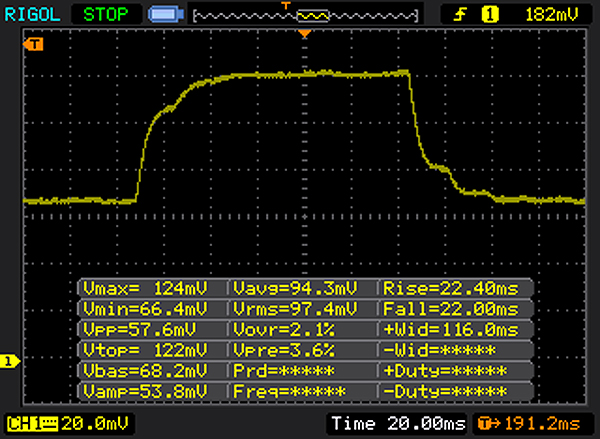 |
| ↘ 22 ms fall | ||
| The screen shows slow response rates in our tests and will be unsatisfactory for gamers. In comparison, all tested devices range from 0.165 (minimum) to 636 (maximum) ms. » 73 % of all devices are better. This means that the measured response time is worse than the average of all tested devices (30.9 ms). | ||
Screen Flickering / PWM (Pulse-Width Modulation)
| Screen flickering / PWM detected | 200 Hz | ≤ 90 % brightness setting | 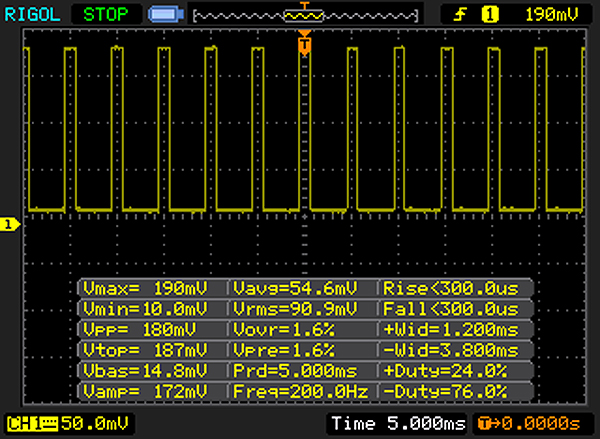 |
The display backlight flickers at 200 Hz (worst case, e.g., utilizing PWM) Flickering detected at a brightness setting of 90 % and below. There should be no flickering or PWM above this brightness setting. The frequency of 200 Hz is relatively low, so sensitive users will likely notice flickering and experience eyestrain at the stated brightness setting and below. In comparison: 52 % of all tested devices do not use PWM to dim the display. If PWM was detected, an average of 7741 (minimum: 5 - maximum: 343500) Hz was measured. | |||
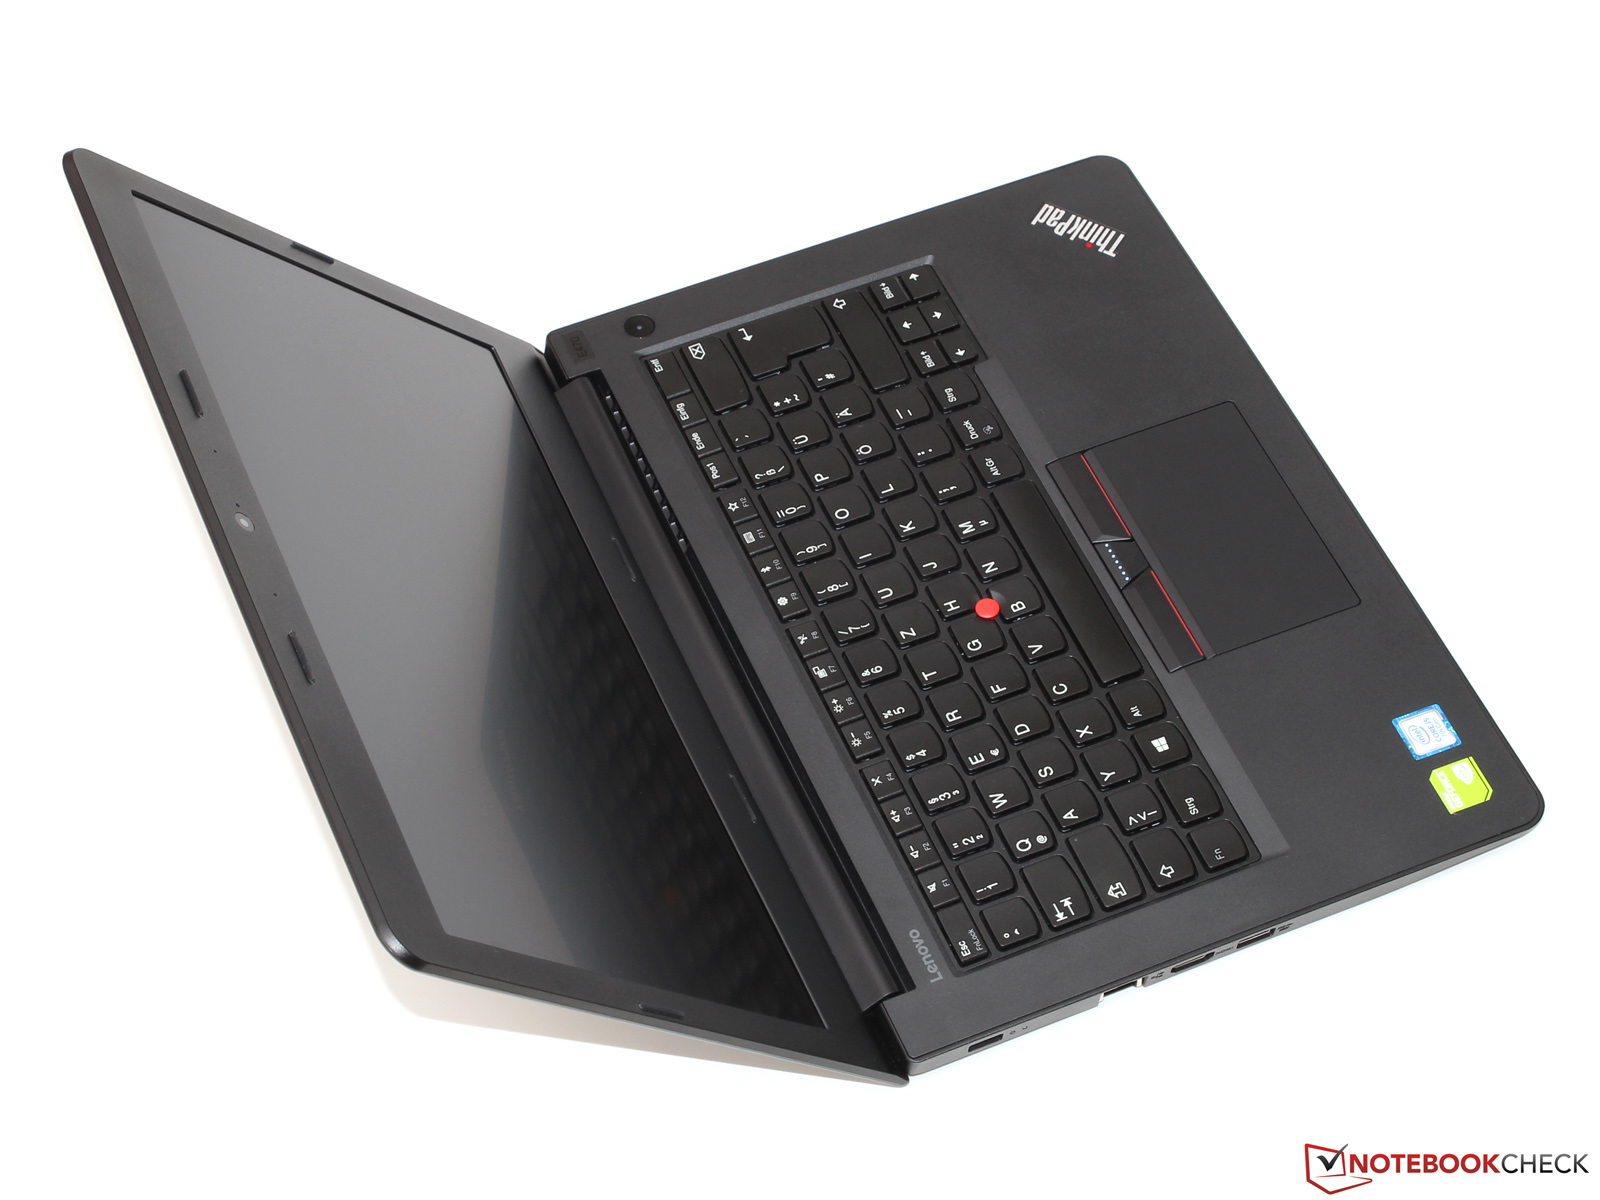
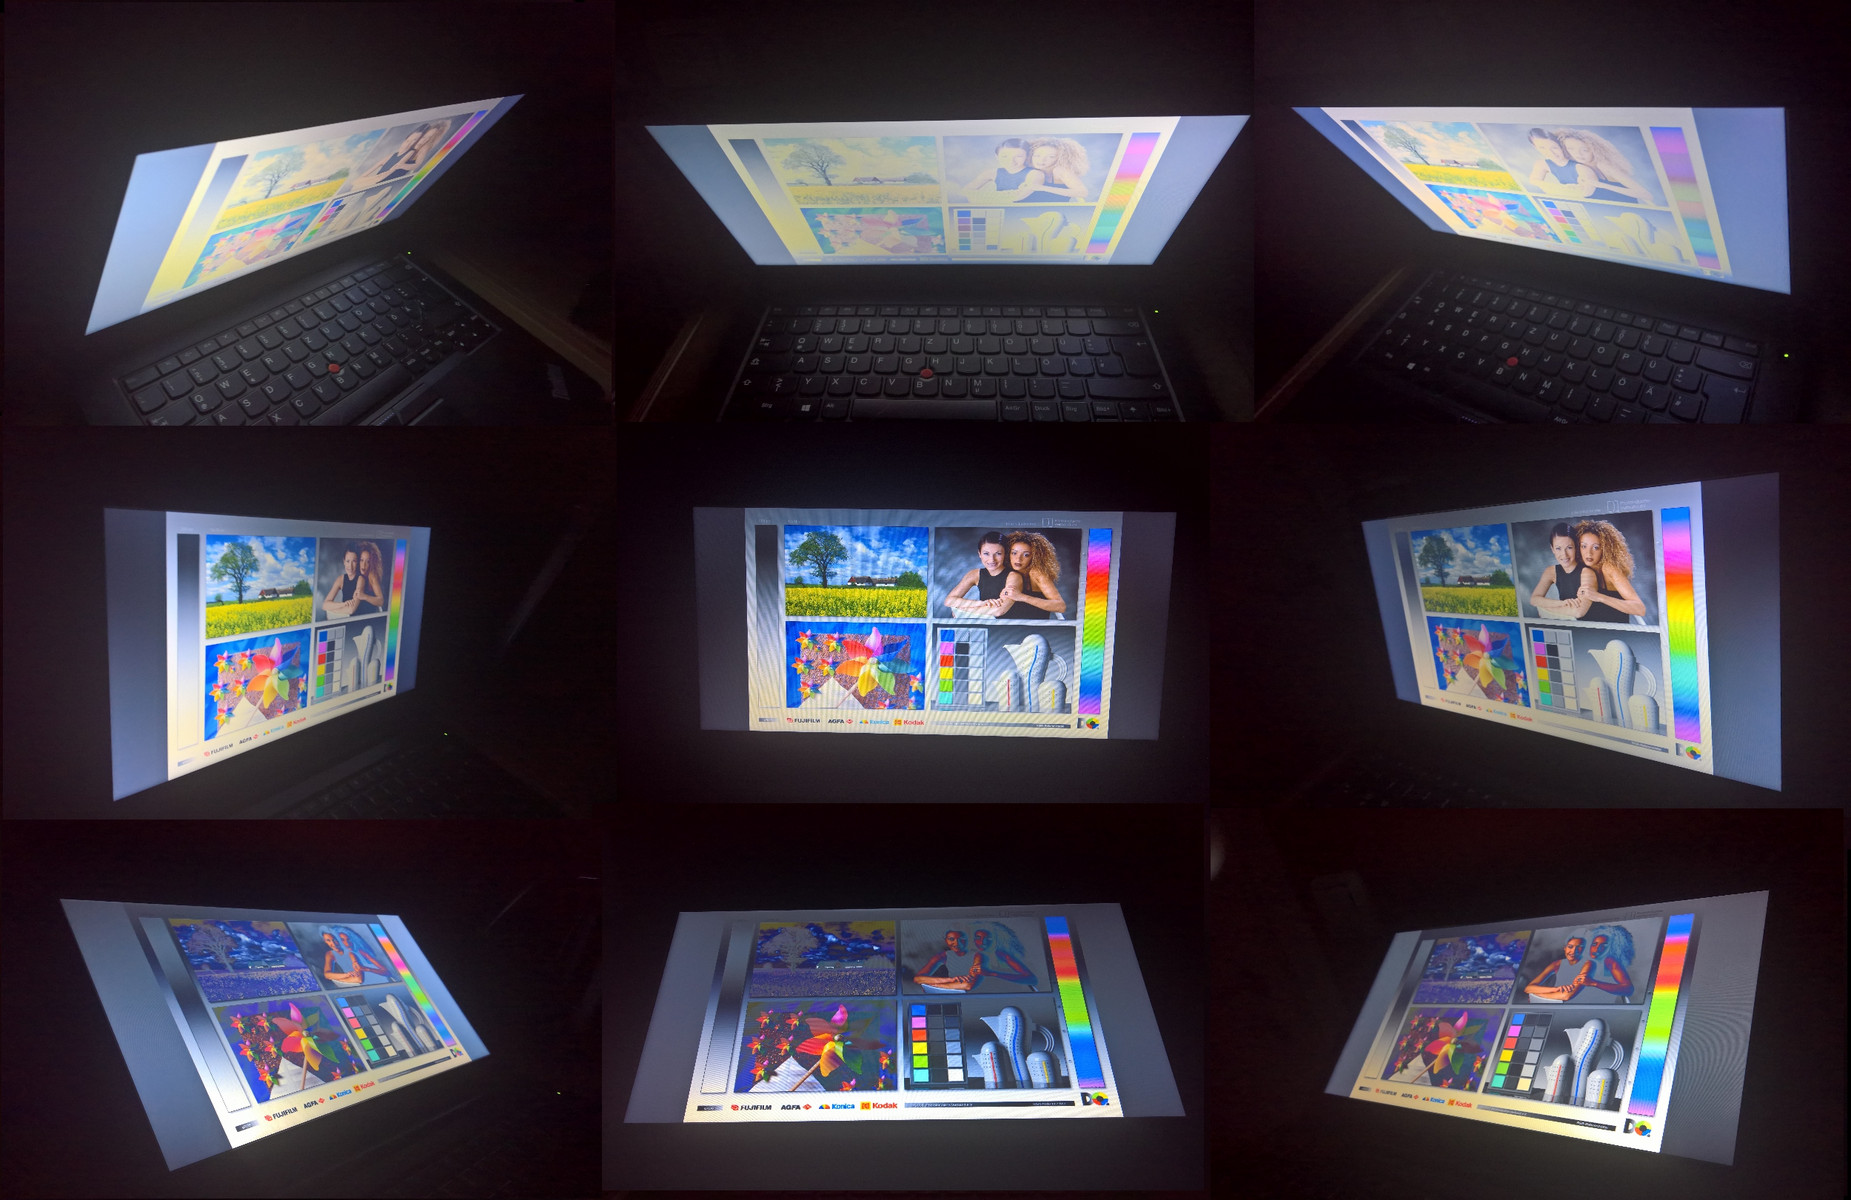
A TN panel’s biggest drawback is its viewing angles. Even the best TN panels are unable to keep up with IPS displays, and our review unit was equipped with a poor TN panel to boot. This means that inverted colors or fading, especially when tilting the display forward or backward. Horizontal viewing angles are slightly better, but nowhere near what we are used to from IPS panels.
Performance
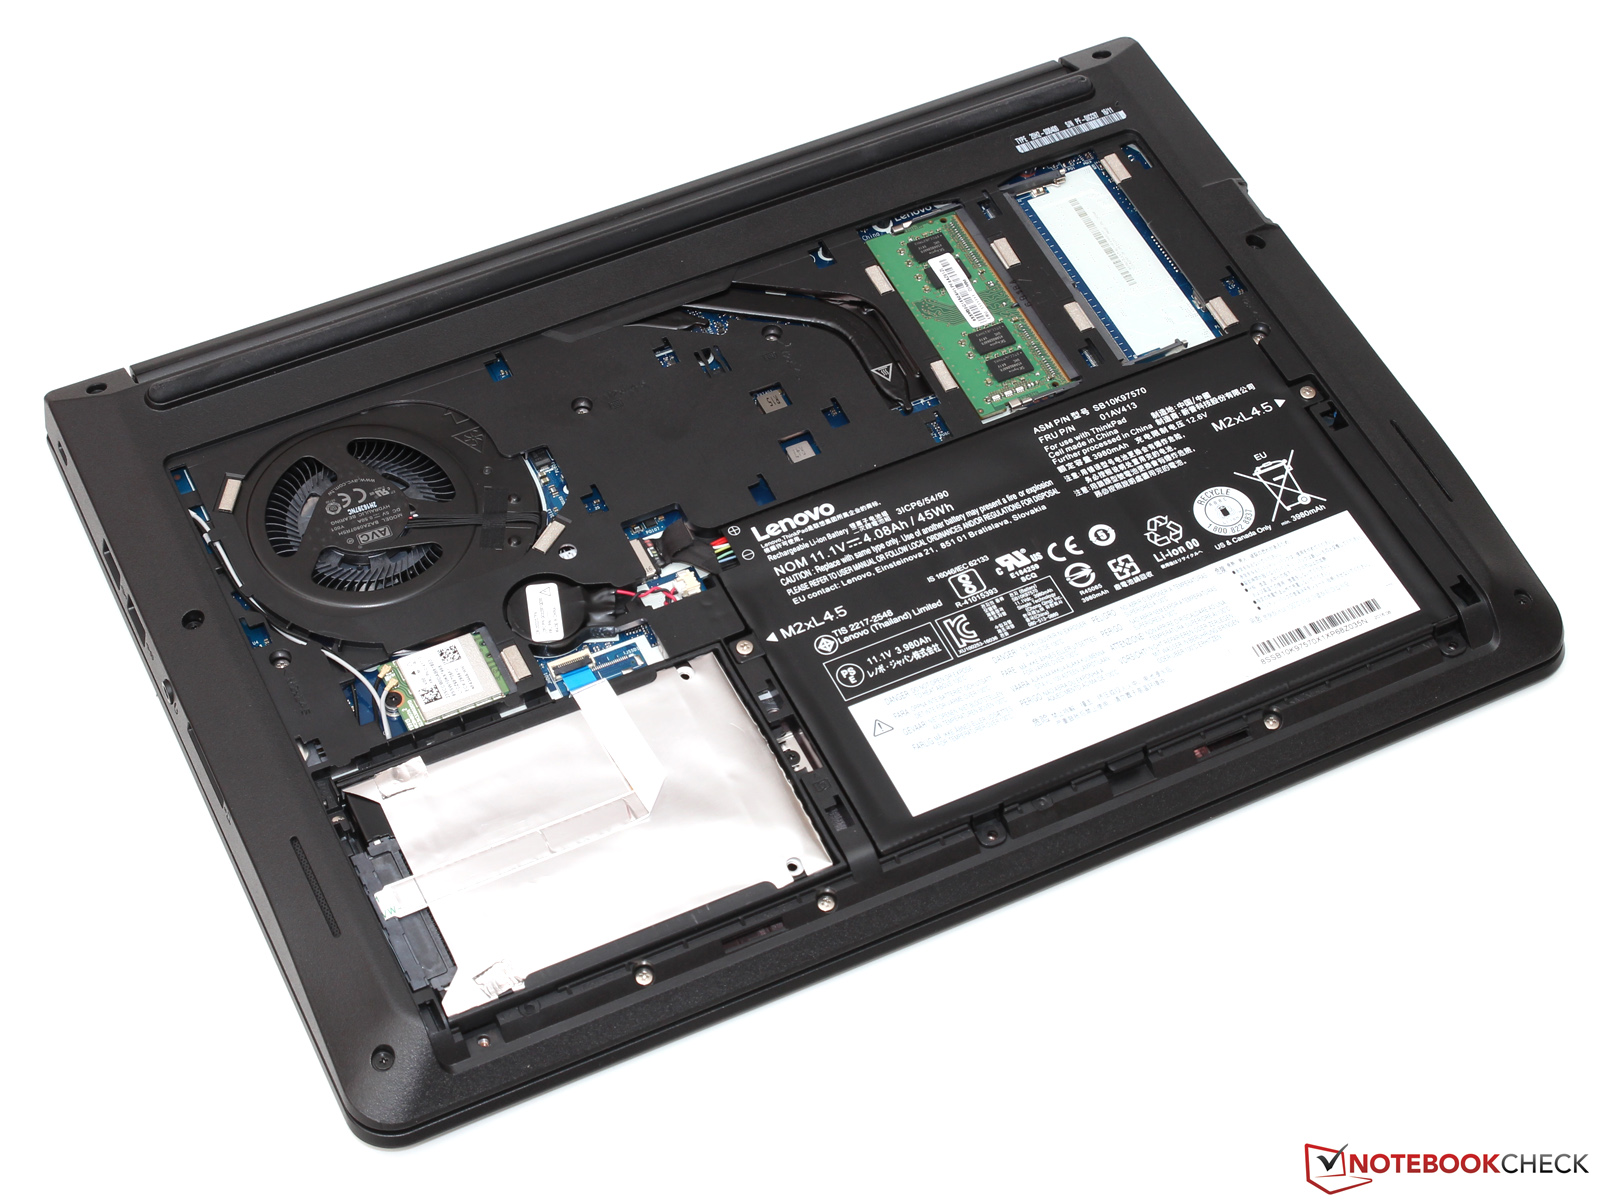
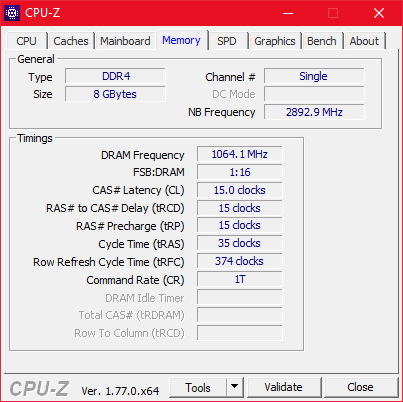
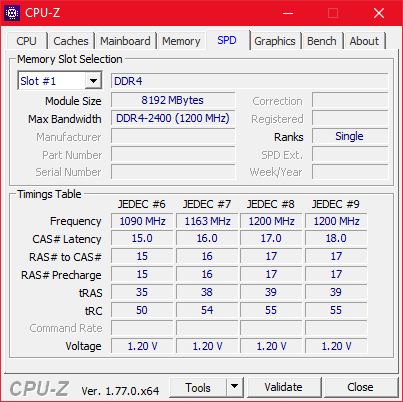
The best way to describe our review unit’s hardware is “neither fish nor fowl.” Given its low price, the terrible HD display is not really a big surprise. Apart from that, however, our review unit was equipped quite nicely: a Core i5, a 256 GB SSD, and 8 GB DDR4-2133 RAM (32 GB max). Cheaper options are available as well, with an i3-7100U, 4 GB of RAM, and a 500 GB HDD at the bottom of the barrel. In this configuration, the E470 will only set you back a mere $540. However, if you are planning on spending a little more, make sure to invest your money in the FHD display.
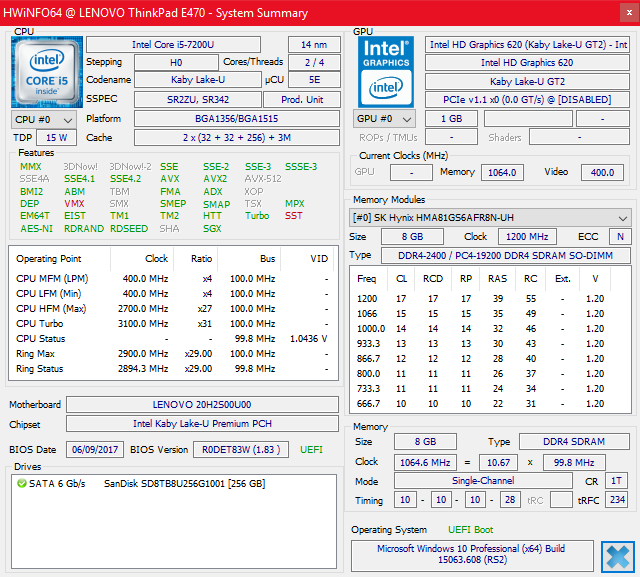
Processor
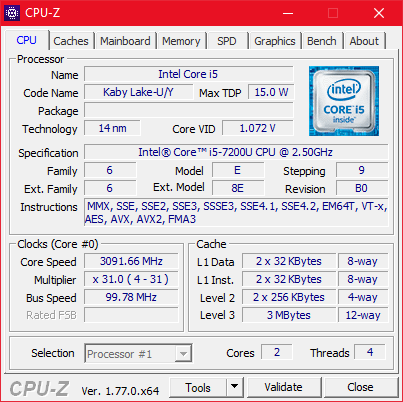
Most of our readers should be quite familiar with Intel’s Core i5-7200U, which seems to be installed in every other notebook reviewed by us. The 15 W Kaby Lake dual-core CPU (four threads thanks to Hyperthreading) was made for Ultrabooks but can be found in much larger and thicker notebooks as well. It runs at a base clock speed of 2.5 GHz and turbo boosts up to 3.1 GHz. Additional information and comparisons can be found in our CPU benchmark list.
In order to simulate sustained CPU load we run Cinebench R15’s multi-core benchmark in a loop for 30 minutes. The CPU was capable of maintaining its high initial performance, which indicates that Lenovo has provided the E470 with an adequate cooling solution.
Comparing the E470 to the other notebooks in our test group yielded no surprises. The Core i5-7200U performed exactly as fast as we would have expected and was capable of maintaining its high 3.1 GHz turbo boost in the Cinebench test.
Unfortunately, performance is reduced slightly on battery and we were only able to achieve a score of 270 to 300 points.
System Performance
Thanks to its SSD, its 8 GB of RAM, and the Core i5 the notebook runs smoothly at all times and never stalled or stuttered. This subjective impression was further reinforced by its decent PCMark performance.
| PCMark 8 Home Score Accelerated v2 | 3674 points | |
| PCMark 8 Work Score Accelerated v2 | 4834 points | |
| PCMark 10 Score | 3144 points | |
Help | ||
Storage Devices
We are already familiar with the 256 GB SanDisk X400 SSD from our previous E470 review, and apart from some minor variations the performance was identical. The X400 is a standard SATA III SSD whose performance is adequate for its price. The ThinkPad T470's PCIe SSD was much faster, but also much more expensive.
| Lenovo ThinkPad E470 SanDisk X400 SED 256GB, SATA (SD8TB8U-256G) | Lenovo ThinkPad E470-20H2S00400 SanDisk X400 SED 256GB, SATA (SD8TB8U-256G) | HP ProBook 440 G4-Y8B51EA SanDisk SD8SNAT256G1002 | Acer TravelMate P249-M-5452 SK Hynix HFS256G39TND-N210A | Dell Latitude 14 3470 Toshiba MQ01ACF050 | Lenovo ThinkPad T470-20HD002HGE Samsung PM961 NVMe MZVLW512HMJP | |
|---|---|---|---|---|---|---|
| CrystalDiskMark 3.0 | -0% | -14% | 7% | -92% | 117% | |
| Read Seq (MB/s) | 454.2 | 476.5 5% | 491.2 8% | 510 12% | 108.9 -76% | 1155 154% |
| Write Seq (MB/s) | 438.1 | 458.7 5% | 322.2 -26% | 267.2 -39% | 103.2 -76% | 1076 146% |
| Read 512 (MB/s) | 304.6 | 346.4 14% | 310.1 2% | 347.6 14% | 811 166% | |
| Write 512 (MB/s) | 343.7 | 291.1 -15% | 276 -20% | 267.5 -22% | 862 151% | |
| Read 4k (MB/s) | 34.15 | 35.15 3% | 19.57 -43% | 33.12 -3% | 0.362 -99% | 55.5 63% |
| Write 4k (MB/s) | 75.1 | 78.8 5% | 77.8 4% | 95.9 28% | 0.946 -99% | 134.6 79% |
| Read 4k QD32 (MB/s) | 284.2 | 276 -3% | 146.3 -49% | 392.8 38% | 0.721 -100% | 496.2 75% |
| Write 4k QD32 (MB/s) | 208.8 | 178.3 -15% | 241.4 16% | 266.4 28% | 0.901 -100% | 425.4 104% |

GPU Performance
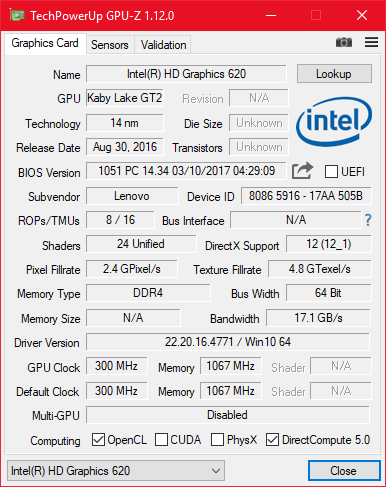
Apart from the display, the other big difference between the two E470 models reviewed by us is the GPU. Instead of a dedicated Nvidia GeForce 940MX we only find Intel’s integrated HD Graphics 620 with 24 execute units and shared memory. Further details and benchmarks can be found in our GPU benchmark list.
GPU performance was slightly reduced by the single RAM module resulting in single channel RAM speeds. A minor improvement can be achieved by adding a second RAM module. However, do not expect any miracles: the HD 620 is never going to catch up to the much faster dedicated Nvidia chips. Even the DDR3-equipped 940MX from our other E470 review was between 30 and 100% faster than the HD 620.
Unlike the CPU performance, the GPU performance was not restricted on battery.
| 3DMark 11 - 1280x720 Performance GPU | |
| Lenovo ThinkPad E470-20H2S00400 | |
| HP ProBook 440 G4-Y8B51EA | |
| Lenovo ThinkPad T470-20HD002HGE | |
| Lenovo ThinkPad E470 | |
| Acer TravelMate P249-M-5452 | |
| Dell Latitude 14 3470 | |
| 3DMark 11 Performance | 1522 points | |
| 3DMark Cloud Gate Standard Score | 5502 points | |
| 3DMark Fire Strike Score | 789 points | |
Help | ||
Gaming Performance
Even older games can only be enjoyed with significantly reduced details on the HD 620. If you happen to be looking for a notebook capable of gaming, the 940MX-equipped SKU would be much more suitable for you. If your requirements are even higher (after all the 940MX is not the fastest kid on the block) you may want to take a look at our gaming top 10 list.
| low | med. | high | ultra | |
|---|---|---|---|---|
| BioShock Infinite (2013) | 39.74 | 23 () | 19 () | |
| Company of Heroes 2 (2013) | 21.28 | |||
| Rise of the Tomb Raider (2016) | 15.7 |
Emissions
System Noise
As is quite common for notebooks equipped with U-series CPUs the fan is completely off under low to medium load. And while it did obviously turn on under heavy load it remained noticeably quieter than on the 940MX-equipped SKU. We found no evidence of coil whining.
Noise level
| Idle |
| 30.5 / 30.5 / 30.5 dB(A) |
| Load |
| 32.9 / 32.9 dB(A) |
 | ||
30 dB silent 40 dB(A) audible 50 dB(A) loud |
||
min: | ||
Temperature
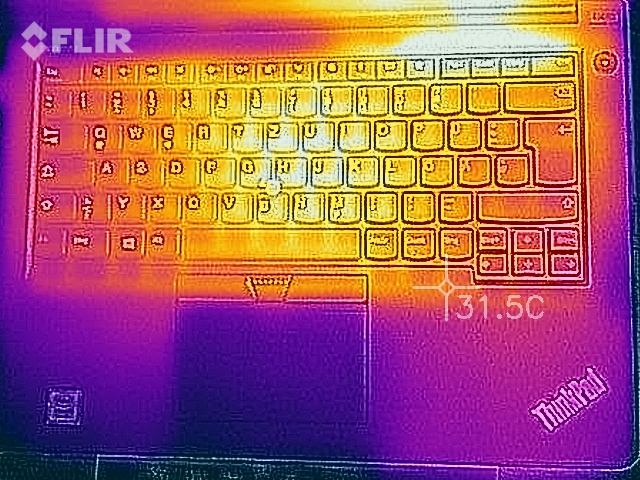
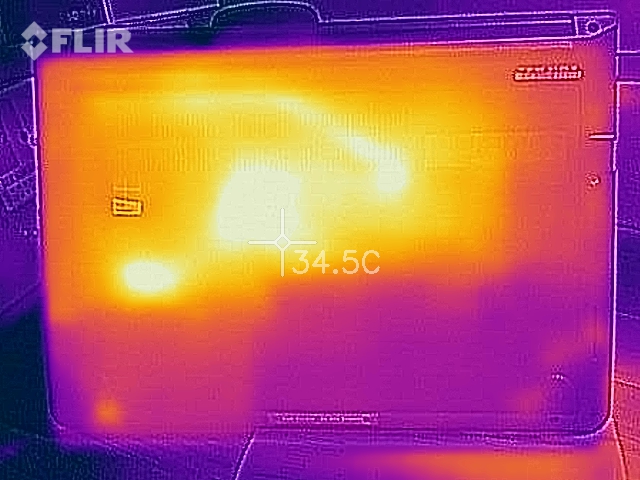
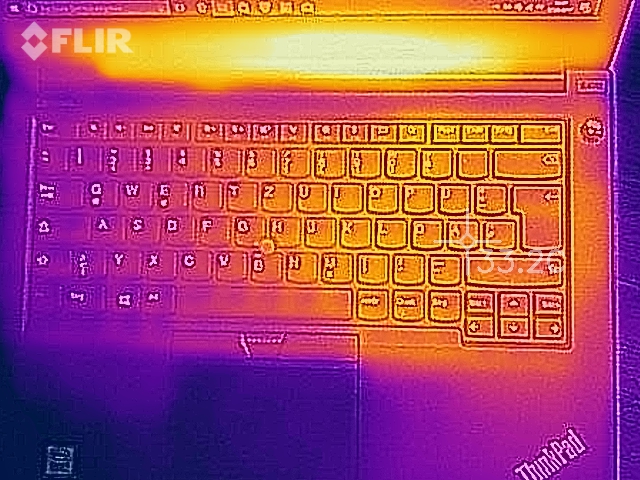
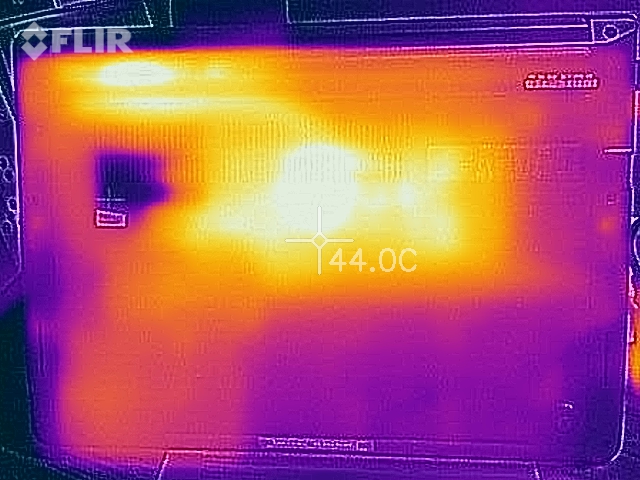
The cooling system handles the installed components with ease. This is not only evident by the low overall noise levels, but also the low temperatures. Even under load the case heats up to only 37 °C (~99 °F; 44 °C/~111 °F at a single hotspot around the fan vent). Accordingly, unlike the 940MX-equipped model, the E470 without an Nvidia GPU remained very cool.
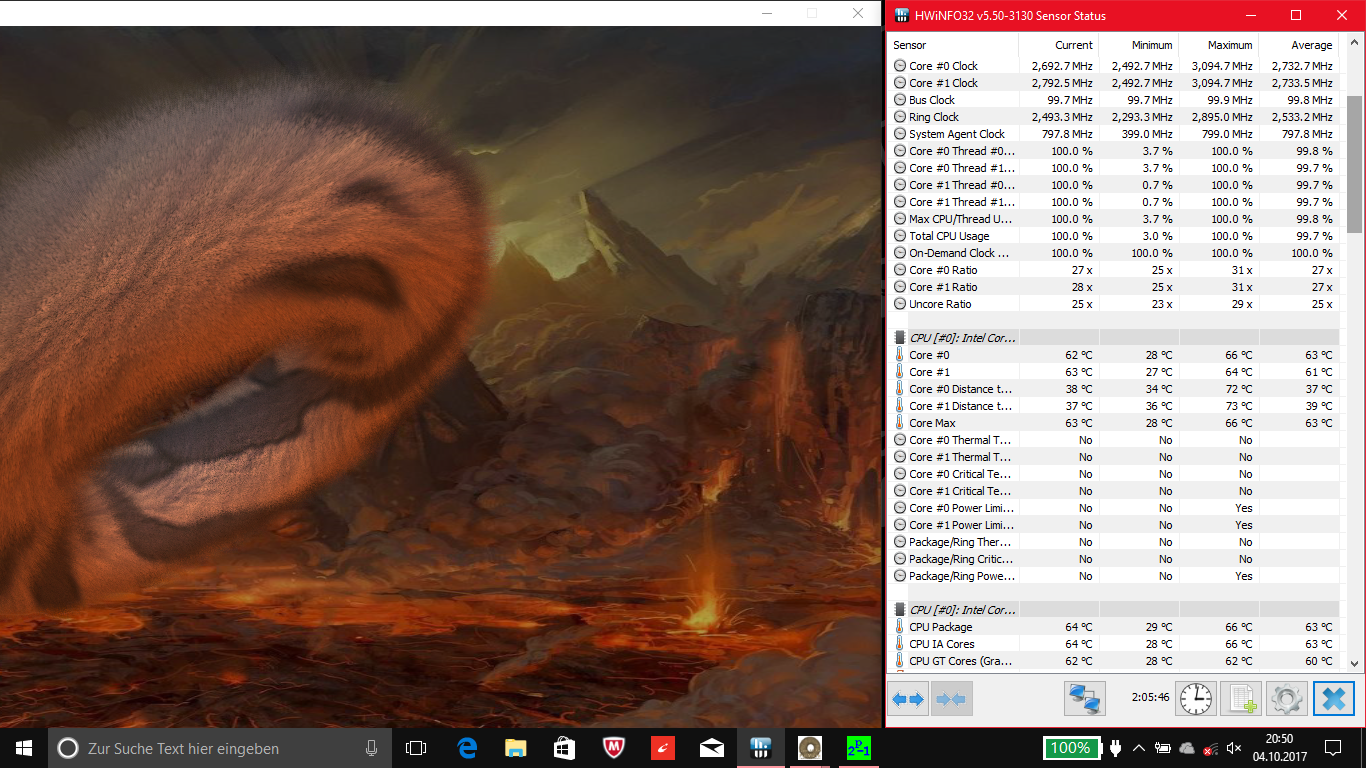
Given its low surface temperature, it should be no surprise that the notebook handled our stress test remarkably well. With Prime95 and FurMark running simultaneously the maximum temperature recorded was 66 °C (~151 °F). The CPU was running at a stable 2.7 GHz throughout the entire duration of the 2 hour long stress test, and while it did not utilize its full turbo boost potential it did not throttle.
The effects on everyday performance were non-existent, and running 3DMark 11 immediately after the stress test yielded the expected scores.
(+) The maximum temperature on the upper side is 35.6 °C / 96 F, compared to the average of 34.3 °C / 94 F, ranging from 21.2 to 62.5 °C for the class Office.
(+) The bottom heats up to a maximum of 37.2 °C / 99 F, compared to the average of 36.8 °C / 98 F
(+) In idle usage, the average temperature for the upper side is 22.7 °C / 73 F, compared to the device average of 29.5 °C / 85 F.
(+) The palmrests and touchpad are cooler than skin temperature with a maximum of 26.7 °C / 80.1 F and are therefore cool to the touch.
(±) The average temperature of the palmrest area of similar devices was 27.6 °C / 81.7 F (+0.9 °C / 1.6 F).
Speakers
Given the poor quality of notebook speakers, our expectations were fairly low at this point. No bass, low maximum volume, distortions at higher volume levels, and mushy highs are what we have come to expect in the last few years. And the E470’s speakers fit right in, with no bass to speak of whatsoever and an overall somewhat decent performance. At least they were fairly loud.
As expected, the 3.5 mm headphone jack worked very well.
Lenovo ThinkPad E470 audio analysis
(+) | speakers can play relatively loud (82.4 dB)
Bass 100 - 315 Hz
(-) | nearly no bass - on average 17.5% lower than median
(±) | linearity of bass is average (11.7% delta to prev. frequency)
Mids 400 - 2000 Hz
(±) | higher mids - on average 10.6% higher than median
(±) | linearity of mids is average (14% delta to prev. frequency)
Highs 2 - 16 kHz
(+) | balanced highs - only 4.5% away from median
(±) | linearity of highs is average (11.2% delta to prev. frequency)
Overall 100 - 16.000 Hz
(±) | linearity of overall sound is average (25.8% difference to median)
Compared to same class
» 79% of all tested devices in this class were better, 7% similar, 14% worse
» The best had a delta of 7%, average was 21%, worst was 53%
Compared to all devices tested
» 79% of all tested devices were better, 4% similar, 17% worse
» The best had a delta of 4%, average was 23%, worst was 134%
Lenovo ThinkPad T470-20HD002HGE audio analysis
(±) | speaker loudness is average but good (80.4 dB)
Bass 100 - 315 Hz
(-) | nearly no bass - on average 16.6% lower than median
(±) | linearity of bass is average (8.8% delta to prev. frequency)
Mids 400 - 2000 Hz
(+) | balanced mids - only 4.3% away from median
(+) | mids are linear (6.7% delta to prev. frequency)
Highs 2 - 16 kHz
(±) | higher highs - on average 5.4% higher than median
(±) | linearity of highs is average (13.3% delta to prev. frequency)
Overall 100 - 16.000 Hz
(±) | linearity of overall sound is average (18.7% difference to median)
Compared to same class
» 35% of all tested devices in this class were better, 6% similar, 59% worse
» The best had a delta of 7%, average was 21%, worst was 53%
Compared to all devices tested
» 43% of all tested devices were better, 8% similar, 49% worse
» The best had a delta of 4%, average was 23%, worst was 134%
Frequency diagram (checkboxes selectable/deselectable!)
Energy Management
Power Consumption
Our review unit’s power consumption was a bit of a puzzle. We did foresee the 940MX-equipped E470’s higher power consumption under load, that was a given. However, despite the higher resolution display, its power consumption when idle was lower than our review unit’s! In the idle test, the latter turned out to be the least energy efficient notebook of our entire test group.
The 45-W charger is amply dimensioned.
| Off / Standby | |
| Idle | |
| Load |
|
Key:
min: | |
| Lenovo ThinkPad E470 i5-7200U, HD Graphics 620, SanDisk X400 SED 256GB, SATA (SD8TB8U-256G), TN LED, 1366x768, 14" | Lenovo ThinkPad E470-20H2S00400 i5-7200U, GeForce 940MX, SanDisk X400 SED 256GB, SATA (SD8TB8U-256G), IPS, 1920x1080, 14" | HP ProBook 440 G4-Y8B51EA i7-7500U, GeForce 930MX, SanDisk SD8SNAT256G1002, TN, 1920x1080, 14" | Acer TravelMate P249-M-5452 6200U, HD Graphics 520, SK Hynix HFS256G39TND-N210A, TN LED, 1920x1080, 14" | Dell Latitude 14 3470 6100U, HD Graphics 520, Toshiba MQ01ACF050, TN LED, 1366x768, 14" | Lenovo ThinkPad T470-20HD002HGE i5-7200U, HD Graphics 620, Samsung PM961 NVMe MZVLW512HMJP, IPS, 1920x1080, 14" | |
|---|---|---|---|---|---|---|
| Power Consumption | -11% | -4% | 8% | 7% | 16% | |
| Idle Minimum * (Watt) | 5.2 | 2.7 48% | 3 42% | 3.8 27% | 5 4% | 3.21 38% |
| Idle Average * (Watt) | 7.6 | 5.5 28% | 5.4 29% | 7.6 -0% | 6.8 11% | 6.15 19% |
| Idle Maximum * (Watt) | 9.9 | 6.5 34% | 6.3 36% | 8 19% | 8.9 10% | 6.82 31% |
| Load Average * (Watt) | 31 | 44.2 -43% | 37.5 -21% | 30.5 2% | 26.2 15% | 28.5 8% |
| Load Maximum * (Watt) | 29.7 | 65.2 -120% | 61.1 -106% | 32.5 -9% | 31.8 -7% | 34.5 -16% |
* ... smaller is better
Battery Life
Unlike the more business-oriented T470 or L470 models, the E470 has only a non-replaceable built-in 45 Wh lithium-polymer battery.
But while power consumption seemed to hint towards a shorter battery life than on the other E470, the opposite was actually the case. Our review unit managed to outperform the other E470 in every single test save for the load test. In our real-life Wi-Fi test it even managed to top the scoreboard.
Charging the E470’s battery from near empty to 100% takes around two hours.
| Lenovo ThinkPad E470 i5-7200U, HD Graphics 620, 45 Wh | Lenovo ThinkPad E470-20H2S00400 i5-7200U, GeForce 940MX, 45 Wh | HP ProBook 440 G4-Y8B51EA i7-7500U, GeForce 930MX, 48 Wh | Acer TravelMate P249-M-5452 6200U, HD Graphics 520, 41 Wh | Dell Latitude 14 3470 6100U, HD Graphics 520, 41 Wh | Lenovo ThinkPad T470-20HD002HGE i5-7200U, HD Graphics 620, 48 Wh | |
|---|---|---|---|---|---|---|
| Battery runtime | -9% | 5% | -25% | -21% | 0% | |
| Reader / Idle (h) | 18.5 | 17.4 -6% | 18.1 -2% | 13.2 -29% | 11.1 -40% | |
| H.264 (h) | 9.1 | 8.4 -8% | 9.5 4% | 6 -34% | 10.4 14% | |
| WiFi v1.3 (h) | 8 | 5.4 -32% | 6.9 -14% | 6.7 -16% | 4.6 -43% | 7.3 -9% |
| Load (h) | 1.9 | 2.1 11% | 2.5 32% | 1.5 -21% | 2.3 21% | 1.8 -5% |
Verdict
Pros
Cons
The bottom line is that the E470 is an affordable business notebook, but we cannot recommend this particular configuration that we have reviewed today.
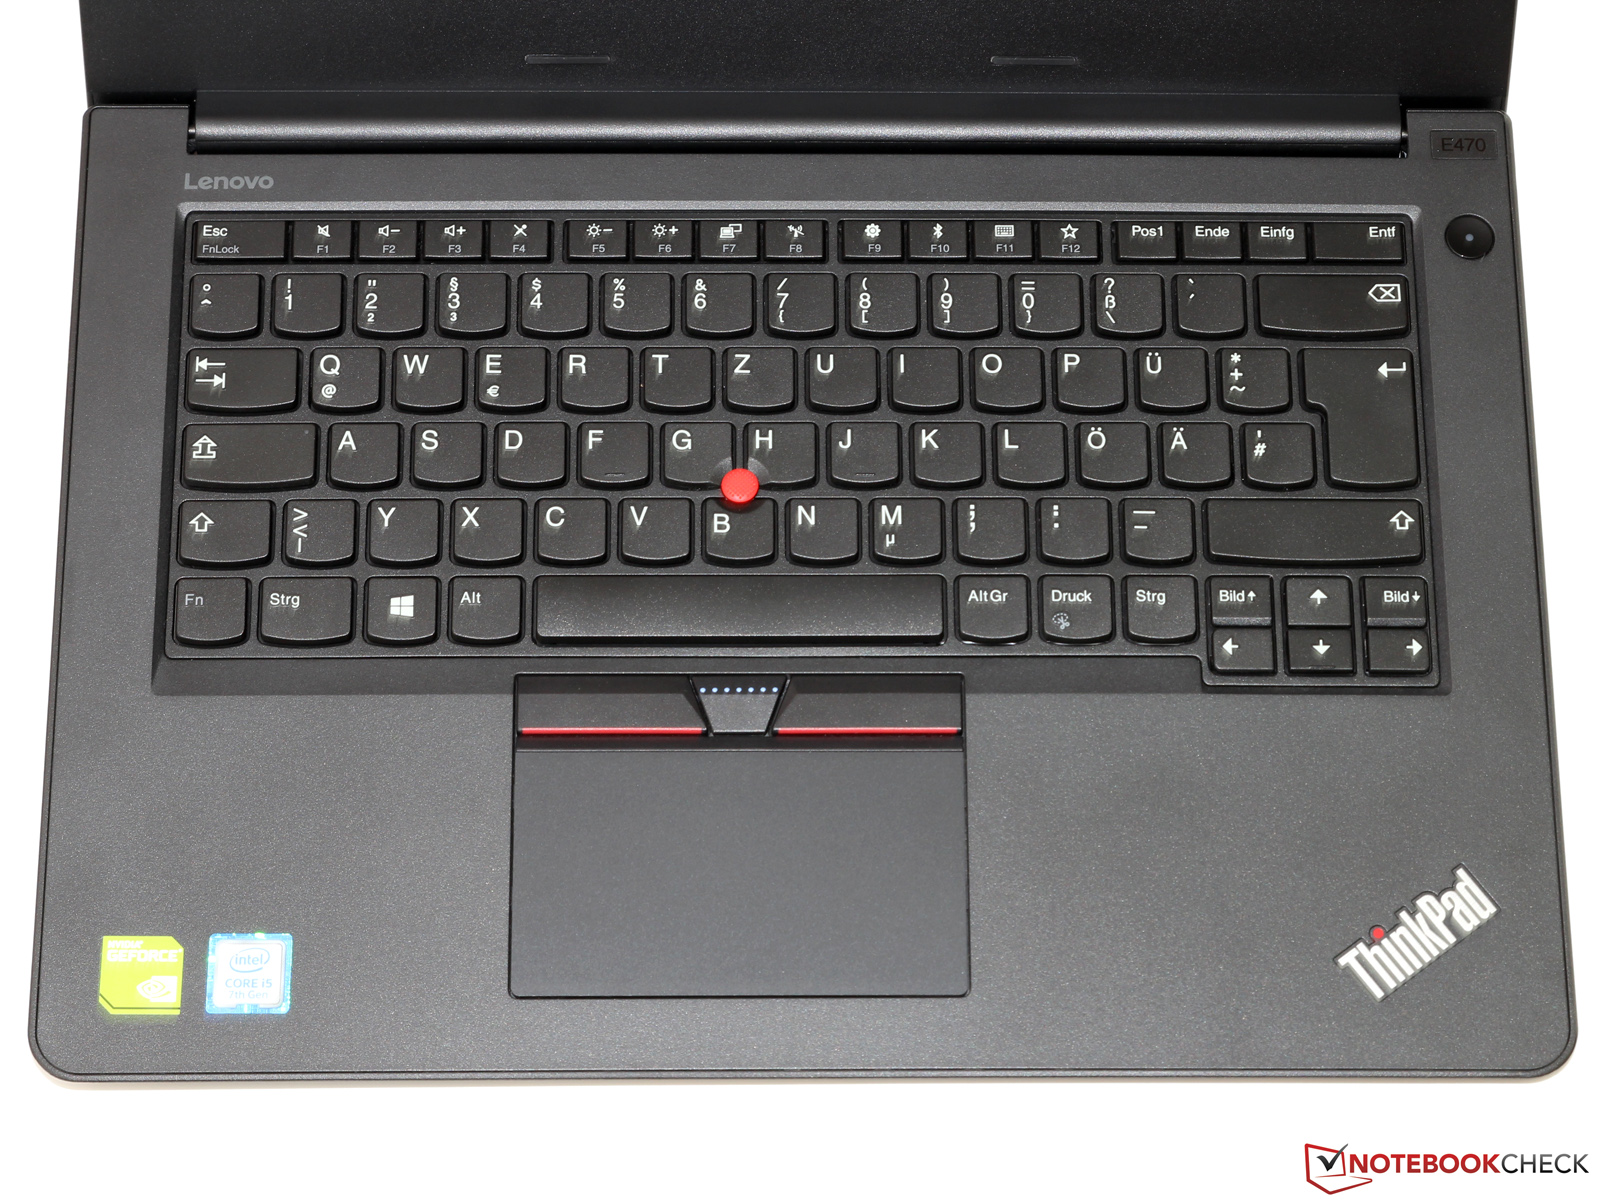
It shares many of its advantages with the other E470: comfortable and decent input devices with the almost legendary ThinkPad keyboard and track point; a solid and well-made case that, while certainly not the prettiest does the job very well; a fast Wi-Fi modem; and solid application performance - all that you can expect from the E470. The only two aspects where today’s review unit bests the other 940MX-equipped E470Lenovo ThinkPad E470 (Core i5, GeForce 940MX) Notebook Review are cooling system and battery life. The lack of Nvidia GPU renders the notebook much cooler and quieter, and the low display resolution results in an improved battery life.
That is, however, the HD display’s only advantage. Otherwise, the display is abysmal: way too high black level, dreadfully narrow viewing angles, and color space coverage not worthy of its name. Furthermore, it also uses PWM for brightness modulation at a very low frequency.
We cannot recommend the particular E470 model in review due to its unbalanced configuration and its abysmal display. Should you be interested in the E470 make sure to get the IPS display.
This alone is enough to deny the E470 a recommendation. Almost $800 is simply too much for a notebook with a display as poor as this. Should you be interested in the E470 make sure to get the FHD IPS display. Either way, the E470 is far from perfect. We do for example, miss a USB-C port and Lenovo’s standard limited warranty of only 12 months is on the short side. We could live with these disadvantages given the notebook’s low price, but the display is a deal-breaker. Also, the device was incapable of delivering its maximum performance on battery, which is why the final score had to be lowered accordingly.
Lenovo ThinkPad E470
- 10/12/2017 v6 (old)
Benjamin Herzig
Price comparison

