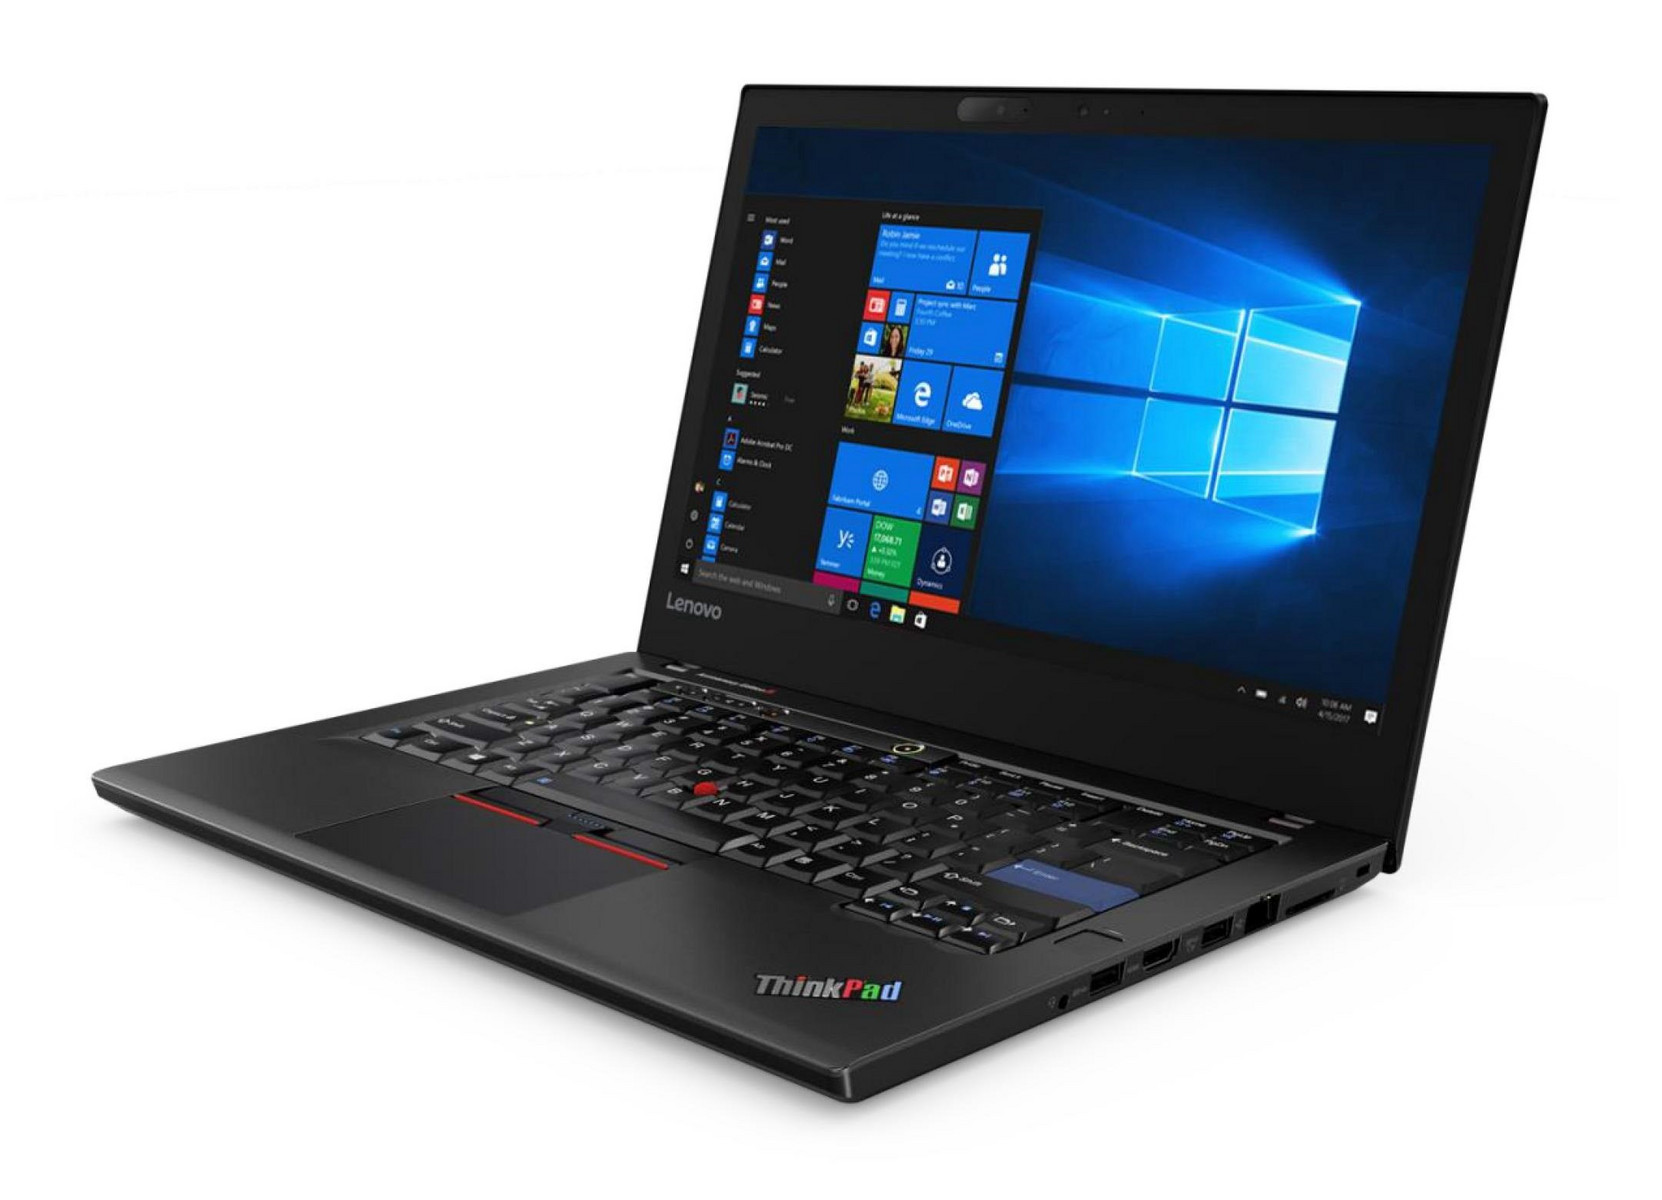
Lenovo ThinkPad 25 Anniversary Edition Laptop Review

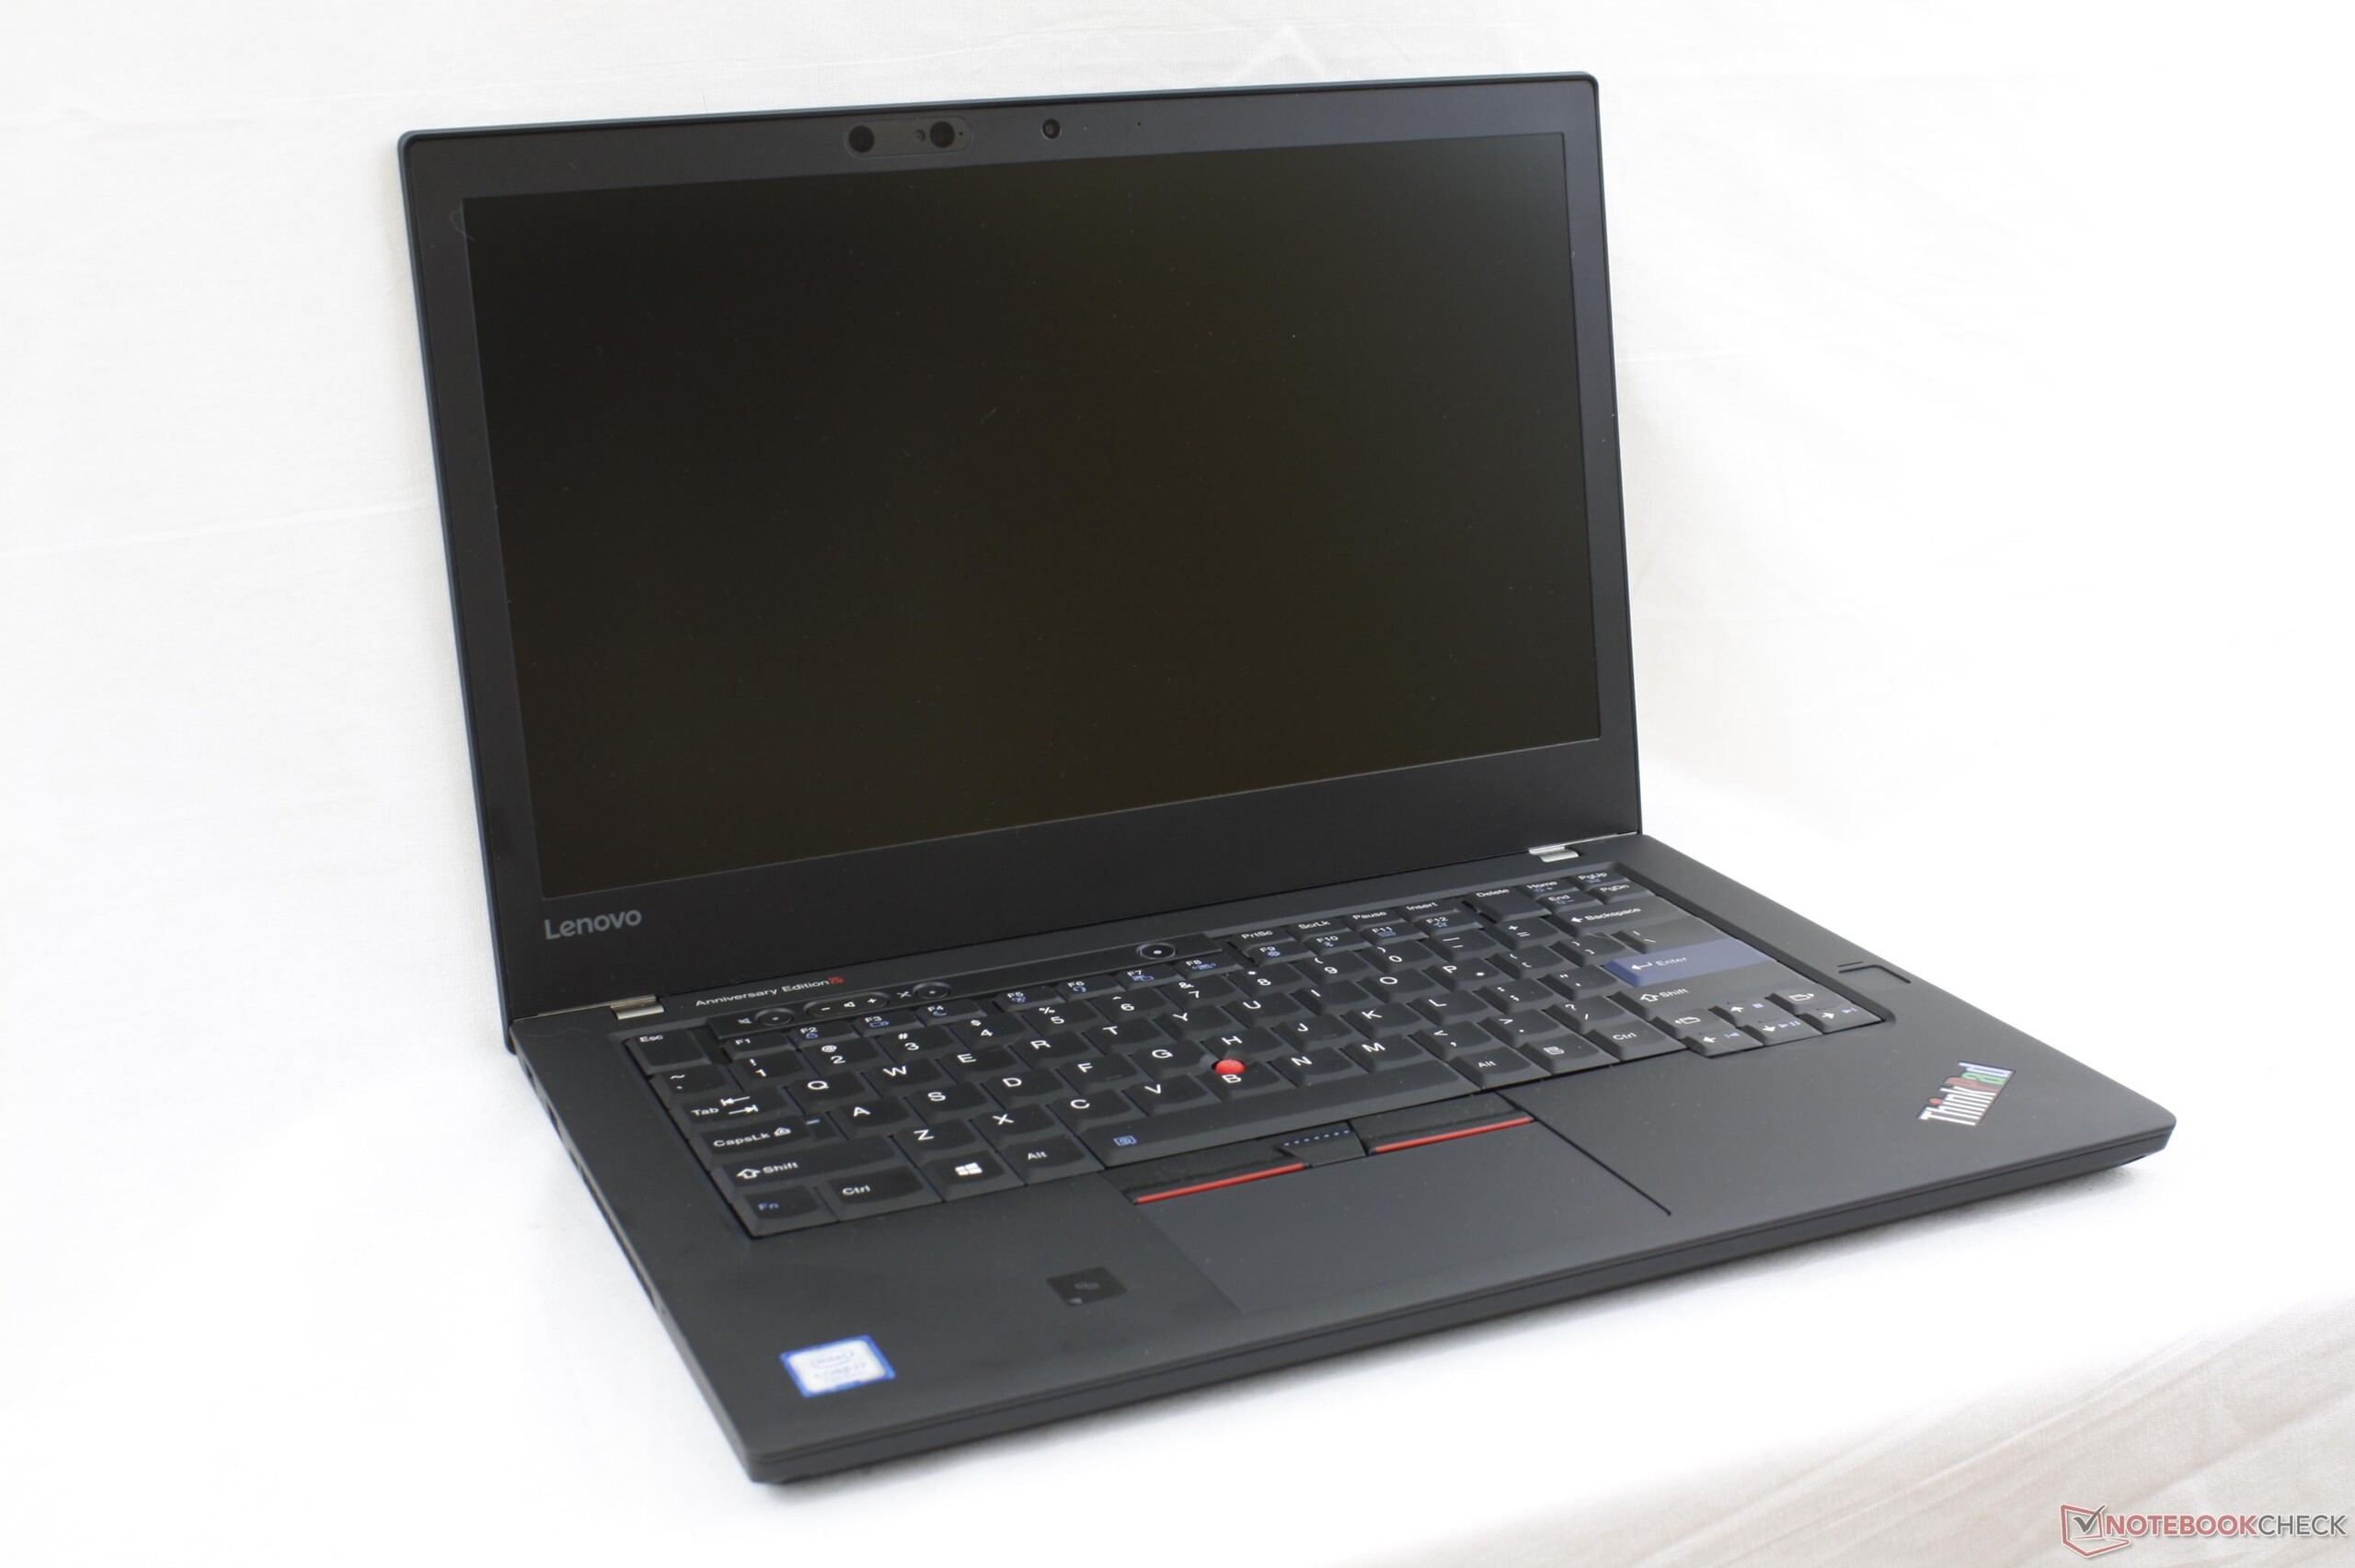
Stirring up nostalgia is a proven way to drive sales if the recent Nintendo Classic consoles are of any indication. In celebration of the ThinkPad's 25th anniversary, Lenovo has repackaged the standard ThinkPad T470 with the classic 7-row ThinkPad keyboard of old and relabeled it as the new ThinkPad 25. This "retro-style" ThinkPad had been rumored for over two years and it is now finally available in limited quantities directly from Lenovo for $1900 USD. The manufacturer has informed us that this is the only planned configuration; what you see here is what you will get.
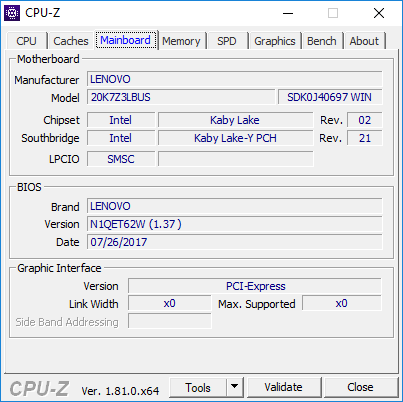
Beyond the keyboard and packaging changes, however, the ThinkPad 25 utilizes the same chassis as the T470 released earlier this year. It is, in essence, a T470 with the AccuType keyboard swapped out for a traditional ThinkPad T420 keyboard and with new rubberized coating on the lid and palm rests. There has been some internal updates since the last time we checked out the T470 including the CPU (i5-7200U to i7-7500U), GPU (HD Graphics 620 to GeForce 940MX), and RAM (8 GB DDR4 to 16 GB DDR4), but we recommend reading up on our existing review of the T470 for more information on the chassis and connectivity features since both are nearly identical.
In this review, we'll be focusing on the performance of the ThinkPad 25 and the advantages and disadvantages it carries over the standard T470.
Case
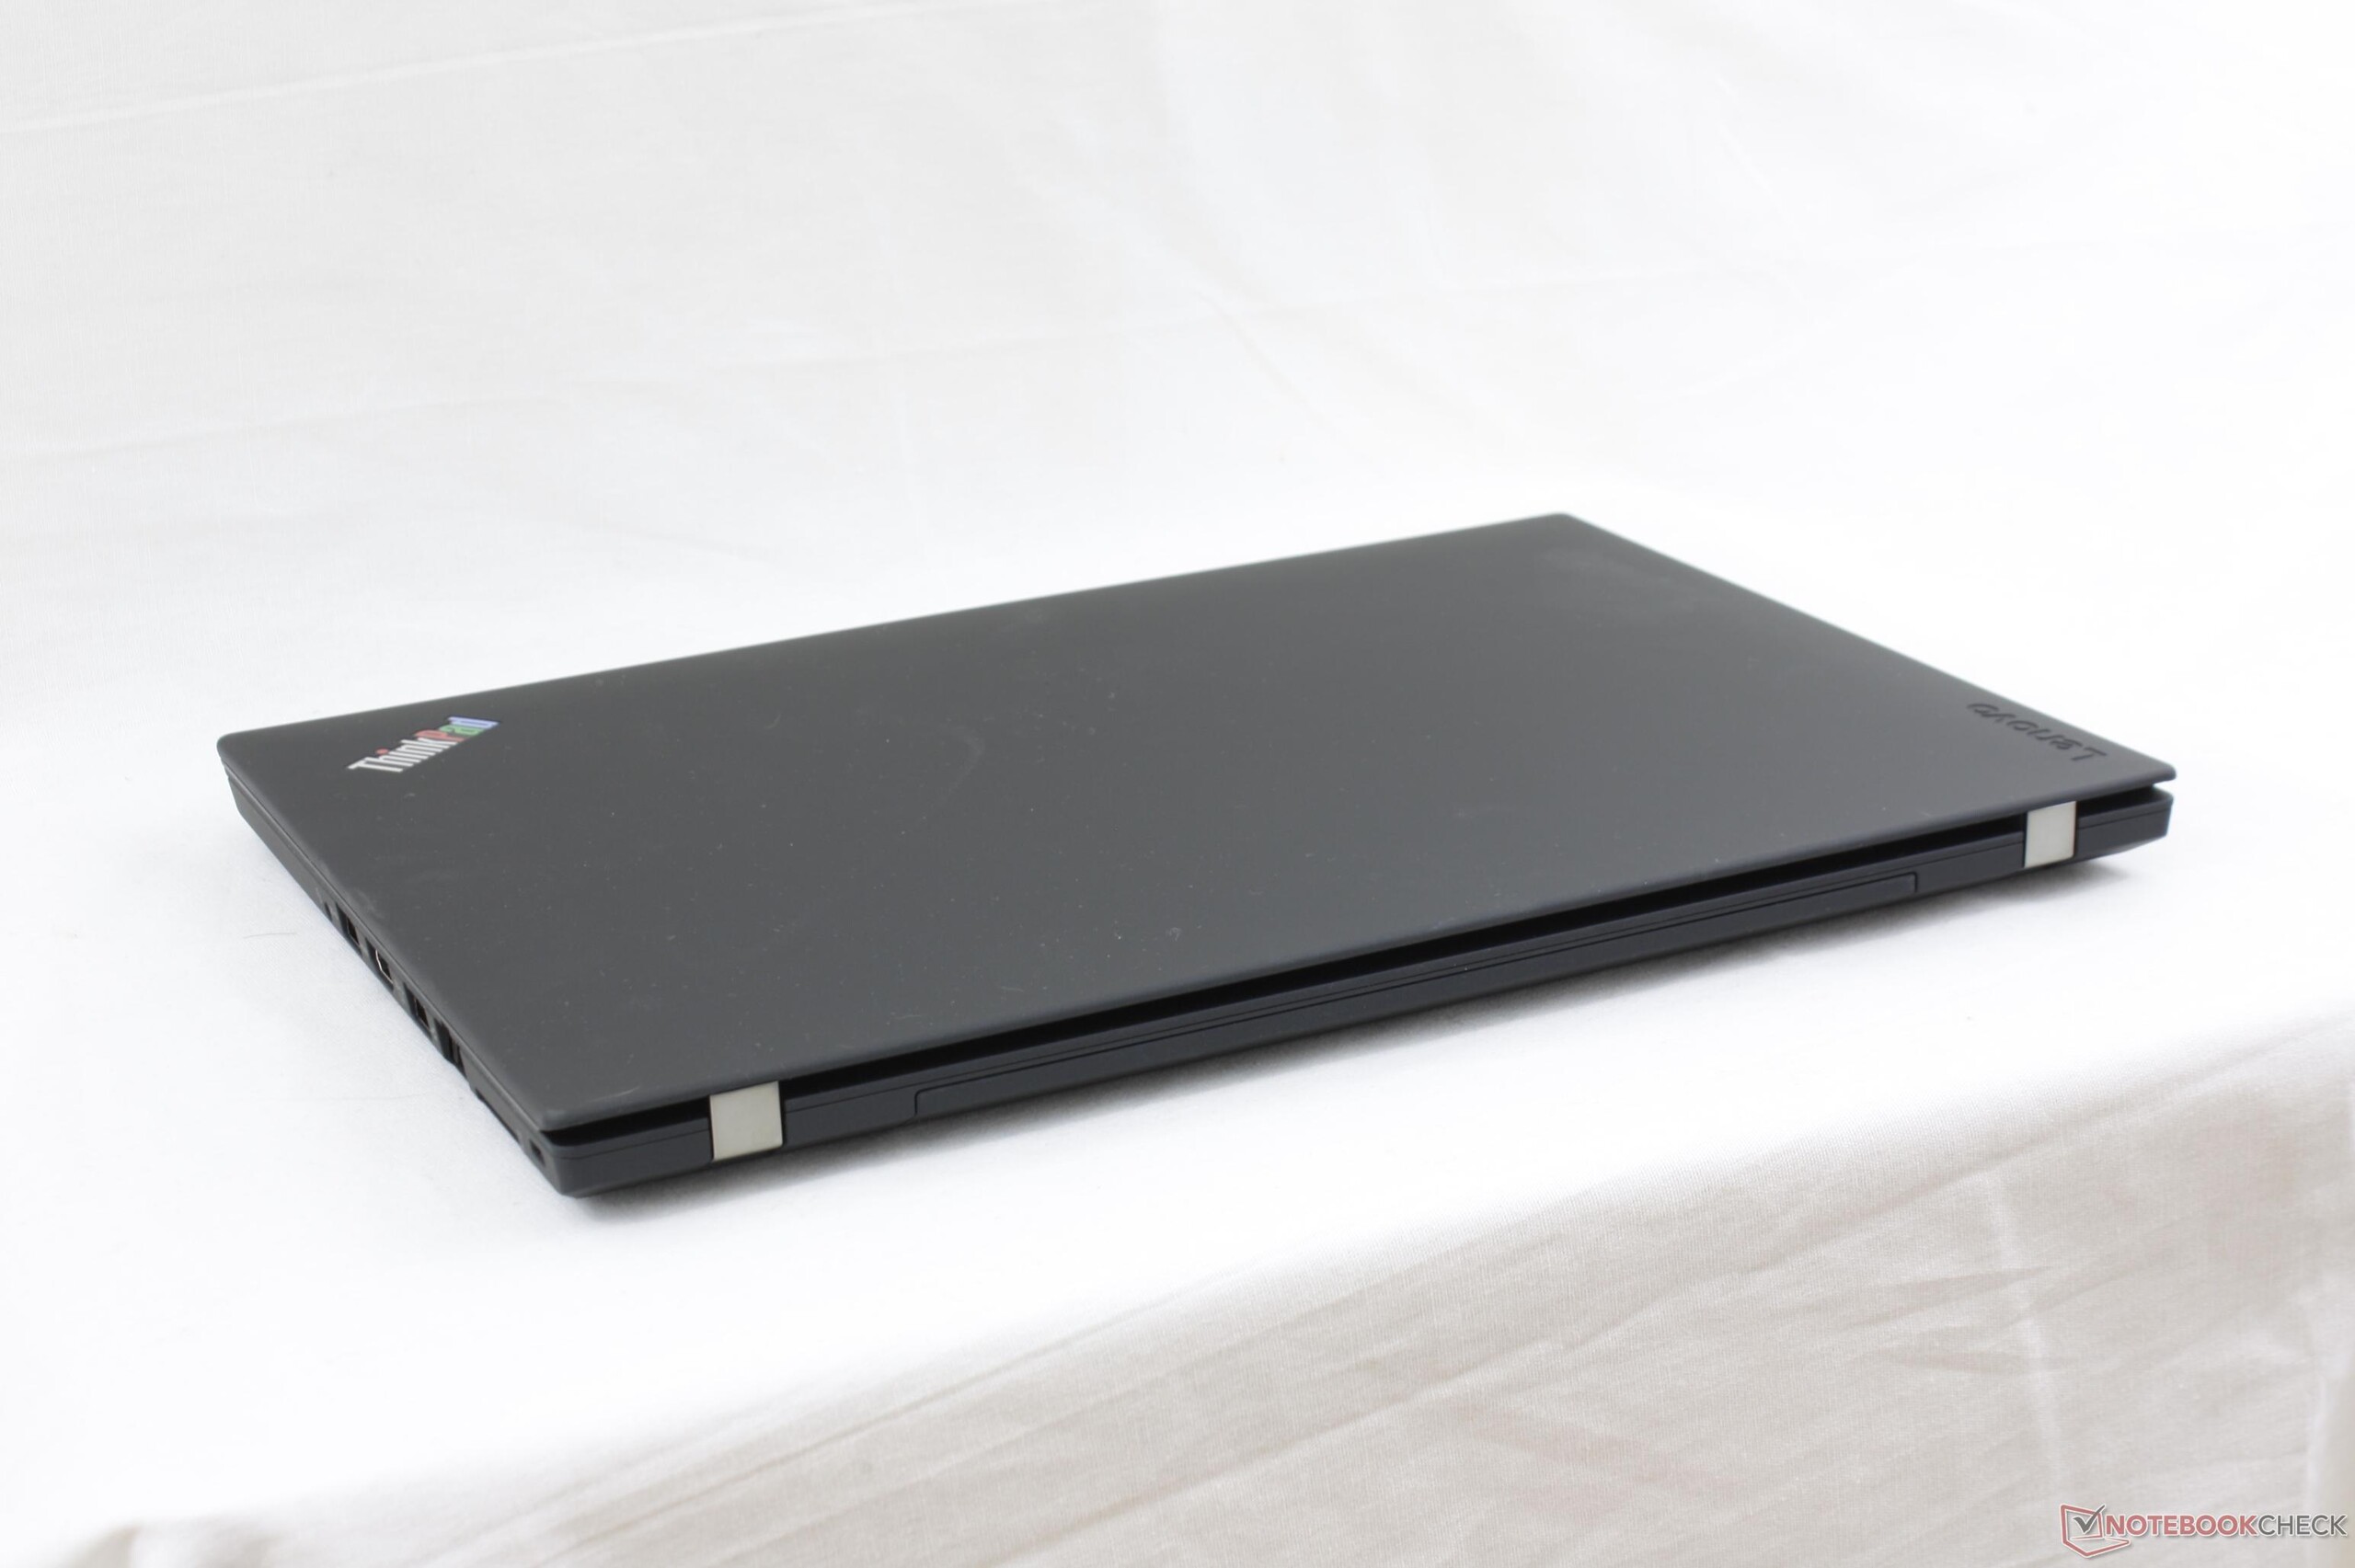
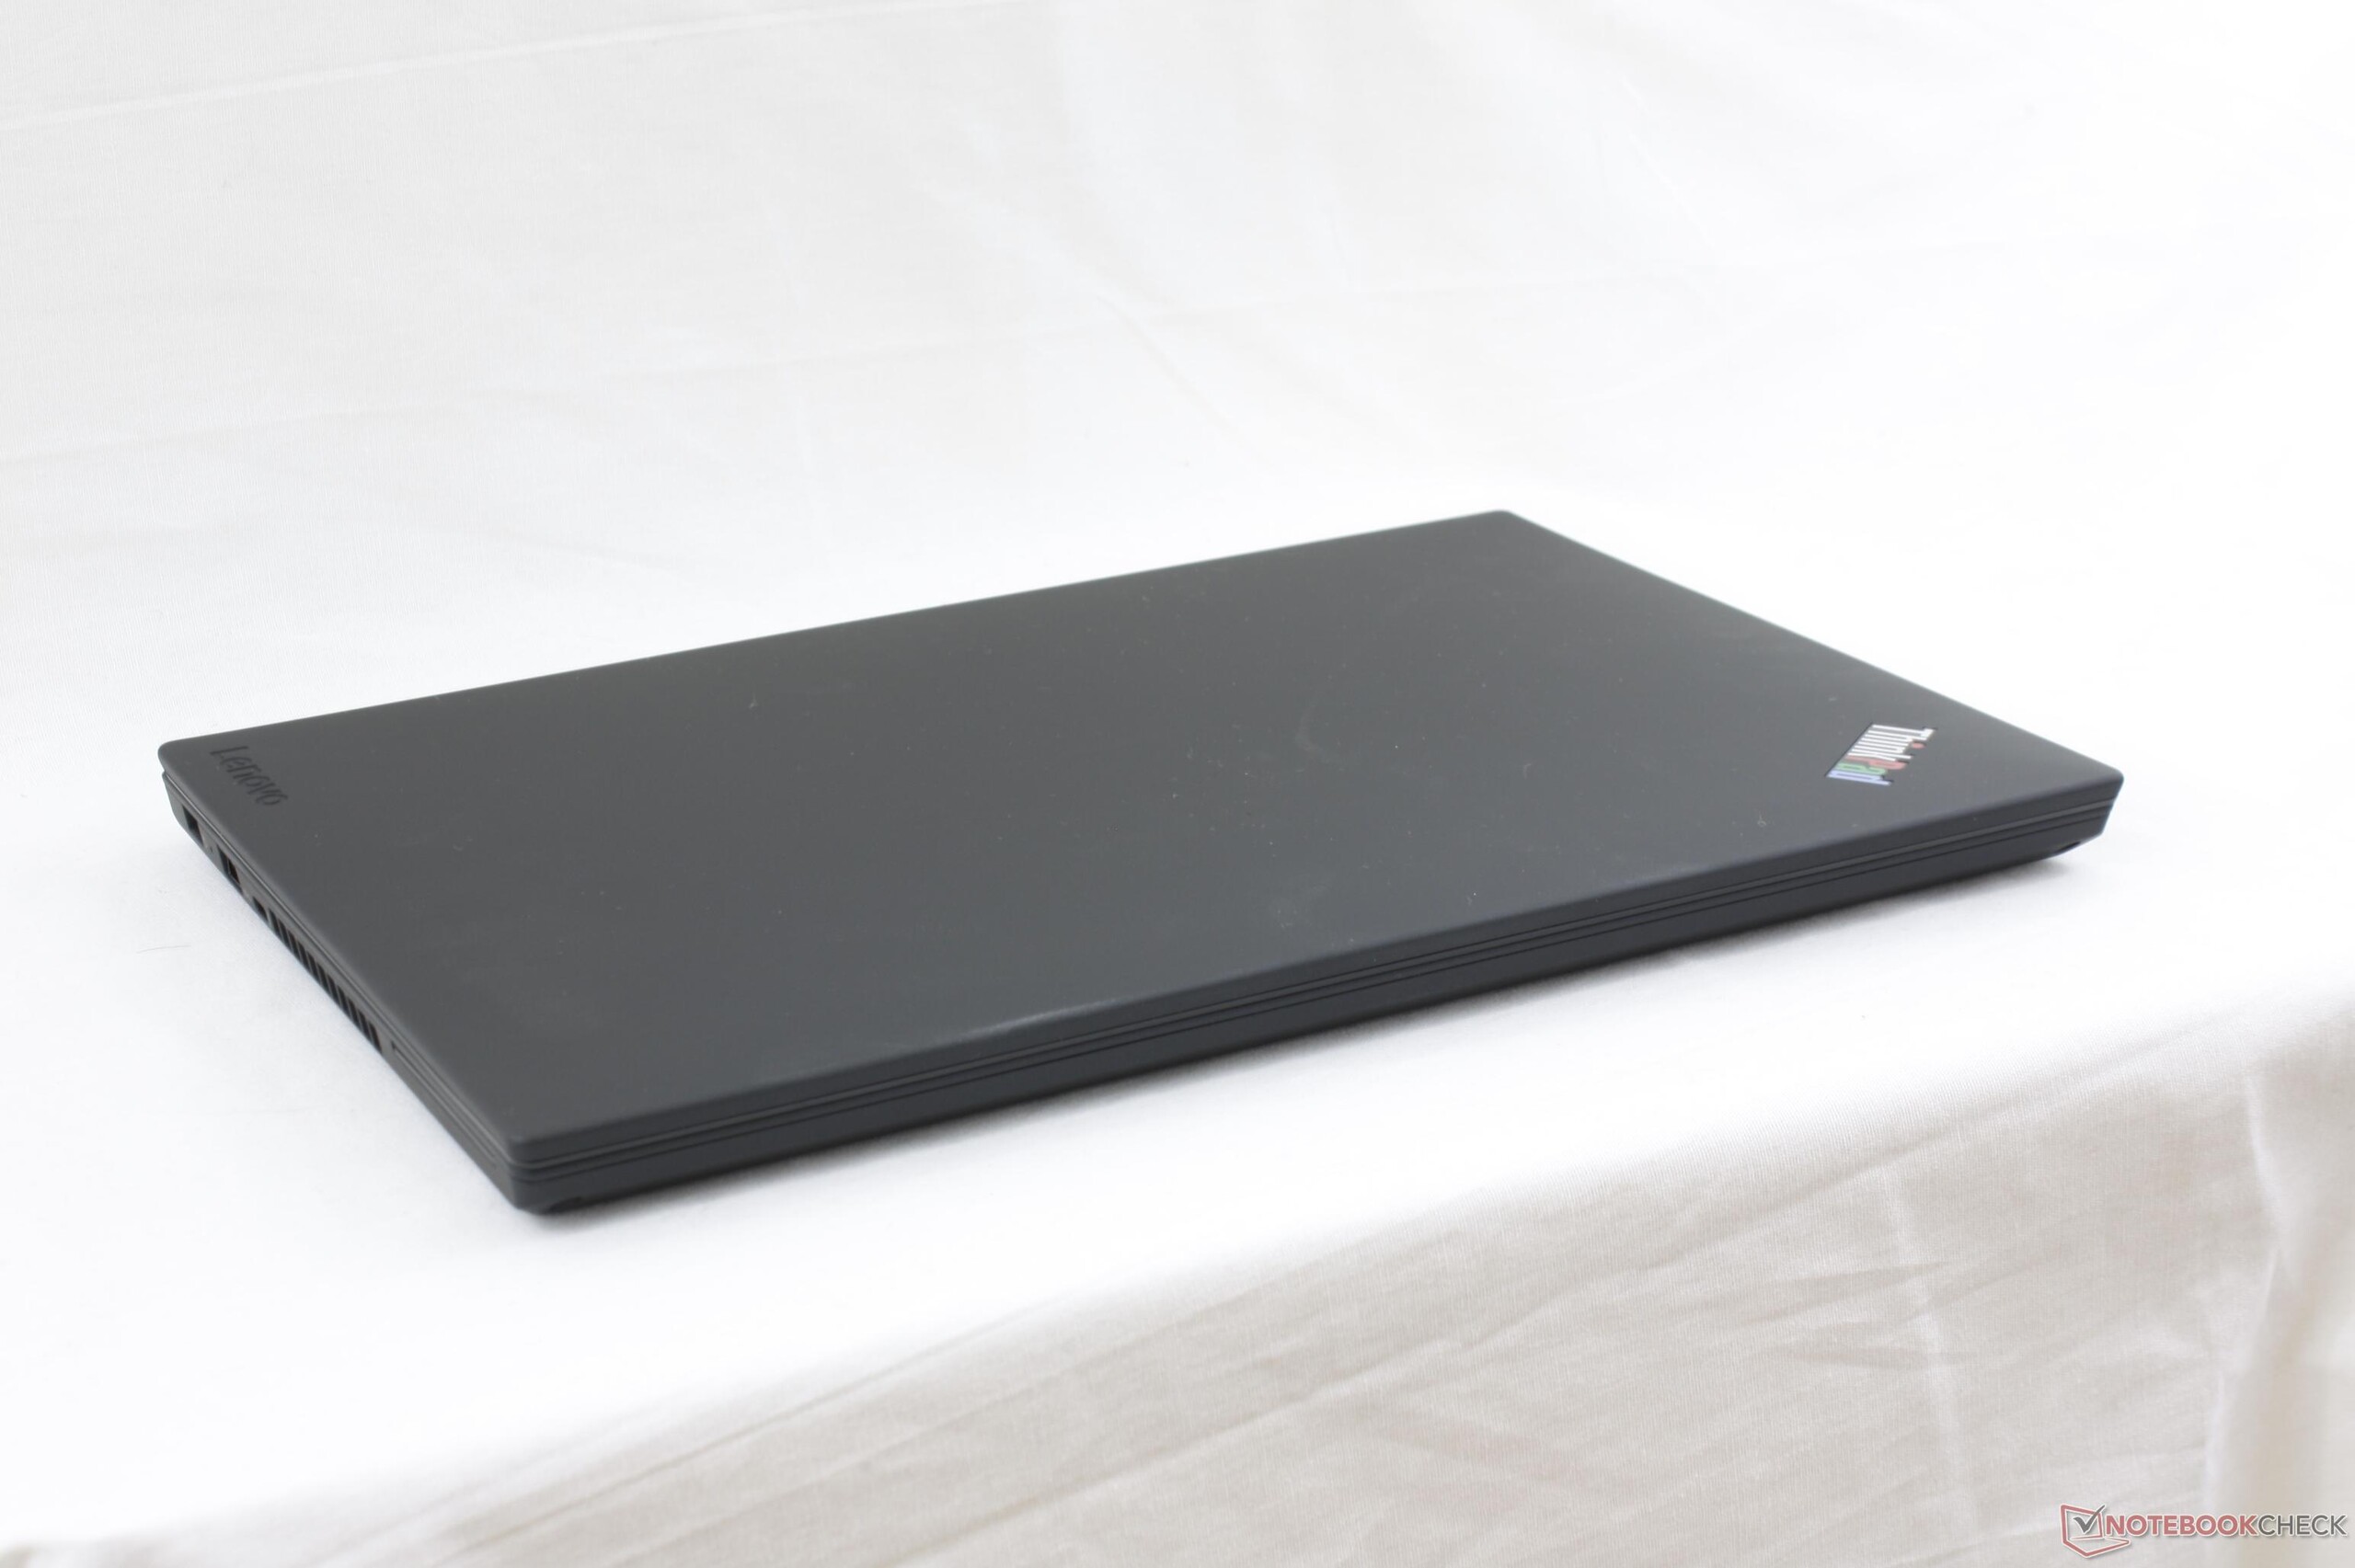
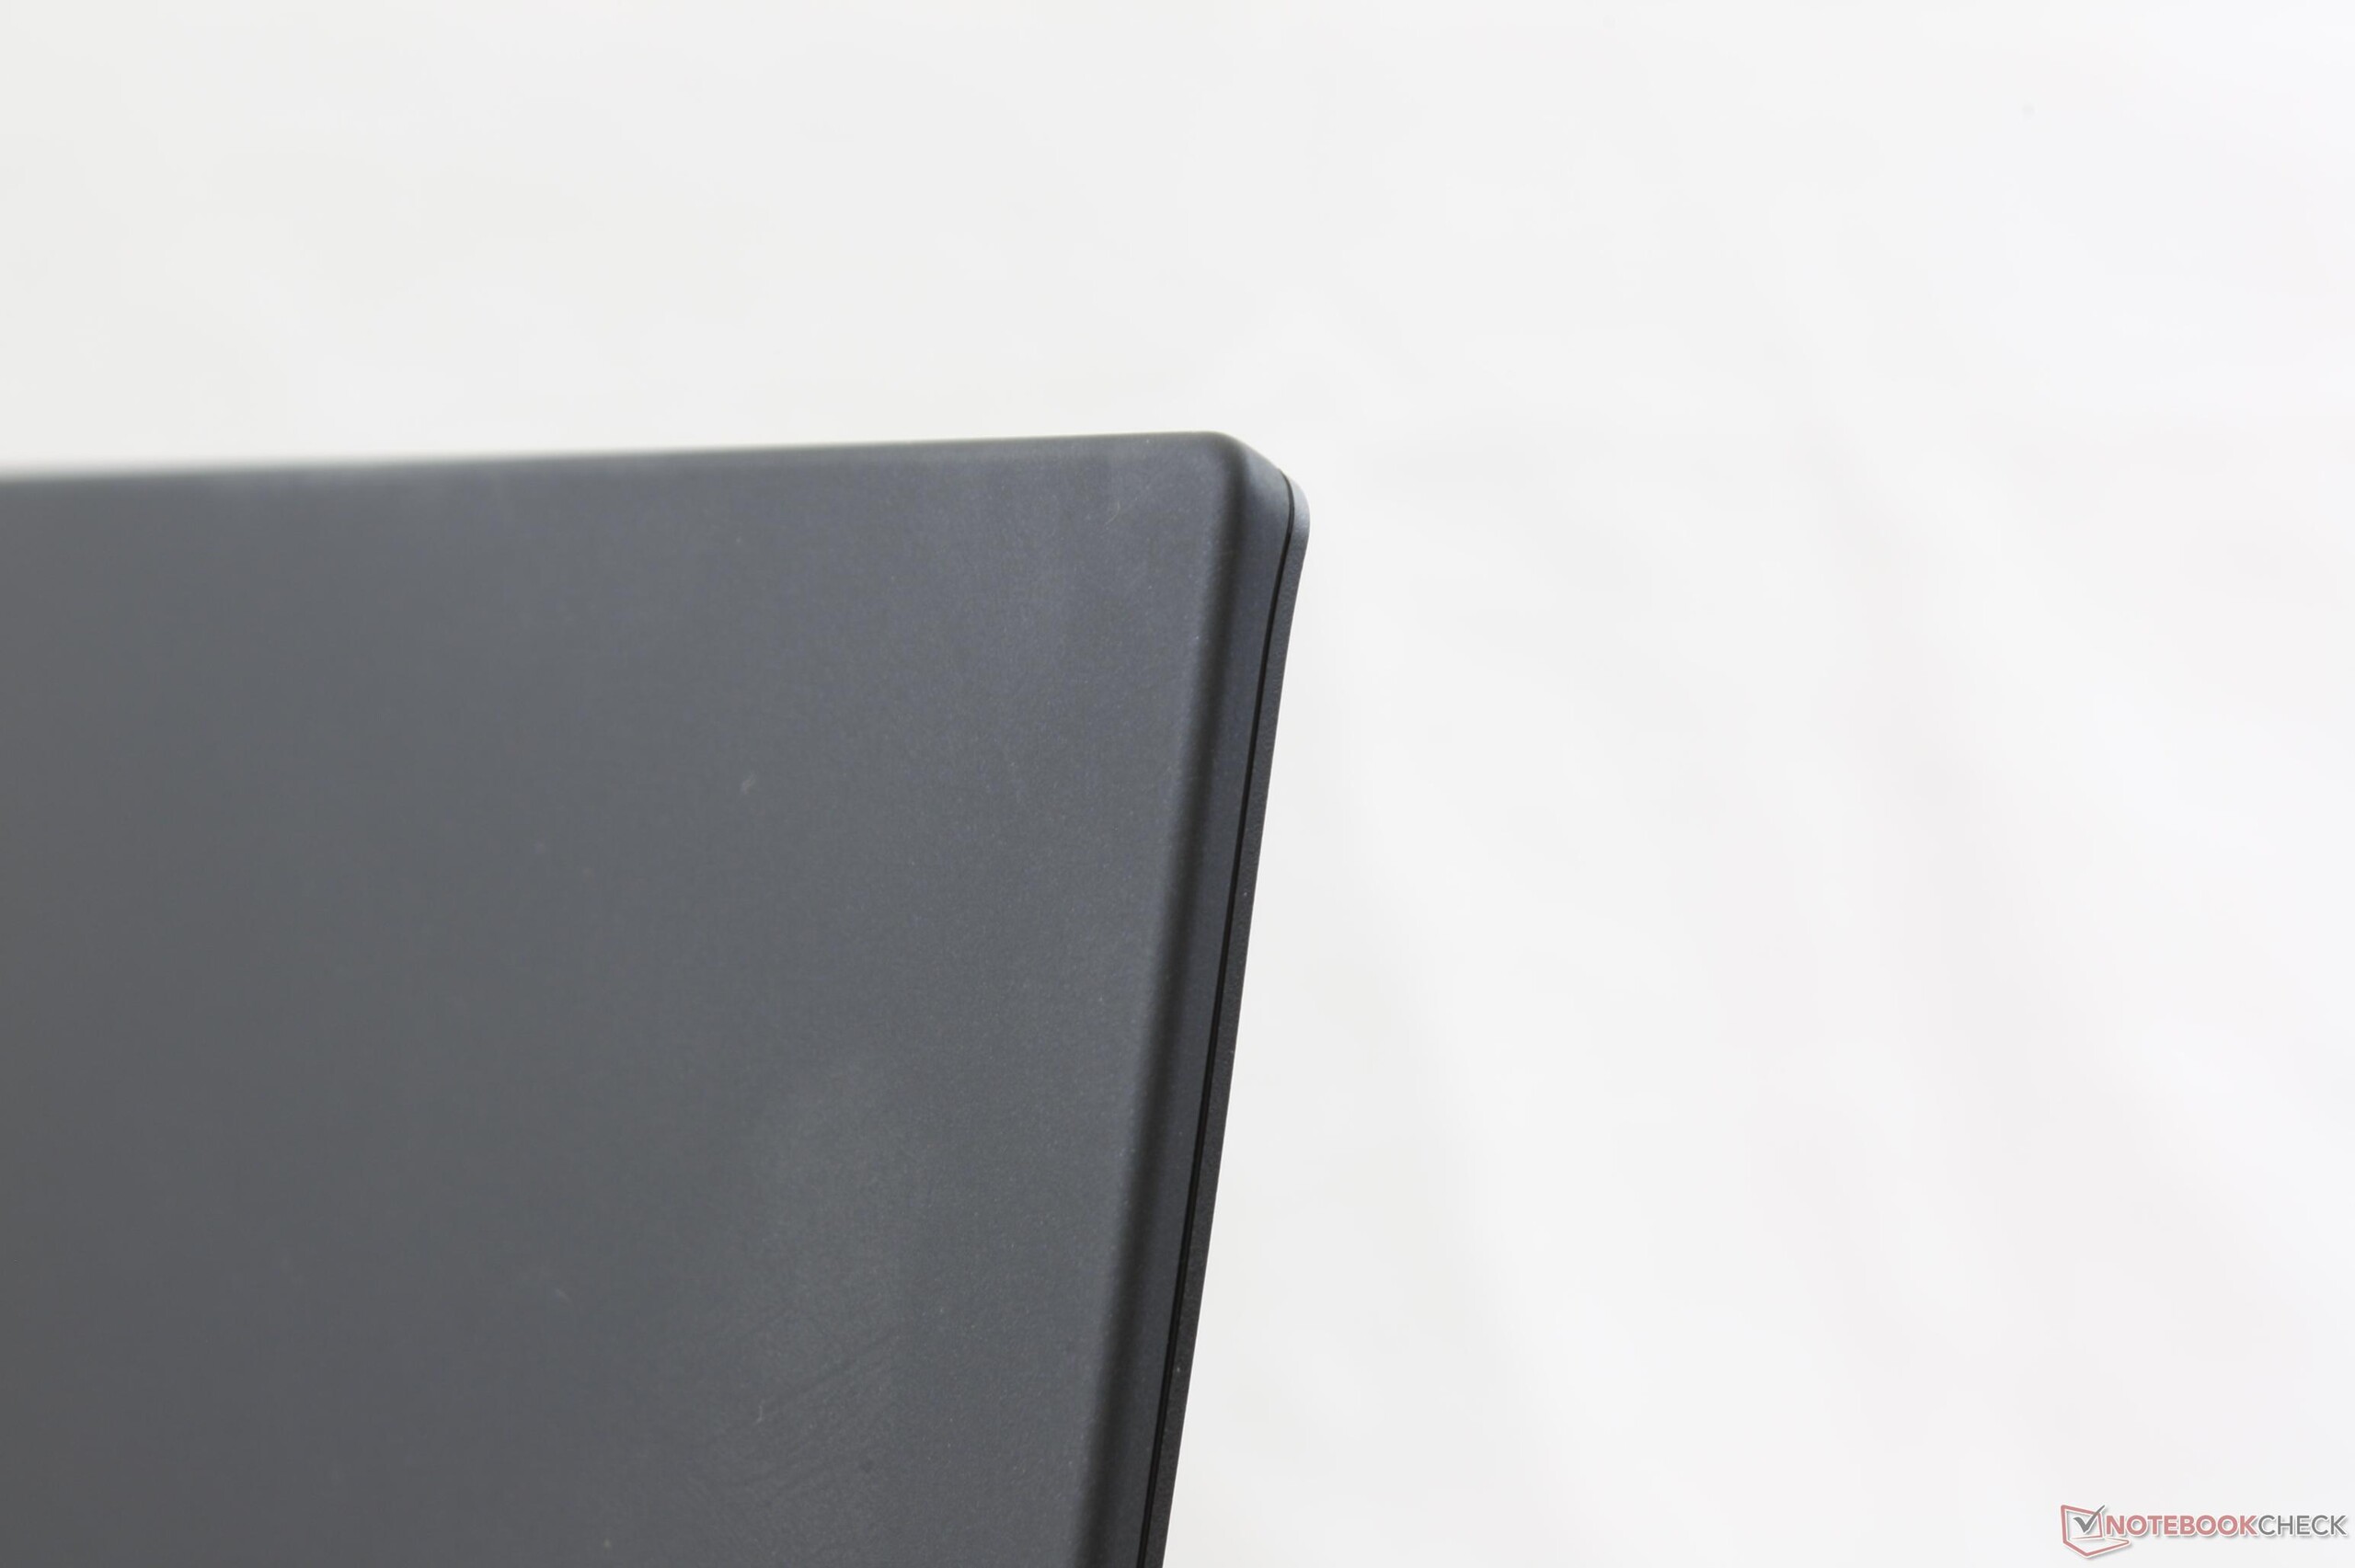
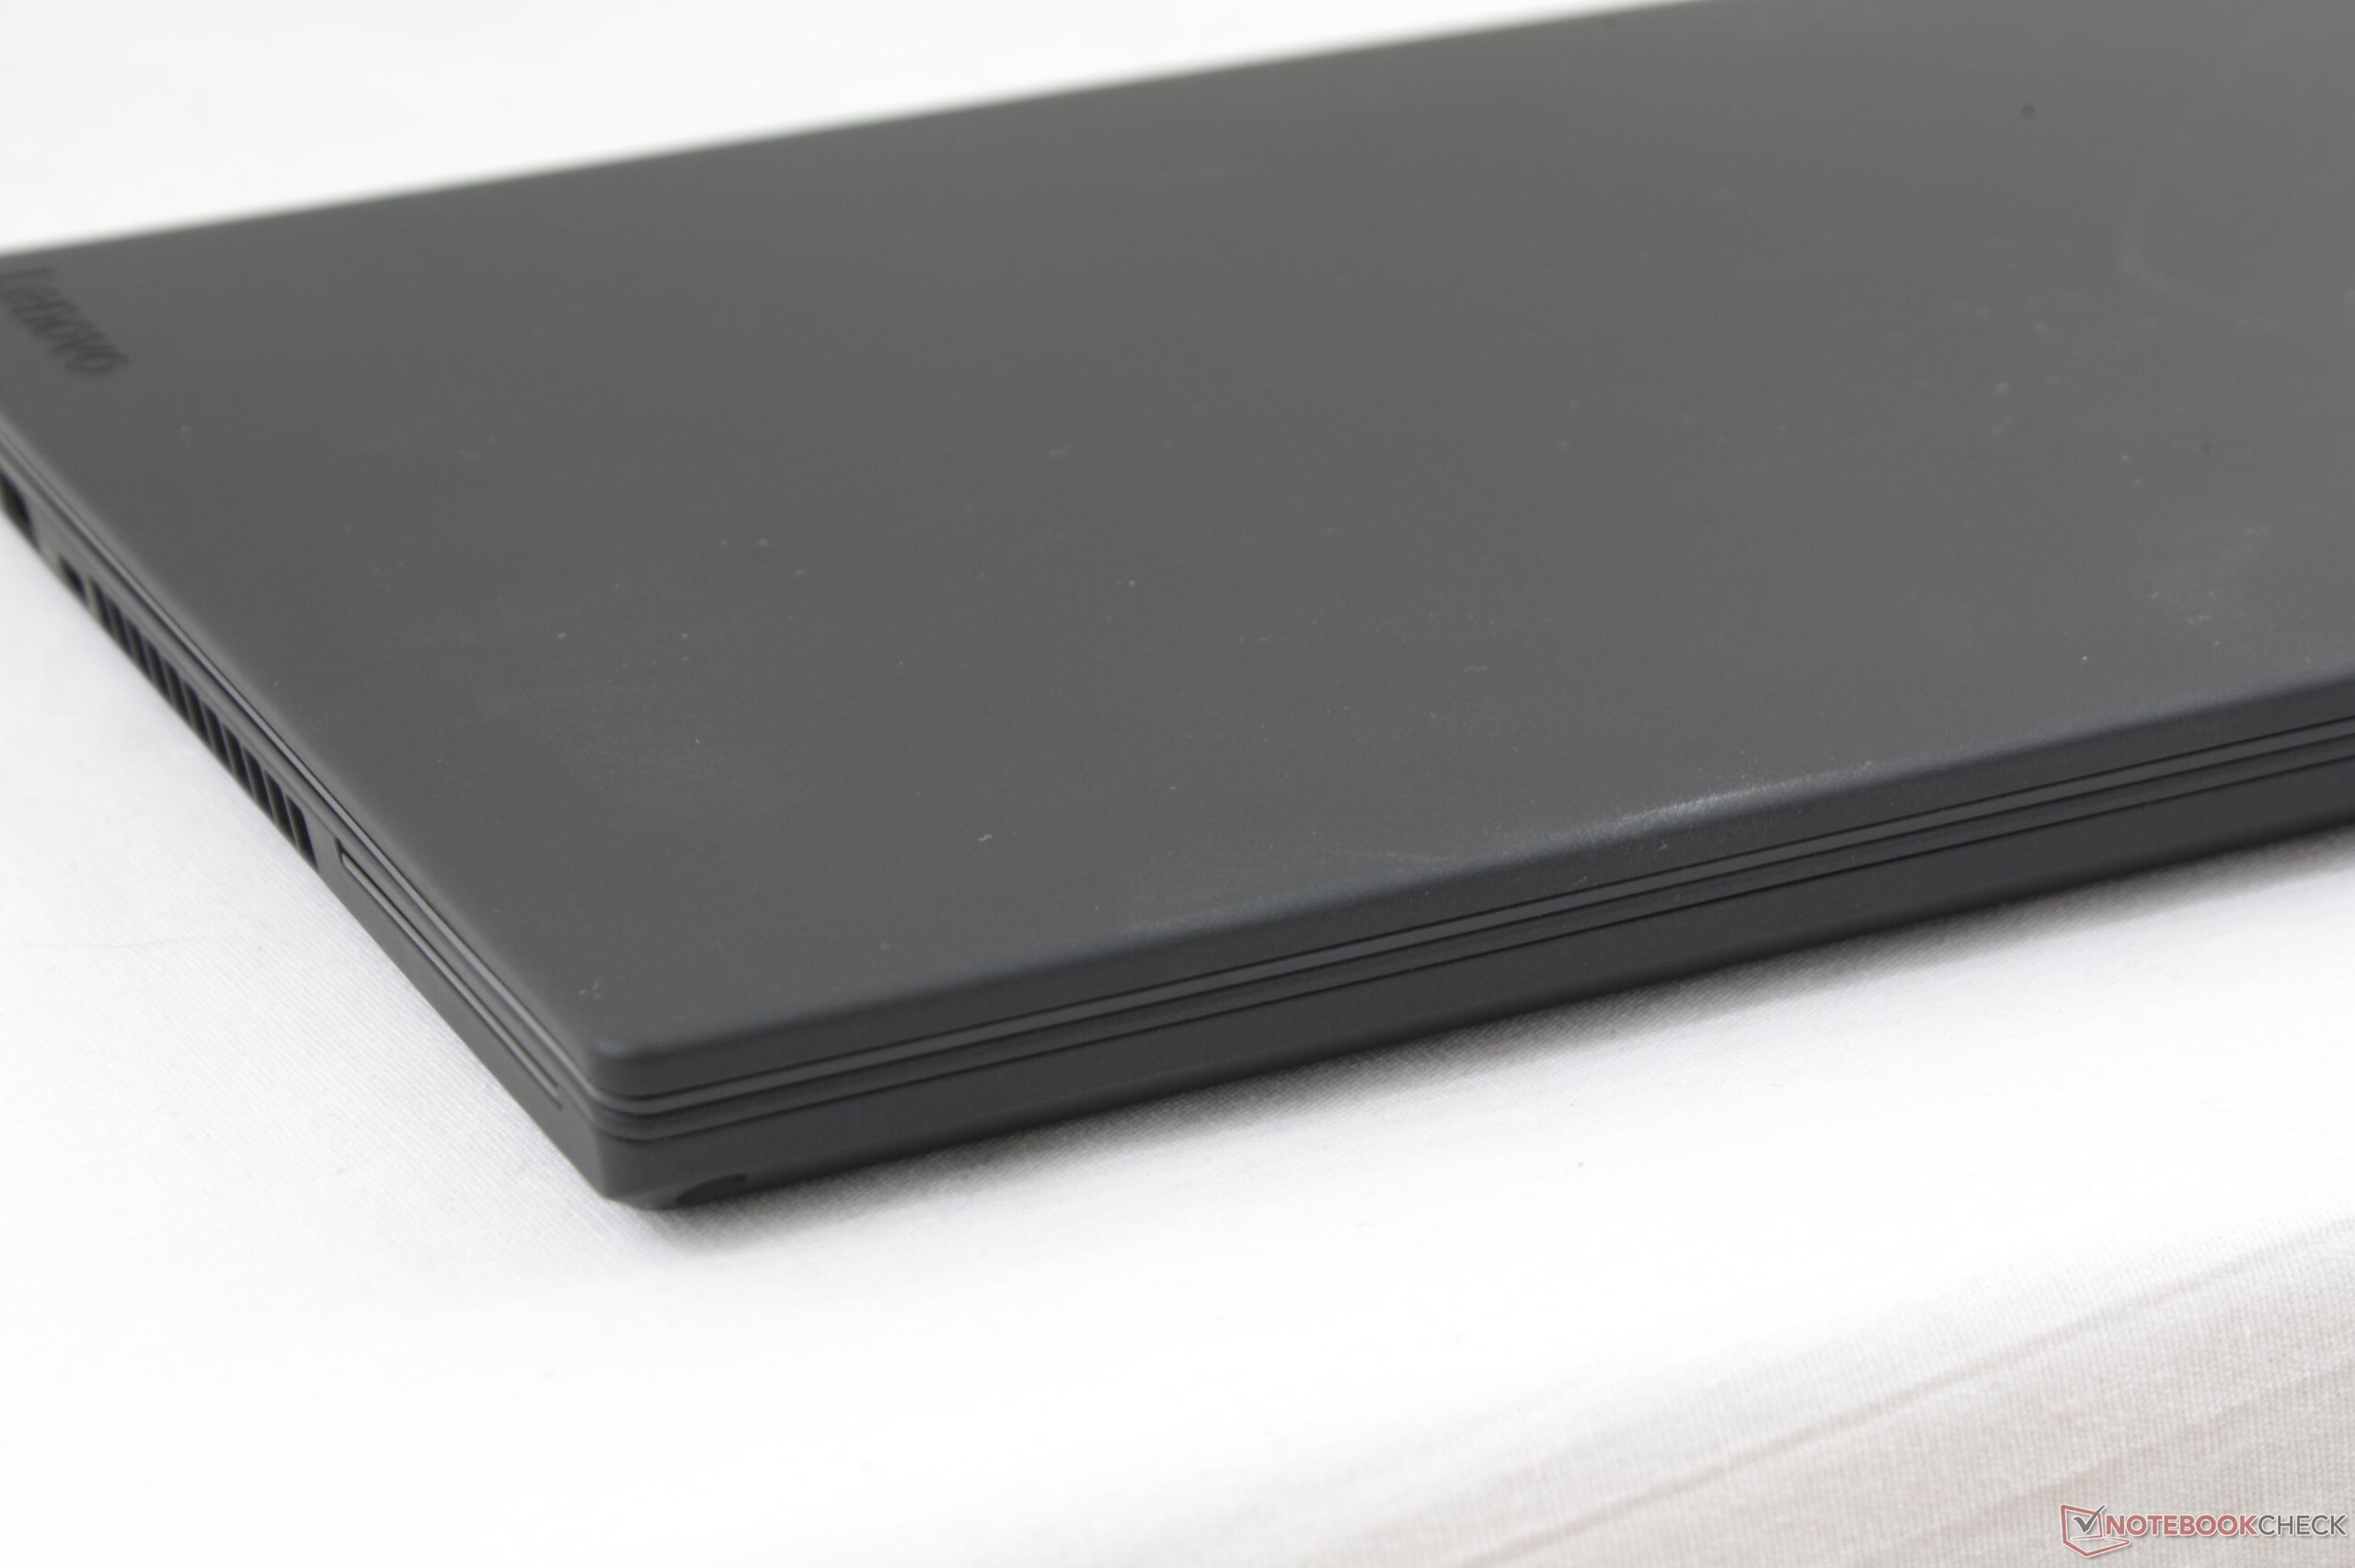
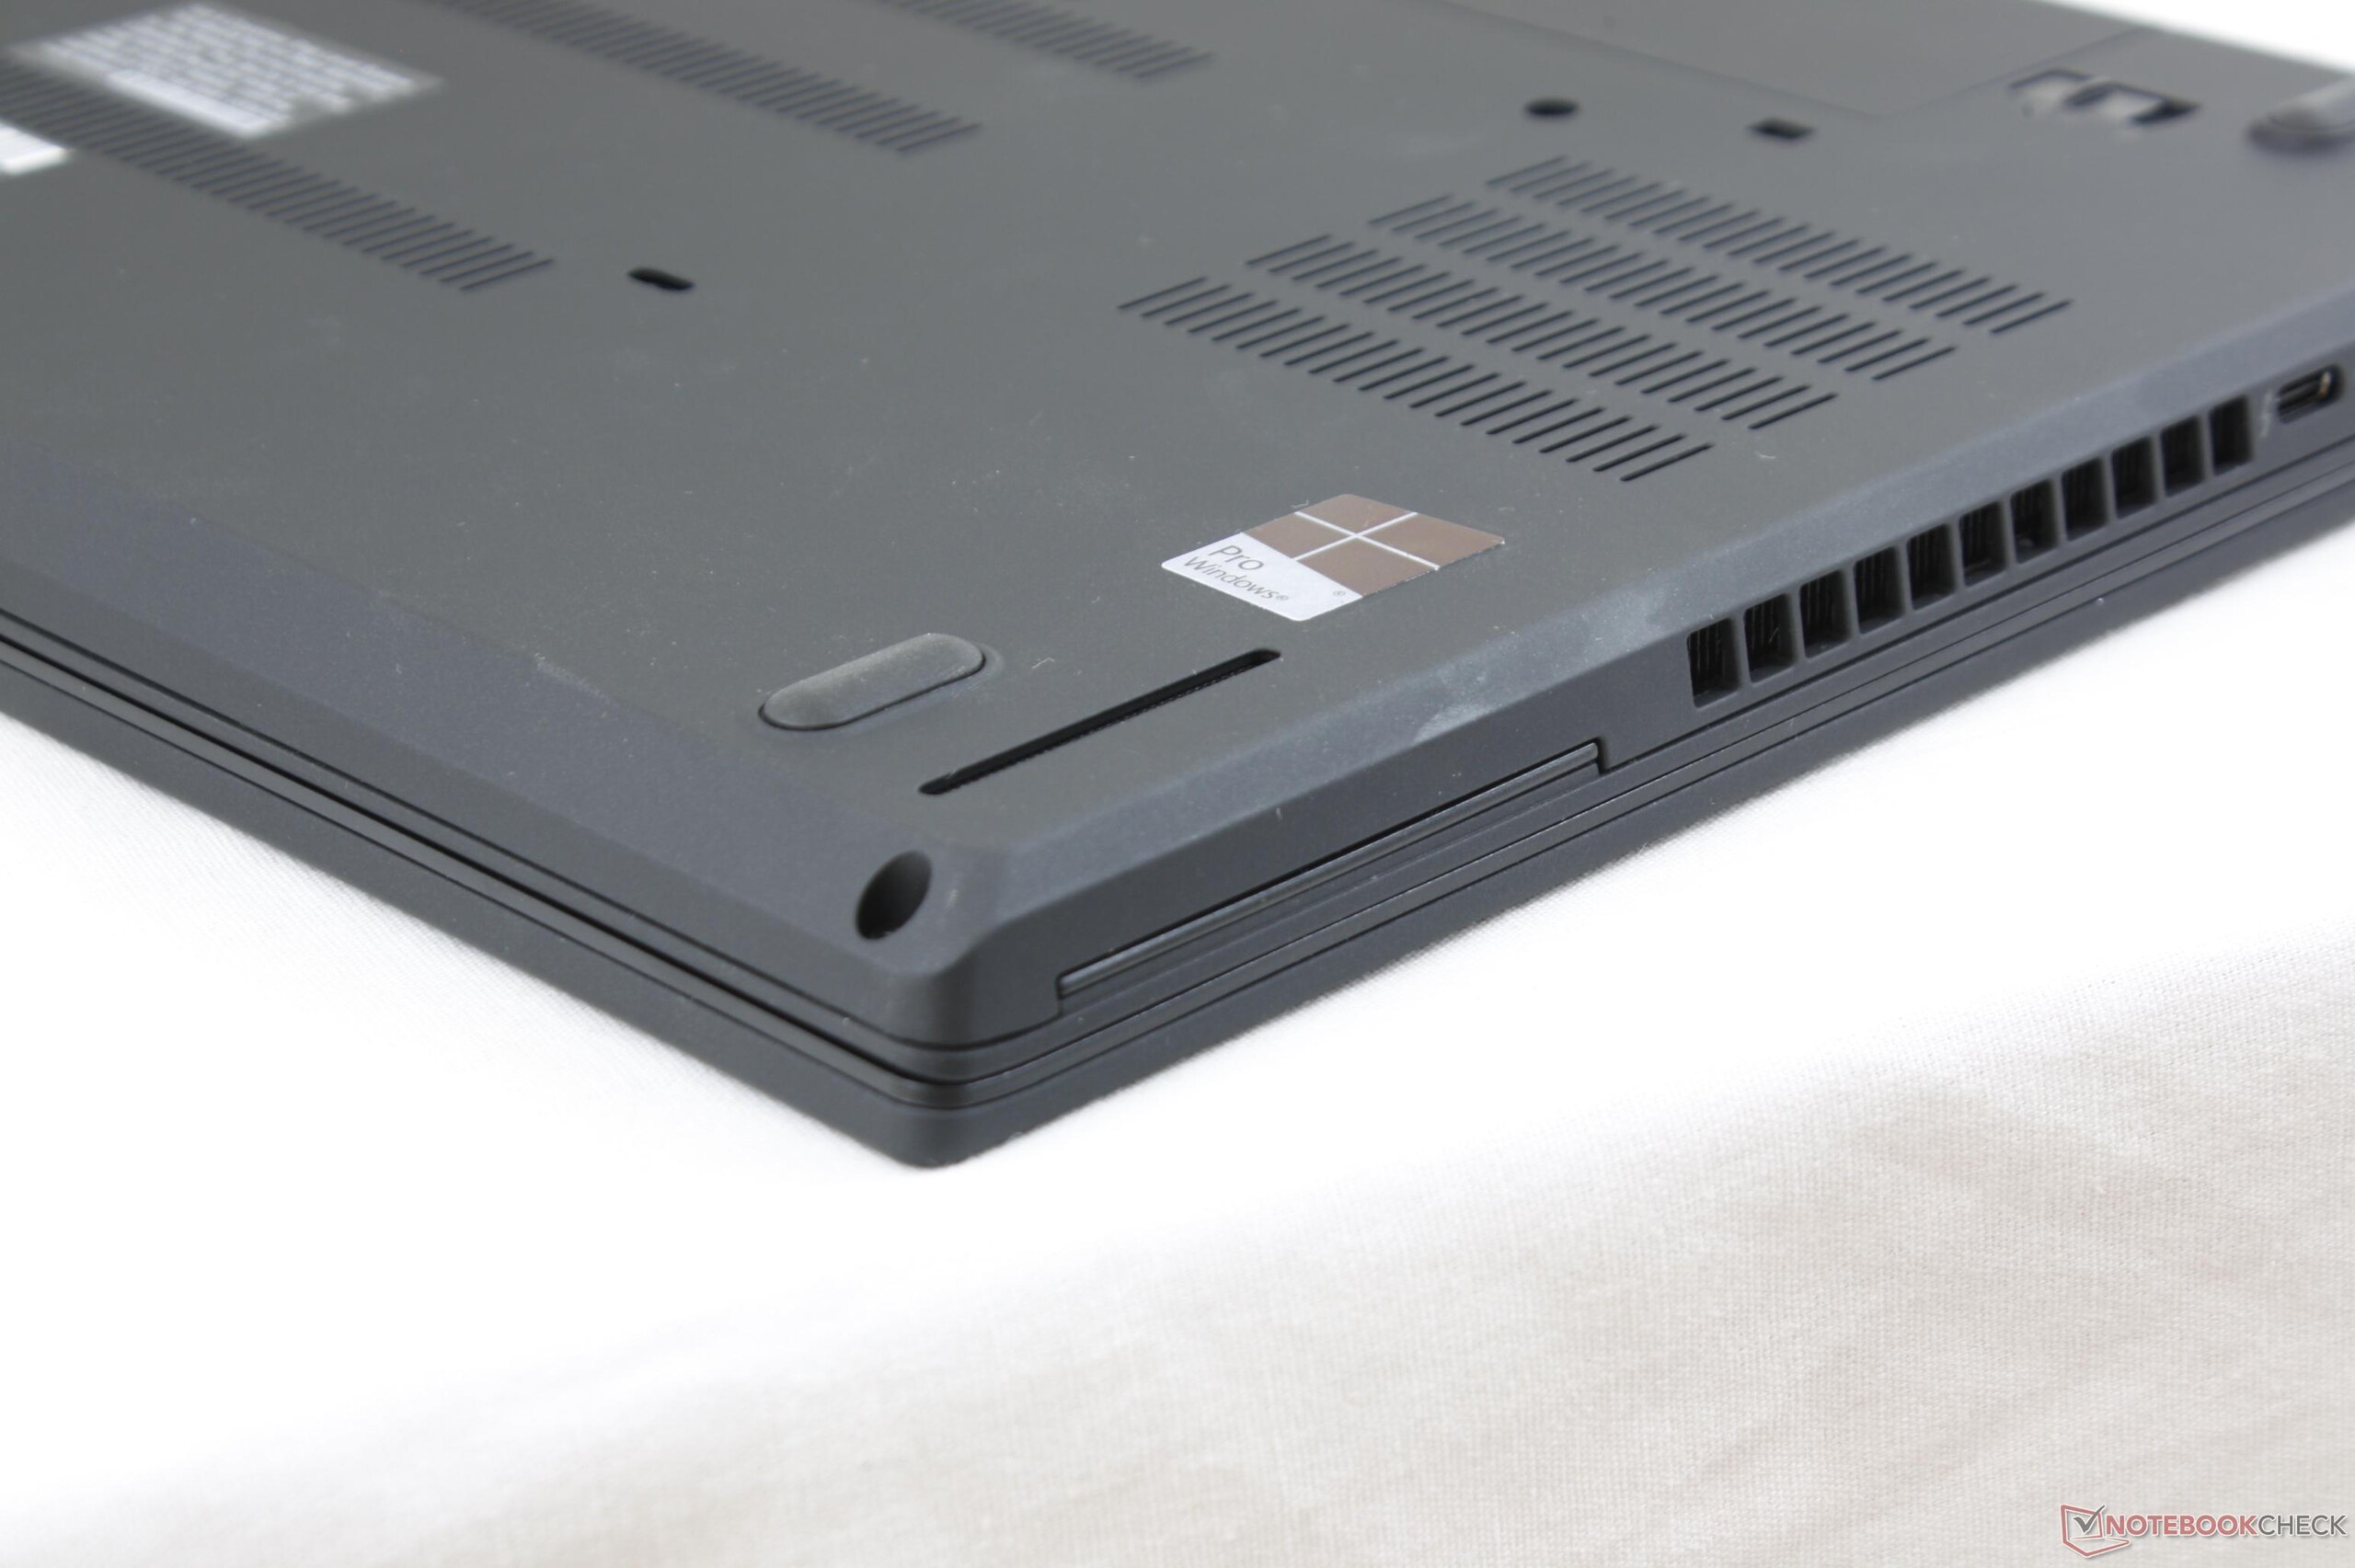
ThinkPad veterans hoping for a new chassis design inspired by the weighty roll-cage skeleton of old IBM ThinkPads will likely be disappointed with the ThinkPad 25. As mentioned above, the ThinkPad 25 exhibits the same pros and cons as the T470 in regards to rigidity and quality. Users can consequently expect a dense and very stable impression even if the build is not quite as firm as aluminum unibody notebooks. The glass fiber-reinforced and MIL-STD 810G-certified plastic case certainly feels classier now that its surfaces have a slight rubberized texture, but fingerprints and grease will accumulate more quickly as a result.
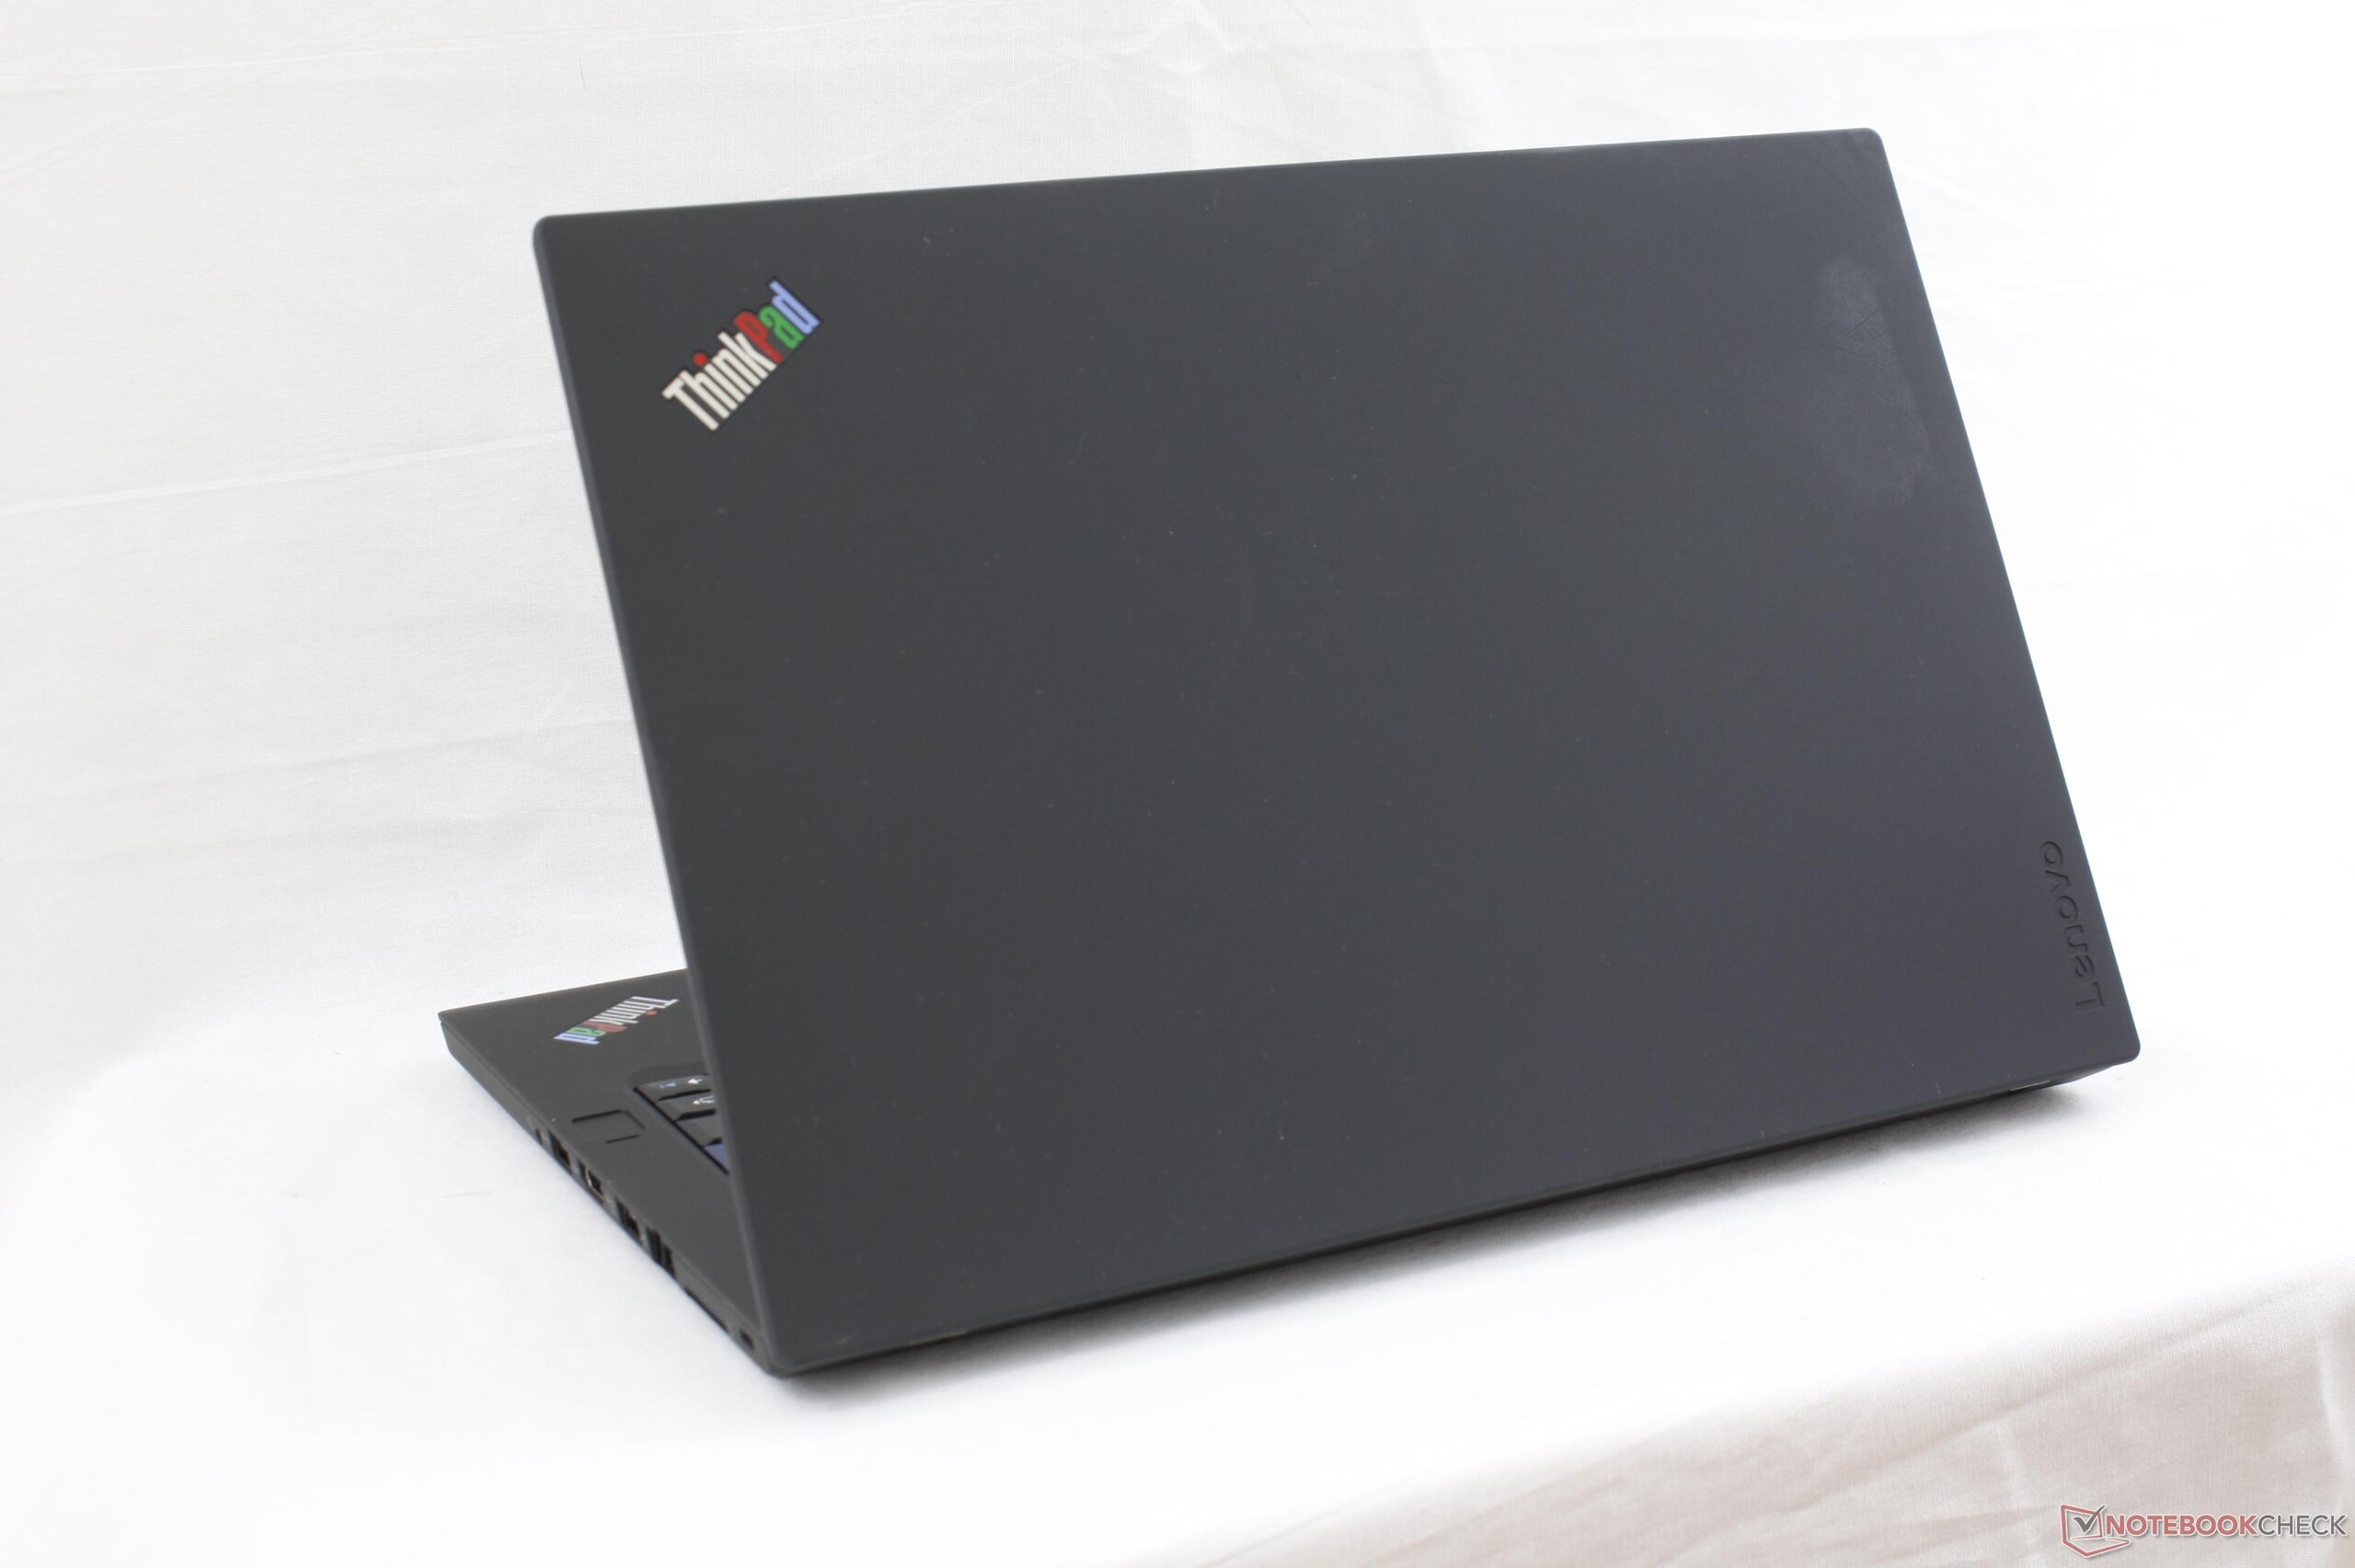
While base stability is still respectable, the lid could use improvement in future ThinkPad redesigns as it is more flexible when compared to the lids of the XPS or Spectre x360 series. Creaking is otherwise kept to a minimum when attempting to twist the unit and the small hinges are sufficiently firm up to the 180-degree maximum.
The dimensions are unsurprisingly the same as on the T470. The competing Samsung Notebook 9 is smaller and significantly lighter while offering a larger 15-inch display with similar internal specifications, but it is nowhere near as rigid as the ThinkPad 25. The T470s is still a relevant alternative to the ThinkPad 25 since it is the lighter and thinner version of the standard T470.
Connectivity
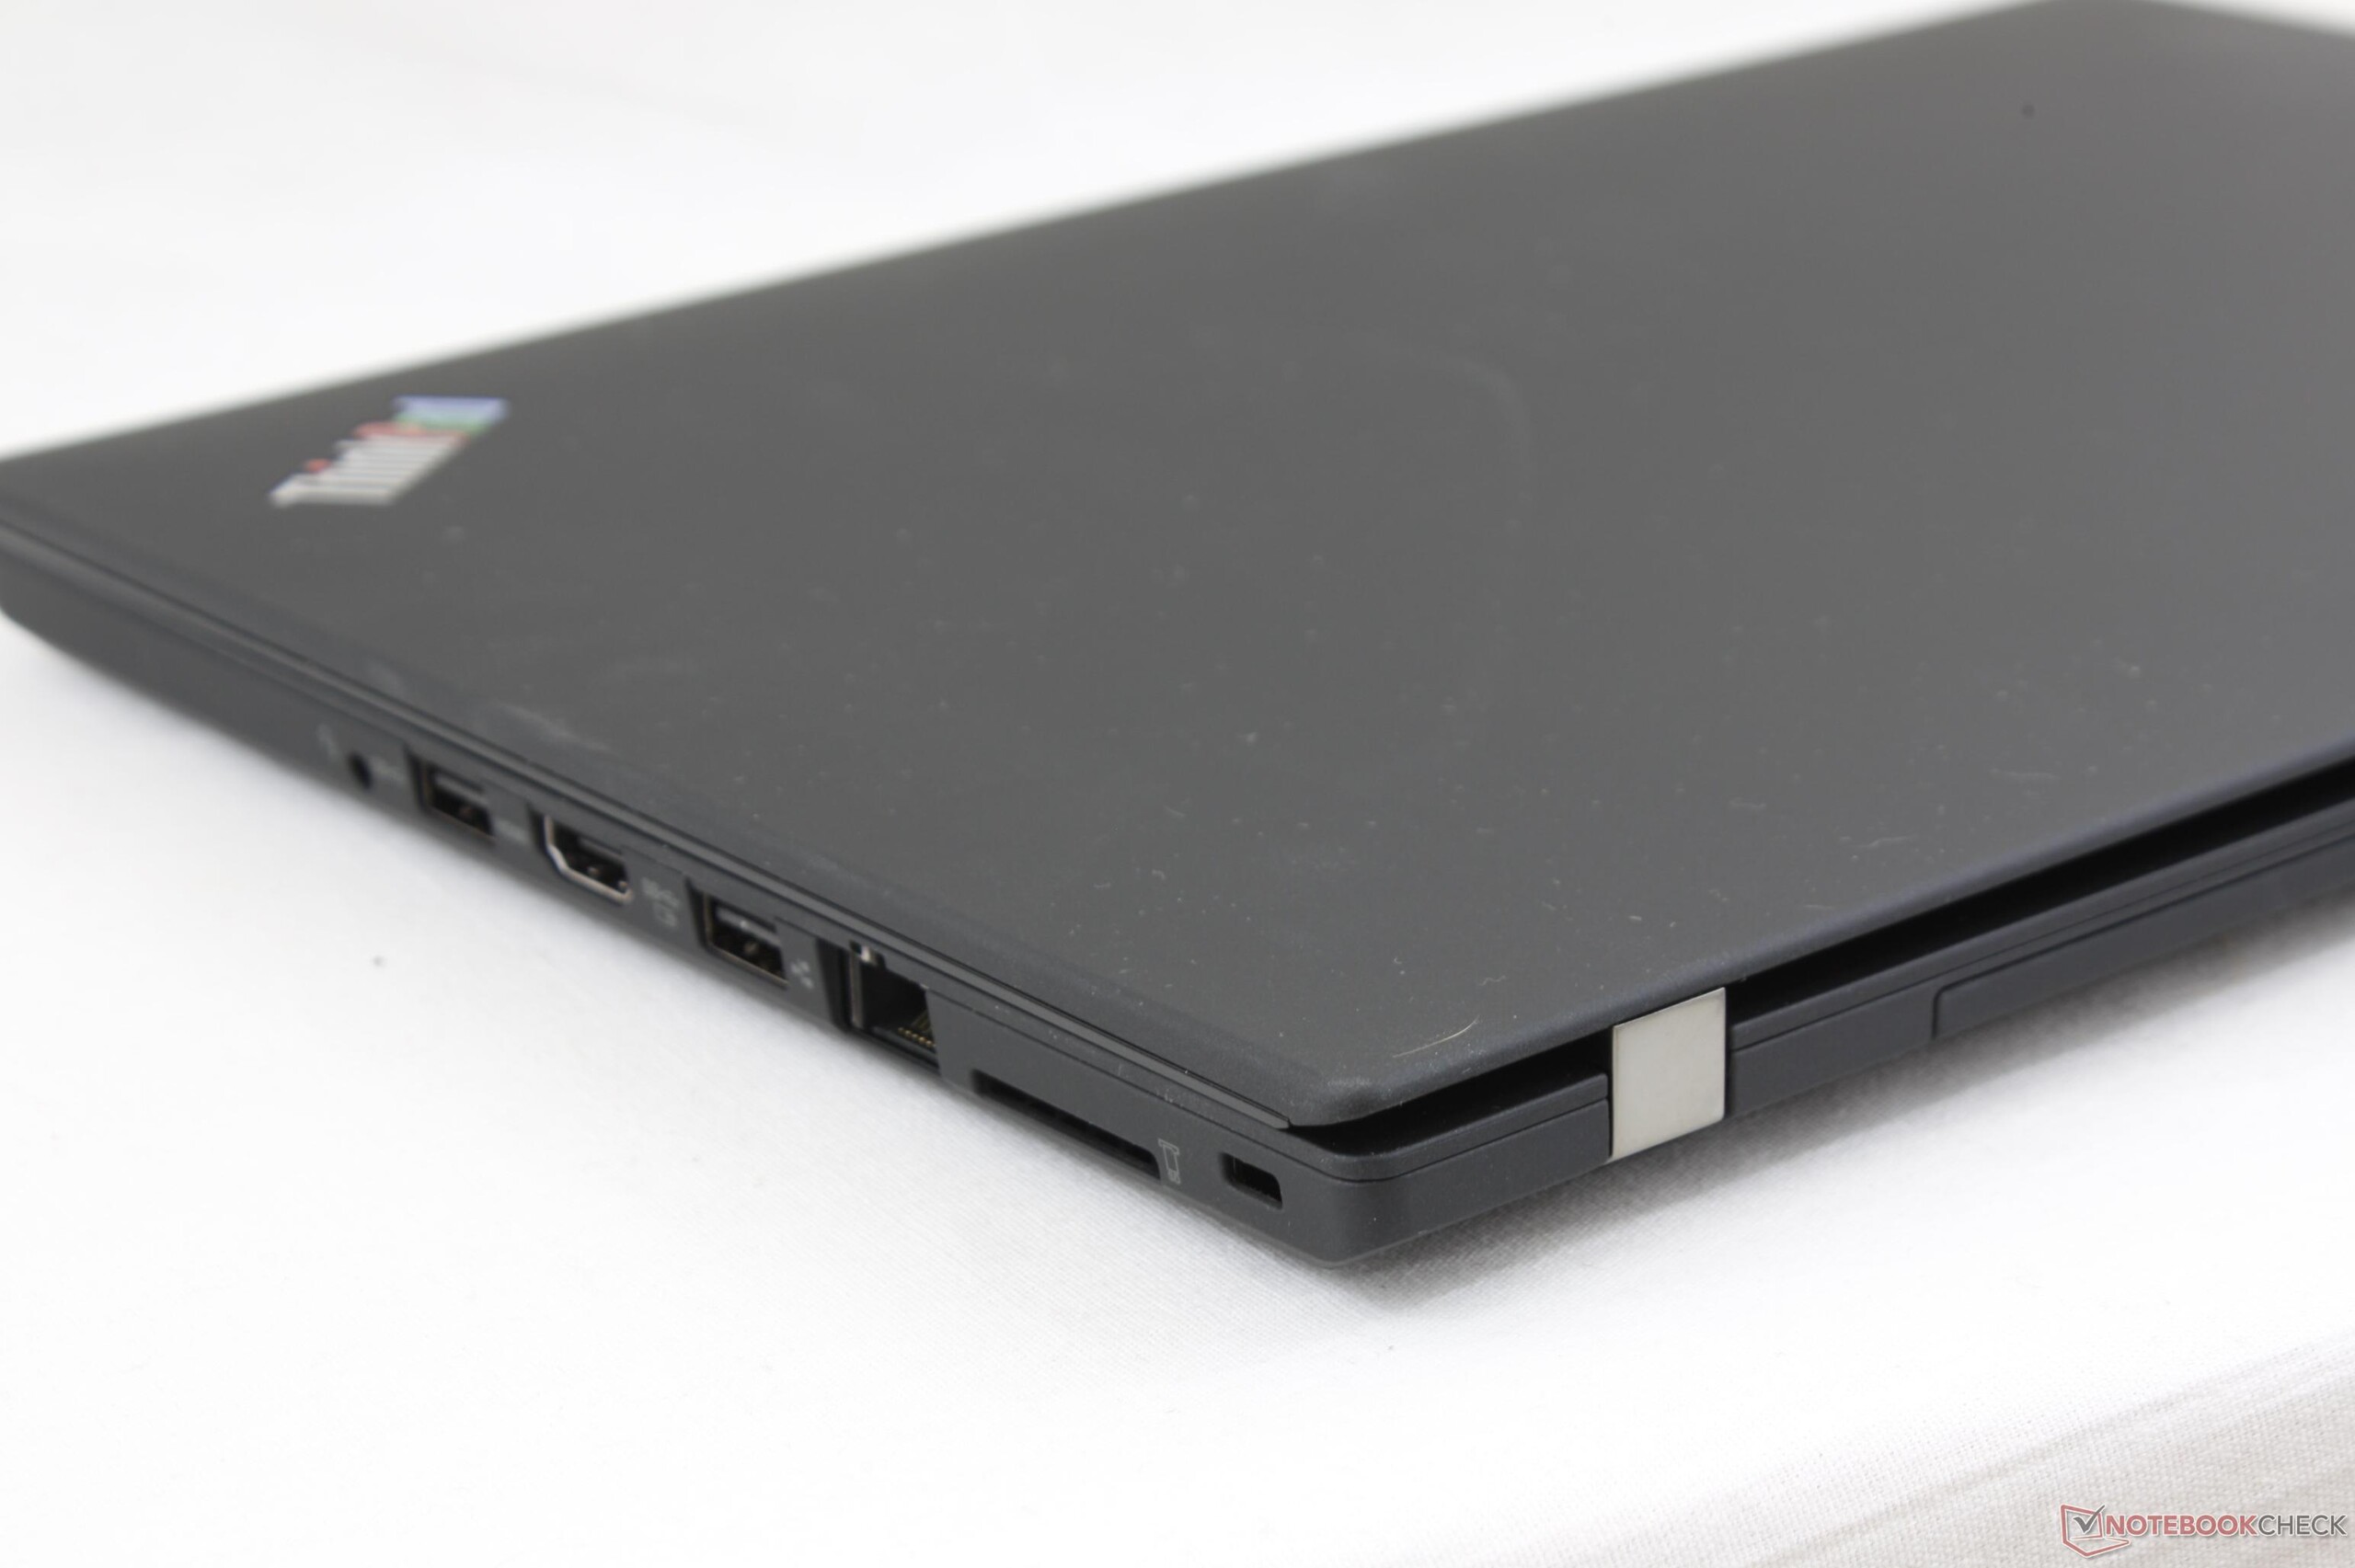
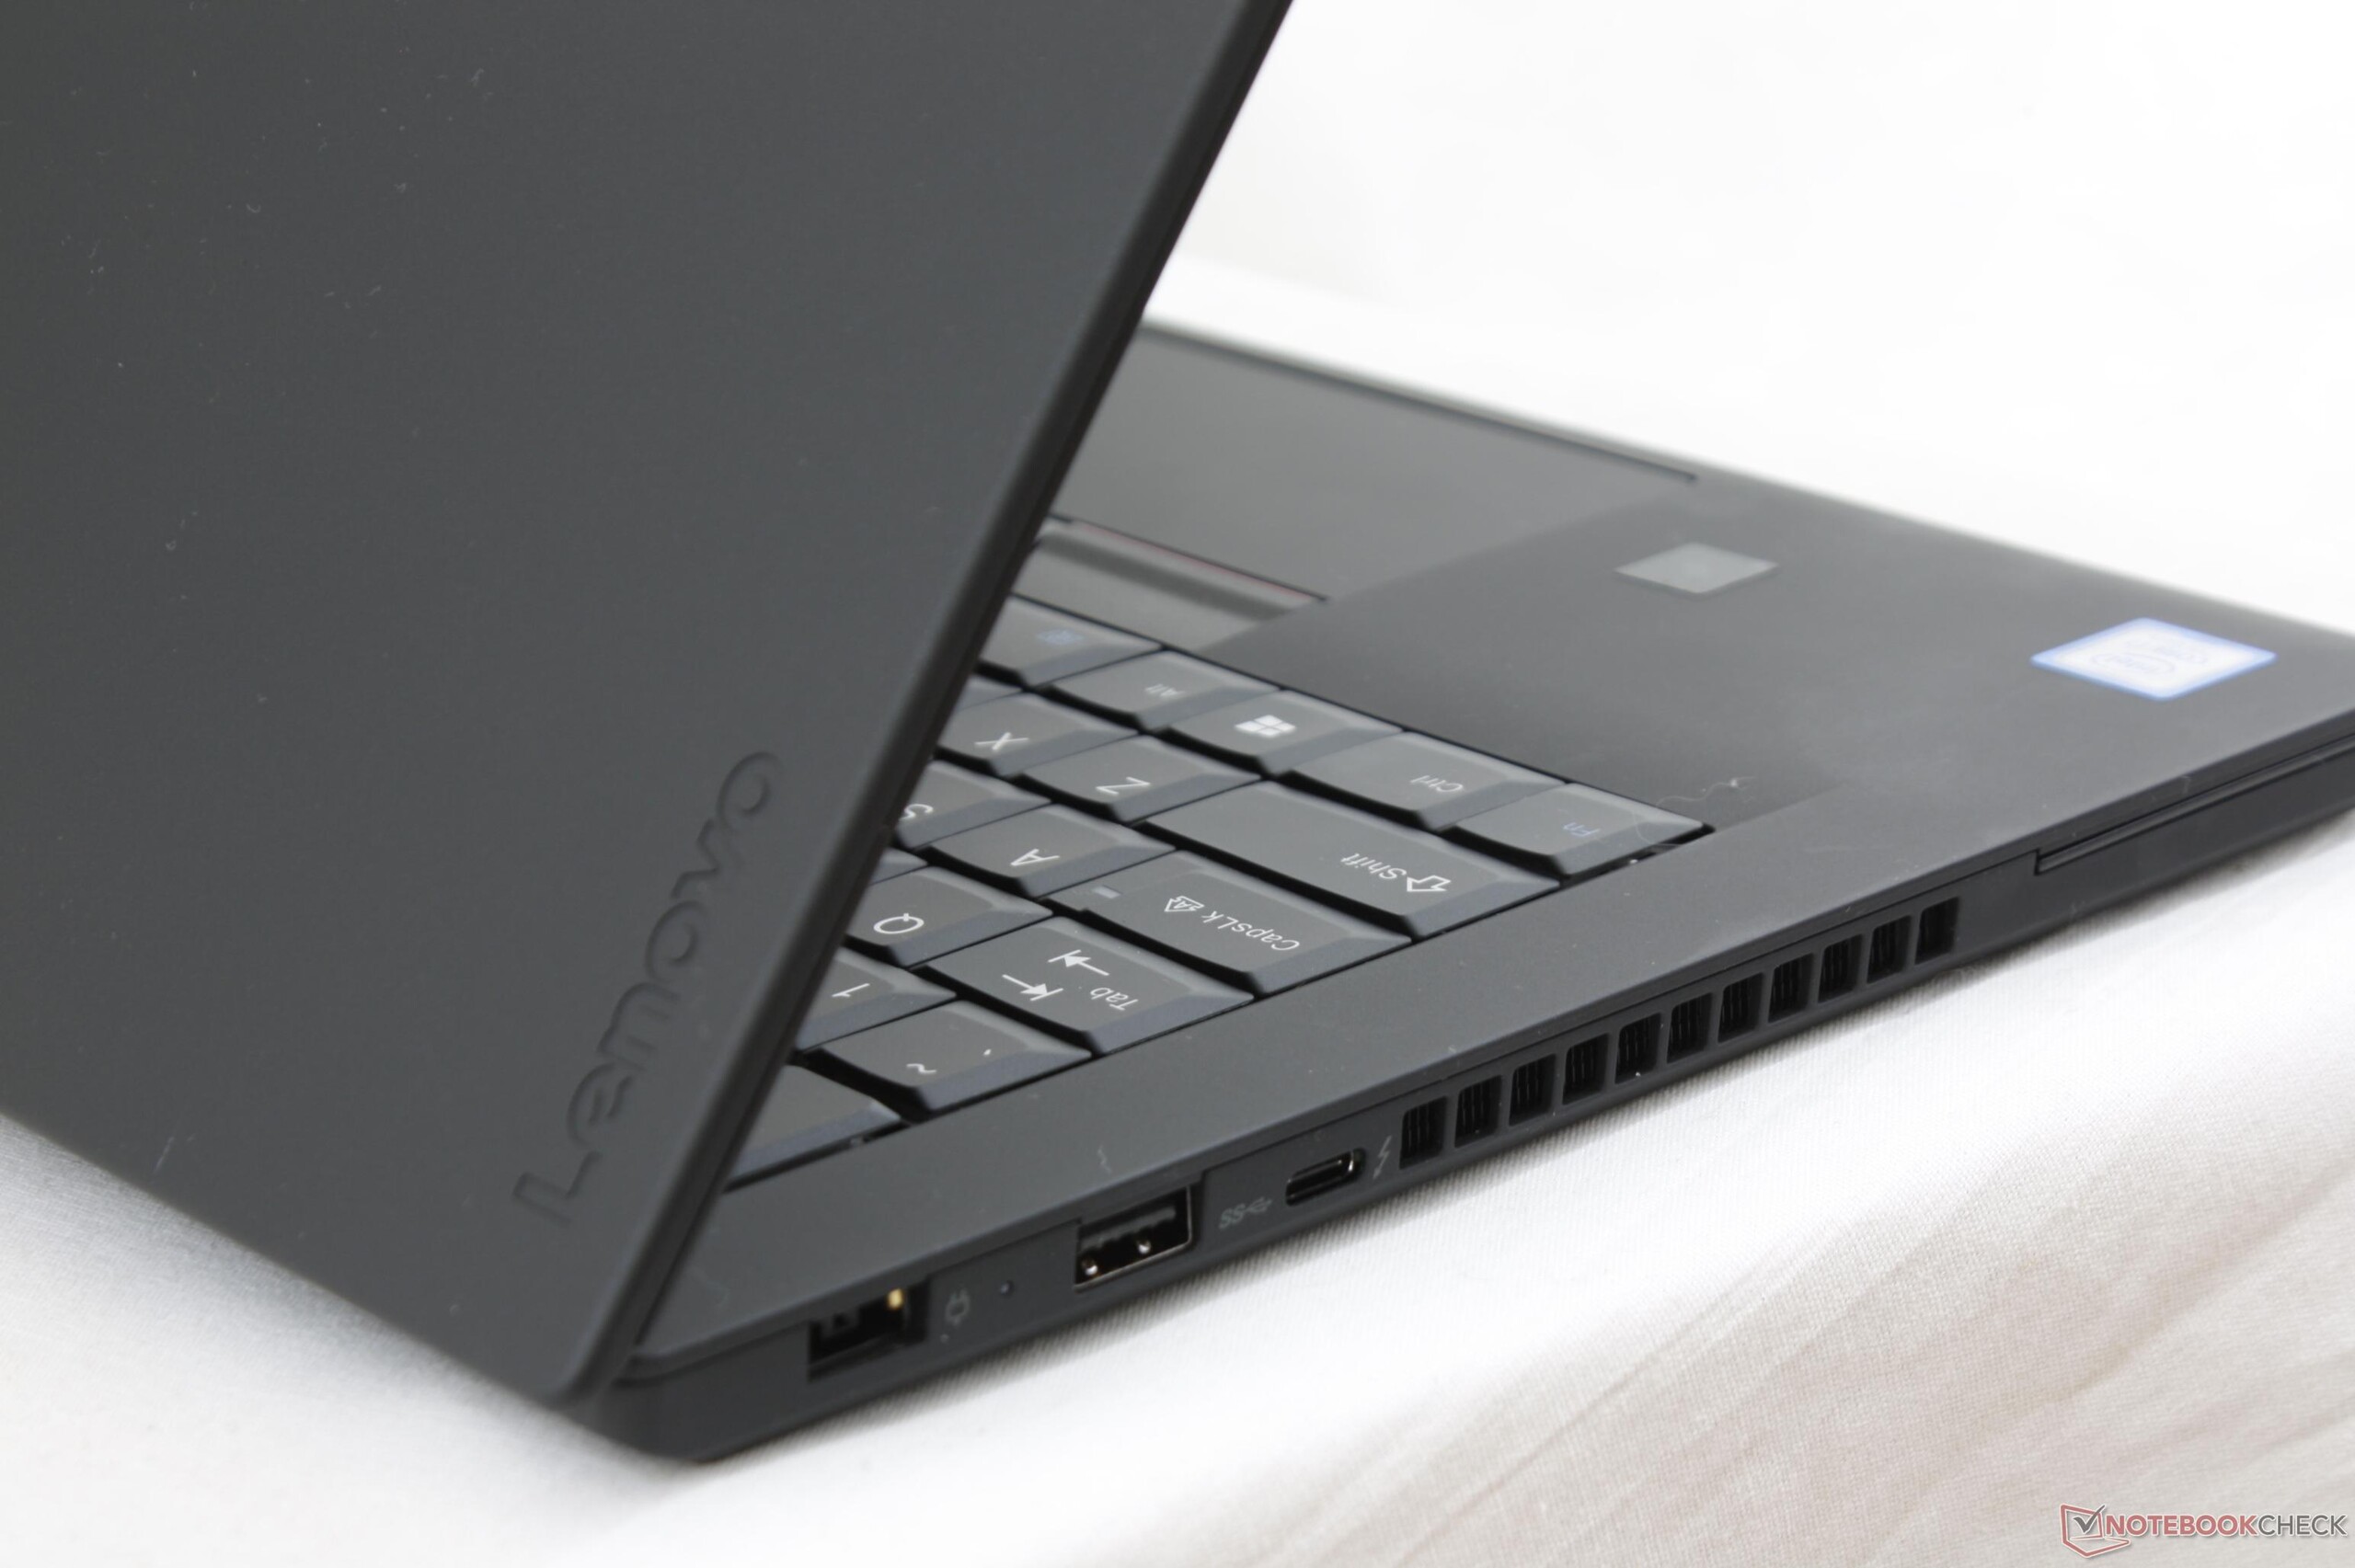
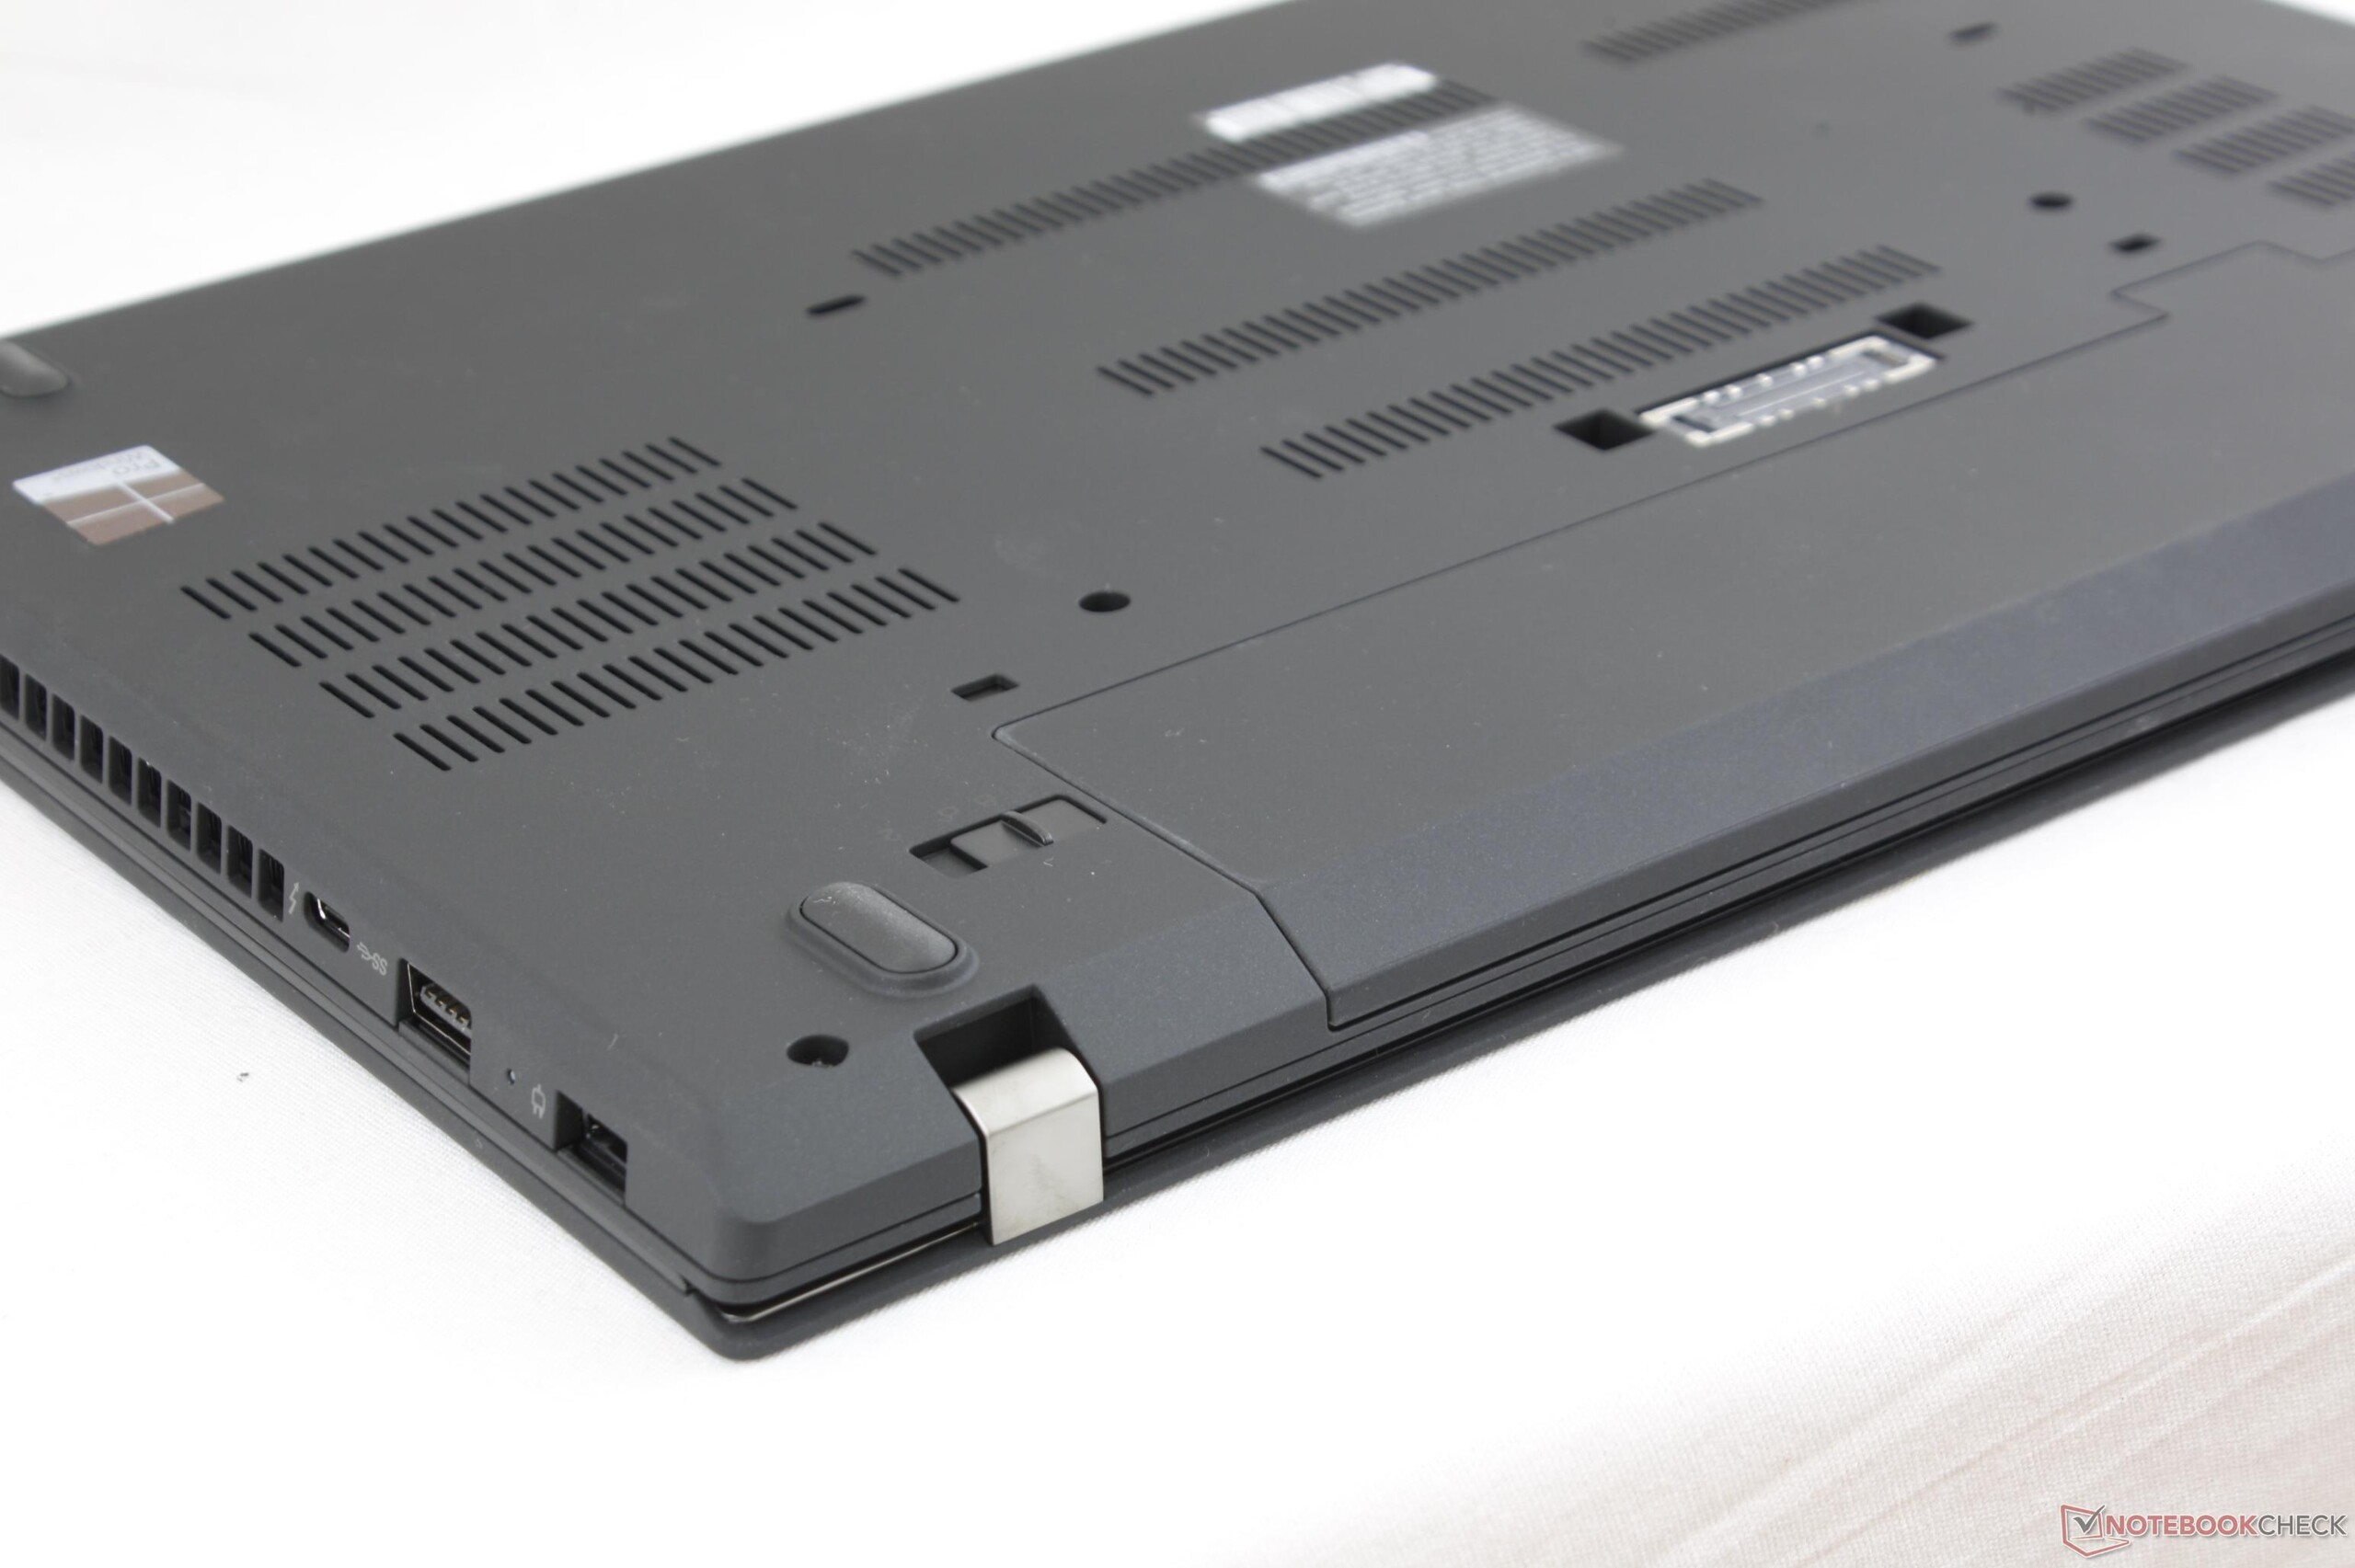
All ports from the T470 have returned with the odd omission of the SmartCard reader on our test unit. The Thunderbolt 3 and dedicated docking ports are fortunately unscathed for compatibility with both future and legacy docking stations, respectively. A VGA port like on the HP ProBook 440 would have been a nice callback to the classic ThinkPad series, but port positioning is already quite tight as it is.


SD Card Reader
The integrated spring-loaded card reader returns average transfer rates of about 86 MB/s with our Toshiba UHS-II SDXC test card. Transferring 1 GB worth of images from the card to desktop will take about 13 seconds compared to 8 seconds on the XPS 15.
A fully inserted SD card sits flush against the edge of the notebook for safe transporting. On the flip side, ejecting the card can be a challenge for larger fingers.
| SD Card Reader | |
| average JPG Copy Test (av. of 3 runs) | |
| Dell XPS 15 9560 (i7-7700HQ, UHD) | |
| Lenovo ThinkPad 25 | |
| Lenovo ThinkPad T470s-20HF0012US | |
| maximum AS SSD Seq Read Test (1GB) | |
| Dell XPS 15 9560 (i7-7700HQ, UHD) | |
| Lenovo ThinkPad T470s-20HF0012US | |
| Lenovo ThinkPad 25 | |
Communication
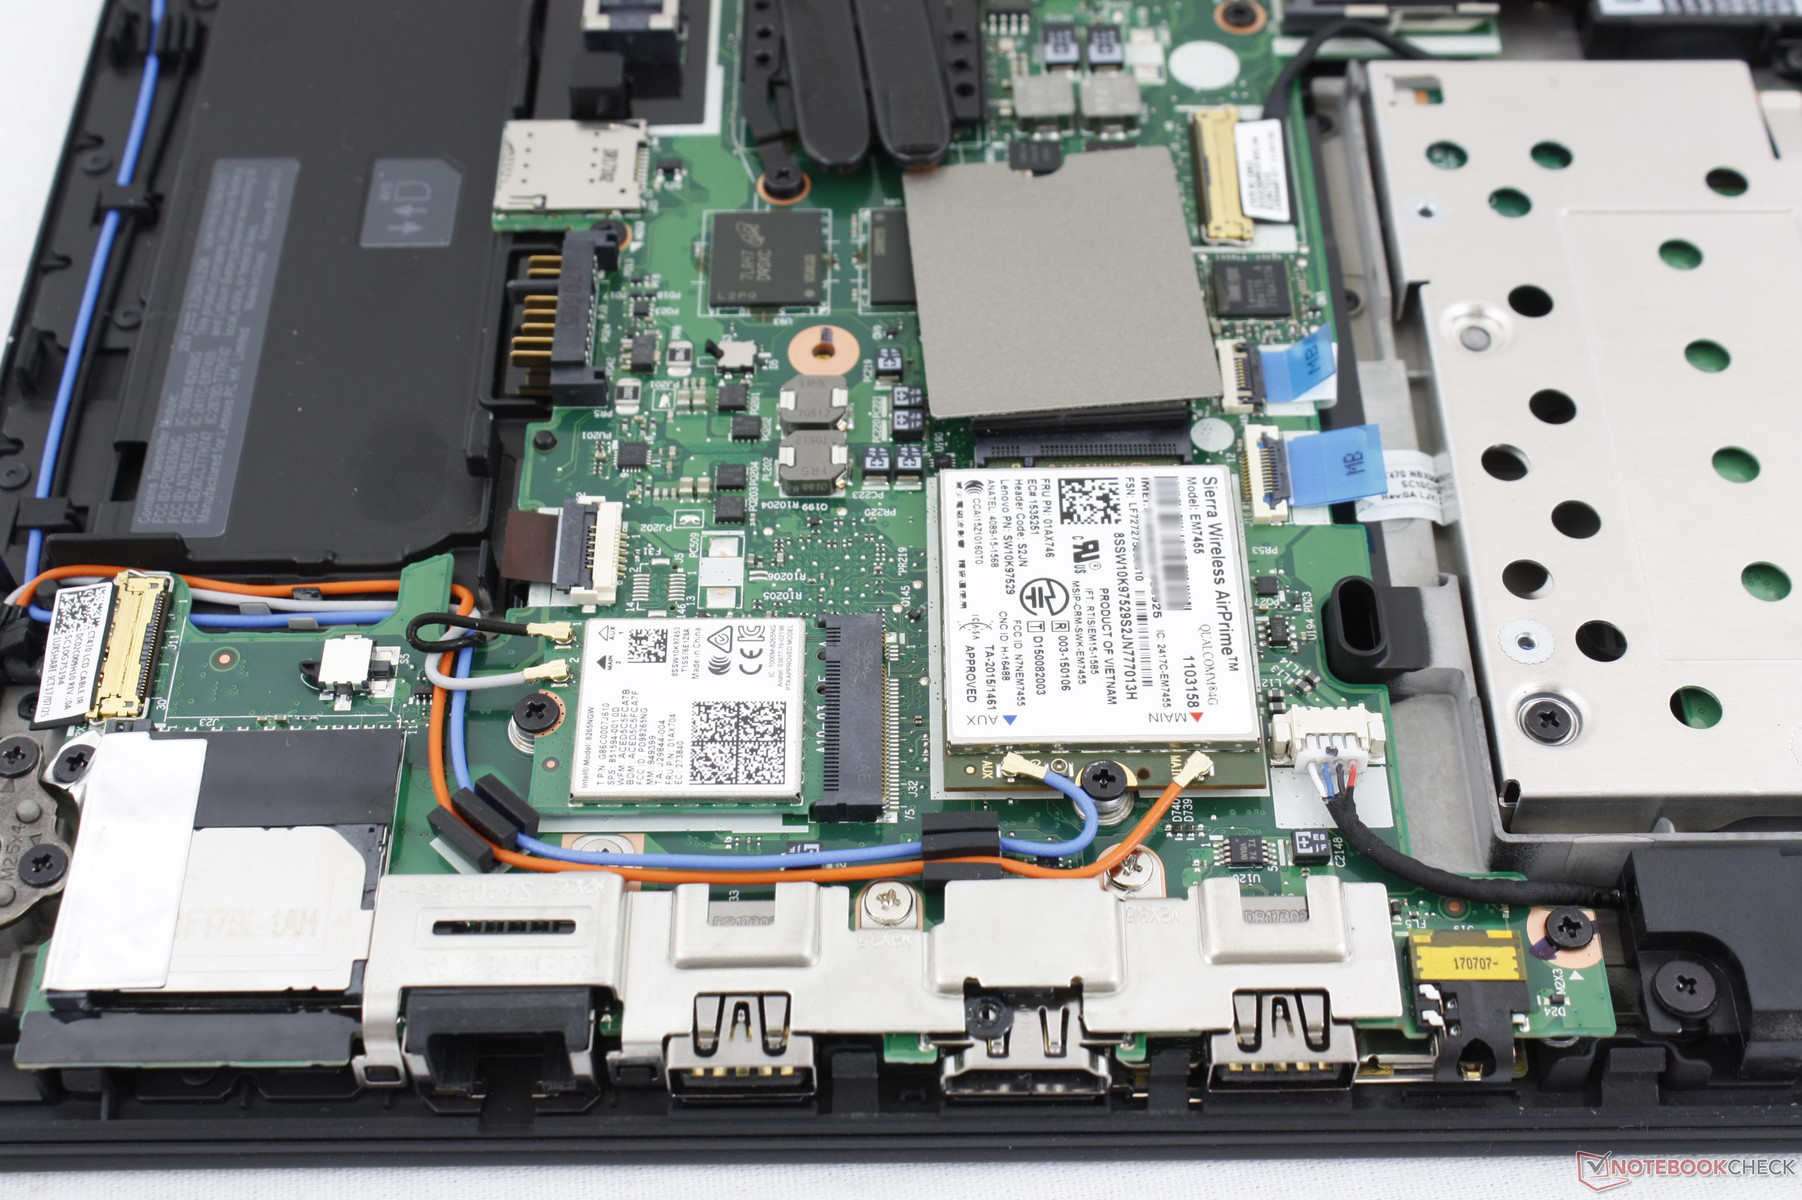
WLAN and Bluetooth 4.2 are provided by a 2x2 Intel 8265 M.2 2230 module whilst the Qualcomm Sierra EM7455 M.2 4230 module provides Cat-6 WAN speeds of up to 300 Mbps with GNSS tracking. We are able to measure a real-world WLAN transfer rate of 659 Mbps when standing one meter away from our Linksys EA8500 router and 4G cellular data works effortlessly after inserting a T-Mobile Micro-SIM card and logging into the network.
| Networking | |
| iperf3 transmit AX12 | |
| Dell XPS 15 9560 (i7-7700HQ, UHD) | |
| Lenovo ThinkPad 25 | |
| Lenovo ThinkPad T470s-20HF0012US | |
| iperf3 receive AX12 | |
| Lenovo ThinkPad 25 | |
| Dell XPS 15 9560 (i7-7700HQ, UHD) | |
| Lenovo ThinkPad T470s-20HF0012US | |
Security
TPM, fingerprint reader, and Windows Hello are all included on our test unit. We experienced no login issues or long delays after setting up the fingerprint, facial recognition, and password via Windows 10 sign-in options.
Accessories
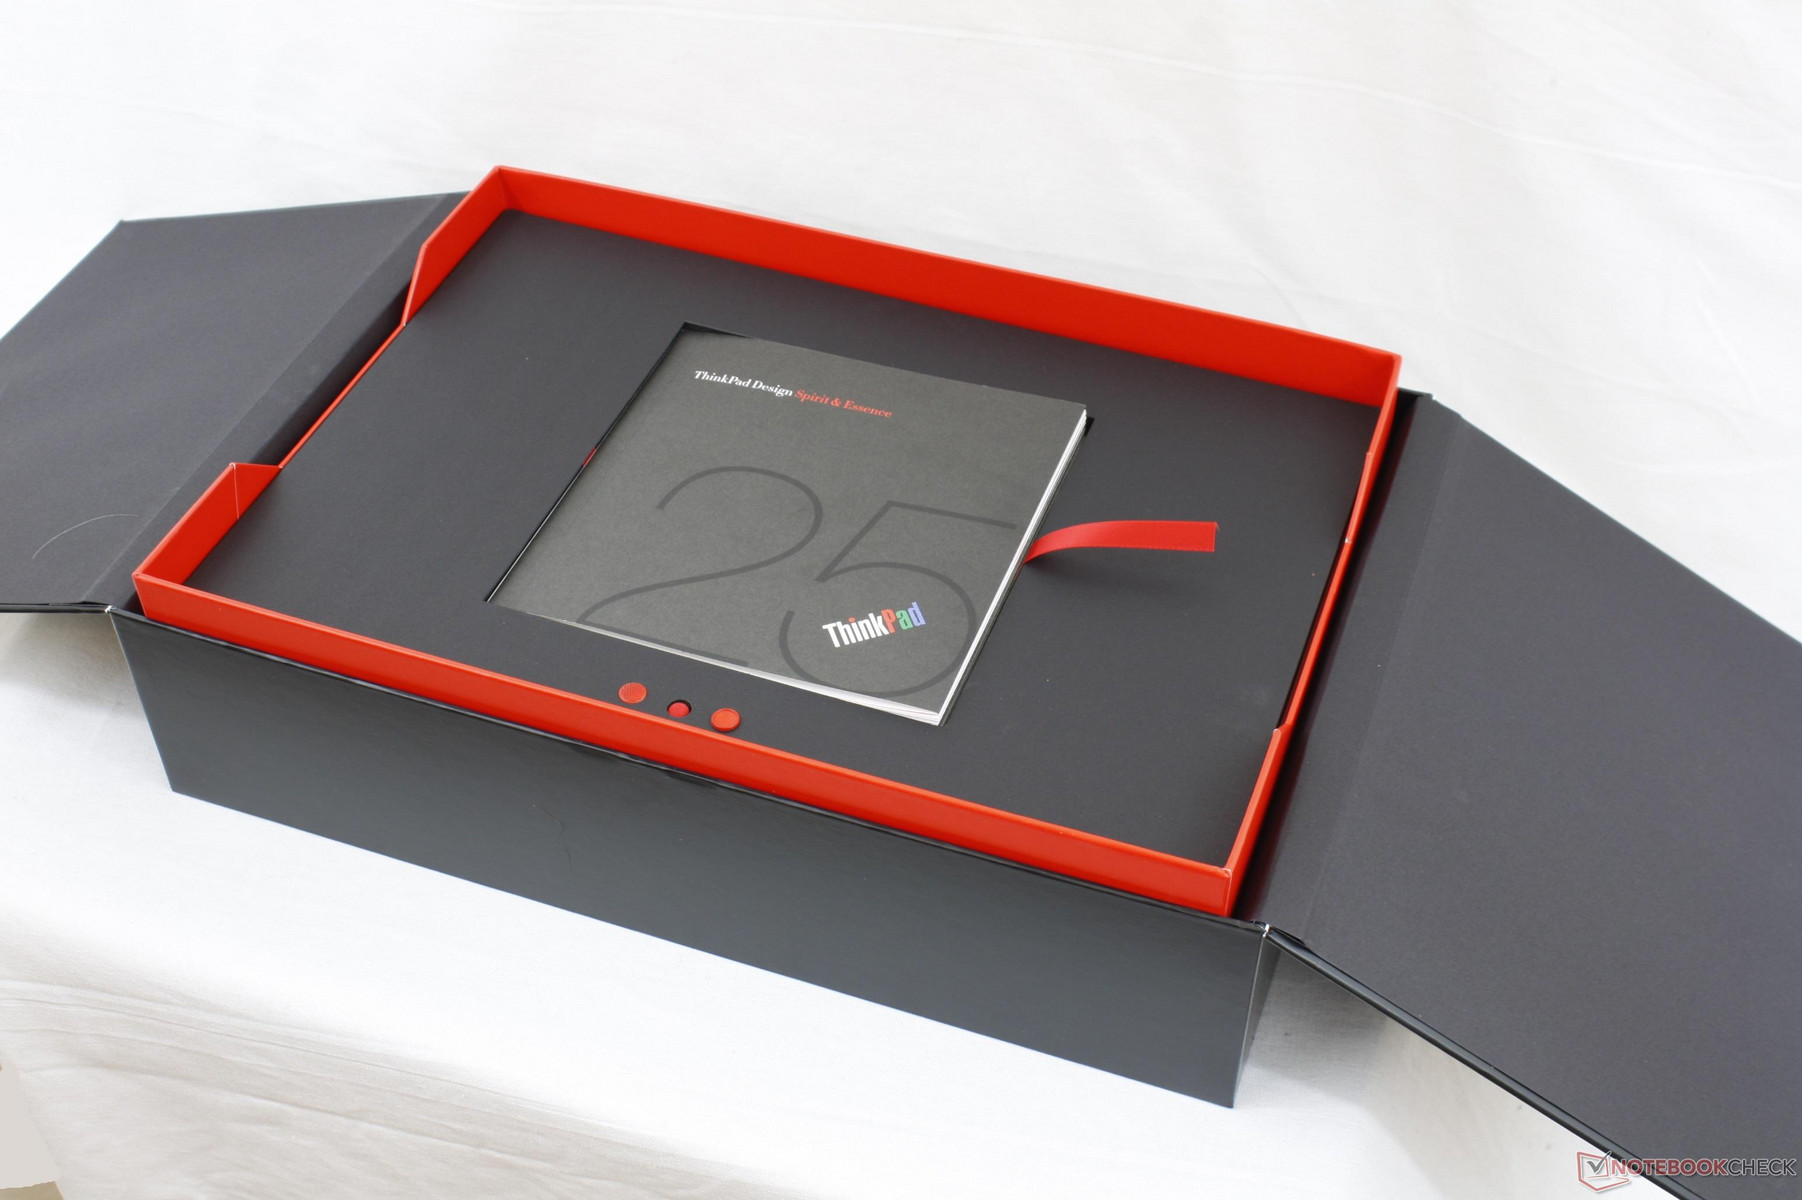
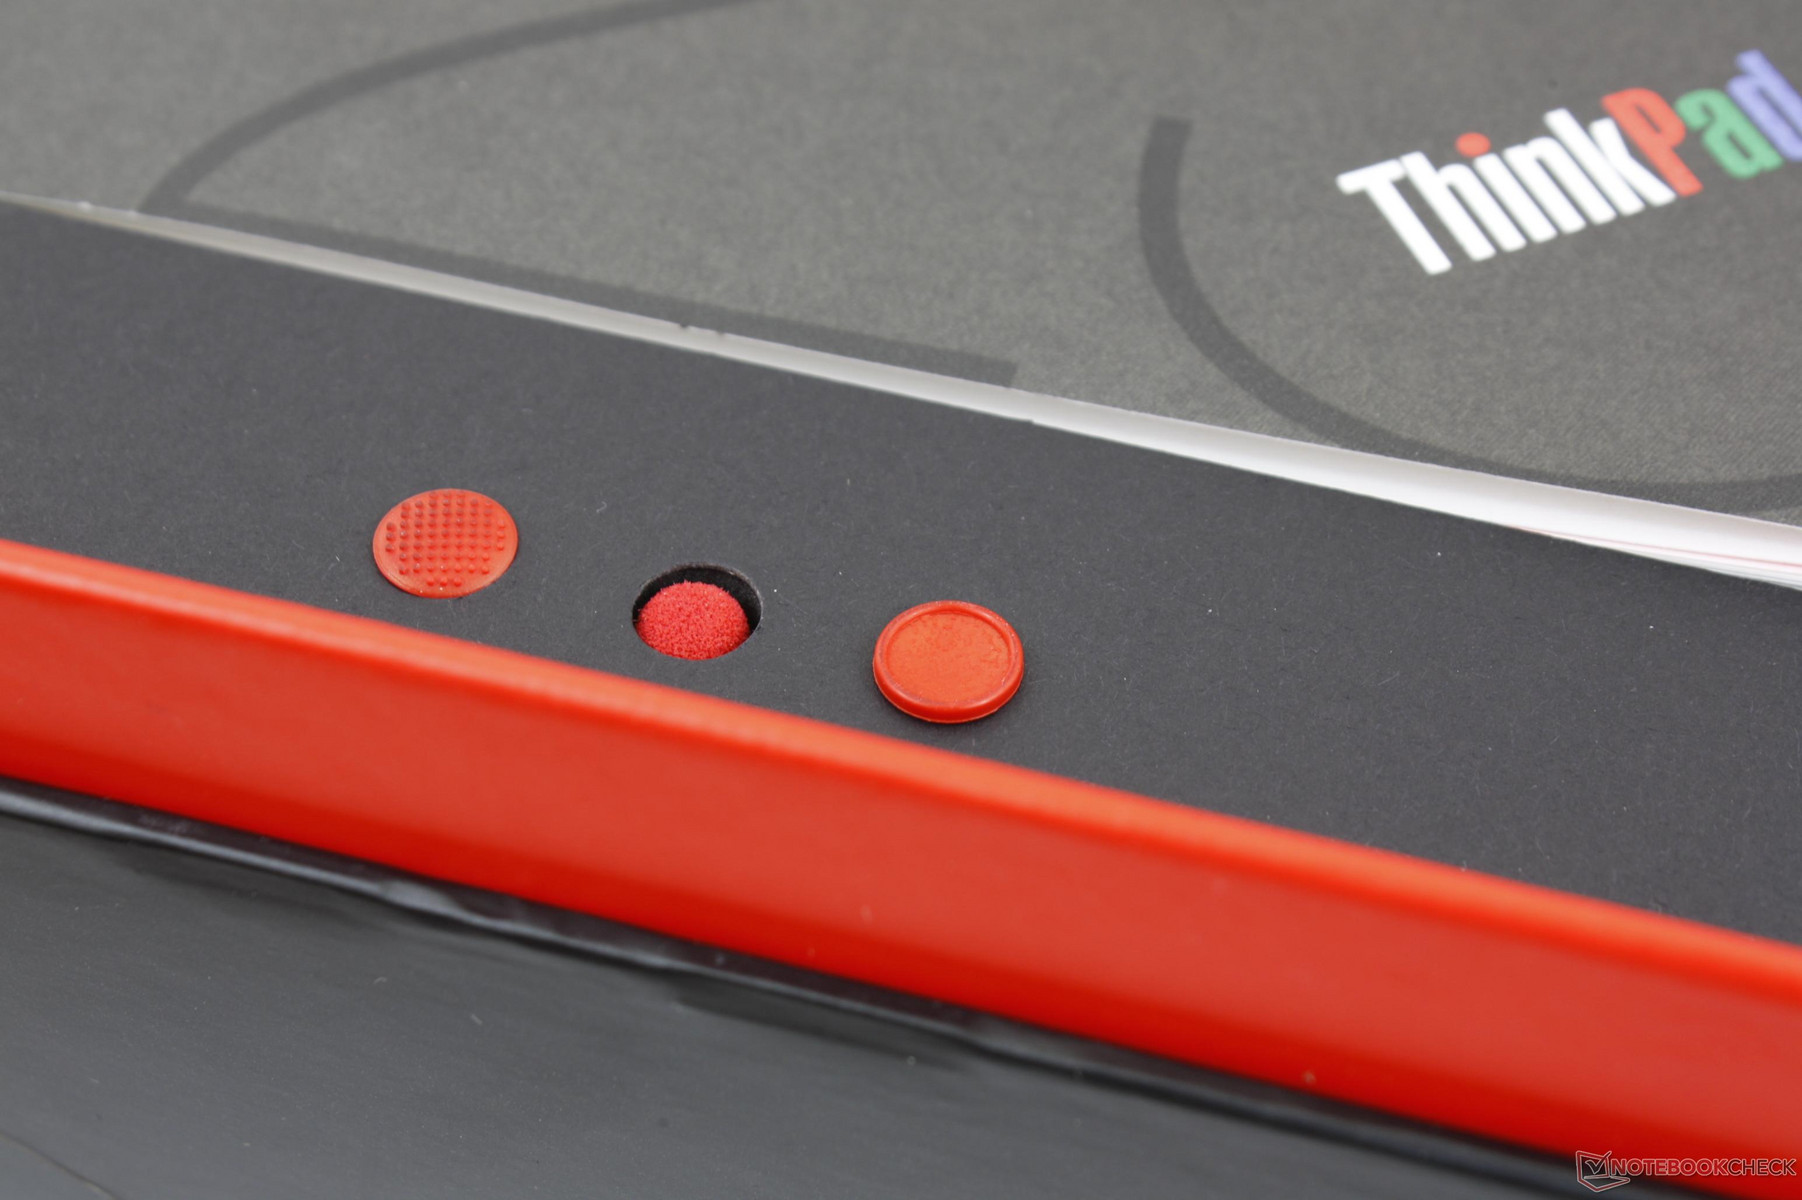
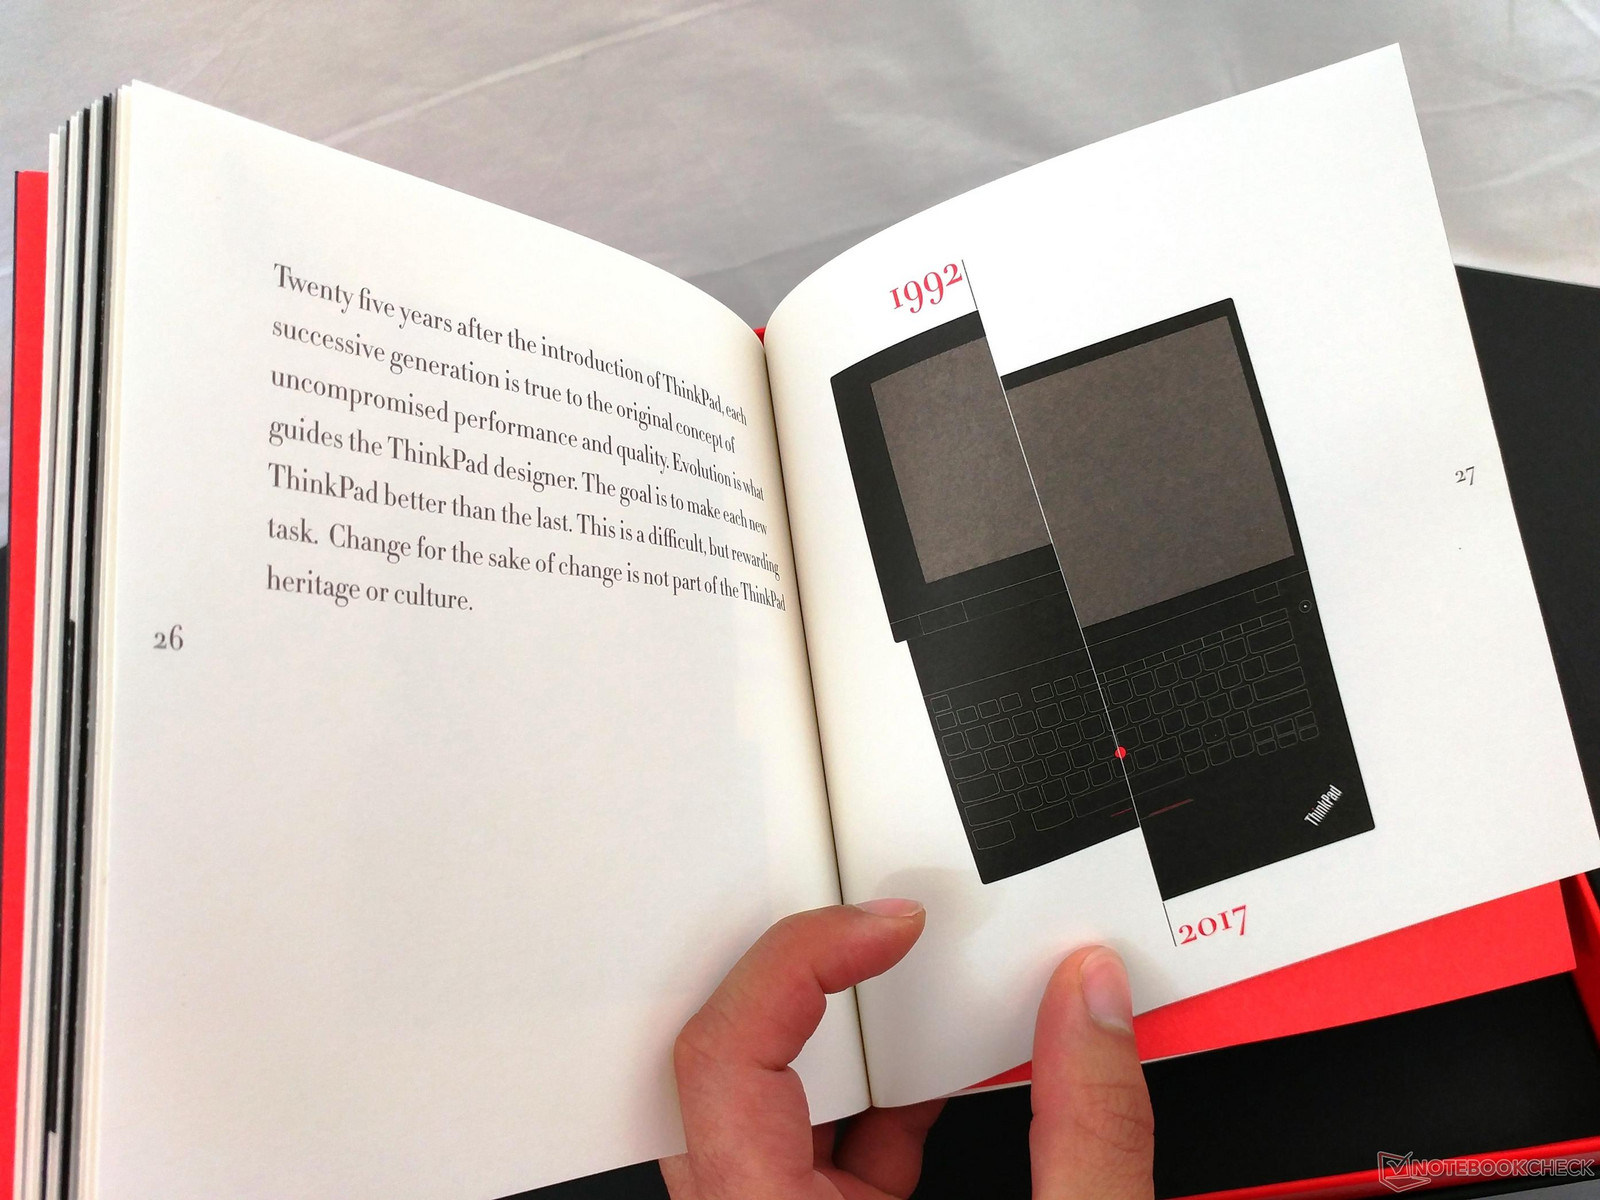
The anniversary system ships in a different box than the standard T470 and with different accessories as well. A small booklet reminisces about the design philosophy and qualities that have made the ThinkPad series unique from day one. Additionally, three extra TrackPoint nubs are included with different textures and shapes on each. Lastly, the AC adapter is now a Thunderbolt 3 charger instead of the usual proprietary AC charger that shipped with the T470. While the proprietary charging port remains for compatibility reasons, we see this as a transition period where future ThinkPad models could omit the charging port entirely in favor of Thunderbolt 3 only.
The same optional accessories that take advantage of the docking port underneath the T470 are also compatible with the ThinkPad 25. This is an uncommon case of a Thinkpad that integrates both Thunderbolt 3 and proprietary docking for a very wide range of compatible solutions.
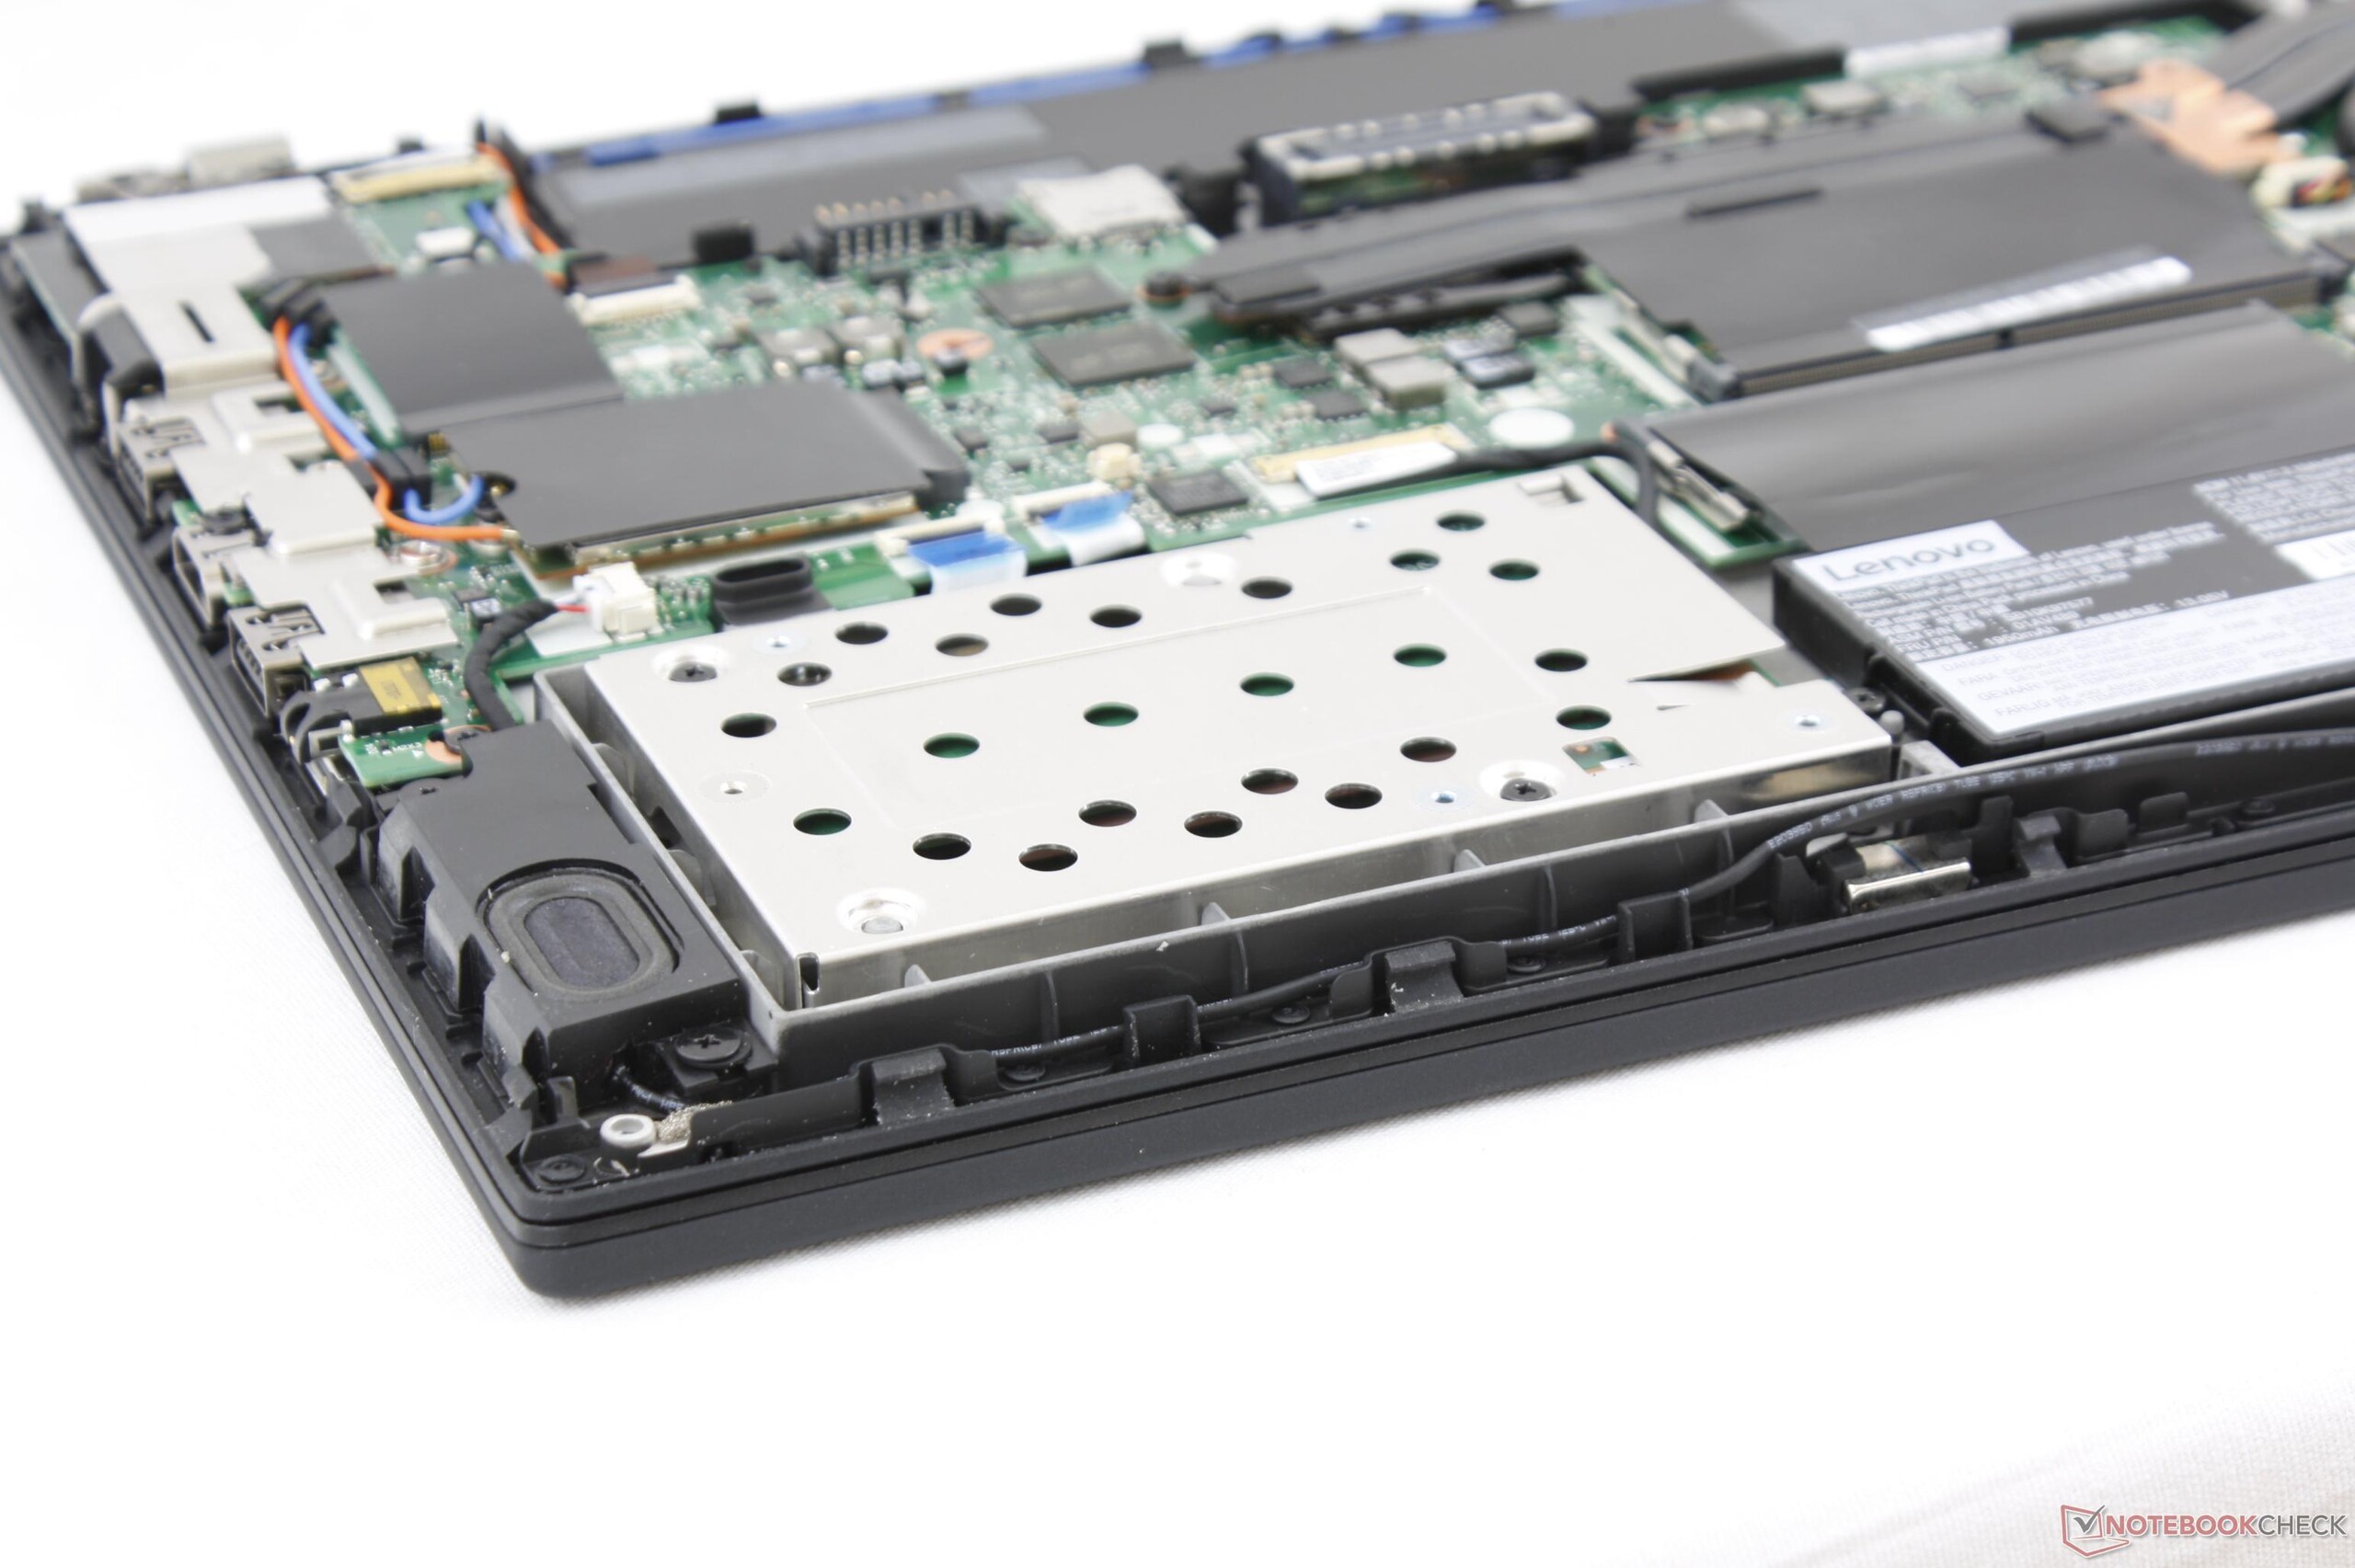
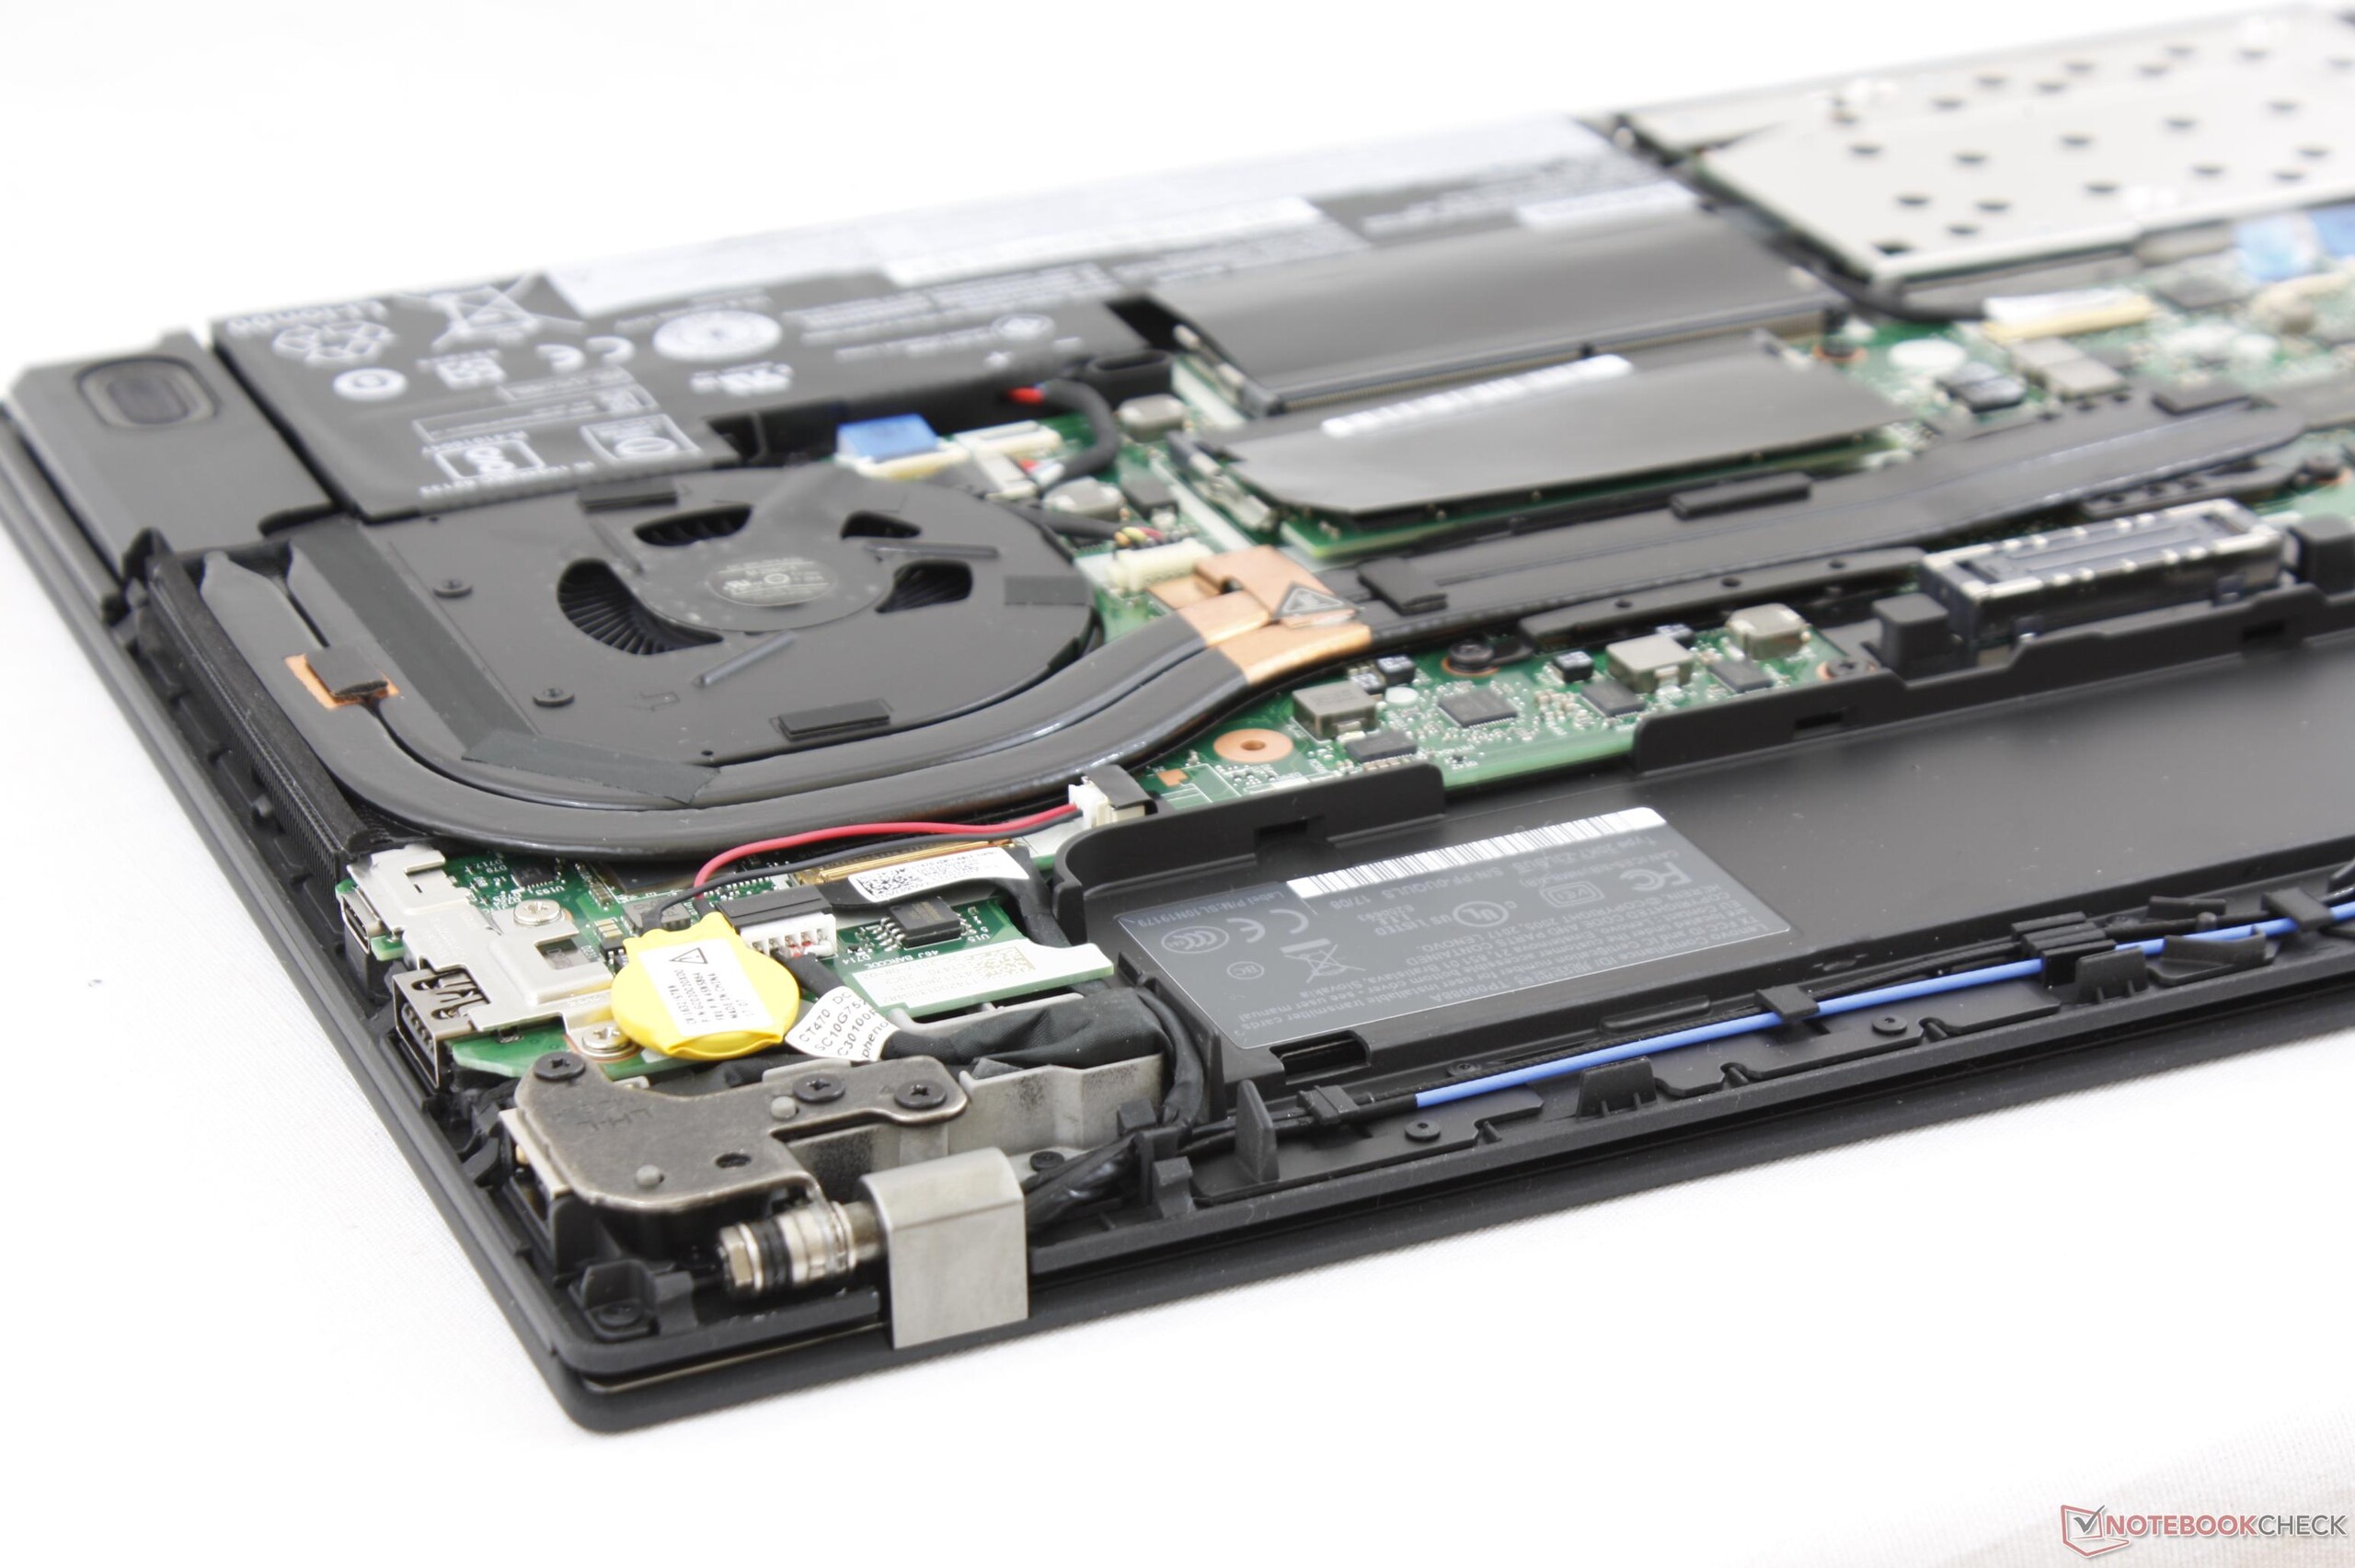
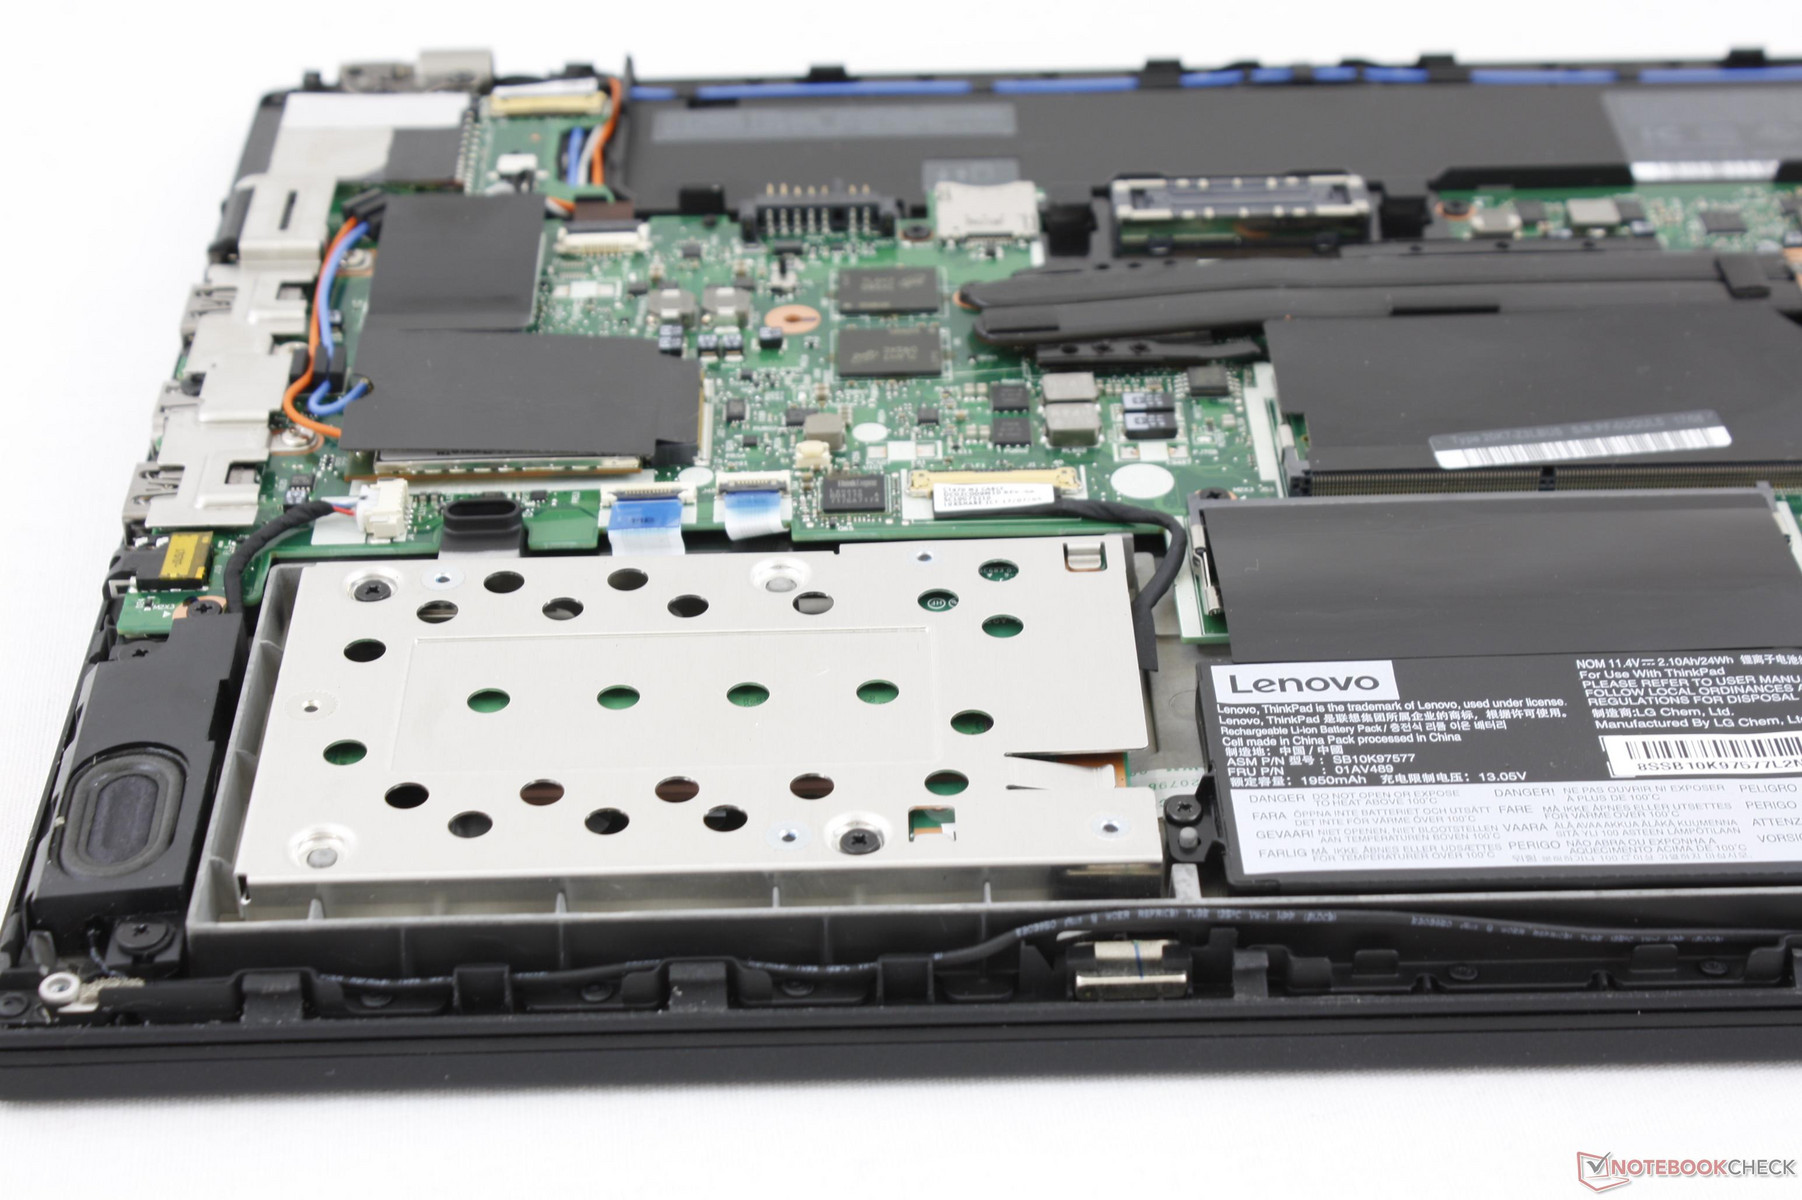
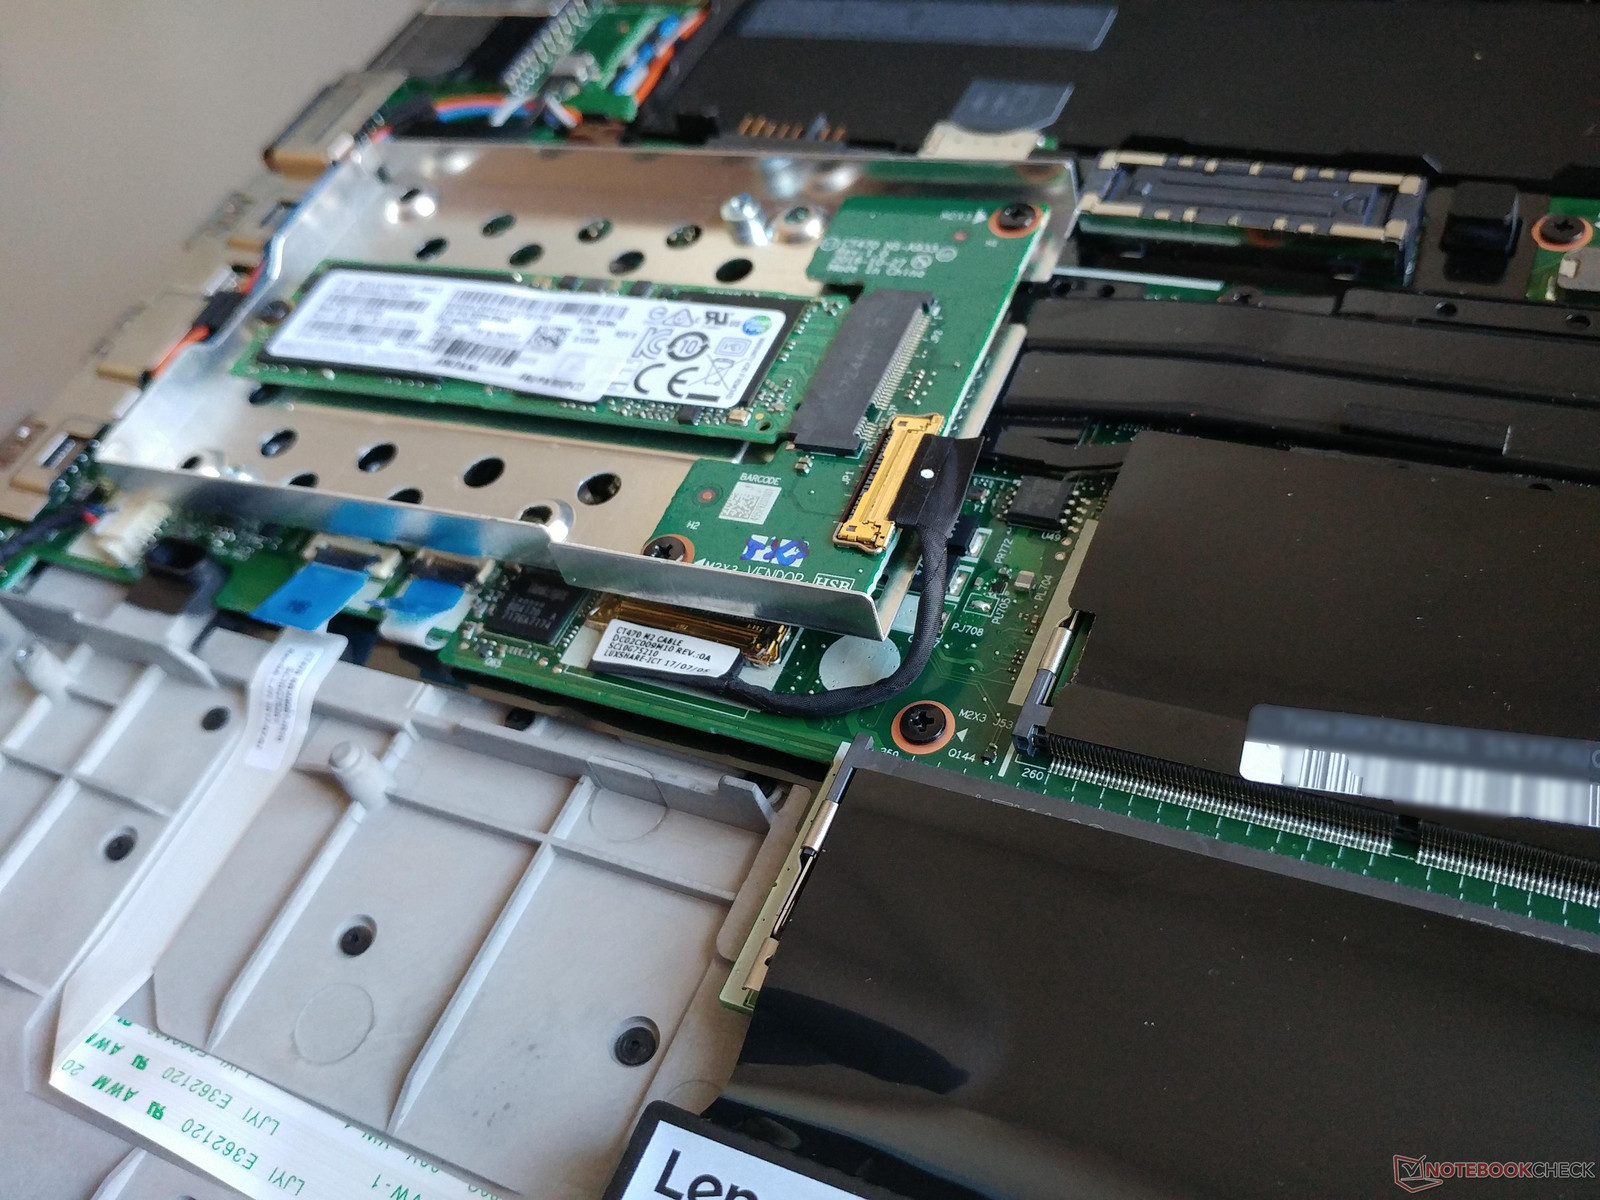
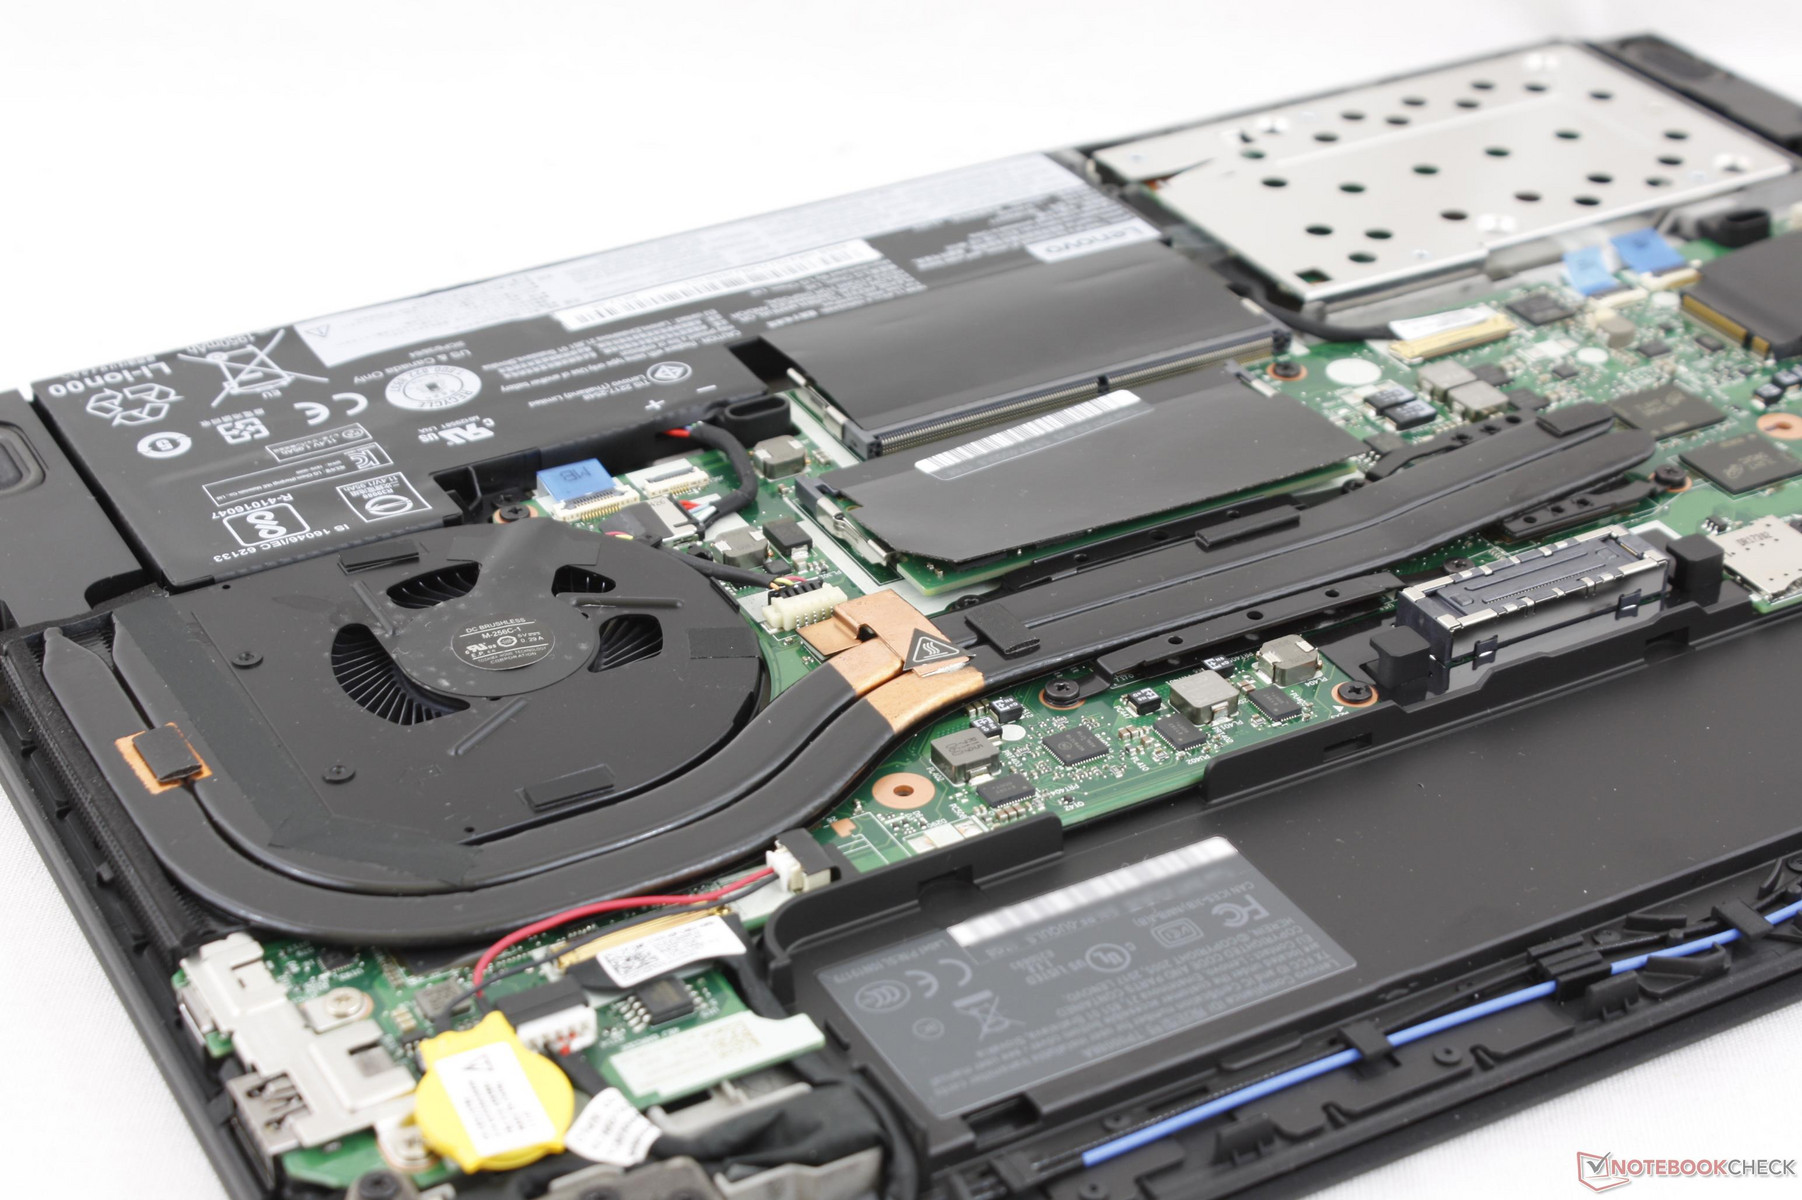
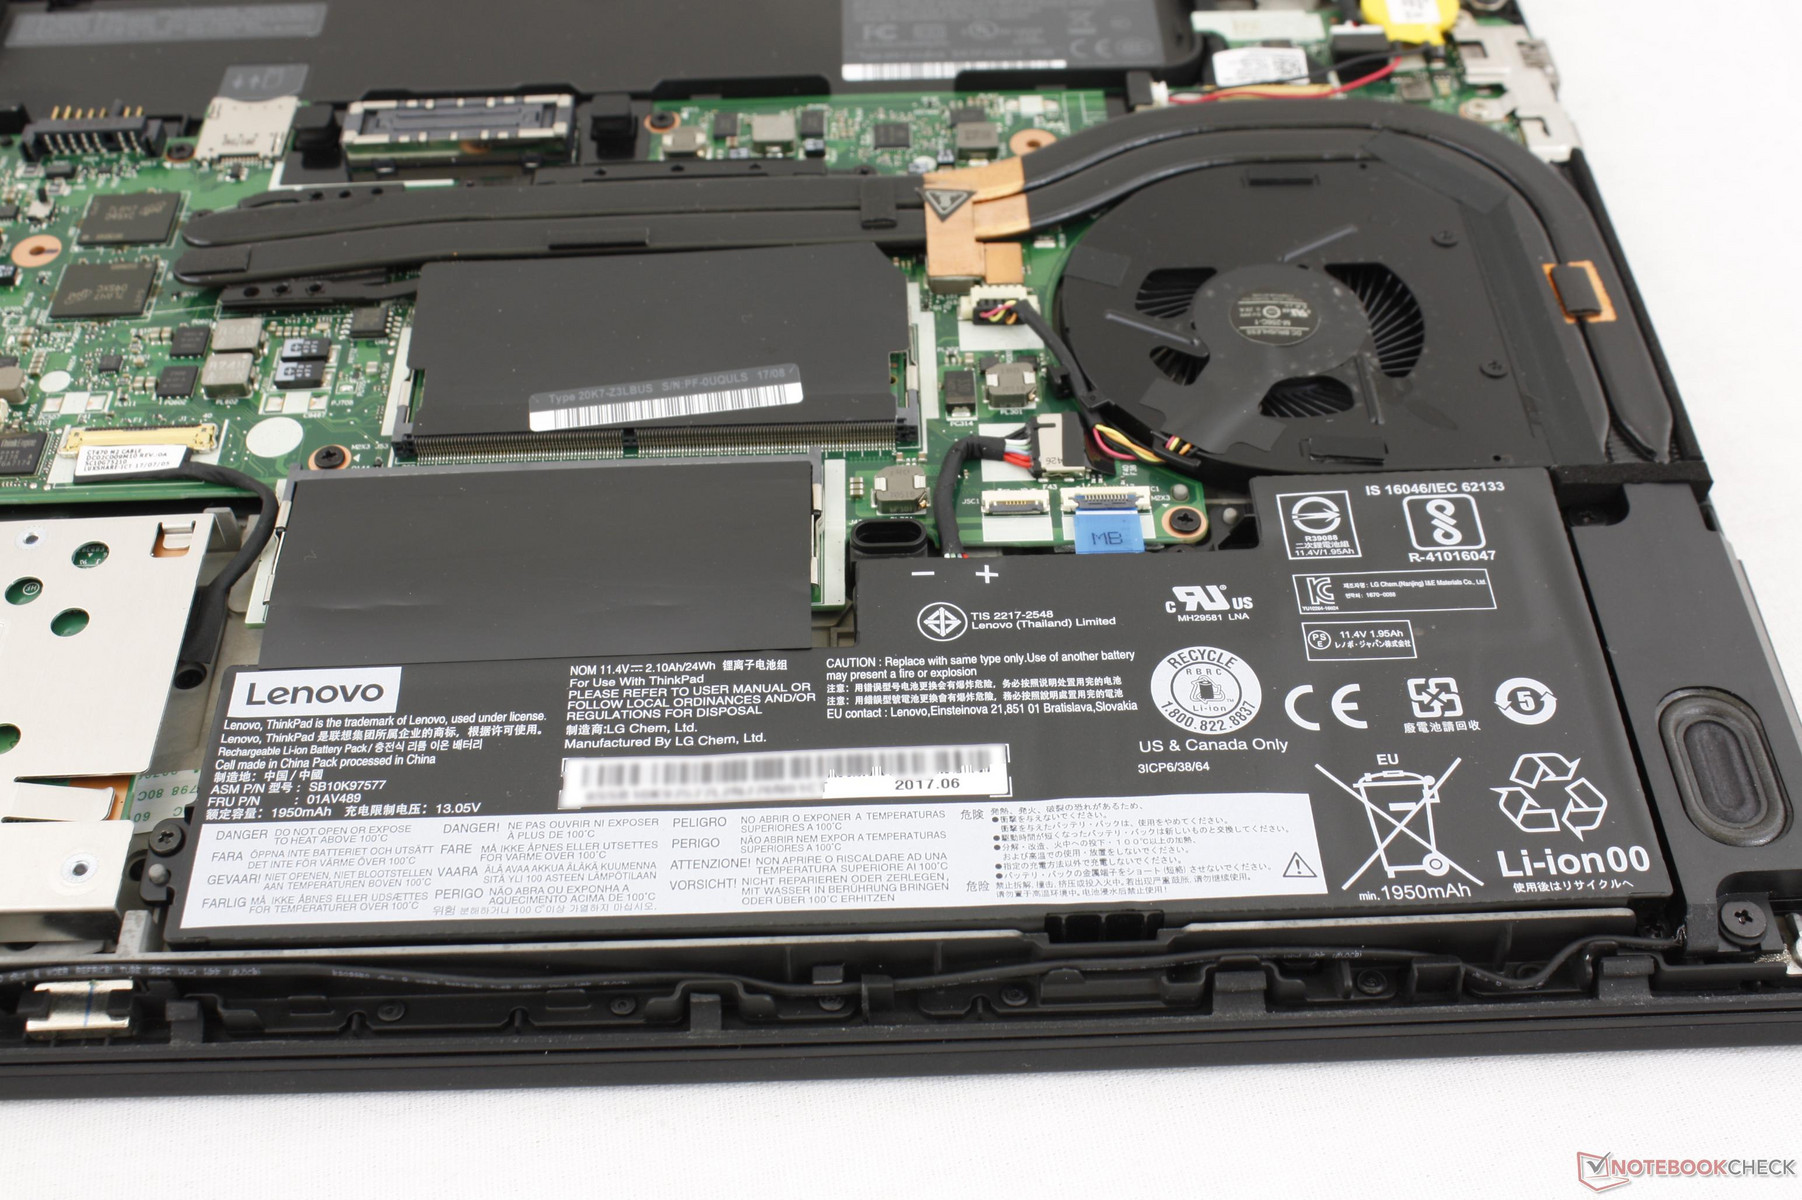
Maintenance
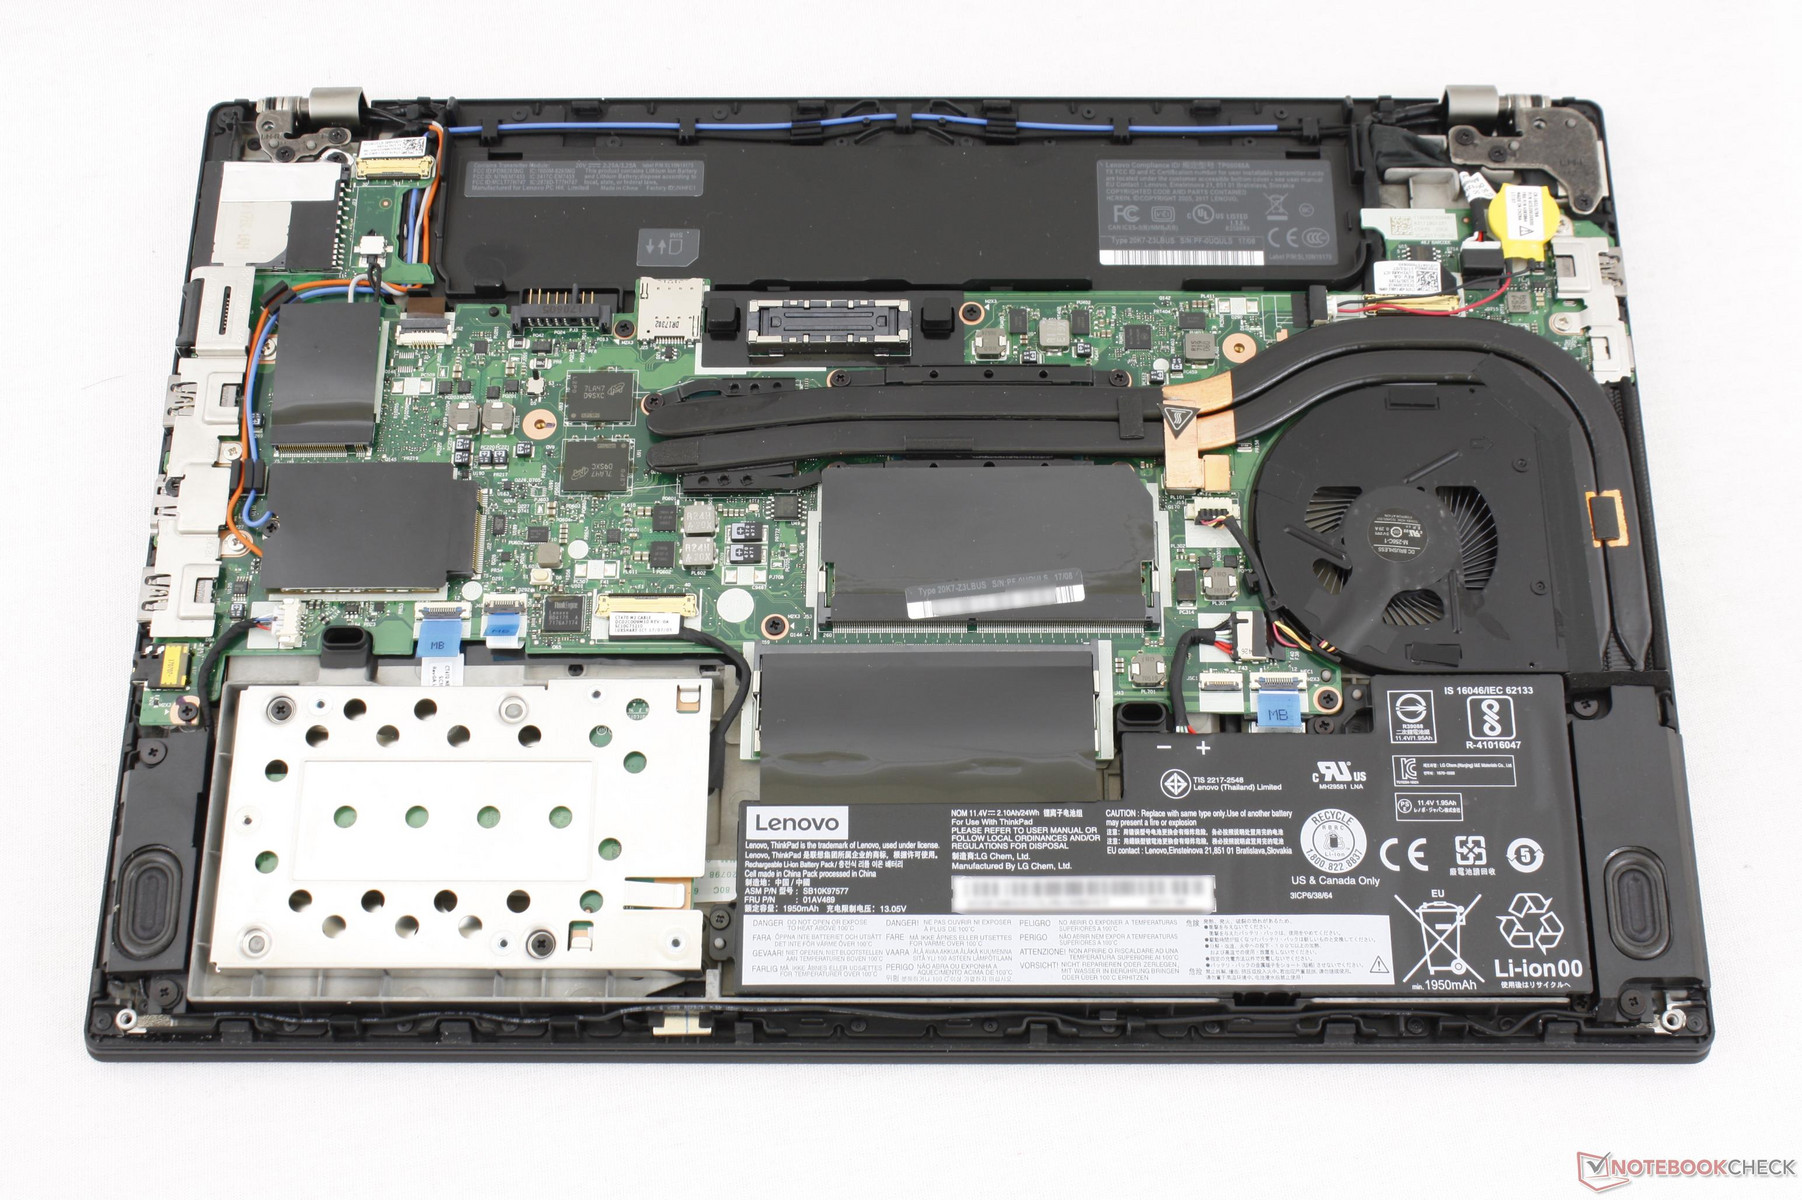
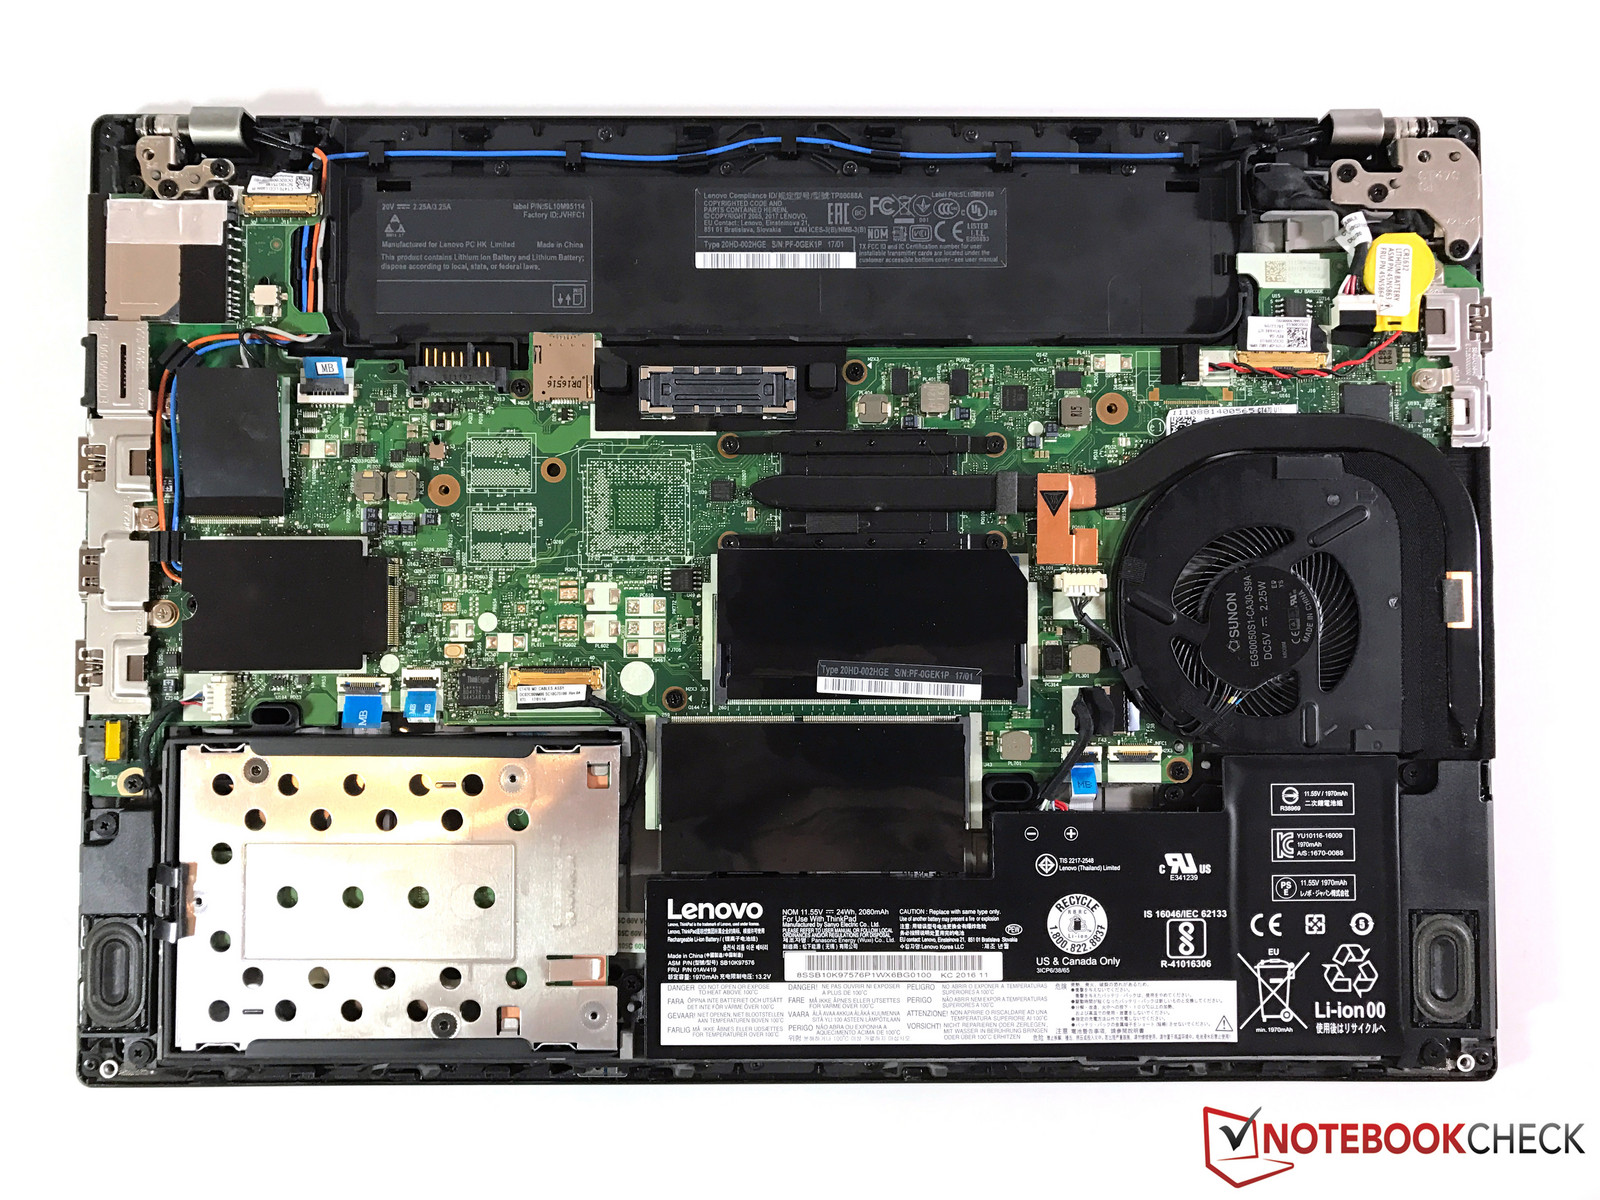
Servicing requires the removal of six screws from the underside of the unit. The panel is latched very tightly around its corners and edges and we recommend using a sharp edge to pry it open safely. As expected, the internals are essentially identical to our T470 save for the slightly larger cooling solution in order to accommodate the discrete Nvidia GPU. Users have direct access to both SODIMM slots, WLAN and WAN cards, and the M.2 slot within the 2.5-inch SATA caddy.
Warranty
The base one-year limited warranty applies. Lenovo offers one of the most comprehensive warranty options should users wish to extend coverage up to five years with onsite service, accidental damage protection, and data protection. Please see our Guarantees, Return Policies & Warranties FAQ for country-specific information.
Input Devices
Keyboard
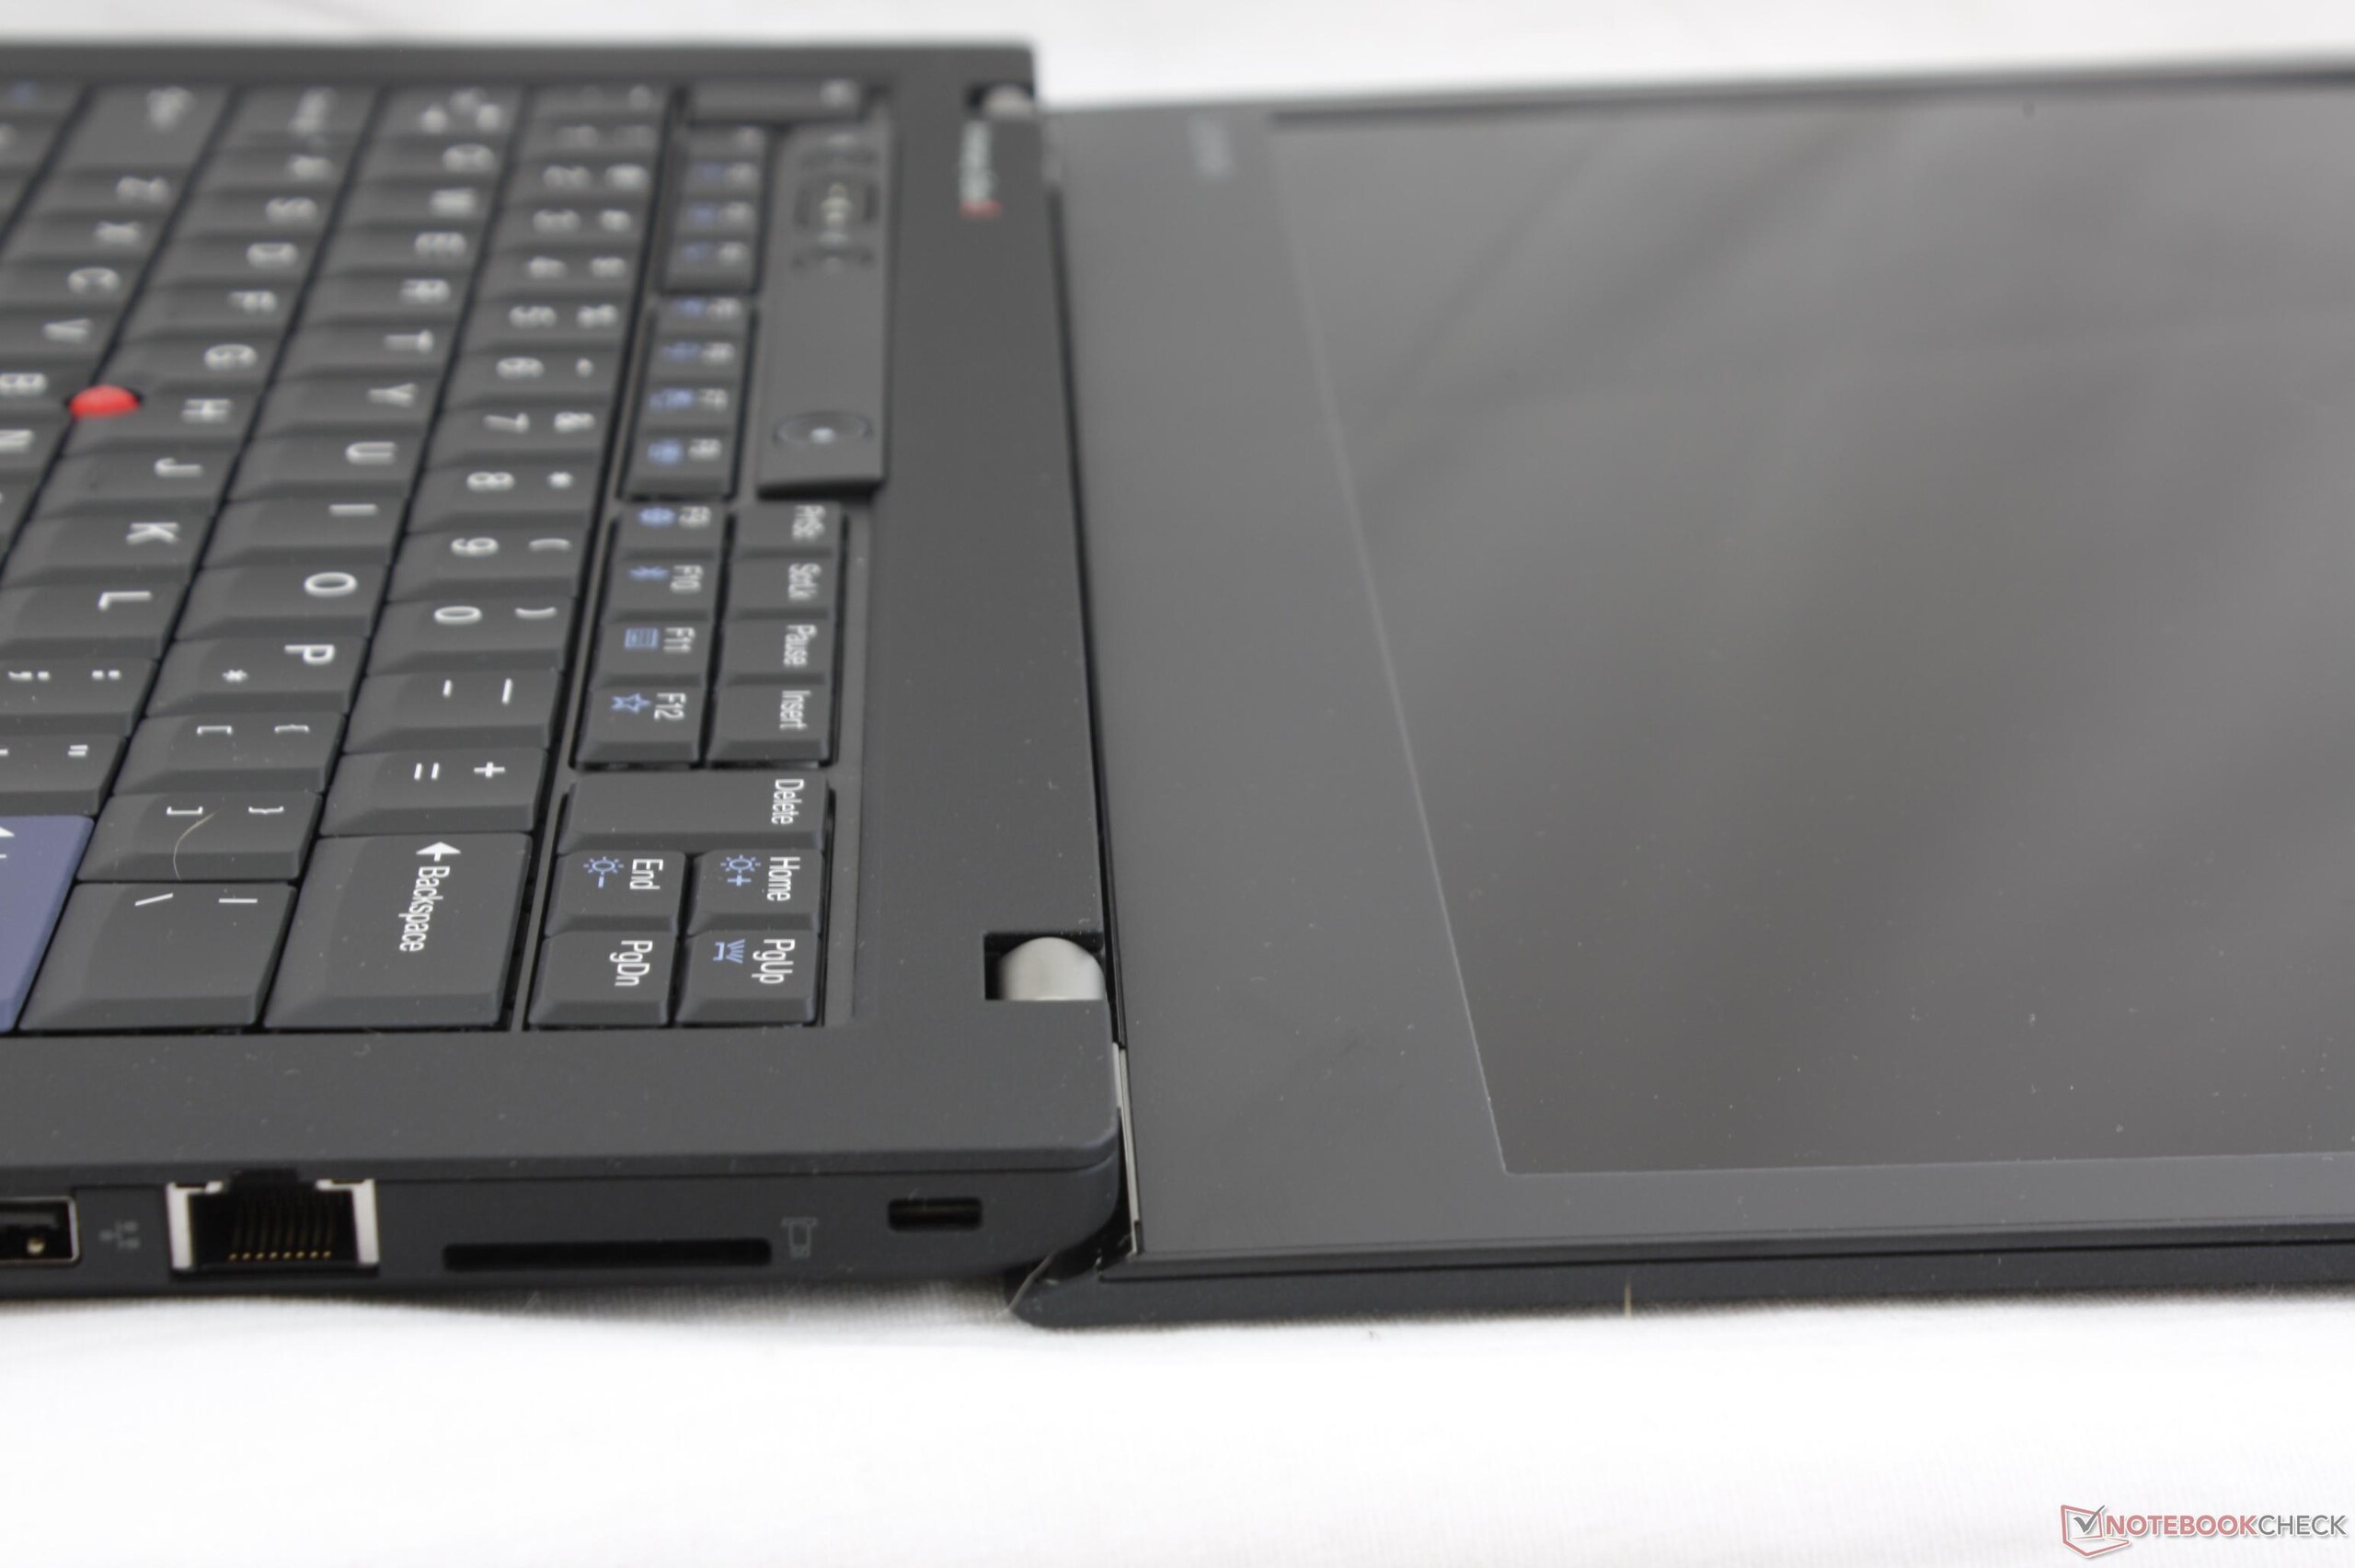
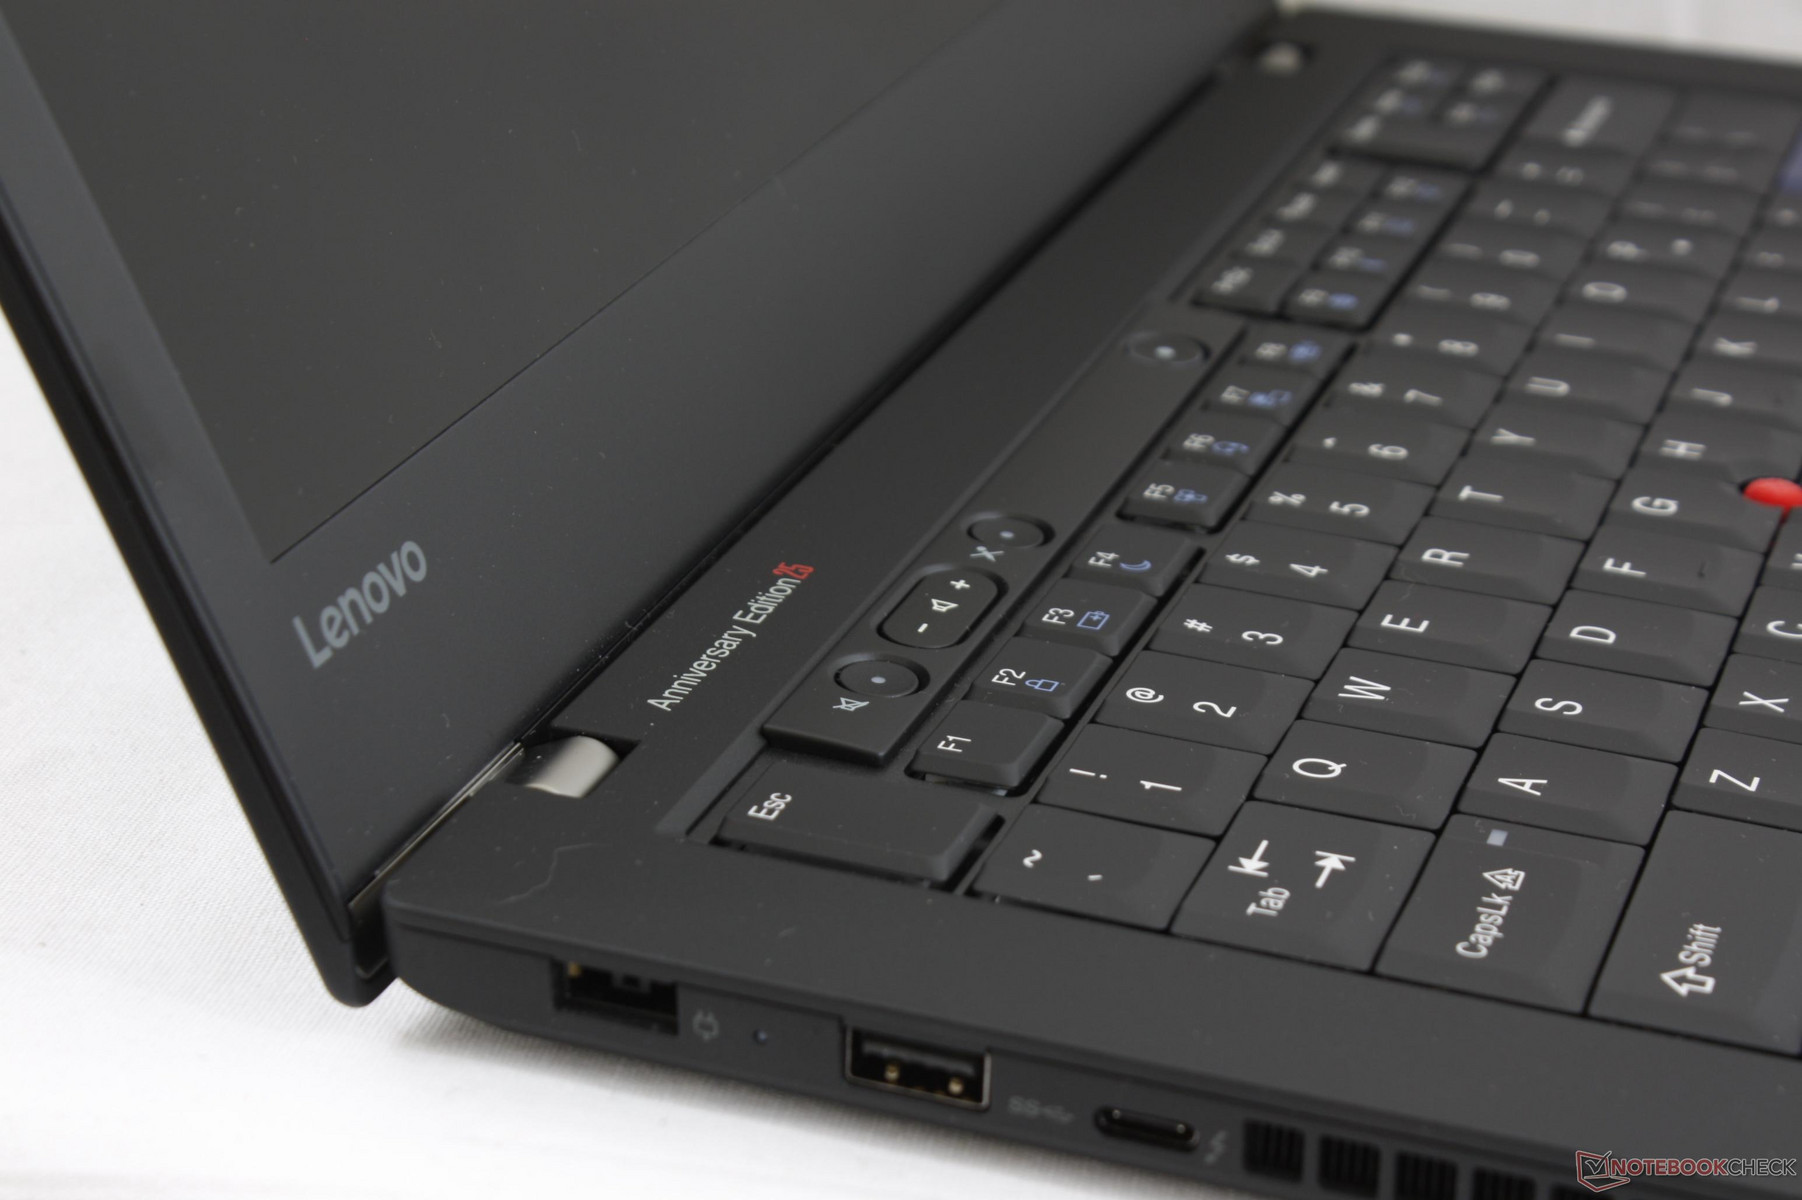
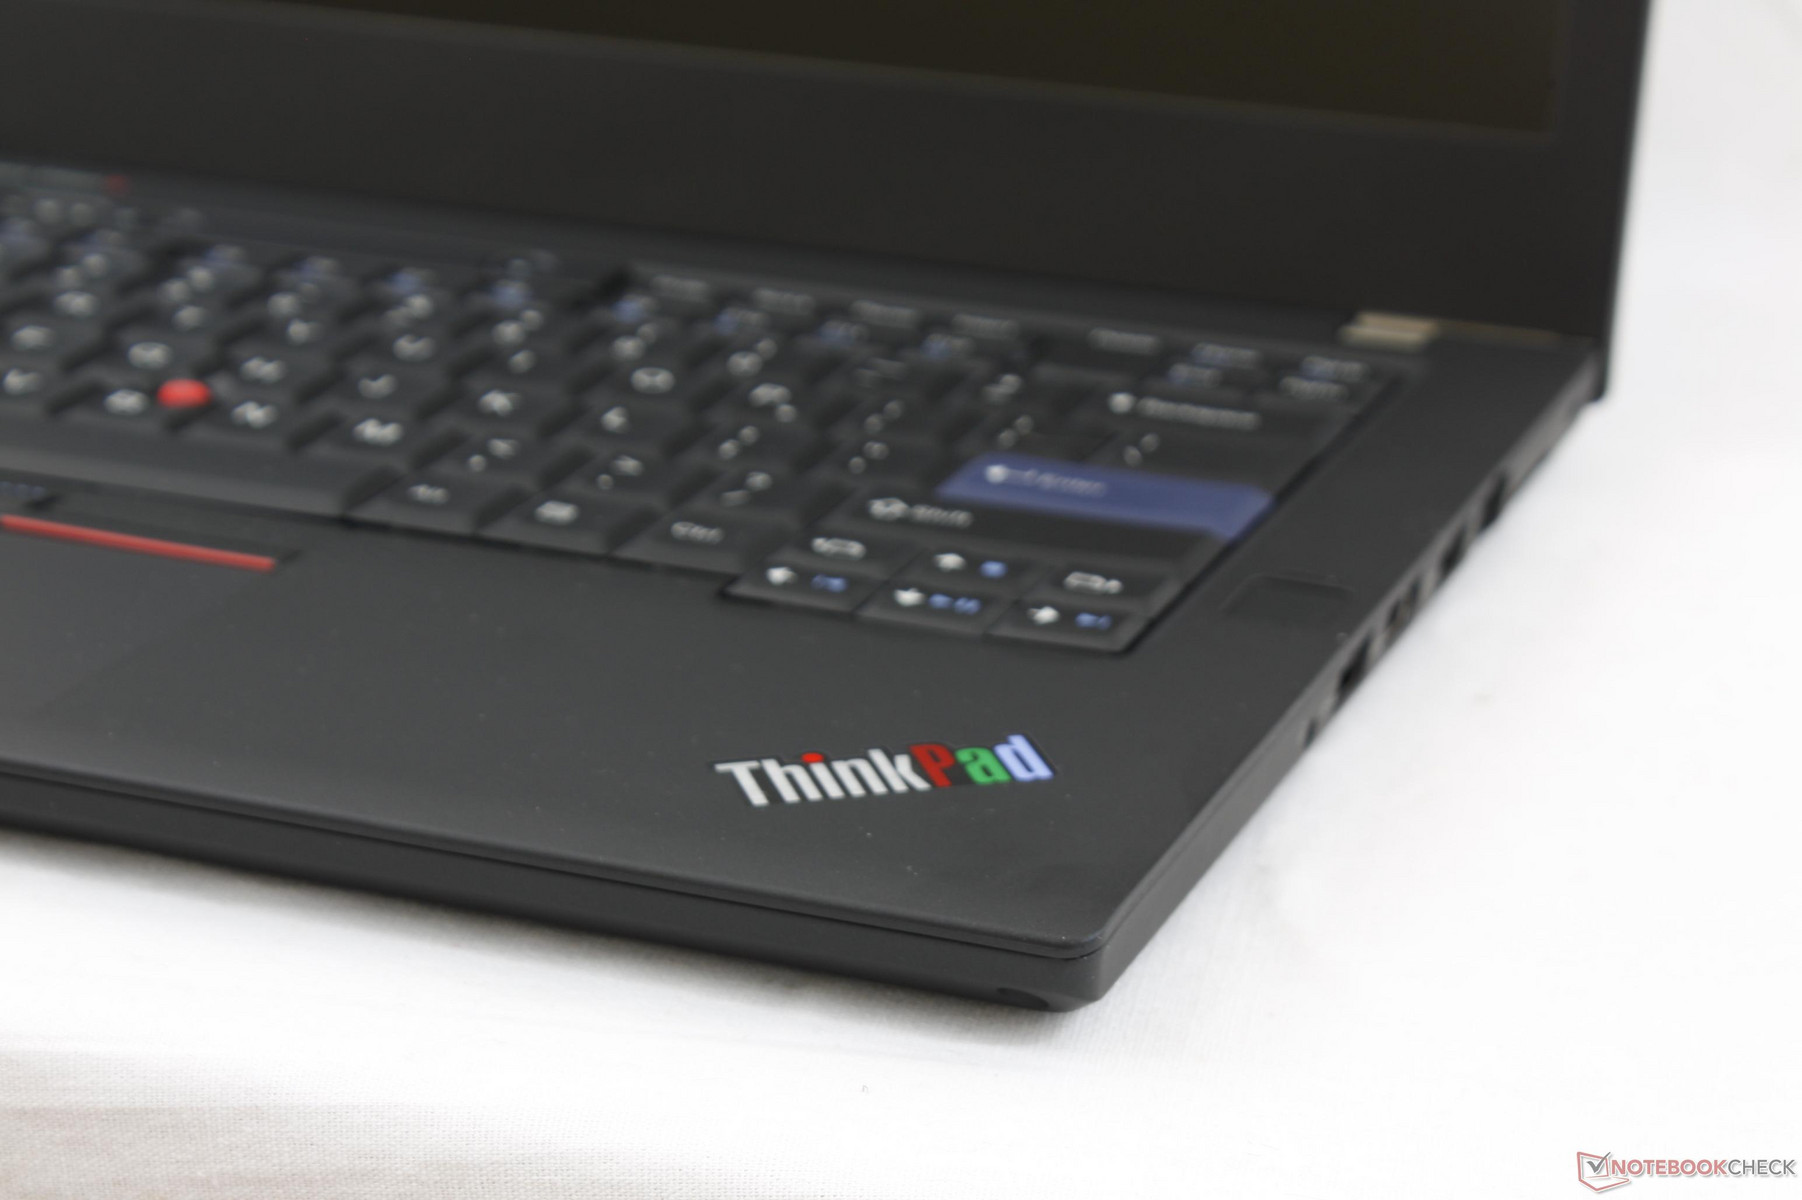
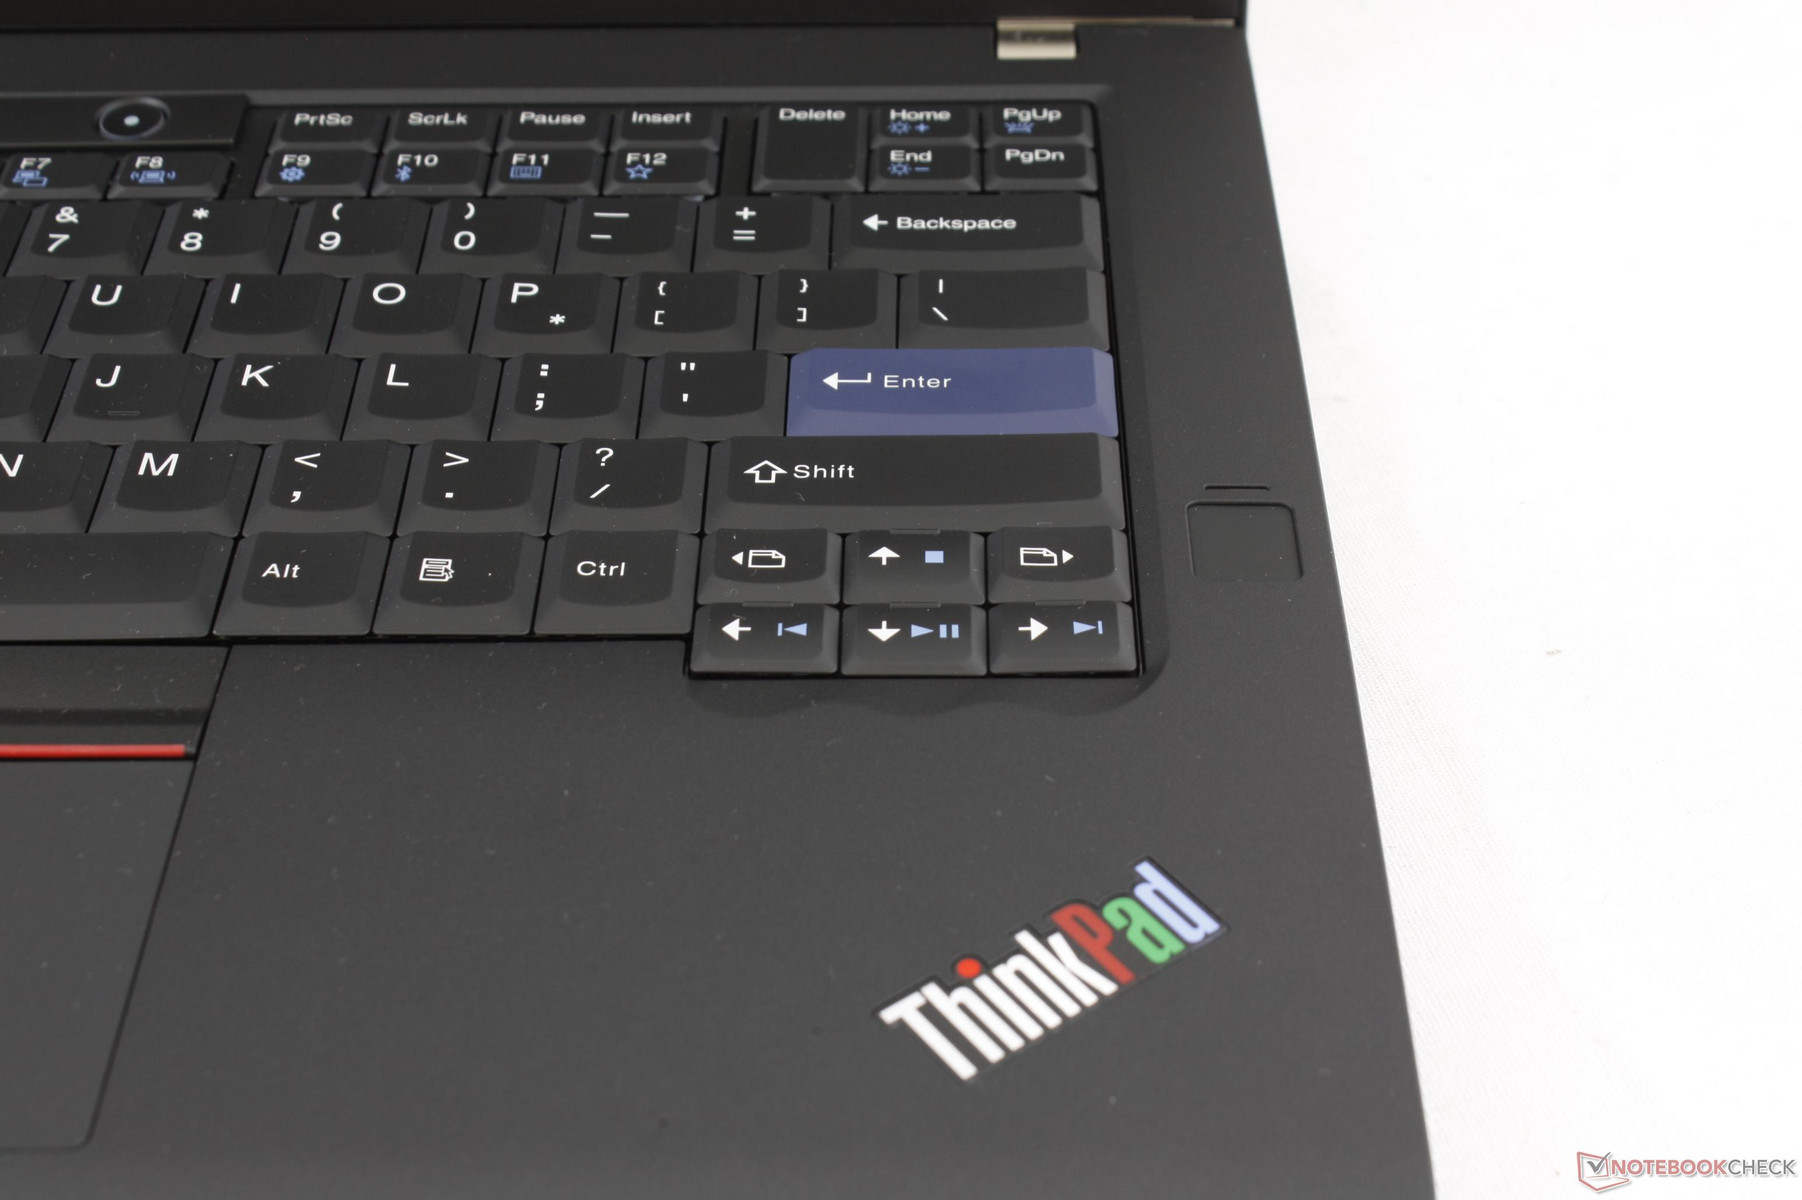
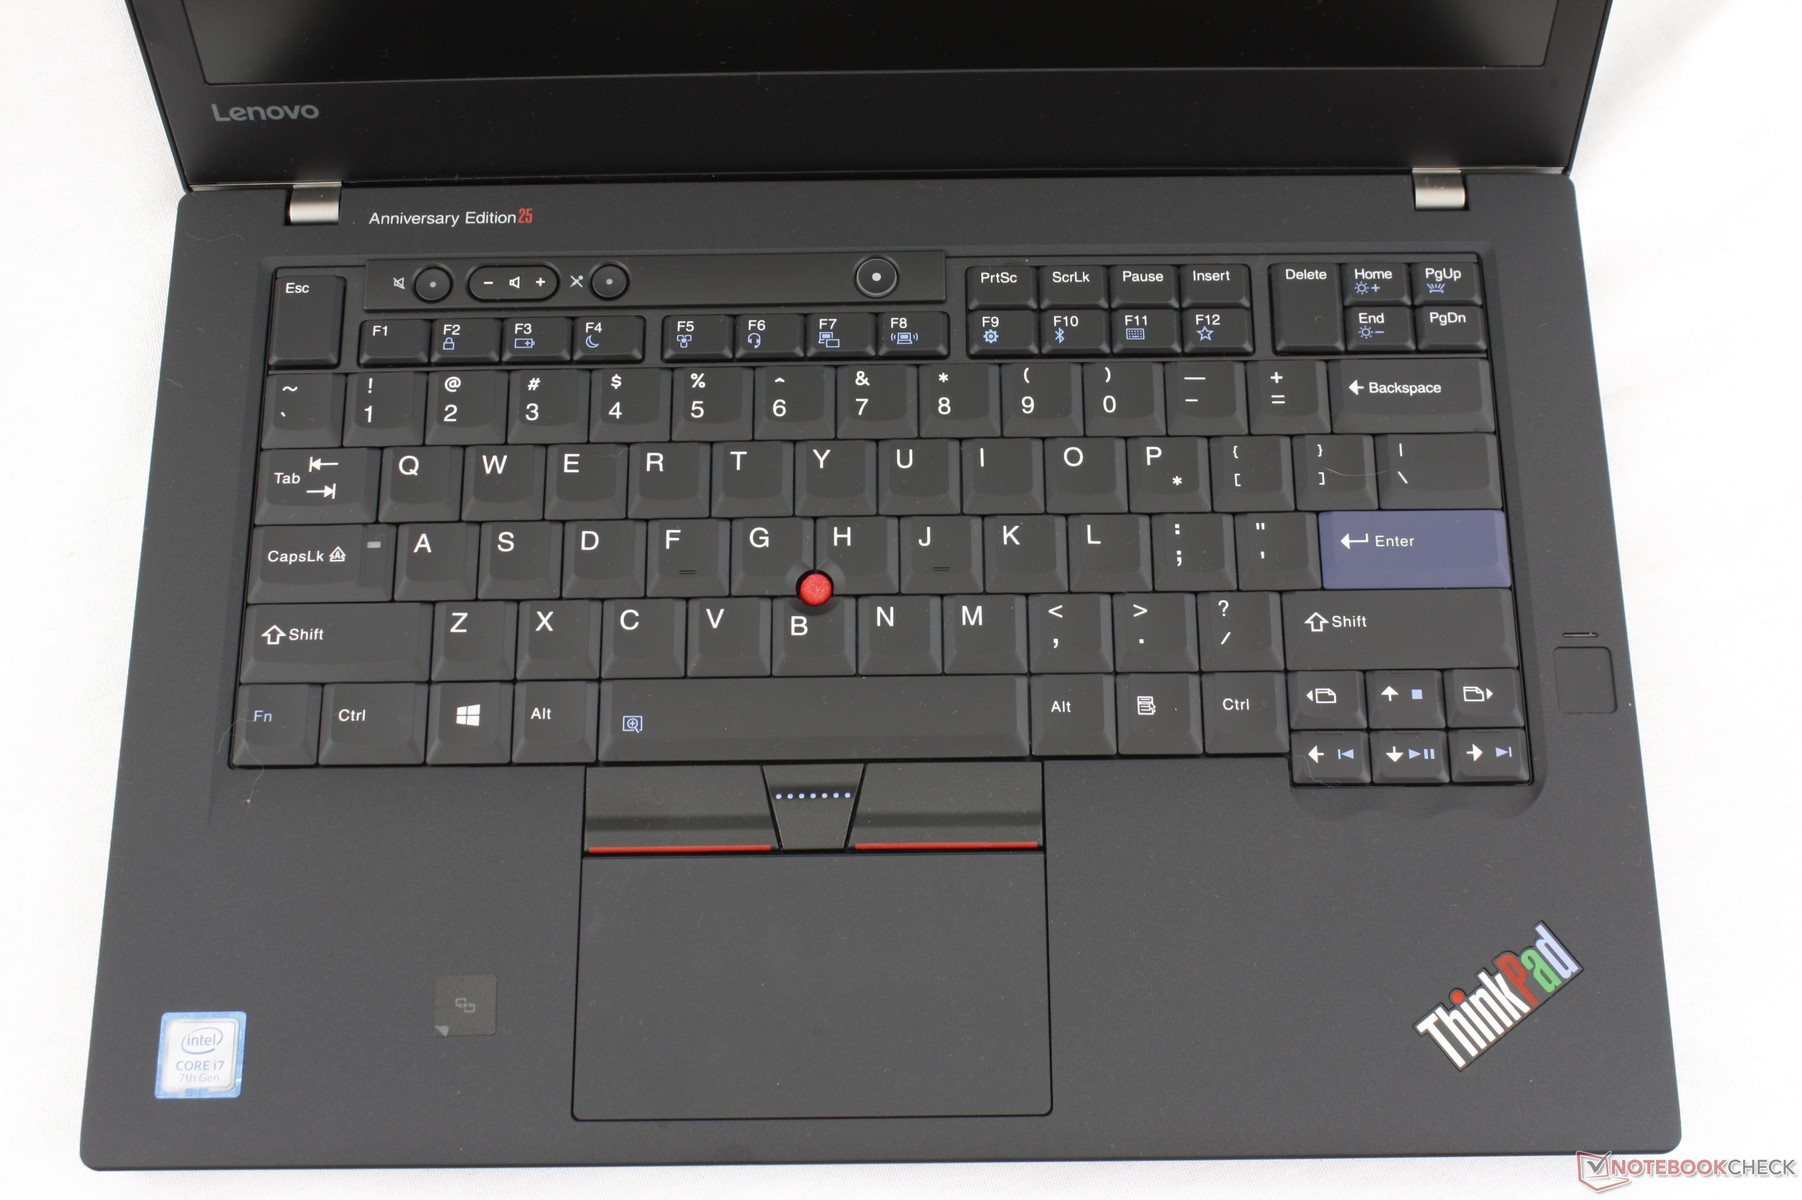
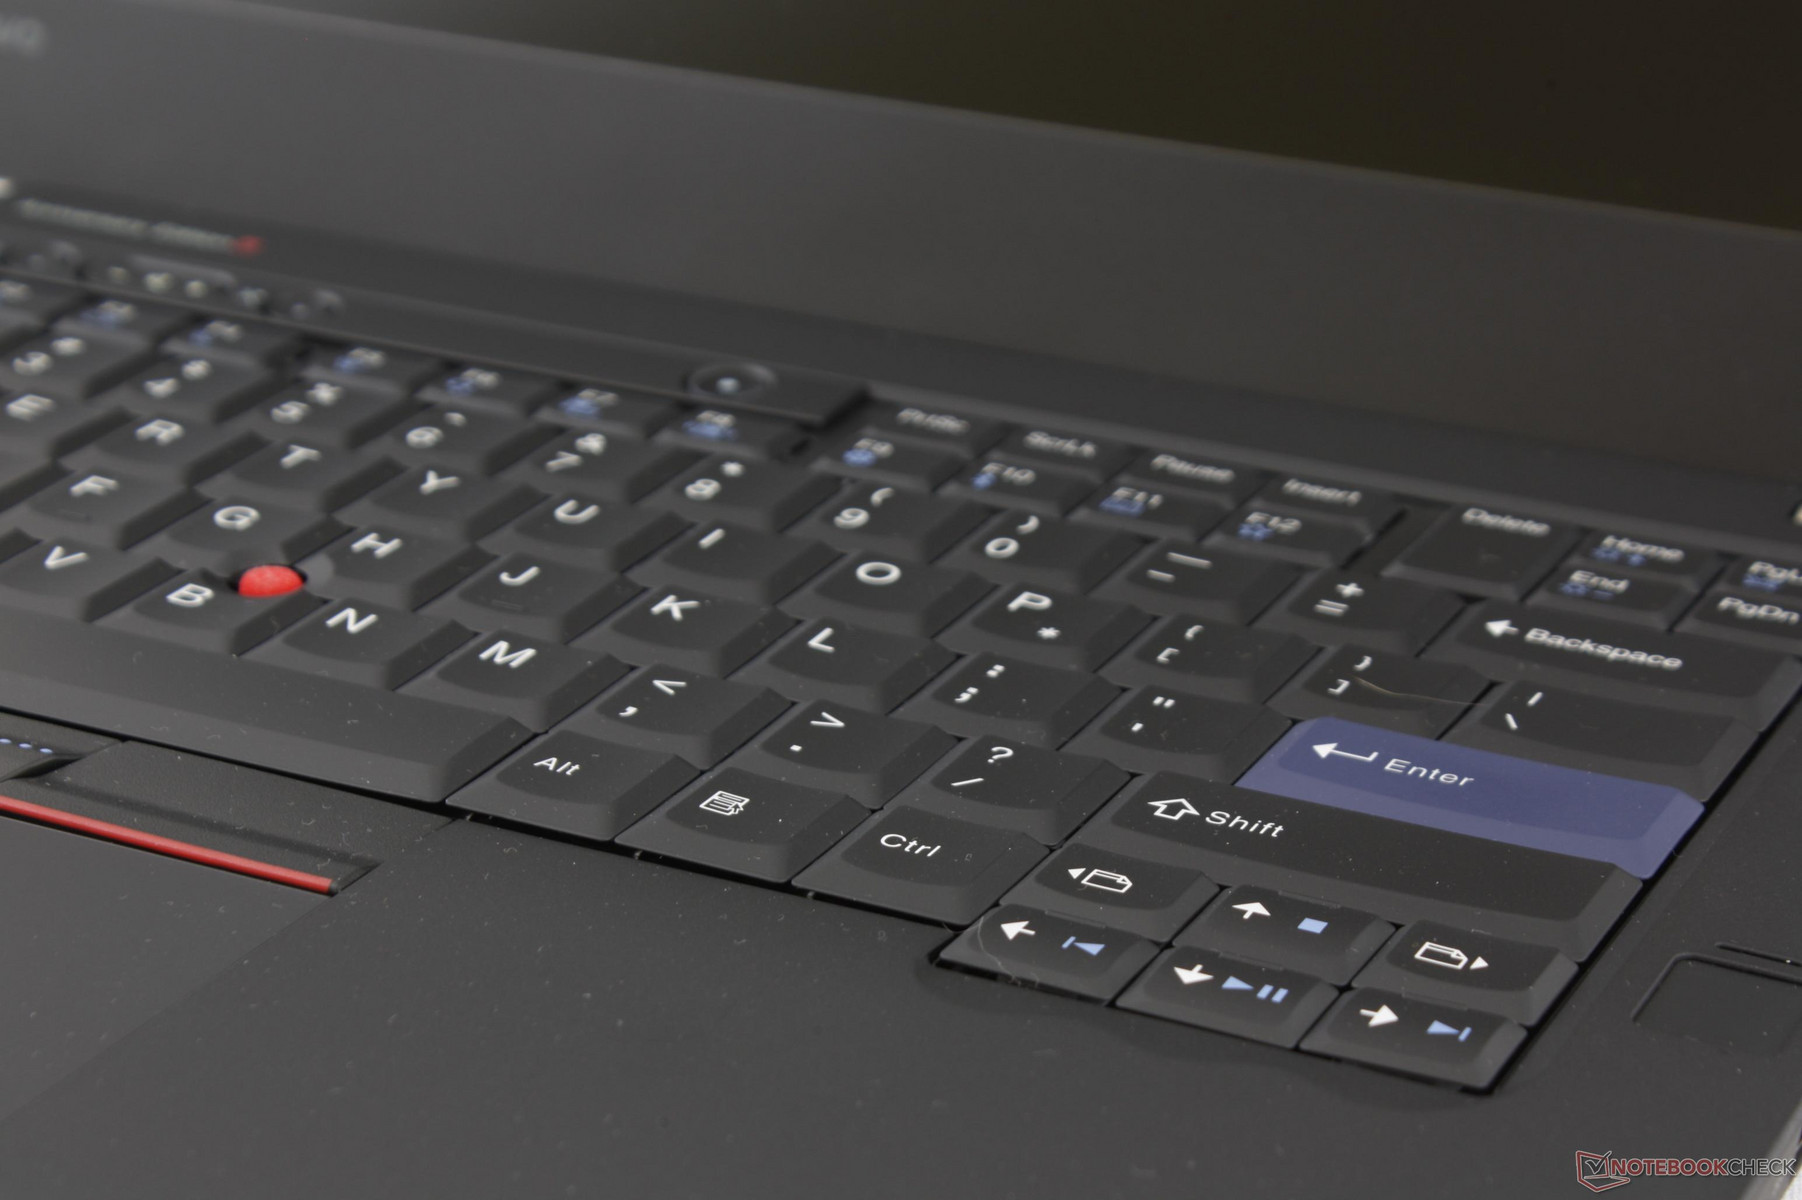
The classic 7-row keyboard layout is the major selling point of this anniversary model. Should Lenovo completely miss the ball on this retro keyboard, then the entire purpose of the ThinkPad 25 would have been moot. Thankfully, we can comfortably say that the keyboard works wonderfully and feels great to use. Feedback is tight and dare we say firmer than on the newer AccuType keyboards on modern ThinkPads. The enlarged Esc and Delete keys are also a boon since they are easier to reach and not as soft as on the T470. It definitely feels like the keyboard on the 6-year old T420 in the best way possible.
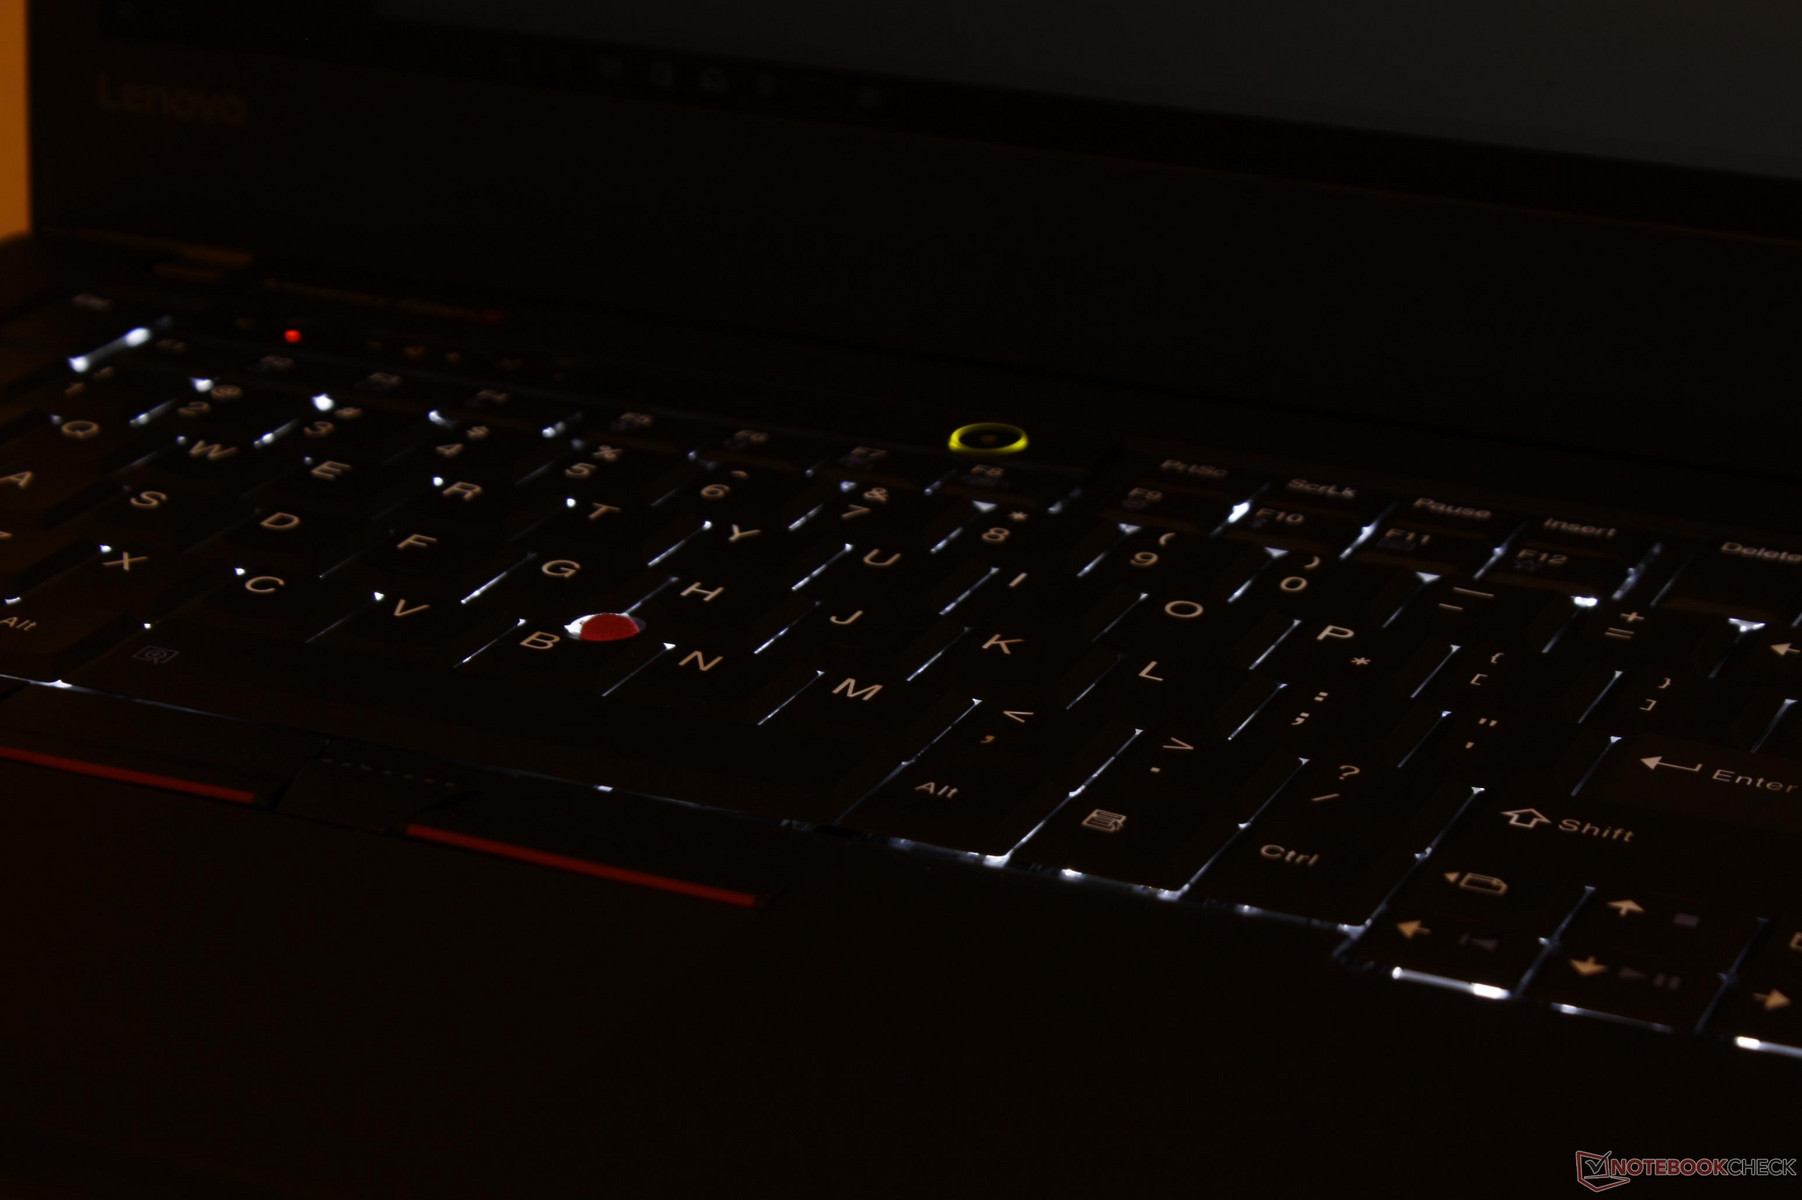
The main drawback is that the smaller Function keys, Volume keys, and Arrow keys are softer in feedback than the larger QWERTY keys. Clatter is definitely louder compared to the AccuType layout as well, though this is the price to pay for a firmer stroke. Additionally, the beveled style can feel more cramped since there is no space separating each key unlike on the more popular chiclet style. Finally, any ThinkLight fans will be upset to know that the feature has been omitted in favor of the modern keyboard backlight.
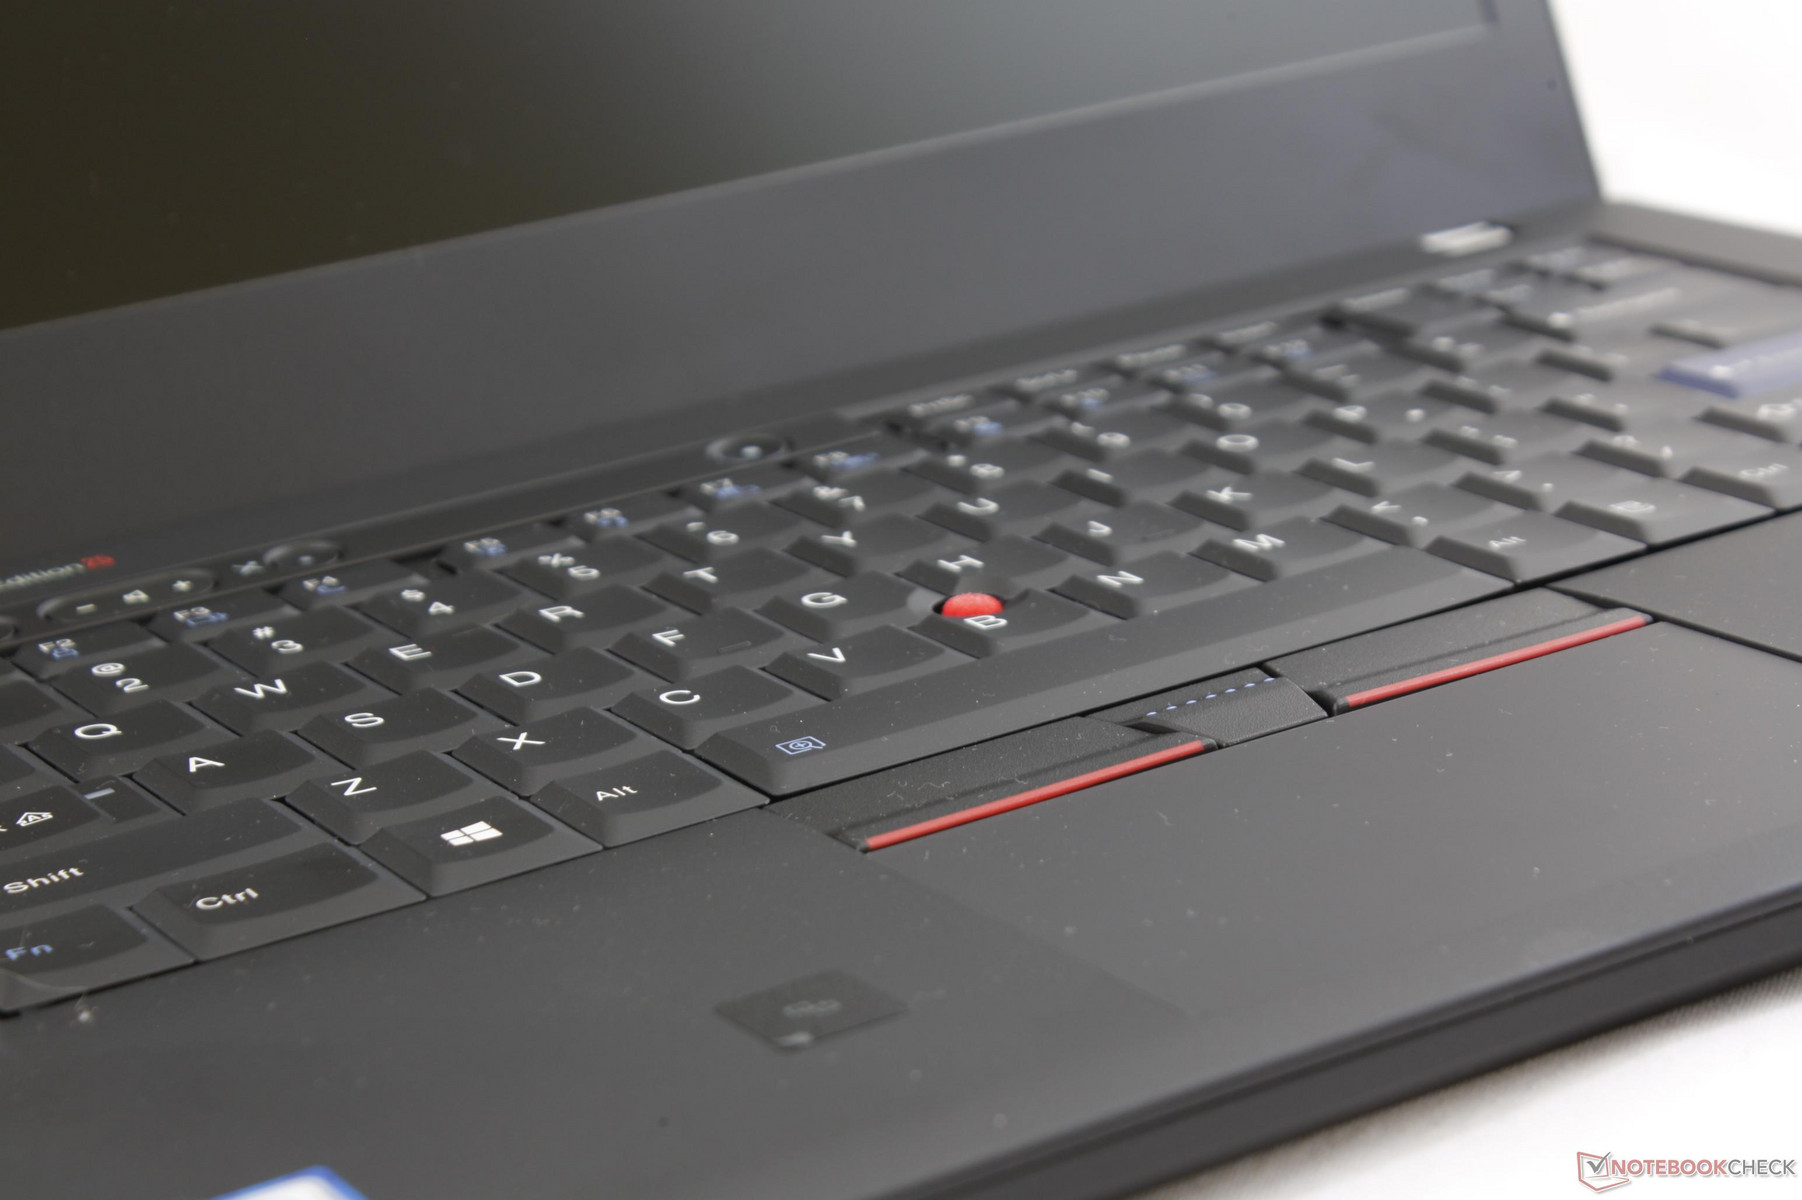
Touchpad
The Precision Trackpad on the ThinkPad 25 is actually slightly shorter than on the T470 (10.0 x 5.5 cm vs. 10.0 x 7.0 cm) because the chassis must accommodate for the slightly taller keyboard. Its surface is lightly rubberized in texture and is smaller in area than the ones on the XPS 15 (10.5 x 8.5 cm) and ProBook 440 (11.0 cm x 6.5 cm) due to its large dedicated mouse keys. While cursor control is smooth and without issues, clicking on the trackpad or mouse keys feels very spongy and without much feedback in contrast to what we experienced on the T470. Clatter is very soft and quiet as a result, but firmer feedback would have been appreciated.
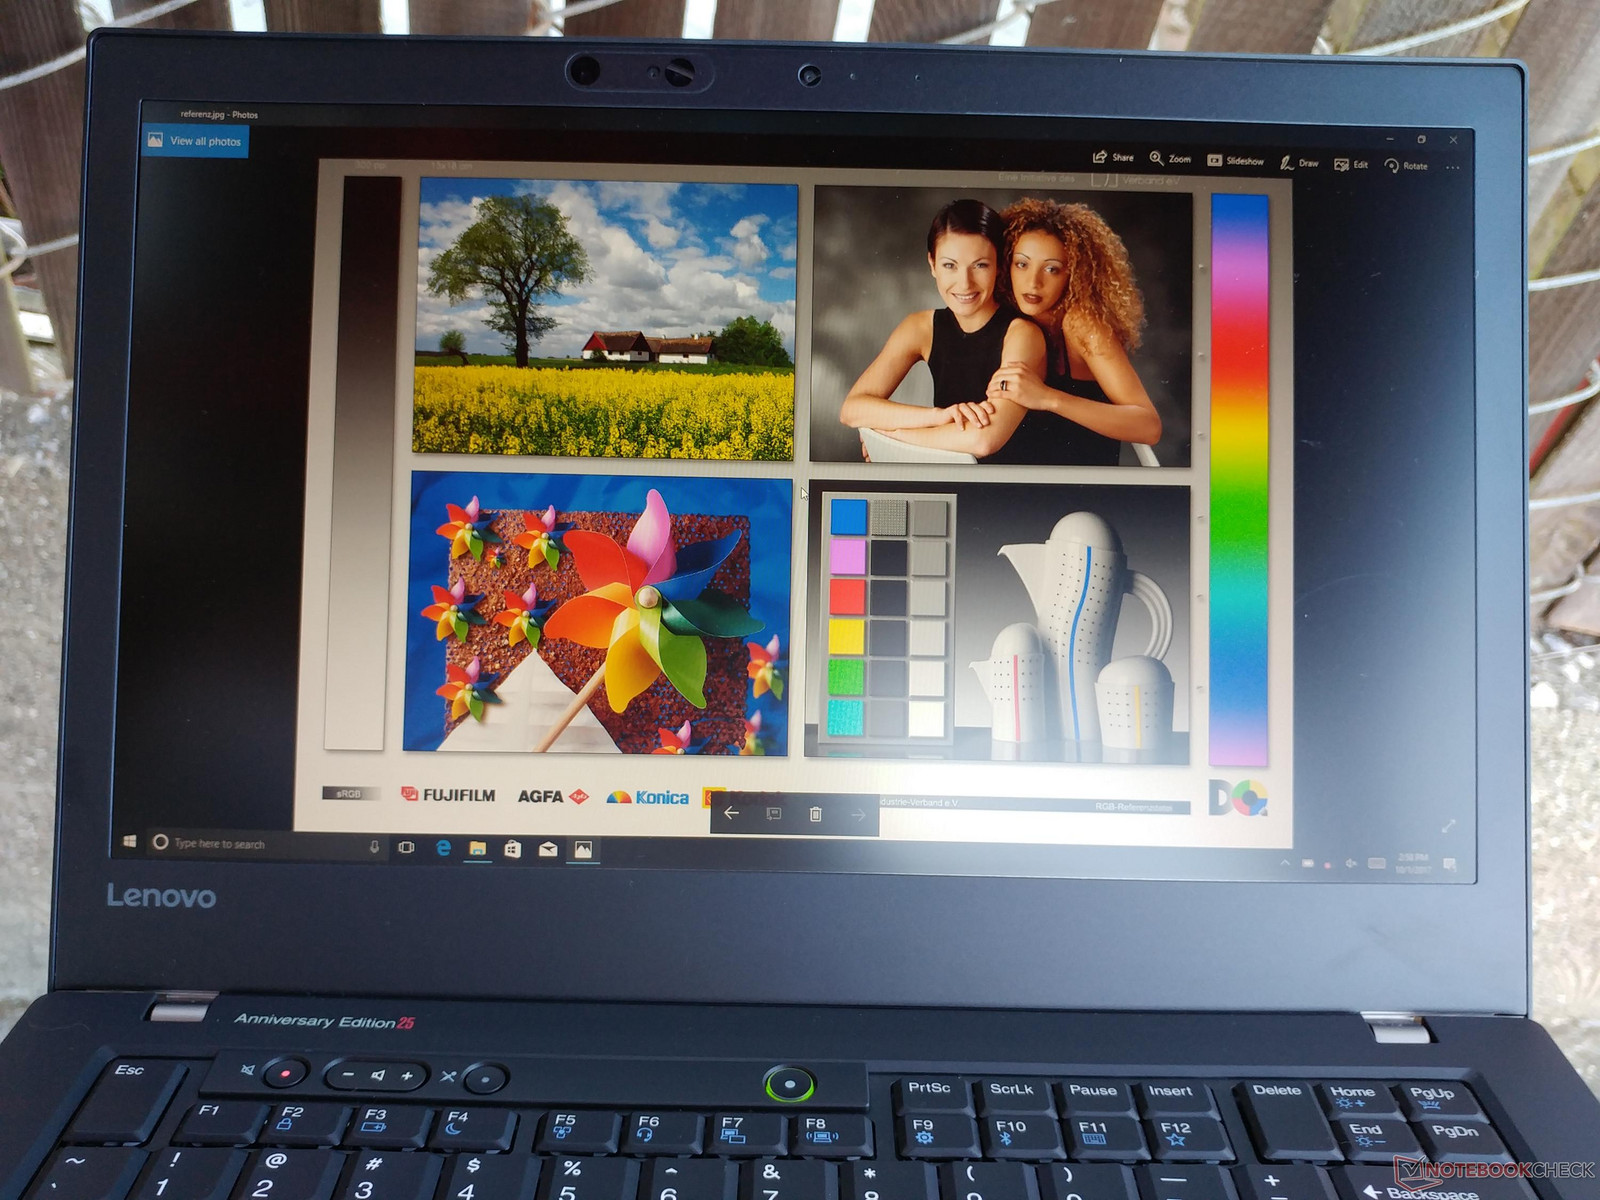
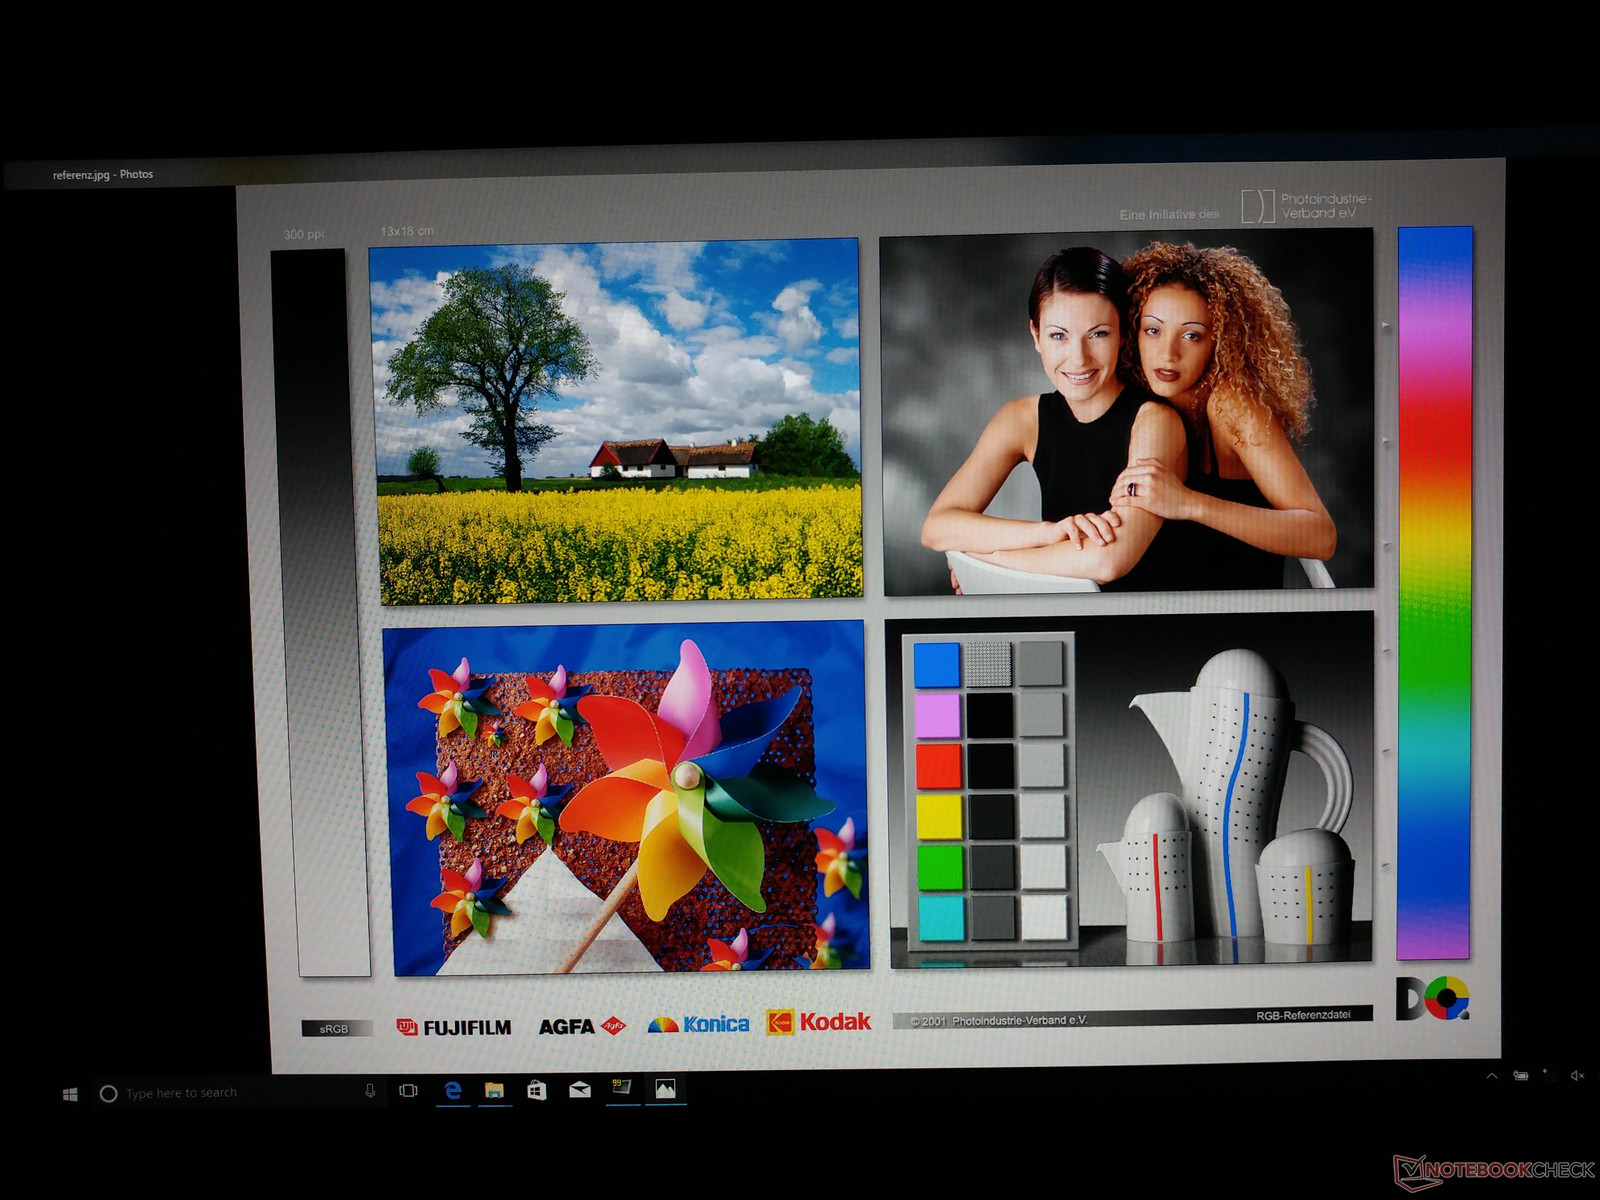
Display
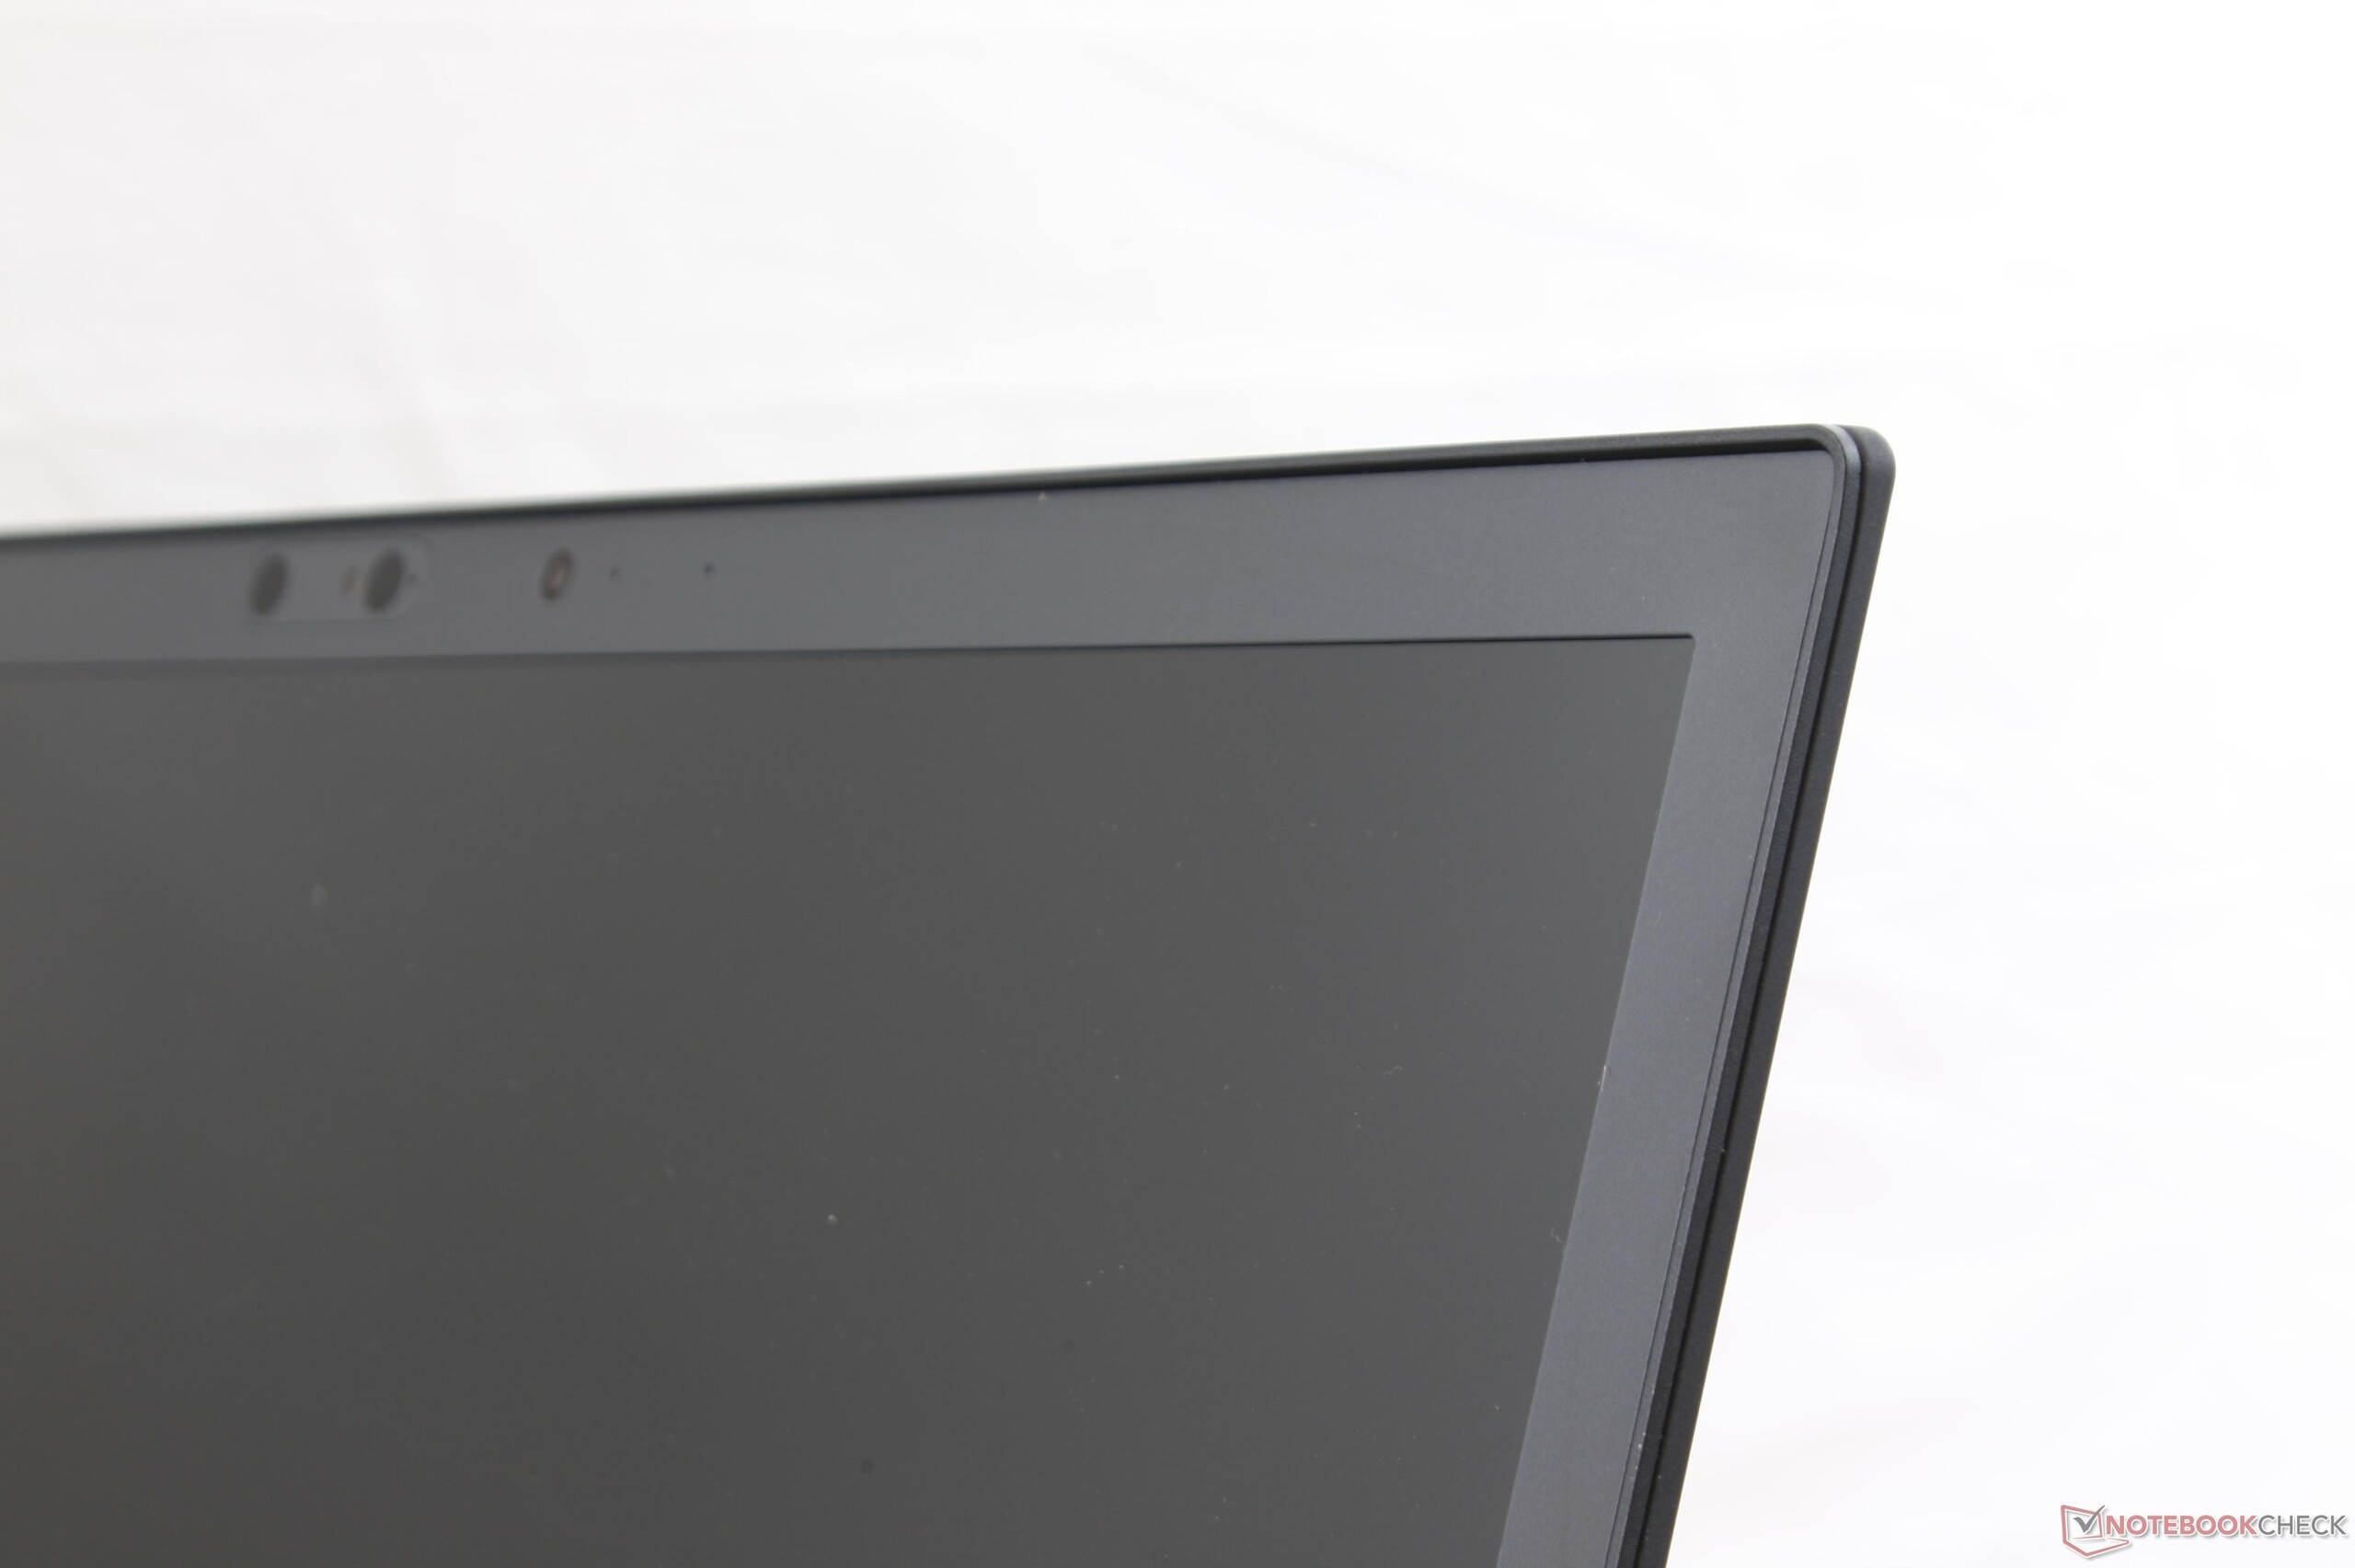
The system utilizes the exact same LEN40A9 IPS matte touchscreen as the one found on our T470s and thus provides a nearly identical viewing experience. Contrast, colors, and response times are also quite similar between them. One notable difference, however, could be the display backlight of the ThinkPad 25. Average brightness is dimmer at about 227 nits on our unit compared to 264 nits and 287 nits on the T470s and T470, respectively, even after double-checking. Additionally, pulse-width modulation is now present on all brightness levels up to 99 percent whereas it was absent on our T470 unit. We're not exactly sure why this difference exists between the ThinkPad 25 and T470, but users sensitive to onscreen flickering may want to avoid the ThinkPad 25 and just opt for the T470 instead.
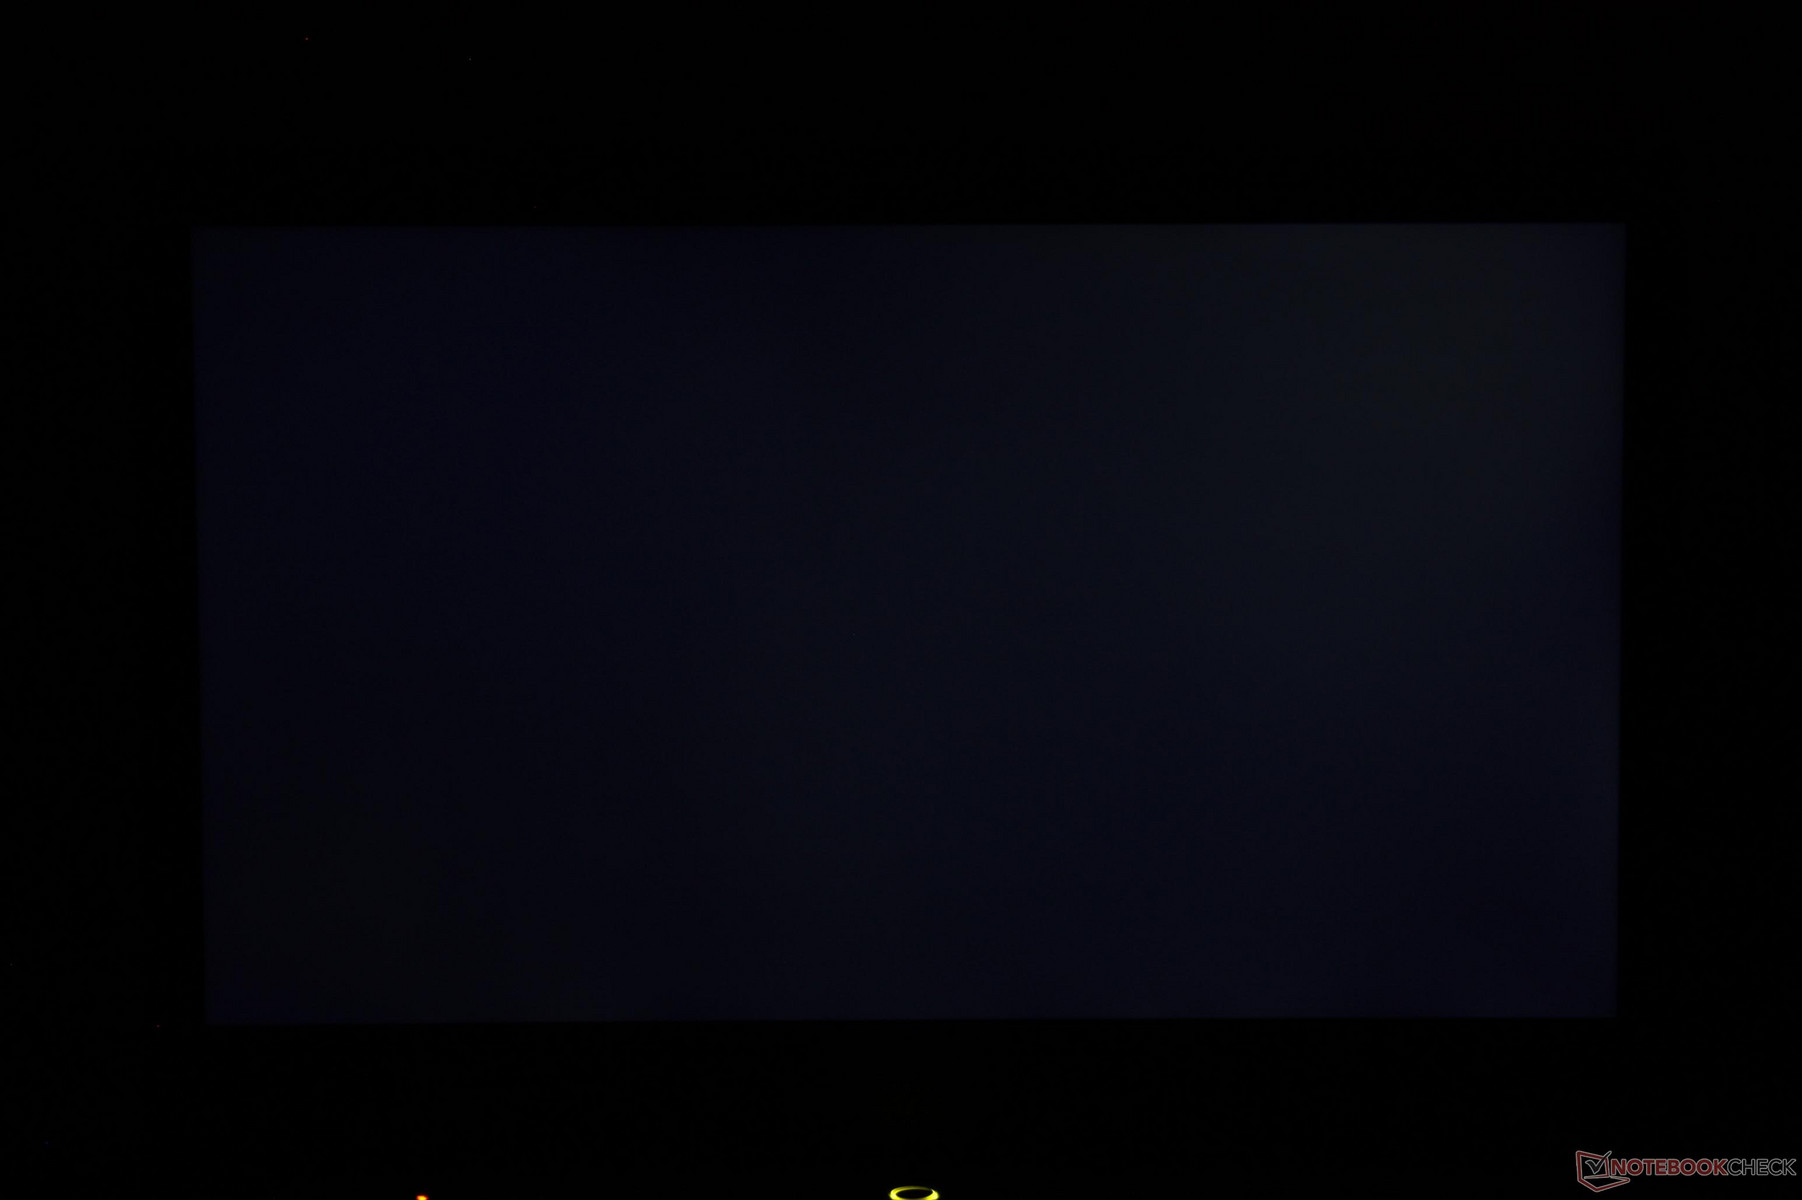
Subjectively, the 1080p screen is crisp and without any distracting color grains that are common on most matte panels versus those with glossy overlays. On the flip side, the lack of any glass protection makes the display feel more fragile for touchscreen use. Very slight backlight bleeding is present near the top and bottom edges that is essentially unnoticeable in practice.

| |||||||||||||||||||||||||
Brightness Distribution: 84 %
Center on Battery: 240.1 cd/m²
Contrast: 1091:1 (Black: 0.22 cd/m²)
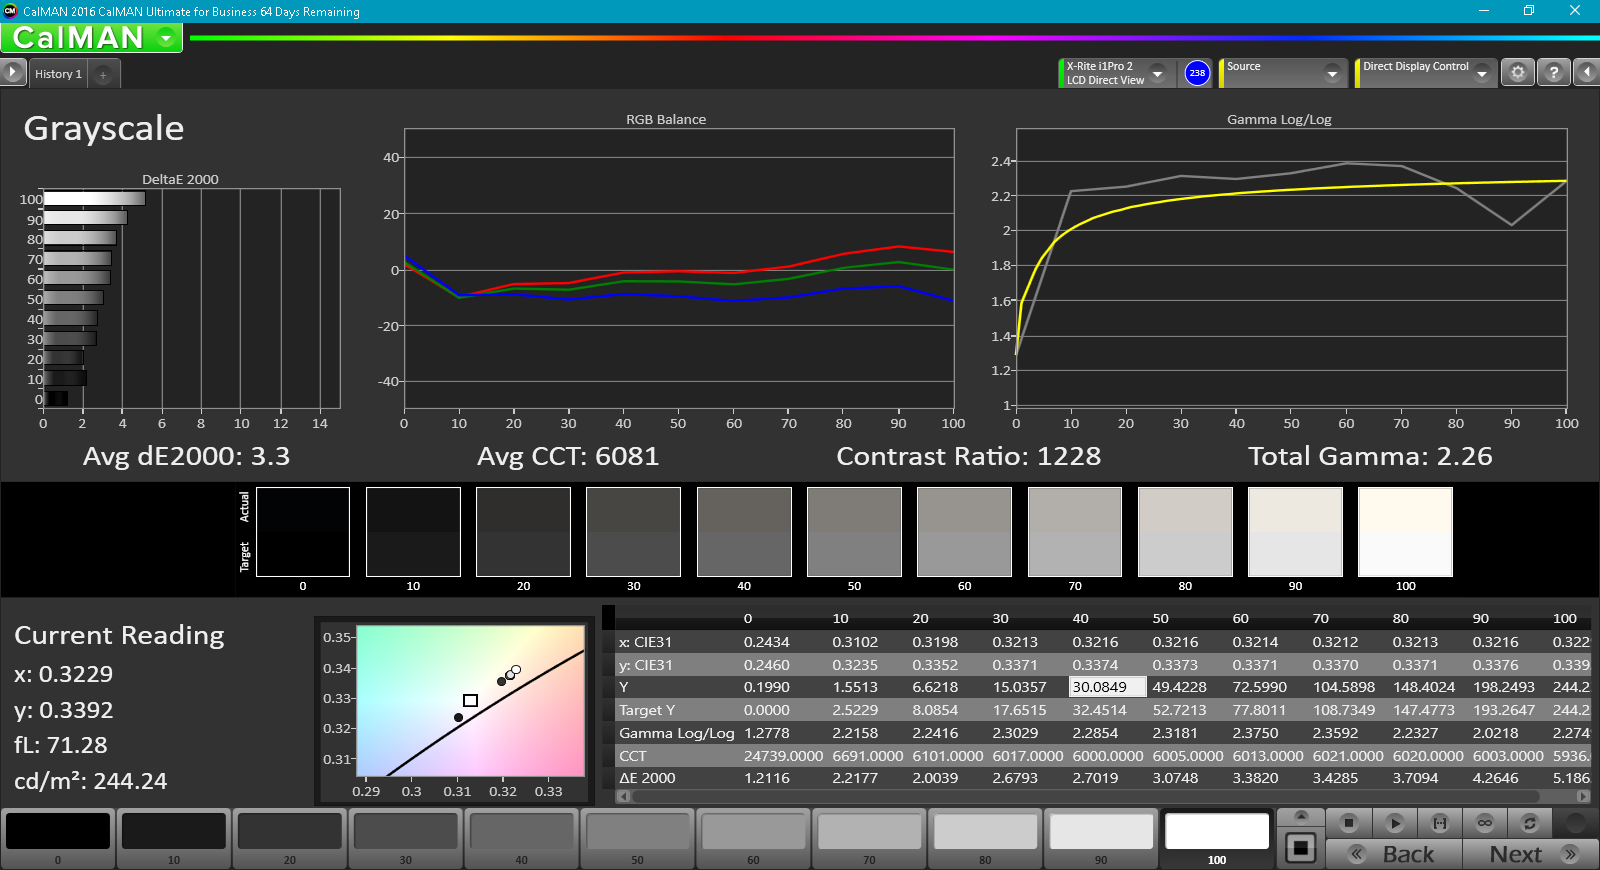
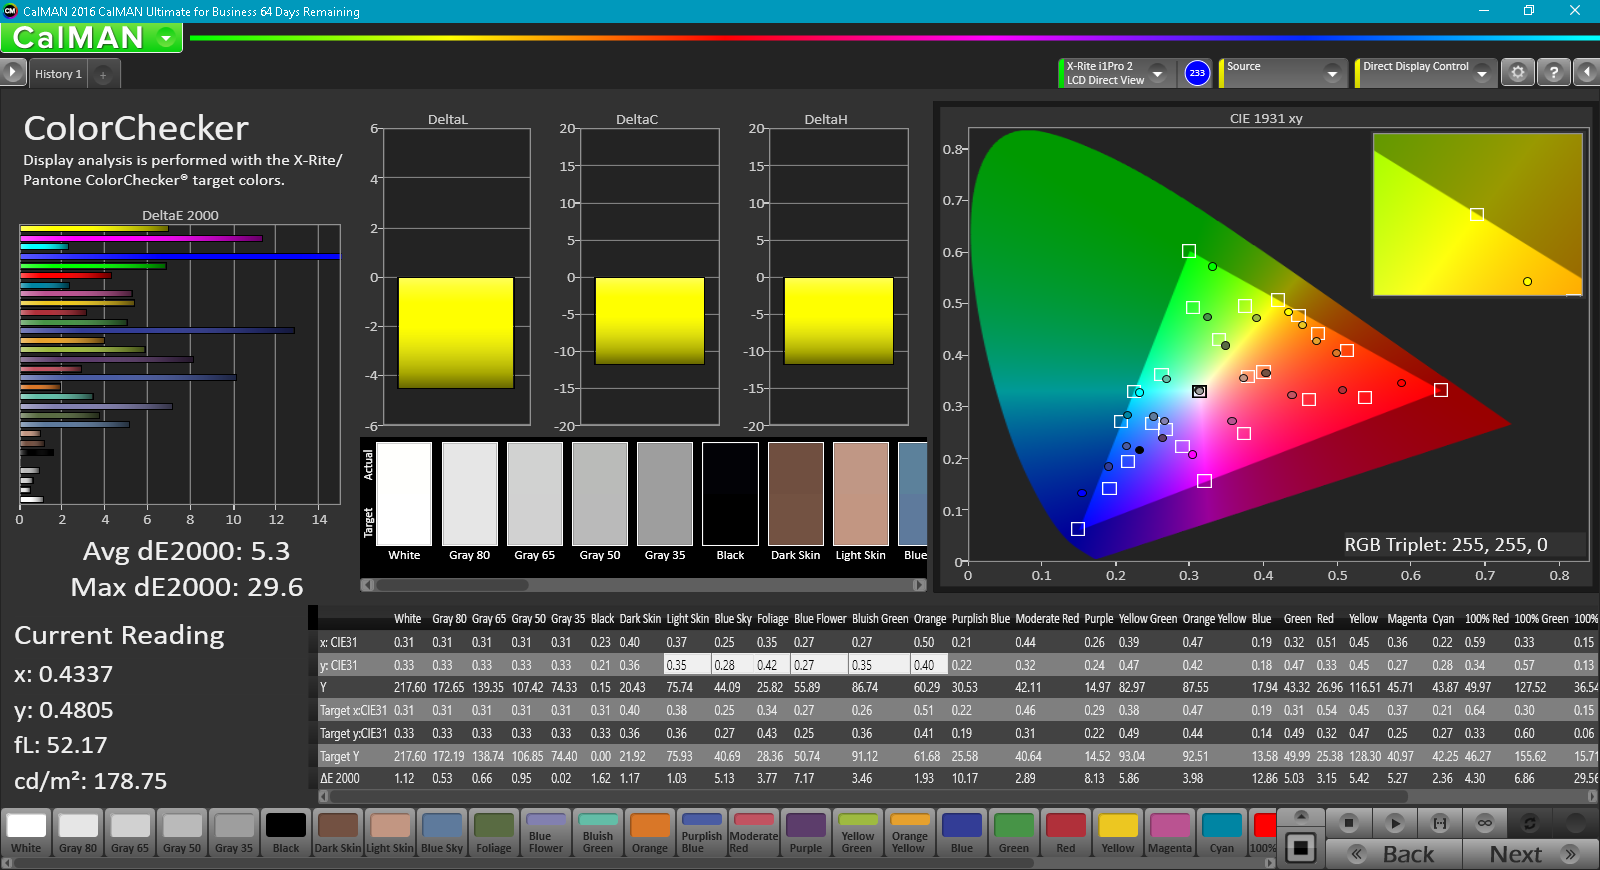
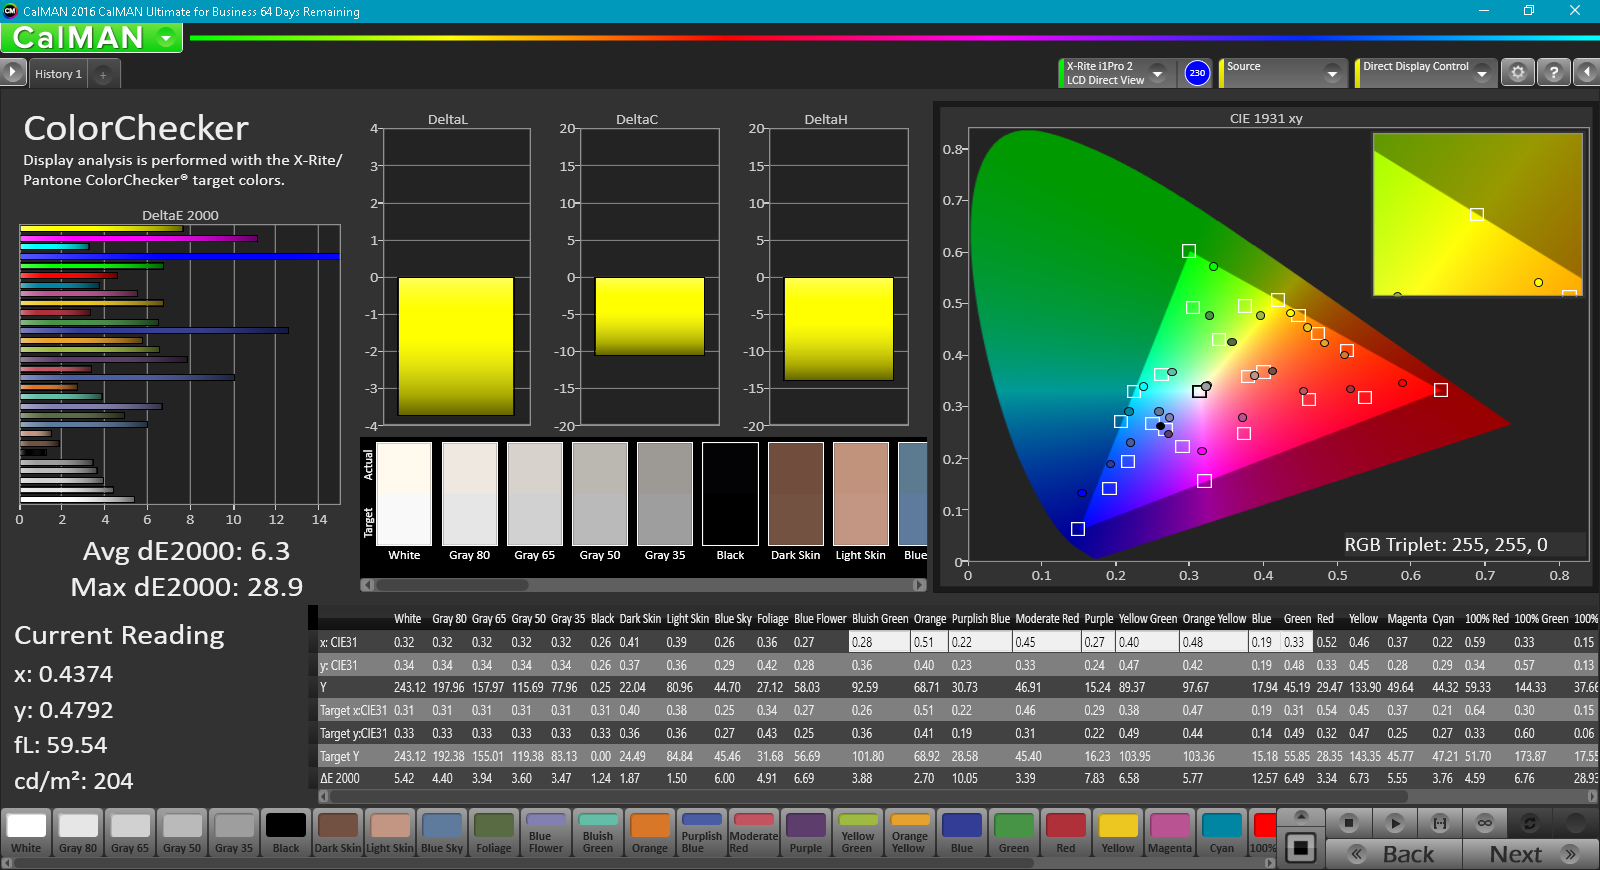
ΔE ColorChecker Calman: 6.3 | ∀{0.5-29.43 Ø4.71}
ΔE Greyscale Calman: 3.3 | ∀{0.09-98 Ø4.96}
63% sRGB (Argyll 1.6.3 3D)
40.6% AdobeRGB 1998 (Argyll 1.6.3 3D)
44.07% AdobeRGB 1998 (Argyll 3D)
63.3% sRGB (Argyll 3D)
42.57% Display P3 (Argyll 3D)
Gamma: 2.26
CCT: 6081 K
| Lenovo ThinkPad 25 ID: LEN40A9, Name: R140NWF5 R1, IPS, 14", 1920x1080 | Lenovo ThinkPad T470s-20HF0012US LEN40A9 (R140NWF5 R1), IPS, 14", 1920x1080 | Lenovo ThinkPad T470-20HD002HGE N140HCA-EAB, IPS, 14", 1920x1080 | Lenovo ThinkPad T470p-20J7S00000 LEN40AA, B140QAN01.5, IPS, 14", 2560x1440 | Apple MacBook Pro 13 2017 APPA033, IPS, 13.3", 2560x1600 | Samsung Notebook 9 NP900X5N-X01US ID: BOE06E8, Name: BOE HF NV150FHB-N31, IPS, 15", 1920x1080 | |
|---|---|---|---|---|---|---|
| Display | -5% | -2% | 57% | 96% | 53% | |
| Display P3 Coverage (%) | 42.57 | 40.35 -5% | 41.6 -2% | 69.3 63% | 99.2 133% | 65.2 53% |
| sRGB Coverage (%) | 63.3 | 60.3 -5% | 61.9 -2% | 94.9 50% | 99.9 58% | 97.7 54% |
| AdobeRGB 1998 Coverage (%) | 44.07 | 41.72 -5% | 43.06 -2% | 69.5 58% | 87.1 98% | 67.2 52% |
| Response Times | 17% | 10% | 7% | 15% | 13% | |
| Response Time Grey 50% / Grey 80% * (ms) | 45.6 ? | 40.8 ? 11% | 41.6 ? 9% | 52.8 ? -16% | 42.8 ? 6% | 40.8 ? 11% |
| Response Time Black / White * (ms) | 37.6 ? | 28.8 ? 23% | 34 ? 10% | 26.8 ? 29% | 28.8 ? 23% | 32.4 ? 14% |
| PWM Frequency (Hz) | 1000 ? | 219.3 ? | 208.3 ? | |||
| Screen | 2% | -1% | -1% | 57% | 44% | |
| Brightness middle (cd/m²) | 240.1 | 271.6 13% | 306 27% | 271 13% | 588 145% | 565.6 136% |
| Brightness (cd/m²) | 227 | 264 16% | 287 26% | 266 17% | 561 147% | 524 131% |
| Brightness Distribution (%) | 84 | 88 5% | 88 5% | 87 4% | 92 10% | 88 5% |
| Black Level * (cd/m²) | 0.22 | 0.24 -9% | 0.3 -36% | 0.25 -14% | 0.45 -105% | 0.49 -123% |
| Contrast (:1) | 1091 | 1132 4% | 1020 -7% | 1084 -1% | 1307 20% | 1154 6% |
| Colorchecker dE 2000 * | 6.3 | 6.1 3% | 6.2 2% | 6.68 -6% | 1.7 73% | 2 68% |
| Colorchecker dE 2000 max. * | 28.9 | 28.6 1% | 13.6 53% | 12.96 55% | 3.5 88% | 5 83% |
| Greyscale dE 2000 * | 3.3 | 3.4 -3% | 5.8 -76% | 9.21 -179% | 1.9 42% | 2.5 24% |
| Gamma | 2.26 97% | 2.12 104% | 2.04 108% | 2.42 91% | 2.33 94% | 2.21 100% |
| CCT | 6081 107% | 6077 107% | 6277 104% | 6018 108% | 6738 96% | 6896 94% |
| Color Space (Percent of AdobeRGB 1998) (%) | 40.6 | 38 -6% | 39.62 -2% | 61.49 51% | 77.92 92% | 61.2 51% |
| Color Space (Percent of sRGB) (%) | 63 | 60 -5% | 61.44 -2% | 94.72 50% | 99.94 59% | 97.5 55% |
| Total Average (Program / Settings) | 5% /
3% | 2% /
0% | 21% /
12% | 56% /
59% | 37% /
41% |
* ... smaller is better
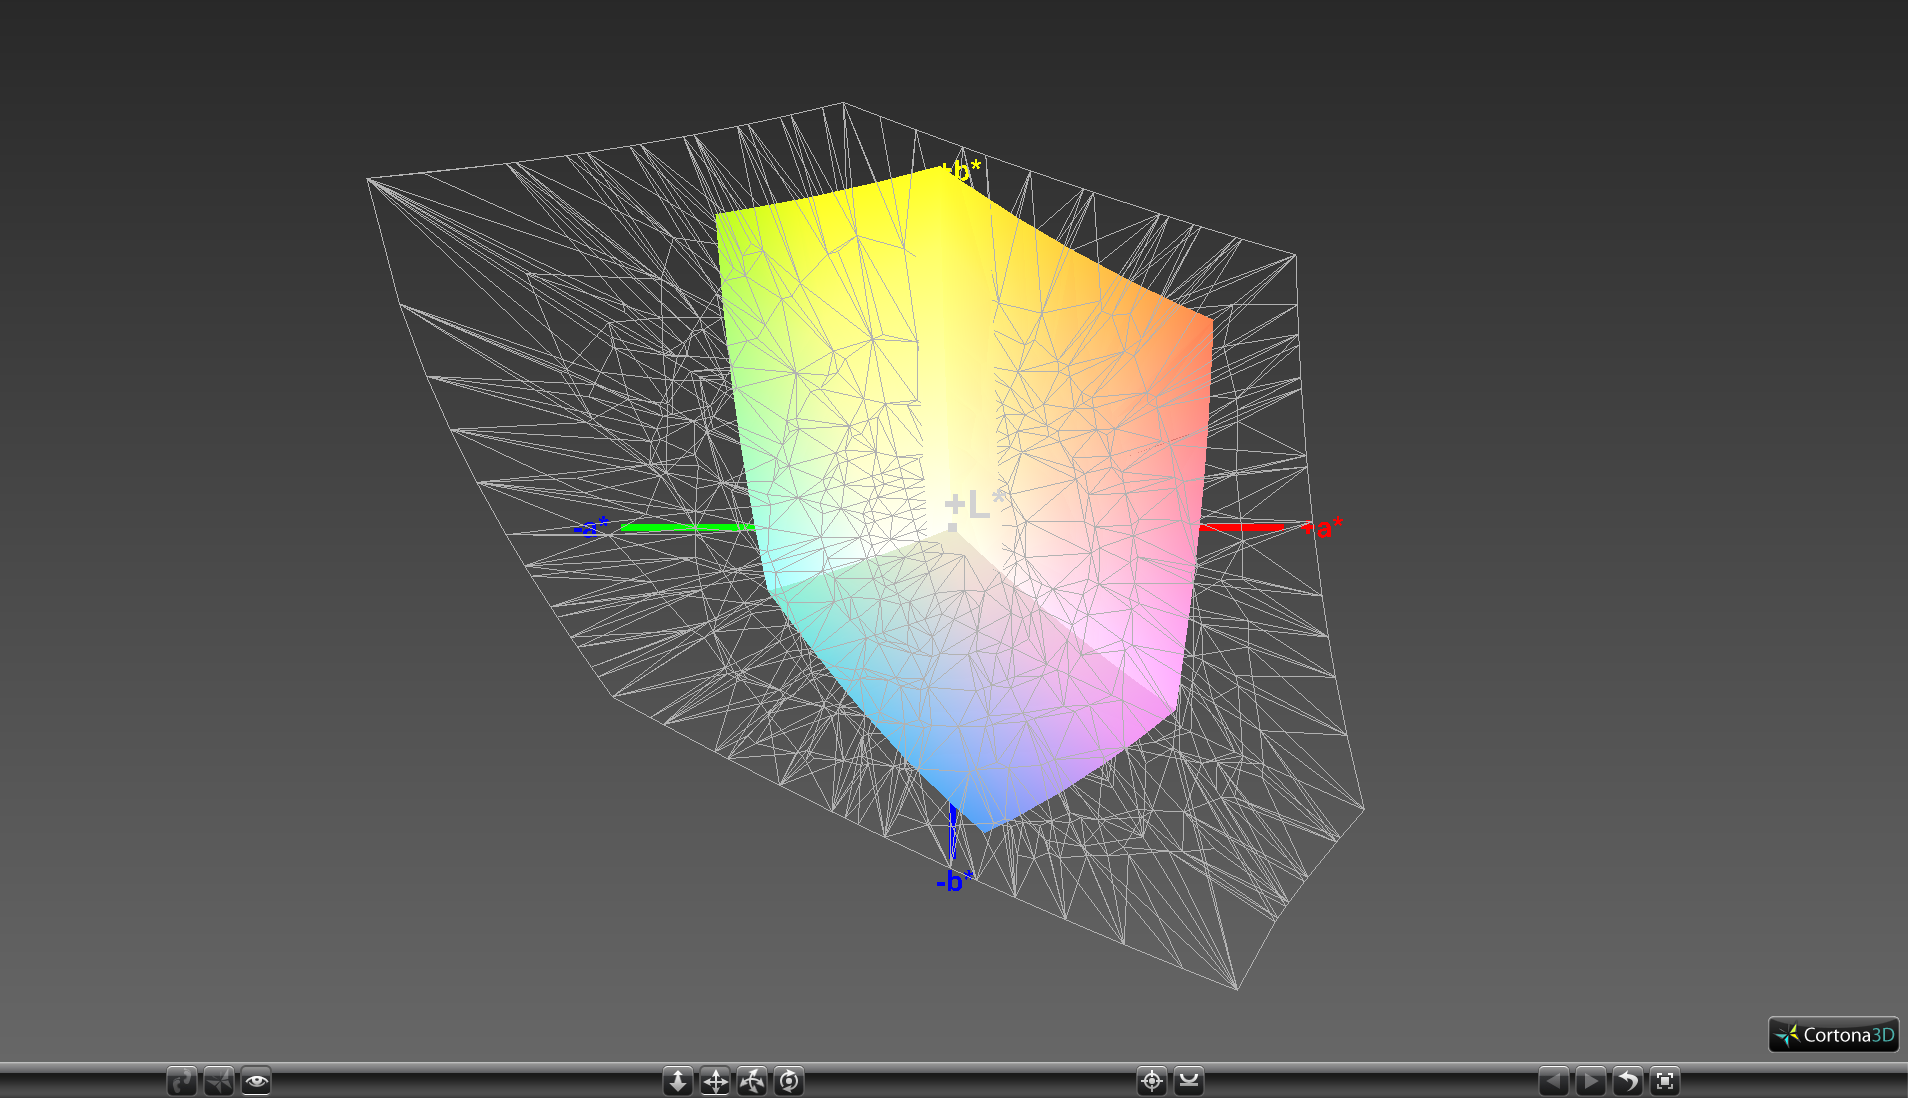
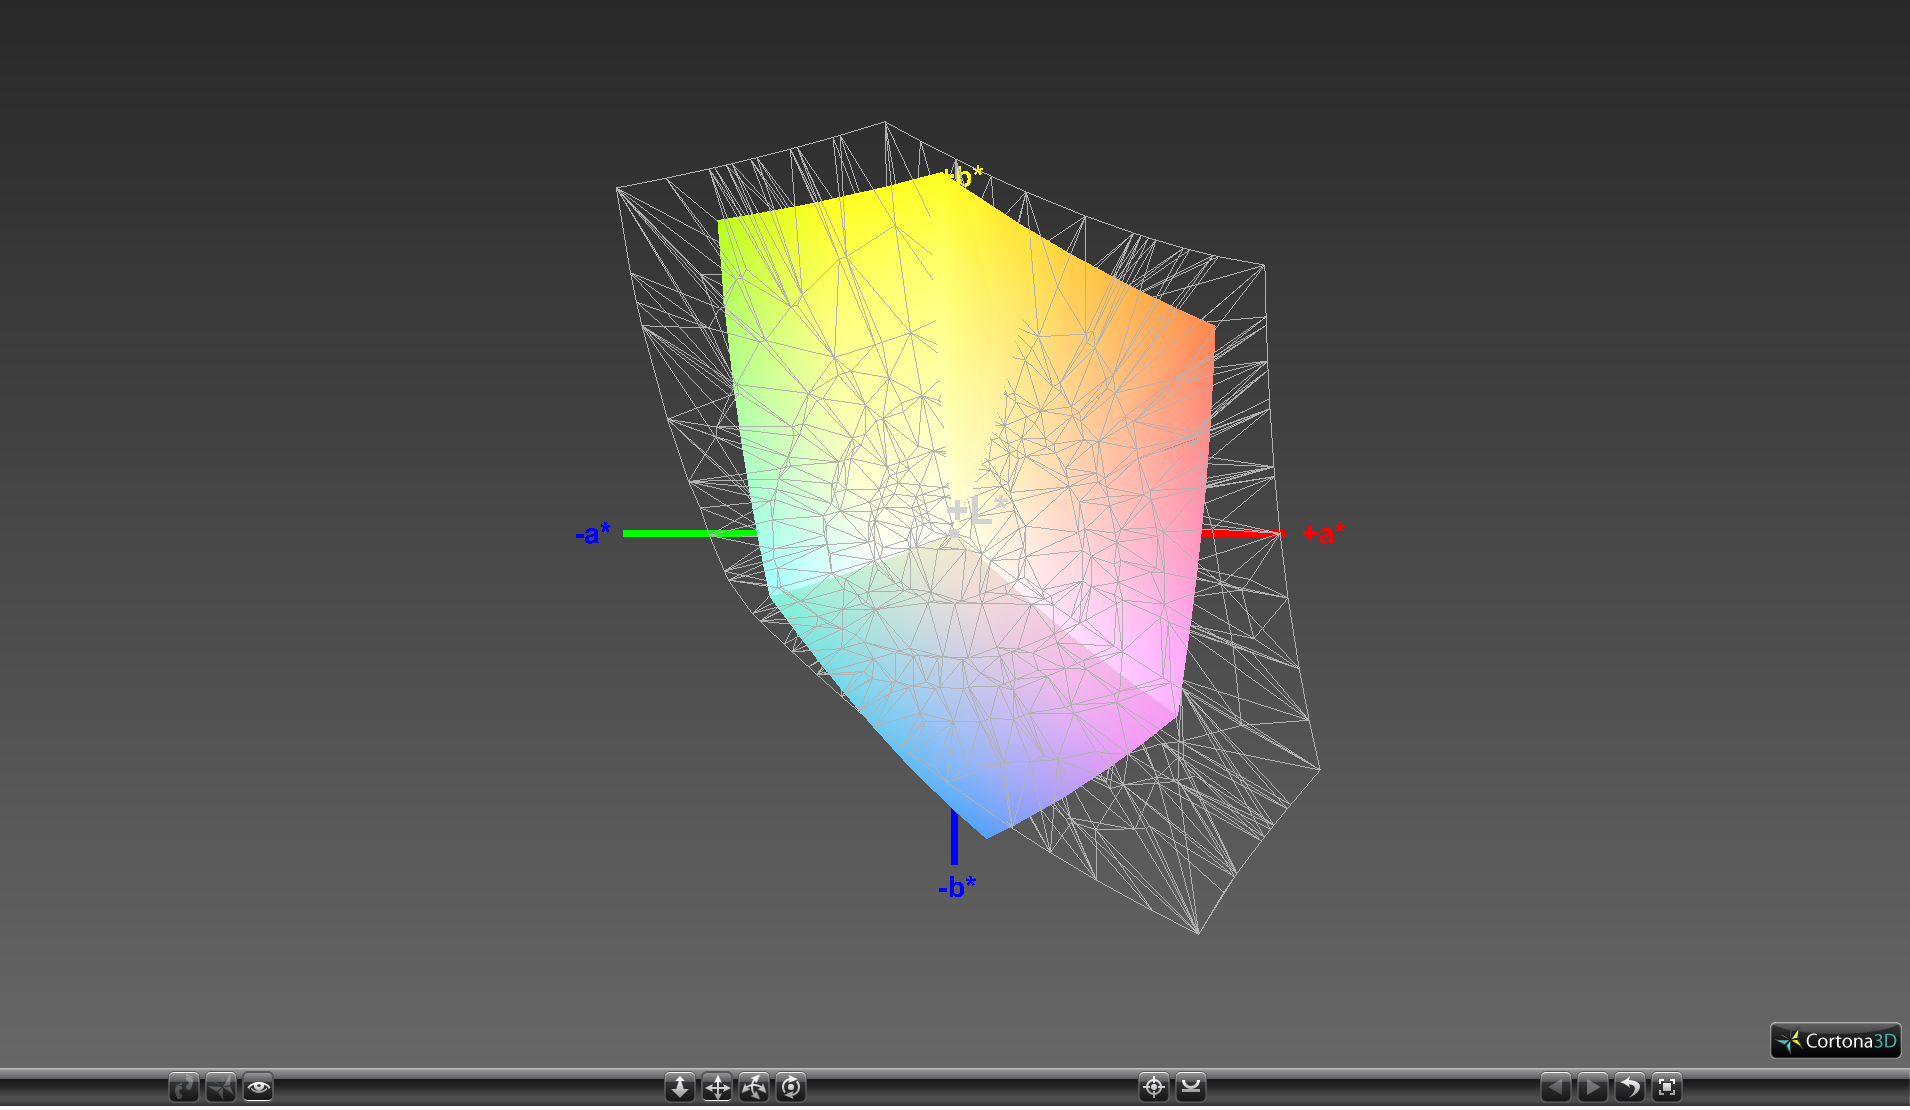
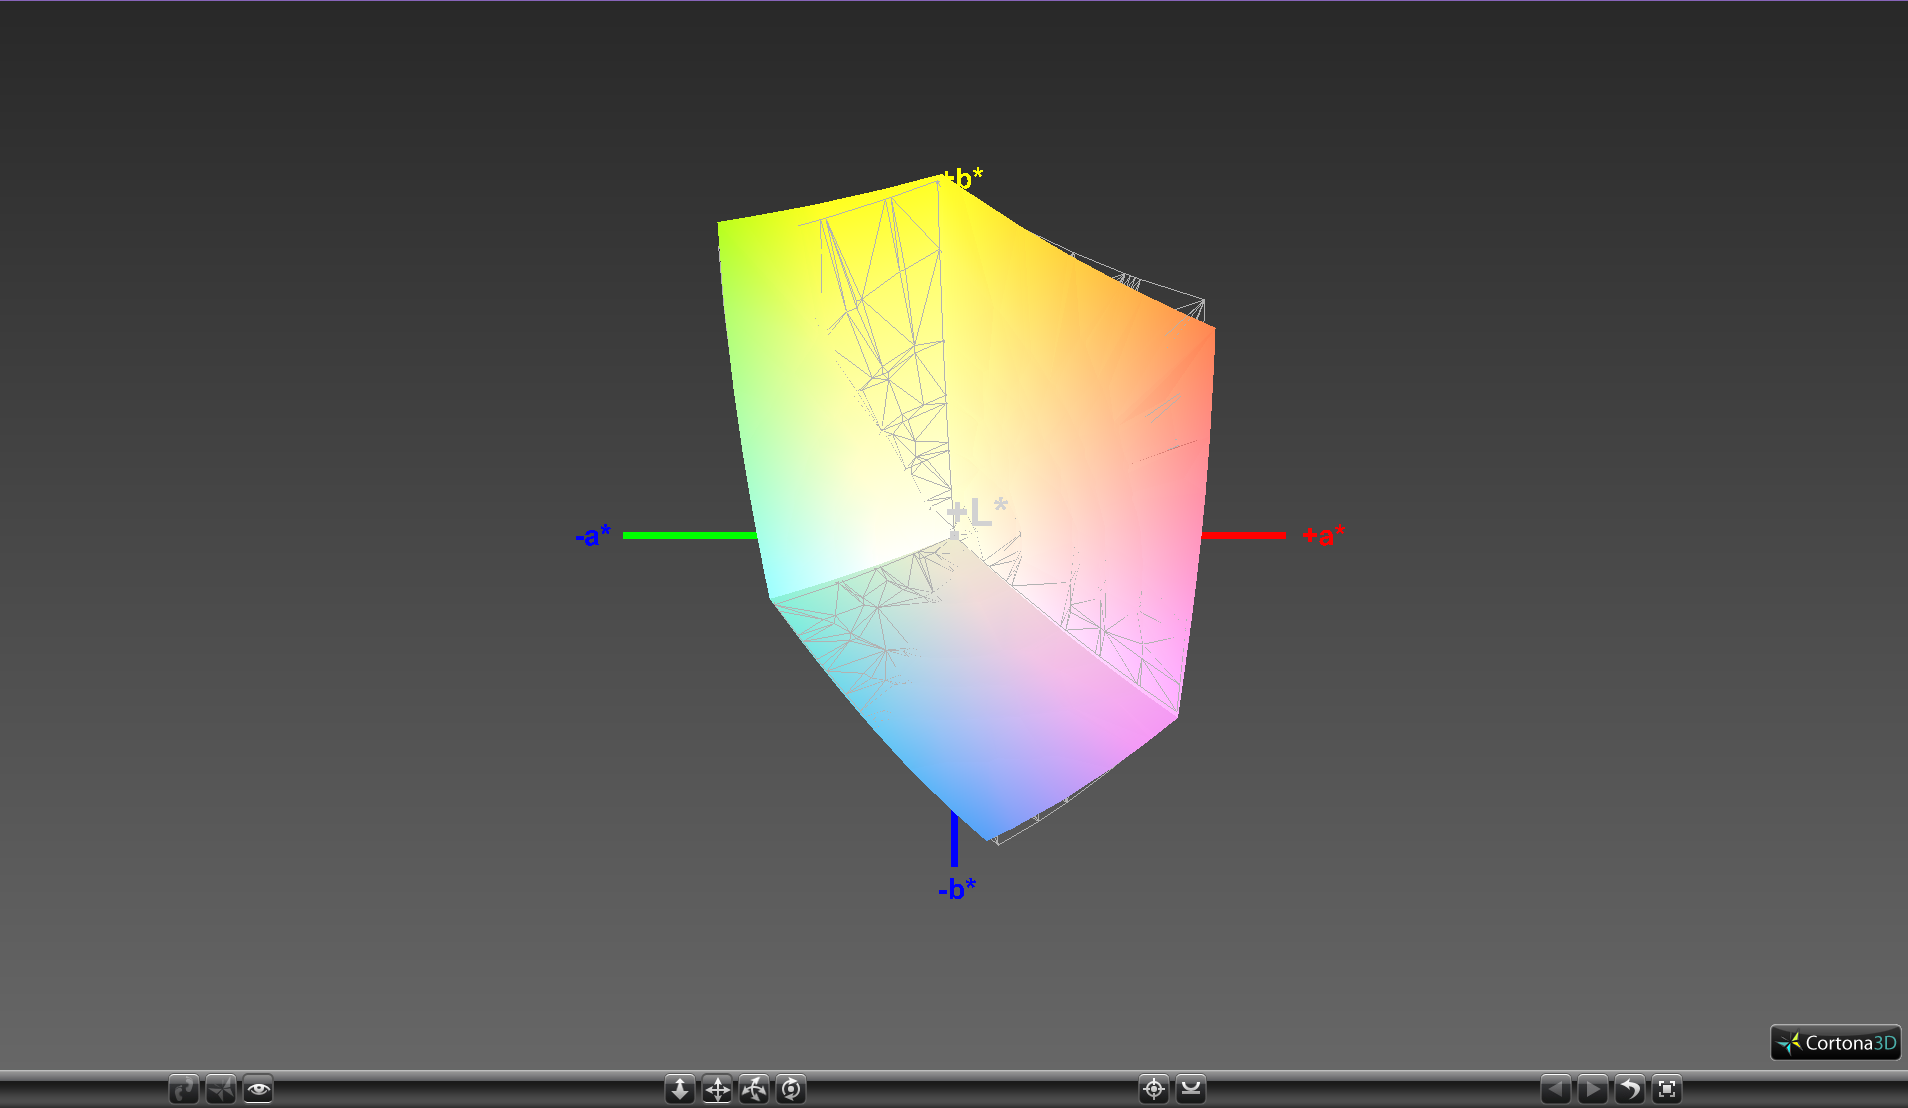
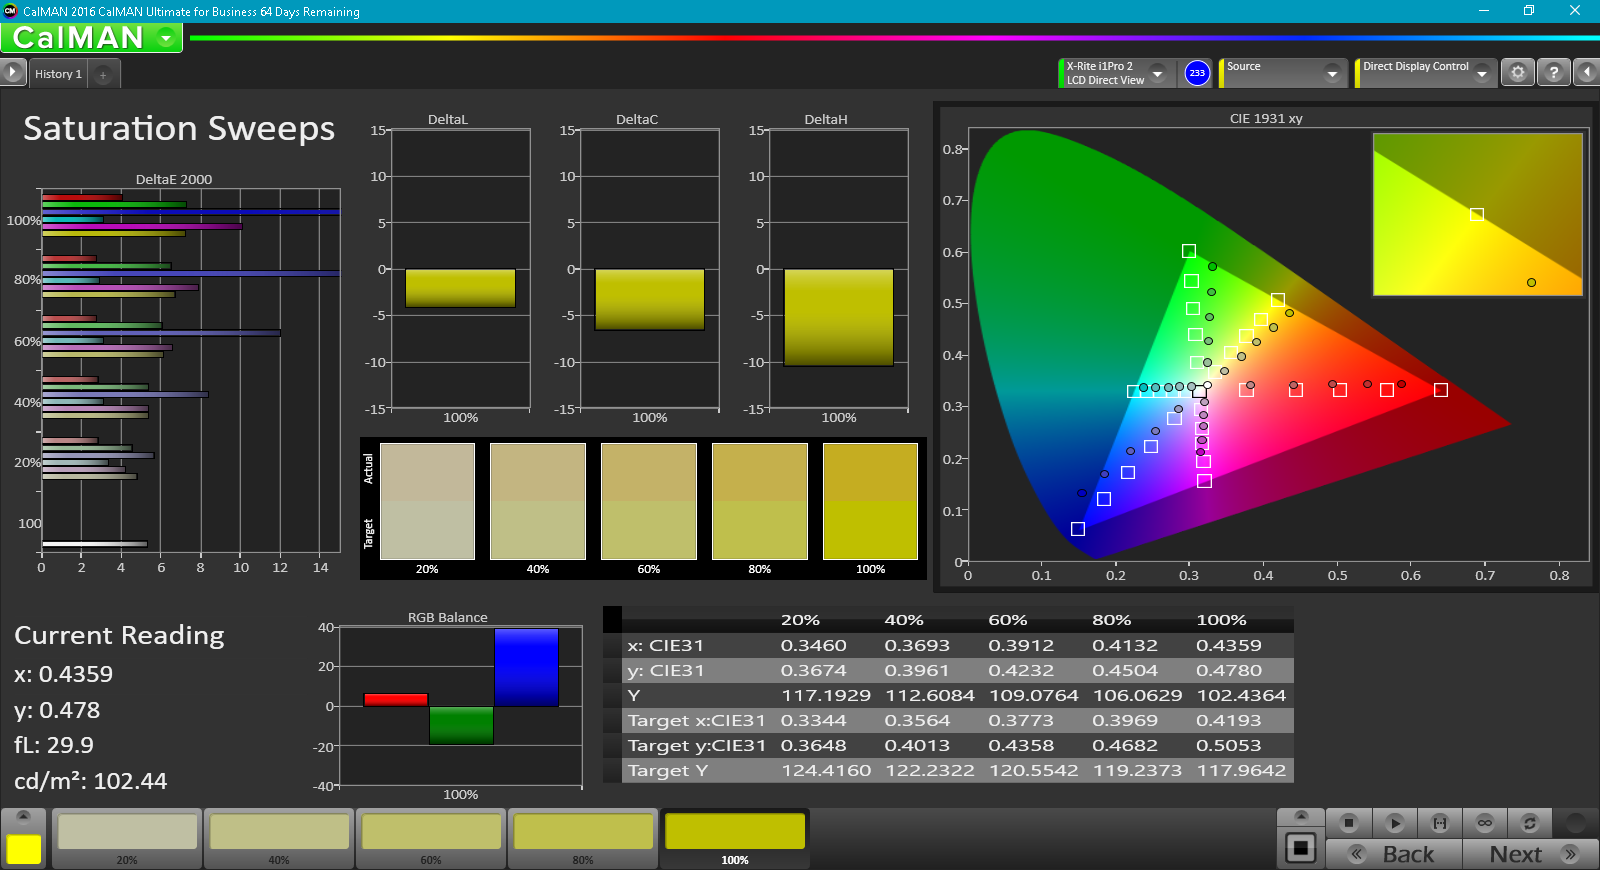
Color space is nearly identical to our T470 at about 63 percent and 41 percent of the sRGB and AdobeRGB standards, respectively. While sufficient for web browsing, presentations, and word processing, most Ultrabooks and competing business notebooks have much wider gamuts for potentially deeper colors. Users who want >95 percent sRGB coverage ought to consider the T470p or MacBook Pro 13 instead.
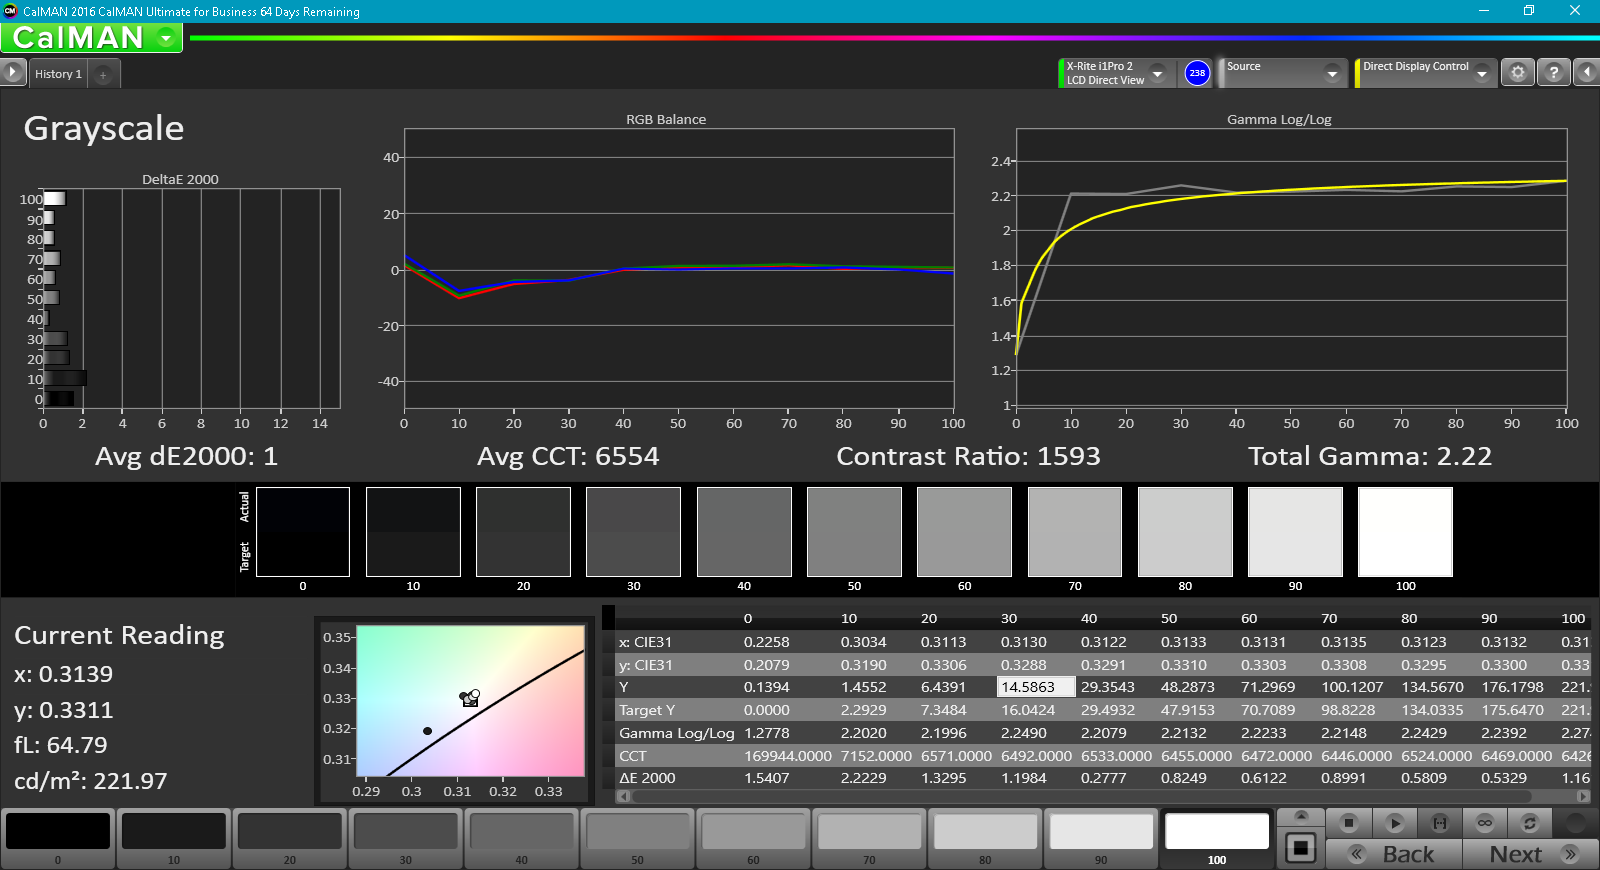
Further measurements with an X-Rite spectrophotometer reveal generally accurate grayscale and RGB balance out of the box. Our calibration efforts improve both with a final average grayscale DeltaE of only 1, but colors do not really improve due to the narrow gamut of the panel becoming a limiting factor. Blue colors in particular are reproduced less accurately compared to others.

Display Response Times
| ↔ Response Time Black to White | ||
|---|---|---|
| 37.6 ms ... rise ↗ and fall ↘ combined | ↗ 22 ms rise | 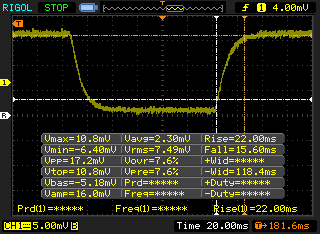 |
| ↘ 15.6 ms fall | ||
| The screen shows slow response rates in our tests and will be unsatisfactory for gamers. In comparison, all tested devices range from 0.1 (minimum) to 240 (maximum) ms. » 95 % of all devices are better. This means that the measured response time is worse than the average of all tested devices (19.8 ms). | ||
| ↔ Response Time 50% Grey to 80% Grey | ||
| 45.6 ms ... rise ↗ and fall ↘ combined | ↗ 18 ms rise | 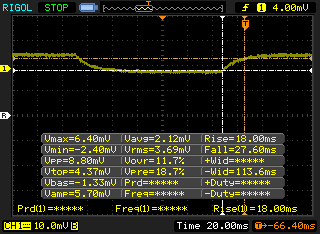 |
| ↘ 27.6 ms fall | ||
| The screen shows slow response rates in our tests and will be unsatisfactory for gamers. In comparison, all tested devices range from 0.165 (minimum) to 636 (maximum) ms. » 78 % of all devices are better. This means that the measured response time is worse than the average of all tested devices (31 ms). | ||
Screen Flickering / PWM (Pulse-Width Modulation)
| Screen flickering / PWM detected | 1000 Hz | ≤ 99 % brightness setting | 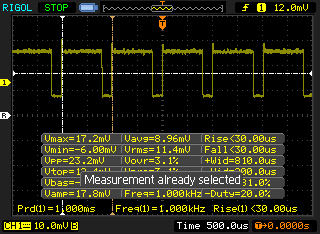 |
The display backlight flickers at 1000 Hz (worst case, e.g., utilizing PWM) Flickering detected at a brightness setting of 99 % and below. There should be no flickering or PWM above this brightness setting. The frequency of 1000 Hz is quite high, so most users sensitive to PWM should not notice any flickering. In comparison: 52 % of all tested devices do not use PWM to dim the display. If PWM was detected, an average of 7747 (minimum: 5 - maximum: 343500) Hz was measured. | |||
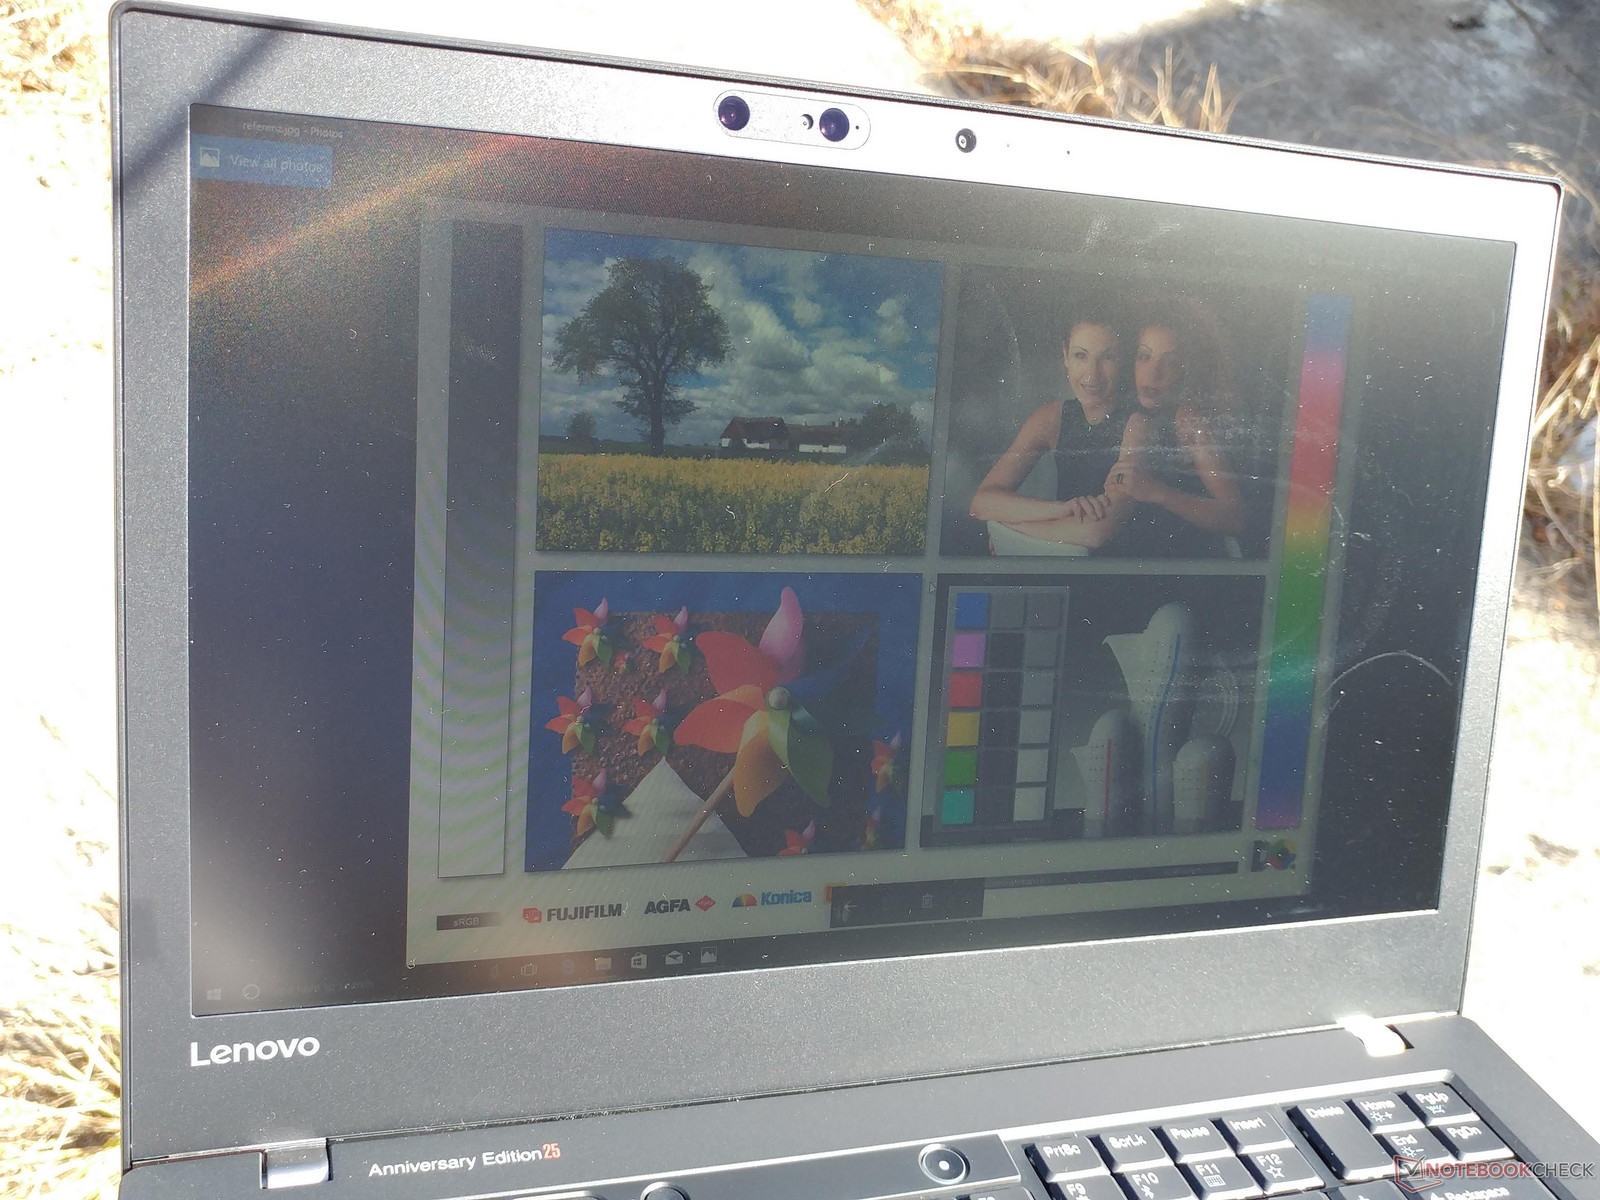
Outdoor visibility is average at best owing to the dimmer backlight. We recommend working under shade as sunlight will wash out colors and make viewing uncomfortable. If outdoor usability is a concern, then alternatives like the MacBook Pro 13 and Samsung Notebook 9 are equipped with significantly brighter backlights.
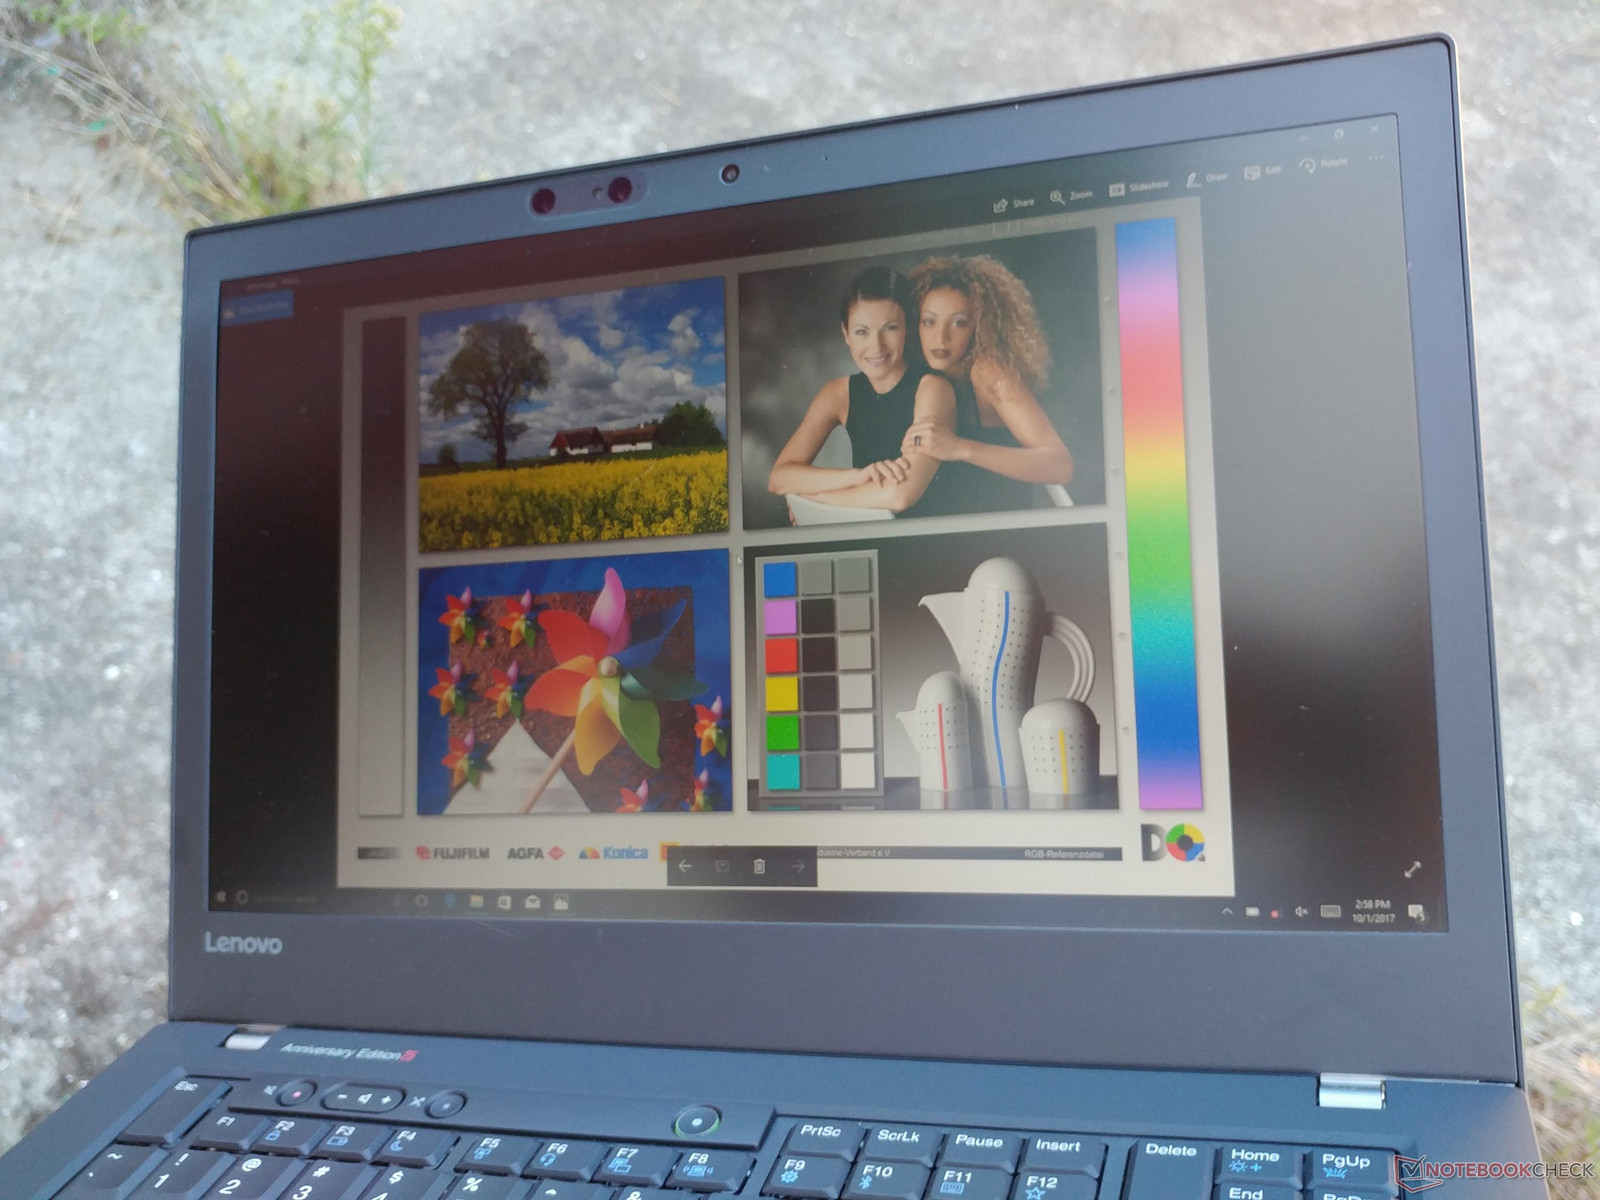
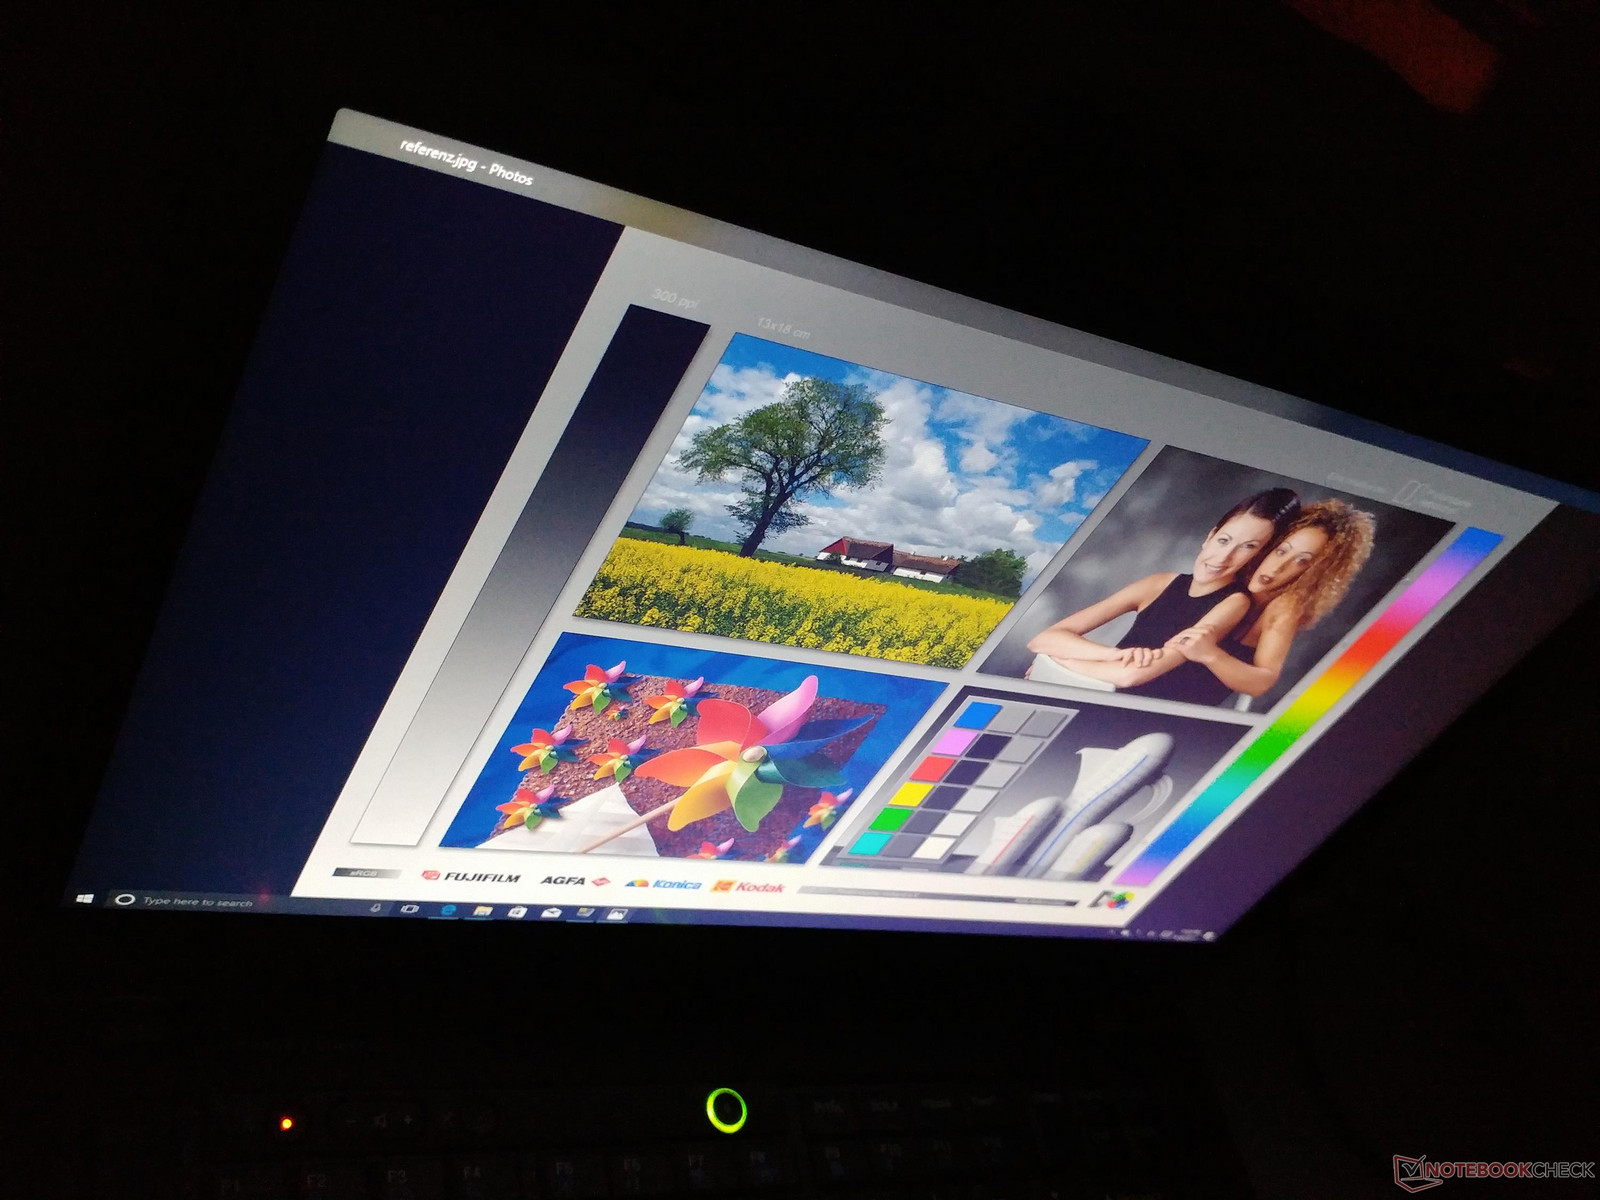
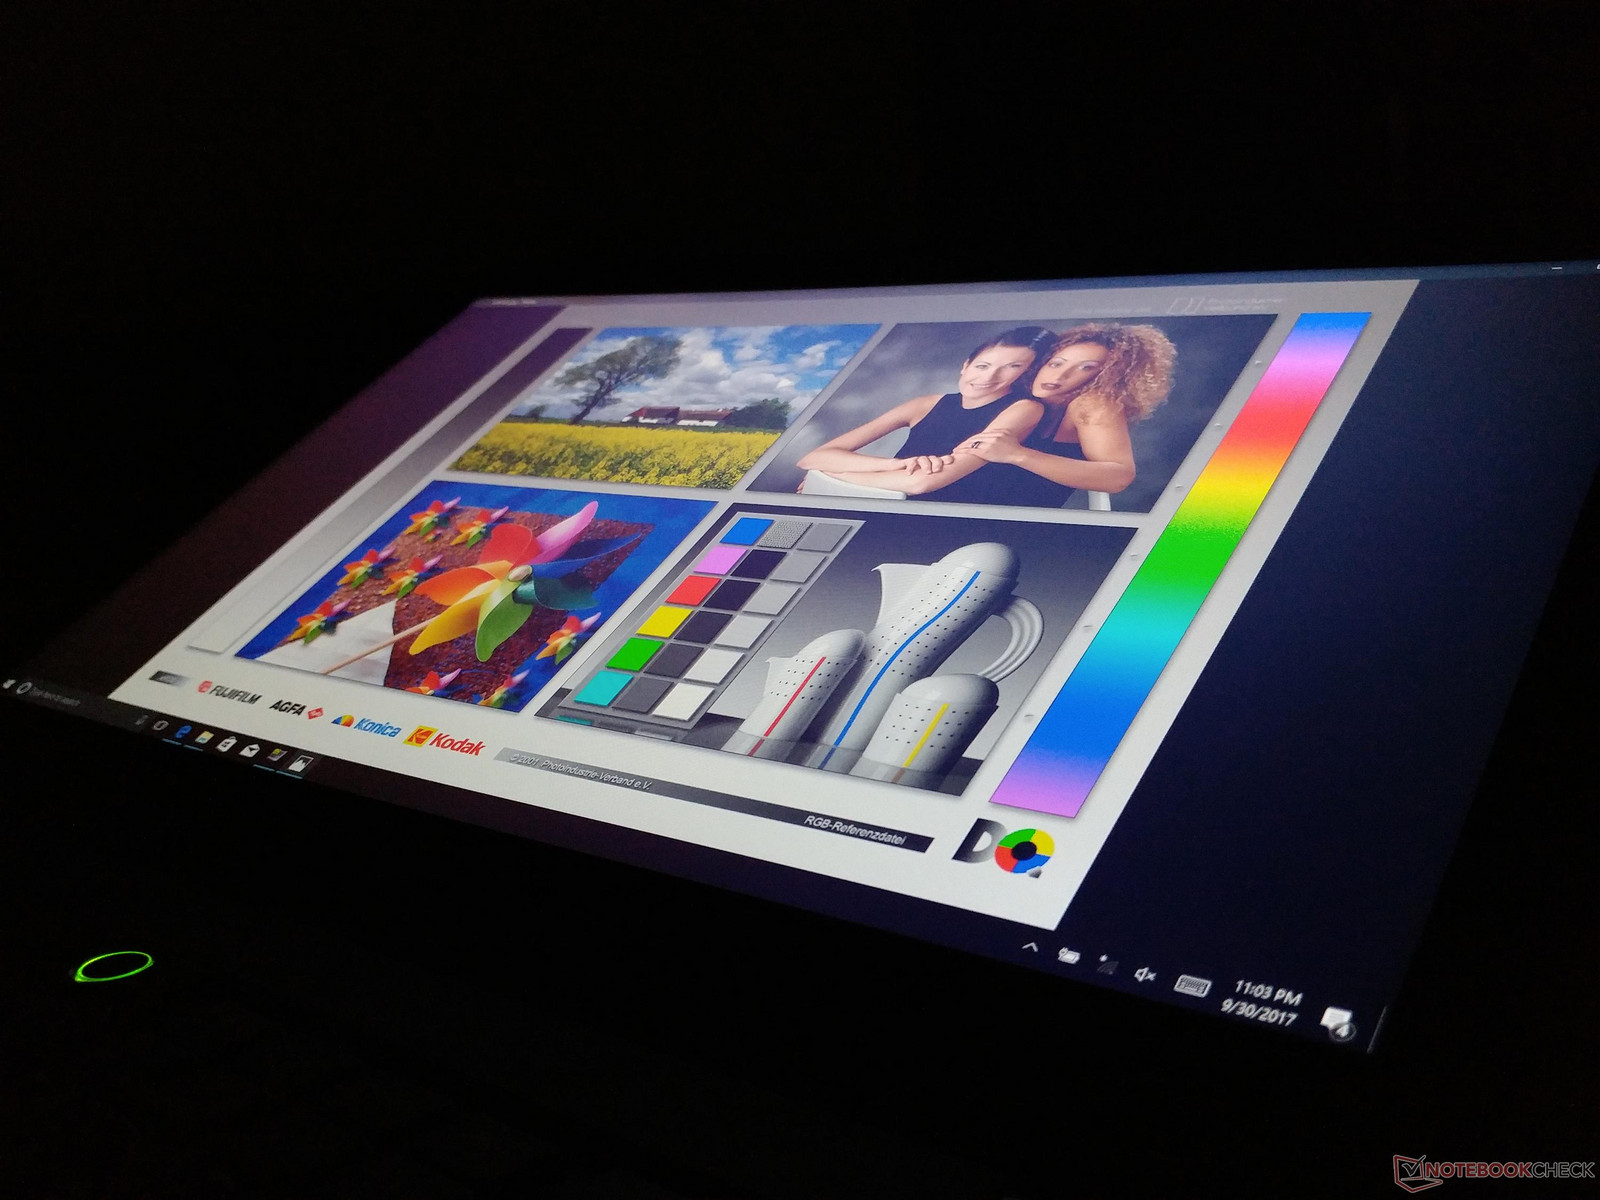
Viewing angles are excellent as expected from an IPS display. Extreme angles can cause apparent contrast and colors to turn slightly purple, but this shouldn't be an issue during normal use.
Performance
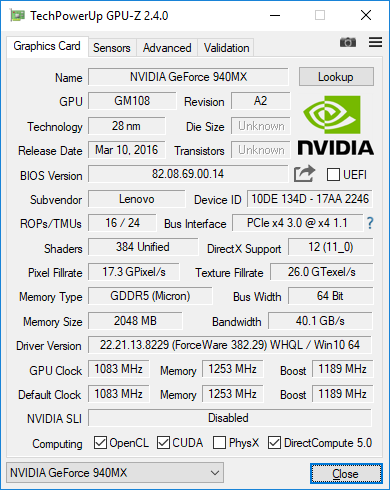
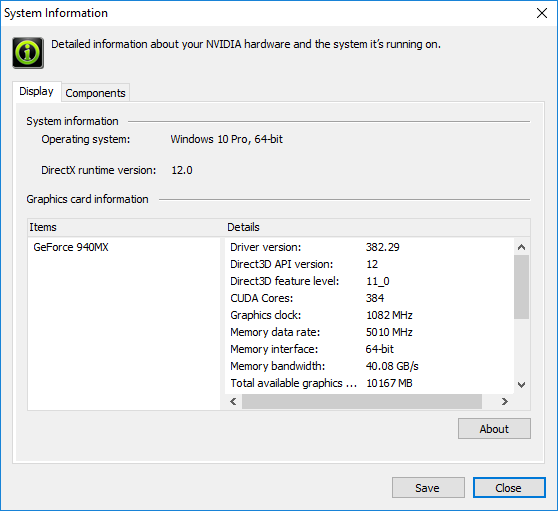
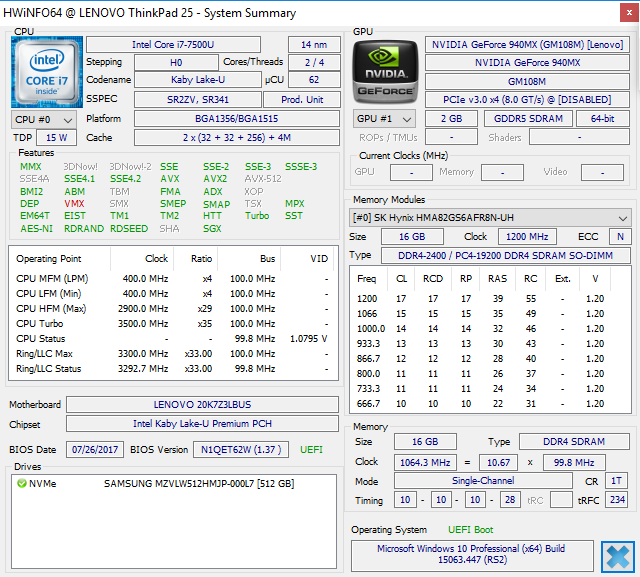
The ULV U-class CPU and GeForce 940MX GPU are not an uncommon pair on business and consumer notebooks. Recent systems like the Huawei Matebook D, HP Spectre x360 15, and Samsung Notebook 9 are all shipping with similar core specifications. Even though performance is an upgrade from our previous T470 equipped with the i5-7200U CPU and integrated HD Graphics 620 GPU, there's no denying that Lenovo may have just barely missed the boat on 8th gen Kaby Lake-R and the MX150 GPU now that the Yoga 920, XPS 13, Spectre 13, and more are coming soon with the next generation Intel hardware.
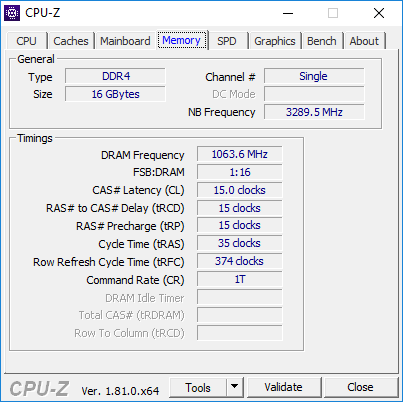
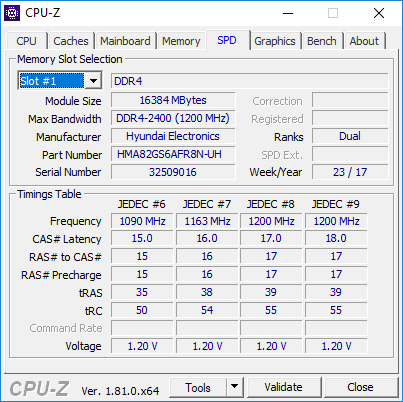
Our test unit houses a single 16 GB DDR4 RAM module in a single-channel configuration. Optimus is included for graphics switching between the integrated HD Graphics 620 GPU and the discrete 940 MX. Luckily, the Nvidia GPU here utilizes GDDR5 VRAM instead of the noticeably slower DDR3 variant as found on the Zenbook UX310UQ or Samsung Notebook 9.
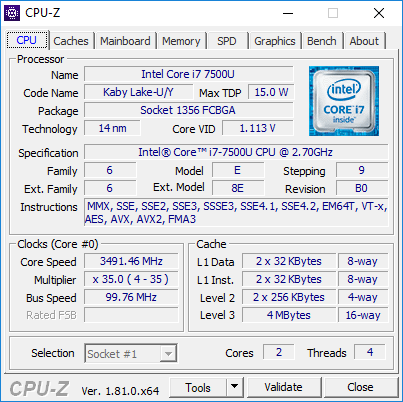

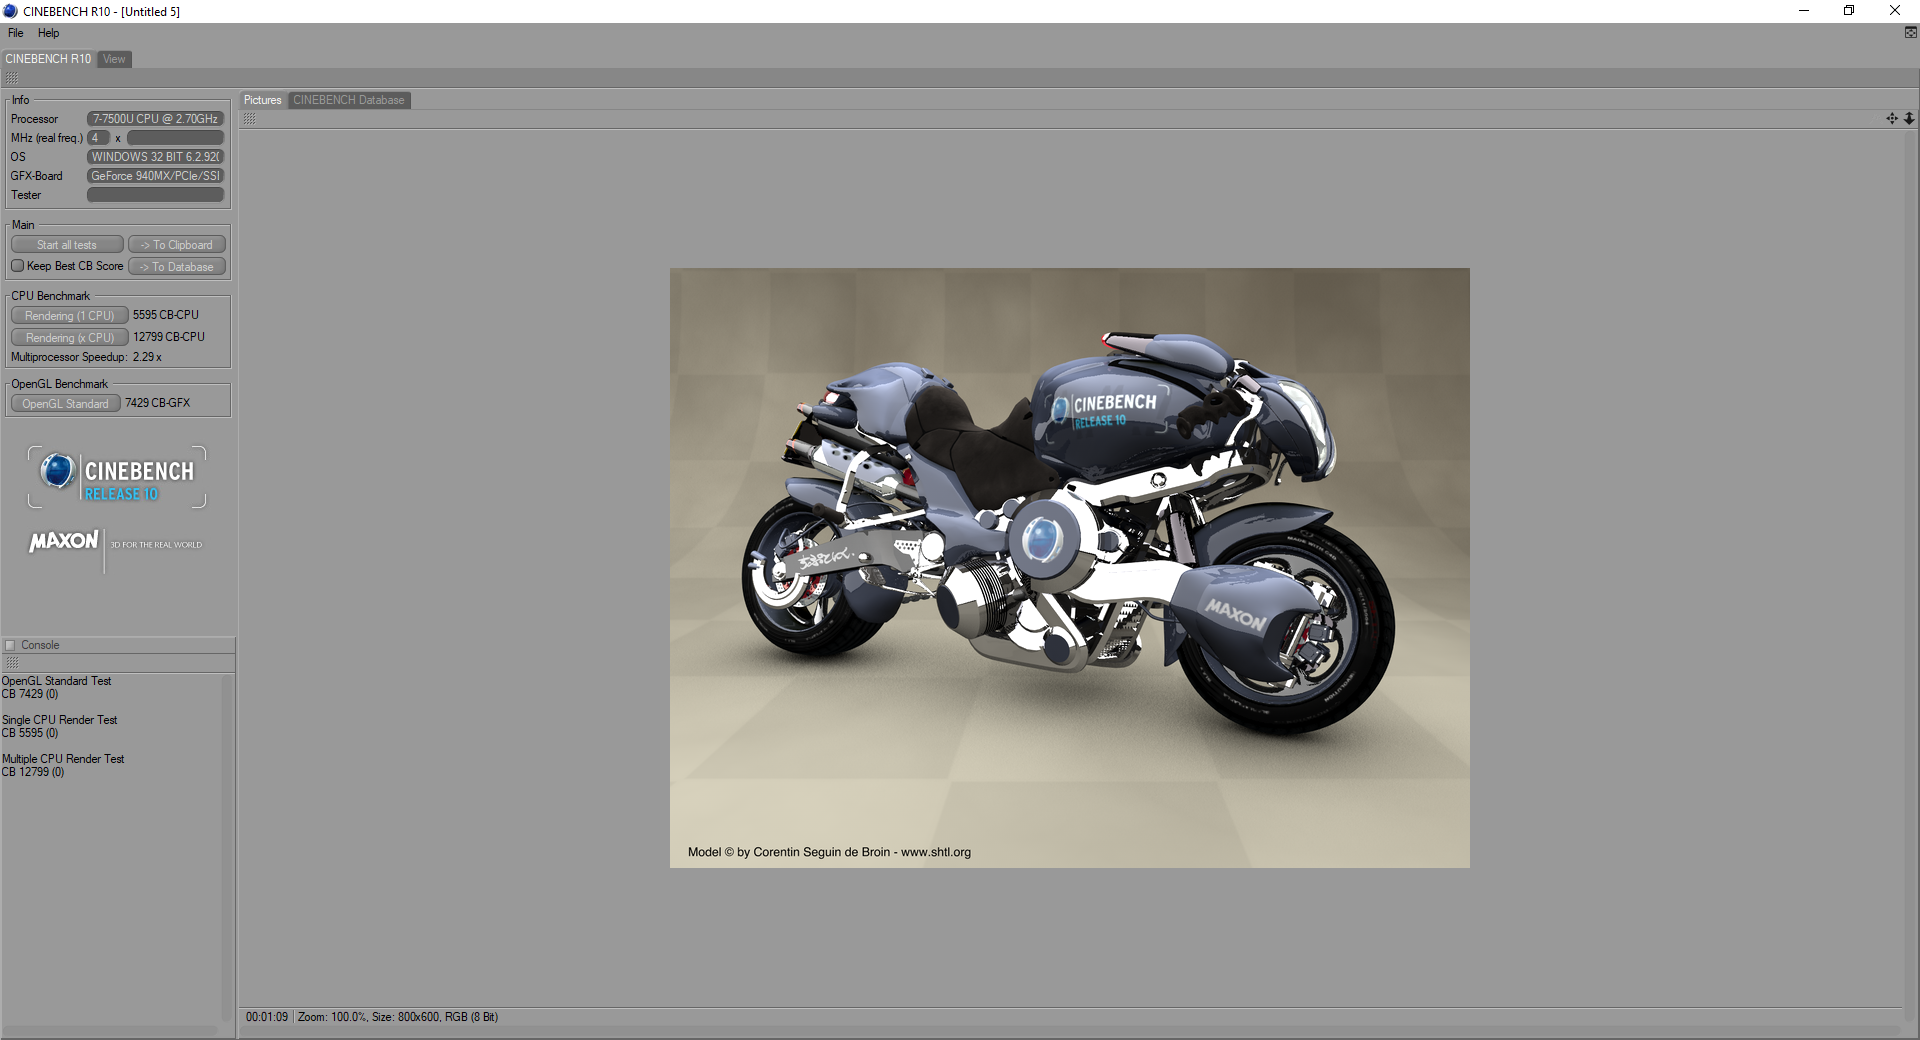
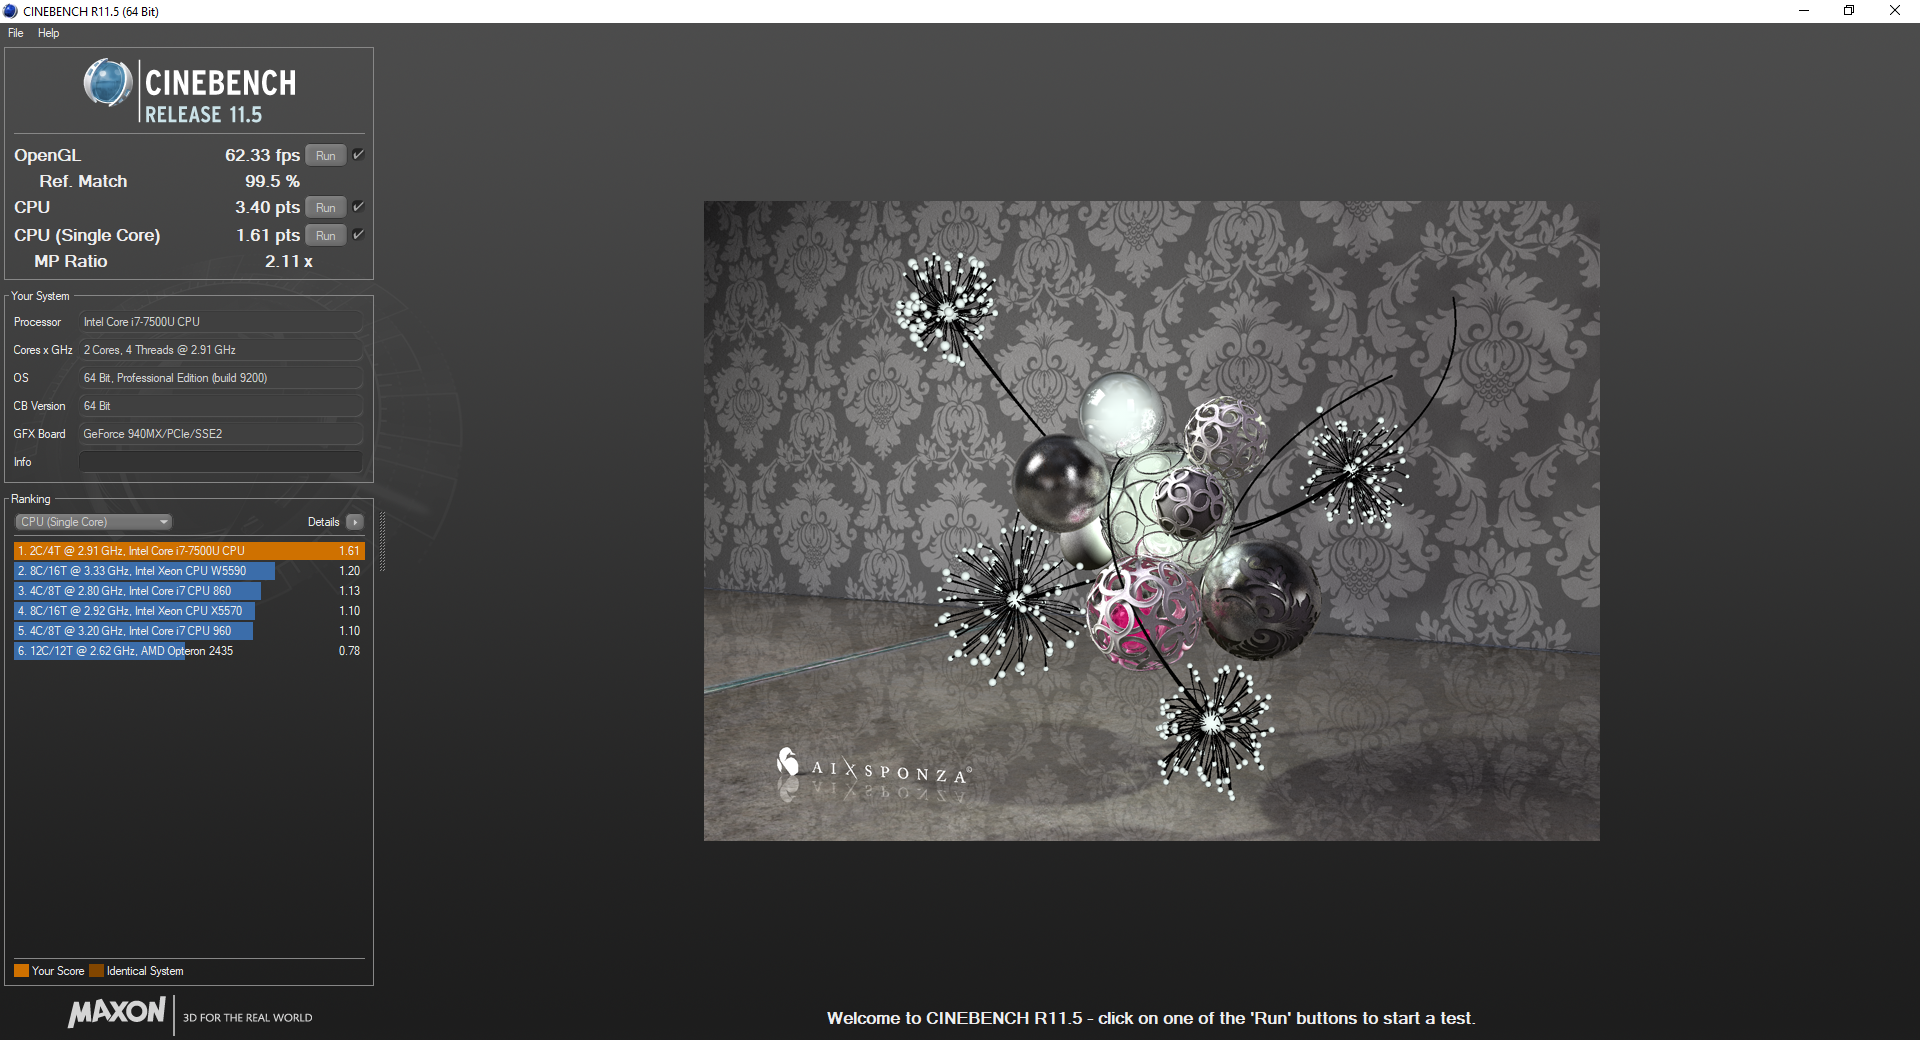
Processor
CPU performance is similar to other notebooks with the same i7-7500U CPU including the Matebook D. As proven many times before, the performance benefits over ULV Core i7 Skylake offerings are minimal especially in multi-threaded loads where differences are measured in single-digit percentages. Upgrading from the i5-7200U in the T470, for example, only brings a rough 15 percent boost in raw performance. Users upgrading from older Broadwell and Haswell ULV cores will see more significant performance jumps by about 30 to 60 percent depending on the CPU load. The latest Kaby Lake-R i5-8550U provides the largest gen-to-gen performance increase yet at 50 percent in multi-threaded workloads due to the doubling of cores.
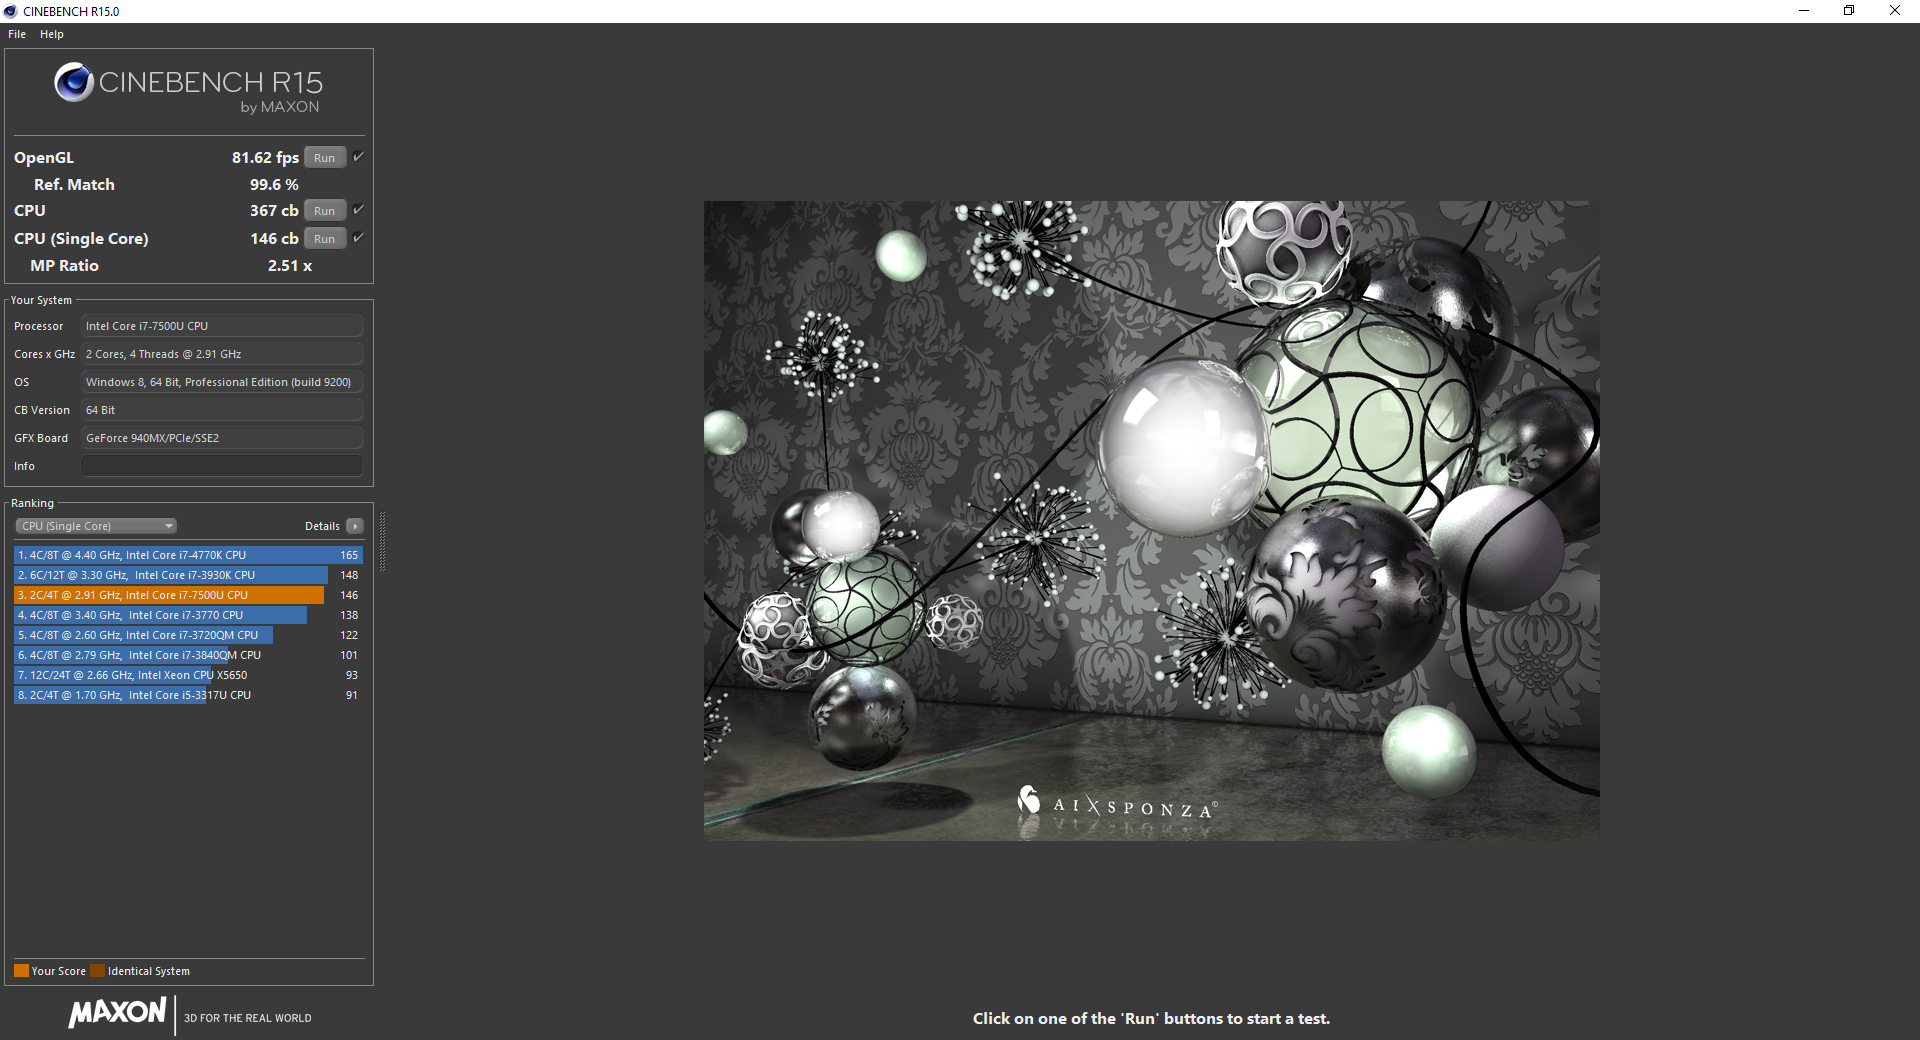
Running CineBench R15 Multi-Thread in a loop results in steady scores over time to suggest no major CPU throttling issues over extended periods. Some Ultrabooks like the MateBook X must throttle CPU clock rates due to weaker cooling solutions.
See our Core i7-7500U CPU page for more technical information and benchmark comparisons.
| Cinebench R15 | |
| CPU Single 64Bit | |
| Acer Swift 3 Pre-Sample Intel | |
| Eurocom Q5 | |
| Huawei MateBook D 15, i7-7500U 940MX | |
| Toshiba Tecra X40-D | |
| Lenovo ThinkPad 25 | |
| Asus Zenbook UX310UQ-GL011T | |
| Lenovo ThinkPad T470-20HD002HGE | |
| Lenovo ThinkPad E550-20DF00CNGE | |
| Lenovo Y40-59423035 | |
| Asus FX550IU-WSFX | |
| CPU Multi 64Bit | |
| Eurocom Q5 | |
| Acer Swift 3 Pre-Sample Intel | |
| Lenovo ThinkPad 25 | |
| Toshiba Tecra X40-D | |
| Huawei MateBook D 15, i7-7500U 940MX | |
| Asus Zenbook UX310UQ-GL011T | |
| Lenovo ThinkPad T470-20HD002HGE | |
| Asus FX550IU-WSFX | |
| Lenovo ThinkPad E550-20DF00CNGE | |
| Lenovo Y40-59423035 | |
| wPrime 2.10 - 1024m | |
| Lenovo Y40-59423035 | |
| Lenovo Thinkpad T420 4236-NGG | |
| Huawei MateBook D 15, i7-7500U 940MX | |
| Toshiba Tecra X40-D | |
| Lenovo ThinkPad 25 | |
| Asus FX550IU-WSFX | |
| Eurocom Q5 | |
* ... smaller is better
System Performance
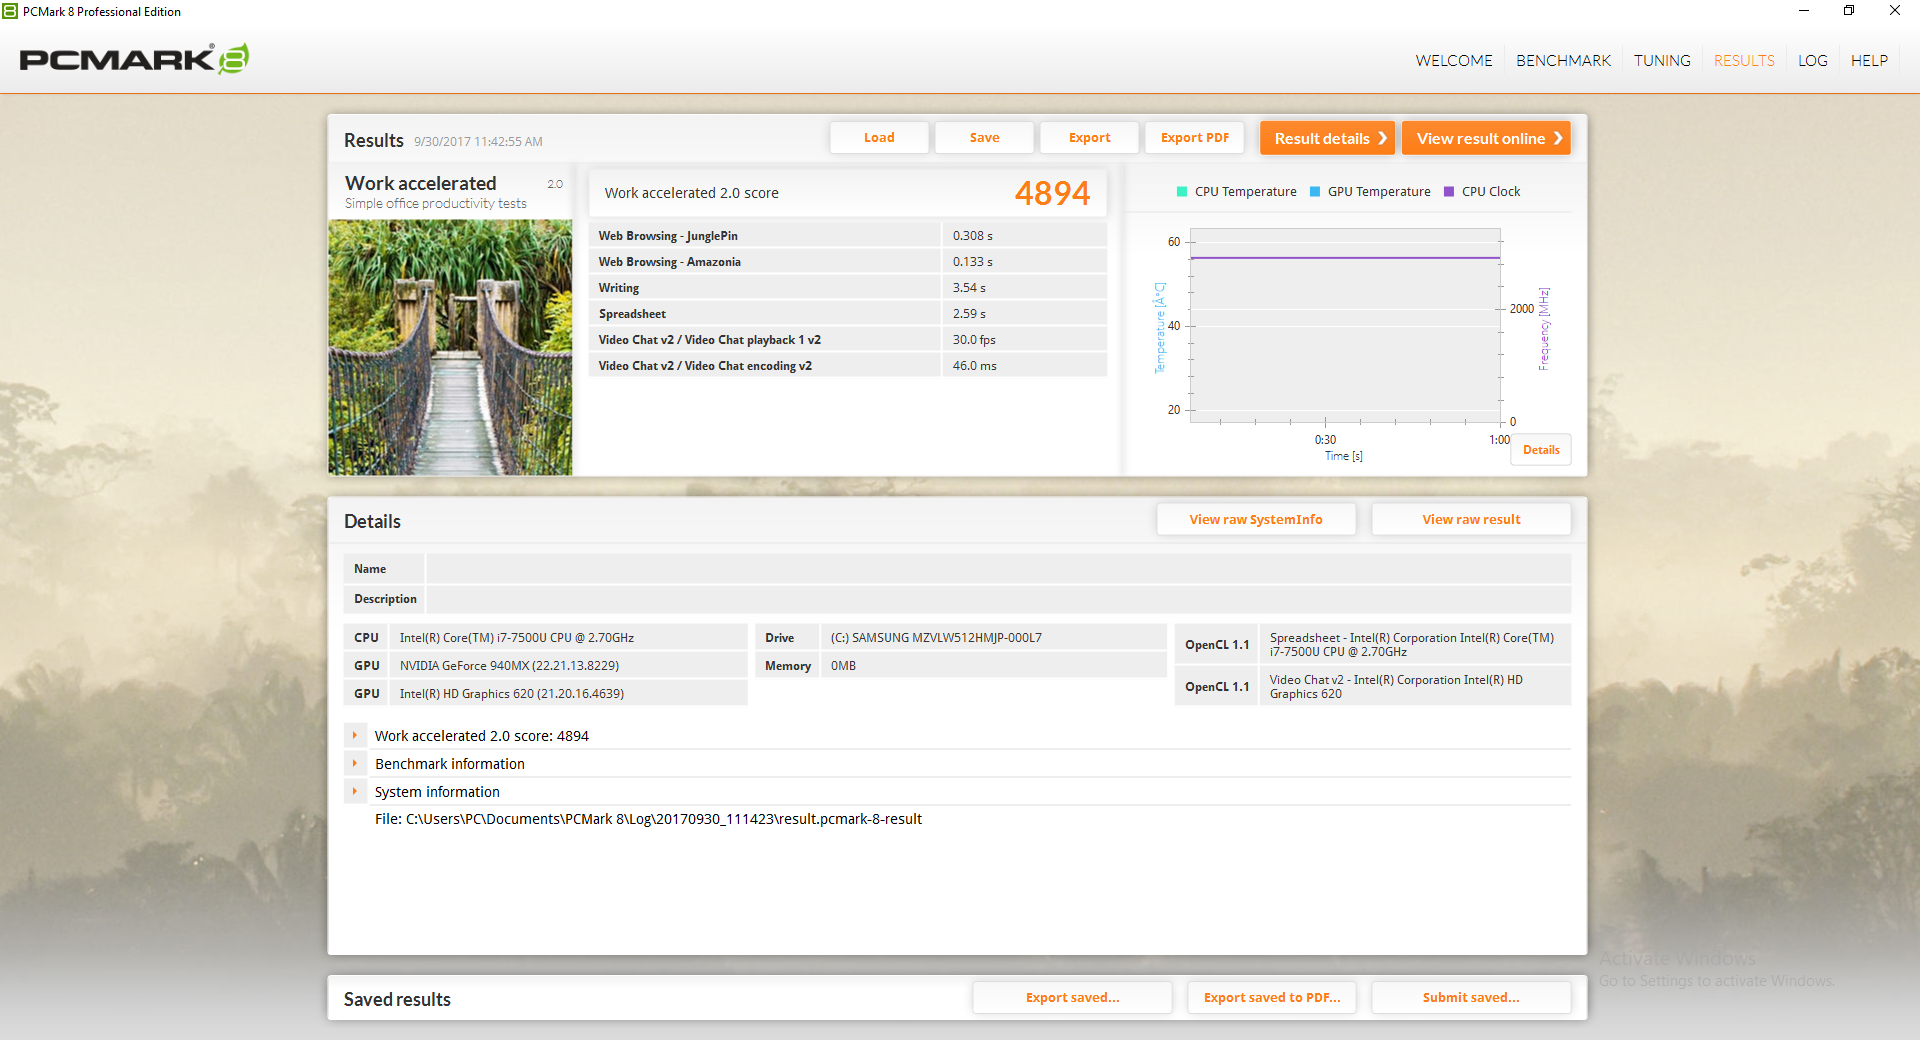
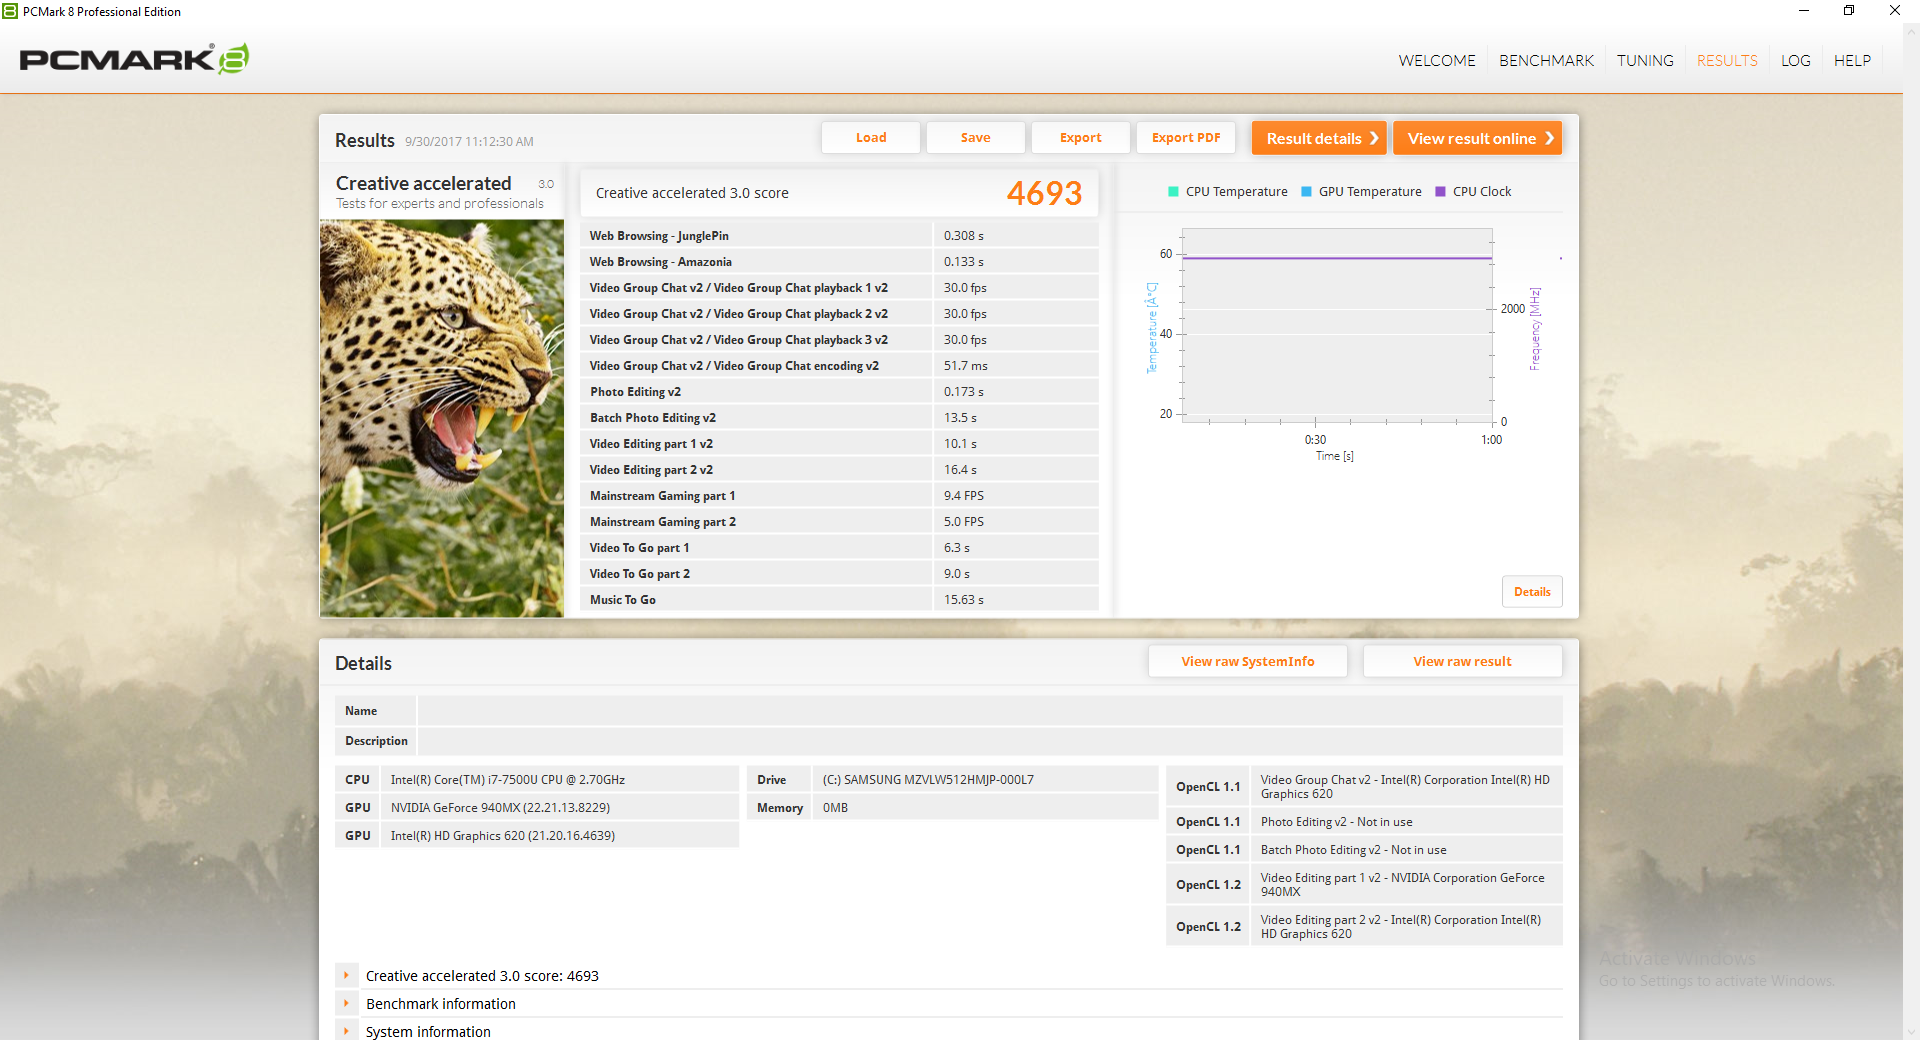
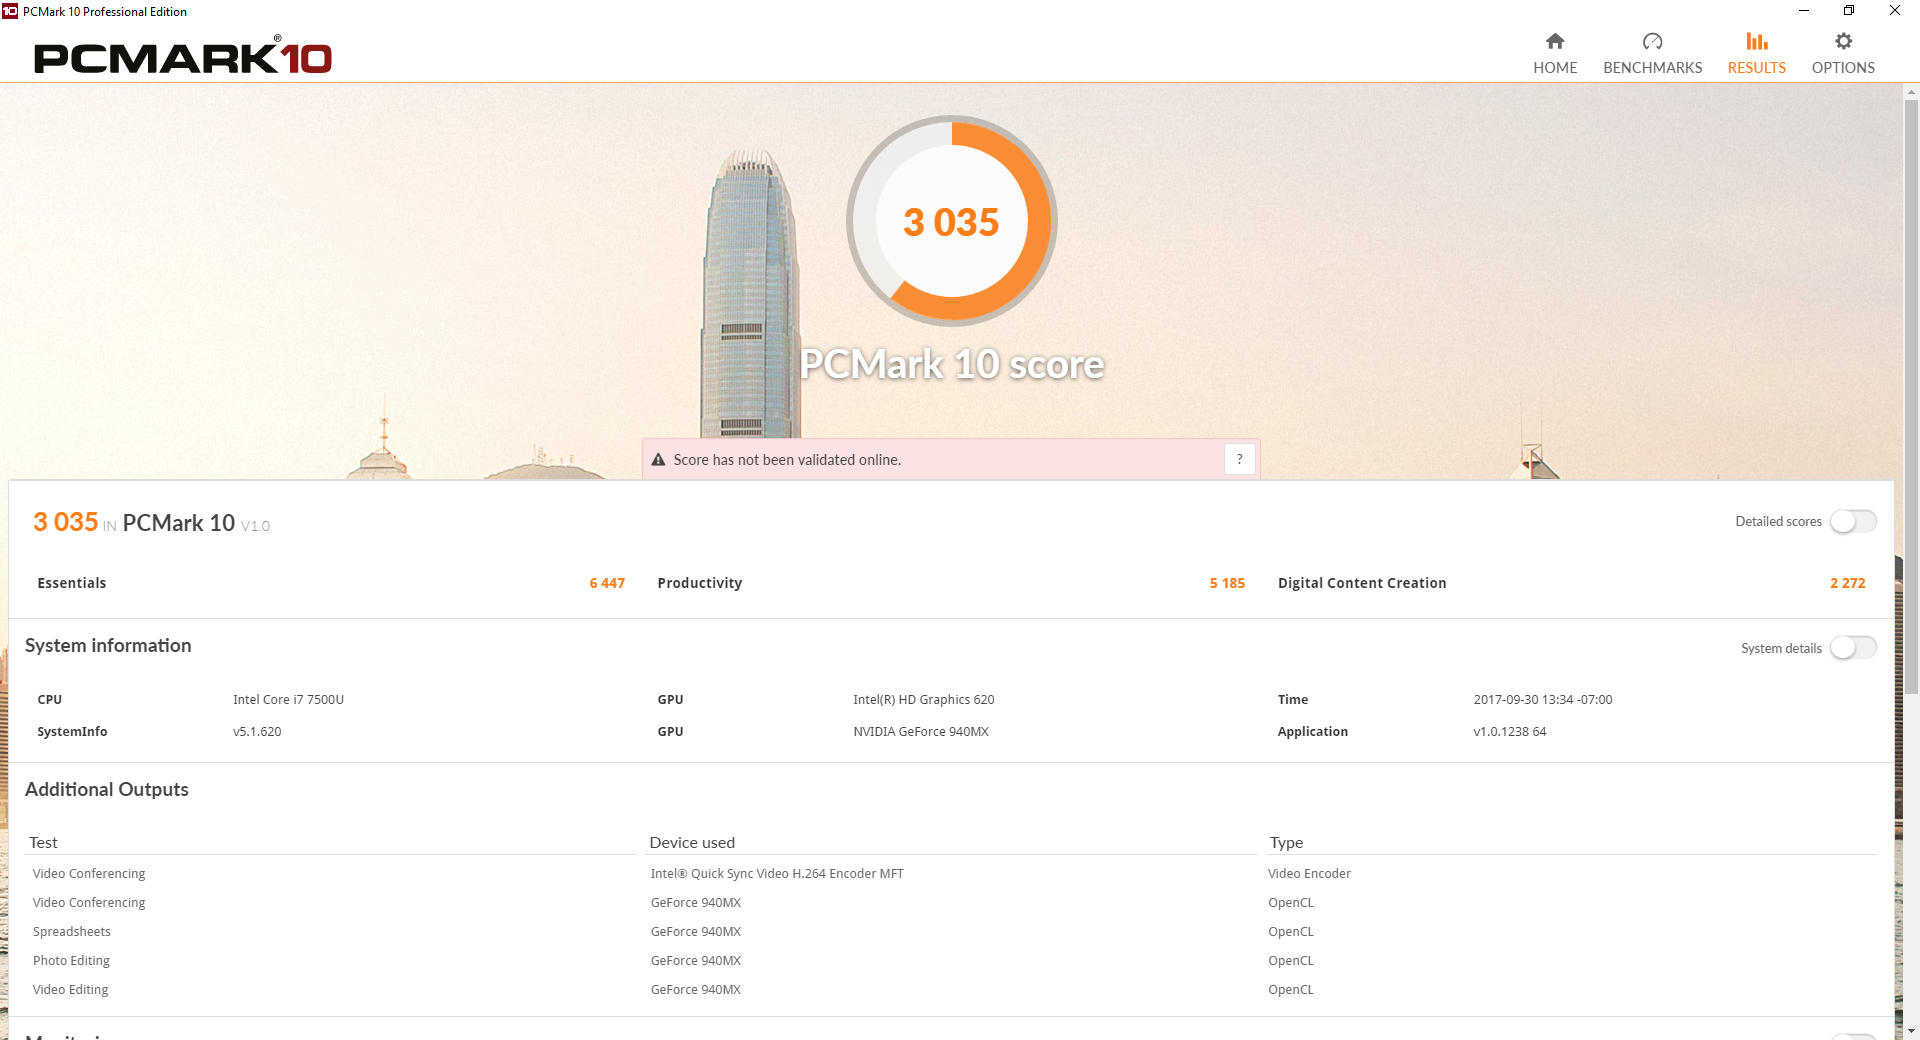
PCMark benchmarks rank the ThinkPad 25 within single-digit percentages of its closest competitors with similar ULV configurations. Strangely enough, the T470p is not scoring any higher even though it carries a faster HQ-class quad-core processor. We didn't experience any slowdown or software issues during our time with the test unit.

| PCMark 8 | |
| Home Score Accelerated v2 | |
| Lenovo ThinkPad T470s-20HF0012US | |
| Samsung Notebook 9 NP900X5N-X01US | |
| Lenovo ThinkPad 25 | |
| Lenovo ThinkPad T470p-20J7S00000 | |
| Work Score Accelerated v2 | |
| Lenovo ThinkPad T470s-20HF0012US | |
| Samsung Notebook 9 NP900X5N-X01US | |
| Lenovo ThinkPad 25 | |
| Lenovo ThinkPad T470p-20J7S00000 | |
| Creative Score Accelerated v2 | |
| Lenovo ThinkPad T470s-20HF0012US | |
| Lenovo ThinkPad T470p-20J7S00000 | |
| Samsung Notebook 9 NP900X5N-X01US | |
| Lenovo ThinkPad 25 | |
| PCMark 8 Home Score Accelerated v2 | 3764 points | |
| PCMark 8 Creative Score Accelerated v2 | 4693 points | |
| PCMark 8 Work Score Accelerated v2 | 4894 points | |
| PCMark 10 Score | 3035 points | |
Help | ||
Storage Devices
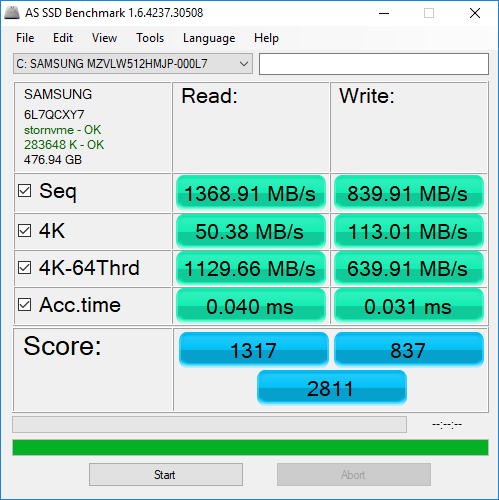
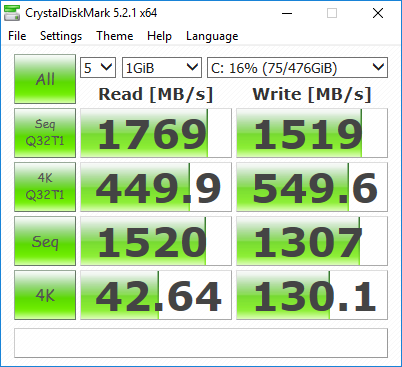
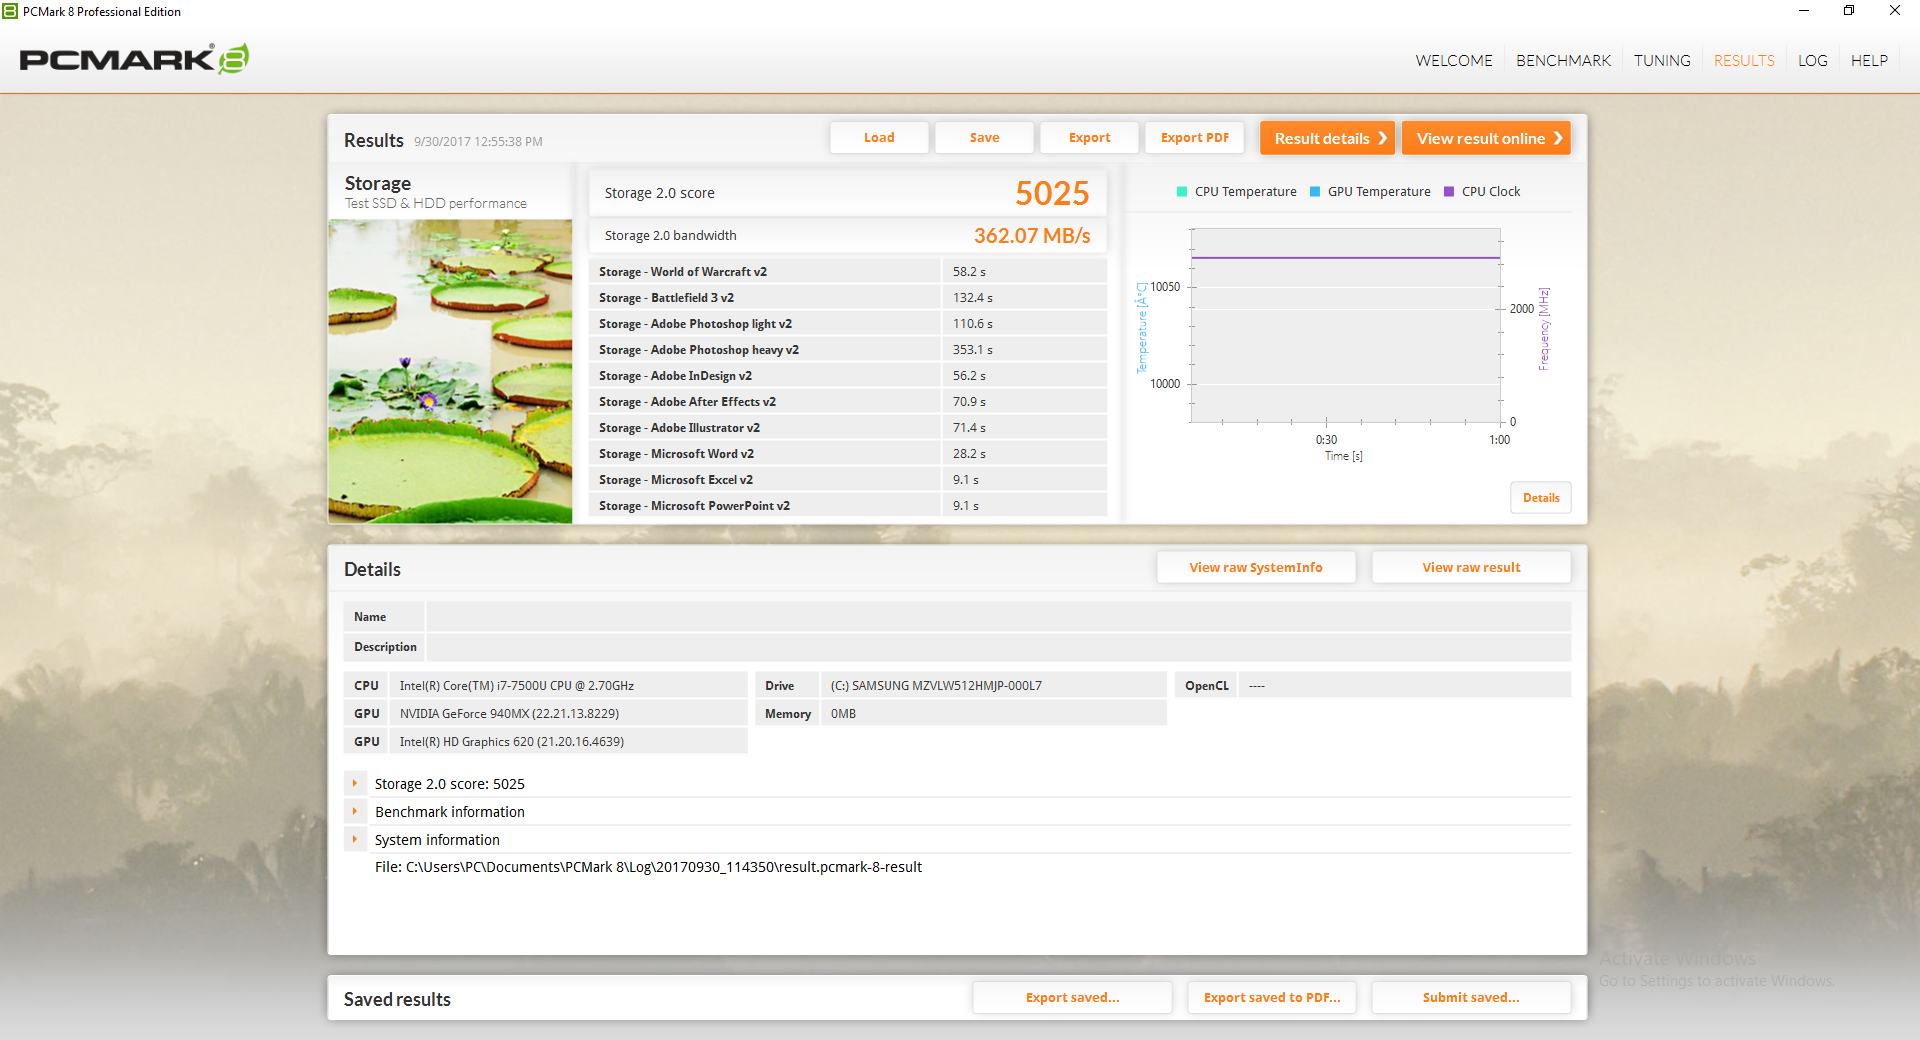
The 2.5-inch SATA III bay utilizes the same M.2 adapter as our original T470. It can technically accept either one 2.5-inch drive or one M.2 2242/2280 SSD depending on the adapter. The ThinkPad 25 ships with a 512 GB Samsung SM961 M.2 NVMe SSD by default and so owners are stuck with M.2 drives unless if they can somehow get their hands on a proper 2.5-inch SATA adapter.
When compared to the TLC-based PM961 in the ThinkPad T470s, the MLC-based SM961 is theoretically faster with sequential read speeds approaching 3200 MB/s. CDM 5 results, however, are about half that at 1769 MB/s. This suggests that the ThinkPad 25 has not been upgraded from the PCIe x2 chipset on the T470 to support the full PCIe x4 bandwidth of the Samsung SSD. The impact on day-to-day browsing is essentially nil, but users who frequently open and save very large files may be disappointed that they aren't getting the maximum performance out of the SSD.
See our growing table of HDDs and SSDs for more benchmark comparisons.
| Lenovo ThinkPad 25 Samsung SM961 MZVKW512HMJP m.2 PCI-e | Lenovo ThinkPad T470s-20HF0012US Samsung PM961 MZVLW256HEHP | Lenovo ThinkPad T470p-20J7S00000 Samsung PM961 NVMe MZVLW512HMJP | Lenovo ThinkPad X1 Carbon 2017-20HR0021GE Toshiba THNSF5256GPUK | Dell XPS 15 9560 (i7-7700HQ, UHD) Lite-On CX2-8B512-Q11 | |
|---|---|---|---|---|---|
| AS SSD | 11% | 17% | -46% | 7% | |
| Copy Game MB/s (MB/s) | 598 | 309.9 -48% | 586 -2% | 229 -62% | 540 -10% |
| Copy Program MB/s (MB/s) | 400.6 | 291 -27% | 347.7 -13% | 172.4 -57% | 411.5 3% |
| Copy ISO MB/s (MB/s) | 1272 | 797 -37% | 673 -47% | 623 -51% | 1272 0% |
| Score Total (Points) | 2811 | 3875 38% | 3606 28% | 1398 -50% | 2810 0% |
| Score Write (Points) | 837 | 803 -4% | 1272 52% | 337 -60% | 1022 22% |
| Score Read (Points) | 1317 | 2083 58% | 1546 17% | 726 -45% | 1206 -8% |
| Access Time Write * (ms) | 0.031 | 0.025 19% | 0.024 23% | 0.034 -10% | 0.034 -10% |
| Access Time Read * (ms) | 0.04 | 0.06 -50% | 0.035 12% | 0.102 -155% | 0.034 15% |
| 4K-64 Write (MB/s) | 640 | 538 -16% | 1007 57% | 149.6 -77% | 789 23% |
| 4K-64 Read (MB/s) | 1130 | 1765 56% | 1344 19% | 526 -53% | 962 -15% |
| 4K Write (MB/s) | 113 | 147.9 31% | 147.3 30% | 109.4 -3% | 112.2 -1% |
| 4K Read (MB/s) | 50.4 | 48.84 -3% | 56.4 12% | 34.34 -32% | 41.34 -18% |
| Seq Write (MB/s) | 840 | 1170 39% | 1176 40% | 775 -8% | 1207 44% |
| Seq Read (MB/s) | 1369 | 2691 97% | 1455 6% | 1649 20% | 2026 48% |
* ... smaller is better
GPU Performance
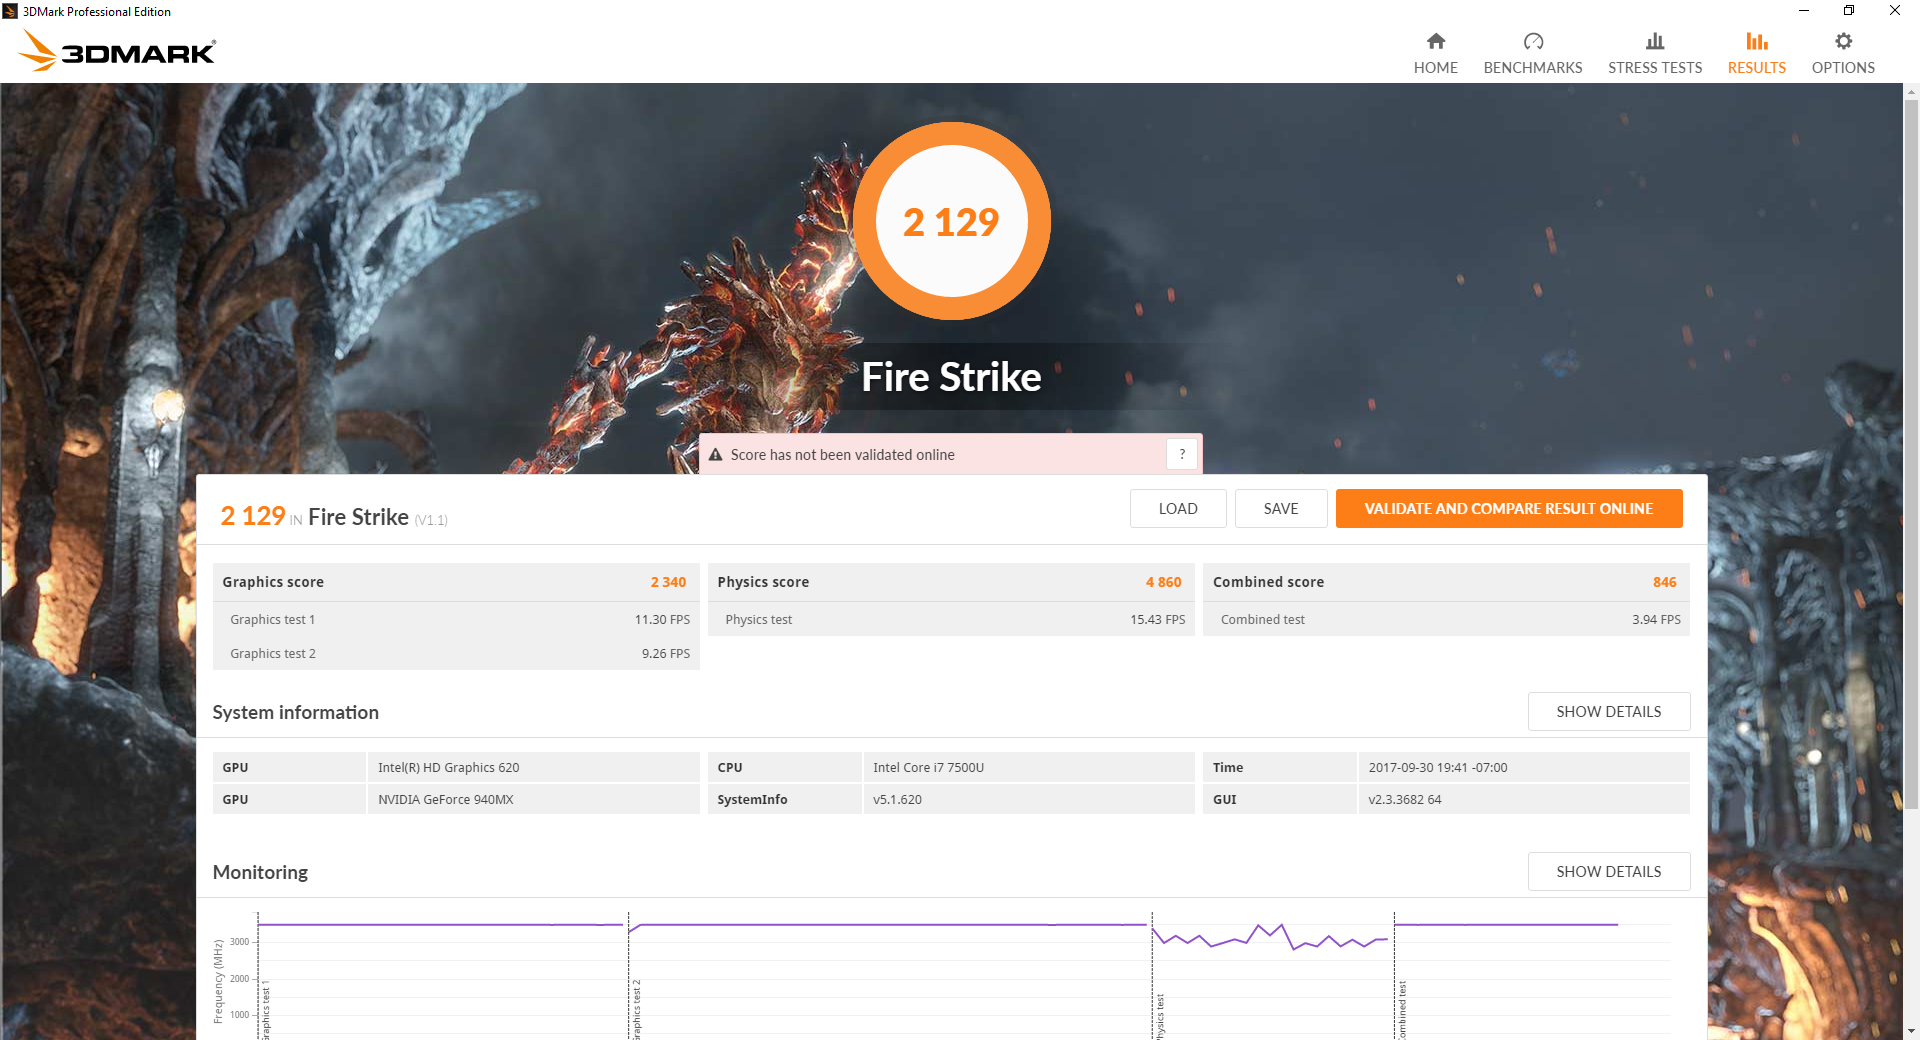
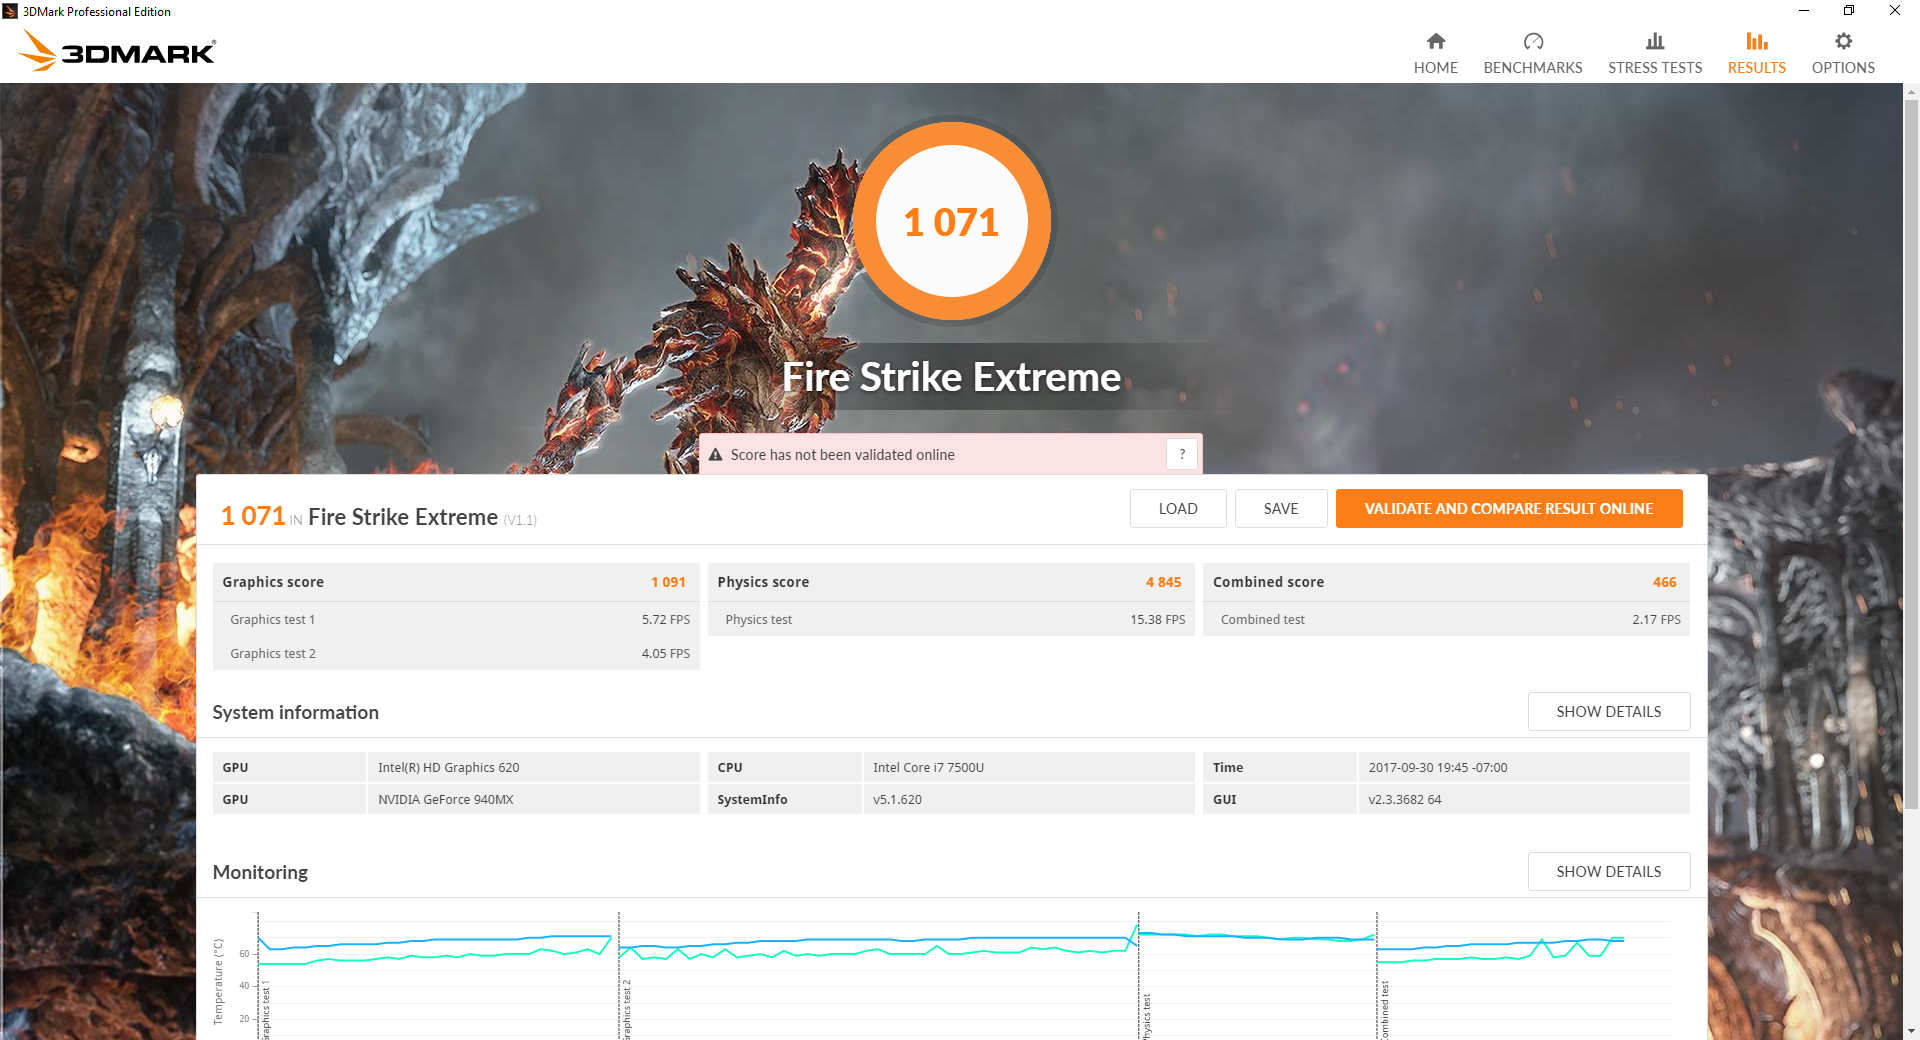
Moving up from the integrated HD Graphics 620 on the T470 to the GeForce 940MX in the ThinkPad 25 will bring a tangible graphics boost of 100 percent according to 3DMark 11. Heavier loads like Fire Strike see an even larger delta as the integrated GPU struggles harder against the increased demand. Of course, the increased graphics performance comes with higher power consumption as our next sections will show. Had Lenovo included the MX150 instead, graphics performance would have been about 60 percent faster than what we've recorded here on the 940MX.
Gaming performance is underwhelming as most newer titles are only playable on very low settings and at 768p. The aging 940MX struggles on modern 3D games, but older or less demanding titles like DOTA 2 will run satisfactorily.
See our review on the GeForce 940MX and dedicated GPU page for more technical information and benchmarks on the Nvidia GPU.
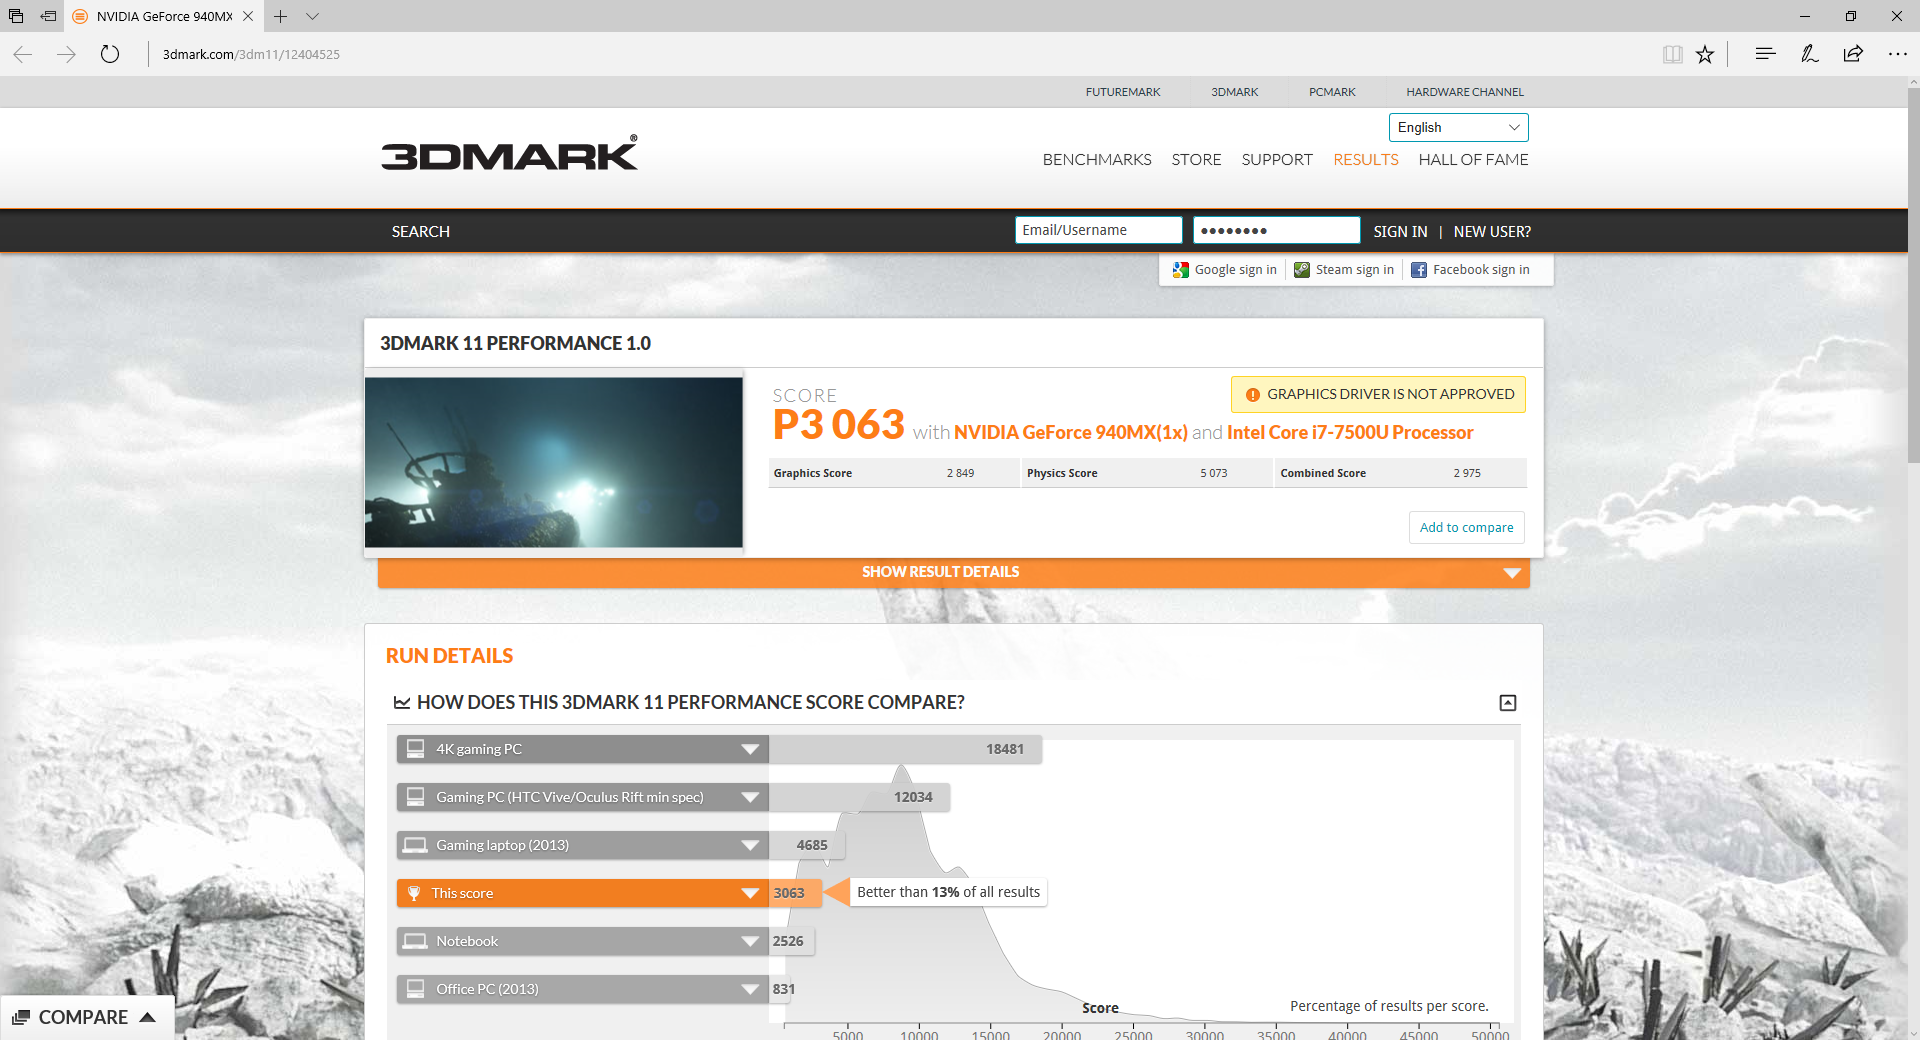
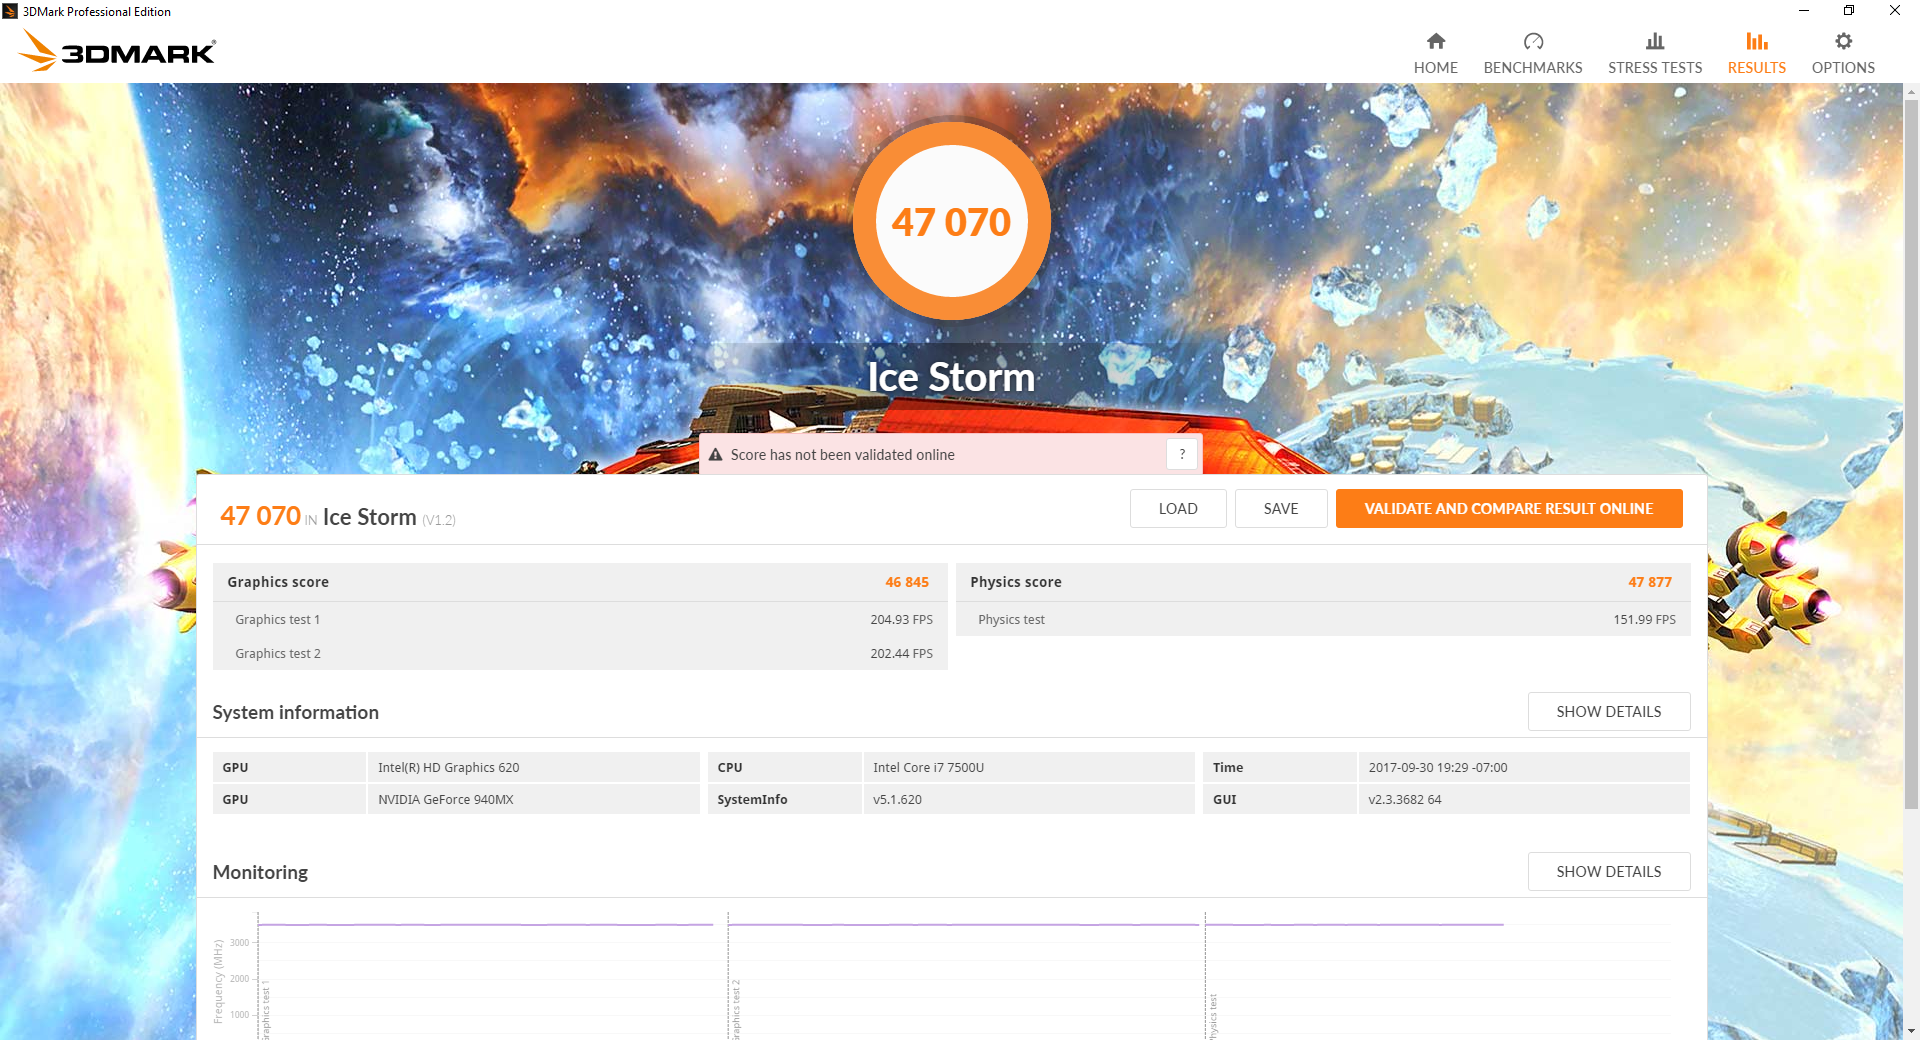
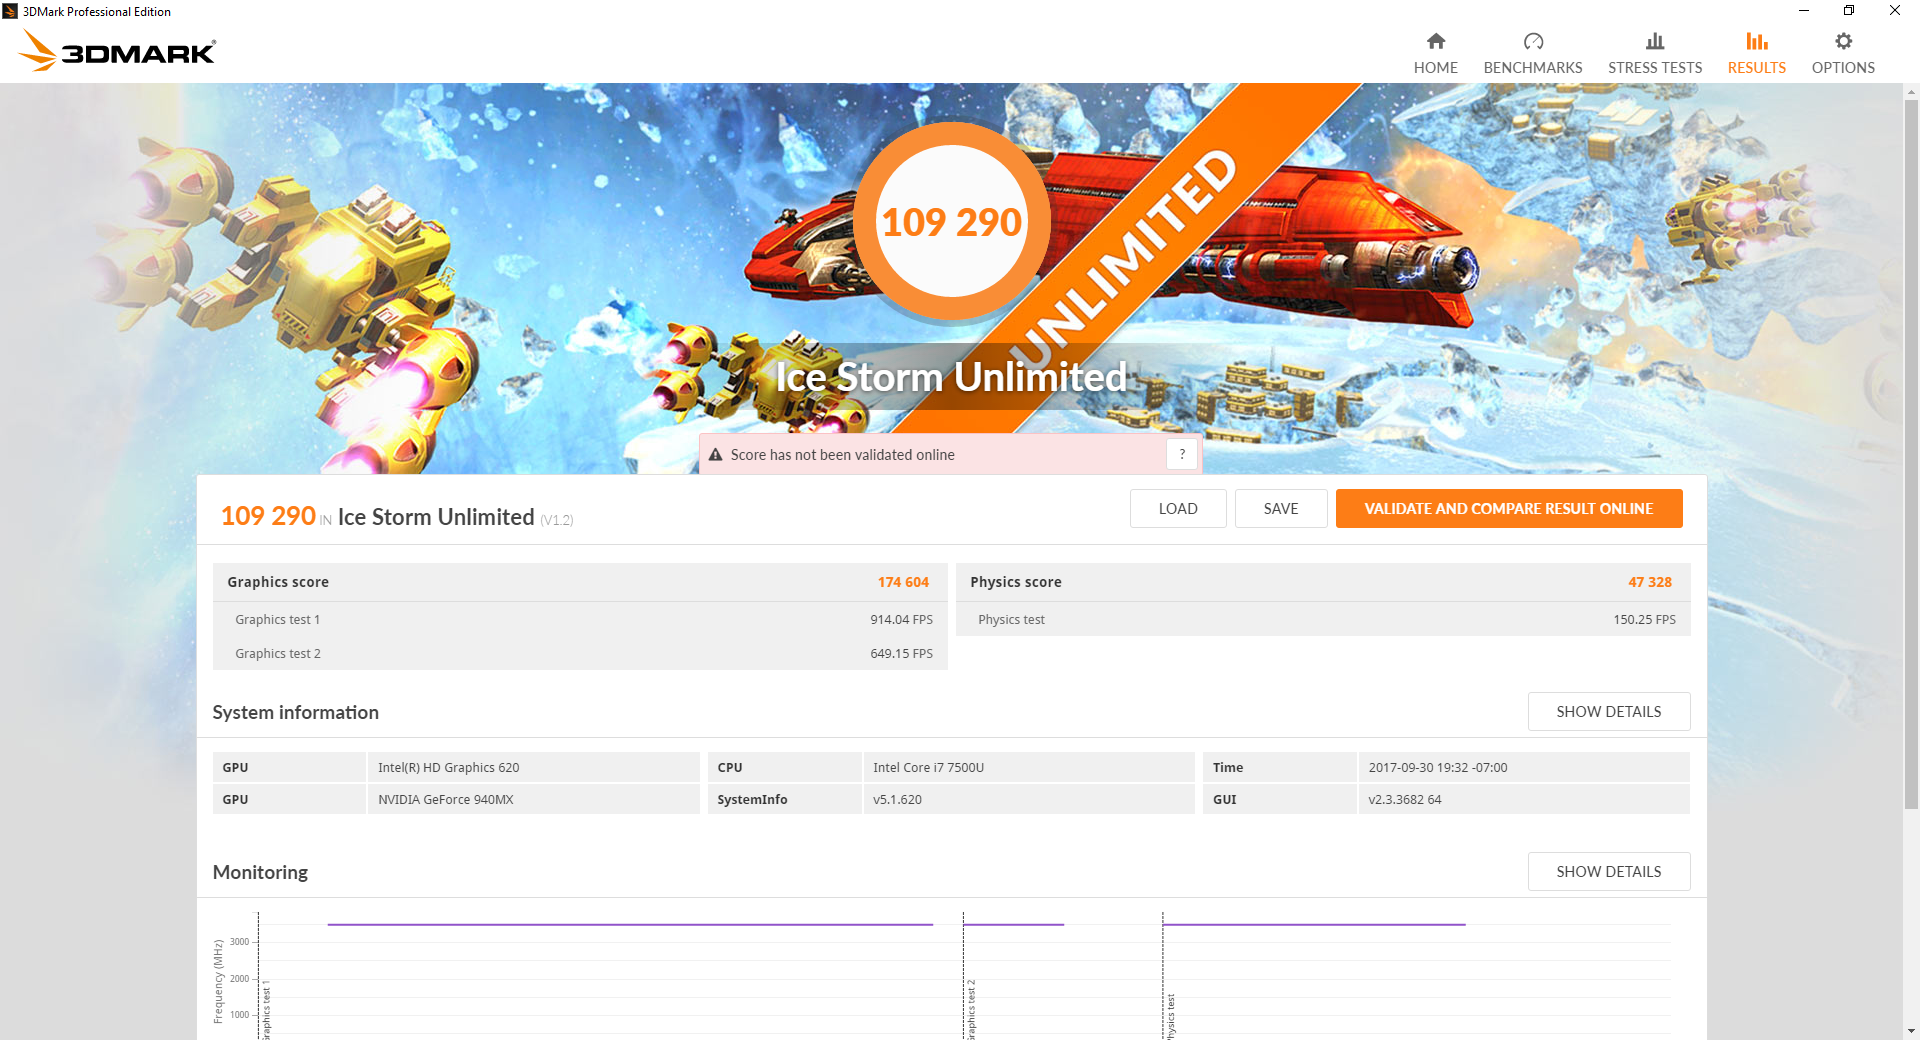
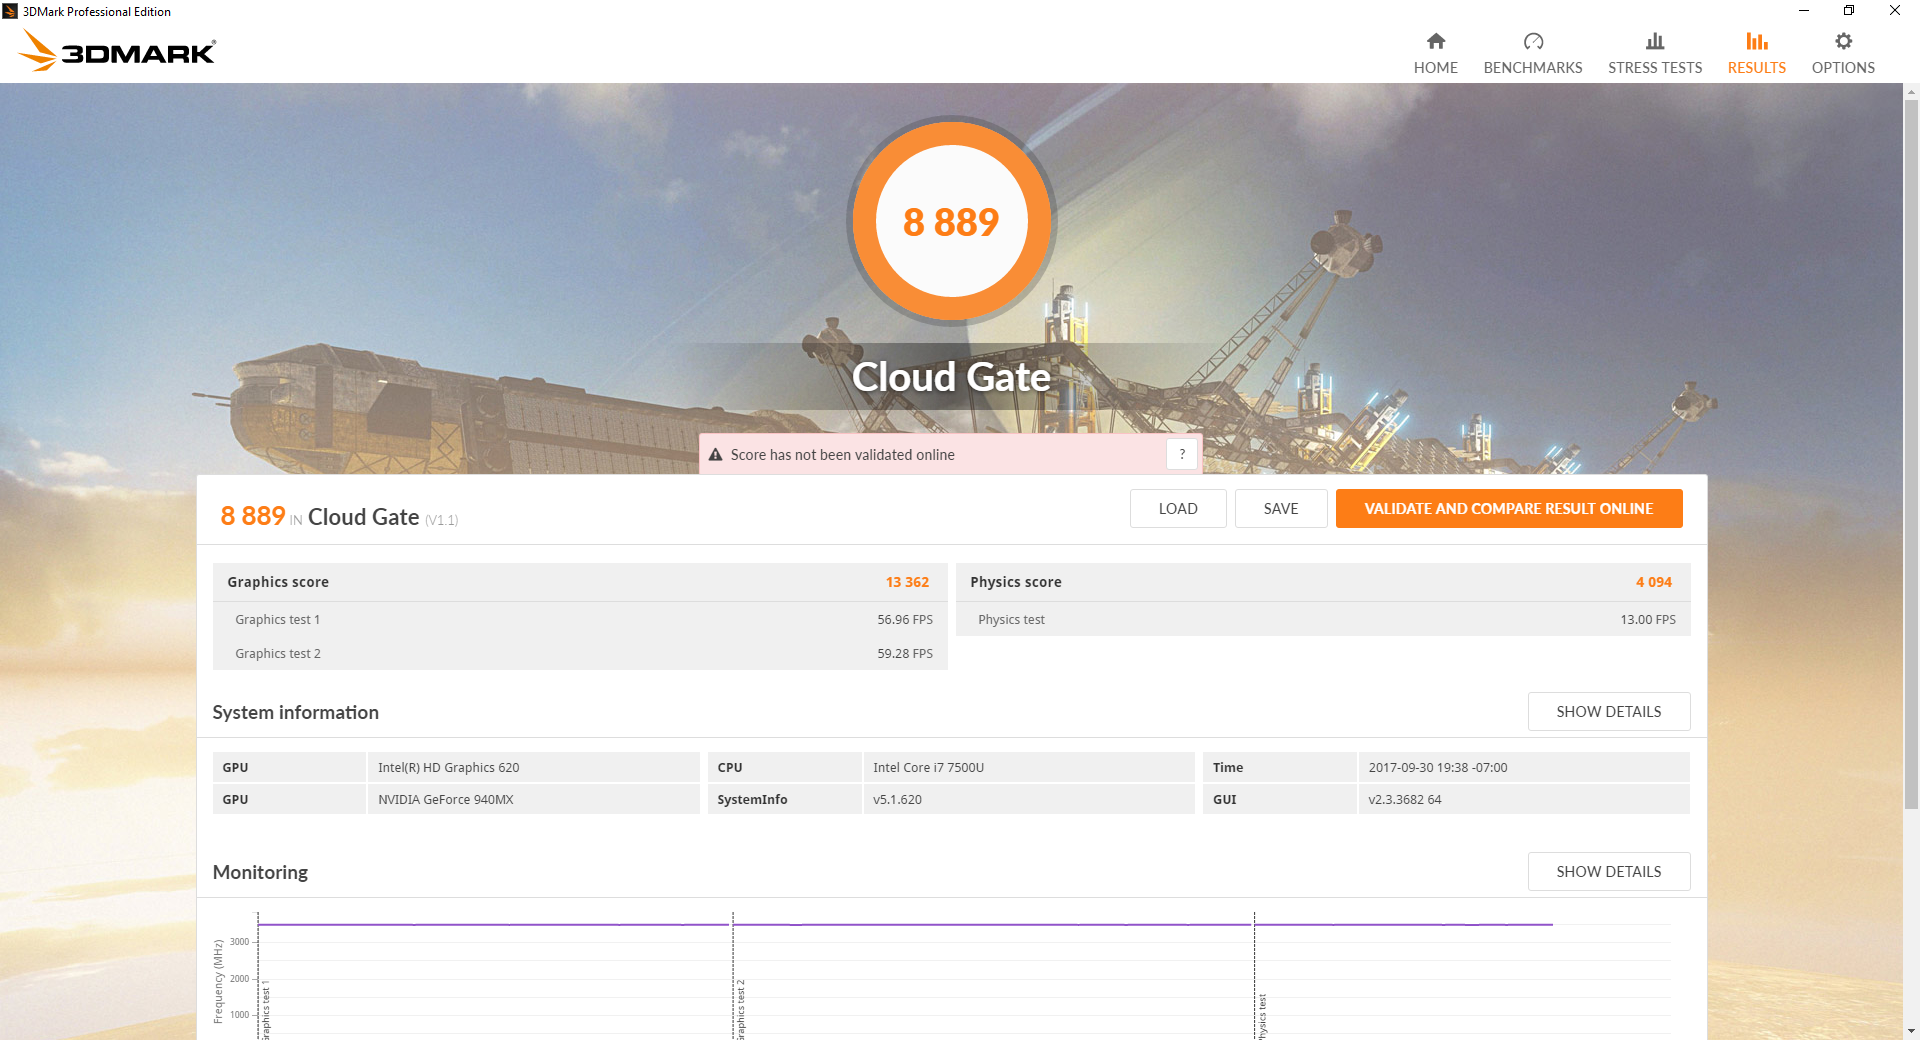
| 3DMark 11 Performance | 3063 points | |
| 3DMark Ice Storm Standard Score | 47070 points | |
| 3DMark Cloud Gate Standard Score | 8889 points | |
| 3DMark Fire Strike Score | 2129 points | |
| 3DMark Fire Strike Extreme Score | 1071 points | |
Help | ||
| low | med. | high | ultra | |
|---|---|---|---|---|
| BioShock Infinite (2013) | 126.1 | 72.1 | 61.7 | 23.9 |
| The Witcher 3 (2015) | 45.4 | 26 | 15.1 | |
| Rise of the Tomb Raider (2016) | 52.8 | 30 | 16.4 | 13.3 |
Stress Test
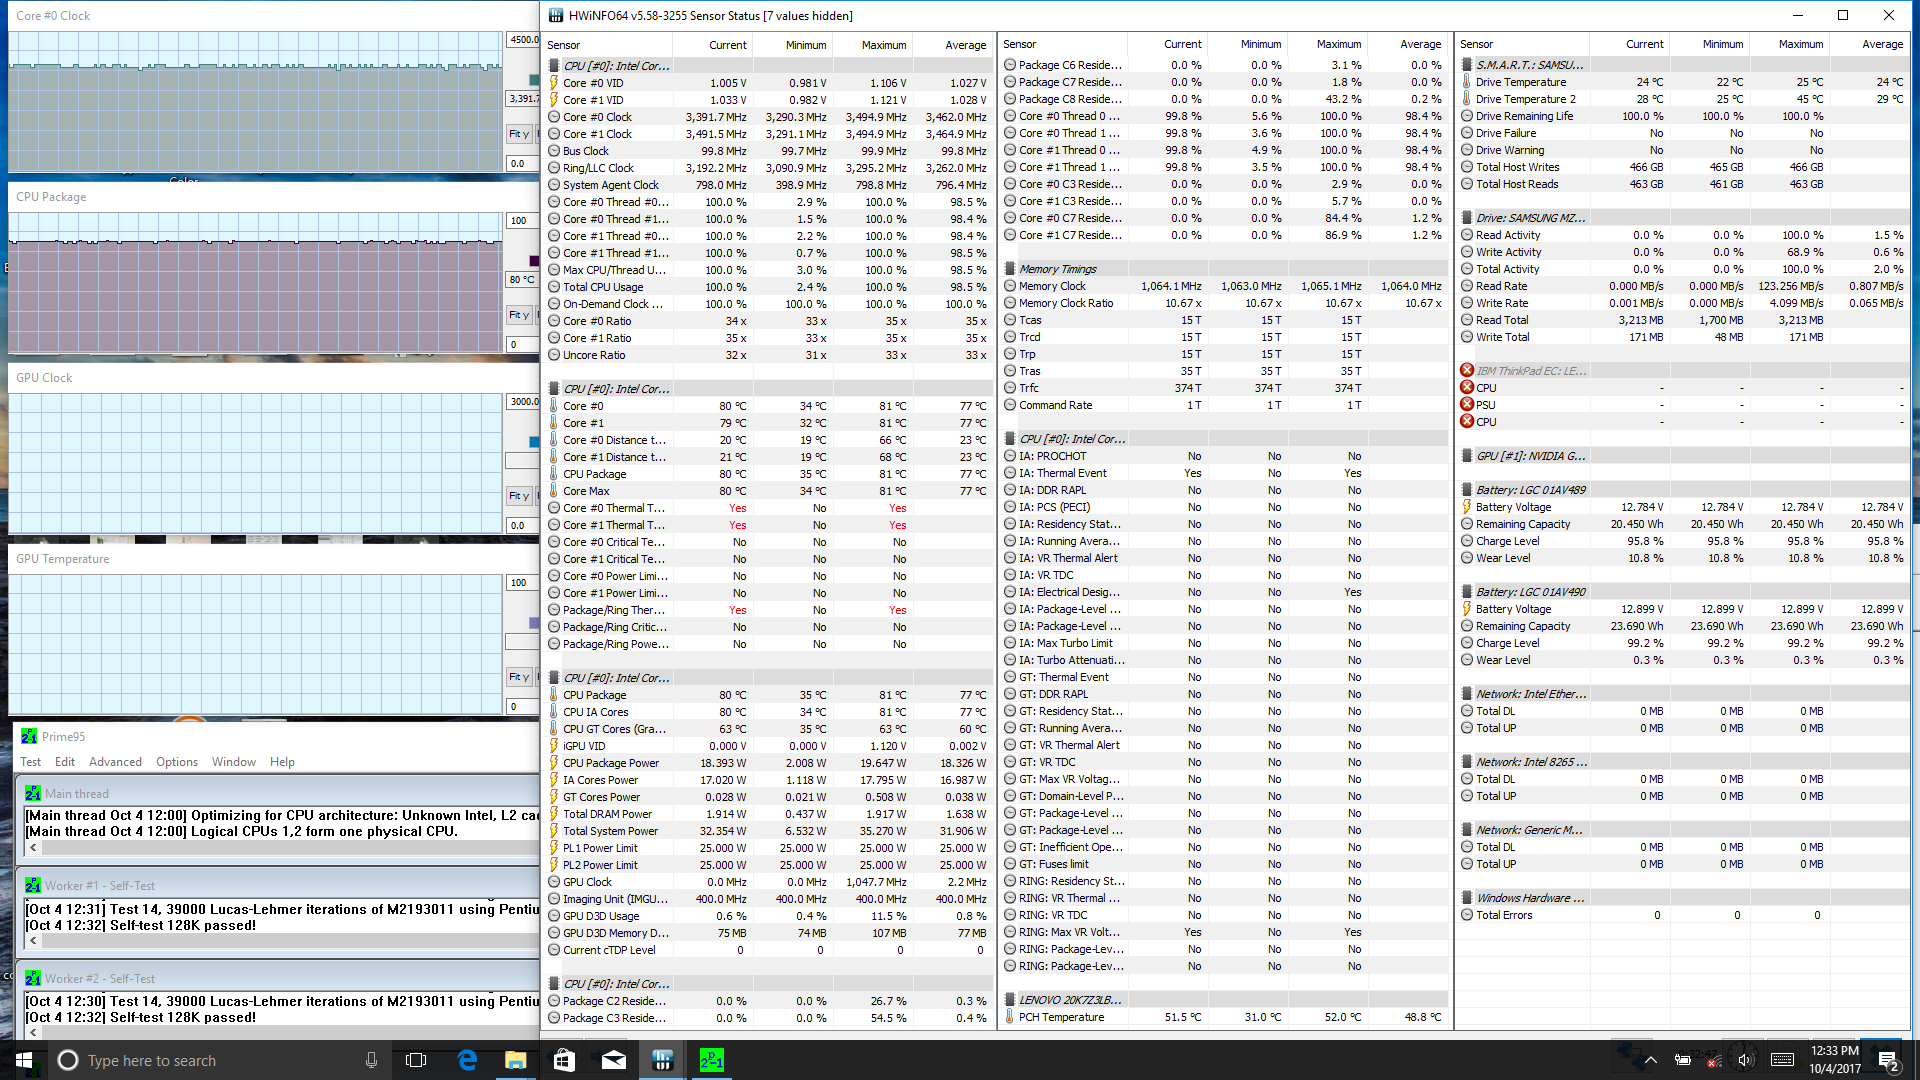
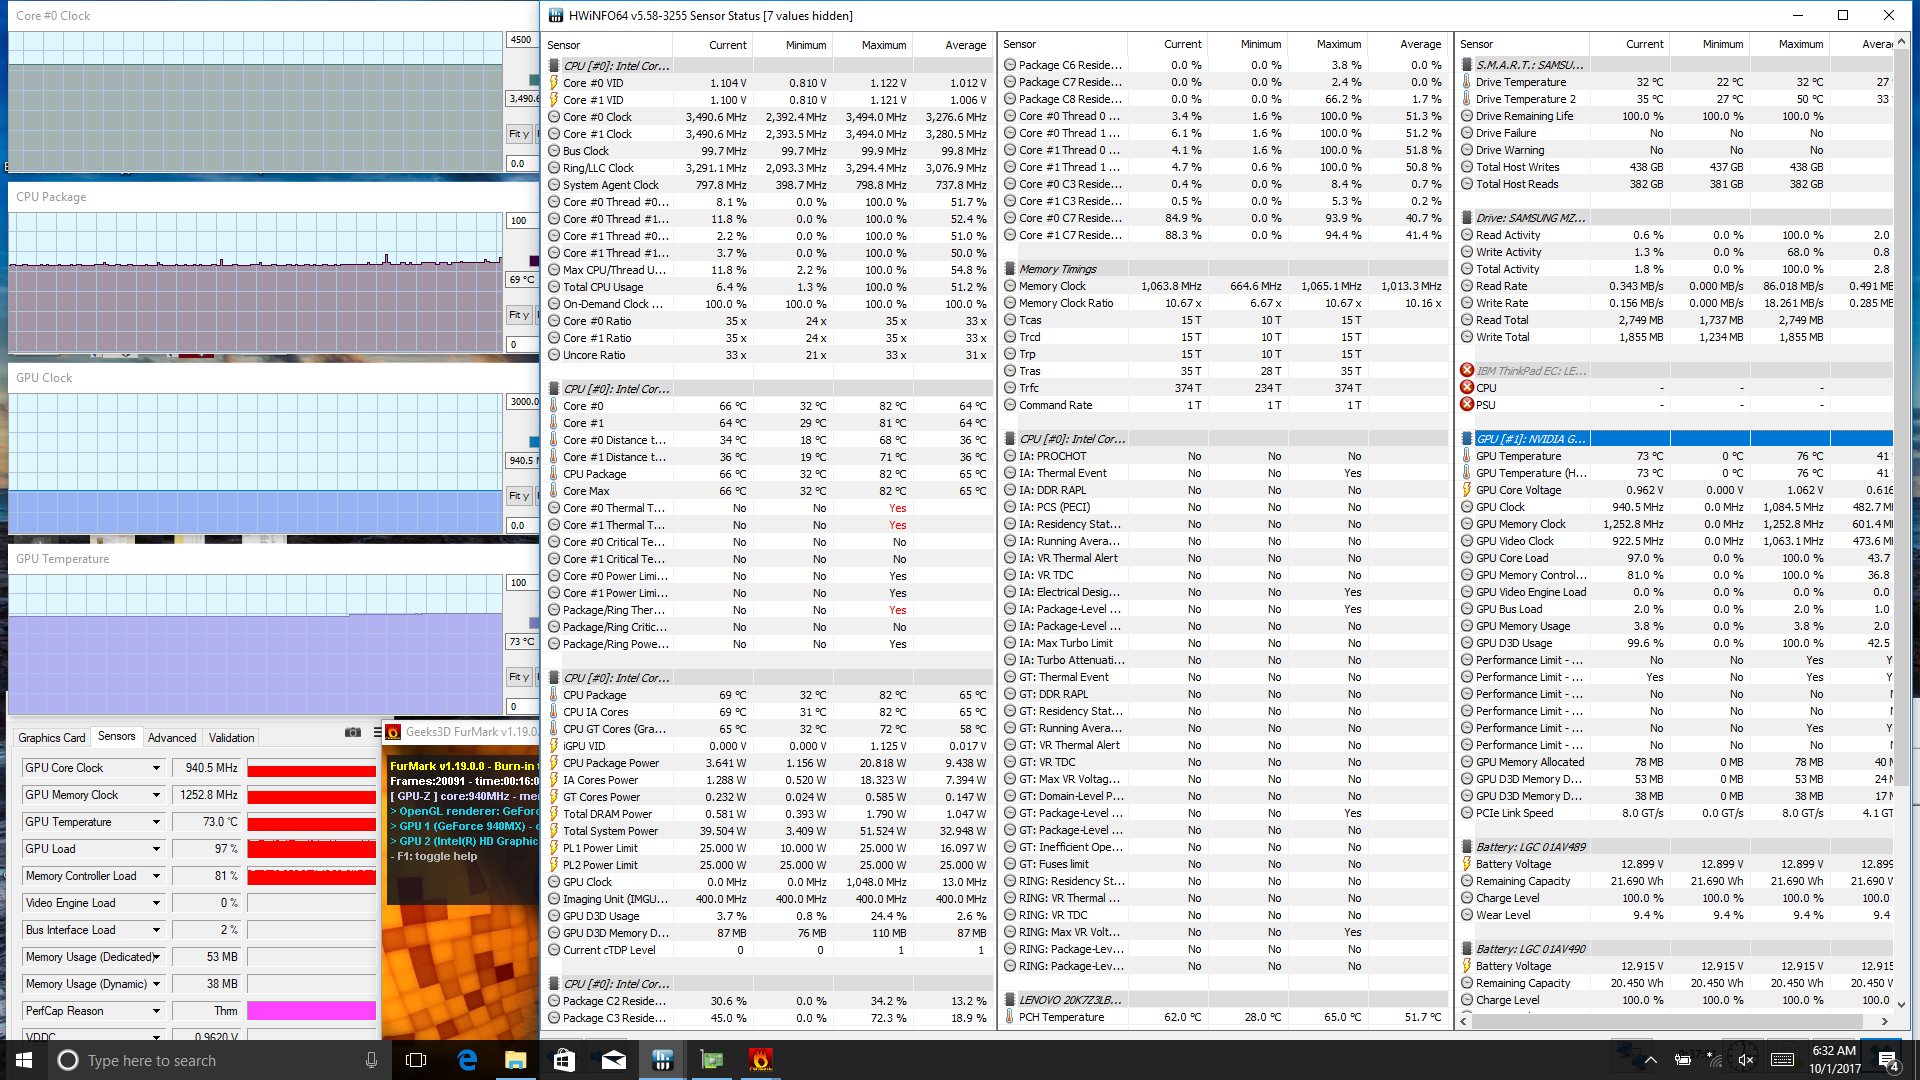
We stress the notebook with unrealistic loads in order to identify for any potential throttling or stability issues. Running Prime95 to stress the CPU shows a steady CPU clock rate of 3.4 - 3.5 GHz or 700 - 800 MHz above the base clock rate of the i7-7500U. This is the maximum rated Turbo Boost for the CPU and it's excellent to see it run at near capacity on the ThinkPad 25. The data also correlates with our steady CineBench R15 loop scores from above, though core temperature will be very warm as a result at just under 80 C. Running both Prime95 and FurMark simultaneously will severely throttle the CPU down to just 400 MHz while the GPU operates comfortably at 1085 MHz. CPU temperature drops to just 66 C to imply that a specific temperature ceiling had been reached for the throttling to occur.
Witcher 3 stress is a more representative of real-world stress than the benchmarks used above. Both the CPU and GPU operate above their respective base clock rates and at a steady mid 70 C range each. Idling on Witcher 3 for over an hour also shows no performance drops over time as our graph below shows.
Running on battery power will not dramatically impact CPU or GPU performance. A 3DMark 11 run on batteries returns Physics and Graphics scores of 4899 and 2895 points, respectively, compared to 5073 and 2849 points when on mains.
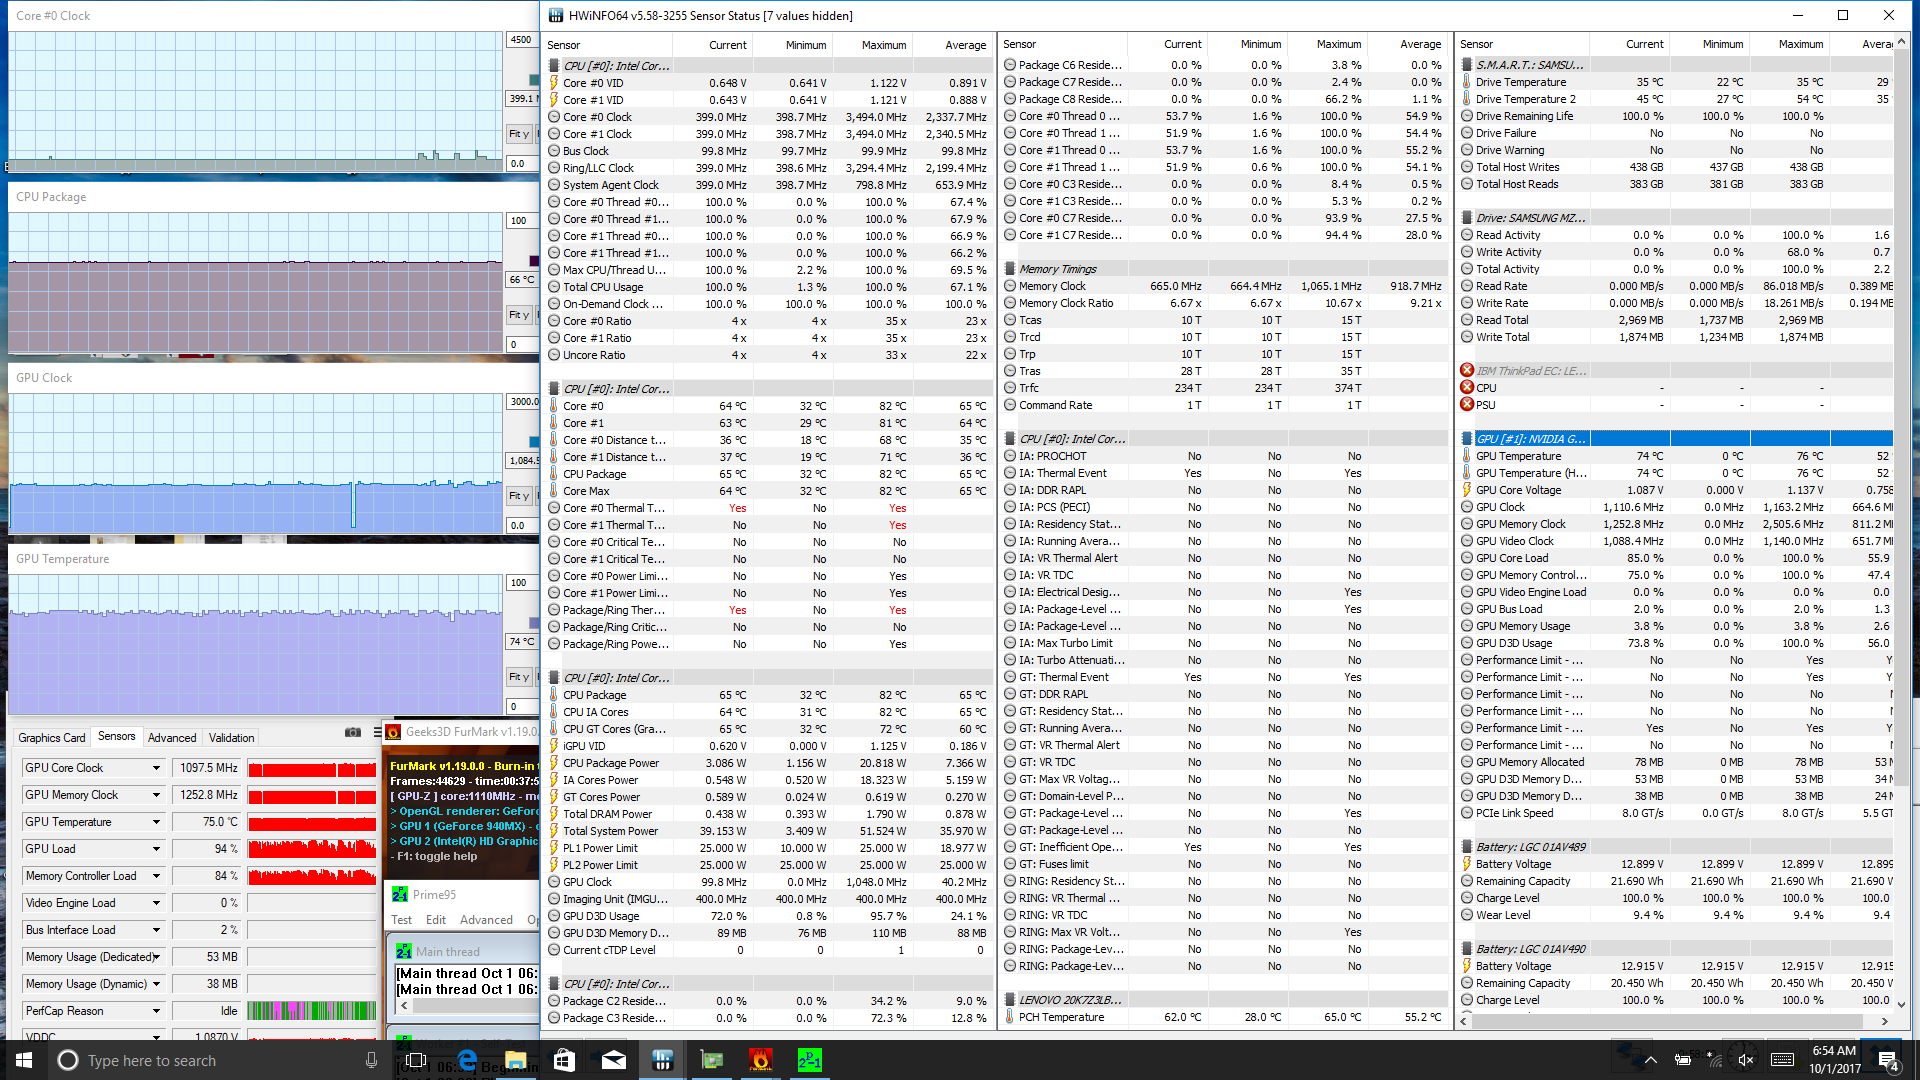
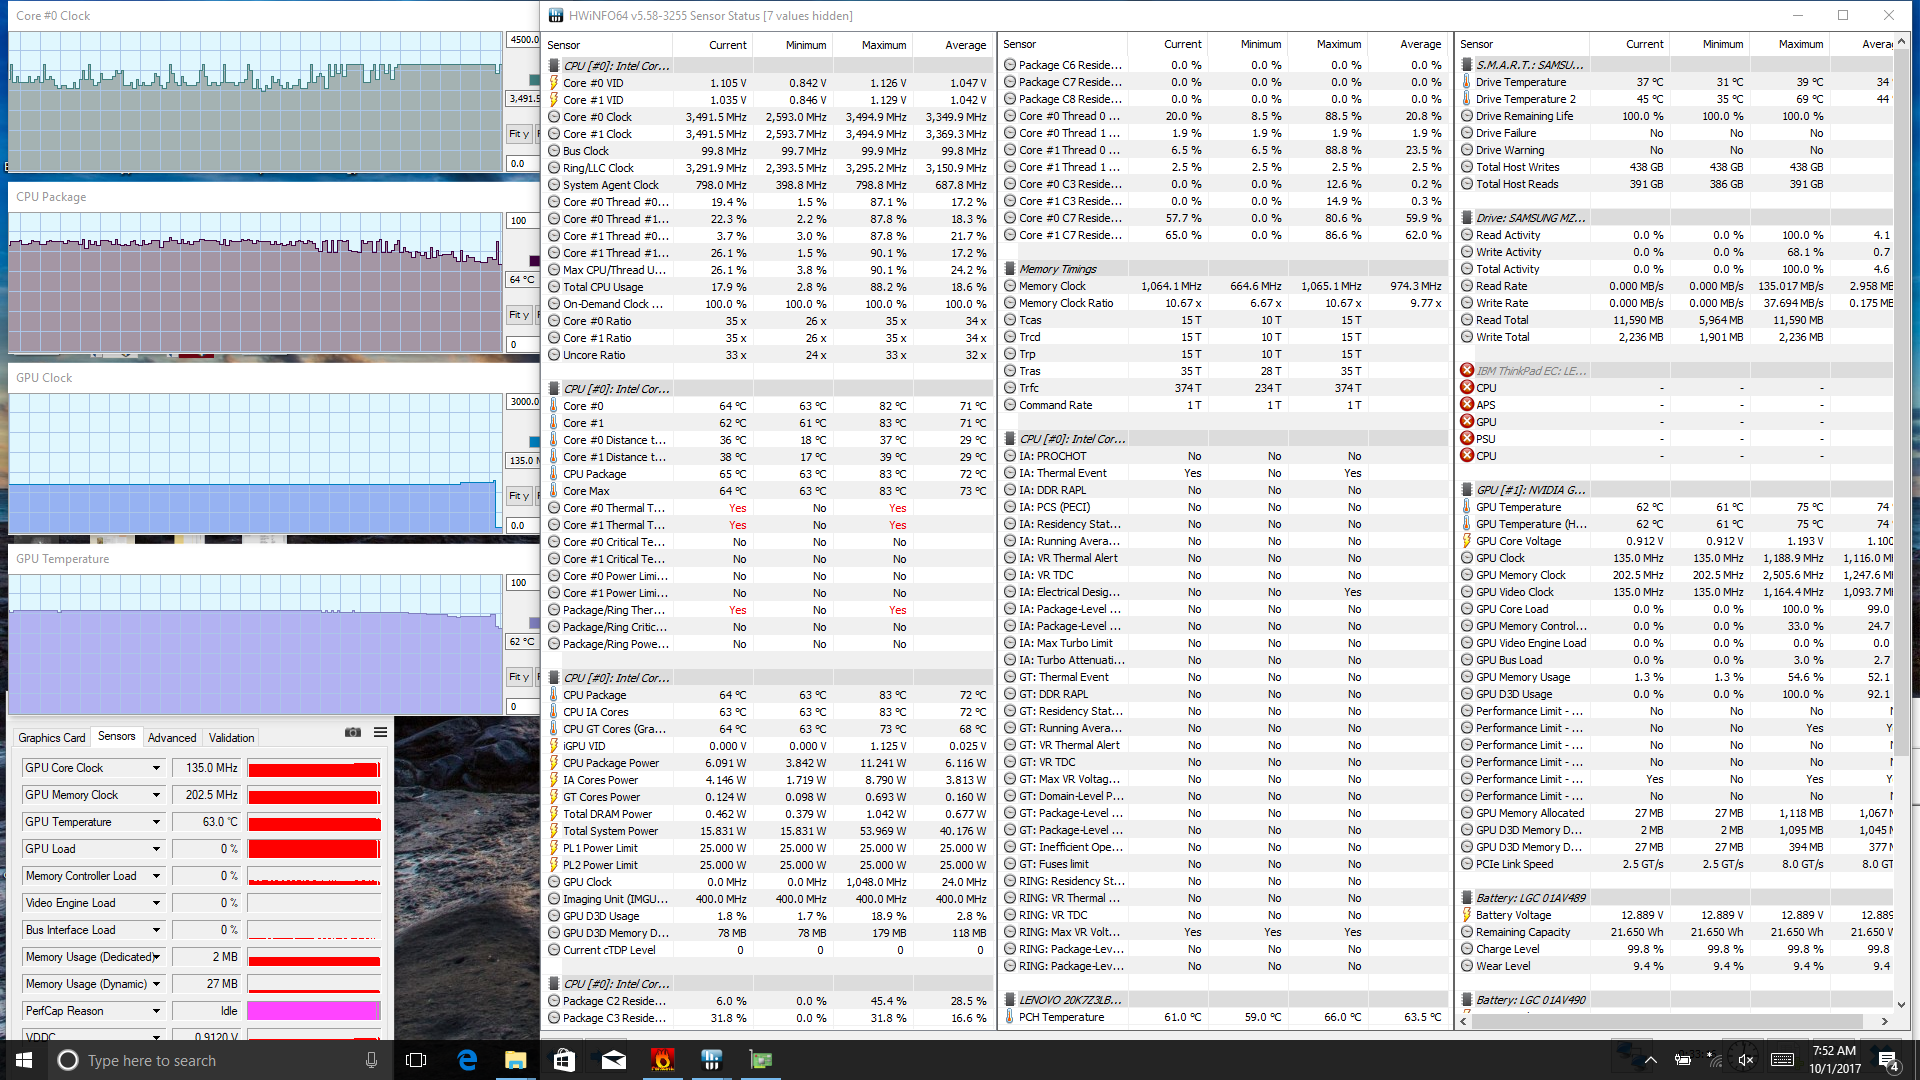
| CPU Clock (GHz) | GPU Clock (MHz) | Average CPU Temperature (°C) | Average GPU Temperature (°C) | |
| Prime95 Stress | 3.4 - 3.5 | -- | 80 | -- |
| FurMark Stress | -- | 941 | 69 | 73 |
| Prime95 + FurMark Stress | 0.4 | 1085 | 66 | 74 |
| Witcher 3 Stress | 2.8 - 3.5 | 1071 | 72 - 80 | 75 |
Emissions
System Noise
Fan behavior during low loads is essentially identical to the T470. The fan will idle if word processing, emailing, or performing light browsing. Slightly higher loads like streaming or light editing will initiate the fan to about 30 dB(A), which is still very quiet and barely noticeable in a typical office setting.
Higher loads like 3DMark06, Prime95, or Witcher 3 will all cause the fan to run at its maximum of 37.6 dB(A) to be noticeably louder than the lesser-equipped T470. Subjectively, the mid-to-high 30 dB(A) range is audible but not loud enough to be distracting during use. Many thinner Ultrabooks like the X1 Carbon can reach over 40 dB(A) when subjected to similar extreme loads.
We experienced no electronic noise or coil whine on our specific test unit.
Noise level
| Idle |
| 27.9 / 27.9 / 30 dB(A) |
| Load |
| 37.6 / 37.6 dB(A) |
 | ||
30 dB silent 40 dB(A) audible 50 dB(A) loud |
||
min: | ||
| Lenovo ThinkPad 25 GeForce 940MX, i7-7500U, Samsung SM961 MZVKW512HMJP m.2 PCI-e | Lenovo ThinkPad T470s-20HF0012US HD Graphics 620, i5-7300U, Samsung PM961 MZVLW256HEHP | Lenovo ThinkPad T470p-20J7S00000 GeForce 940MX, i7-7700HQ, Samsung PM961 NVMe MZVLW512HMJP | Apple MacBook Pro 13 2017 Iris Plus Graphics 640, i5-7360U, Apple SSD AP0128 | Lenovo ThinkPad T470-20HD002HGE HD Graphics 620, i5-7200U, Samsung PM961 NVMe MZVLW512HMJP | |
|---|---|---|---|---|---|
| Noise | -1% | -2% | -3% | 4% | |
| off / environment * (dB) | 27.9 | 27.8 -0% | 29 -4% | 30.2 -8% | 28 -0% |
| Idle Minimum * (dB) | 27.9 | 27.8 -0% | 29 -4% | 30.2 -8% | 28 -0% |
| Idle Average * (dB) | 27.9 | 27.8 -0% | 29 -4% | 30.2 -8% | 28 -0% |
| Idle Maximum * (dB) | 30 | 27.8 7% | 29 3% | 30.2 -1% | 29.4 2% |
| Load Average * (dB) | 37.6 | 34.8 7% | 35.6 5% | 32.9 13% | 31.4 16% |
| Witcher 3 ultra * (dB) | 37.6 | 42 -12% | |||
| Load Maximum * (dB) | 37.6 | 42 -12% | 39.7 -6% | 39.3 -5% | 34.6 8% |
* ... smaller is better
Temperature
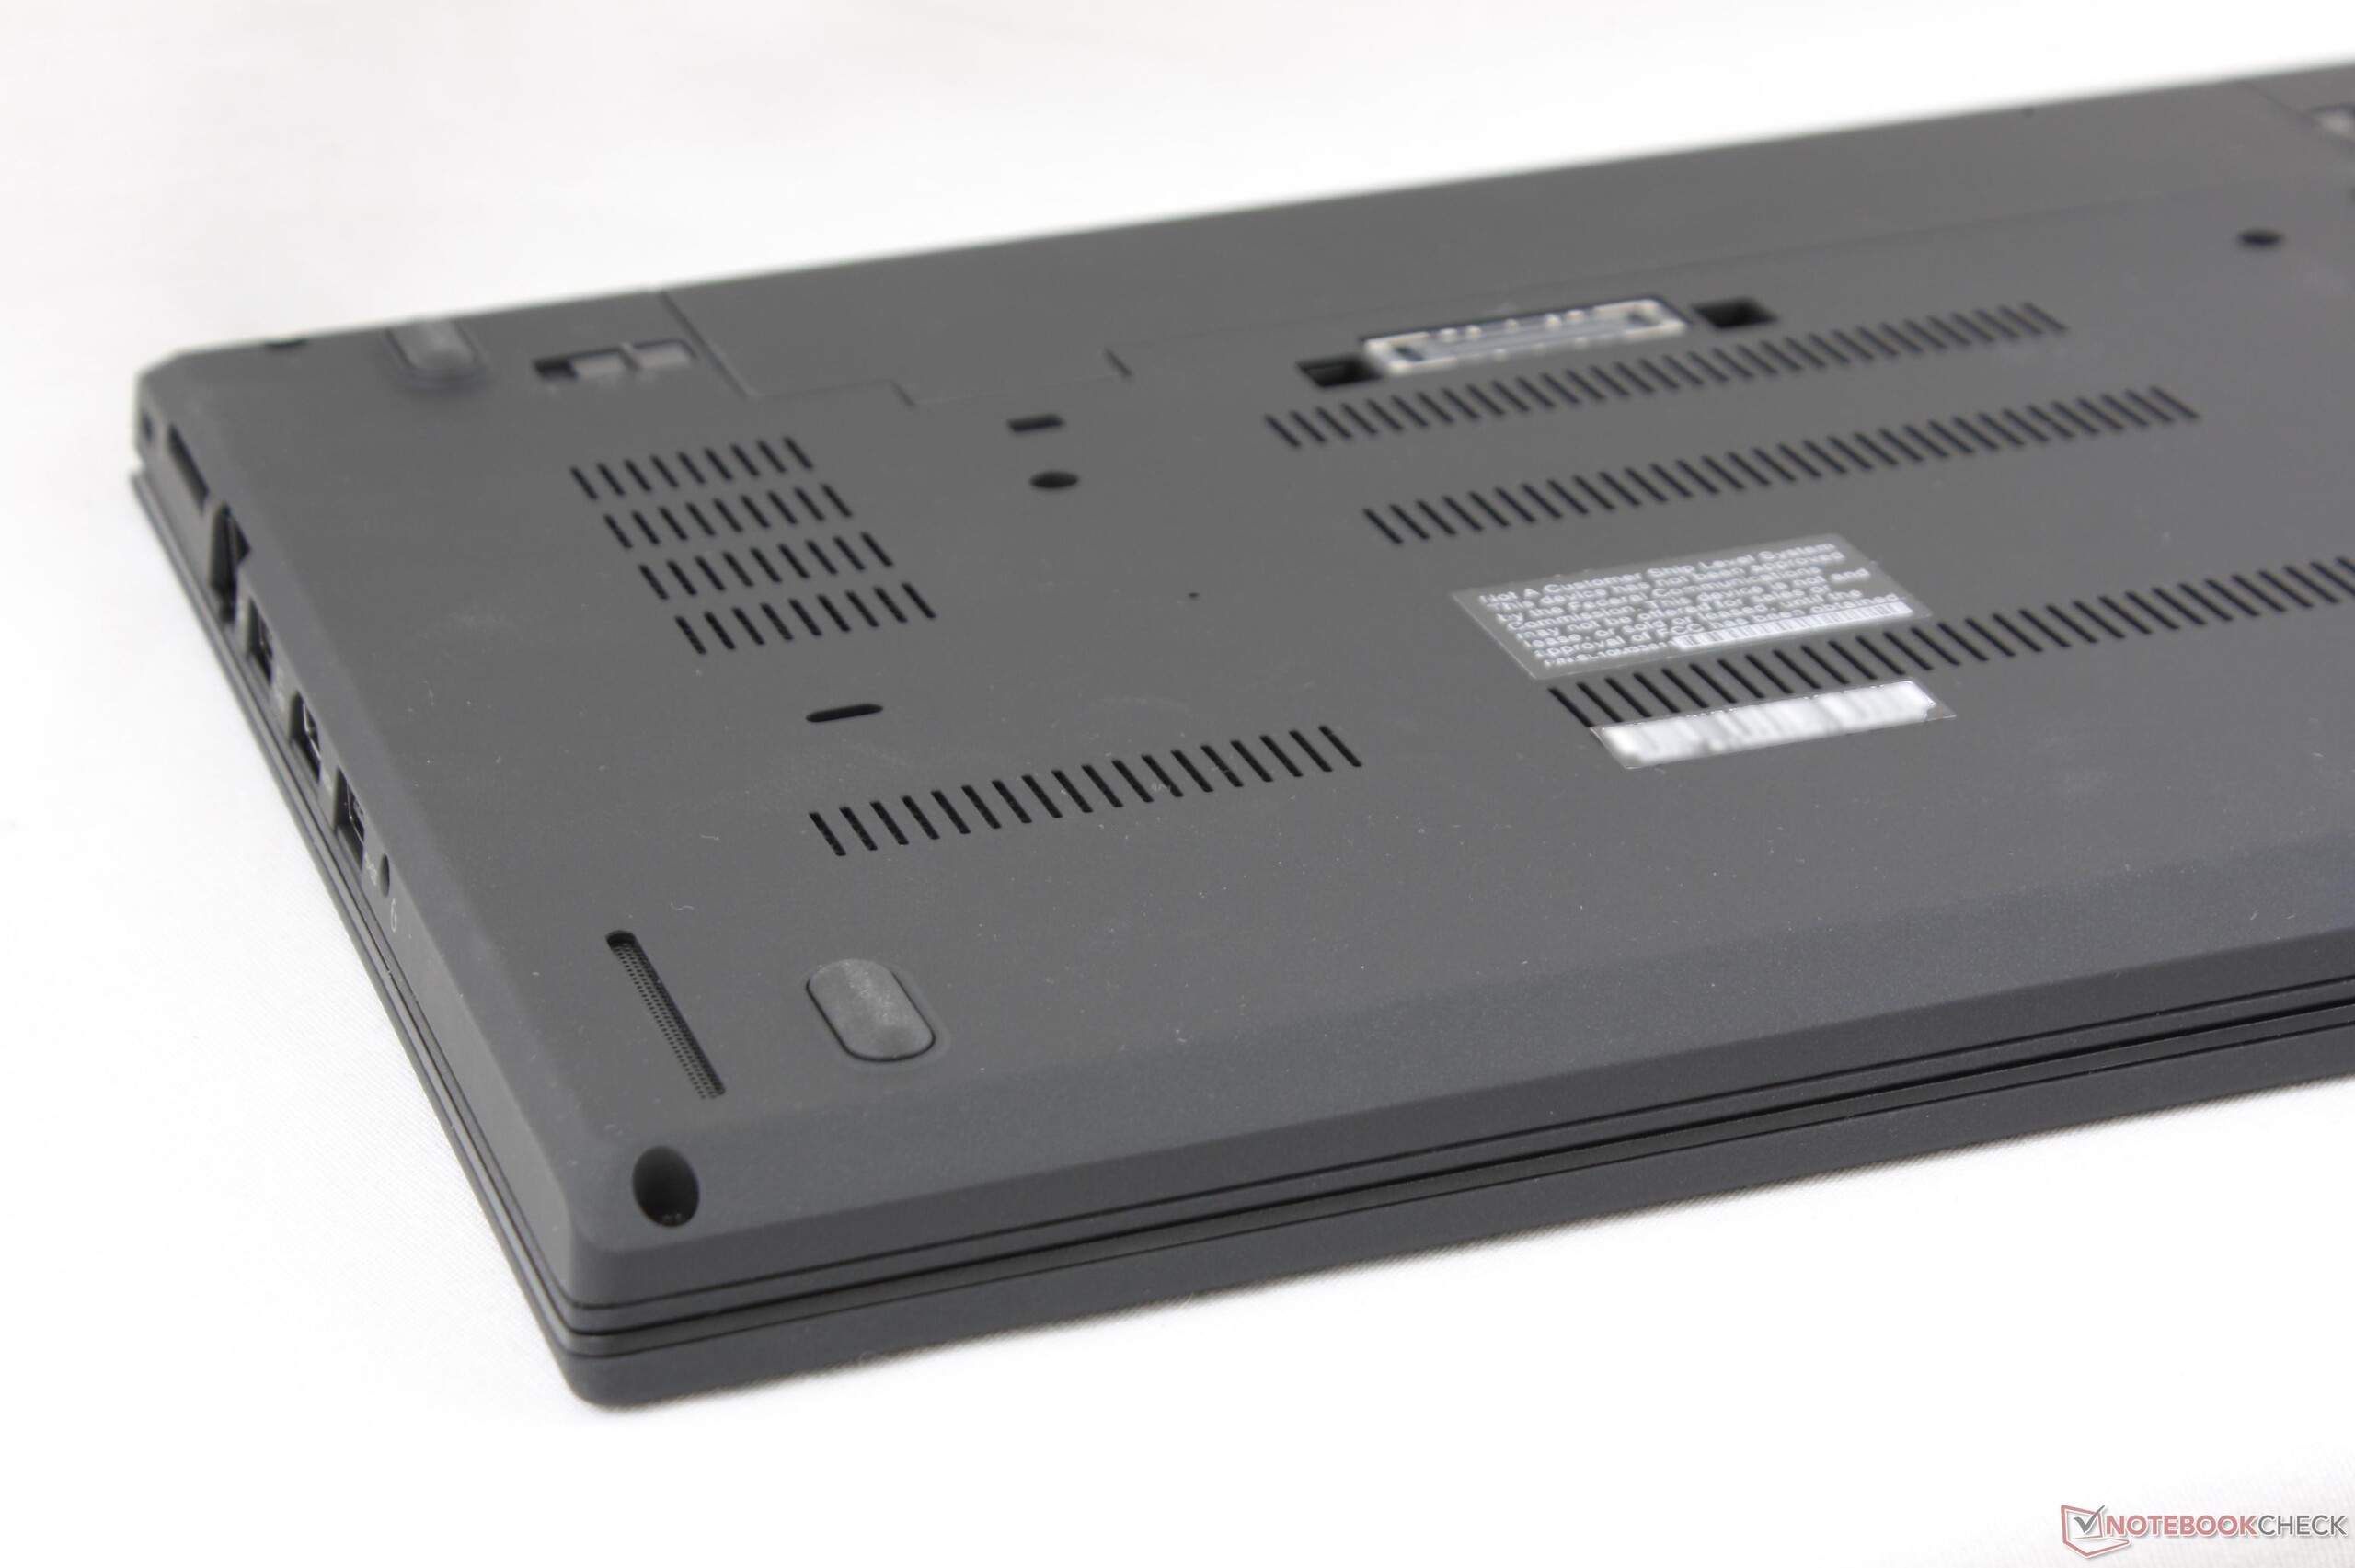
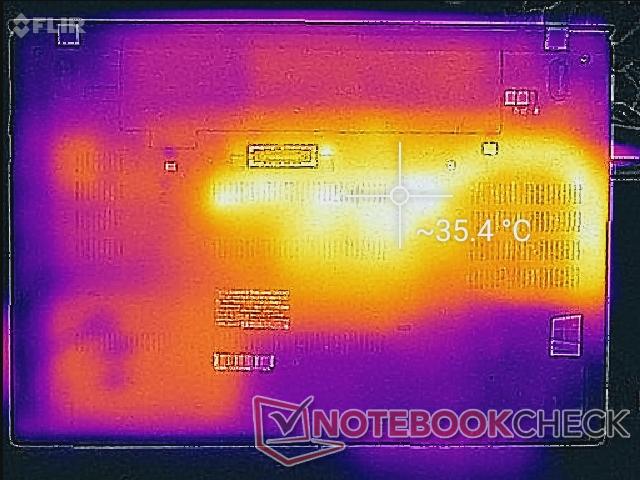
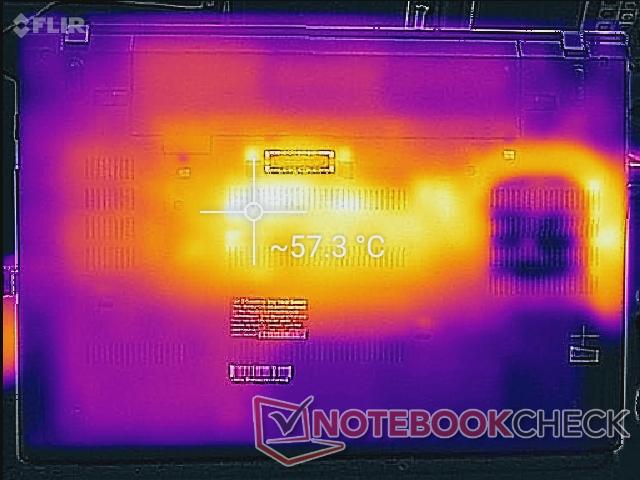
Surface temperatures when idling are relatively flat on top while hot spots on the bottom are always noticeable near the heat pipes. These bottom hot spots can become as warm as 57 C when gaming or under extreme processing loads to be uncomfortable to use without a proper desk. Furthermore, the positioning of the ventilation grilles makes it very easy to obstruct airflow if using the notebook on one's lap. We don't recommend running very high loads unless if the notebook is set on a flat surface. The palm rests and keyboard temperatures are otherwise mostly even between the left- and right-hand sides of the notebook despite being quite warm at about 40 C.
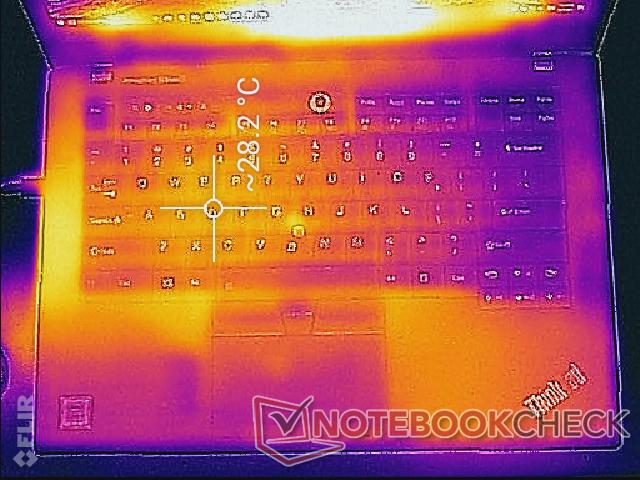
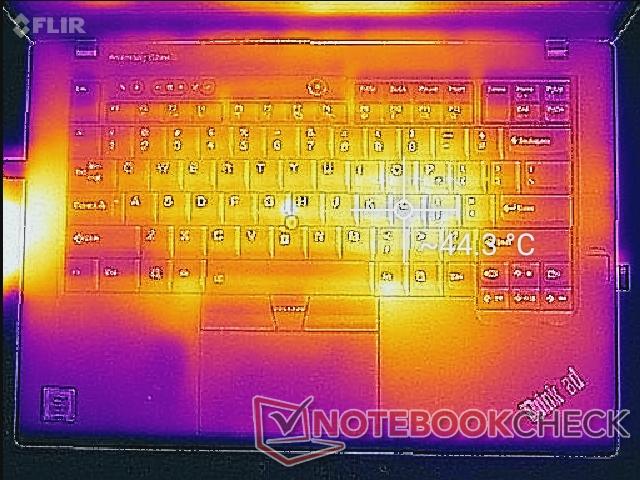
(±) The maximum temperature on the upper side is 43.6 °C / 110 F, compared to the average of 34.3 °C / 94 F, ranging from 21.2 to 62.5 °C for the class Office.
(-) The bottom heats up to a maximum of 57.2 °C / 135 F, compared to the average of 36.8 °C / 98 F
(+) In idle usage, the average temperature for the upper side is 27.2 °C / 81 F, compared to the device average of 29.5 °C / 85 F.
(±) Playing The Witcher 3, the average temperature for the upper side is 33.6 °C / 92 F, compared to the device average of 29.5 °C / 85 F.
(±) The palmrests and touchpad can get very hot to the touch with a maximum of 36.6 °C / 97.9 F.
(-) The average temperature of the palmrest area of similar devices was 27.5 °C / 81.5 F (-9.1 °C / -16.4 F).
Speakers

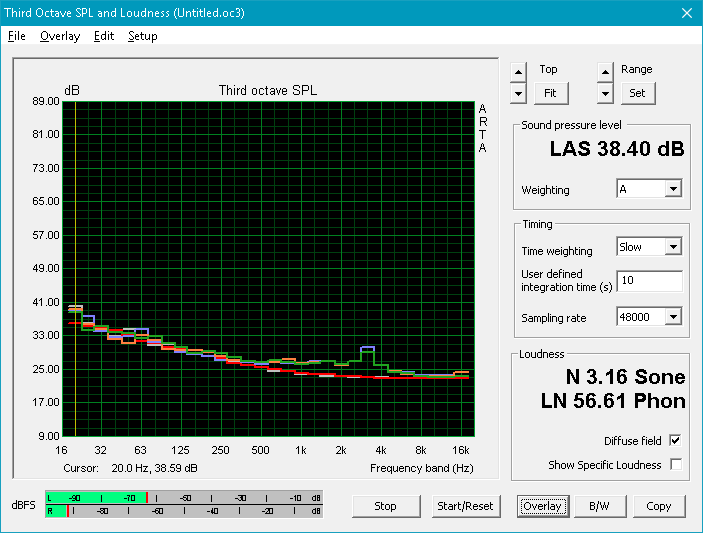
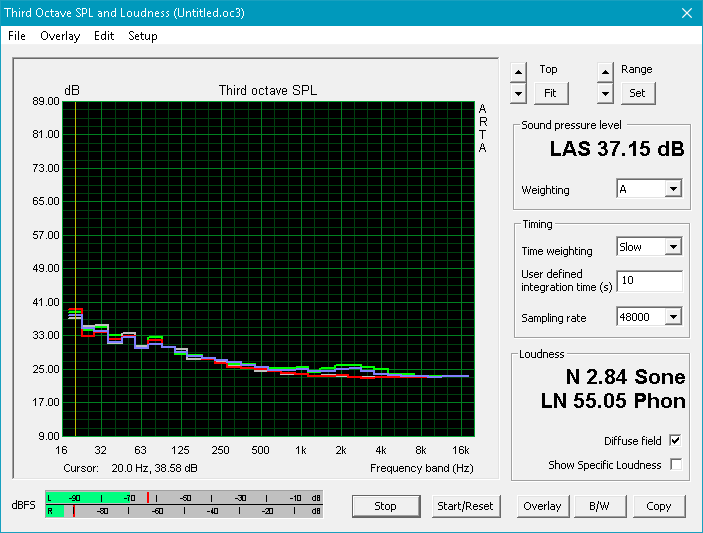
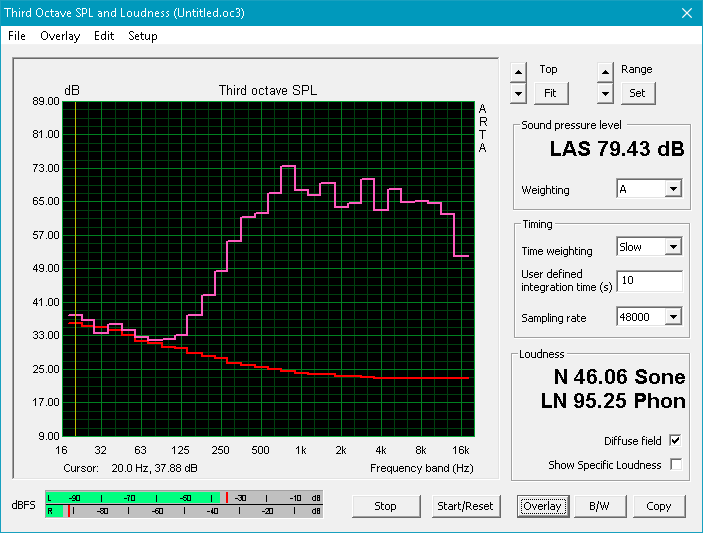
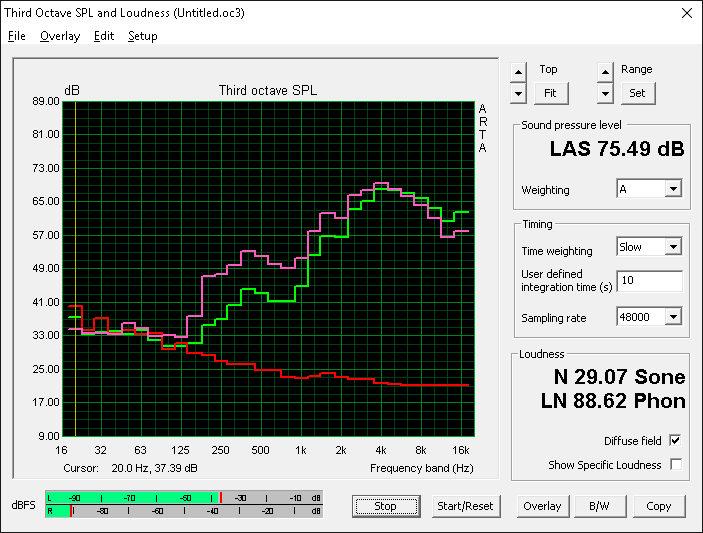
Sound quality from the 2 W stereo speakers is tinny and is more similar to the speakers of cheaper netbooks than those on multimedia notebooks. Pink noise measurements show poor bass reproduction especially at frequencies under 500 Hz. Notebooks with flatter pink curves that extend across a wider range of frequencies are better suited for music and movie playback. For conferencing purposes, however, the ThinkPad 25 is sufficient if not underwhelming since voices tend to sound higher-pitched than normal. High volume settings will not introduce any rattling or static. Headsets or external speakers are recommended for multimedia playback.
Lenovo ThinkPad 25 audio analysis
(±) | speaker loudness is average but good (73.6 dB)
Bass 100 - 315 Hz
(-) | nearly no bass - on average 22% lower than median
(±) | linearity of bass is average (9.9% delta to prev. frequency)
Mids 400 - 2000 Hz
(+) | balanced mids - only 3.7% away from median
(±) | linearity of mids is average (10.7% delta to prev. frequency)
Highs 2 - 16 kHz
(+) | balanced highs - only 2.3% away from median
(±) | linearity of highs is average (8.3% delta to prev. frequency)
Overall 100 - 16.000 Hz
(±) | linearity of overall sound is average (22.6% difference to median)
Compared to same class
» 61% of all tested devices in this class were better, 8% similar, 31% worse
» The best had a delta of 7%, average was 21%, worst was 53%
Compared to all devices tested
» 67% of all tested devices were better, 6% similar, 28% worse
» The best had a delta of 4%, average was 23%, worst was 134%
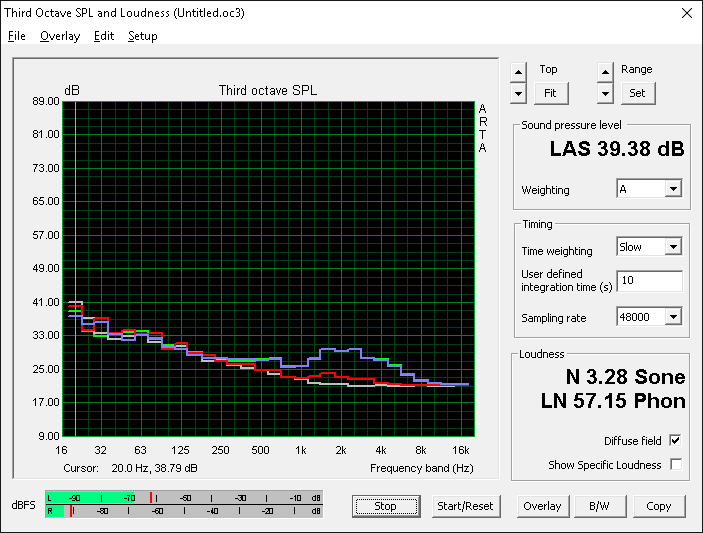
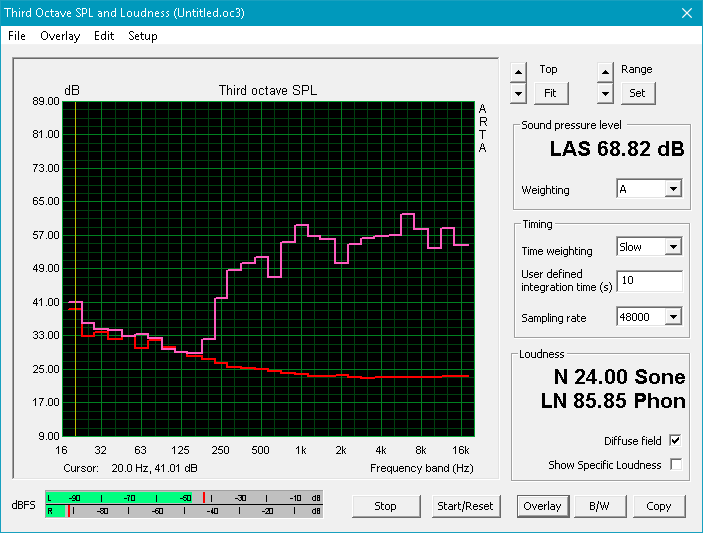
Apple MacBook 12 (Early 2016) 1.1 GHz audio analysis
(+) | speakers can play relatively loud (83.6 dB)
Bass 100 - 315 Hz
(±) | reduced bass - on average 11.3% lower than median
(±) | linearity of bass is average (14.2% delta to prev. frequency)
Mids 400 - 2000 Hz
(+) | balanced mids - only 2.4% away from median
(+) | mids are linear (5.5% delta to prev. frequency)
Highs 2 - 16 kHz
(+) | balanced highs - only 2% away from median
(+) | highs are linear (4.5% delta to prev. frequency)
Overall 100 - 16.000 Hz
(+) | overall sound is linear (10.2% difference to median)
Compared to same class
» 7% of all tested devices in this class were better, 2% similar, 90% worse
» The best had a delta of 5%, average was 18%, worst was 53%
Compared to all devices tested
» 5% of all tested devices were better, 1% similar, 94% worse
» The best had a delta of 4%, average was 23%, worst was 134%
Frequency Comparison (Checkbox selectable!)
Graph 1: Pink Noise 100% Vol.; Graph 2: Audio off
Energy Management
Power Consumption
Idling on desktop will demand anywhere from 4 W to 8 W depending on the Power Profile and brightness setting while medium loads as represented by 3DMark06 will draw about 55 W. The T470 and T470s are each more energy efficient by as much as 20 W to 30 W since they lack the more powerful Nvidia GPU.
The small power adapter (~11.0 x 4.6 x 2.8 cm) is rated for up to 65 W while the highest we can record is 64 W when at maximum CPU and GPU utilization. There is absolutely no overhead whereas most notebooks typically have adapters that are rated at least 10 percent higher than what the system can effectively draw at maximum load capacity. Perhaps a more capable adapter would have been best for the ThinkPad 25.
| Off / Standby | |
| Idle | |
| Load |
|
Key:
min: | |
| Lenovo ThinkPad 25 i7-7500U, GeForce 940MX, Samsung SM961 MZVKW512HMJP m.2 PCI-e, IPS, 1920x1080, 14" | Lenovo ThinkPad T470s-20HF0012US i5-7300U, HD Graphics 620, Samsung PM961 MZVLW256HEHP, IPS, 1920x1080, 14" | Lenovo ThinkPad T470p-20J7S00000 i7-7700HQ, GeForce 940MX, Samsung PM961 NVMe MZVLW512HMJP, IPS, 2560x1440, 14" | Apple MacBook Pro 13 2017 i5-7360U, Iris Plus Graphics 640, Apple SSD AP0128, IPS, 2560x1600, 13.3" | Lenovo ThinkPad T470-20HD002HGE i5-7200U, HD Graphics 620, Samsung PM961 NVMe MZVLW512HMJP, IPS, 1920x1080, 14" | |
|---|---|---|---|---|---|
| Power Consumption | 13% | -8% | 18% | 29% | |
| Idle Minimum * (Watt) | 4.2 | 4.8 -14% | 3.8 10% | 3.7 12% | 3.21 24% |
| Idle Average * (Watt) | 7.3 | 6.6 10% | 6.5 11% | 5.2 29% | 6.15 16% |
| Idle Maximum * (Watt) | 7.7 | 7 9% | 7.2 6% | 7.6 1% | 6.82 11% |
| Load Average * (Watt) | 55.4 | 39.2 29% | 62.5 -13% | 41.6 25% | 28.5 49% |
| Witcher 3 ultra * (Watt) | 49.1 | ||||
| Load Maximum * (Watt) | 64.4 | 44.8 30% | 99.6 -55% | 50.5 22% | 34.5 46% |
* ... smaller is better
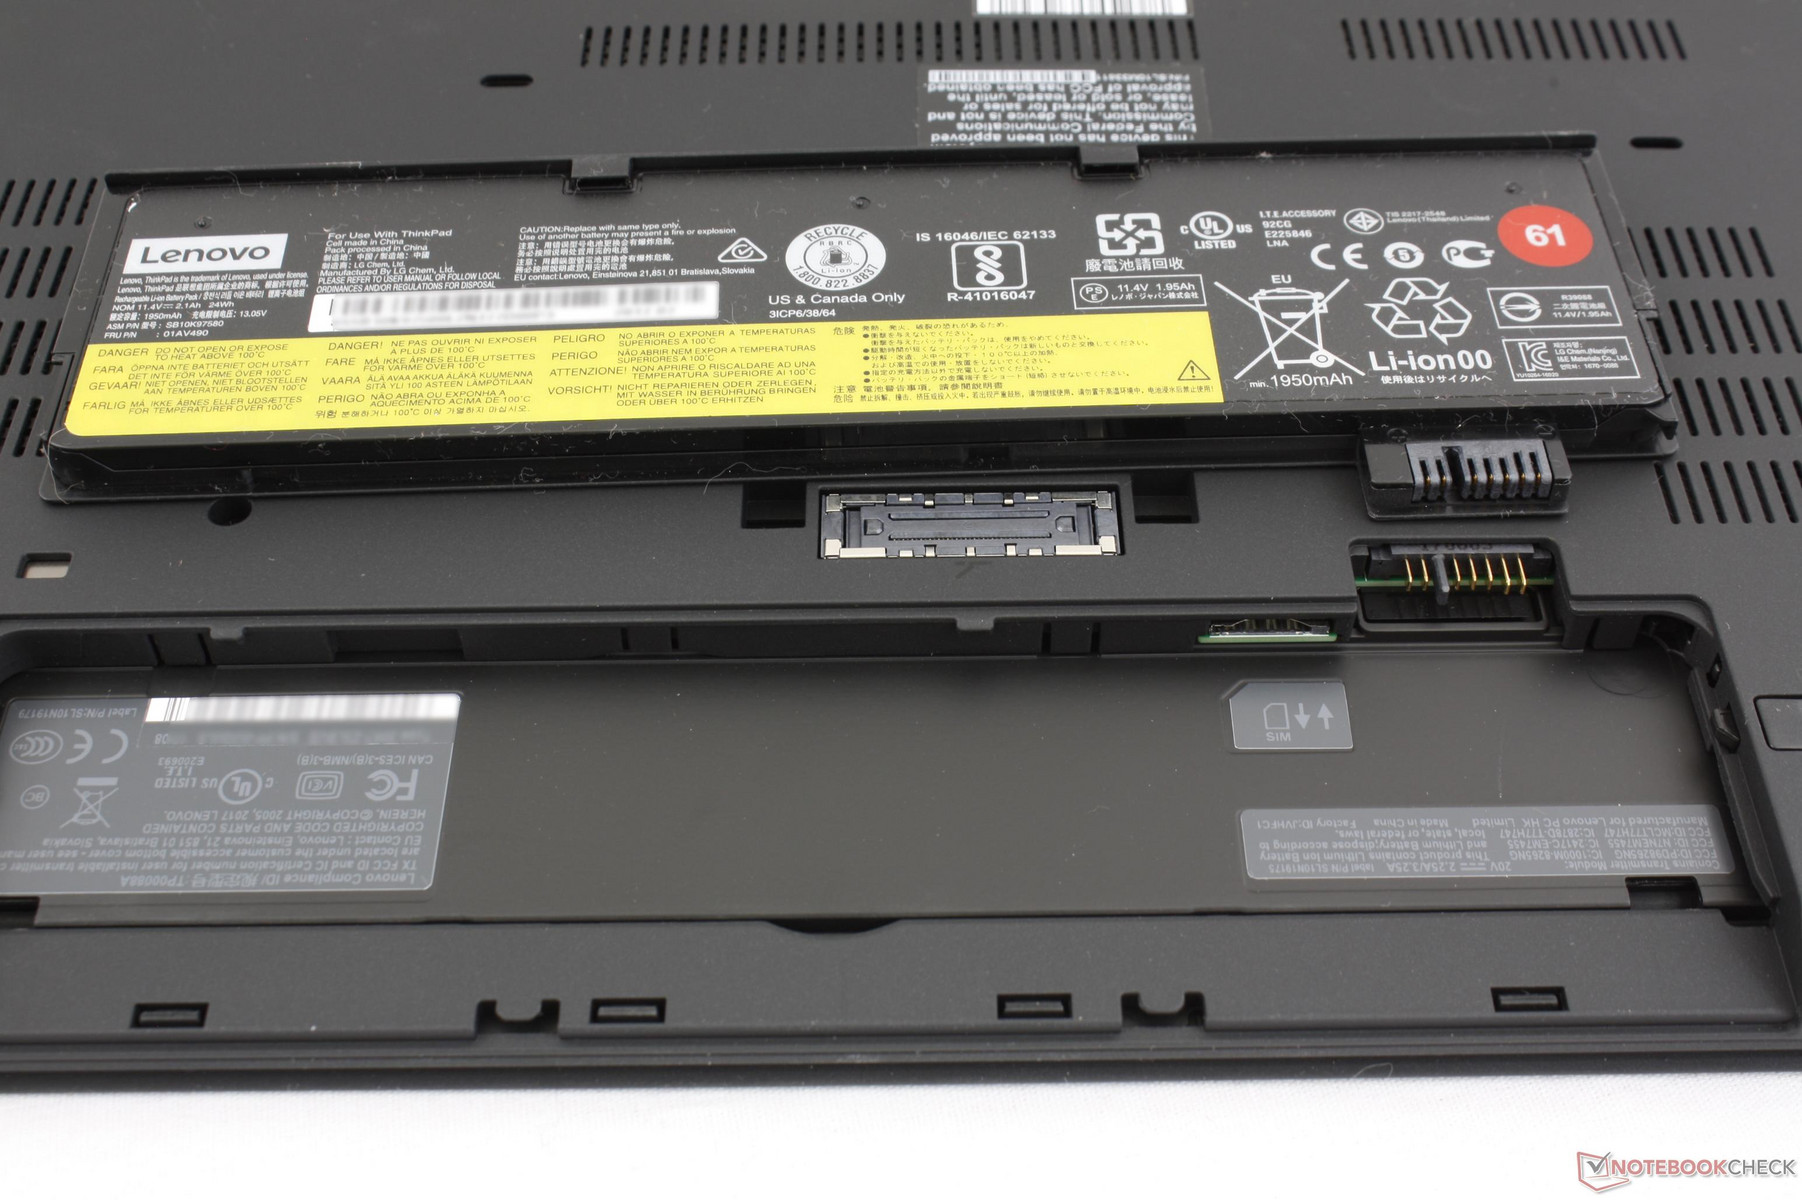
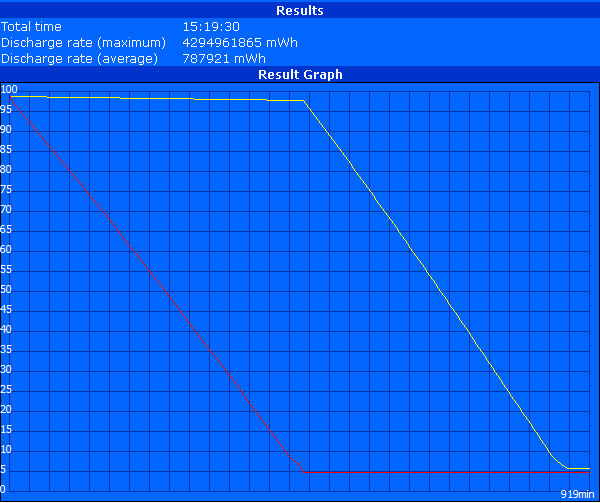
Battery Life
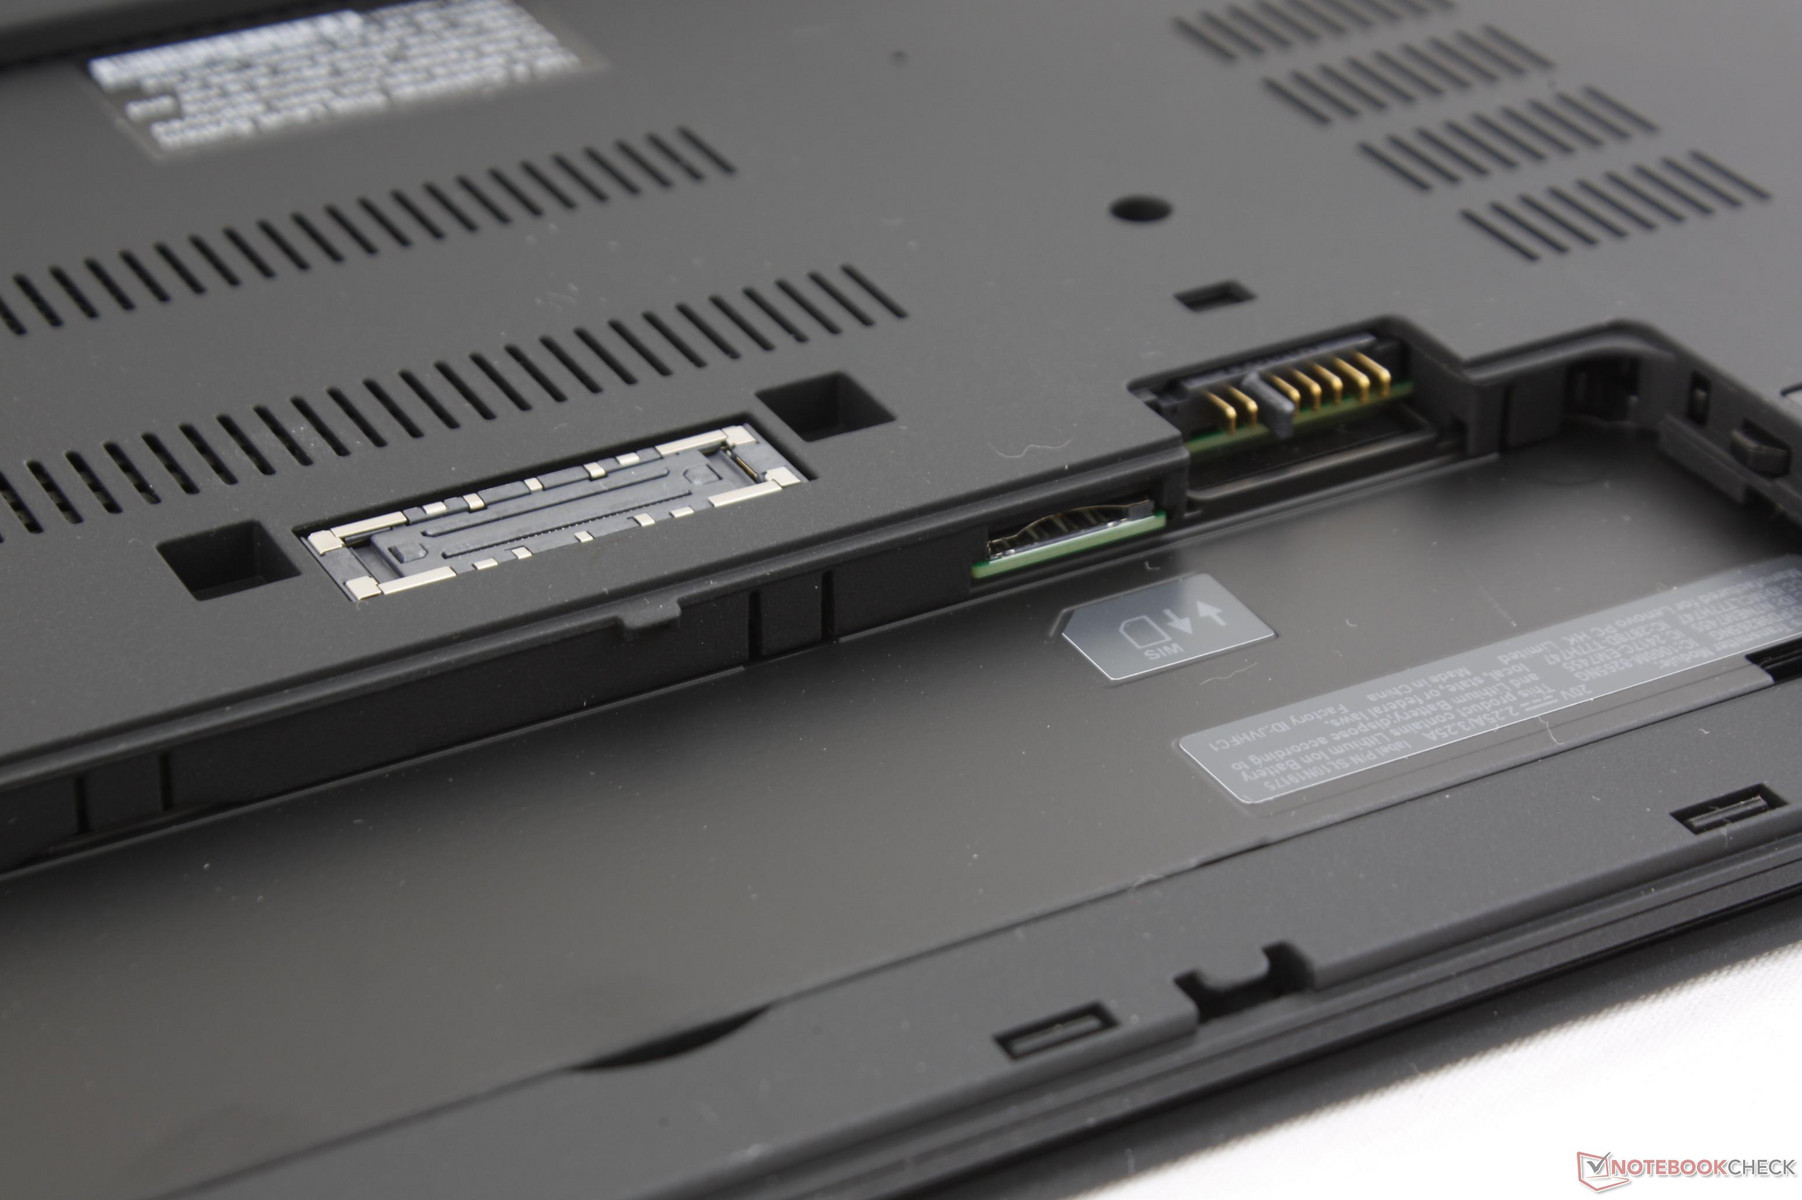
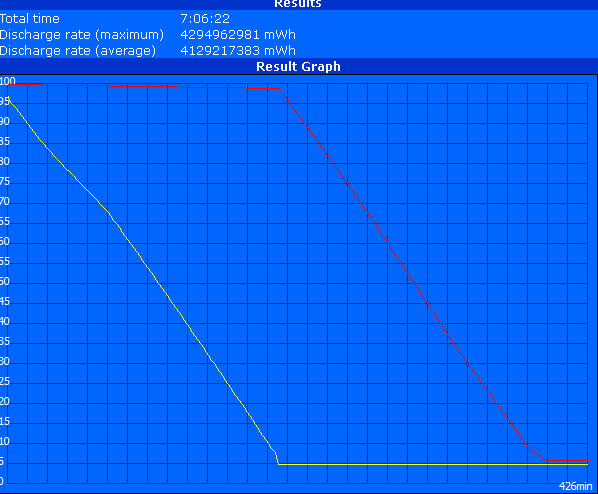
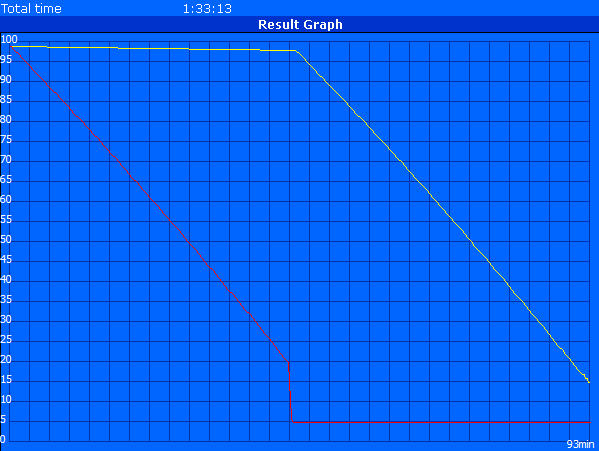
The T470 chassis is built around a small internal 24 Wh battery pack plus a secondary 24 Wh battery pack that attaches from the rear for a combined 48 Wh of power. Since the removable secondary battery is included in the packaging, we've utilized both batteries for battery life testing. Power is always drawn from the secondary battery first to completion before drawing from the internal module.
Users can expect about 7 hours of real-world WLAN use (or 3.5 hours when halved) before needing to recharge. This is very similar to the T470 even though the ThinkPad 25 is configured with more powerful hardware, but it still falls flat by an hour or more compared to the T470s, ThinkPad X1 Carbon, or MacBook Pro 13 when subjected to similar testing conditions. The above alternatives are also equipped with larger battery capacities that indubitably give it the edge over the ThinkPad 25 and T470 by extension.
Charging from near empty to full capacity will take around 2 hours and 15 minutes. If the secondary battery is attached, then both will charge simultaneously.
| Lenovo ThinkPad 25 i7-7500U, GeForce 940MX, 48 Wh | Lenovo ThinkPad T470s-20HF0012US i5-7300U, HD Graphics 620, 51 Wh | Lenovo ThinkPad T470p-20J7S00000 i7-7700HQ, GeForce 940MX, 72 Wh | Apple MacBook Pro 13 2017 i5-7360U, Iris Plus Graphics 640, 54.5 Wh | Lenovo ThinkPad X1 Carbon 2017-20HR0021GE i5-7200U, HD Graphics 620, 57 Wh | Lenovo ThinkPad T470-20HD002HGE i5-7200U, HD Graphics 620, 48 Wh | |
|---|---|---|---|---|---|---|
| Battery runtime | 37% | 15% | 21% | 14% | 8% | |
| Reader / Idle (h) | 15.3 | 17.7 16% | 17.7 16% | 13.7 -10% | ||
| WiFi v1.3 (h) | 7.1 | 8.1 14% | 10 41% | 11.4 61% | 9.1 28% | 7.3 3% |
| Load (h) | 1.6 | 2.9 81% | 1.4 -13% | 1.3 -19% | 2 25% | 1.8 13% |
Pros
Cons
Verdict
The ThinkPad 25 caters to those who miss the classic ThinkPad keyboard or are die-hard fans of the series. Users who are otherwise content with the AccuType keyboard on newer ThinkPads will have few reasons to choose the ThinkPad 25 over the standard T470.
Interestingly, configuring the T470 as closely as possible to the ThinkPad 25 will retail for about the same price of $1900 USD. The T470 will lack both the GeForce 940MX GPU and classic keyboard, but will gain a Smart Card reader, slightly taller trackpad, and brighter display backlight in return. As such, the ThinkPad 25 is more of a side-step for the ThinkPad series rather than a full-on next generation update. Its existence is solely to celebrate the 25th anniversary of the ThinkPad rather than compete directly with the latest and greatest notebooks as evident by its last generation CPU and GPU. Business users who may be clamoring for more hardware performance will have to wait longer for that inevitable Kaby Lake-R and Pascal refresh or jump ship to the consumer Yoga 920, Spectre 13 2017, or XPS 13. Turbo Boost performance, GPU performance, fan noise, and of course the keyboard are all otherwise excellent with little to complain.
Despite being one of the best 14-inch business notebooks around, there's no shaking off the small disappointment from an anniversary perspective. The ThinkPad 25 feels like a rehashed T470 instead of something truly unique. Again, this isn't necessarily bad because the T470 is great to begin with, but the keyboard alone may not be special enough to satisfy ThinkPad enthusiasts as the classic models were about so much more than just the keyboard.
The Anniversary Edition feels more like a souped-up ThinkPad T470 than the special one-of-a-kind ThinkPad Lenovo is marketing it to be. Unless if the classic keyboard is a must-have, then existing ThinkPad users should just wait until the next major update to the T4x0 series especially since the Anniversary Edition is behind a very pricey paywall.
Lenovo ThinkPad 25
- 10/05/2017 v6 (old)
Allen Ngo
Price comparison
