Apple MacBook Pro 13 (Mid 2017, i5, without Touch Bar) Review
For the original German review, see here.
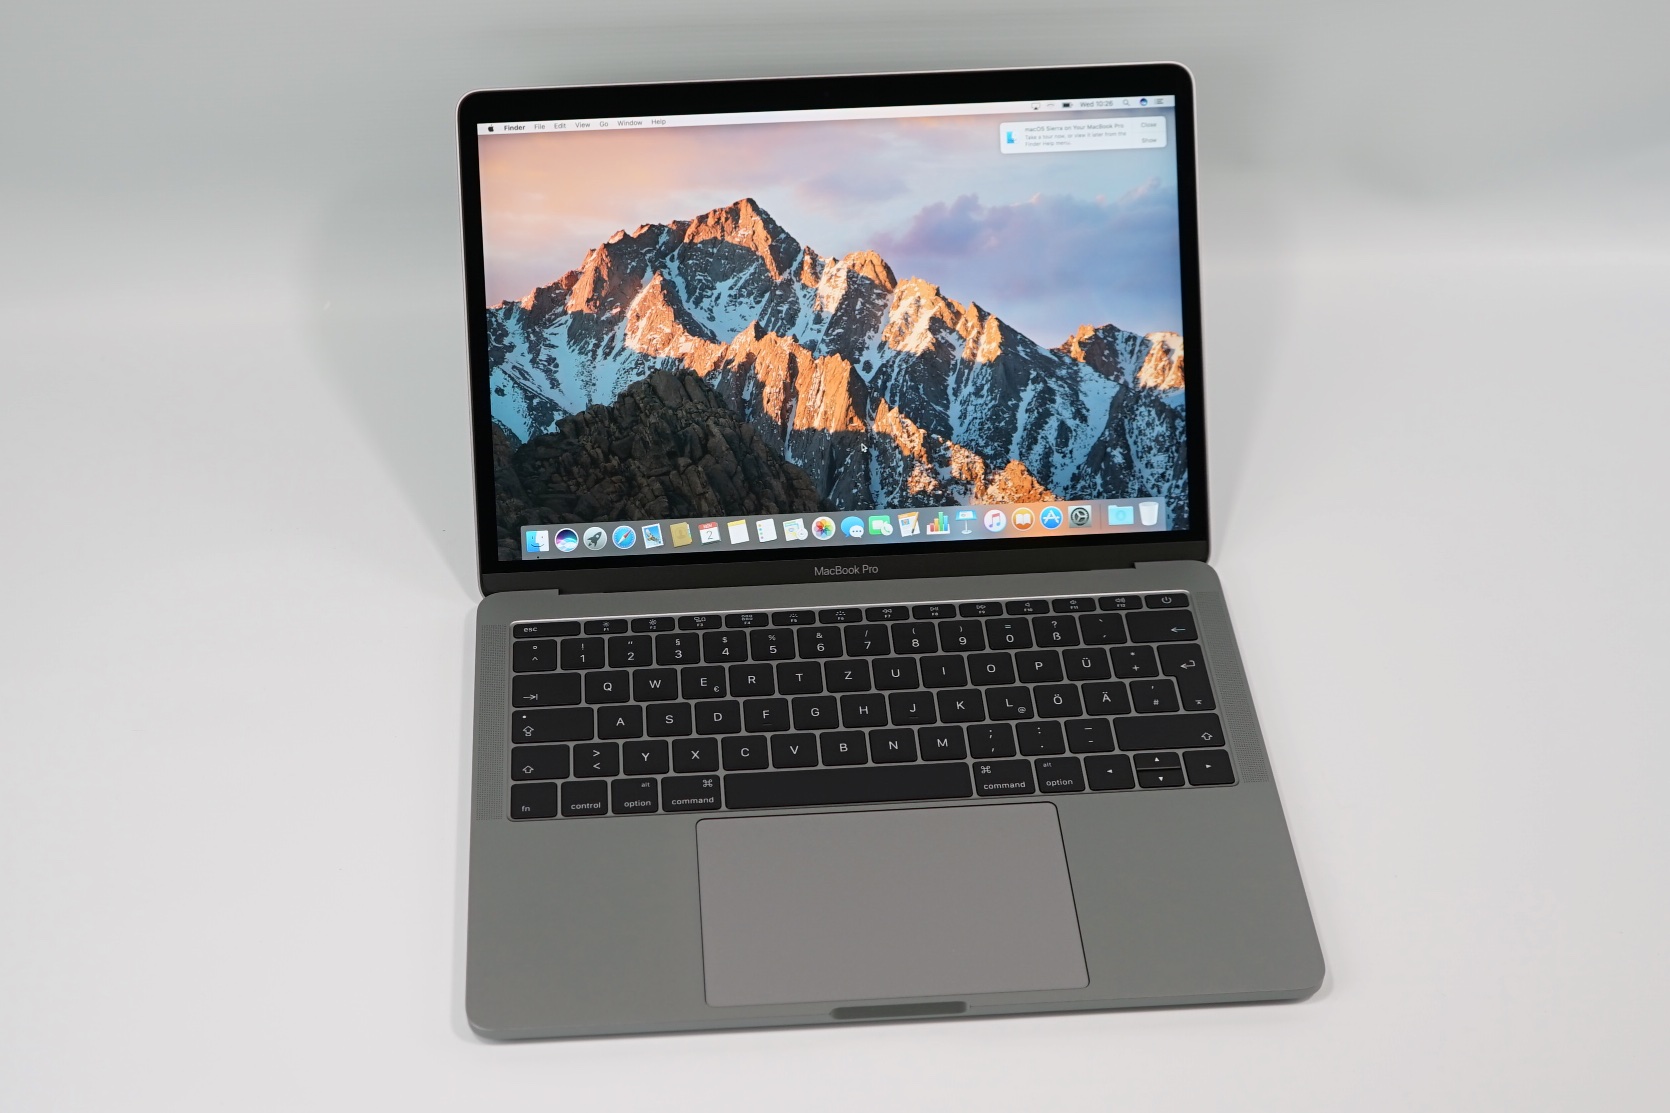
Apple updated the "smaller" MacBook Pro 13 without Touch Bar with Intel's current Kaby Lake processors from Intel. Today we have a look at the entry-level model, which is cheaper than before. It now starts at $1299, but with a smaller 128 GB SSD. The upgrade to the 256 GB drive is $200, so the price tag is similar to the previous model. You should check other shops to save some money.
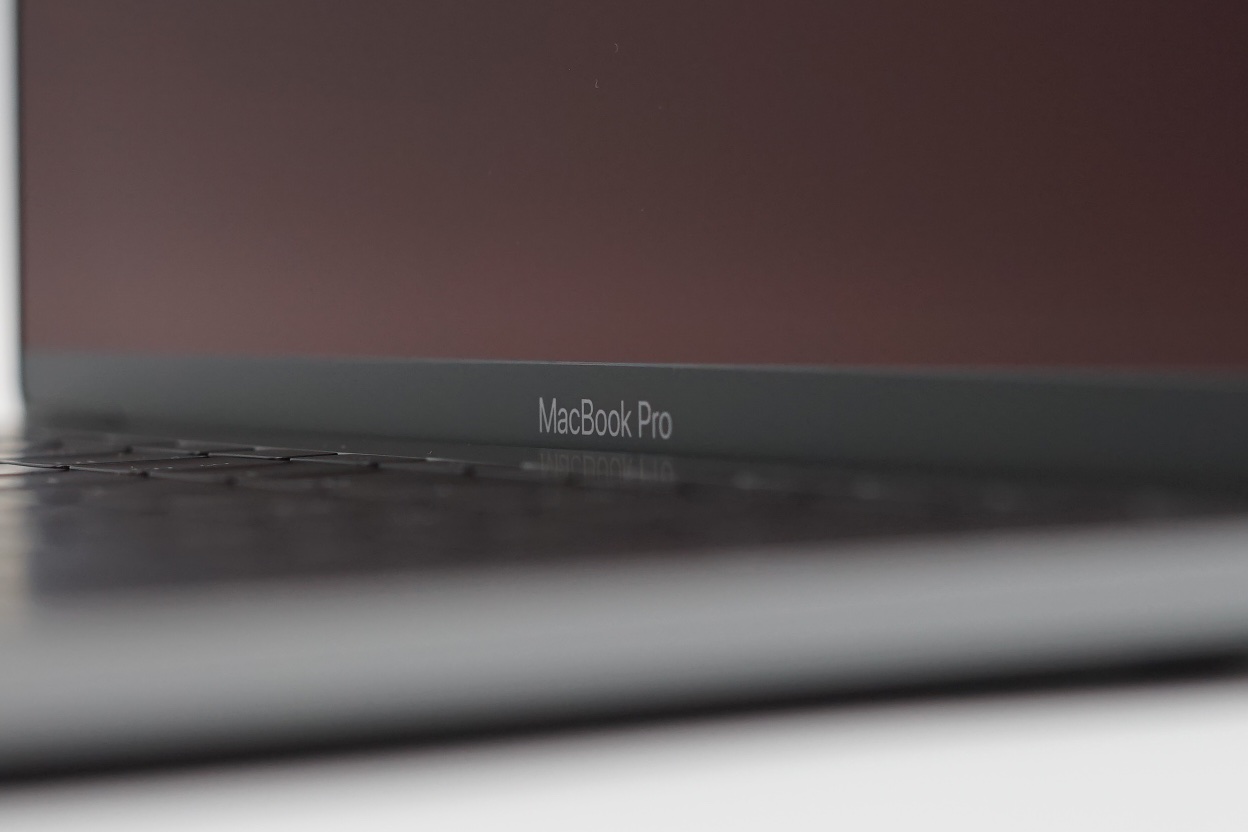
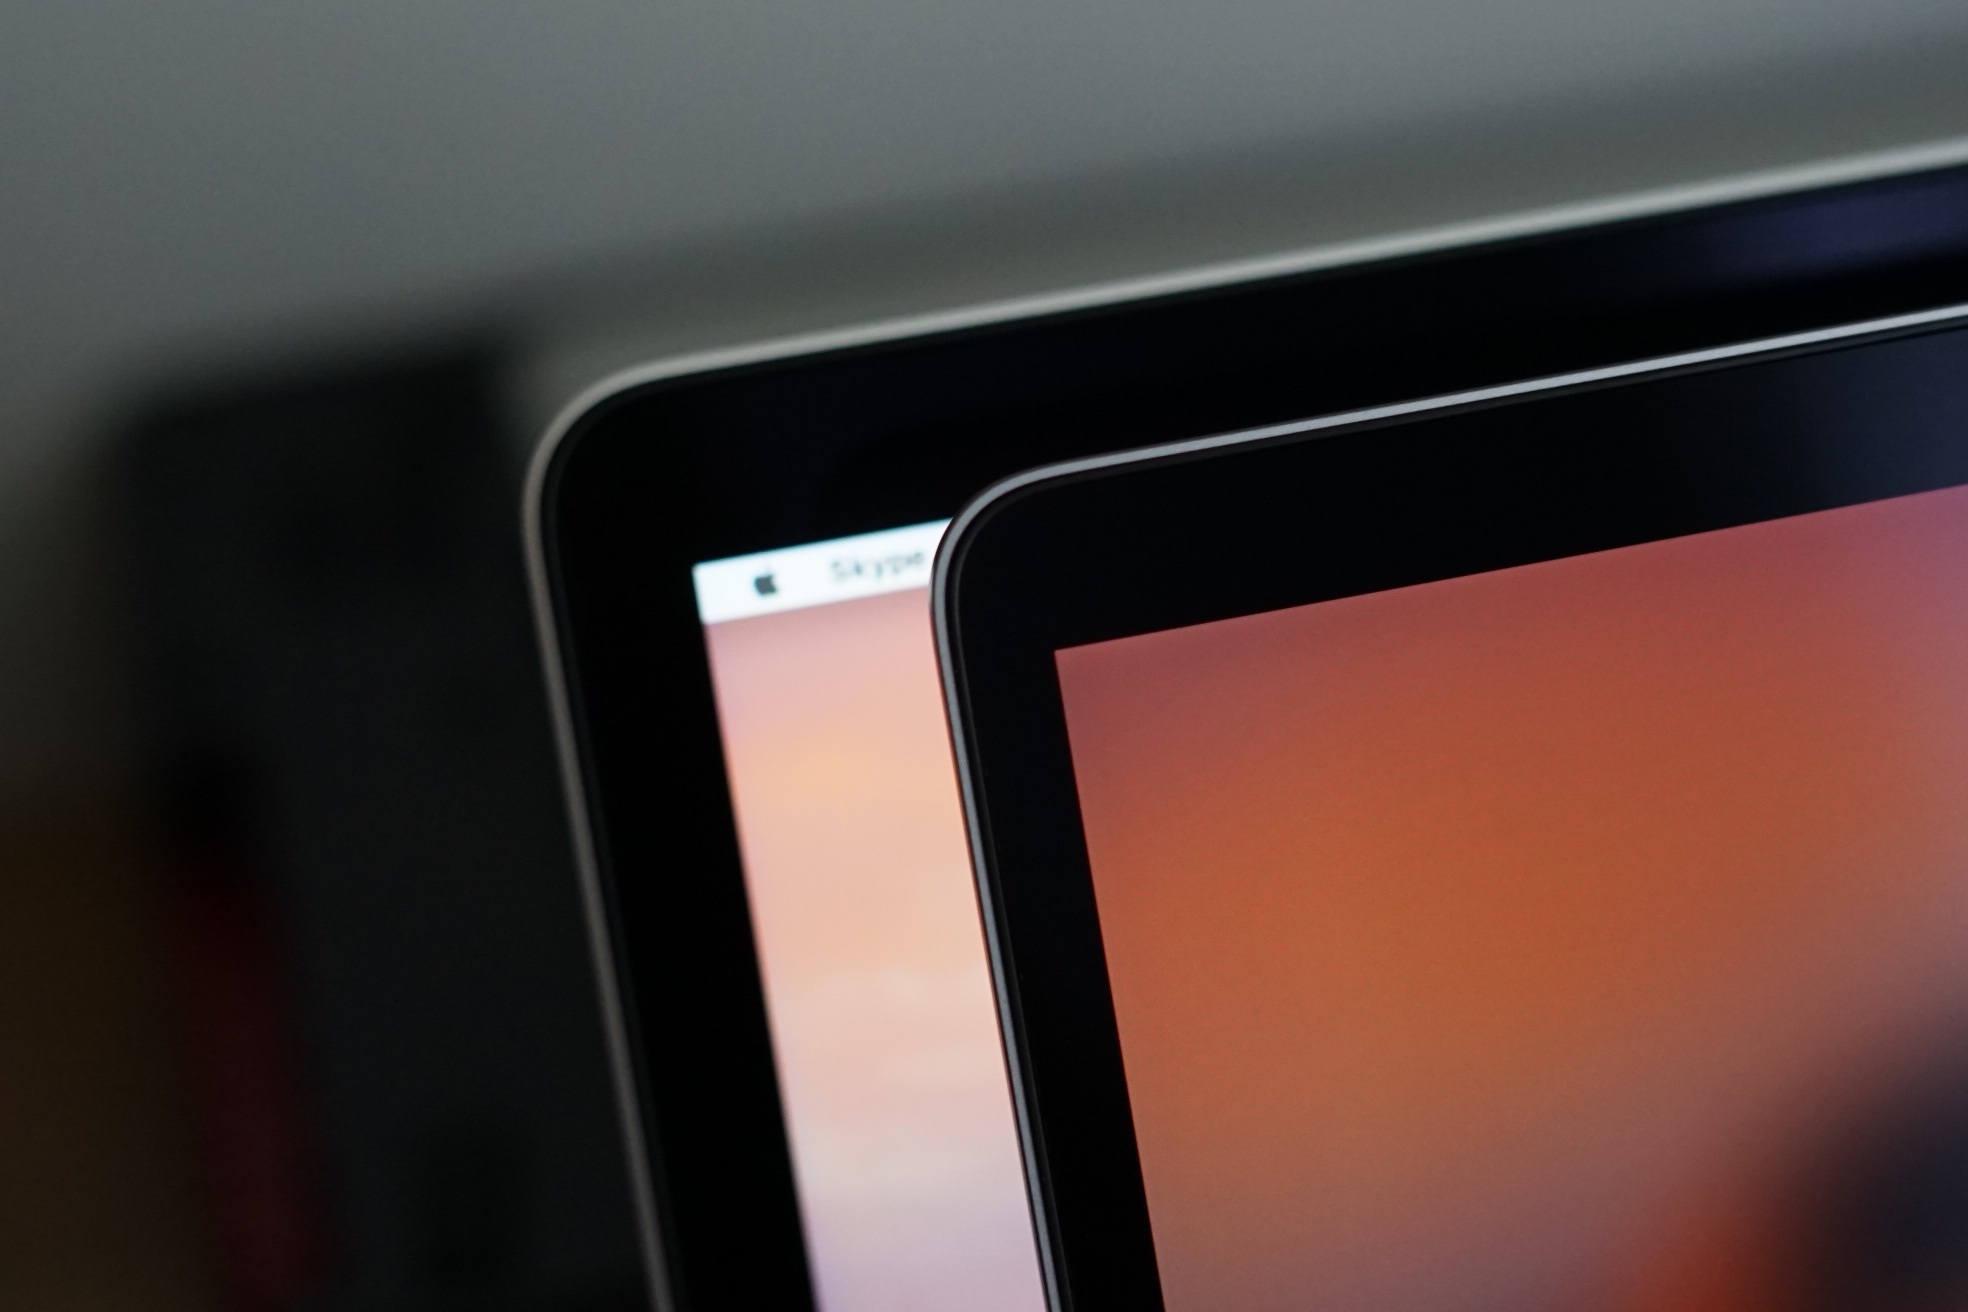
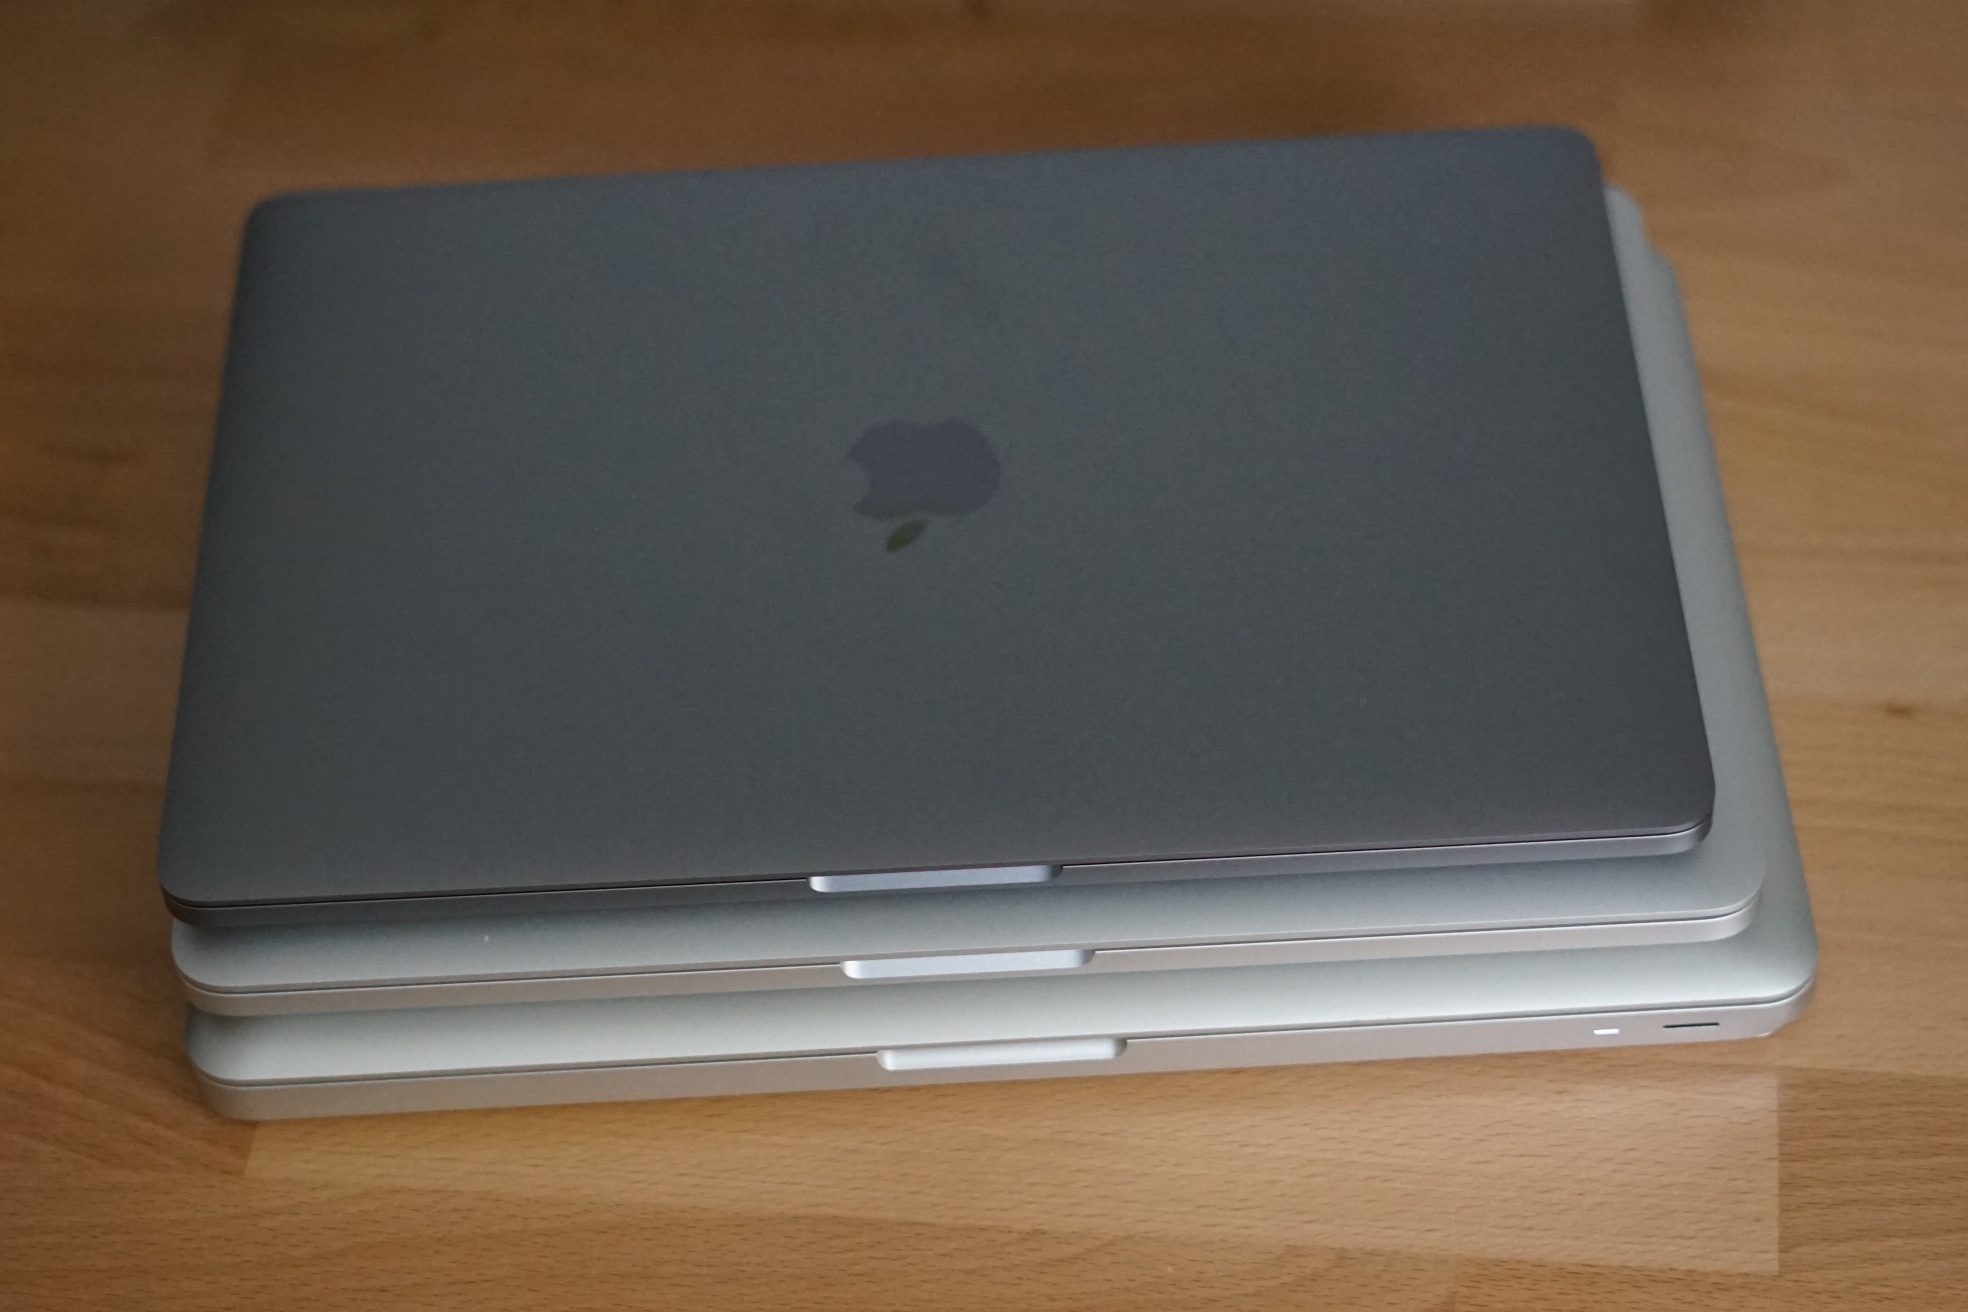
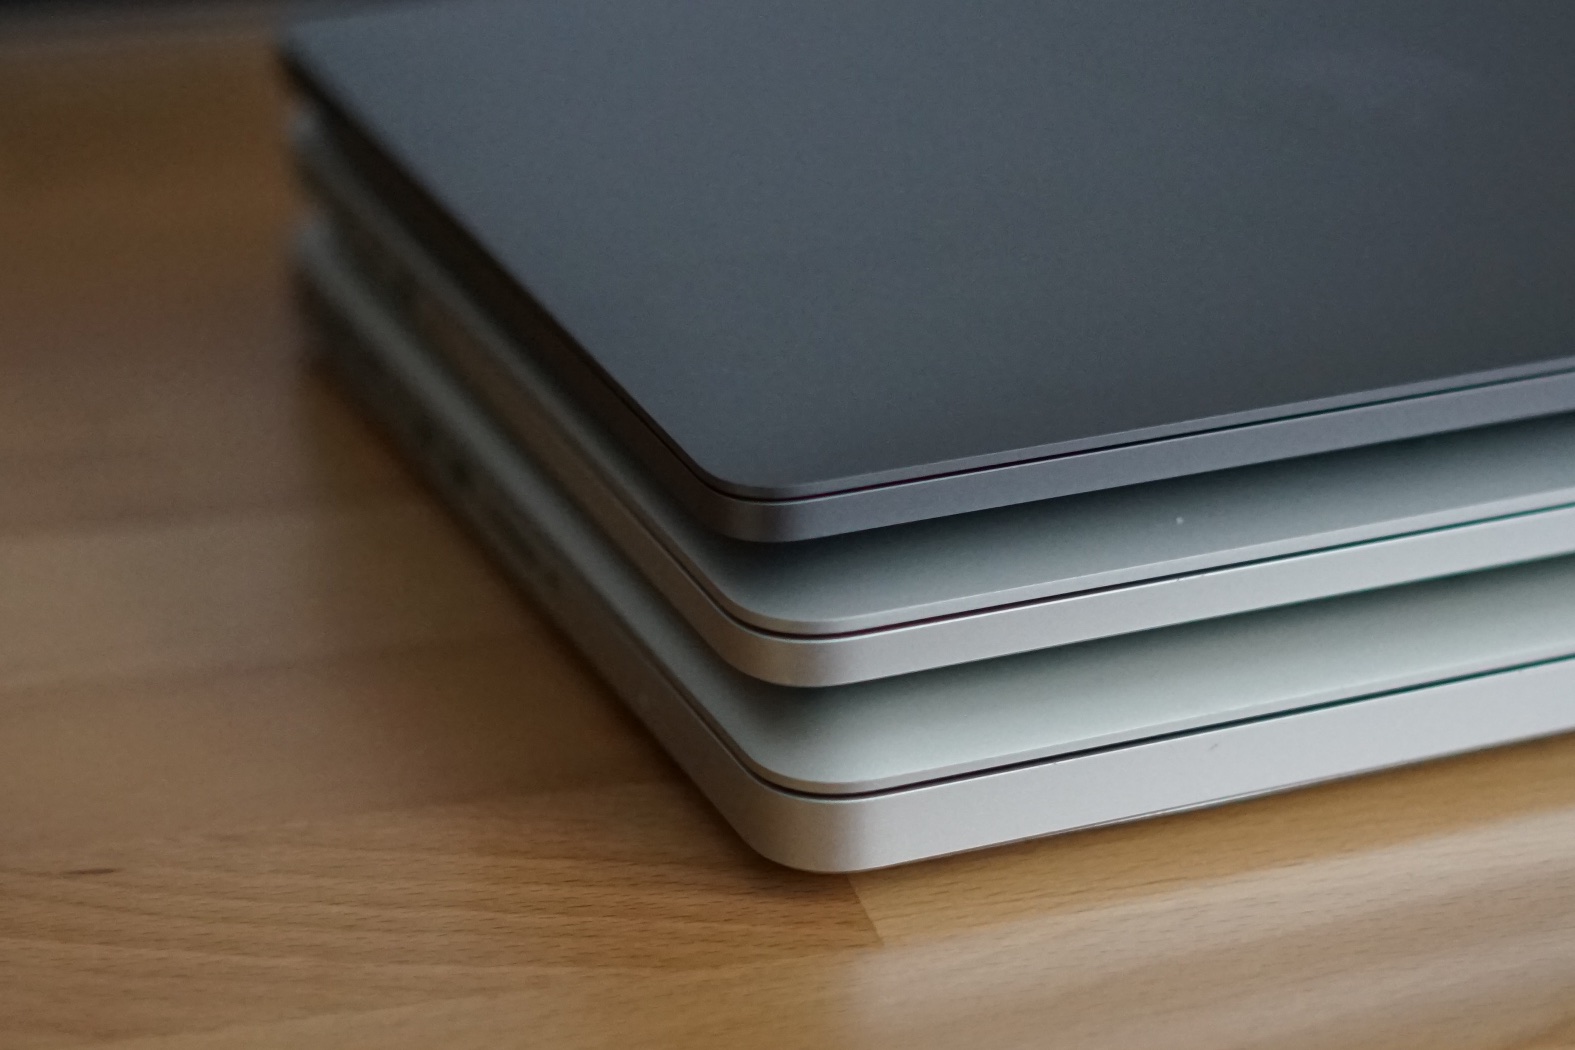
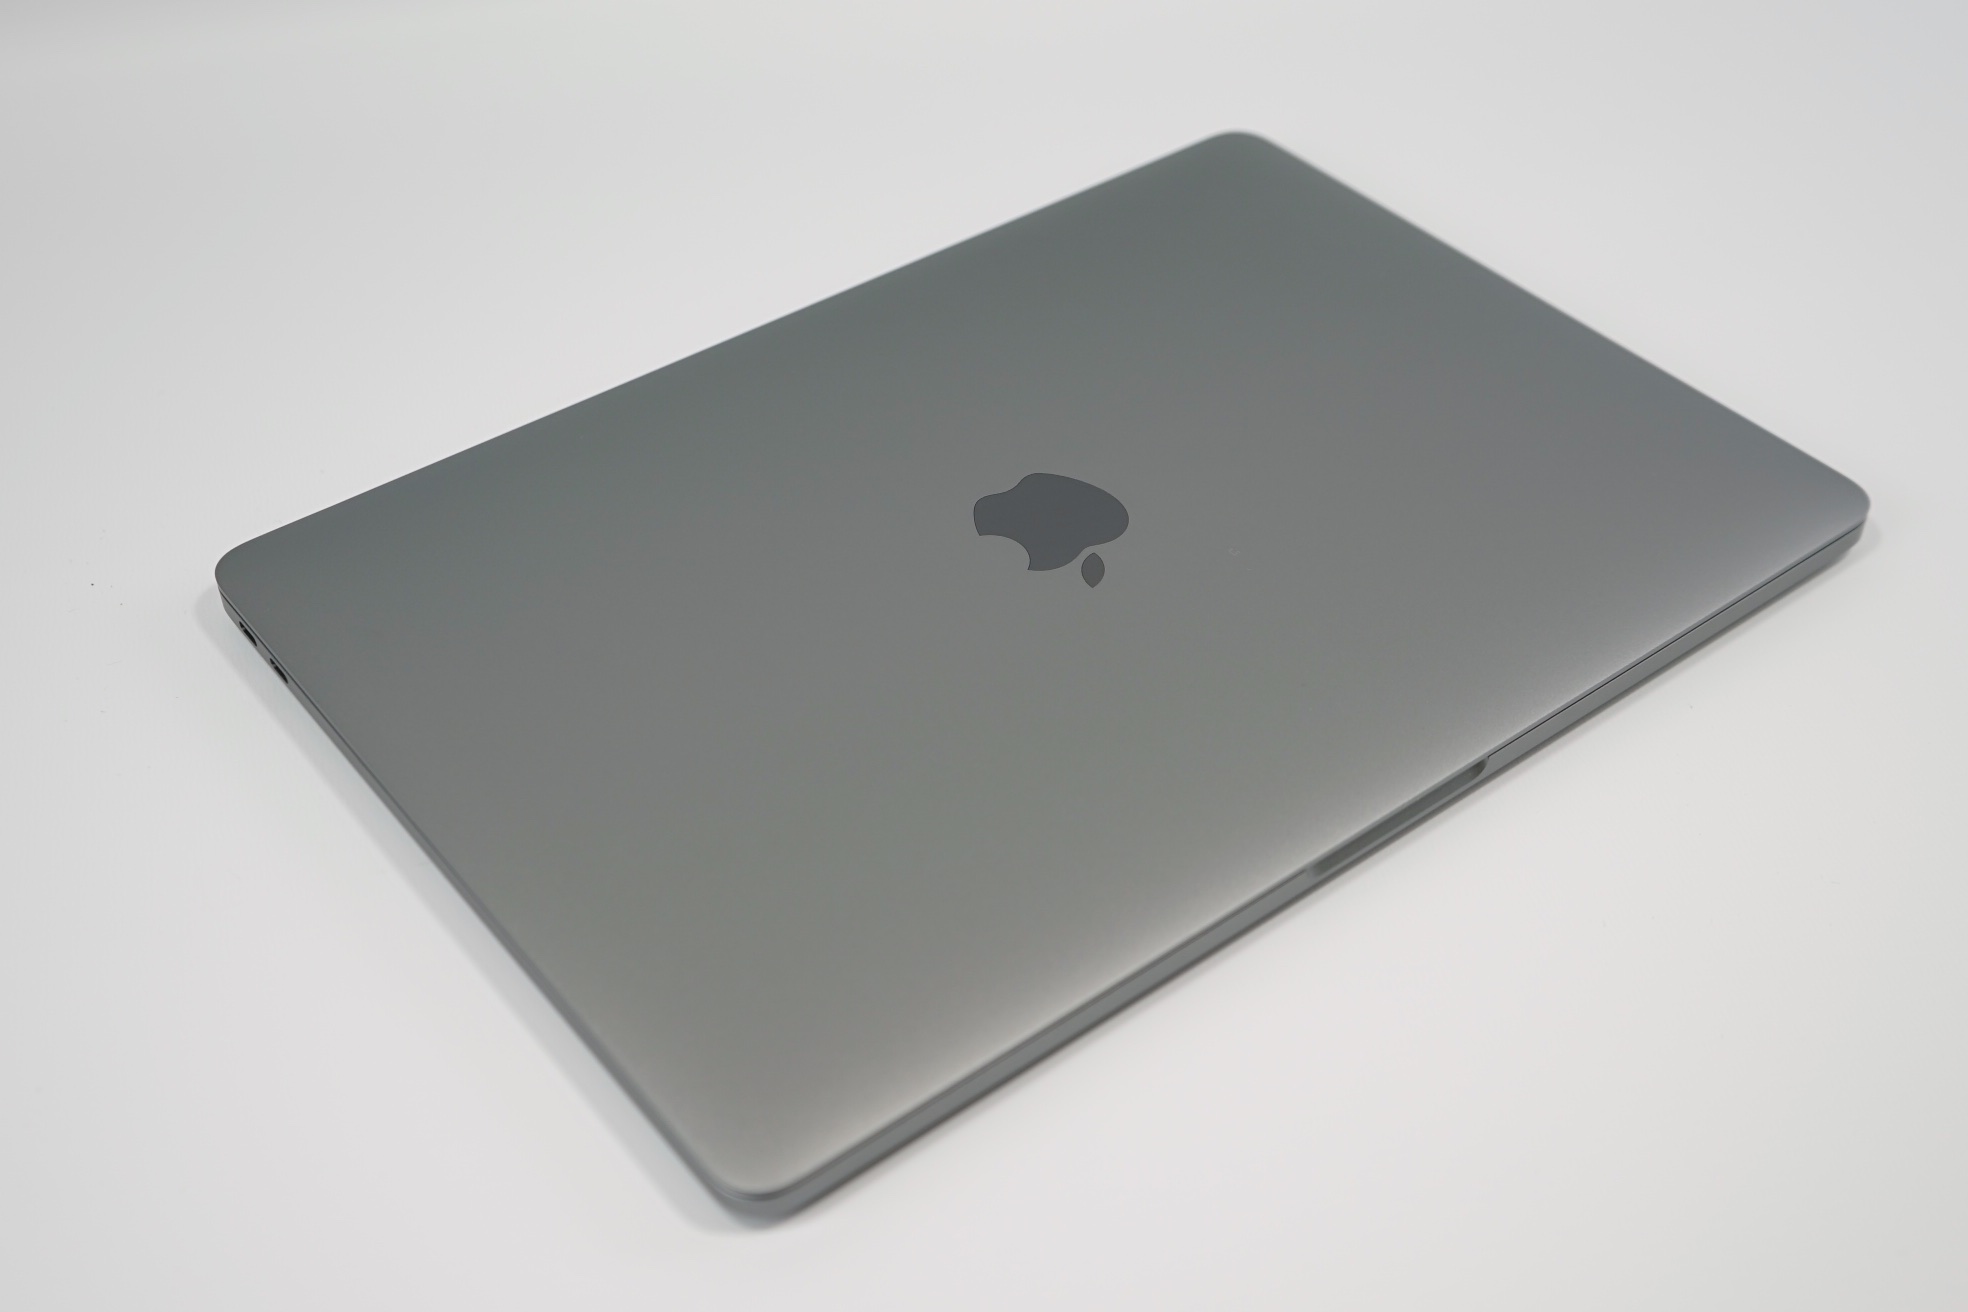
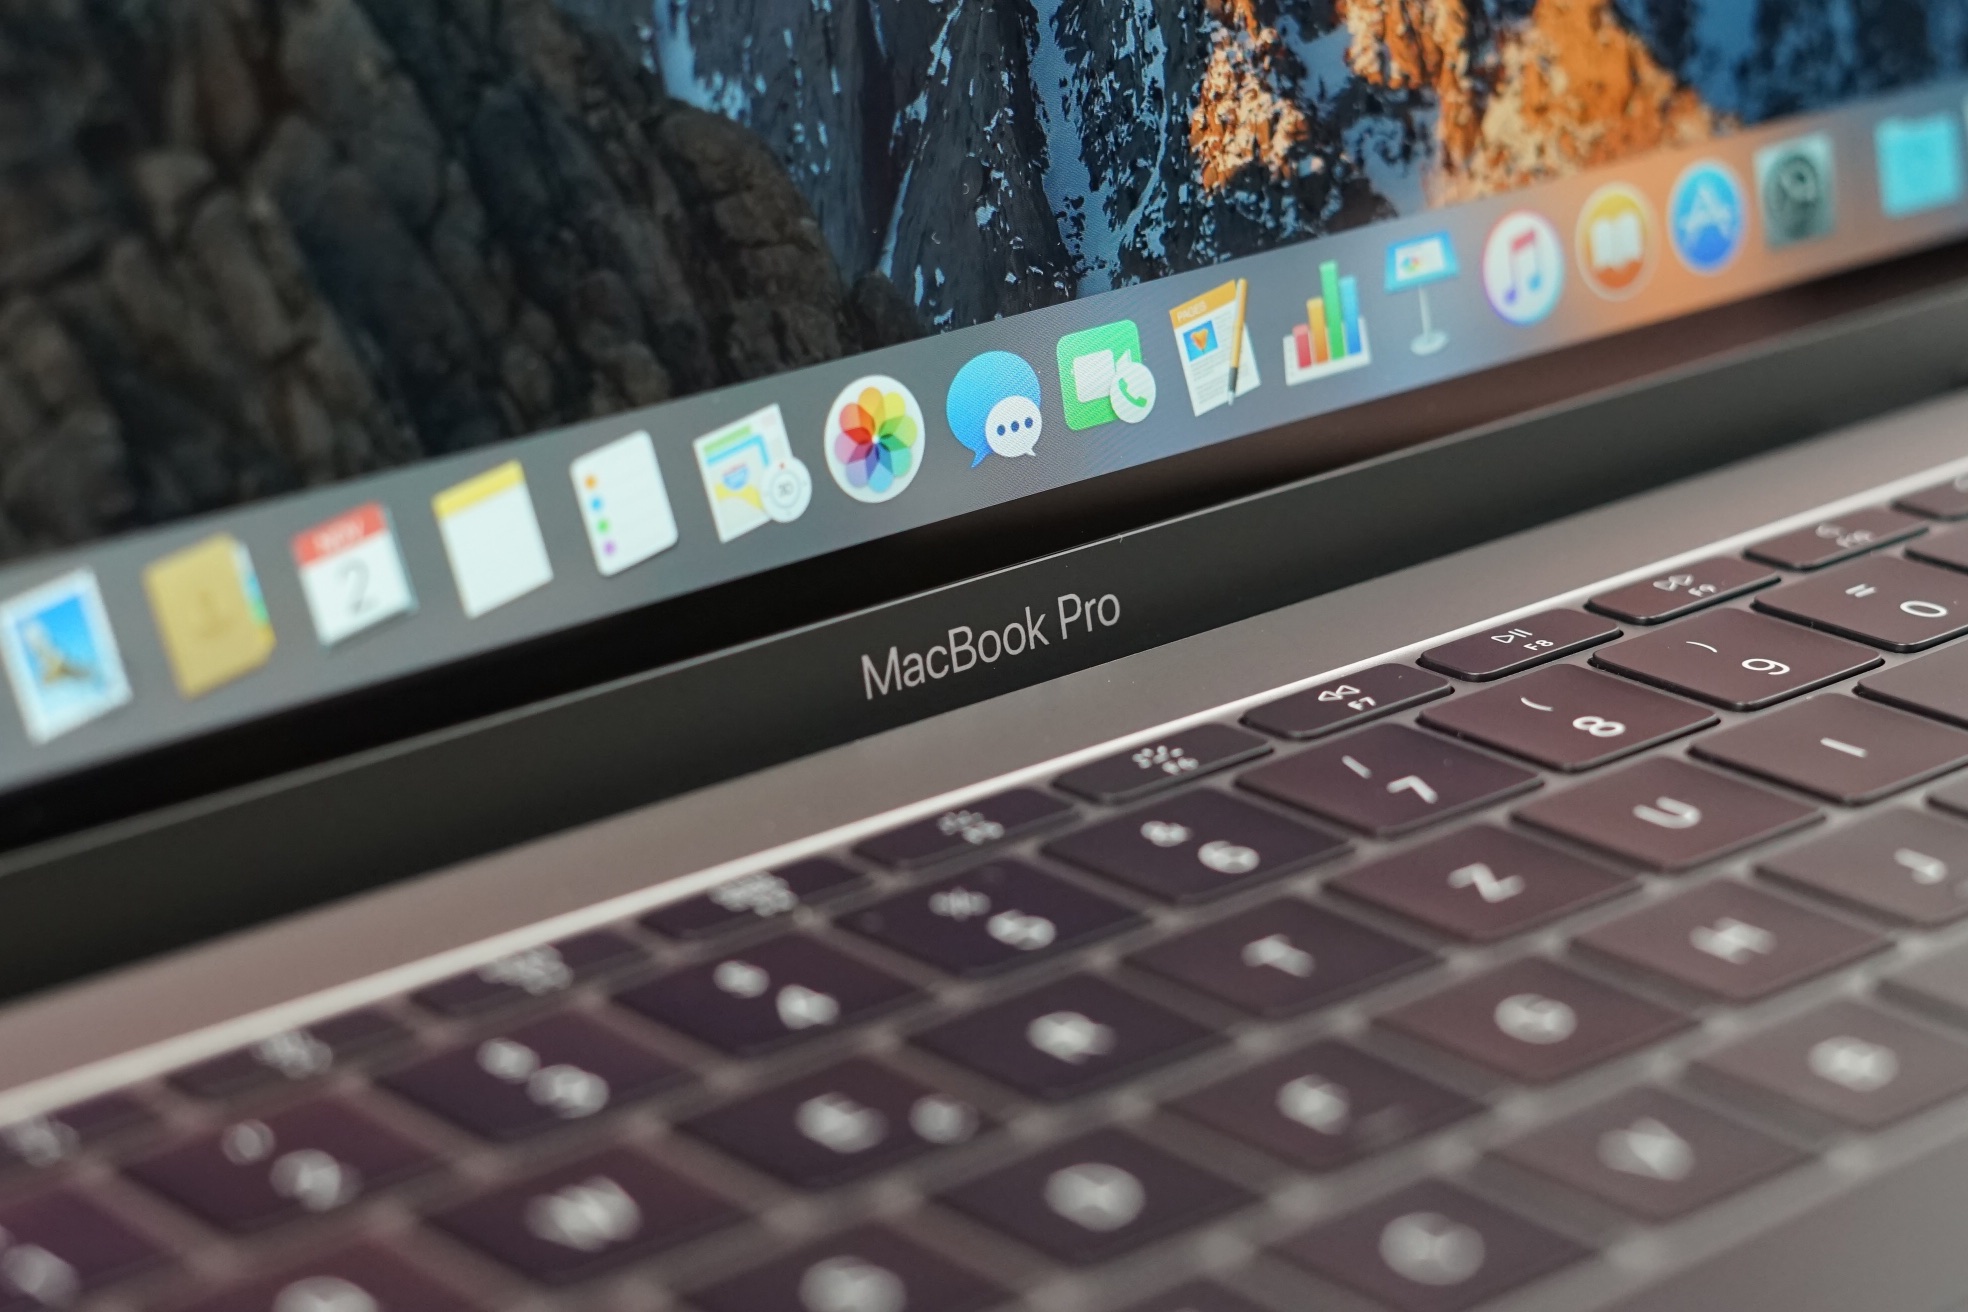
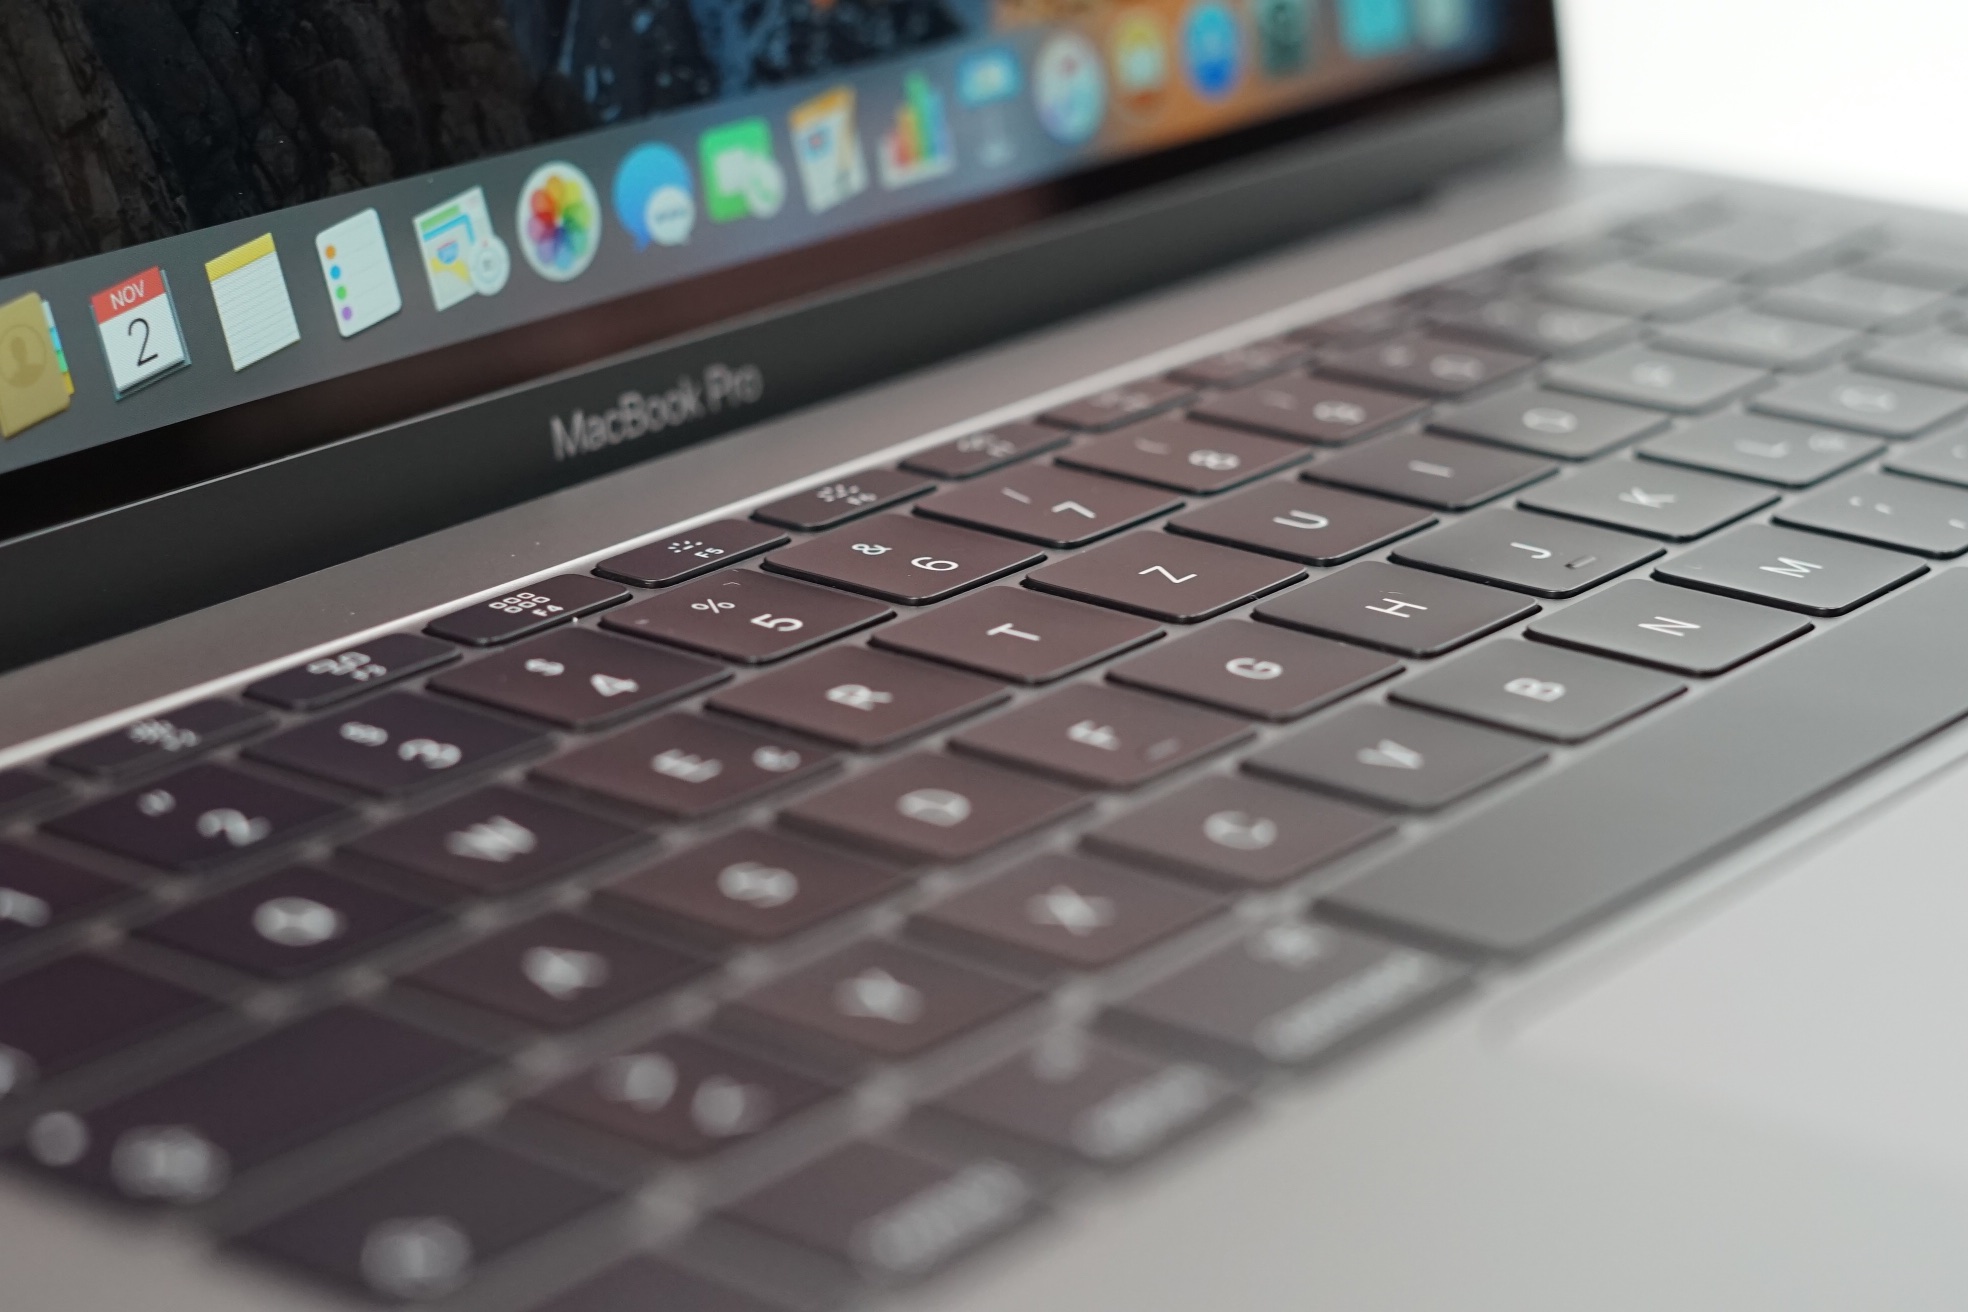
It looks like the Touch Bar above the keyboard is the only difference between the two 13-inch models when you have them next to each other. A look on the inside, however, reveals two completely different notebooks. The MacBook with the function keys is shipped with slightly weaker processors and a less powerful cooling solution. Apple also implements a bigger battery. Our review shows why the "small" model might actually be the better choice for some users.
| MacBook Pro 13 without Touch Bar | MacBook Pro 13 with Touch Bar | |
| Processor | Core i5 2.3 GHz (Kaby Lake, 15 W) Core i7 2.5 GHz (Kaby Lake, 15 W) |
Core i5 3.1 GHz (Kaby Lake, 28 W) Core i5 3.3 GHz (Kaby Lake, 28 W) Core i7 3.5 GHz (Kaby Lake, 28 W) |
| GPU | Intel Iris Plus Graphics 640 | Intel Iris Plus Graphics 650 |
| RAM | 8 GB LPDDR3-2133 16 GB LPDDR3-2133 |
8 GB LPDDR3-2133 16 GB LPDDR3-2133 |
| SSD | 128 GB / 256 GB / 512 GB / 1 TB | 256 GB / 512 GB / 1 TB |
| Display | 13.3-inch IPS 2560x1600 pixels | 13.3-inch IPS 2560x1600 pixels |
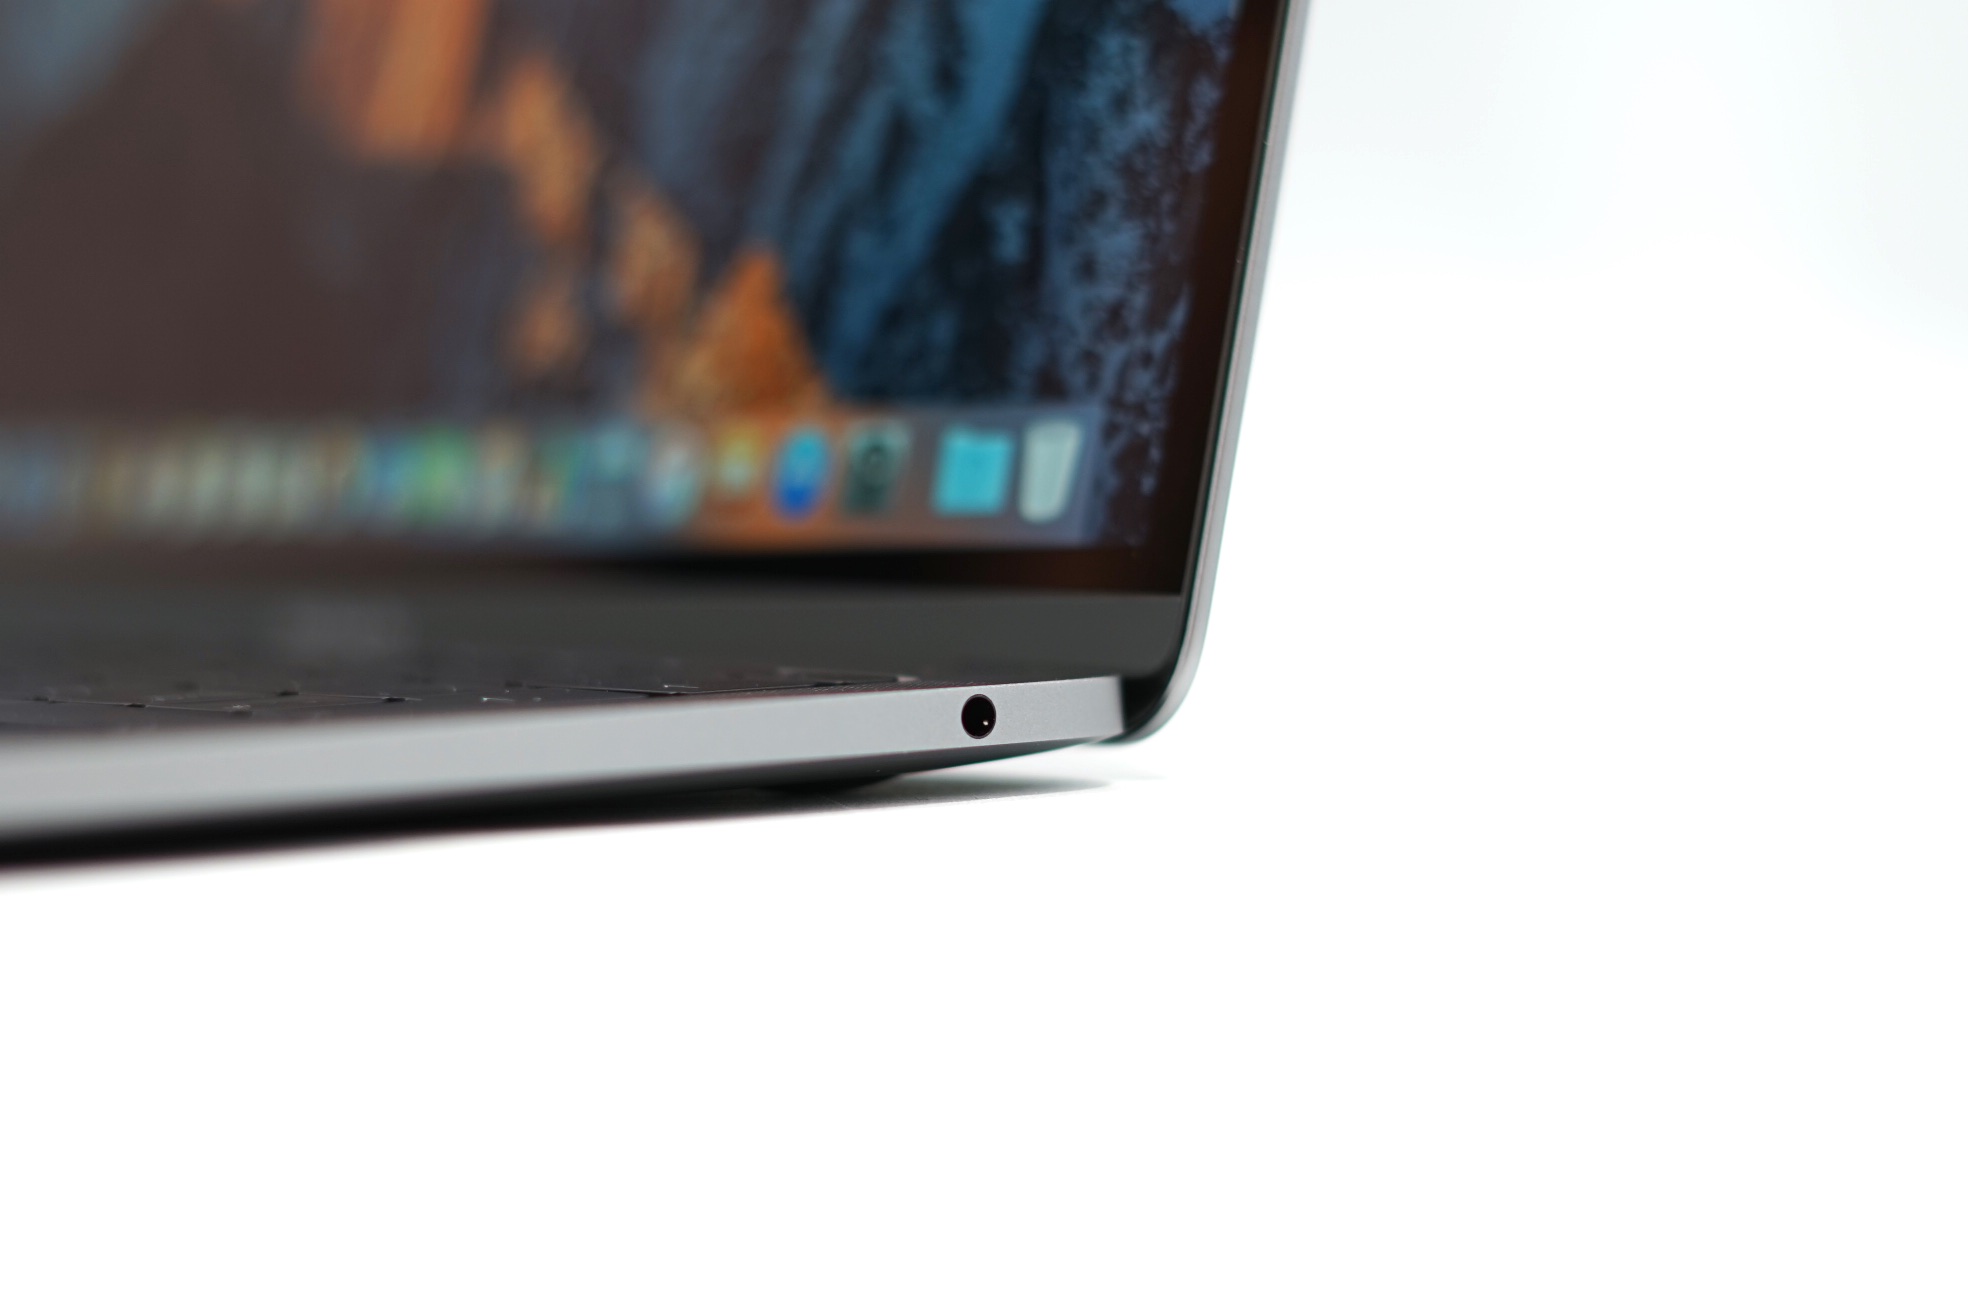
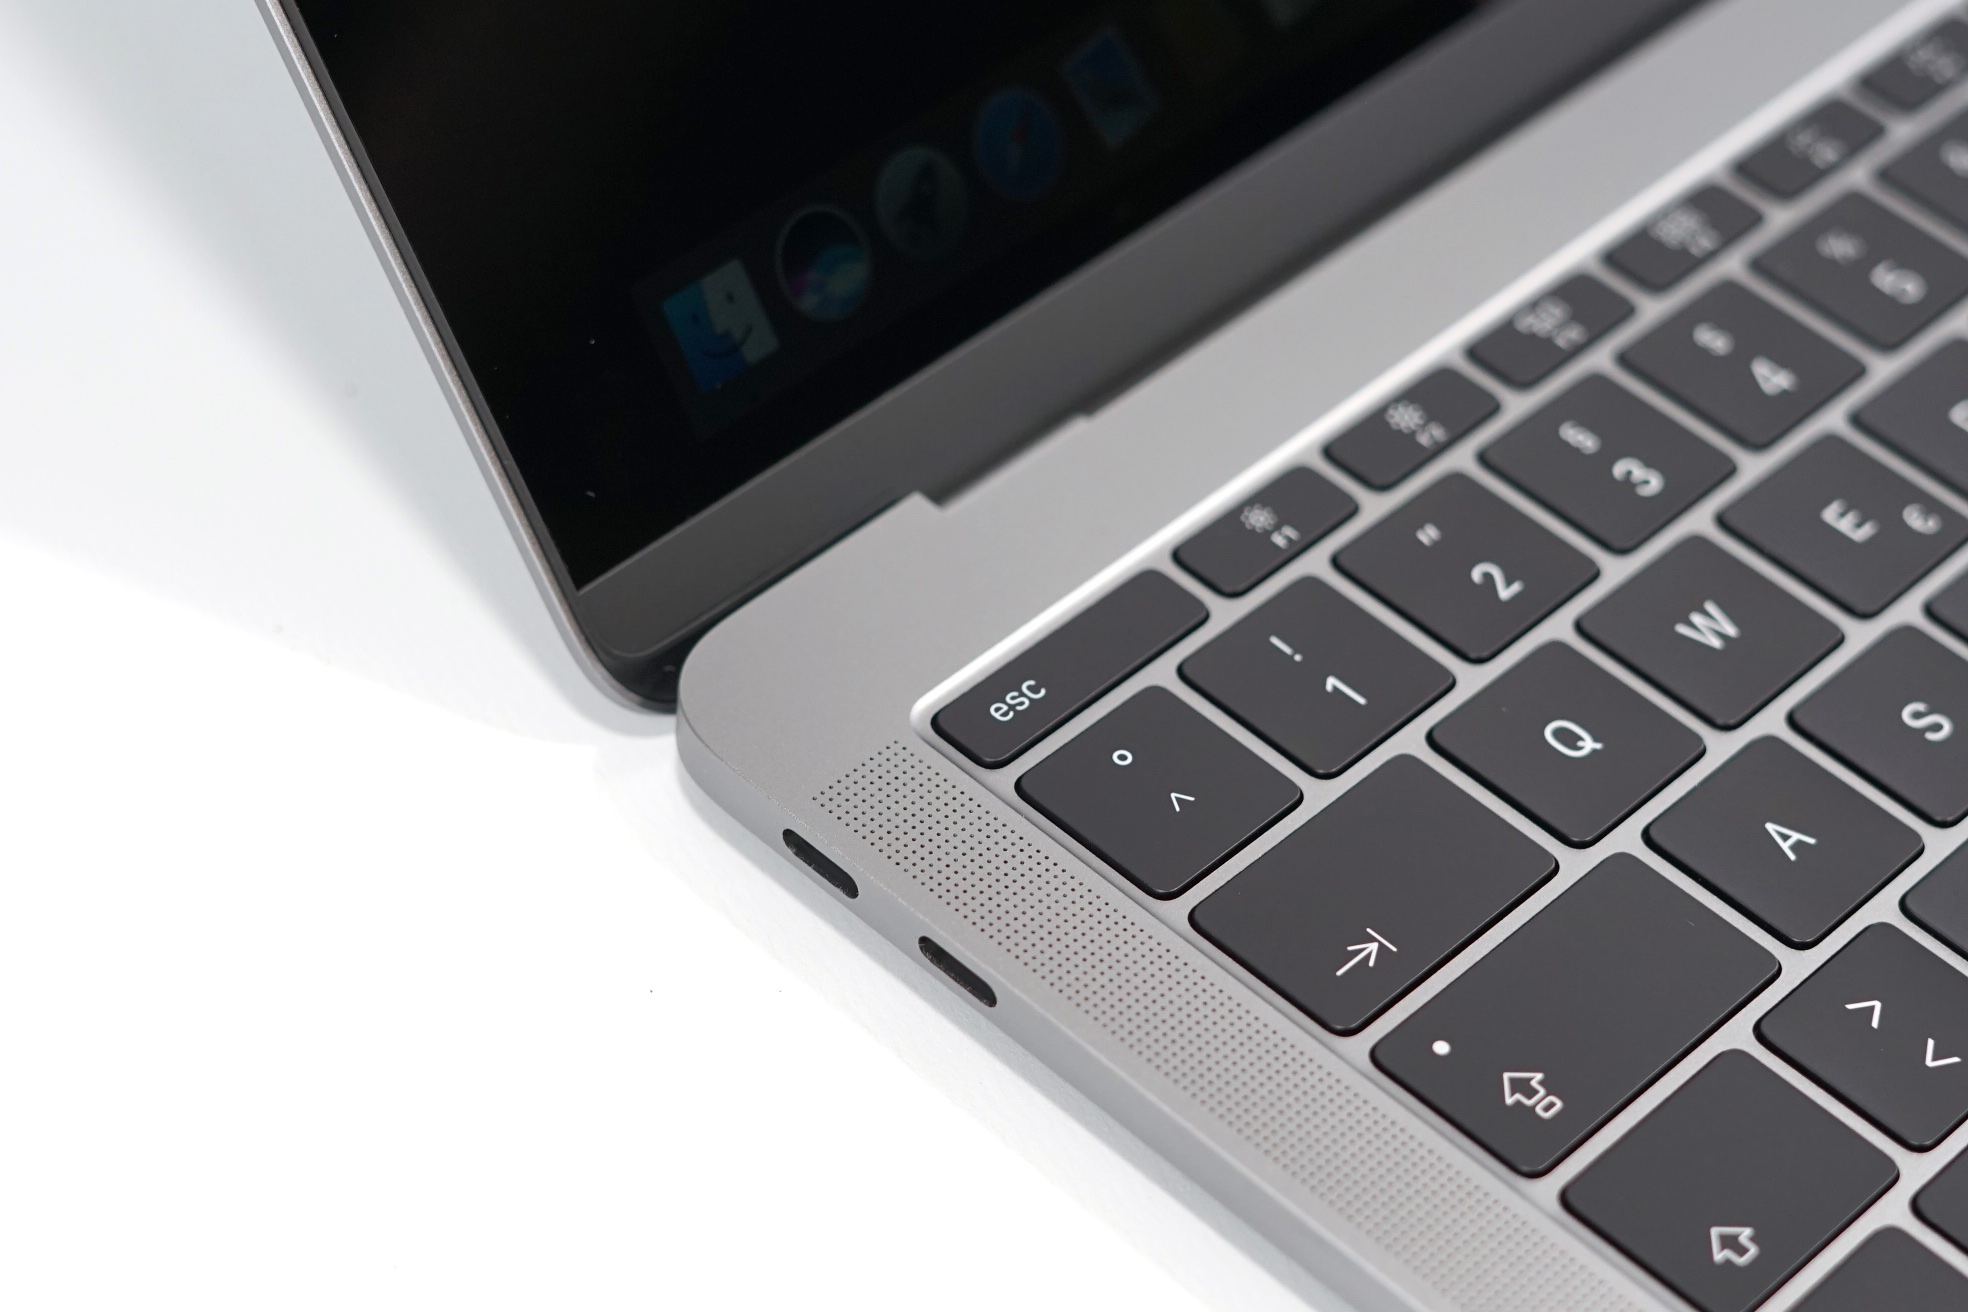
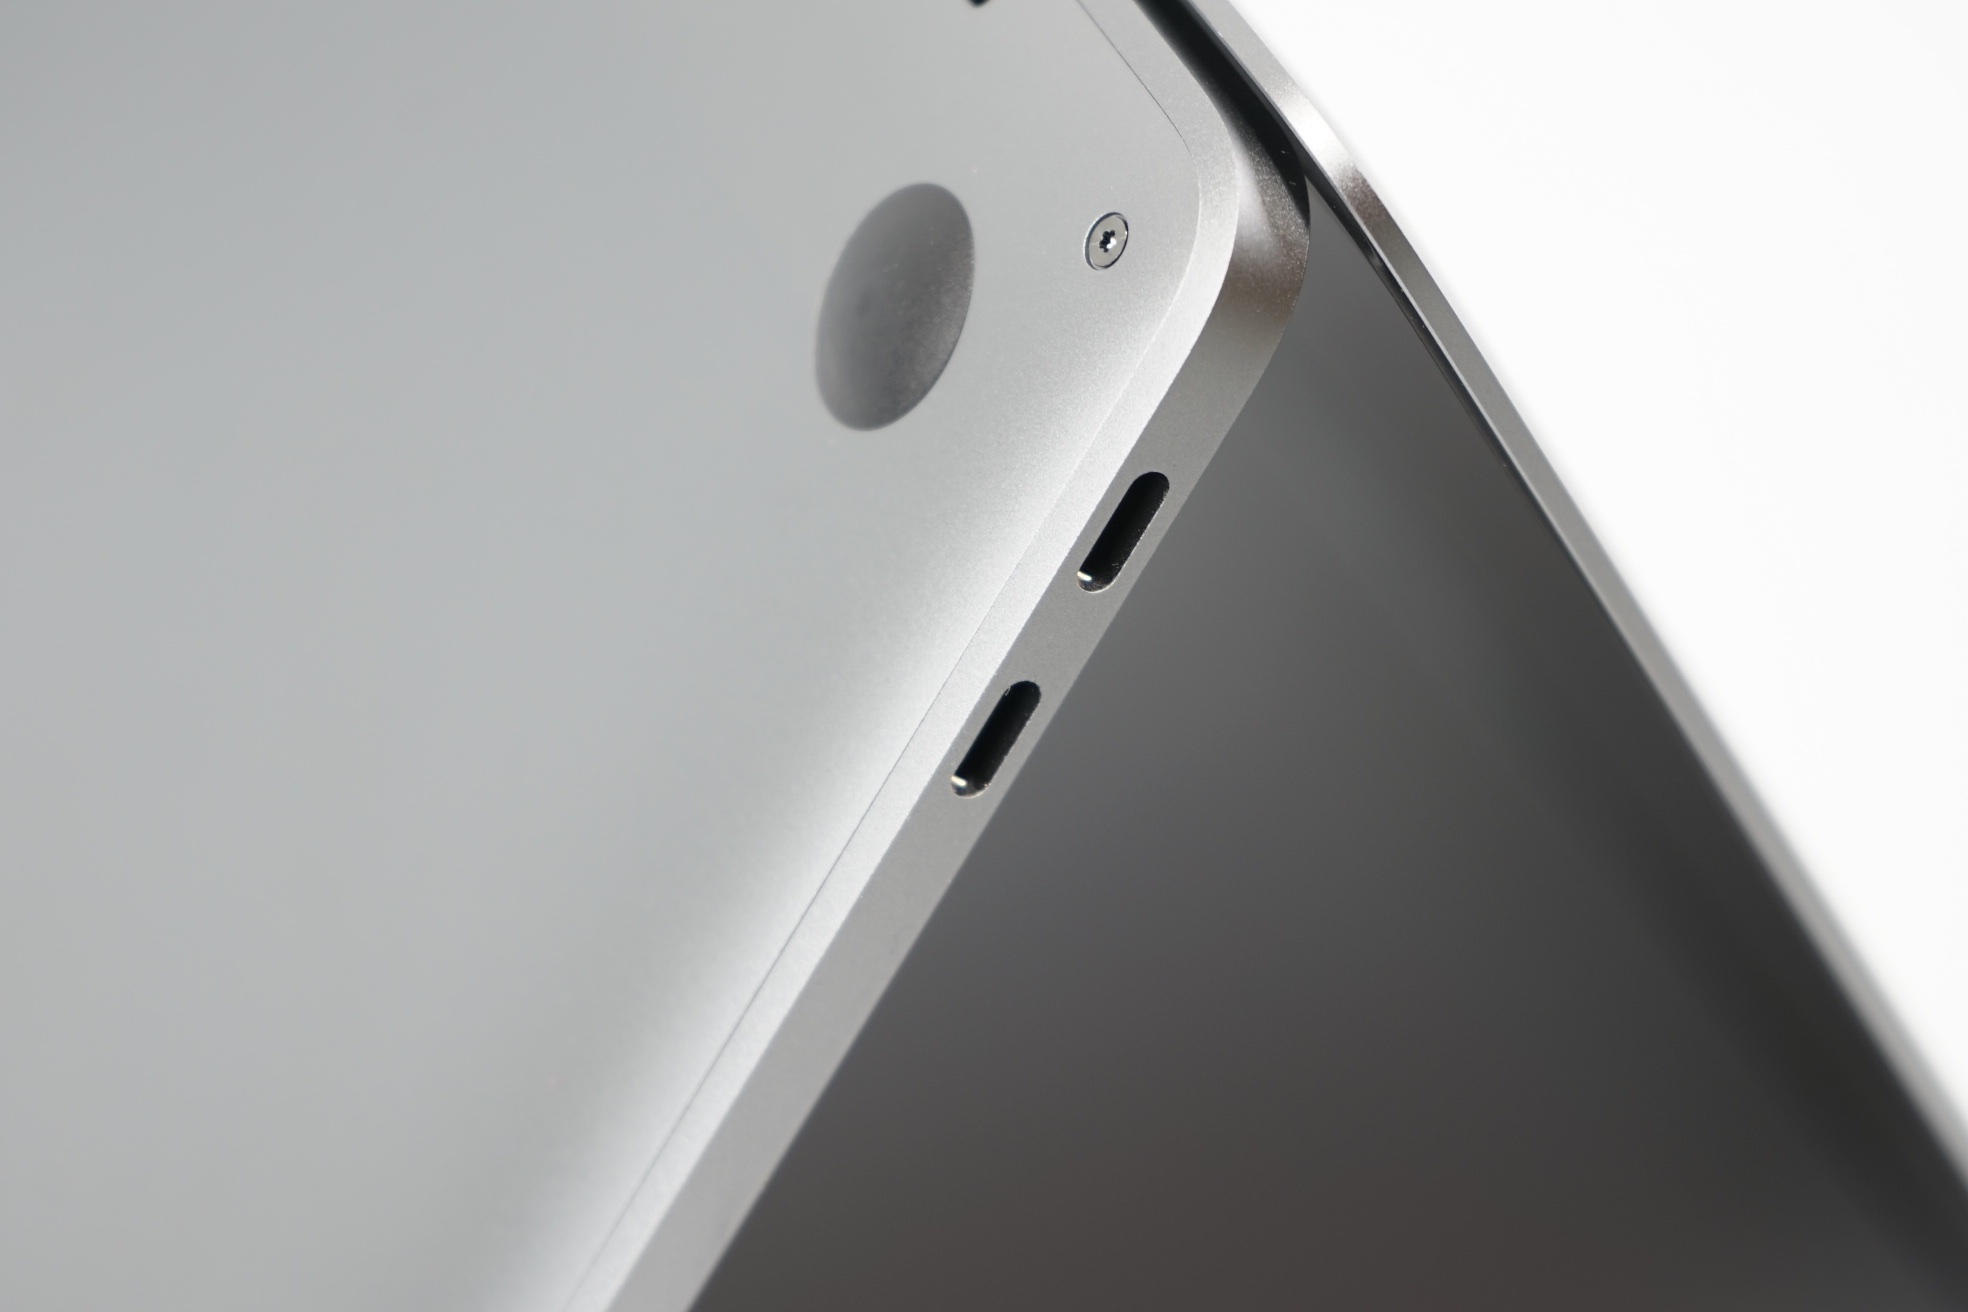
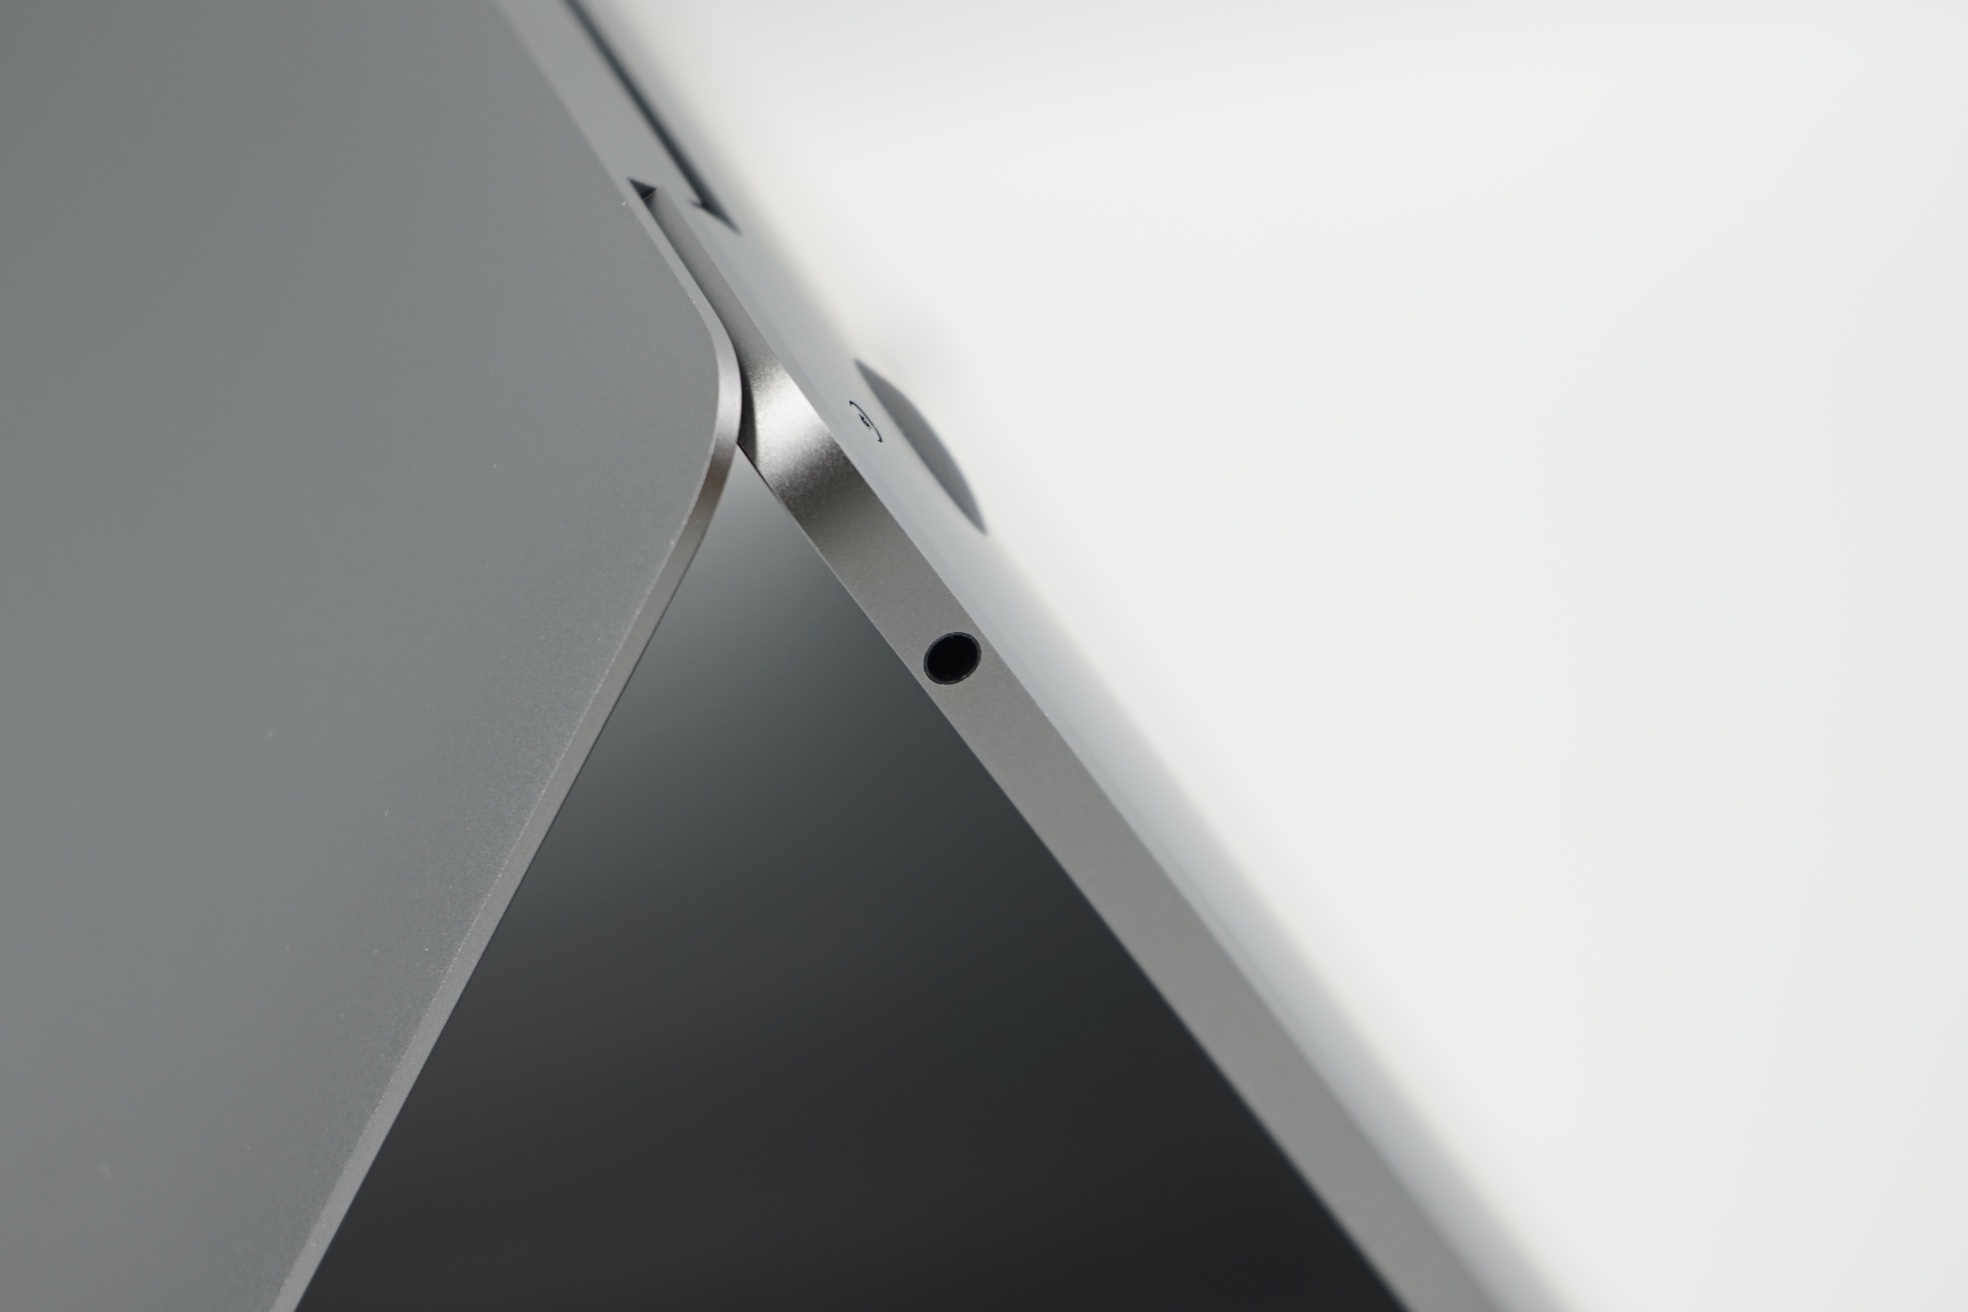
| Ports | 2x Thunderbolt 3 with USB-C 3.5 mm headset |
4x Thunderbolt 3 with USB-C 3.5 mm headset |
| Price | from $1299 | from $1799 |
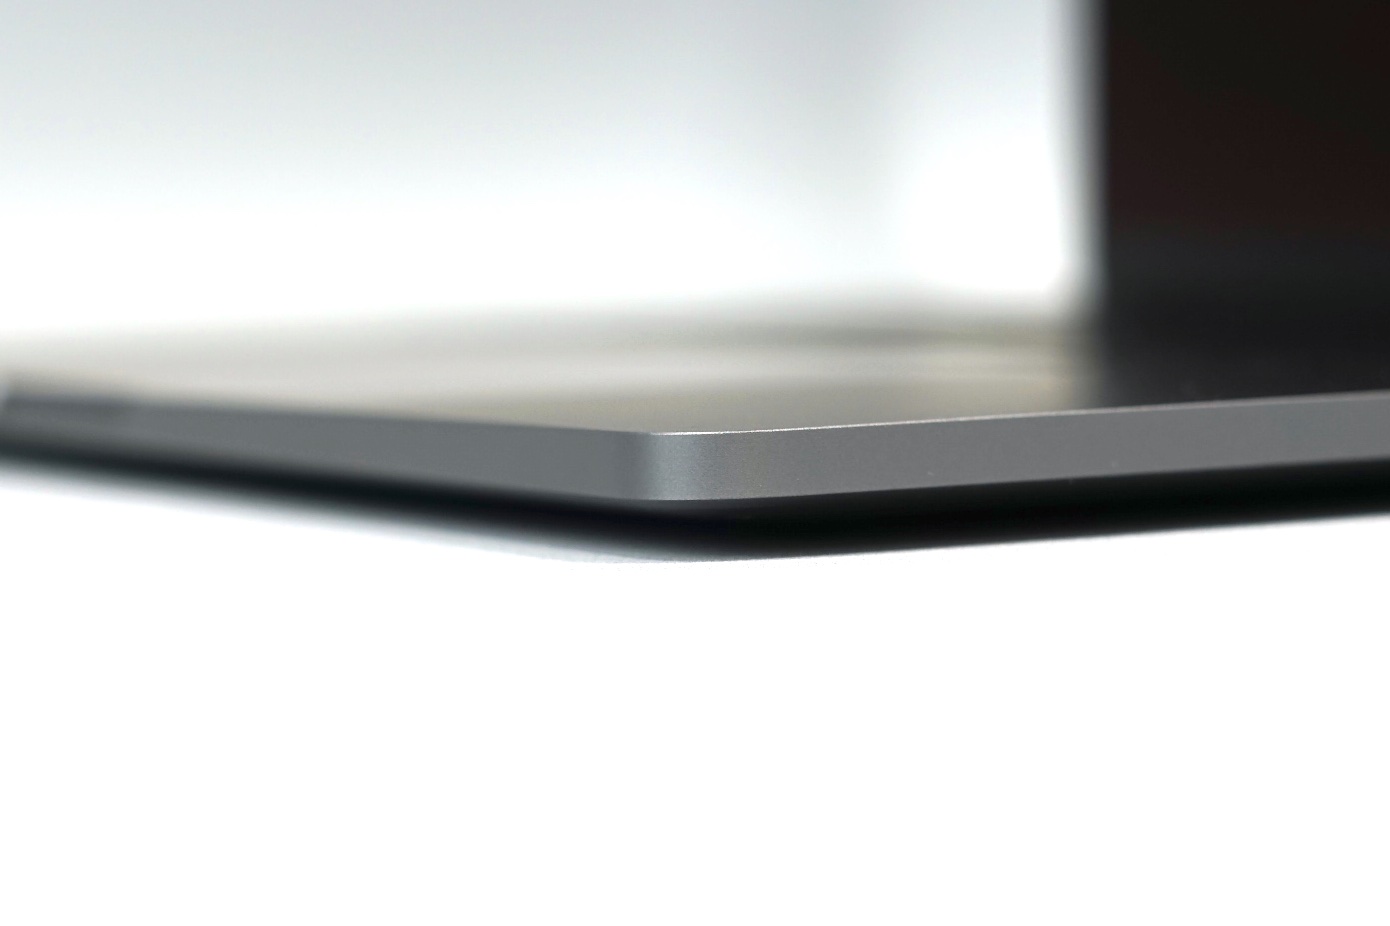
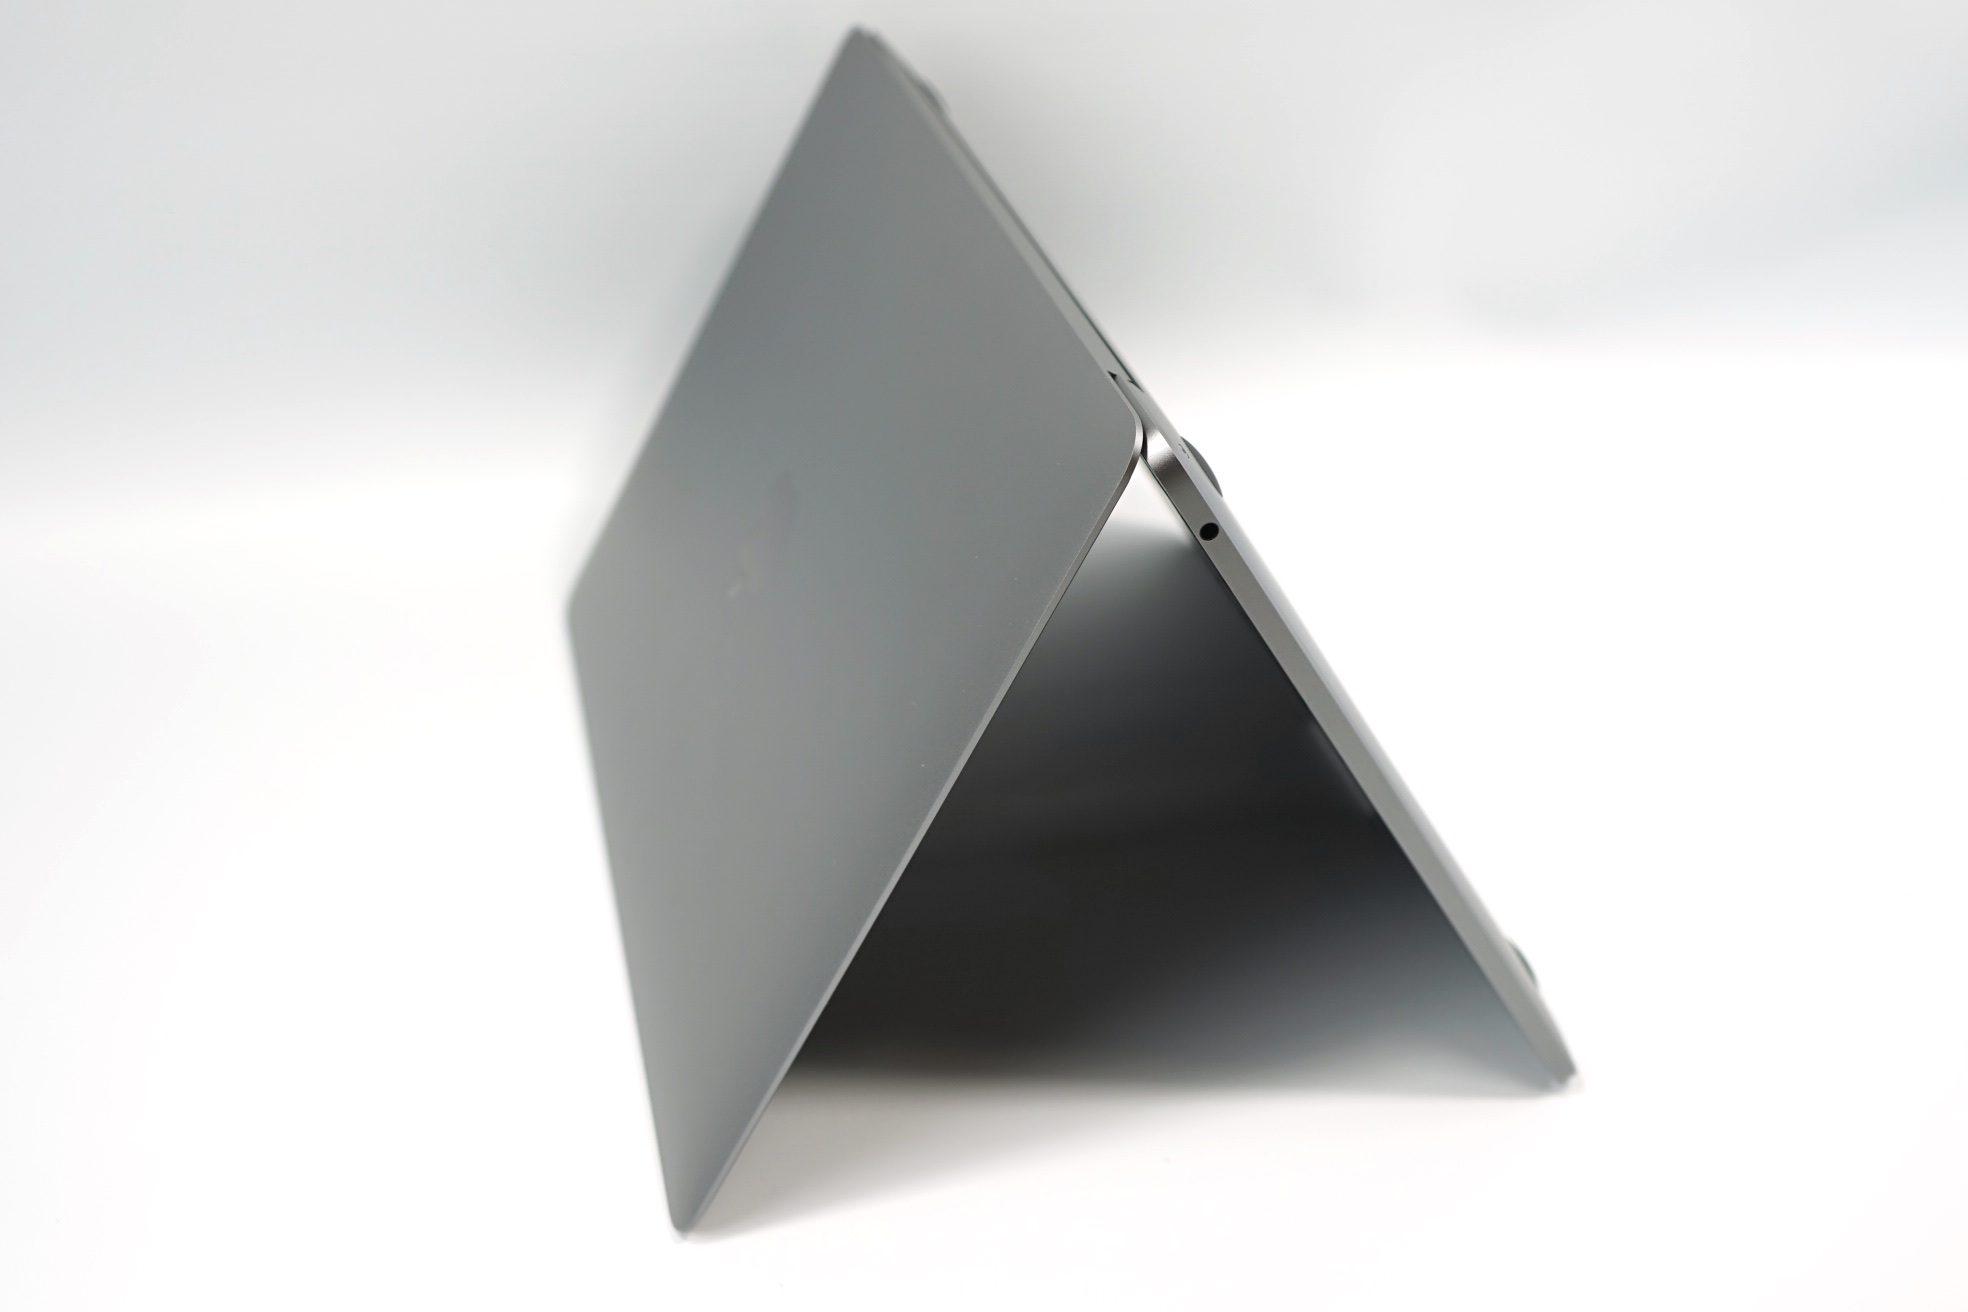
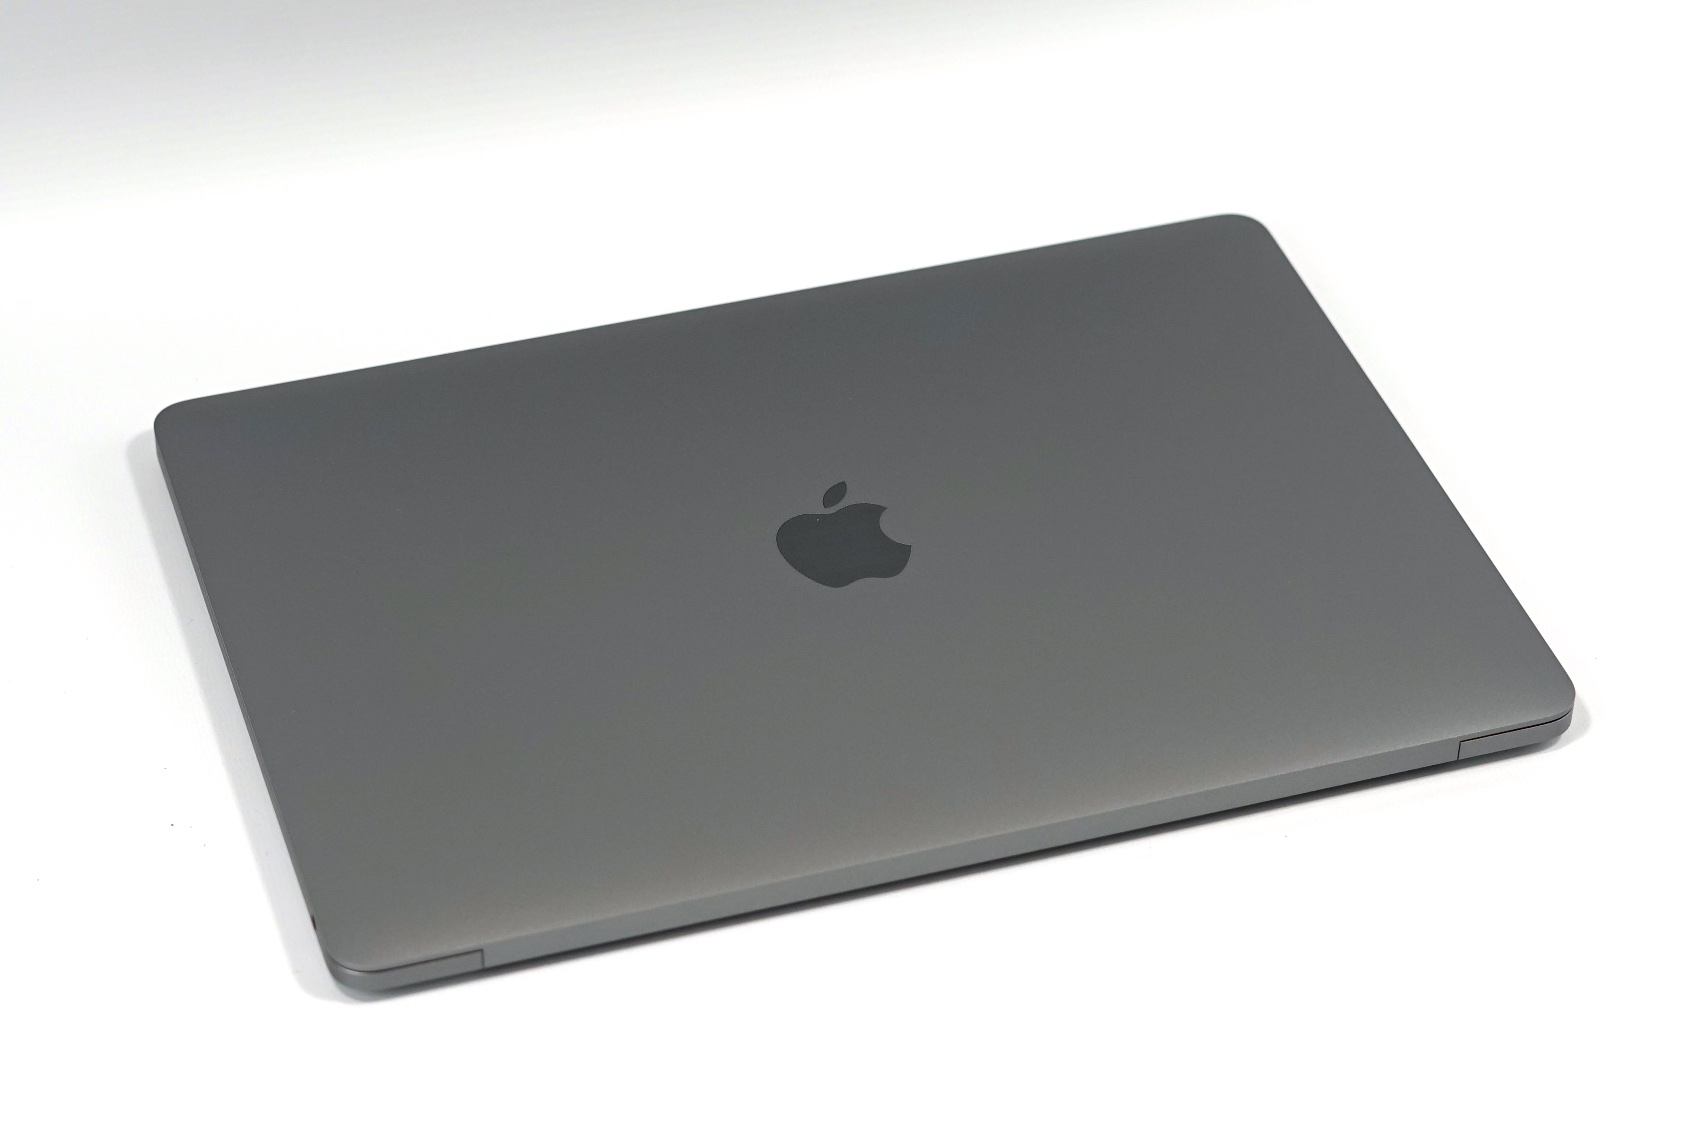
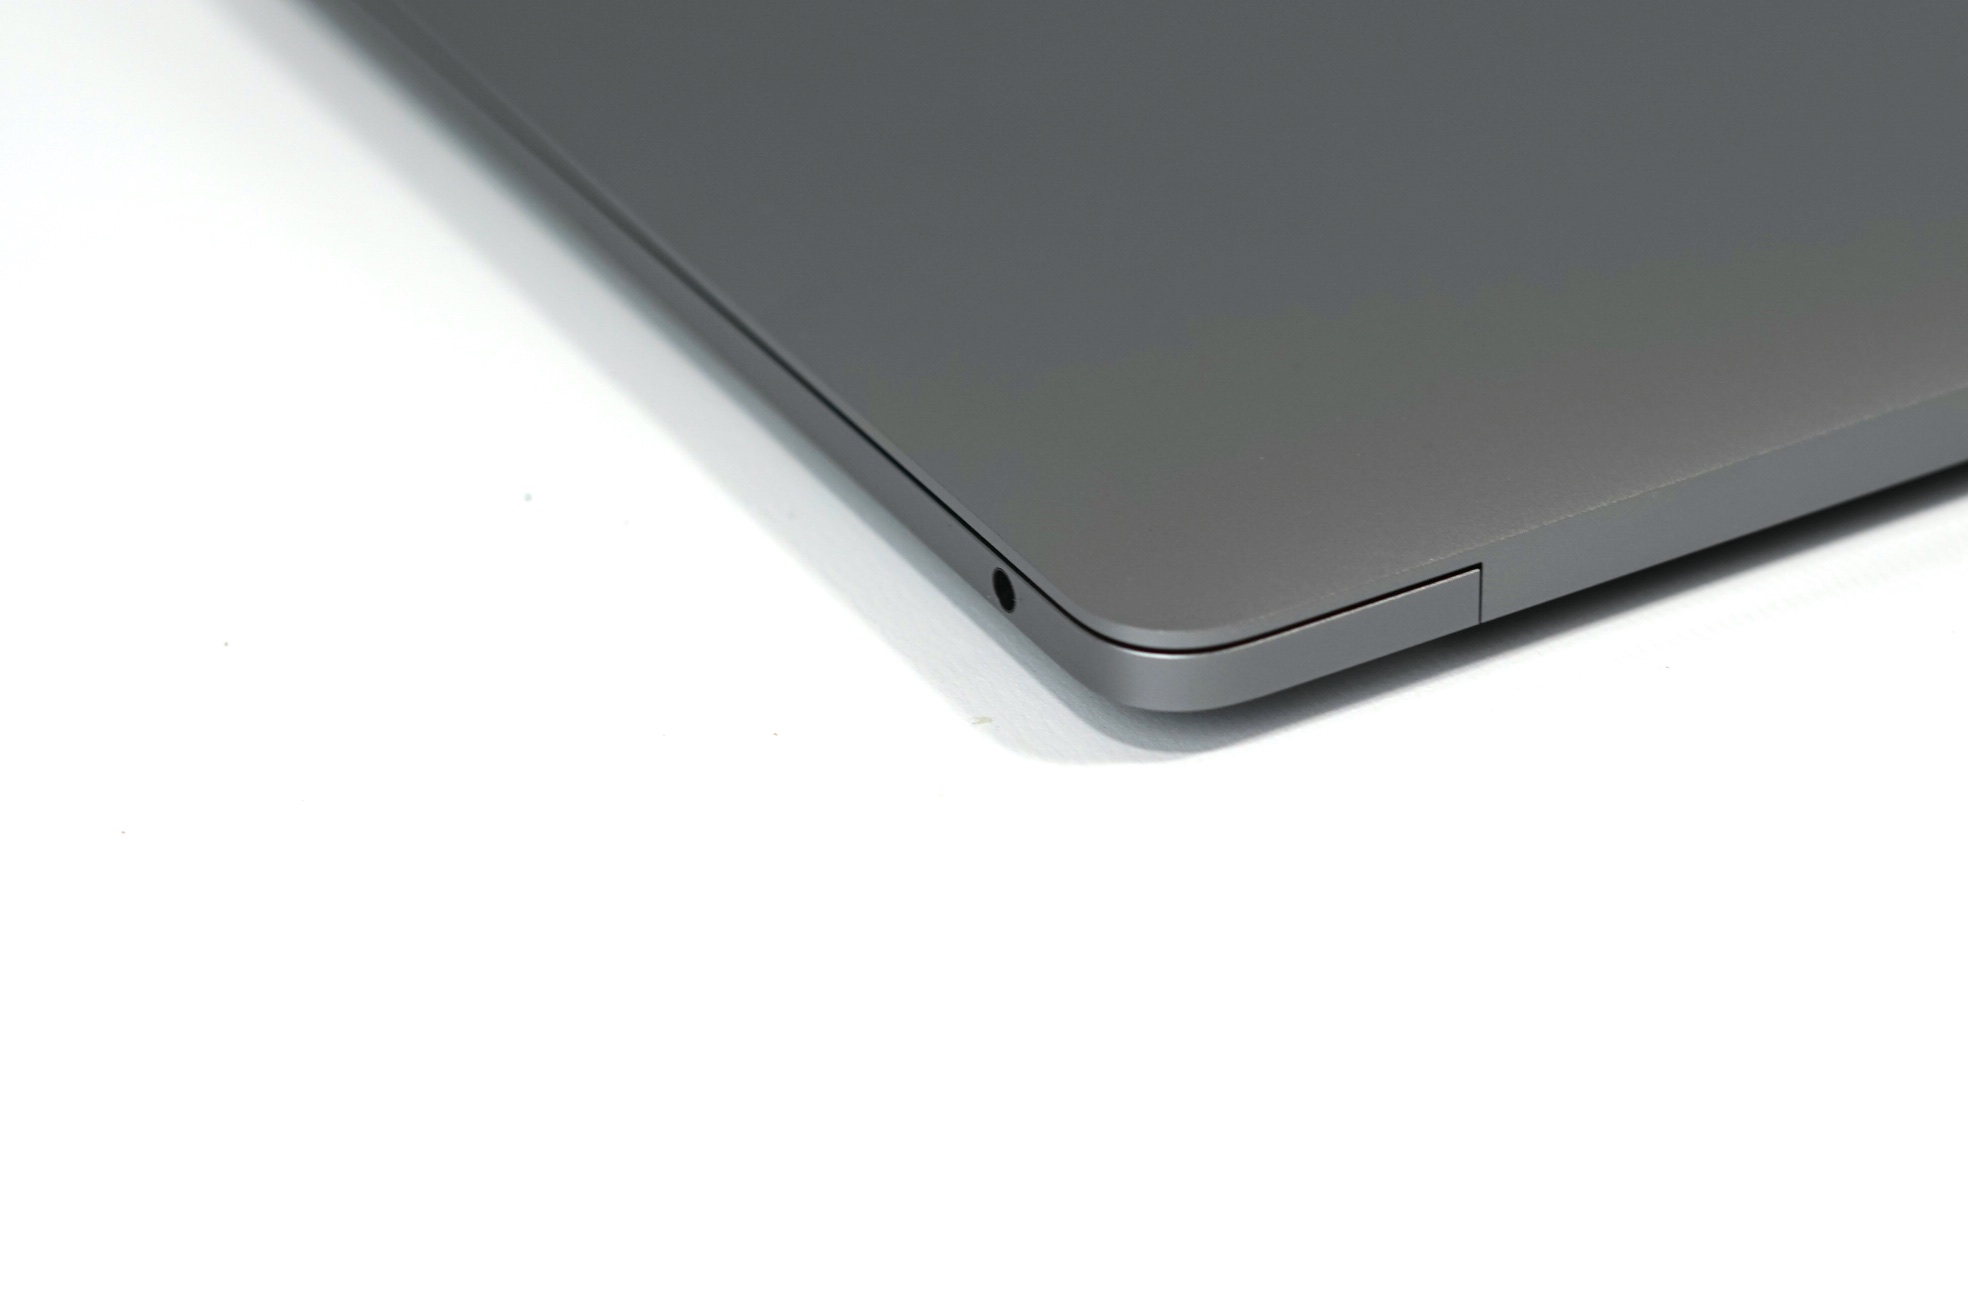
The case and the port selection did not change compared to the previous model, so we will not cover all the review sections once again. Please see our review of the MacBook Pro 13 2016 for the corresponding information; the following pictures were taken from this article as well. We also reviewed the other 2017 MacBooks:
- Apple MacBook Pro 13 with Touch Bar (Mid 2017, Core i5)
- Apple MacBook Pro 15 (Mid 2017, Core i7, Radeon Pro 555)
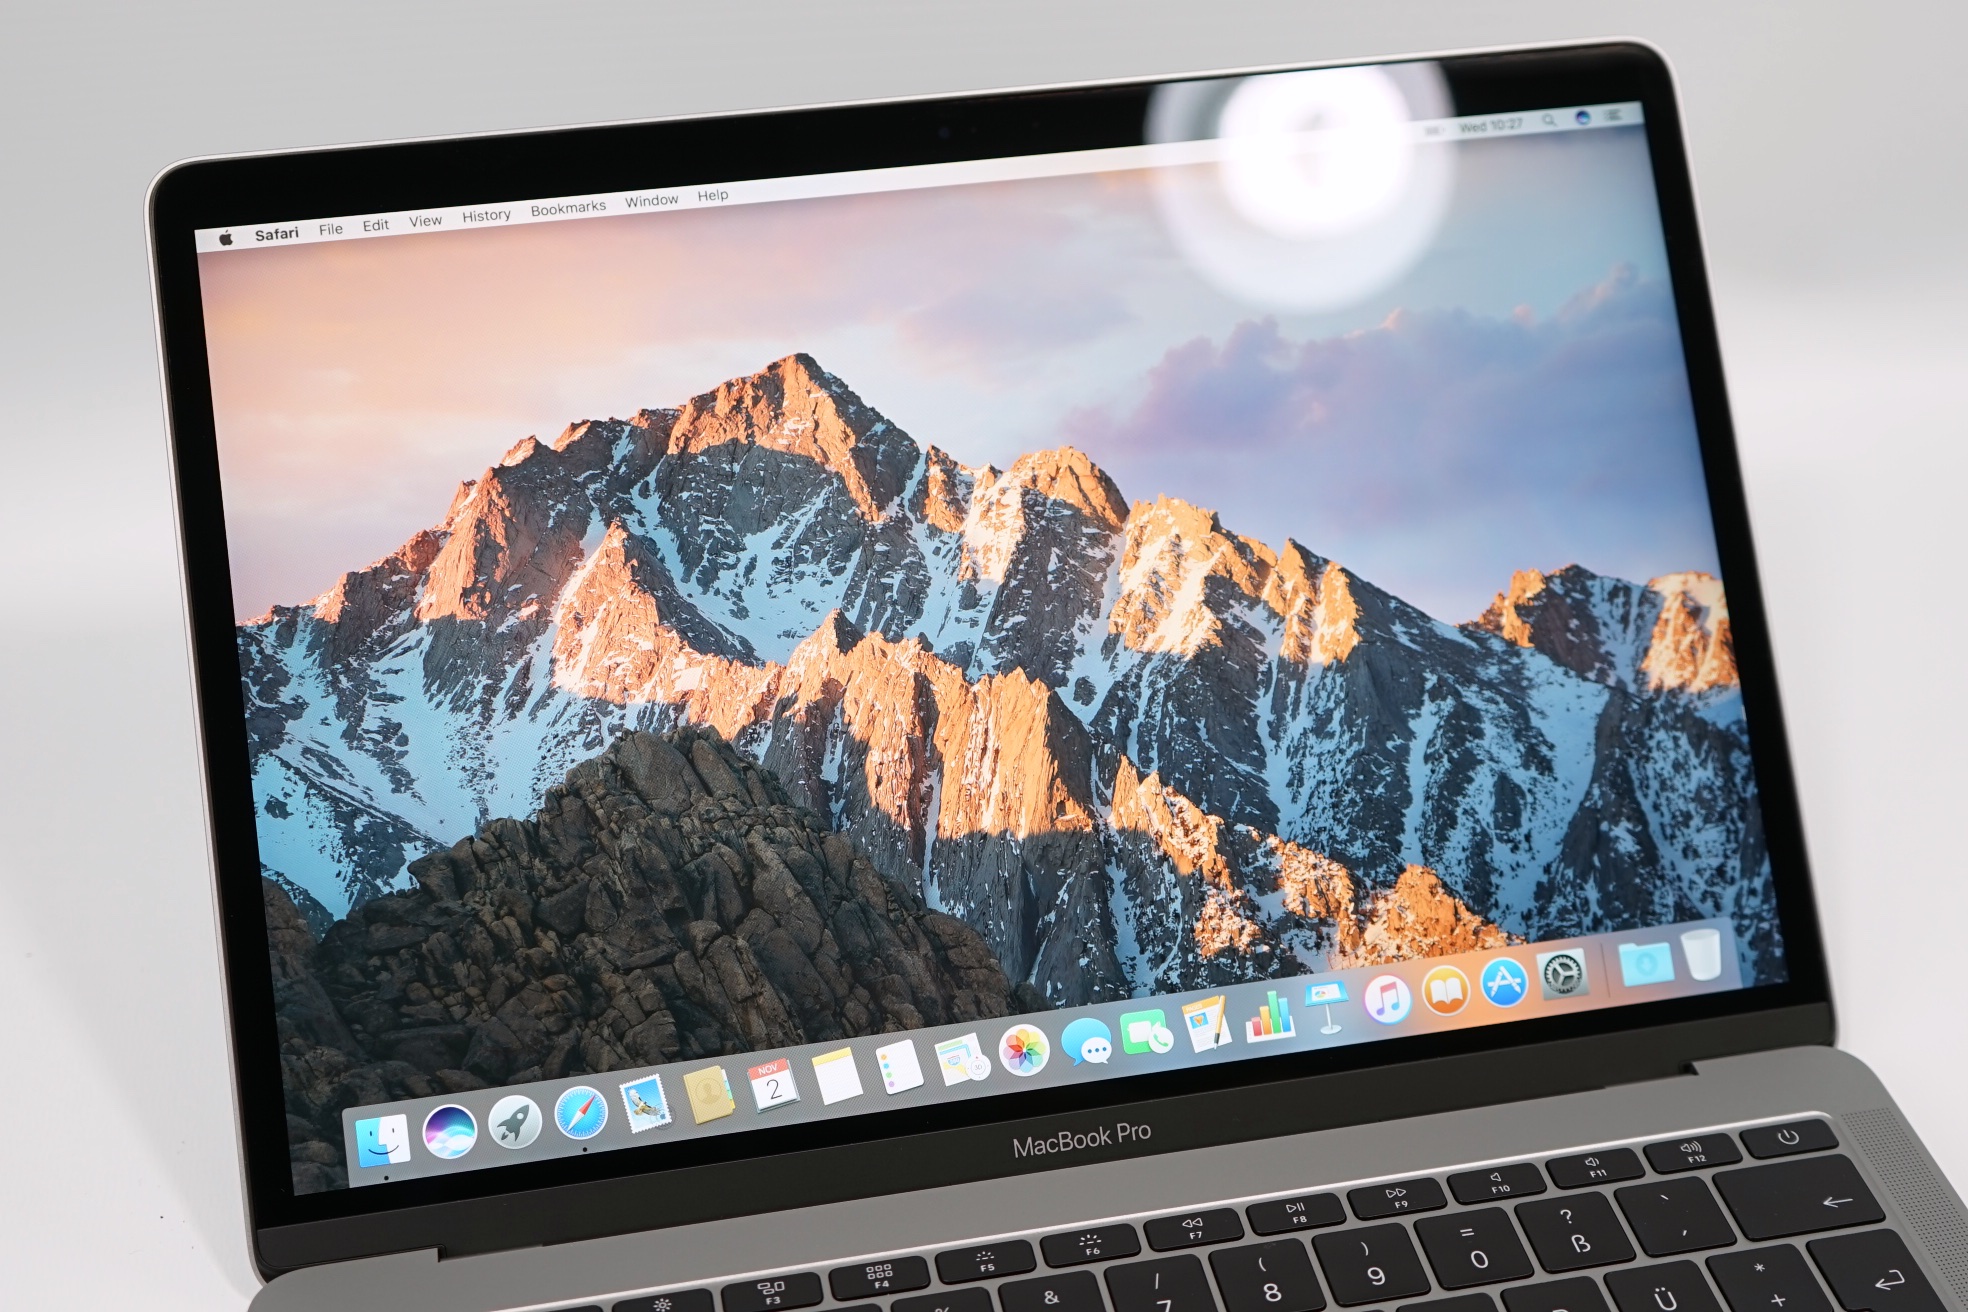
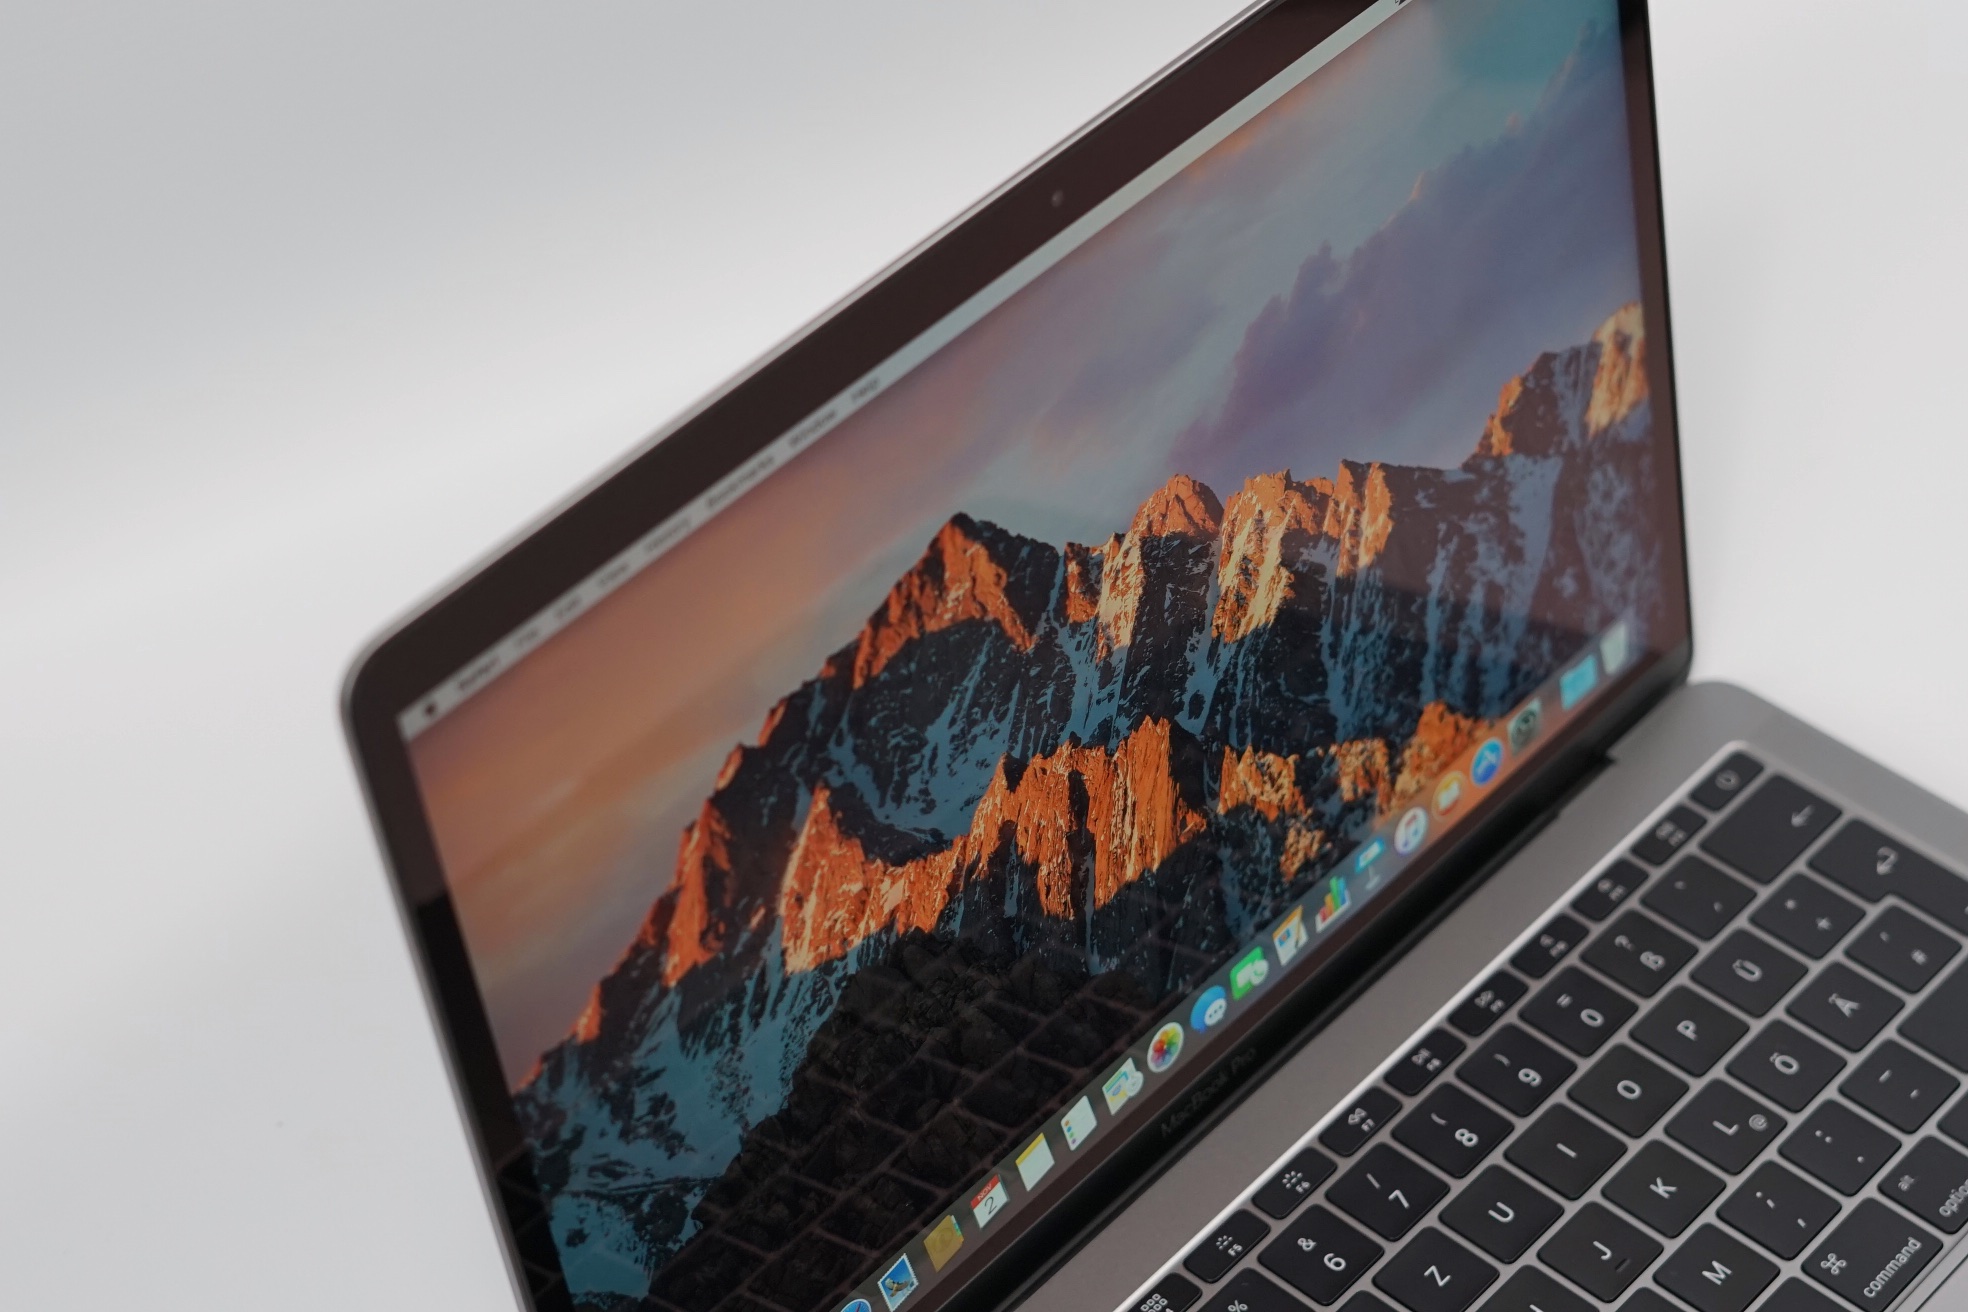
Display
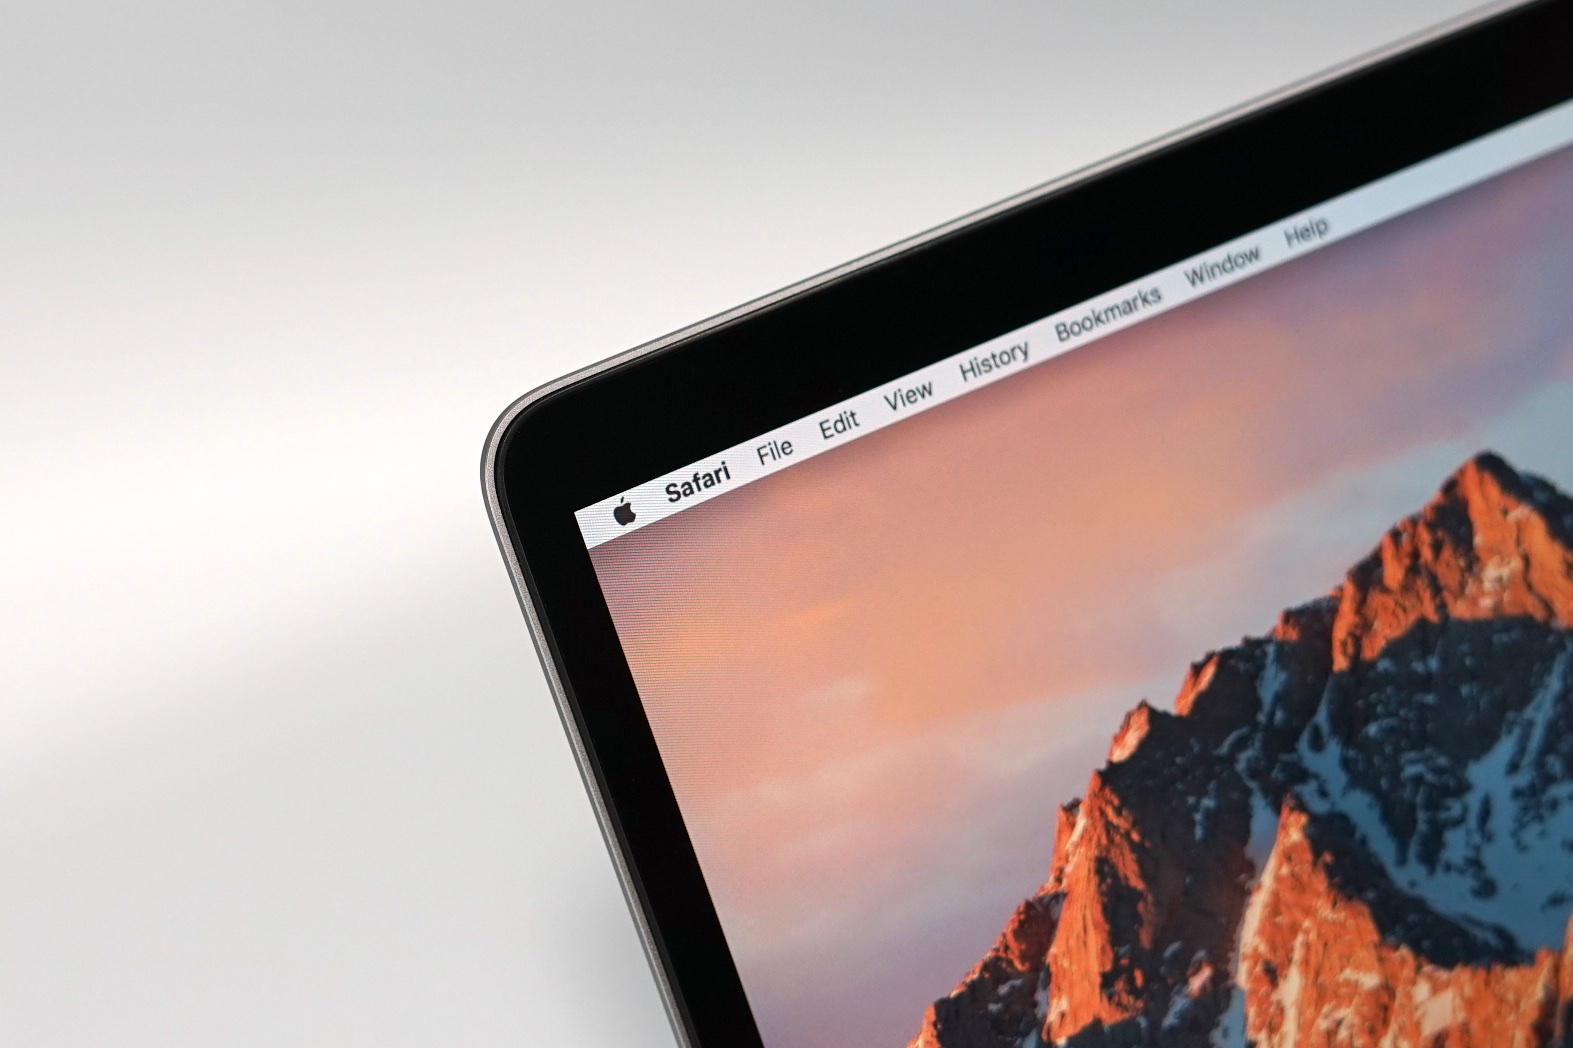
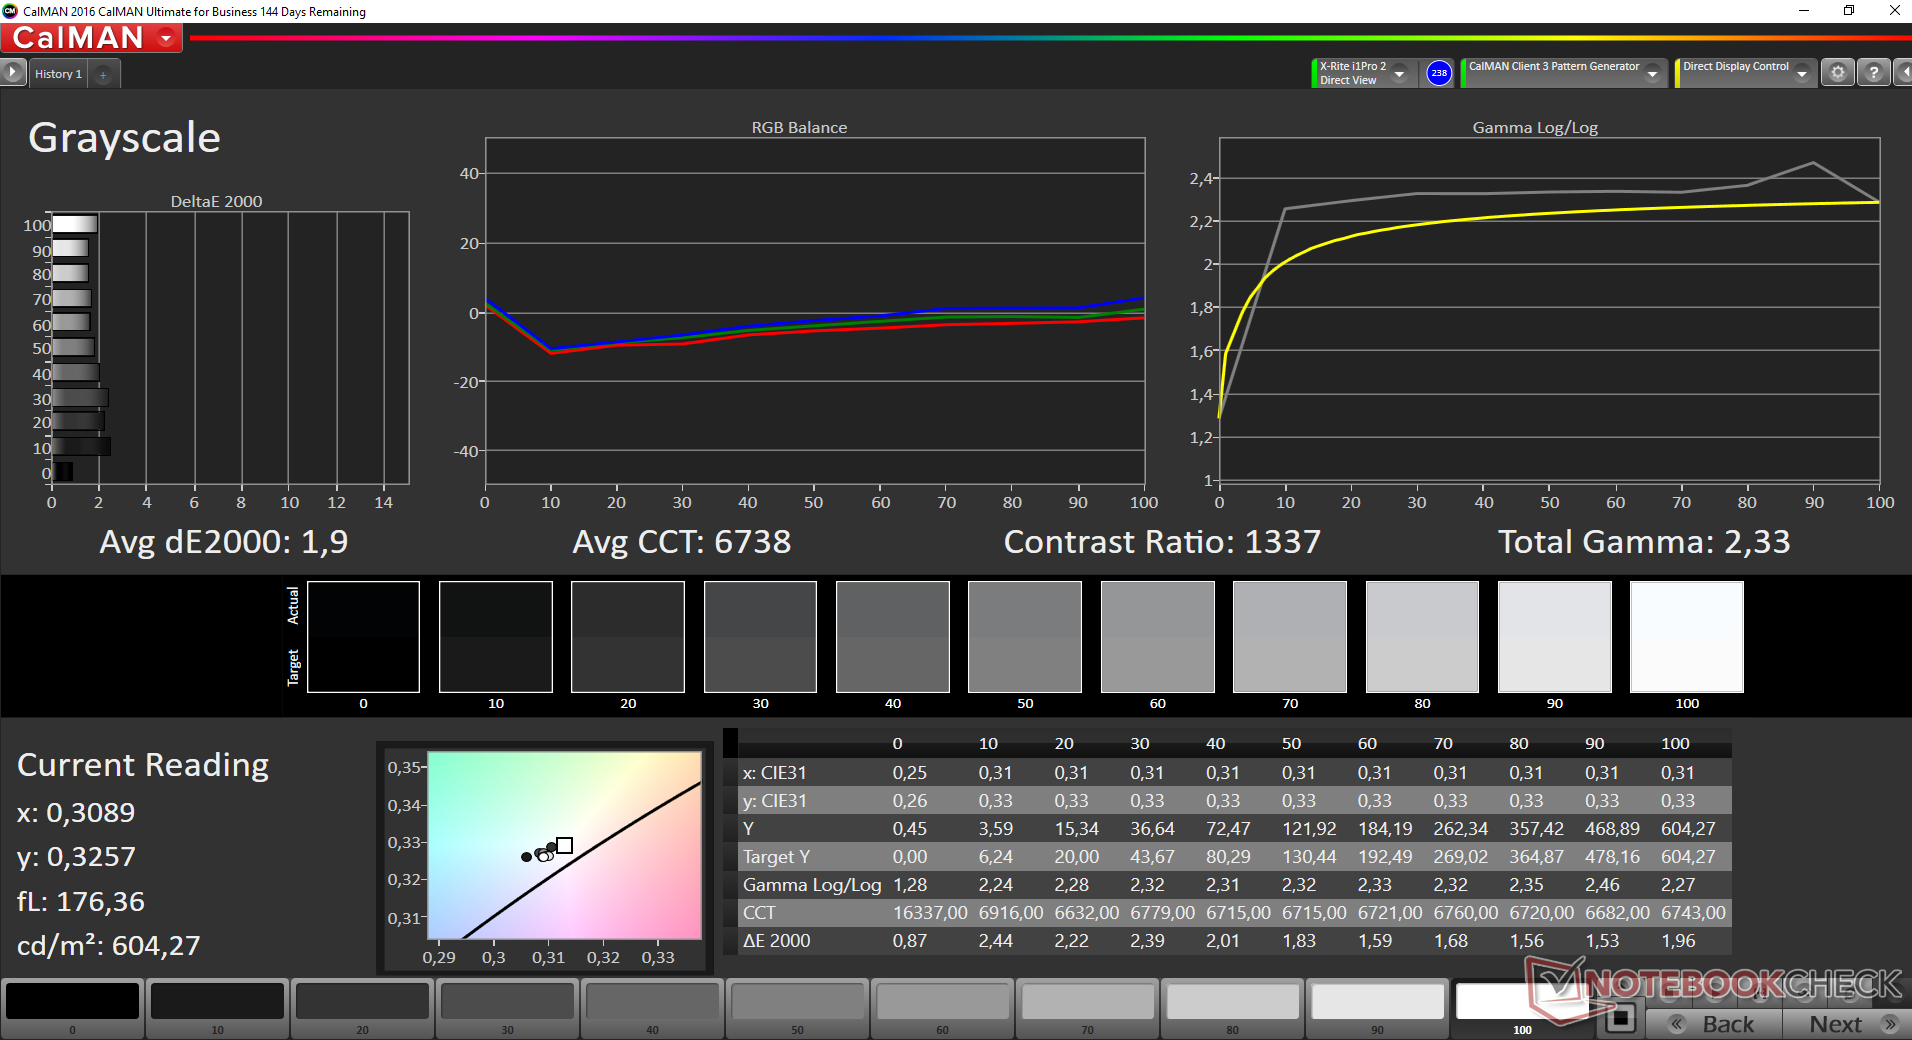
The basic features of the 13.3-inch display did not change. The native resolution is still 2560x1600 pixels, which results in very sharp contents. macOS in particular scales perfectly and you can always enjoy crisp texts and images. Our test models of the current MacBook Pro 13 (with/without Touch Bar) either used the panel APPA033 or APPA034, but there are no major differences between the screens. Our test model today was shipped with the APPA033. It manages a high luminance of 564 cd/m² on average. The black value suffers a bit, but 0.45 cd/m² is still okay and results in a contrast ratio of more than 1300:1.
| |||||||||||||||||||||||||
Brightness Distribution: 92 %
Center on Battery: 588 cd/m²
Contrast: 1307:1 (Black: 0.45 cd/m²)
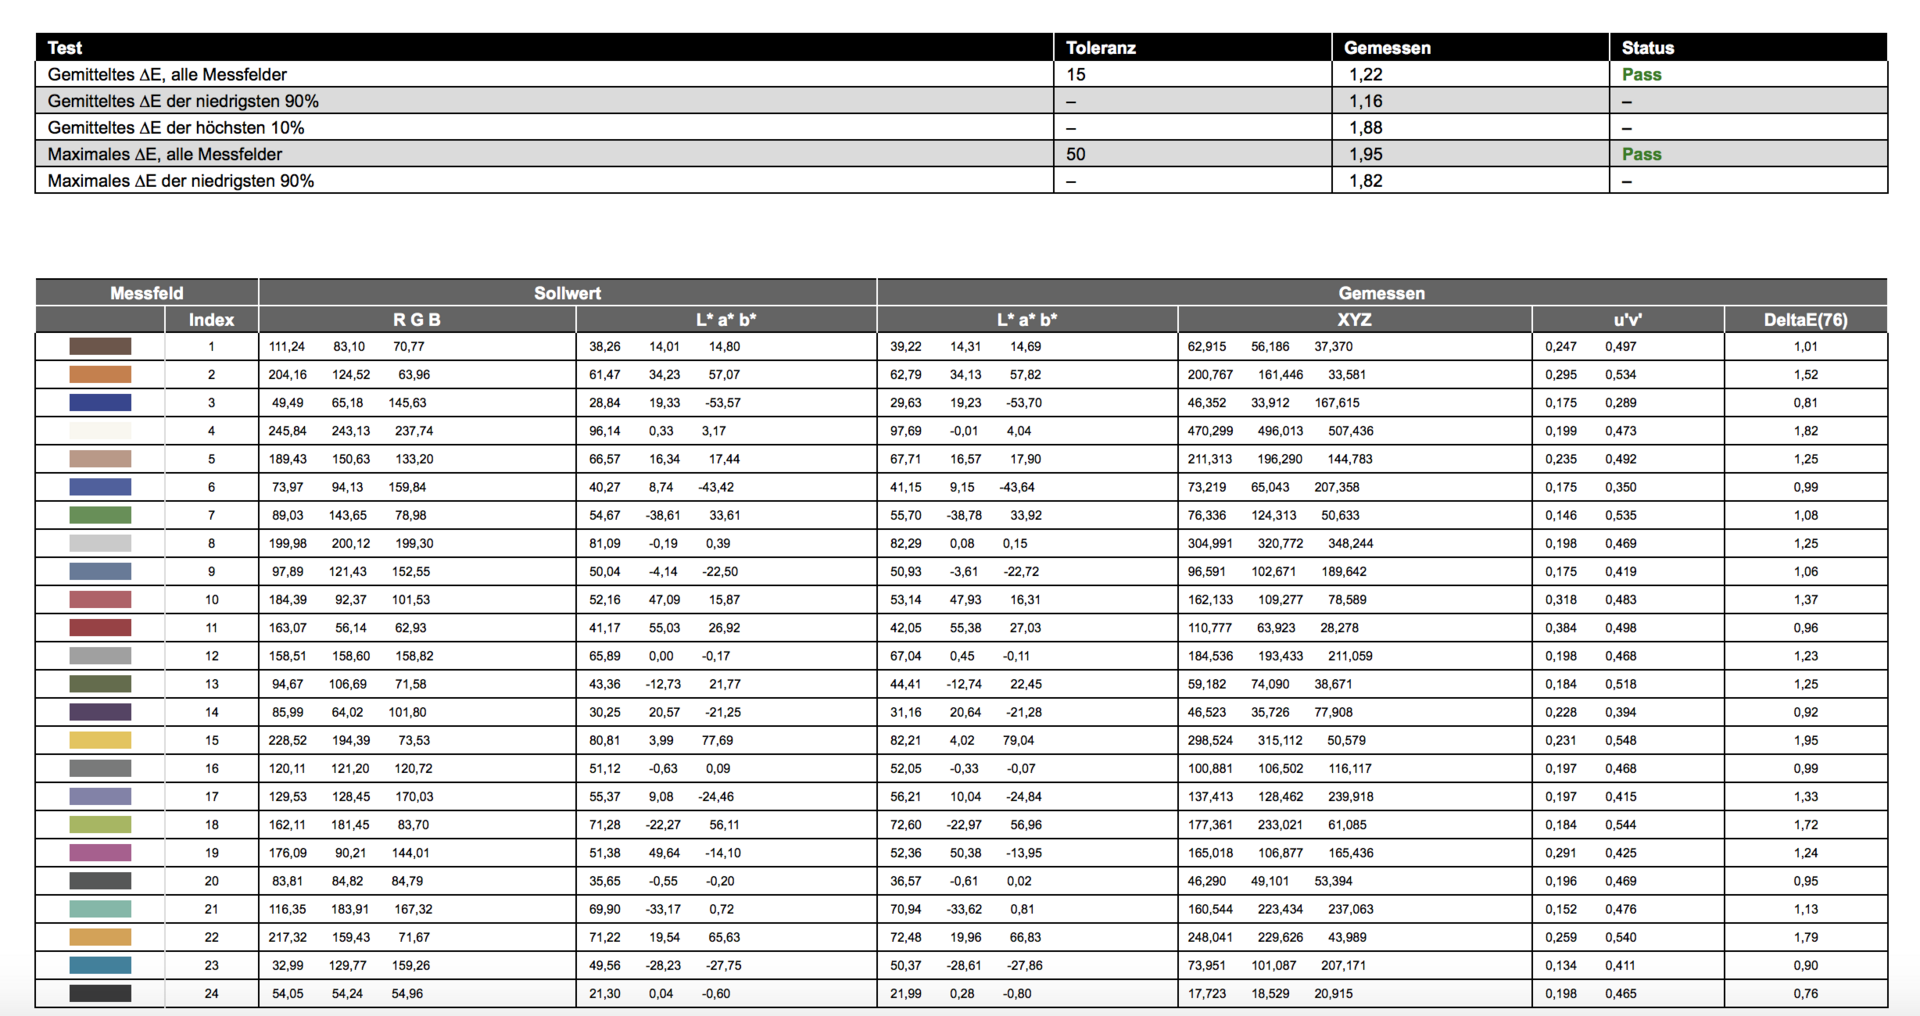
ΔE ColorChecker Calman: 1.7 | ∀{0.5-29.43 Ø4.73}
ΔE Greyscale Calman: 1.9 | ∀{0.09-98 Ø4.97}
99.94% sRGB (Argyll 1.6.3 3D)
77.92% AdobeRGB 1998 (Argyll 1.6.3 3D)
87.1% AdobeRGB 1998 (Argyll 3D)
99.9% sRGB (Argyll 3D)
99.2% Display P3 (Argyll 3D)
Gamma: 2.33
CCT: 6738 K
| Apple MacBook Pro 13 2017 APPA033, , 2560x1600, 13.3" | Apple MacBook Pro 13 2016 APPA034, , 2560x1600, 13.3" | Apple MacBook Pro 13 2017 Touchbar i5 APPA034, , 2560x1600, 13.3" | Lenovo ThinkPad X1 Carbon 2017-20HR0021GE B140HAN03_1, , 1920x1080, 14" | Razer Blade Stealth QHD i7-7500U Sharp SHP142F (LQ125T1JW02), , 2560x1440, 12.5" | Dell XPS 13 9360 QHD+ i7 Sharp SHP144A, , 3200x1800, 13.3" | |
|---|---|---|---|---|---|---|
| Display | -1% | -1% | -26% | -18% | -25% | |
| Display P3 Coverage (%) | 99.2 | 97.1 -2% | 98.6 -1% | 61.6 -38% | 68.7 -31% | 62.8 -37% |
| sRGB Coverage (%) | 99.9 | 99.8 0% | 100 0% | 87.6 -12% | 95.8 -4% | 89.4 -11% |
| AdobeRGB 1998 Coverage (%) | 87.1 | 86.7 0% | 86.5 -1% | 62.6 -28% | 69.9 -20% | 64.6 -26% |
| Response Times | -45% | -15% | -9% | -1% | -2% | |
| Response Time Grey 50% / Grey 80% * (ms) | 42.8 ? | 47.2 ? -10% | 48 ? -12% | 48 ? -12% | 37 ? 14% | 43.6 ? -2% |
| Response Time Black / White * (ms) | 28.8 ? | 51.6 ? -79% | 33.6 ? -17% | 30.4 ? -6% | 33.4 ? -16% | 29.2 ? -1% |
| PWM Frequency (Hz) | 119000 ? | 200 ? | ||||
| Screen | -3% | 15% | -42% | -48% | -43% | |
| Brightness middle (cd/m²) | 588 | 600 2% | 551 -6% | 278 -53% | 402 -32% | 396.2 -33% |
| Brightness (cd/m²) | 561 | 564 1% | 514 -8% | 271 -52% | 382 -32% | 357 -36% |
| Brightness Distribution (%) | 92 | 89 -3% | 88 -4% | 91 -1% | 88 -4% | 84 -9% |
| Black Level * (cd/m²) | 0.45 | 0.57 -27% | 0.48 -7% | 0.16 64% | 0.45 -0% | 0.266 41% |
| Contrast (:1) | 1307 | 1053 -19% | 1148 -12% | 1738 33% | 893 -32% | 1489 14% |
| Colorchecker dE 2000 * | 1.7 | 1.5 12% | 0.8 53% | 4.5 -165% | 3.6 -112% | 3.9 -129% |
| Colorchecker dE 2000 max. * | 3.5 | 2.9 17% | 1.4 60% | 8.4 -140% | 7.5 -114% | 7.58 -117% |
| Greyscale dE 2000 * | 1.9 | 2 -5% | 1 47% | 3.2 -68% | 4.3 -126% | 4.16 -119% |
| Gamma | 2.33 94% | 2.27 97% | 2.16 102% | 2.02 109% | 2.1 105% | 2.31 95% |
| CCT | 6738 96% | 6855 95% | 6672 97% | 7042 92% | 6572 99% | 6514 100% |
| Color Space (Percent of AdobeRGB 1998) (%) | 77.92 | 77 -1% | 57 -27% | 62.3 -20% | 57.5 -26% | |
| Color Space (Percent of sRGB) (%) | 99.94 | 92 -8% | 87.5 -12% | 95.7 -4% | 88.7 -11% | |
| Total Average (Program / Settings) | -16% /
-8% | -0% /
7% | -26% /
-34% | -22% /
-36% | -23% /
-33% |
* ... smaller is better
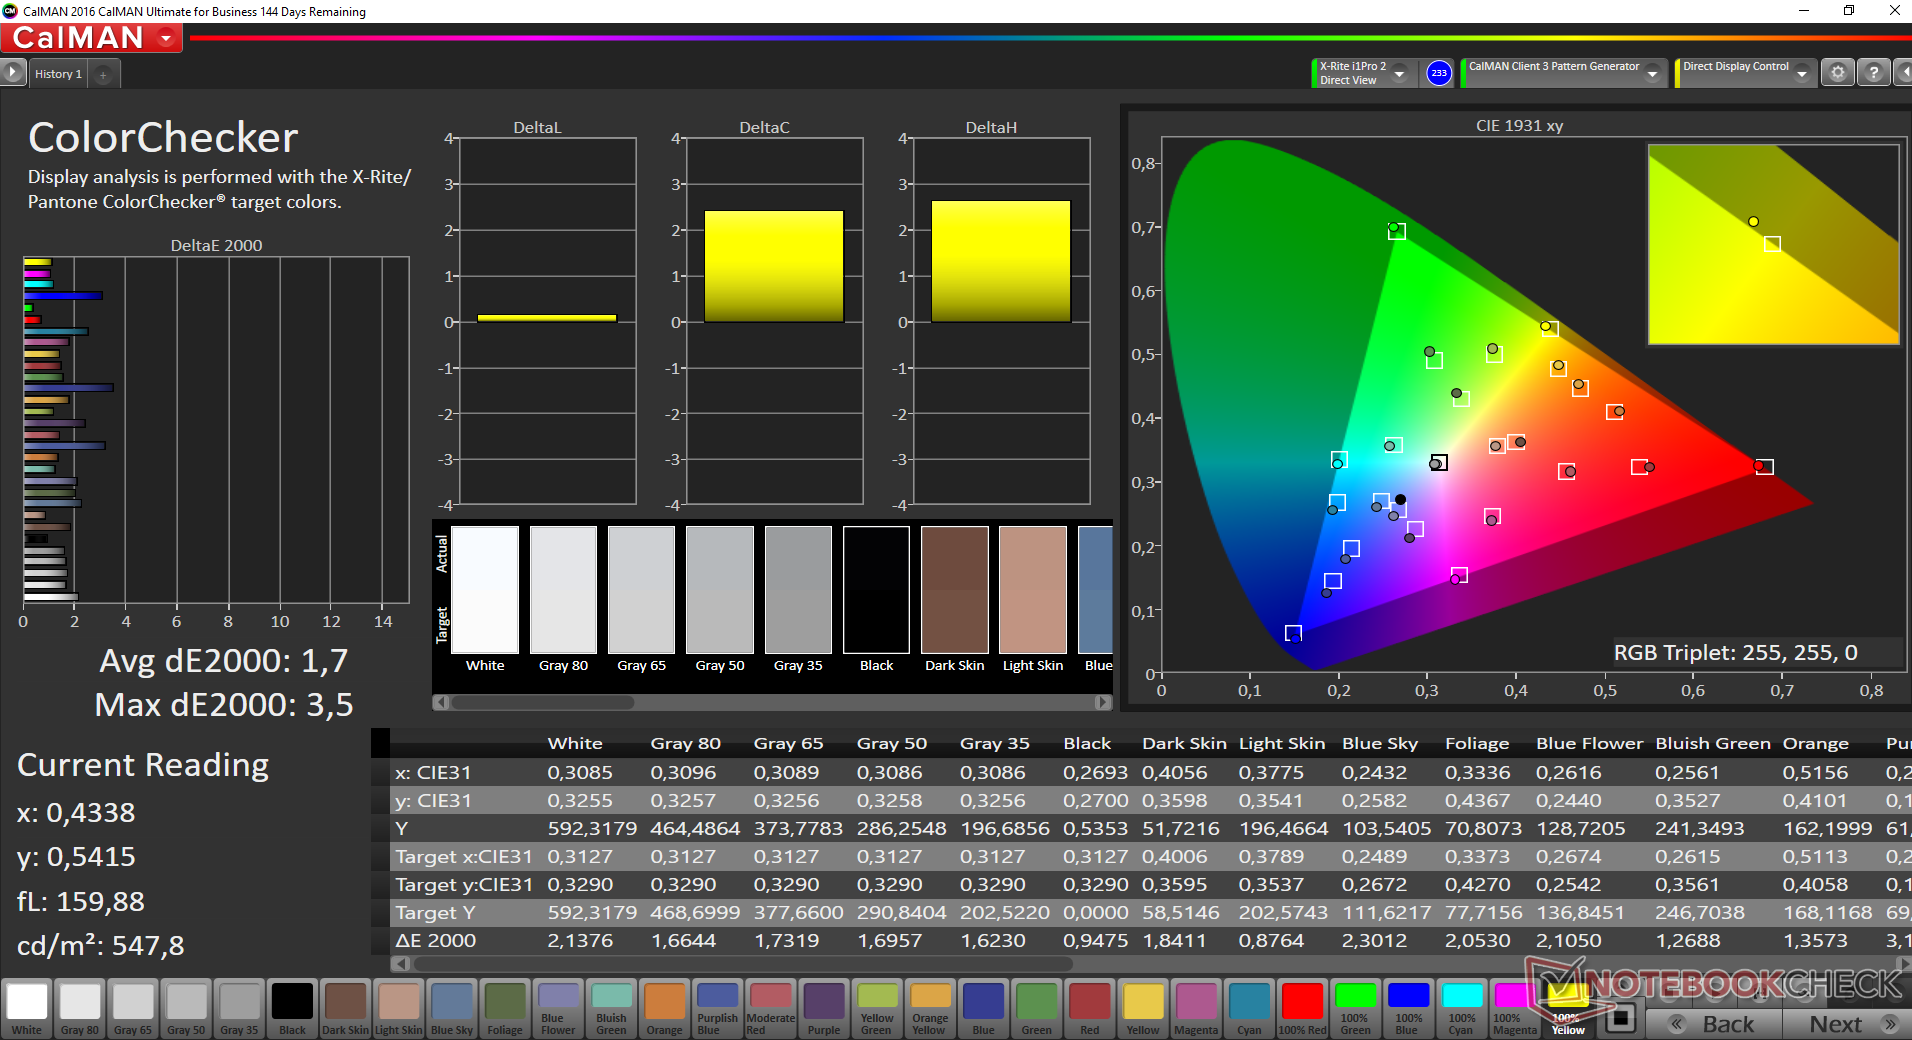
Our display measurements with the X-Rite i1Pro 2 spectrophotometer and the professional software CalMAN already determines low deviations compared to the P3 reference out of the box. The average DeltaE-2000 values are within the target range (smaller 3), only some shades of blue surpass 3.
Display Response Times
| ↔ Response Time Black to White | ||
|---|---|---|
| 28.8 ms ... rise ↗ and fall ↘ combined | ↗ 14.8 ms rise | 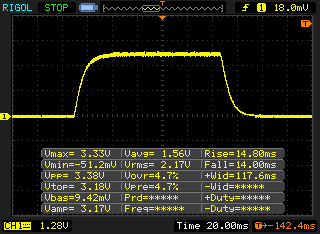 |
| ↘ 14 ms fall | ||
| The screen shows relatively slow response rates in our tests and may be too slow for gamers. In comparison, all tested devices range from 0.1 (minimum) to 240 (maximum) ms. » 76 % of all devices are better. This means that the measured response time is worse than the average of all tested devices (19.9 ms). | ||
| ↔ Response Time 50% Grey to 80% Grey | ||
| 42.8 ms ... rise ↗ and fall ↘ combined | ↗ 22.4 ms rise | 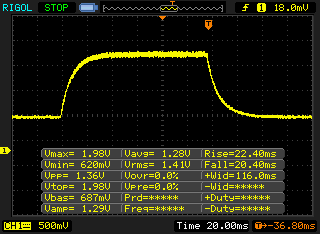 |
| ↘ 20.4 ms fall | ||
| The screen shows slow response rates in our tests and will be unsatisfactory for gamers. In comparison, all tested devices range from 0.165 (minimum) to 636 (maximum) ms. » 70 % of all devices are better. This means that the measured response time is worse than the average of all tested devices (31.1 ms). | ||
Screen Flickering / PWM (Pulse-Width Modulation)
| Screen flickering / PWM not detected | 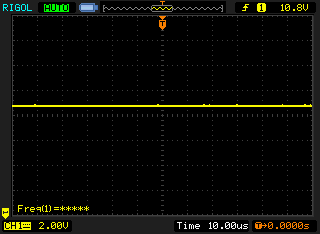 | ||
In comparison: 52 % of all tested devices do not use PWM to dim the display. If PWM was detected, an average of 7794 (minimum: 5 - maximum: 343500) Hz was measured. | |||
Performance
Apple ships the "small" MacBook Pro 13 with 15-watt processor (dual-core) from Intel. The specialty feature is the more powerful Iris Plus Graphics 640 graphics card with dedicated eDRAM cache, so the performance is better compared to regular ULV-iGPUs like the Intel HD Graphics 620, for example. Dedicated GPUs are not available. Apple only uses fast PCIe-SSD storage, so the subjective performance impression is very good. The MacBook Pro 13 can handle many workloads as long as they are not too demanding. Everyday tasks like web browsing, mails, light picture editing and the like are no problem though.

Processor
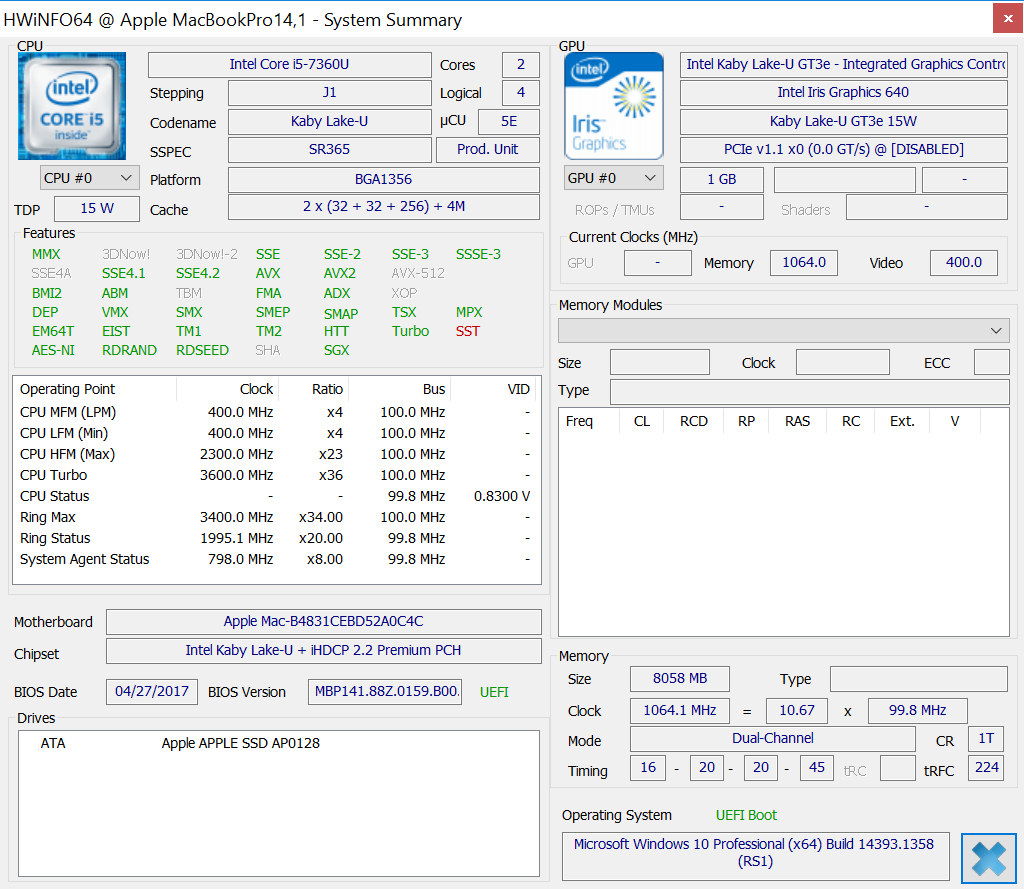
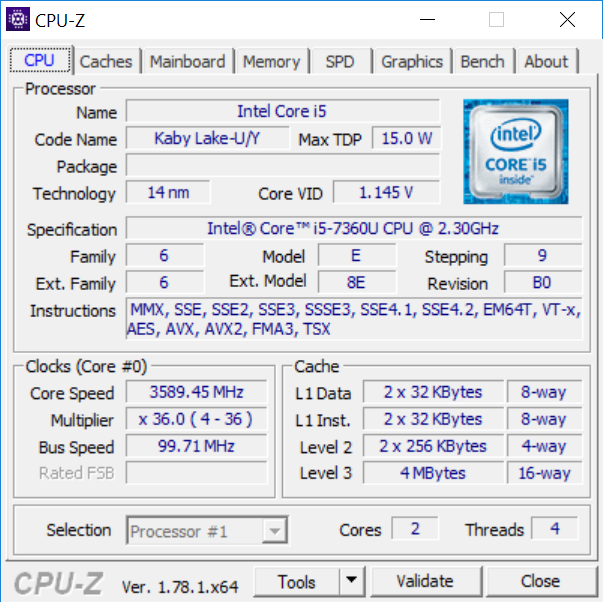
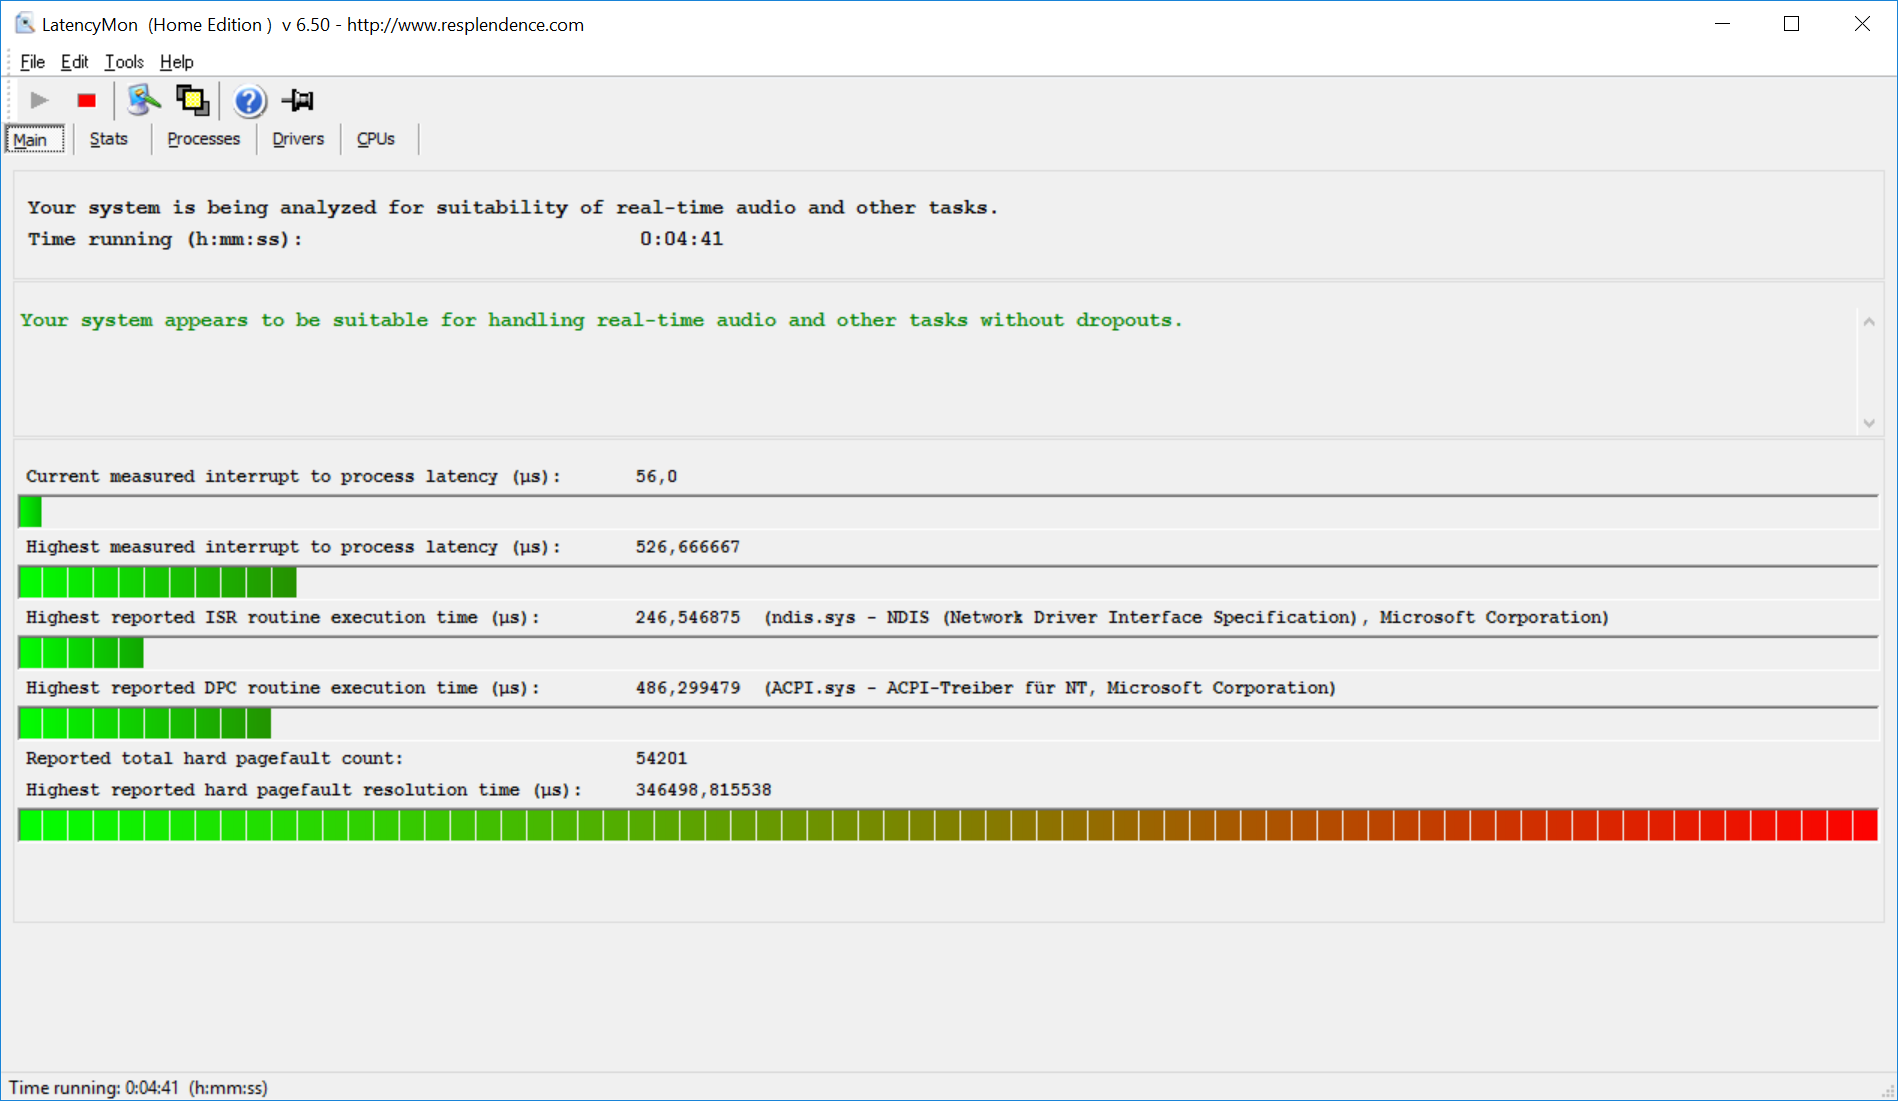
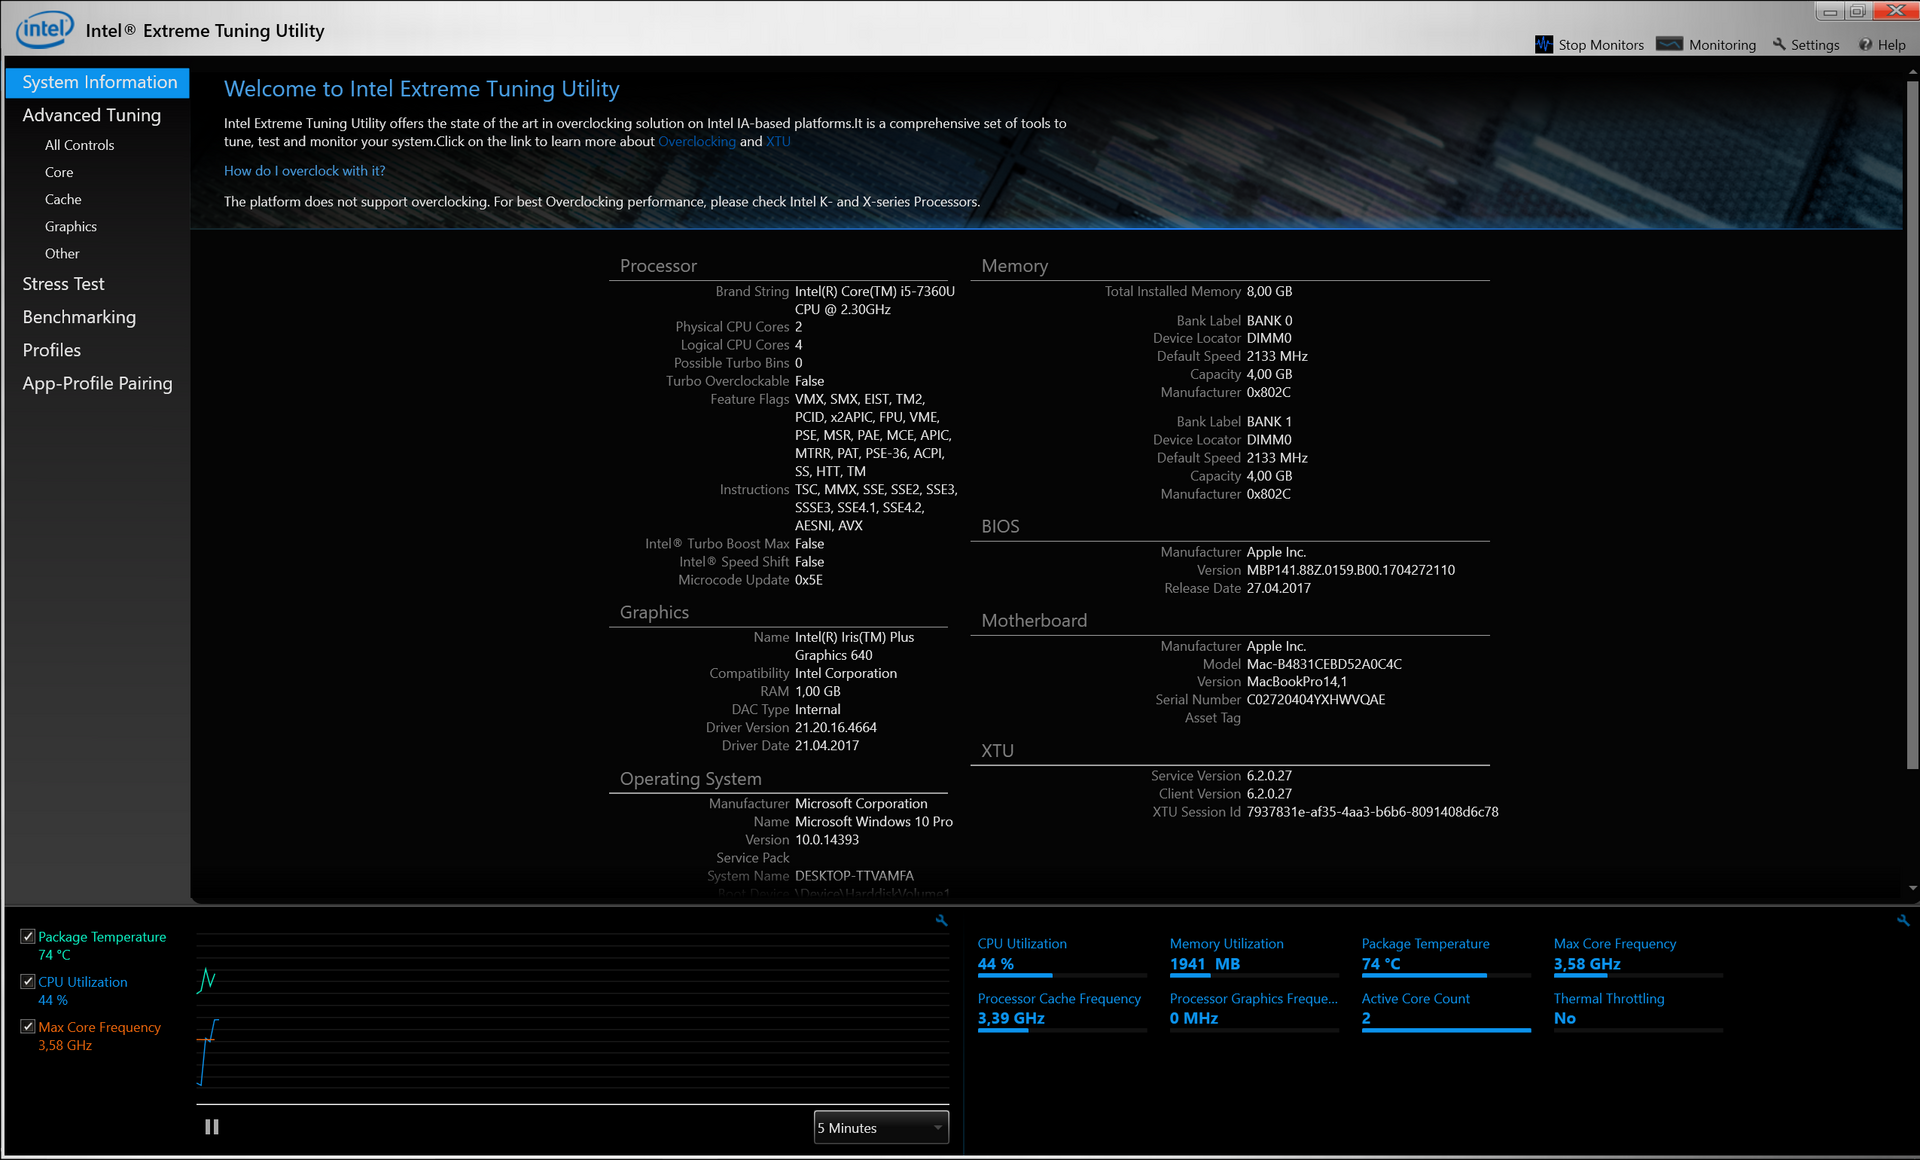
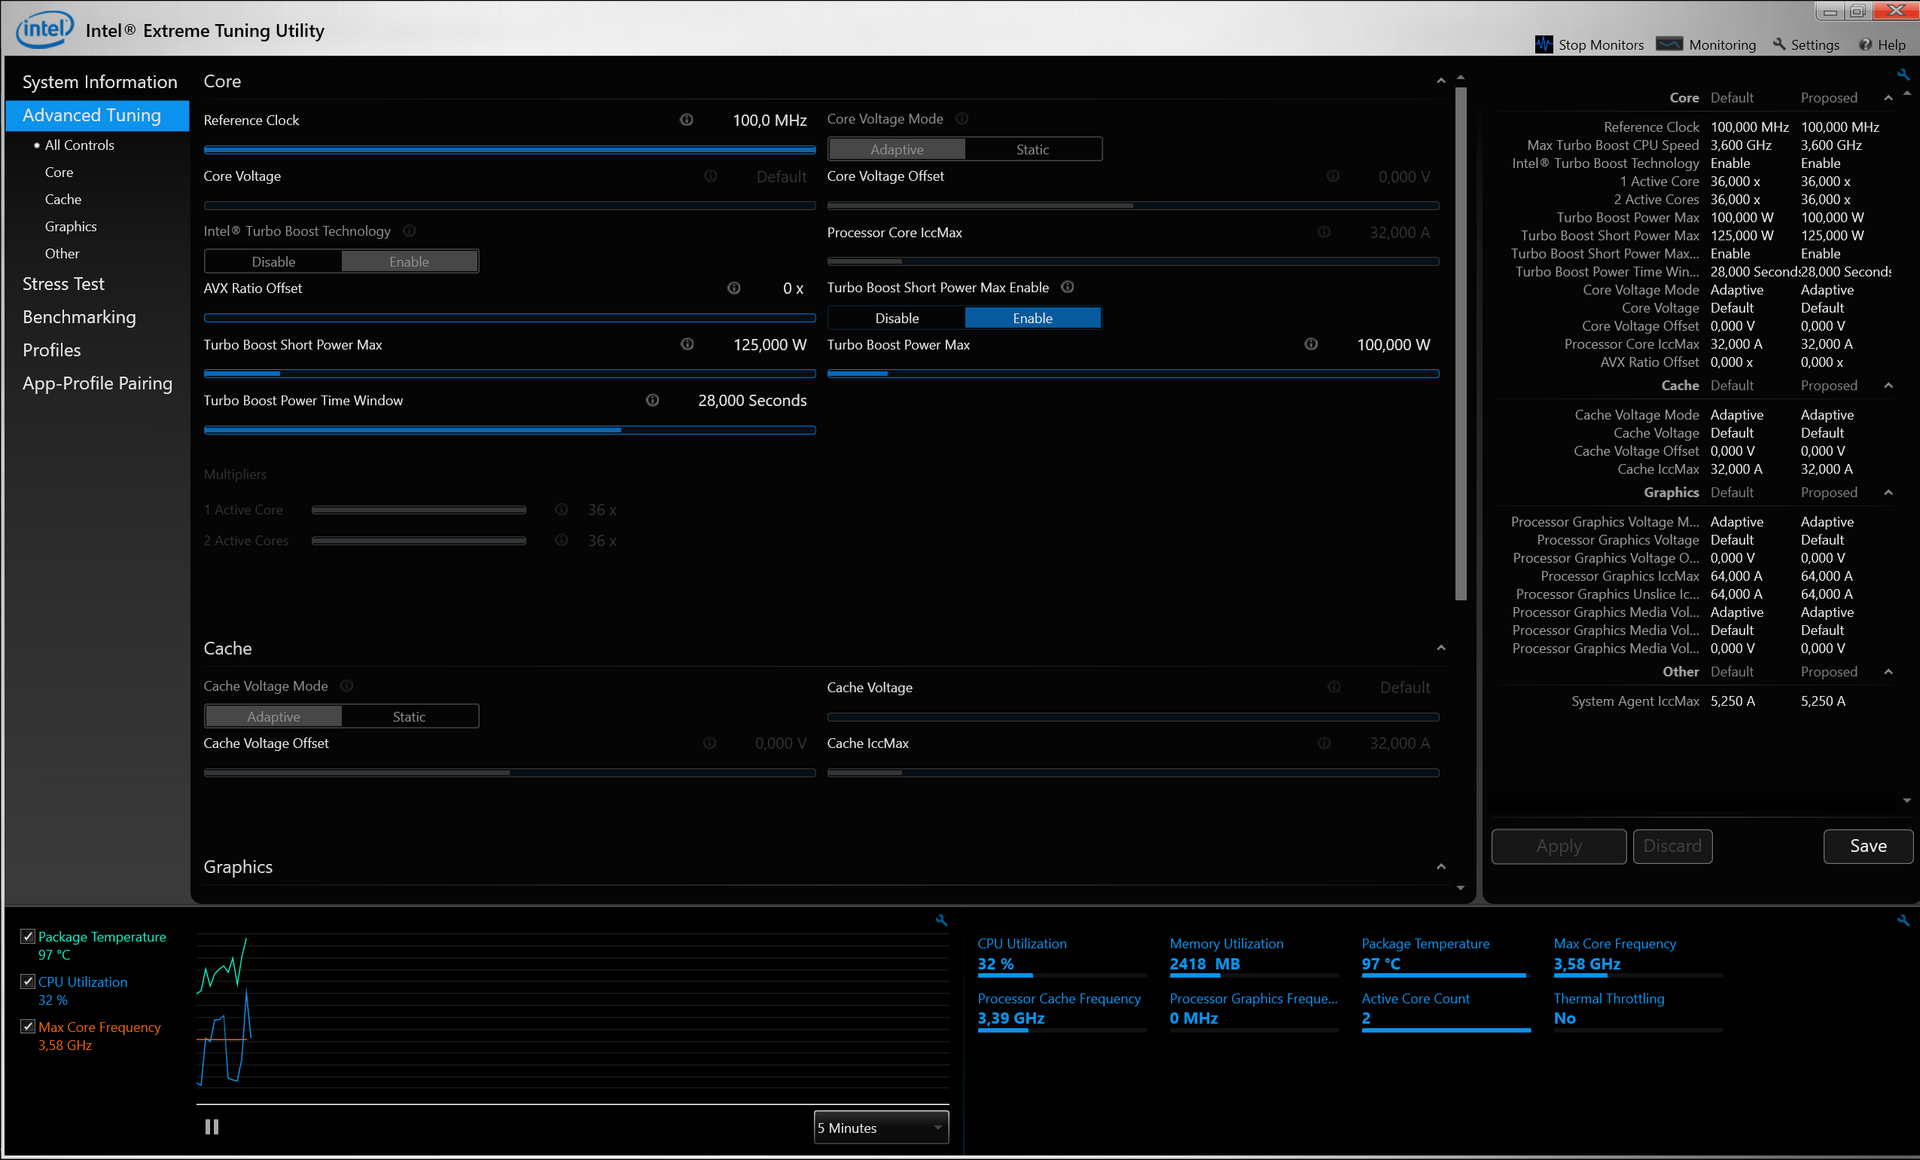
The Kaby Lake processor from the entry-level model has the designation Core i5-7360U and the base frequency for the two cores is 2.3 GHz, but the maximum Turbo Boost is 3.6 GHz for both cores. However, this speed can only be maintained for a couple of seconds. Apple removes the usual TDP limitation at 15 watts, but the two CPU cores quickly reach core temperatures of more than 90 °C, so they have to reduce the clocks.

The CPU performance is a bit better than the regular Core i7-7500U, which can be found in many high-end Ultrabooks. The optional Core i7-7660U we reviewed in the current Microsoft Surface Book, is up to 13% faster in optimal conditions (CB R15 Multi), but the MacBook Pro 13 will probably not be able to maintain this performance for long periods. The difference compared to the more expensive Touch Bar model is very small at just 6%; here we can see the effect of the better cooling performance.
The cooling solution of the MacBook Pro 13 is challenged by the high clocks of the Kaby Lake processor. Sustained workloads simulated by a Cinebench R15 Multi loop results in a performance drop. It is rather small after 2 runs in macOS, but the Windows (Bootcamp) performance drops quicker. The optional Core i7 with a 400 MHz higher Turbo, which creates even more heat, does not make a whole lot of sense here.
The performance is not reduced on battery power. More information about the Core i5-7360U is available in our Tech section.
System Performance
The handling is extremely smooth and responsive, which is not surprising thanks to the fast SSD and the powerful processor. Applications are launched almost instantly, and the situation is also very good when you use Windows via BootCamp. There have been significant improvements in this regard over the last couple of years, and it is no problem to use the MacBook with the operating system from Redmond.
| PCMark 10 - Score | |
| Apple MacBook Pro 15 2017 (2.8 GHz, 555) | |
| Microsoft Surface Pro (2017) i7 | |
| Apple MacBook Pro 13 2017 | |
| Apple MacBook Pro 13 2017 Touchbar i5 | |
| Lenovo ThinkPad X1 Carbon 2017-20HR0021GE | |
| PCMark 8 Home Score Accelerated v2 | 4057 points | |
| PCMark 8 Creative Score Accelerated v2 | 5544 points | |
| PCMark 8 Work Score Accelerated v2 | 4461 points | |
| PCMark 10 Score | 3840 points | |
Help | ||
Storage Devices
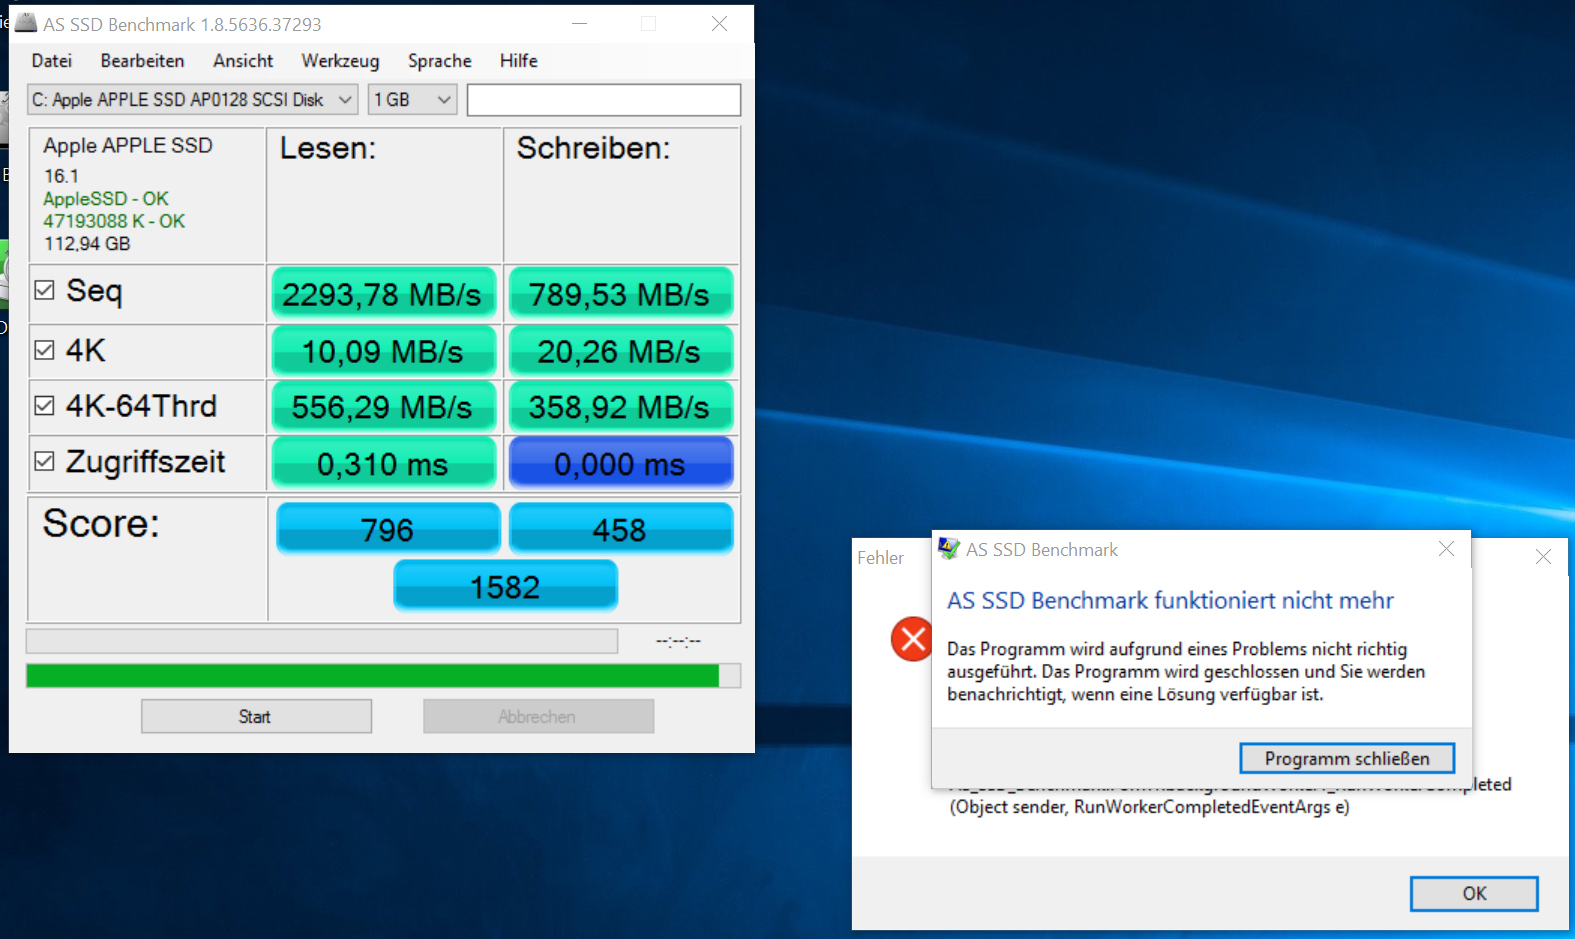
Our test model is equipped with the small 128 GB SSD. It is still attached via PCIe and manages high sequential read results, but it falls behind in terms of write performance. However, this is no problem in practice. The small capacity is probably the biggest issue. 128 GB are not much in times of 4K videos and complex applications, especially if you plan to install Windows via Bootcamp.

GPU Performance
The biggest difference between the processor in the MacBook Pro 13 compared to the standard ULV chips (Dell XPS 13 or ThinkPad X1 Carbon) is the integrated graphics adapter. The Iris Plus Graphics 640 is equipped with 64 MB eDRAM cache and is about 40-50% faster than the "normal" HD Graphics 620 in the synthetic 3DMarks. the Plus Graphics 650 in the more expensive TouchBar-Modell can reach higher clocks and is another 10-15% faster depending on the test. The graphics performance is not reduced on battery power. More technical information about the Iris Plus Graphics 640 is available on our dedicated page.
| 3DMark 11 Performance | 2564 points | |
| 3DMark Cloud Gate Standard Score | 8102 points | |
| 3DMark Fire Strike Score | 1425 points | |
| 3DMark Fire Strike Extreme Score | 634 points | |
| 3DMark Time Spy Score | 543 points | |
Help | ||
Gaming Performance
Gaming is not completely off the table with the Iris Plus Graphics 640, but you should focus on less demanding titles like Overwatch or Rocket League, which will run smoothly at medium settings. This is also the case for older titles like the first Tomb Raider or Bioshock Infinite from 2013. You will eventually have to reduce the settings and resolution to play more challenging titles at more than 30 FPS.
| low | med. | high | ultra | |
|---|---|---|---|---|
| Tomb Raider (2013) | 132.6 | 68.7 | 47.1 | 21.6 |
| BioShock Infinite (2013) | 68.2 | 45.1 | 38.3 | 12.5 |
| Battlefield 4 (2013) | 60.3 | 42 | 30.7 | 9.9 |
| The Witcher 3 (2015) | 21 | 13.4 | 4 | |
| Star Wars Battlefront (2015) | 44.7 | 26.2 | 12.9 | |
| Rainbow Six Siege (2015) | 59.2 | 32.9 | 18.7 | 14.2 |
| Rise of the Tomb Raider (2016) | 25.8 | 19.4 | ||
| Overwatch (2016) | 67.3 | 52.9 | 36.5 | 19.5 |
| Battlefield 1 (2016) | 38.6 | 24.2 | 11.1 | |
| Titanfall 2 (2016) | 42.9 | 31.4 | 22.9 | |
| For Honor (2017) | 30.8 | 11.8 | ||
| Ghost Recon Wildlands (2017) | 16.6 | |||
| Prey (2017) | 39.9 | 17.9 | 14.8 | |
| Rocket League (2017) | 101 | 48.2 | 33.6 |
Emissions
System Noise
One big problem of our previous test model was the rattling fan, but our current model does not have any problems so far. However, the high-pitched sound characteristic stays, which is why the fan is not very pleasant under load.
The good news is that the fan is not audible under light workloads or short peak load (up to ~30 seconds), respectively. The fan is even completely deactivated in macOS, while it is always spinning with at least 1200 rpm on Windows (Bootcamp) – independent of the power profile. However, the fan is only audible at ~2300 rpm in very quiet environments. We will have a look at some scenarios below and start with macOS. You can see that the fan quickly reaches its maximum speed of 7200 rpm when you stress the CPU in particular. The fan control is seamless, so the results are average values.
We use the Cinebench R15 Multi test running on macOS. You cannot hear the fan for the first ~30 seconds, but the speed will increase to around 6000 rpm and 35 dB(A) until the end of the run. The second run results in the maximum fan speed of 7200 rpm at 39.3 dB(A).
More GPU demanding applications like Unigine Valley take more time to activate the fan. It is basically not audible at ~30.6 dB(A) (3400-4600 rpm) in the first 5 minutes. This is followed by jumps to ~4100 rpm, ~4900 rpm, and ~5800 rpm before we reach the full 7200 rpm after a total of 16 minutes.
3DMark 06 on Windows results in 32.9 dB(A) and 5200 rpm on average. The fastest method to reach the maximum fan speed is Prime95. The situation in our stress test with the tools Prime95 and FurMark is similar to Unigine Valley. Thanks to the reduced processor clock, the temperature situation is more relaxed and we can only measure 31.5 dB(A) at first. It once again takes about ~15 minutes before the fan reaches 7200 rpm.
We cannot hear any other unpleasant noises.
Noise level
| Idle |
| 30.2 / 30.2 / 30.2 dB(A) |
| Load |
| 32.9 / 39.3 dB(A) |
 | ||
30 dB silent 40 dB(A) audible 50 dB(A) loud |
||
min: | ||
Temperature
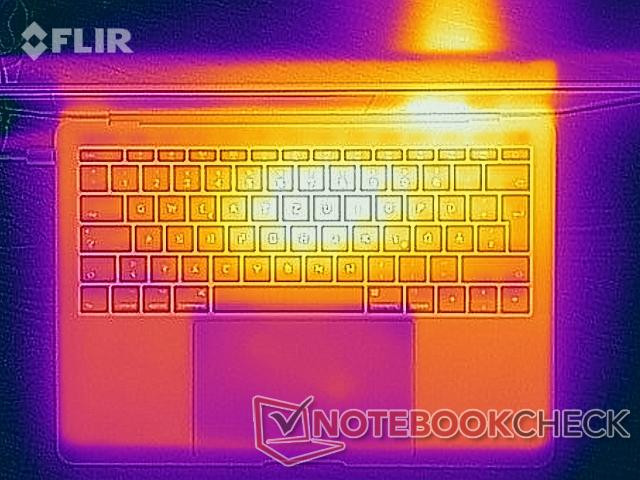
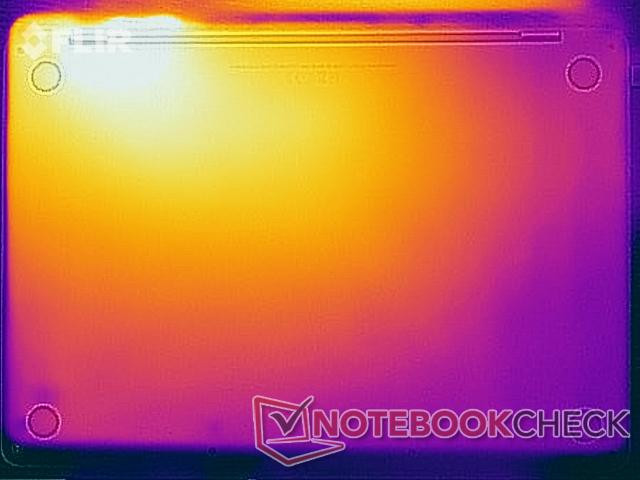
The two infrared pictures of the MacBook Pro 13 illustrate the difference compared to the more expensive Touch Bar model since there is only one fan dissipating the heat from the chassis. This is noticeable under load when you use the MacBook on your lap. The aluminum chassis dissipates the heat very well, but the right side is warmer at up to 43 °C. However, there are no limitations with less demanding workloads and the case basically does not warm up at all.
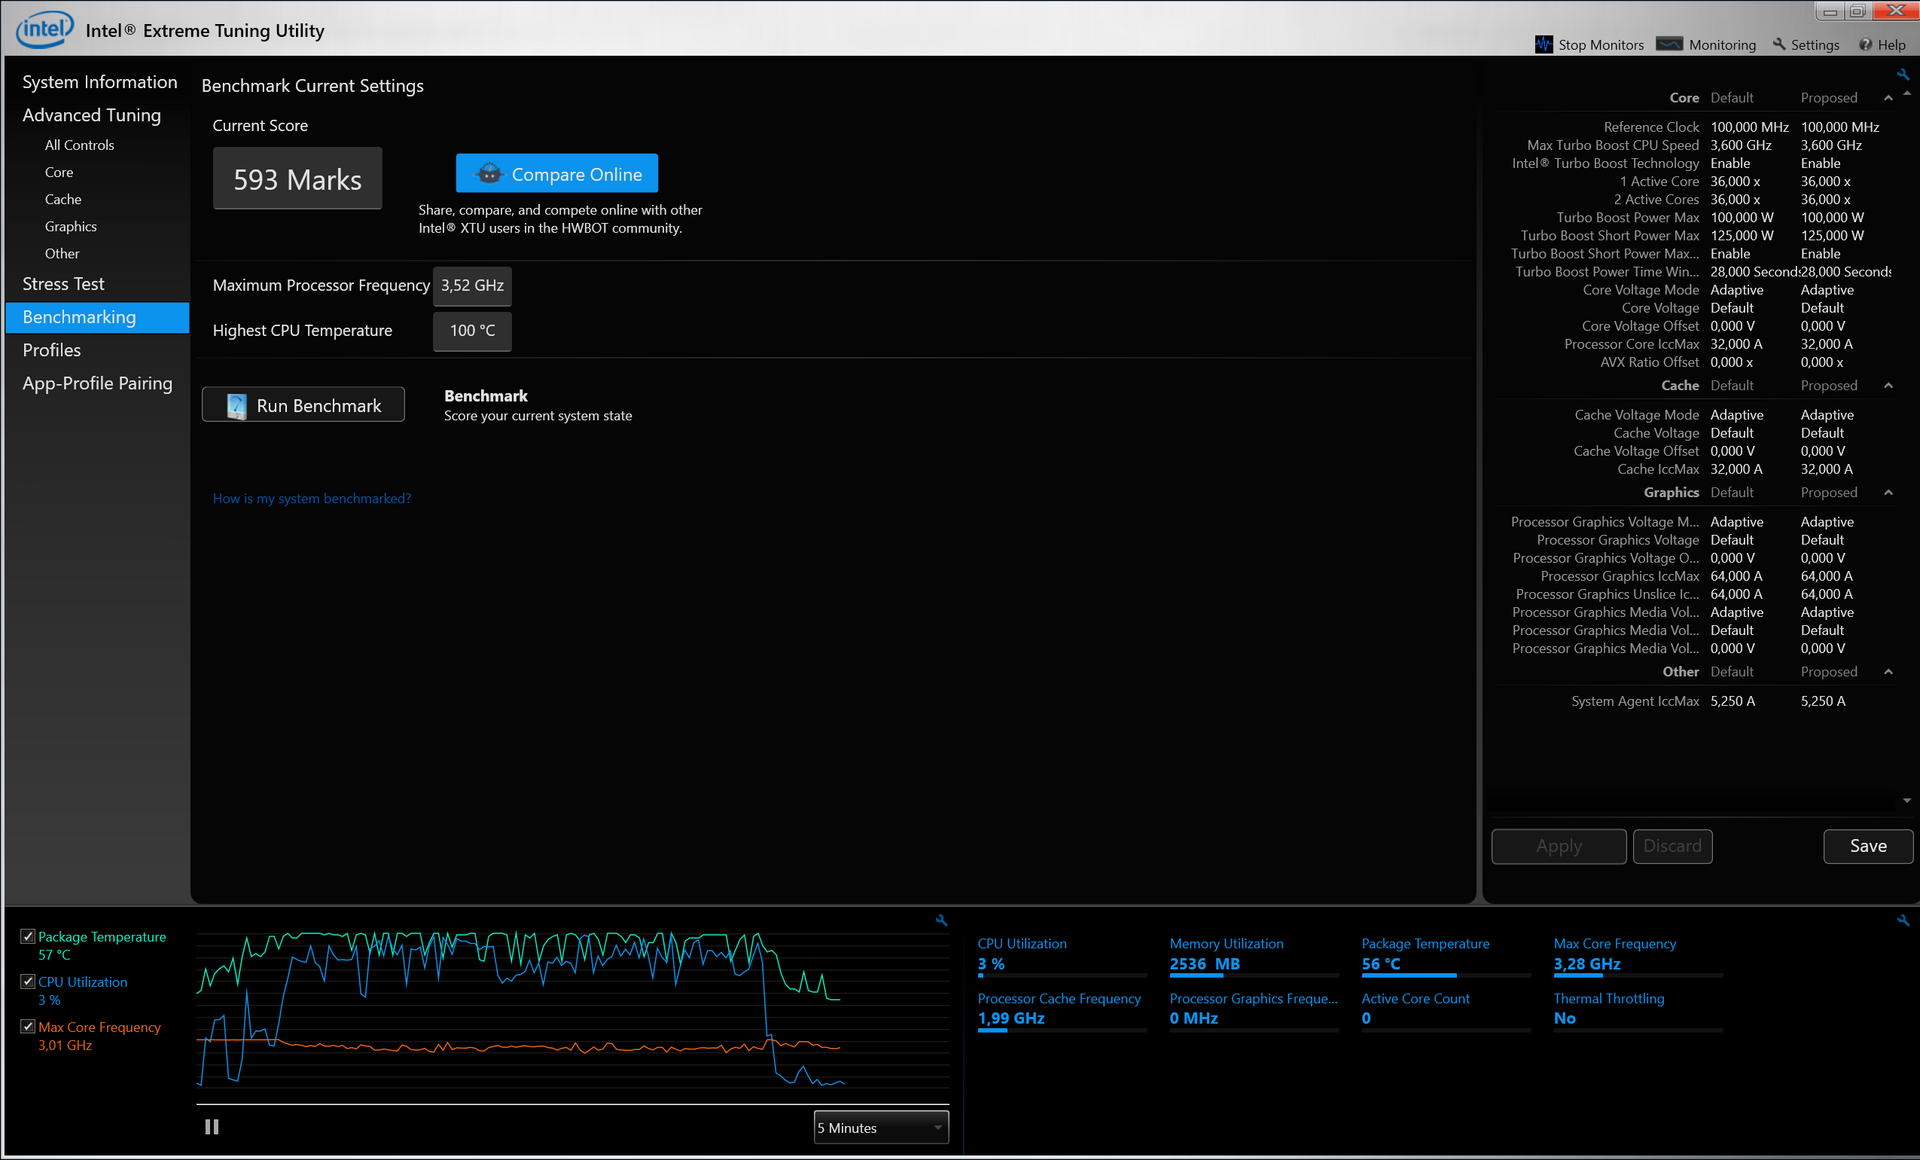
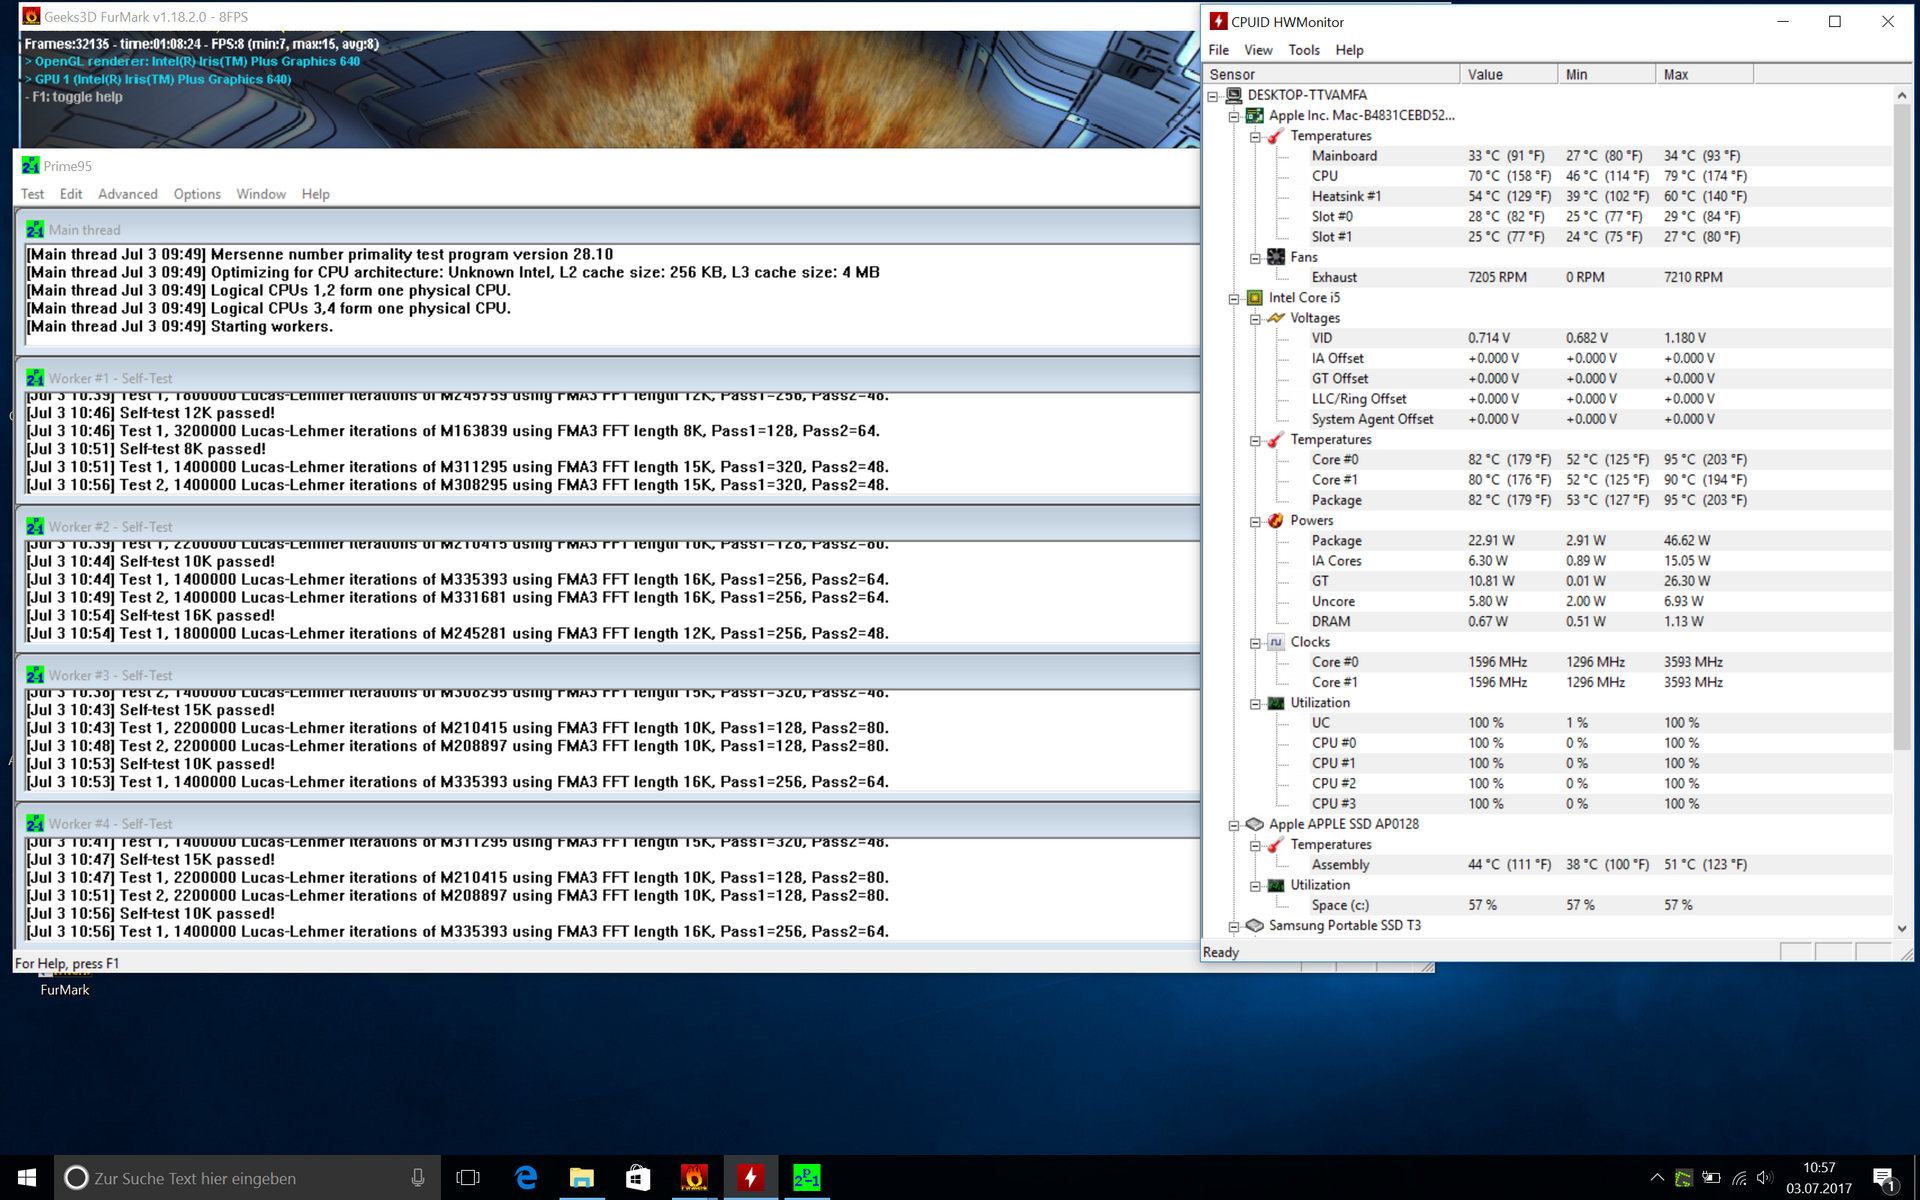
The processor performance in particular is significantly reduced during our stress test with the two Windows tools Prime95 and FurMark. The consumption of the Intel Core i5-7360U is steady at 23-24 watts, but the clocks change over the course of the test. The CPU starts at 1.3-1.5 GHz, but then levels off at 1.6-1.7 GHz after some time. We were not able to determine the GPU clock running on Windows.
A 3DMark 11 test immediately after the stress test did not result in a lower score, so there should not be any limitations in practice, even running on Windows.
(±) The maximum temperature on the upper side is 43.5 °C / 110 F, compared to the average of 35.9 °C / 97 F, ranging from 21.4 to 59 °C for the class Subnotebook.
(±) The bottom heats up to a maximum of 40.6 °C / 105 F, compared to the average of 39.2 °C / 103 F
(+) In idle usage, the average temperature for the upper side is 26.1 °C / 79 F, compared to the device average of 30.8 °C / 87 F.
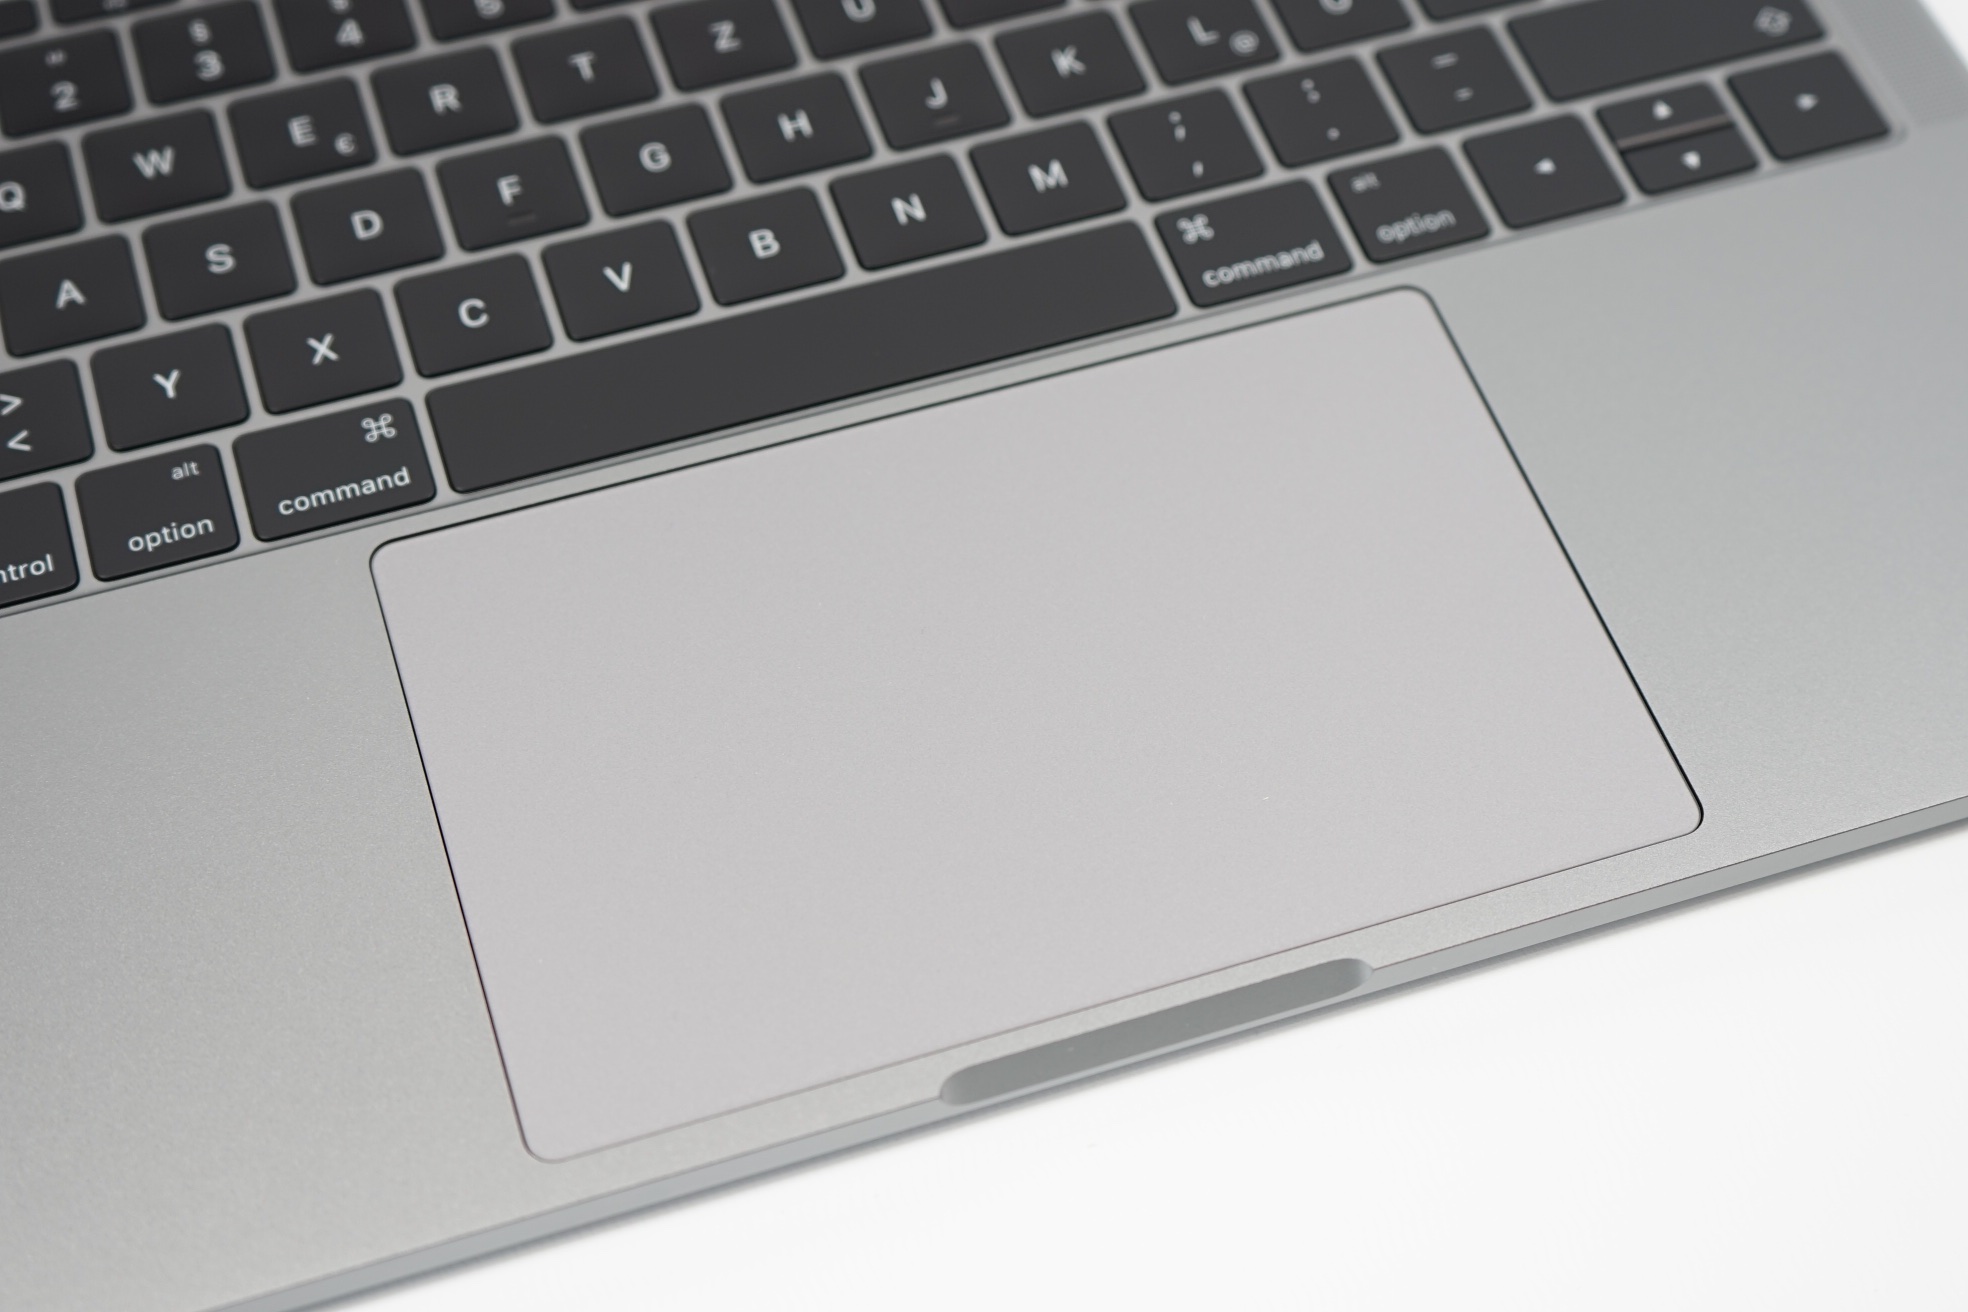
(+) The palmrests and touchpad are reaching skin temperature as a maximum (32.7 °C / 90.9 F) and are therefore not hot.
(-) The average temperature of the palmrest area of similar devices was 28.2 °C / 82.8 F (-4.5 °C / -8.1 F).
Energy Management
Power Consumption
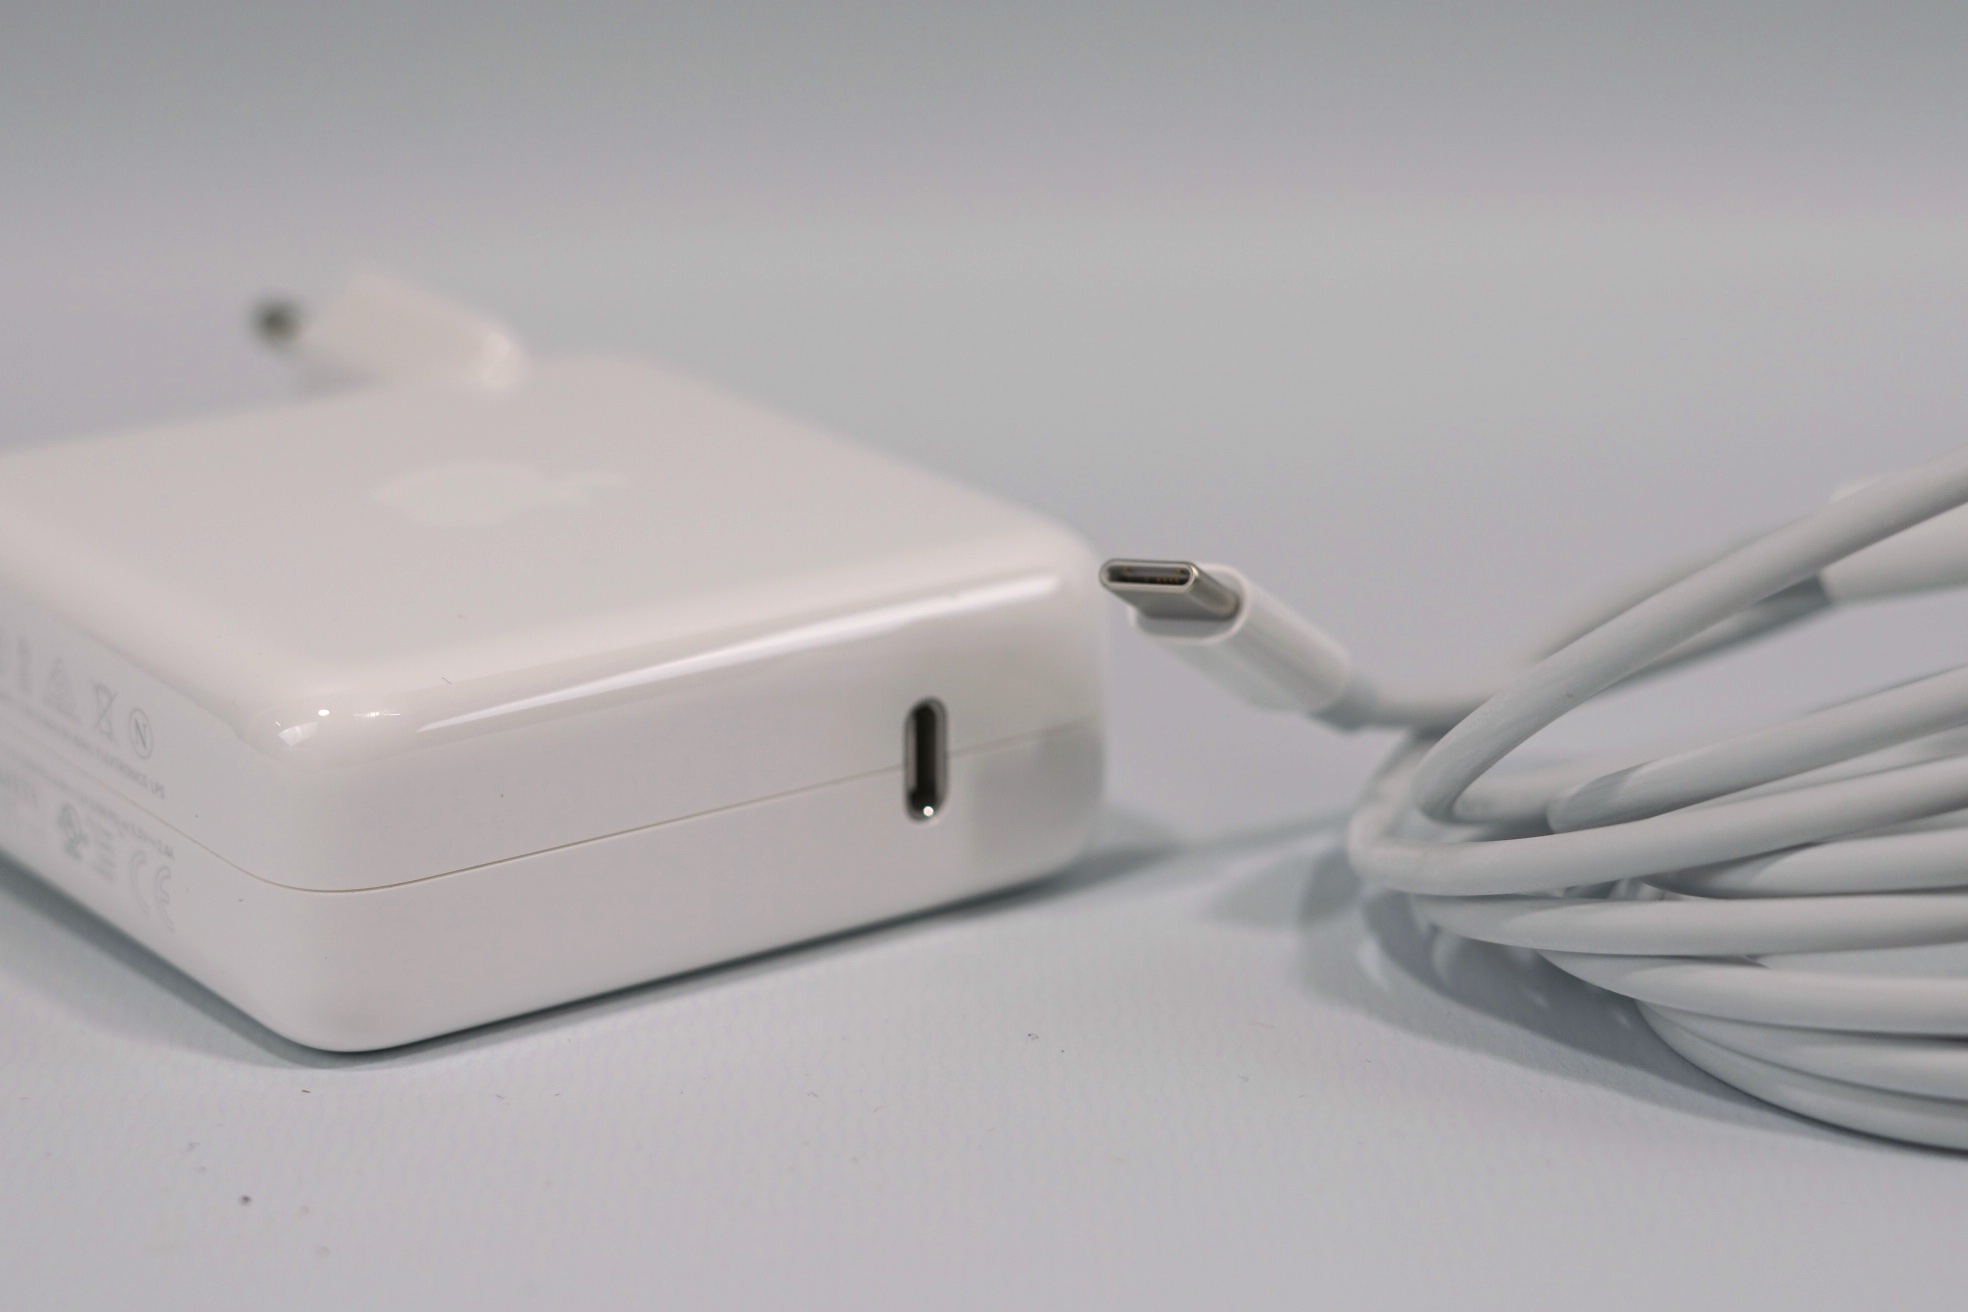
The MacBook Pro 13 is a very efficient device while idling and with light workloads. The results are even reduced compared to the predecessor. You can clearly see that Apple removed the TDP limitation under load (which is particularly important when you stress the Iris GPU). 41.6 W in 3DMark 06 are much higher compared to regular ULV notebooks like the Dell XPS 13. The stress test even requires more than 50 W, but the provided 61 W power adapter is sufficient.
| Off / Standby | |
| Idle | |
| Load |
|
Key:
min: | |
| Apple MacBook Pro 13 2017 i5-7360U, Iris Plus Graphics 640, IPS, 2560x1600, 13.3" | Apple MacBook Pro 13 2016 6360U, Iris Graphics 540, , 2560x1600, 13.3" | Dell XPS 13 9360 QHD+ i7 i7-7500U, HD Graphics 620, IPS, 3200x1800, 13.3" | Apple MacBook Pro 13 2017 Touchbar i5 i5-7267U, Iris Plus Graphics 650, IPS, 2560x1600, 13.3" | Apple MacBook Pro 15 2017 (2.8 GHz, 555) i7-7700HQ, Radeon Pro 555, IPS, 2880x1800, 15.4" | Lenovo ThinkPad X1 Carbon 2017-20HR0021GE i5-7200U, HD Graphics 620, IPS, 1920x1080, 14" | |
|---|---|---|---|---|---|---|
| Power Consumption | -11% | -4% | -37% | -87% | -3% | |
| Idle Minimum * (Watt) | 3.7 | 3 19% | 6.4 -73% | 2.8 24% | 3.4 8% | 3.8 -3% |
| Idle Average * (Watt) | 5.2 | 8.9 -71% | 6.6 -27% | 10.9 -110% | 13.9 -167% | 7.1 -37% |
| Idle Maximum * (Watt) | 7.6 | 8.9 -17% | 6.8 11% | 11.4 -50% | 17.6 -132% | 8.3 -9% |
| Load Average * (Watt) | 41.6 | 43.4 -4% | 27.5 34% | 55.4 -33% | 71.1 -71% | 34.2 18% |
| Load Maximum * (Watt) | 50.5 | 42.1 17% | 32.4 36% | 57.5 -14% | 88.5 -75% | 43.3 14% |
| Witcher 3 ultra * (Watt) | 57.9 |
* ... smaller is better
Battery Runtime
The 54.5 Wh lithium-polymer battery of the Apple MacBook Pro 13 is a bit bigger compared to the more expensive Touch Bar model. The battery runtime in the Wi-Fi test at an adjusted luminance of 150 nits is around 11.5 hours, which is basically identical to the previous Skylake model. This is longer than both the XPS 12 as well as the X1 Carbon. The video runtime is also at around 11.5 hours and beats the previous model, which is probably a result of optimizations.
We already saw the higher load consumption of the new Kaby Lake model compared to the Skylake MacBook. This affects the minimum runtime as well, which is just 78 minutes.
You have to expect shorter battery runtimes using Windows, where the WiFi test only runs for 7.5 hours (-4.5 hours vs. macOS). However, this is not only caused by Windows, but also missing optimization of Bootcamp drivers.
| Apple MacBook Pro 13 2017 i5-7360U, Iris Plus Graphics 640, 54.5 Wh | Apple MacBook Pro 13 2016 6360U, Iris Graphics 540, 54 Wh | Dell XPS 13 9360 QHD+ i7 i7-7500U, HD Graphics 620, 60 Wh | Apple MacBook Pro 13 2017 Touchbar i5 i5-7267U, Iris Plus Graphics 650, 49.2 Wh | Apple MacBook Pro 15 2017 (2.8 GHz, 555) i7-7700HQ, Radeon Pro 555, 76 Wh | Lenovo ThinkPad X1 Carbon 2017-20HR0021GE i5-7200U, HD Graphics 620, 57 Wh | |
|---|---|---|---|---|---|---|
| Battery runtime | 7% | 22% | -24% | -18% | 6% | |
| H.264 (h) | 11.4 | 10.3 -10% | 6.9 -39% | 8.5 -25% | 9.6 -16% | |
| WiFi v1.3 (h) | 11.4 | 11.4 0% | 8.6 -25% | 8.7 -24% | 10.7 -6% | 9.1 -20% |
| Load (h) | 1.3 | 1.7 31% | 2.2 69% | 1.2 -8% | 1 -23% | 2 54% |
| Witcher 3 ultra (h) | 1.5 |
Verdict
Pros
Cons
The biggest difference between the two available 13-inch MacBook Pro models from Apple is not only the Touch Bar above the keyboard, but also the cooling. The more expensive model gets a superior solution with two fans, while the cheaper test model only gets one. This is usually no problem in practice, where the fan is often deactivated anyway, but you can hear the small fan as soon as you start to stress the device. We do not like the high-pitched sound, which makes the noise more unpleasant than the numbers would suggest.
We can see a big advantage in the practical Wi-Fi as well as video test. It will easily last a full day or cover a long trip at more than 11 hours. The performance of the test model does not have to hide behind the more expensive model. If you are not looking for the latest bit of performance – although this type of notebook will probably be the wrong choice anyway – you can easily get the less expensive model without Touch Bar.
Thanks to much longer battery runtimes, the MacBook Pro 13 without Touch bar is often the better choice in practice. The only issue is the high-pitched fan noise under load. The more expensive Touch Bar model is superior in this respect.
Otherwise, not a lot has changed, but this is not a bad thing. You still get one of the best cases, which can also be said about the luminance and quality of the display (in a 16:10 aspect ratio). There is also still the issue with the limited port selection, so you will probably need adapters. The less expensive model is the better choice if you only plan on using the MacBook for daily stuff like writing mails, video streaming, web browsing, or even some light picture editing. We would only recommend an SKU with a bigger SSD.
Apple MacBook Pro 13 2017
- 09/26/2017 v6 (old)
Andreas Osthoff
Price comparison
