Apple MacBook 12 (2017) Laptop Review
")
For the original German review, see here.
You might hardly believe it, but the MacBook 12 is already three years old. It still uses the same base unit as the first model, which was introduced in March 2015. Since that time, there have been only minor upgrades to the CPU, GPU, RAM, and Bluetooth, while the case and the display have remained unchanged. Hence, we will skip the case and display sections in this review and only provide new measurement results where either measurement procedure or measurement instruments have changed in the meanwhile. Please refer to our reviews from 2016 and 2015 for further information on the MacBook 12.
Connectivity
Communication
Since we have adjusted our Wi-Fi test since the review of the MacBook 12 from 2016, we have repeated the test in order to get comparable data. We measured very good values of 660 MB/s (receive) and 689 MB/s (send). The MacBook 12 from 2017 is just about on par with the MacBook Air from 2017 here, while Apple's MacBook Pro 13 still performs better. The MacBook 12 falls slightly behind the new Air, the MBP 13 and the MBP 15 (2017 models) under harder conditions (several walls between the router and the test device). This is also true in comparison with the actually cheaper Air 13.
Input Devices
Keyboard
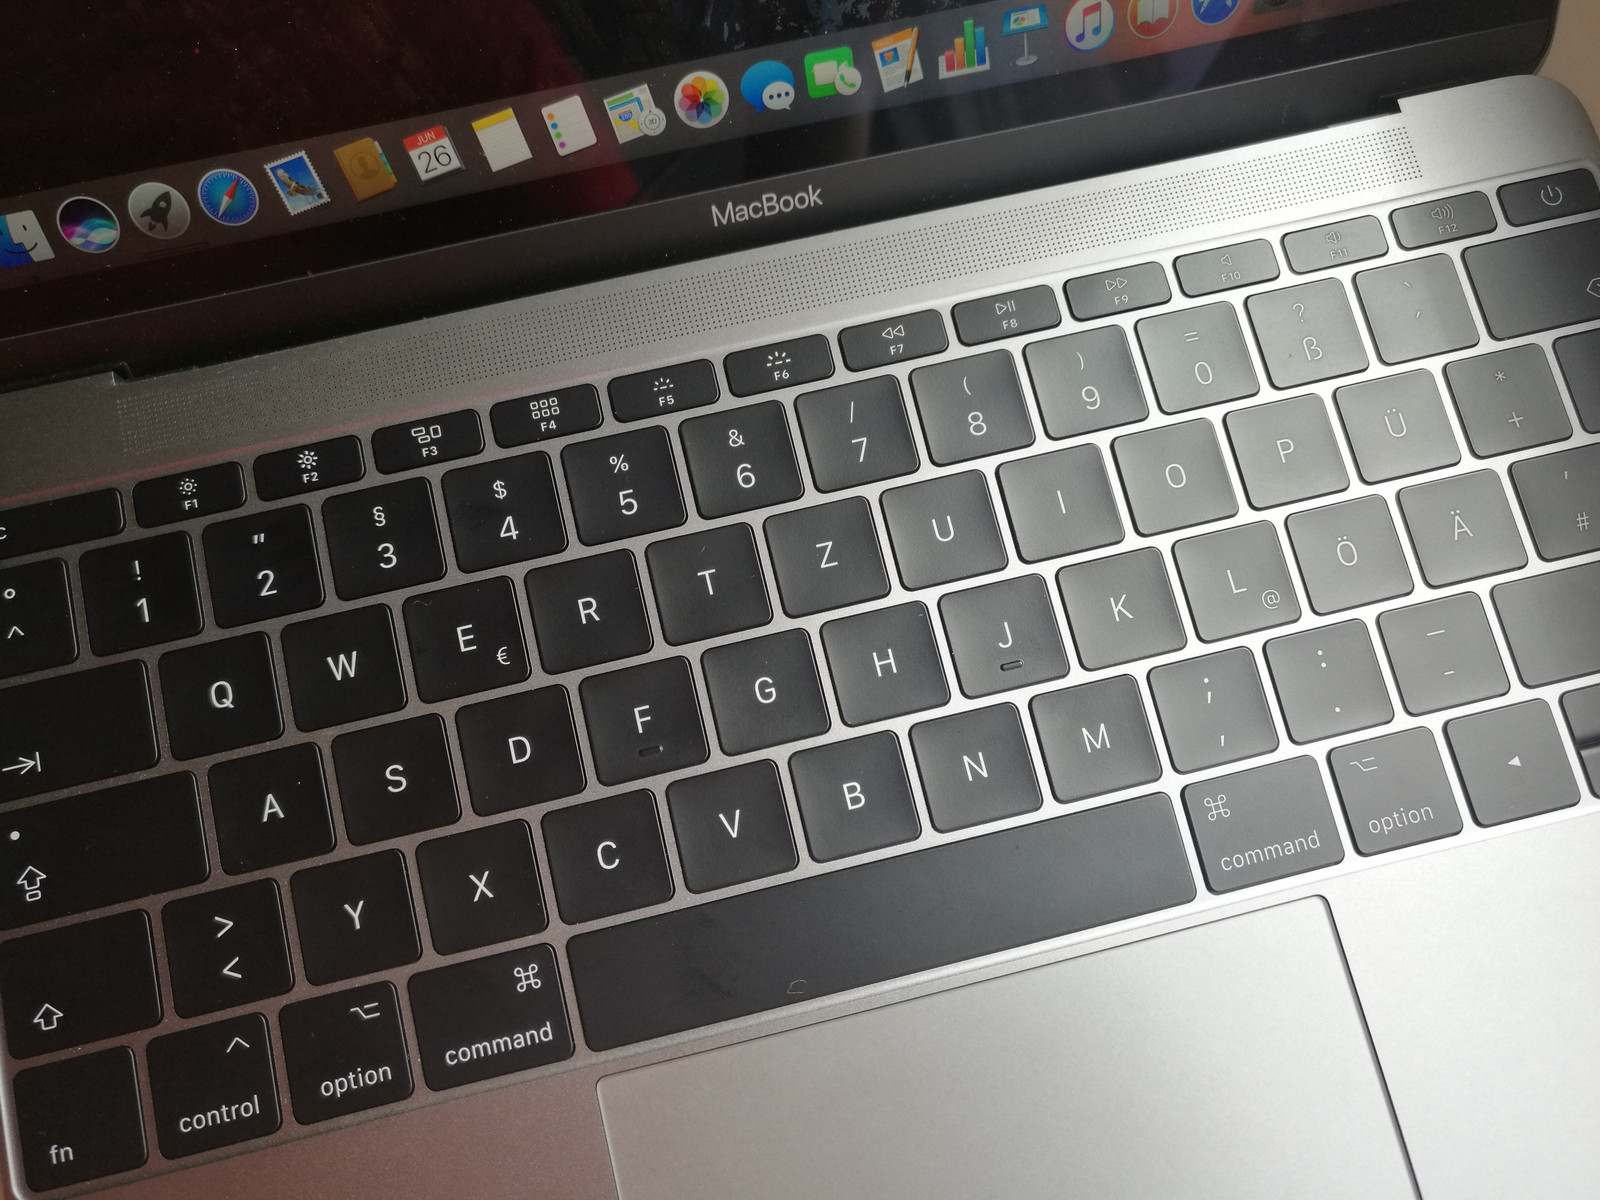
Apple states that the MacBook 12 now features a revised keyboard with the Butterfly mechanism of the 2nd generation. Apple users will actually notice an improved stroke in comparison to the predecessor. However, to newcomers, the key travel will still appear short and the pressure point crisp. Since the typing experience differs significantly from all other notebook keyboards on the market, we recommend trying it in a demo model before purchase.
Display
The display of the MacBook 12 has also remained the same in 2017. The laptop still uses a 12-inch IPS panel with a resolution of 2304x1440 pixels. Resolution and display diagonal ensure a very sharp image. Texts in particular appear very sharp. In direct comparison with the recently renewed MacBook Air, the Air shows noticeable weaknesses in terms of display sharpness. The other measured values of the predecessor's display also do not show noticeable weaknesses. As so often, the glossy surface is controversial.
We have re-checked the display brightness with our test model from 2017 and observed that it is slightly less bright than the predecessor from 2016. However, this might be due to production tolerances. In the following, you will find the measurement results of the identical predecessor from 2016. Because of new measurement instruments, we have also re-measured of the response times and repeated the PWM check.
| |||||||||||||||||||||||||
Brightness Distribution: 88 %
Center on Battery: 387 cd/m²
Contrast: 823:1 (Black: 0.47 cd/m²)
ΔE ColorChecker Calman: 1.6 | ∀{0.5-29.43 Ø4.71}
ΔE Greyscale Calman: 1 | ∀{0.09-98 Ø4.96}
97.8% sRGB (Calman 2D)
82.2% sRGB (Argyll 1.6.3 3D)
61.6% AdobeRGB 1998 (Argyll 1.6.3 3D)
68% AdobeRGB 1998 (Argyll 3D)
95.4% sRGB (Argyll 3D)
66.8% Display P3 (Argyll 3D)
Gamma: 2.26
CCT: 6680 K
| Apple MacBook 12 2017 APPA027, , 2304x1440, 12" | Apple MacBook 12 (Early 2016) 1.1 GHz APPA027, , 2304x1440, 12" | Apple MacBook Air 13.3" 1.8 GHz (2017) 1440x900, 13.3" | Apple MacBook Pro 13 2017 Touchbar i5 APPA034, , 2560x1600, 13.3" | Apple MacBook Pro 15 2017 (2.8 GHz, 555) APPA031, , 2880x1800, 15.4" | Apple iPad Pro 12.9 2017 2732x2048, 12.9" | Apple iPad Pro 10.5 2017 2224x1668, 10.5" | |
|---|---|---|---|---|---|---|---|
| Display | |||||||
| Display P3 Coverage (%) | 66.8 | 98.6 | 97.9 | ||||
| sRGB Coverage (%) | 95.4 | 100 | 99.9 | ||||
| AdobeRGB 1998 Coverage (%) | 68 | 86.5 | 85.9 | ||||
| Response Times | -3% | -13% | -17% | -17% | 18% | 22% | |
| Response Time Grey 50% / Grey 80% * (ms) | 40.8 ? | 41.2 ? -1% | 52.4 ? -28% | 48 ? -18% | 48 ? -18% | 41.6 ? -2% | 39.6 ? 3% |
| Response Time Black / White * (ms) | 29.2 ? | 30.4 ? -4% | 28.4 ? 3% | 33.6 ? -15% | 33.8 ? -16% | 18.4 ? 37% | 17.6 ? 40% |
| PWM Frequency (Hz) | 116000 | 58000 | 119000 ? | 119000 ? | |||
| Screen | |||||||
| Brightness middle (cd/m²) | 387 | 551 | 545 | 650 | 634 | ||
| Black Level * (cd/m²) | 0.47 | 0.48 | 0.44 | 0.42 | 0.39 | ||
| Brightness (cd/m²) | 358 | 514 | 523 | 614 | 625 | ||
| Brightness Distribution (%) | 88 | 88 | 86 | 90 | 87 | ||
| Contrast (:1) | 823 | 1148 | 1239 | 1548 | 1626 | ||
| Colorchecker dE 2000 * | 1.6 | 0.8 | 1.6 | 1 | 1.9 | ||
| Colorchecker dE 2000 max. * | 4 | 1.4 | 3.8 | 1.9 | 3.9 | ||
| Greyscale dE 2000 * | 1 | 1 | 1.9 | 1.5 | 2.8 | ||
| Gamma | 2.26 97% | 2.16 102% | 2.26 97% | 2.25 98% | 2.26 97% | ||
| CCT | 6680 97% | 6672 97% | 6834 95% | 6734 97% | 7027 93% | ||
| Color Space (Percent of AdobeRGB 1998) (%) | 61.6 | ||||||
| Color Space (Percent of sRGB) (%) | 82.2 | ||||||
| Total Average (Program / Settings) | -3% /
-3% | -13% /
-13% | -17% /
-17% | -17% /
-17% | 18% /
18% | 22% /
22% |
* ... smaller is better
While the response times have not changed noticeably in comparison to the predecessor, we discovered something new in terms of PWM: Our new, more sensitive instrument reveals that the MacBook 12 also uses PWM for brightness control at brightness level 30% and lower. The reason why PWM has remained hidden so far is the extremely high frequency: 116 KHz or 116000 Hertz. If this can even mislead expensive measurement instruments, impacts on users appear to be more than unlikely.
Display Response Times
| ↔ Response Time Black to White | ||
|---|---|---|
| 29.2 ms ... rise ↗ and fall ↘ combined | ↗ 15.8 ms rise | 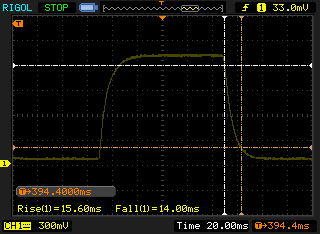 |
| ↘ 13.4 ms fall | ||
| The screen shows relatively slow response rates in our tests and may be too slow for gamers. In comparison, all tested devices range from 0.1 (minimum) to 240 (maximum) ms. » 78 % of all devices are better. This means that the measured response time is worse than the average of all tested devices (19.8 ms). | ||
| ↔ Response Time 50% Grey to 80% Grey | ||
| 40.8 ms ... rise ↗ and fall ↘ combined | ↗ 19.6 ms rise | 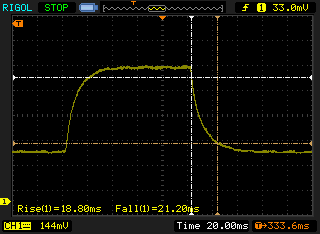 |
| ↘ 21.2 ms fall | ||
| The screen shows slow response rates in our tests and will be unsatisfactory for gamers. In comparison, all tested devices range from 0.165 (minimum) to 636 (maximum) ms. » 64 % of all devices are better. This means that the measured response time is worse than the average of all tested devices (31 ms). | ||
Screen Flickering / PWM (Pulse-Width Modulation)
| Screen flickering / PWM detected | 116000 Hz | 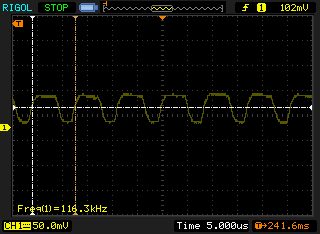 | |
The display backlight flickers at 116000 Hz (worst case, e.g., utilizing PWM) . The frequency of 116000 Hz is quite high, so most users sensitive to PWM should not notice any flickering. In comparison: 52 % of all tested devices do not use PWM to dim the display. If PWM was detected, an average of 7747 (minimum: 5 - maximum: 343500) Hz was measured. | |||
Performance
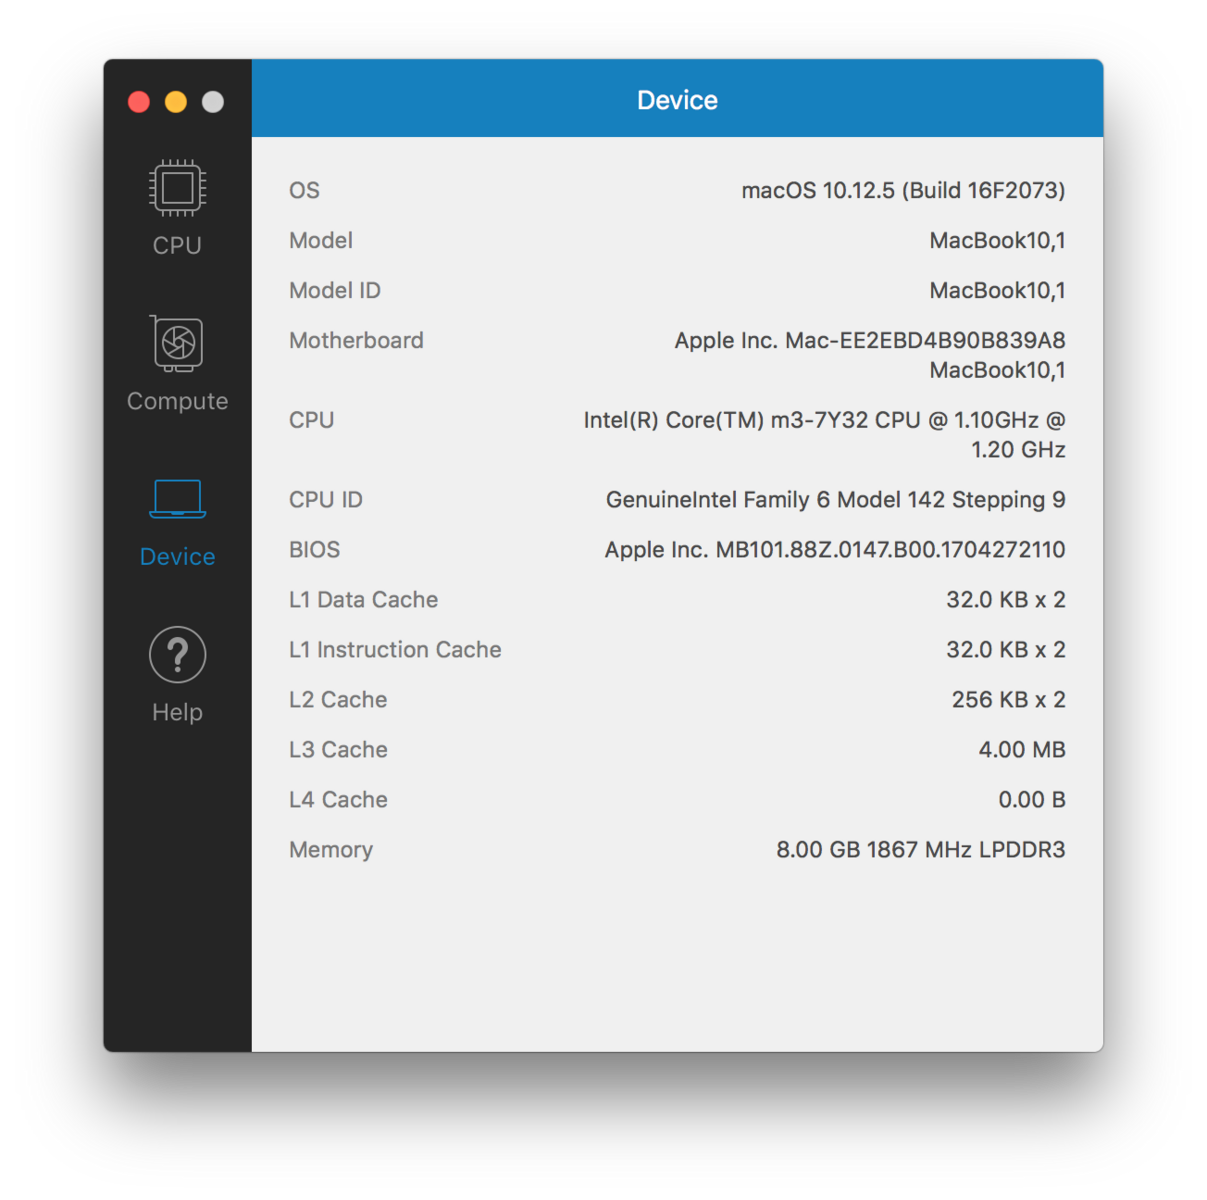
Even the entry-level model features a Core m3-7Y32 with a base clock of 1.2 GHz instead of a Core m CPU 1.1 GHz now. Intel has specified a base clock of 1.1 GHz for this chip. This means that Apple drives it with a higher clock rate. The chip has a configurable TDP and Intel has designed it for a clock rate range between 600 MHz and 1.6 GHz (3.75 to 7 watts TDP). Regardless of the low clock frequency, the processor can temporarily increase its clock rate to up to 3 GHz.
Our Cinebench 15 results show a performance gain of up to 20 to 30% when compared to the predecessor with a 1.1 GHz CPU. This is significantly higher than expected, since the CPU was only updated from Skylake to the current Kaby Lake architecture and the base clock was only increased by 100 MHz. Note: This is only representative for short performance peaks. The refreshed Apple MacBook 12 behaves oddly under prolonged load, since it is passively cooled.
| Cinebench R15 | |
| CPU Single 64Bit | |
| Apple MacBook Pro 13 2017 Touchbar i5 | |
| Apple MacBook 12 2017 | |
| Apple MacBook Air 13.3" 1.8 GHz (2017) | |
| Apple MacBook 12 (Early 2015) 1.1 GHz | |
| Apple MacBook 12 (Early 2015) 1.1 GHz | |
| Apple MacBook 12 (Early 2015) 1.1 GHz | |
| Apple MacBook 12 (Early 2016) 1.1 GHz | |
| Apple MacBook 12 (Early 2016) 1.1 GHz | |
| CPU Multi 64Bit | |
| Apple MacBook Pro 13 2017 Touchbar i5 | |
| Apple MacBook Air 13.3" 1.8 GHz (2017) | |
| Apple MacBook 12 2017 | |
| Apple MacBook 12 (Early 2016) 1.1 GHz | |
| Apple MacBook 12 (Early 2015) 1.1 GHz | |
| Apple MacBook 12 (Early 2015) 1.1 GHz | |
| Apple MacBook 12 (Early 2015) 1.1 GHz | |
As usual, we also let the current MacBook 12 run Cinebench in a loop in order to analyze the long-term behavior of the notebook. The first quick glance at the diagram reveals that the MacBook 12 behaves oddly. The notebook starts at a good level. Then the performance falls slowly by about -10% before it collapses for the first time. Apparently the threshold of the passively cooling system is exceeded at that point and the CPU throttles significantly. It takes about 15 minutes before this occurs, whereas the processor can rest for a few seconds after each run due to the design of the test.
After the CPU has throttled for a while, it increases its speed again, but remains 15 to 20% below the initial results. After another six runs, the clock rate collapses again, this time even more noticeably than the first time. In the following, the score almost reaches its initial value, but it falls notably faster during the following runs.
The behavior can be easily explained with the passive cooling solution of the MB 12, which reaches its limits under prolonged load. As a result, the CPU has to throttle. The longer this takes place, the more "reserves" are available for the next try. The time it takes until the first collapse (15 minutes) should be long enough for most demanding office tasks. Thus, a noticeable performance loss is not to be expected here.
System Performance
In order to run the PCMark 8 benchmark, we have once again, installed Windows via Bootcamp on the Apple computer. Depending on the score, PCMark rates the new entry level configuration about 10 to 17% better than the predecessor. Despite being cheaper, the Air 13 performs better in both tests. However, it features an older, yet actively cooled CPU with higher performance reserves.
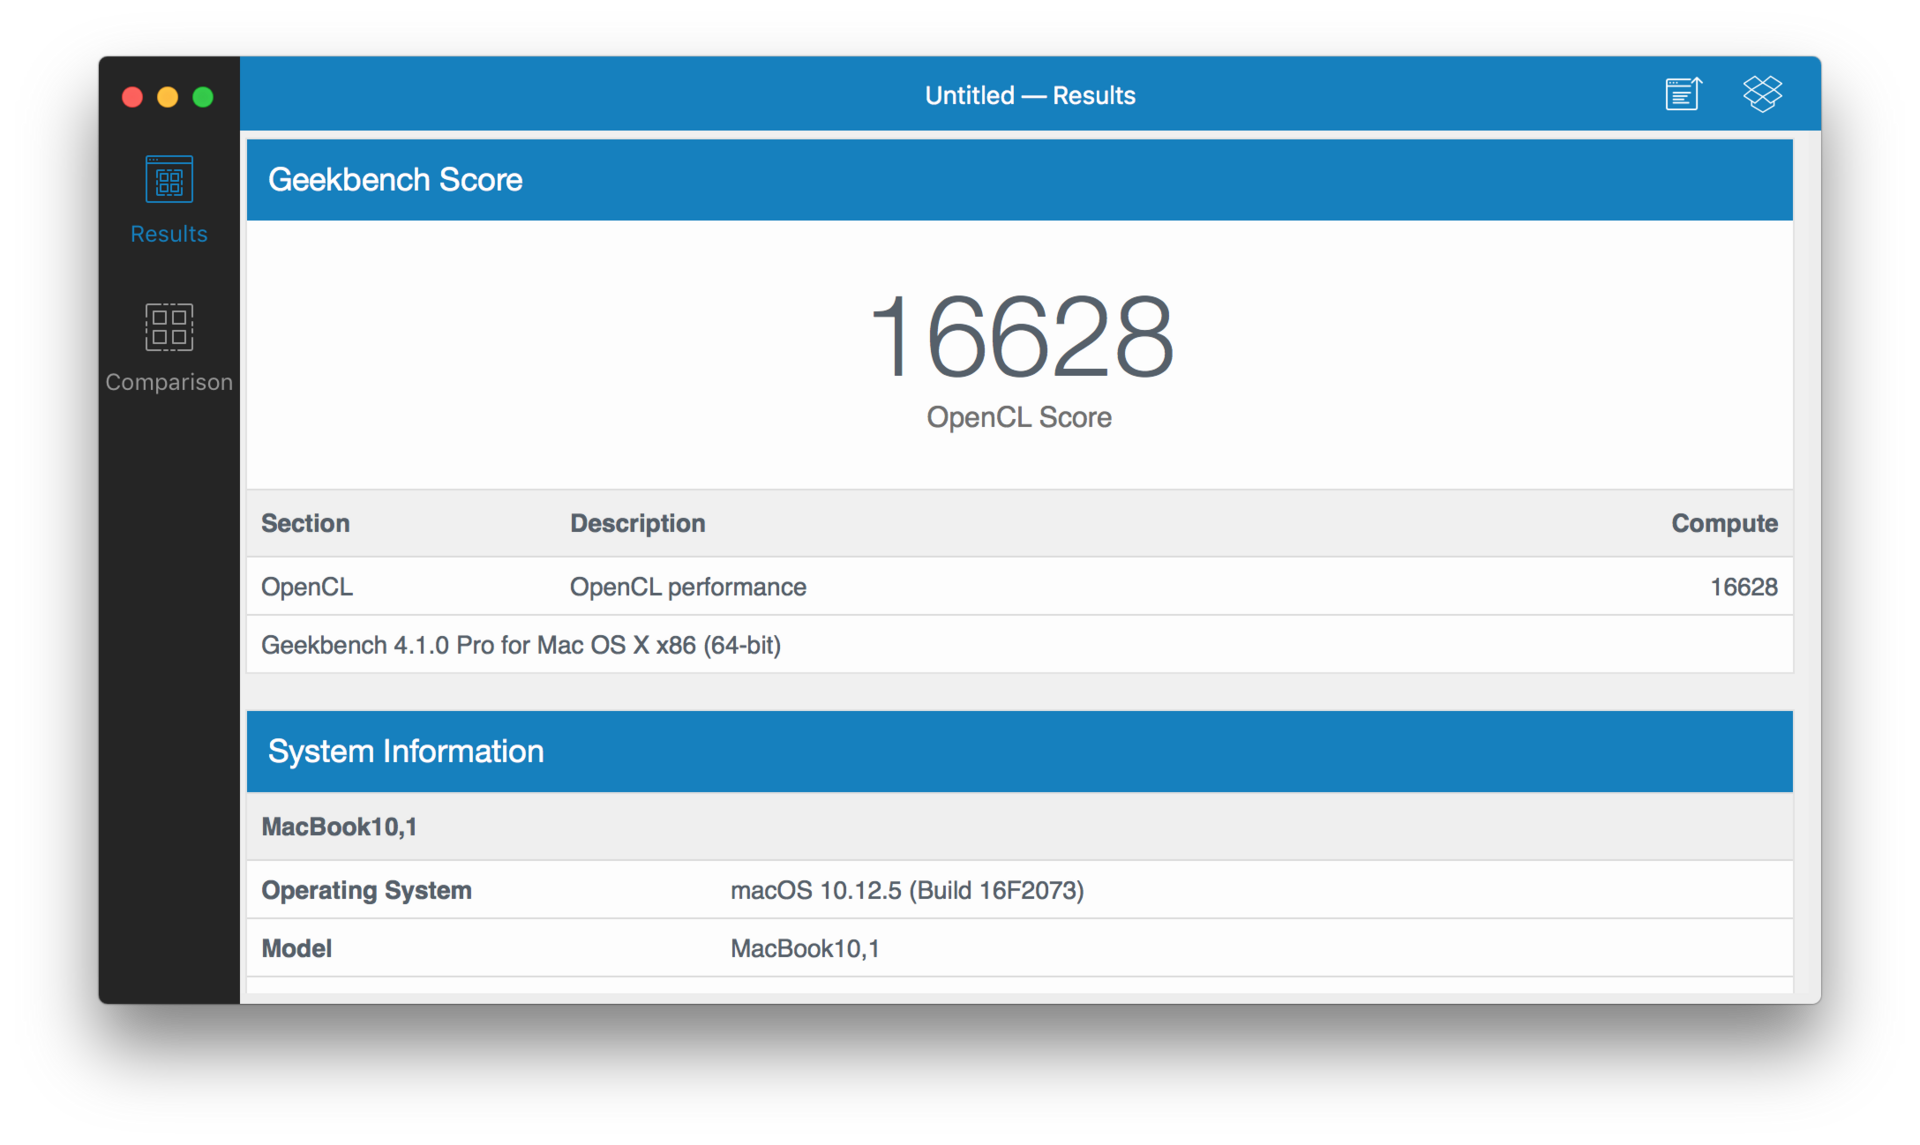
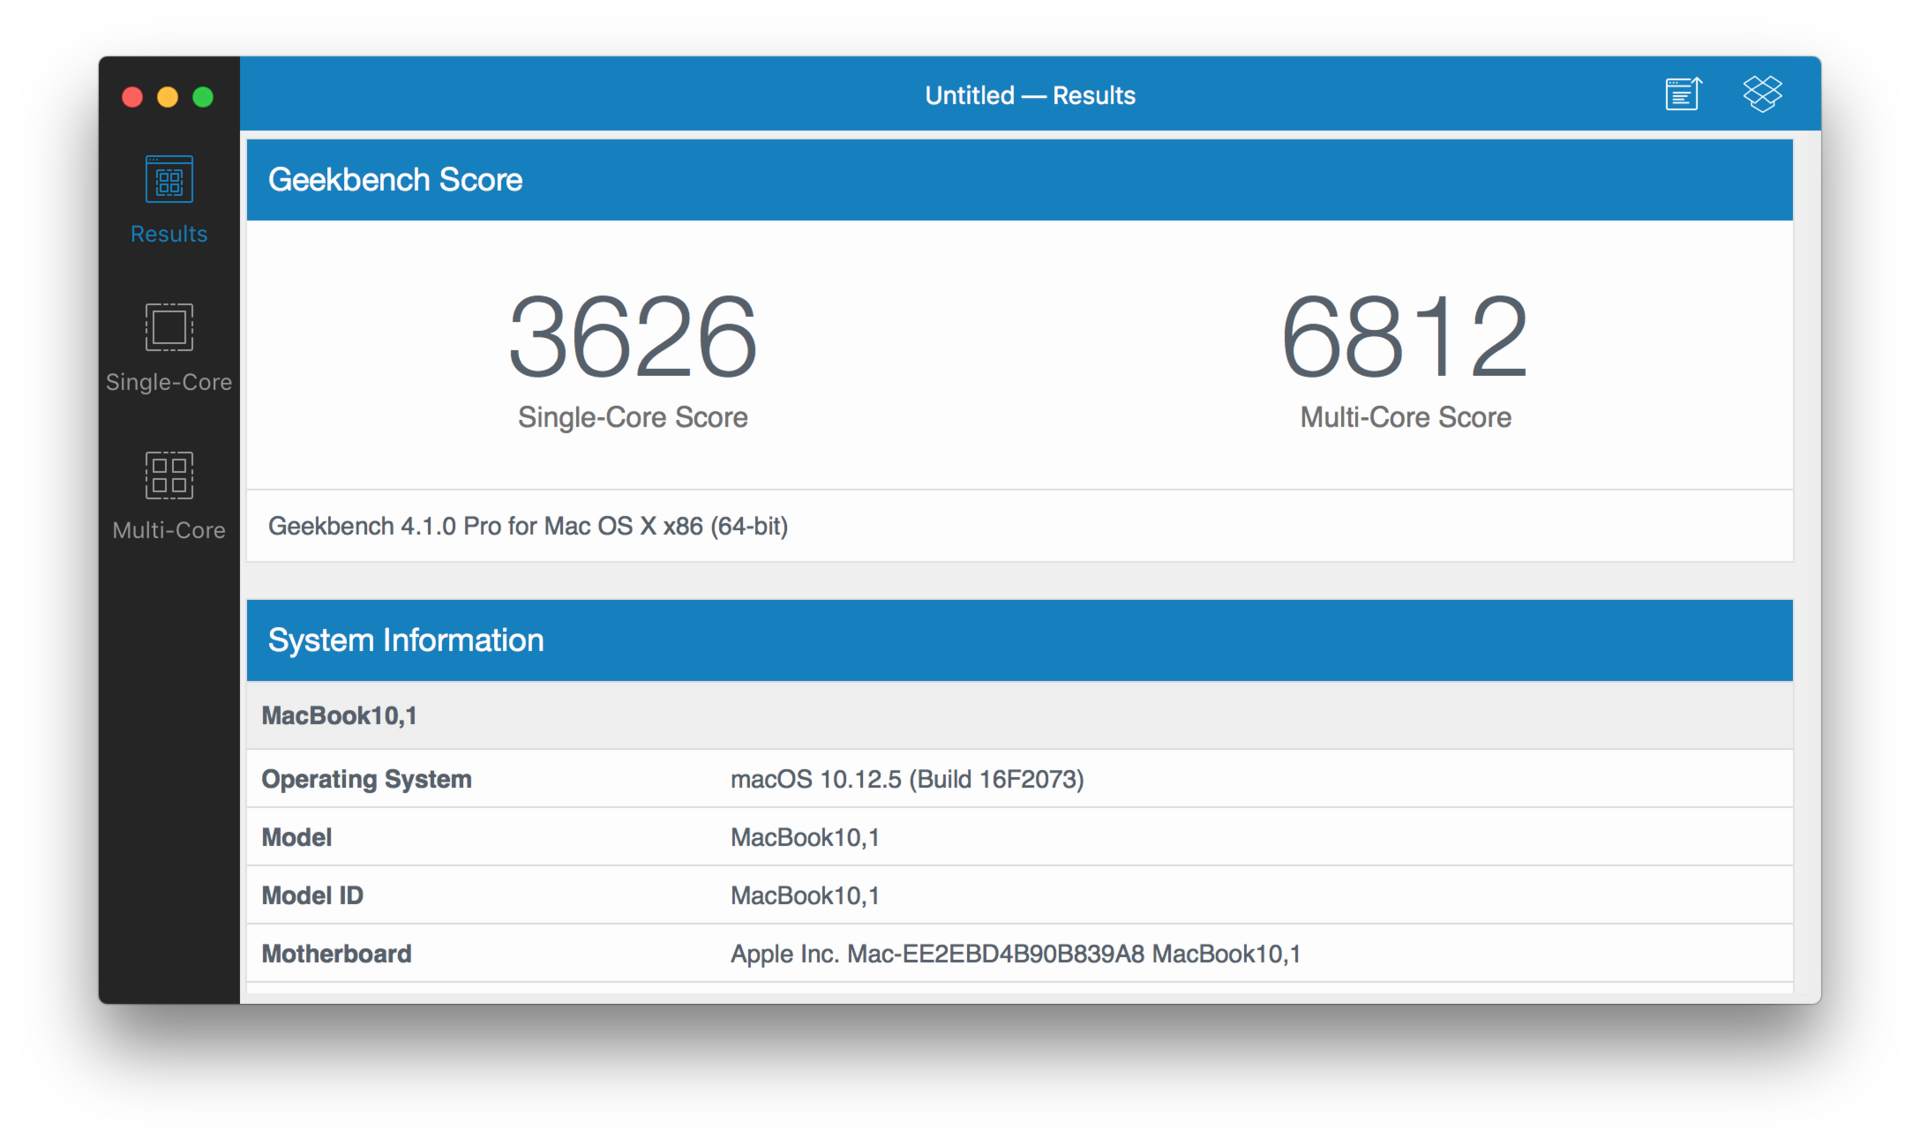
Meanwhile, the MacBook 12 is marginally better in the Geekbench 4 benchmark (single-core and multi-core), while it remains behind the new Air 13 in the OpenCL test (GPU).
| PCMark 8 Home Score Accelerated v2 | 3078 points | |
| PCMark 8 Creative Score Accelerated v2 | 3904 points | |
| PCMark 8 Work Score Accelerated v2 | 3946 points | |
| PCMark 10 Score | 2568 points | |
Help | ||
Storage Device
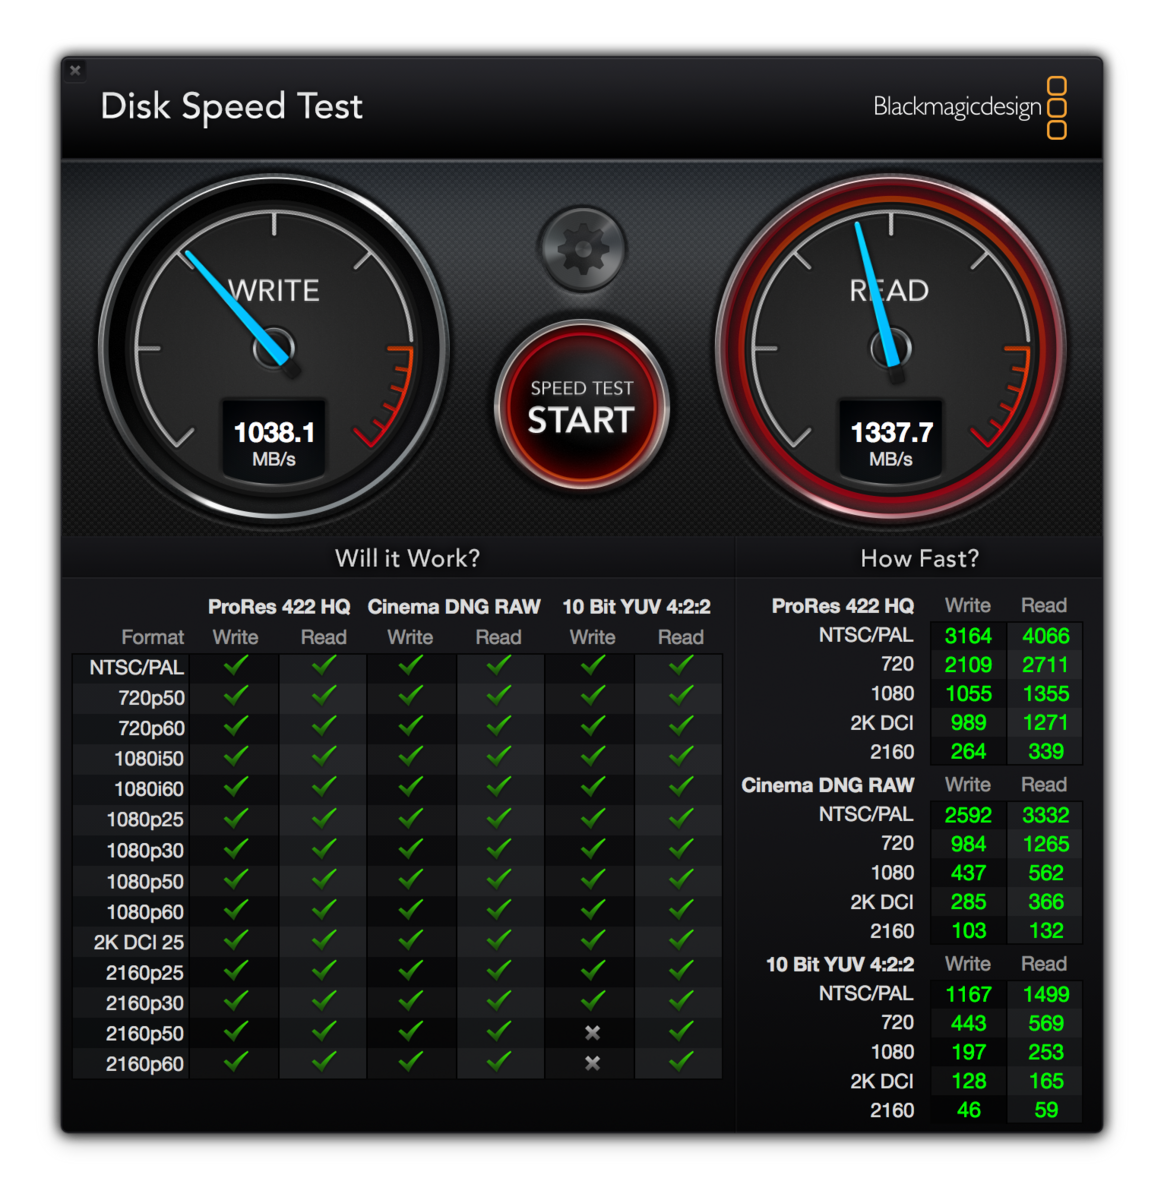
According to CrystalDiskMark 3.0, the sequential read and write rates are marginally higher than the predecessor's. When comparing the results of the newer CrystalDiskMark 5.2, which is more suitable for testing PCIe-based storage devices, the drive performs worse, especially in sequential reading than the equally large storage device in the MacBook Air 13. Without exception, the storage solution in the current MacBook Pro notebooks are faster.
You have to buy the variant with 1.3 GHz processor for more storage space, which costs 1799 Euros (~$2051), i.e., 300 Euros (~$342) more than the entry level variant at hand.
| Apple MacBook 12 2017 Apple SSD AP0256 | Apple MacBook 12 (Early 2016) 1.1 GHz Apple SSD AP0256 | Apple MacBook Pro 13 2017 Touchbar i5 Apple SSD AP0256 | Apple MacBook Pro 15 2017 (2.8 GHz, 555) Apple SSD SM0256L | Apple MacBook Air 13.3" 1.8 GHz (2017) Apple SSD SM0128G | Asus Zenbook UX310UA-FC347T iGP Micron SSD 1100 (MTFDDAV256TBN) | Dell XPS 13 9360 FHD i5 Toshiba NVMe THNSN5256GPUK | |
|---|---|---|---|---|---|---|---|
| CrystalDiskMark 3.0 | 15% | 25% | 36% | 52% | 167% | 257% | |
| Read Seq (MB/s) | 955 | 754 -21% | 1540 61% | 1557 63% | 1390 46% | 489.4 -49% | 1233 29% |
| Write Seq (MB/s) | 899 | 638 -29% | 1353 51% | 1505 67% | 731 -19% | 431.6 -52% | 733 -18% |
| Read 4k (MB/s) | 9.721 | 14.6 50% | 9.92 2% | 10.76 11% | 16.29 68% | 26.68 174% | 29.31 202% |
| Write 4k (MB/s) | 12.78 | 20.5 60% | 10.74 -16% | 12.87 1% | 27.17 113% | 88.7 594% | 116.9 815% |
| CrystalDiskMark 5.2 / 6 | 14% | 33% | 12% | ||||
| Read Seq (MB/s) | 940 | 1509 61% | 1572 67% | 1491 59% | |||
| Write Seq (MB/s) | 867 | 1345 55% | 1473 70% | 741 -15% | |||
| Read 4K (MB/s) | 22.8 | 23.77 4% | 23.33 2% | 21.26 -7% | |||
| Write 4K (MB/s) | 95.7 | 32.94 -66% | 86.7 -9% | 105.9 11% | |||
| Total Average (Program / Settings) | 15% /
15% | 20% /
19% | 35% /
34% | 32% /
32% | 167% /
167% | 257% /
257% |

Graphics Card
The migration from Skylake to Kaby Lake has also upgraded the graphics unit: The Intel HD Graphics 515 is replaced by the HD Graphics 615. However, big performance gains are not to be expected. In the 3DMark benchmark test (Bootcamp Windows), the new configuration performs just 3 to 13% better. The Apple MacBook 12 is definitely not designed for complex 3D tasks, such as running modern computer games.
| 3DMark 11 Performance | 1324 points | |
| 3DMark Cloud Gate Standard Score | 5035 points | |
Help | ||
Emissions
System Noise
The Apple MacBook 12 is and remains silent. There are no moving parts in the notebook, neither on part of the cooling system nor in the storage device. Electronic noises were also not noticeable in our test.
Temperature
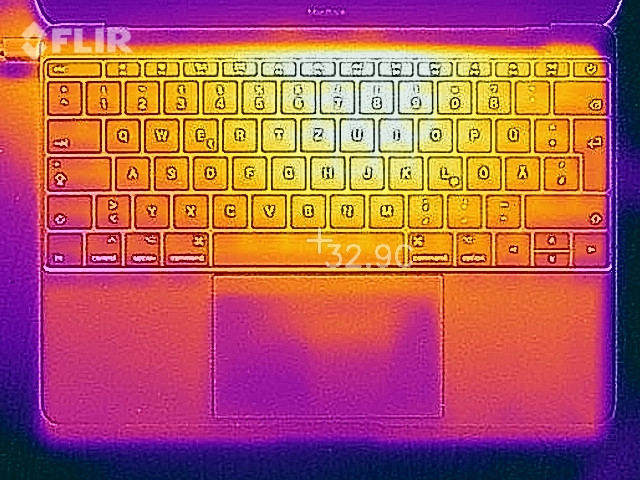
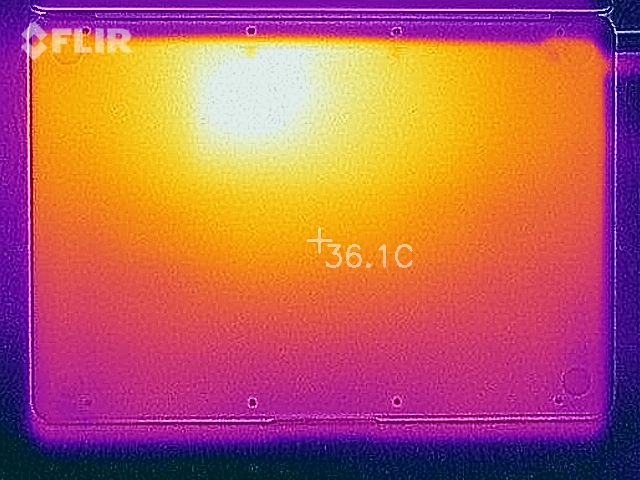
The surface temperatures are not noticeably different from the predecessor's. However, this was not to be expected anyway, since the changes are too small. While the MacBook 12 remains cool without exception during normal use such as office tasks and web surfing, hotspots develop during prolonged load in the lower middle segment at the top side and the underside. However, a temperature of just above 40 °C (~104 °F) does not cause problems.
(+) The maximum temperature on the upper side is 38.9 °C / 102 F, compared to the average of 35.9 °C / 97 F, ranging from 21.4 to 59 °C for the class Subnotebook.
(±) The bottom heats up to a maximum of 42.5 °C / 109 F, compared to the average of 39.2 °C / 103 F
(+) In idle usage, the average temperature for the upper side is 29.1 °C / 84 F, compared to the device average of 30.8 °C / 87 F.
(+) The palmrests and touchpad are reaching skin temperature as a maximum (32.8 °C / 91 F) and are therefore not hot.
(-) The average temperature of the palmrest area of similar devices was 28.2 °C / 82.8 F (-4.6 °C / -8.2 F).
Speakers
We have also repeated the audio measurements on the new MacBook from 2017 and our measurements are almost identical, apart from a small exception. An extraneous noise in the range of 100 to 125 Hertz might have been present in the measurements of the predecessor. You can still say that the Apple MacBook 12 really features an exemplary audio solution worth hearing for a compact notebook.
Apple MacBook 12 2017 audio analysis
(+) | speakers can play relatively loud (83.9 dB)
Bass 100 - 315 Hz
(-) | nearly no bass - on average 15% lower than median
(±) | linearity of bass is average (8.8% delta to prev. frequency)
Mids 400 - 2000 Hz
(+) | balanced mids - only 2% away from median
(+) | mids are linear (3.8% delta to prev. frequency)
Highs 2 - 16 kHz
(+) | balanced highs - only 2.3% away from median
(+) | highs are linear (3.3% delta to prev. frequency)
Overall 100 - 16.000 Hz
(+) | overall sound is linear (11.6% difference to median)
Compared to same class
» 13% of all tested devices in this class were better, 3% similar, 84% worse
» The best had a delta of 5%, average was 18%, worst was 53%
Compared to all devices tested
» 8% of all tested devices were better, 2% similar, 90% worse
» The best had a delta of 4%, average was 23%, worst was 134%
Apple MacBook 12 (Early 2016) 1.1 GHz audio analysis
(+) | speakers can play relatively loud (83.6 dB)
Bass 100 - 315 Hz
(±) | reduced bass - on average 11.3% lower than median
(±) | linearity of bass is average (14.2% delta to prev. frequency)
Mids 400 - 2000 Hz
(+) | balanced mids - only 2.4% away from median
(+) | mids are linear (5.5% delta to prev. frequency)
Highs 2 - 16 kHz
(+) | balanced highs - only 2% away from median
(+) | highs are linear (4.5% delta to prev. frequency)
Overall 100 - 16.000 Hz
(+) | overall sound is linear (10.2% difference to median)
Compared to same class
» 7% of all tested devices in this class were better, 2% similar, 90% worse
» The best had a delta of 5%, average was 18%, worst was 53%
Compared to all devices tested
» 5% of all tested devices were better, 1% similar, 94% worse
» The best had a delta of 4%, average was 23%, worst was 134%
Frequency diagram in comparison (check boxes above can be turned on/off!)
Energy Management
Power Consumption
With the exception of the idle average value, the power consumption measurements on the revised MacBook at hand are quite close to the predecessor's. This could be caused by a measuring error or deviations due to the new measurement instrument. Overall, a significantly higher power consumption due to the use of the newer, faster CPU is not noticeable.
| Off / Standby | |
| Idle | |
| Load |
|
Key:
min: | |
| Apple MacBook 12 2017 m3-7Y32, HD Graphics 615, Apple SSD AP0256, LED IPS, 2304x1440, 12" | Apple MacBook 12 (Early 2016) 1.1 GHz 6Y30, HD Graphics 515, Apple SSD AP0256, IPS, 2304x1440, 12" | Apple MacBook Air 13.3" 1.8 GHz (2017) 5350U, HD Graphics 6000, Apple SSD SM0128G, TN LED, 1440x900, 13.3" | Apple MacBook Pro 13 2017 Touchbar i5 i5-7267U, Iris Plus Graphics 650, Apple SSD AP0256, IPS, 2560x1600, 13.3" | Apple iPad Pro 12.9 2017 A10X Fusion, A10X Fusion GPU, Toshiba THGBX669D4LLDXG 64 GB NAND , IPS, 2732x2048, 12.9" | Apple iPad Pro 10.5 2017 A10X Fusion, A10X Fusion GPU, Toshiba THGBX669D4LLDXG 64 GB NAND , IPS, 2224x1668, 10.5" | |
|---|---|---|---|---|---|---|
| Power Consumption | 1% | -50% | -111% | 7% | 26% | |
| Idle Minimum * (Watt) | 2 | 2.7 -35% | 3.4 -70% | 2.8 -40% | 1.55 22% | 1.44 28% |
| Idle Average * (Watt) | 5.4 | 2.7 50% | 6.3 -17% | 10.9 -102% | 8.58 -59% | 6.12 -13% |
| Idle Maximum * (Watt) | 6.6 | 7.2 -9% | 7 -6% | 11.4 -73% | 8.59 -30% | 6.14 7% |
| Load Average * (Watt) | 22 | 22 -0% | 34.5 -57% | 55.4 -152% | 10.09 54% | 8.55 61% |
| Load Maximum * (Watt) | 20 | 20.5 -2% | 40 -100% | 57.5 -188% | 10.61 47% | 10.62 47% |
* ... smaller is better
Battery Life
The battery life of the revised MacBook 12 is slightly better than the predecessor's: It lasts 540 minutes (9 hours) in our standardized Wi-Fi test. This should be enough for a work day on-the-move if demanding applications are not used.
| Apple MacBook 12 2017 m3-7Y32, HD Graphics 615, 41.4 Wh | Apple MacBook 12 (Early 2016) 1.1 GHz 6Y30, HD Graphics 515, 41.4 Wh | Apple MacBook Air 13.3" 1.8 GHz (2017) 5350U, HD Graphics 6000, 54 Wh | Apple MacBook Pro 13 2017 Touchbar i5 i5-7267U, Iris Plus Graphics 650, 49.2 Wh | Apple iPad Pro 12.9 2017 A10X Fusion, A10X Fusion GPU, 41 Wh | Apple iPad Pro 10.5 2017 A10X Fusion, A10X Fusion GPU, 30.8 Wh | |
|---|---|---|---|---|---|---|
| Battery runtime | -7% | 18% | -3% | 37% | 29% | |
| WiFi v1.3 (h) | 9 | 8.4 -7% | 10.6 18% | 8.7 -3% | 12.3 37% | 11.6 29% |
| H.264 (h) | 8.5 | 6.9 | 11.3 | 10.5 | ||
| Load (h) | 3.9 | 1.2 | 4.3 | 3.3 | ||
| Reader / Idle (h) | 48.7 | 33.9 |
Verdict
Pros
Cons
How is the new MacBook 12 from Apple doing about 2 years after its first release? Well, we would not say that it is "light years" ahead, since other manufacturers have not slept during this time and offer slim and likewise powerful mobile computers too. Nevertheless, the MacBook 12 still features many qualities, which are as important today as two years ago.
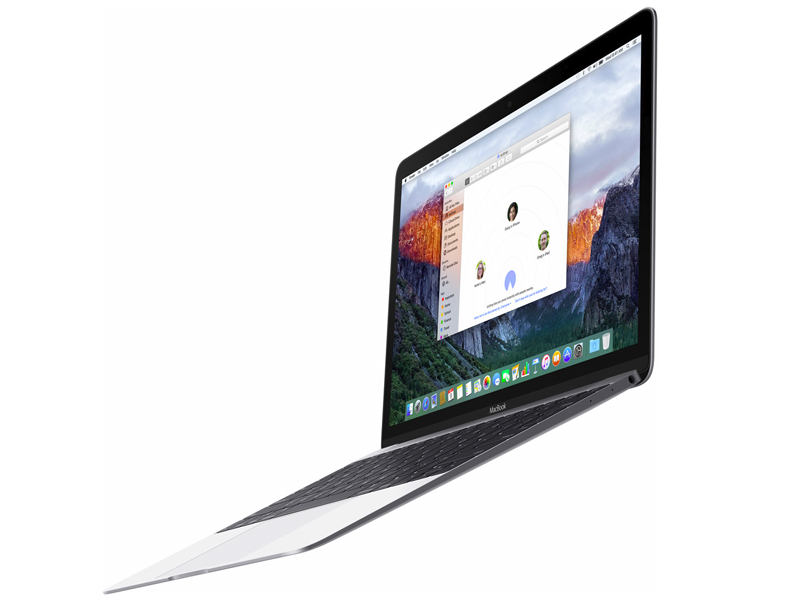
First of all, not only does the high-end aluminum case feel very good to the touch, but is also very robust, slim, and light (1.3 cm, 0.92 kg/~0.5 in, ~2 lb). The only disadvantage: There is only one USB Type C port, which is also used for charging. Without compatible hubs or adapters, you will quickly reach the limits here.
Compared to other notebooks including the new MacBook Pros, the keyboard still features an extremely short travel. However, the revised Butterfly mechanism brings significant advantages in comparison to the predecessor. In contrast, the touchpad implements a fully-fledged Force Touch technology.
The display has remained unchanged since the first launch. However, it is still one of the best panels of its size available in the market in view of its specification and measured values. In contrast to previous assumptions, Apple apparently uses PWM for brightness control. However, this is negligible due to the high frequency used.
The CPU, GPU, and SSD performance are higher than the predecessor's. However, the performance gain is not high enough to justify replacing a model from 2015 or 2016. The performance loss during prolonged load remains a crux. However, since it takes about 15 minutes until it occurs (full load!), this should not cause problems in practice.
Always silent operation, good battery runtimes of up to 9 hours during realistic use and very good speakers, which do not indicate that they are squeezed into an extremely slim case, are still important pros of the MacBook 12.
The Apple MacBook 12 can be recommended to ultra-mobile users, who need to frequently transport their device and to not have high requirements on the performance reserves of their companion (office task always run fast). While there are several better equipped companions available in the Windows world for the asking price of 1499 Euros (~$1710), the MacBook 12 from Apple is an attractive choice for users you can accept its few compromises (lack of ports, keyboard with short key travel, reduced long-term performance).
Apple MacBook 12 2017
- 06/27/2017 v6 (old)
J. Simon Leitner
Price comparison
