Dell XPS 13 9360 FHD i5 Notebook Review
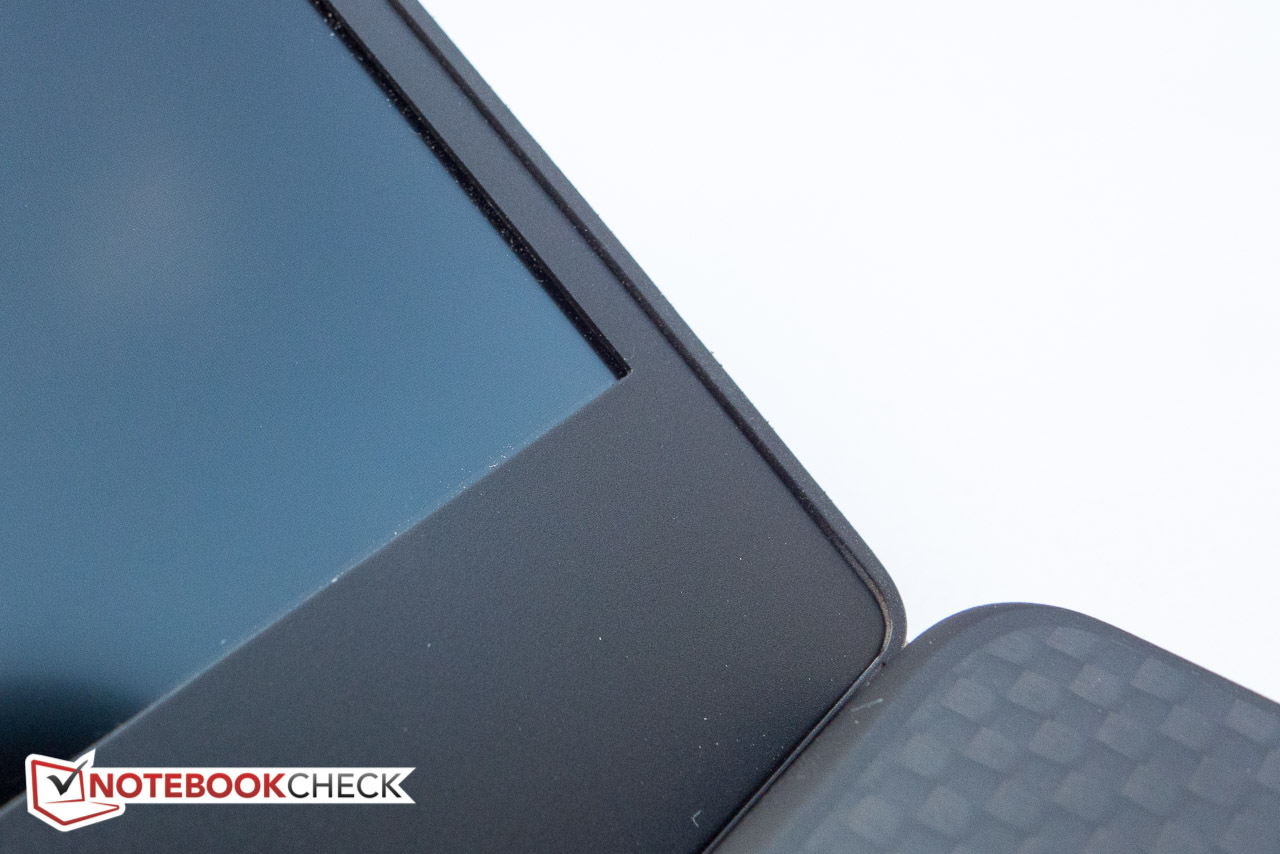
Now in its fourth generation, the Dell XPS 13 is far from being a new kid on the block. Much has been said about the venerable notebook and most of it is quite positive. At a time when manufactures primarily started to focus on shrinking the thickness of their Ultrabooks, Dell set out to reduce the footprint as well with their innovated "InfinityEdge" display. In addition to the practical aspects - the laptop is smaller than some 12.5-inch devices - the design is also extremely sturdy, well thought-out and strikingly beautiful.
A little over a month ago, we reviewed the XPS 13 9360 with QHD+ display and i5-7200U Kaby Lake processor; a few months before that we took a look at the XPS 13 9350 2016 with FHD and the previous-generation i7-6560U CPU. The review candidate this time is essentially a combination of the two with Full-HD display and i5-7200U processor, so it seems logical to compare the performance, the battery life and other merits to those versions as well as to other aluminum-clad competitors like the HP Spectre 13 or the Asus Zenbook UX330UA.
In order to provide an easy overview, here's a complete list of the XPS 13 versions we have reviewed so far:
- XPS 13 9360 QHD+ Core i5-7200U
- XPS 13 9360 QHD+ Core i7-7500U
- XPS 13 9350 FHD Core i7-6560U
- XPS 13 9350 QHD+ Core i7-6560U
- XPS 13 9350 FHD Core i5-6200U
- XPS 13 9350 QHD+ Core i7-6500U
- XPS 13 9343 QHD+ Core i5-5200U
- XPS 13 9333 FHD Core i5-4200U
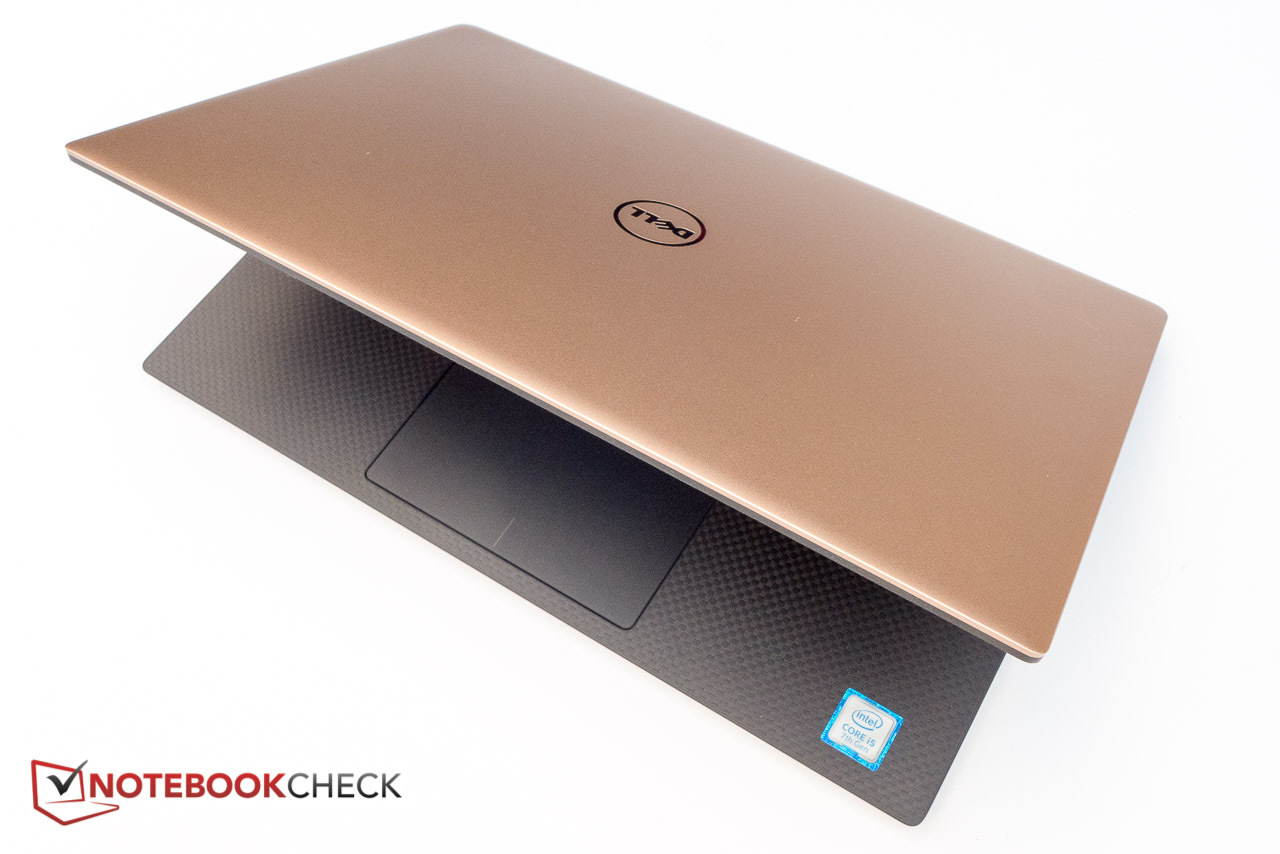
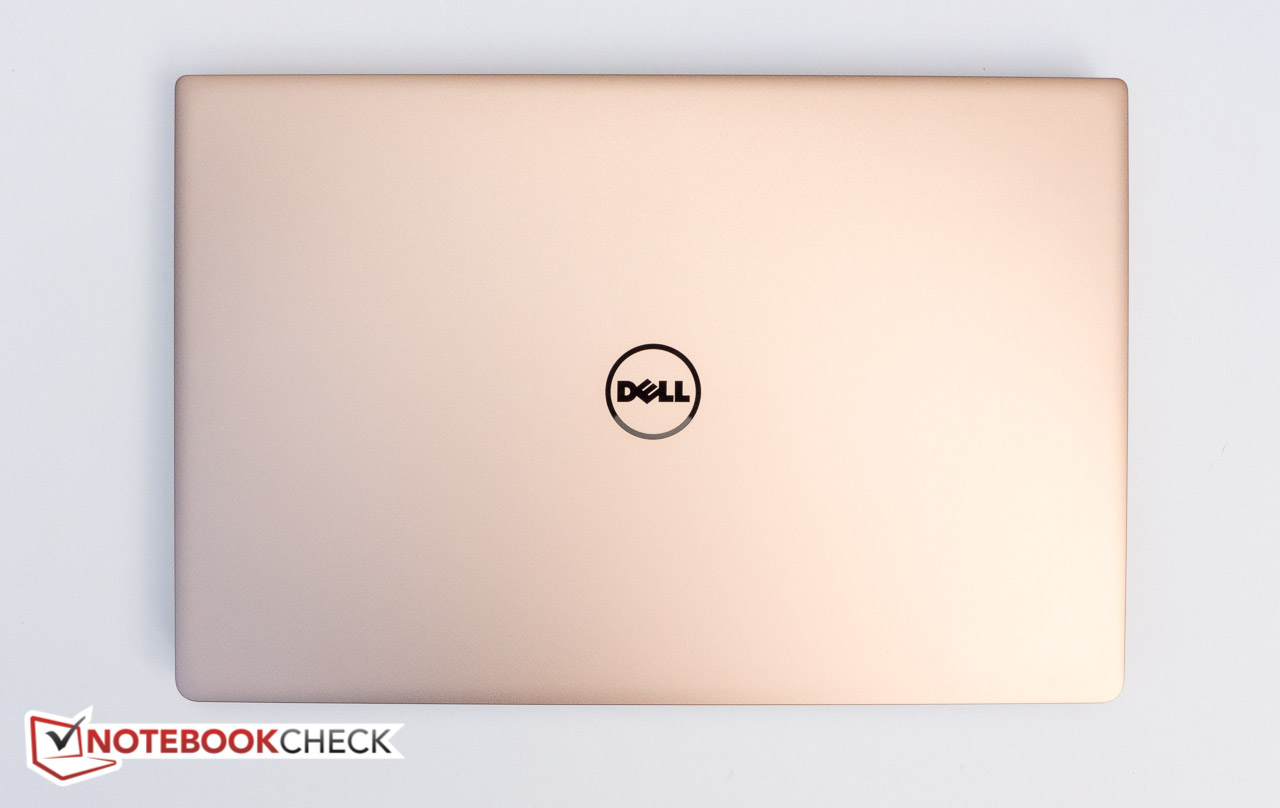
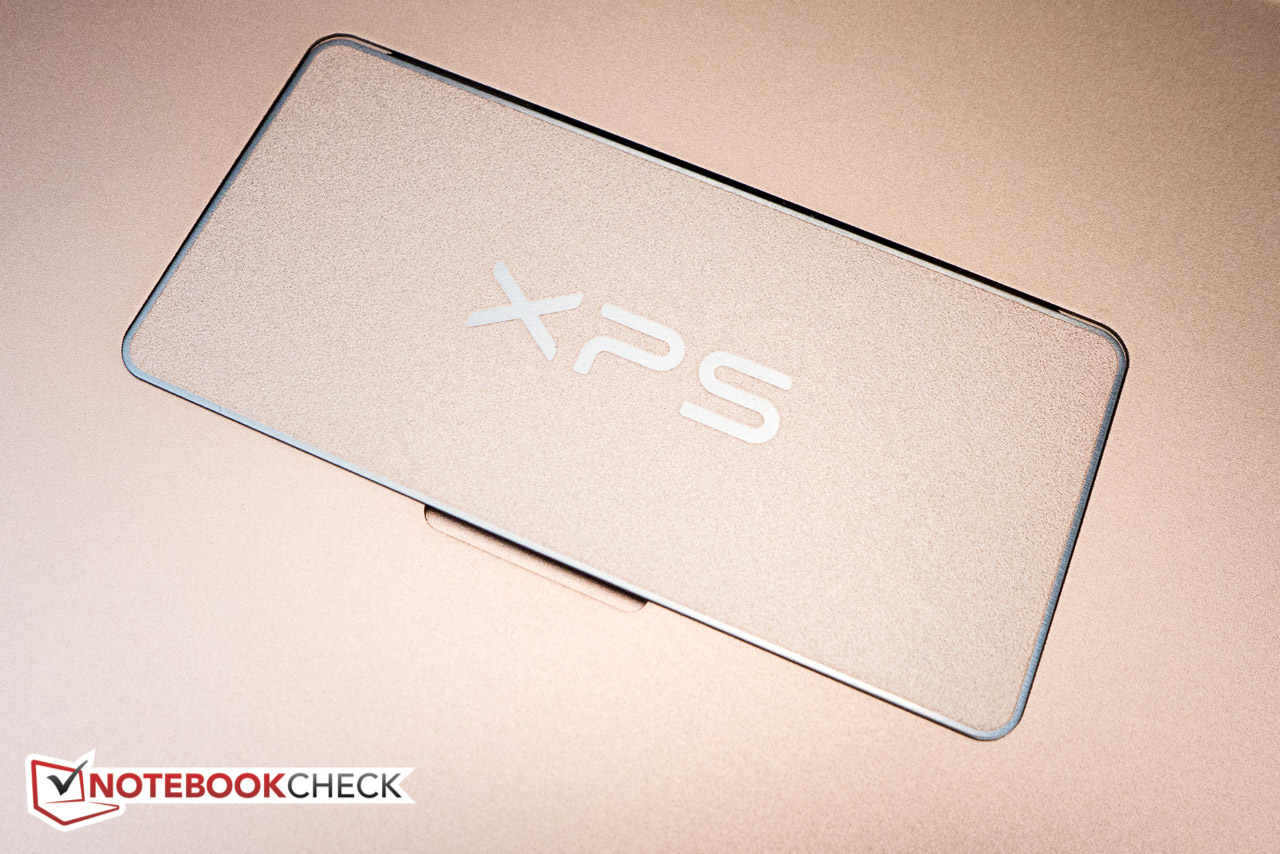
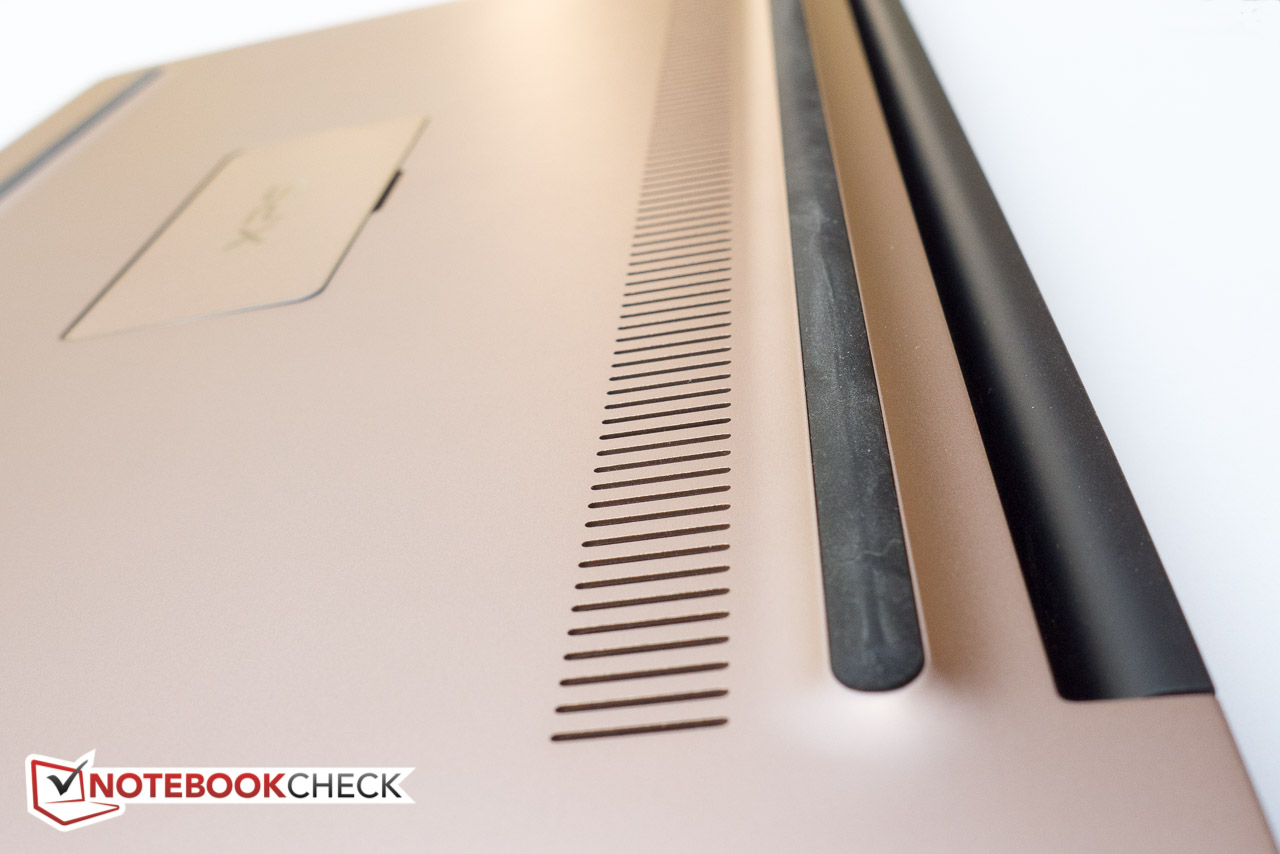
At the time of writing, Dell offers five base versions of the XPS starting with a configuration with i3-7100U CPU, 4 GB of RAM, non-touch FHD display and 128 GB SSD for $800 and ending with a model with i7-7500U processor, 16 GB of RAM, touch-enabled QHD+ display and 1 TB PCIe SSD for an eye-popping $2250. Our version with i5-7200U, 8 GB of RAM and 256 GB SSD sells for $1150. Note: the regular "Silver" version can be purchased for $1100, but our "Rose Gold" option costs an additional $50. Since much of the design has been covered previously, we are going to omit some sections entirely - the case design for example - and touch upon others only briefly. Please check out our previous reviews for in-depth details.
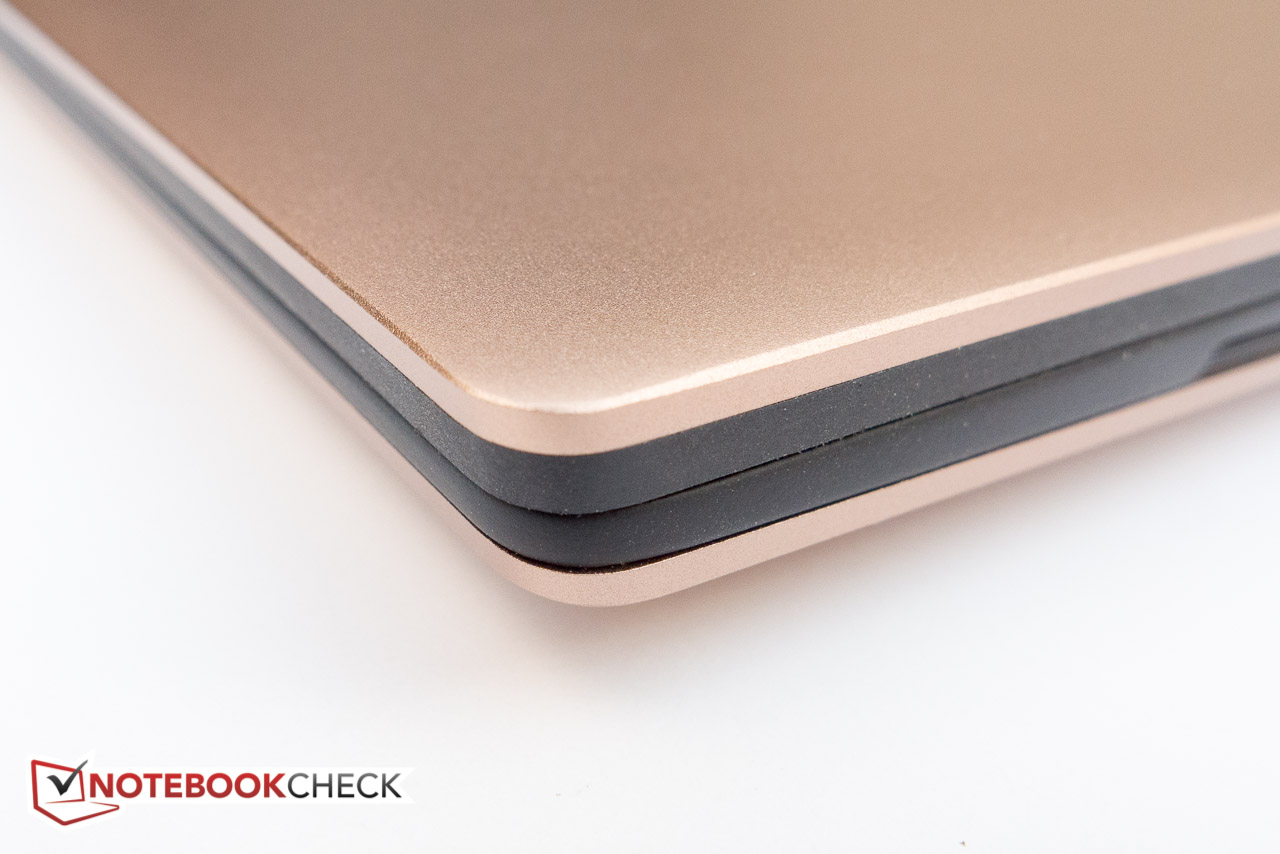
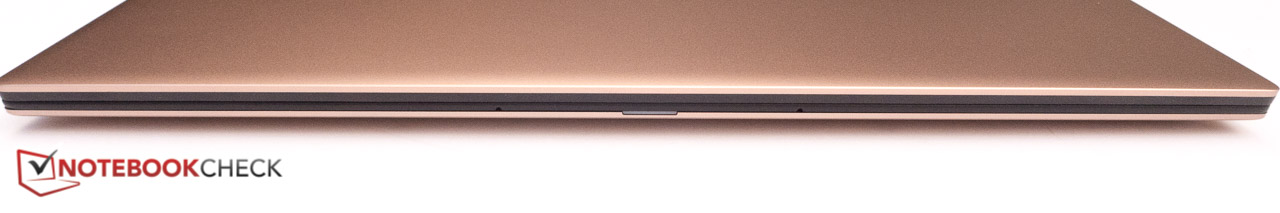
Compared to the QHD+ model with the Corning Gorilla Glass panel touch display - which weighs 1.31 kg / 2.89 lbs - the FHD model comes in slightly lighter at 1.23 kg / 2.71 lbs. Either one isn't particularly light by todays standards: the Lenovo IdeaPad 710S-13ISK, for example, weighs 2.56 lbs and ties the HP Spectre 13; the Asus Zenbook UX330UA weighs 2.6 lbs. For all intents and purposes, those differences are negligible though.The XPS 13 is one of the thickest ultraportables at 15 mm at its thickest point. No other 13-inch notebook is as ridiculously thin as the HP Spectre 13 at just over 10 mm of course and most competitors generally measure around 13 mm. For overall portability, the size of the notebook matters much more and this is where the XPS 13 shines with the smallest footprint of the bunch.
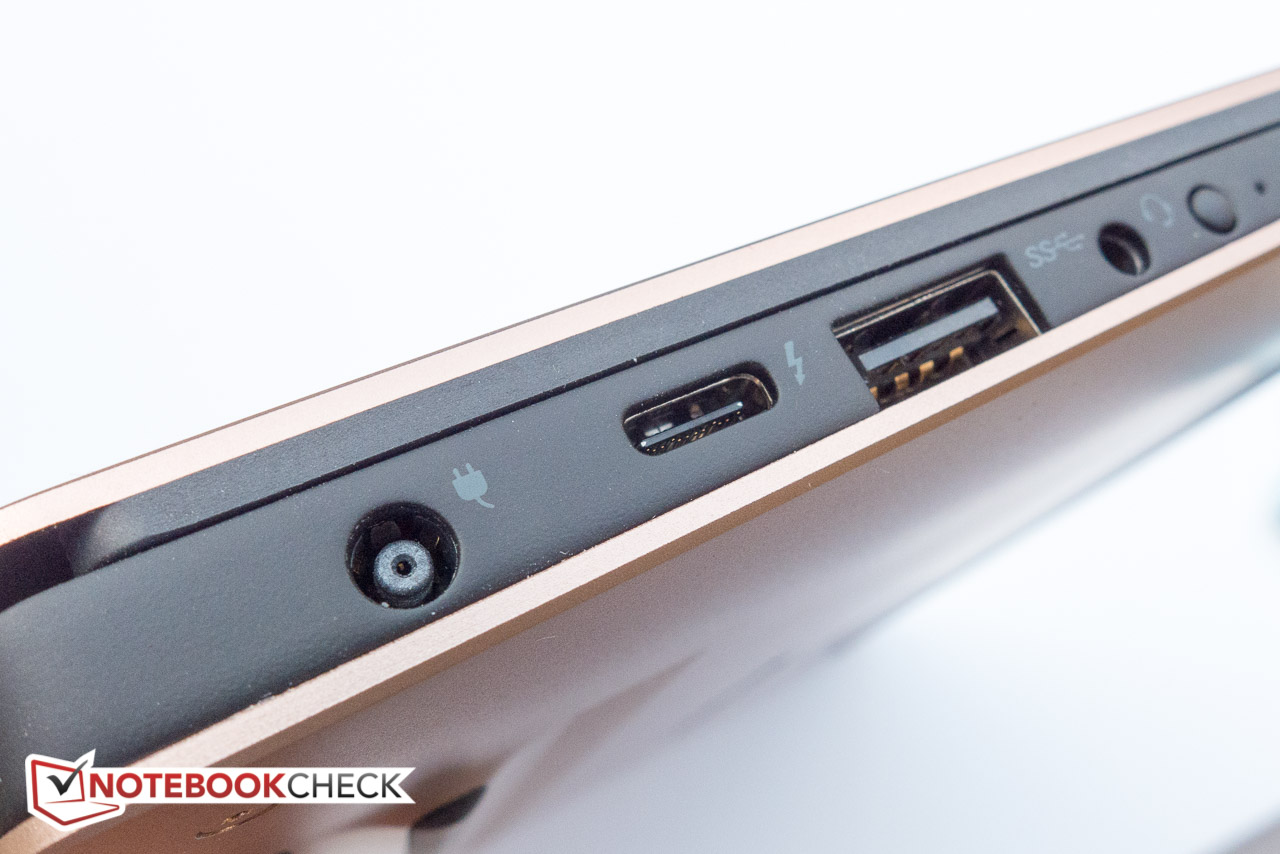
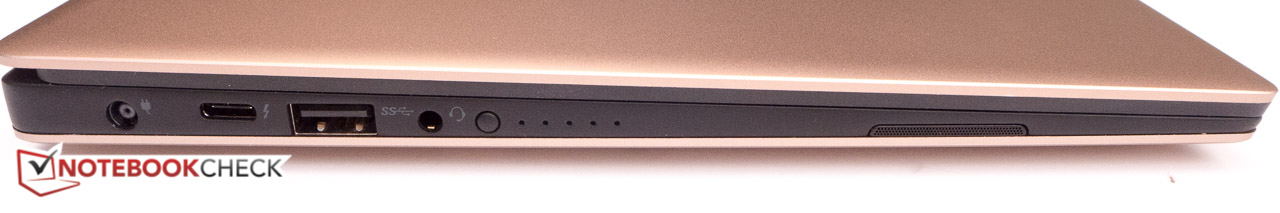
Connectivity
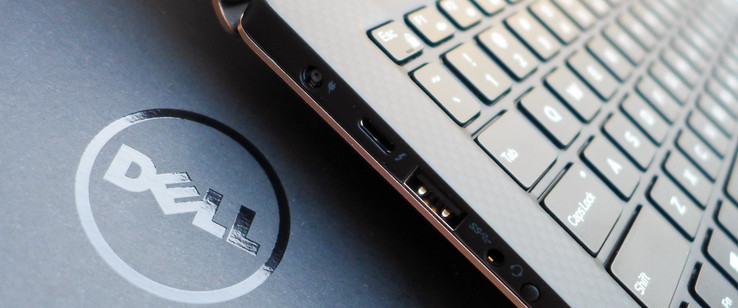
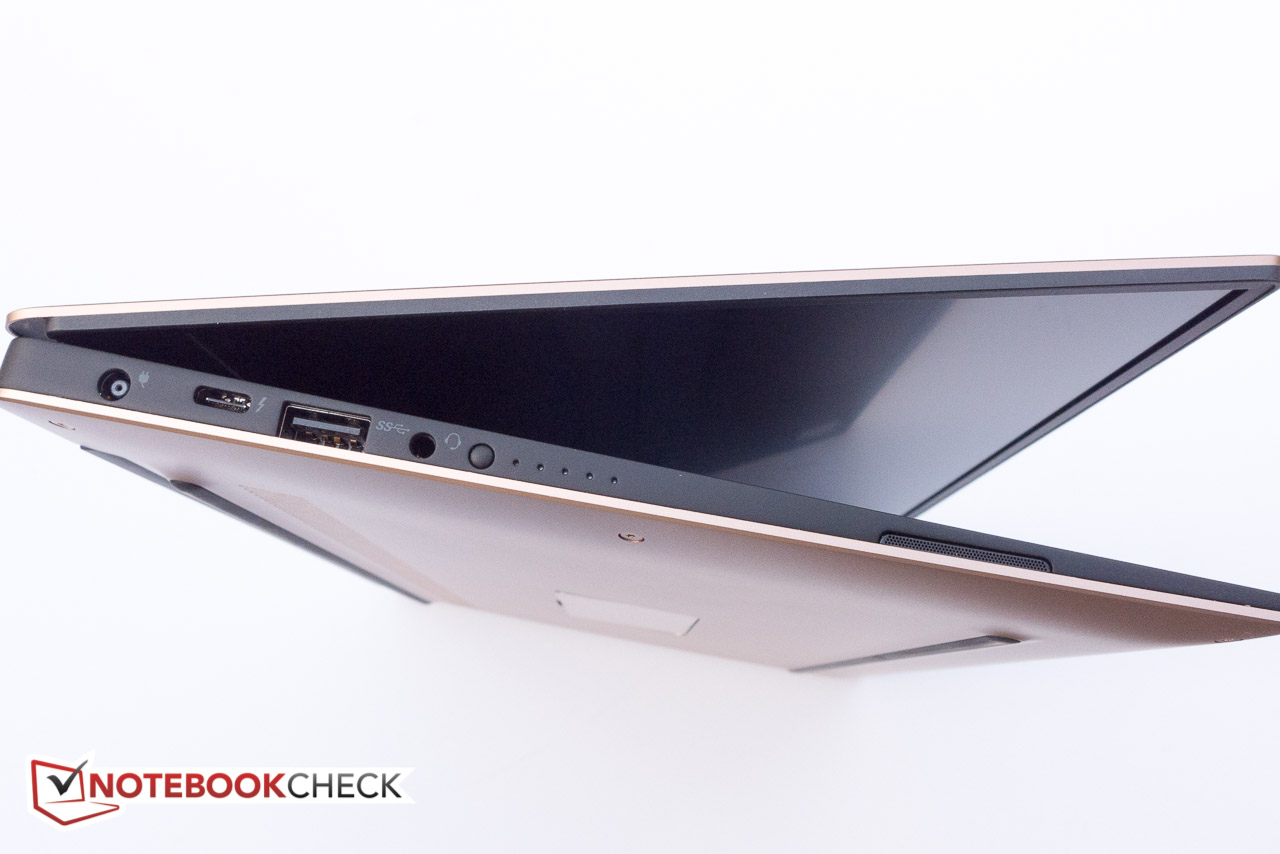
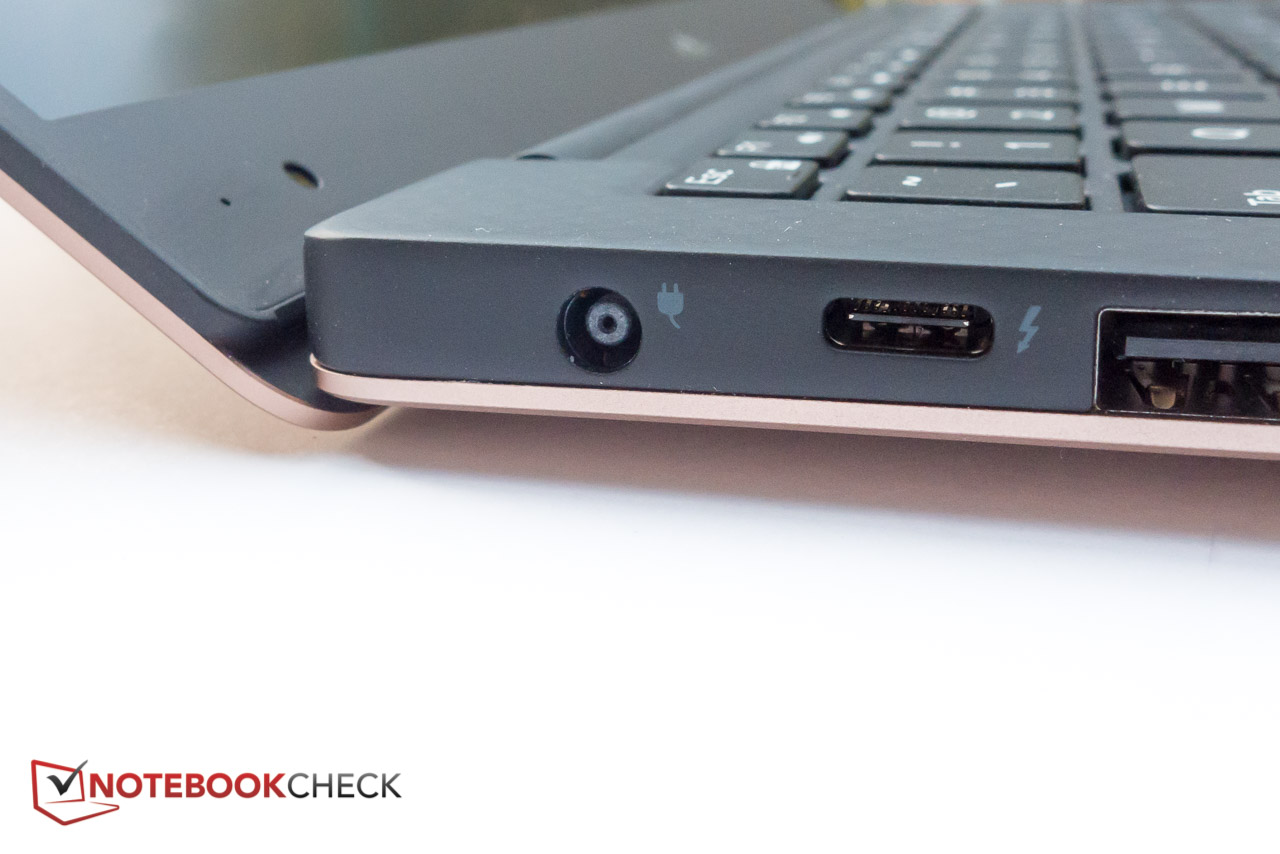
No changes here: the XPS 13 comes with a Thunderbolt 3 port - which also doubles as a USB 3.1 Gen 2 port - in addition to 2x USB 3.0 ports. While it seems like a good idea to keep a USB Type-A port around for compatibility reasons, we do think that the HP Spectre's configuration with 1x USB Type-C Gen. 1 and 2x USB Type-C Gen. 2 + Thunderbolt 3 is a bit more future-proof. Note that the XPS 13 lacks a traditional video-out port, so users wanting to hook up external displays need to use the DisplayPort-functionality - with 4K support - of the Thunderbolt 3 port via an adapter.
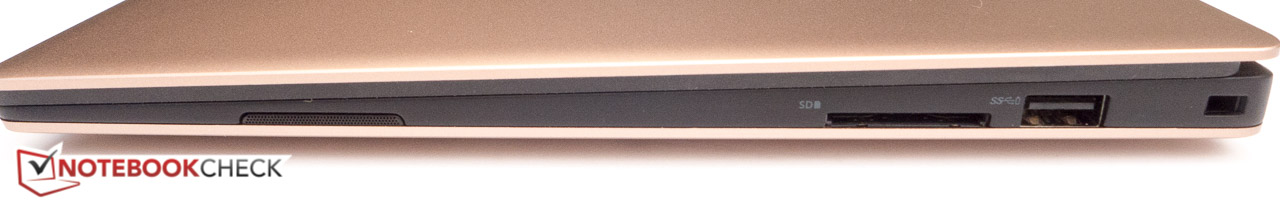
SD Card Reader
With read speeds of over 250 MB/s on our Toshiba Exceria Pro UHS-II test card, the XPS 13 outperforms most competing notebooks. Interestingly enough, the transfer rates are a little lower at 108 MB/s compared to what we saw with the Dell XPS 13 9360 QHD+ i7-7500U, which has the same card reader, but copied jpeg files at a rate of 128 MB/s.
| SD Card Reader | |
| average JPG Copy Test (av. of 3 runs) | |
| Dell XPS 13 9360 QHD+ i7 | |
| Dell XPS 13 9360 FHD i5 | |
| Lenovo IdeaPad 710S-13ISK | |
| Asus Zenbook UX330UA-FC059T | |
| maximum AS SSD Seq Read Test (1GB) | |
| Dell XPS 13 9360 FHD i5 | |
| Dell XPS 13 9360 QHD+ i7 | |
| Lenovo IdeaPad 710S-13ISK | |
| Asus Zenbook UX330UA-FC059T | |
Communication
WiFi 802.11ac 2x2 and Bluetooth 4.1 is courtesy of a Killer 1535 WLAN module - a surprising addition to the newest XPS 13 editions. Our review laptop also lags slightly behind - by about 20 % - the Dell XPS 13 9360 QHD+ i7-7500U, which is equipped with the same module. The speeds are still very good though with transfer rates of over 500 Mbps one meter away from our reference router Linsys EA8500. For more details on the Killer WiFi card, please check our dedicated page.
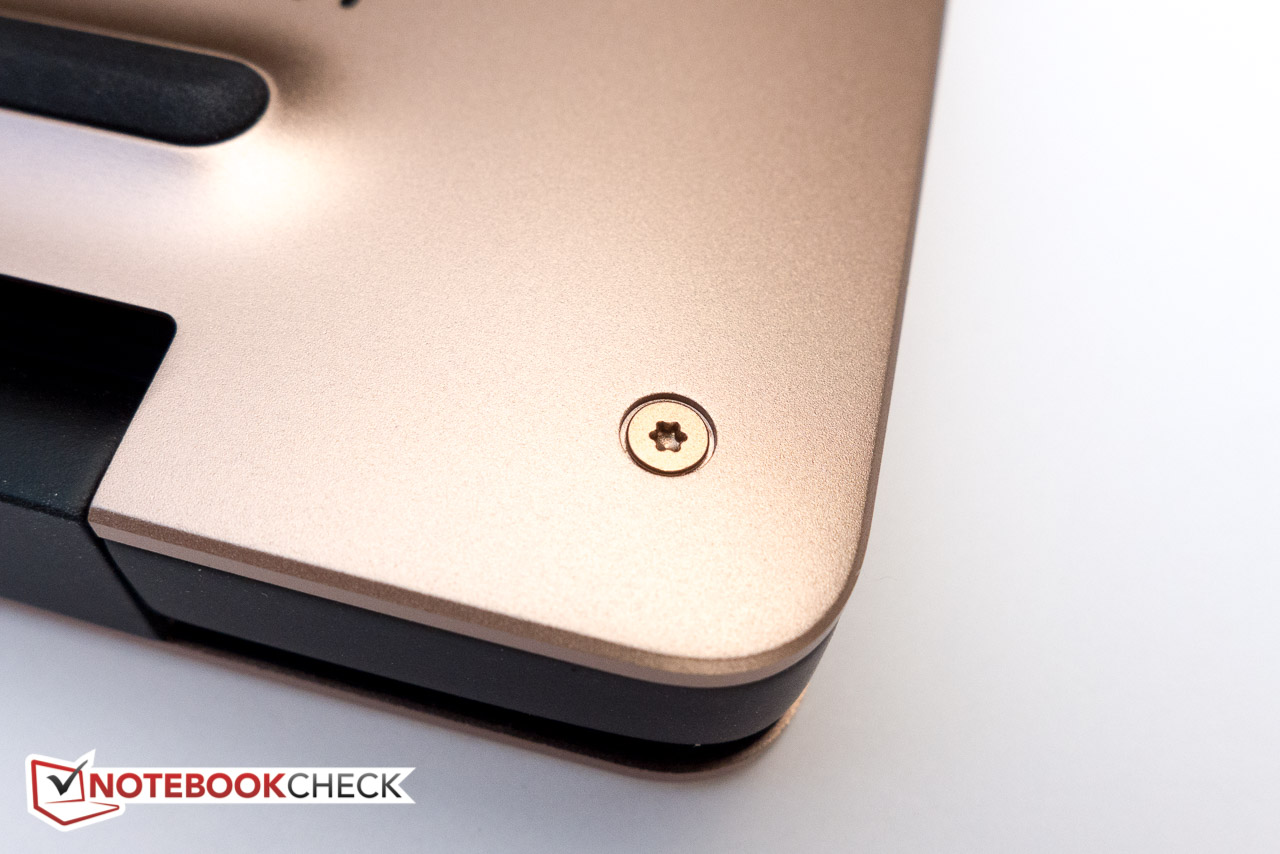
Maintenance
Since we've taken a look at the inside of the XPS 13 on several occasions, we have decided to skip opening up the review notebook this time around. For more information and pictures, please check out the following review.
Warranty
Dell covers the XPS 13 for a period of 12 months against manufacturers defect with other options available. Upgrading the mail-in service to 3 years of onsite service costs $240, to give one example. Accidental damage protection for the same period costs an additional $130.
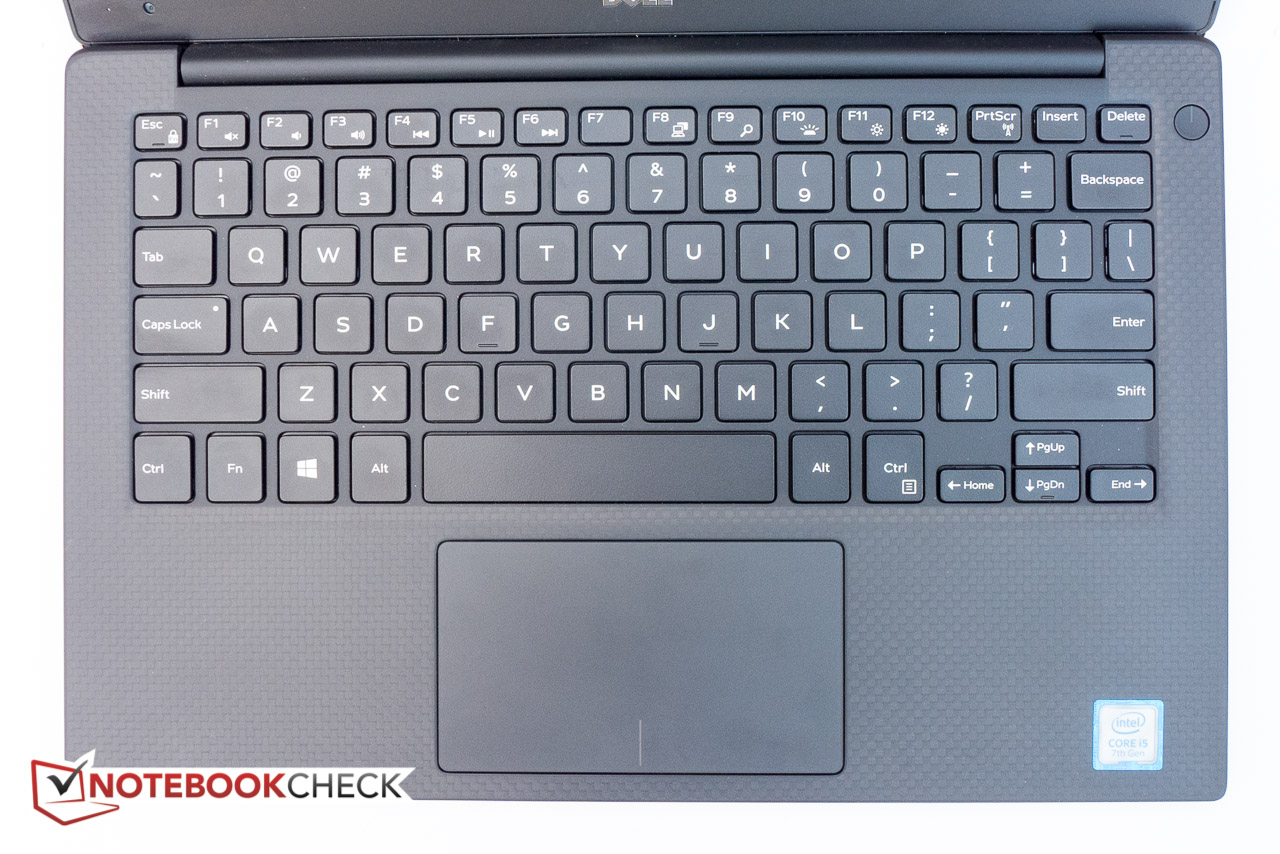
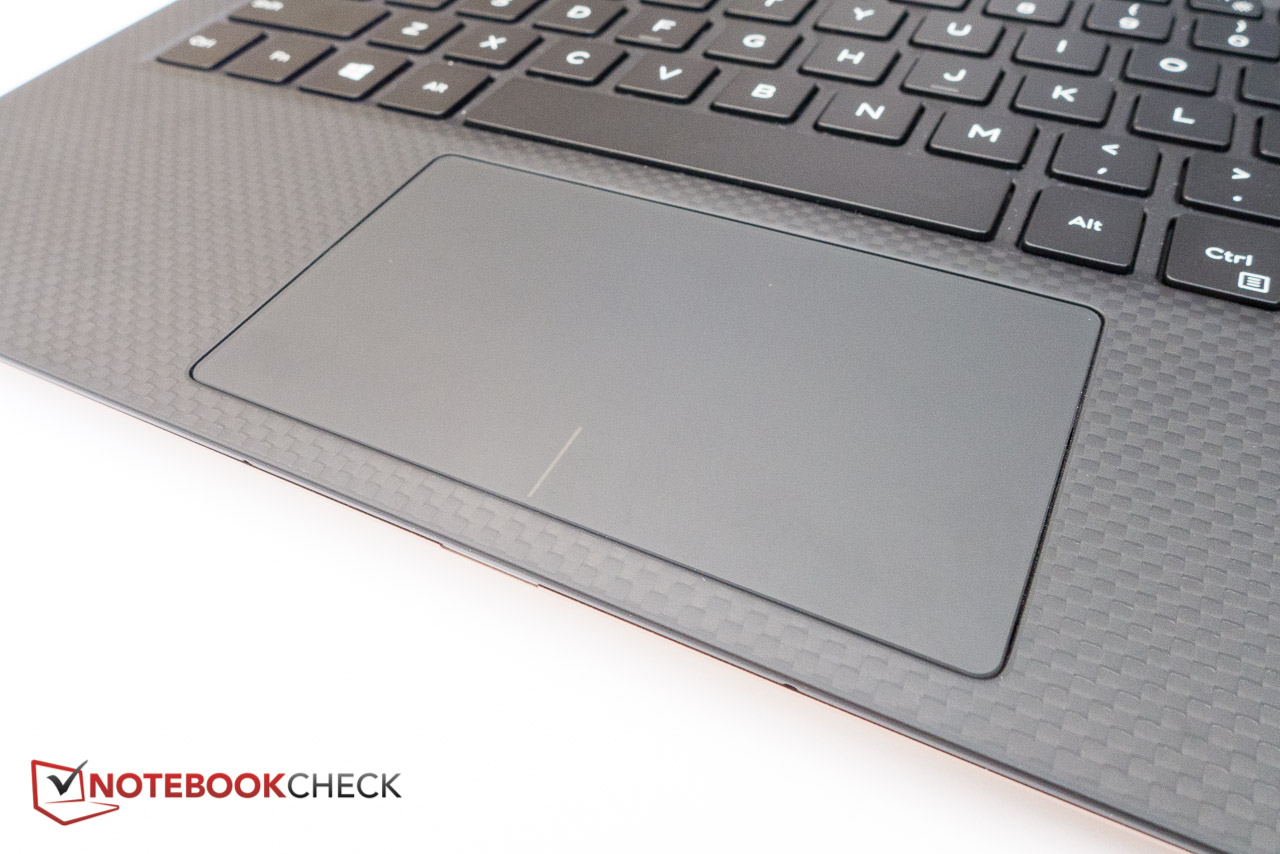
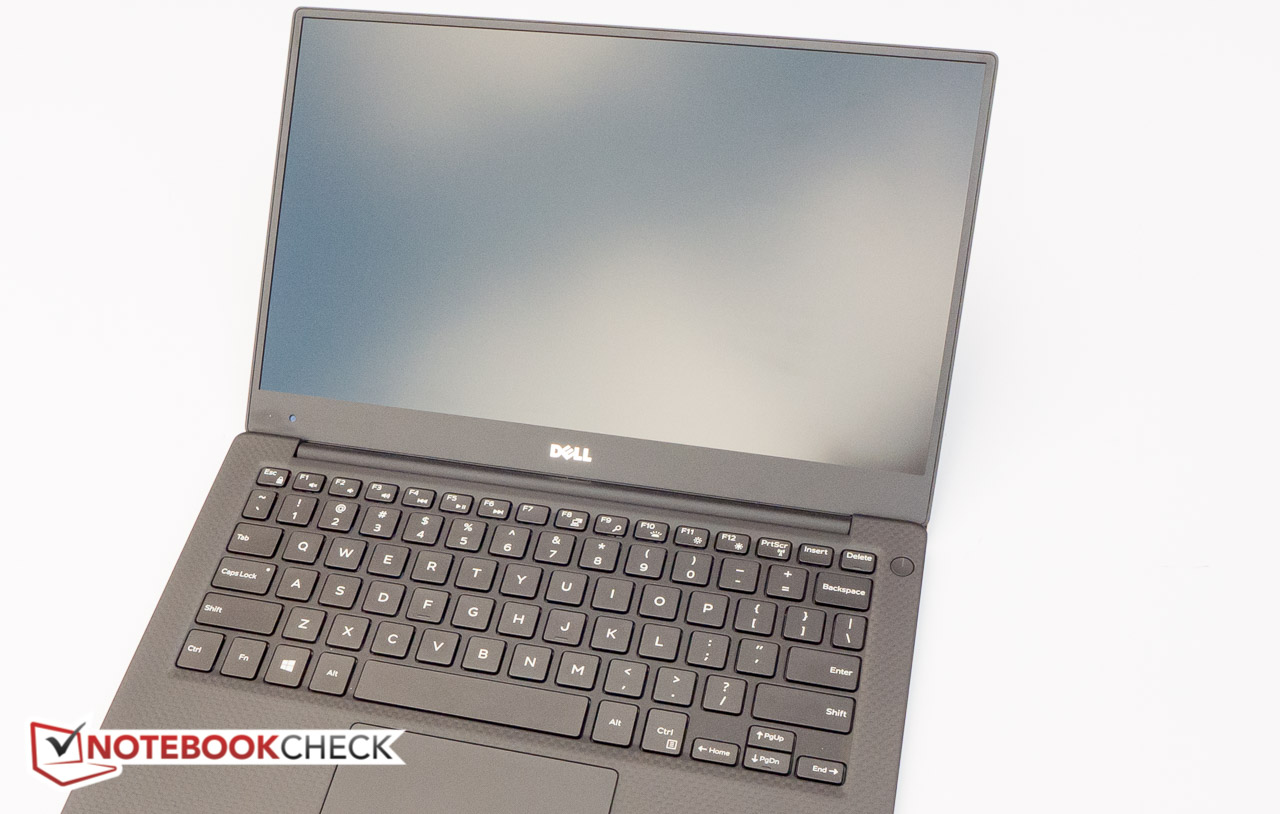
Input Devices
For more information on the keyboard and touchpad please check one of the previous reviews. We should note here that the space bar on our review notebook did not quite behave the way we would have come to expect from this otherwise outstanding keyboard. When pressing down right in the middle, the space bar would tilt forward, almost like it was hinged at the edge of closest to the touchpad. Presses here felt duller and provided less feedback, although the inputs were still registered reliably.
Display

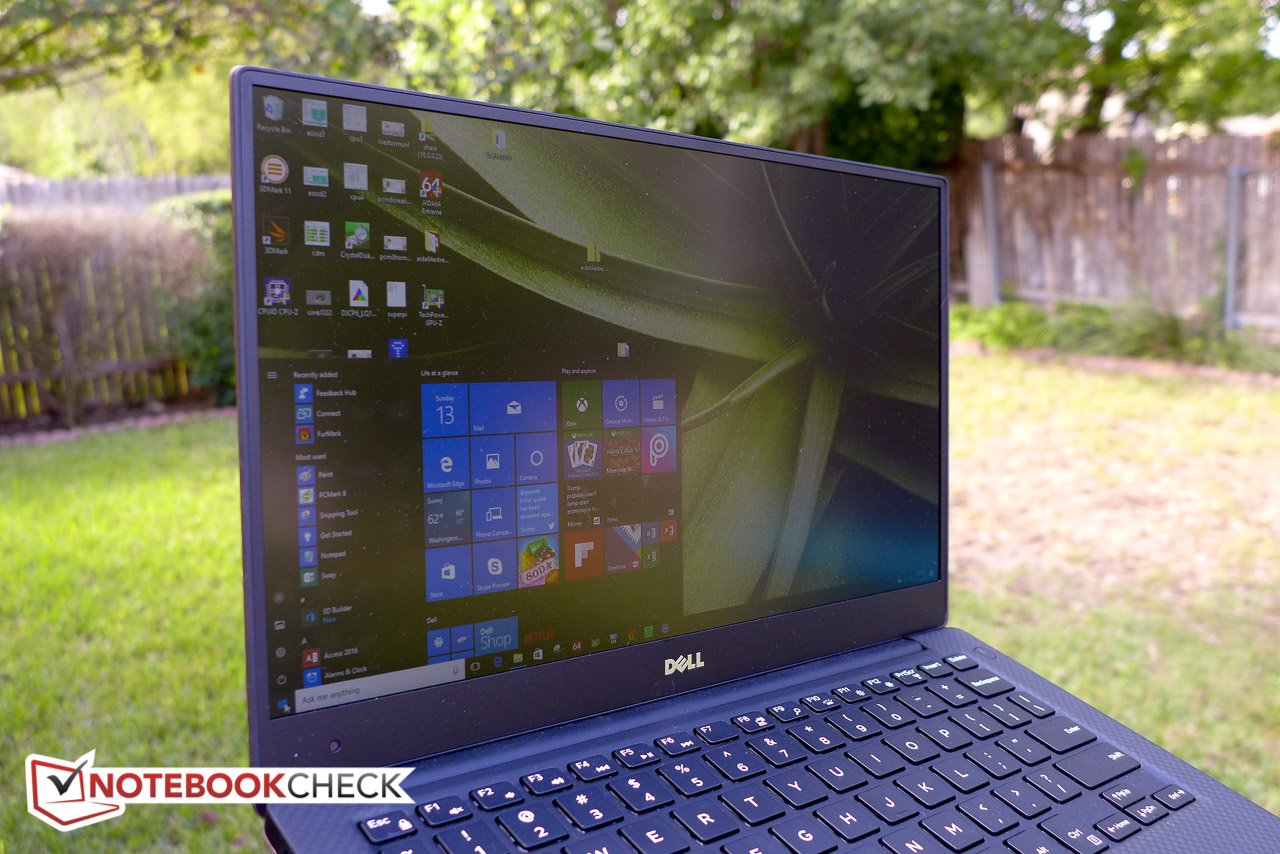
Most users will be familiar with the notebook's Infinity-display and super-slim bezel by now, so we won't comment on it any further. Visually, the screen looks pleasing with good colors and very minor display bleeding around the edges. Dell once again uses CABC (Content Adaptive Brightness/Backlight Control - for an explanation please see here), so getting accurate screen measurements can be quite difficult.
Dell offers the matte FHD display (1920x1080 pixels) for the more entry-level configurations with a maximum hard drive size of 256 GB and 8 GB of RAM. The glossy QHD+ panel with touch support is reserved for the higher-end configurations only. One of the biggest - unfortunately negative - surprises was the performance of the FHD display in our review unit. According to our tools, Dell uses the same exact IPS panel - a 13.3-inch Sharp SHP1449 LQ133M1 - not only in the review candidate with i5 processor, but also for the XPS 13 with FHD screen and i7 CPU.
| |||||||||||||||||||||||||
Brightness Distribution: 89 %
Center on Battery: 328 cd/m²
Contrast: 1801:1 (Black: 0.195 cd/m²)
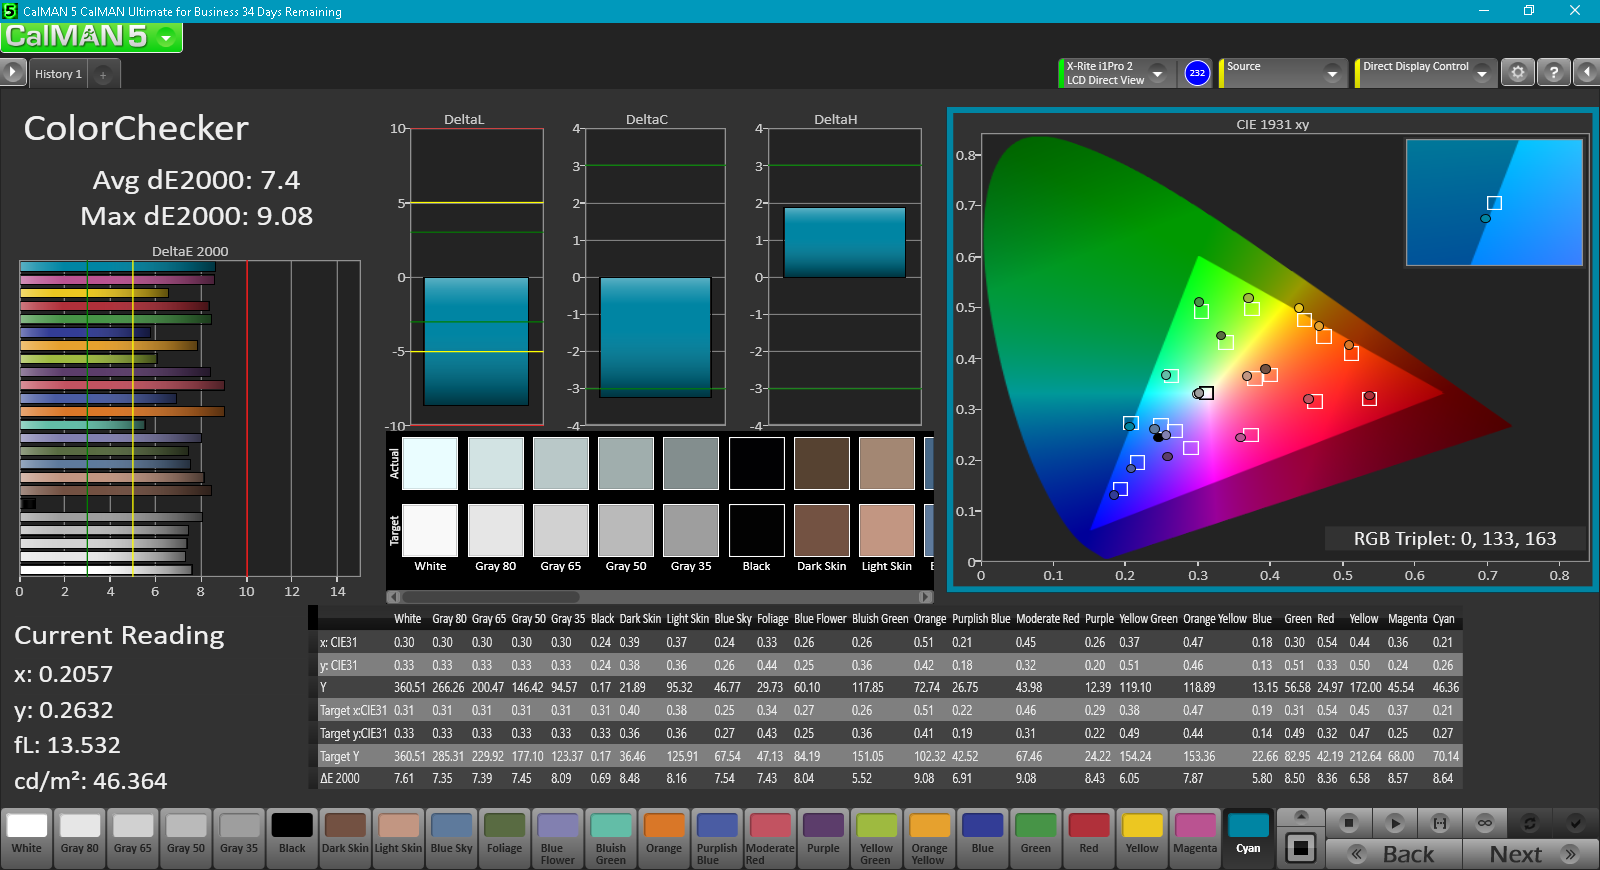
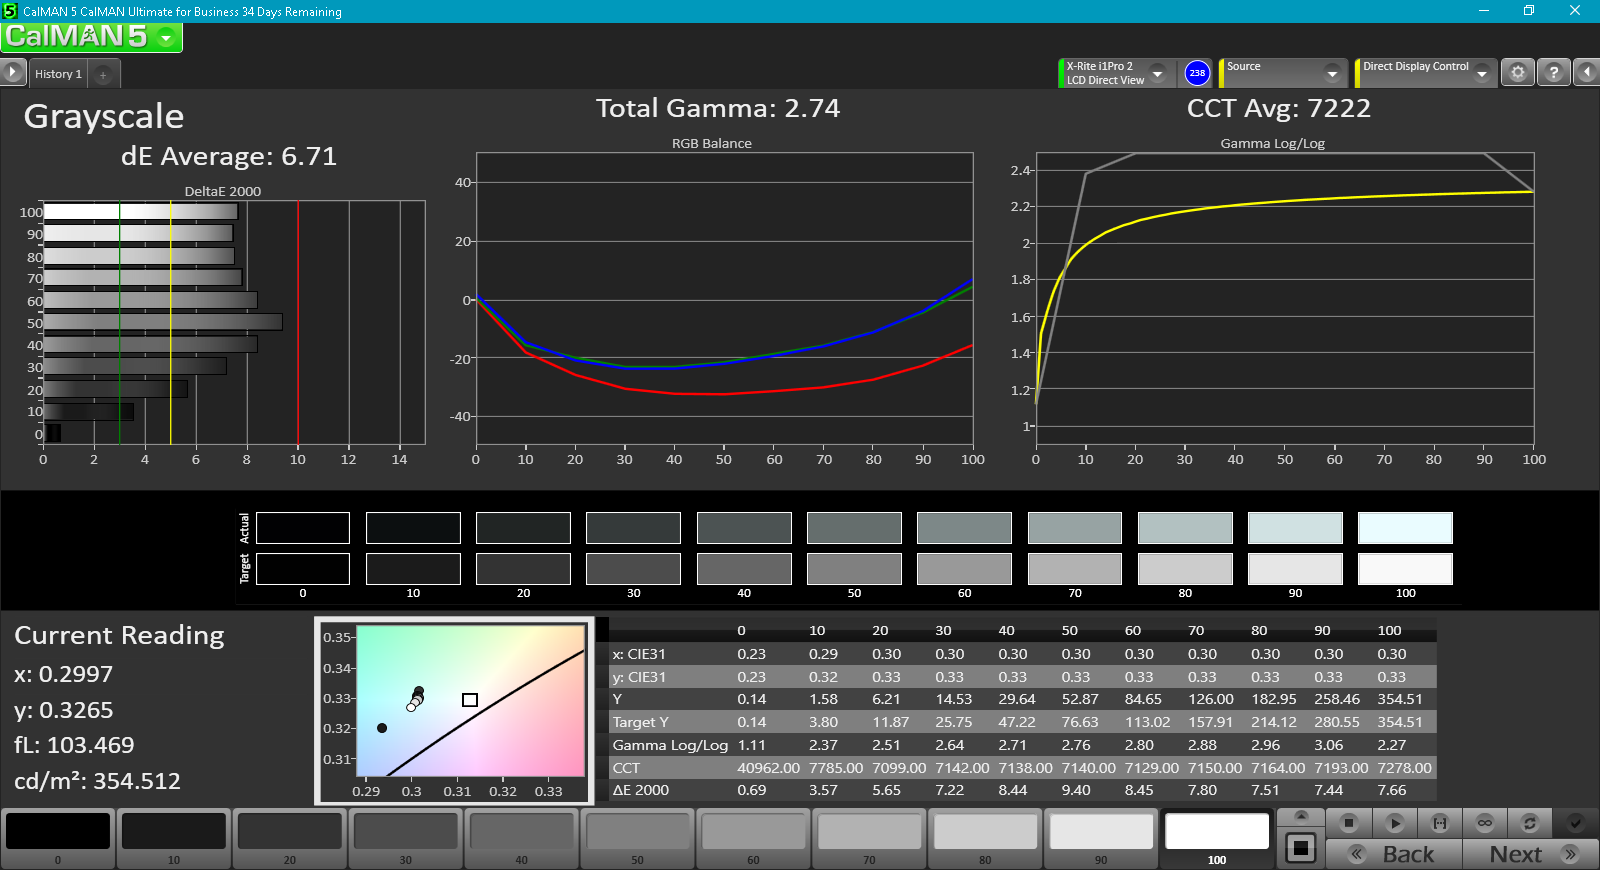
ΔE ColorChecker Calman: 7.4 | ∀{0.5-29.43 Ø4.73}
ΔE Greyscale Calman: 6.71 | ∀{0.09-98 Ø4.97}
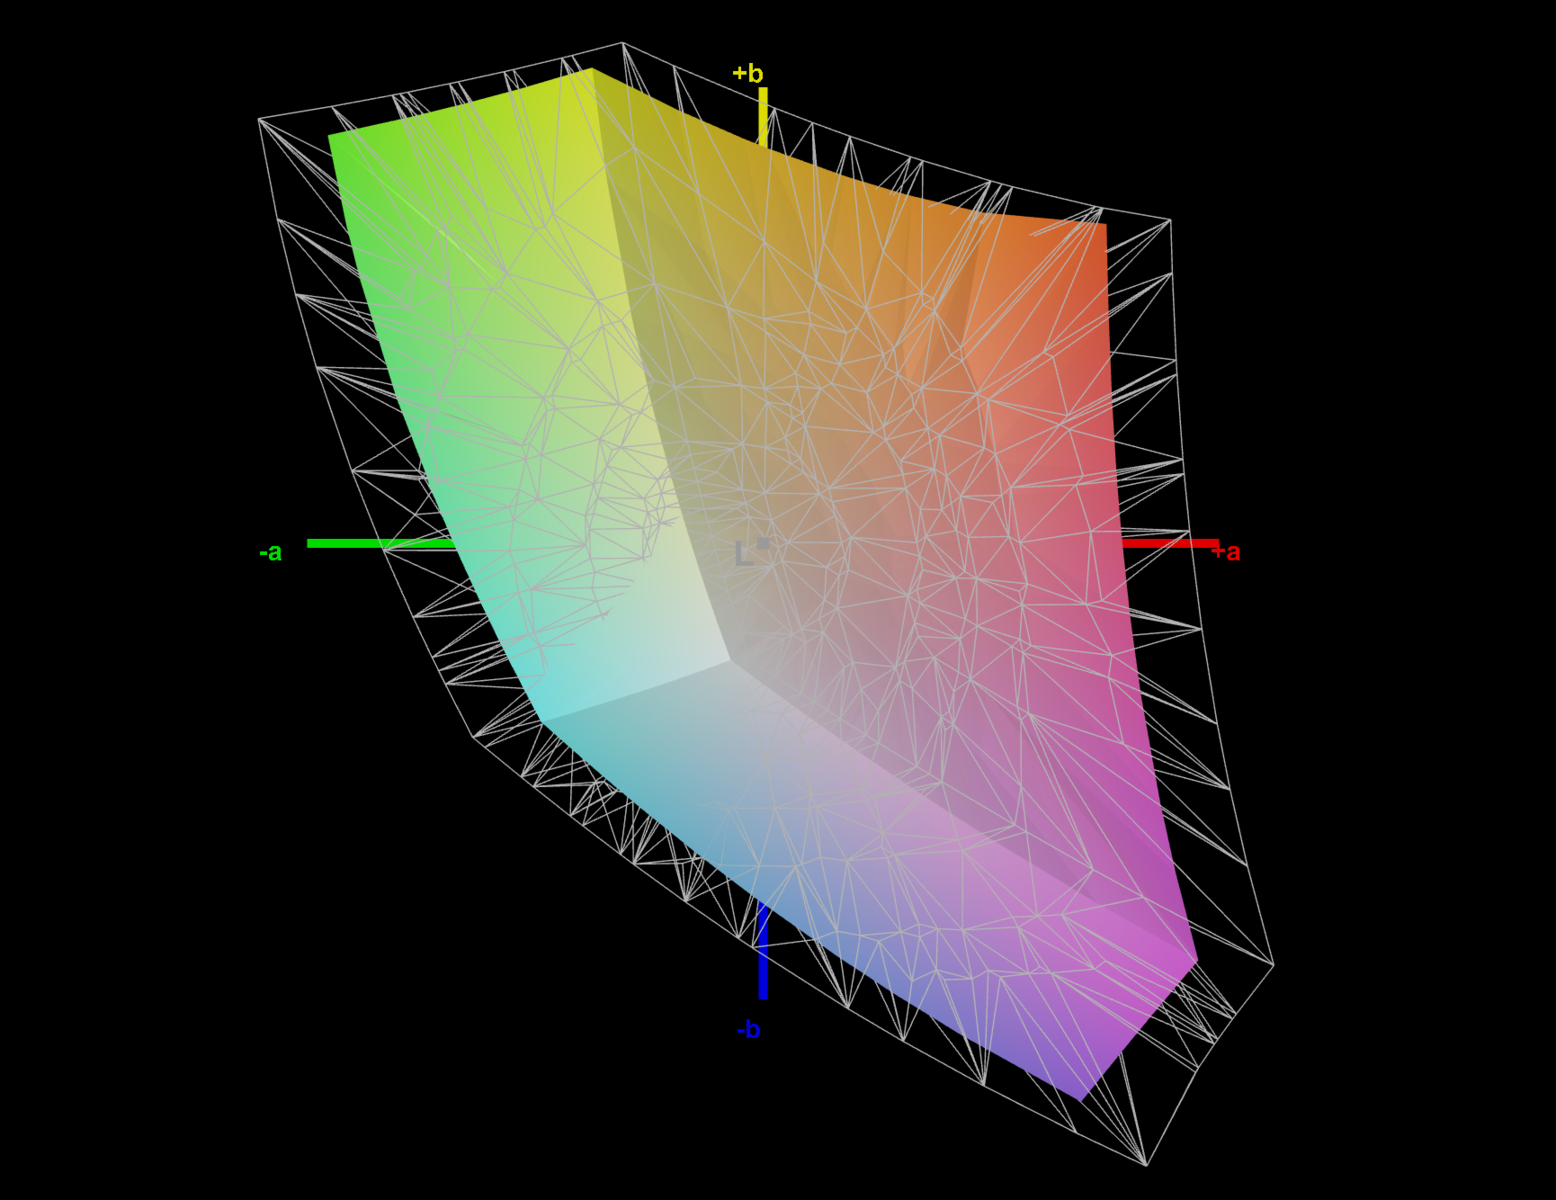
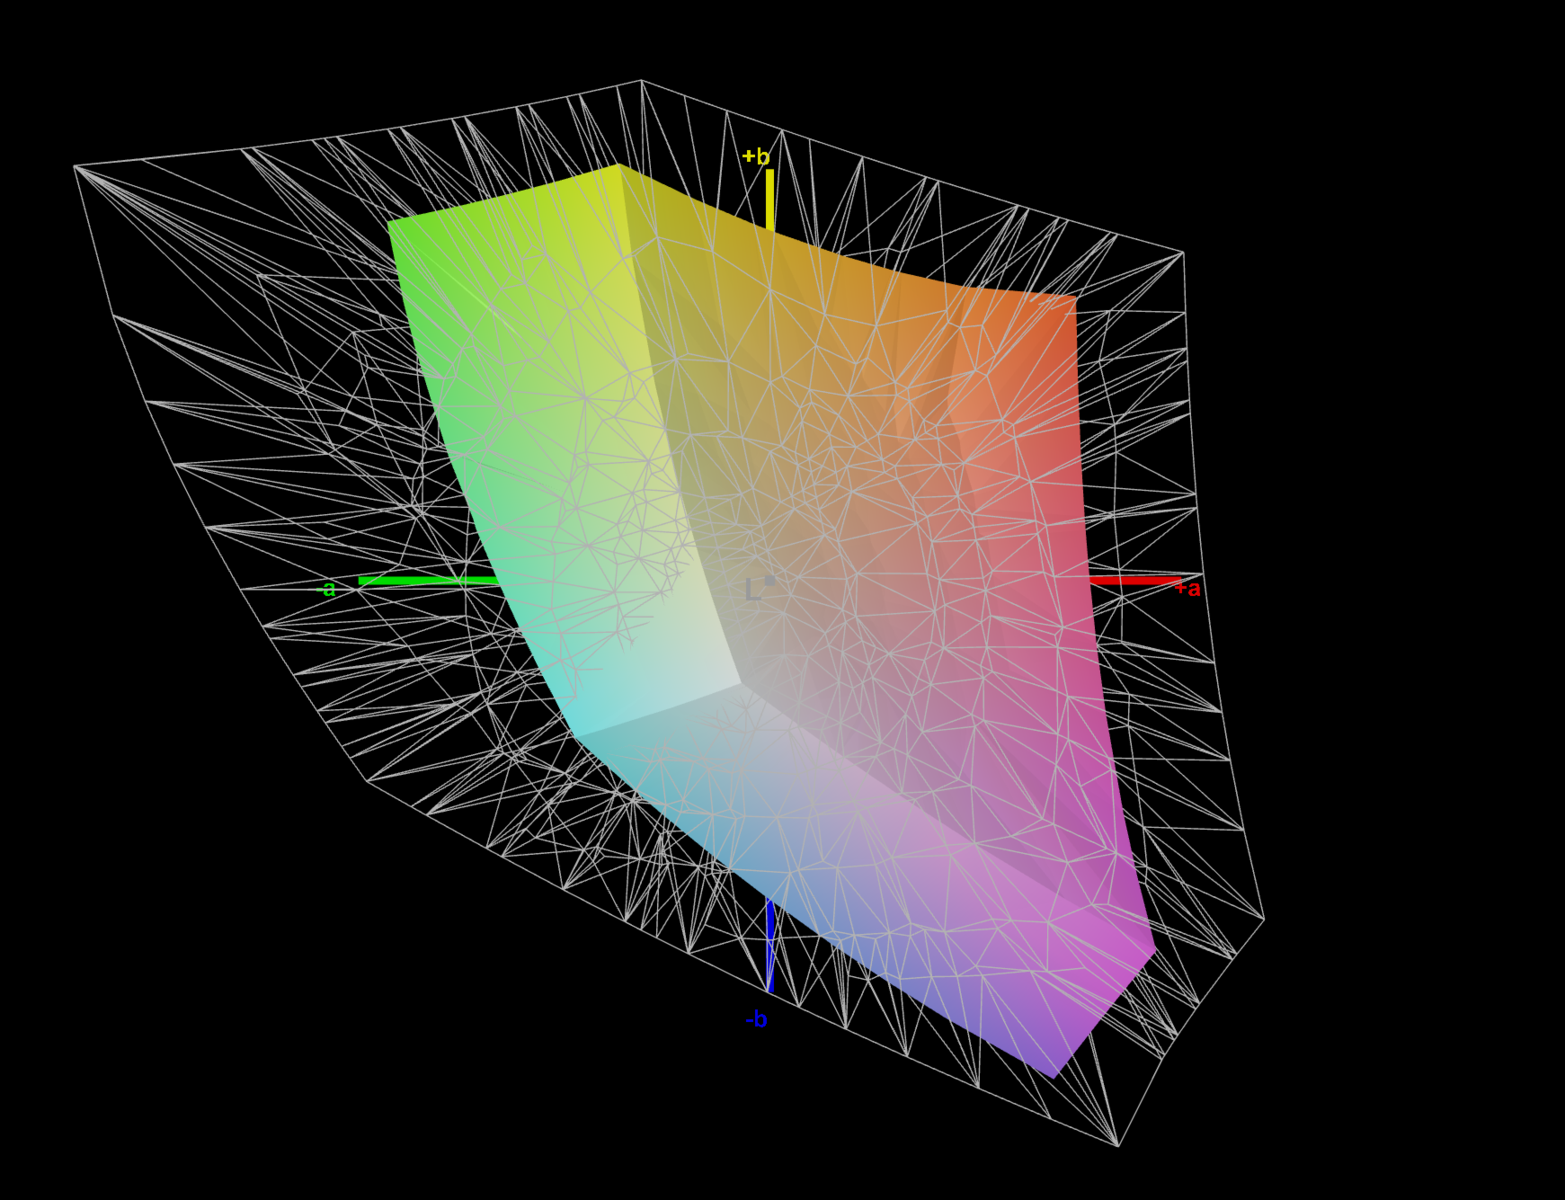
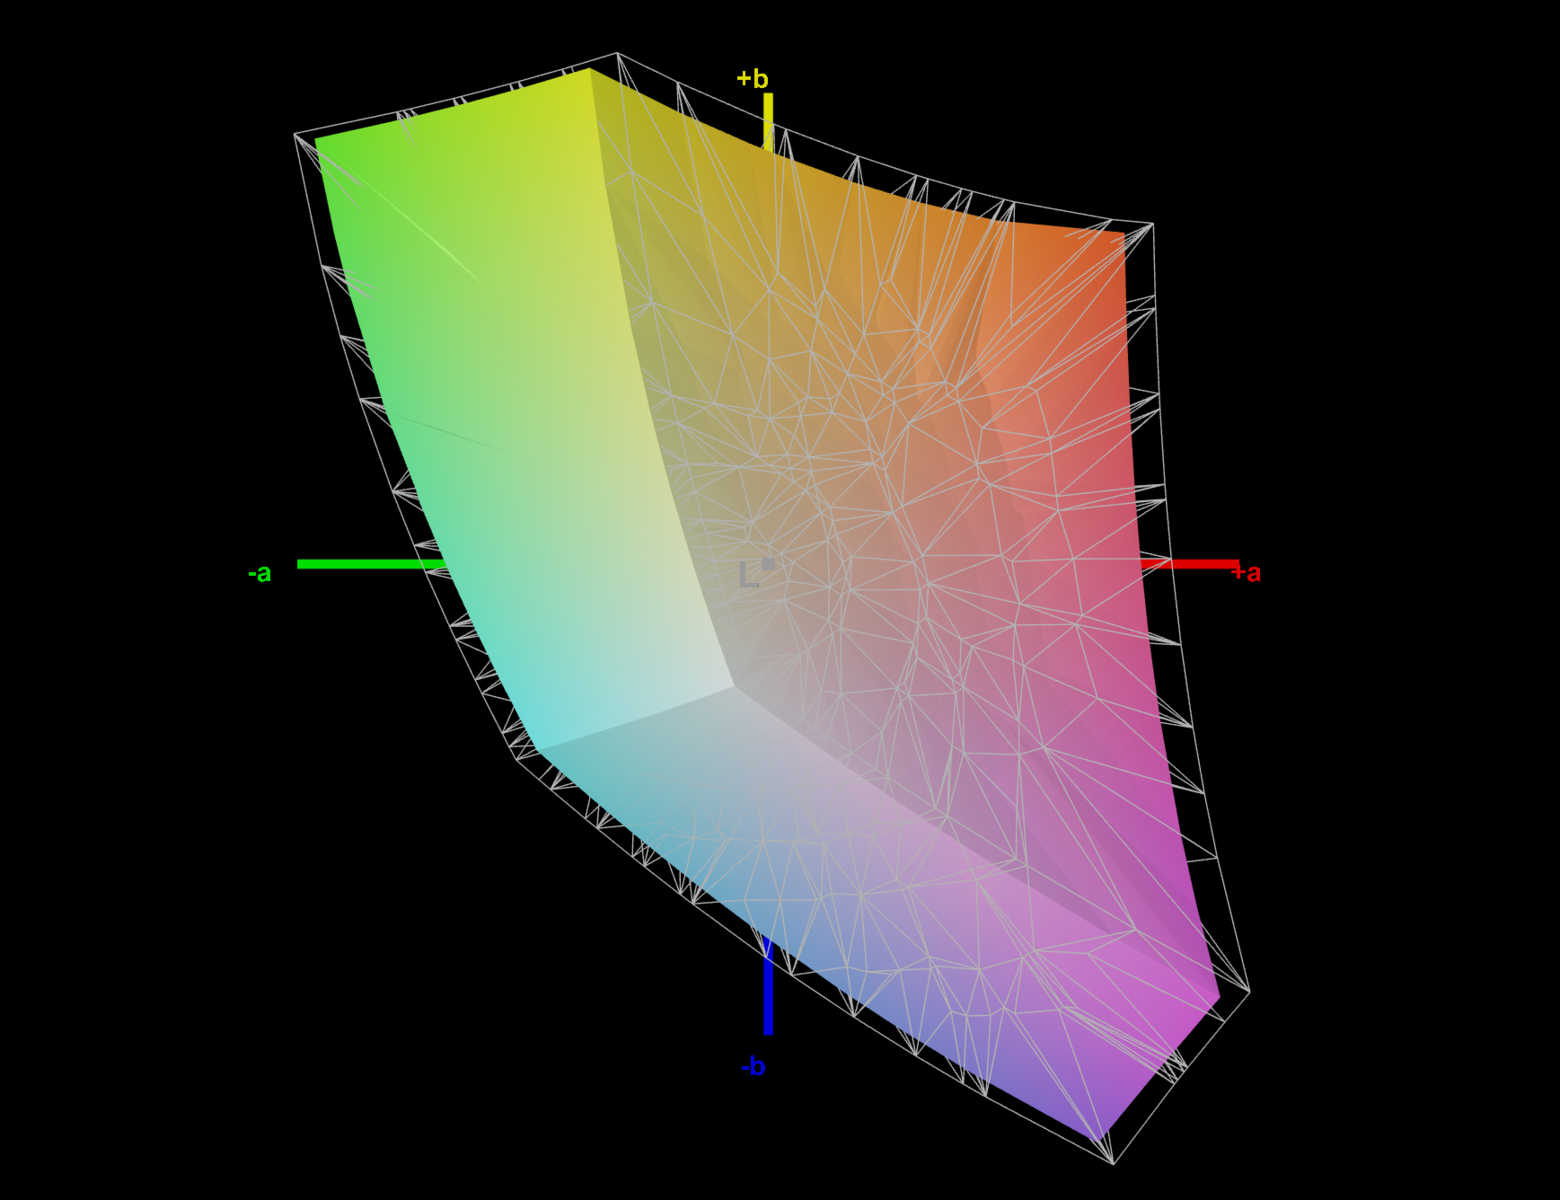
73.31% sRGB (Argyll 1.6.3 3D)
50.48% AdobeRGB 1998 (Argyll 1.6.3 3D)
50.5% AdobeRGB 1998 (Argyll 3D)
73.3% sRGB (Argyll 3D)
48.94% Display P3 (Argyll 3D)
Gamma: 2.74
CCT: 7222 K
| Dell XPS 13 9360 FHD i5 Sharp SHP1449 LQ133M1, IPS, 13.3", 1920x1080 | Dell XPS 13 2016 9350 (FHD, i7-6560U) Sharp SHP1449 LQ133M1, IPS, 13.3", 1920x1080 | Asus Zenbook UX330UA-FC059T AU Optronics AUO272D / B133HAN02.7, IPS, 13.3", 1920x1080 | Dell XPS 13 9360 QHD+ i7 Sharp SHP144A, IPS, 13.3", 3200x1800 | Lenovo IdeaPad 710S-13ISK Sharp SHP 1447 / LQ133M1JW15, IPS, 13.3", 1920x1080 | HP Spectre 13 IPS UWVA, 13.3", 1920x1080 | Acer Aspire S 13 S5-371-71QZ AUO B133HAN04.1, IPS, 13.3", 1920x1080 | Razer Blade Stealth QHD i7-7500U Sharp SHP142F (LQ125T1JW02), , 12.5", 2560x1440 | |
|---|---|---|---|---|---|---|---|---|
| Display | 12% | 28% | 26% | 35% | 32% | 36% | ||
| Display P3 Coverage (%) | 48.94 | 54.8 12% | 64.2 31% | 62.8 28% | 66.4 36% | 65.6 34% | 68.7 40% | |
| sRGB Coverage (%) | 73.3 | 82.3 12% | 90.6 24% | 89.4 22% | 97.5 33% | 94.7 29% | 95.8 31% | |
| AdobeRGB 1998 Coverage (%) | 50.5 | 56.6 12% | 65.3 29% | 64.6 28% | 68.4 35% | 67.5 34% | 69.9 38% | |
| Response Times | -3% | 14% | -11% | -16% | -28% | -21% | -7% | |
| Response Time Grey 50% / Grey 80% * (ms) | 32.8 ? | 42.8 ? -30% | 32 ? 2% | 43.6 ? -33% | 52.4 ? -60% | 50.8 ? -55% | 50 ? -52% | 37 ? -13% |
| Response Time Black / White * (ms) | 33.2 ? | 24.8 ? 25% | 25 ? 25% | 29.2 ? 12% | 23.6 ? 29% | 33.2 ? -0% | 29.6 ? 11% | 33.4 ? -1% |
| PWM Frequency (Hz) | 200 ? | 220 ? | 200 ? | |||||
| Screen | 19% | 6% | 10% | -5% | 18% | -2% | 1% | |
| Brightness middle (cd/m²) | 351.2 | 385 10% | 360 3% | 396.2 13% | 344 -2% | 300.5 -14% | 375 7% | 402 14% |
| Brightness (cd/m²) | 325 | 350 8% | 337 4% | 357 10% | 326 0% | 305 -6% | 358 10% | 382 18% |
| Brightness Distribution (%) | 89 | 86 -3% | 86 -3% | 84 -6% | 87 -2% | 76 -15% | 87 -2% | 88 -1% |
| Black Level * (cd/m²) | 0.195 | 0.17 13% | 0.22 -13% | 0.266 -36% | 0.36 -85% | 0.184 6% | 0.39 -100% | 0.45 -131% |
| Contrast (:1) | 1801 | 2265 26% | 1636 -9% | 1489 -17% | 956 -47% | 1633 -9% | 962 -47% | 893 -50% |
| Colorchecker dE 2000 * | 7.4 | 4.17 44% | 5.21 30% | 3.9 47% | 6.09 18% | 2.64 64% | 4.6 38% | 3.6 51% |
| Colorchecker dE 2000 max. * | 9.08 | 7.61 16% | 8.85 3% | 7.58 17% | 10 -10% | 5.06 44% | 8.8 3% | 7.5 17% |
| Greyscale dE 2000 * | 6.71 | 5.39 20% | 6.23 7% | 4.16 38% | 5.36 20% | 2.8 58% | 4 40% | 4.3 36% |
| Gamma | 2.74 80% | 2.12 104% | 2.5 88% | 2.31 95% | 2.01 109% | 2.16 102% | 2.34 94% | 2.1 105% |
| CCT | 7222 90% | 7404 88% | 6506 100% | 6514 100% | 7230 90% | 6999 93% | 7304 89% | 6572 99% |
| Color Space (Percent of AdobeRGB 1998) (%) | 50.48 | 62.7 24% | 59 17% | 57.5 14% | 62.25 23% | 60.9 21% | 57.9 15% | 62.3 23% |
| Color Space (Percent of sRGB) (%) | 73.31 | 99.8 36% | 90 23% | 88.7 21% | 97.54 33% | 94.3 29% | 88.7 21% | 95.7 31% |
| Total Average (Program / Settings) | 9% /
15% | 16% /
12% | 8% /
11% | 5% /
1% | 7% /
15% | -12% /
-5% | 10% /
7% |
* ... smaller is better
The difference in brightness between the review notebook and the XPS 13 with FHD screen and i7 CPU (325 cd/m² vs. 350 cd/m²) and in contrast (1801:1 vs. 2265:1) can likely be attributed to panel variation and the aforementioned use of CABC-technology, which has been a recurring issue with the XPS 13 and also XPS 15 InfinityEdge models. The color space coverage on the other hand is vastly different: while the review notebook only covers about 73 % of sRGB, the XPS with the older i7 CPU managed almost 100 %.
It's a pity in our opinion that the newer FHD panel is not nearly as bright as the first XPS 13 FHD display Dell made available in early 2015, which reached 405 nits.
Note: at this time, we're unsure about the cause of the gamut discrepancies between the supposedly identical display panels. We will continue tests with future models of the XPS 13.
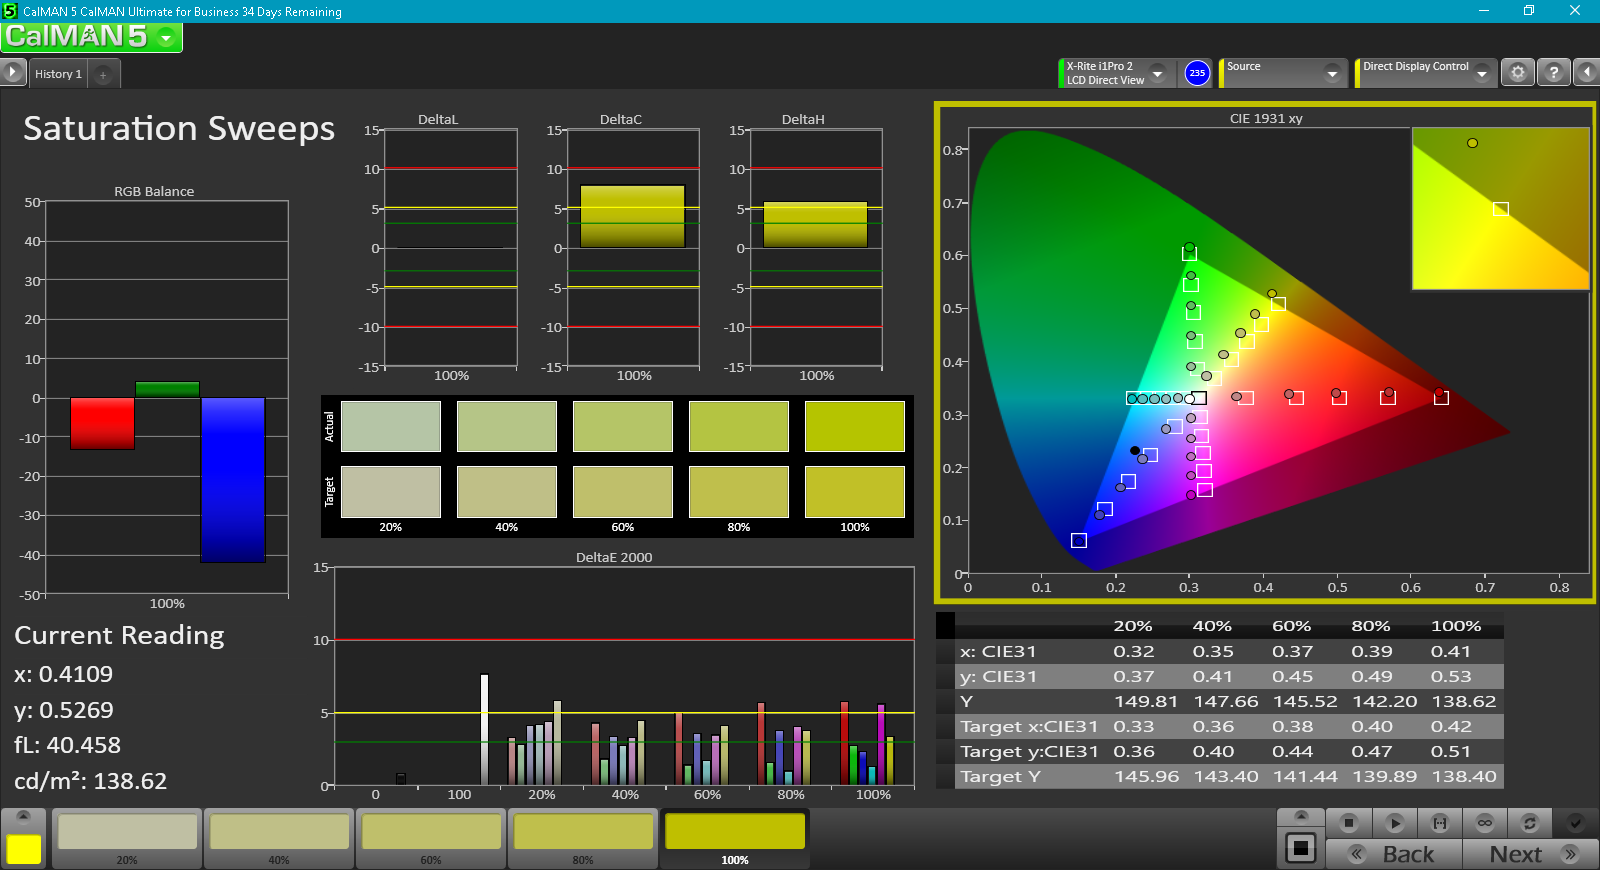
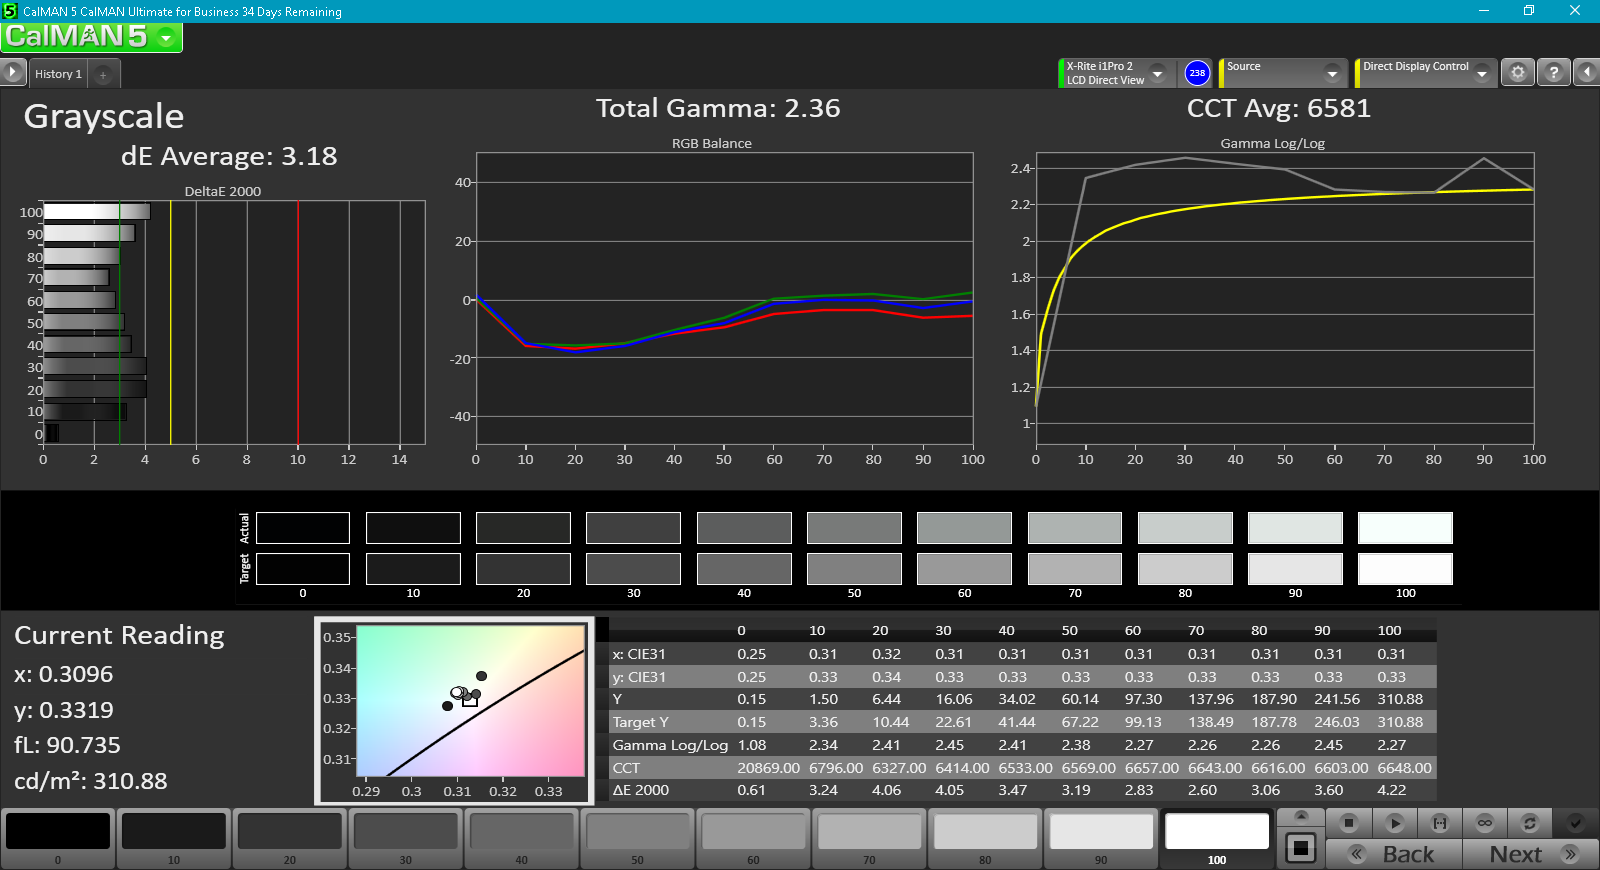
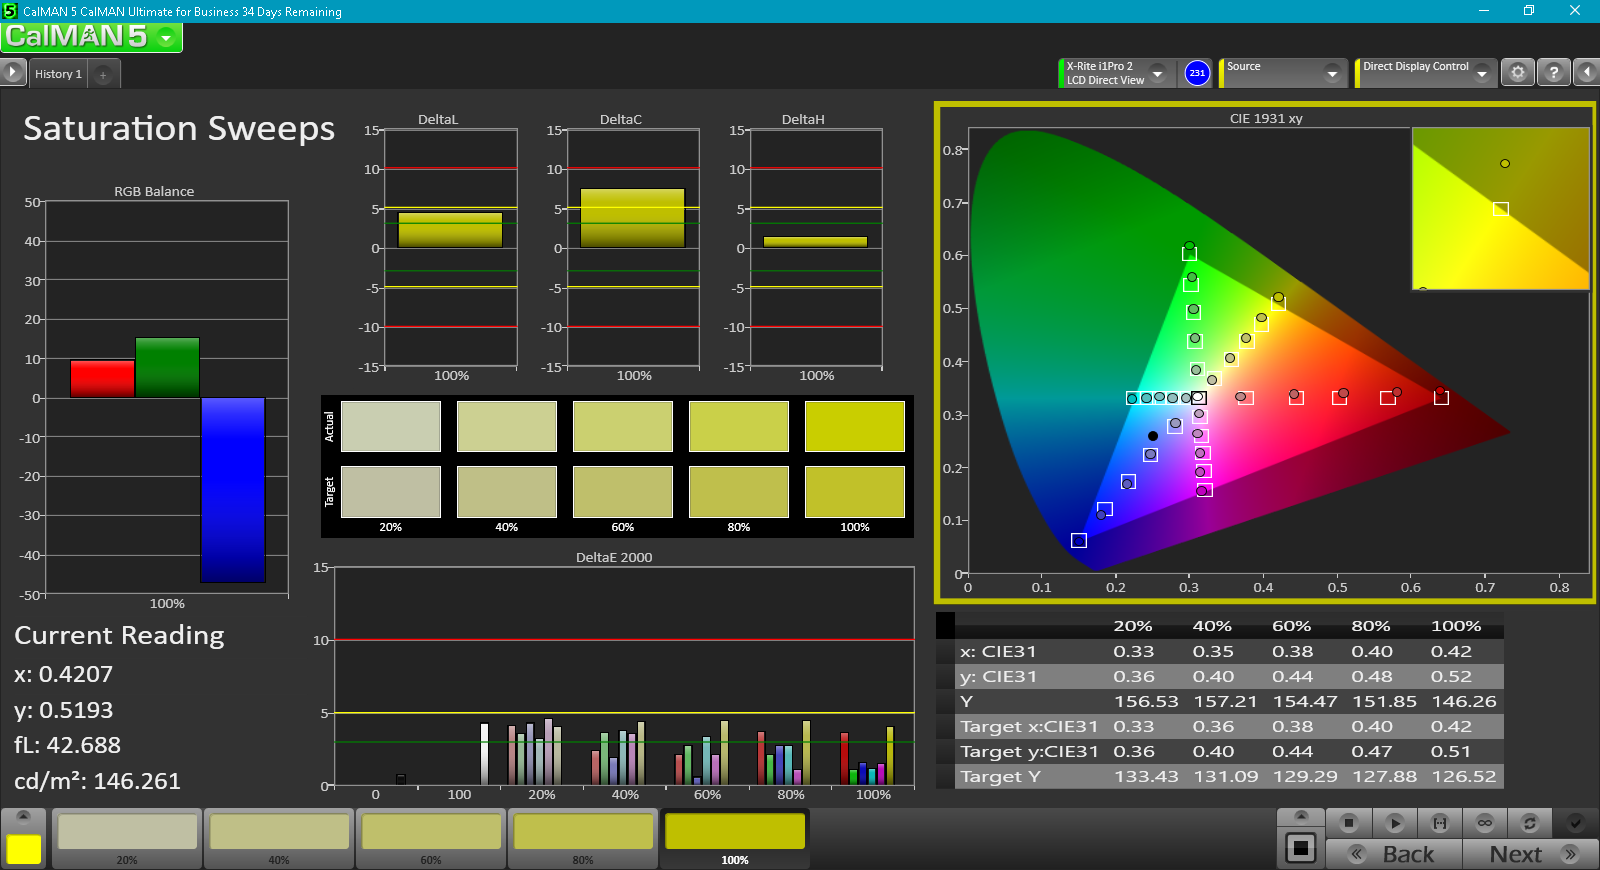
We use the CalMAN 5 software and a colorimeter to determine how accurate the panel is in terms of color reproduction. The average DeltaE of 6.7 for grayscale and the color-DeltaE average of 7.4 are a little worse than those of the competitors. With DeltaE deviations of under 3 for both color and grayscale, the HP Spectre 13 is head and tails above the other subnotebooks. The panel responds reasonably well to calibration with average DeltaEs at just slightly above 3 afterwards, although orange/yellow remains an outlier with a DeltaE of closer to 7. In its uncalibrated state, we noticed a slight bluish color cast. For photo editing, the HP Spectre 13 is the most viable choice - not only because its colors are the most accurate, but also because it features almost full coverage of the sRGB color space. For every day use, the XPS 13 is certainly sufficient.

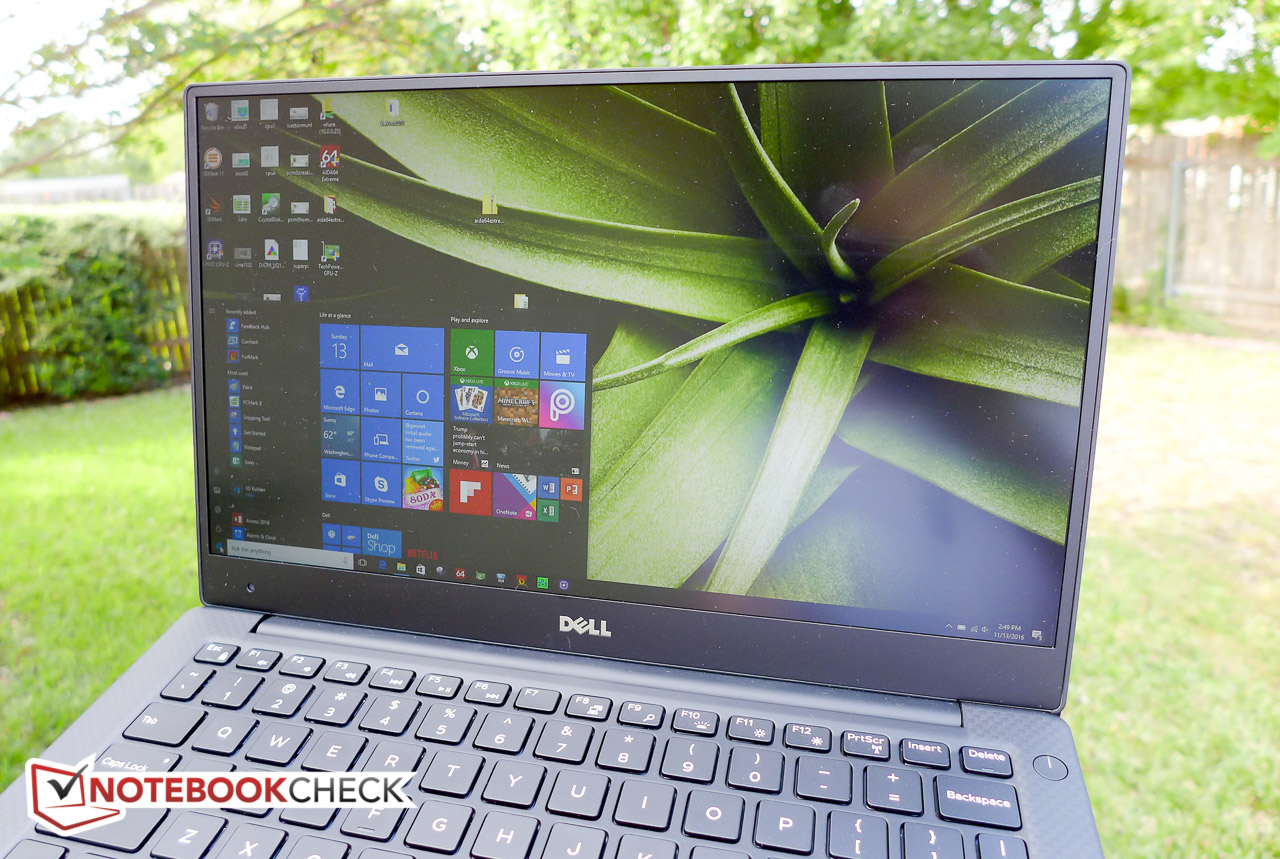
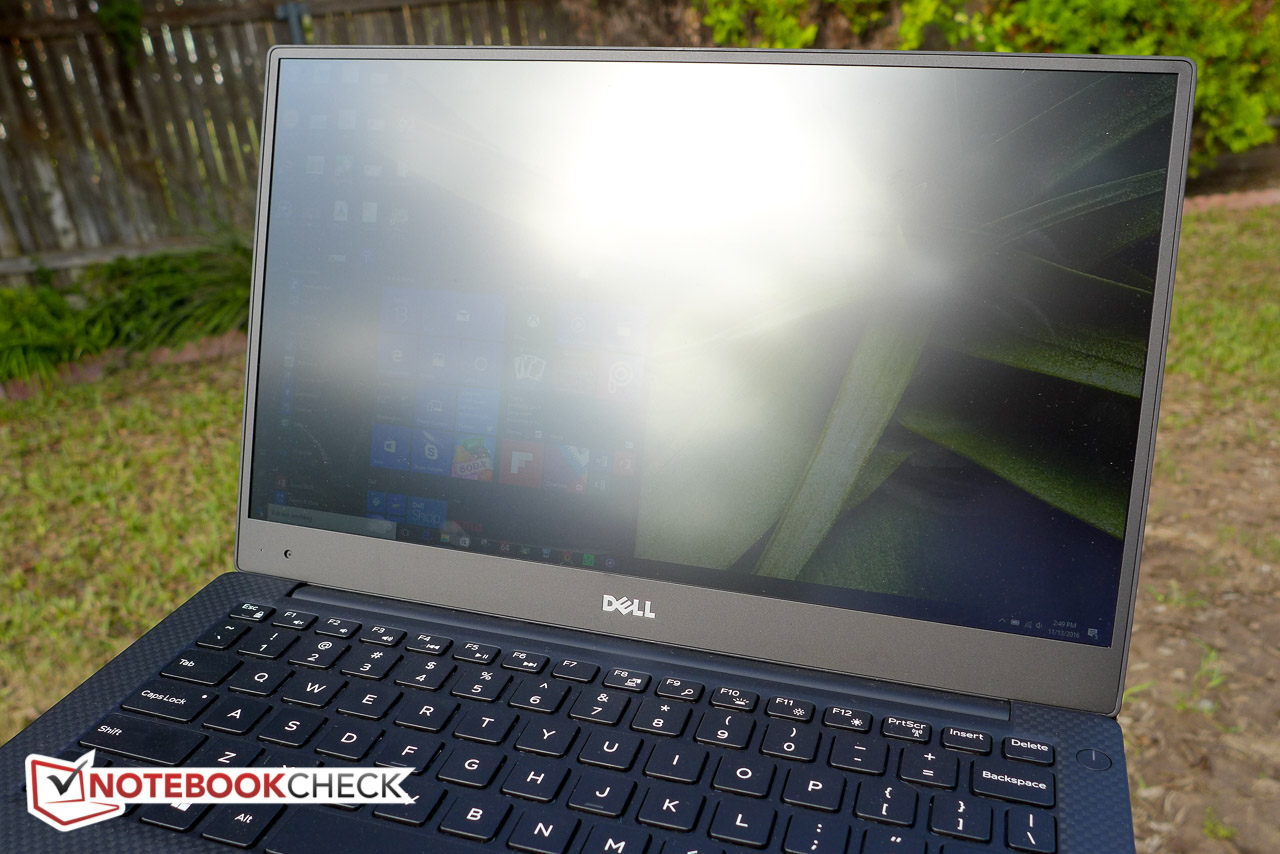
Outdoors visibility is decent despite the reduced brightness compared to the FHD model from 2015. Working with the laptop in the shade is no problem whatsoever and even on overcast days we could easily find a workable display position. Even very bright non-glare displays generally can't overcome direct sunlight, so it comes as no surprise that the Dell display is all but unreadable under such conditions.
Display Response Times
| ↔ Response Time Black to White | ||
|---|---|---|
| 33.2 ms ... rise ↗ and fall ↘ combined | ↗ 10.8 ms rise |  |
| ↘ 22.4 ms fall | ||
| The screen shows slow response rates in our tests and will be unsatisfactory for gamers. In comparison, all tested devices range from 0.1 (minimum) to 240 (maximum) ms. » 90 % of all devices are better. This means that the measured response time is worse than the average of all tested devices (19.9 ms). | ||
| ↔ Response Time 50% Grey to 80% Grey | ||
| 32.8 ms ... rise ↗ and fall ↘ combined | ↗ 16 ms rise | 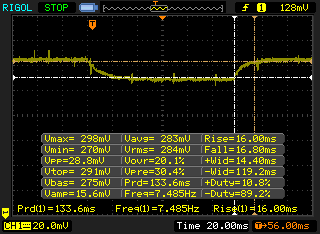 |
| ↘ 16.8 ms fall | ||
| The screen shows slow response rates in our tests and will be unsatisfactory for gamers. In comparison, all tested devices range from 0.165 (minimum) to 636 (maximum) ms. » 44 % of all devices are better. This means that the measured response time is similar to the average of all tested devices (31.1 ms). | ||
Screen Flickering / PWM (Pulse-Width Modulation)
| Screen flickering / PWM not detected | 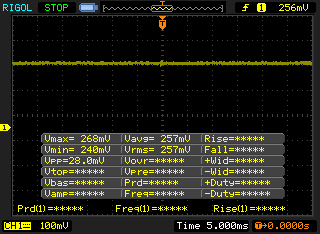 | ||
In comparison: 52 % of all tested devices do not use PWM to dim the display. If PWM was detected, an average of 7810 (minimum: 5 - maximum: 343500) Hz was measured. | |||
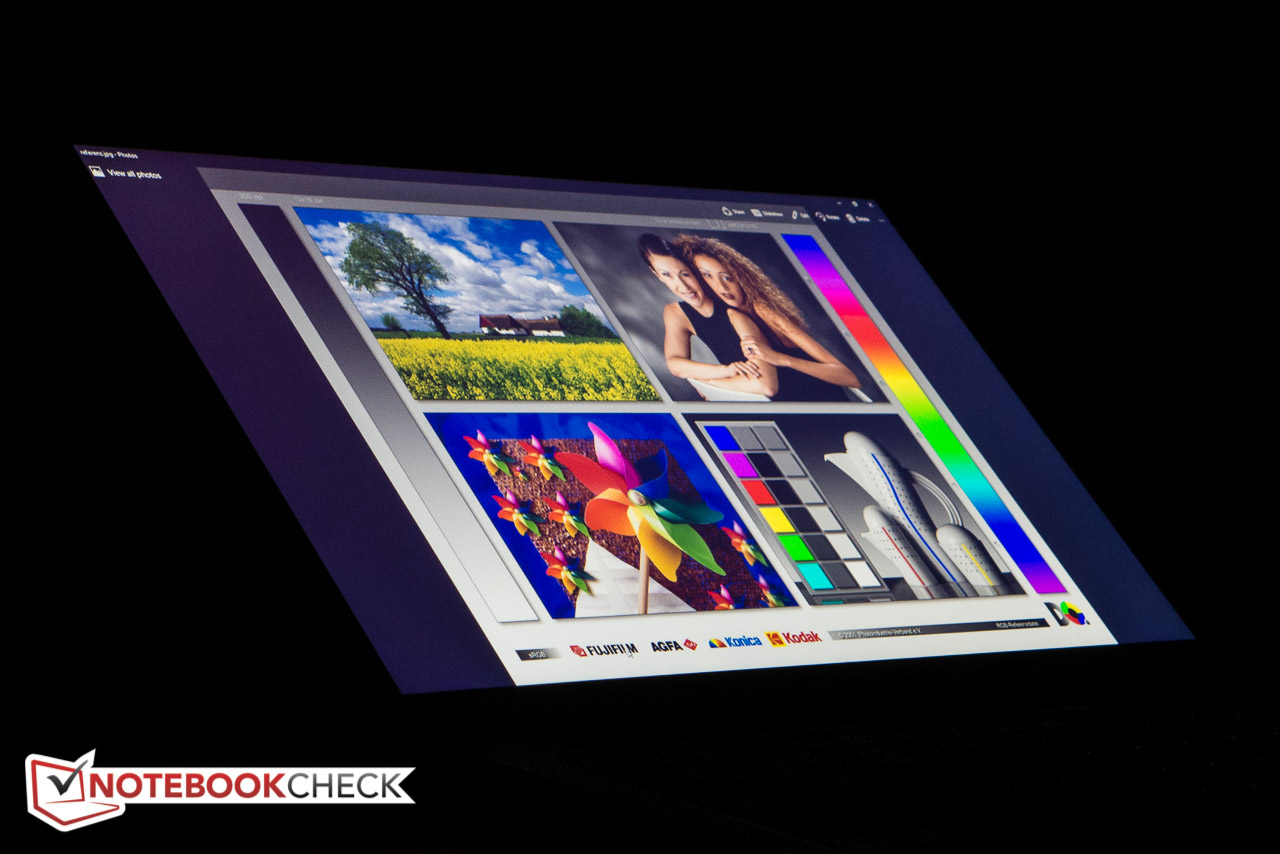
As it is typical for IPS displays, the viewing angle stability is quite good with no occurrence of significant color changes or even inversions at all angles. Even at very shallow angle, the screen content still remains readable, although the brightness naturally decreases when moving significantly away from the center line. Even so, the display is very well suited for sharing movies or the screen content in general. The FHD display has an advantage here over the QHD+ brother as well as it is matte, so reflections are less of an issue.
Performance
At the time of writing, the XPS 13 is available with three different Kaby Lake processors: the Core i3-7100U, the i5-7200U and the i7-7500U. The i3 model tops out at 4 GB of RAM and a 128 GB SSD, while the version with i5 processor can be paired up with up to 8 GB of LPDDR3 RAM and a 256 GB SSD. Both the i5 as well as the i7 version can be equipped with the QHD+ display, although the highest compliment of RAM (16 GB) and the largest hard drive (1 TB SSD) are reserved for the i7 model.
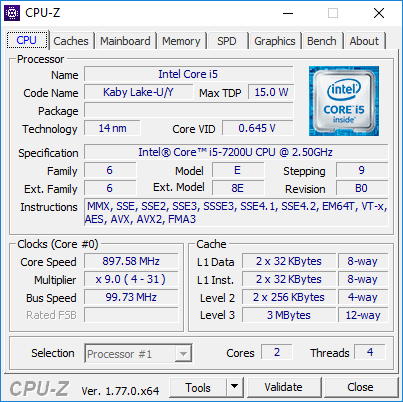
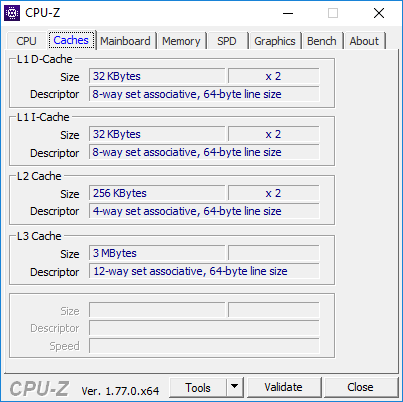
Processor
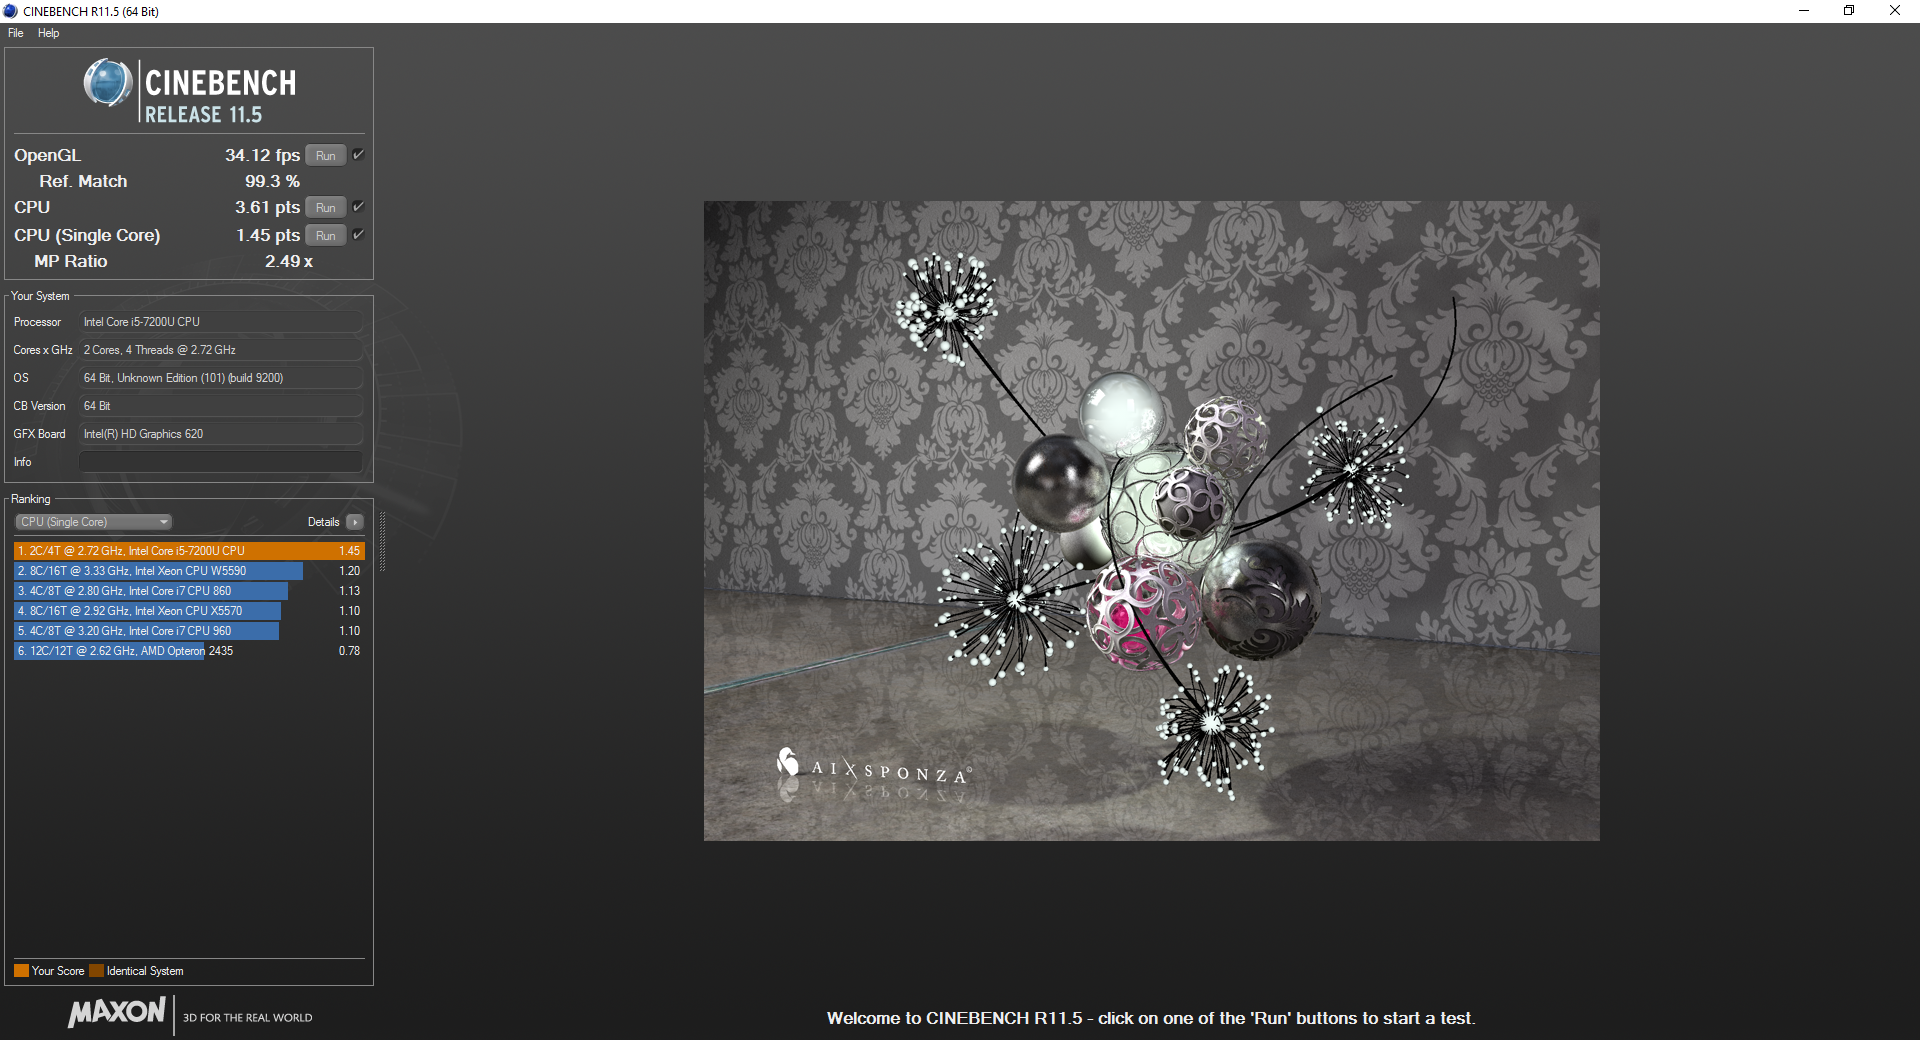
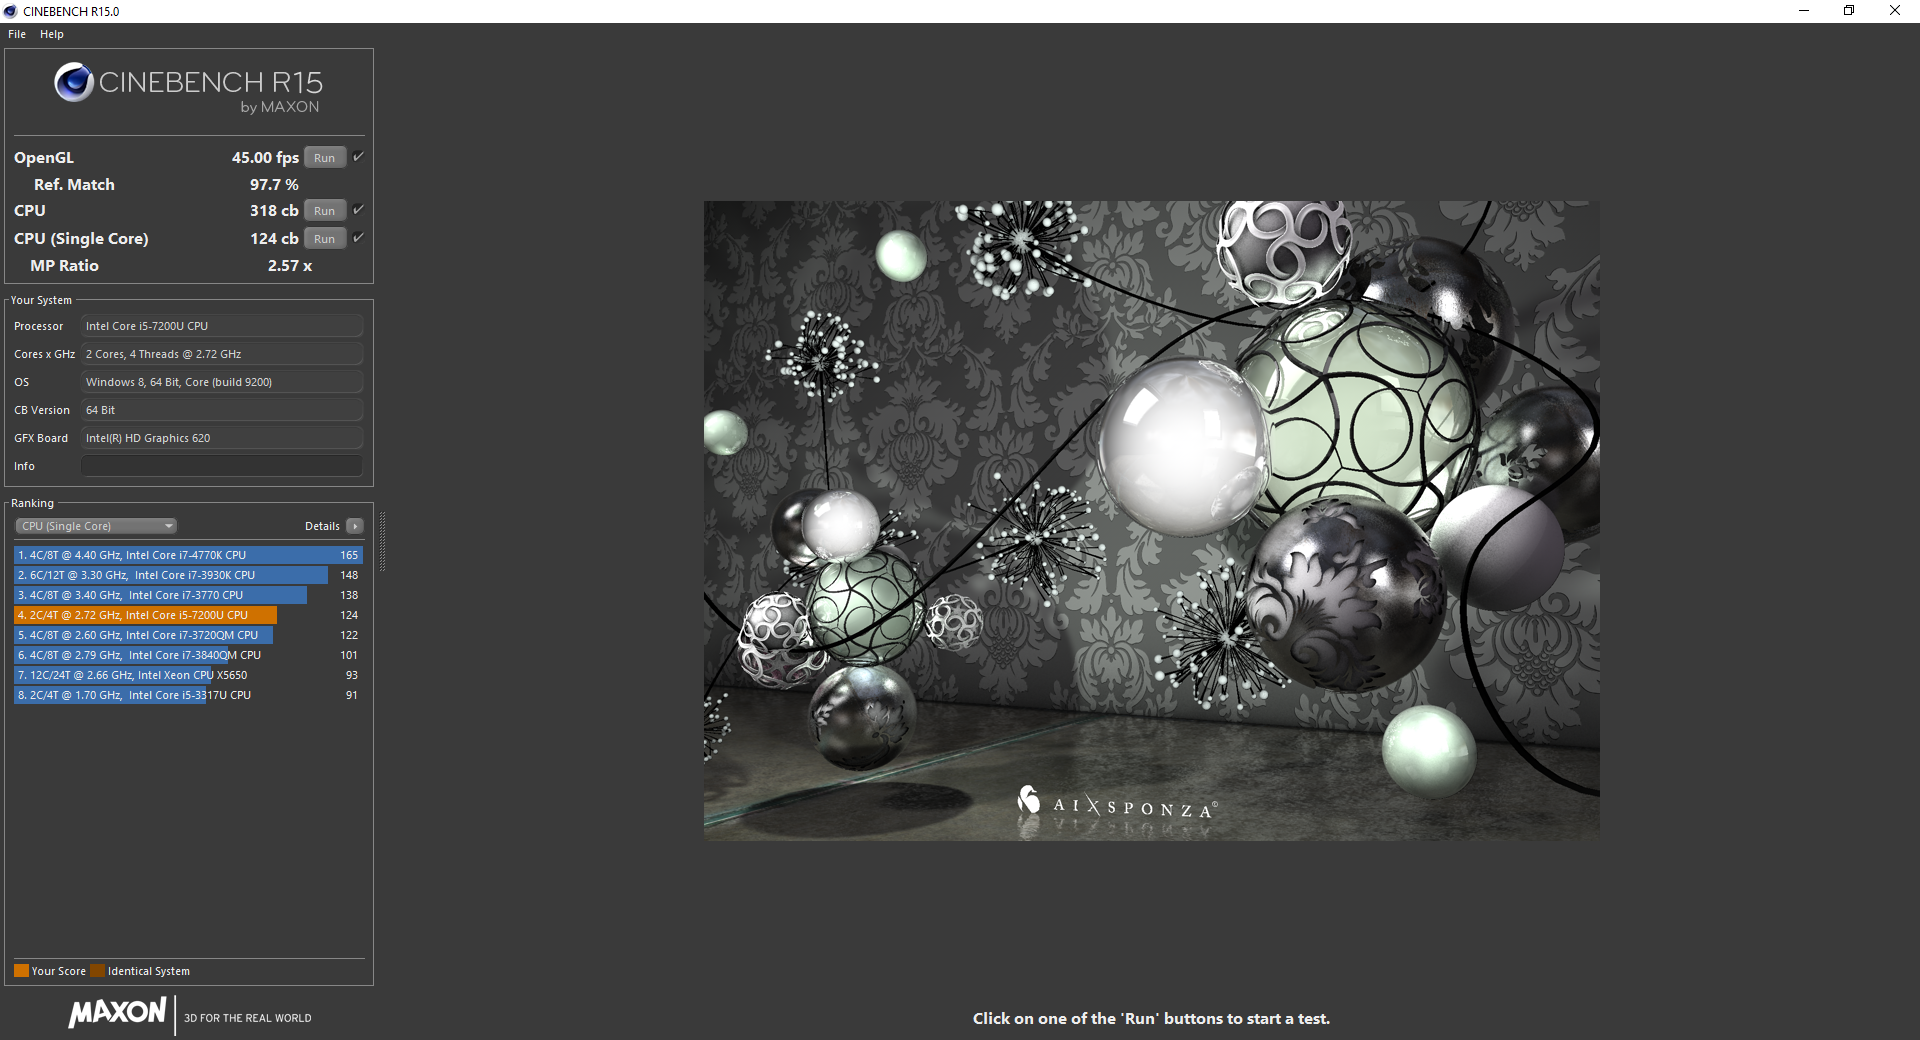
According to our synthetic Cinebench benchmark test results, the Kaby Lake dual-core i5-7200U - clocked at 2.5 - 3.1 GHz - generally delivers performance within a percentage point of the previous-generation i7-6500U in the HP Spectre 13 or the Asus Zenbook UX330UA. This is good news, as the i5-7200 didn't reach it's full potential when we conducted our test of the 2016-version of the XPS 13 with QHD+ display. The current-generation Intel Core i7-7500U in the Dell XPS 13 9360 QHD+ pulls ahead by only about 10 %, but costs a hefty $200 more. The new i5-7200U performs about 6 - 10 % faster than the previous-generation i5-6200U.
In one of our earlier reviews we noted that that particular XPS 13 shipped with only two Windows power plans - Dell and Balanced. This is also the case for the review model. We enabled the other power plans via a registry setting to allow for a fair comparison of the performance and the battery life.
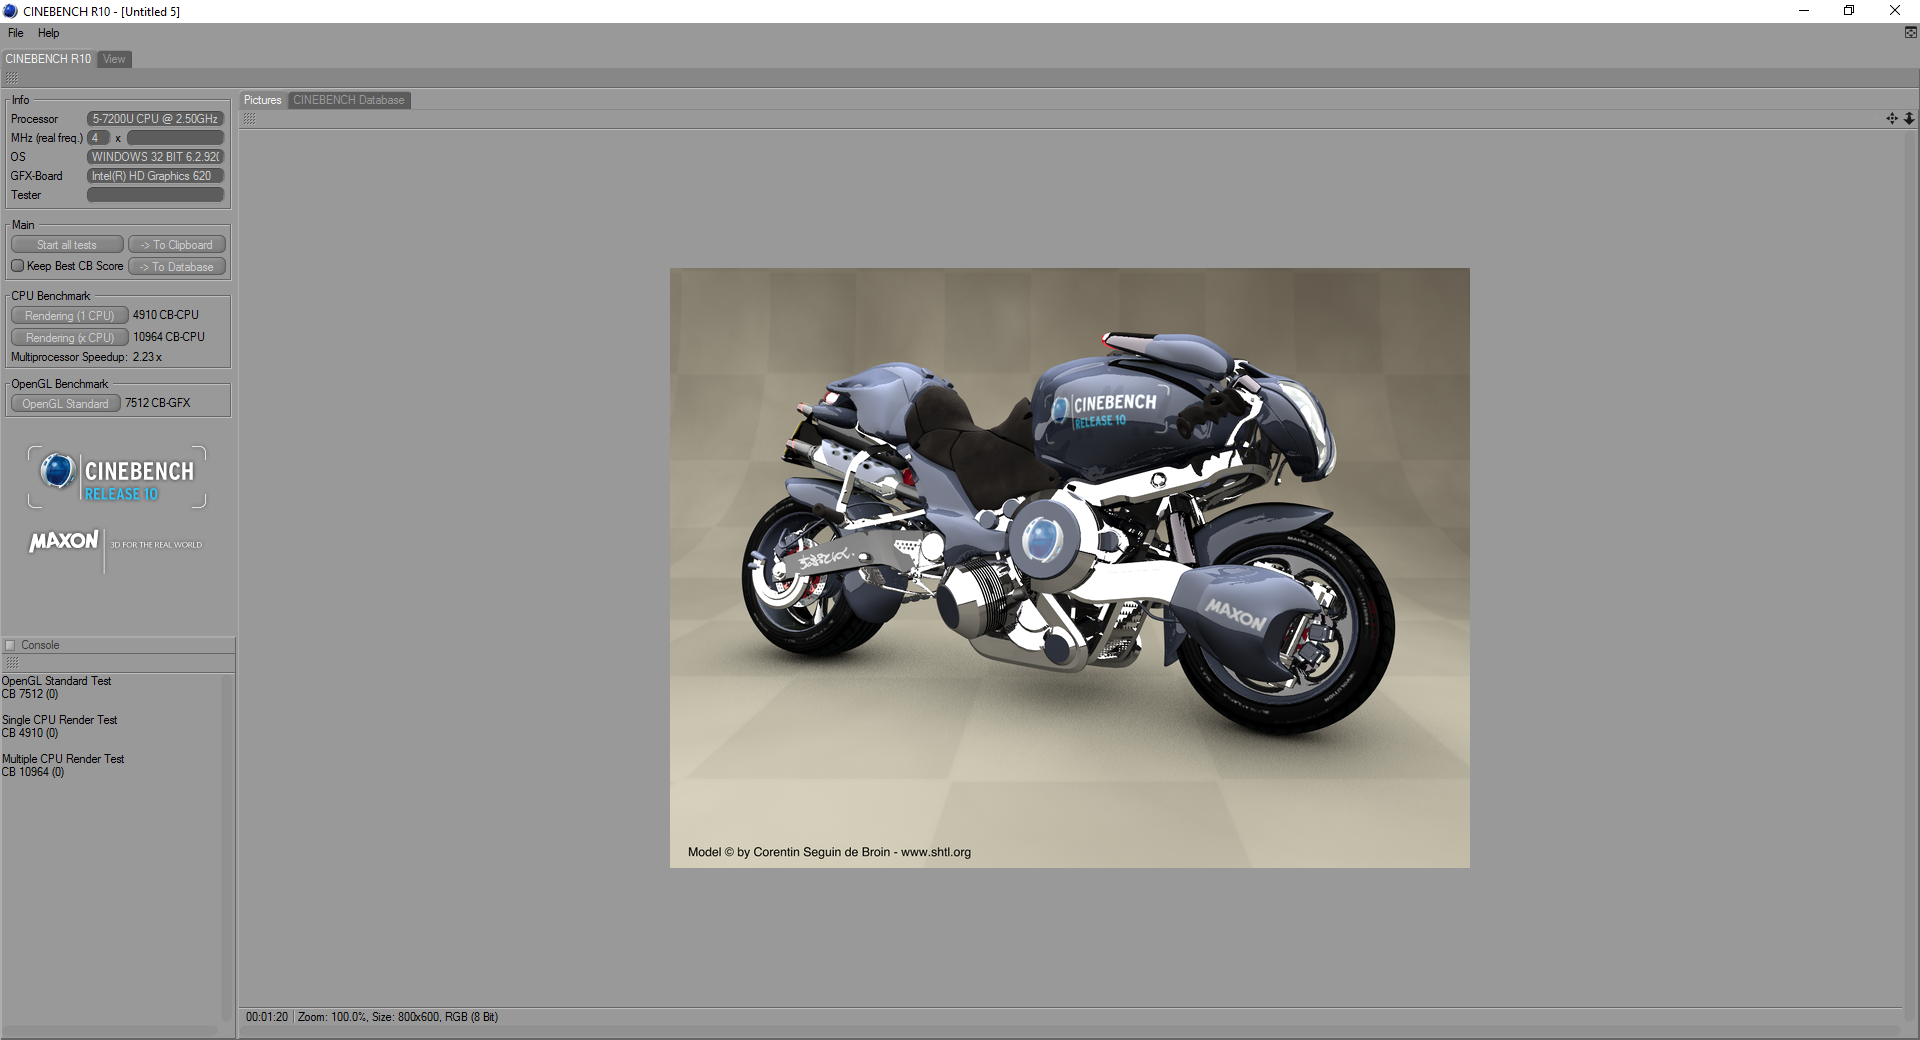
| Cinebench R10 | |
| Rendering Multiple CPUs 32Bit | |
| Dell XPS 13 9360 QHD+ i7 | |
| Dell XPS 13 9360 FHD i5 | |
| HP Spectre 13 | |
| Rendering Single 32Bit | |
| Dell XPS 13 9360 QHD+ i7 | |
| Dell XPS 13 9360 FHD i5 | |
| HP Spectre 13 | |
| wPrime 2.10 - 1024m | |
| Dell XPS 13 9360 QHD+ i5 | |
| HP Spectre 13 | |
| Dell XPS 13 9360 QHD+ i7 | |
| Super Pi Mod 1.5 XS 32M - 32M | |
| HP Spectre 13 | |
| Dell XPS 13 9360 FHD i5 | |
| Dell XPS 13 9360 QHD+ i7 | |
* ... smaller is better
System Performance
We use the PCMark benchmark tests to rank the overall system performance. The XPS 13 does very well and generally performs on par with the HP Spectre 13 with i7-6500U. Only the Lenovo IdeaPad 710S-13ISK with dual-core Intel Core i7-6560U and integrated graphics Intel Iris 540 outperforms it by about 10 % depending on the test selected.
Subjective system performance is very fast thanks to the snappy CPU and quick SSD. During our time with the notebook we never experienced any crashes or significant performance lags.
| PCMark 8 Home Score Accelerated v2 | 3535 points | |
| PCMark 8 Creative Score Accelerated v2 | 4211 points | |
| PCMark 8 Work Score Accelerated v2 | 4568 points | |
Help | ||
Storage Devices
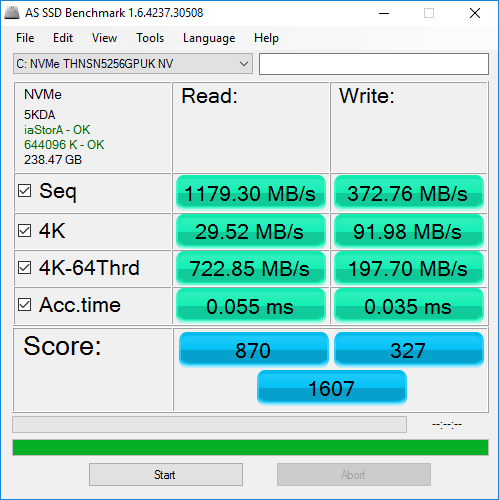
Just like the XPS 13 with QHD+ display, our XPS 13 comes with a 256 GB Toshiba NVMe SSD. The previous versions - for example the XPS 13 9350 2016 (FHD, i7-6560U) - came with drives from Samsung. We should point out that i3-version of the XPS 13 still uses the slower AHCI-interface for its 128 GB SSD and not NVMe PCIe, so its hard drive performance will likely be much slower.
Performance of the drive compared to the same unit in the XPS 13 with QHD+ display should be pretty close, but in fact our review unit lags behind a little. We don't think the difference is significant, since the results between machines can vary by quite a bit depending on what background processes are running during the test.
Please check out our table of HDDs and SSDs for more comparisons and benchmark results.
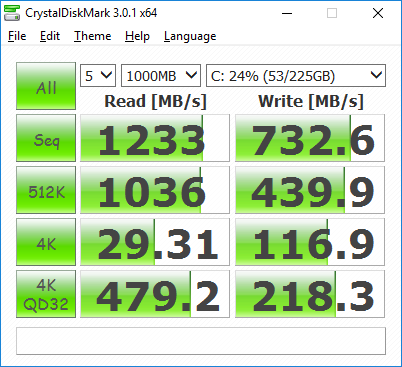

| Dell XPS 13 9360 FHD i5 Toshiba NVMe THNSN5256GPUK | HP Spectre 13 Samsung PM951 NVMe MZVLV256 | Acer Aspire S 13 S5-371-71QZ LiteOn CV1-8B512 | Asus Zenbook UX330UA-FC059T SanDisk SD8SNAT256G1002 | Lenovo IdeaPad 710S-13ISK Samsung PM951 NVMe MZVLV256 | Razer Blade Stealth QHD i7-7500U Samsung PM951 NVMe MZVLV256 | Dell XPS 13 9360 QHD+ i7 Toshiba NVMe THNSN5256GPUK | |
|---|---|---|---|---|---|---|---|
| CrystalDiskMark 3.0 | -9% | -31% | -46% | -1% | -0% | 1% | |
| Read Seq (MB/s) | 1233 | 1322 7% | 502 -59% | 447.6 -64% | 1193 -3% | 1178 -4% | 1214 -2% |
| Write Seq (MB/s) | 733 | 305.5 -58% | 418.9 -43% | 309.4 -58% | 309.6 -58% | 305.4 -58% | 655 -11% |
| Read 512 (MB/s) | 1036 | 621 -40% | 341.3 -67% | 265.9 -74% | 613 -41% | 638 -38% | 1019 -2% |
| Write 512 (MB/s) | 439.9 | 306 -30% | 389.7 -11% | 275.2 -37% | 311 -29% | 305.7 -31% | 445.7 1% |
| Read 4k (MB/s) | 29.31 | 40.09 37% | 29.69 1% | 18.89 -36% | 42.43 45% | 38.54 31% | 35.55 21% |
| Write 4k (MB/s) | 116.9 | 119 2% | 86.8 -26% | 75.1 -36% | 144.9 24% | 153.4 31% | 130 11% |
| Read 4k QD32 (MB/s) | 479.2 | 513 7% | 301.3 -37% | 142.2 -70% | 549 15% | 614 28% | 537 12% |
| Write 4k QD32 (MB/s) | 218.3 | 231.5 6% | 211.2 -3% | 228.9 5% | 311.3 43% | 302.7 39% | 173.8 -20% |

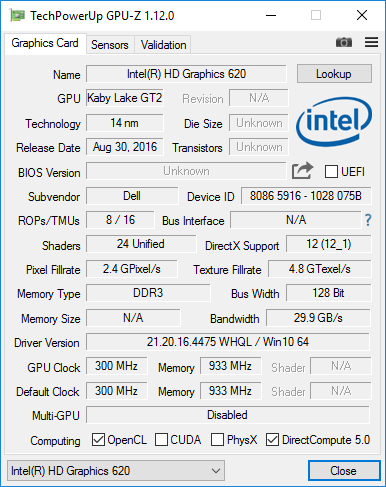
GPU Performance
The processor-integrated Intel HD 620 outperforms the predecessor HD 520 in the HP Spectre 13 only by about 5 % according to the 3DMark 13 and 3DMark 11 benchmark tests. The Intel Iris 540 in the Lenovo IdeaPad 710S-13ISK and the XPS 13 9350 QHD+ Core i7-6560U is markedly faster and outperforms the HD 620 by 20 - 40 %. The XPS 13 QHD+ version with i7 CPU also comes with the HD 620 and doesn't really offer better performance.
| 3DMark | |
| 1280x720 Cloud Gate Standard Graphics | |
| Lenovo IdeaPad 710S-13ISK | |
| Dell XPS 13 2016 9350 (FHD, i7-6560U) | |
| Dell XPS 13 9360 FHD i5 | |
| Dell XPS 13 9360 QHD+ i7 | |
| Asus Zenbook UX330UA-FC059T | |
| HP Spectre 13 | |
| Dell XPS 13 9360 QHD+ i5 | |
| 1920x1080 Fire Strike Graphics | |
| Dell XPS 13 2016 9350 (FHD, i7-6560U) | |
| Dell XPS 13 9360 FHD i5 | |
| Dell XPS 13 9360 QHD+ i7 | |
| Dell XPS 13 9360 QHD+ i5 | |
| HP Spectre 13 | |
| 3DMark 11 Performance | 1699 points | |
| 3DMark Ice Storm Standard Score | 64297 points | |
| 3DMark Cloud Gate Standard Score | 6349 points | |
| 3DMark Fire Strike Score | 892 points | |
| 3DMark Fire Strike Extreme Score | 405 points | |
Help | ||
Gaming Performance
As expected, the gaming performance is fairly modest. Older games play stutter-free at lower to medium settings. The Razer Blade Stealth with its Razer Core is the much better choice if gaming with a subnotebook is on the agenda.
| Tomb Raider | |
| 1024x768 Low Preset (sort by value) | |
| Dell XPS 13 9360 FHD i5 | |
| 1366x768 Normal Preset AA:FX AF:4x (sort by value) | |
| Dell XPS 13 9360 FHD i5 | |
| 1366x768 High Preset AA:FX AF:8x (sort by value) | |
| Dell XPS 13 9360 FHD i5 | |
| 1920x1080 Ultra Preset AA:FX AF:16x (sort by value) | |
| Dell XPS 13 9360 FHD i5 | |
| low | med. | high | ultra | |
|---|---|---|---|---|
| Tomb Raider (2013) | 83.8 | 42.6 | 25.9 | 12 |
| GRID 2 (2013) | 79.7 | 46.4 | 33.7 | 12.5 |
Stress Test
We use the tools Prime95 and Furmark to stress the CPU and GPU and to check for throttling and stability issues. At the start of the CPU stress test with Prime95, the cores ran at 3.1 GHz at a temperature of 37 C. Within 10 seconds, the temperature had increased to 70 degrees C and kept climbing until the fan kicked in at about 89 - 90 degrees C. About 5 minutes later, the fan speed increased from 3600 to 4400 RPM with the CPU running between 2.9-3.0 GHz and the temperature between 84 - 86 degrees C. A few minutes later, the fan speed increased once again - this time to 5000 RPM - with both the clock speed and the temperature unaffected.
With only Furmark running, the integrated GPU started out at 1000 MHz with the temps rapidly increasing to 86 degrees, at which point the fan started up and stabilized at 3600 RPM. The fan speed increased again to 4400 RPM and then to 5000 RPM after a few minutes with the GPU running at 950 with dips to 900 MHz. The temperature stabilized at 78 degrees C.
With both Prime95 and Furmark running in parallel, we saw an immediate drop of the CPU speed to 1.4 GHz while the GPU maintained about 900 MHz with the fan running at 3600 RPM. Two minutes later, the fan speed increased to 4400 RPM and once again had topped out at 5000 RPM about 8 minutes later. The CPU maintained 1.4 GHz at about 77 degrees C with the GPU running at about 900 MHz from this point on forward. CPU throttling is clearly an issue, although we should point out that our stress test simulates a highly unlikely scenario which isn't encountered during normal use.
According to a quick test with PCMark 11, the notebook does not lose performance when running on battery power. The score results are nearly identical.
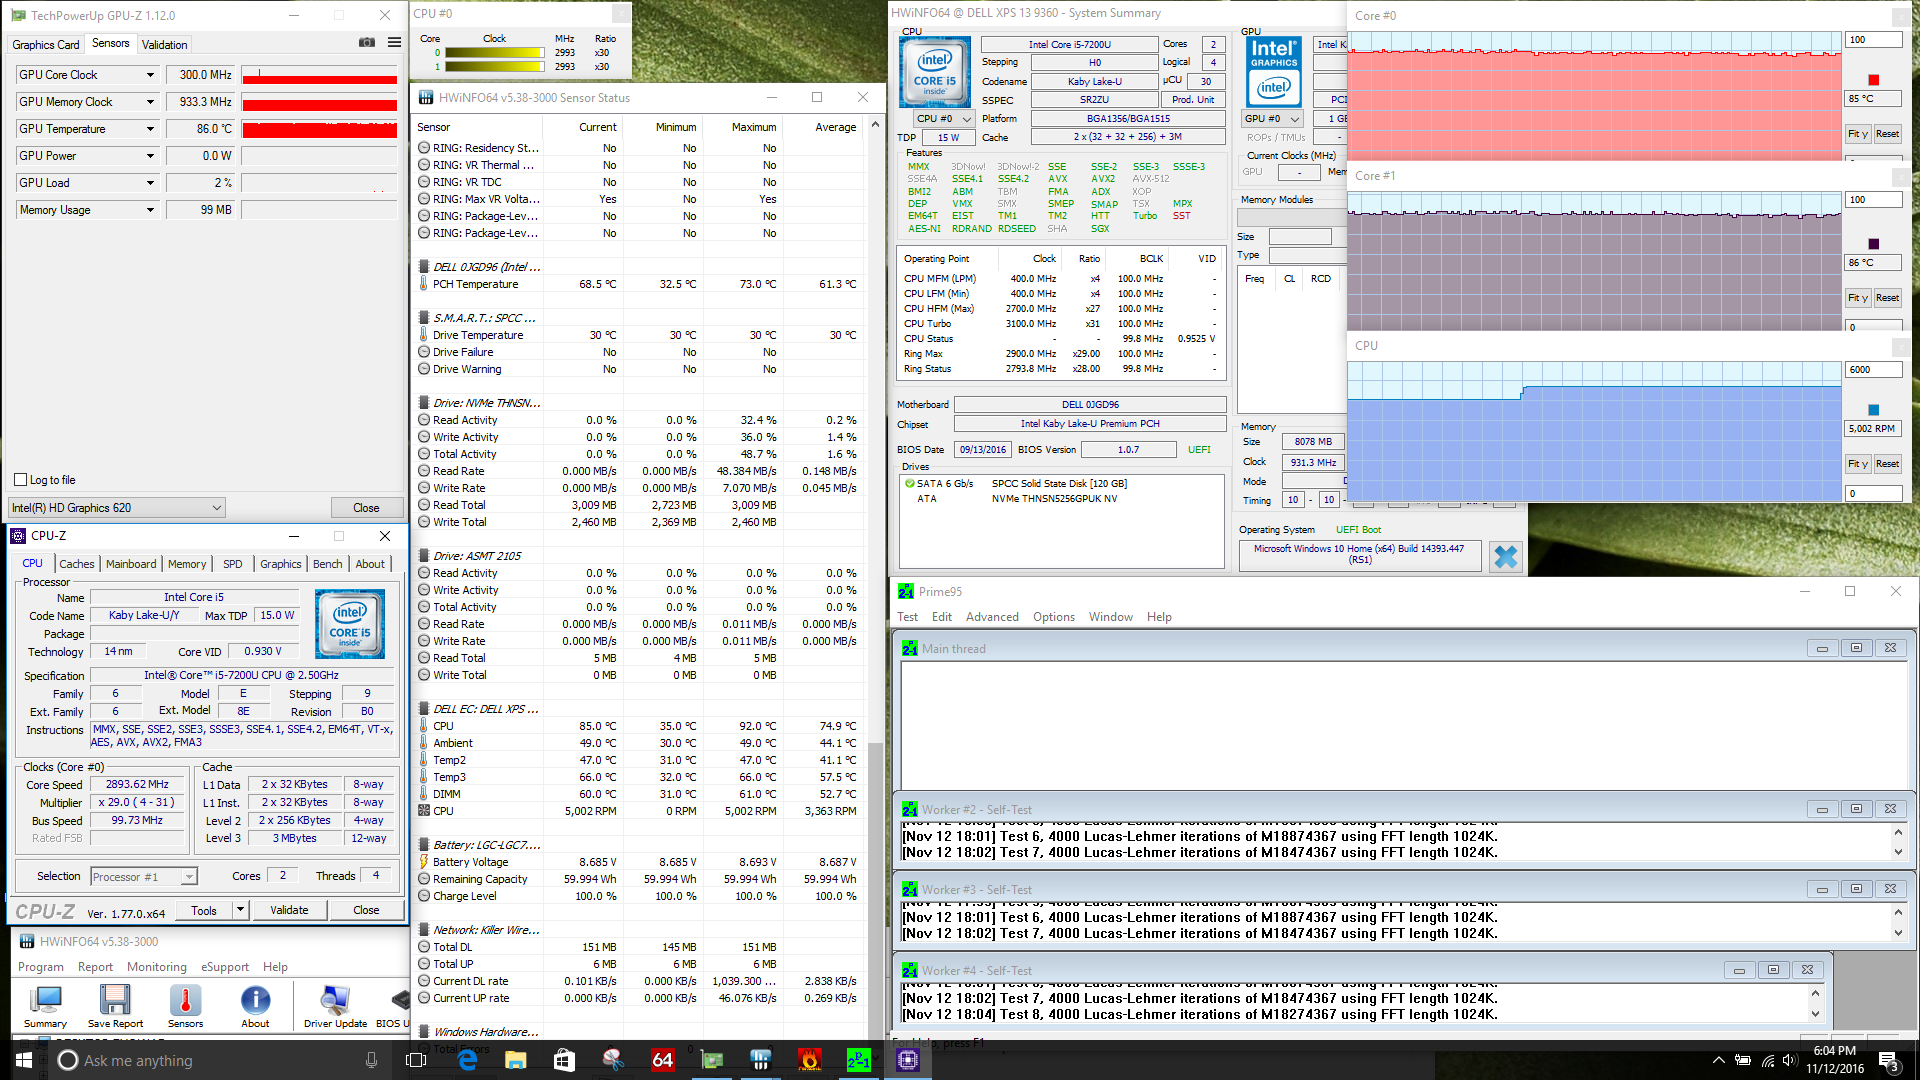
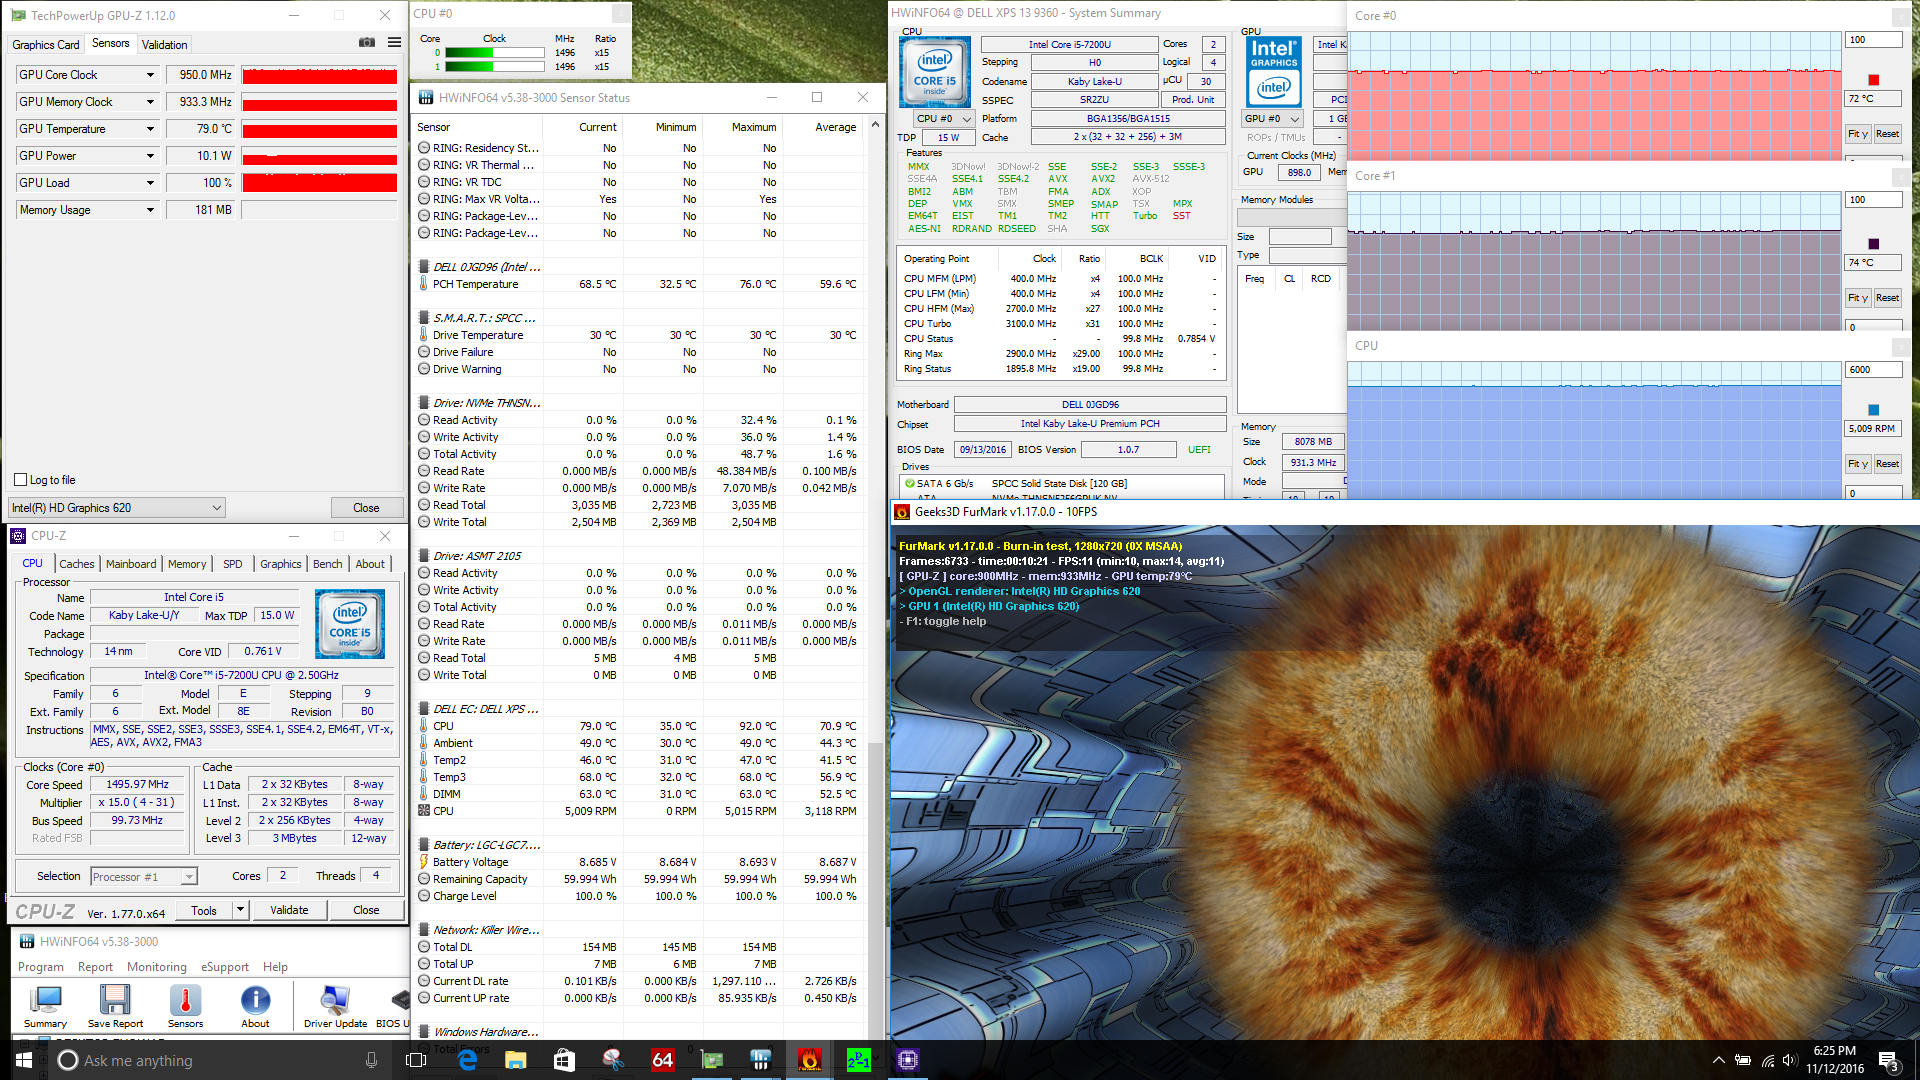
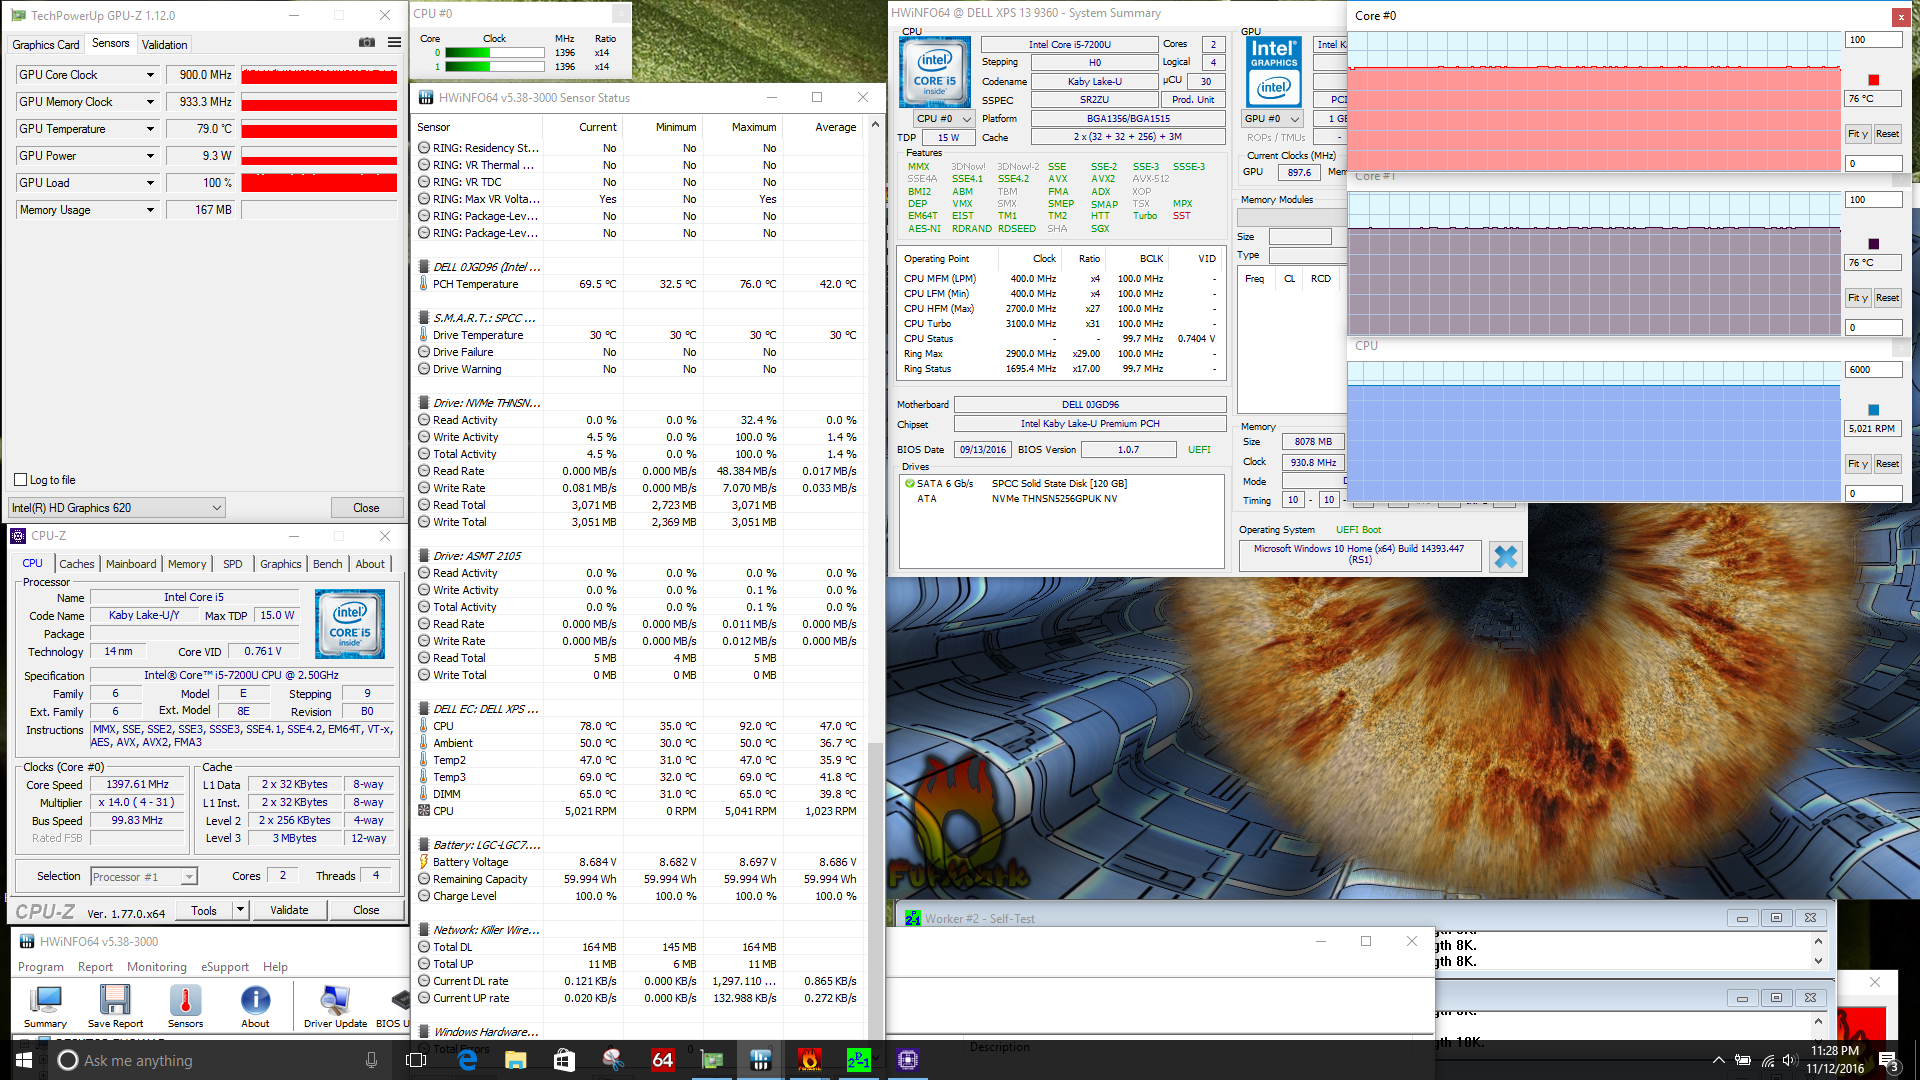
| CPU Clock (GHz) | GPU Clock (MHz) | Average CPU Temperature (°C) | Average GPU Temperature (°C) | |
| Prime95 Stress | 3.0 | - | 85 | - |
| FurMark Stress | - | 950 | - | 78 |
| Prime95 + FurMark Stress | 1.4 | 900 | 76 | 79 |
Emissions
System Noise
During idle and while performing moderate tasks like word processing or web browsing, the XPS 13 is more or less not audible above ambient noise. As outlined above, heavy stress causes the fan speed to increase from 3600 to 4400 and subsequently to 5000 RPM. Even under maximum load, the system doesn't get overly noisy, although the fan systems of thinner systems are generally operating at a higher frequency range, which can get annoying after a while. Still, as far as subnotebooks are concerned, the XPS 13 is one of the most quiet systems around. The HP Spectre 13 is at a clear disadvantage because of its extremely thin build and exceeds 41 dB in an attempt to stay cool.
Our review notebook did exhibit coil whine on occasion, although it's not overly loud and noticeable. Still, extremely noise sensitive users might find the high-pitched sound distracting.
Noise level
| Idle |
| 28.9 / 28.9 / 28.9 dB(A) |
| Load |
| 30.9 / 33.5 dB(A) |
 | ||
30 dB silent 40 dB(A) audible 50 dB(A) loud |
||
min: | ||
| Dell XPS 13 9360 FHD i5 HD Graphics 620, i5-7200U, Toshiba NVMe THNSN5256GPUK | HP Spectre 13 HD Graphics 520, 6500U, Samsung PM951 NVMe MZVLV256 | Acer Aspire S 13 S5-371-71QZ HD Graphics 520, 6500U, LiteOn CV1-8B512 | Asus Zenbook UX330UA-FC059T HD Graphics 520, 6500U, SanDisk SD8SNAT256G1002 | Lenovo IdeaPad 710S-13ISK Iris Graphics 540, 6560U, Samsung PM951 NVMe MZVLV256 | Razer Blade Stealth QHD i7-7500U HD Graphics 620, i7-7500U, Samsung PM951 NVMe MZVLV256 | Dell XPS 13 2016 9350 (FHD, i7-6560U) Iris Graphics 540, 6560U, Samsung PM951 NVMe MZ-VLV256D | Dell XPS 13 9360 QHD+ i5 HD Graphics 620, i5-7200U, Toshiba NVMe THNSN5256GPUK | |
|---|---|---|---|---|---|---|---|---|
| Noise | -13% | -10% | -14% | -11% | -11% | -9% | -8% | |
| Idle Minimum * (dB) | 28.9 | 28.5 1% | 31.2 -8% | 31.2 -8% | 30.1 -4% | 31 -7% | 30 -4% | 30.6 -6% |
| Idle Average * (dB) | 28.9 | 30.9 -7% | 31.2 -8% | 31.2 -8% | 30.1 -4% | 31 -7% | 30 -4% | 30.6 -6% |
| Idle Maximum * (dB) | 28.9 | 31.6 -9% | 31.5 -9% | 31.2 -8% | 30.1 -4% | 31 -7% | 30 -4% | 32.2 -11% |
| Load Average * (dB) | 30.9 | 38.8 -26% | 35.7 -16% | 37.4 -21% | 39.2 -27% | 35 -13% | 36.5 -18% | 32.2 -4% |
| Load Maximum * (dB) | 33.5 | 41.4 -24% | 35.8 -7% | 41.4 -24% | 39.3 -17% | 40.5 -21% | 38.3 -14% | 38.5 -15% |
| off / environment * (dB) | 28.5 | 31.2 | 31.2 | 29 | 31 | 30 | 30.3 |
* ... smaller is better
Temperature
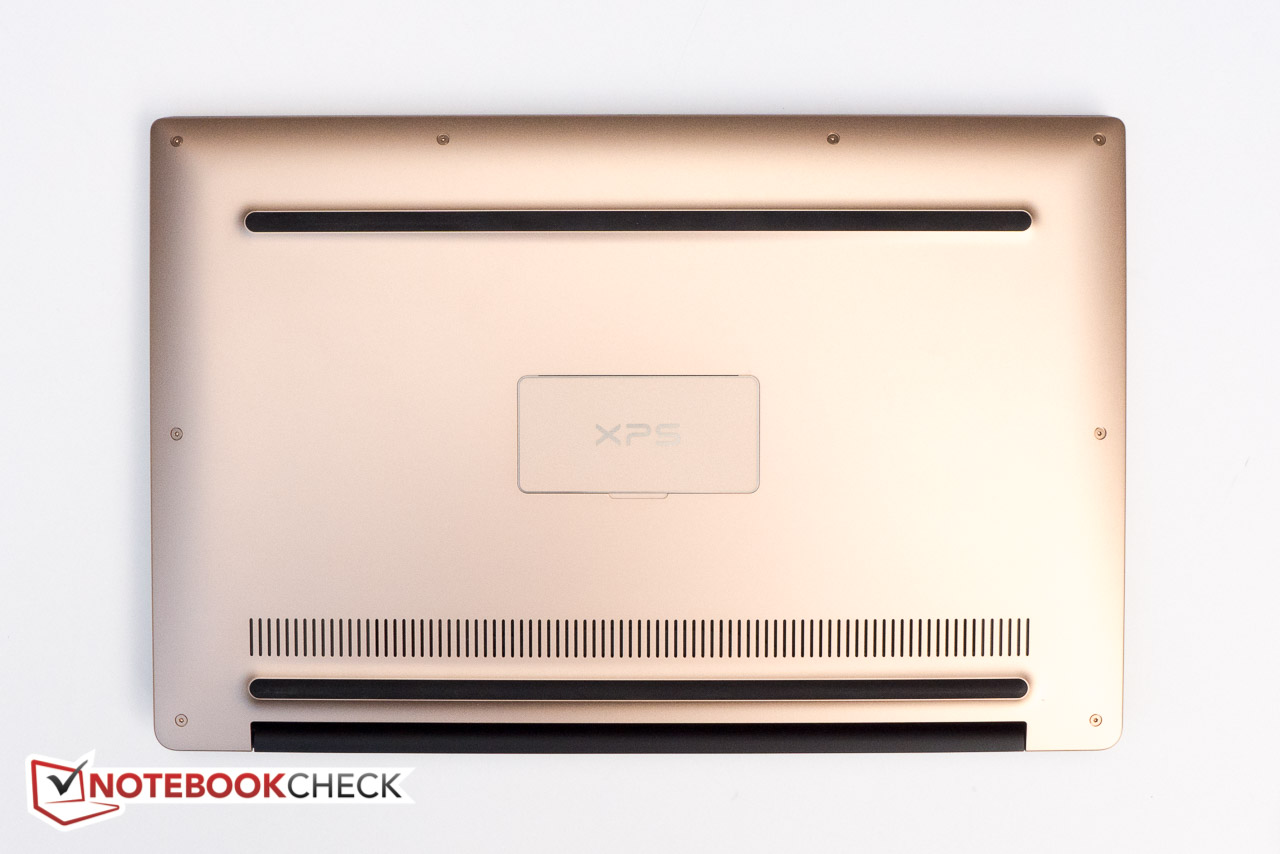
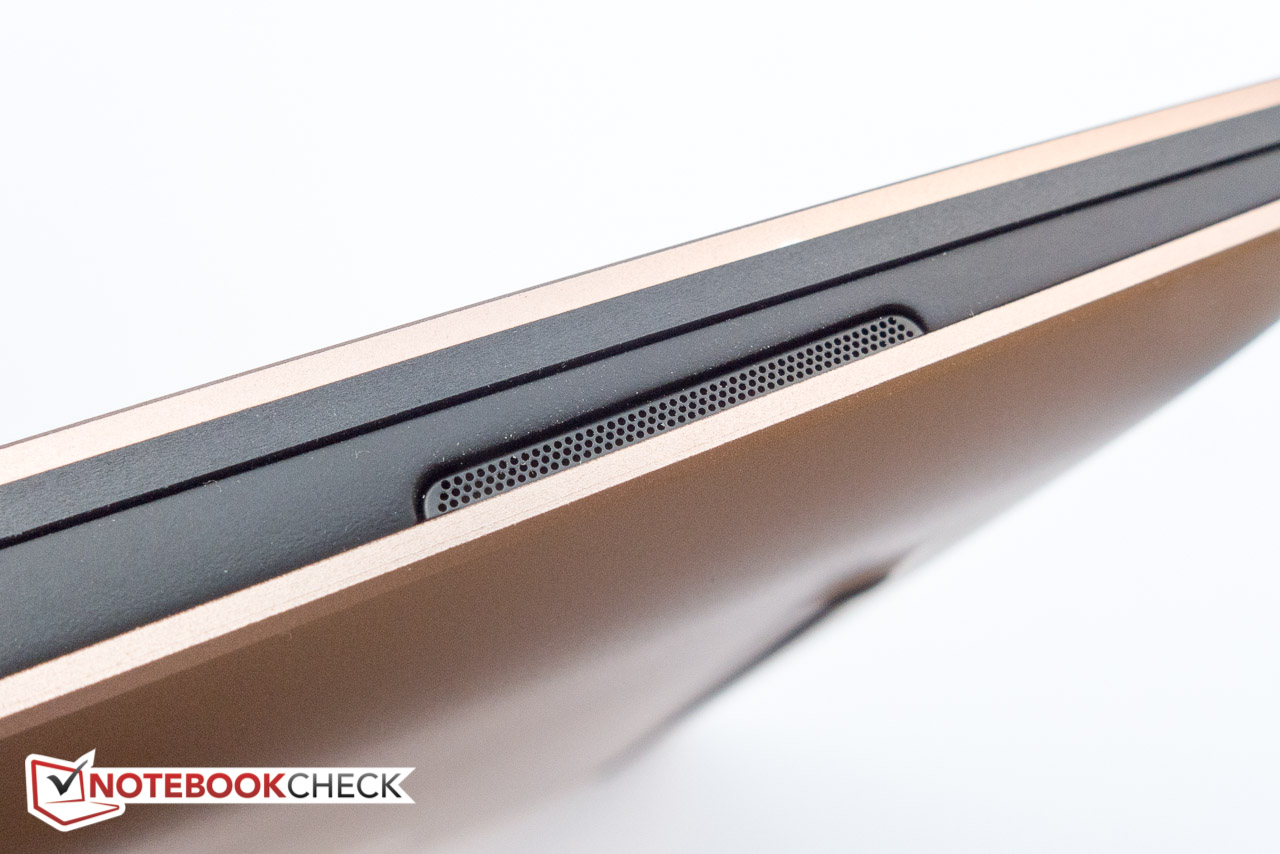
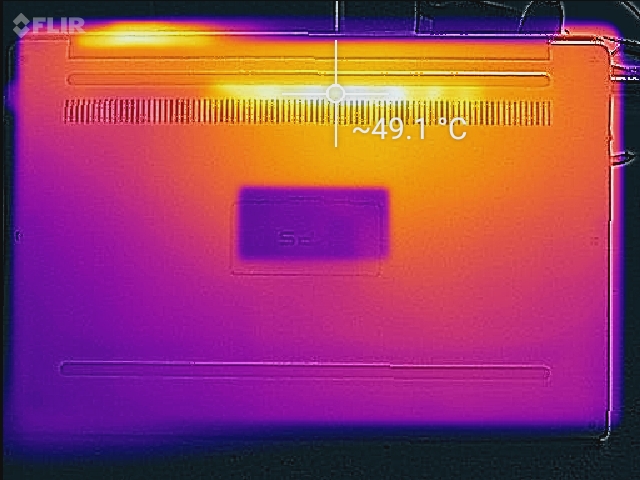
Good performance in a slim chassis and extremely low noise level generally mean one thing: high temperatures. The review notebook does indeed get pretty toasty, especially after long periods under load. The XPS 13 with QHD+ display and i7 CPU only gets marginally hotter. Interestingly enough, the HP Spectre 13 has a comparable heat signature despite being much thinner. The location of the hot spot of about 50 degrees C is in the middle of the bottom towards the back, so working with the notebook on the lap is still possible. The fan exhaust runs across the width of the notebook in that location, so care needs to be taken that the vent is not covered up by the user's legs, which might increase both the internal and surface temperatures further.
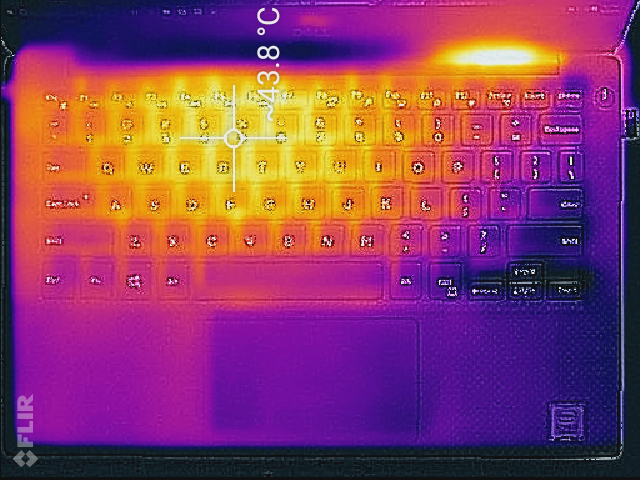
(±) The maximum temperature on the upper side is 43.4 °C / 110 F, compared to the average of 35.9 °C / 97 F, ranging from 21.4 to 59 °C for the class Subnotebook.
(-) The bottom heats up to a maximum of 49.2 °C / 121 F, compared to the average of 39.2 °C / 103 F
(+) In idle usage, the average temperature for the upper side is 25.1 °C / 77 F, compared to the device average of 30.8 °C / 87 F.
(+) The palmrests and touchpad are cooler than skin temperature with a maximum of 29.4 °C / 84.9 F and are therefore cool to the touch.
(±) The average temperature of the palmrest area of similar devices was 28.2 °C / 82.8 F (-1.2 °C / -2.1 F).
Speakers
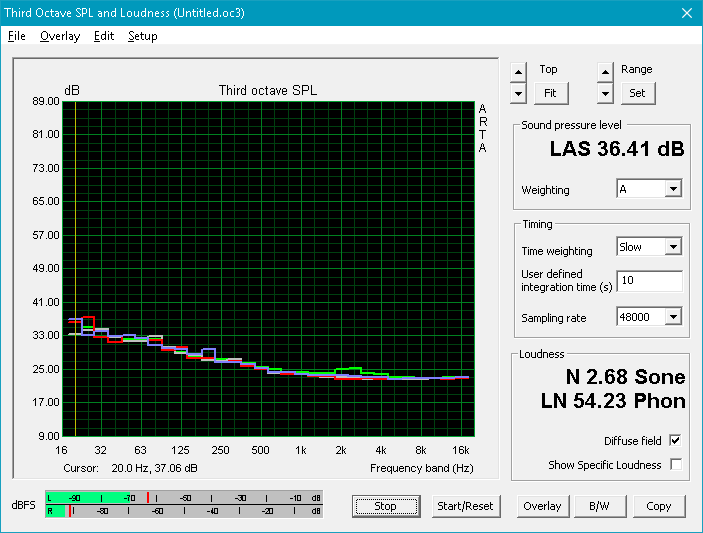
The speakers are not overly loud but remain distortion-free even at the maximum volume level. As expected, the audio quality isn't impressive with low amounts of bass, but otherwise decently-balanced sound across the board. We definitely recommend headphones or external speakers for longer listening periods and especially for music.
Dell XPS 13 9360 FHD i5 audio analysis
(-) | not very loud speakers (70.3 dB)
Bass 100 - 315 Hz
(±) | reduced bass - on average 6.9% lower than median
(±) | linearity of bass is average (10.5% delta to prev. frequency)
Mids 400 - 2000 Hz
(+) | balanced mids - only 3.7% away from median
(+) | mids are linear (4% delta to prev. frequency)
Highs 2 - 16 kHz
(+) | balanced highs - only 2% away from median
(±) | linearity of highs is average (10.3% delta to prev. frequency)
Overall 100 - 16.000 Hz
(±) | linearity of overall sound is average (18.3% difference to median)
Compared to same class
» 53% of all tested devices in this class were better, 7% similar, 40% worse
» The best had a delta of 5%, average was 18%, worst was 53%
Compared to all devices tested
» 40% of all tested devices were better, 8% similar, 53% worse
» The best had a delta of 4%, average was 24%, worst was 134%
Apple MacBook 12 (Early 2016) 1.1 GHz audio analysis
(+) | speakers can play relatively loud (83.6 dB)
Bass 100 - 315 Hz
(±) | reduced bass - on average 11.3% lower than median
(±) | linearity of bass is average (14.2% delta to prev. frequency)
Mids 400 - 2000 Hz
(+) | balanced mids - only 2.4% away from median
(+) | mids are linear (5.5% delta to prev. frequency)
Highs 2 - 16 kHz
(+) | balanced highs - only 2% away from median
(+) | highs are linear (4.5% delta to prev. frequency)
Overall 100 - 16.000 Hz
(+) | overall sound is linear (10.2% difference to median)
Compared to same class
» 7% of all tested devices in this class were better, 2% similar, 91% worse
» The best had a delta of 5%, average was 18%, worst was 53%
Compared to all devices tested
» 5% of all tested devices were better, 1% similar, 94% worse
» The best had a delta of 4%, average was 24%, worst was 134%
Frequency Comparison (Checkbox selectable!)
Graph 1: Pink Noise 100% Vol.; Graph 2: Audio off
Energy Management
Power Consumption
Compared to the XPS 13 with i7 CPU and QHD+ display, the maximum idle power consumption is lower by about 25 %. The maximum power consumption is fairly similar though - likely because Dell employs similar methods to keep the core temperatures in check and thus employs throttling. Even when using the integrated the GPU, the gaming-oriented Razer Blade Stealth has a much higher ceiling when it comes to the power draw and happily pulls over 50 watts. The review XPS draws about 22 watts at medium load levels - roughly 20 % lower than its larger brother - so we are expecting to see a difference when it comes to the battery life.
| Off / Standby | |
| Idle | |
| Load |
|
Key:
min: | |
| Dell XPS 13 9360 FHD i5 i5-7200U, HD Graphics 620, Toshiba NVMe THNSN5256GPUK, IPS, 1920x1080, 13.3" | HP Spectre 13 6500U, HD Graphics 520, Samsung PM951 NVMe MZVLV256, IPS UWVA, 1920x1080, 13.3" | Acer Aspire S 13 S5-371-71QZ 6500U, HD Graphics 520, LiteOn CV1-8B512, IPS, 1920x1080, 13.3" | Asus Zenbook UX330UA-FC059T 6500U, HD Graphics 520, SanDisk SD8SNAT256G1002, IPS, 1920x1080, 13.3" | Lenovo IdeaPad 710S-13ISK 6560U, Iris Graphics 540, Samsung PM951 NVMe MZVLV256, IPS, 1920x1080, 13.3" | Razer Blade Stealth QHD i7-7500U i7-7500U, HD Graphics 620, Samsung PM951 NVMe MZVLV256, , 2560x1440, 12.5" | Dell XPS 13 9360 QHD+ i7 i7-7500U, HD Graphics 620, Toshiba NVMe THNSN5256GPUK, IPS, 3200x1800, 13.3" | Dell XPS 13 2016 9350 (FHD, i7-6560U) 6560U, Iris Graphics 540, Samsung PM951 NVMe MZ-VLV256D, IPS, 1920x1080, 13.3" | Dell XPS 13 9360 QHD+ i5 i5-7200U, HD Graphics 620, Toshiba NVMe THNSN5256GPUK, , 3200x1800, 13.3" | |
|---|---|---|---|---|---|---|---|---|---|
| Power Consumption | -94% | -32% | -28% | -46% | -50% | -36% | -46% | -21% | |
| Idle Minimum * (Watt) | 4.1 | 8.6 -110% | 4.1 -0% | 3 27% | 3.3 20% | 4.4 -7% | 6.4 -56% | 5.8 -41% | 3.7 10% |
| Idle Average * (Watt) | 4.2 | 11 -162% | 6.7 -60% | 6.3 -50% | 7.4 -76% | 5.8 -38% | 6.6 -57% | 7.3 -74% | 6.1 -45% |
| Idle Maximum * (Watt) | 5.1 | 11.3 -122% | 7.4 -45% | 7.5 -47% | 8.2 -61% | 8.6 -69% | 6.8 -33% | 8.5 -67% | 6.5 -27% |
| Load Average * (Watt) | 22.1 | 33.8 -53% | 32.4 -47% | 36 -63% | 36.5 -65% | 35.2 -59% | 27.5 -24% | 30.6 -38% | 29.5 -33% |
| Load Maximum * (Watt) | 29.4 | 36.2 -23% | 32.4 -10% | 31.5 -7% | 43.7 -49% | 52 -77% | 32.4 -10% | 32.5 -11% | 33 -12% |
* ... smaller is better
Battery Life
Thanks in part to the large 60 Wh battery - the aforementioned use of CABC-technology likely plays a role as well - the XPS 13 does very well when it comes to the battery life. The laptop lasted 11 hours 17 minutes when we performed our real-world WLAN test with the brightness set to 150 nits (setting 5/10). It appears we had some background processes skew the result, so 12 hours should be possible under ideal conditions. The Asus Zenbook UX330UA is the only system that can come close at just over 10 hours. The HP Spectre 13 only runs about half as long. The review laptop beats the XPS 13 with the same i5 processor, but QHD+ display handily by 2.5 hours.
The Reader's test showed a ridiculously long run time of 21.5 hours and the XPS 13 shut down after almost 2 hours and 40 minutes when running the Battery Eater Classic test.
All things considered, the battery life of the subnotebook is simply outstanding. Even without being overly conservative, the system can easily last an entire work day.
| Dell XPS 13 9360 FHD i5 i5-7200U, HD Graphics 620, 60 Wh | HP Spectre 13 6500U, HD Graphics 520, 38 Wh | Acer Aspire S 13 S5-371-71QZ 6500U, HD Graphics 520, 45 Wh | Asus Zenbook UX330UA-FC059T 6500U, HD Graphics 520, 57 Wh | Lenovo IdeaPad 710S-13ISK 6560U, Iris Graphics 540, 46 Wh | Razer Blade Stealth QHD i7-7500U i7-7500U, HD Graphics 620, 53.6 Wh | Dell XPS 13 9360 QHD+ i7 i7-7500U, HD Graphics 620, 60 Wh | Dell XPS 13 9360 QHD+ i5 i5-7200U, HD Graphics 620, 60 Wh | |
|---|---|---|---|---|---|---|---|---|
| Battery runtime | -48% | -29% | -14% | -39% | -32% | -19% | -17% | |
| Reader / Idle (h) | 21.6 | 11.9 -45% | 17.1 -21% | 20.4 -6% | 13.5 -37% | 13.6 -37% | 17.6 -19% | |
| WiFi v1.3 (h) | 11.3 | 5.6 -50% | 7.9 -30% | 10.2 -10% | 7 -38% | 8.3 -27% | 8.6 -24% | 8.8 -22% |
| Load (h) | 2.6 | 1.3 -50% | 1.7 -35% | 1.9 -27% | 1.5 -42% | 1.8 -31% | 2.2 -15% | 2.3 -12% |
Pros
Cons
Verdict
The Dell XPS 13 9360 with FHD display and 7th-generation i5 processor picks up where the predecessors have left of. The Kaby Lake chipset performs as expected, operation is smooth and fast and the notebook remains unobtrusive during all but the most extreme scenarios. The new i5 processor performs more or less on par with the previous-generation (Skylake) i7 CPU. Upgrading to the newest i7 CPU for $200 more doesn't net a lot of extra performance - especially since Intel's Iris GPU isn't part of the package. For most users, the review configuration with i5-7200U, 8 GB of RAM and 256 NVMe SSD will likely hit the sweet spot. Upgrading to the QHD+ display only makes sense for those who desire the much higher resolution and want a touchscreen - we are honestly quite happy with the FHD display. With a real-world battery life approaching almost 12 hours, the laptop lasts twice as long as some competitors. Our complaints are minor: we would prefer a display panel with better color accuracy and higher brightness, the system can get quite hot when subjected to heavy stress, and our review laptop exhibited some coil whine. There's also the location of the webcam on the left bottom edge of the display, which might concern some potential buyers.
The XPS 13 ticks all the right check boxes. The display performance of the system might not be up there with the best of the ultraportable competition, but that's a minor complaint indeed.
The other systems in our review are all - each in their own way - decent choices. Although it is now in its fourth generation, the XPS 13 is quite unique with its ultra-thin bezel and the balance it strikes between portability, design, power, and value. It is therefore still a top pick in this category.
Dell XPS 13 9360 FHD i5
- 12/07/2016 v6 (old)
Bernhard Pechlaner
Price comparison