Notebook reviews with Intel HD Graphics 615 graphics card
Lenovo Yoga Book C930 (i5-7Y54, LTE, E-Ink) Convertible Review
The new Yoga Book has an E-Ink display instead of a keyboard and can be considered a combination of a laptop, a tablet and an e-reader. On top of that, you can also digitalize text and drawings with this all-rounder. The device is based on its predecessor from 2016 but offers many changes and improvements. For instance, it provides better performance. On the other hand, it has also dropped at least one feature. Is the 2018 Yoga Book worth twice the price of the old version? Find out in our detailed review.
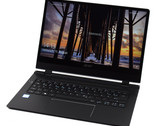
Intel Core i5-7Y54, HD Graphics 615, 10.8", 778 gAcer Swift 7 SF714-51T (Core i7-7Y75, 256 GB, FHD, Touch) Laptop Review
The latest revision of the Acer Swift 7 is not only slimmer than its predecessor, but it also packs an Intel Core i7 Y-series processor, which should provide better performance and a multi-touch display. Find out in this detailed review the strengths and weaknesses of the latest Acer Swift 7 and how it fares against the competition.
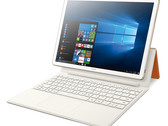
Intel Core i7-7Y75, HD Graphics 615, 14", 1.2 kgHuawei MateBook E (i5-7Y54, HD615) Convertible Review
Convertible with a retro design. The Huawei MateBook E has enough style to suit any office. Find out in our review whether the Intel Core i5-7Y54 and HD Graphics 615-powered convertible stands out from the competition with its internal capabilities.
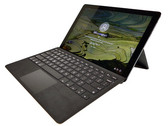
Intel Core i5-7Y54, HD Graphics 615, 12", 1.1 kgEve V (m3, i5, i7) Convertible Review
From the crowd to the people. It has been about a year since the Eve V project made waves on the Indiegogo crowdfunding platform. The financial goal was achieved within a record time and finally even exceeded by more than 1800%. Now the time has come for the devices to be ready for shipment to the supporters and to be available for interested buyers. We have already tested the device and are comparing all three CPU models available for the Eve V.
Intel Core i5-7Y54, HD Graphics 615, 12.3", 1.4 kgEve V (m3, i5, i7) Convertible Review
From the crowd to the people. It has been about a year since the Eve V project made waves on the Indiegogo crowdfunding platform. The financial goal was achieved within a record time and finally even exceeded by more than 1800%. Now the time has come for the devices to be ready for shipment to the supporters and to be available for interested buyers. We have already tested the device and are comparing all three CPU models available for the Eve V.
Intel Core i7-7Y75, HD Graphics 615, 12.3"Eve-Tech Eve V m3: Intel Core m3-7Y30, 12.30"
Review » Eve V (m3, i5, i7) Convertible Review
Google Pixelbook: Intel Core i5-7Y57, 12.30", 1.3 kg
Review » Google Pixelbook Chromebook Review
Dell Latitude 7285: Intel Core i5-7Y57, 12.30", 1.4 kg
Review » Dell Latitude 7285 (i5-7Y57, 256 GB, 3K) Convertible Review
Microsoft Surface Pro (2017) m3: Intel Core m3-7Y30, 12.30", 1.1 kg
Review » Microsoft Surface Pro (2017) (Core m3, 128GB, 4GB) Convertible Review
Cube Thinker m3: Intel Core m3-7Y30, 13.50", 1.7 kg
Review » Cube Thinker Laptop (Core m3-7Y30, 8 GB, 256 GB) Review
Apple MacBook 12 2017: Intel Core m3-7Y32, 12.00", 0.9 kg
Review » Apple MacBook 12 (2017) Laptop Review
Lenovo ThinkPad X1 Tablet Gen 2: Intel Core i5-7Y54, 12.00", 1.1 kg
Review » Lenovo ThinkPad X1 Tablet Gen 2 (i5-7Y54) Tablet Review
Dell XPS 13 9365-4537 2-in-1: Intel Core i5-7Y54, 13.30", 1.2 kg
Review » Dell XPS 13 9365 (7Y54, QHD+) Convertible Review
Dell XPS 13-9365 2-in-1: Intel Core i7-7Y75, 13.30", 1.2 kg
Review » Dell XPS 13 9365 2-in-1 Convertible Review
Acer Swift 7 SF713-51: Intel Core i5-7Y54, 13.30", 1.1 kg
Review » Acer Swift 7 SF713-51 Notebook Review
Acer Spin 7 SP714-51-M09D: Intel Core i5-7Y54, 14.00", 1.3 kg
Review » Acer Spin 7 SP714-51-M09D Convertible Review
Chuwi UBook XPro: Intel Core i7-7Y75, 13.00", 0.9 kg
External Review » Chuwi UBook XPro
Asus Chromebook C425TA-H50039: Intel Pentium Gold 4415Y, 14.00", 1.3 kg
External Review » Asus Chromebook C425TA-H50039
Acer Swift 7 SF714-51T-M4JV: Intel Core i7-7Y75, 14.00", 1.2 kg
External Review » Acer Swift 7 SF714-51T-M4JV
Acer Swift 7 SF714-51T-M3EW: Intel Core i7-7Y75, 14.00", 1.2 kg
External Review » Acer Swift 7 SF714-51T-M3EW
Microsoft Surface Pro (2017) m3: Intel Core m3-7Y30, 12.30", 1.1 kg
External Review » Microsoft Surface Pro (2017) m3
Acer Swift 7 SF714-51T-M16F: Intel Core i7-7Y75, 14.00", 1.2 kg
External Review » Acer Swift 7 SF714-51T-M16F
Asus VivoBook Flip 14 TP401CA-EC067T: Intel Core m3-7Y30, 14.00", 1.5 kg
External Review » Asus VivoBook Flip 14 TP401CA-EC067T
Asus VivoBook Flip 14 TP401CA-DHM4T: Intel Core m3-7Y30, 14.00", 1.5 kg
External Review » Asus VivoBook Flip 14 TP401CA-DHM4T
Acer Swift 7 Sf714-51t-m64v: Intel Core i7-7Y75, 14.00", 1.2 kg
External Review » Acer Swift 7 Sf714-51t-m64v
Lenovo Yoga Book C930 YB-J912F: Intel Core i5-7Y54, 10.80", 0.8 kg
External Review » Lenovo Yoga Book C930 YB-J912F
Samsung Chromebook Plus XE521QAB-K01US: Intel Celeron 3965Y, 12.20", 1.3 kg
External Review » Samsung Chromebook Plus XE521QAB-K01US
Microsoft Surface Go MCZ-00002: Intel Pentium Gold 4415Y, 10.00", 0.5 kg
External Review » Microsoft Surface Go MCZ-00002
HP Chromebook x2 12-f015nr: Intel Core m3-7Y30, 12.30", 1.4 kg
External Review » HP Chromebook x2 12-f015nr
Asus VivoBook Flip 14 TP401CA-EC011T: Intel Core m3-7Y30, 14.00", 1.6 kg
External Review » Asus VivoBook Flip 14 TP401CA-EC011T
Wortmann Terra Pad 1270: Intel Core i5-7Y54, 12.10", 0.8 kg
External Review » Wortmann Terra Pad 1270
Asus VivoBook Flip 14 TP401CA-DHM6T: Intel Core m3-7Y30, 14.00", 1.5 kg
External Review » Asus VivoBook Flip 14 TP401CA-DHM6T
Chuwi CoreBook 13: Intel Core m3-7Y30, 13.30", 1.1 kg
External Review » Chuwi CoreBook 13
Teclast F6 Pro: Intel Core m3-7Y30, 13.30", 1.4 kg
External Review » Teclast F6 Pro
Acer Swift 7 SF714-51T: Intel Core i7-7Y75, 14.00", 1.2 kg
External Review » Acer Swift 7 SF714-51T
Dell Latitude 7285-8718: Intel Core i5-7Y57, 12.30", 1.4 kg
External Review » Dell Latitude 7285-8718
Asus Zenbook UX330CA-FC106T: Intel Core m3-7Y30, 13.30", 1.2 kg
External Review » Asus Zenbook UX330CA-FC106T
Google Pixelbook: Intel Core i5-7Y57, 12.30", 1.3 kg
External Review » Google Pixelbook
Dell Latitude 7285: Intel Core i5-7Y57, 12.30", 1.4 kg
External Review » Dell Latitude 7285
Lenovo ThinkPad X1 Tablet 2017, Core i5-7Y57: unknown, 12.00", 1.1 kg
External Review » Lenovo ThinkPad X1 Tablet 2017, Core i5-7Y57
Acer Swift 7 SF713-51-M8MF: Intel Core i5-7Y54, 13.30", 1.1 kg
External Review » Acer Swift 7 SF713-51-M8MF
Cube i35 Thinker: Intel Core m3-7Y30, 13.50", 1.7 kg
External Review » Cube i35 Thinker
Samsung Galaxy Book 10.6 W627N LTE: Intel Core m3-7Y30, 10.60", 0.6 kg
External Review » Samsung Galaxy Book 10.6 W627N LTE
Lenovo ThinkPad X1 Tablet 2017, Core i7-7Y75: Intel Core i7-7Y75, 12.00", 1.1 kg
External Review » Lenovo ThinkPad X1 Tablet 2017, Core i7-7Y75
Apple MacBook 12 2017: Intel Core m3-7Y32, 12.00", 0.9 kg
External Review » Apple MacBook 12 2017
Huawei Matebook E: Intel Core i5-7Y54, 12.10", 1.1 kg
External Review » Huawei Matebook E
Microsoft Surface Pro (2017) m3: Intel Core m3-7Y32, 12.30", 0.8 kg
External Review » Microsoft Surface Pro (2017)
Dell XPS 13 9365-4537 2-in-1: Intel Core i5-7Y54, 13.30", 1.2 kg
External Review » Dell XPS 13 9365-4537
Acer Swift 7 SF713-51-M90J: Intel Core i5-7Y54, 13.30", 1.1 kg
External Review » Acer Swift 7 SF713-51-M90J
Lenovo Yoga 710-11IKB-80V6001RGE: Intel Core m3-7Y30, 11.60", 1 kg
External Review » Lenovo Yoga 710-11IKB-80V6001RGE
Dell Inspiron 11 3179: Intel Core m3-7Y30, 11.60", 1.4 kg
External Review » Dell Inspiron 11 3179
Acer Swift 7 SF713-51-M2SB: Intel Core i5-7Y54, 13.30", 1.1 kg
External Review » Acer Swift 7 SF713-51-M2SB
Asus Zenbook Flip UX360CA-C4171T: Intel Core m3-7Y30, 13.30", 1.3 kg
External Review » Asus Zenbook Flip UX360CA-C4171T
Cube Mix Plus: Intel Core m3-7Y30, 10.60", 0.7 kg
External Review » Cube Mix Plus
Dell XPS 13 9365-4544 2-in-1: Intel Core i7-7Y75, 13.30", 1.2 kg
External Review » Dell XPS 13 9365-4544 2-in-1
HP Pro x2 612 G2: Intel Core m3-7Y30, 12.10", 1.2 kg
External Review » HP Pro x2 612 G2
Lenovo ThinkPad X1 Tablet 2017: Intel Core m3-7Y30, 12.20", 1.1 kg
External Review » Lenovo ThinkPad X1 Tablet 2017
Dell XPS 13-9365 2-in-1: Intel Core i7-7Y75, 13.30", 1.2 kg
External Review » Dell XPS 13-9365
Acer Swift 7 SF713-51-M2LH: Intel Core i5-7Y54, 13.30", 1.1 kg
External Review » Acer Swift 7 SF713-51-M2LH
Acer Spin 7 SP714-51-M37P: Intel Core i7-7Y75, 14.00", 1.6 kg
External Review » Acer Spin 7 SP714-51-M37P
Asus Transformer 3 T305CA-GW019T: Intel Core m3-7Y30, 12.60", 0.7 kg
External Review » Asus Transformer 3 T305CA-GW019T
Acer Spin 7 SP714-51-M339: Intel Core i5-7Y54, 14.00", 1.3 kg
External Review » Acer Spin 7 SP714-51-M339
Dell XPS 13 2-in-1: Intel Core i5-7Y54, 13.30", 1.2 kg
External Review » Dell XPS 13 2-in-1
Acer Spin 7 SP714-51-M4YD: Intel Core i7-7Y75, 14.00", 1.3 kg
External Review » Acer Spin 7 SP714-51-M4YD
Asus Zenbook UX360CA-C4172T: Intel Core i5-7Y54, 13.30", 1.3 kg
External Review » Asus Zenbook UX360CA-C4172T
Acer Spin 7 SP714-51-M09D: Intel Core i5-7Y54, 14.00", 1.3 kg
External Review » Acer Spin 7 SP714-51-M09D
Acer Aspire R14 R7-471T-M613: Intel Core i7-7Y75, 14.00", 1.2 kg
External Review » Acer Aspire R14 R7-471T-M613
Asus Transformer 3 T305CA-GW015T: Intel Core m3-7Y30, 12.60", 0.7 kg
External Review » Asus Transformer 3 T305CA-GW015T
Acer Spin 7 SP714-51-M6LT: Intel Core i7-7Y75, 14.00", 1.6 kg
External Review » Acer Spin 7 SP714-51-M6LT
Acer Swift 7 SF713-51: Intel Core i5-7Y54, 13.30", 1.1 kg
External Review » Acer Swift 7 SF713-51