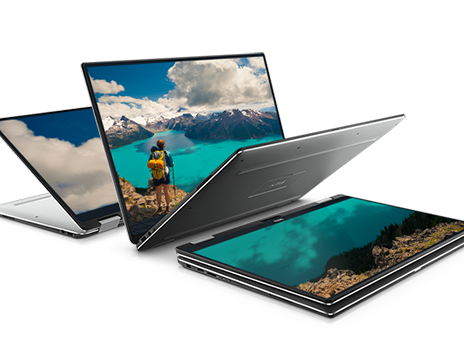
Dell XPS 13 9365 2-in-1 Convertible Review
Dell has dabbled in convertibles with 360-degree hinges in the past including on the Inspiron series, but these have been very large and generally impractical to use beyond the standard notebook mode. The success of smaller 13-inch models like the Lenovo Yoga 900/910 series, HP Spectre x360 13 series, and Asus Zenbook Flip series has prompted the company to spin-off its successful XPS 13 notebook into a proper convertible. Appropriately called the XPS 13 2-in-1, Dell is aiming to offer the innate versatility of a multi-mode form factor while sacrificing as few features as possible from the mainline XPS 13.
Perhaps the biggest change to the XPS 13 2-in-1 is the move from an actively cooled Kaby Lake U-series processor to the fanless Y-series. At less than one-third the TDP requirement, it would be unrealistic to expect the same performance out of the XPS 13 2-in-1 as on the XPS 13 9360. How close can the XPS 13 2-in-1 come to the XPS 13 in terms of raw performance, battery life, display, and overall quality?
See our existing reviews on the long-running XPS 13 series for more details on the chassis and its similar features.
Case
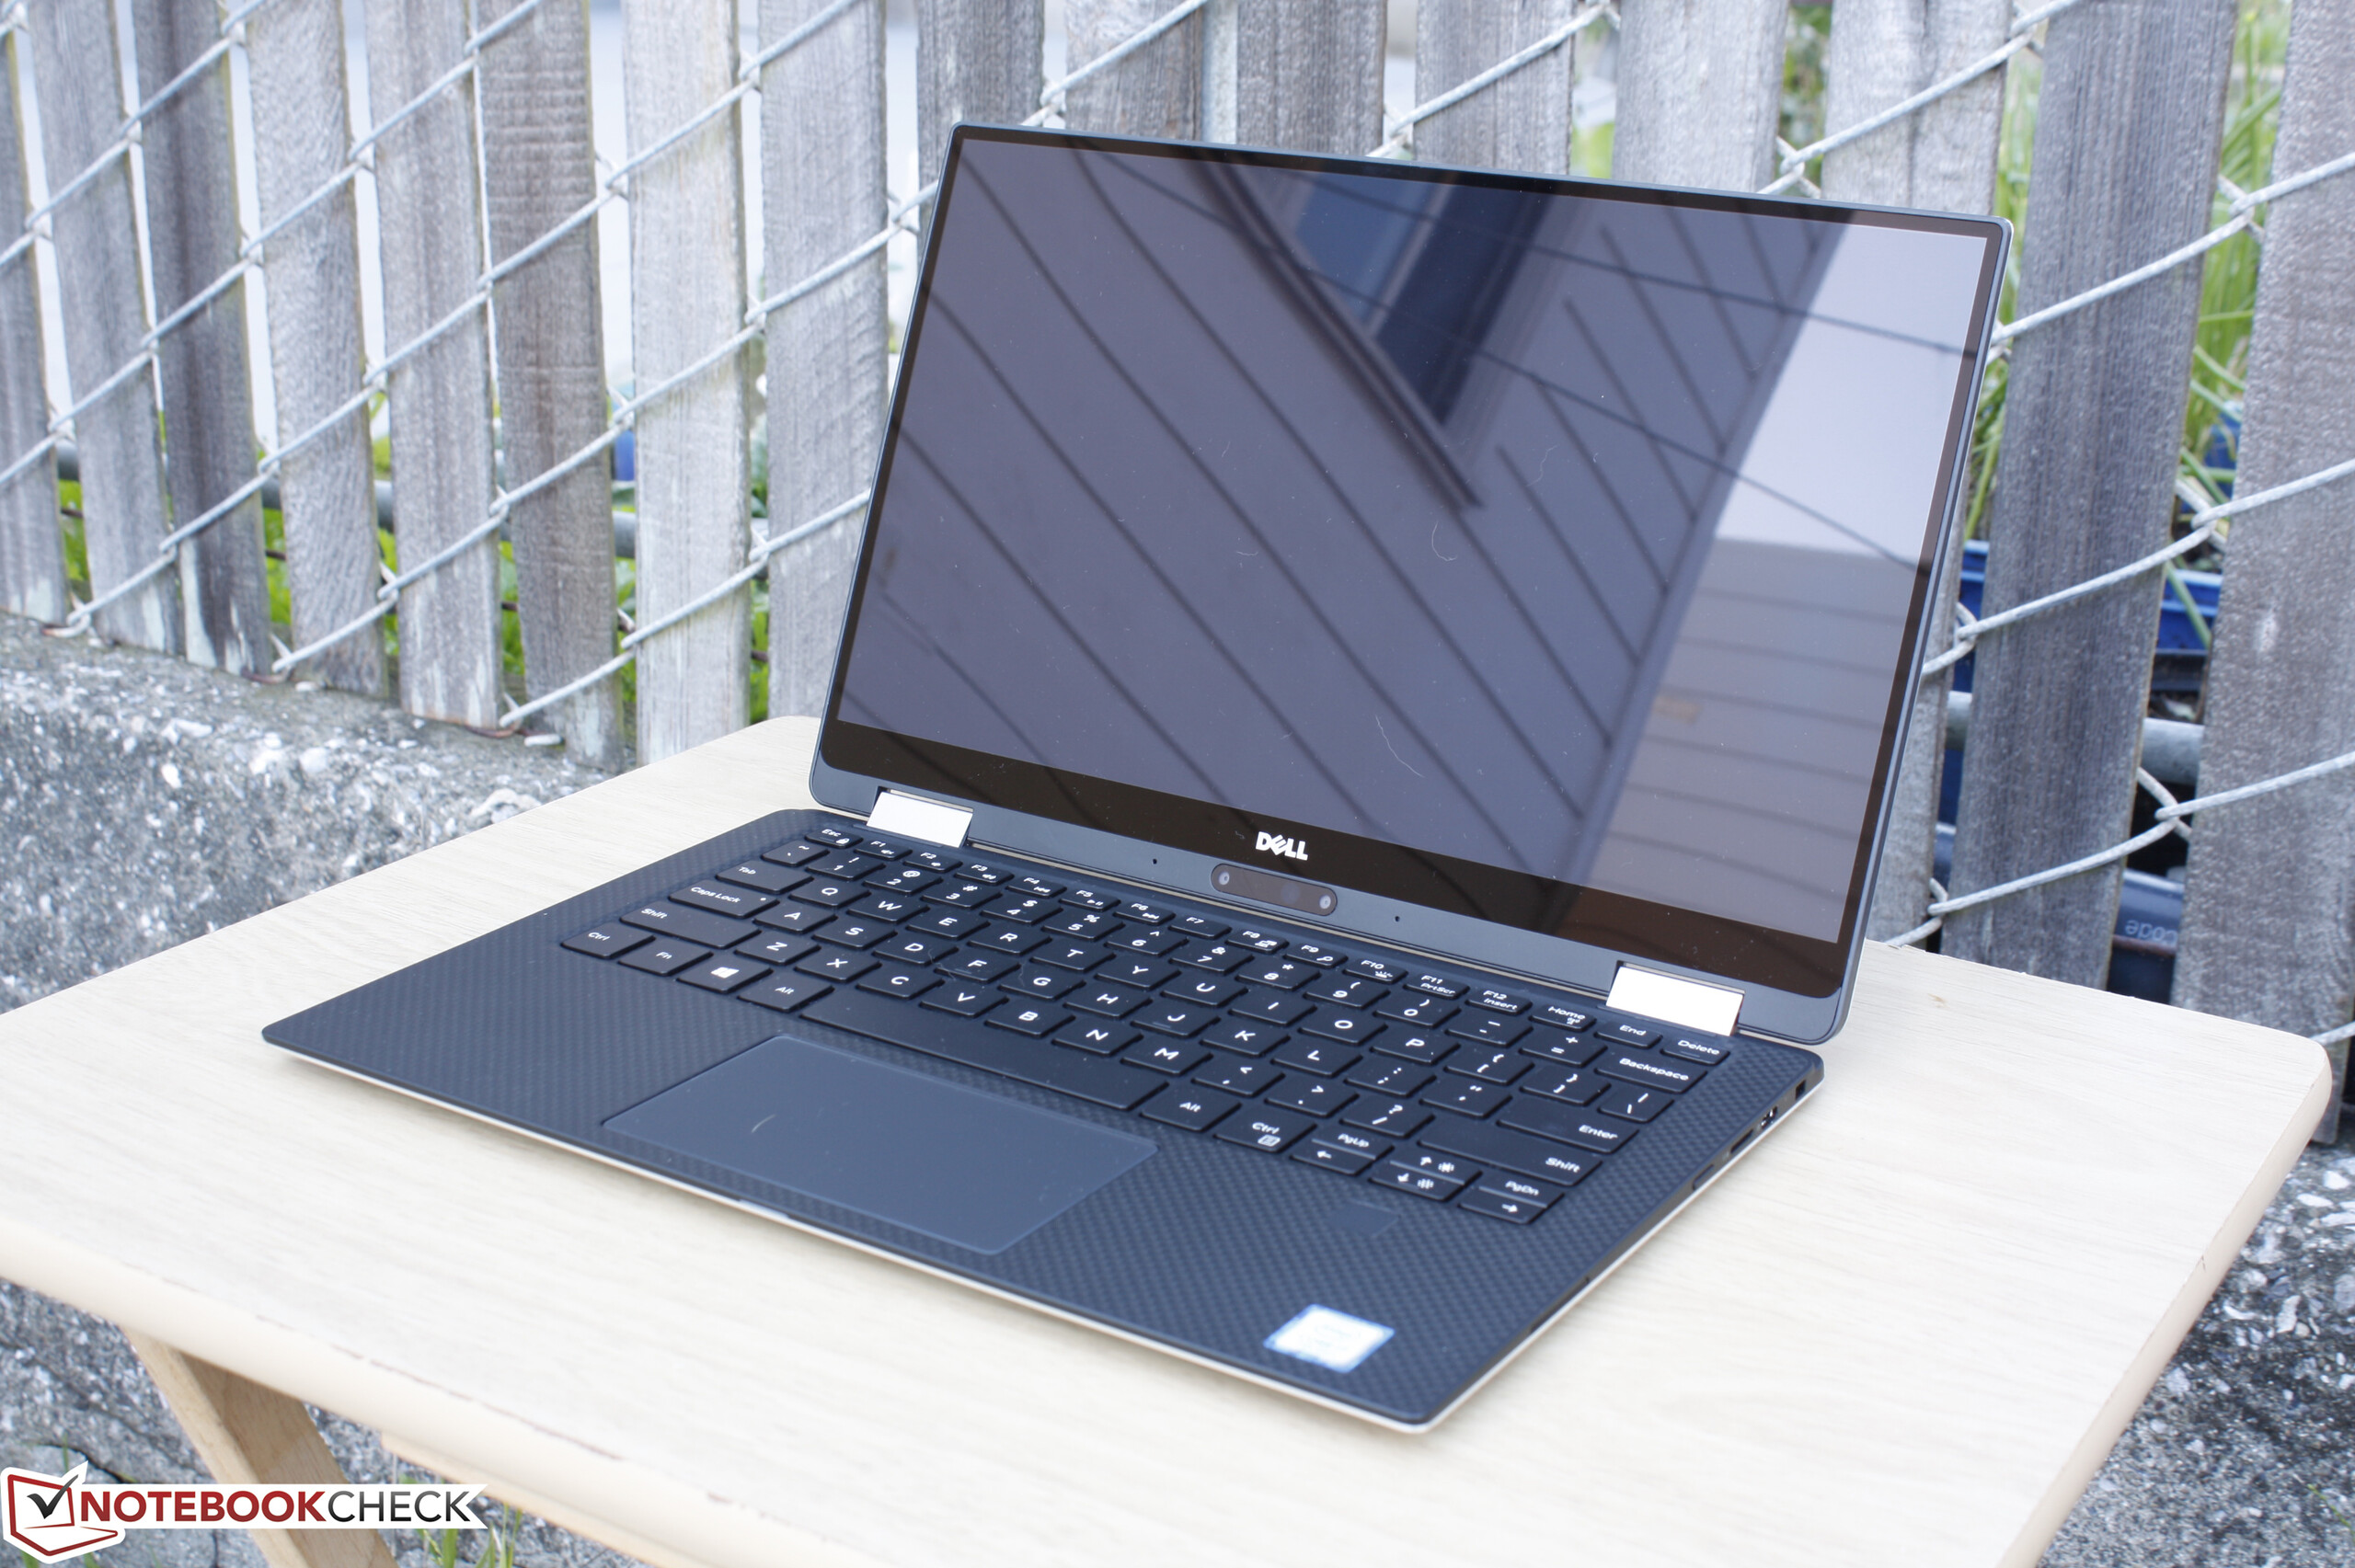
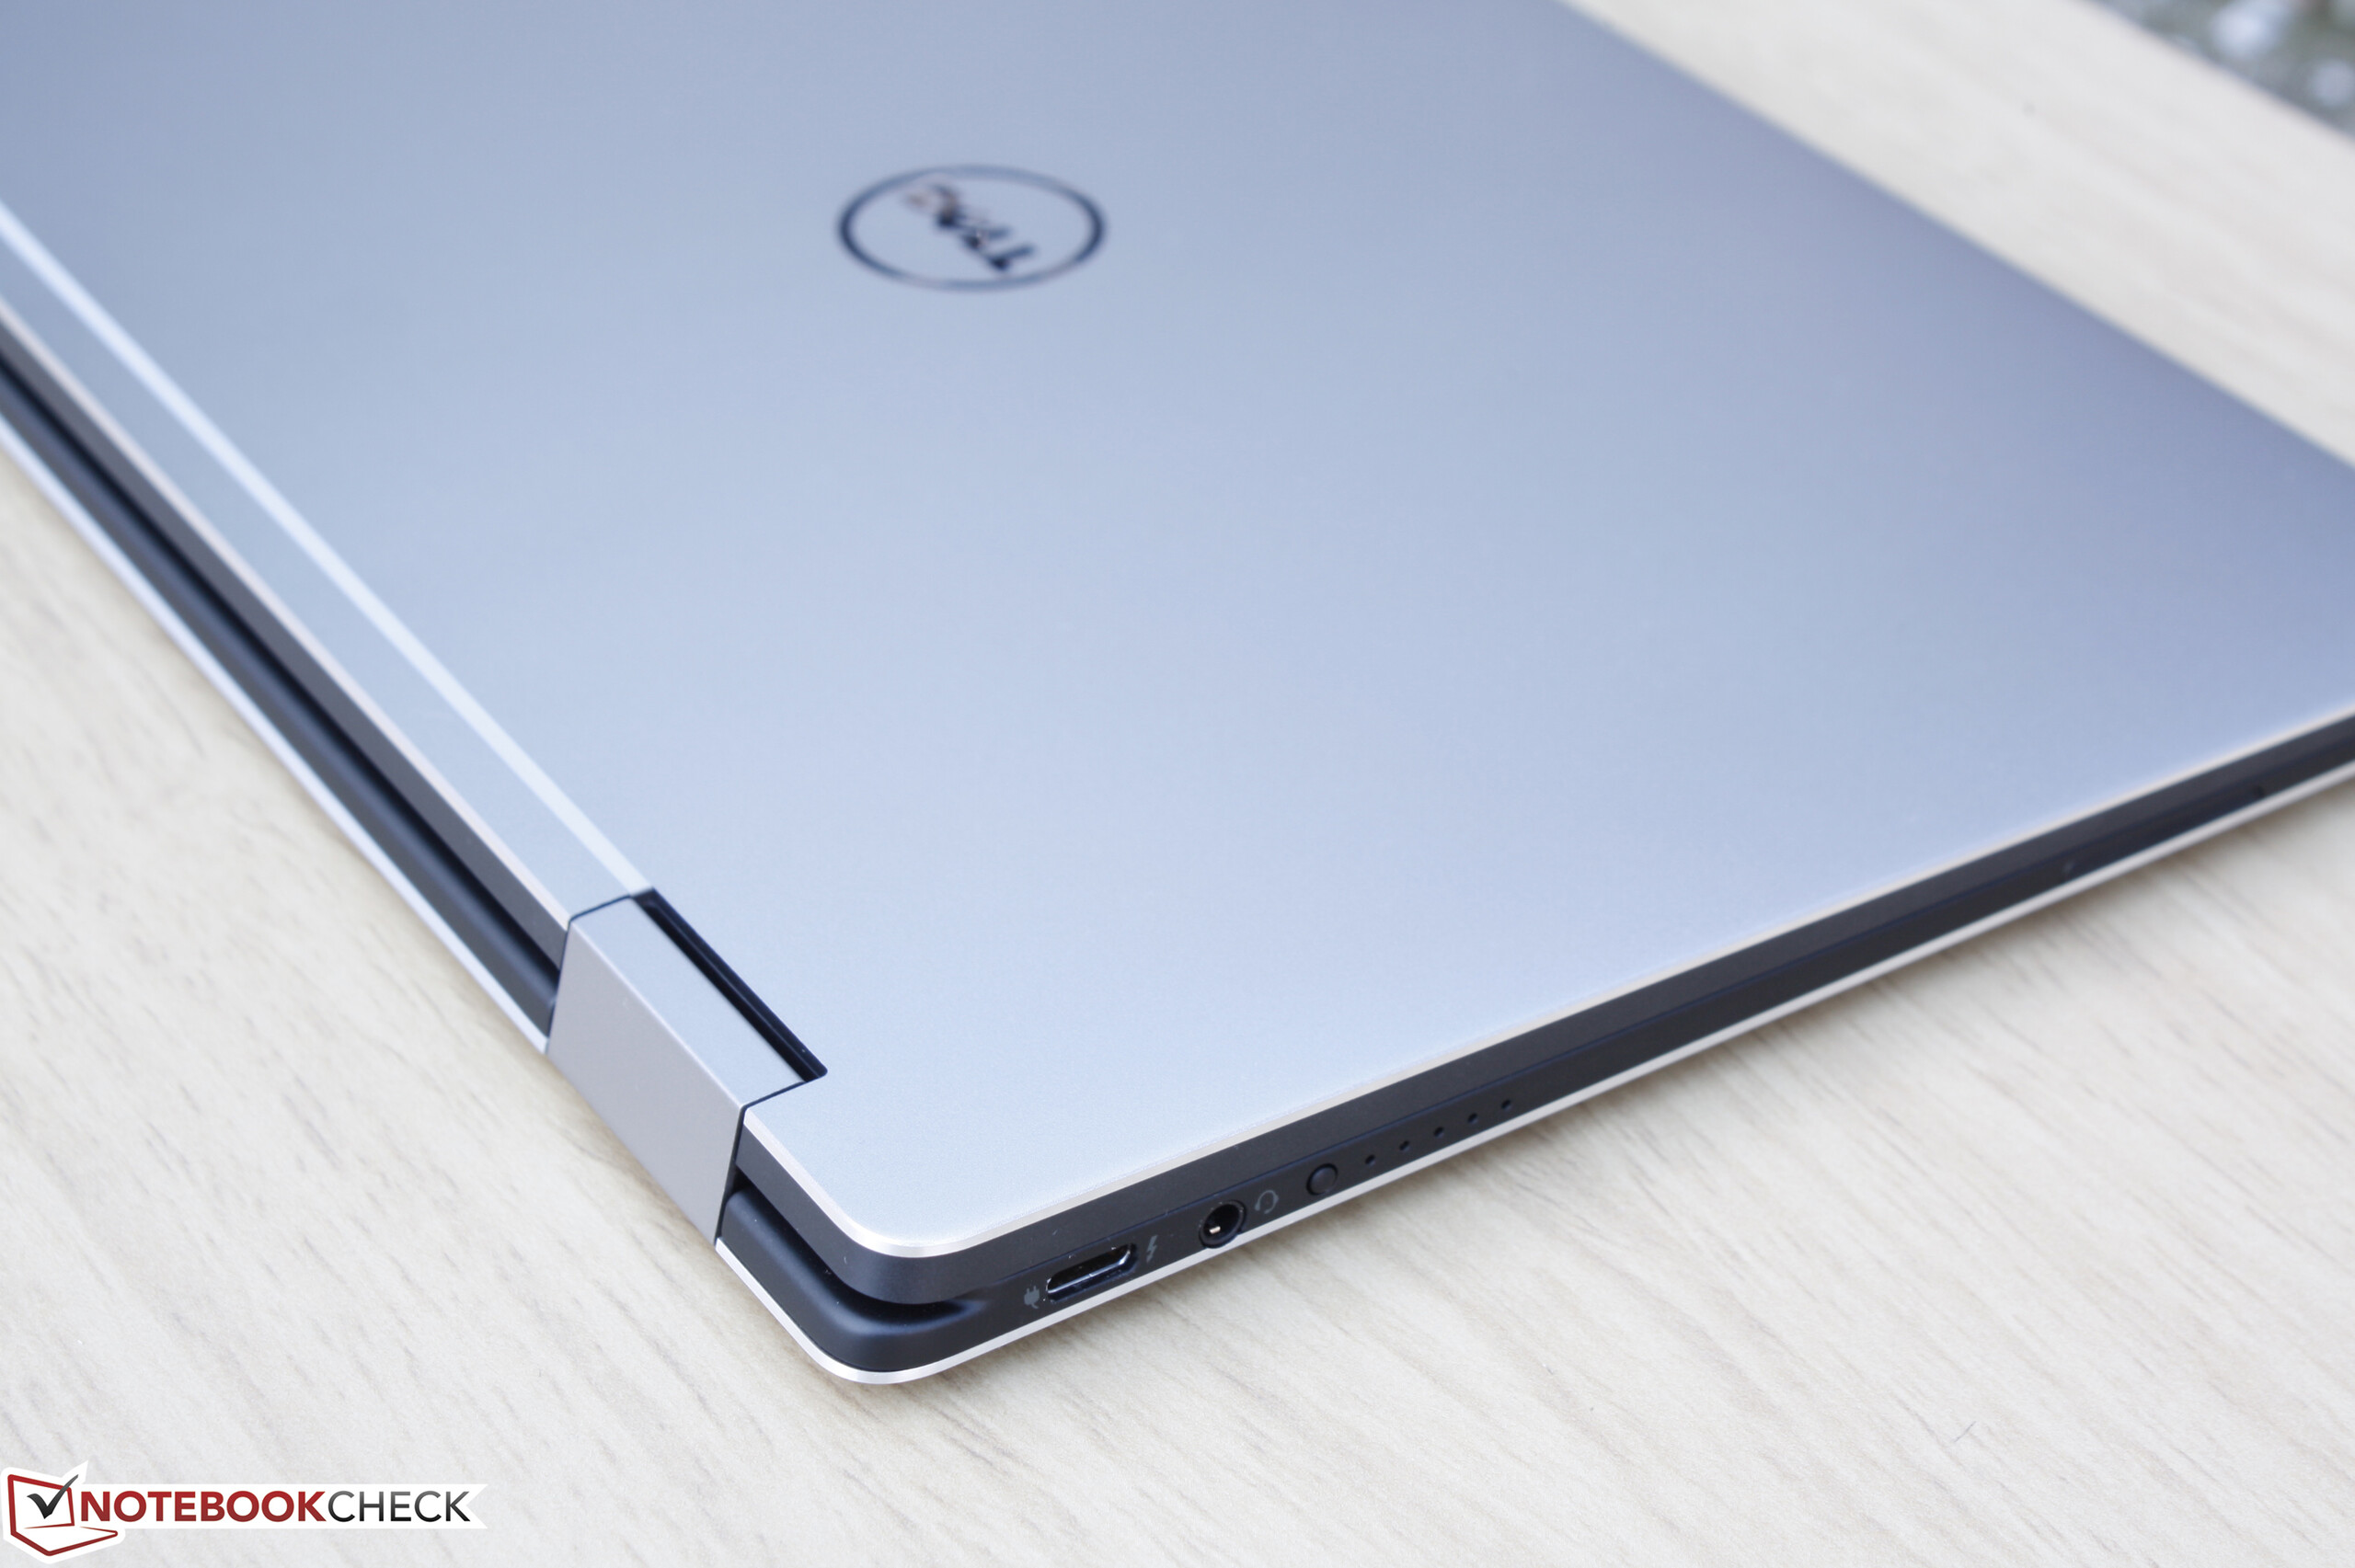
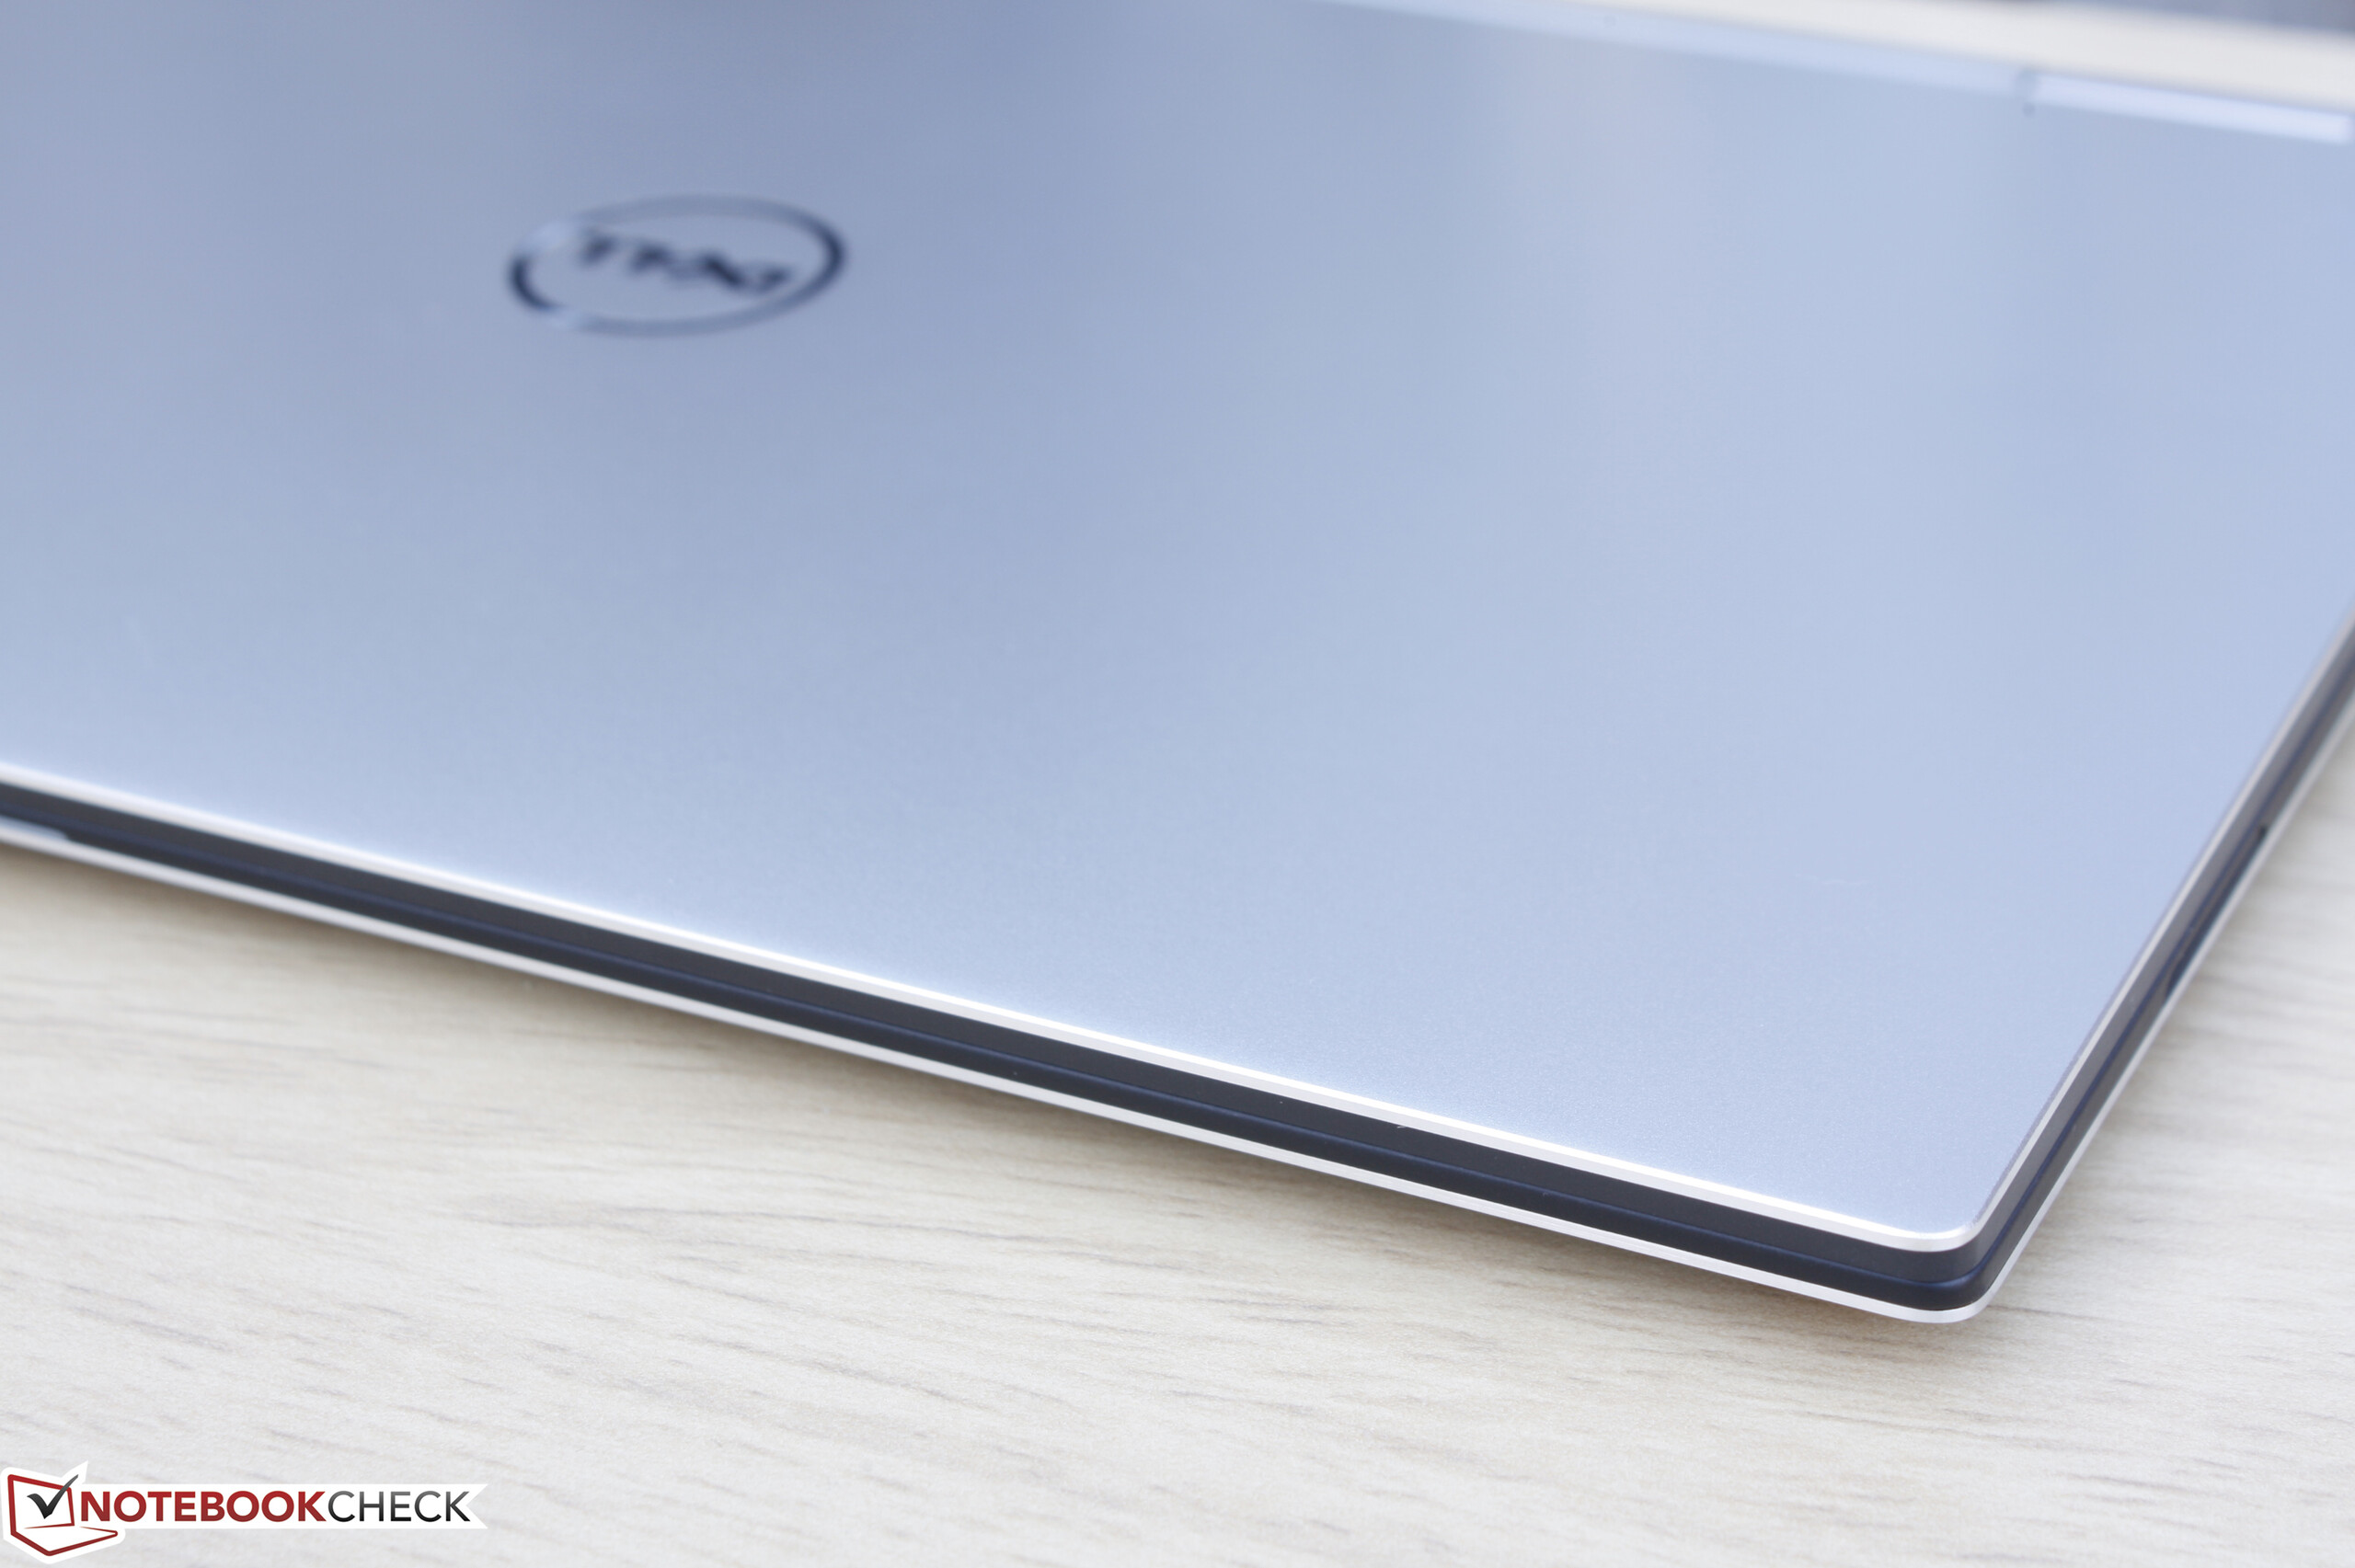
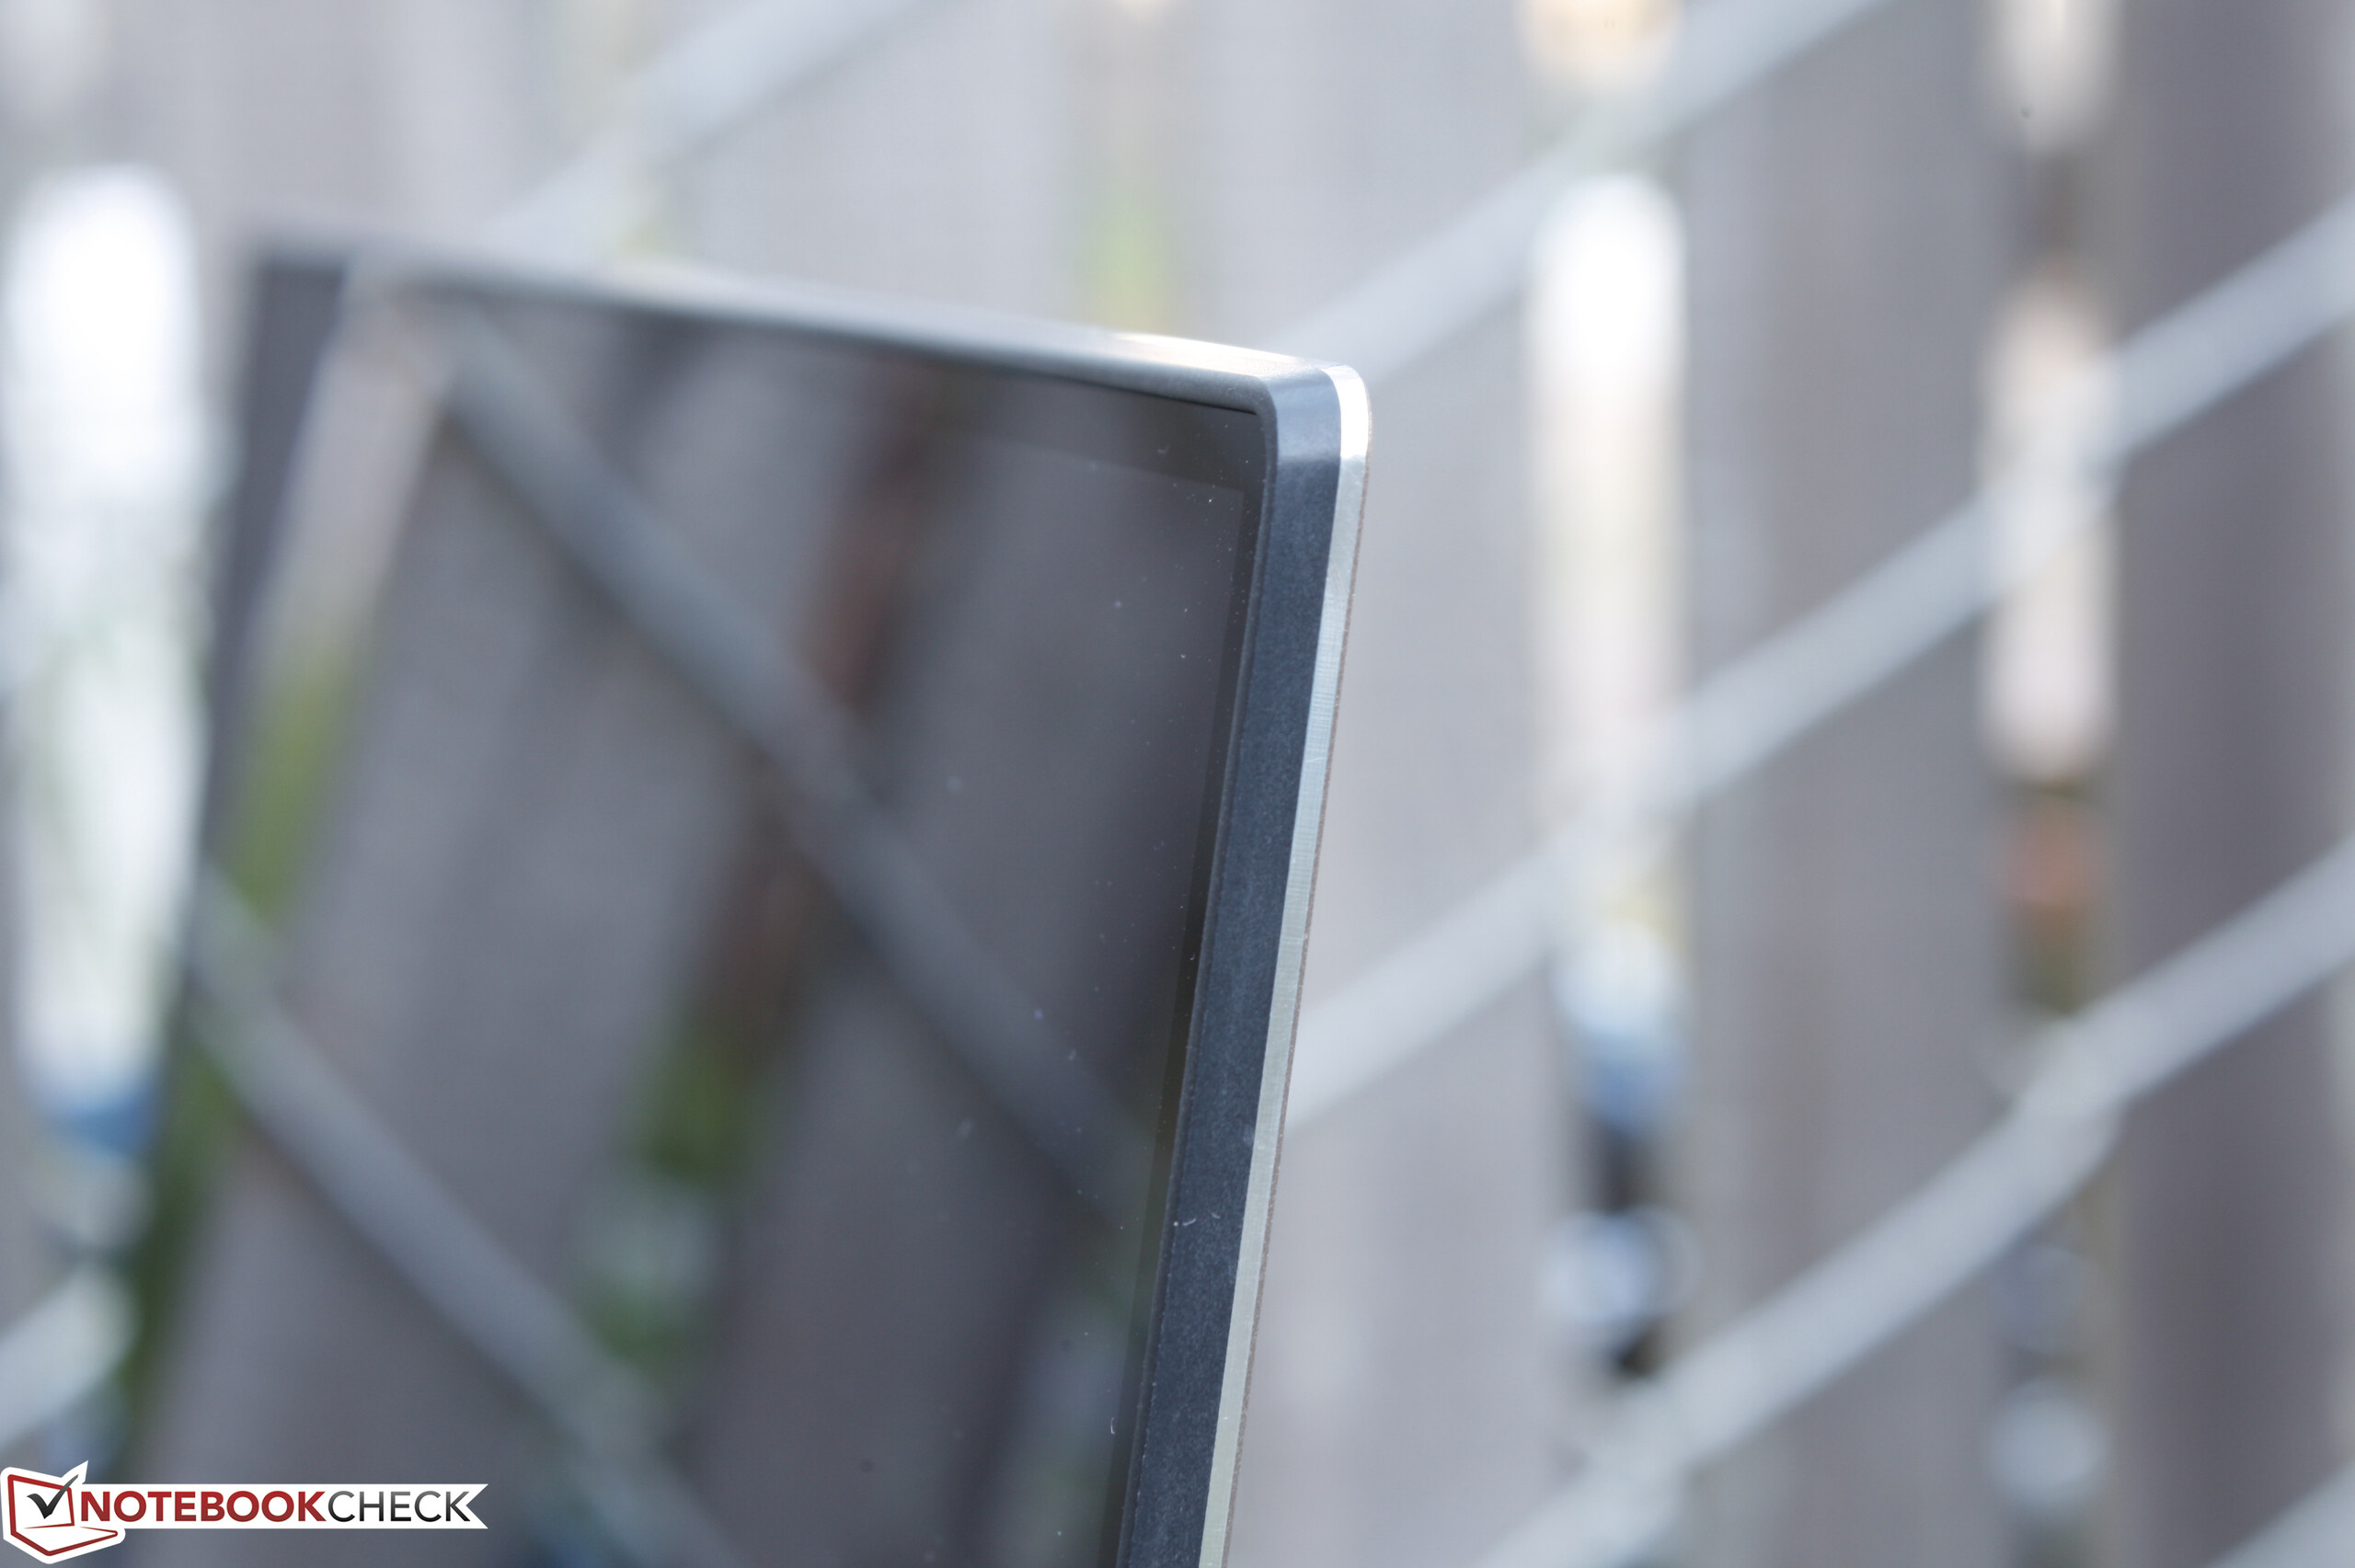
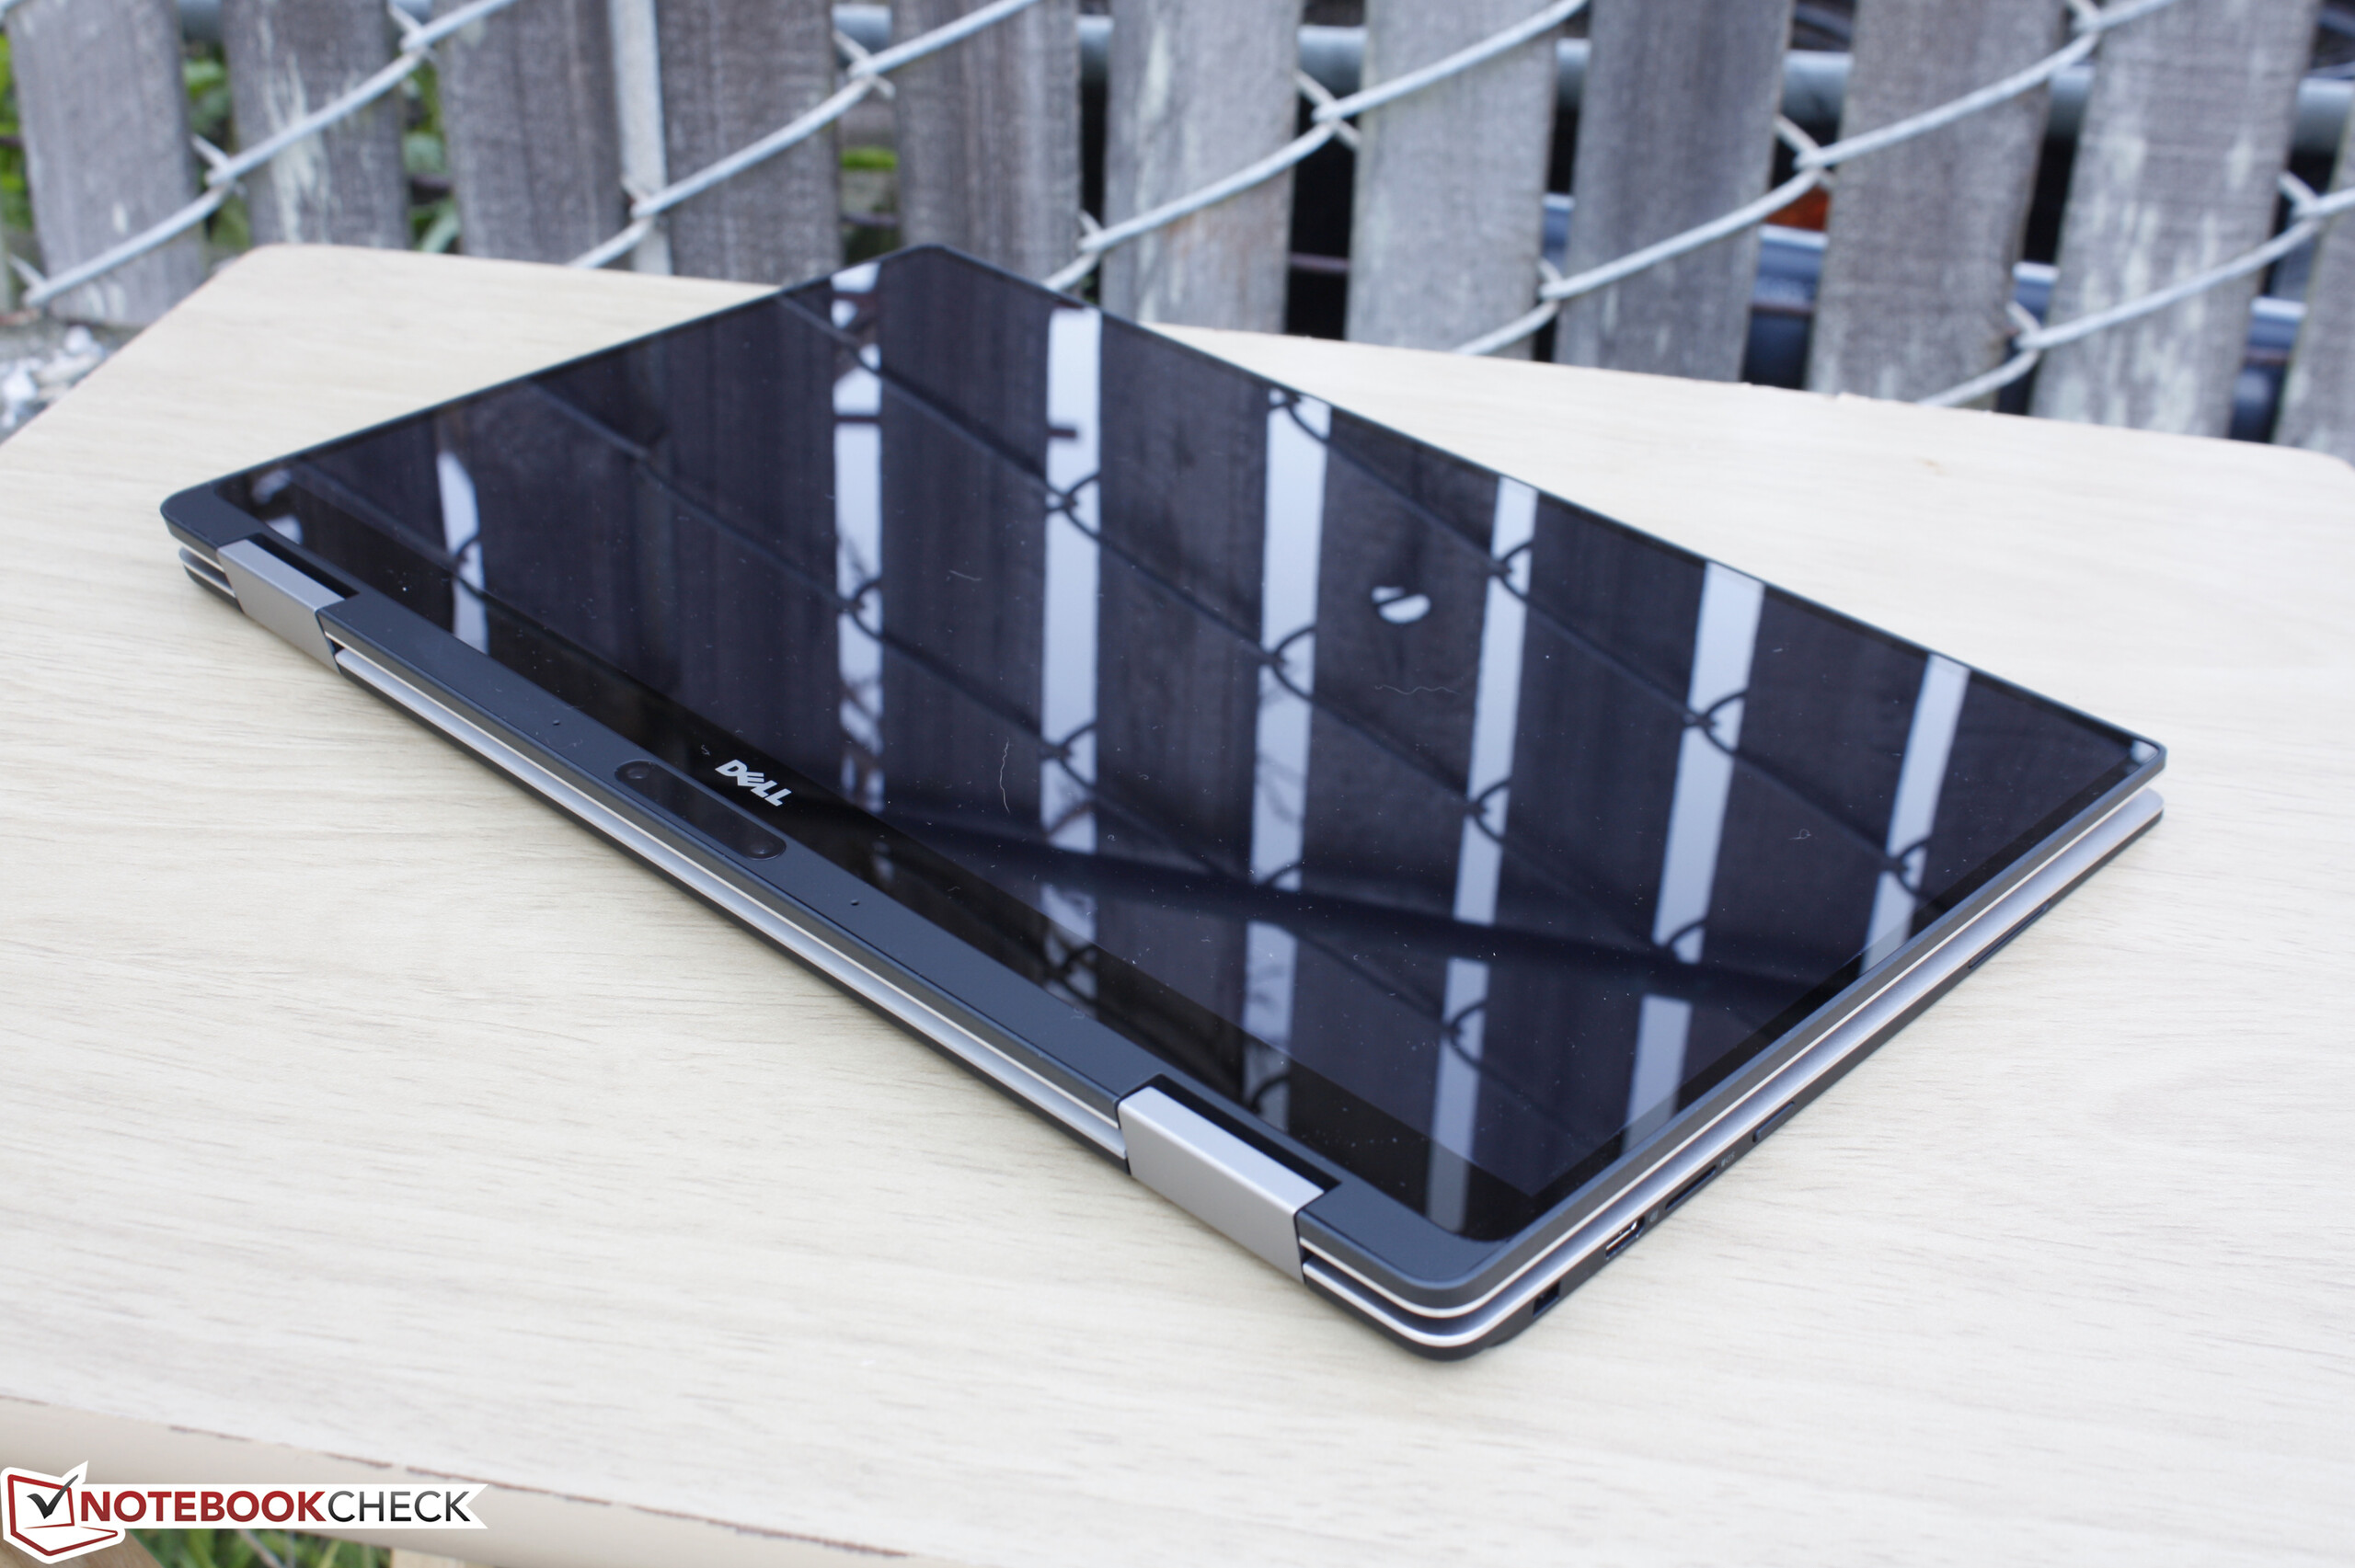
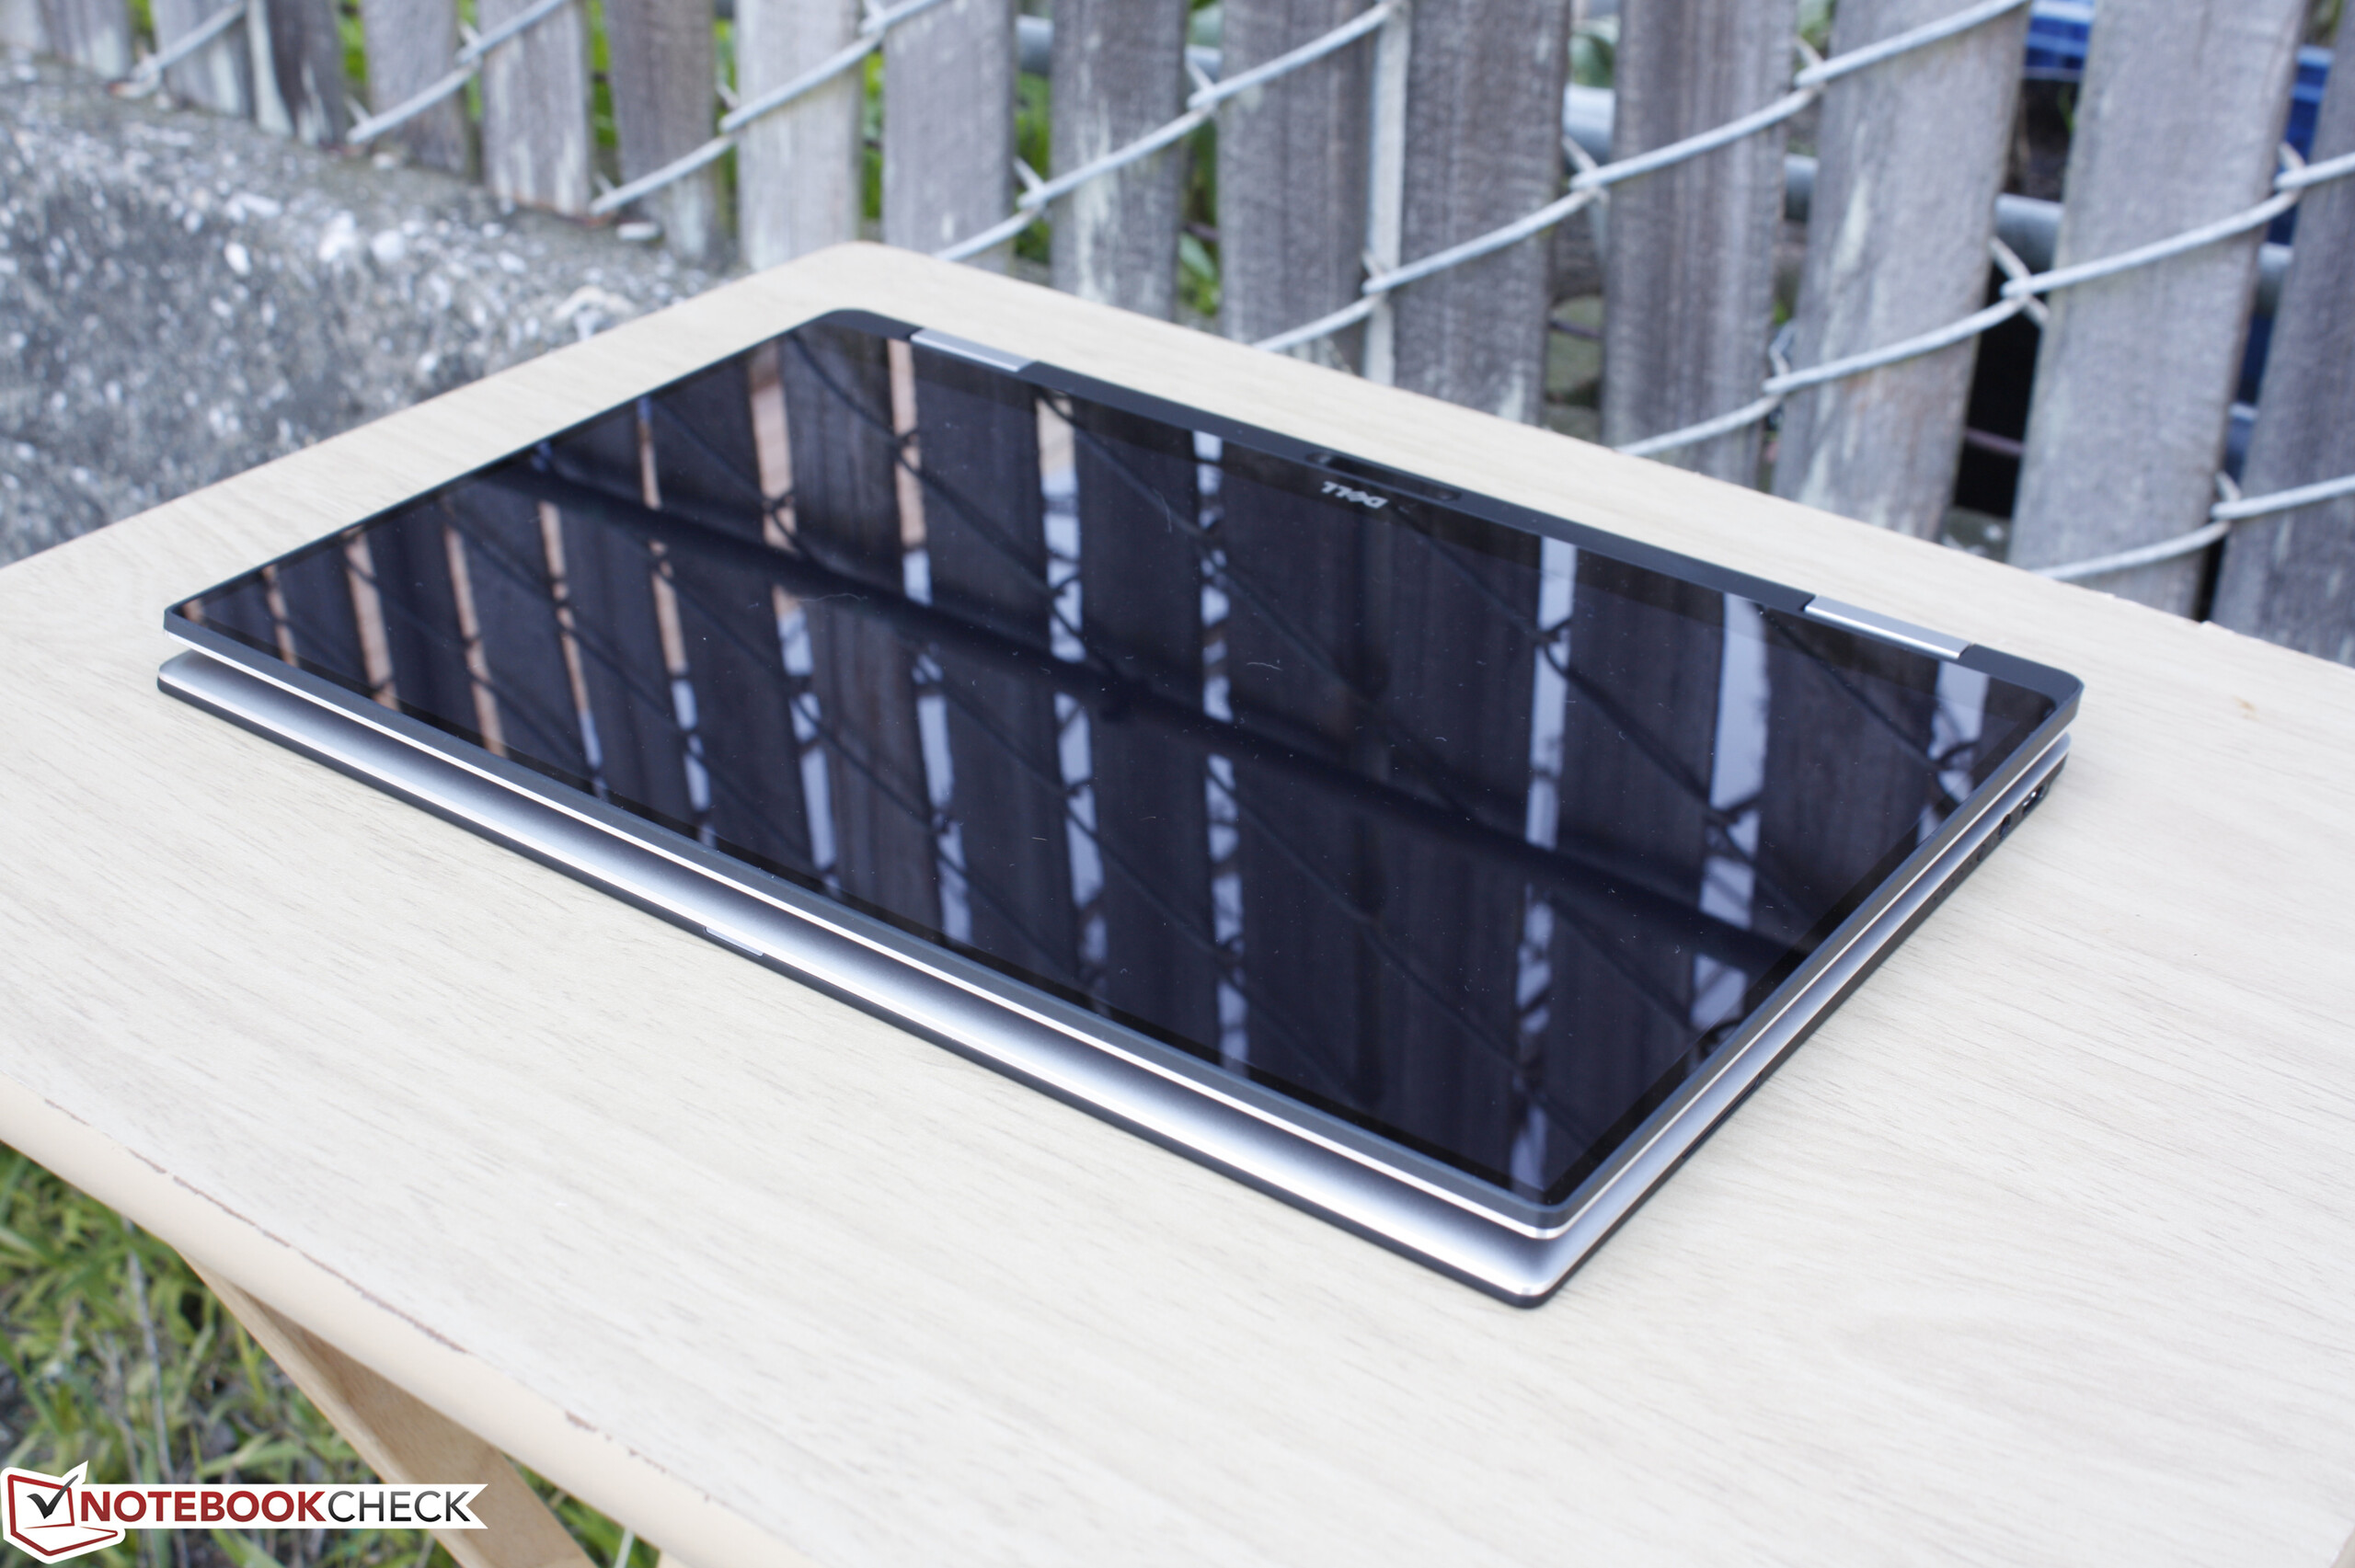
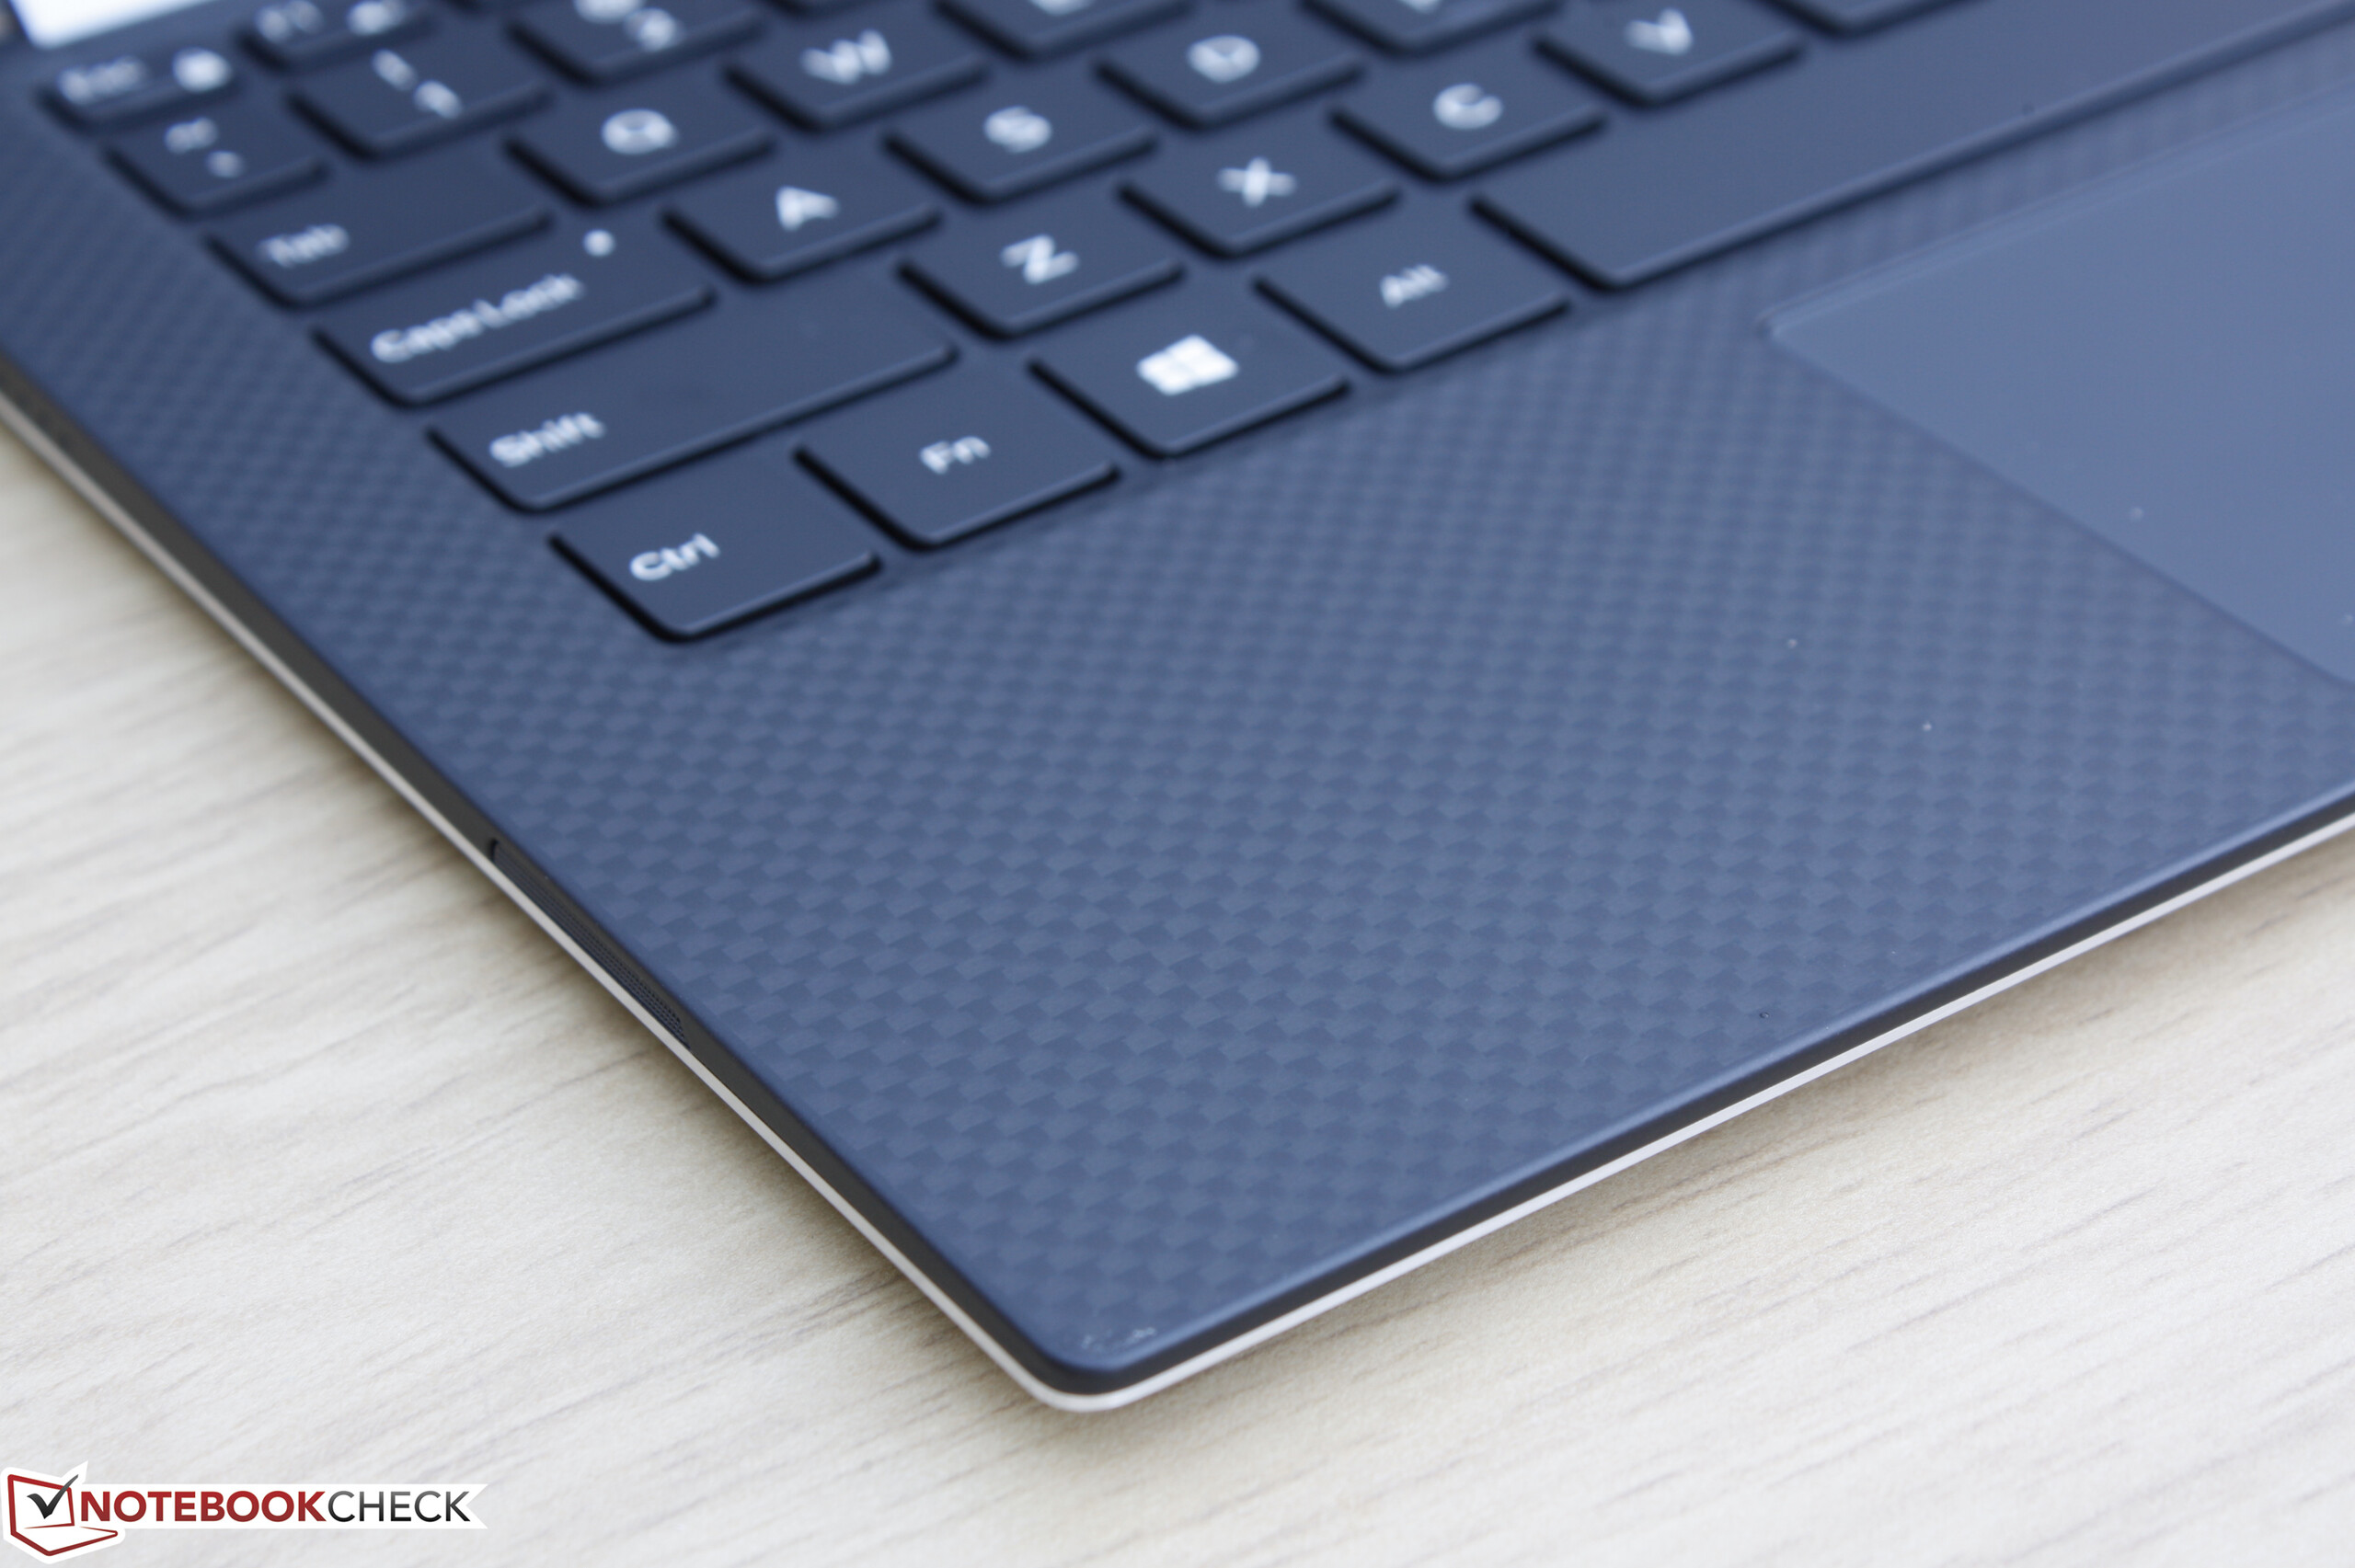
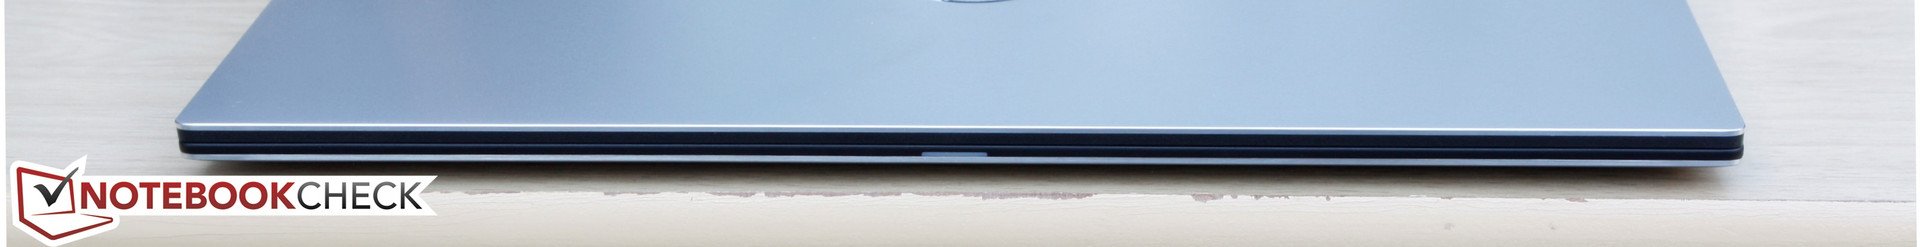
The overall design of the XPS 13 2-in-1 captures the look and feel of the standard XPS 13. It utilizes the same machined aluminum outer surfaces, carbon fiber palm rests, and slightly rubberized edges and corners that work well to provide extra grip when in tablet mode. Of course, the signature InfinityEdge bezel returns on all three sides of the display as opposed to HP's approach on the Spectre x360 13.
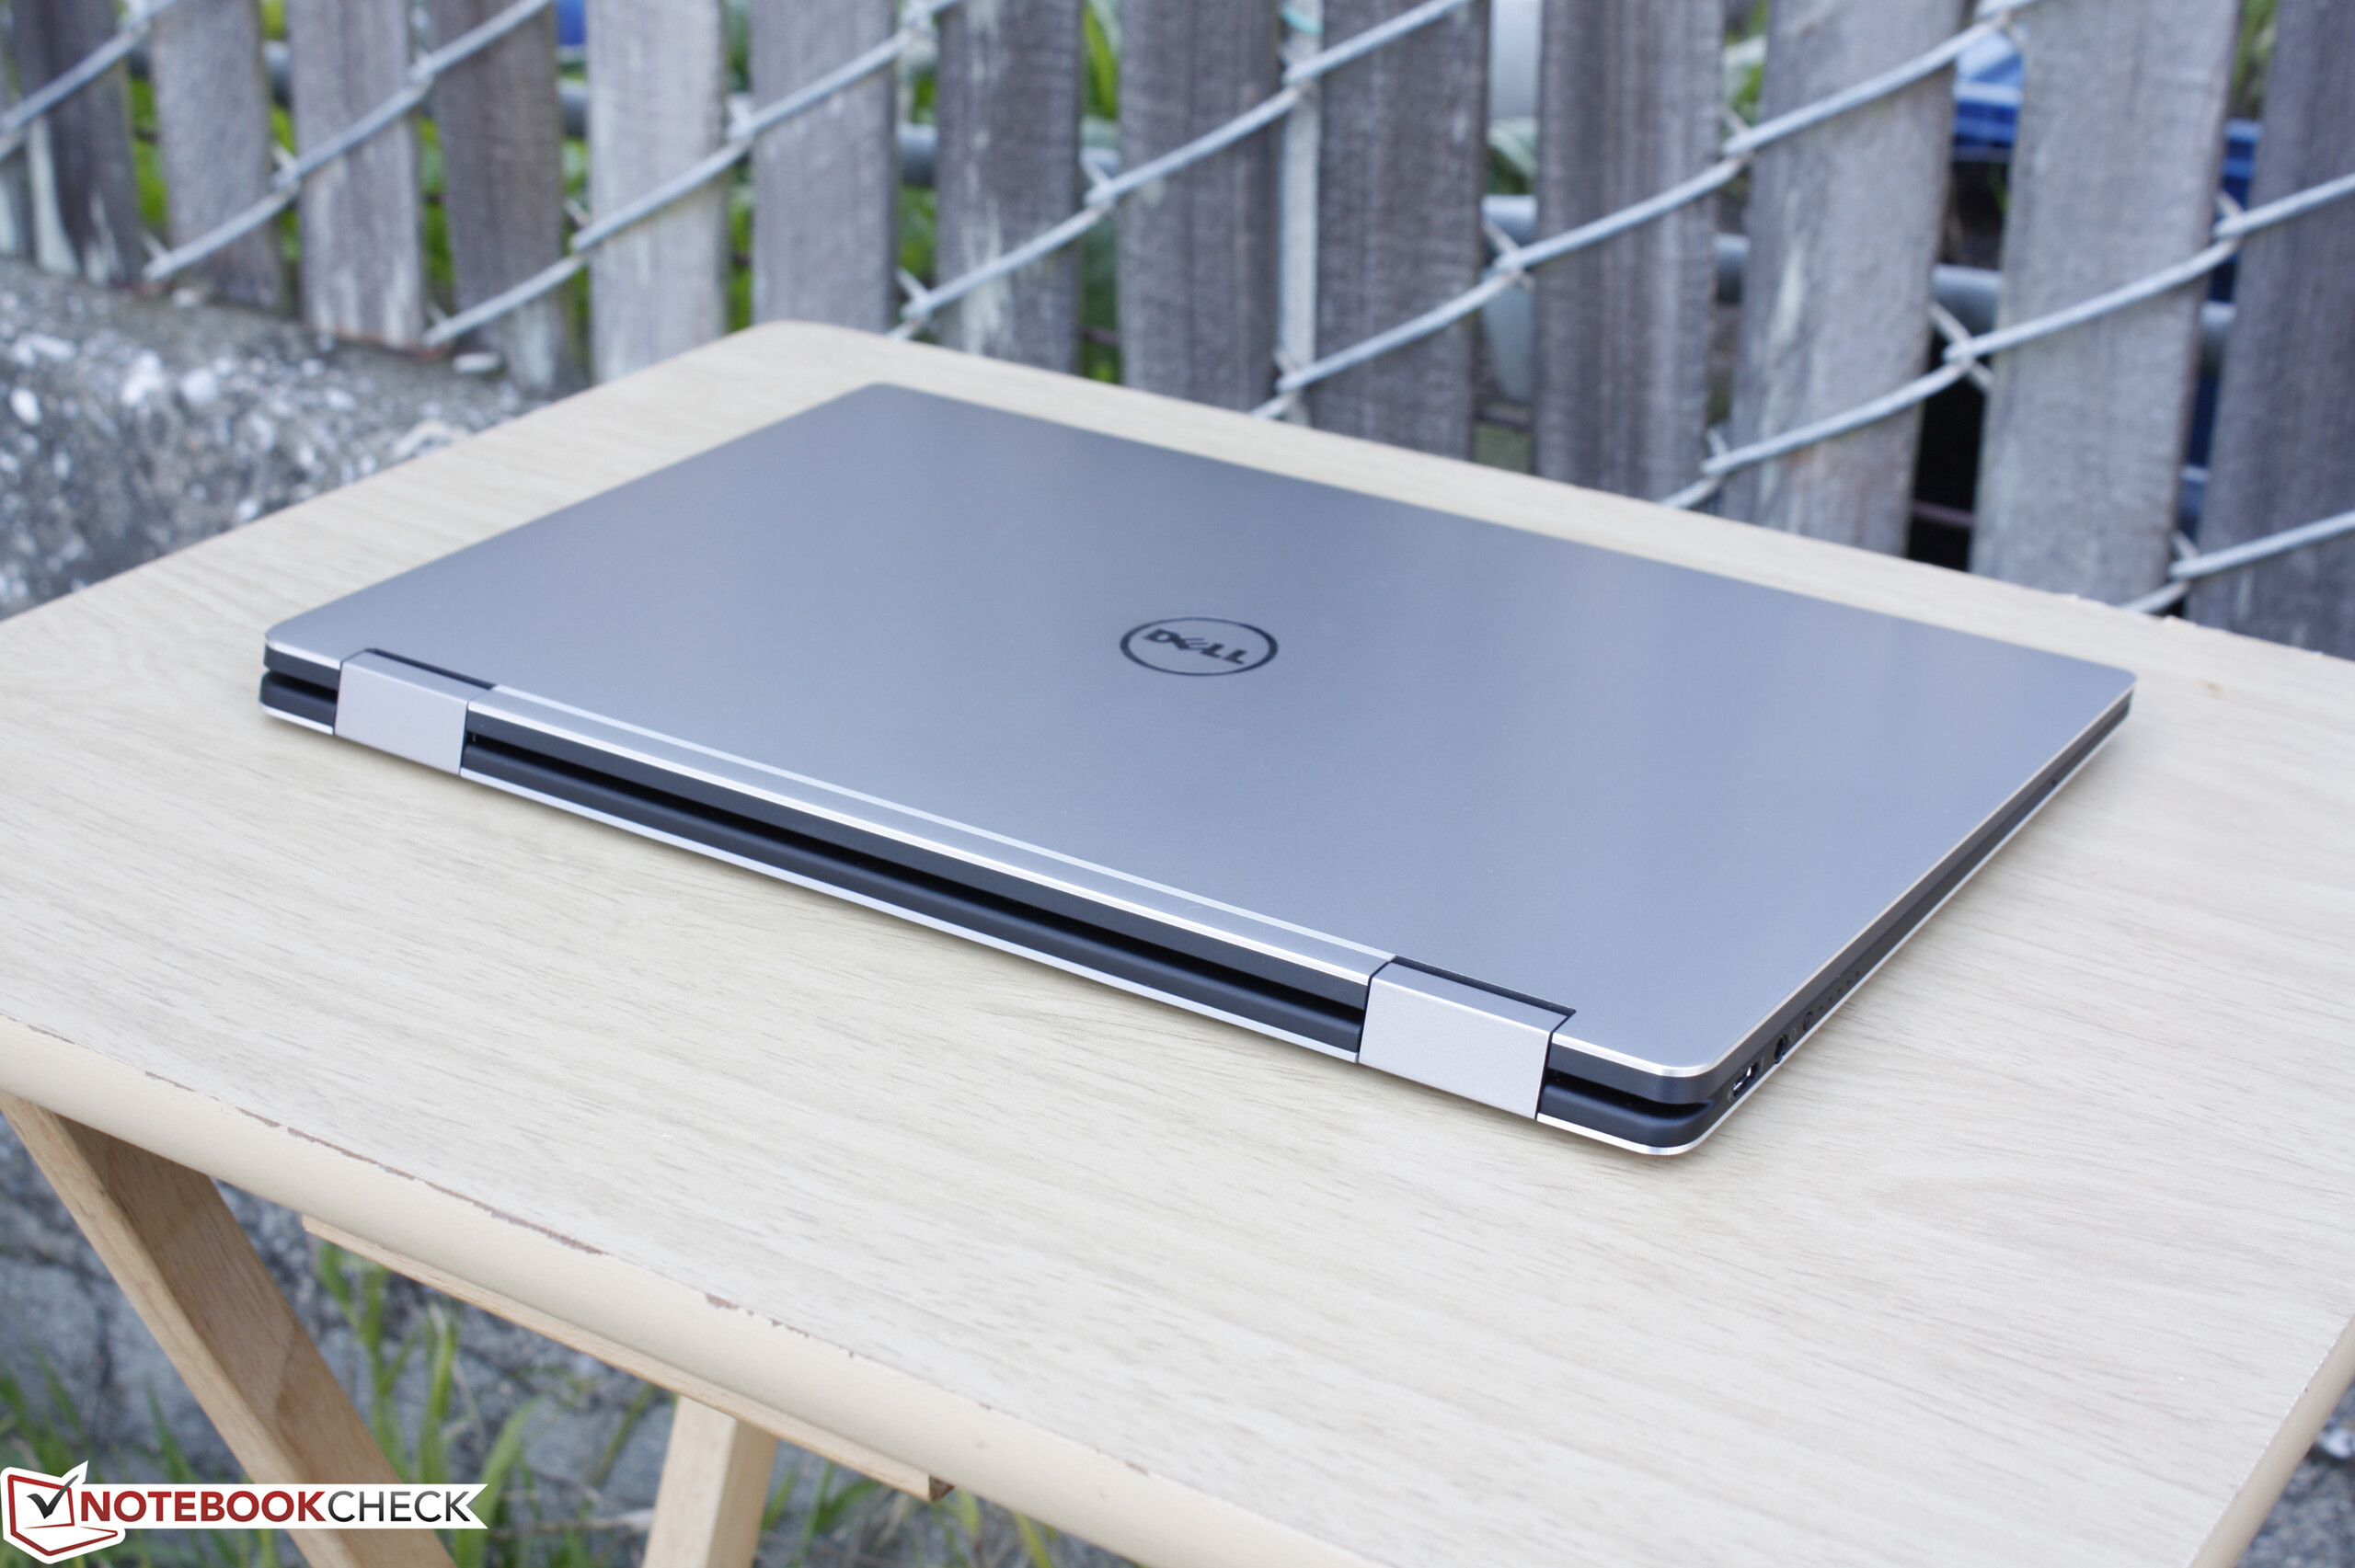
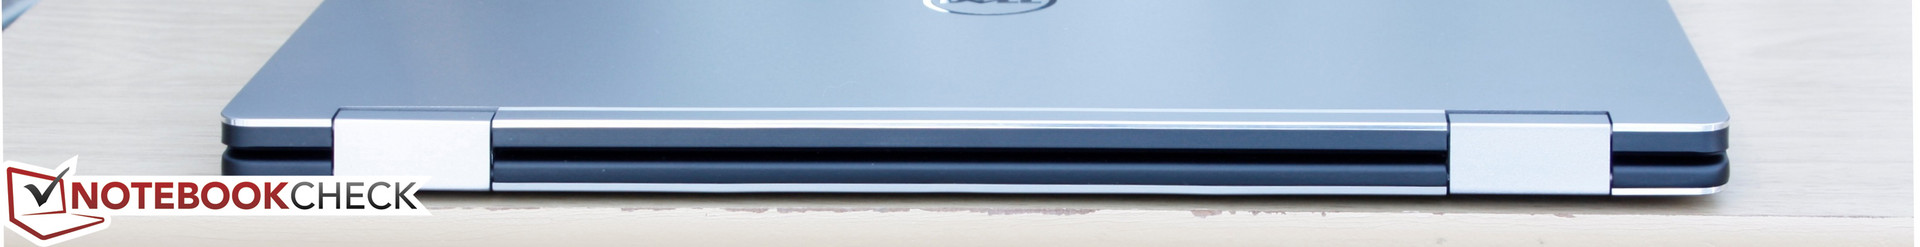
The dual hinges are a departure from the single-bar design of the XPS 13. Fortunately, they function as intended up to the maximum 360-degree angle with no inconsistencies or major teetering when typing. The edge-to-edge glass lid is about as thick as the base of the notebook unlike on most other notebooks, so the weight distribution of the Dell feels more even and predictable when handling in tablet mode.
Workmanship is excellent from top to bottom with no unintended gaps between materials. The lid is surprisingly almost as rigid as the base, so the extra narrow bezels appear to have no negative impact on the design. Attempting to twist or bend the notebook will result in very minor creaking that should be no cause for concern. Perhaps the weakest spots of the chassis are the areas between the two hinges both on the display and keyboard portions. These areas flex slightly more easily with applied pressure compared to the original XPS 13.
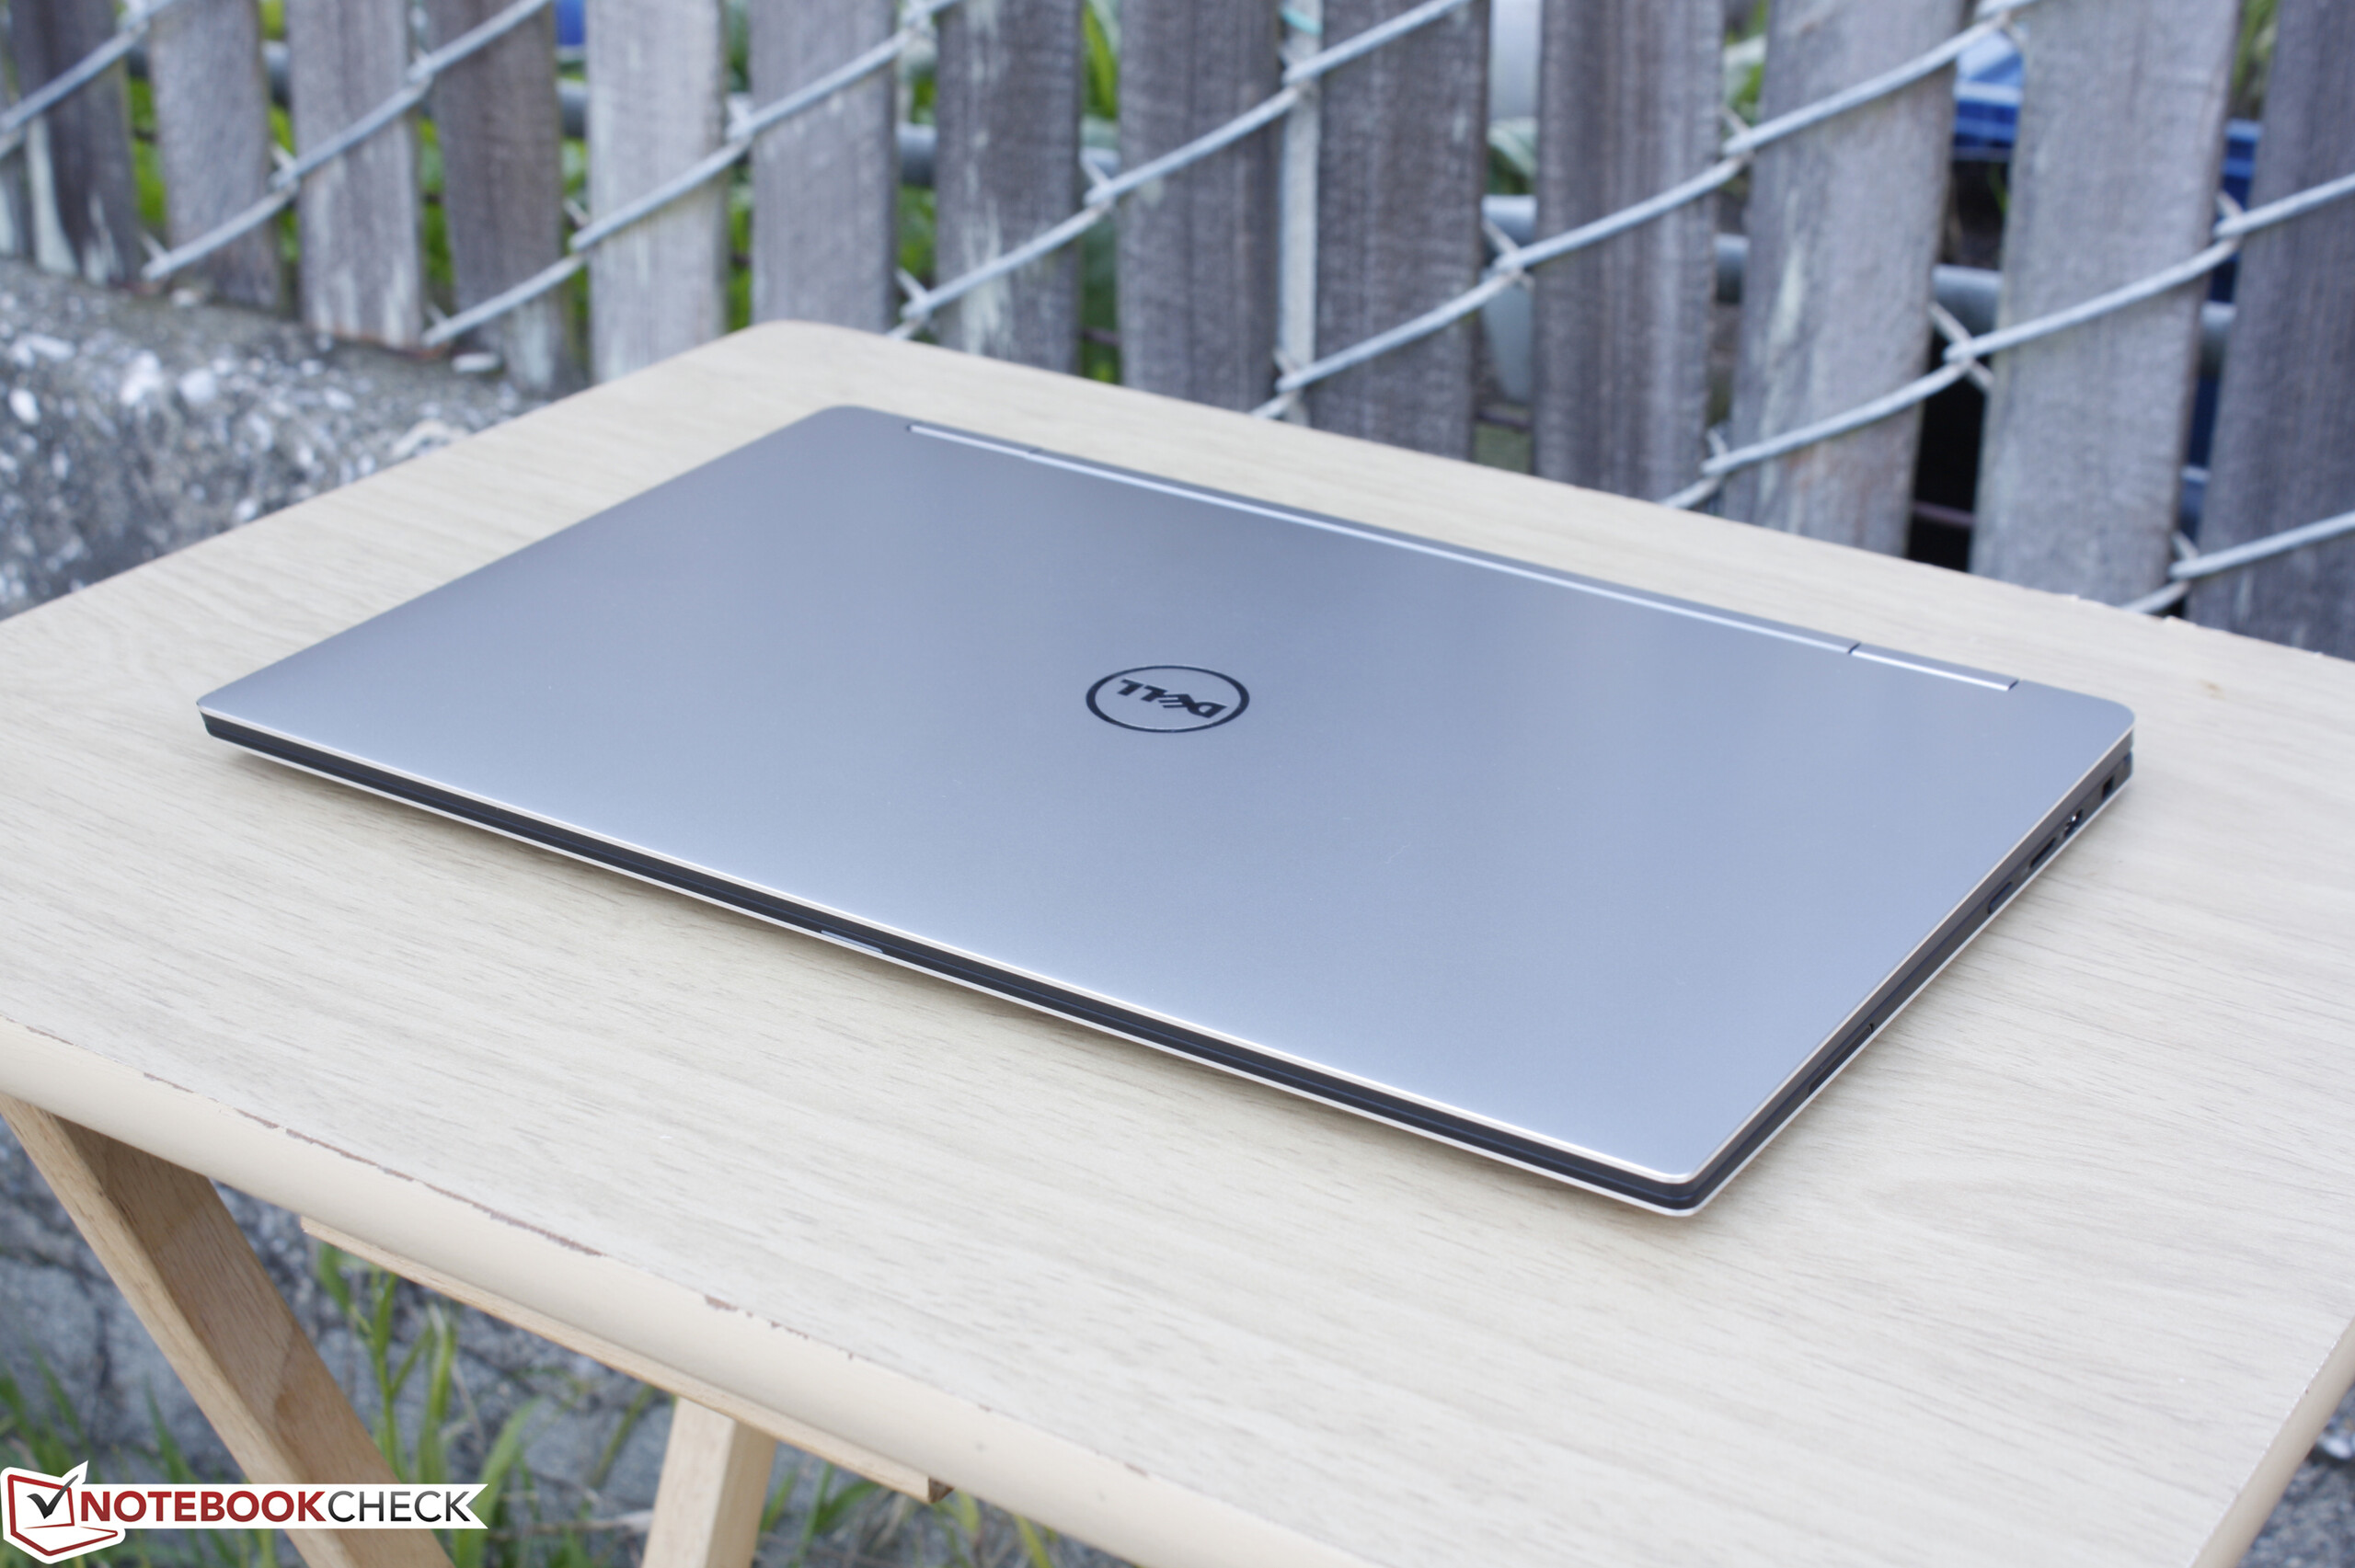
Size and weight are nearly the same as the XPS 13 if not just slightly thinner on the 2-in-1 design. A major reason for the switch to the Kaby Lake Y-series may have been to maintain a weight of about 1.2 kg compared to 1.3 kg and 1.4 kg on the Spectre x360 13 and Yoga 910, respectively. Combine this with the smaller footprint from the InfinityEdge bezel design and you have a convertible that is very portable and easier to use in tablet mode.
Connectivity
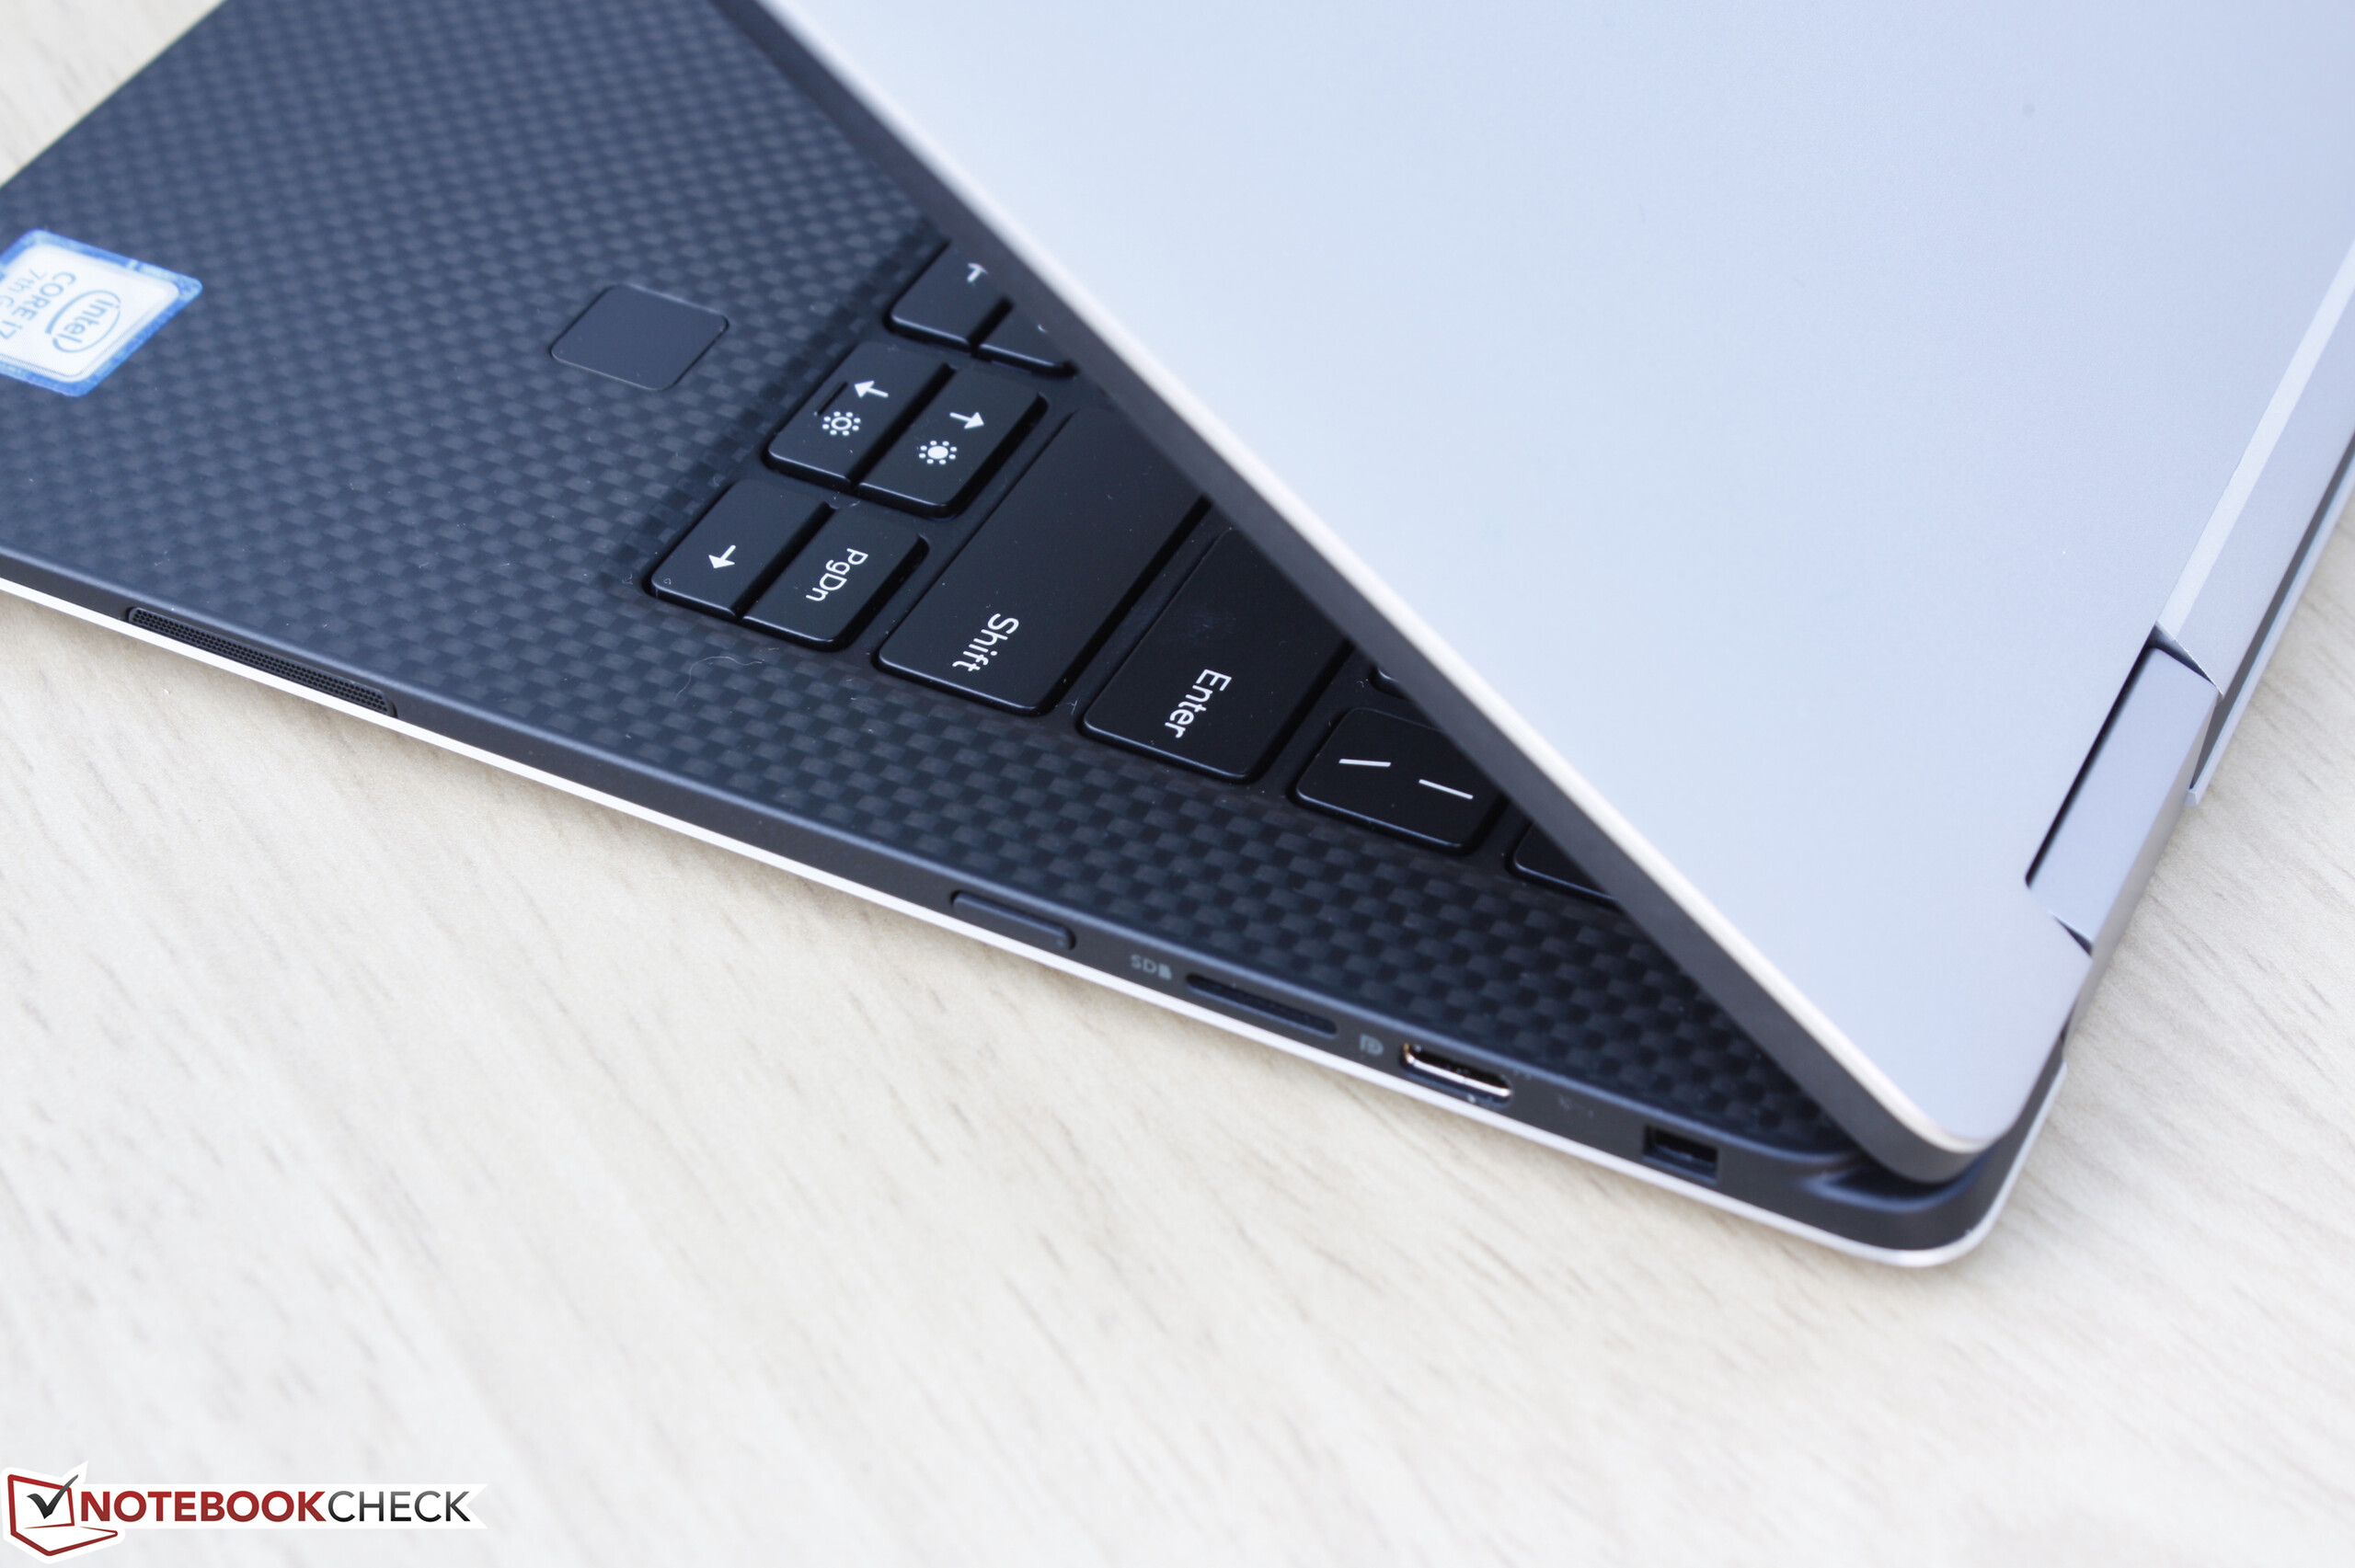
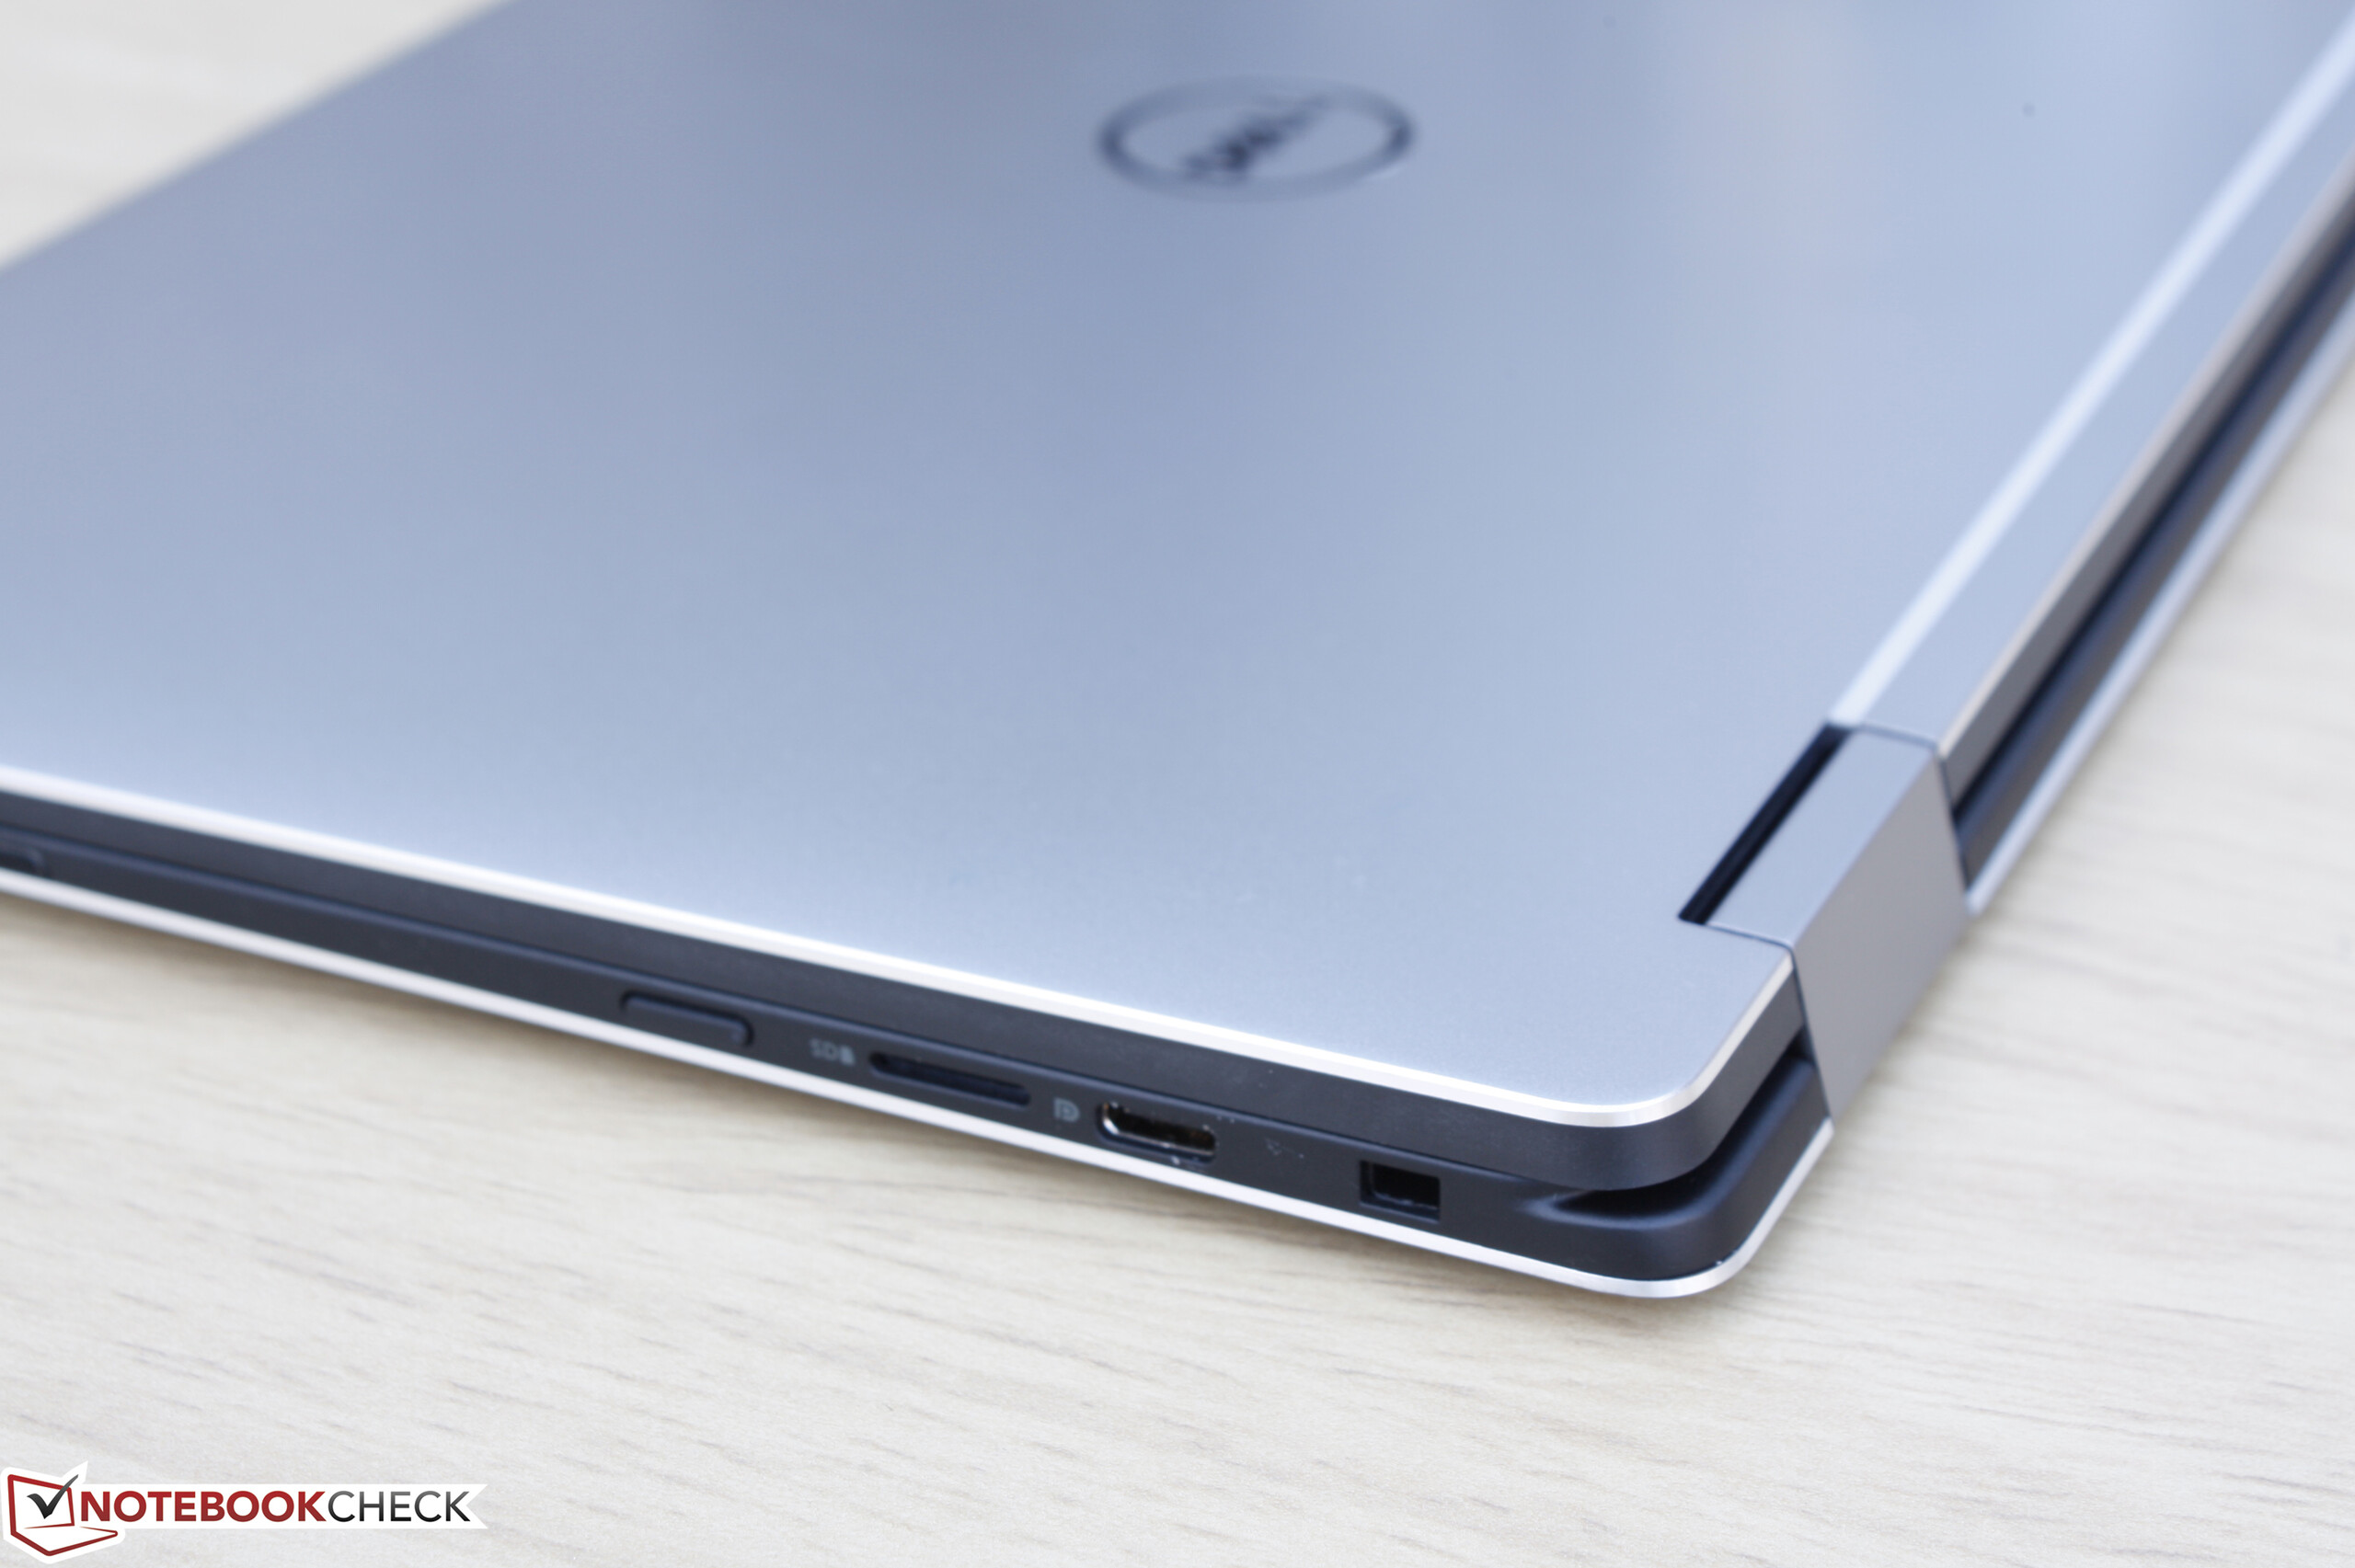
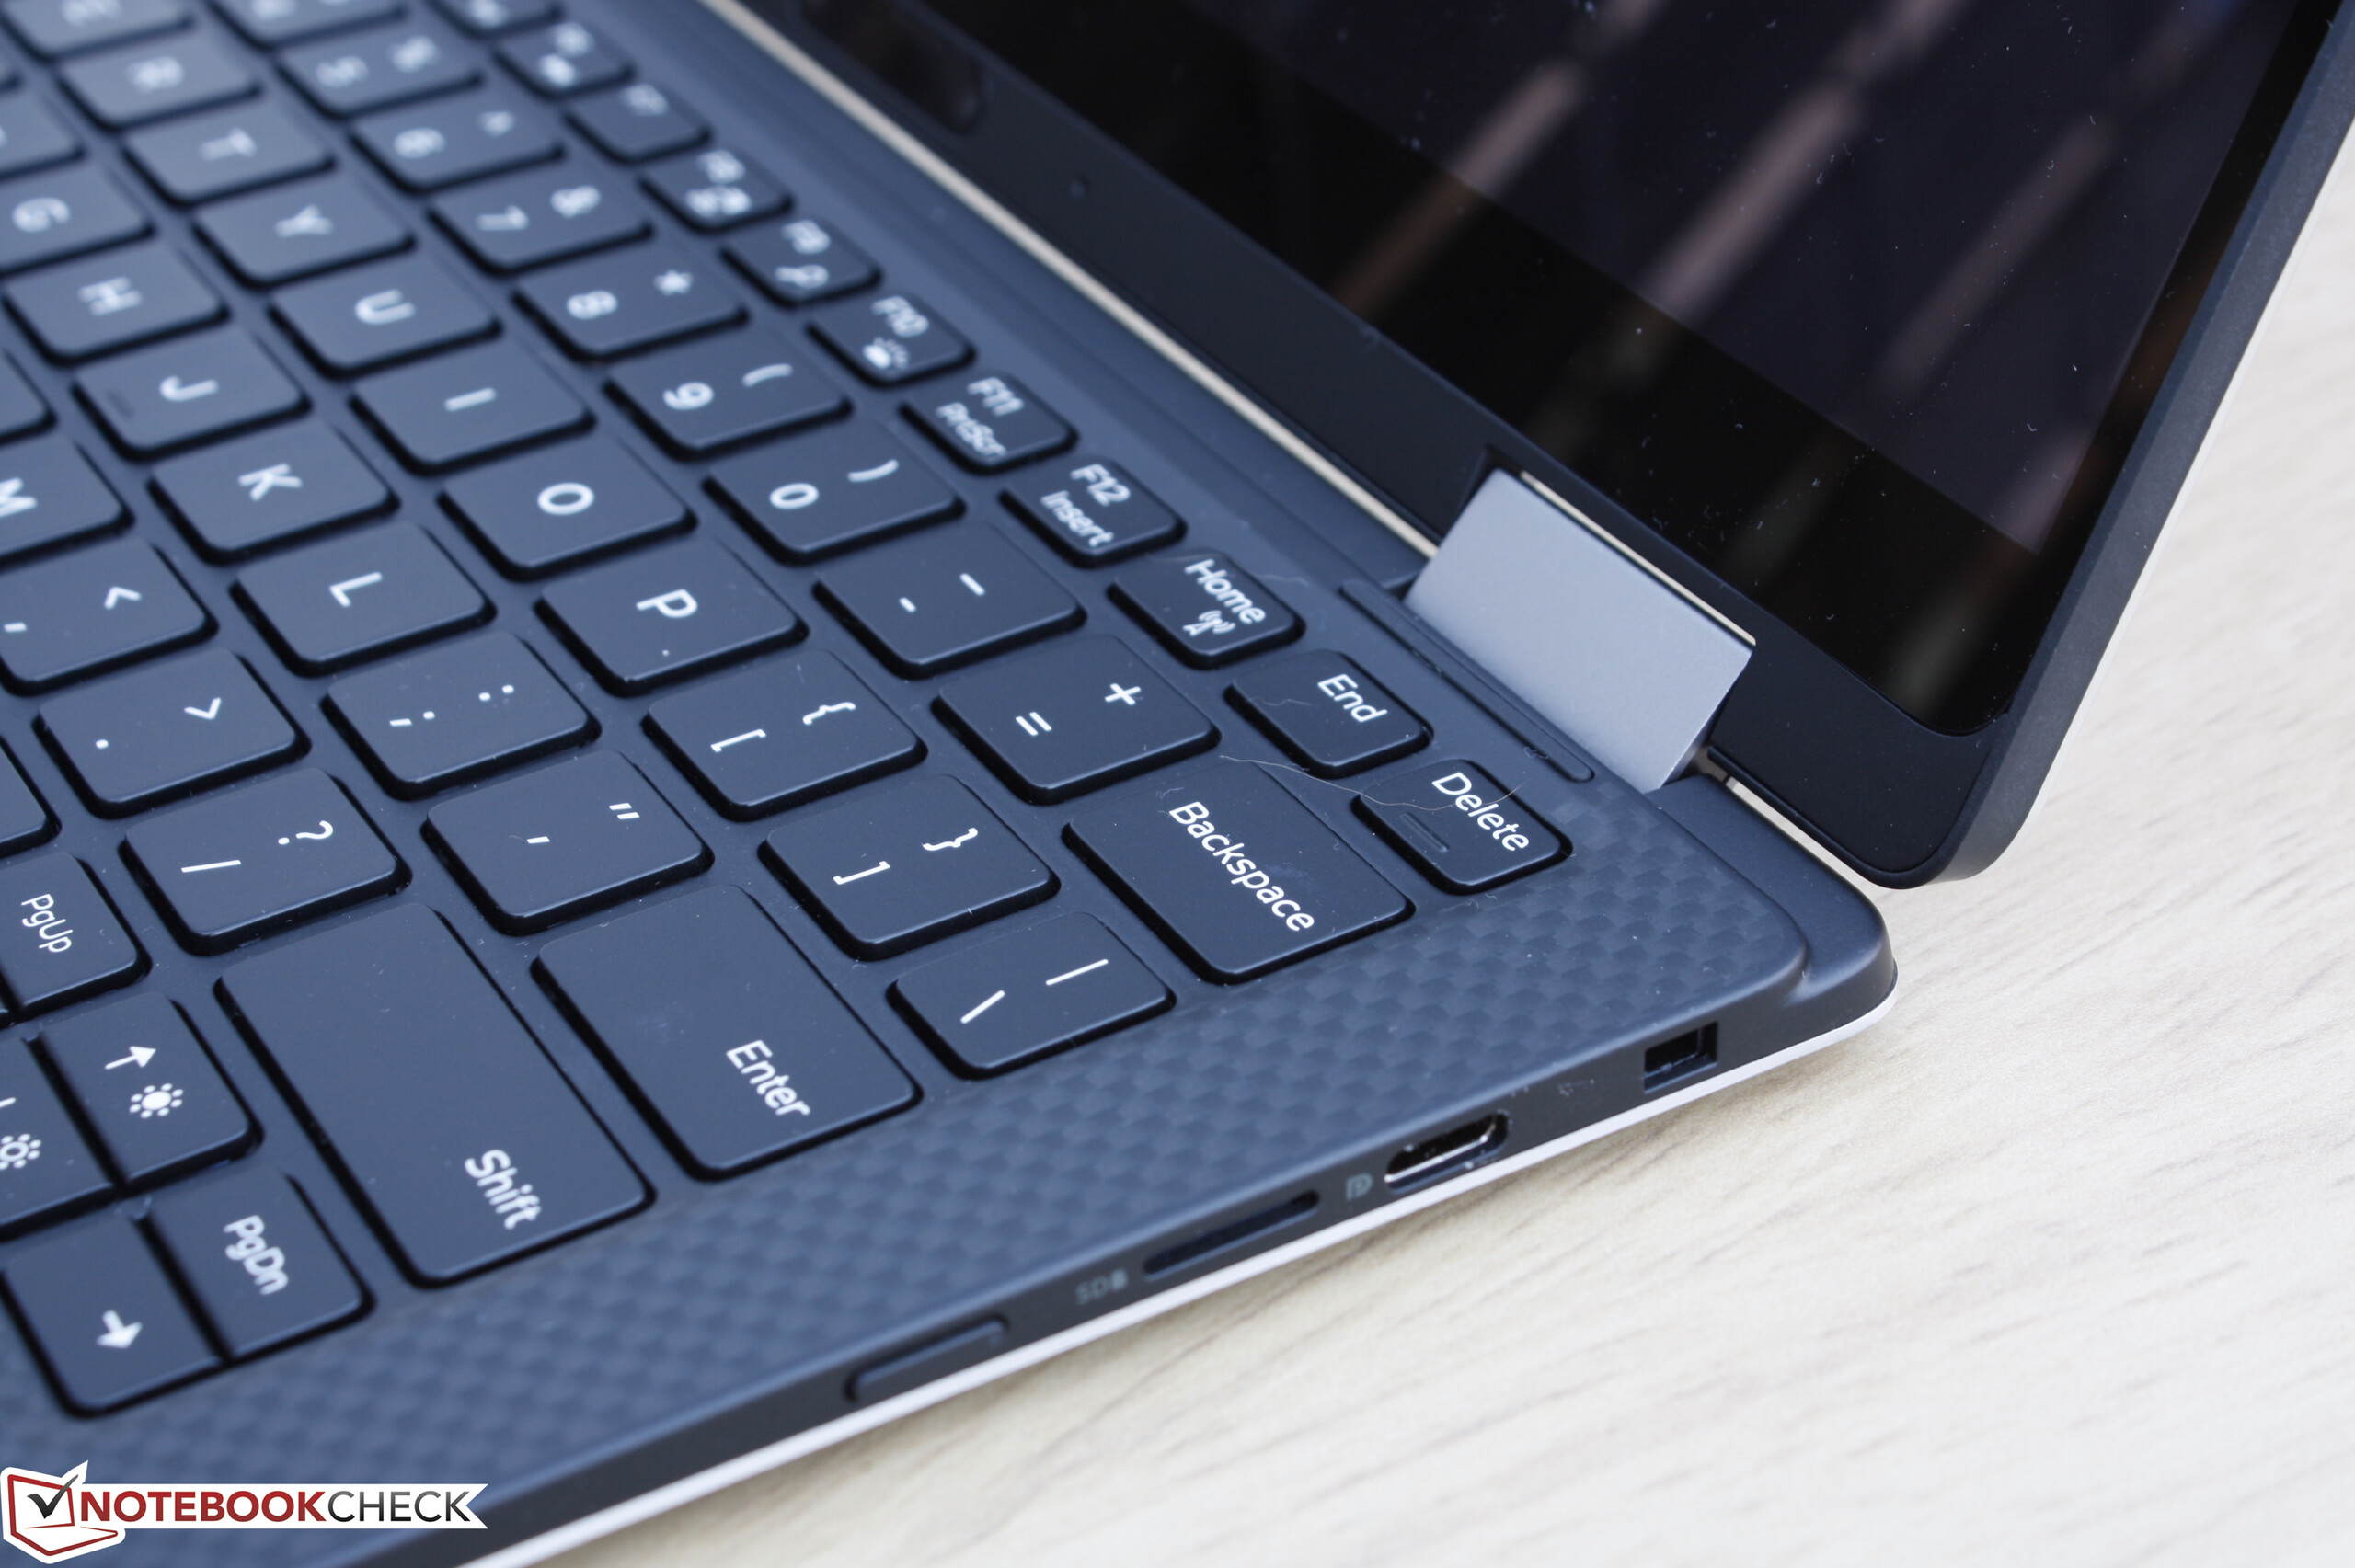
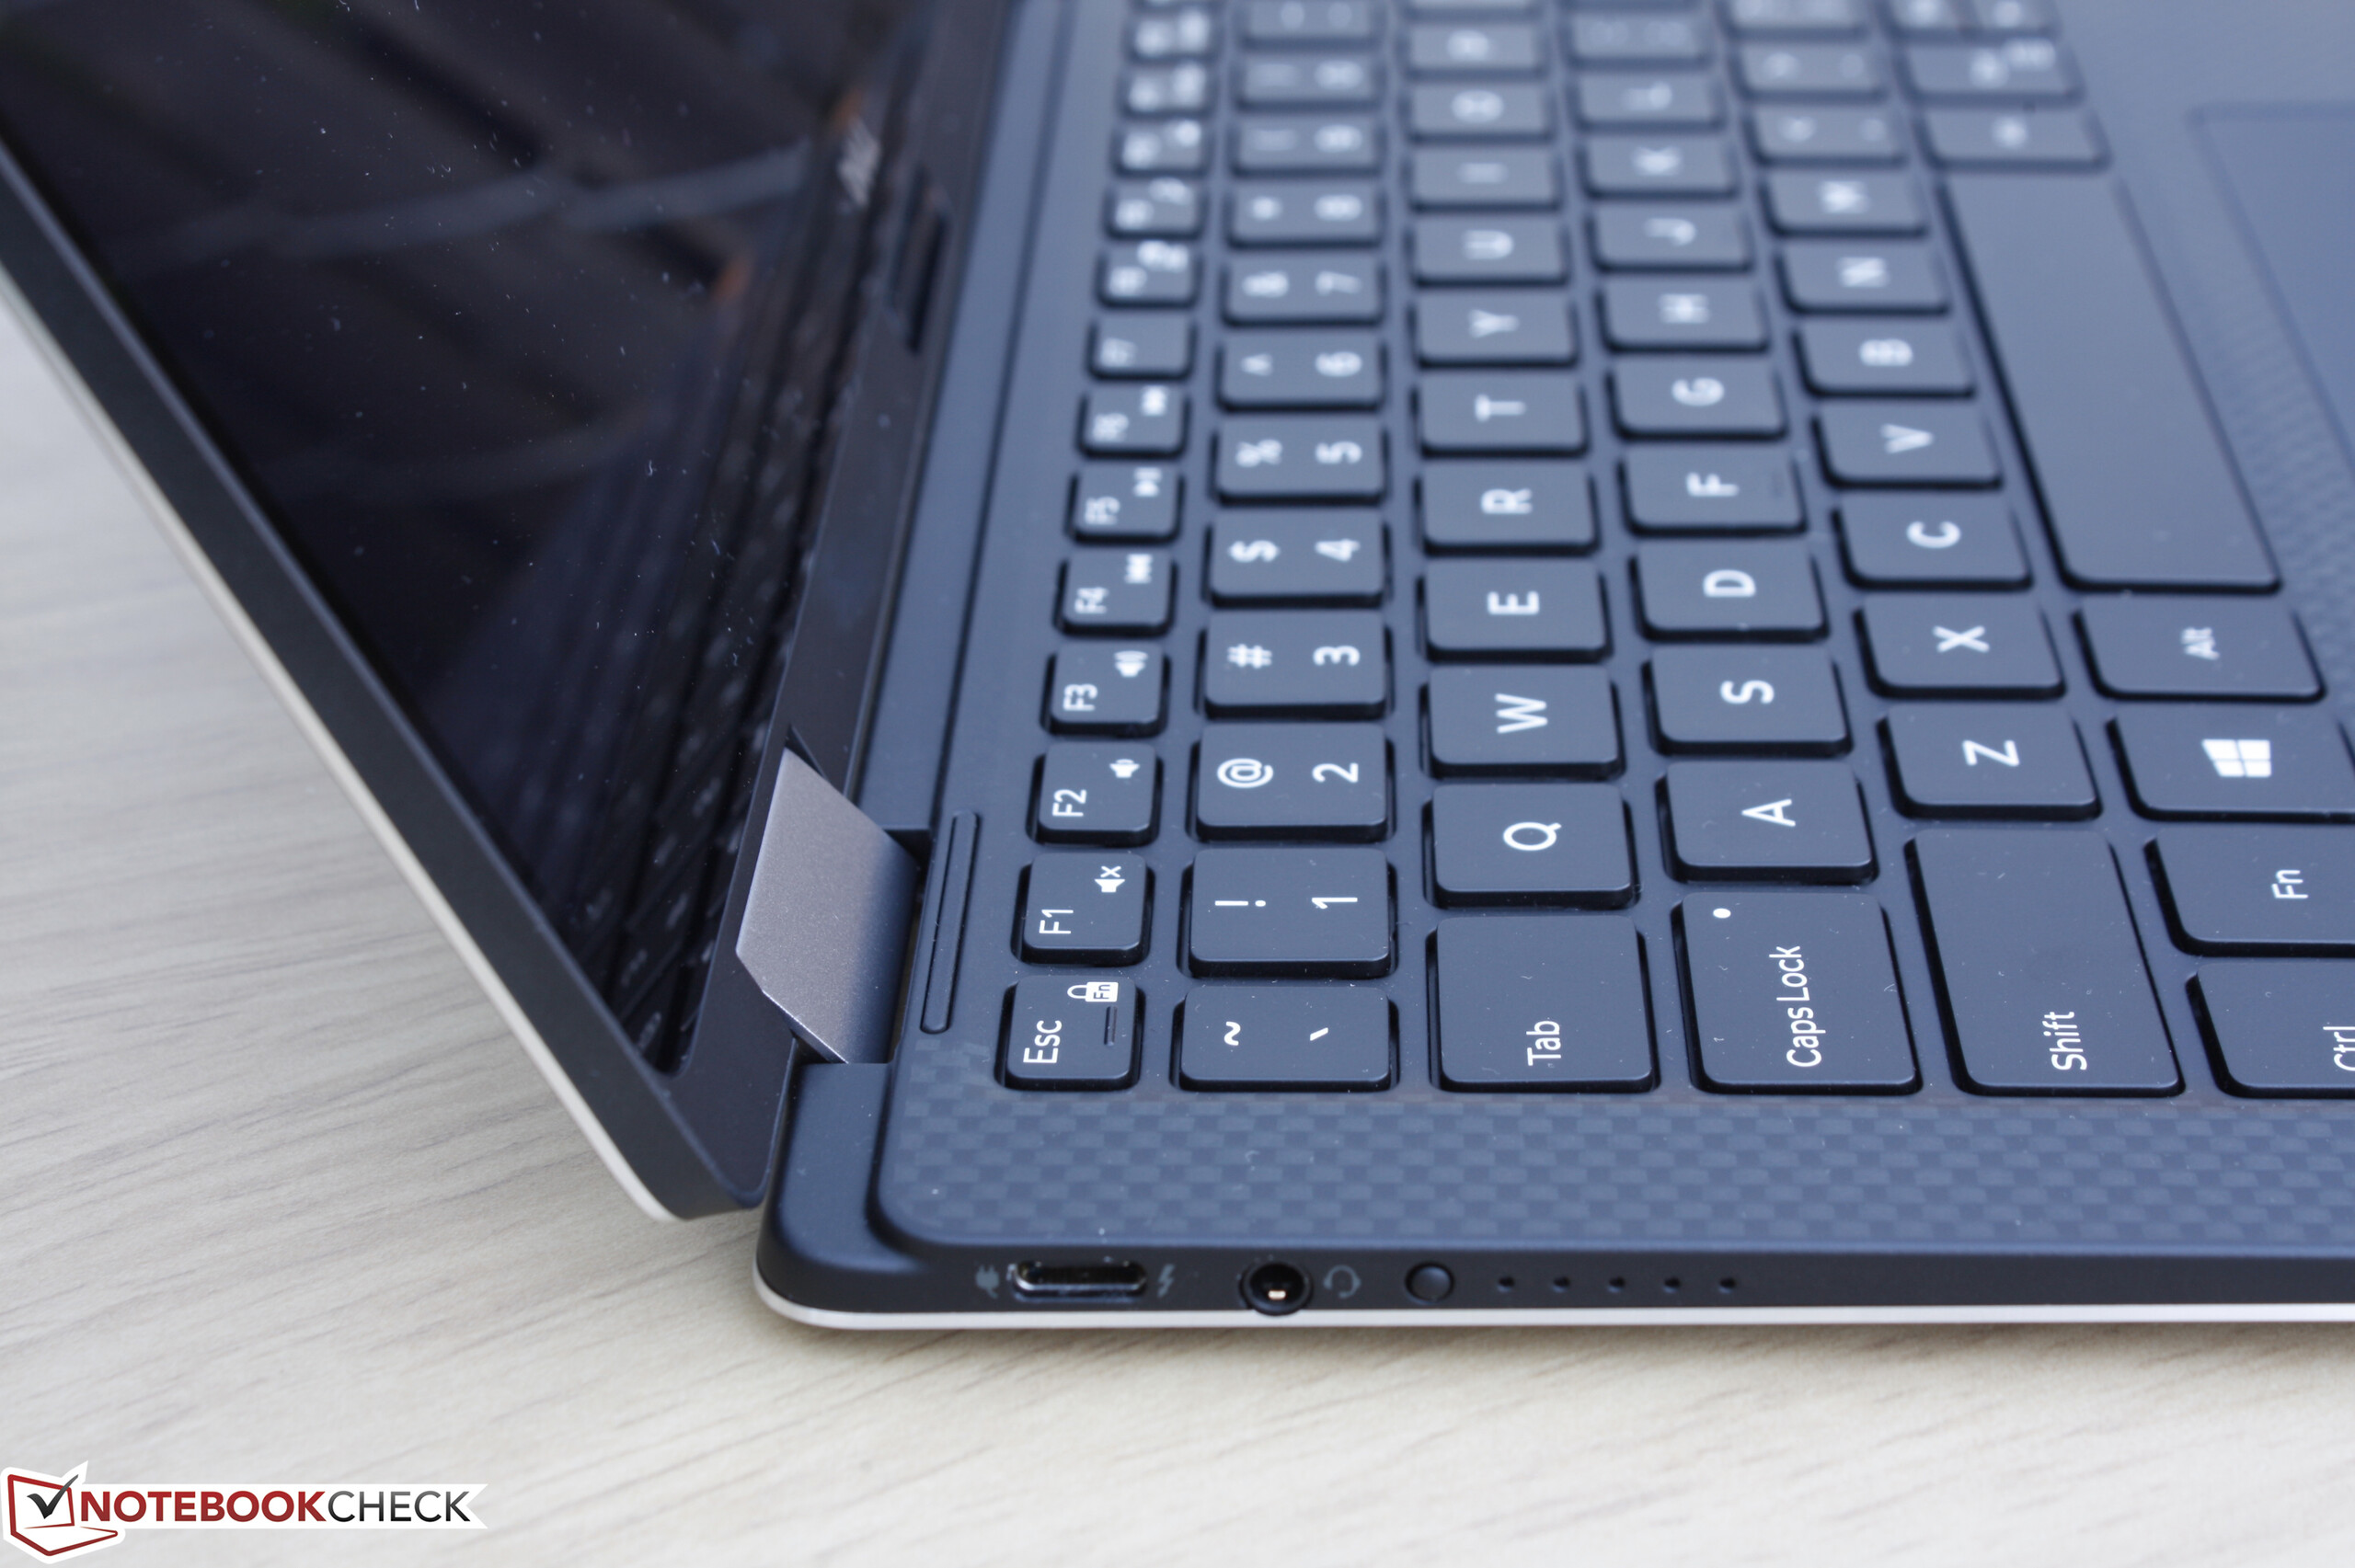
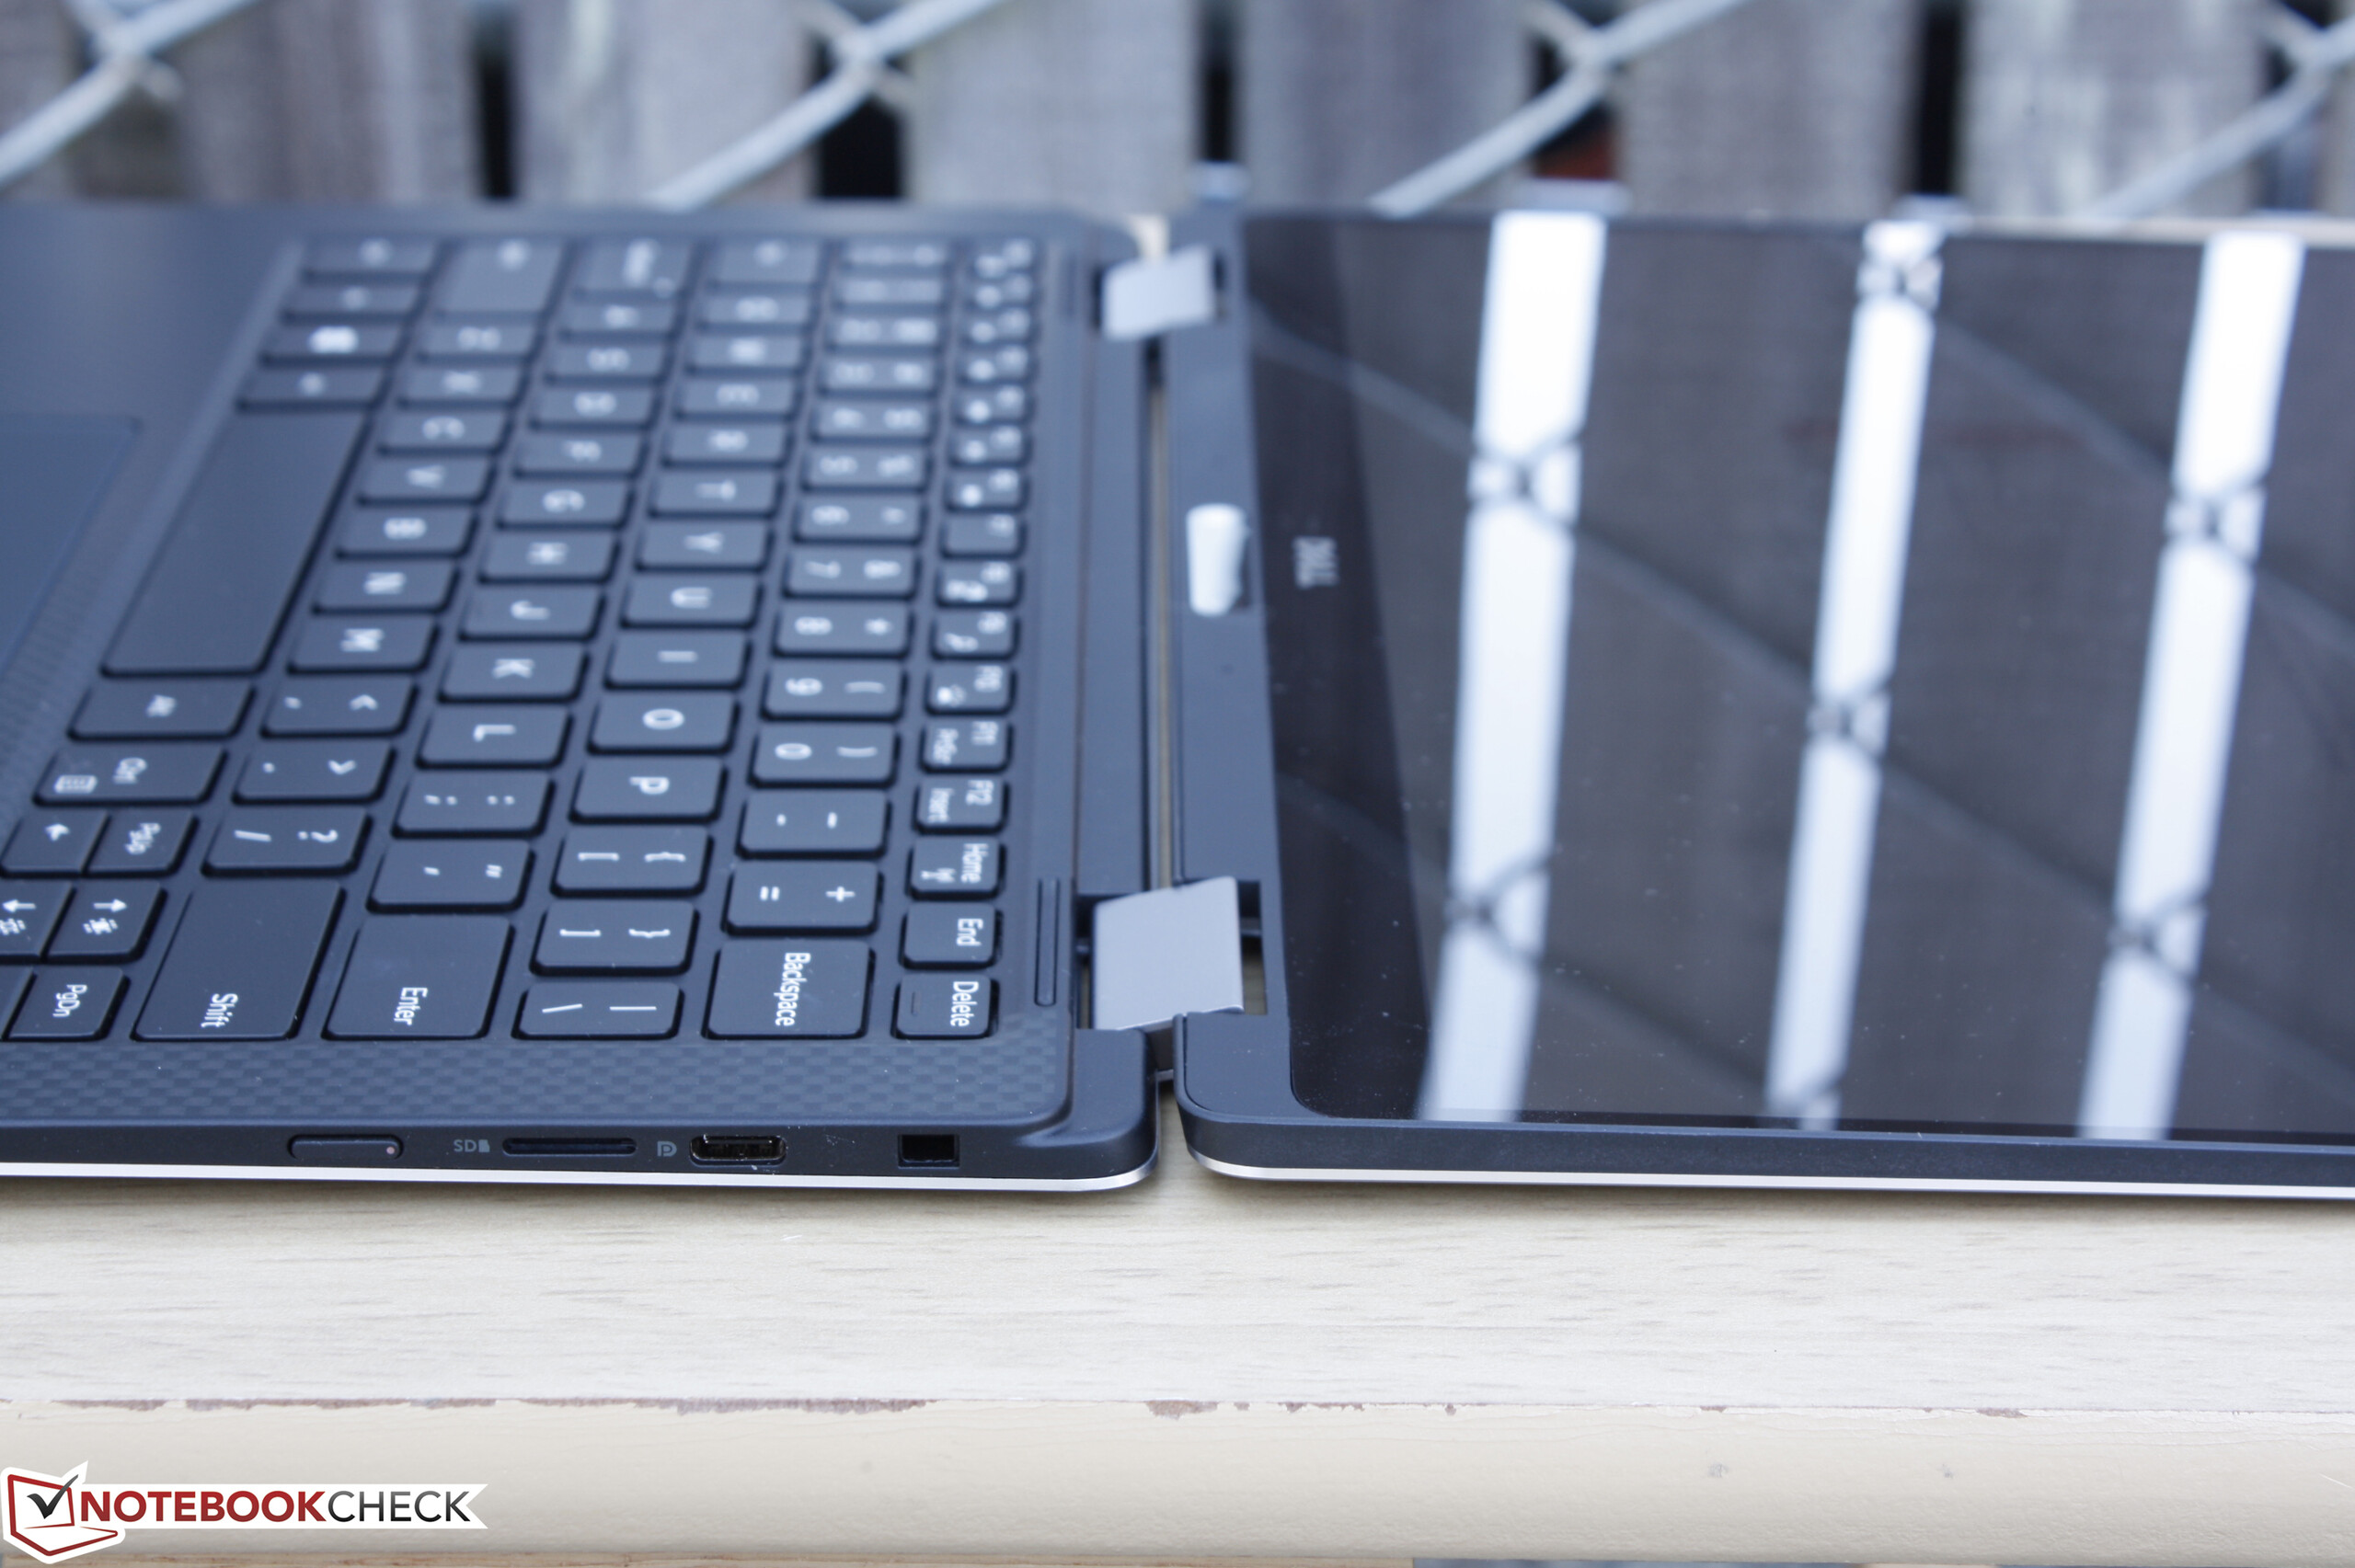
Available ports are fewer than on the XPS 13 with just two USB Type-C ports and a standard 3.5 mm audio jack. Since each of the USB Type-C ports also double as a charging port, users will have just one port to work with when connected to mains. In comparison, both the Yoga 910 and Spectre x360 13 convertibles have one USB Type-A port each in addition to USB Type-C to reduce the need for dongles and adapters. Thunderbolt 3 is enabled on the XPS 2-in-1 only for the USB port on the right edge.


SD Card Reader
The XPS 2-in-1 drops the full-size SD reader on the XPS 13 9350/9360 in favor of a MicroSD reader. While somewhat disappointing, this is at least better than on the Spectre 13 and Spectre x360 13, both of which have no integrated SD readers at all. The MicroSD card sits flush against the edge of the XPS 2-in-1 when inserted, so users with larger fingers may have some trouble ejecting the card.
Transfer rates from the MicroSD reader are significantly slower than the SD reader on the XPS 13 according to our Toshiba Exceria Pro MicroSDXC test card. Transferring 1 GB worth of images from the reader to desktop will take about 17 seconds.
| SD Card Reader | |
| average JPG Copy Test (av. of 3 runs) | |
| Dell XPS 13 9360 FHD i5 | |
| Lenovo ThinkPad E570-20H6S00000 | |
| Dell XPS 13-9365 2-in-1 | |
| maximum AS SSD Seq Read Test (1GB) | |
| Dell XPS 13 9360 FHD i5 | |
| Dell XPS 13-9365 2-in-1 | |
| Lenovo ThinkPad E570-20H6S00000 | |
Communication
WLAN is provided by an Intel 8265 M.2 1216 module capable of theoretical transfer rates of up to 867 Mbps. All SKUs make use of the same Intel WLAN module with no options for the Killer 1535 as found on the XPS 13 9360. When connected to our Linksys EA8500 test router, real-world average transfer rates are about 471 Mbps.
Bluetooth is integrated onto the same WLAN module, but there are no options for NFC or WWAN.
| Networking | |
| iperf3 transmit AX12 | |
| MSI GT72VR 7RE-433 | |
| Dell XPS 13 9360 FHD i5 | |
| Dell XPS 13-9365 2-in-1 | |
| iperf3 receive AX12 | |
| MSI GT72VR 7RE-433 | |
| Dell XPS 13 9360 FHD i5 | |
| Dell XPS 13-9365 2-in-1 | |
Accessories
Aside from the usual AC adapter, Dell throws in a helpful USB Type-C to USB 3.0 dongle with every new purchase of the XPS 2-in-1. The optional Dell DA200 Thunderbolt 3 adapter converts the port to HDMI, VGA, USB 3.0, and RJ-45 all in a single solution for those who may want more out of the XPS system.
An optional active pen is also available for use on the XPS 2-in-1. The notebook chassis includes no recess or dedicated pockets for holding onto the pen unlike on the ThinkPad X1 Yoga.
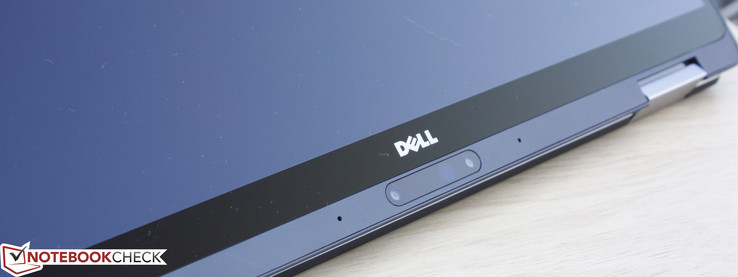
Camera
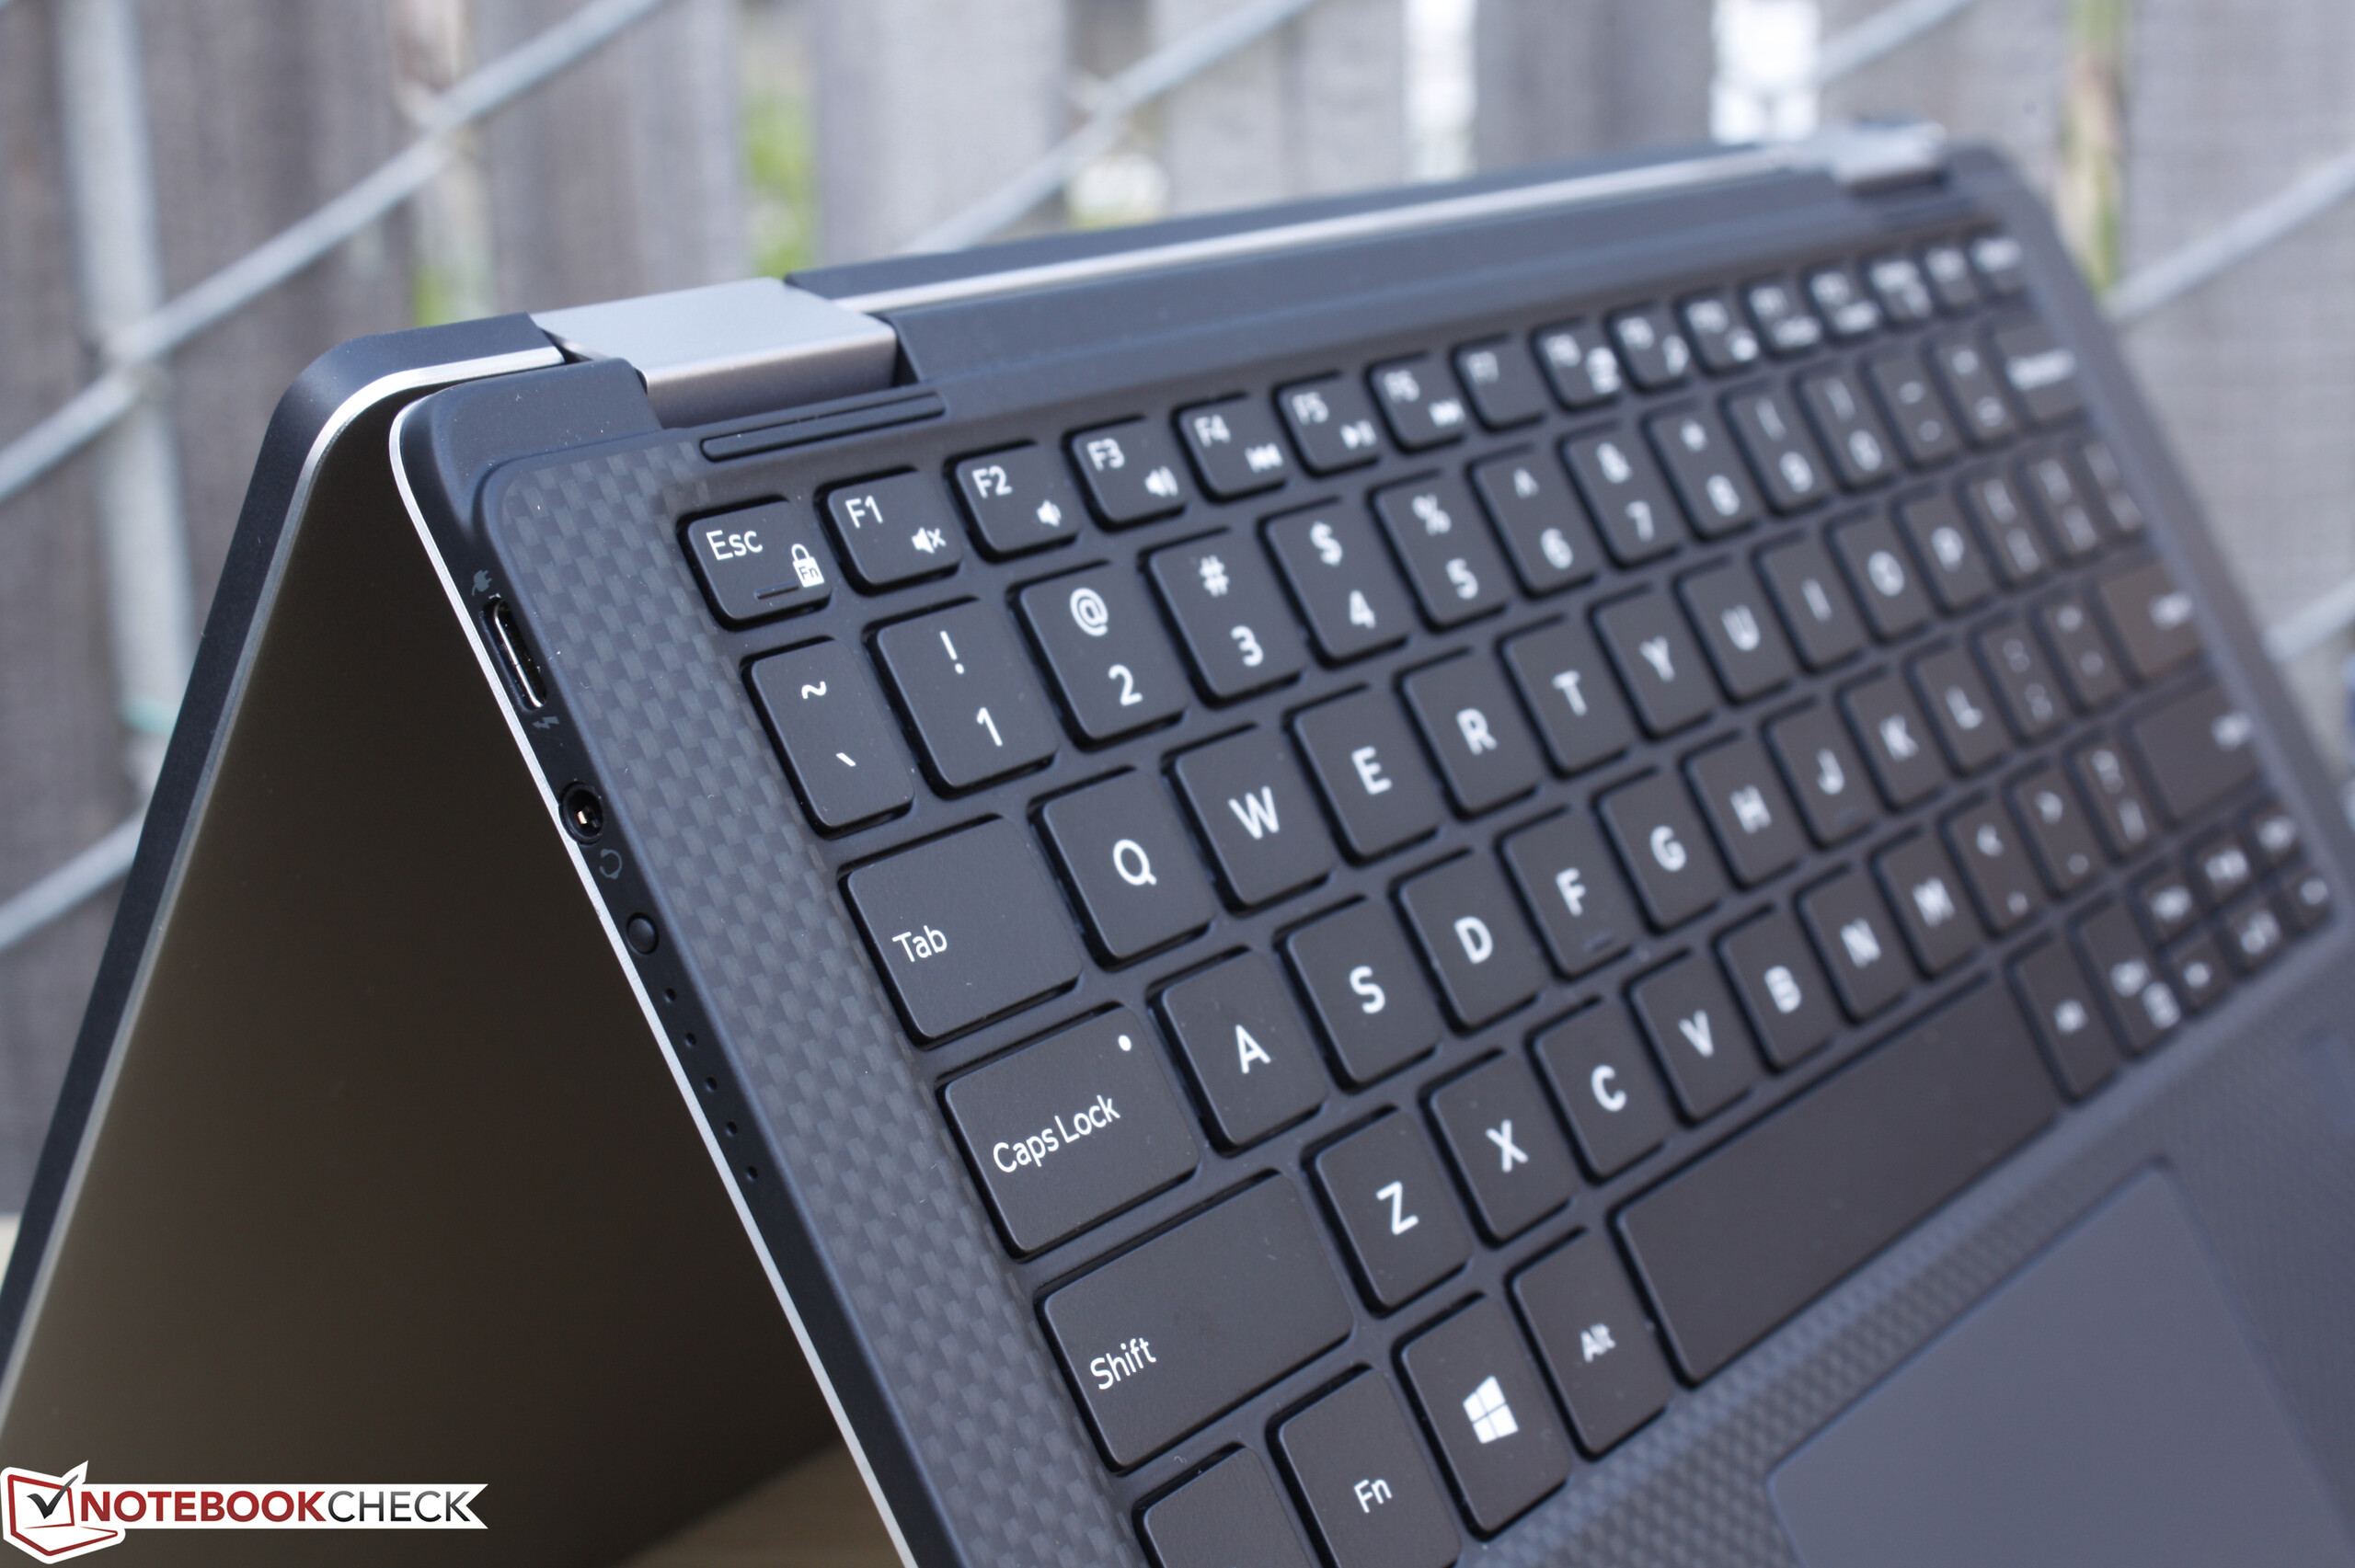
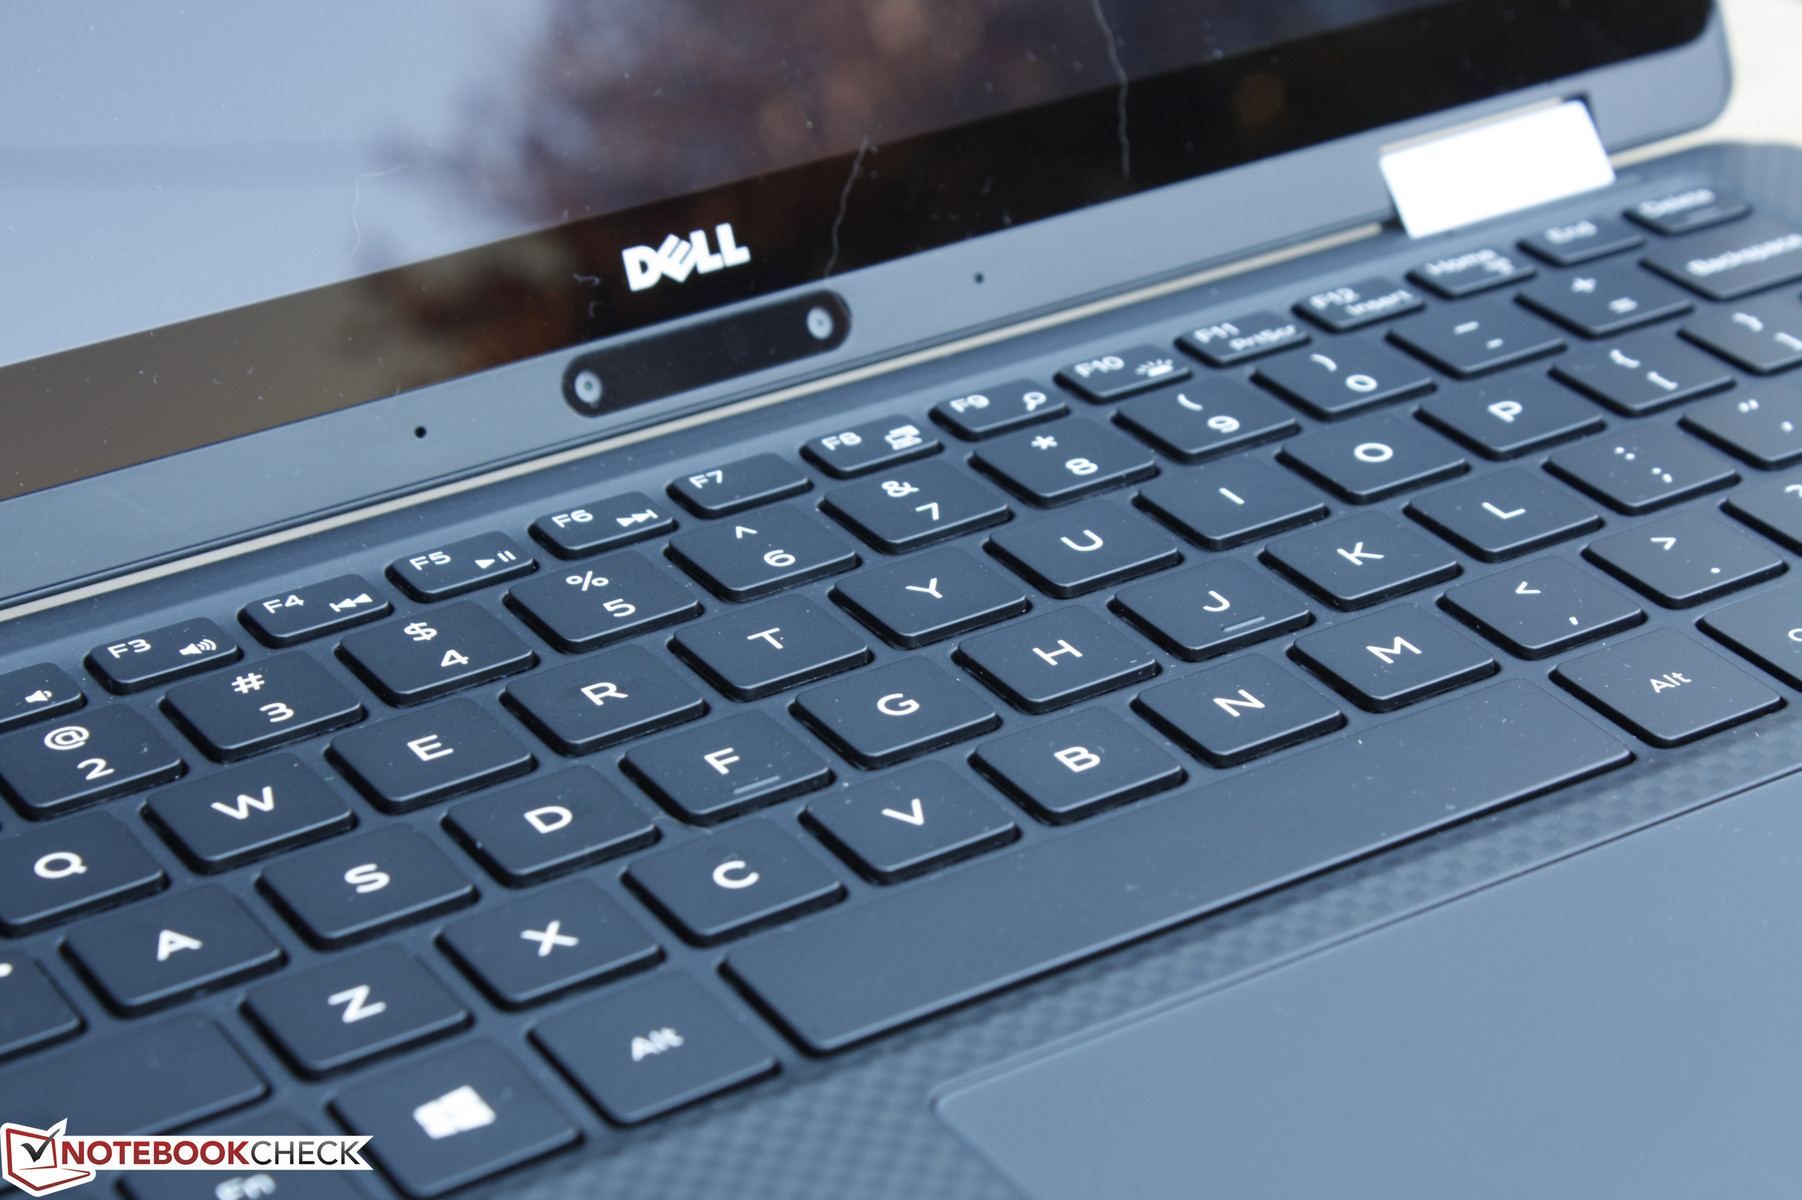
Webcam placement is a slight improvement over the peculiar corner location as found on the XPS 13. Nonetheless, the angle continues to be suboptimal unless if you don't mind the other person getting a good look at your chin and nostrils. Dell has somewhat gotten around this issue with the 360-degree hinges as the user can simply use the camera with the convertible in "Tent" mode instead of the standard notebook mode. Of course, this will also prevent keyboard use and is still an unfortunate drawback to the InfinityEdge design that competitors like HP and Lenovo have been duly pointing out.


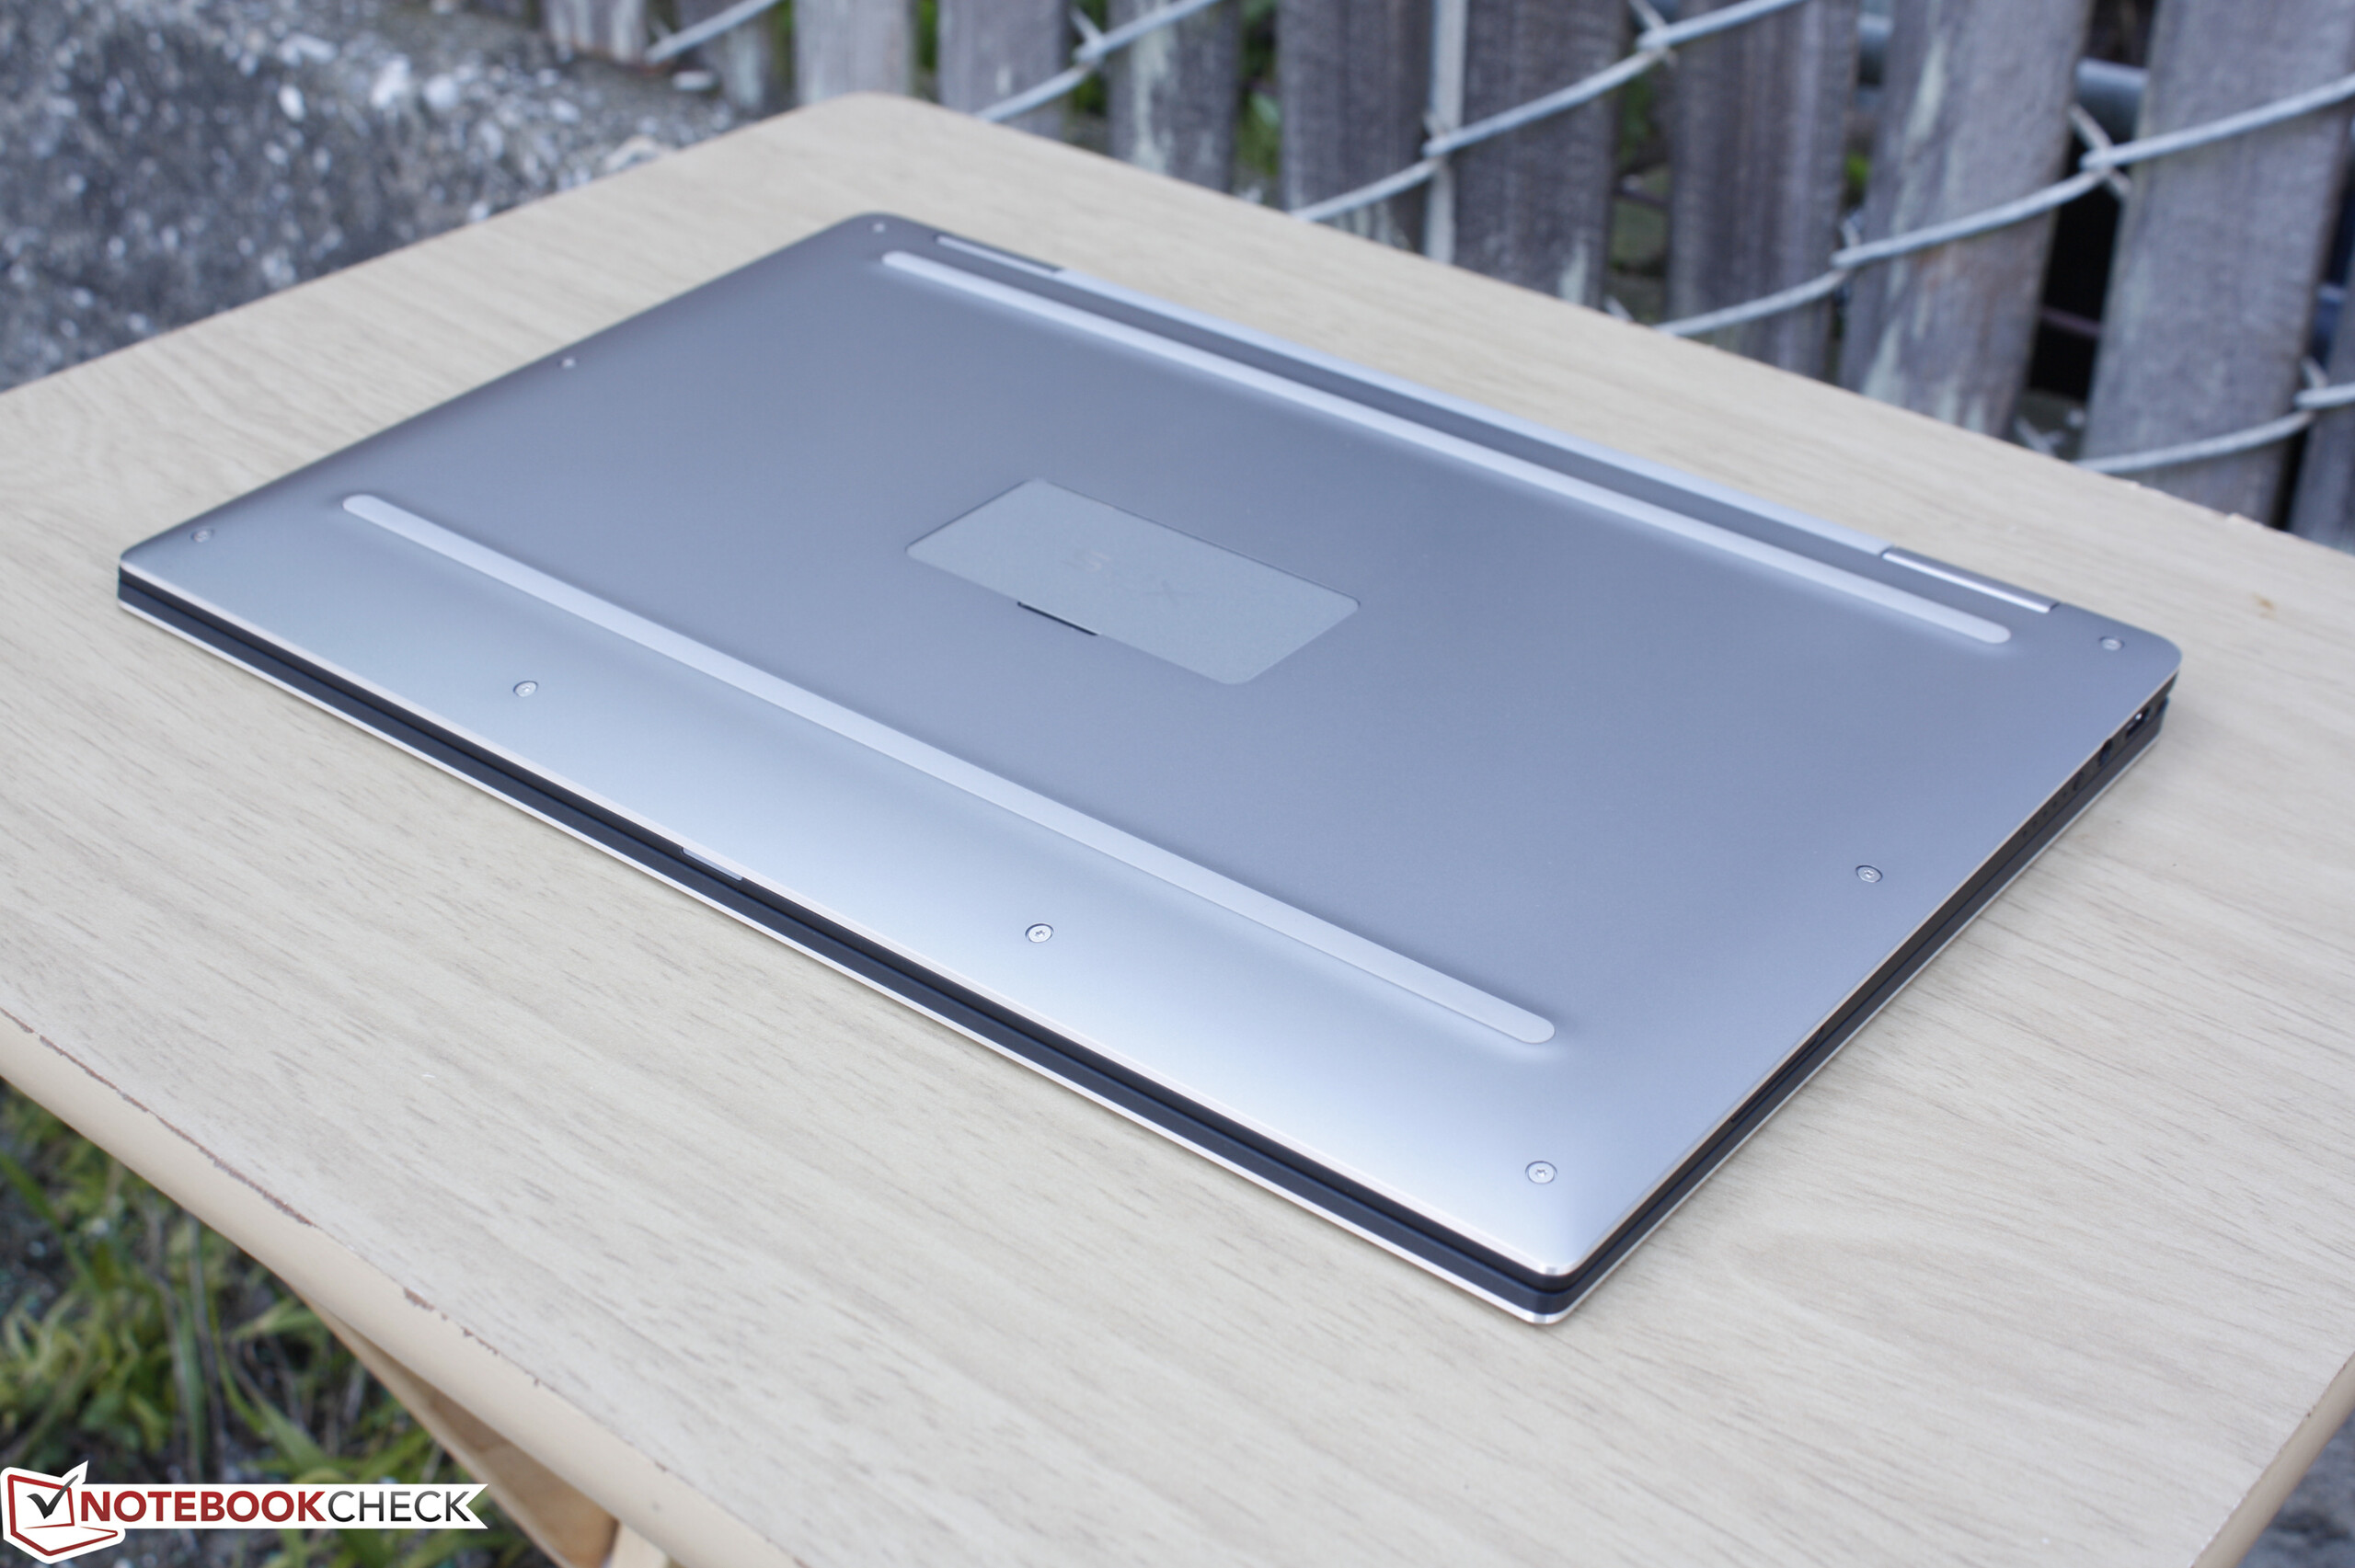
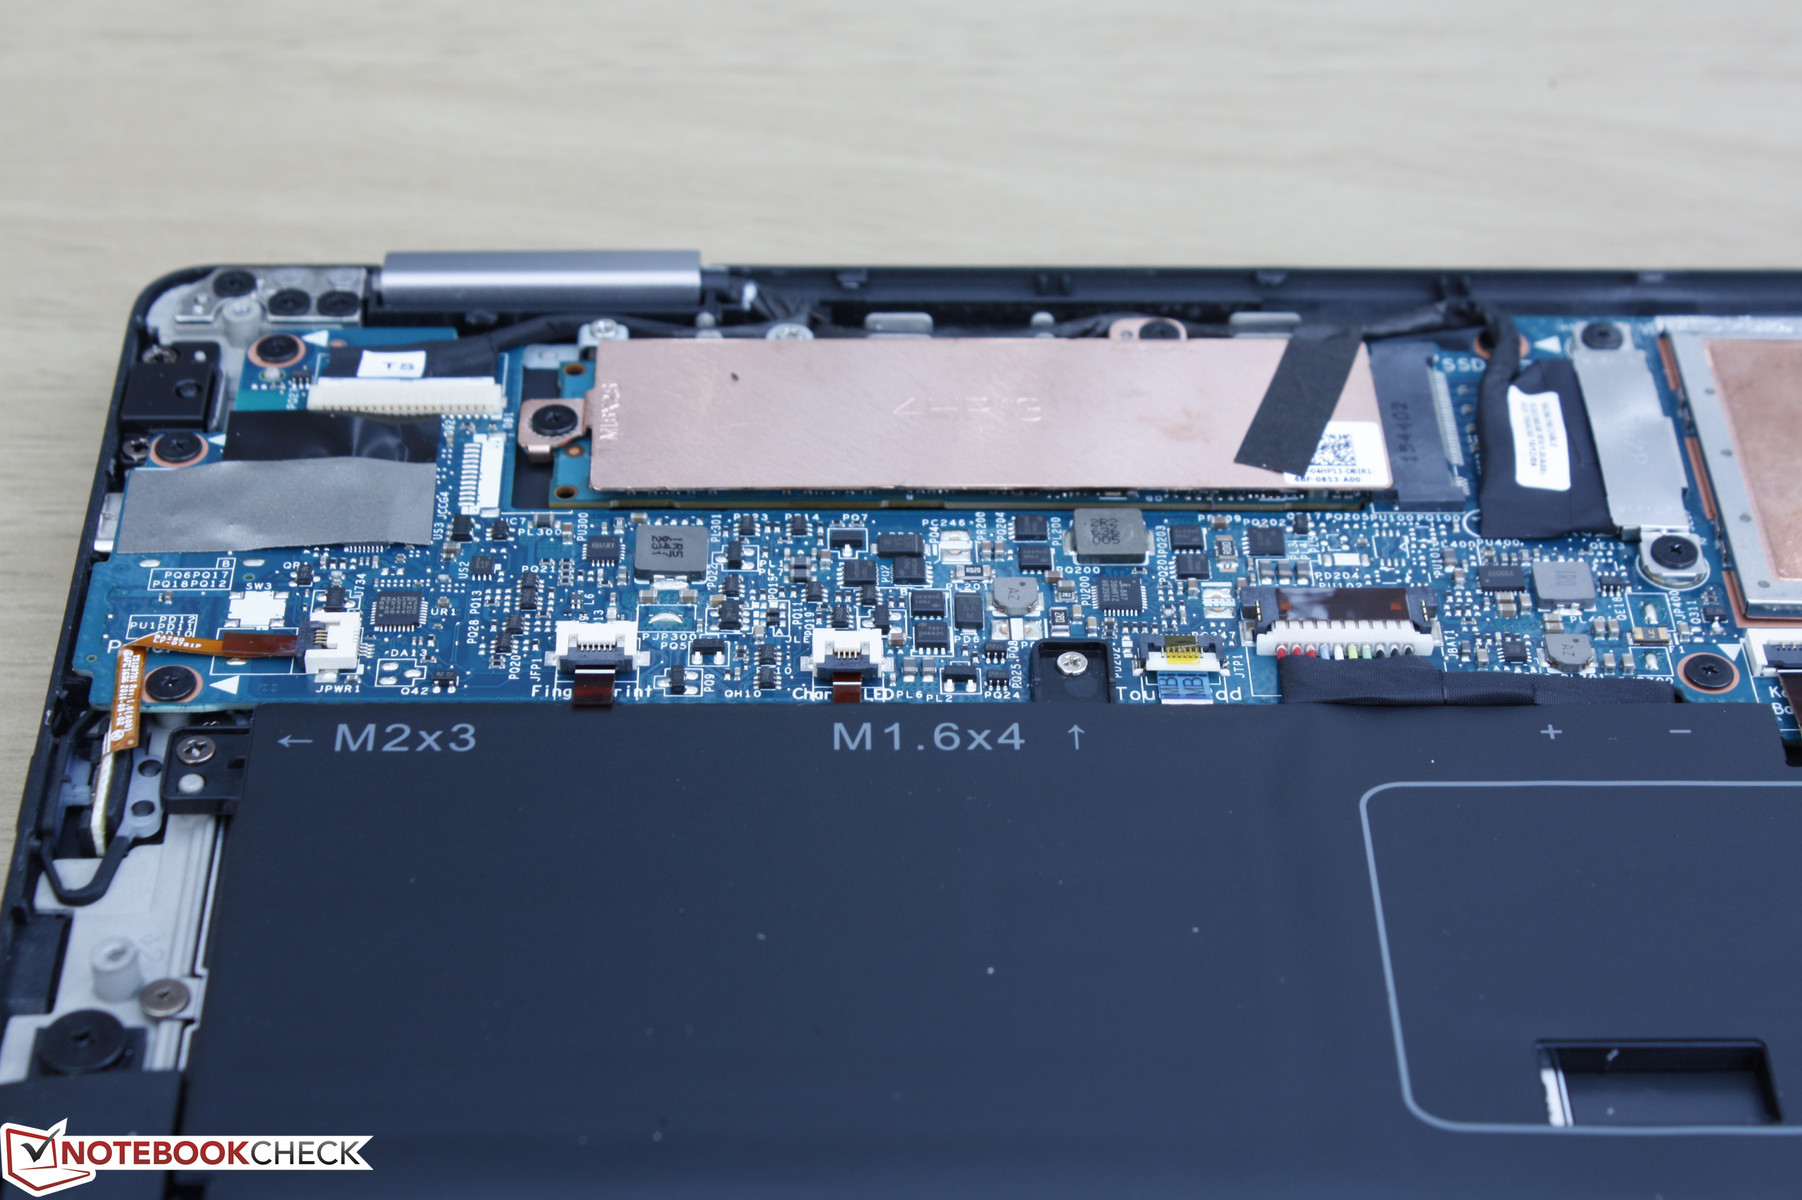
Maintenance
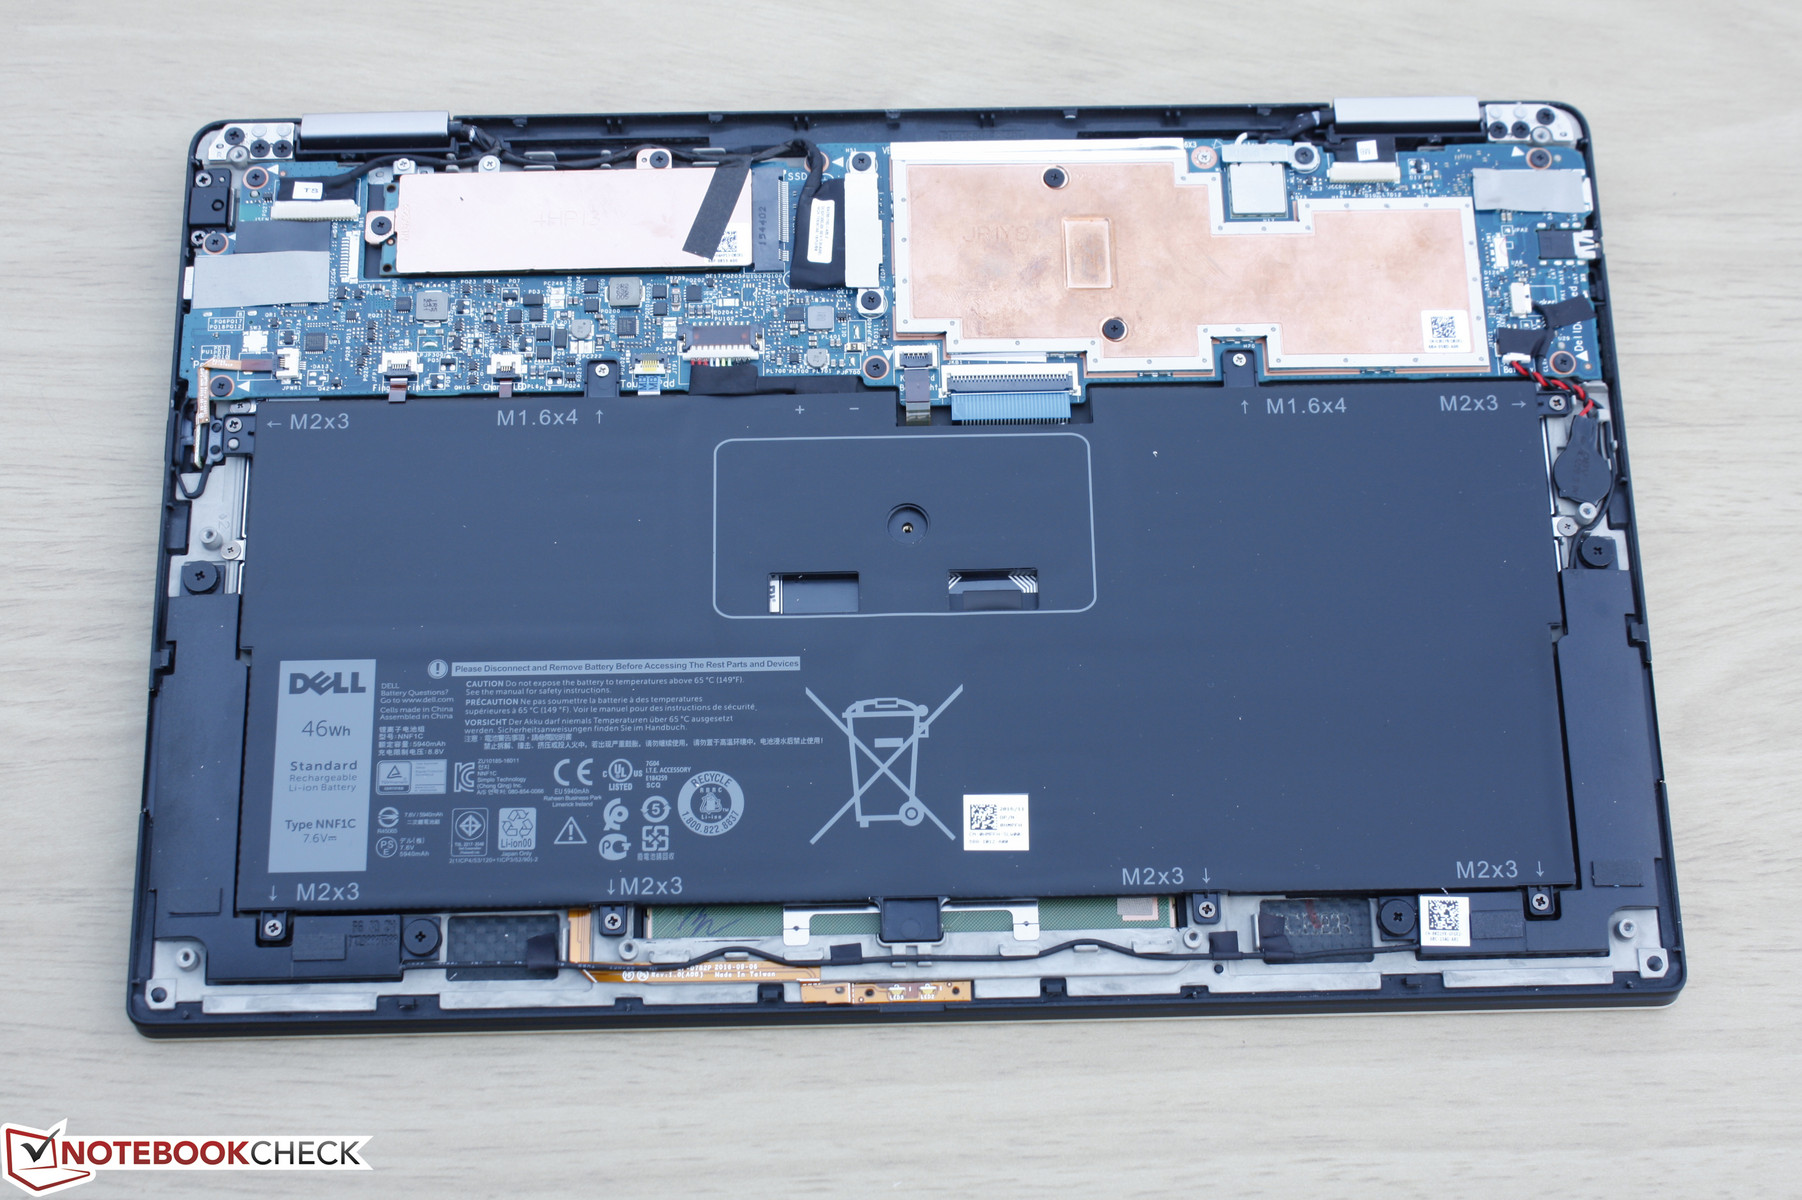
The bottom panel requires both a Philips screwdriver and T5 hex wrench to remove. Additionally, a sharp edge and some patience will be required around the edges and latches of the notebook. Users will have direct access to the internal battery, BIOS battery, CPU, and M.2 2280 NVMe slot.
Warranty
The standard one-year limited warranty applies with options to extend to up to four years plus accidental damage protection. Please see our Guarantees, Return Policies and Warranties FAQ for country-specific information.
Input Devices
Keyboard
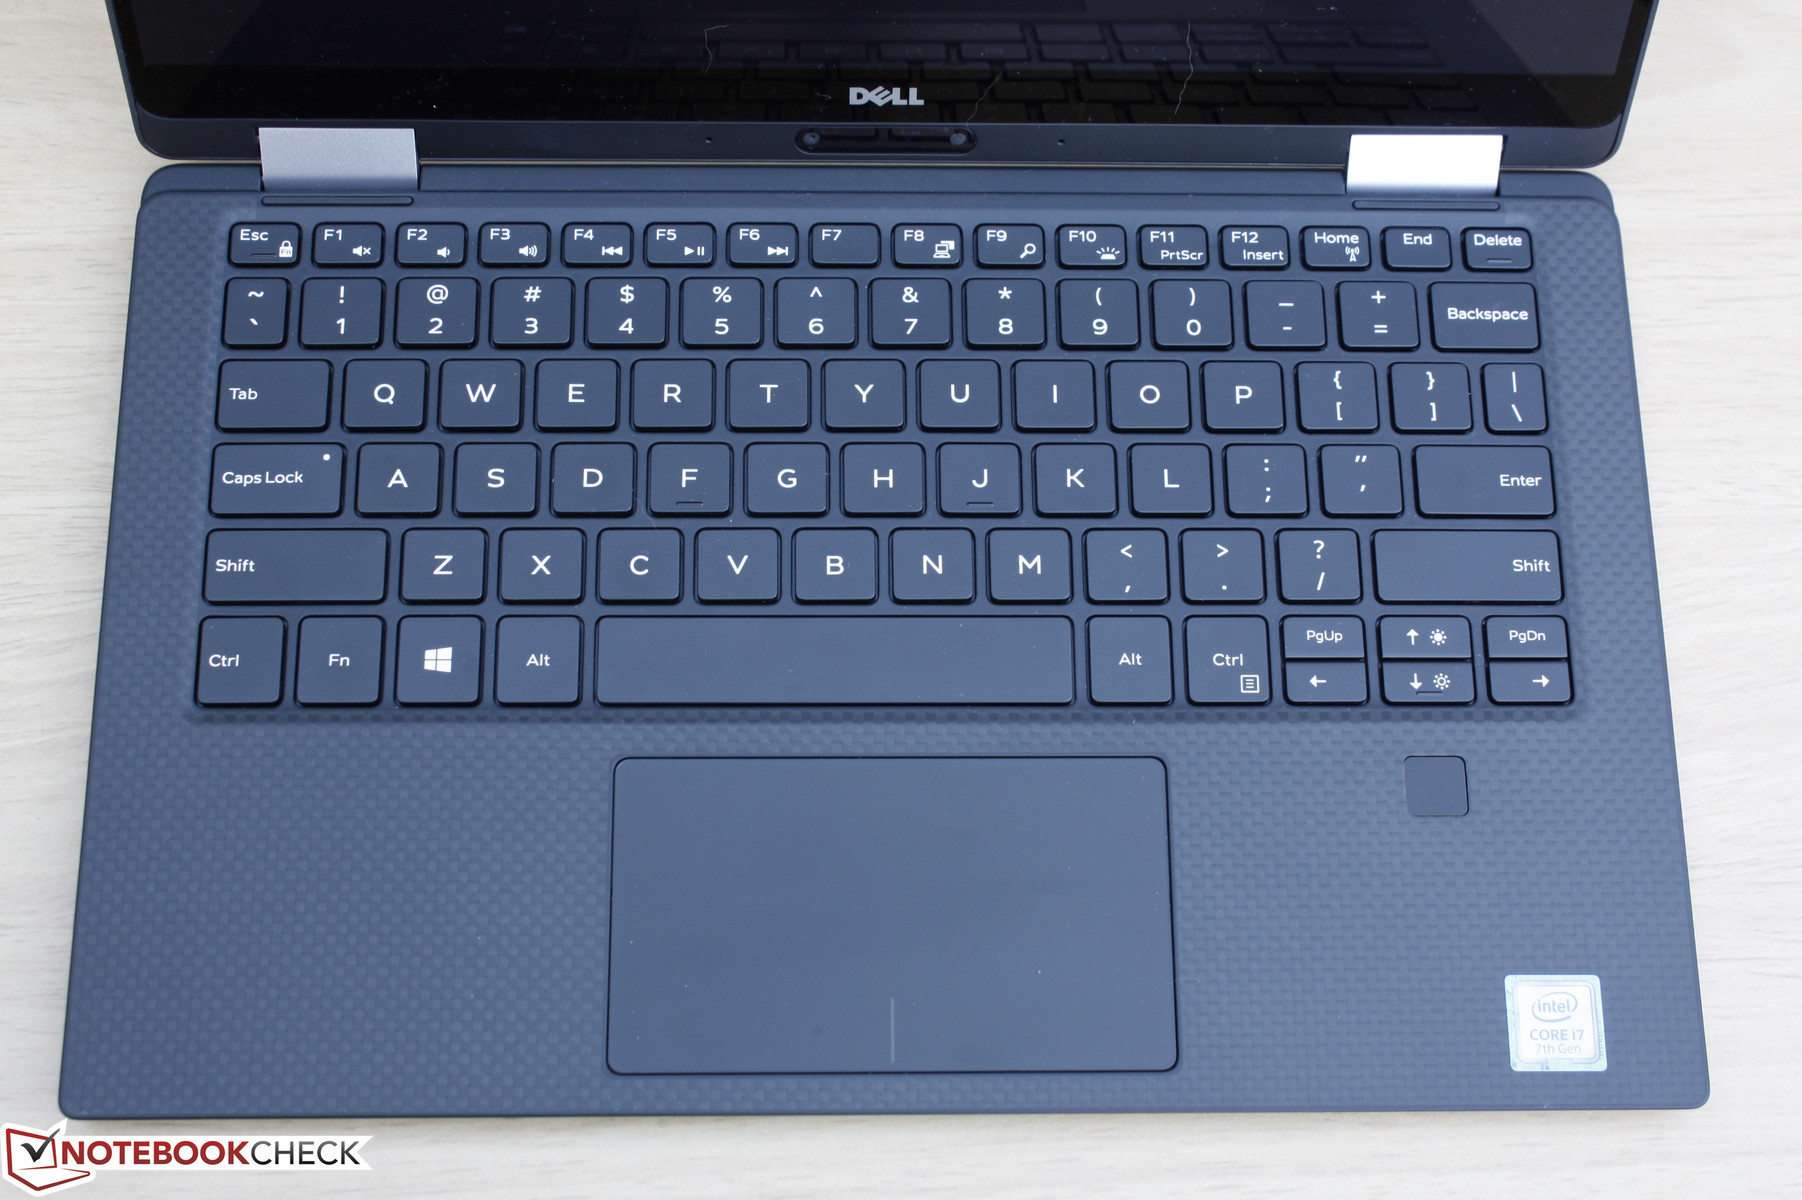
The backlit keyboard has undergone a few minor changes from a visual standpoint. The PgUp and PgDn keys are now adjacent to the Arrow keys and the vertical spacing between each key has been reduced to make room for slightly wider keys overall. Unfortunately, key travel remains very shallow and the feedback when pressed feels spongier compared to the original XPS 13. The smaller keys surrounding the main QWERTY keys are even softer and feel uneven. In comparison, the ThinkPad AccuType keyboard provides deeper travel with stronger and more consistent feedback between each key.
Touchpad
The wide clickpad (10.5 x 6 cm) is again virtually identical to the one of the XPS 13. Its surface is smooth and responsiveness is equally consistent around the corners and edges. Moving the cursor slowly will not result in any jumping or odd onscreen behavior. The main drawback are its integrated mouse keys as feedback is rather light and with a very shallow travel. The firm auditory click is otherwise satisfactory and easy to press on the bottom half of the surface.
Display
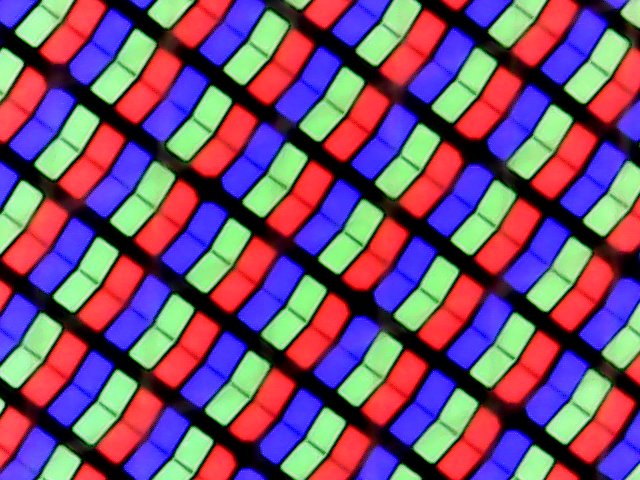
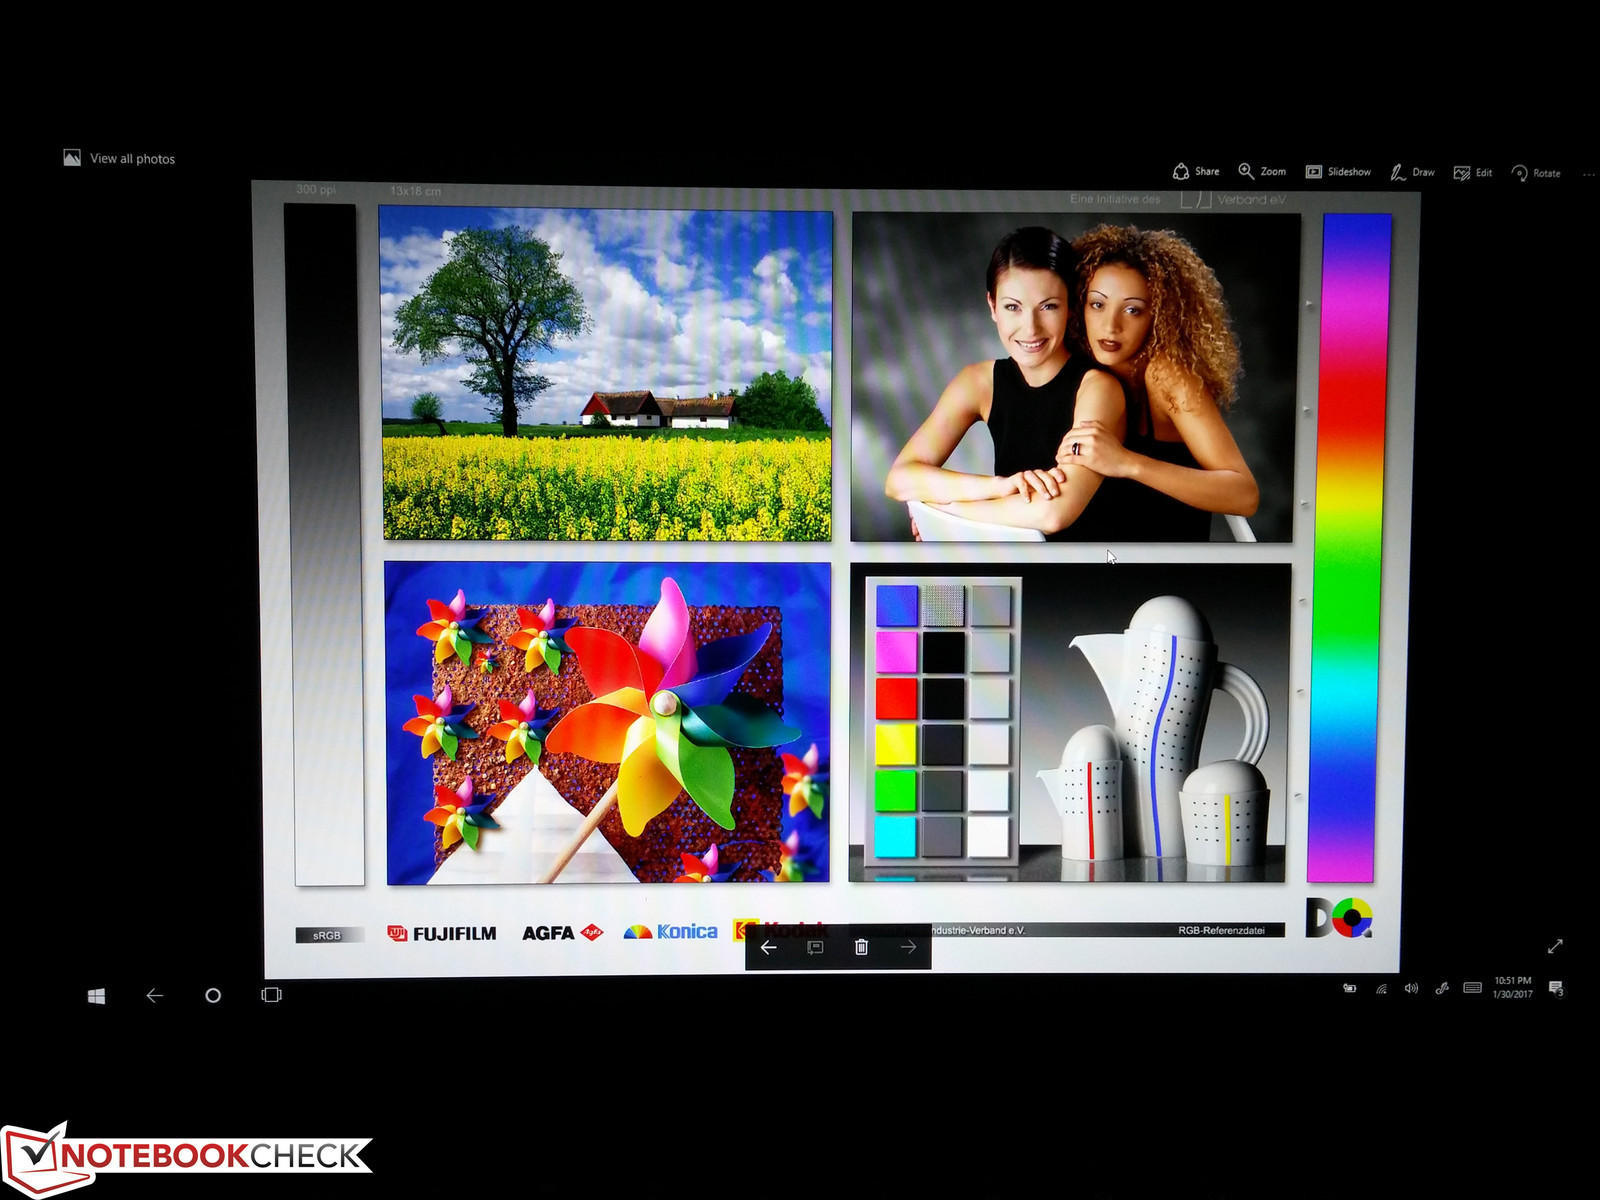
Dell is promising the same IPS display experience on the XPS 13 2-in-1 as on the glossy XPS 13 9350/9360. According to our own measurements, the Sharp SHP146A panel at play here is nearly identical to the Sharp SHP1449 panel on our XPS 13 9360 FHD SKU in terms of backlight brightness, contrast, and black-white response times. SKUs with the higher resolution QHD (3200 x 1800) display are also available that will likely carry different contrast levels and color gamuts than our FHD SKU on hand.
Unfortunately, Dell's CABC is again in effect here and so our brightness measurements below may not be representative of the full potential of the backlight. For example, Dell advertises a backlight brightness of 400 nits compared to our measured average of just over 300 nits when on the maximum setting. Flashing the ambient light sensor with a bright light will indeed bring the display up to about 425 nits according to our X-Rite spectrophotometer.
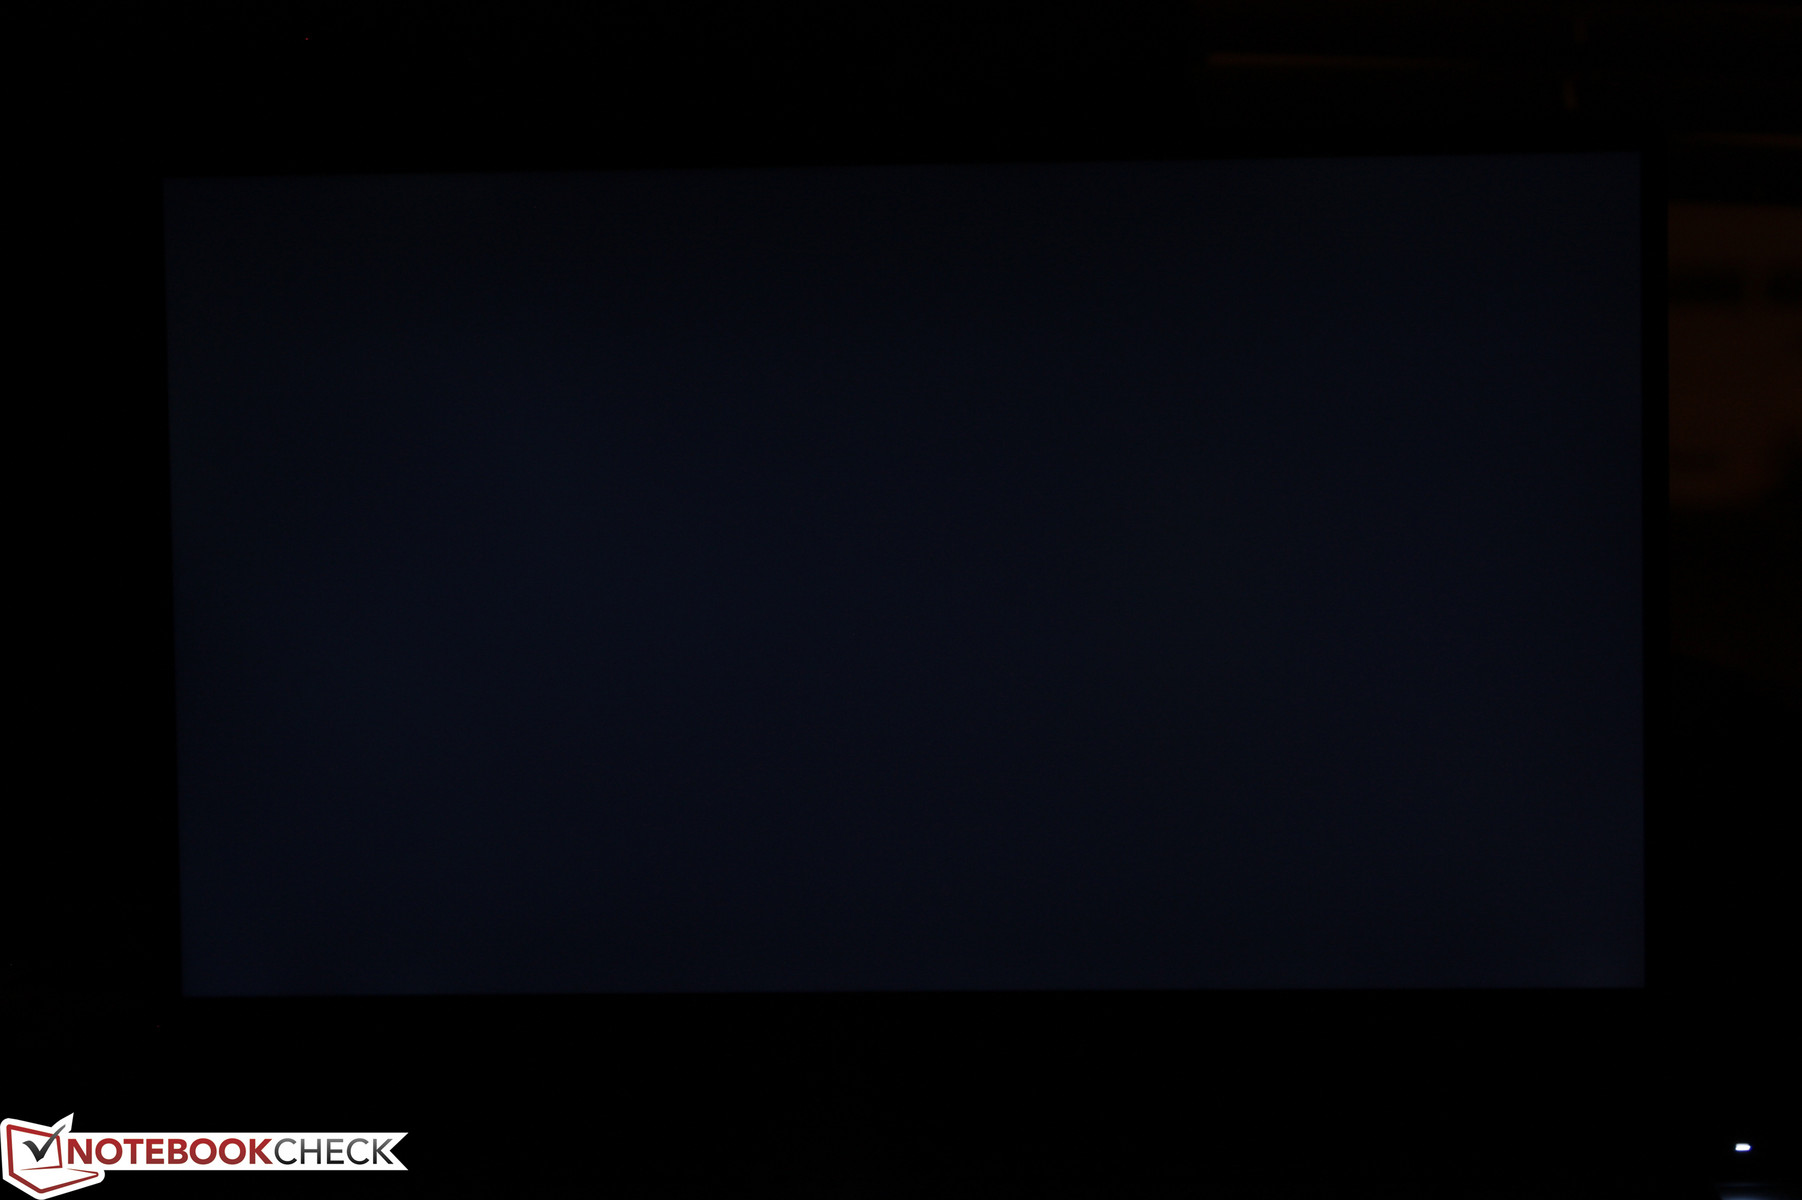
Backlight bleeding is minimal and very even around the edges and corners. We can notice no distracting bright spots even when set to the maximum brightness setting whilst displaying a dark background.
| |||||||||||||||||||||||||
Brightness Distribution: 91 %
Center on Battery: 322.6 cd/m²
Contrast: 1698:1 (Black: 0.19 cd/m²)
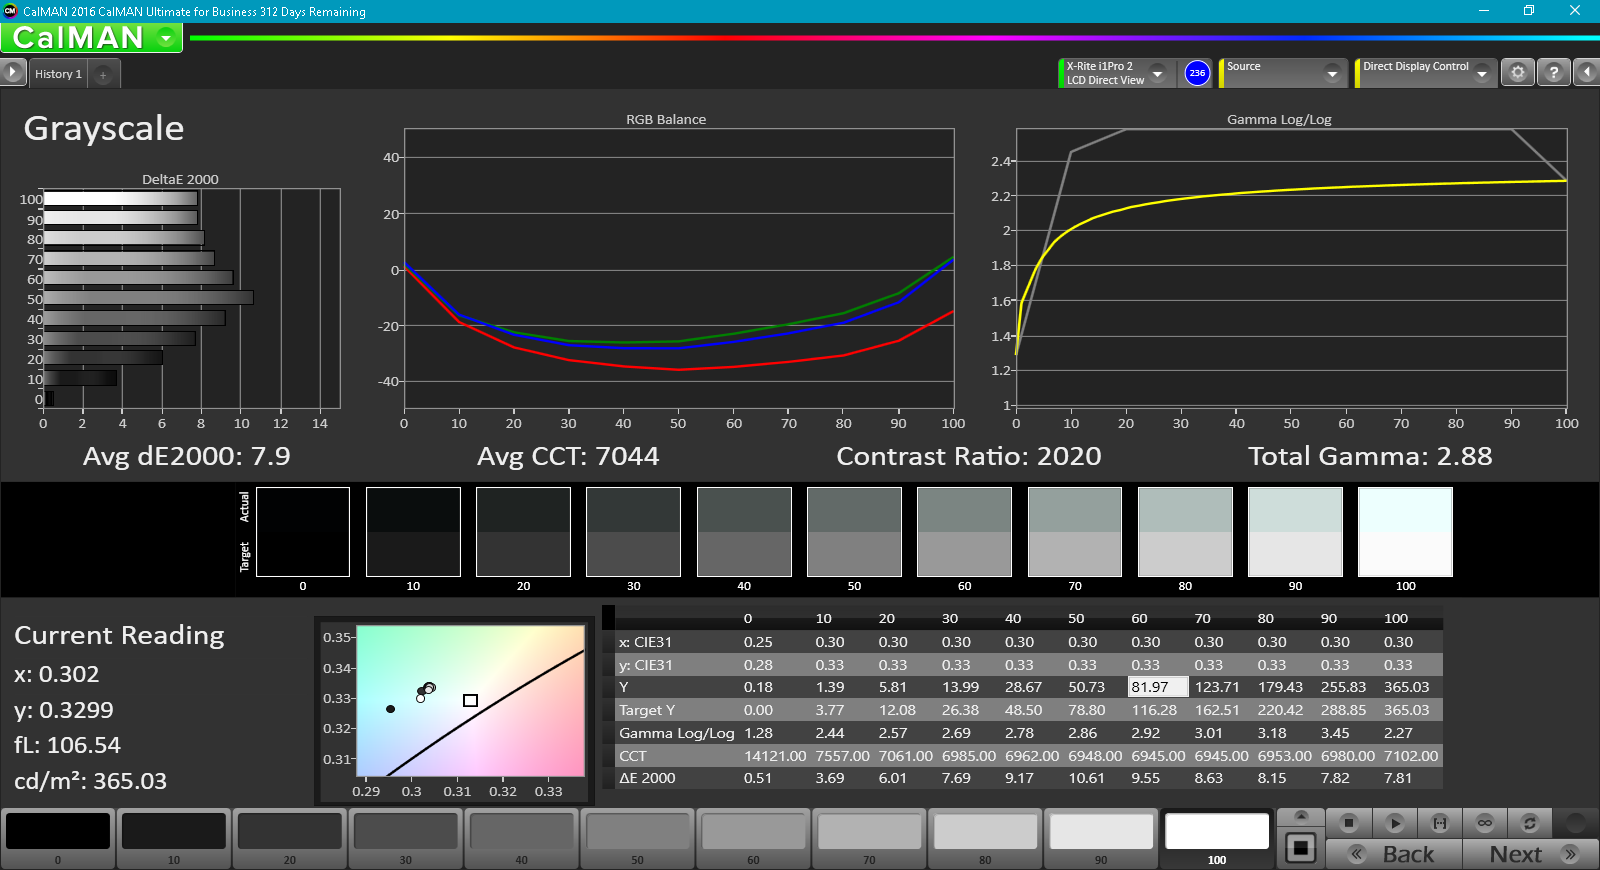
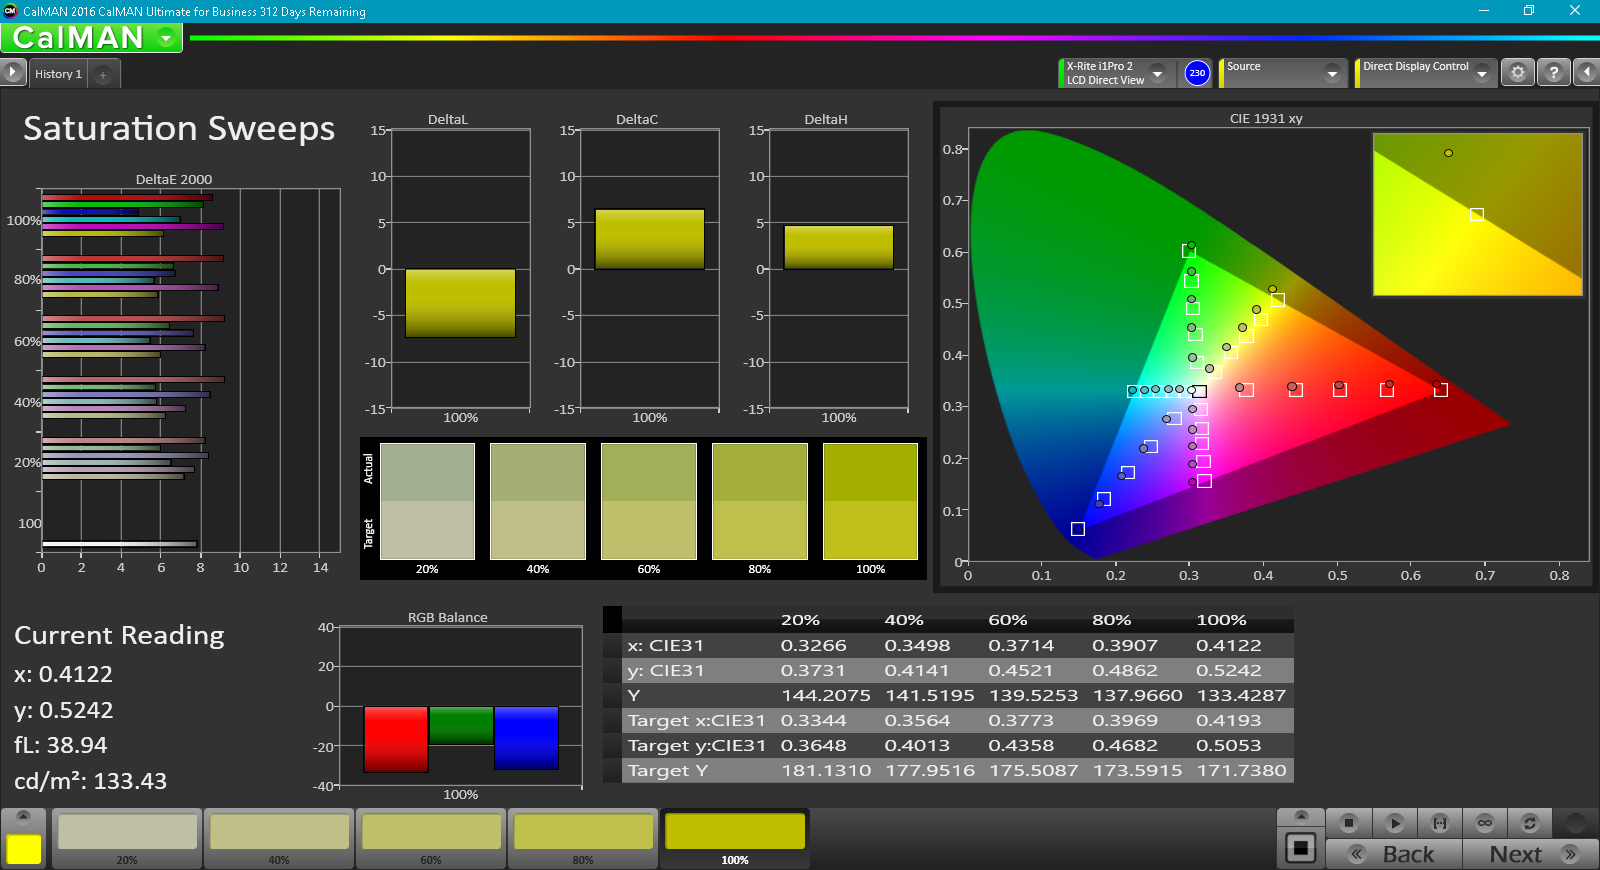
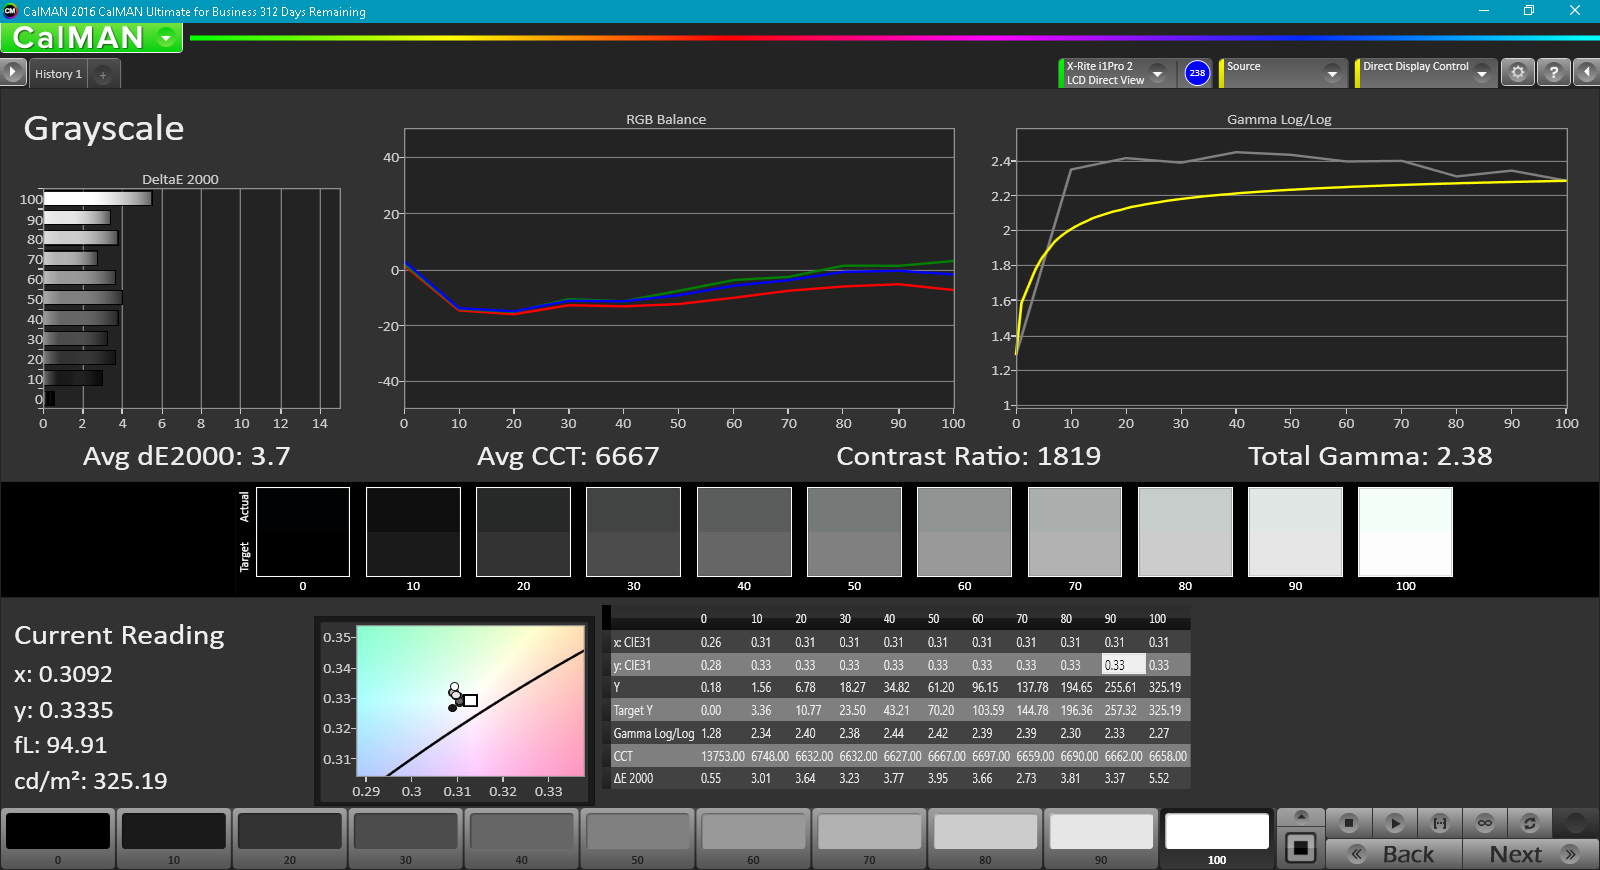
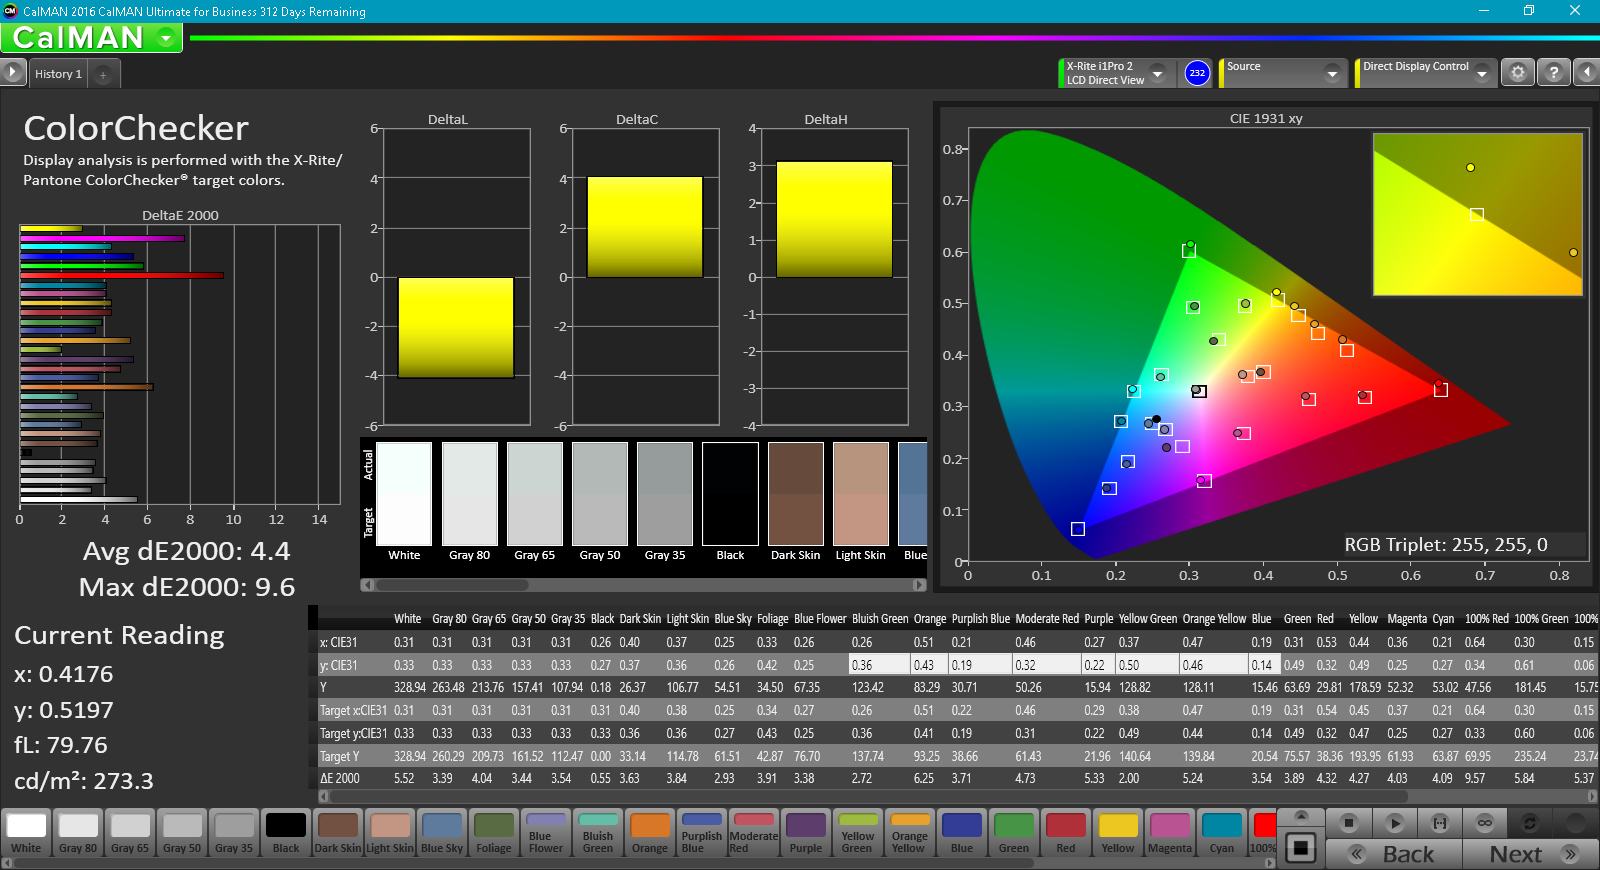
ΔE ColorChecker Calman: 7.7 | ∀{0.5-29.43 Ø4.71}
ΔE Greyscale Calman: 7.9 | ∀{0.09-98 Ø4.96}
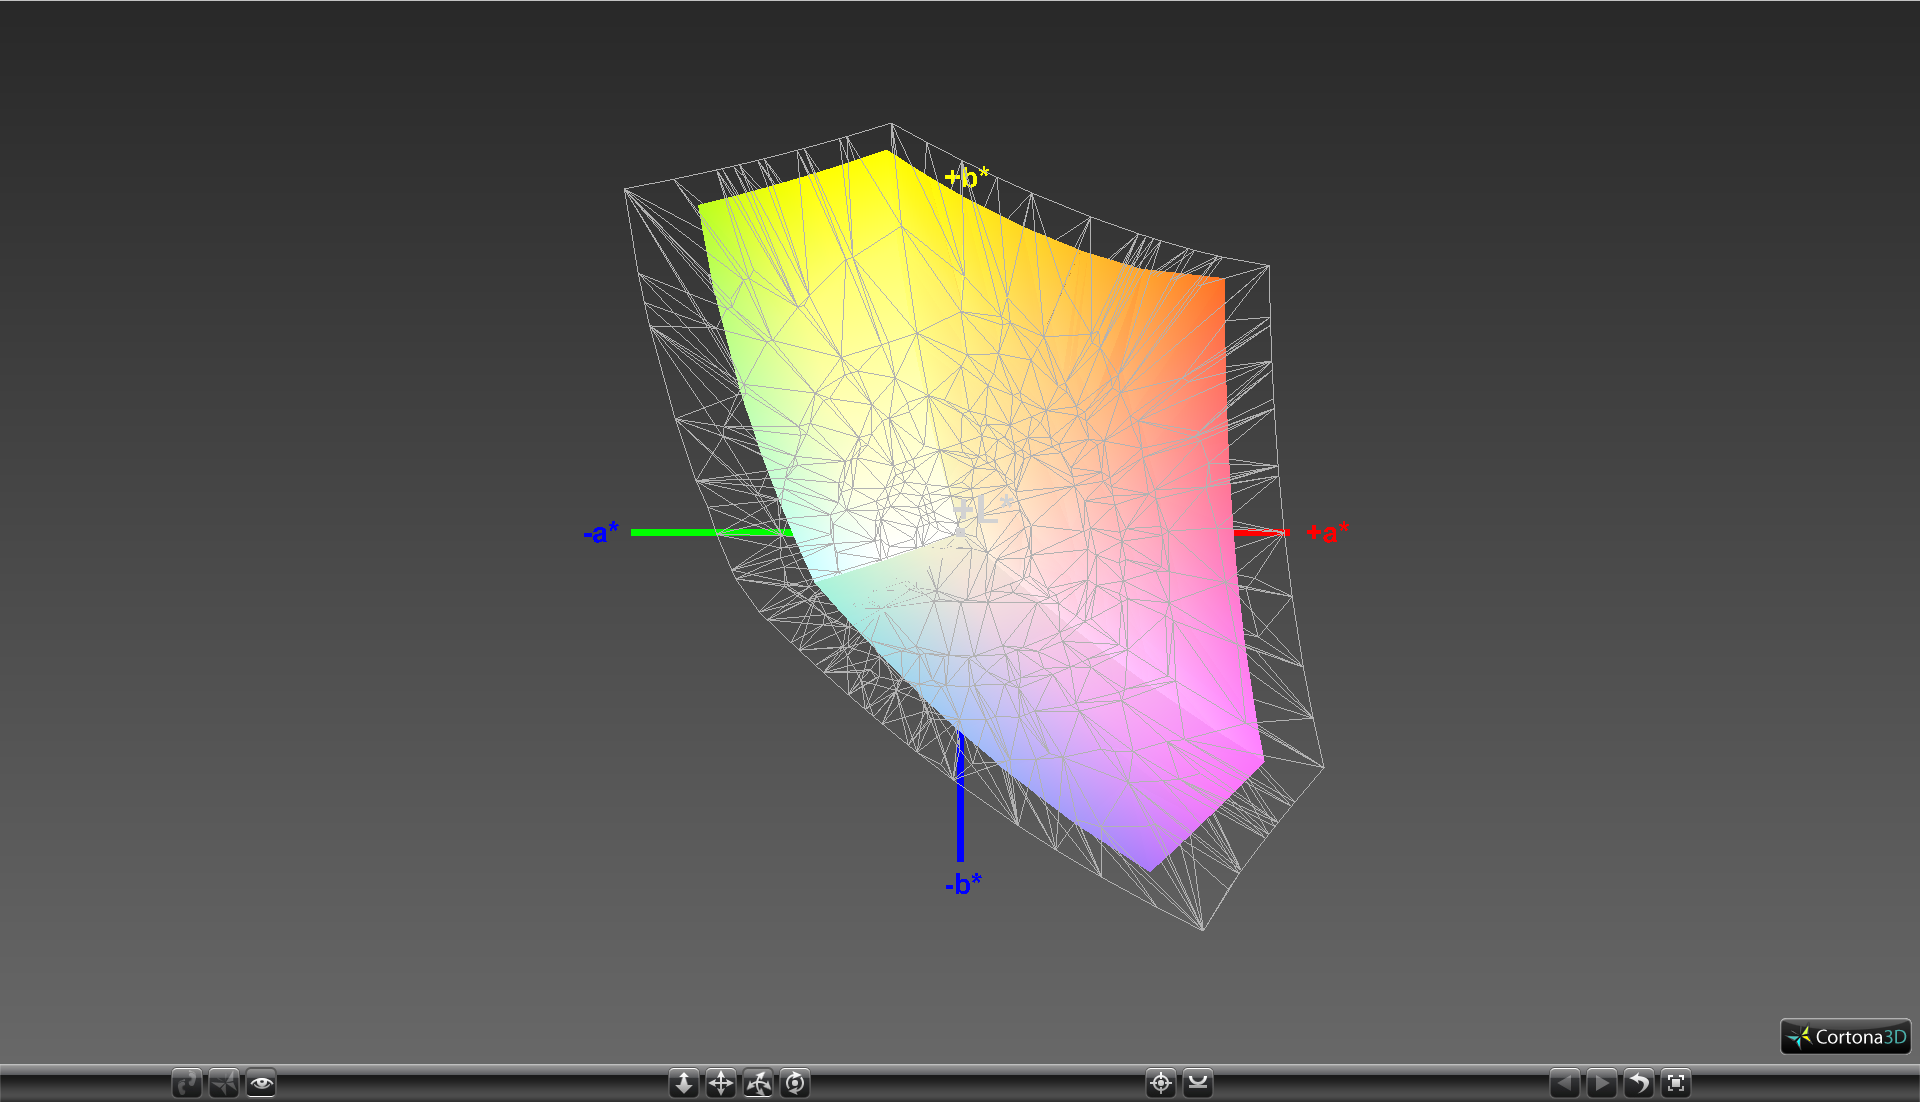
69.9% sRGB (Argyll 1.6.3 3D)
44.1% AdobeRGB 1998 (Argyll 1.6.3 3D)
48.83% AdobeRGB 1998 (Argyll 3D)
71.1% sRGB (Argyll 3D)
47.32% Display P3 (Argyll 3D)
Gamma: 2.88
CCT: 7044 K
| Dell XPS 13-9365 2-in-1 IPS, 13.3", 1920x1080 | Lenovo Yoga 910-13IKB-80VF004CGE AU Optronics AUO323D / B139HAN03.2, IPS, 13.9", 3840x2160 | HP Spectre x360 13-w023dx Chi Mei CMN1367, IPS, 13.3", 1920x1080 | Asus Zenbook UX310UQ-GL011T AU Optronics AUO142D, TN LED, 13.3", 1920x1080 | Dell XPS 13 9360 FHD i5 Sharp SHP1449 LQ133M1, IPS, 13.3", 1920x1080 | |
|---|---|---|---|---|---|
| Display | 29% | 33% | 28% | 3% | |
| Display P3 Coverage (%) | 47.32 | 62.2 31% | 65.4 38% | 61.9 31% | 48.94 3% |
| sRGB Coverage (%) | 71.1 | 90.1 27% | 90.4 27% | 88.3 24% | 73.3 3% |
| AdobeRGB 1998 Coverage (%) | 48.83 | 63.5 30% | 65.8 35% | 63 29% | 50.5 3% |
| Response Times | 16% | 23% | 23% | 16% | |
| Response Time Grey 50% / Grey 80% * (ms) | 48 ? | 46 ? 4% | 33.2 ? 31% | 39 ? 19% | 32.8 ? 32% |
| Response Time Black / White * (ms) | 32.8 ? | 24 ? 27% | 28 ? 15% | 24 ? 27% | 33.2 ? -1% |
| PWM Frequency (Hz) | 1042 ? | 50 ? | |||
| Screen | -2% | -4% | -9% | 7% | |
| Brightness middle (cd/m²) | 322.6 | 348 8% | 334.6 4% | 247 -23% | 351.2 9% |
| Brightness (cd/m²) | 306 | 310 1% | 319 4% | 240 -22% | 325 6% |
| Brightness Distribution (%) | 91 | 80 -12% | 90 -1% | 90 -1% | 89 -2% |
| Black Level * (cd/m²) | 0.19 | 0.25 -32% | 0.336 -77% | 0.43 -126% | 0.195 -3% |
| Contrast (:1) | 1698 | 1392 -18% | 996 -41% | 574 -66% | 1801 6% |
| Colorchecker dE 2000 * | 7.7 | 7.86 -2% | 6.21 19% | 4.74 38% | 7.4 4% |
| Colorchecker dE 2000 max. * | 11.1 | 13.43 -21% | 12 -8% | 9.14 18% | 9.08 18% |
| Greyscale dE 2000 * | 7.9 | 8.25 -4% | 7.71 2% | 4.87 38% | 6.71 15% |
| Gamma | 2.88 76% | 2.05 107% | 2.36 93% | 2.57 86% | 2.74 80% |
| CCT | 7044 92% | 6834 95% | 6458 101% | 7450 87% | 7222 90% |
| Color Space (Percent of AdobeRGB 1998) (%) | 44.1 | 58 32% | 58.6 33% | 57 29% | 50.48 14% |
| Color Space (Percent of sRGB) (%) | 69.9 | 90 29% | 90 29% | 88 26% | 73.31 5% |
| Total Average (Program / Settings) | 14% /
7% | 17% /
7% | 14% /
3% | 9% /
7% |
* ... smaller is better
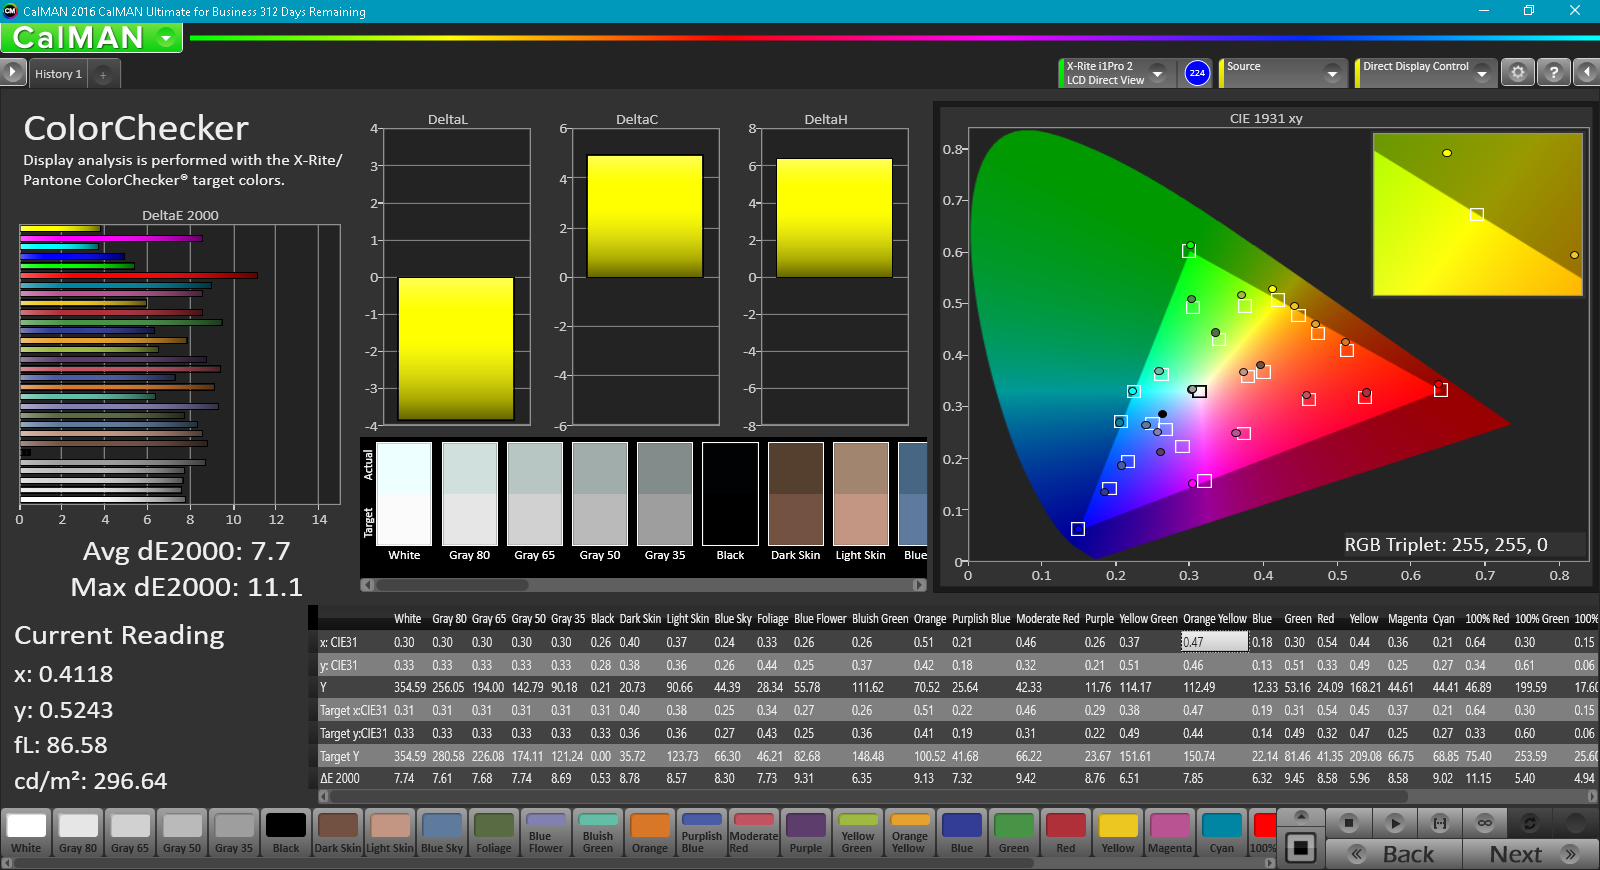
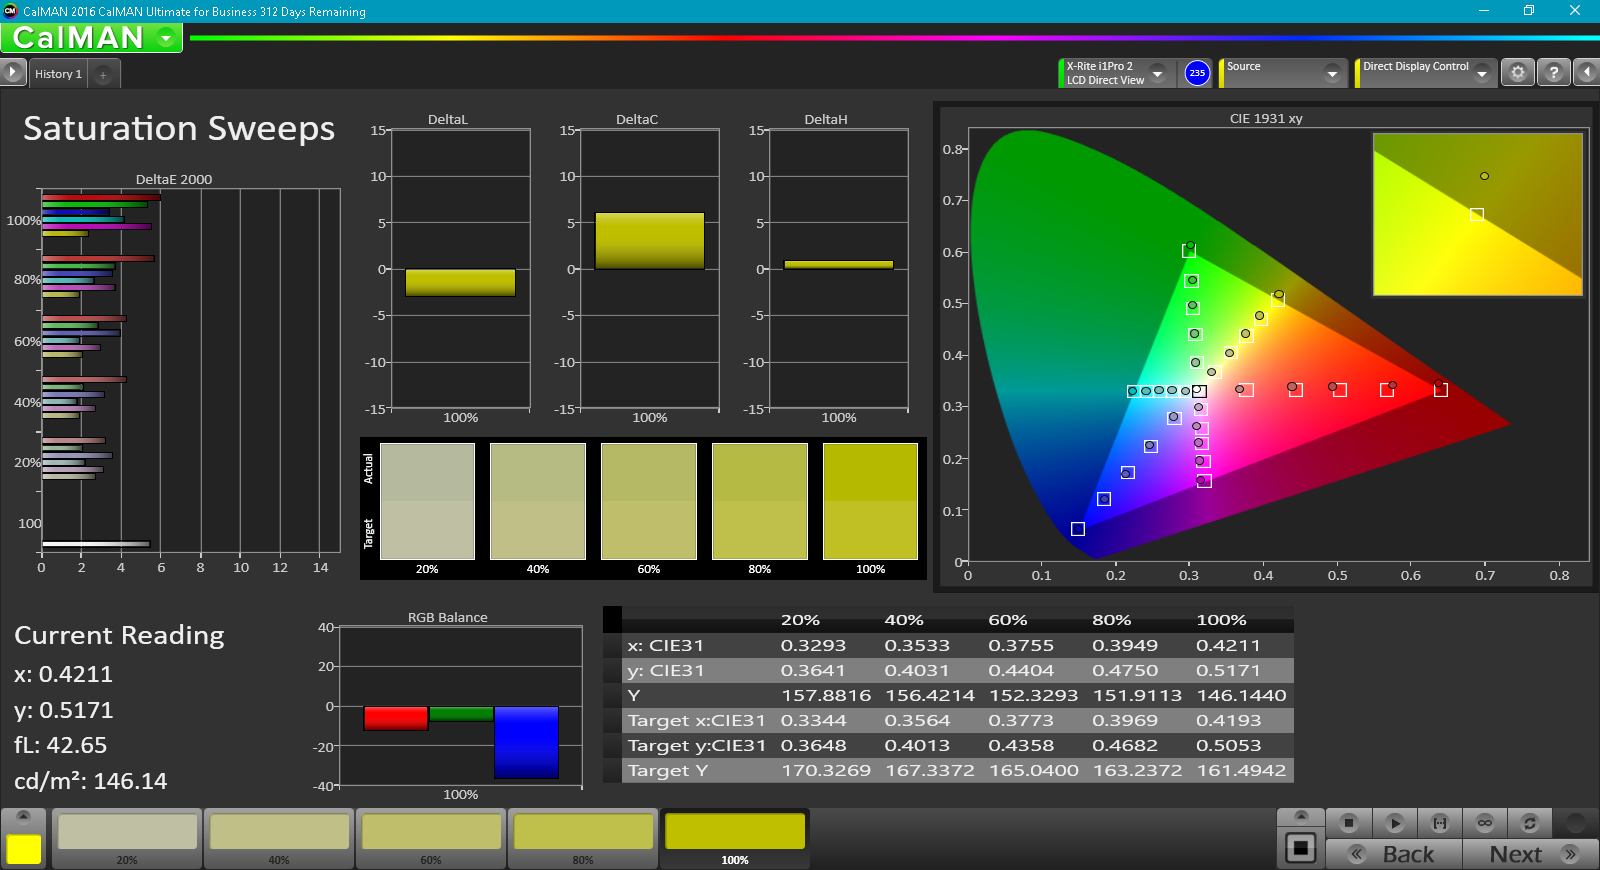
Color space coverage is approximately 70 percent and 44 percent of the sRGB and AdobeRGB standards, respectively. This is far narrower than the displays on the Yoga 910, Spectre x360 13, or Zenbook UX310UQ, all of which cover about 90 percent of the sRGB spectrum each. While this will not significantly impact web browsing or word processing, it's a little disappointing to know that colors on the XPS 2-in-1 are not as vibrant on an otherwise attractive display.


Further display measurements reveal generally inaccurate grayscale and colors out of the box. A calibration improves both noticeably and is recommended if possible. Colors become increasingly more inaccurate the higher the saturation level due to the panel's imperfect sRGB coverage.
Display Response Times
| ↔ Response Time Black to White | ||
|---|---|---|
| 32.8 ms ... rise ↗ and fall ↘ combined | ↗ 7.6 ms rise | 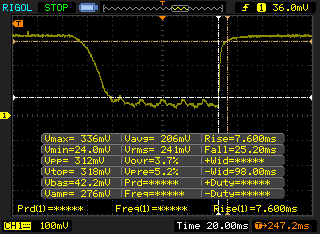 |
| ↘ 25.2 ms fall | ||
| The screen shows slow response rates in our tests and will be unsatisfactory for gamers. In comparison, all tested devices range from 0.1 (minimum) to 240 (maximum) ms. » 88 % of all devices are better. This means that the measured response time is worse than the average of all tested devices (19.8 ms). | ||
| ↔ Response Time 50% Grey to 80% Grey | ||
| 48 ms ... rise ↗ and fall ↘ combined | ↗ 16.4 ms rise | 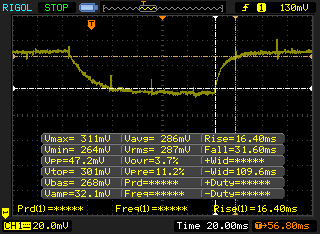 |
| ↘ 31.6 ms fall | ||
| The screen shows slow response rates in our tests and will be unsatisfactory for gamers. In comparison, all tested devices range from 0.165 (minimum) to 636 (maximum) ms. » 82 % of all devices are better. This means that the measured response time is worse than the average of all tested devices (30.9 ms). | ||
Screen Flickering / PWM (Pulse-Width Modulation)
| Screen flickering / PWM detected | 1042 Hz | ≤ 29 % brightness setting | 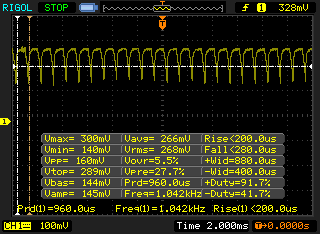 |
The display backlight flickers at 1042 Hz (worst case, e.g., utilizing PWM) Flickering detected at a brightness setting of 29 % and below. There should be no flickering or PWM above this brightness setting. The frequency of 1042 Hz is quite high, so most users sensitive to PWM should not notice any flickering. In comparison: 52 % of all tested devices do not use PWM to dim the display. If PWM was detected, an average of 7744 (minimum: 5 - maximum: 343500) Hz was measured. | |||
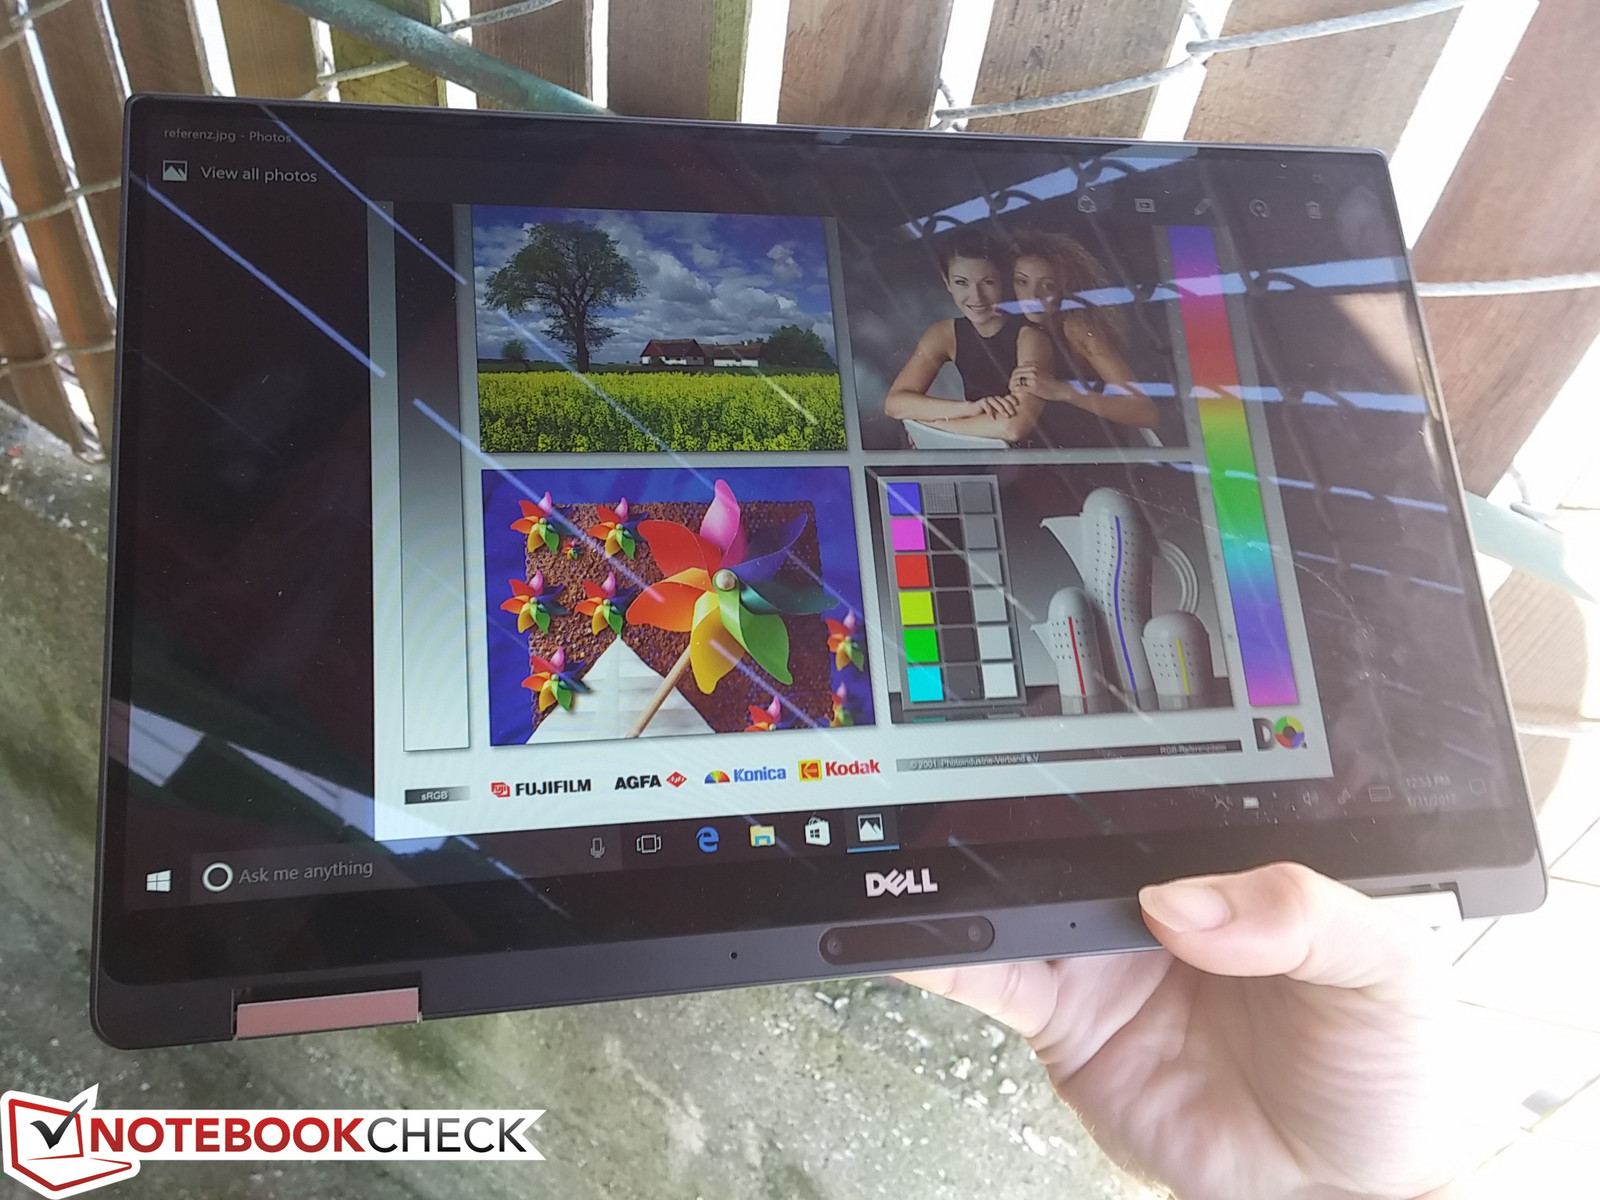
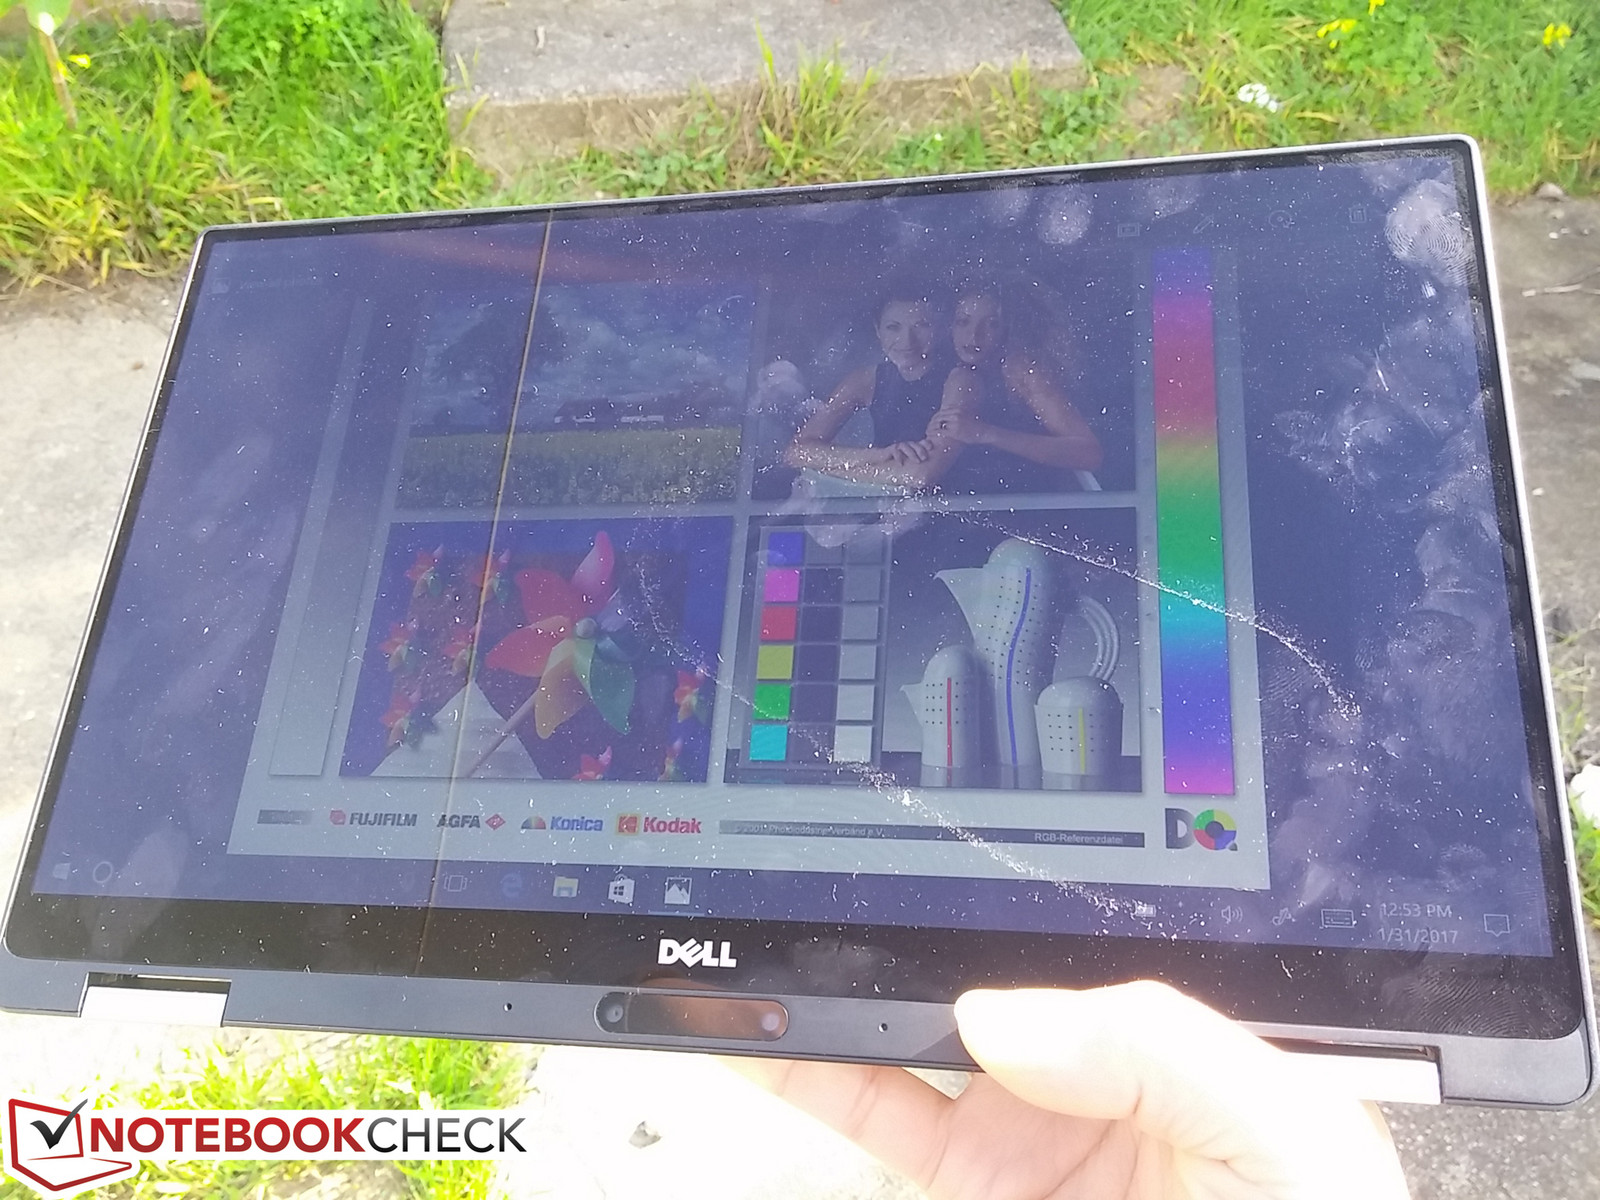
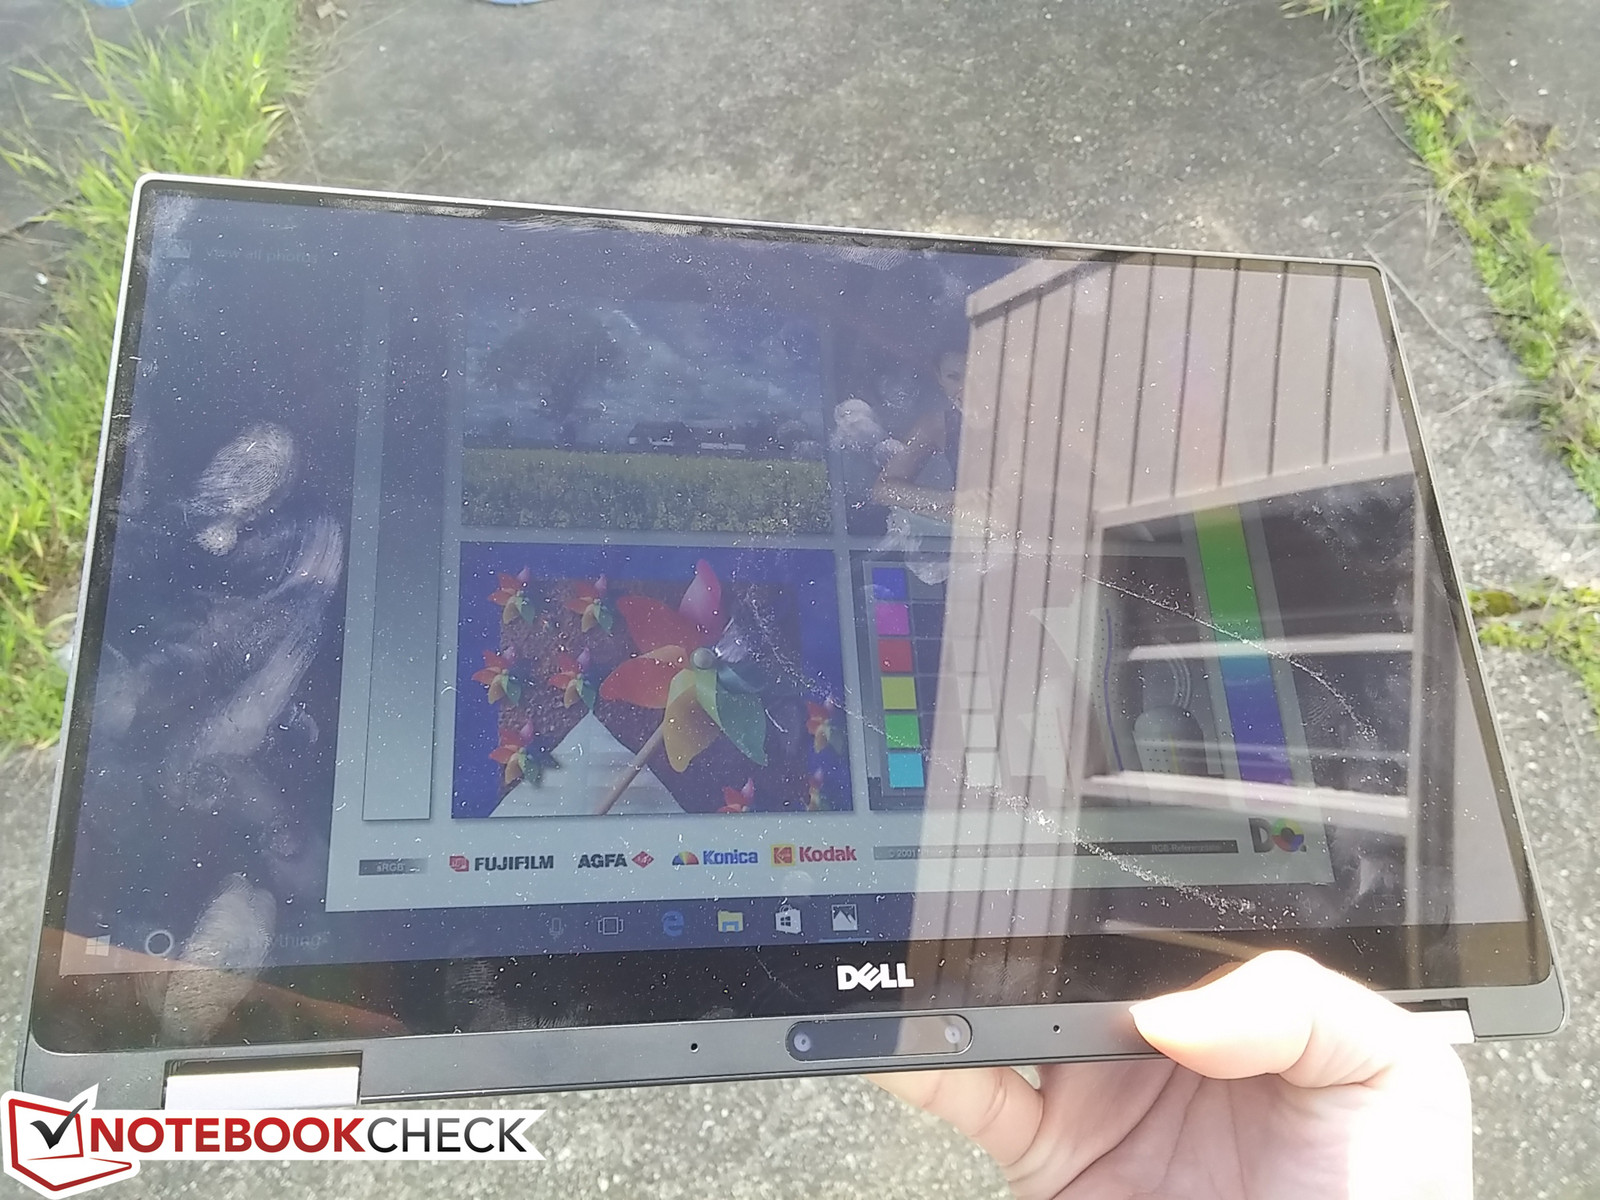
Outdoor visibility is acceptable when under shade due to the very bright backlight. The minor glare is not distracting and can be easily ignored with the wide IPS viewing angles available. Working under direct sunlight is more difficult and will result in more washed out colors, of course, but it's definitely manageable assuming zoomed-in texts to reduce squinting.
Performance
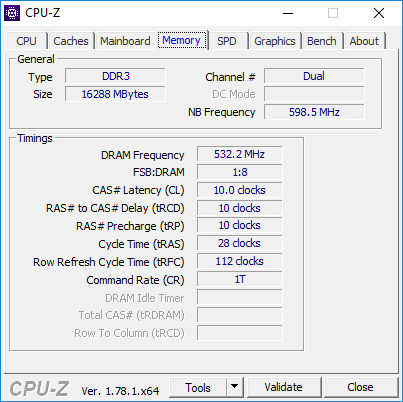
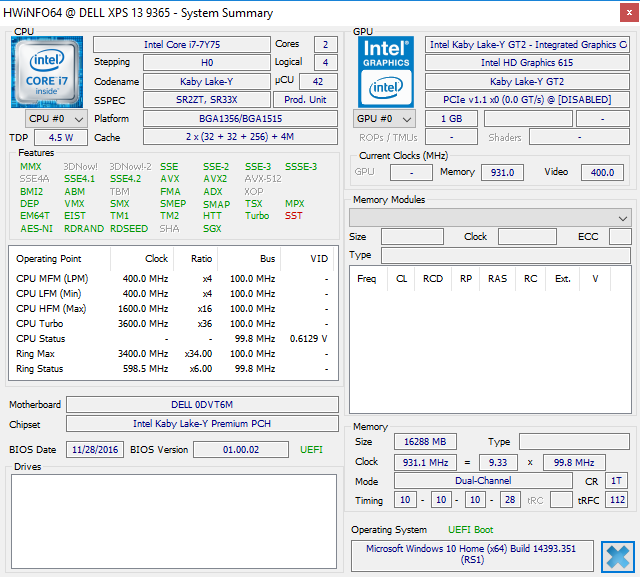
Just two processor options are available on the XPS 2-in-1 as of this writing: The Core i5-7Y54 and the Core i7-7Y75. The higher-end i7 SKU includes vPro, a slightly faster integrated HD Graphics 615 GPU, and slightly faster base and maximum clock rates than the i5-7Y54 by 100 MHz and 400 MHz, respectively. RAM options are soldered from 4 GB up to 16 GB while the M.2 SSD can be configured from 128 GB up to 512 GB.
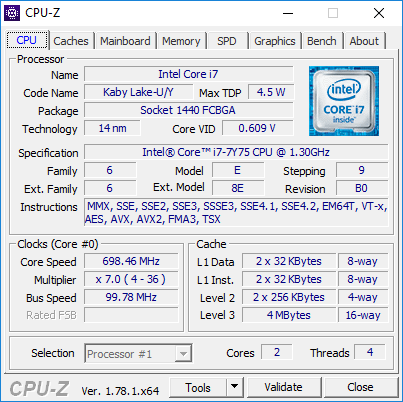
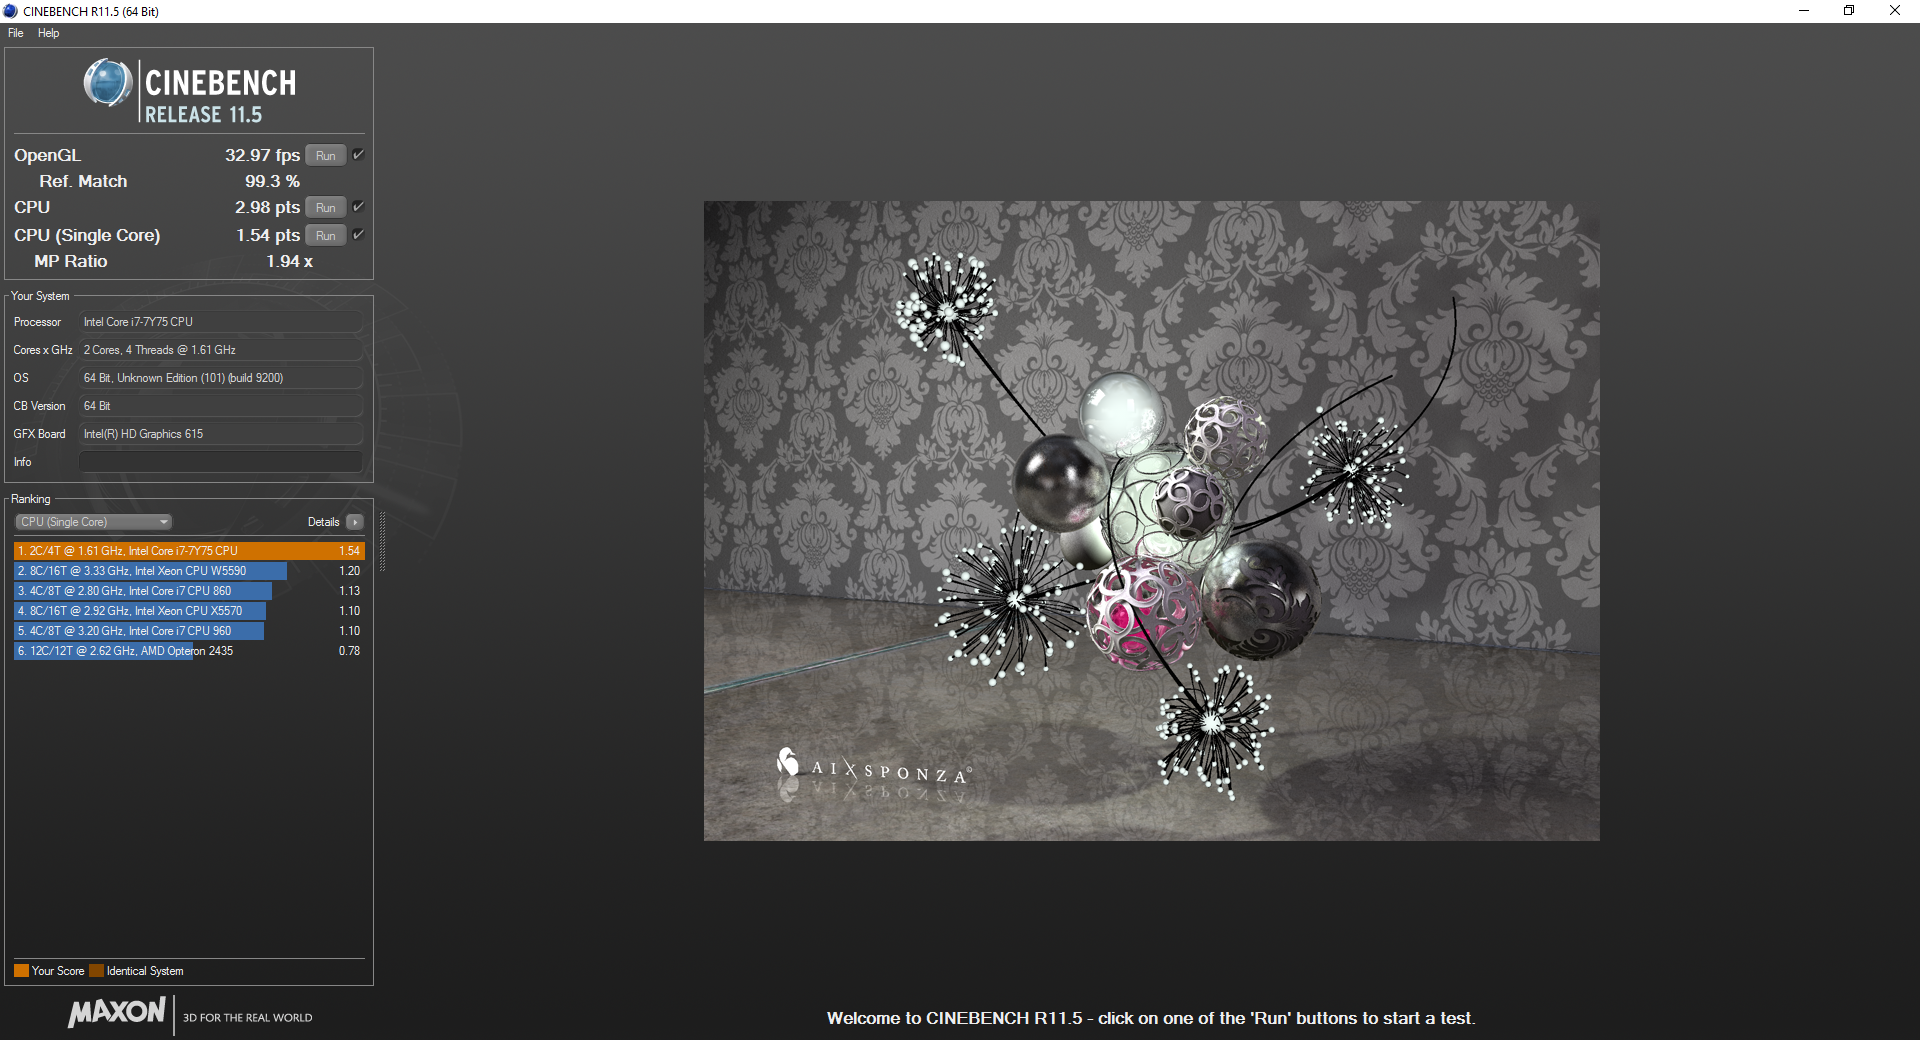
Processor
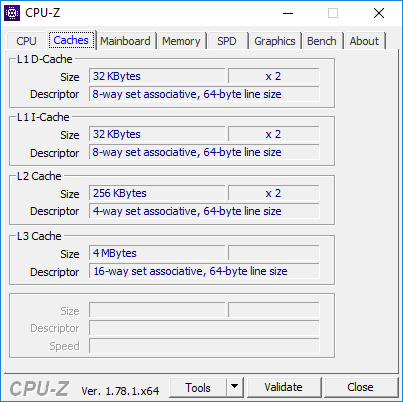
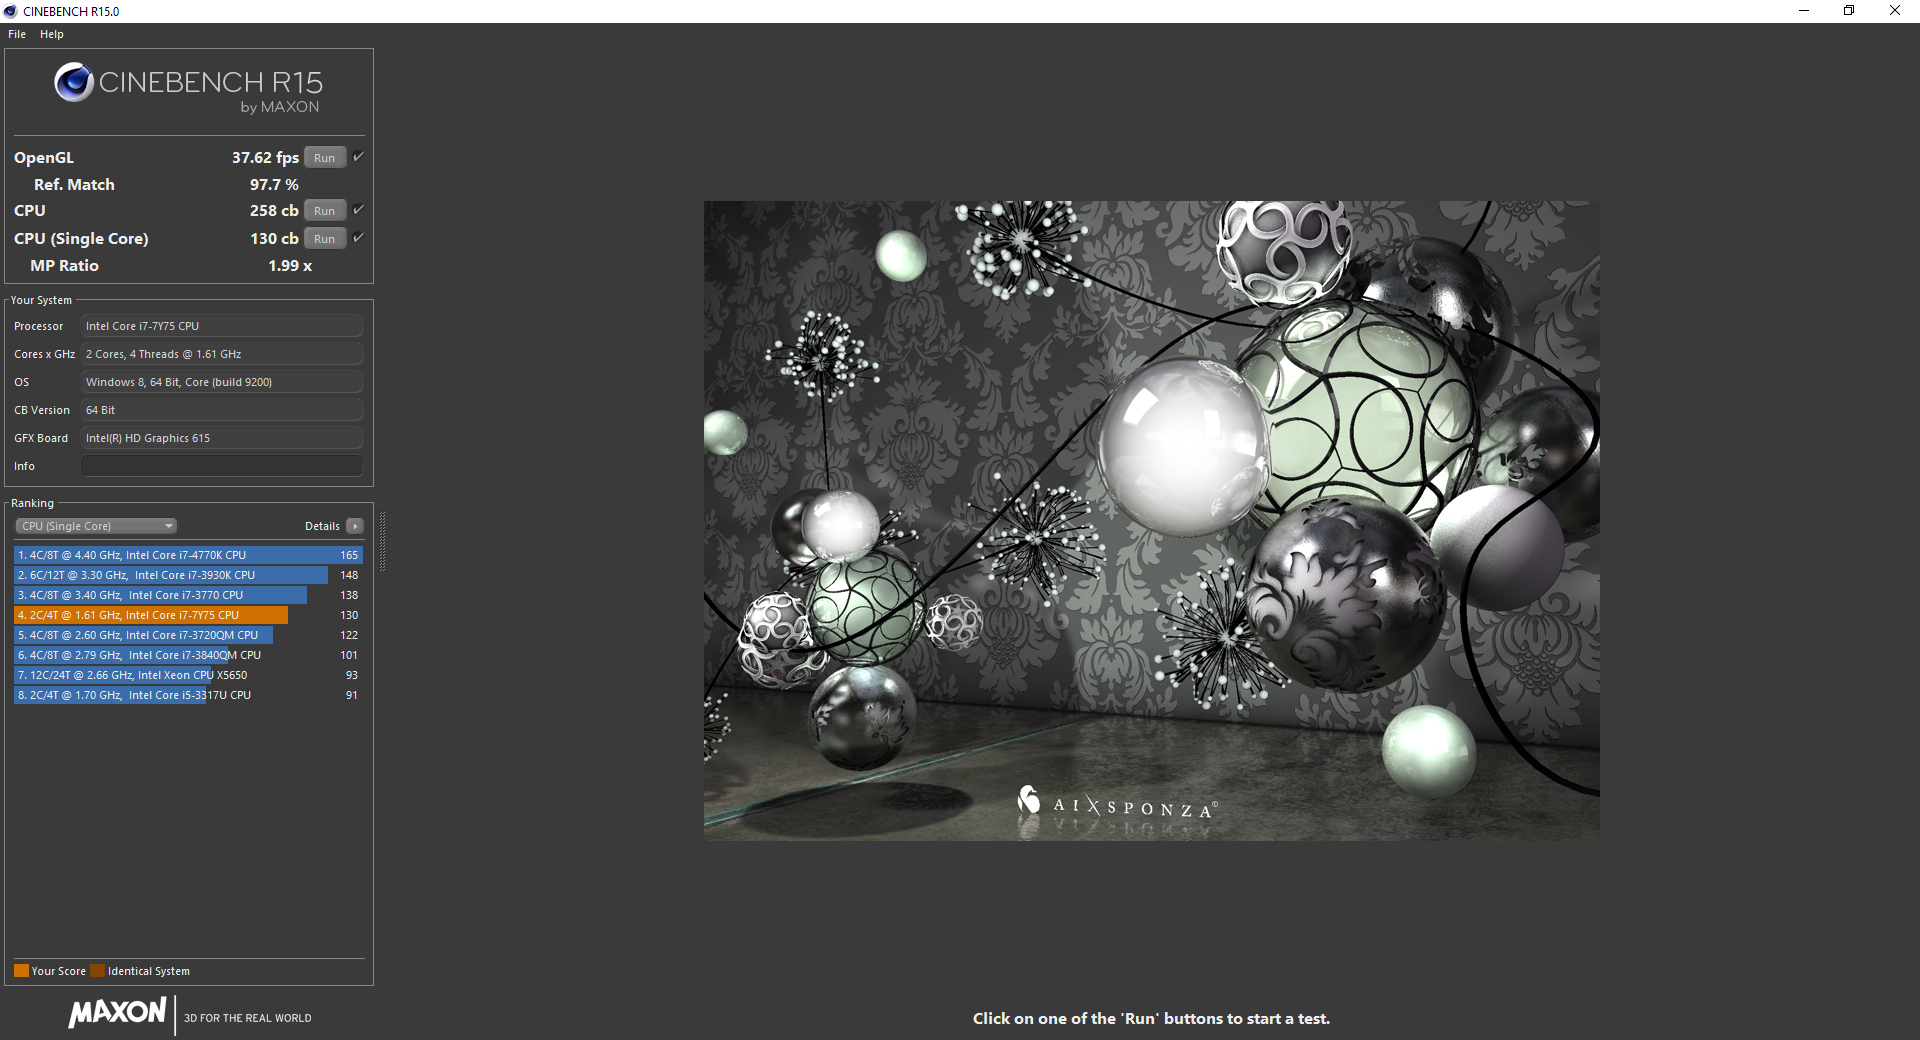
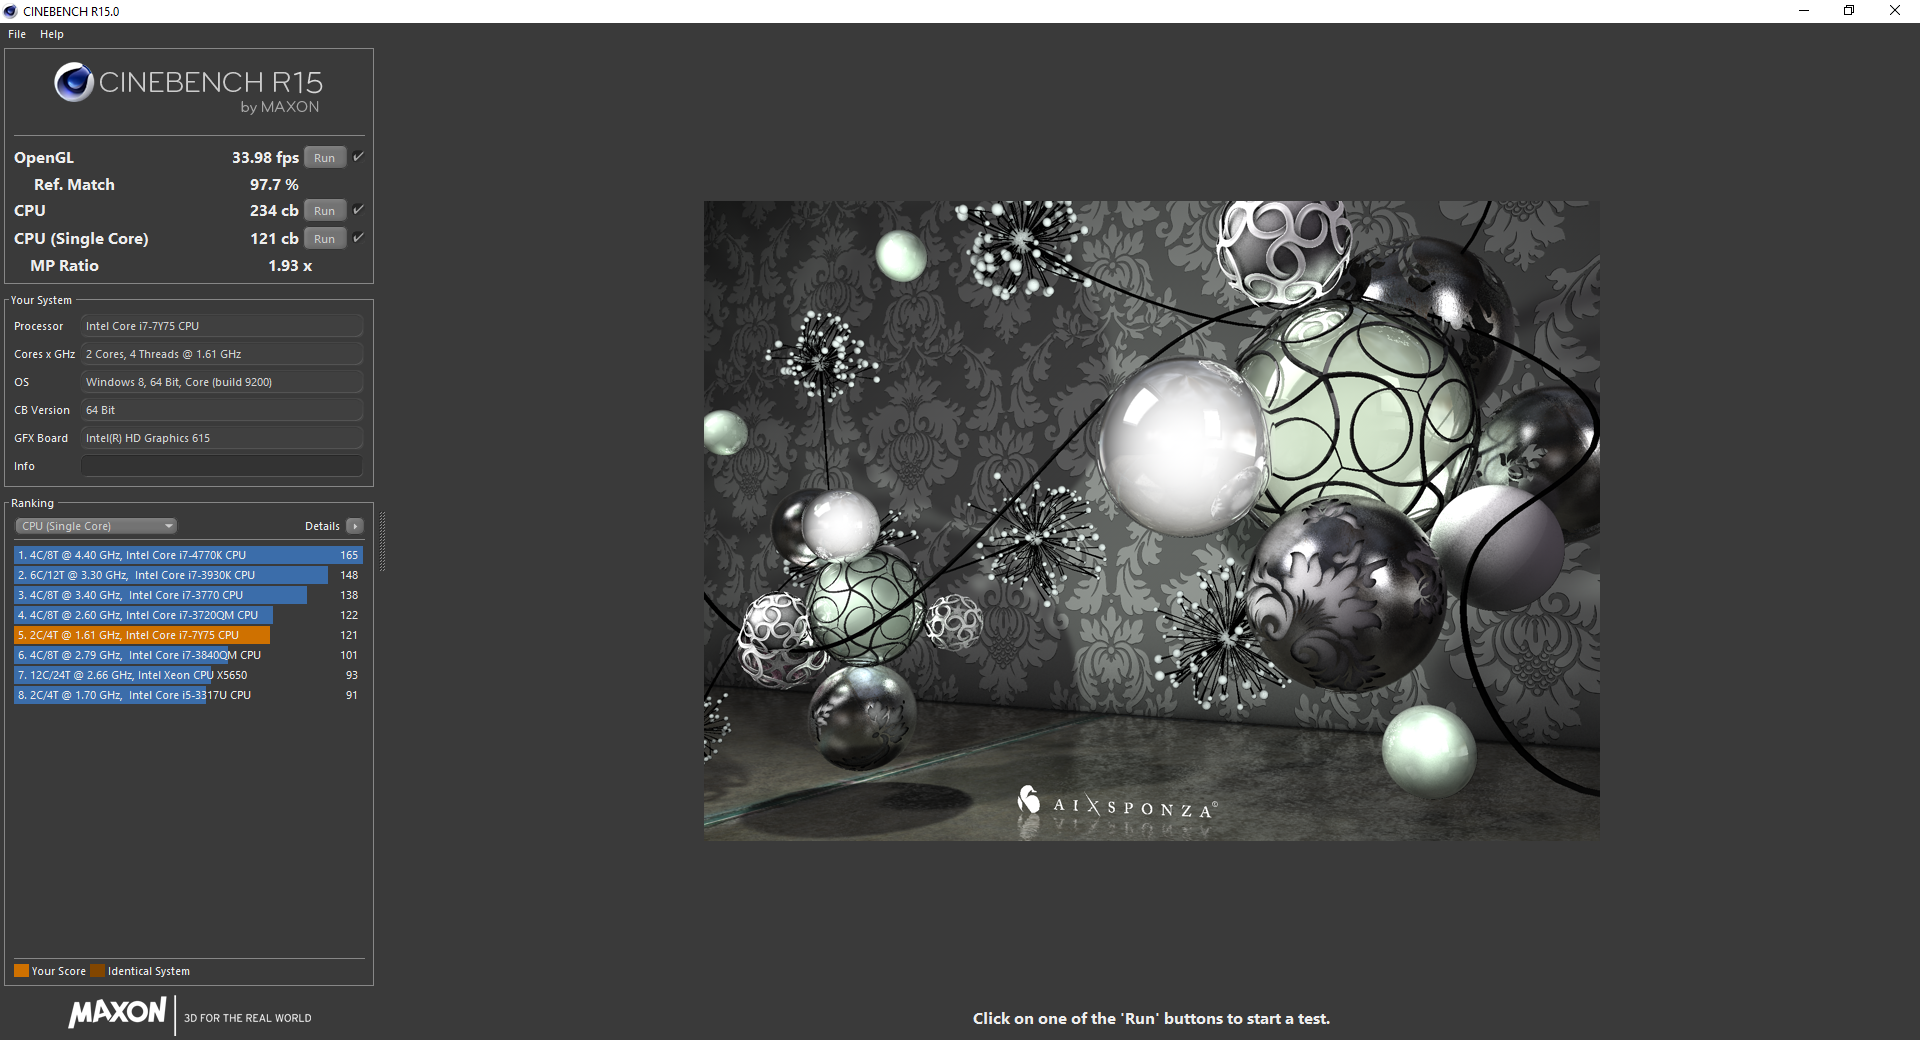
The new Kaby Lake Y-series is very similar to the outgoing Skylake Y-series in both lithography and performance. Instead, the Kaby Lake i7-7Y75 differentiates itself from the outgoing Skylake m7-6Y75 largely with its faster raw clock rates. CineBench R15 shows the i7-7Y75 in our Dell outperforming the m7-6Y75 in the EliteBook 1030 G1 by about 14 percent in single-threaded workloads. The processor even matches the single-threaded performance of the i5-7200U commonly found in the latest Ultrabooks including on the XPS 13 9360, which is impressive for a passively-cooled CPU. Dell has explicitly stated that the XPS 2-in-1 can run its processor at well over the 4.5 W TDP limit for faster performance, though the CPU can only sustain a clock rate in the 2.8 - 3.0 GHz range for single-threaded workloads according to our own observations.
Multi-threaded performance from the i7-7Y75 is a little more disappointing as even the older m7-6Y75 is able to outperform our XPS 2-in-1 configuration by about 10 percent according to CineBench R15. This may be due to the Dell sustaining slower core clock rates than the HP when under extended stress conditions. In fact, running CineBench R15 benchmarks consecutively one after another shows progressively lower scores each time with results as shown below. The XPS 13 9360 and its i7-7200U is measurably faster than the XPS 13 2-in-1 by 23 percent in the same benchmark.
See our dedicated CPU page on the Core i7-7Y75 for more technical information and benchmark comparisons.


| wPrime 2.10 - 1024m | |
| Dell XPS 13-9365 2-in-1 | |
| HP Pavilion 15t-au100 CTO (W0P31AV) | |
| Super Pi Mod 1.5 XS 32M - 32M | |
| Acer Spin 7 SP714-51-M09D | |
| Dell XPS 13 9360 FHD i5 | |
| HP Pavilion 15t-au100 CTO (W0P31AV) | |
| Dell XPS 13-9365 2-in-1 | |
* ... smaller is better
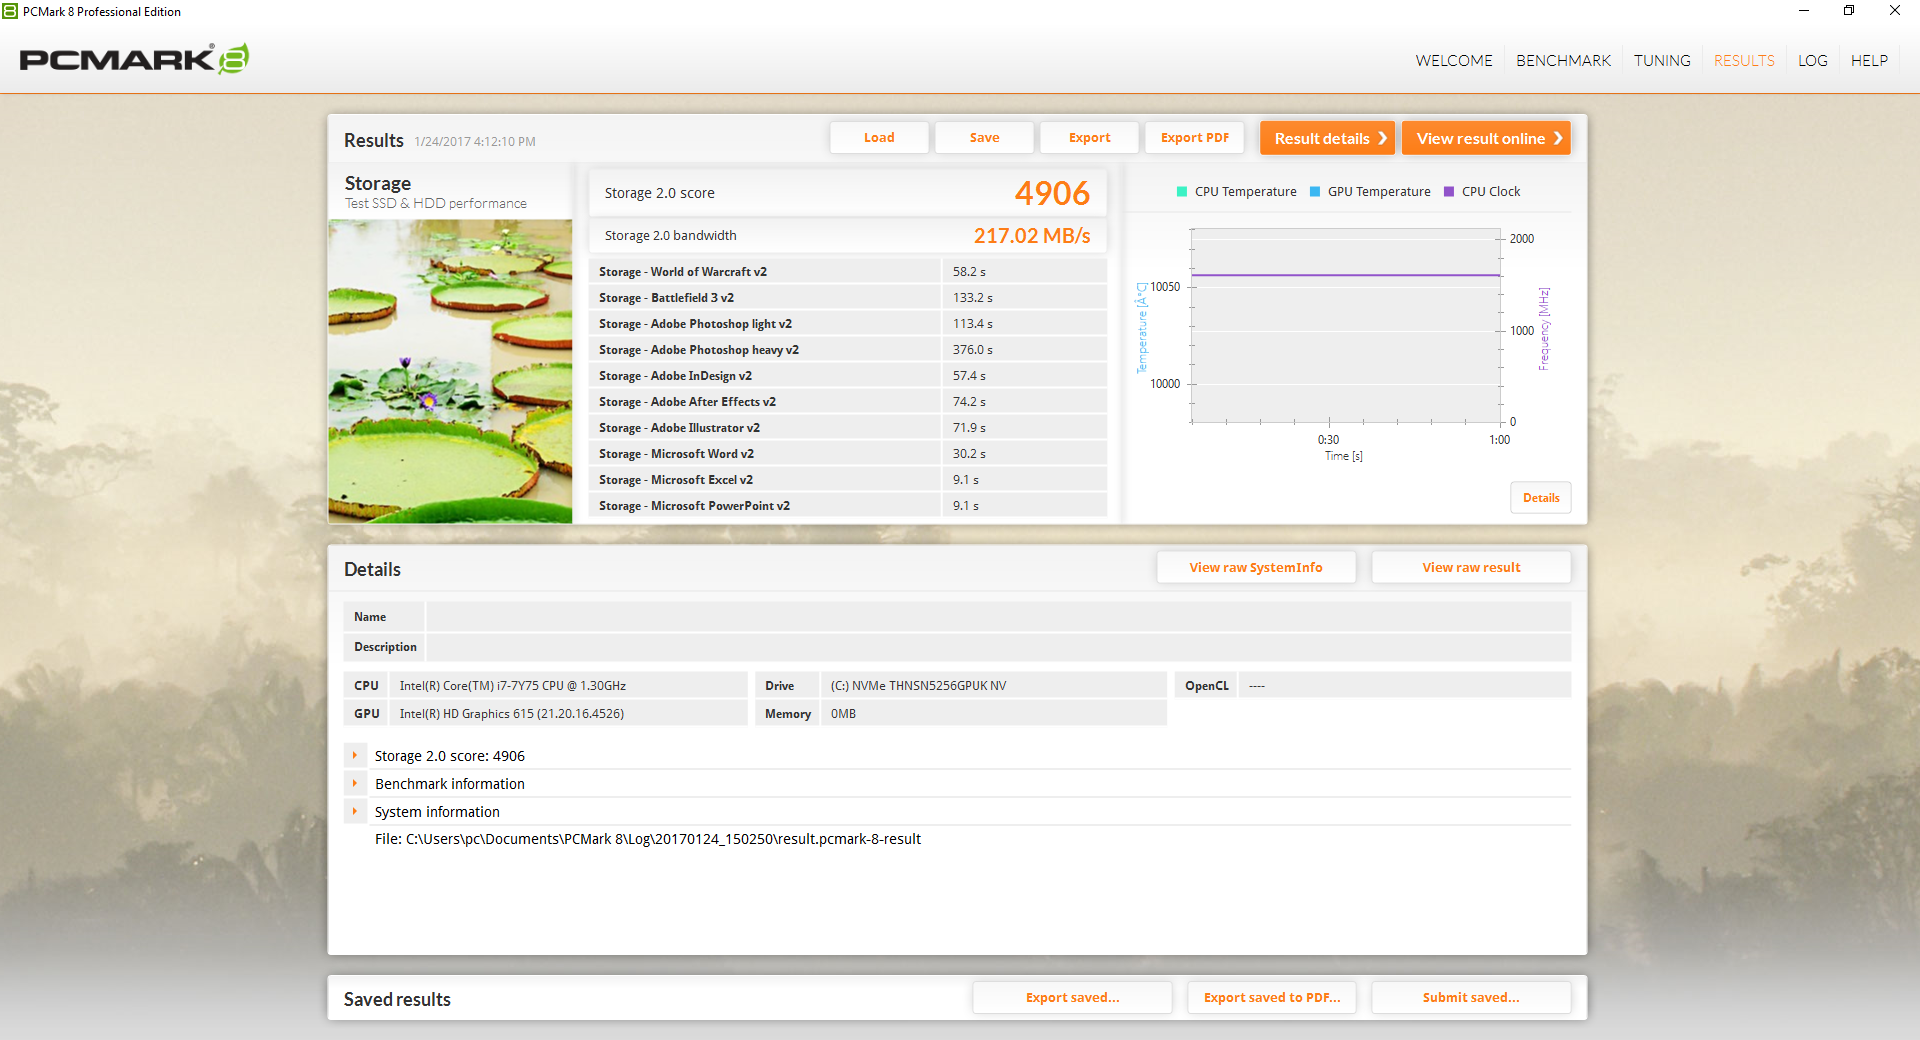
System Performance
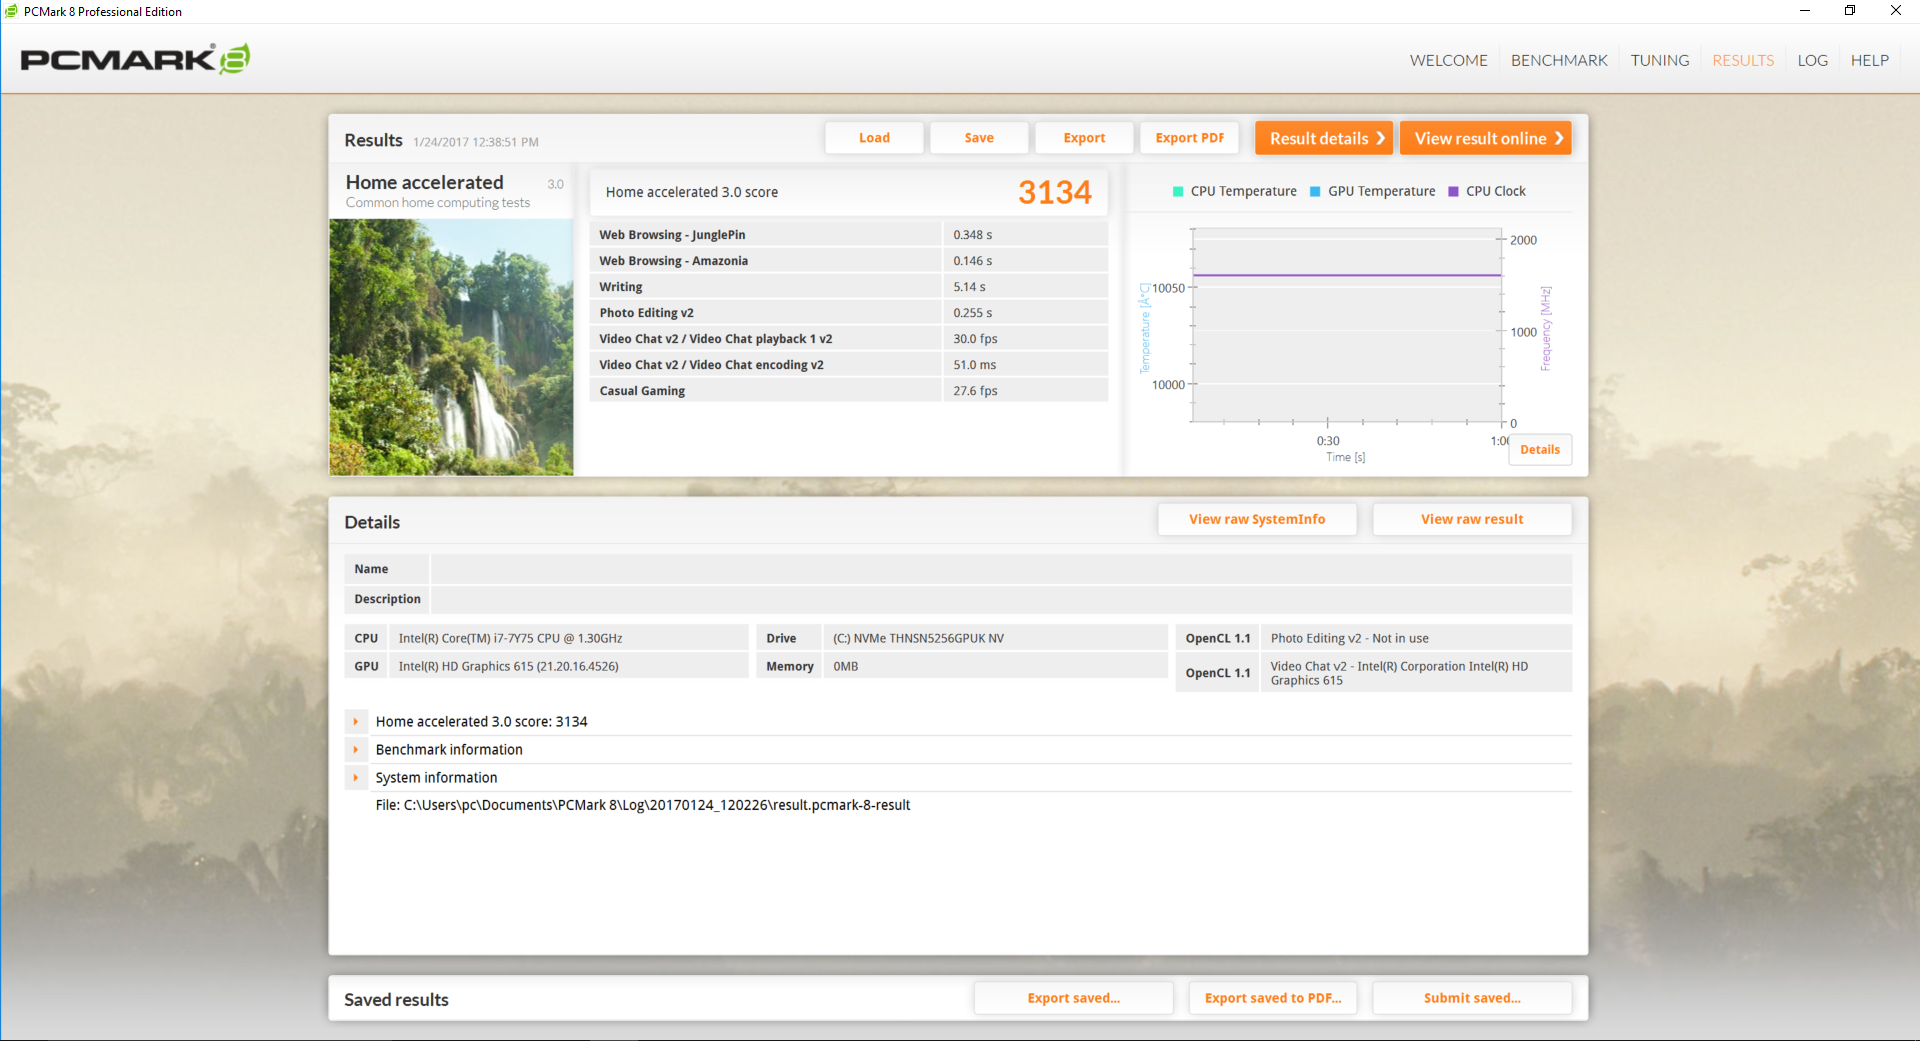
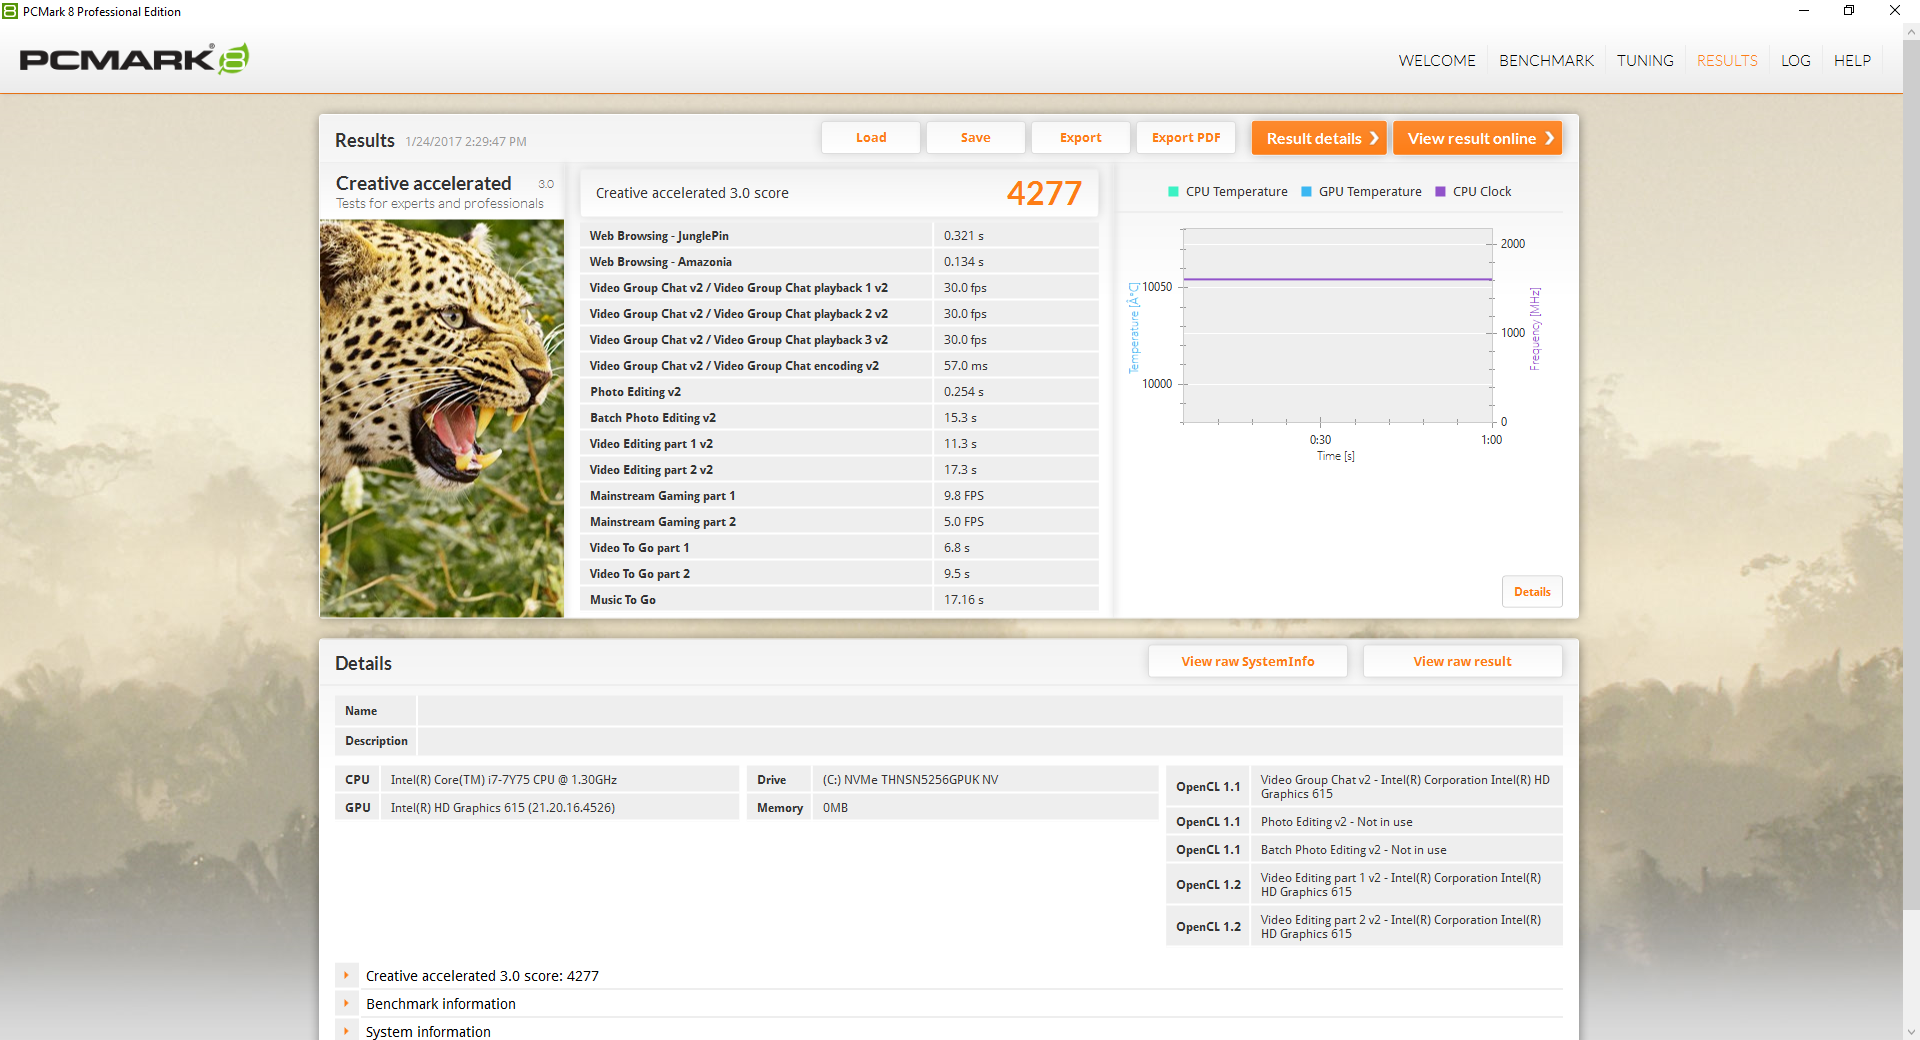
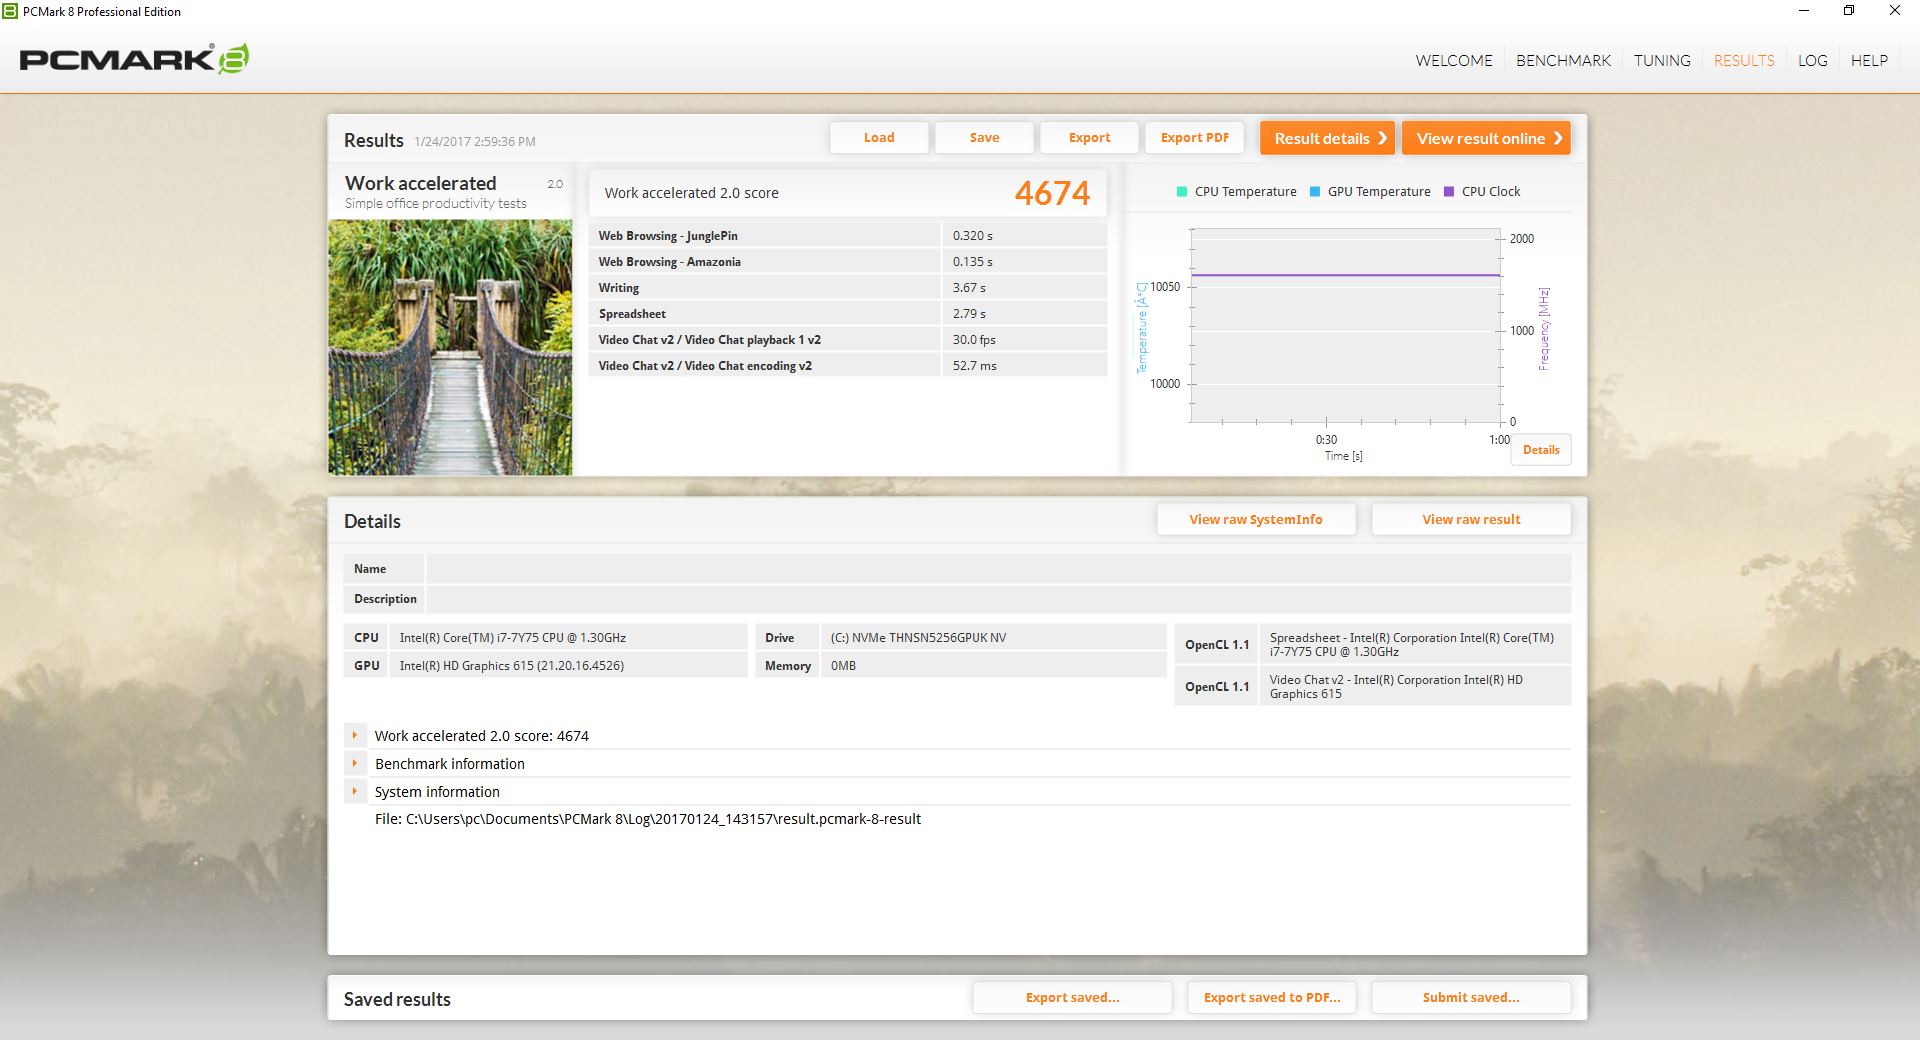
PCMark 8 ranks the XPS 2-in-1 in the same ballpark as competing notebooks with ULV U-class processors including the Spectre x360 13 and Zenbook UX310UQ despite the weaker Core i7-7Y75 in the Dell.
Subjectively, system responsiveness is very fast when navigating and launching applications as expected from a SSD-based PC. Heavier programs like Photoshop or games take noticeably longer to launch compared to a proper Ultrabook. While we experienced no notable hardware or software issues, the wake and boot up times for our XPS 2-in-1 are longer than usual as the initial Dell splash screen will strangely take several seconds to appear after pressing the Power button.
| PCMark 8 | |
| Home Score Accelerated v2 | |
| HP Spectre x360 13-w023dx | |
| Asus Zenbook UX310UQ-GL011T | |
| Lenovo Yoga 910-13IKB-80VF004CGE | |
| Dell XPS 13 9360 FHD i5 | |
| Dell XPS 13-9365 2-in-1 | |
| Work Score Accelerated v2 | |
| HP Spectre x360 13-w023dx | |
| Dell XPS 13-9365 2-in-1 | |
| Asus Zenbook UX310UQ-GL011T | |
| Dell XPS 13 9360 FHD i5 | |
| Creative Score Accelerated v2 | |
| HP Spectre x360 13-w023dx | |
| Asus Zenbook UX310UQ-GL011T | |
| Dell XPS 13-9365 2-in-1 | |
| Dell XPS 13 9360 FHD i5 | |
| PCMark 8 Home Score Accelerated v2 | 3134 points | |
| PCMark 8 Creative Score Accelerated v2 | 4277 points | |
| PCMark 8 Work Score Accelerated v2 | 4674 points | |
Help | ||
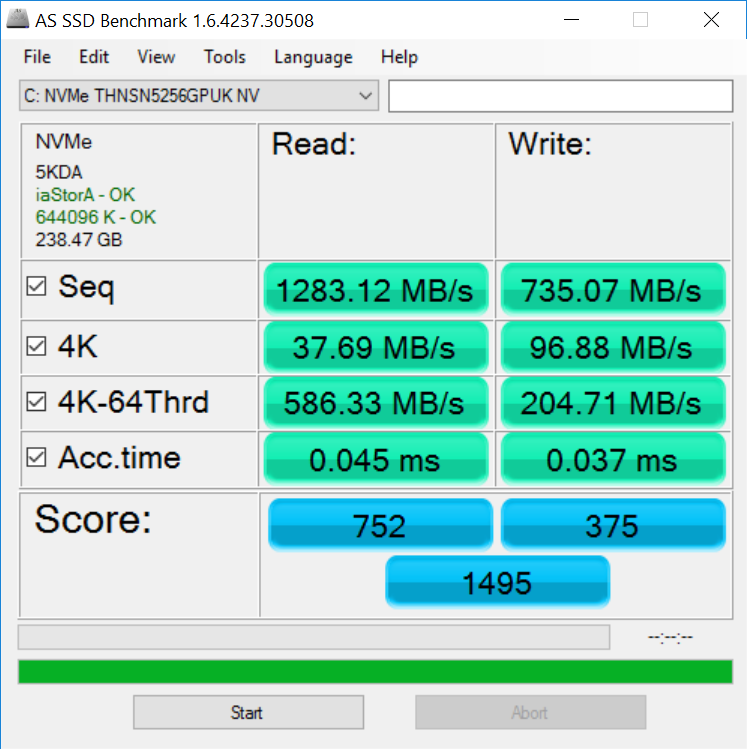
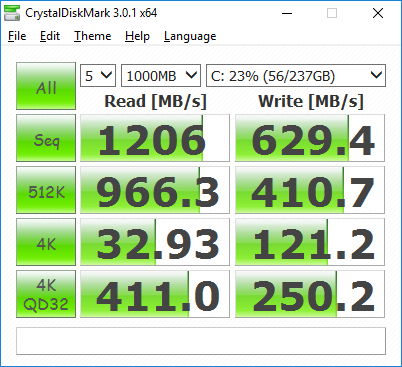
Storage Devices
Perhaps unsurprisingly, our XPS 13 2-in-1 is equipped with the same 256 GB Toshiba NVMe M.2 2280 SSD model as found on the XPS 13 9360. CrystalDiskMark results are essentially the same between them as shown by our comparison table below, so users can expect very similar storage performances with no compromises made on the Dell convertible. There are no secondary internal storage options, though Dell is promising configurations with self-encrypting SSDs in the future.
See our growing table of SSDs and HDDs for more benchmark comparisons.
| Dell XPS 13-9365 2-in-1 Toshiba NVMe THNSN5256GPUK | Lenovo Yoga 910-13IKB-80VF004CGE Samsung PM951 NVMe MZVLV512 | HP Spectre x360 13-w023dx Samsung PM951 NVMe MZVLV512 | Asus Zenbook UX310UQ-GL011T SanDisk SD8SNAT256G1002 | Dell XPS 13 9360 FHD i5 Toshiba NVMe THNSN5256GPUK | |
|---|---|---|---|---|---|
| CrystalDiskMark 3.0 | 28% | 17% | -46% | 3% | |
| Read Seq (MB/s) | 1206 | 1412 17% | 1376 14% | 468.1 -61% | 1233 2% |
| Write Seq (MB/s) | 629 | 578 -8% | 571 -9% | 319.2 -49% | 733 17% |
| Read 512 (MB/s) | 966 | 701 -27% | 679 -30% | 318.6 -67% | 1036 7% |
| Write 512 (MB/s) | 410.7 | 580 41% | 571 39% | 272.8 -34% | 439.9 7% |
| Read 4k (MB/s) | 32.93 | 43.5 32% | 42.66 30% | 22.03 -33% | 29.31 -11% |
| Write 4k (MB/s) | 121.2 | 159.7 32% | 137.9 14% | 72.1 -41% | 116.9 -4% |
| Read 4k QD32 (MB/s) | 411 | 570 39% | 535 30% | 147.4 -64% | 479.2 17% |
| Write 4k QD32 (MB/s) | 250.2 | 488.7 95% | 361.2 44% | 200.2 -20% | 218.3 -13% |

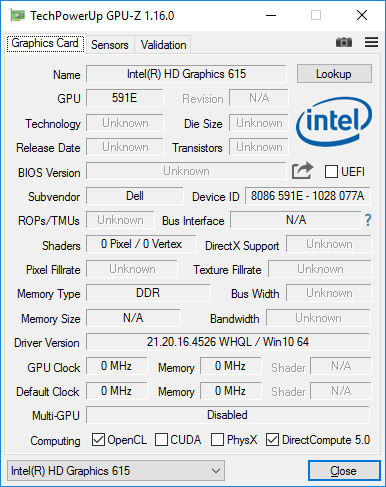
GPU Performance
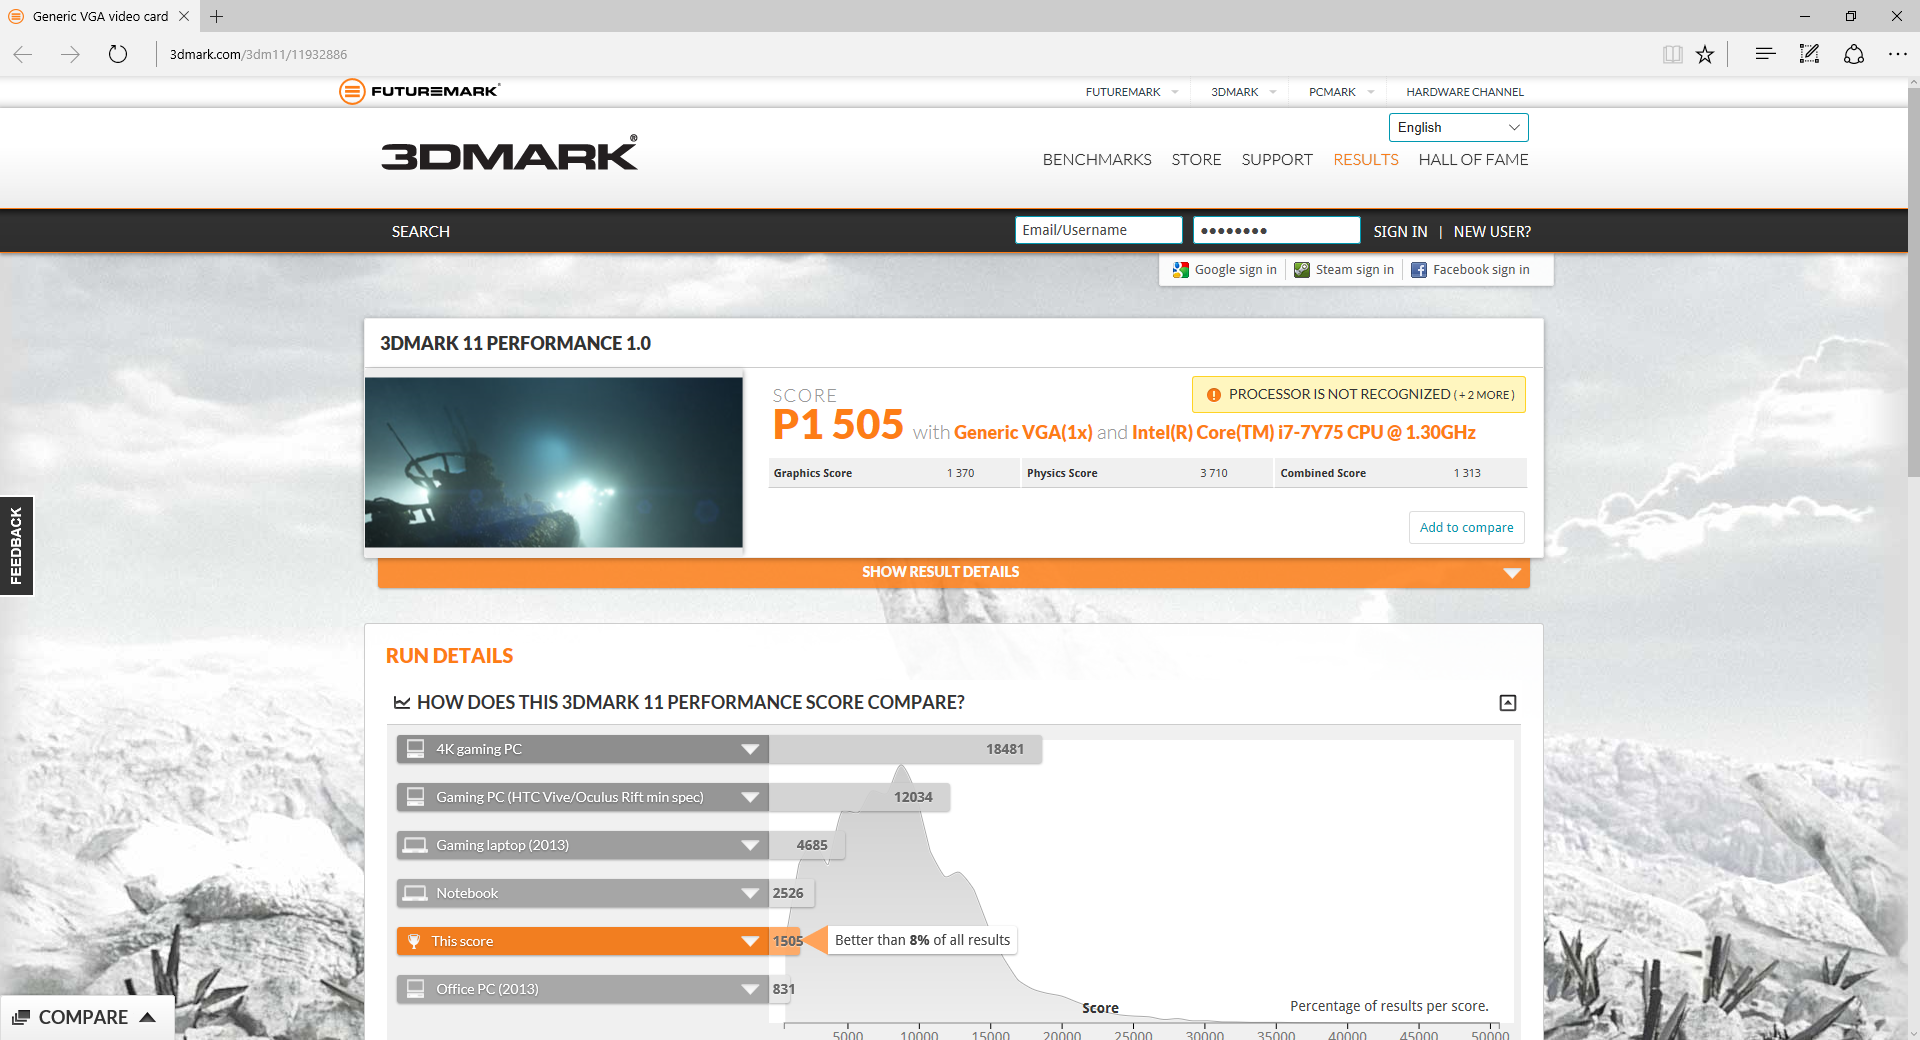
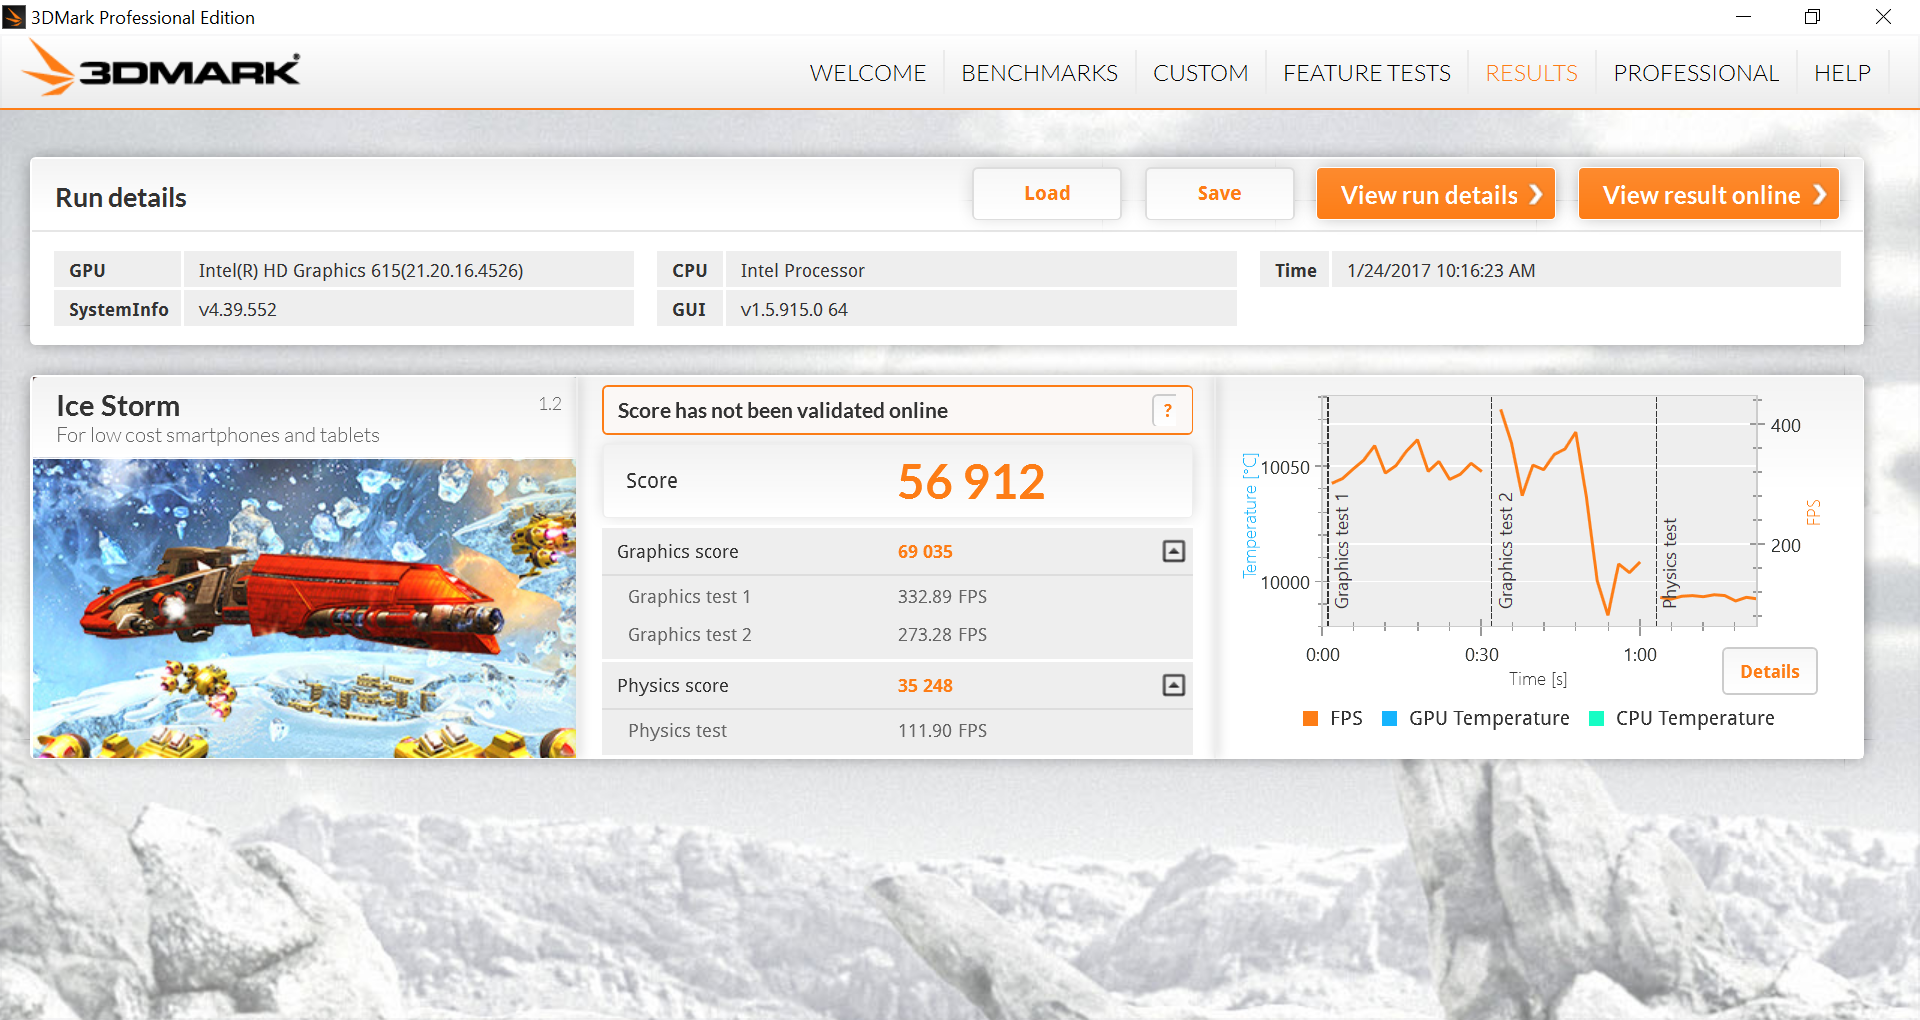
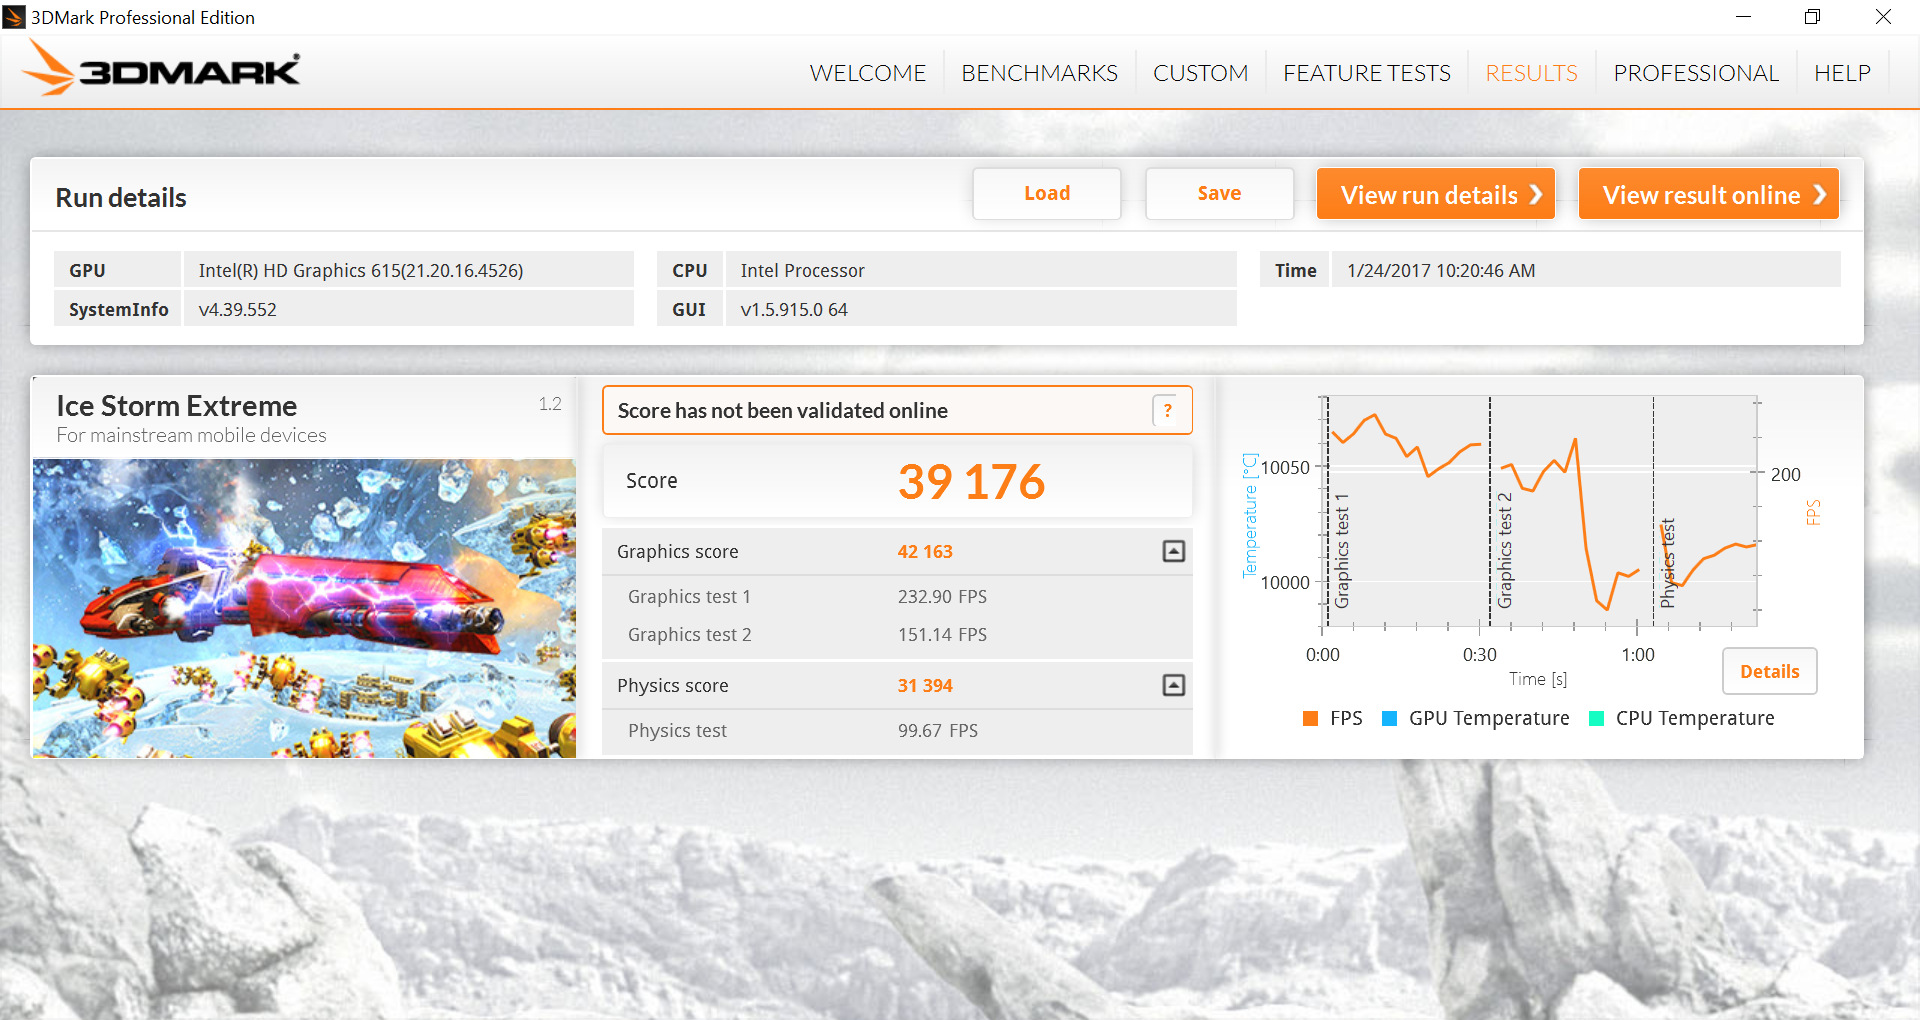
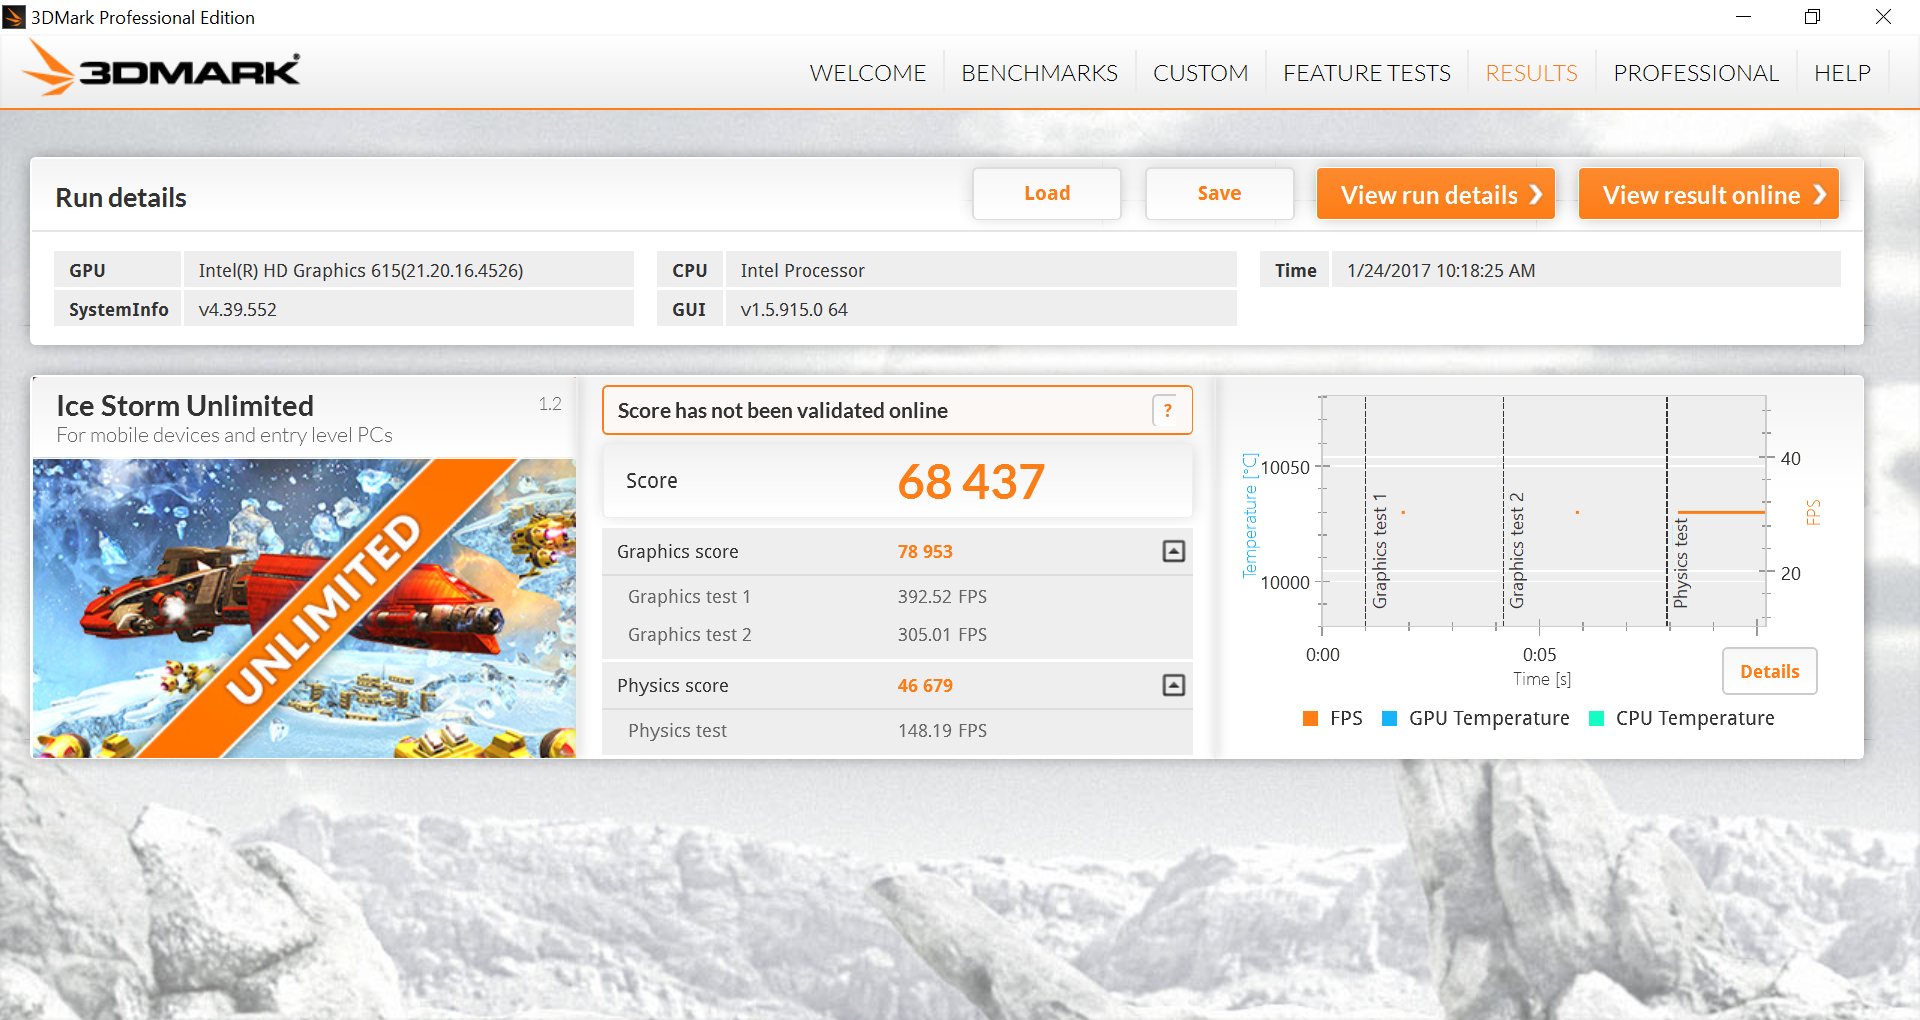
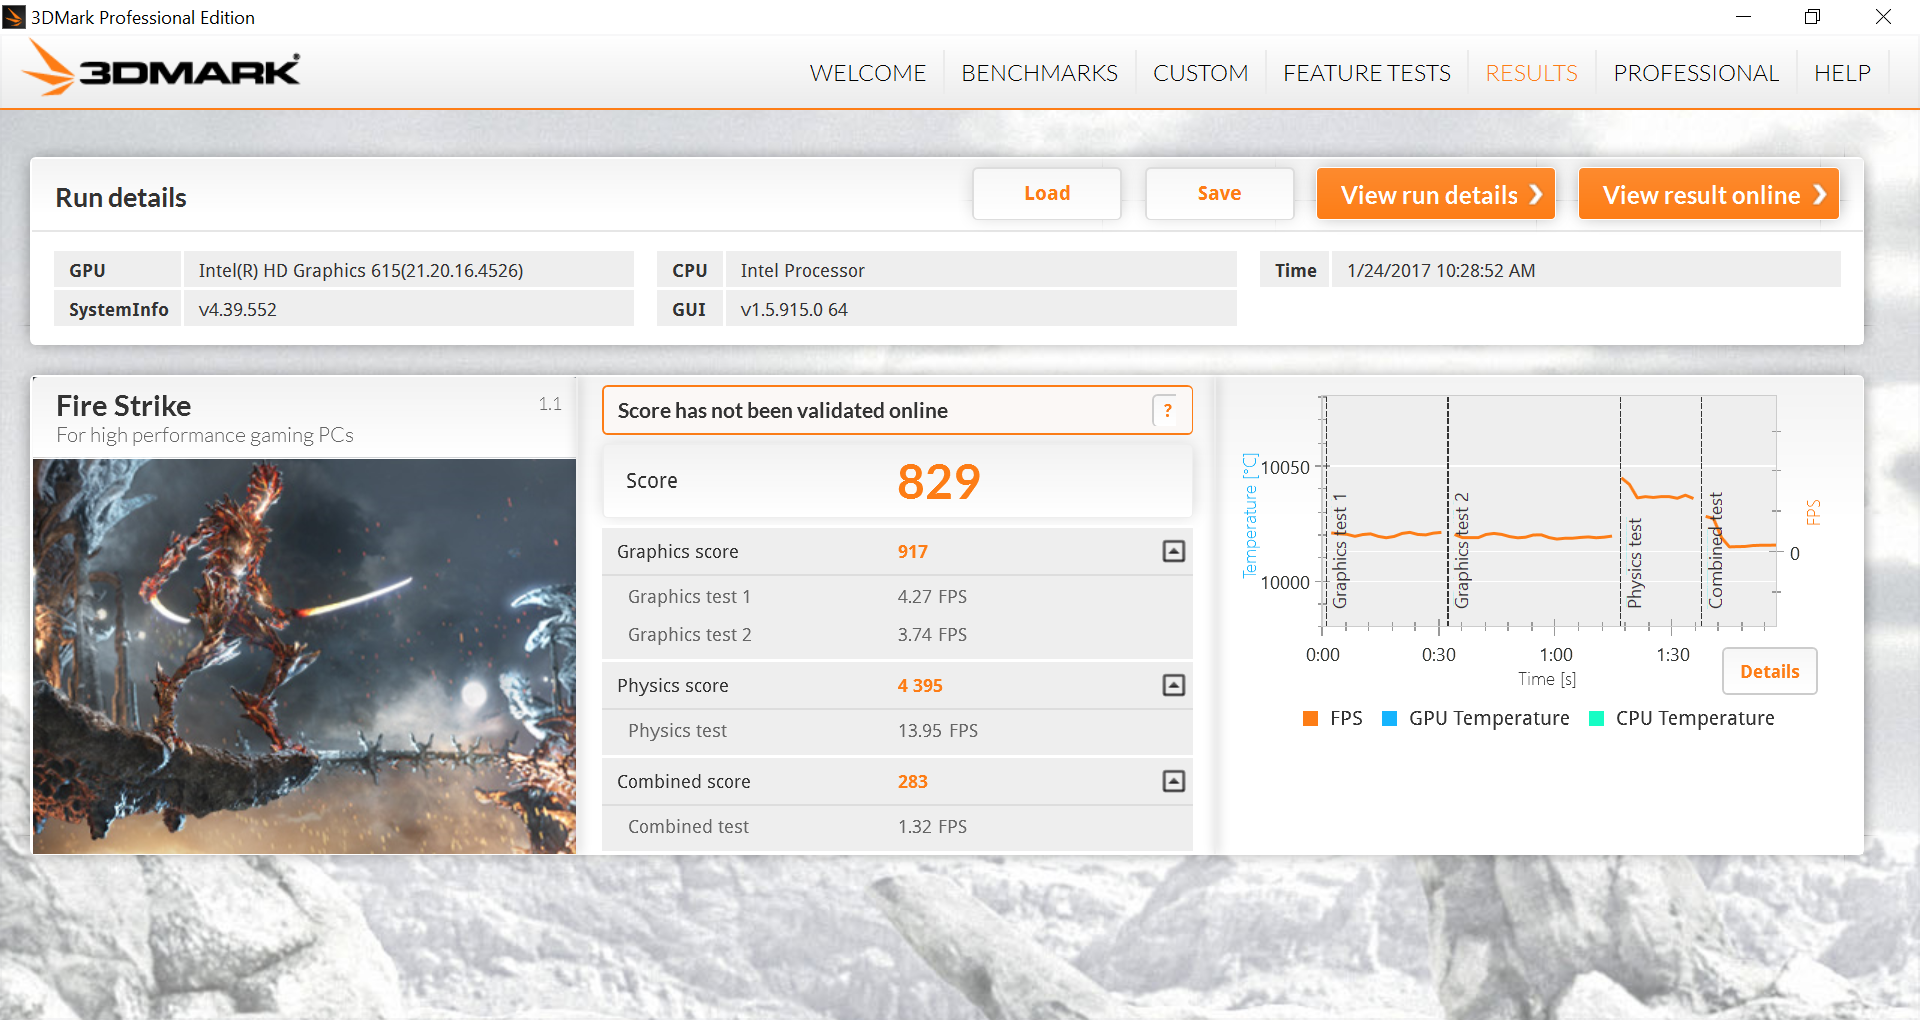
Raw graphics power according to 3DMark benchmarks is above even the HD Graphics 520 in the Skylake i5-6200U but still well below both the HD Graphics 620 in the Kaby Lake i7-7500U and the low-end GeForce 940MX discrete GPU. Overall performance is very low when dealing with integrated GPUs especially on a passively cooled processor.
See our dedicated GPU page on the HD Graphics 615 for more technical information and benchmark comparisons.
| 3DMark | |
| 1280x720 Cloud Gate Standard Graphics | |
| HP Pavilion 15-aw004ng W8Y60EA | |
| Asus Zenbook UX3410UA | |
| HP Pavilion 15t-au100 CTO (W0P31AV) | |
| Dell XPS 13 9360 FHD i5 | |
| Dell XPS 13-9365 2-in-1 | |
| HP 250 G5 SP X0N33EA | |
| Acer Spin 7 SP714-51-M09D | |
| Asus TransformerBook T302CA-FL010T | |
| Lenovo Yoga Book 2016 Windows 64GB LTE | |
| 1920x1080 Ice Storm Extreme Graphics | |
| Dell XPS 13 9360 FHD i5 | |
| HP Pavilion 15-aw004ng W8Y60EA | |
| Dell XPS 13-9365 2-in-1 | |
| 1280x720 offscreen Ice Storm Unlimited Graphics Score | |
| Dell XPS 13 9360 FHD i5 | |
| Dell XPS 13-9365 2-in-1 | |
| HP Pavilion 15-aw004ng W8Y60EA | |
| 1280x720 Ice Storm Standard Graphics | |
| Dell XPS 13 9360 FHD i5 | |
| Dell XPS 13-9365 2-in-1 | |
| HP Pavilion 15-aw004ng W8Y60EA | |
| HP 250 G5 SP X0N33EA | |
| Acer Spin 7 SP714-51-M09D | |
| 3DMark 11 Performance | 1505 points | |
| 3DMark Ice Storm Standard Score | 56912 points | |
| 3DMark Cloud Gate Standard Score | 5828 points | |
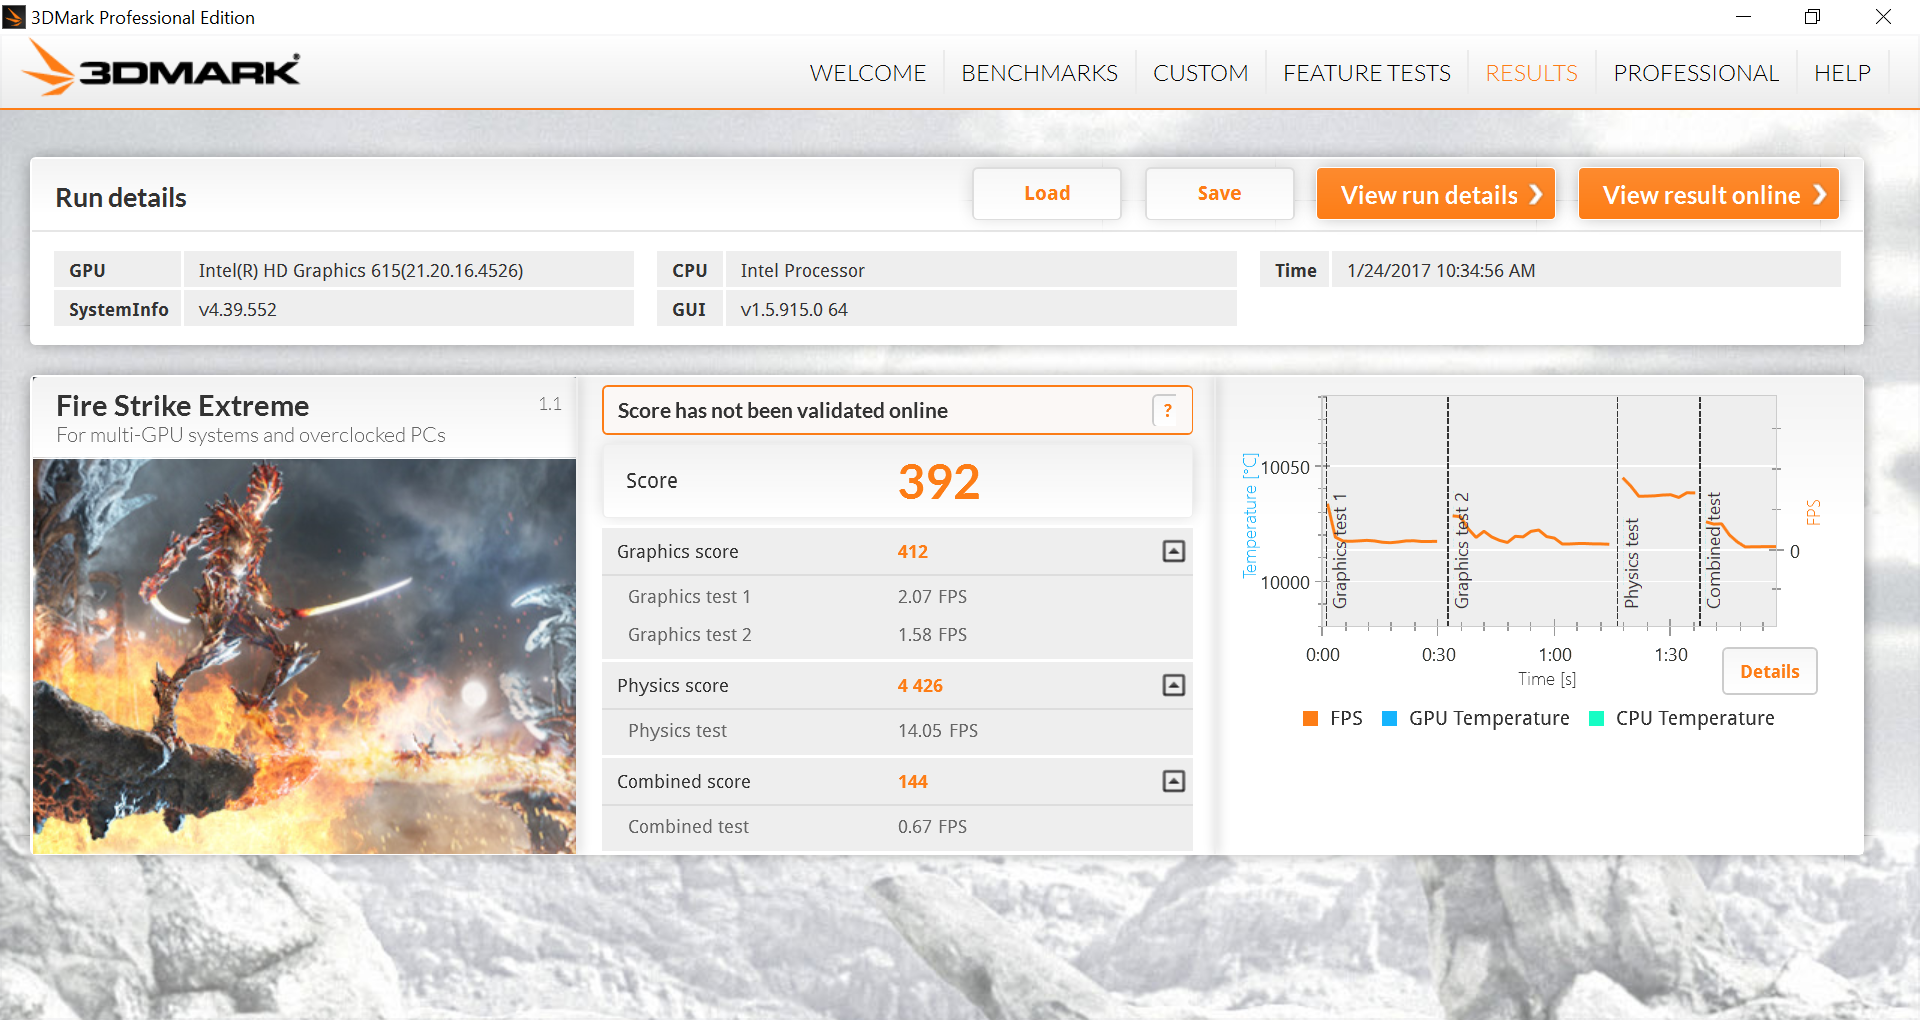
| 3DMark Fire Strike Score | 829 points | |
| 3DMark Fire Strike Extreme Score | 392 points | |
Help | ||
Gaming Performance
Real-world performance in games is bottom of the barrel as the Dell convertible is unable to play most modern 3D titles on even the lowest of settings and resolutions. Whereas 3DMark ranks the HD Graphics 615 faster than the HD Graphics 520, the Dell still comes out slower in our Bioshock Infinite test.
Performance throttling occurs during gaming loads. Our initial benchmark run on Metro: Last Light returned an average frame rate of 20.2. Rerunning the benchmark four more times in sequence returned an average frame rate of about 17.6 each time.
| BioShock Infinite - 1280x720 Very Low Preset | |
| Apple MacBook Pro 13 2016 (2.9 GHz) | |
| HP 17-y044ng | |
| Asus Zenbook UX3410UA | |
| Fujitsu LifeBook E736 E7360M27BBPL | |
| Asus TransformerBook T302CA-FL010T | |
| Dell XPS 13-9365 2-in-1 | |
| Acer Spin 7 SP714-51-M09D | |
| Medion Akoya E2215T | |
| low | med. | high | ultra | |
|---|---|---|---|---|
| BioShock Infinite (2013) | 38.4 | 18.8 | ||
| Metro: Last Light (2013) | 20.2 | |||
| Rise of the Tomb Raider (2016) | 12.9 |
Stress Test
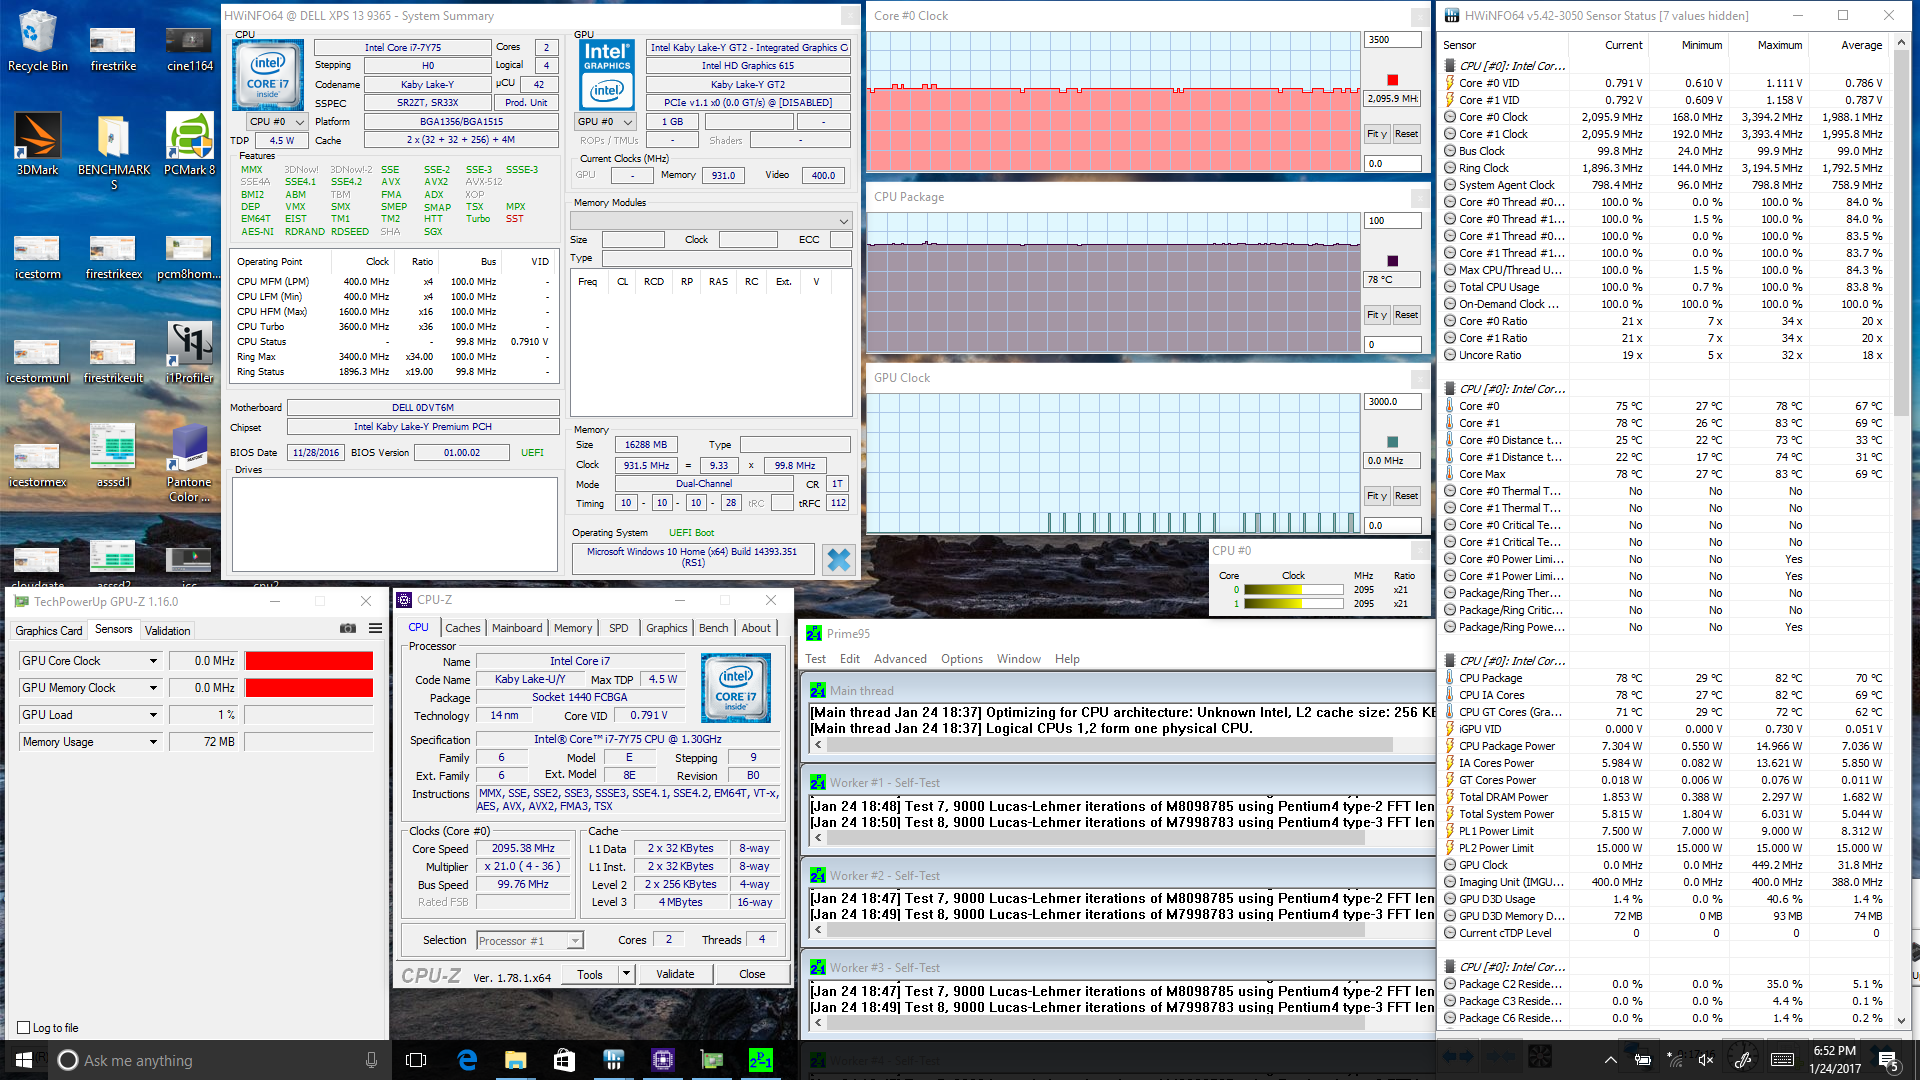
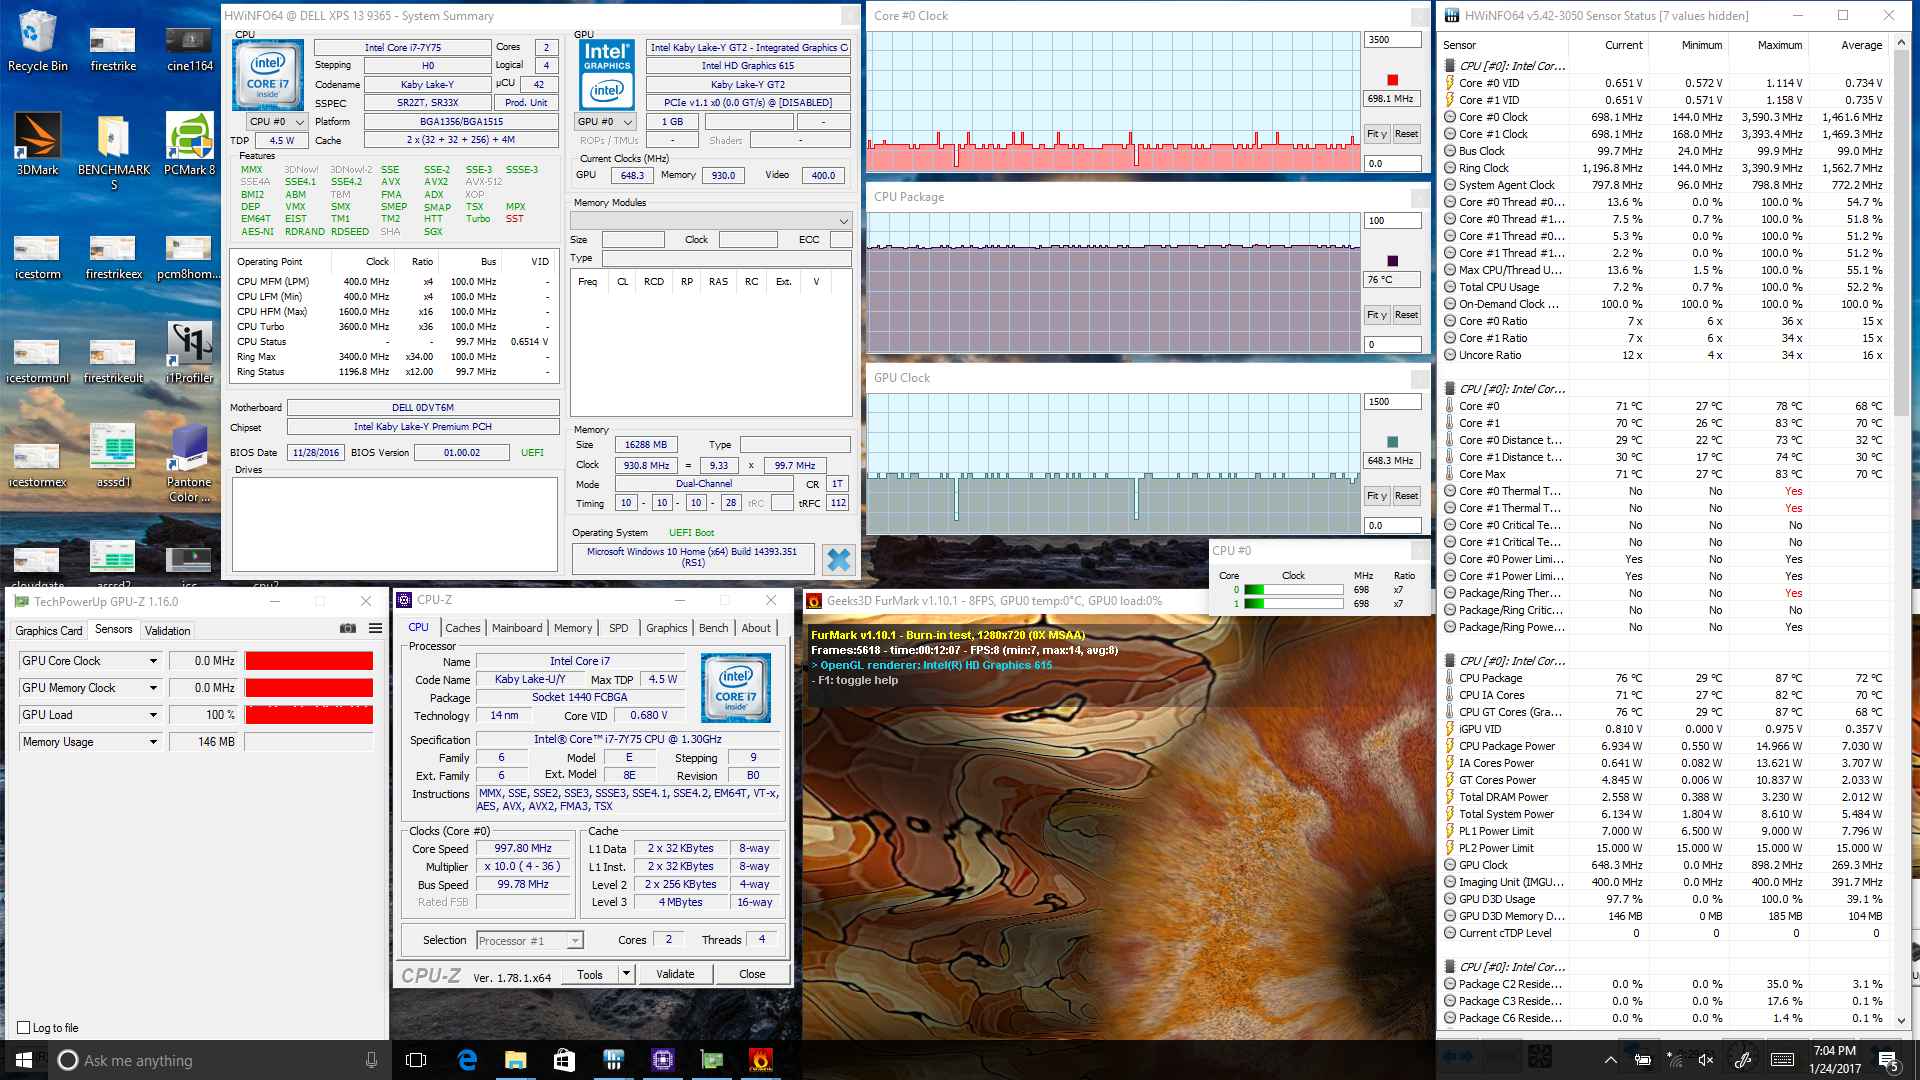
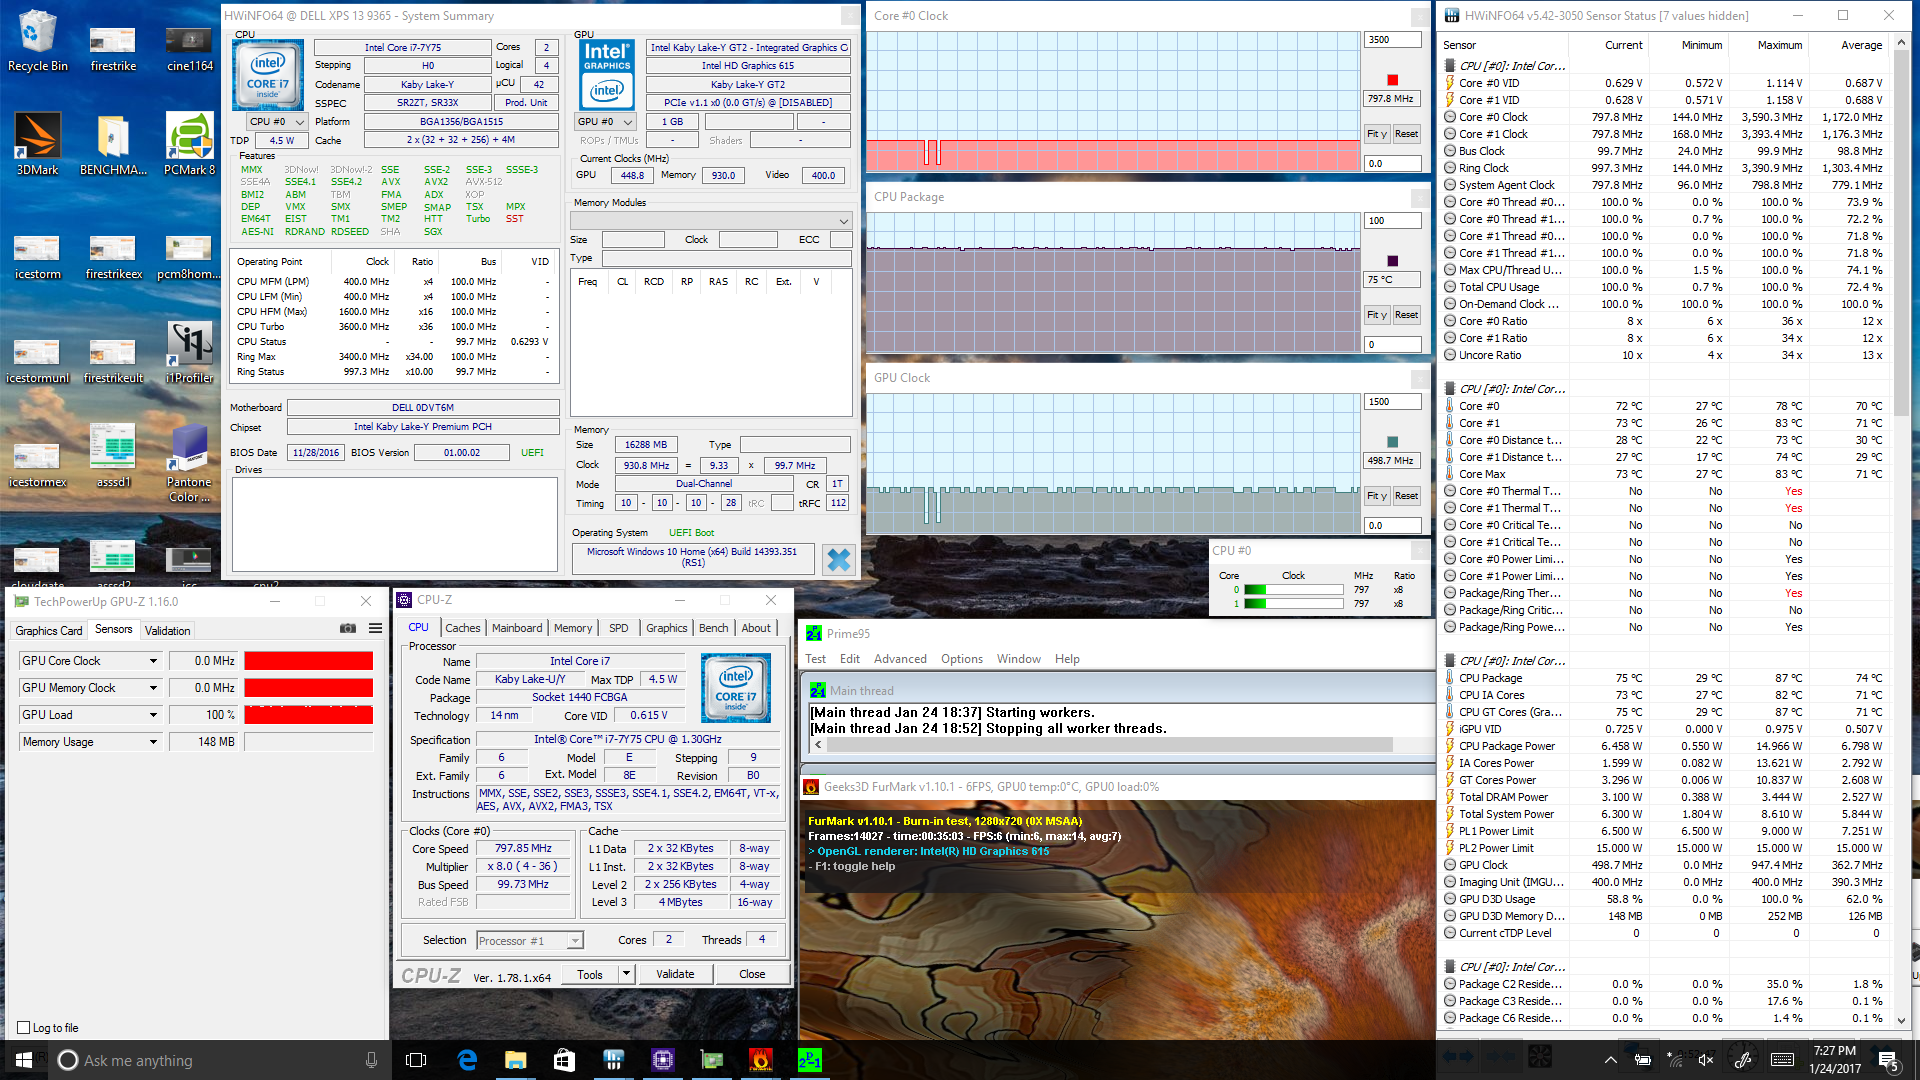
We stress the convertible with extreme benchmark workloads to identify for any potential throttling or stability issues. When under Prime95 stress, the CPU can be observed running at the 3.0 - 3.1 GHz range for the first few seconds before steadily dropping to a stable 2.0 - 2.1 GHz over the next several minutes to maintain a core temperature of 78 C. This is rather impressive for a passively cooled processor considering that the base clock of the Core i7-7Y75 is much slower at 1.3 GHz. Running FurMark to stress the integrated graphics unit will see a stable GPU clock of around 650 MHz.
Running both Prime95 and FurMark simultaneously will throttle both the CPU and GPU down to a steady 800 MHz and 500 MHz, respectively, in order to maintain a core temperature of about 75 C. It appears that the system will initially run at higher Boost clock rates until core temperature reaches 87 C where performance will then automatically throttle as appropriate.
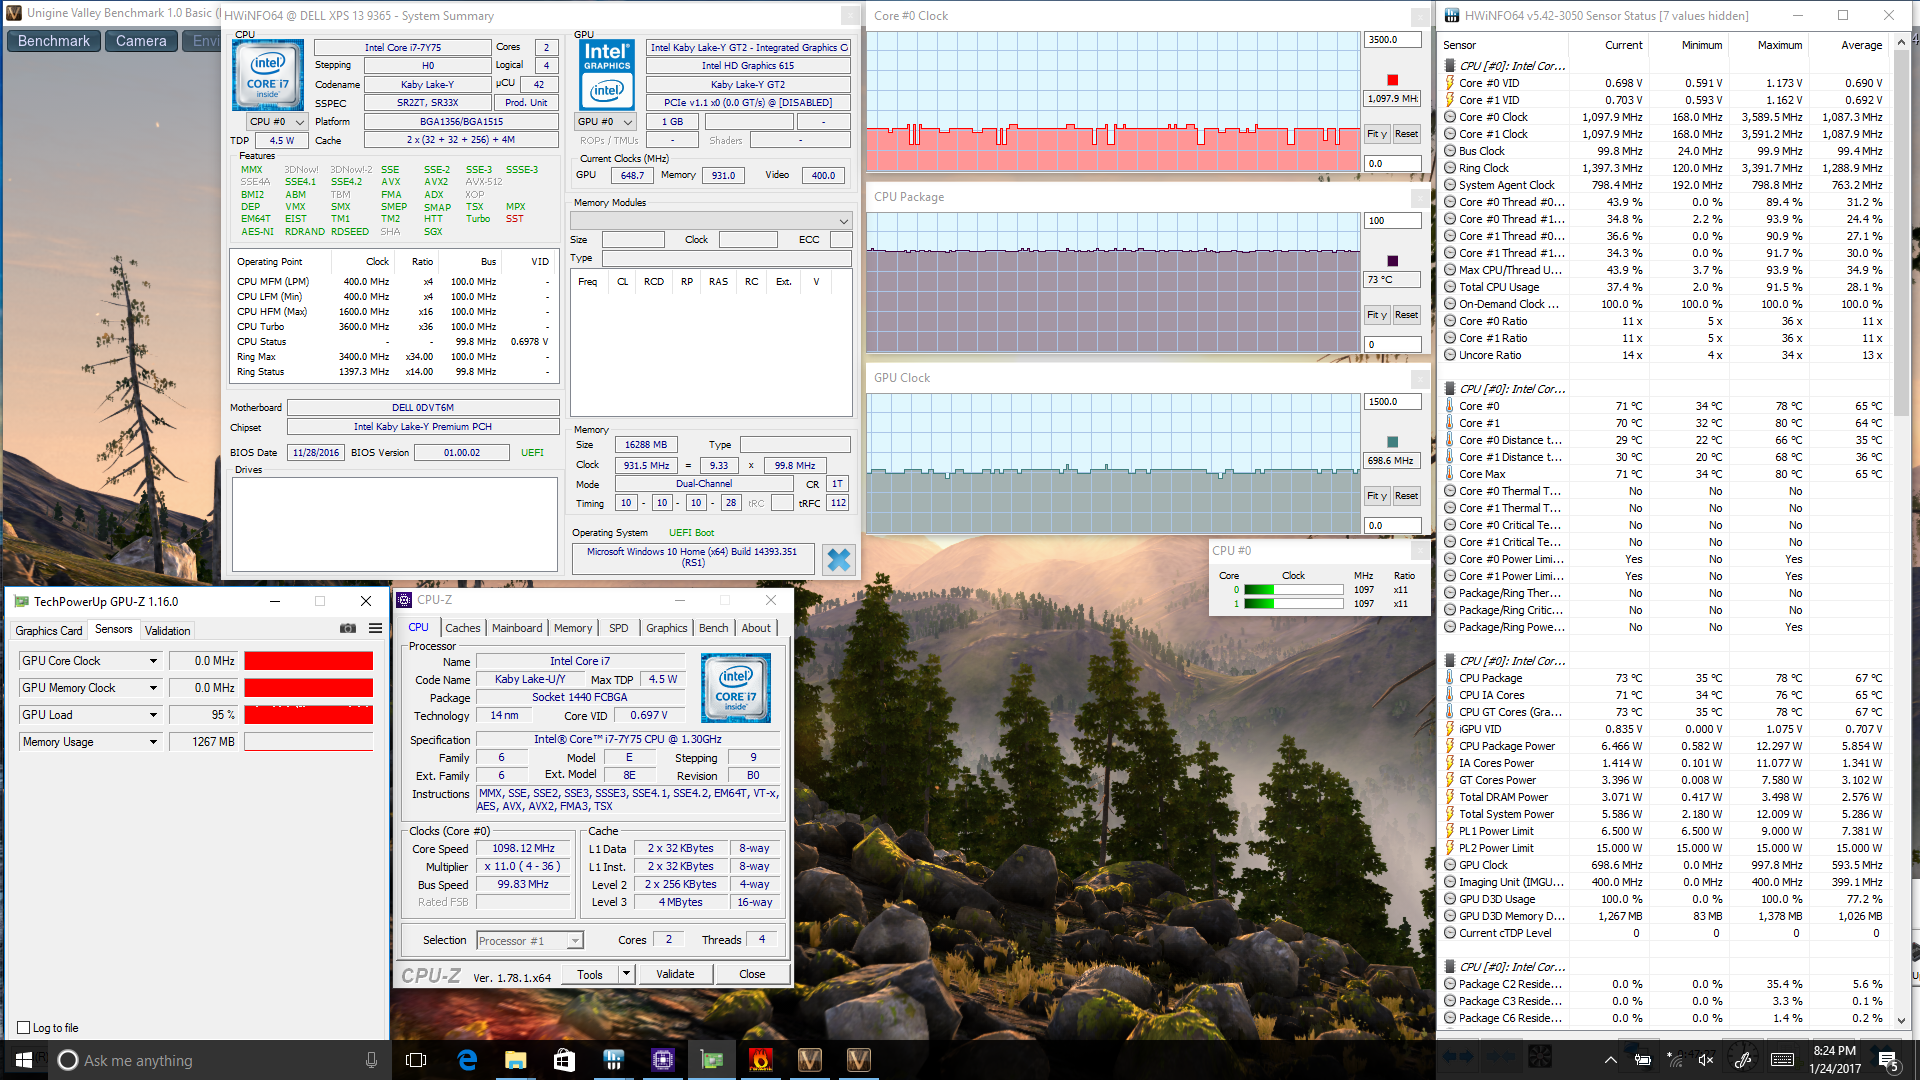
Running Unigine Valley to better represent gaming loads reveals a similar CPU behavior as the Prime95 stress test above. Processor clock rates start high in the 3 GHz range before gradually falling to a steady and even slower 0.8 to 1.1 GHz range. Meanwhile, GPU clock is steady at 700 MHz throughout the entire run. It's possible that system resources and power are favoring the integrated GPU rather than the CPU when both processors are under stress.
Running on battery power will reduce both CPU and GPU performance. A 3DMark 11 run on batteries returns Physics and Graphics scores of 2934 and 1116 points, respectively, compared to 3710 and 1370 points when on mains.
| CPU Clock (GHz) | GPU Clock (MHz) | Average CPU Temperature (°C) | |
| Prime95 Stress | 1.9 - 2.0 | -- | 78 |
| FurMark Stress | -- | 648 | 76 |
| Prime95 + FurMark Stress | 0.8 | 499 | 75 |
| Unigine Valley Stress | 1.1 | 699 | 73 |
Emissions
System Noise
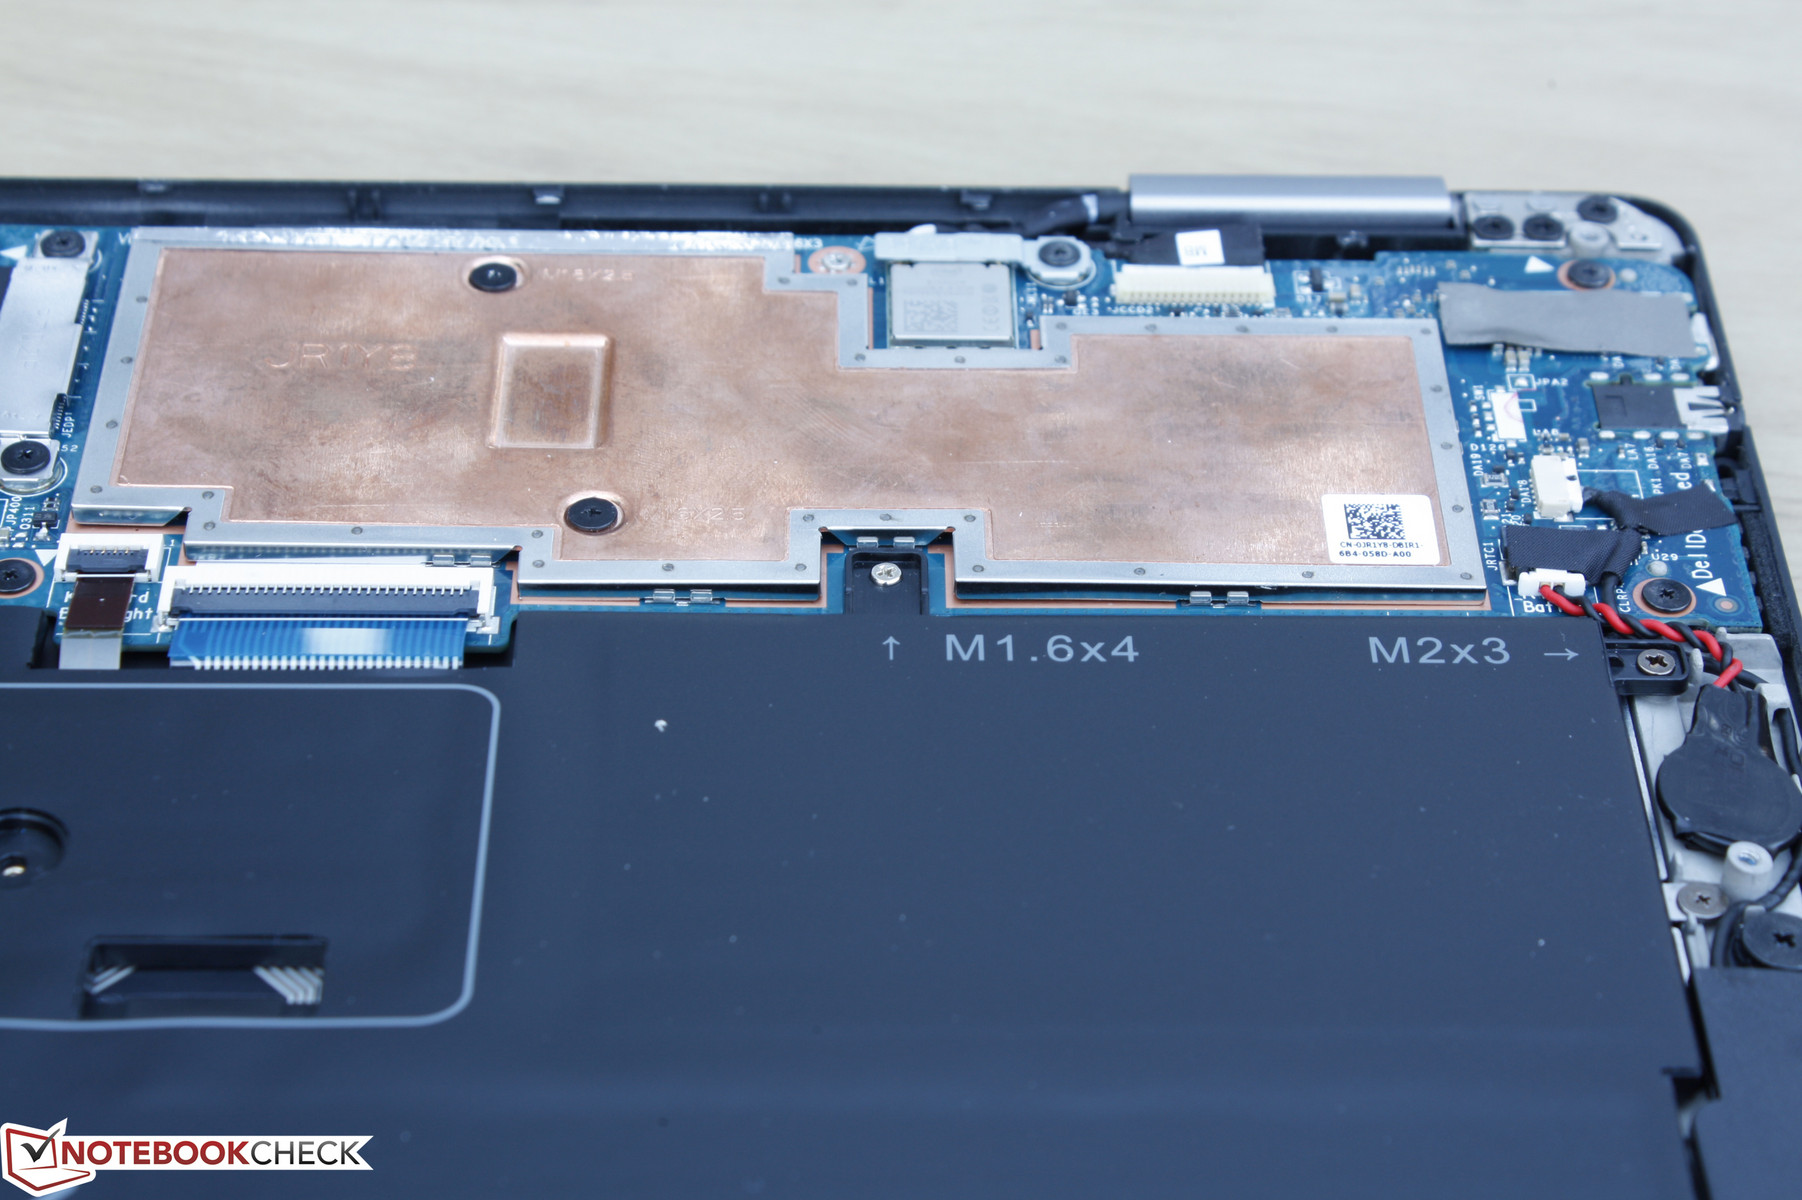
The system runs in complete silence as there is no active fan. Instead, a copper heat spreader sits atop the processor for all its cooling needs. Periodic coil whine is only audible when placing the ear right next to the keyboard base.
| Dell XPS 13-9365 2-in-1 HD Graphics 615, i7-7Y75, Toshiba NVMe THNSN5256GPUK | Lenovo Yoga 910-13IKB-80VF004CGE HD Graphics 620, i7-7500U, Samsung PM951 NVMe MZVLV512 | HP Spectre x360 13-w023dx HD Graphics 620, i7-7500U, Samsung PM951 NVMe MZVLV512 | Asus Zenbook UX310UQ-GL011T GeForce 940MX, 6500U, SanDisk SD8SNAT256G1002 | Dell XPS 13 9360 FHD i5 HD Graphics 620, i5-7200U, Toshiba NVMe THNSN5256GPUK | |
|---|---|---|---|---|---|
| Noise | |||||
| off / environment * (dB) | 31.7 | 29.1 | 30.5 | ||
| Idle Minimum * (dB) | 31.7 | 29.1 | 30.5 | 28.9 | |
| Idle Average * (dB) | 31.7 | 29.1 | 30.5 | 28.9 | |
| Idle Maximum * (dB) | 31.7 | 31.2 | 31.5 | 28.9 | |
| Load Average * (dB) | 38.4 | 37.3 | 36.2 | 30.9 | |
| Load Maximum * (dB) | 34.7 | 39.6 | 40 | 33.5 |
* ... smaller is better
Temperature
Surface temperatures when idling are relatively warm on both sides of the notebook. Areas closest to the processor, for example, can be up to 26 C when the system is idling against a room temperature of 20 C.
The notebook can be as warm as 50 C on surfaces nearest the processor when under extreme processing loads. The frontal areas including the palm rests and most of the keyboard remain comfortable for typing and never become too warm to use. The exception is the top row of F keys since this area is directly above the copper heat spreader, but these keys are pressed infrequently enough that we were never bothered by the warmth. The Spectre x360 13 can become almost as warm as the XPS 2-in-1 around this same area, but its keyboard is positioned lower to better avoid the hot spots.
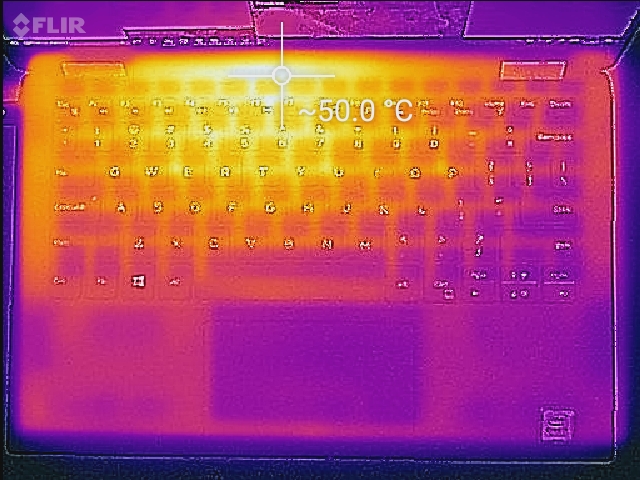
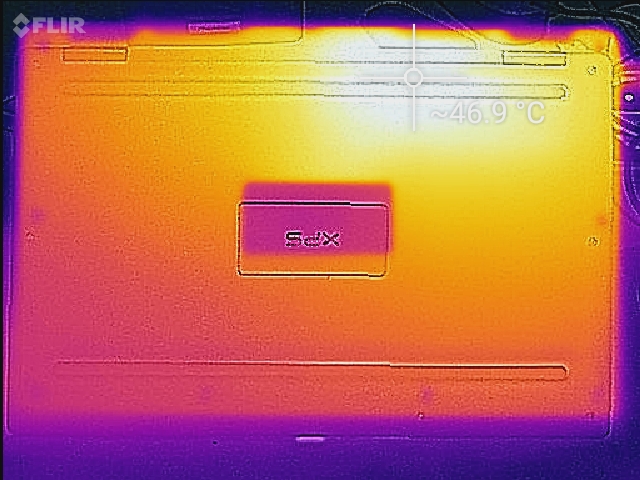
(-) The maximum temperature on the upper side is 51 °C / 124 F, compared to the average of 35.4 °C / 96 F, ranging from 19.6 to 60 °C for the class Convertible.
(-) The bottom heats up to a maximum of 48 °C / 118 F, compared to the average of 36.9 °C / 98 F
(+) In idle usage, the average temperature for the upper side is 23 °C / 73 F, compared to the device average of 30.3 °C / 87 F.
(+) The palmrests and touchpad are reaching skin temperature as a maximum (32.4 °C / 90.3 F) and are therefore not hot.
(-) The average temperature of the palmrest area of similar devices was 28 °C / 82.4 F (-4.4 °C / -7.9 F).
Speakers
The 2 W (1 W x 2) stereo speakers are about as loud as the ones on the XPS 13. Sound quality is not as good on the XPS 2-in-1 as shown by our microphone measurements below. Bass reproduction is poorer and treble is more uneven as well. Higher volume settings will not introduce static or reverberations, though sound balance suffers due to the weak bass.
")
")
Dell XPS 13-9365 2-in-1 audio analysis
(-) | not very loud speakers (68.9 dB)
Bass 100 - 315 Hz
(-) | nearly no bass - on average 15.5% lower than median
(±) | linearity of bass is average (7.5% delta to prev. frequency)
Mids 400 - 2000 Hz
(±) | higher mids - on average 5.5% higher than median
(-) | mids are not linear (15.3% delta to prev. frequency)
Highs 2 - 16 kHz
(+) | balanced highs - only 3.3% away from median
(±) | linearity of highs is average (12.7% delta to prev. frequency)
Overall 100 - 16.000 Hz
(-) | overall sound is not linear (31.7% difference to median)
Compared to same class
» 91% of all tested devices in this class were better, 2% similar, 7% worse
» The best had a delta of 6%, average was 20%, worst was 57%
Compared to all devices tested
» 91% of all tested devices were better, 2% similar, 7% worse
» The best had a delta of 4%, average was 23%, worst was 134%
Apple MacBook 12 (Early 2016) 1.1 GHz audio analysis
(+) | speakers can play relatively loud (83.6 dB)
Bass 100 - 315 Hz
(±) | reduced bass - on average 11.3% lower than median
(±) | linearity of bass is average (14.2% delta to prev. frequency)
Mids 400 - 2000 Hz
(+) | balanced mids - only 2.4% away from median
(+) | mids are linear (5.5% delta to prev. frequency)
Highs 2 - 16 kHz
(+) | balanced highs - only 2% away from median
(+) | highs are linear (4.5% delta to prev. frequency)
Overall 100 - 16.000 Hz
(+) | overall sound is linear (10.2% difference to median)
Compared to same class
» 7% of all tested devices in this class were better, 2% similar, 90% worse
» The best had a delta of 5%, average was 18%, worst was 53%
Compared to all devices tested
» 5% of all tested devices were better, 1% similar, 94% worse
» The best had a delta of 4%, average was 23%, worst was 134%
Frequency Comparison (Checkbox selectable!)
Graph 1: Pink Noise 100% Vol.; Graph 2: Audio off
Energy Management
Power Consumption
The Dell convertible consumes measurably less power when idling than other similarly sized notebooks with ULV U-class Skylake or Kaby Lake processors. Power consumption jumps to over 24 W when under 3DMark loads but drops slightly to just under 23 W when running Prime95 and FurMark due to the aforementioned throttling.
The small power adapter (~8.25 x 5.5 x 2 cm) is rated for 50 W or about twice the power consumption of the system when under full processing load. It also includes a full size USB Type-A port solely for charging smartphones or other devices. While it's possible to charge the notebook with a third party USB Type-C adapter (20 V/5 V, 2.25 A/3 A), it's always recommended to use the AC adapter provided by the manufacturer whenever possible.
| Off / Standby | |
| Idle | |
| Load |
|
Key:
min: | |
| Dell XPS 13-9365 2-in-1 i7-7Y75, HD Graphics 615, Toshiba NVMe THNSN5256GPUK, IPS, 1920x1080, 13.3" | Lenovo Yoga 910-13IKB-80VF004CGE i7-7500U, HD Graphics 620, Samsung PM951 NVMe MZVLV512, IPS, 3840x2160, 13.9" | HP Spectre x360 13-w023dx i7-7500U, HD Graphics 620, Samsung PM951 NVMe MZVLV512, IPS, 1920x1080, 13.3" | Asus Zenbook UX310UQ-GL011T 6500U, GeForce 940MX, SanDisk SD8SNAT256G1002, TN LED, 1920x1080, 13.3" | Dell XPS 13 9360 FHD i5 i5-7200U, HD Graphics 620, Toshiba NVMe THNSN5256GPUK, IPS, 1920x1080, 13.3" | |
|---|---|---|---|---|---|
| Power Consumption | -46% | -54% | -68% | -11% | |
| Idle Minimum * (Watt) | 3.1 | 4.3 -39% | 5.5 -77% | 3 3% | 4.1 -32% |
| Idle Average * (Watt) | 4.3 | 6.3 -47% | 6.7 -56% | 5.6 -30% | 4.2 2% |
| Idle Maximum * (Watt) | 4.9 | 9 -84% | 7.1 -45% | 6.8 -39% | 5.1 -4% |
| Load Average * (Watt) | 24.3 | 32.7 -35% | 33.1 -36% | 48.7 -100% | 22.1 9% |
| Load Maximum * (Watt) | 22.8 | 28.8 -26% | 35.2 -54% | 63 -176% | 29.4 -29% |
* ... smaller is better
Battery Life
The capacity of the internal battery is indeed smaller than on competing convertibles and even the standard XPS 13. Nonetheless, battery life on the XPS 13 2-in-1 is almost on par with its notebook sibling largely due to both the less demanding i7-7Y75 CPU and passive cooling. Users can expect almost 11.5 hours of real-world WLAN use compared to about 9 hours on the HP Spectre 13 or 11 hours on the Yoga 910. At worst, users will get just under 3 hours of use at maximum screen brightness and extreme processing loads.
Charging can be done through either of the two USB Type-C ports. Charging from near empty to full capacity will take about two hours when the system is turned off or three to four hours if using the notebook whilst connected.
| Dell XPS 13-9365 2-in-1 i7-7Y75, HD Graphics 615, 46 Wh | Lenovo Yoga 910-13IKB-80VF004CGE i7-7500U, HD Graphics 620, 78 Wh | HP Spectre x360 13-w023dx i7-7500U, HD Graphics 620, 57.8 Wh | Asus Zenbook UX310UQ-GL011T 6500U, GeForce 940MX, 48 Wh | Dell XPS 13 9360 FHD i5 i5-7200U, HD Graphics 620, 60 Wh | |
|---|---|---|---|---|---|
| Battery runtime | 1% | -7% | -27% | 7% | |
| Reader / Idle (h) | 16.2 | 17.8 10% | 20.6 27% | 14.6 -10% | 21.6 33% |
| WiFi v1.3 (h) | 11.4 | 10.7 -6% | 9.3 -18% | 8.1 -29% | 11.3 -1% |
| Load (h) | 2.9 | 2.9 0% | 2 -31% | 1.7 -41% | 2.6 -10% |
Pros
Cons
Verdict
Why purchase the original XPS 13 when its more versatile 2-in-1 alternative is available?
Despite the almost identical appearance, there are still several reasons to consider the standard XPS 13. Firstly, the original XPS 13 is ever so slightly thicker and more rigid around its base and center of the keyboard without being any heavier. Secondly, it integrates both USB Type-A and a faster SD reader compared to no USB Type-A and just a MicroSD reader on the 2-in-1. Thirdly, the keyboard keys of the XPS 13 provide slightly firmer feedback when pressed and feel closer to that of the excellent AccuType keyboard on certain Lenovo notebooks.
The CPU performance differences between the XPS 13 2-in-1 and the XPS 13 shouldn't be ignored. The entry-level XPS 13 SKU with the i7-5200U CPU is almost 25 percent faster than the i7-7Y75 in the highest-end XPS 2-in-1 SKU. The deltas only grow larger when comparing the high-end XPS 13 SKU with the i7-7500U to the low-end XPS 2-in-1 SKU with the i5-7Y54. While not noticeable if simply word processing or browsing, loading times become more obvious for larger workloads and programs. Factor in the limited Turbo Boost and potential for throttling and you have a system that's more inadequate for photo editing and heavy multi-tasking than your typical Ultrabook or competing Spectre x360 13 and Yoga 910.
Users who can see beyond these drawbacks will have one of the best 2-in-1 experiences from a 13-inch notebook that's even more compact and lighter than the latest from Lenovo or HP. The InfinityEdge design translate beautifully to a convertible form factor and other key aspects like the display, SSD performance, battery life, and workmanship are all close if not identical to that of the XPS 13.
Users who want to do more than just web browsing, video streaming, and word processing may still prefer an Ultrabook with a U-class processor. Otherwise, this is easily one of our favorite 2-in-1s simply because of its small size and subsequent practicality in tablet mode.
Dell XPS 13-9365 2-in-1
- 02/02/2017 v6 (old)
Allen Ngo
Price comparison
