Reviews for the Intel Core i7-7500U processor
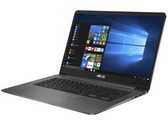
Asus ZenBook UX530UX (i7-7500U, GTX 950M) Laptop Review
Tame lightweight. A 15-inch device which is still as thin as 17 mm and weighs only 1630 grams? A brilliant screen with minimal bezels? A battery runtime lasting a whole day? We will check into those big promises the manufacturer has made, thoroughly testing the allegedly slimmest ZenBook with gaming graphics.
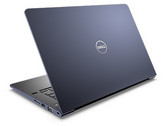
Intel Core i7-7500U, NVIDIA GeForce GTX 950M, 15.6", 1.6 kgDell Vostro 15 5568 (i7-7500U, 940MX) Laptop Review
New assets, old shortcomings. We already announced in January that Dell was planning to offer the Vostro 15 5568 with other processors and a dedicated graphics solution. This configuration is now available and we are going to test what this entry-level business laptop with an Intel Core i7-7500U CPU and an Nvidia GeForce 940MX can offer.
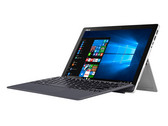
Intel Core i7-7500U, NVIDIA GeForce 940MX, 15.6", 1.9 kgAsus Transformer 4 Pro (i7-7500U, HD620) Convertible Laptop Review
Just a compromise, again and again. Asus' Transformer 4 Pro is a product of the company's regular practice of keeping their models up-to-date. The convertible laptop is now available with a choice from various Kaby Lake processors and up to 16 GB of RAM. Those who have a penchant for high-performance tablets will not find our test device lacking in attractive features. For anyone looking for an alternative to a simple laptop, it is worth a look. In everyday use, it was not so much the hardware and connections that vexed us – but rather the little defects we encountered during our testing process.
Intel Core i7-7500U, HD Graphics 620, 12.6", 1.1 kgHP ZBook 14u G4 (7500U, FirePro W4190M) Workstation Review
The consumer workstation. The new ZBook 14u encompasses exactly 14 inches and is for those who seek a reliable companion above all else. We are quite fond of the overall package, but the hardware choices leave a lot to be desired.
Intel Core i7-7500U, AMD FirePro W4190M, 14", 1.7 kgHP Envy 13-ad006ng (i7-7500U, MX150) Laptop Review
HP XPS 13 for gaming. A compact 13.3-inch Ultrabook with GeForce MX150 graphics and a metal chassis? Sounds like a solid concept. In our comprehensive review update we'll try to identify the strengths and weaknesses of the HP Envy 13 with MX150 and Core i7-7500U.
Intel Core i7-7500U, NVIDIA GeForce MX150, 13.3", 1.3 kgLenovo ThinkPad 25: NVIDIA GeForce 940MX, 14.00", 1.7 kg
Review » Lenovo ThinkPad 25 Anniversary Edition Laptop Review
HP ZBook 15u G4: AMD FirePro W4190M, 15.60", 1.9 kg
Review » HP ZBook 15u G4 (7500U, FirePro W4190M) Workstation Review
Huawei MateBook D 15, i7-7500U 940MX: NVIDIA GeForce 940MX, 15.60", 1.8 kg
Review » Huawei MateBook D (i7-7500U, GeForce 940MX) Laptop Review
Razer Blade Stealth QHD i7-7500U: Intel HD Graphics 620, 13.30", 1.3 kg
Review » Display Check: Razer Blade Stealth (13.3 QHD+, i7-7500U)
Porsche Design BOOK ONE: Intel HD Graphics 620, 13.30", 1.6 kg
Review » Porsche Design BOOK ONE (i7, 512 GB, QHD+) Convertible Review
Acer Switch 5 SW512-52-5819: Intel HD Graphics 620, 12.00", 1.3 kg
Review » Acer Switch 5 (7500U, 512 GB) Convertible Review
Asus Zenbook UX3430UQ-GV012T: NVIDIA GeForce 940MX, 14.00", 1.3 kg
Review » Asus Zenbook UX3430UQ (7500U, 940MX, 512 GB) Laptop Review
Acer TravelMate P648-G2-M-73T0: Intel HD Graphics 620, 14.00", 1.7 kg
Review » Acer TravelMate P648-G2 (i7, 256 GB) Laptop Review
Samsung Notebook 9 NP900X5N-X01US: NVIDIA GeForce 940MX, 15.00", 1.2 kg
Review » Samsung Notebook 9 NP900X5N (7500U, FHD, GeForce 940MX) Laptop Review
Asus ASUSPRO B9440UA-GV0101T: Intel HD Graphics 620, 14.00", 1.1 kg
Review » Asus AsusPro B9440UA (Core i7, 16 GB) Laptop Review Update
Asus Zenbook UX3410UQ-GV077T: NVIDIA GeForce 940MX, 14.00", 1.4 kg
Review » Asus ZenBook UX3410UQ (7500U, 940MX, Full HD) Laptop Review
Acer TravelMate P658-G2-MG-7327: NVIDIA GeForce 940MX, 15.60", 2.1 kg
Review » Acer TravelMate P658-G2 (7500U, 940MX, FHD) Laptop Review
Lenovo ThinkPad T570-20HAS01E00: NVIDIA GeForce 940MX, 15.60", 2 kg
Review » Lenovo ThinkPad T570 (Core i7, 4K, 940MX) Laptop Review
HP Spectre x360 13-ac033dx: Intel HD Graphics 620, 13.30", 1.3 kg
Review » HP Spectre x360 13 (7500U, 4K UHD) Convertible Review
Lenovo Ideapad Miix 720-12IKB: Intel HD Graphics 620, 12.00", 1.2 kg
Review » Lenovo IdeaPad Miix 720 (7500U, QHD) Convertible Laptop Review
HP Spectre 13-v131ng: Intel HD Graphics 620, 13.30", 1.1 kg
Review » HP Spectre 13 (Core i7, Full-HD) Laptop Review
Lenovo ThinkPad 13-20J2S00G00: Intel HD Graphics 620, 13.30", 1.4 kg
Review » Lenovo ThinkPad 13 2017 (Core i7, Full-HD) Laptop Review
Lenovo ThinkPad X1 Carbon 2017-20HQS03P00: Intel HD Graphics 620, 14.00", 1.1 kg
Review » Lenovo ThinkPad X1 Carbon 2017 (Core i7, Full-HD) Laptop Review
Asus Zenbook UX310UA-FC347T iGP: Intel HD Graphics 620, 13.30", 1.4 kg
Review » Asus ZenBook UX310UA (7500U, Full HD) Laptop Review
Asus UX310UQ-FC396T: NVIDIA GeForce 940MX, 13.30", 1.5 kg
Review » Asus ZenBook UX310UQ (7500U, 940MX, Full HD) Notebook Review
HP EliteBook 820 G4 Z2V72ET: Intel HD Graphics 620, 12.50", 1.3 kg
Review » HP EliteBook 820 G4 (7500U, Full HD) Notebook Review
HP Spectre x360 15-bl002xx: NVIDIA GeForce 940MX, 15.60", 2 kg
Review » HP Spectre x360 15-bl002xx Convertible Review
HP Envy 15-as133cl: Intel HD Graphics 620, 15.60", 2.2 kg
Review » HP Envy 15 as133cl Notebook Review
Lenovo IdeaPad 710S Plus-13IKB: NVIDIA GeForce 940MX, 13.30", 1.1 kg
Review » Lenovo IdeaPad 710S Plus (Core i7) Subnotebook Review
Dell Inspiron 15 5000 5567-1753: AMD Radeon R7 M445, 15.60", 2.3 kg
Review » Dell Inspiron 15 5000 5567-1753 Notebook Review
Asus Zenbook UX3410UA: Intel HD Graphics 620, 14.00", 1.3 kg
Review » Asus ZenBook UX3410UA Notebook Review
HP ProBook 440 G4-Y8B51EA: NVIDIA GeForce 930MX, 14.00", 1.7 kg
Review » HP ProBook 440 G4 (Core i7, Full-HD) Notebook Review
HP Pavilion 15t-au100 CTO (W0P31AV): NVIDIA GeForce 940MX, 15.60", 2.1 kg
Review » HP Pavilion 15t-au100 (W0P31AV) Notebook Review
HP ProBook 430 G4-Y8B47EA: Intel HD Graphics 620, 13.30", 1.6 kg
Review » HP ProBook 430 G4 (Core i7, Full HD) Notebook Review
Lenovo Yoga 910-13IKB-80VF004CGE: Intel HD Graphics 620, 13.90", 1.4 kg
Review » Lenovo Yoga 910-13IKB Convertible Review
HP Envy x360 15t-w200: NVIDIA GeForce 930MX, 15.60", 2.3 kg
Review » HP Envy x360 15t-w200 Convertible Review
HP Spectre x360 13-w023dx: Intel HD Graphics 620, 13.30", 1.3 kg
Review » HP Spectre x360 13 w023dx Convertible Review
HP ProBook 450 G4 Y8B60EA: NVIDIA GeForce 930MX, 15.60", 2 kg
Review » HP ProBook 450 G4 Y8B60EA Notebook Review
Lenovo IdeaPad 510S-13IKB 80V00026GE: Intel HD Graphics 620, 13.30", 1.5 kg
Review » Lenovo IdeaPad 510S-13IKB 80V00026GE Subnotebook Review
HP ProBook 470 G4: NVIDIA GeForce 930MX, 17.30", 2.8 kg
Review » HP ProBook 470 G4 Notebook Review
Lenovo IdeaPad 510-15IKB 80SV0087GE: NVIDIA GeForce 940MX, 15.60", 2.2 kg
Review » Lenovo IdeaPad 510-15IKB Notebook Review
Razer Blade Stealth QHD i7-7500U: Intel HD Graphics 620, 12.50", 1.3 kg
Review » Razer Blade Stealth (i7-7500U) Notebook Review
Dell XPS 13 9360 QHD+ i7: Intel HD Graphics 620, 13.30", 1.3 kg
Review » Dell XPS 13 9360 QHD+ i7-7500U Notebook Review
MSI CX72-7QL: Intel HD Graphics 620, 0.00"
Review » Kaby Lake (Core i7-7500U) Review: Skylake on Steroids
Acer Aspire E15 E5-576-766Q: Intel HD Graphics 620, 15.60", 2.3 kg
External Review » Acer Aspire E15 E5-576-766Q
HP Pavilion 14-bf013ns: NVIDIA GeForce 940MX, 14.00", 1.5 kg
External Review » HP Pavilion 14-bf013ns
Asus UX410UA-GV036: Intel HD Graphics 620, 14.00", 1.4 kg
External Review » Asus UX410UA-GV036
Samsung Style S51: Intel HD Graphics 620, 13.30", 0.8 kg
External Review » Samsung Style S51
Asus F540UA-DM1204T: Intel HD Graphics 620, 15.60", 1.9 kg
External Review » Asus F540UA-DM1204T
Lenovo Yoga 910-13IKB-80VF00NHSP: Intel HD Graphics 620, 13.90", 1.4 kg
External Review » Lenovo Yoga 910-13IKB-80VF00NHSP
HP Envy 13-ad015na: NVIDIA GeForce MX150, 13.30", 1.3 kg
External Review » HP Envy 13-ad015na
HP Pavilion 15-cc514ns: Intel HD Graphics 620, 15.60", 1.8 kg
External Review » HP Pavilion 15-cc514ns
Asus AsusPro B9440UA-GV0005R: Intel HD Graphics 620, 14.00", 1 kg
External Review » Asus AsusPro B9440UA-GV0005R
Acer TravelMate P648-G2-M-73T0: Intel HD Graphics 620, 14.00", 1.7 kg
External Review » Acer TravelMate P648-G2-M-73T0
Acer Aspire 5 A515-51G-73QQ: NVIDIA GeForce MX130, 15.60", 2.2 kg
External Review » Acer Aspire 5 A515-51G-73QQ
Lenovo Yoga 720-80X600DLMX: Intel HD Graphics 620, 13.30", 1.3 kg
External Review » Lenovo Yoga 720-80X600DLMX
HP Pavilion 14-bf014ns: NVIDIA GeForce 940MX, 14.00", 1.5 kg
External Review » HP Pavilion 14-bf014ns
Lenovo Yoga 910-13IKB-80VF00FHSP: Intel HD Graphics 620, 13.90", 1.4 kg
External Review » Lenovo Yoga 910-13IKB-80VF00FHSP
Lenovo Ideapad 520-15IKB-80YL00MNSP: NVIDIA GeForce 940MX, 15.60", 2.2 kg
External Review » Lenovo Ideapad 520-15IKB-80YL00MNSP
HP ZBook 15u G4: AMD FirePro W4190M, 15.60", 1.9 kg
External Review » HP ZBook 15u G4
LG Gram 13Z970-E.AA7BA3: Intel HD Graphics 620, 13.30", 0.8 kg
External Review » LG Gram 13Z970-E.AA7BA3
Lenovo Ideapad 520S-14IKB-80X200DGSP: Intel HD Graphics 620, 14.00", 1.6 kg
External Review » Lenovo Ideapad 520S-14IKB-80X200DGSP
Lenovo Ideapad 320-15IKBN-80XL02U2SP: NVIDIA GeForce 940MX, 15.60", 2.2 kg
External Review » Lenovo Ideapad 320-15IKBN-80XL02U2SP
Asus A442UQ-FA020T : NVIDIA GeForce 940MX, 14.00", 1.8 kg
External Review » Asus A442UQ-FA020T
Acer Switch 5 SW512-52-73Y5: Intel HD Graphics 620, 12.00"
External Review » Acer Switch 5 SW512-52-73Y5
Asus K541UA-GQ612T: Intel HD Graphics 620, 15.60", 2 kg
External Review » Asus K541UA-GQ612T
HP EliteBook 1040 G4-1EP15EA: Intel HD Graphics 620, 14.00", 1.5 kg
External Review » HP EliteBook 1040 G4-1EP15EA
Asus VivoBook X405UQ: NVIDIA GeForce MX150, 14.00", 1.3 kg
External Review » Asus VivoBook X405UQ
Dell Vostro 15 5568-V4F8F: NVIDIA GeForce 940MX, 15.60", 2 kg
External Review » Dell Vostro 15 5568-V4F8F
Asus UX410UQ-GV045R: NVIDIA GeForce 940MX, 14.00", 1.4 kg
External Review » Asus UX410UQ-GV045R
Porsche Design BOOK ONE: Intel HD Graphics 620, 13.30", 1.6 kg
External Review » Porsche Design BOOK ONE
HP 15-bs043NS: Intel HD Graphics 620, 15.60", 2.1 kg
External Review » HP 15-BS043NS
HP 250 G6 1XN75EA: Intel HD Graphics 620, 15.60", 1.9 kg
External Review » HP 250 G6 1XN75EA
Lenovo IdeaPad 720S-13-81A8000SRK: Intel HD Graphics 620, 13.30", 1.1 kg
External Review » Lenovo IdeaPad 720S-13-81A8000SRK
Asus VivoBook Flip 14 TP410UA-EC246T: Intel HD Graphics 620, 14.00", 1.6 kg
External Review » Asus VivoBook Flip 14 TP410UA-EC246T
Lenovo Yoga 720-13IKB-80X60076TX: Intel HD Graphics 620, 13.30", 1.3 kg
External Review » Lenovo Yoga 720-13IKB-80X60076TX
Asus K541UJ-GQ125T: NVIDIA GeForce 920M, 15.60", 2 kg
External Review » Asus K541UJ-GQ125T
Lenovo IdeaPad 520s-14IKB-80X2002VCK: NVIDIA GeForce 940MX, 14.00", 1.7 kg
External Review » Lenovo IdeaPad 520s-14IKB-80X2002VCK
Lenovo IdeaPad Flex 5 1570-80XB0000US: NVIDIA GeForce 940MX, 15.60", 2 kg
External Review » Lenovo Flex 5 1570-80XB0000US
Lenovo ThinkPad L570-20J8001MGE: Intel HD Graphics 620, 15.60", 2.4 kg
External Review » Lenovo ThinkPad L570-20J8001MGE
HP Spectre 13-ac000ns x360: Intel HD Graphics 620, 13.30", 1.3 kg
External Review » HP Spectre 13-ac000ns x360
HP Envy x360 15-bp008ng: NVIDIA GeForce 940MX, 15.60", 2.2 kg
External Review » HP Envy x360 15-bp008ng
HP Spectre x360 13-ac033dx: Intel HD Graphics 620, 13.30", 1.3 kg
External Review » HP Spectre x360 13-ac033dx
Asus Zenbook UX430UA-GV232T: Intel HD Graphics 620, 14.00", 1.3 kg
External Review » Asus Zenbook UX430UA-GV232T
LG Gram 15 15Z970-G.AA6BB: Intel HD Graphics 620, 15.60", 1.1 kg
External Review » LG Gram 15 15Z970-G.AA6BB
HP ZBook 14u G4 1RQ68EA: AMD FirePro W4190M, 14.00", 1.6 kg
External Review » HP ZBook 14u G4 1RQ68EA
Asus Zenbook 3 Deluxe UX490UA-BE064T: Intel HD Graphics 620, 14.00", 1 kg
External Review » Asus Zenbook 3 Deluxe UX490UA-BE064T
Asus ZenBook Flip S UX370UA-C4170T : Intel HD Graphics 620, 13.30", 1.1 kg
External Review » Asus ZenBook Flip S UX370UA-C4170T
Acer Aspire F5 573G-71S6: NVIDIA GeForce 940MX, 15.60", 2.3 kg
External Review » Acer Aspire F5 573G-71S6
Lenovo ThinkPad X270-20HN0012RT: Intel HD Graphics 620, 12.50", 1.4 kg
External Review » Lenovo ThinkPad X270-20HN0012RT
Toshiba Portege X30-D-121: Intel HD Graphics 620, 13.30", 1.1 kg
External Review » Toshiba Portege X30-D-121
Lenovo Ideapad 310-15IKB-80TV017PSP: NVIDIA GeForce 920MX, 15.60", 2.2 kg
External Review » Lenovo Ideapad 310-15IKB-80TV017PSP
HP Pavilion 14-Bf009Ur: NVIDIA GeForce 940MX, 14.00", 1.6 kg
External Review » HP Pavilion 14-Bf009Ur
Lenovo Yoga 910-13IKB-80VF00EDMX: Intel HD Graphics 620, 13.90", 1.4 kg
External Review » Lenovo Yoga 910-13IKB-80VF00EDMX
Asus ZenBook UX530UX-FY026T: NVIDIA GeForce GTX 950M, 15.60", 1.6 kg
External Review » Asus ZenBook UX530UX-FY026T
Asus ZenBook Flip S UX370UA-C4060R: Intel HD Graphics 620, 13.30", 1.1 kg
External Review » Asus ZenBook Flip S UX370UA-C4060R
Lenovo ThinkPad Yoga 370-20JH003BMC: Intel HD Graphics 620, 13.30", 1.4 kg
External Review » Lenovo ThinkPad Yoga 370-20JH003BMC
Lenovo Ideapad 310-15IKB-80TV01FJSP: Intel HD Graphics 620, 15.60", 2.2 kg
External Review » Lenovo Ideapad 310-15IKB-80TV01FJSP
MSI PL60 7RD-022GB: NVIDIA GeForce GTX 1050 Mobile, 15.60", 2.2 kg
External Review » MSI PL60 7RD-022GB
Asus AsusPro B9440UA-GV0132R: Intel HD Graphics 620, 14.00", 1.1 kg
External Review » Asus AsusPro B9440UA-GV0132R
Lenovo Ideapad 310-15IKB-80TV01F9SP: NVIDIA GeForce 920MX, 15.60", 2.2 kg
External Review » Lenovo Ideapad 310-15IKB-80TV01F9SP
Lenovo ThinkPad P51s 20HB000URT: NVIDIA Quadro M520, 15.60", 2.5 kg
External Review » Lenovo ThinkPad P51s 20HB000URT
Lenovo ThinkPad 25: NVIDIA GeForce 940MX, 14.00", 1.7 kg
External Review » Lenovo ThinkPad 25
HP Pavilion 14-BF007NS: NVIDIA GeForce 940MX, 14.00", 1.6 kg
External Review » HP Pavilion 14-BF007NS
Asus X756UW-T4081T: NVIDIA GeForce GTX 960M, 17.30", 2.7 kg
External Review » Asus X756UW-T4081T
Lenovo IdeaPad Flex 5 14-80XA0009US: NVIDIA GeForce 940MX, 14.00", 1.7 kg
External Review » Lenovo Flex 5 14-80XA0009US
Asus ZenBook UX430UA-GV027T: Intel HD Graphics 620, 14.00", 1.3 kg
External Review » Asus ZenBook UX430UA-GV027T
Acer Switch 5 SW512-52P: Intel HD Graphics 620, 12.00", 1.3 kg
External Review » Acer Switch 5 SW512-52P
Toshiba Tecra X40-D-10H: Intel HD Graphics 620, 14.00", 1.3 kg
External Review » Toshiba Tecra X40-D-10H
Lenovo Yoga 720 12-inch: Intel HD Graphics 620, 12.50", 1.2 kg
External Review » Lenovo Yoga 720 12-inch
Lenovo IdeaPad 720S-80XC004NGE: NVIDIA GeForce 940MX, 14.00", 1.6 kg
External Review » Lenovo IdeaPad 720S-80XC004NGE
Lenovo IdeaPad 520S-14IKB-80X2006DGE: Intel HD Graphics 620, 14.00", 2 kg
External Review » Lenovo IdeaPad 520S-14IKB-80X2006DGE
Lenovo Ideapad 320S-14IKB-80X4005AGE: NVIDIA GeForce 920MX, 14.00", 1.7 kg
External Review » Lenovo Ideapad 320S-14IKB-80X4005AGE
Acer Swift 3 SF314-52-722E: NVIDIA GeForce MX150, 14.00", 1.8 kg
External Review » Acer Swift 3 SF314-52-722E
Acer Swift 3 SF314-52-717H: NVIDIA GeForce MX150, 14.00", 1.8 kg
External Review » Acer Swift 3 SF314-52-717H
Asus UX310UQ-FC396T: NVIDIA GeForce 940MX, 13.30", 1.5 kg
External Review » Asus UX310UQ-FC396T
Lenovo IdeaPad Flex 5 15-80XB0014US: NVIDIA GeForce 940MX, 15.60", 2 kg
External Review » Lenovo Flex 5 15-80XB0014US
Samsung Notebook 9 Pro NP940X3M-K01US: Intel HD Graphics 620, 13.30", 1.3 kg
External Review » Samsung Notebook 9 Pro NP940X3M-K01US
HP Envy 13-ad009ns: Intel HD Graphics 620, 13.30", 1.4 kg
External Review » HP Envy 13-ad009ns
HP Envy 15-bp030nd x360: NVIDIA GeForce 940MX, 15.60", 2.2 kg
External Review » HP Envy 15-bp030nd x360
Asus ZenBook 3 Deluxe UX490UA-BE012T: Intel HD Graphics 620, 14.00", 1.1 kg
External Review » Asus ZenBook 3 Deluxe UX490UA-BE012T
HP 15-ay156ns: AMD Radeon R7 M440, 15.60", 2 kg
External Review » HP 15-ay156ns
HP Pavilion x360 14-ba043nd: NVIDIA GeForce 940MX, 14.00", 1.6 kg
External Review » HP Pavilion x360 14-ba043nd
Acer Aspire F5-573G-743S: NVIDIA GeForce GTX 950M, 15.60", 2.4 kg
External Review » Acer Aspire F5-573G-743S
Lenovo IdeaPad 710S-80VQ001NCK: Intel HD Graphics 620, 13.30", 1.1 kg
External Review » Lenovo IdeaPad 710S-80VQ001NCK
Asus UX410UQ-GV109T: NVIDIA GeForce 940MX, 14.00", 1.5 kg
External Review » Asus UX410UQ-GV109T
Asus VivoBook S15 S510UQ-BQ165T: NVIDIA GeForce 940MX, 15.60", 2 kg
External Review » Asus VivoBook S15 S510UQ-BQ165T
Acer Spin 3 SP315-51-78FJ: Intel HD Graphics 620, 15.60", 2.3 kg
External Review » Acer Spin 3 SP315-51-78FJ
Lenovo Thinkpad E570-20H50070SP: NVIDIA GeForce GTX 950M, 15.60", 2.3 kg
External Review » Lenovo Thinkpad E570-20H50070SP
Asus K756UV-TY210T: NVIDIA GeForce 920MX, 17.30", 2.7 kg
External Review » Asus K756UV-TY210T
Asus ZenBook UX430UA-GV003T: Intel HD Graphics 620, 14.00", 1.3 kg
External Review » Asus ZenBook UX430UA-GV003T
Fujitsu Lifebook U757-0M0004EN: Intel HD Graphics 620, 15.60", 1.7 kg
External Review » Fujitsu Lifebook U757-0M0004EN
Dell Inspiron 15 5567-2655: AMD Radeon R7 M445, 15.60", 2.4 kg
External Review » Dell Inspiron 15 5567-2655
Acer Aspire E5-575G-73CN: NVIDIA GeForce 940MX, 15.60", 2.2 kg
External Review » Acer Aspire E5-575G-73CN
Asus Vivobook S15 S510UQ-BR180T: NVIDIA GeForce 940MX, 15.60", 1.7 kg
External Review » Asus Vivobook S15 S510UQ-BR180T
HP Envy 13-ad006ng: NVIDIA GeForce MX150, 13.30", 1.3 kg
External Review » HP Envy 13-ad006ng
Lenovo Yoga 910-13IKB-80VF00C5GE: Intel HD Graphics 620, 13.90", 1.4 kg
External Review » Lenovo Yoga 910-13IKB-80VF00C5GE
Toshiba Tecra X40-D-10R: Intel HD Graphics 620, 14.00", 1.3 kg
External Review » Toshiba Tecra X40-D-10R
Asus Vivobook S15 S510UQ-BQ182T: NVIDIA GeForce 940MX, 15.60", 1.7 kg
External Review » Asus Vivobook S15 S510UQ-BQ182T
Medion Erazer P6679-MD60474: NVIDIA GeForce GTX 950M, 15.60", 2.3 kg
External Review » Medion Erazer P6679-MD60474
HP Pavilion 14-bf015ns: NVIDIA GeForce 940MX, 14.00", 1.5 kg
External Review » HP Pavilion 14-bf015ns
Acer Swift 3 SF314-51-71W: Intel HD Graphics 620, 14.00", 1.5 kg
External Review » Acer Swift 3 SF314-51-71W
Lenovo IdeaPad 710s Plus 13IKB-80W3000CRK: Intel HD Graphics 620, 13.30", 1.2 kg
External Review » Lenovo IdeaPad 710s Plus 13IKB-80W3000CRK
HP Spectre 13-ac006nn x360: Intel HD Graphics 620, 13.30", 1.3 kg
External Review » HP Spectre 13-ac006nn x360
Lenovo Ideapad Miix 720-12IKB: Intel HD Graphics 620, 12.00", 1.2 kg
External Review » Lenovo Ideapad Miix 720-12IKB
Asus Transformer 4 Pro T304UA-BC005T: Intel HD Graphics 620, 12.50", 0.8 kg
External Review » Asus Transformer 4 Pro T304UA-BC005T
HP EliteBook 850 G4-Z2W91EA: Intel HD Graphics 620, 15.60", 1.9 kg
External Review » HP EliteBook 850 G4-Z2W91EA
Lenovo ThinkPad 13-20J2S00G00: Intel HD Graphics 620, 13.30", 1.4 kg
External Review » Lenovo ThinkPad 13-20J2S00G00
Acer Switch 5 SW512-52-5819: Intel HD Graphics 620, 12.00", 1.3 kg
External Review » Acer Switch 5 SW512-52-5819
HP 15-bs044ns: AMD Radeon 530, 15.60", 2.1 kg
External Review » HP 15-bs044ns
Lenovo Ideapad 510-15IKB-80SV00QVGE: NVIDIA GeForce 940MX, 15.60", 2.2 kg
External Review » Lenovo Ideapad 510-15IKB-80SV00QVGE
Lenovo IdeaPad Miix 510-12IKB-80XE000QGE: Intel HD Graphics 620, 12.20", 1.3 kg
External Review » Lenovo IdeaPad Miix 510-12IKB-80XE000QGE
Toshiba Portege X30-D-123: Intel HD Graphics 620, 13.30", 1.1 kg
External Review » Toshiba Portege X30-D-123
Asus Zenbook U5100UQ: NVIDIA GeForce 940MX, 15.60", 1.6 kg
External Review » Asus Zenbook U5100UQ
Asus Zenbook U4100UQ: NVIDIA GeForce 940MX, 14.00", 1.3 kg
External Review » Asus Zenbook U4100UQ
Medion Akoya P6677-MD60283: NVIDIA GeForce 940MX, 15.60", 2.3 kg
External Review » Medion Akoya P6677-MD60283
HP Spectre x360 15-bl001ng: NVIDIA GeForce 940MX, 15.60", 2 kg
External Review » HP Spectre x360 15-bl001ng
HP ProBook 450 G4-Y8B58EA: Intel HD Graphics 620, 15.60", 2 kg
External Review » HP ProBook 450 G4-Y8B58EA
Asus Zenbook UX330UA-FB161T: Intel HD Graphics 620, 13.30", 1.2 kg
External Review » Asus Zenbook UX330UA-FB161T
Acer Aspire F15 F5-573G-7420: NVIDIA GeForce 940MX, 15.60", 2.3 kg
External Review » Acer Aspire F15 F5-573G-7420
HP Elitebook 820 G4 Z2V77EA: Intel HD Graphics 620, 12.50", 1.3 kg
External Review » HP Elitebook 820 G4 Z2V77EA
Asus F541UA-GQ630T: Intel HD Graphics 620, 15.60", 2 kg
External Review » Asus F541UA-GQ630T
Dell Inspiron 17 5767-1807: AMD Radeon R7 M445, 17.00", 2.8 kg
External Review » Dell Inspiron 17 5767-1807
HP ProBook 430 G4-Y8B47EA: Intel HD Graphics 620, 13.30", 1.6 kg
External Review » HP ProBook 430 G4-Y8B47EA
Asus AsusPro B9440UA-GV0094R: Intel HD Graphics 620, 14.00", 1.1 kg
External Review » Asus AsusPro B9440UA-GV0094R
Samsung Notebook 9 Pro NP940X5M: AMD Radeon RX 540, 15.00", 1.7 kg
External Review » Samsung Notebook 9 Pro NP940X5M-X01US
Lenovo Yoga 720-13IKB-80X6001QGE: Intel HD Graphics 620, 13.30", 1.3 kg
External Review » Lenovo Yoga 720-13IKB-80X6001QGE
Asus VivoBook S510UA-DB71: Intel HD Graphics 620, 15.60", 1.6 kg
External Review » Asus VivoBook S510UA-DB71
Asus ZenBook UX430UQ-PURE4: NVIDIA GeForce 940MX, 14.00", 1.3 kg
External Review » Asus ZenBook UX430UQ-PURE4
Asus ZenBook Flip UX560UQ 2017: NVIDIA GeForce 940MX, 15.60", 2.3 kg
External Review » Asus ZenBook Flip UX560UQ 2017
HP Spectre x360 13-w031TU: Intel HD Graphics 620, 13.30", 1.3 kg
External Review » HP Spectre x360 13-w031TU
LG Gram 14 Z970-A.AAS7U1: Intel HD Graphics 620, 14.00", 1.7 kg
External Review » LG Gram 14 Z970-A.AAS7U1
HP Spectre x360 13-ac002ng: Intel HD Graphics 620, 13.30", 1.3 kg
External Review » HP Spectre x360 13-ac002ng
Asus Zenbook UX310UA-GL618T: Intel HD Graphics 620, 13.30", 1.3 kg
External Review » Asus Zenbook UX310UA-GL618T
HP 15-Ay120Ur: AMD Radeon R7 M440, 15.60", 2 kg
External Review » HP 15-Ay120Ur
Asus K541UJ-GQ481T: NVIDIA GeForce 920M, 15.60", 2 kg
External Review » Asus K541UJ-GQ481T
Asus ZenBook Flip S UX370: Intel HD Graphics 620, 13.30", 1.1 kg
External Review » Asus Zenbook Flip S UX370
Huawei MateBook D 15, i7-7500U 940MX: NVIDIA GeForce 940MX, 15.60", 1.8 kg
External Review » Huawei MateBook D
Asus ZenBook UX430UA-GV117T: Intel HD Graphics 620, 14.00", 1.3 kg
External Review » Asus ZenBook UX430UA-GV117T
LG Gram 15 15Z970-G.AP7SB : Intel HD Graphics 620, 15.60", 1.1 kg
External Review » LG Gram 15 15Z970-G.AP7SB
Hyperbook N131BU: Intel HD Graphics 620, 13.30", 1.3 kg
External Review » Hyperbook N131BU
Asus ASUSPRO B9440UA-GV0101T: Intel HD Graphics 620, 14.00", 1.1 kg
External Review » Asus ASUSPRO B9440UA-GV0101T
HP Spectre 13-ac004nf x360: Intel HD Graphics 620, 13.30", 1.3 kg
External Review » HP Spectre 13-ac004nf x360
Acer TravelMate X349-G2-M-73W6: Intel HD Graphics 620, 14.00", 1.6 kg
External Review » Acer TravelMate X349-G2-M-73W6
Lenovo Ideapad 310-15IKB-80TV014WGE: NVIDIA GeForce 920MX, 15.60", 2.2 kg
External Review » Lenovo Ideapad 310-15IKB-80TV014WGE
Asus UX410UA-GV113T: Intel HD Graphics 620, 14.00", 1.4 kg
External Review » Asus UX410UA-GV113T
HP Spectre 13-v101ns: Intel HD Graphics 620, 13.30", 1.1 kg
External Review » HP Spectre 13-v101ns
Asus AsusPro B9440UA-GV0081R: Intel HD Graphics 620, 14.00", 1.1 kg
External Review » Asus AsusPro B9440UA-GV0081R
Toshiba Portege X20W-D-10V: Intel HD Graphics 620, 12.50", 1.1 kg
External Review » Toshiba Portege X20W-D-10V
HP Spectre 13-w030nd x360: Intel HD Graphics 620, 13.30", 1.4 kg
External Review » HP Spectre 13-w030nd x360
Acer Swift 3 SF314-51-77W2 : Intel HD Graphics 620, 14.00", 1.7 kg
External Review » Acer Swift 3 SF314-51-77W2
Dell XPS 13 9360 FHD i7: Intel HD Graphics 620, 13.30", 1.2 kg
External Review » Dell XPS 13 9360 FHD i7
LG Gram 15Z970-AAAS7U1: Intel HD Graphics 620, 15.60", 1.1 kg
External Review » LG Gram 15Z970-AAAS7U1
Samsung Notebook 9 NP900X5N-X01US: NVIDIA GeForce 940MX, 15.00", 1.2 kg
External Review » Samsung Notebook 9 NP900X5N-X01US
Xploretech XSlate R12: Intel HD Graphics 620, 12.50", 1.3 kg
External Review » Xploretech XSlate R12
Lenovo IdeaPad 710S Plus-13IKB: NVIDIA GeForce 940MX, 13.30", 1.1 kg
External Review » Lenovo IdeaPad 710S Plus-13IKB
Dell Inspiron 17-7779: NVIDIA GeForce 940MX, 17.30", 2.8 kg
External Review » Dell Inspiron 17-7779
Lenovo ThinkPad X1 Carbon 2017-20HQS03P00: Intel HD Graphics 620, 14.00", 1.1 kg
External Review » Lenovo ThinkPad X1 Carbon 2017-20HQS03P00
Asus K541UJ-GQ127T: NVIDIA GeForce 920M, 15.60", 2 kg
External Review » Asus K541UJ-GQ127T
HP Envy 13-ab003ru: Intel HD Graphics 620, 13.30", 1.3 kg
External Review » HP Envy 13-ab003ru
Asus Zenbook UX330UA-FC171T: Intel HD Graphics 620, 13.30", 1.2 kg
External Review » Asus Zenbook UX330UA-FC171T
Acer Swift 5 SF514-51 75W4: Intel HD Graphics 620, 14.00", 1.3 kg
External Review » Acer Swift 5 SF514-51 75W4
Asus UX410UQ-GV034T: NVIDIA GeForce 940MX, 14.00", 1.2 kg
External Review » Asus UX410UQ-GV034T
Acer TravelMate X3 X349-G2-M: Intel HD Graphics 620, 14.00", 1.6 kg
External Review » Acer TravelMate X3 X349-G2-M
MSI CX62 7QL-047XES: NVIDIA GeForce 940MX, 15.60", 2.3 kg
External Review » MSI CX62 7QL-047XES
HP 348 G4: AMD Radeon R5 M430, 14.10", 1.9 kg
External Review » HP 348 G4
Asus F556UA-UH71: Intel HD Graphics 620, 15.60", 2.3 kg
External Review » Asus F556UA-UH71
HP 15-ay196n: Intel HD Graphics 620, 15.60", 2.1 kg
External Review » HP 15-ay196n
Razer Blade Stealth QHD i7-7500U: Intel HD Graphics 620, 13.30", 1.3 kg
External Review » Razer Blade Stealth QHD, Intel Core i7-7500U
HP Spectre 13-v102ng: Intel HD Graphics 620, 13.30", 1.1 kg
External Review » HP Spectre 13-v102ng
HP Envy 17-W0Q29AV: NVIDIA GeForce 940MX, 17.30", 3 kg
External Review » HP Envy 17-W0Q29AV
HP Envy x360 m6-aq105dx: Intel HD Graphics 620, 15.60", 2.2 kg
External Review » HP Envy x360 m6-aq105dx
Dell Inspiron 15 5567-1760: AMD Radeon R7 M445, 15.60", 2.3 kg
External Review » Dell Inspiron 15 5567-1760
Asus Zenbook UX330UA-FC079T: Intel HD Graphics 620, 13.30", 1.2 kg
External Review » Asus Zenbook UX330UA-FC079T
HP Spectre x360 15-bl002xx: NVIDIA GeForce 940MX, 15.60", 2 kg
External Review » HP Spectre x360 15-bl002xx
HP Spectre x360 15-bl020nd: NVIDIA GeForce 940MX, 15.60", 2 kg
External Review » HP Spectre x360 15-bl020nd
Dell Inspiron 15 5000 5567-1753: AMD Radeon R7 M445, 15.60", 2.3 kg
External Review » Dell Inspiron 15 5000 5567-1753
HP Spectre 13-w025nd x360: Intel HD Graphics 620, 13.30", 1.4 kg
External Review » HP Spectre 13-w025nd x360
Asus Zenbook Flip UX360UAK-C4341T: Intel HD Graphics 620, 13.30", 1.2 kg
External Review » Asus Zenbook Flip UX360UAK-C4341T
Asus Zenbook U510UX-DM117T: Intel HD Graphics 620, 15.60", 2 kg
External Review » Asus Zenbook U510UX-DM117T
Lenovo Yoga 910-13IKB-80VF00C6GE: Intel HD Graphics 620, 13.90", 1.4 kg
External Review » Lenovo Yoga 910-13IKB-80VF00C6GE
Asus ZenBook 3 UX390UA-GS068T: Intel HD Graphics 620, 12.50", 0.9 kg
External Review » Asus ZenBook 3 UX390UA-GS068T
Asus ZenBook 3 UX390UA-77DHDAB1: Intel HD Graphics 620, 12.50", 0.9 kg
External Review » Asus ZenBook 3 UX390UA-77DHDAB1
Asus ZenBook UX3410UQ-GV077T: NVIDIA GeForce 940MX, 14.00", 1.4 kg
External Review » Asus ZenBook UX3410UQ-GV077T
Acer Aspire F15 F5-573G-74X5: NVIDIA GeForce GTX 950M, 15.60", 2.4 kg
External Review » Acer Aspire F15 F5-573G-74X5
HP Envy 13-ab001ns: Intel HD Graphics 620, 13.30", 1.3 kg
External Review » HP Envy 13-ab001ns
Acer Spin 5 SP513-51-79LN: Intel HD Graphics 620, 13.30", 1.6 kg
External Review » Acer Spin 5 SP513-51-79LN
Lenovo Yoga 910-13IKB-80VF001PCK: Intel HD Graphics 620, 13.90", 1.4 kg
External Review » Lenovo Yoga 910-13IKB-80VF001PCK
HP Spectre 13-w002ng x360: Intel HD Graphics 620, 13.30", 1.4 kg
External Review » HP Spectre 13-w002ng x360
HP Envy 13-ab021nd: Intel HD Graphics 620, 13.30", 1.3 kg
External Review » HP Envy 13-ab021nd
Lenovo Yoga 910-13IKB-80VF007RMH: Intel HD Graphics 620, 13.90", 1.4 kg
External Review » Lenovo Yoga 910-13IKB-80VF007RMH
HP Spectre 13-w001nf x360: Intel HD Graphics 620, 13.30", 1.4 kg
External Review » HP Spectre 13-w001nf x360
Lenovo IdeaPad Miix 720-12IKB-80VV002JGE: Intel HD Graphics 620, 12.00", 1.1 kg
External Review » Lenovo IdeaPad Miix 720-12IKB-80VV002JGE
Asus Zenbook 3 Deluxe UX490UA: Intel HD Graphics 620, 14.00", 1.1 kg
External Review » Asus Zenbook 3 Deluxe UX490UA
MSI GS32 7QE-013RU Shadow: NVIDIA GeForce GTX 950M, 13.30", 1.2 kg
External Review » MSI GS32 7QE-013RU Shadow
Lenovo Yoga 710-14IKB-80V4002VGE: NVIDIA GeForce 940MX, 14.00", 1.6 kg
External Review » Lenovo Yoga 710-14IKB-80V4002VGE
Asus Zenbook Flip UX360UAK-BB284T: Intel HD Graphics 620, 13.30", 1.3 kg
External Review » Asus Zenbook Flip UX360UAK-BB284T
Lenovo Ideapad 510S-14IKB: AMD Radeon R7 M460, 14.00", 1.7 kg
External Review » Lenovo Ideapad 510S-14IKB
HP ProBook 470 G4: NVIDIA GeForce 930MX, 17.30", 2.8 kg
External Review » HP ProBook 470 G4
Asus A456UQ-FA073D: NVIDIA GeForce 940MX, 14.00", 2.3 kg
External Review » Asus A456UQ-FA073D
Lenovo Ideapad 710S-13IKB-80VQ0060GE: Intel HD Graphics 620, 3.30", 1.2 kg
External Review » Lenovo Ideapad 710S-13IKB-80VQ0060GE
Lenovo Yoga 710-14IKB-80V4004NMH: Intel HD Graphics 620, 14.00", 1.6 kg
External Review » Lenovo Yoga 710-14IKB-80V4004NMH
Lenovo Yoga 710-14IKB-80V40031SP: NVIDIA GeForce 940MX, 14.00", 1.6 kg
External Review » Lenovo Yoga 710-14IKB-80V40031SP
Asus ZenBook 3 UX390UA-GS031T: Intel HD Graphics 620, 12.50", 1 kg
External Review » Asus ZenBook 3 UX390UA-GS031T
Lenovo Yoga 510-14IKB-80VB004DGE: Intel HD Graphics 620, 14.00", 1.7 kg
External Review » Lenovo Yoga 510-14IKB-80VB004DGE
Acer Aspire F17 F5-771G-74P9: NVIDIA GeForce GTX 950M, 17.30", 2.9 kg
External Review » Acer Aspire F17 F5-771G-74P9
Dell Inspiron i5767-3649GRY: AMD Radeon R8 M445DX, 17.30", 3 kg
External Review » Dell Inspiron i5767-3649GRY
HP ProBook 450 G4 Y8B60EA: NVIDIA GeForce 930MX, 15.60", 2 kg
External Review » HP ProBook 450 G4 Y8B60EA
HP Envy 13-ab003nf: Intel HD Graphics 620, 13.30", 1.4 kg
External Review » HP Envy 13-ab003nf
Asus ZenBook 3 UX390UA-GS007R: Intel HD Graphics 620, 12.50", 1 kg
External Review » Asus ZenBook 3 UX390UA-GS007R
Medion P7648-MD99980: NVIDIA GeForce GTX 950M, 17.30", 2.9 kg
External Review » Medion P7648-MD99980
Dell XPS 13 9360 QHD+ i7: Intel HD Graphics 620, 13.30", 1.3 kg
External Review » Dell XPS 13 9360 QHD+ i7
Dell Inspiron 15 7560, Core i7: NVIDIA GeForce 940MX, 15.60", 2 kg
External Review » Dell Inspiron 15-7560, Core i7
HP 15-ay110ns: AMD Radeon R7 M440, 15.60", 2 kg
External Review » HP 15-ay110ns
HP 15-AY126NS: Intel HD Graphics 620, 15.60", 2 kg
External Review » HP 15-AY126NS
Asus ZenBook 3 UX390UA-GS073T: Intel HD Graphics 620, 12.50", 1 kg
External Review » Asus ZenBook 3 UX390UA-GS073T
Dell Inspiron 13z (5378) Touch: Intel HD Graphics 620, 13.30", 1.6 kg
External Review » Dell Inspiron 13z (5378) Touch
Dell Vostro 5468-N010VN5468EMEA01: NVIDIA GeForce 940MX, 14.00", 1.6 kg
External Review » Dell Vostro 5468-N010VN5468EMEA01
Acer Aspire F5-771G-78X0: NVIDIA GeForce GTX 950M, 17.30", 3 kg
External Review » Acer Aspire F5-771G-78X0
HP 15-ay142ns: AMD Radeon R7 M440, 15.60", 2.9 kg
External Review » HP 15-ay142ns
HP Spectre x360 13-w023dx: Intel HD Graphics 620, 13.30", 1.3 kg
External Review » HP Spectre x360 13-w023dx
Razer Blade Stealth i7-7500U, Late 2016: Intel HD Graphics 620, 12.50", 1.3 kg
External Review » Razer Blade Stealth, Late 2016
Asus ZenBook 3 UX390UA-GS039T: Intel HD Graphics 620, 12.50", 0.9 kg
External Review » Asus ZenBook 3 UX390UA-GS039T
Medion Akoya S3409-MD60234: Intel HD Graphics 620, 13.30", 1.5 kg
External Review » Medion Akoya S3409-MD60234
Asus Zenbook 3 UX390UA-XH74-BL: Intel HD Graphics 620, 12.50", 0.9 kg
External Review » Asus Zenbook 3 UX390UA-XH74-BL
Medion Akoya S3409-MD60234: Intel HD Graphics 620, 13.30", 1.5 kg
External Review » Medion Akoya S3409-MD60226
Lenovo Yoga 910-13IKB-80VF004CGE: Intel HD Graphics 620, 13.90", 1.4 kg
External Review » Lenovo Yoga 910, 13.9 inch