Reviews for the Intel Core i7-8850H processor
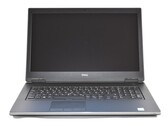
Dell Precision 7730 (Core i7-8850H, Quadro P3200, FHD) Workstation Review
Dell has redesigned its largest Precision workstations, of which the Precision 7730 is one. The new 17.3-inch workstation has a more compact design than its predecessor, although you may be hard-pressed to tell the two apart. The Precision 7730 certainly has plenty of power, but can its 92 Wh go the distance?
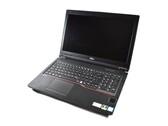
Intel Core i7-8850H, NVIDIA Quadro P3200, 17.3", 3.3 kgFujitsu Celsius H780 (i7-8850H, P2000, FHD) Workstation Review
As a somewhat smaller player, Fujitsu is facing an uphill battle in the mobile workstation market. Can Fujitsu establish its Celsius H780 as a credible competitor against the likes of Dell, HP and Lenovo? That may be difficult, since the Fujitsu Celsius H780 revealed plenty of weaknesses in our comprehensive review.
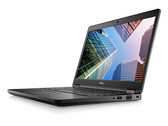
Intel Core i7-8850H, NVIDIA Quadro P2000, 15.6", 2.8 kgDell Latitude 5591 (8850H, MX130, Touchscreen) Laptop Review
More power. Equipped with a 45 W Coffee Lake-H CPU and dedicated graphics, the Latitude 5591 is a more potent version of Dell's 15.6-inch mid-range Latitude 5590. The performance is up significantly, but surface temperature and noise level have increased as well.
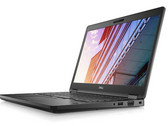
Intel Core i7-8850H, NVIDIA GeForce MX130, 15.6", 2.3 kgDell Latitude 5491 (8850H, MX130, Touchscreen) Laptop Review
Hexa-core for business. Dell's mid-range Latitude 5000 series gets the Coffee Lake-H treatment and dedicated graphics as well. The new 14-inch model with 45 W processor and GeForce graphics outperforms the sibling with ULV processor, but the additional power draw creates more heat and shortens battery life. The display remains less than impressive.
Intel Core i7-8850H, NVIDIA GeForce MX130, 14", 1.8 kgApple MacBook Pro 15 2018 (2.6 GHz, 560X) Laptop Review
Apple finally ships the MacBook Pro 15 with the new Intel processors. They feature 6 cores and should increase the multi-core performance significantly. At least in theory, because a comparison with the predecessor shows that the advantage is not always that big.
Intel Core i7-8850H, AMD Radeon Pro 560X, 15.4", 1.8 kgAorus X7 DT v8: NVIDIA GeForce GTX 1080 Mobile, 17.30", 3.4 kg
Review » AORUS X7 DT v8 (i7-8850H, GTX 1080, Full HD) Laptop Review
Aorus X5 v8: NVIDIA GeForce GTX 1070 Mobile, 15.60", 2.7 kg
Review » Aorus X5 v8 (i7-8850H, GTX 1070, Full HD) Laptop Review
HP ZBook Studio x360 G5-9AV38PA: NVIDIA Quadro P2000, 15.60", 2.2 kg
External Review » HP ZBook Studio x360 G5-9AV38PA
Lenovo ThinkPad P52-20M90024US: NVIDIA Quadro P3200, 15.60", 2.6 kg
External Review » Lenovo ThinkPad P52-20M90024US
Lenovo ThinkPad P1-20MD000NGE: NVIDIA Quadro P2000, 15.60", 1.7 kg
External Review » Lenovo ThinkPad P1-20MD000NGE
Lenovo ThinkPad P1-20MD0023US: NVIDIA Quadro P2000, 15.60", 1.7 kg
External Review » Lenovo ThinkPad P1-20MD0023US
HP EliteBook 1050 G1-3TN97AV: NVIDIA GeForce GTX 1050 Max-Q, 15.60", 2.1 kg
External Review » HP EliteBook 1050 G1-3TN97AV
Lenovo ThinkPad X1 Extreme-20MFS03W00: NVIDIA GeForce GTX 1050 Ti Max-Q, 15.60", 1.8 kg
External Review » Lenovo ThinkPad X1 Extreme-20MFS03W00
Fujitsu Celsius H980: NVIDIA Quadro P5200, 17.30", 3.5 kg
External Review » Fujitsu Celsius H980
Lenovo ThinkPad P52-20M90017GE: NVIDIA Quadro P2000, 15.60", 2.9 kg
External Review » Lenovo ThinkPad P52-20M90017GE
HP ZBook 15 G5-2ZC66EA: NVIDIA Quadro P2000, 15.60", 2.6 kg
External Review » HP ZBook 15 G5-2ZC66EA
Dell Latitude 5491 (8850H, UHD 630): Intel UHD Graphics 630, 14.00", 1.8 kg
External Review » Dell Latitude 5491 (8850H, UHD 630)
Lenovo ThinkPad X1 Extreme 20MF000NUS: NVIDIA GeForce GTX 1050 Ti Max-Q, 15.60", 1.8 kg
External Review » Lenovo ThinkPad X1 Extreme 20MF000NUS
HP ZBook Studio x360 G5 ZC62EA: NVIDIA Quadro P1000, 15.60", 2.3 kg
External Review » HP ZBook Studio x360 G5 ZC62EA
Lenovo ThinkPad P1-20MDS00F00: NVIDIA Quadro P1000, 15.60", 1.7 kg
External Review » Lenovo ThinkPad P1-20MDS00F00
Dell Latitude 5591: NVIDIA GeForce MX130, 15.60", 2.3 kg
External Review » Dell Latitude 5591
Dell Latitude 5491: NVIDIA GeForce MX130, 14.00", 1.8 kg
External Review » Dell Latitude 5491
Apple MacBook Pro 15 2018 (2.6 GHz, 560X): AMD Radeon Pro 560X, 15.40", 1.8 kg
External Review » Apple MacBook Pro 15 2018 (2.6 GHz, 560X)
Aorus X7 DT v8: NVIDIA GeForce GTX 1080 Mobile, 17.30", 3.4 kg
External Review » Aorus X7 DT v8
MSI GT75 8RG-008ES Titan: NVIDIA GeForce GTX 1080 Mobile, 17.30", 4.6 kg
External Review » MSI GT75 8RG-008ES Titan
Gigabyte Aorus X5 V8 : NVIDIA GeForce GTX 1070 Mobile, 15.60", 2.5 kg
External Review » Gigabyte Aorus X5 V8
Aorus X5 v8: NVIDIA GeForce GTX 1070 Mobile, 15.60", 2.7 kg
External Review » Aorus X5 v8