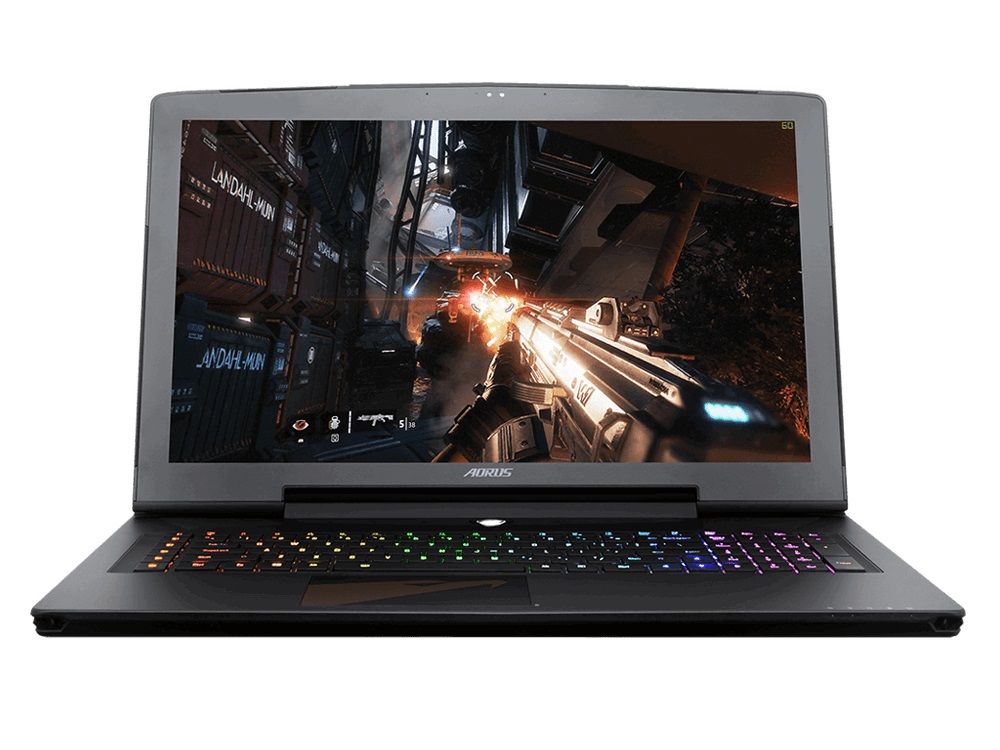
AORUS X7 DT v8 (i7-8850H, GTX 1080, Full HD) Laptop Review

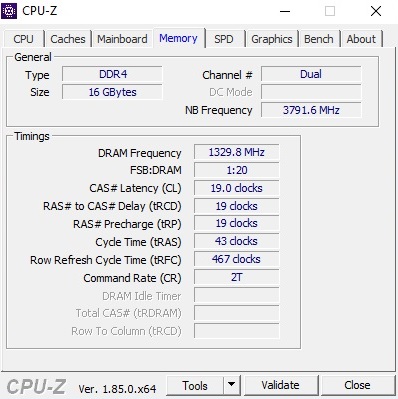
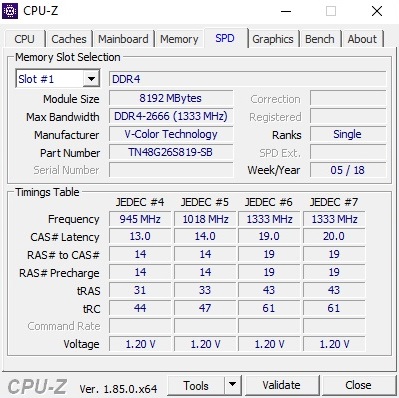
The only AORUS X7 DT v8 currently listed on price comparison site geizhals.de is our test configuration. This configuration is currently priced at just under 3,100 Euros (~$3631), for which you get a device with an Intel Core i7-8850H processor, an Nvidia GeForce GTX 1080 GPU, 16 GB DDR4 2666 RAM, a 512 GB NVMe SSD and a 1 TB 7,200 RPM HDD. The i7-8850H is currently the fastest laptop CPU available for consumers. Gigabyte, AORUS’ parent company, has even thrown in a 144 Hz panel to sweeten the deal.
Most gaming laptops are equipped with either an Nvidia GeForce GTX 1060 or a GTX 1070, but there are plenty of laptops that are equipped with the GTX 1080 too. We have chosen to compare the X7 DT v8 against other 17-inch gaming laptops that are also under 3.0 cm thick. These are the Razer Blade Pro 2017, the Schenker XMG Pro 17, the Alienware 17 R4 and the MSI GE73 8RF.
Innovations
The X7 DT v8 has changed internally and externally from the last predecessor we tested, the X7 DT v6; we only tested the non-DT variant of AORUS’ v7 series.
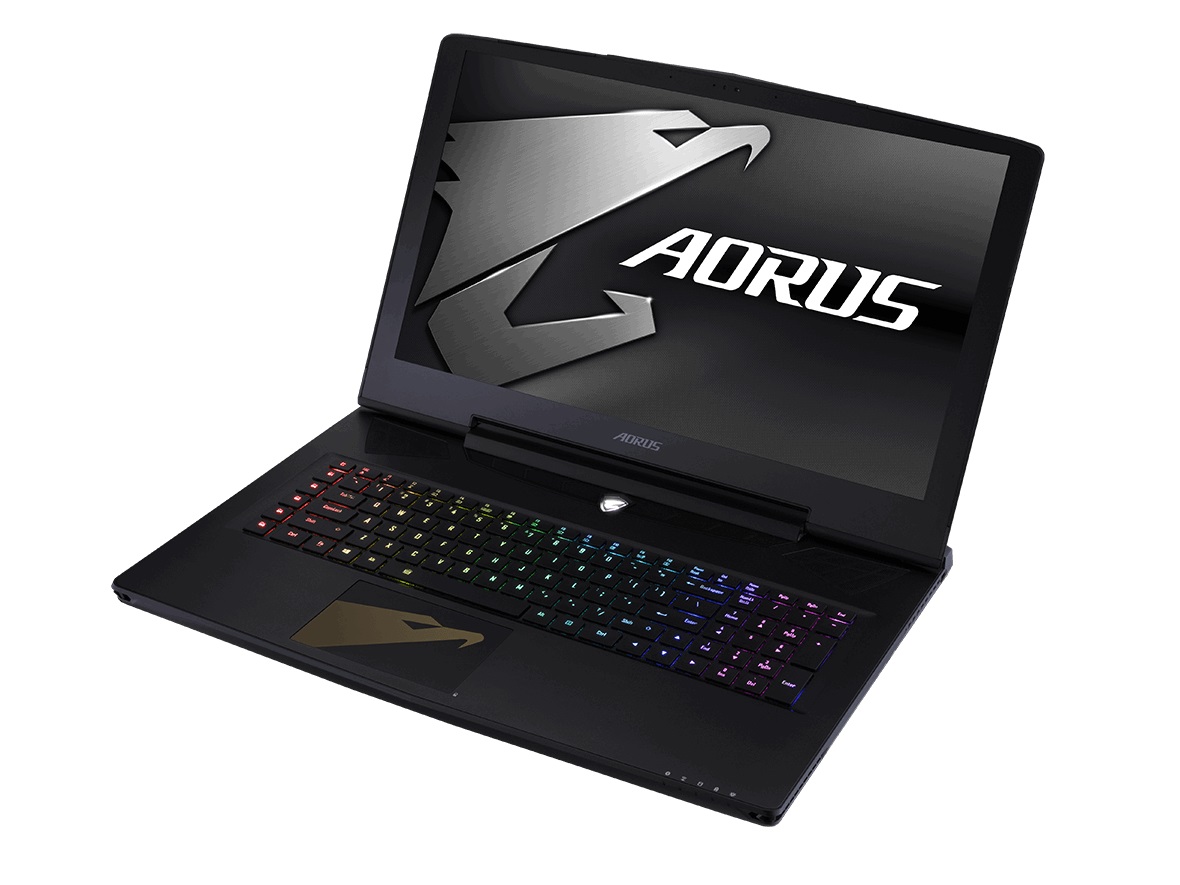
Briefly, AORUS has integrated the keyboard into the case as opposed to designing it to look like the keyboard has been added on top as was the case with the X7 DT v6.
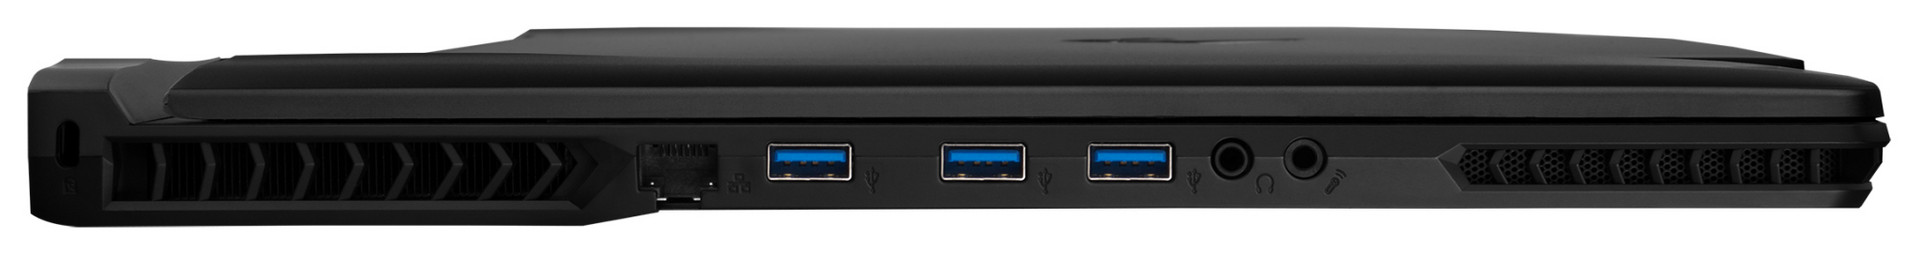
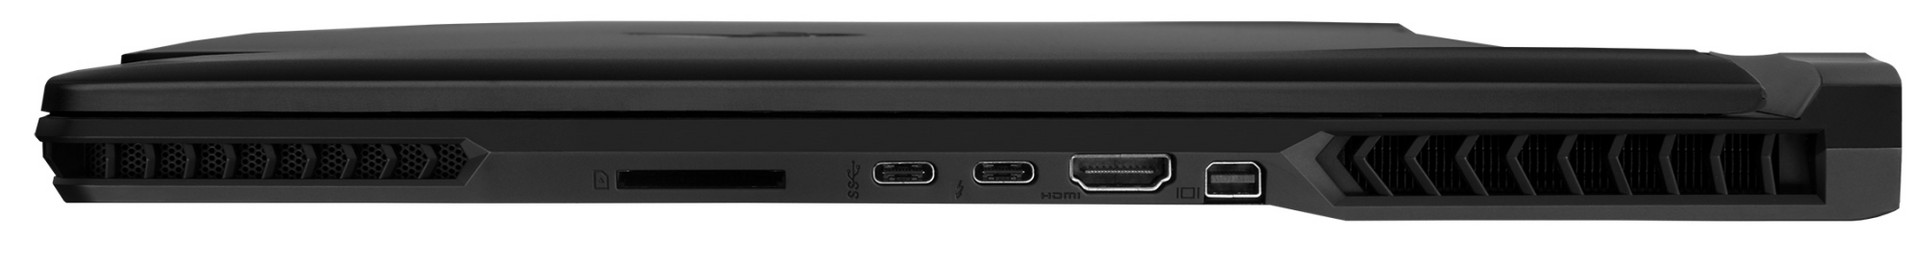
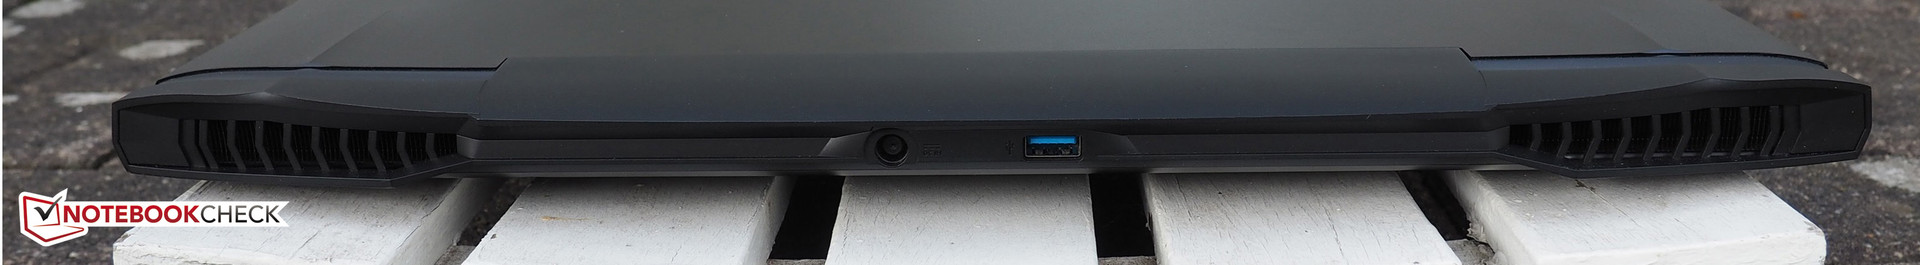
More excitingly, AORUS has modernized the X7 DT v8’s ports from its predecessors. There is a Thunderbolt 3 port, as is befitting of current premium notebooks. Moreover, AORUS has increased the number of USB ports to six, including the Thunderbolt 3 port. The card reader is blazingly fast too.
Neither the case, nor the connectivity, nor the input devices have changed much between generations. As such, we will not be covering these in this review. Please see our review of the X7 DT v6 for information on these areas.
| SD Card Reader | |
| average JPG Copy Test (av. of 3 runs) | |
| Aorus X7 DT v8 (Toshiba Exceria Pro SDXC 64 GB UHS-II) | |
| Schenker XMG Pro 17 (Toshiba Exceria Pro SDXC 64 GB UHS-II) | |
| Average of class Gaming (20.9 - 210, n=54, last 2 years) | |
| Aorus X7 DT v6 (Toshiba Exceria Pro SDXC 64 GB UHS-II) | |
| Razer Blade Pro 2017 (Toshiba Exceria Pro SDXC 64 GB UHS-II) | |
| MSI GE73 8RF-008 Raider RGB (Toshiba Exceria Pro SDXC 64 GB UHS-II) | |
| maximum AS SSD Seq Read Test (1GB) | |
| Aorus X7 DT v8 (Toshiba Exceria Pro SDXC 64 GB UHS-II) | |
| Schenker XMG Pro 17 (Toshiba Exceria Pro SDXC 64 GB UHS-II) | |
| Average of class Gaming (25.5 - 261, n=51, last 2 years) | |
| Aorus X7 DT v6 (Toshiba Exceria Pro SDXC 64 GB UHS-II) | |
| Razer Blade Pro 2017 (Toshiba Exceria Pro SDXC 64 GB UHS-II) | |
| MSI GE73 8RF-008 Raider RGB (Toshiba Exceria Pro SDXC 64 GB UHS-II) | |
| Networking | |
| iperf3 transmit AX12 | |
| MSI GE73 8RF-008 Raider RGB | |
| Aorus X7 DT v8 | |
| Alienware 17 R4 | |
| Schenker XMG Pro 17 | |
| Razer Blade Pro 2017 | |
| iperf3 receive AX12 | |
| MSI GE73 8RF-008 Raider RGB | |
| Schenker XMG Pro 17 | |
| Razer Blade Pro 2017 | |
| Aorus X7 DT v8 | |
| Alienware 17 R4 | |
Display
The X7 DT v8 has an AU Optronics B173HAN03.0 panel with a 1920x1080 display, which at first seems like a step down from the v6’s 2560x1440 display. However, the X7 DT v8 has a 144 Hz IPS panel to the v6’s 120 Hz TN panel. This means that the v8’s display has stronger viewing angles and a higher refresh rate than its predecessors; this could prove useful when playing games.
| |||||||||||||||||||||||||
Brightness Distribution: 84 %
Center on Battery: 297 cd/m²
Contrast: 1291:1 (Black: 0.23 cd/m²)
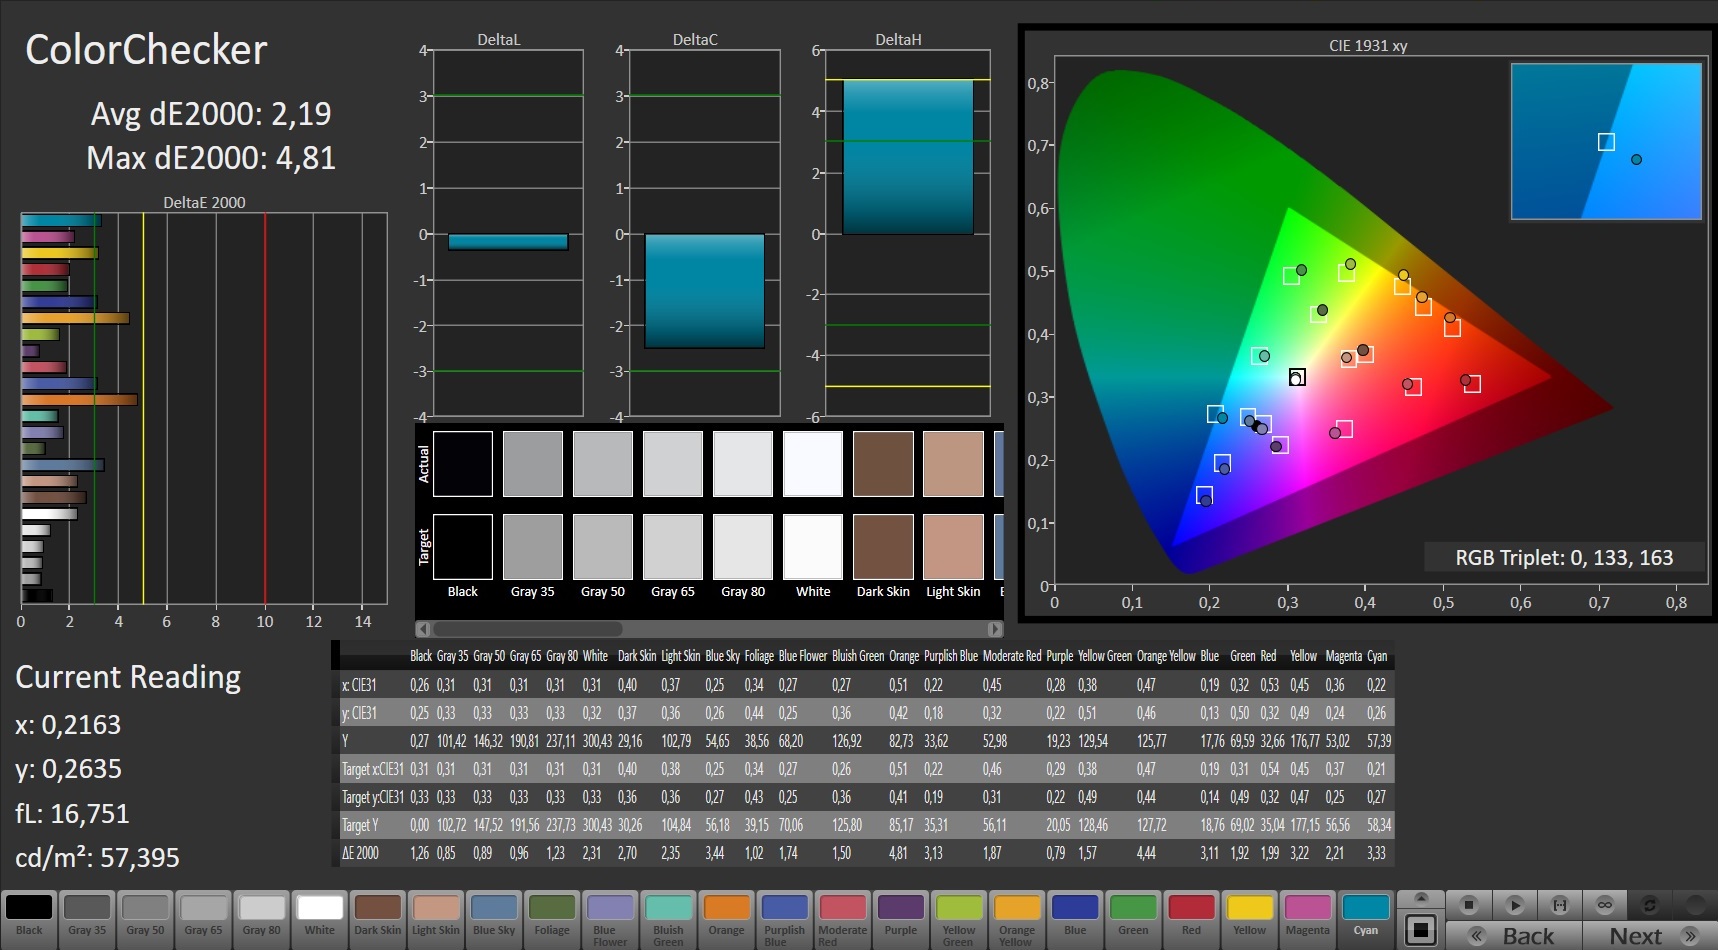
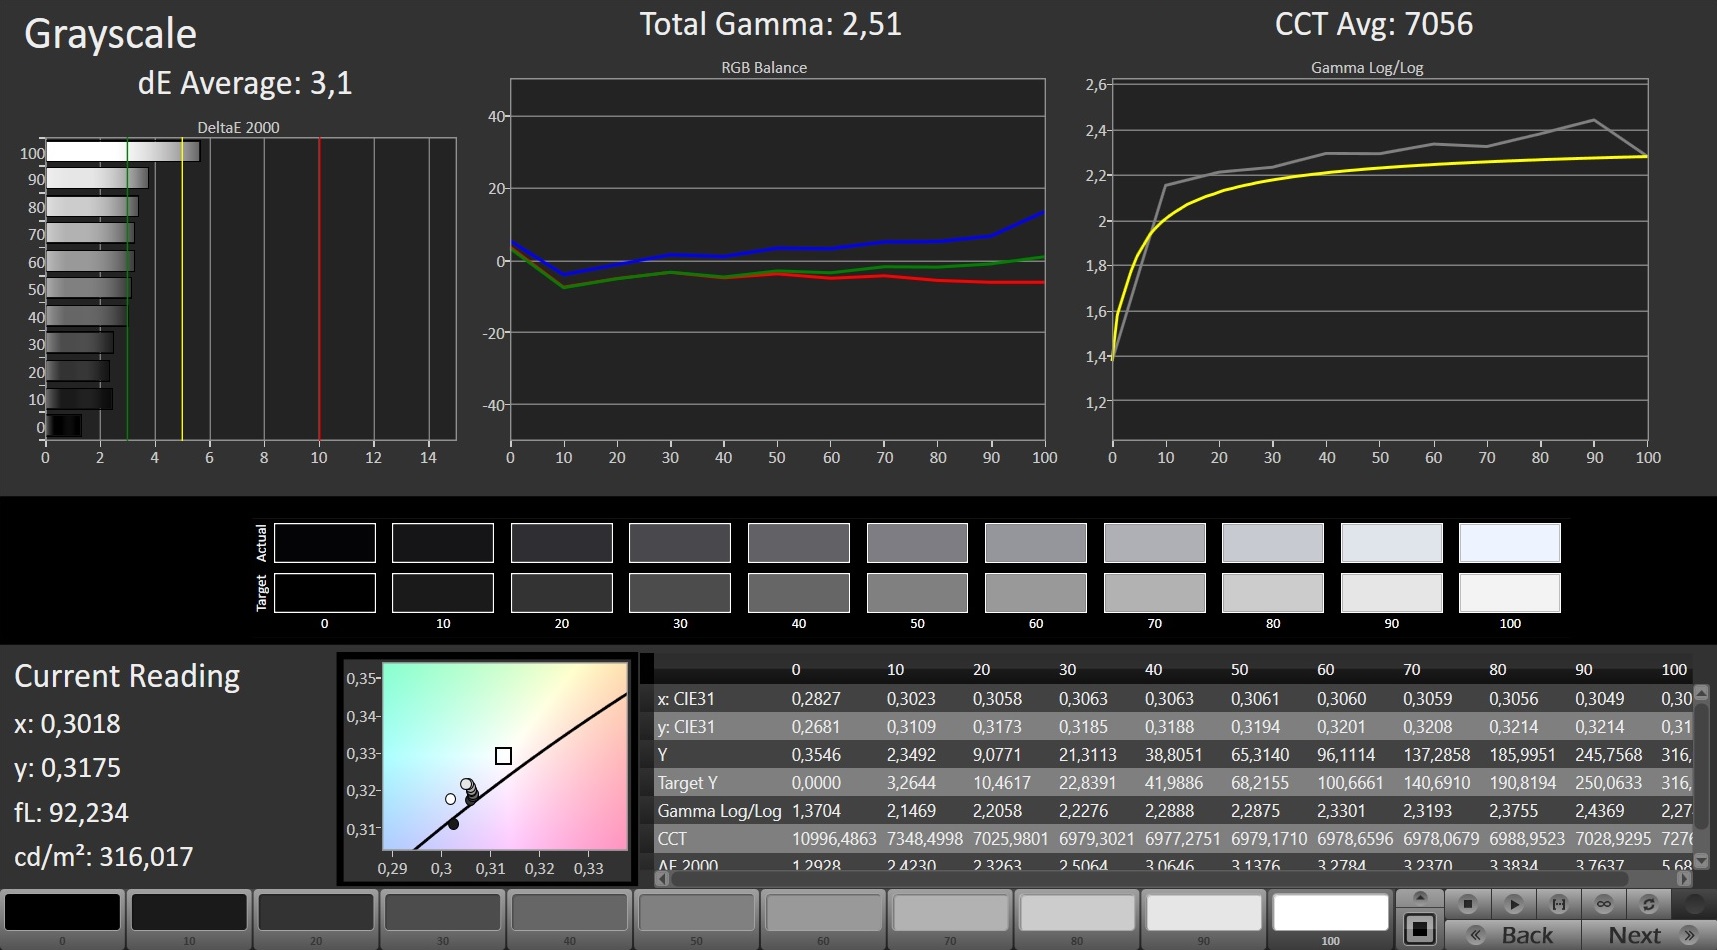
ΔE ColorChecker Calman: 2.19 | ∀{0.5-29.43 Ø4.71}
ΔE Greyscale Calman: 1.31 | ∀{0.09-98 Ø4.96}
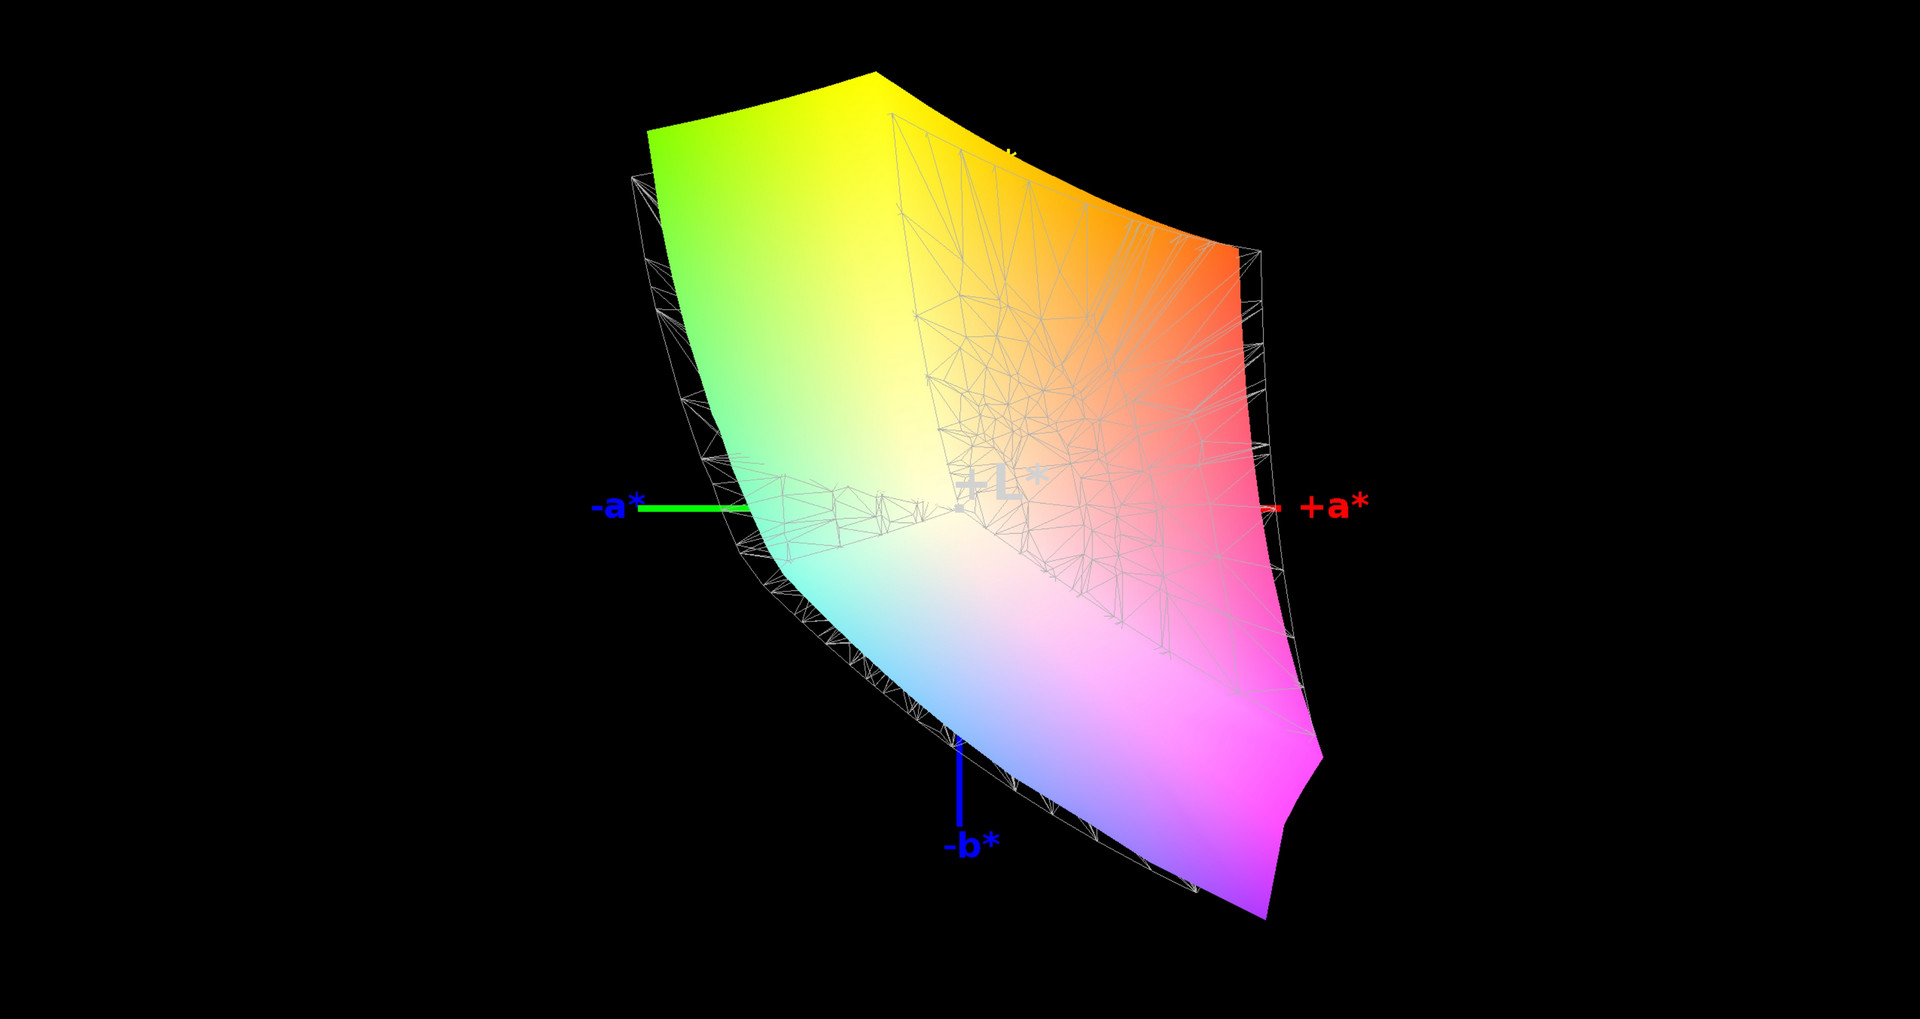
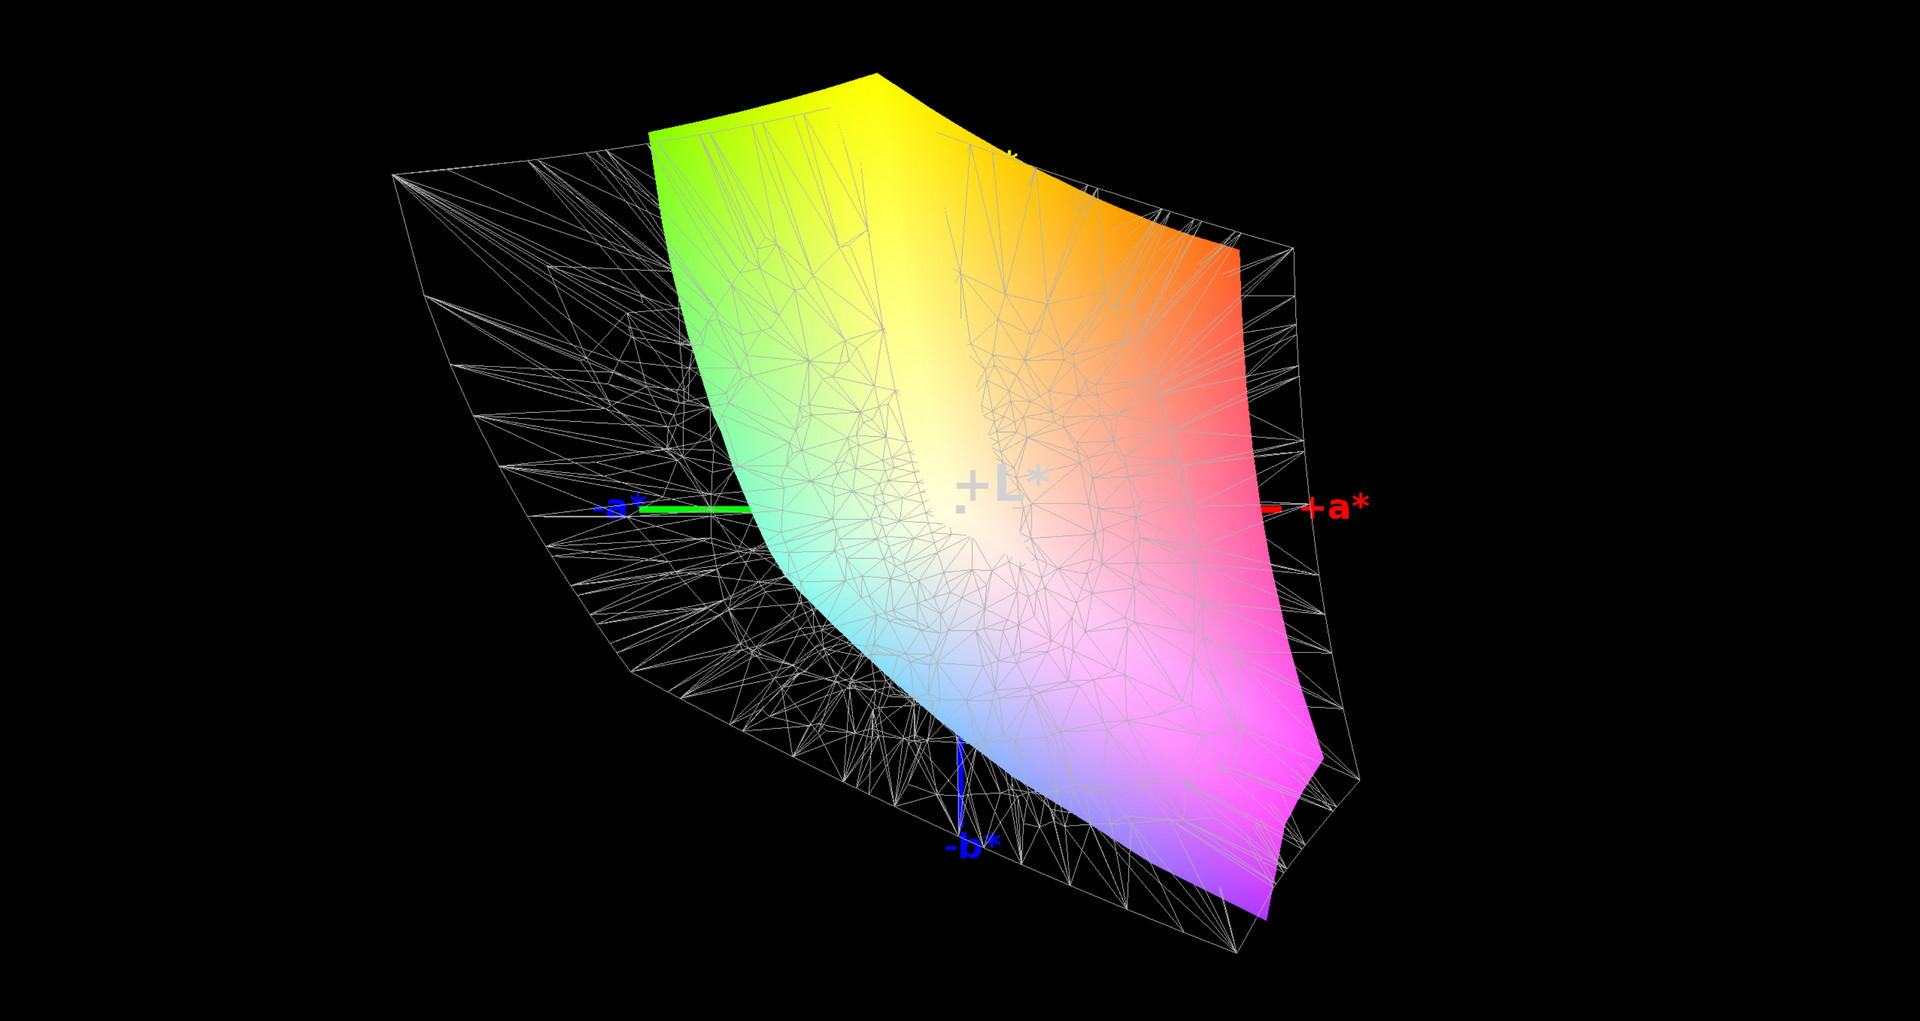
91% sRGB (Argyll 1.6.3 3D)
59% AdobeRGB 1998 (Argyll 1.6.3 3D)
66.3% AdobeRGB 1998 (Argyll 3D)
91.2% sRGB (Argyll 3D)
65.3% Display P3 (Argyll 3D)
Gamma: 2.42
CCT: 6464 K
| Aorus X7 DT v8 AU Optronics B173HAN03.0 (AUO309D), IPS, 1920x1080 | Aorus X7 DT v6 AUO1096, TN LED, 2560x1440 | Razer Blade Pro 2017 Sharp LQ173D1JW33 (SHP145A), IGZO, 3840x2160 | Alienware 17 R4 TN LED, 2560x1440 | Schenker XMG Pro 17 AU Optronics B173ZAN01.0 (AUO109B), IPS, 3840x2160 | MSI GE73 8RF-008 Raider RGB Chi Mei N173HHE-G32 (CMN1747), TN WLED, 1920x1080 | |
|---|---|---|---|---|---|---|
| Display | -9% | 32% | -8% | 30% | 26% | |
| Display P3 Coverage (%) | 65.3 | 59.6 -9% | 88.9 36% | 61.2 -6% | 85.9 32% | 90.8 39% |
| sRGB Coverage (%) | 91.2 | 82.8 -9% | 100 10% | 82.9 -9% | 99.9 10% | 99.9 10% |
| AdobeRGB 1998 Coverage (%) | 66.3 | 60.1 -9% | 99.7 50% | 60.5 -9% | 98.9 49% | 85.8 29% |
| Response Times | -15% | -229% | -37% | -126% | -35% | |
| Response Time Grey 50% / Grey 80% * (ms) | 18 ? | 21.6 ? -20% | 60.8 ? -238% | 30 ? -67% | 44 ? -144% | 28 ? -56% |
| Response Time Black / White * (ms) | 12 ? | 13.2 ? -10% | 38.4 ? -220% | 12.8 ? -7% | 24.8 ? -107% | 13.6 ? -13% |
| PWM Frequency (Hz) | 59.5 | 204.9 ? | 25000 ? | |||
| Screen | -86% | -51% | -69% | -46% | -23% | |
| Brightness middle (cd/m²) | 297 | 339.5 14% | 230 -23% | 402.3 35% | 303 2% | 273 -8% |
| Brightness (cd/m²) | 281 | 309 10% | 207 -26% | 372 32% | 287 2% | 273 -3% |
| Brightness Distribution (%) | 84 | 80 -5% | 83 -1% | 86 2% | 83 -1% | 90 7% |
| Black Level * (cd/m²) | 0.23 | 0.45 -96% | 0.2 13% | 0.62 -170% | 0.25 -9% | 0.26 -13% |
| Contrast (:1) | 1291 | 754 -42% | 1150 -11% | 649 -50% | 1212 -6% | 1050 -19% |
| Colorchecker dE 2000 * | 2.19 | 6.88 -214% | 5.62 -157% | 5.6 -156% | 4.38 -100% | 3.52 -61% |
| Colorchecker dE 2000 max. * | 4.81 | 9.99 -108% | 10.24 -113% | 9.8 -104% | 7.42 -54% | 6.34 -32% |
| Greyscale dE 2000 * | 1.31 | 6.57 -402% | 4.54 -247% | 4.7 -259% | 5.96 -355% | 3.11 -137% |
| Gamma | 2.42 91% | 2.04 108% | 2.36 93% | 2.14 103% | 2.31 95% | 2.43 91% |
| CCT | 6464 101% | 8608 76% | 6625 98% | 7519 86% | 6247 104% | 6999 93% |
| Color Space (Percent of AdobeRGB 1998) (%) | 59 | 54 -8% | 88 49% | 53.7 -9% | 87 47% | 76 29% |
| Color Space (Percent of sRGB) (%) | 91 | 82 -10% | 100 10% | 82.2 -10% | 100 10% | 100 10% |
| Colorchecker dE 2000 calibrated * | 2.09 | |||||
| Total Average (Program / Settings) | -37% /
-61% | -83% /
-58% | -38% /
-52% | -47% /
-42% | -11% /
-15% |
* ... smaller is better
Our test device scored relatively well in our tests too, but it falls short of the competition overall. Our test devices scored an average maximum brightness of 280.8 cd/m² with X-Rite i1Pro 2, which puts the X7 DT v8 in the middle of our comparison devices. A highlight of the display is its X-Rite Pantone certification, which corresponds with the good values that our test device achieved. Our test device achieved a 1,291:1 contrast ratio and a 0.23 cd/m² black value, which is higher than many of our comparison devices.
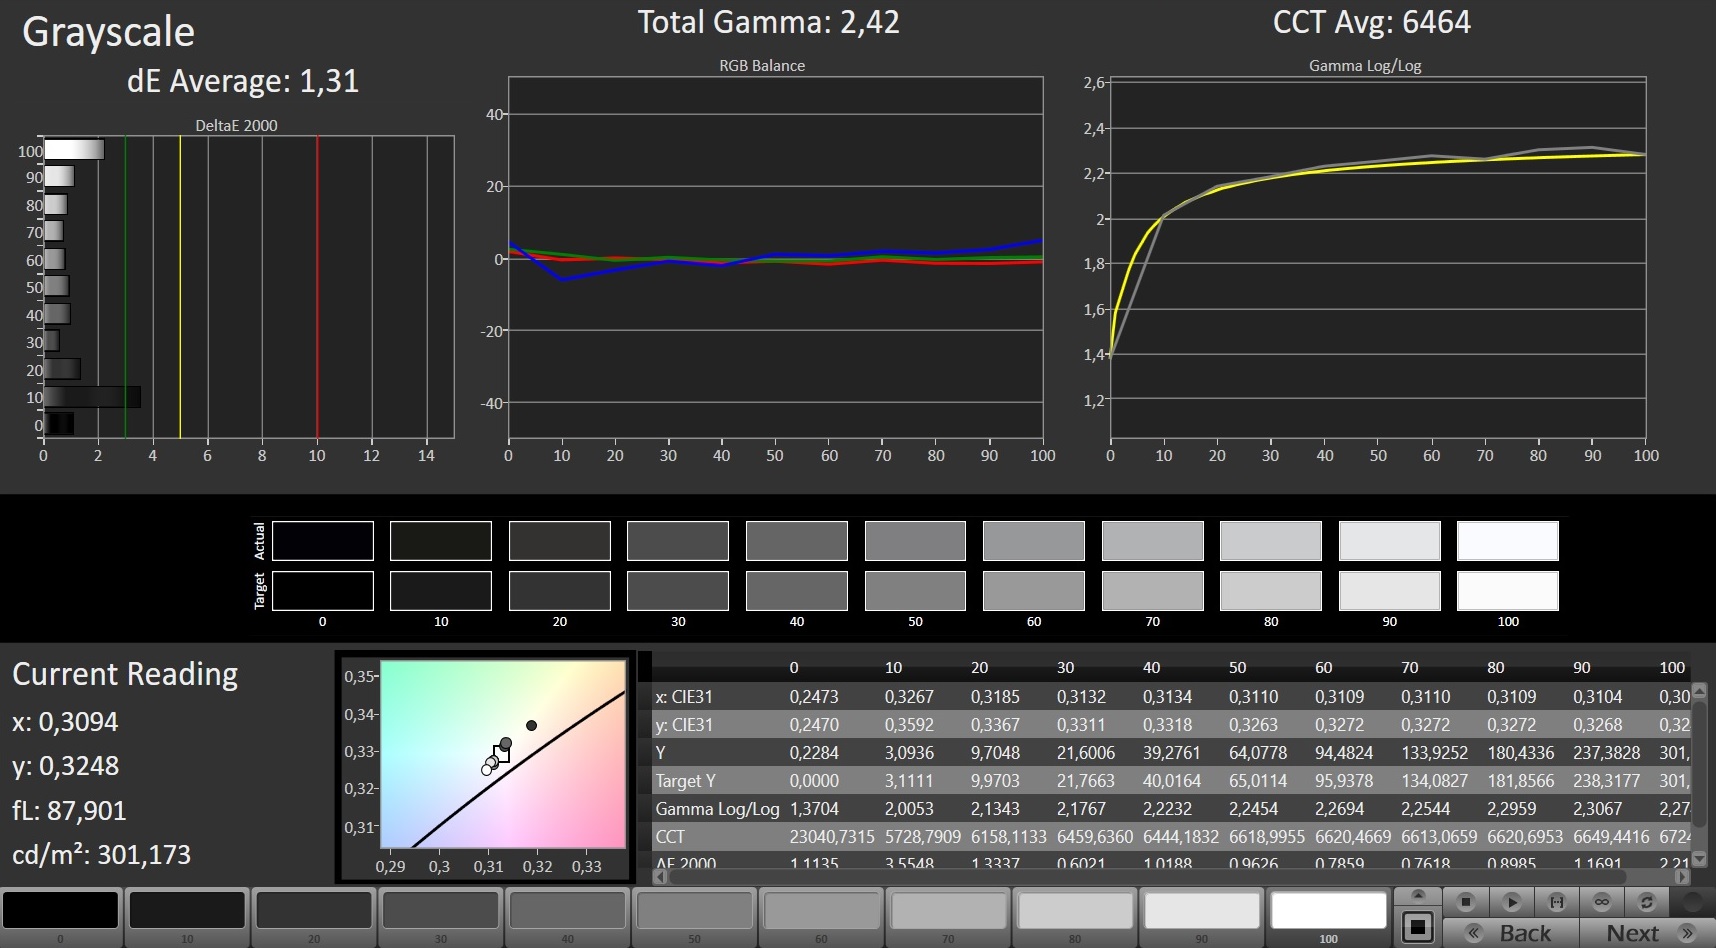
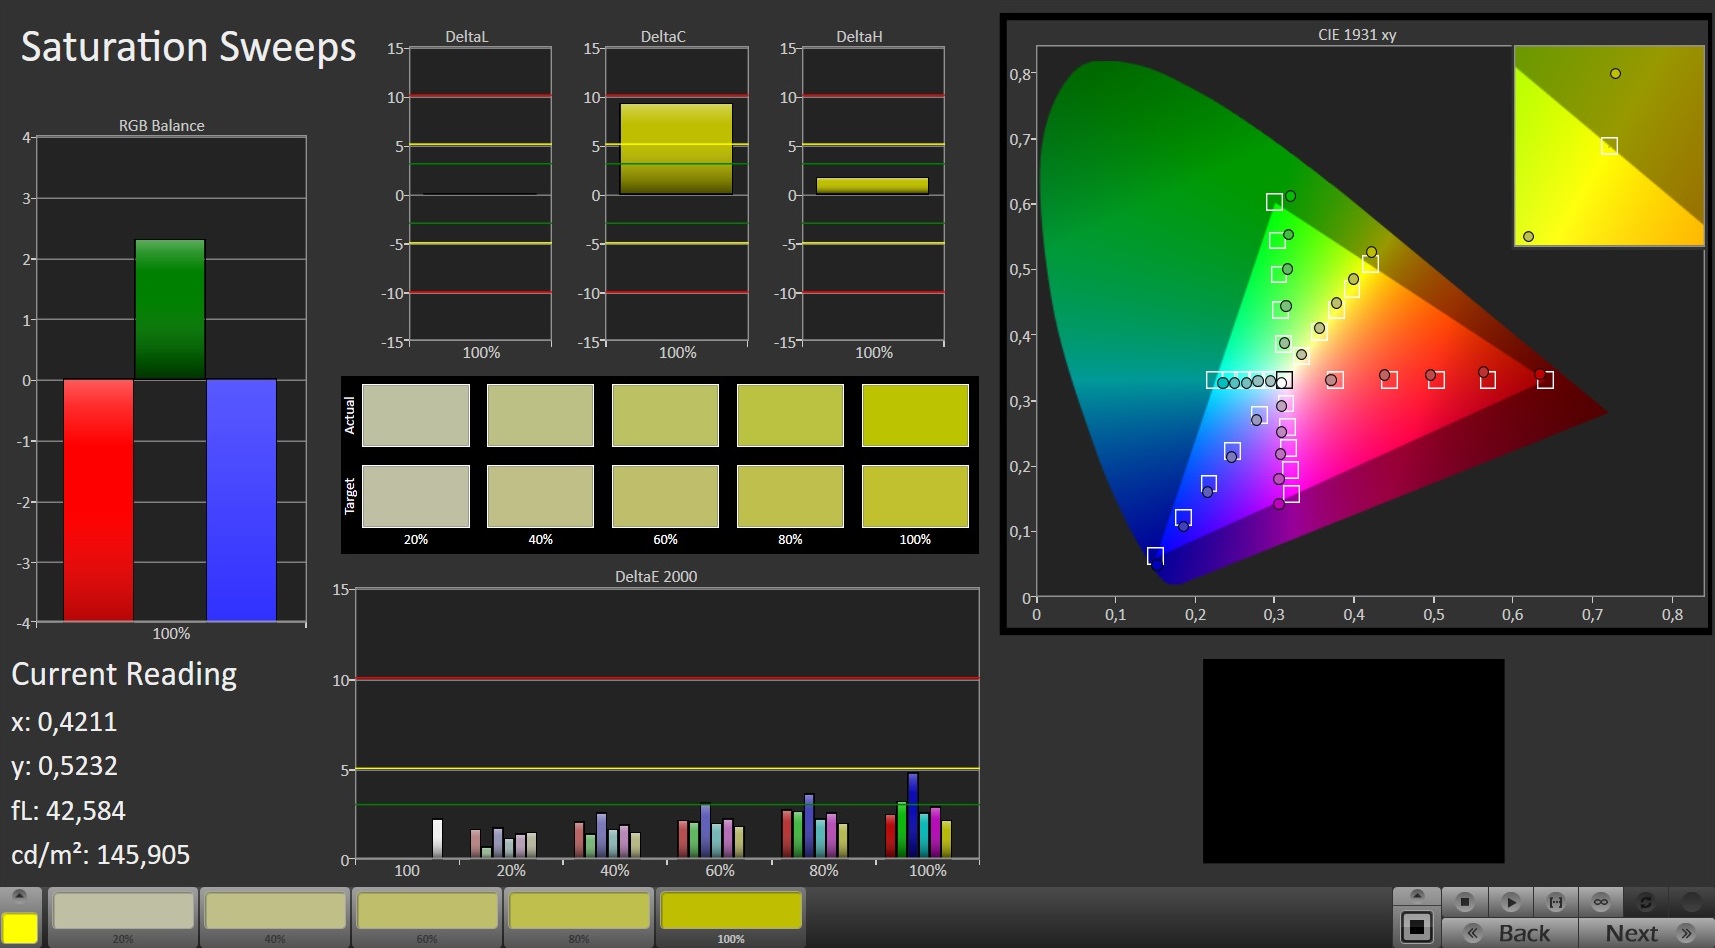
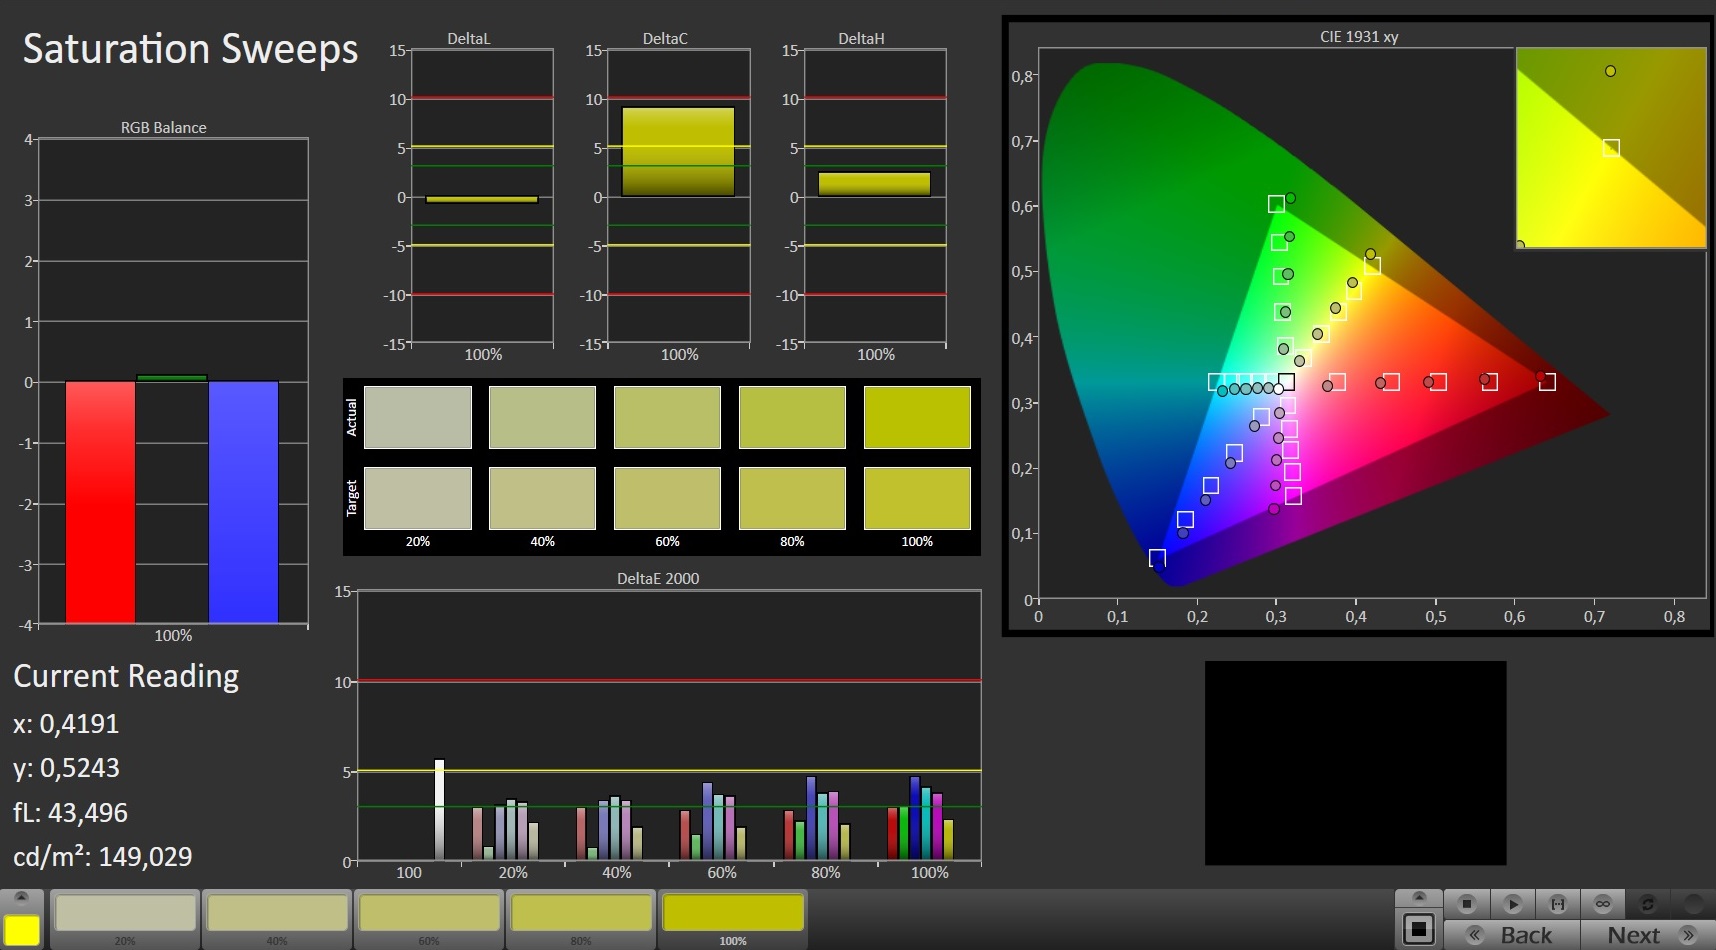
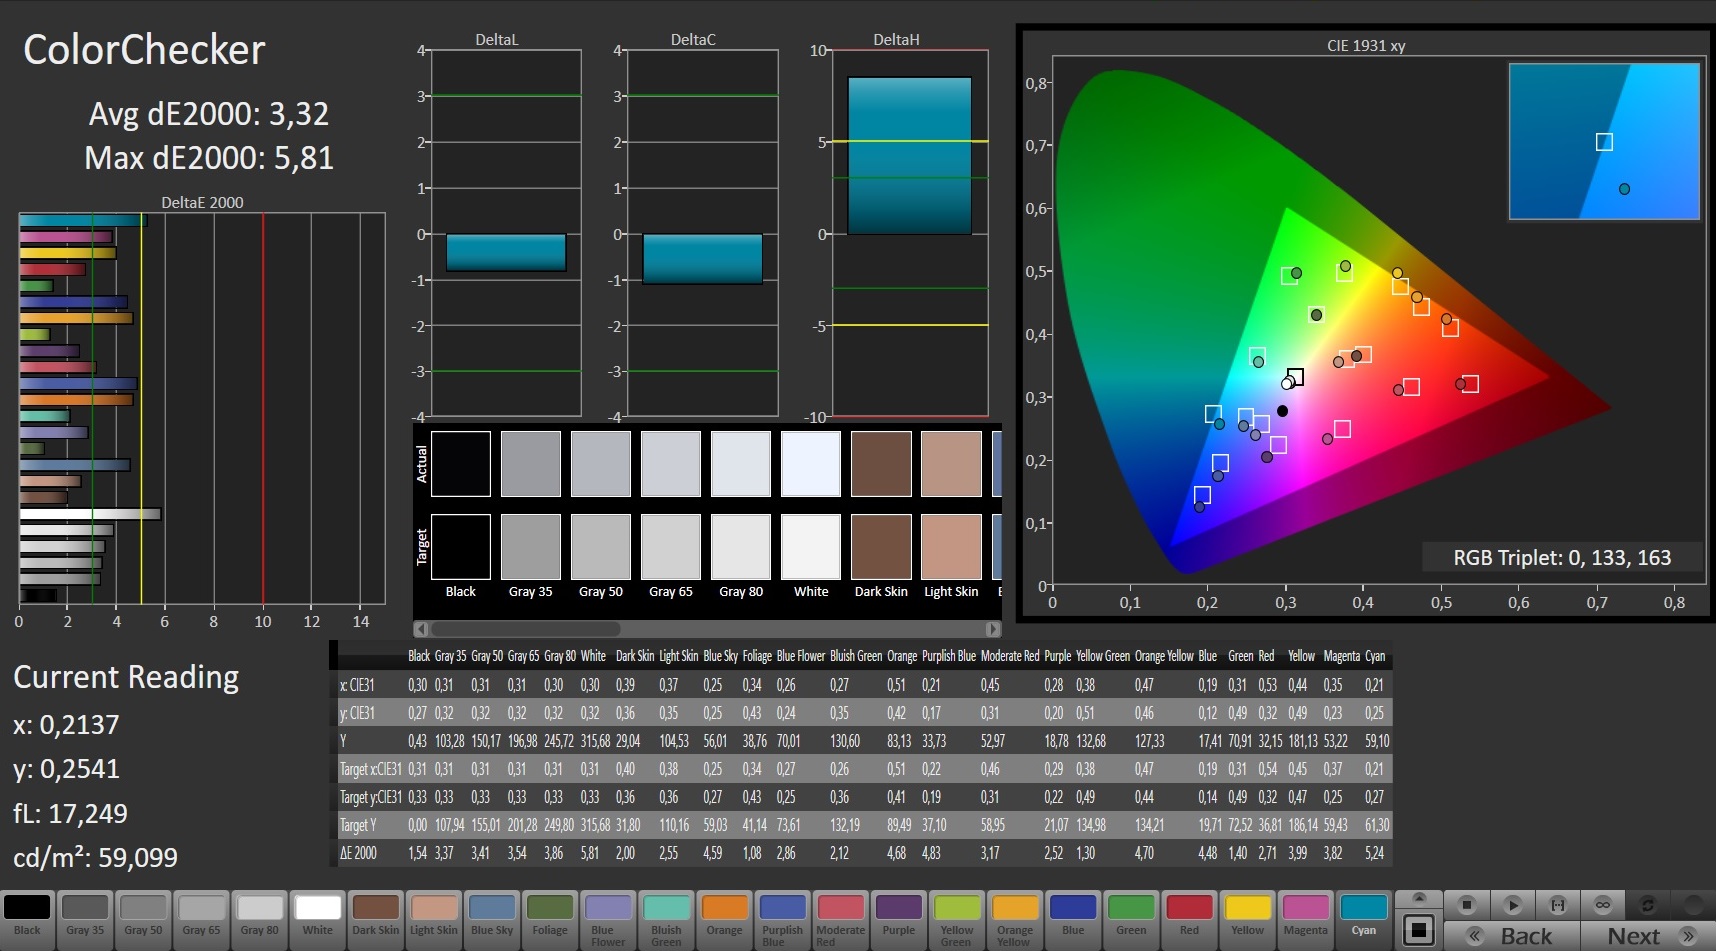
Our test device is 91% sRGB and 59% AdobeRGB accurate, which is decent for a gaming notebook. We would recommend that you check out the MSI GE73 or the 4K versions of the Razer Blade Pro or the Schenker XMG Pro 17 if you need a device with a wider color-space coverage.
The average maximum luminosity is adequate for using the X7 DT v8 indoors, but it is rather low for outdoor use.
Unfortunately, there is some backlight bleeding at the bottom of the display, but this phenomenon affects plenty of gaming notebooks.
Positively, the X7 DT v8 does not use pulse-width modulation (PWM) to regulate display brightness. PWM can cause headaches and eye strain in some people, but this will not be a problem with the X7 DT v8.
Display Response Times
| ↔ Response Time Black to White | ||
|---|---|---|
| 12 ms ... rise ↗ and fall ↘ combined | ↗ 6.8 ms rise | 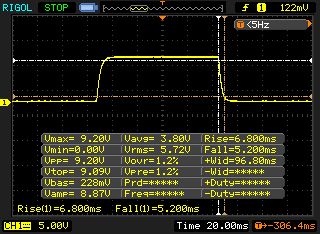 |
| ↘ 5.2 ms fall | ||
| The screen shows good response rates in our tests, but may be too slow for competitive gamers. In comparison, all tested devices range from 0.1 (minimum) to 240 (maximum) ms. » 32 % of all devices are better. This means that the measured response time is better than the average of all tested devices (19.8 ms). | ||
| ↔ Response Time 50% Grey to 80% Grey | ||
| 18 ms ... rise ↗ and fall ↘ combined | ↗ 8.8 ms rise | 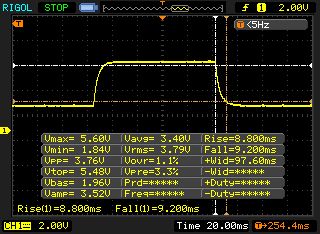 |
| ↘ 9.2 ms fall | ||
| The screen shows good response rates in our tests, but may be too slow for competitive gamers. In comparison, all tested devices range from 0.165 (minimum) to 636 (maximum) ms. » 32 % of all devices are better. This means that the measured response time is better than the average of all tested devices (30.9 ms). | ||
Screen Flickering / PWM (Pulse-Width Modulation)
| Screen flickering / PWM not detected | 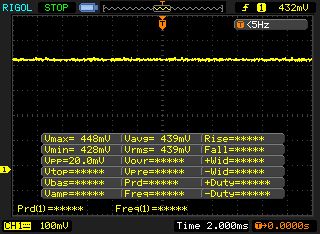 | ||
In comparison: 52 % of all tested devices do not use PWM to dim the display. If PWM was detected, an average of 7741 (minimum: 5 - maximum: 343500) Hz was measured. | |||
Performance
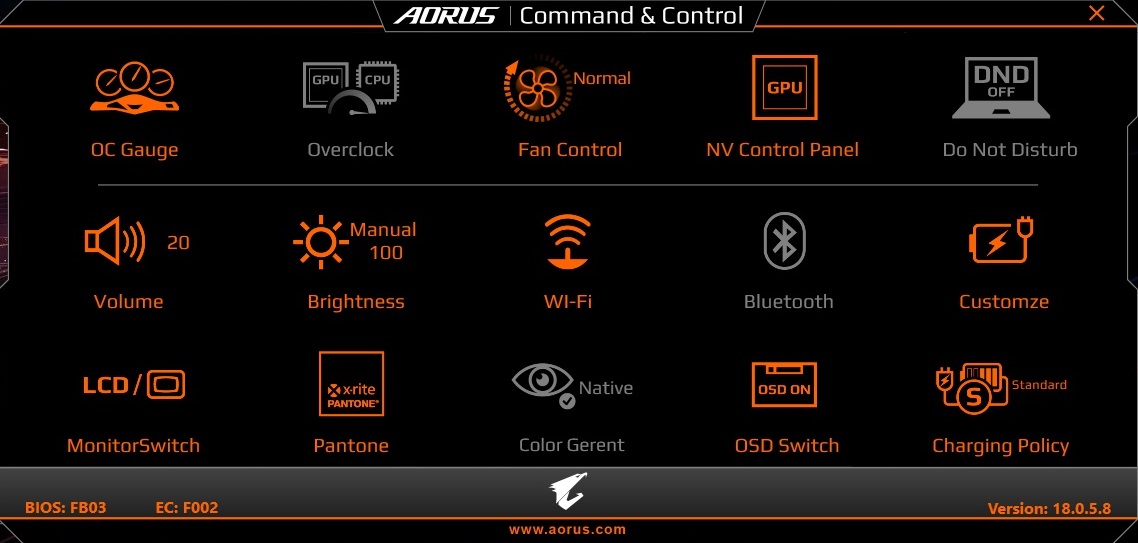
The X7 DT v8 packs plenty of useful manufacturer software, which benefits performance. There is Command & Control, which includes numerous features that are clearly laid out. Additionally, Gigabyte includes a CPU and GPU overclocking utility that we disabled during our tests. There are also several fan modes that range from “Quiet” to “Gaming”.
We set our test device to “Normal” for the purposes of our tests.
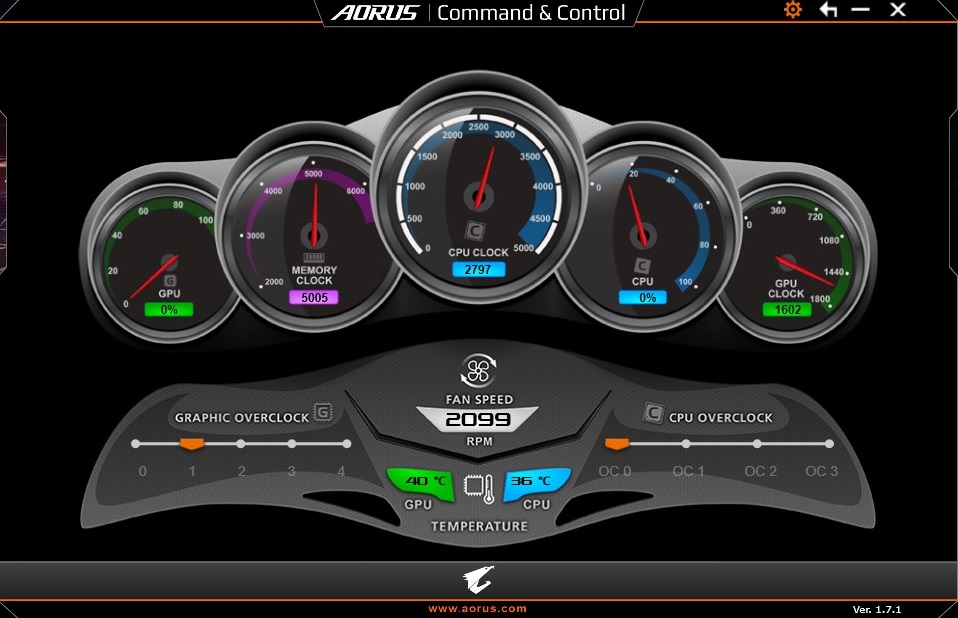
For some reason, the energy-saving options are currently rather buggy. Setting the Windows Power mode to Balanced fixes the CPU clock speed at 2.8 GHz, but this bug is overcome by using Gigabyte’s power settings. We also used the Command & Control utility to adjust settings during our tests.
Processor
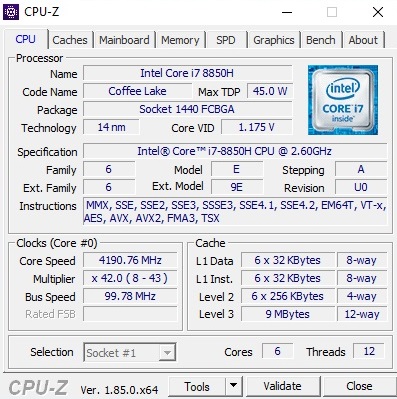
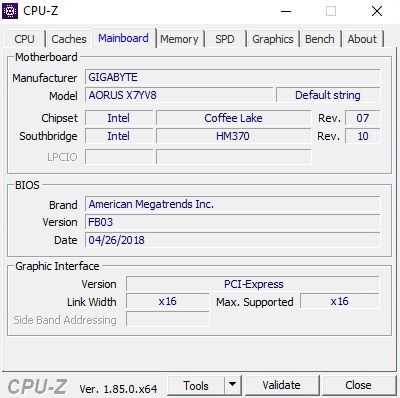
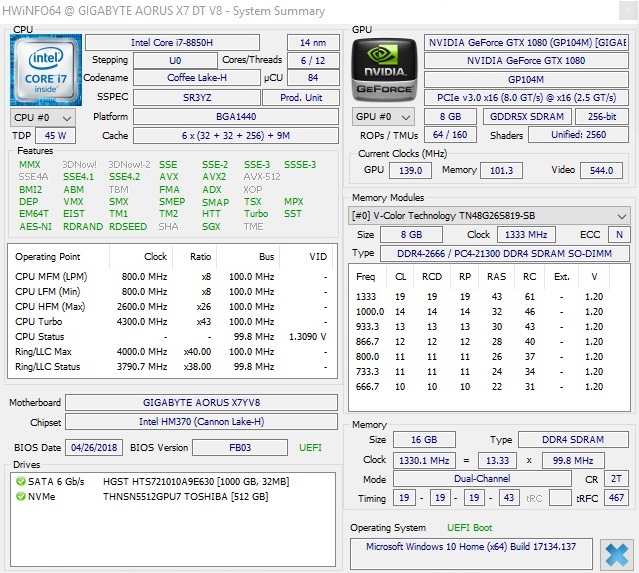
The X7 DT v8 is equipped with an Intel Core i7-8850H processor, which is almost a temporary solution between the release of the Intel Core i7-8750H and the release of the more powerful Intel Core i9-8950HK.
The Core i7-8850H is a Coffee Lake hexa-core CPU with a 2.6 GHz base clock speed that supports Hyper-Threading and Turbo Boost. This means that the CPU can execute up to 12 application threads simultaneously and can clock up to 4.3 GHz when required.
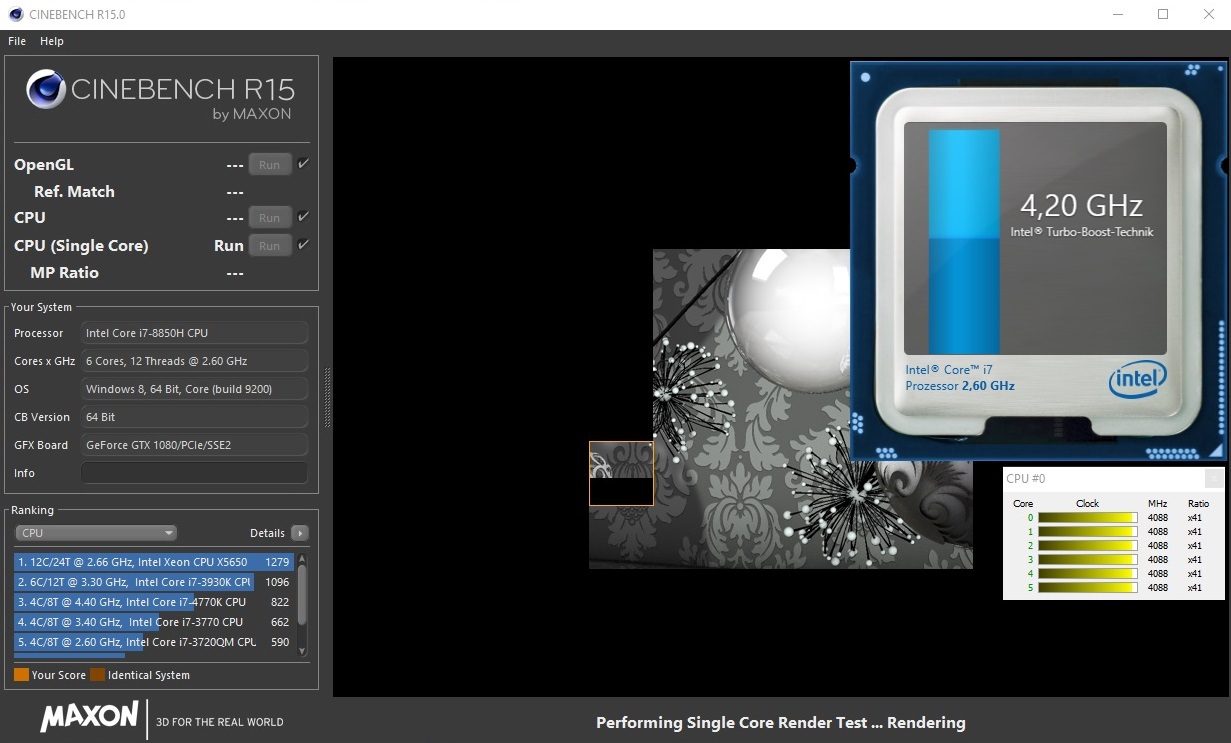
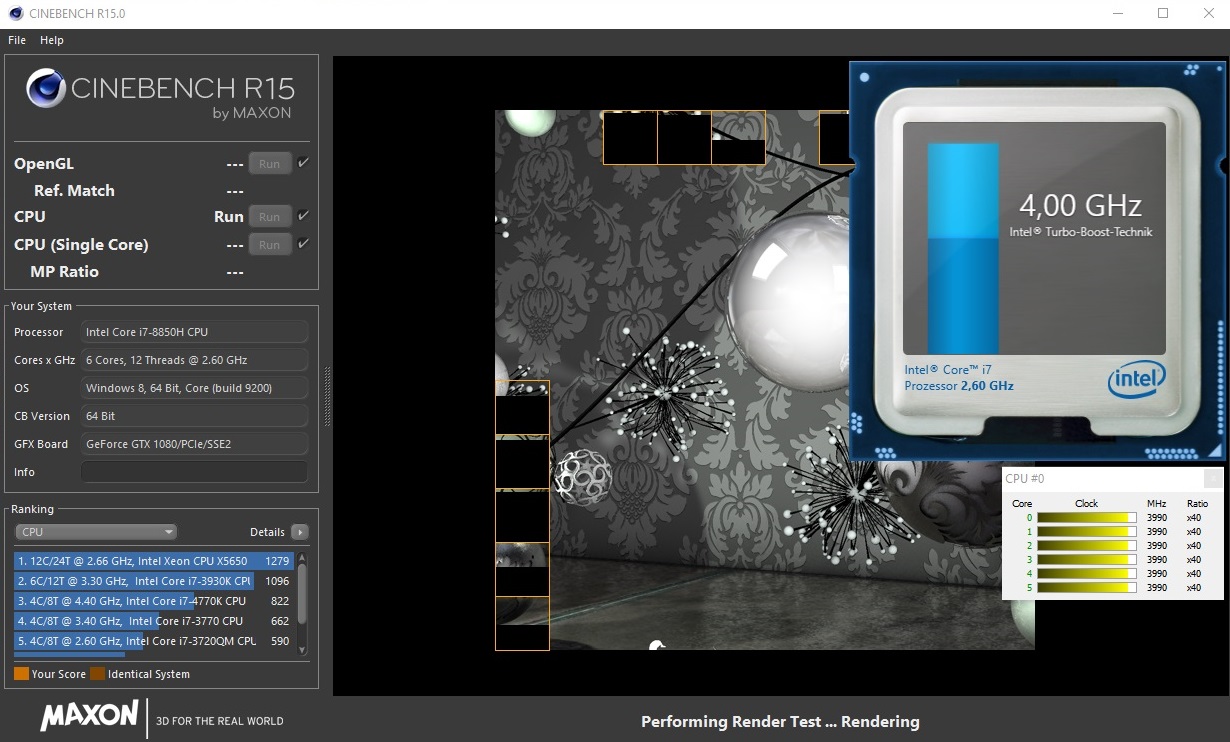
The X7 DT v8 is faster than all our comparison devices in CPU benchmarks. Our test device averaged 1,276 points in Cinebench R15 multi-core benchmarks, which is significantly higher than much of the competition. The X7 DT v8 is 10% faster than our best comparison device, which is the MSI GE73 with its Core i7-8750H processor. The difference between the Core i7-8850H and the Core i7-7820HK is much clearer though, with our test device scoring between 47% and 65% faster than its Core i7-7820HK-powered counterparts. The Core i7-6820HK and Core i7-7700HQ are far behind the Core i7-8750H too, with the latter outscoring them by 53% and 74%, respectively.
The X7 DT v8 has comparatively impressive Turbo Boost performance too. Our test device maintained around 4.0 GHz throughout our CPU benchmarks. By contrast, CPU performance in other Coffee Lake-powered notebooks typically drops by more than 10% after 30 minutes of CPU benchmarks.
System Performance
The premium hardware helps the X7 DT v8 to score highly in our system performance benchmarks. While our test device scored 1% and 21% less in PCMark 10 than the Schenker XMG Pro 17 and the MSI GE73 respectively, it is a clear winner in PCMark 8.
| PCMark 10 - Score | |
| Average of class Gaming (5828 - 12414, n=93, last 2 years) | |
| MSI GE73 8RF-008 Raider RGB | |
| Schenker XMG Pro 17 | |
| Aorus X7 DT v8 | |
| Razer Blade Pro 2017 | |
| PCMark 8 - Home Score Accelerated v2 | |
| Aorus X7 DT v8 | |
| Average of class Gaming (n=1last 2 years) | |
| Aorus X7 DT v6 | |
| Alienware 17 R4 | |
| Razer Blade Pro 2017 | |
| MSI GE73 8RF-008 Raider RGB | |
| Schenker XMG Pro 17 | |
| PCMark 8 Home Score Accelerated v2 | 5779 points | |
| PCMark 10 Score | 4524 points | |
Help | ||
Storage Devices
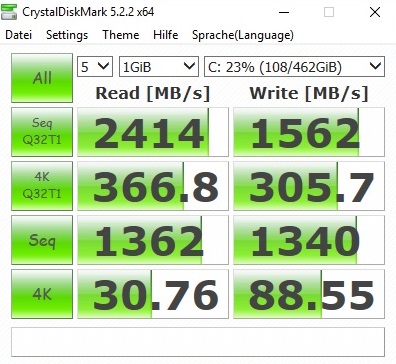
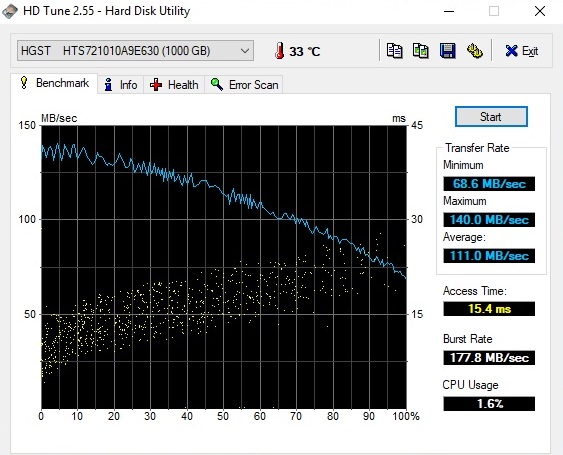
Our test device is equipped with a 512 GB Toshiba THNSN5512GPU7 M.2-2280 NVMe SSD and a 1 TB HGST Travelstar 7K1000 7,200 RPM HDD. Our test device achieved 2,182 MB/s sequential read and 1,341 MB/s sequential write speeds in AS SSD benchmarks.
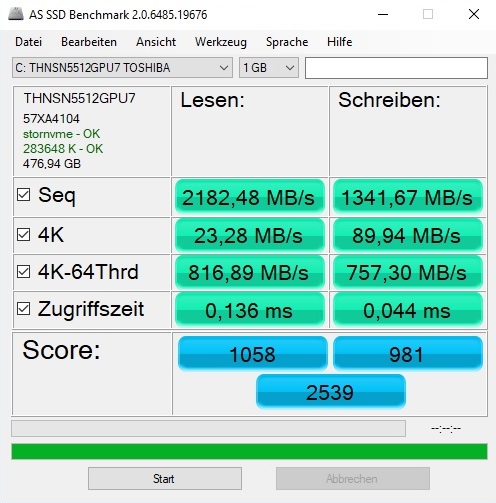
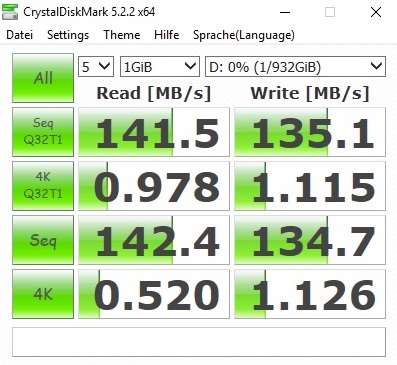
This is much faster than the MSI GE73 8RF, which uses a slower SATA III SSD. However, the Toshiba NVMe SSD cannot compete in benchmarks with its Samsung-made competitors like the SM951 or the 960 EVO.
Alternatively, you could use the 1 TB HDD if storage runs low on the 512 GB SSD. The 1 TB HDD will be a lot slower than the SSD in daily use, so you will see better system performance if you primarily store things on the SSD rather than the HDD.
| Aorus X7 DT v8 Toshiba NVMe THNSN5512GPU7 | Aorus X7 DT v6 Samsung SM951 MZVPV512HDGL m.2 PCI-e | Razer Blade Pro 2017 2x Samsung SSD PM951 MZVLV256HCHP (RAID 0) | Alienware 17 R4 SK Hynix PC300 NVMe 512 GB | Schenker XMG Pro 17 Samsung SSD 960 Evo 500GB m.2 NVMe | MSI GE73 8RF-008 Raider RGB Toshiba HG6 THNSNJ256G8NY | |
|---|---|---|---|---|---|---|
| AS SSD | 26% | 7% | -5% | 57% | -63% | |
| Seq Read (MB/s) | 2182 | 1971 -10% | 2599 19% | 1752 -20% | 2746 26% | 511 -77% |
| Seq Write (MB/s) | 1342 | 1494 11% | 588 -56% | 735 -45% | 1673 25% | 425.7 -68% |
| 4K Read (MB/s) | 23.28 | 48.93 110% | 37.57 61% | 35.61 53% | 45.58 96% | 14.07 -40% |
| 4K Write (MB/s) | 89.9 | 149.1 66% | 104.4 16% | 113.4 26% | 154.2 72% | 38.34 -57% |
| Score Read (Points) | 1058 | 1353 28% | 1414 34% | 831 -21% | 1711 62% | 417 -61% |
| Score Write (Points) | 981 | 665 -32% | 676 -31% | 858 -13% | 1558 59% | 254 -74% |
| Score Total (Points) | 2539 | 2695 6% | 2715 7% | 2072 -18% | 4093 61% | 881 -65% |

Graphics Card
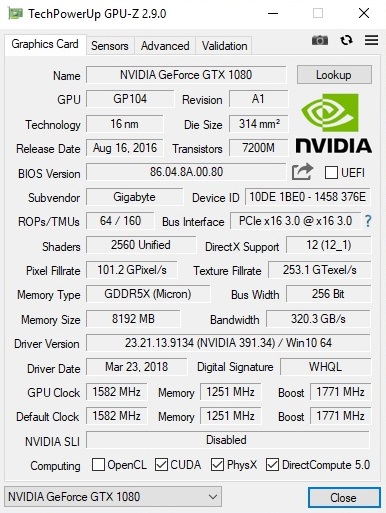
The X7 DT v8 is equipped with an Nvidia GeForce GTX 1080, which is currently the most powerful consumer laptop GPU on the market. The GPU has 2,560 shader units, 8 GB GDDR5X RAM and supports DirectX 12.
Our test device performs similarly to other GTX 1080-equipped laptops in benchmarks, with 3DMark Fire Strike and 3DMark 11 throwing up no surprises.
| 3DMark - 1920x1080 Fire Strike Graphics | |
| Average of class Gaming (18629 - 62849, n=112, last 2 years) | |
| Aorus X7 DT v6 | |
| Alienware 17 R4 | |
| Aorus X7 DT v8 | |
| Razer Blade Pro 2017 | |
| MSI GE73 8RF-008 Raider RGB | |
| Schenker XMG Pro 17 | |
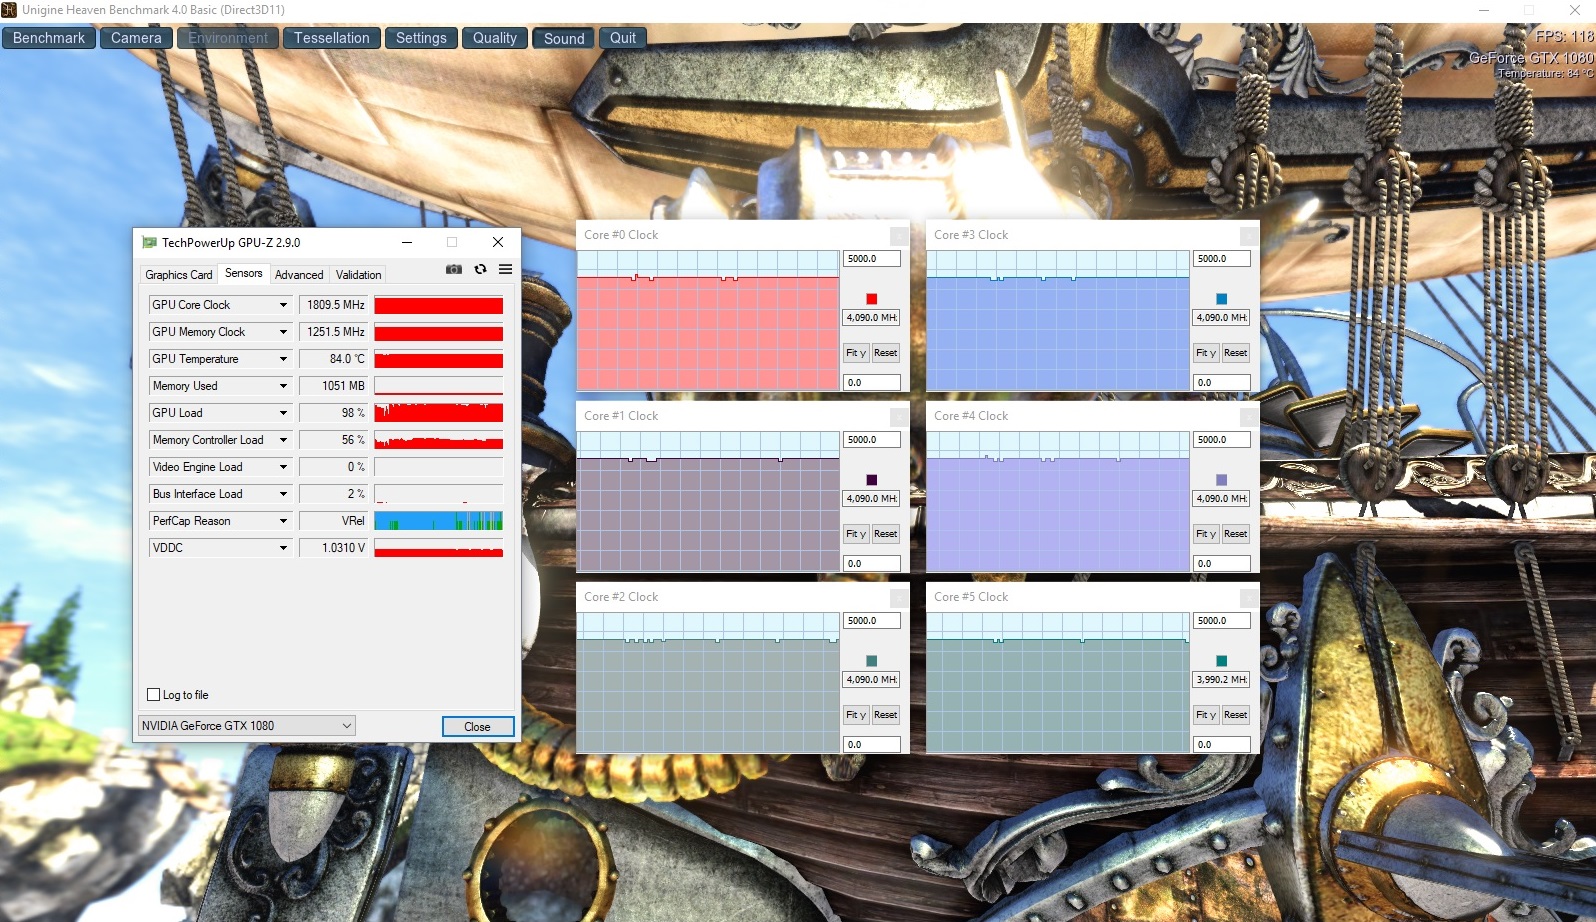
The GTX 1080 has a 1,582 MHz base clock speed that can increase up to 1,896 MHz when required. Our test device performed well in GPU benchmarks, with the GPU maintaining a 1,810 MHz clock speed in Unigine Heaven 4.0 benchmark.
| 3DMark 11 Performance | 20577 points | |
| 3DMark Ice Storm Standard Score | 177420 points | |
| 3DMark Cloud Gate Standard Score | 39020 points | |
| 3DMark Fire Strike Score | 18006 points | |
Help | ||
3D performance over an extended period is fine too. Our test device can play The Witcher 3 for an hour at 1920x1080 in full details without a problem; the CPU and GPU maintained their boost clock speeds throughout this test.
Gaming Performance
The X7 DT v8 makes good use of its 144 Hz display. Our test device easily runs every game against which we tested it in 1920x1080 at maximum details.
Our test device regularly exceeded 100 FPS in games, which looks smooth on the 144 Hz display. The only game that maintains 60 FPS is The Crew 2. However, this game has a 60 FPS lock, so feasibly the X7 DT v8 could run the game at a higher FPS if this limitation was removed by the developers.
| The Witcher 3 - 1920x1080 Ultra Graphics & Postprocessing (HBAO+) | |
| Average of class Gaming (104.7 - 240, n=7, last 2 years) | |
| Alienware 17 R4 | |
| Aorus X7 DT v8 | |
| Razer Blade Pro 2017 | |
| MSI GE73 8RF-008 Raider RGB | |
| Schenker XMG Pro 17 | |
The X7 DT v8 also supports Nvidia G-Sync, which ensures that games play smoothly and without screen tearing. The device does not support Nvidia Optimus technology though, which would allow the system to switch between the low-power Intel UHD Graphics 630 and the GTX 1080-dedicated GPU. Optimus technology allows systems with Nvidia GPUs to draw less power when they do not need it.
| low | med. | high | ultra | |
|---|---|---|---|---|
| The Witcher 3 (2015) | 141 | 71.4 | ||
| The Division (2016) | 128 | 100 | ||
| Mirror's Edge Catalyst (2016) | 130 | 121 | ||
| Battlefield 1 (2016) | 156 | 141 | ||
| Dishonored 2 (2016) | 115 | 96.4 | ||
| Watch Dogs 2 (2016) | 104 | 72.8 | ||
| Destiny 2 (2017) | 165 | 144 | ||
| The Crew 2 (2018) | 60 | 60 |
Emissions
Fan Noise
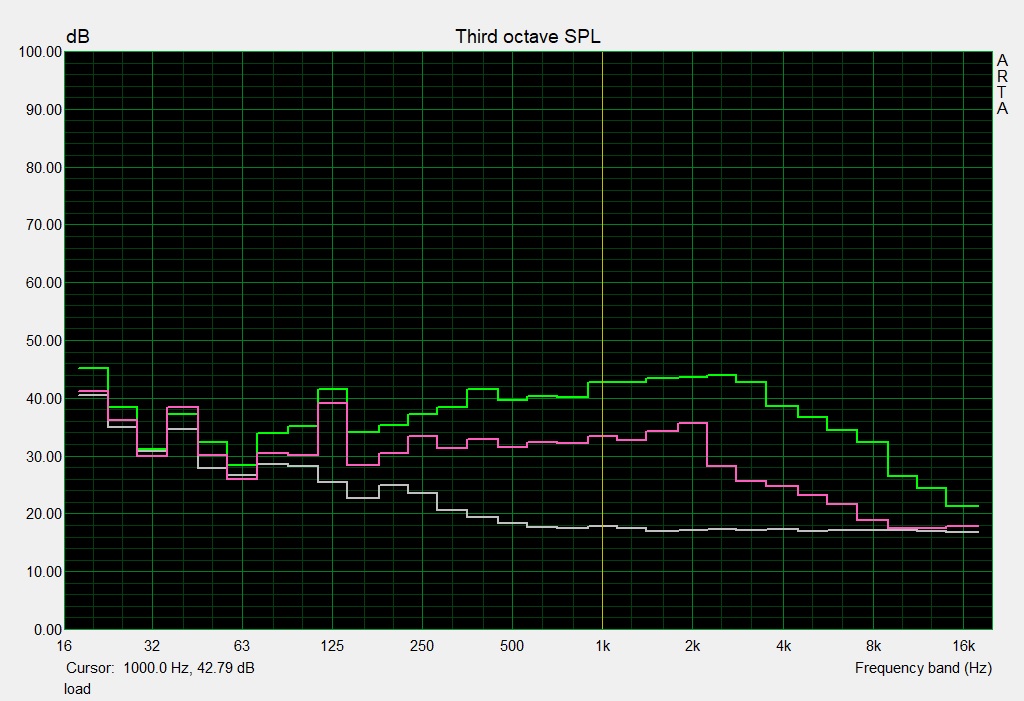
Typically, the X7 DT v8 gets very loud when gaming. While our test device achieved a relatively modest 43 dB(A) in 3DMark06, fan noise reached 53 dB(A) in The Witcher 3 and a maximum of 54 dB(A).
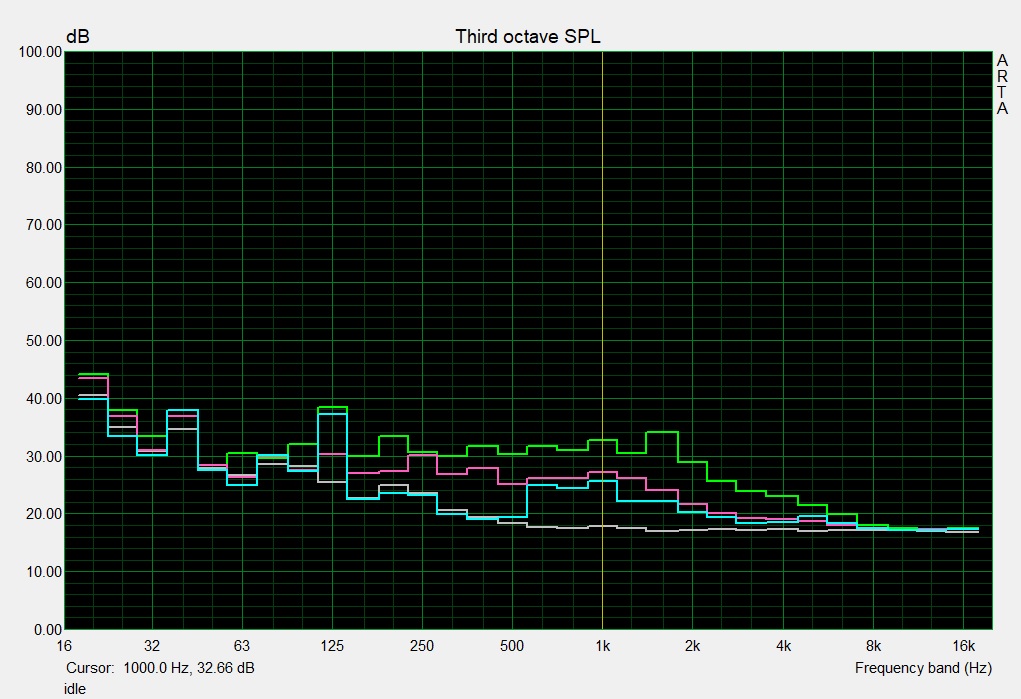
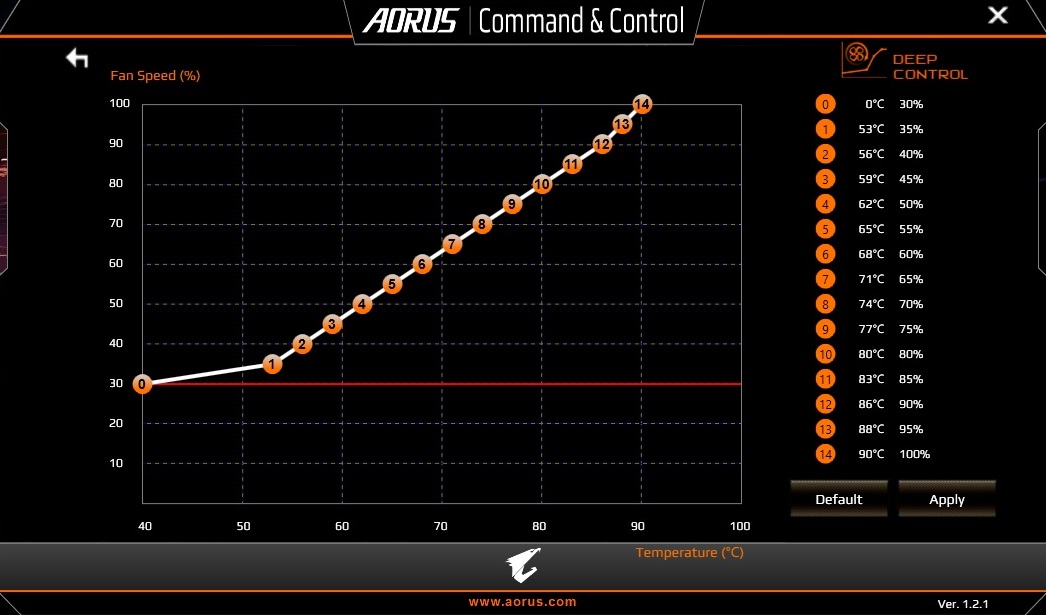
Fan noise is relatively loud at idle too, with our test device averaging 36 dB(A) and reaching a maximum of 41 dB(A). You could set the fan to Quiet for a quieter experience, or even manually control the fan within the Deep Control utility.
Overall, the fan noise is comparable to many other gaming laptops, but it is significantly louder than slimmer devices.
Noise level
| Idle |
| 35 / 36 / 41 dB(A) |
| HDD |
| 33 dB(A) |
| Load |
| 43 / 54 dB(A) |
 | ||
30 dB silent 40 dB(A) audible 50 dB(A) loud |
||
min: | ||
| Aorus X7 DT v8 GeForce GTX 1080 Mobile, i7-8850H | Aorus X7 DT v6 GeForce GTX 1080 Mobile, 6820HK | Razer Blade Pro 2017 GeForce GTX 1080 Mobile, i7-7820HK | Alienware 17 R4 GeForce GTX 1080 Mobile, i7-7820HK | Schenker XMG Pro 17 GeForce GTX 1070 Mobile, i7-7700HQ | MSI GE73 8RF-008 Raider RGB GeForce GTX 1070 Mobile, i7-8750H | Average of class Gaming | |
|---|---|---|---|---|---|---|---|
| Noise | 0% | 5% | 1% | 2% | 6% | 15% | |
| off / environment * (dB) | 29 | 28.6 1% | 30 -3% | 28.2 3% | 29 -0% | 30 -3% | 24.1 ? 17% |
| Idle Minimum * (dB) | 35 | 32.2 8% | 30 14% | 35.6 -2% | 32 9% | 32 9% | 25.9 ? 26% |
| Idle Average * (dB) | 36 | 35.2 2% | 31 14% | 35.6 1% | 33 8% | 33 8% | 27.4 ? 24% |
| Idle Maximum * (dB) | 41 | 35.2 14% | 33 20% | 35.7 13% | 35 15% | 34 17% | 30.1 ? 27% |
| Load Average * (dB) | 43 | 51.7 -20% | 43 -0% | 50.2 -17% | 50 -16% | 41 5% | 43.7 ? -2% |
| Witcher 3 ultra * (dB) | 53 | 55 -4% | 50.2 5% | 52 2% | 50 6% | ||
| Load Maximum * (dB) | 54 | 55.7 -3% | 58 -7% | 50.2 7% | 56 -4% | 54 -0% | 54.3 ? -1% |
* ... smaller is better
Temperature
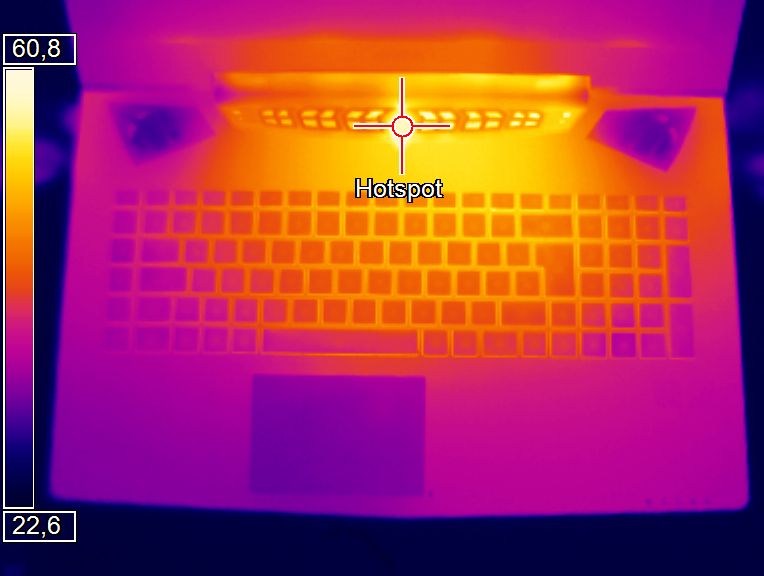
The X7 DT v8 is a very hot device under load. Our test device reached a maximum of 51 °C on the top case and 63 °C on the bottom case under maximum load. Maximum surface temperatures were slightly lower when playing The Witcher 3 at 47 °C and 59 °C, respectively, but these are hot nonetheless. Surface temperatures averaged 45.2 °C during The Witcher 3 and 48.7 °C under maximum load, but these are both too hot for gaming with the device on your lap.
Idle temperatures are much better though, with our test device averaging 26.3 °C on its top case and 26.8 °C on the bottom case. Maximum surface temperatures at idle are marginally higher too at 27 °C and 28 °C, respectively.
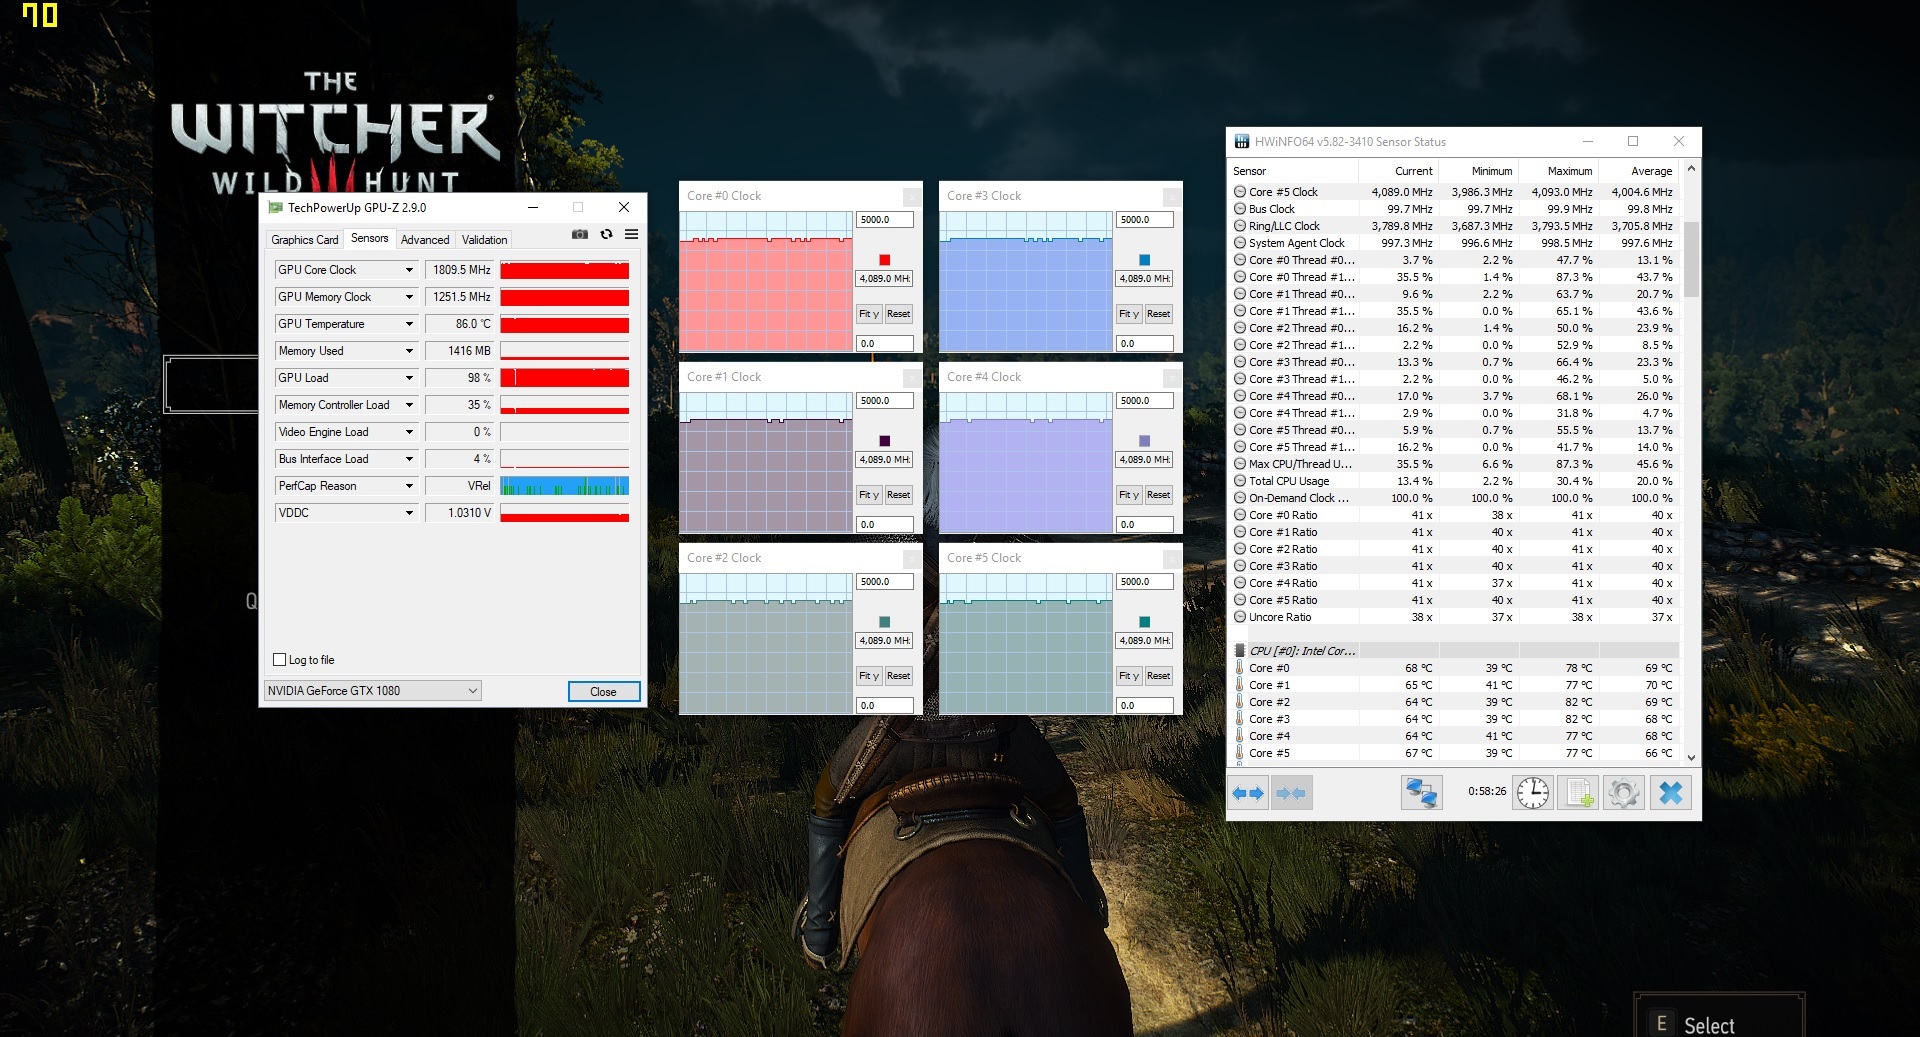
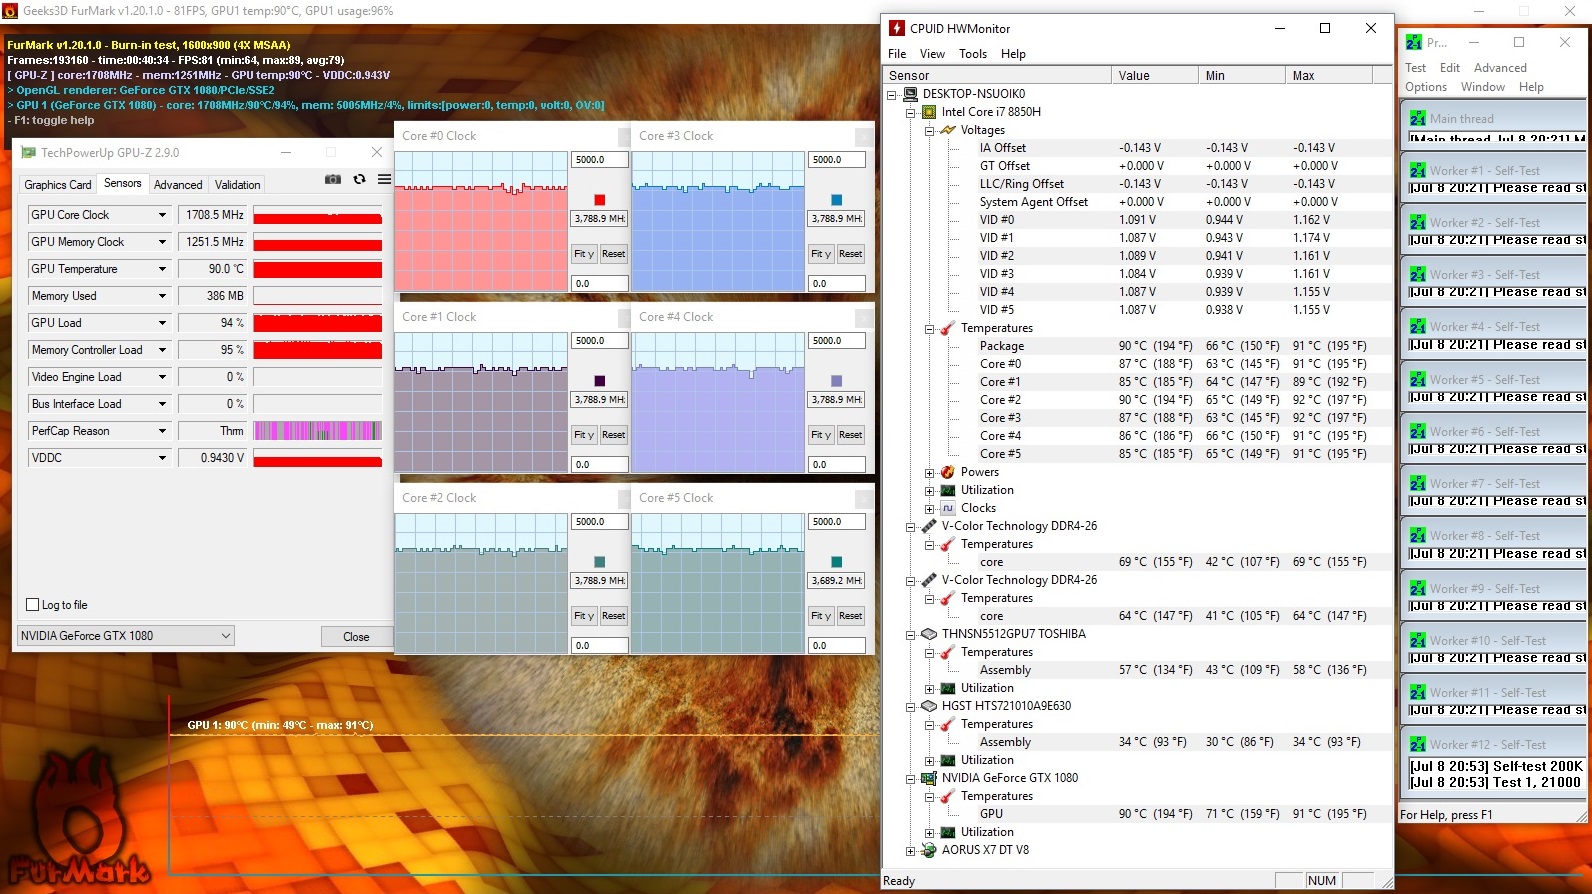
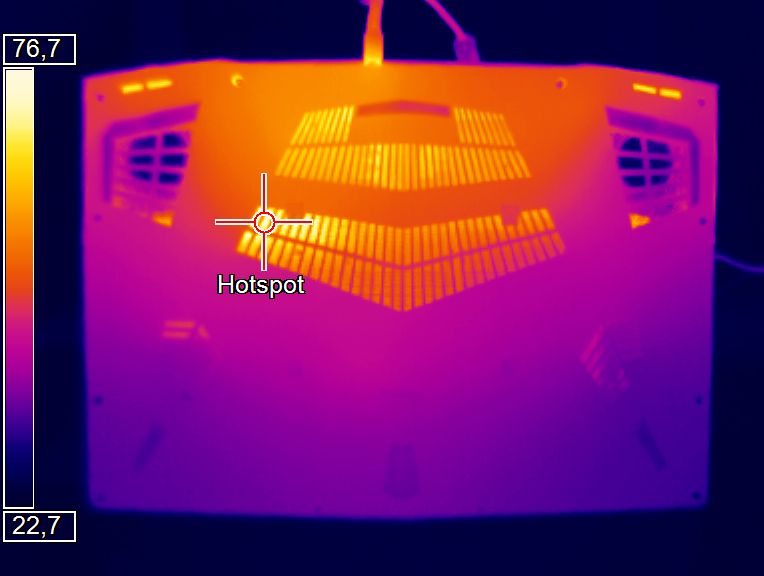
Internal temperatures are hotter still but without thermal throttling. The CPU and GPU core temperatures sat at just below 90 °C during our 60-minute combined FurMark and Prime95 stress test.
(-) The maximum temperature on the upper side is 51 °C / 124 F, compared to the average of 40.4 °C / 105 F, ranging from 21.2 to 68.8 °C for the class Gaming.
(-) The bottom heats up to a maximum of 63 °C / 145 F, compared to the average of 43.2 °C / 110 F
(+) In idle usage, the average temperature for the upper side is 26.3 °C / 79 F, compared to the device average of 33.9 °C / 93 F.
(-) Playing The Witcher 3, the average temperature for the upper side is 41.2 °C / 106 F, compared to the device average of 33.9 °C / 93 F.
(±) The palmrests and touchpad can get very hot to the touch with a maximum of 39 °C / 102.2 F.
(-) The average temperature of the palmrest area of similar devices was 28.8 °C / 83.8 F (-10.2 °C / -18.4 F).
| Aorus X7 DT v8 GeForce GTX 1080 Mobile, i7-8850H | Aorus X7 DT v6 GeForce GTX 1080 Mobile, 6820HK | Razer Blade Pro 2017 GeForce GTX 1080 Mobile, i7-7820HK | Alienware 17 R4 GeForce GTX 1080 Mobile, i7-7820HK | Schenker XMG Pro 17 GeForce GTX 1070 Mobile, i7-7700HQ | MSI GE73 8RF-008 Raider RGB GeForce GTX 1070 Mobile, i7-8750H | Average of class Gaming | |
|---|---|---|---|---|---|---|---|
| Heat | 5% | -13% | 0% | 4% | -3% | -0% | |
| Maximum Upper Side * (°C) | 51 | 45.4 11% | 53 -4% | 49.6 3% | 55 -8% | 47 8% | 45.1 ? 12% |
| Maximum Bottom * (°C) | 63 | 58.2 8% | 53 16% | 56 11% | 56 11% | 49 22% | 48.1 ? 24% |
| Idle Upper Side * (°C) | 27 | 27.4 -1% | 35 -30% | 29.6 -10% | 25 7% | 32 -19% | 31 ? -15% |
| Idle Bottom * (°C) | 28 | 27.2 3% | 37 -32% | 29.2 -4% | 26 7% | 34 -21% | 34.2 ? -22% |
* ... smaller is better
Speakers
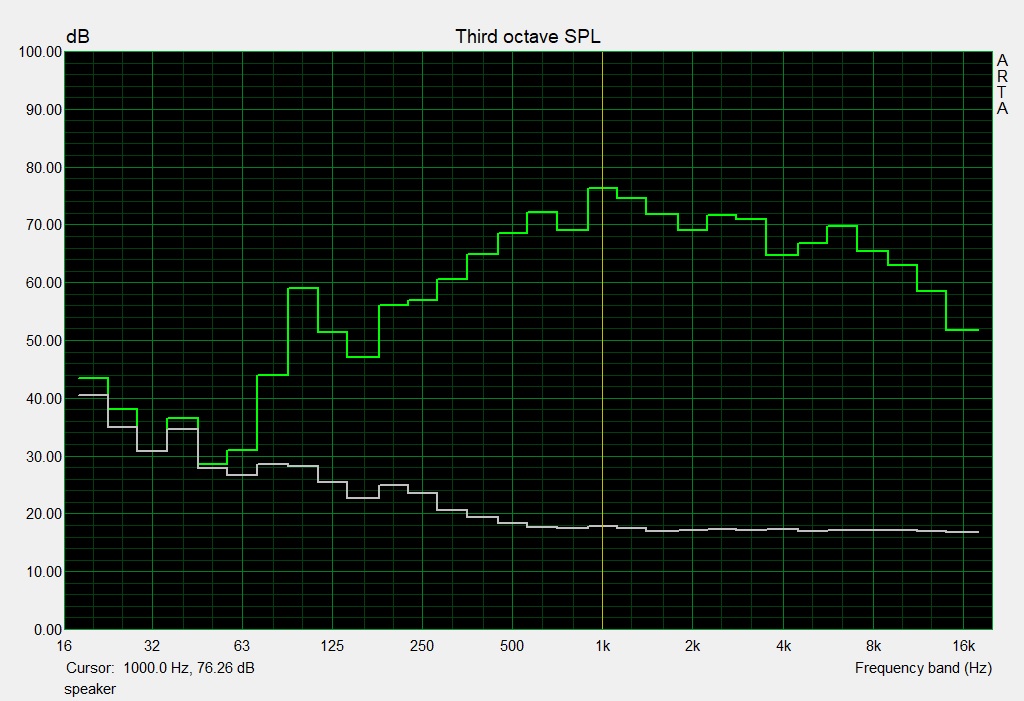
Aorus X7 DT v8 audio analysis
(+) | speakers can play relatively loud (83 dB)
Bass 100 - 315 Hz
(±) | reduced bass - on average 10.2% lower than median
(±) | linearity of bass is average (14.1% delta to prev. frequency)
Mids 400 - 2000 Hz
(±) | higher mids - on average 5.6% higher than median
(±) | linearity of mids is average (7.7% delta to prev. frequency)
Highs 2 - 16 kHz
(+) | balanced highs - only 3% away from median
(+) | highs are linear (6.3% delta to prev. frequency)
Overall 100 - 16.000 Hz
(+) | overall sound is linear (14.4% difference to median)
Compared to same class
» 27% of all tested devices in this class were better, 8% similar, 66% worse
» The best had a delta of 6%, average was 18%, worst was 132%
Compared to all devices tested
» 18% of all tested devices were better, 4% similar, 78% worse
» The best had a delta of 4%, average was 23%, worst was 134%
Razer Blade Pro 2017 audio analysis
(+) | speakers can play relatively loud (83 dB)
Bass 100 - 315 Hz
(±) | reduced bass - on average 8.8% lower than median
(±) | linearity of bass is average (9% delta to prev. frequency)
Mids 400 - 2000 Hz
(+) | balanced mids - only 4.7% away from median
(+) | mids are linear (5.7% delta to prev. frequency)
Highs 2 - 16 kHz
(±) | reduced highs - on average 7.5% lower than median
(+) | highs are linear (6.4% delta to prev. frequency)
Overall 100 - 16.000 Hz
(±) | linearity of overall sound is average (17.1% difference to median)
Compared to same class
» 46% of all tested devices in this class were better, 12% similar, 42% worse
» The best had a delta of 6%, average was 18%, worst was 132%
Compared to all devices tested
» 31% of all tested devices were better, 8% similar, 61% worse
» The best had a delta of 4%, average was 23%, worst was 134%
Power Management
Power Consumption
The X7 DT v8 has high power consumption, as may be expected by its powerful hardware. Our test device consumes a minimum of 23 W at idle, which is considerably lower than other GTX 1080-powered devices but is higher than GTX 1070-powered competitors. We recorded a 37 W maximum power draw at idle, which is closer to other GTX 1080-powered devices than the minimum value. Overall, the X7 DT v8 consumes just over 10 W more than GTX 1070-powered devices.
As expected, power consumption ramps up under load. Our test device draws an average of 115 W under load, which can increase up to 281 W. This maximum value is higher than all our comparison devices and is higher than the included 265 W power supply. It is worth noting that the power supply provides 255 W to the notebook and uses 10 W for its USB port.
This maximum value should not be a problem for charging though as our test device consumed 225 W while playing The Witcher 3. This should mean that the device will not lose charge while gaming.
| Off / Standby | |
| Idle | |
| Load |
|
Key:
min: | |
| Aorus X7 DT v8 GeForce GTX 1080 Mobile, i7-8850H | Aorus X7 DT v6 GeForce GTX 1080 Mobile, 6820HK | Razer Blade Pro 2017 GeForce GTX 1080 Mobile, i7-7820HK | Alienware 17 R4 GeForce GTX 1080 Mobile, i7-7820HK | Schenker XMG Pro 17 GeForce GTX 1070 Mobile, i7-7700HQ | MSI GE73 8RF-008 Raider RGB GeForce GTX 1070 Mobile, i7-8750H | Average of class Gaming | |
|---|---|---|---|---|---|---|---|
| Power Consumption | -20% | -7% | -11% | 29% | 25% | 26% | |
| Idle Minimum * (Watt) | 23 | 31.5 -37% | 31 -35% | 37.5 -63% | 13 43% | 15 35% | 13.1 ? 43% |
| Idle Average * (Watt) | 33 | 33.9 -3% | 36 -9% | 37.6 -14% | 19 42% | 20 39% | 19 ? 42% |
| Idle Maximum * (Watt) | 37 | 34.6 6% | 44 -19% | 37.6 -2% | 26 30% | 26 30% | 24.6 ? 34% |
| Load Average * (Watt) | 115 | 205.6 -79% | 107 7% | 122.4 -6% | 95 17% | 97 16% | 111.3 ? 3% |
| Witcher 3 ultra * (Watt) | 225 | 212 6% | 180.3 20% | 179 20% | 186 17% | ||
| Load Maximum * (Watt) | 281 | 250.8 11% | 258 8% | 277.4 1% | 220 22% | 239 15% | 260 ? 7% |
* ... smaller is better
Battery Life
The X7 DT v8 has a 94 Wh battery, which is on par with other GTX 1080-powered devices. Despite this, our test device has only a mediocre battery life, potentially because of the lack of Nvidia Optimus graphics-switching technology.
Our test device lasted 3 h 48 m in our Wi-Fi battery test, during which we run a script that simulates the load required to render websites. We set the display brightness to 150 cd/m² for this test.
Battery runtimes are equally mediocre during our idle and load battery tests too. Our test device lasted for 4 h 56 m while idling with display brightness set to a minimum and Wi-Fi switched off. Likewise, the battery only lasted 80 minutes with the device operating at full load with the brightness set to maximum.
It is worth noting that gaming performance dropped by around 40% in The Witcher 3 when we were gaming on battery to when we were gaming on mains power.
| Aorus X7 DT v8 GeForce GTX 1080 Mobile, i7-8850H, 94.24 Wh | Aorus X7 DT v6 GeForce GTX 1080 Mobile, 6820HK, 94 Wh | Razer Blade Pro 2017 GeForce GTX 1080 Mobile, i7-7820HK, 99 Wh | Alienware 17 R4 GeForce GTX 1080 Mobile, i7-7820HK, 99 Wh | Schenker XMG Pro 17 GeForce GTX 1070 Mobile, i7-7700HQ, 66 Wh | MSI GE73 8RF-008 Raider RGB GeForce GTX 1070 Mobile, i7-8750H, 51 Wh | Average of class Gaming | |
|---|---|---|---|---|---|---|---|
| Battery runtime | -18% | -6% | -12% | 15% | -23% | 54% | |
| Reader / Idle (h) | 4.9 | 3 -39% | 4.2 -14% | 4.6 -6% | 6.6 35% | 5.1 4% | 7.84 ? 60% |
| WiFi v1.3 (h) | 3.8 | 2.4 -37% | 3.3 -13% | 3 -21% | 3.6 -5% | 3.1 -18% | 7.08 ? 86% |
| Load (h) | 1.3 | 1.6 23% | 1.4 8% | 1.2 -8% | 1.5 15% | 0.6 -54% | 1.496 ? 15% |
| H.264 (h) | 3.4 | 3.7 | 3.2 | 8.27 ? |
Verdict
Pros
Cons
The AORUS X7 DT v8 continues Gigabyte’s tradition of producing smartly designed and high-performance gaming laptops.
The X7 DT v8 scores well for its sturdy metal case, its decent selection of input devices and for its high-contrast, 144 Hz, and Full HD IPS display.
The combination of an Nvidia GeForce GTX 1080 GPU, a 144 Hz display and Nvidia G-Sync ensure a smooth gaming experience that few laptops can match. The hexa-core Intel Core i7-8850H processor should be plenty powerful for many years to come, while the 16 GB of DDR4 RAM and the NVMe SSD ensure that the X7 DT v8 has smooth system performance regardless of the application thrown at it.
These high performance components come at a cost to surface temperatures, fans noise and battery life. The X7 DT v8 feels hot to the touch under load, with fans getting correspondingly loud. This high power consumption and lack of graphics-switching technology results in mediocre battery life even with the huge 94 Wh battery. Speaker quality is second rate too and should be better, given the X7 DT v8’s price tag.
Overall, the AORUS X7 DT v8 is an excellent gaming laptop that will deservedly sit in our top 10 list. Gigabyte has done just enough for us to score the X7 DT v8 higher than both the GTX 1080-equipped Alienware 17 R4, and 4K Razer Blade Pro and the GTX 1070-equipped Schenker XMG Pro 17 and MSI GE73 8RF.
Aorus X7 DT v8
- 07/10/2018 v6 (old)
Florian Glaser
Price comparison

