Aorus RTX 2070 Gaming Box with Dell XPS 13 9380 Review
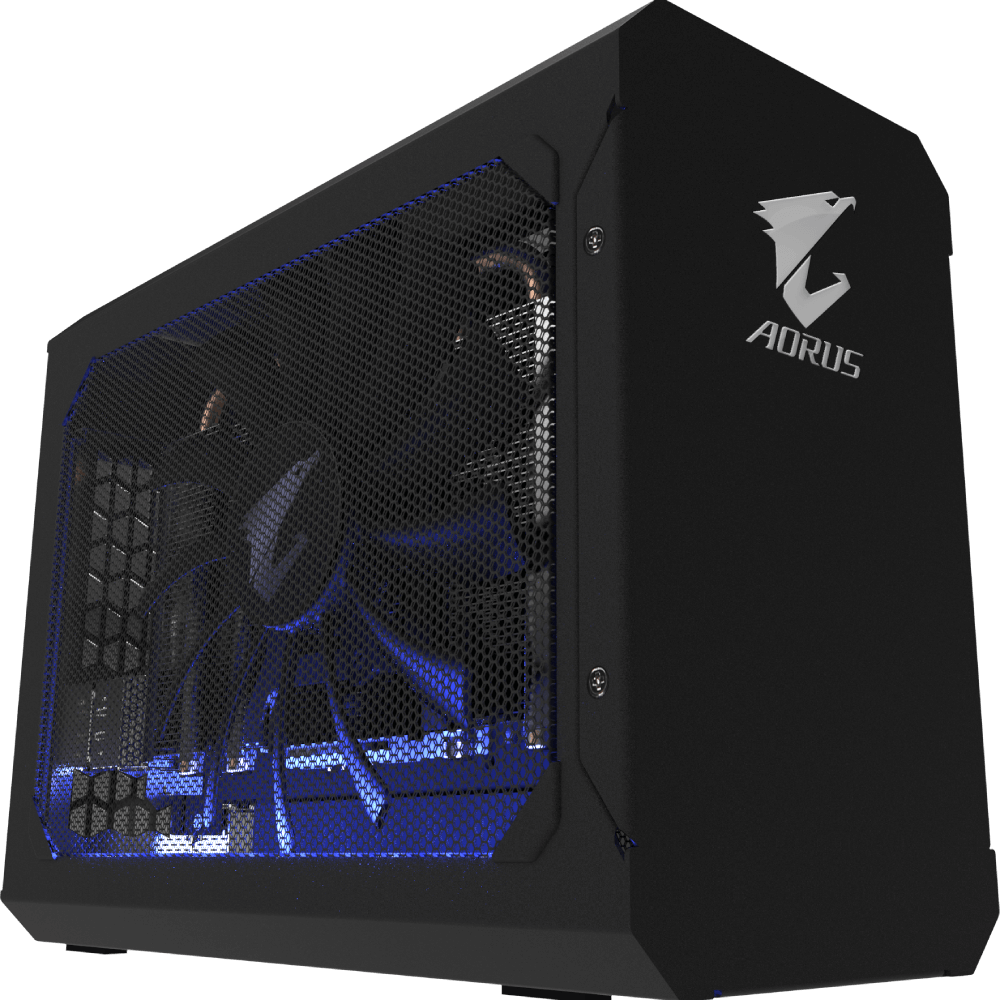
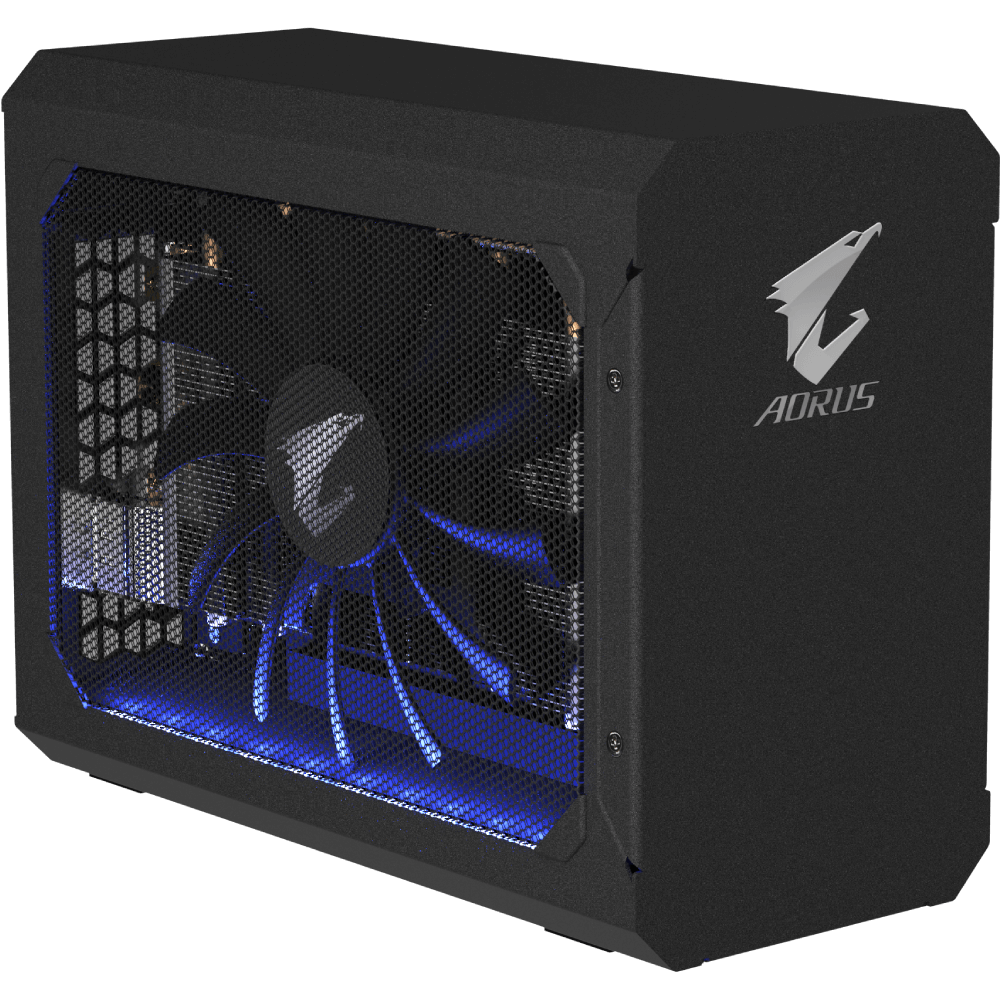
Last year's Aorus Gaming Box graphics dock offered GeForce GTX 1070 and GTX 1080 SKUs to transform any Thunderbolt 3-powered Windows 10 laptop into a mean gaming machine. This latest model swaps out the GTX GPU for an RTX 2070, but the compact chassis remains identical. As a result, we recommend checking out our existing review on the Gaming Box GTX 1080 for more information on the chassis and its features as our comments still apply here.
For the Gaming Box RTX 2070, we're here to answer the burning question: How does performance compare to a regular desktop RTX 2070? We'll be jumping straight into the benchmarks to show what this eGPU is capable of.
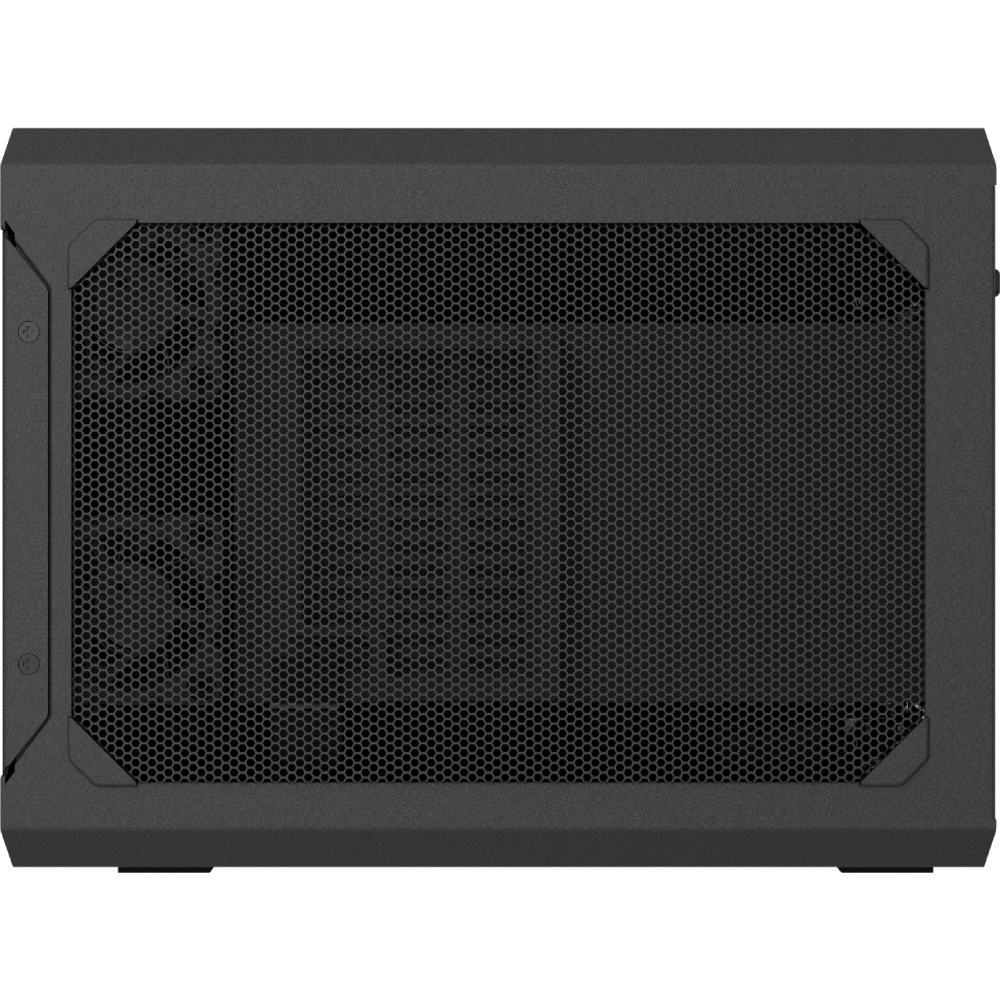
Case

Connectivity
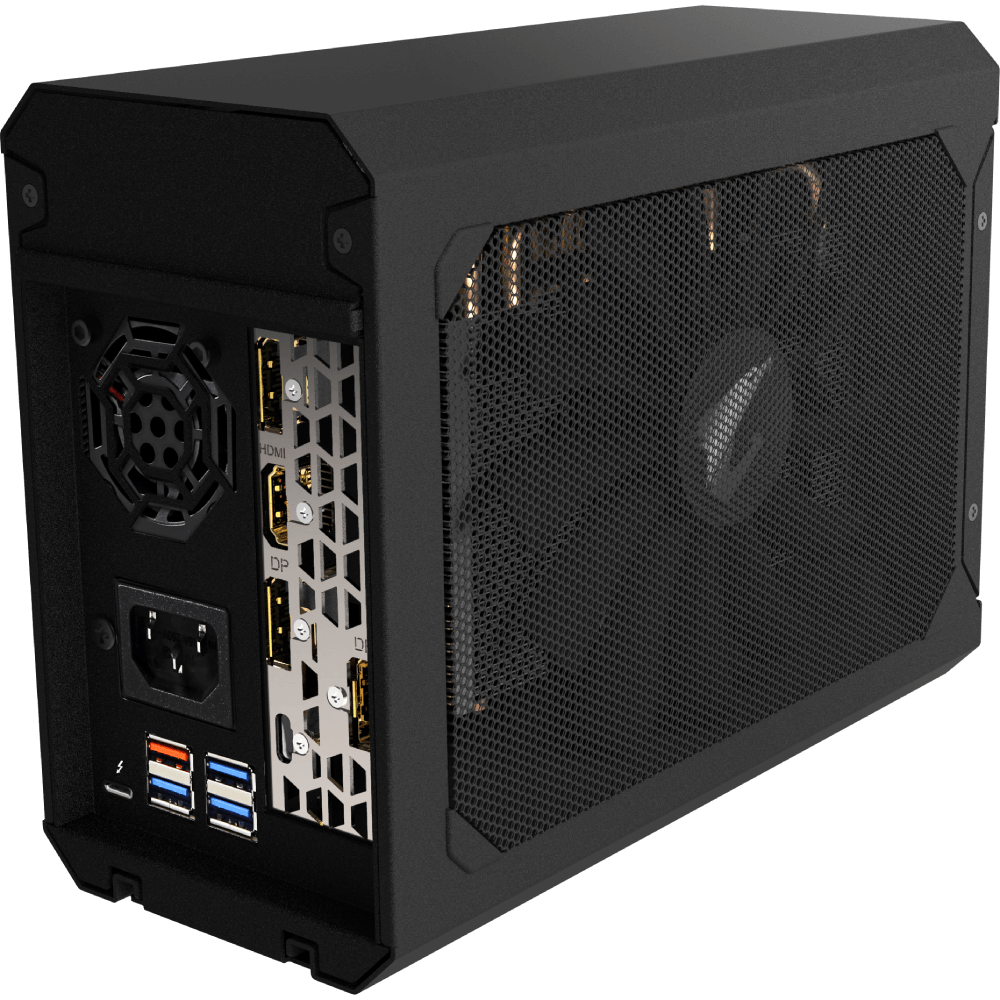
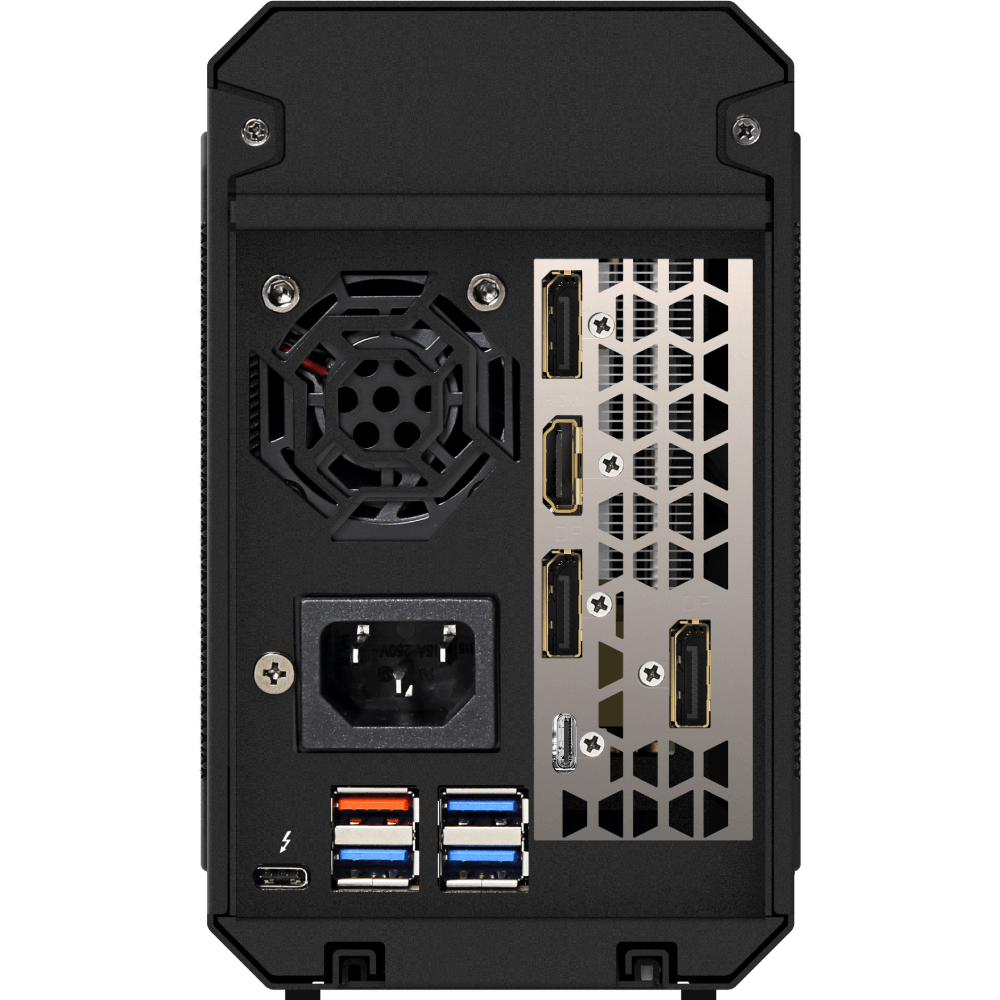
3x DisplayPort 1.4, 1x HDMI 2.0b, 4x USB 3.0, 1x USB-C (for VirtualLInk™), 1x Thunderbolt 3 (for connecting to PC). The DVI port on last year's model is now gone
Test Setup
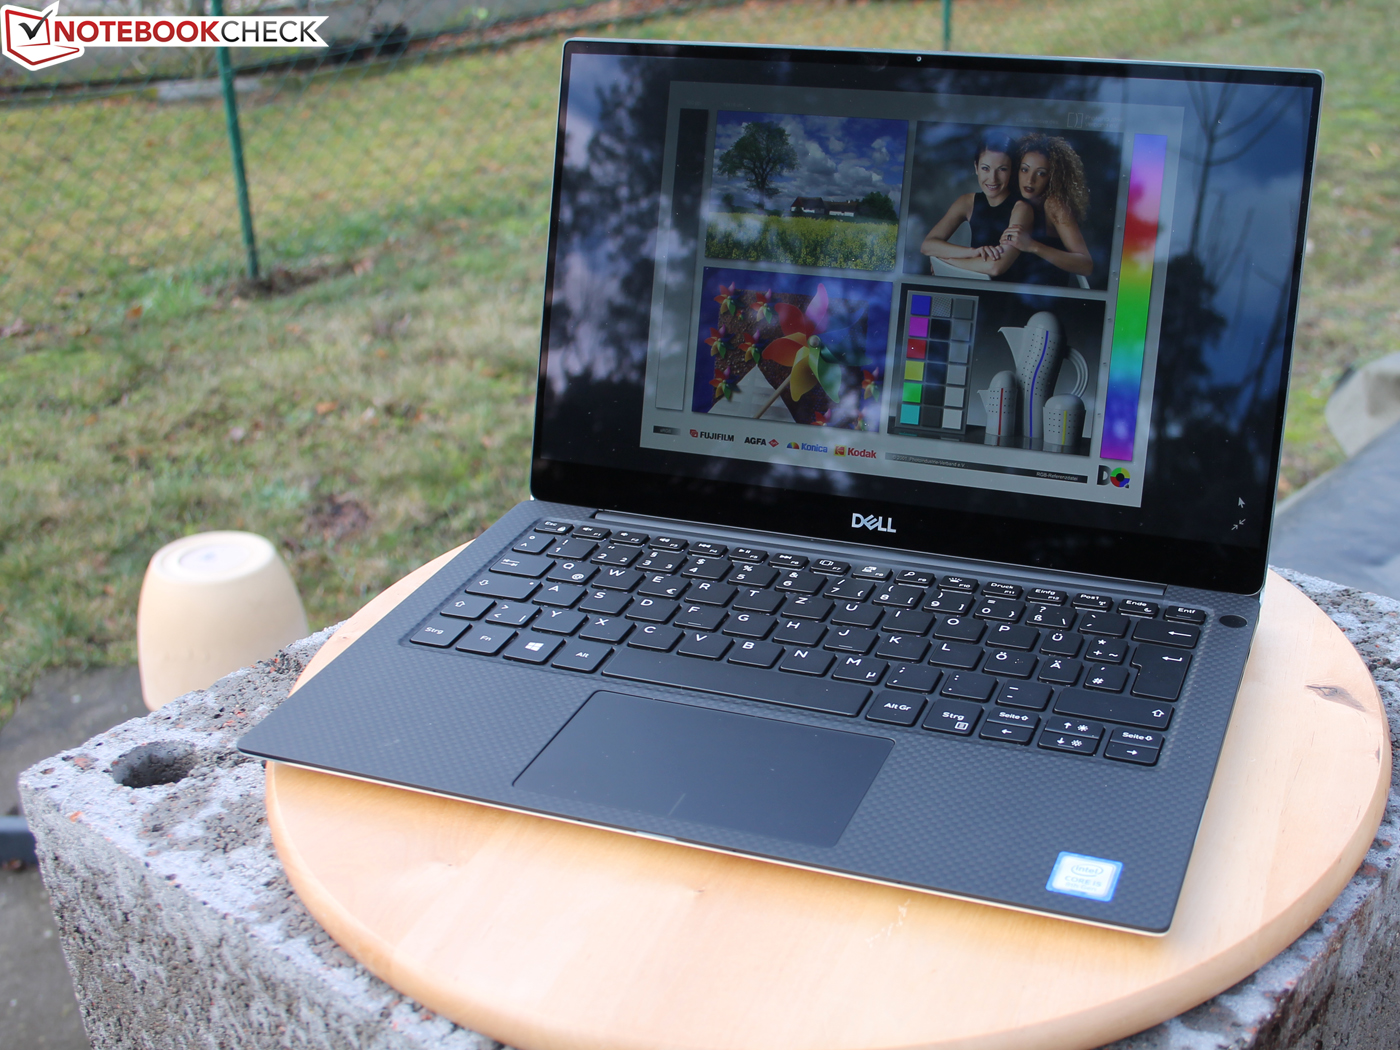
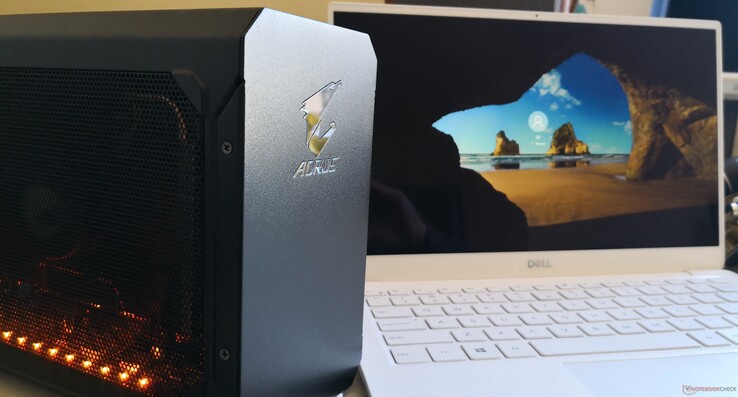
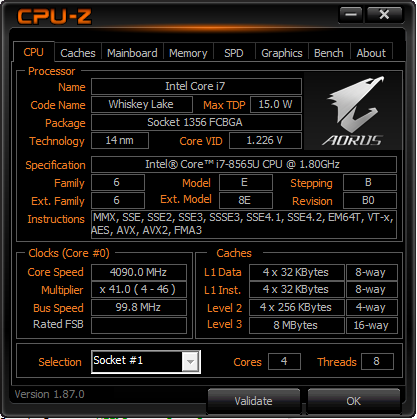
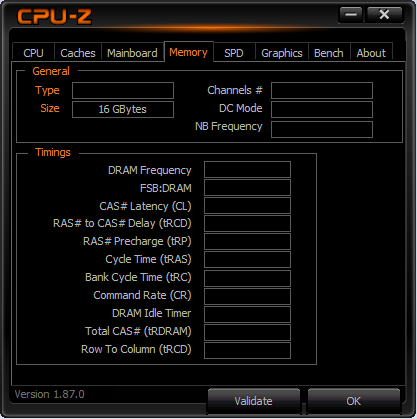
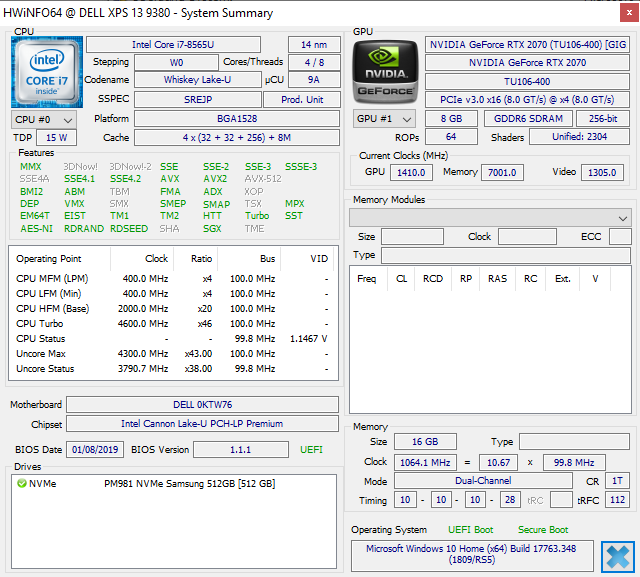
We paired last year's Gaming Box GTX 1080 with the Kaby Lake-G Dell XPS 15 9575 convertible. Instead of using another uncommon Ultrabook, we decided to go with the more popular XPS 13 9380 this time equipped with 16 GB of RAM and a quad-core Core i7-8565U CPU.
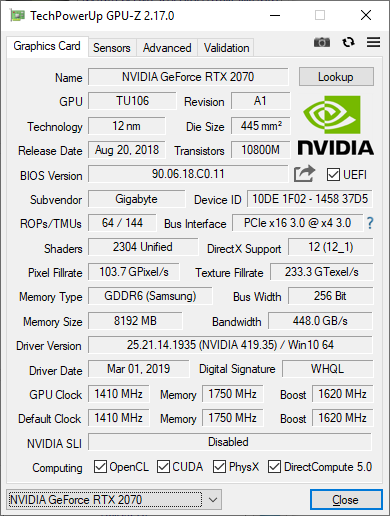
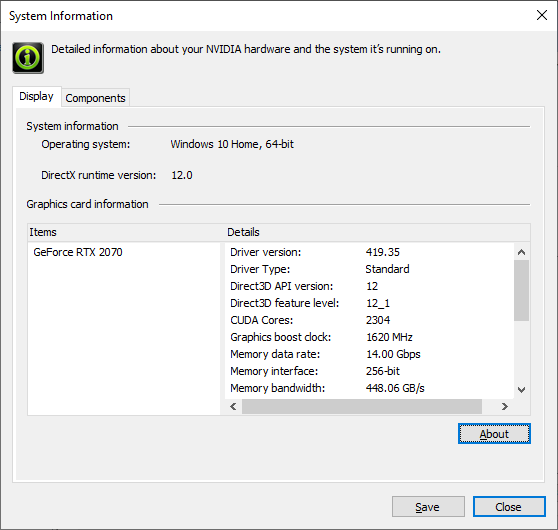
Setting up the Gaming Box is relatively straightforward. The Dell system automatically recognizes the external GPU once connected and the necessary drivers will be downloaded. Once installed, the system reboots and the Gaming Box will be ready to go. Note that the unit ships with an older Nvidia 416.34 driver which we had to manually update to 419.35. Furthermore, all our benchmarks below were performed on an external 1080p monitor as performance would have been significantly reduced if using the laptop display not unlike on the Razer Core. Initial setup takes no more than a few minutes, but do keep in mind that unplugging the Gaming Box before shutting down Windows will inevitably result in a crash.
Reliability is still somewhat finicky. Should a game fail to launch, crash, freeze, or need a soft system reboot, then the laptop may subsequently not recognize the eGPU dock. Disconnecting and then reconnecting the dock after another hard reboot fixes the problem. The eGPU concept still has a long way to go before it becomes truly "plug and play".
Performance
System Performance
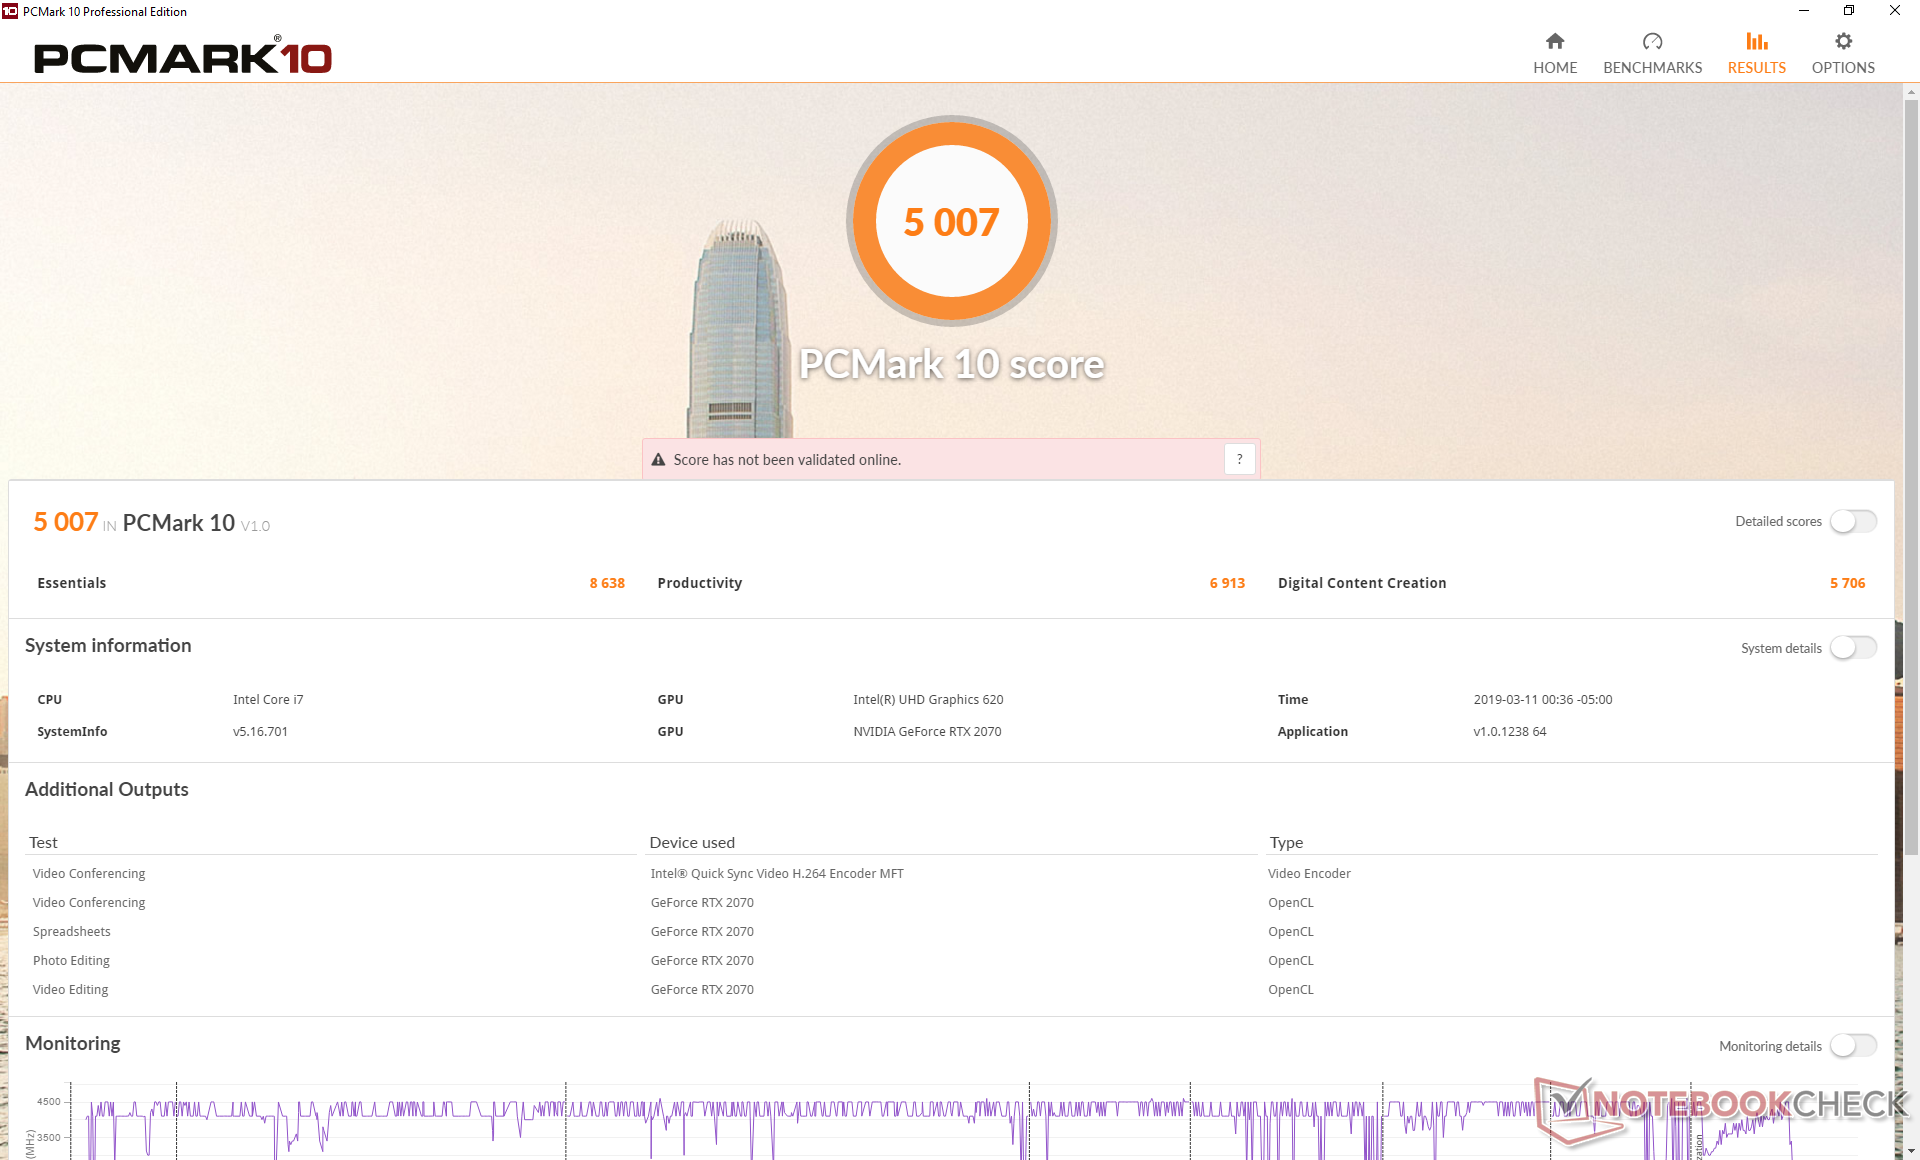
PCMark 10 Productivity and Essentials benchmarks are nearly identical to a lone XPS 13 without the Gaming Box docking station. Thus, the laptop won't actually feel any faster when web browsing or running common office applications. The difference is in Digital Content Creation where the eGPU can flex its muscles for video editing and graphics rendering. Our boosted XPS 13 lags behind the MSI GE75 with the same RTX 2070 GPU by only 7 percent in this particular case.
GPU Performance
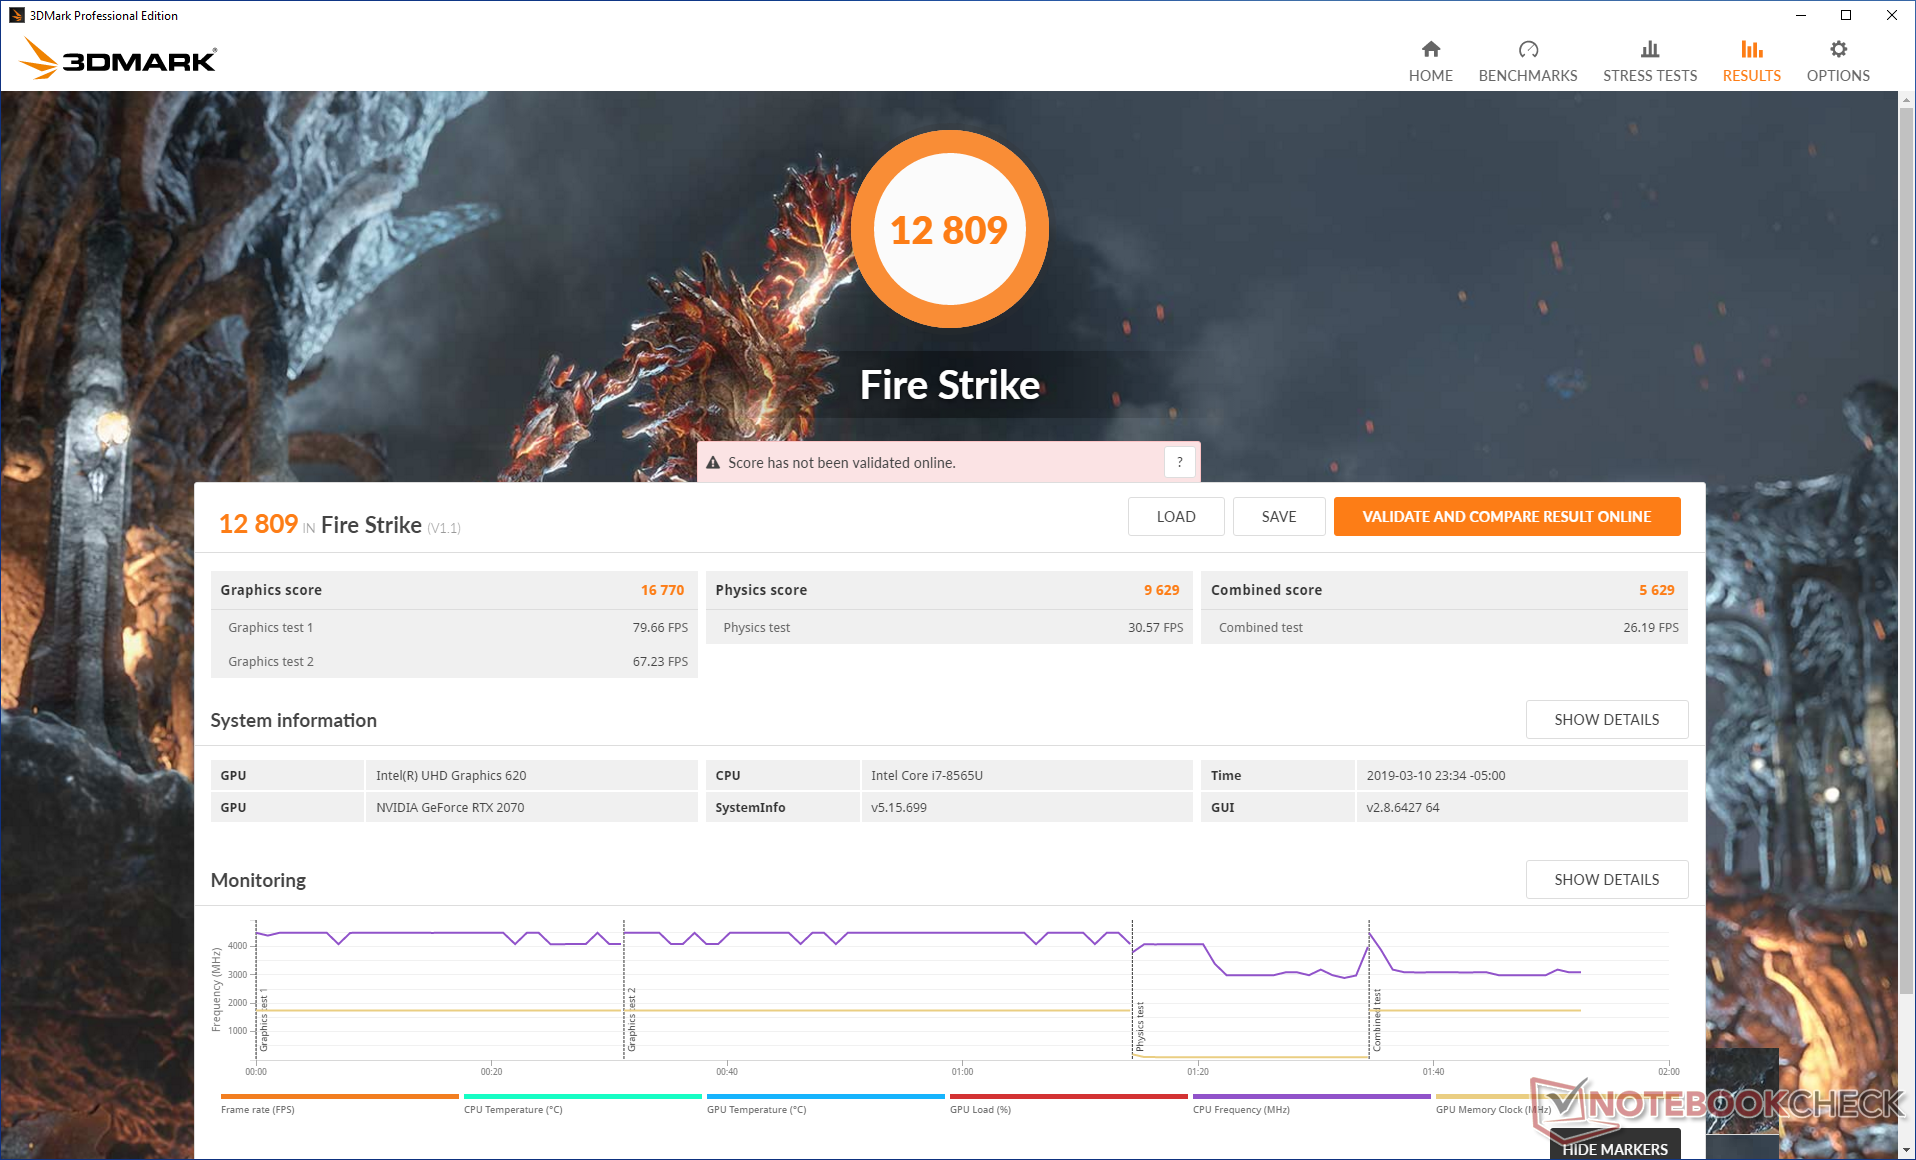
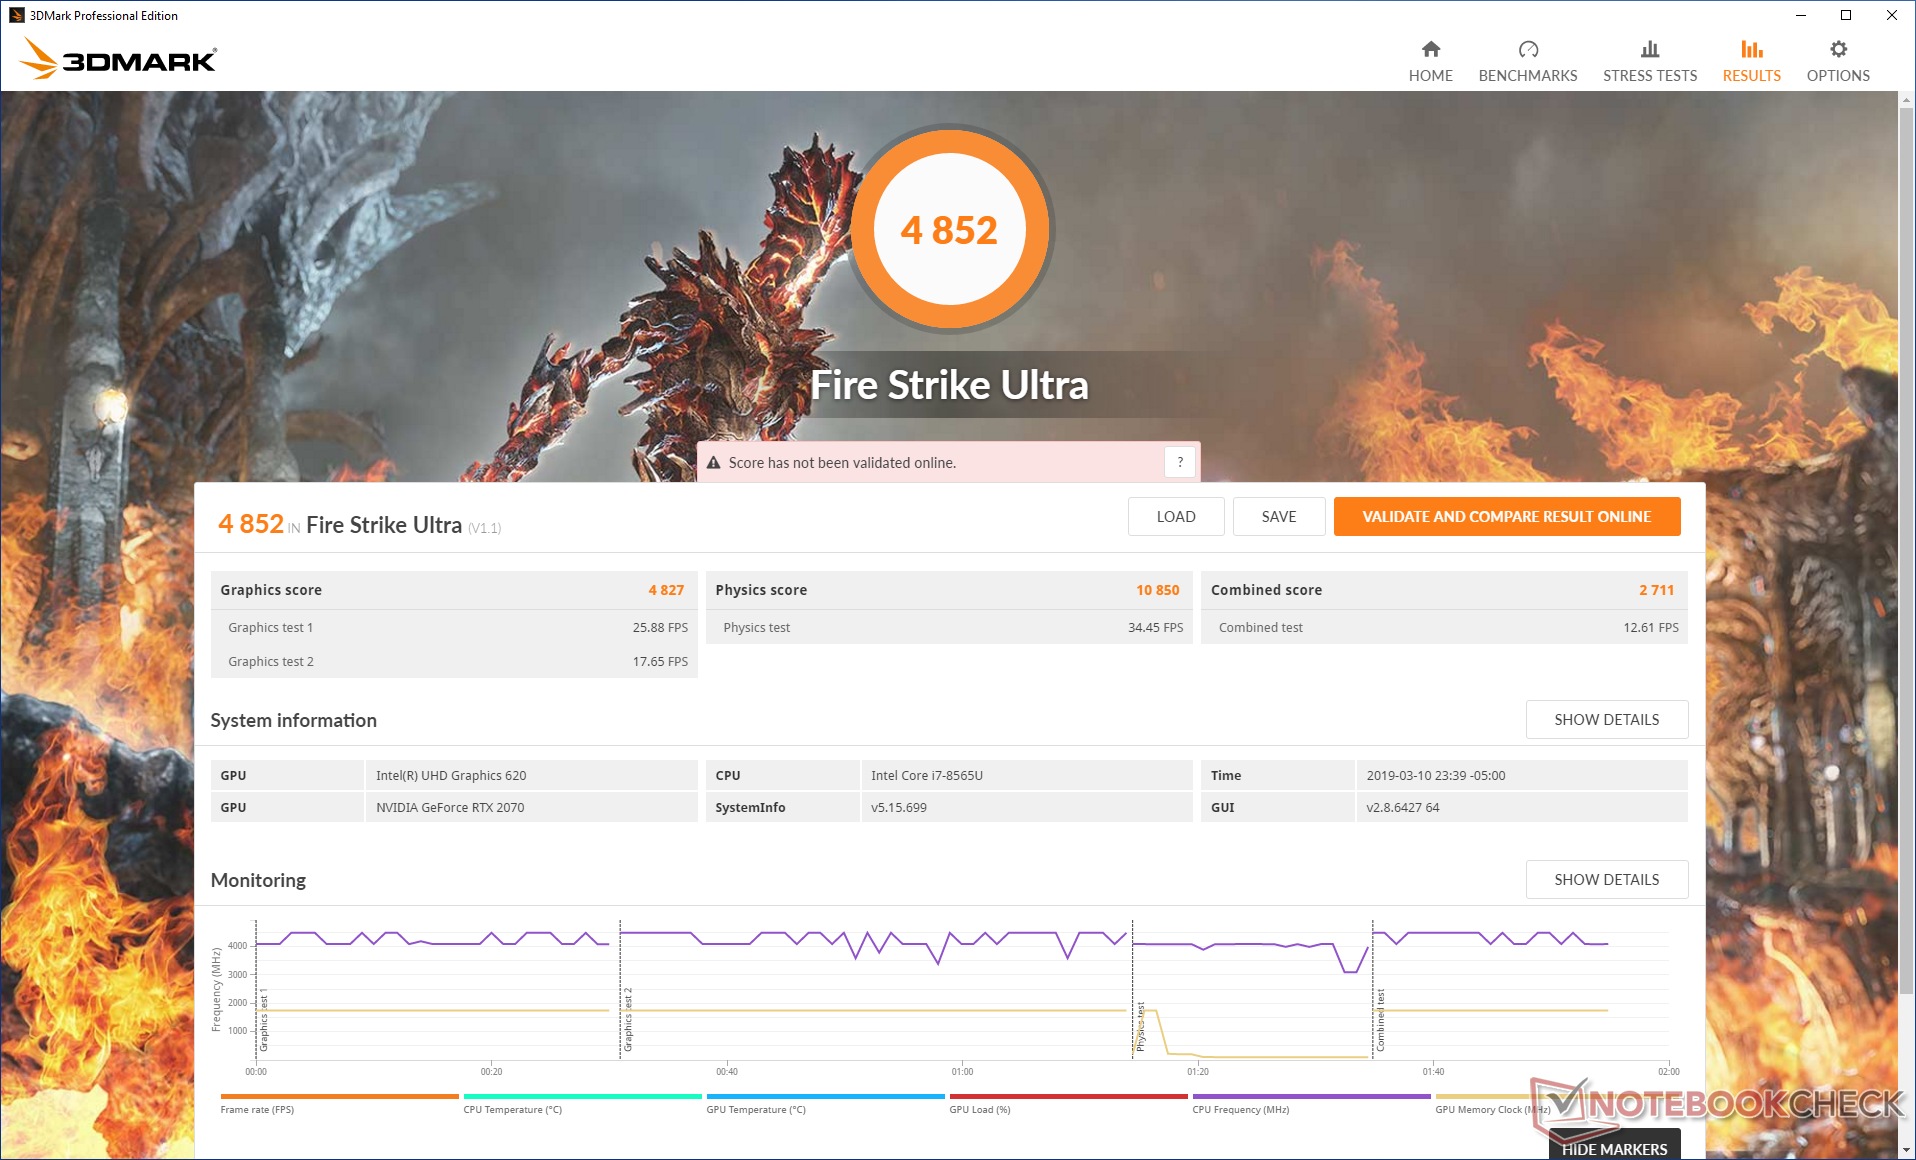
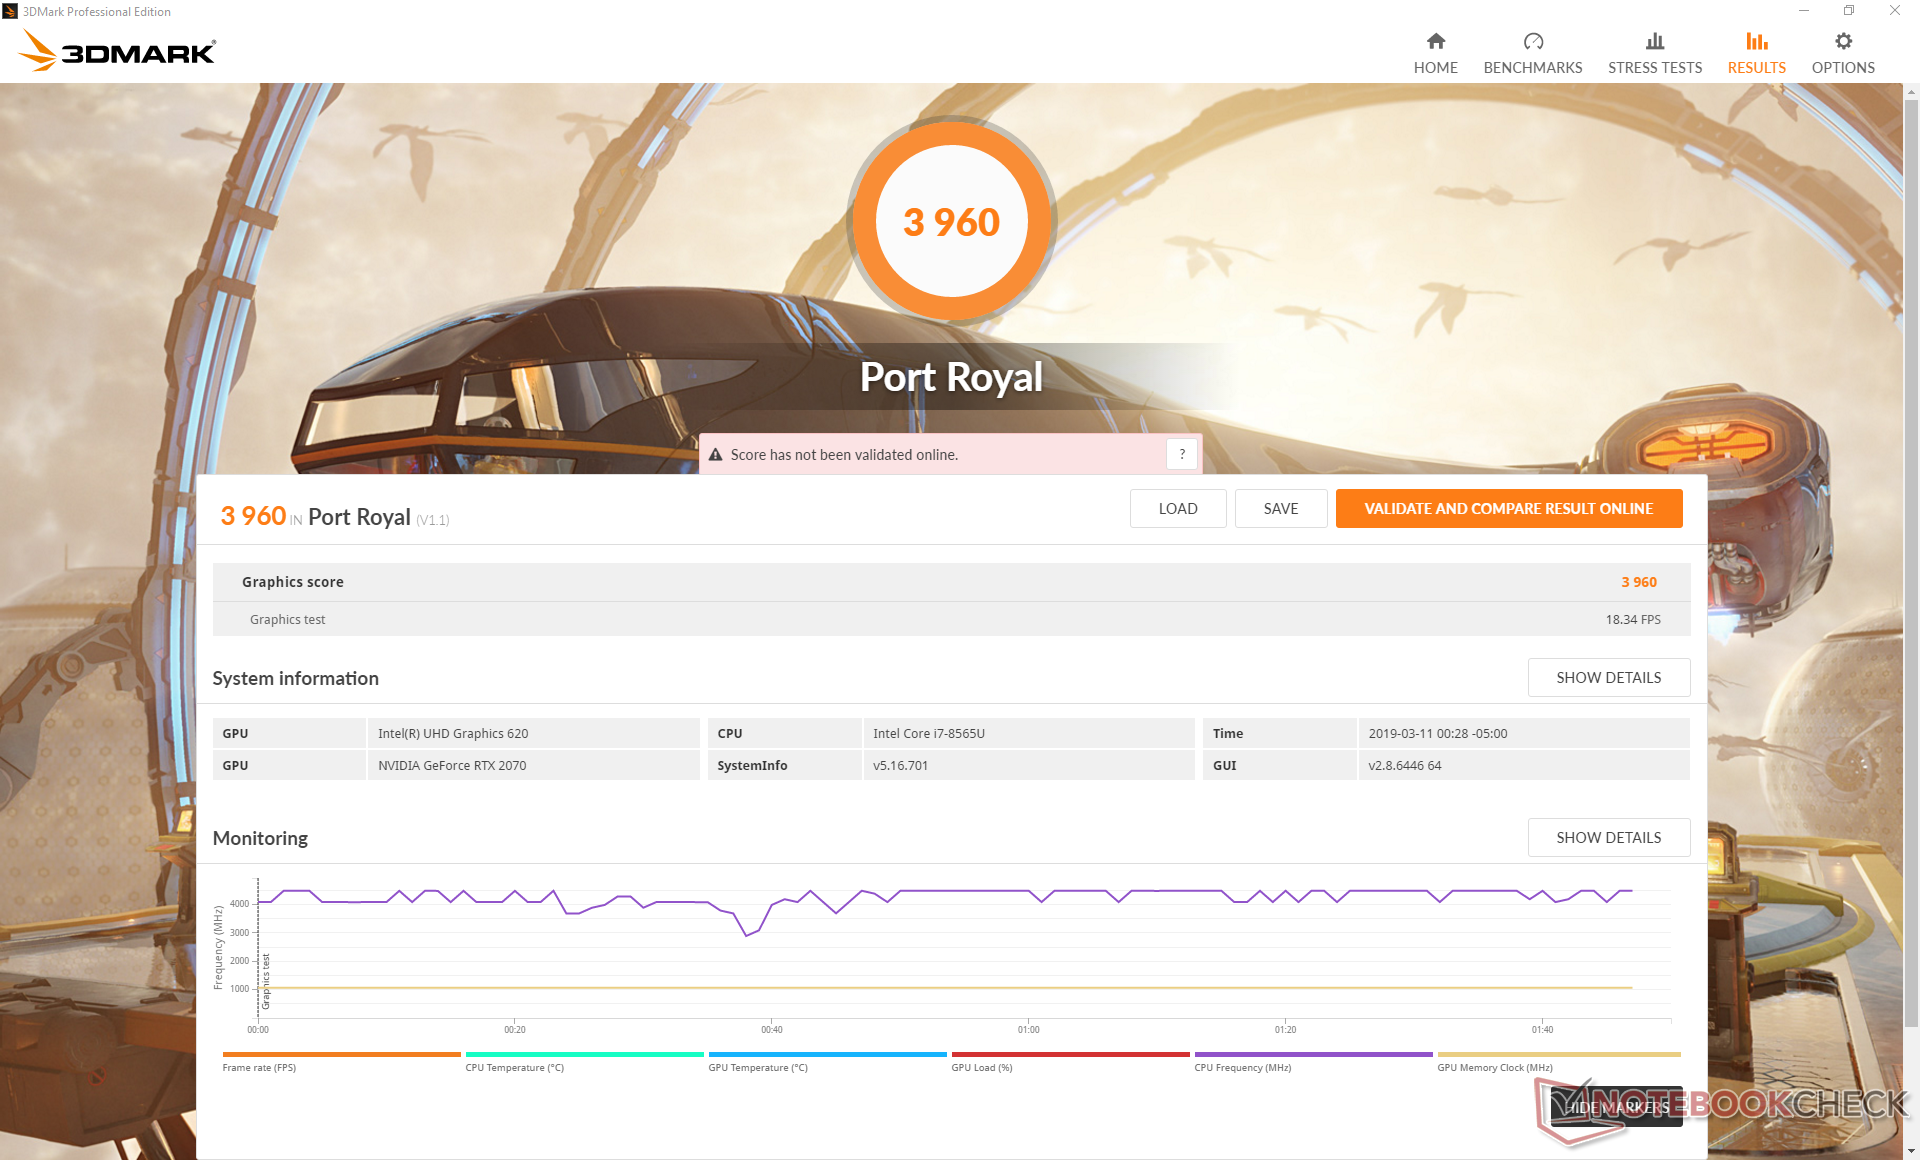
3DMark results mirror what we observed on the Gaming Box GTX 1080 in that 1080p performance is lower than expected while 4K UHD performance is much closer to a laptop with a "regular" RTX 2070. Fire Strike 1080p, for example, is 17 percent slower than the MSI GE75 RTX 2070 while their scores in Fire Strike Ultra 4K are within 3 percent of one another. Creating a GPU-bound scenario by upping the resolution and/or graphical settings will be a more optimal setup for an eGPU-powered laptop.
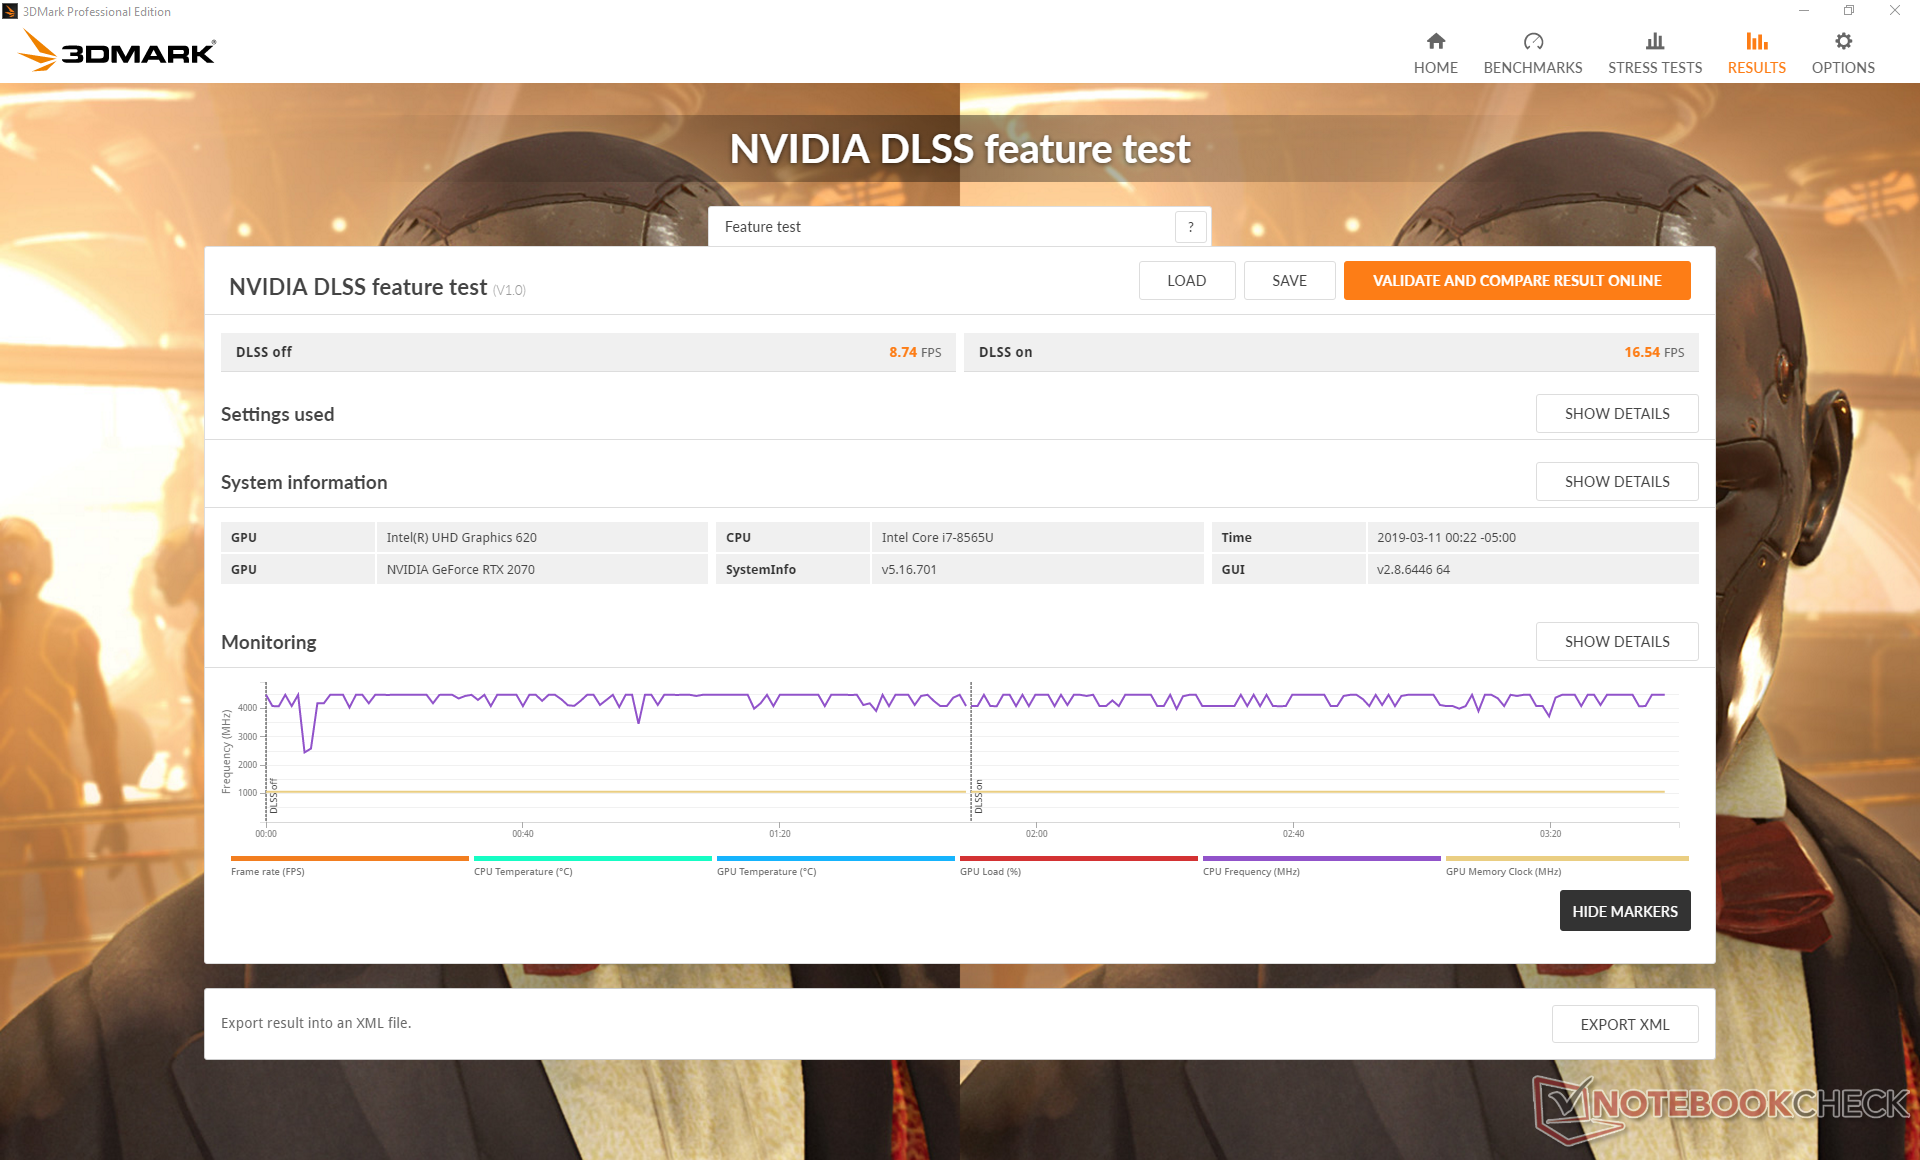
Note that 3DMark scores are not all that different from last year's Gaming Box GTX 1080. Fire Strike results are within single-digit percentages of each other and so the biggest reasons to own a Gaming Box RTX 2070 instead of the older Gaming Box GTX 1080 are for the special DLSS and ray-tracing features.
When compared to a traditional desktop PC with GeForce RTX 2070 graphics, the Aorus eGPU docking station is about 10 to 15 percent slower according to 3DMark benchmarks.
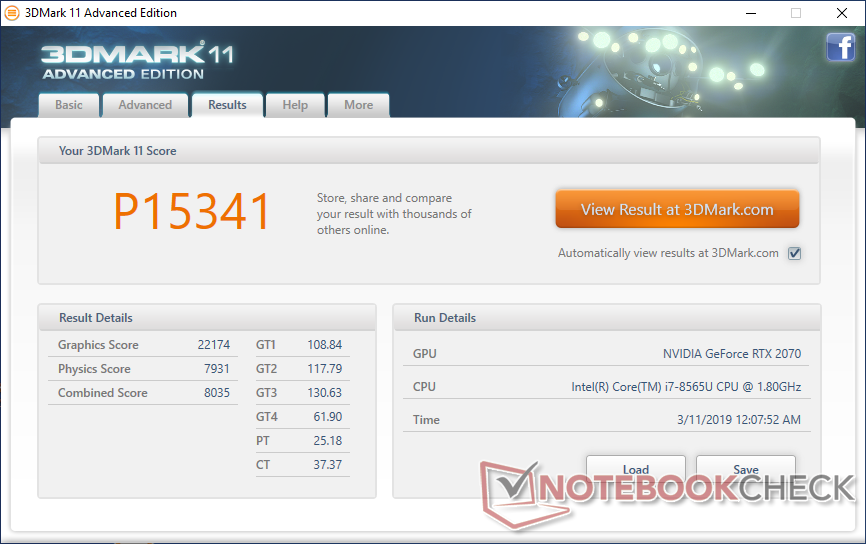
| 3DMark 11 Performance | 15341 points | |
| 3DMark Cloud Gate Standard Score | 22847 points | |
| 3DMark Fire Strike Score | 12809 points | |
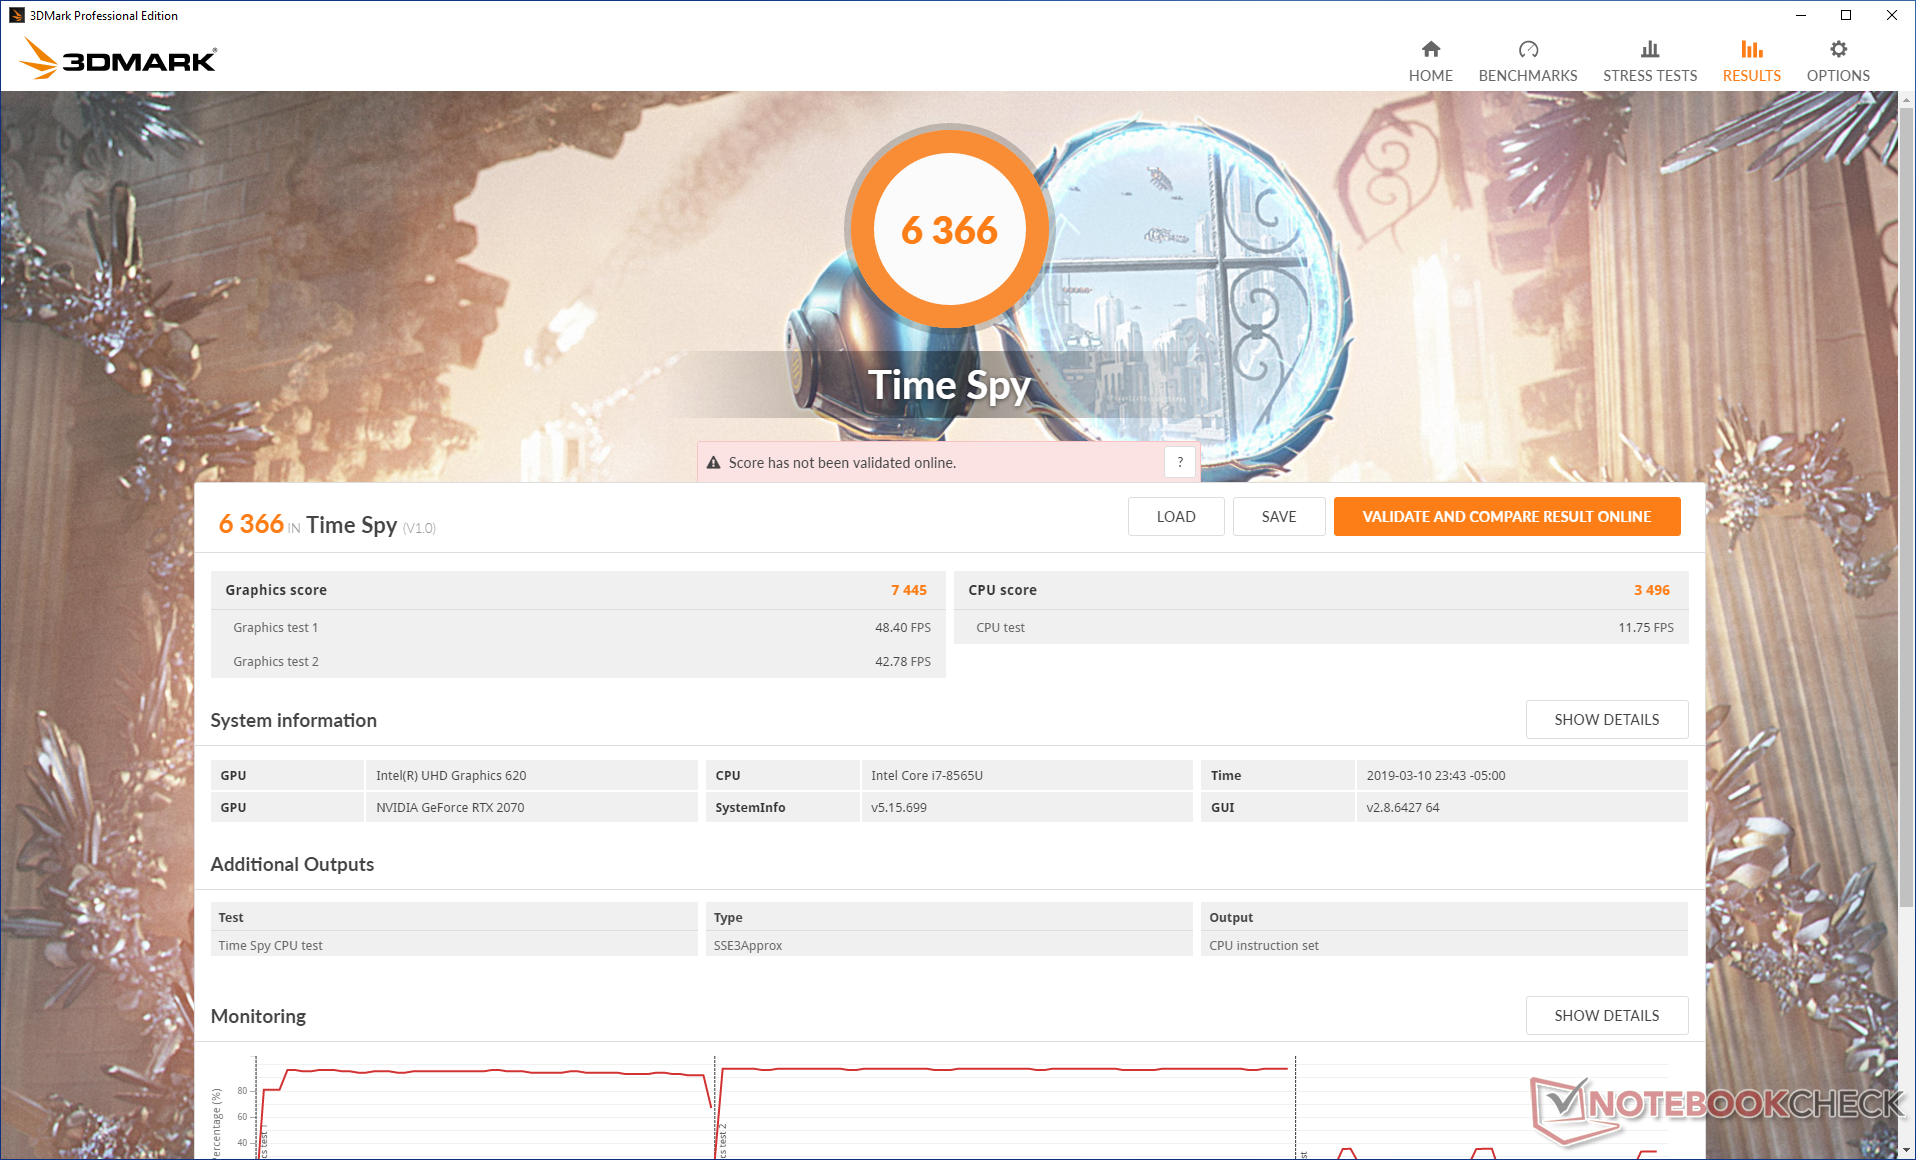
| 3DMark Time Spy Score | 6366 points | |
Help | ||
Gaming Performance
Real-world gaming performance is more variable but generally slower than what our 3DMark results above would suggest. Demanding triple-A titles like Rise of the Tomb Raider, Witcher 3, and Final Fantasy 15 run about 40 percent slower than a standard desktop PC with GeForce RTX 2070 graphics. In fact, overall performance is most similar to the Gaming Box GTX 1080 or a standard GTX 1060 laptop in some cases. The system comes close to an RTX 2060 laptop at best when paired with the low-power Core i7-8565U.
Metro Exodus will run at 1080p with Ultra settings and ray-tracing enabled which is surprising in itself. However, the performance hit is severe yet again at about 40 to 45 percent of a standard desktop PC with GeForce RTX 2070 graphics. Performance is even lower than a proper GTX 1070 laptop by almost 30 percent.
Idling on Witcher 3 shows no recurring frame dips to suggest no interrupting background activity.
| Middle-earth: Shadow of War | |
| 1280x720 Lowest Preset | |
| Asus G752VS | |
| Aorus Gaming Box RTX 2070 | |
| Average NVIDIA GeForce RTX 2070 (Desktop) (n=1) | |
| 1920x1080 Medium Preset AA:T | |
| Asus Zephyrus S GX701GX | |
| Asus G752VS | |
| Aorus Gaming Box RTX 2070 | |
| Average NVIDIA GeForce RTX 2070 (Desktop) (n=1) | |
| 1920x1080 High Preset AA:T | |
| Asus Zephyrus S GX701GX | |
| Asus G752VS | |
| Aorus Gaming Box RTX 2070 | |
| Average NVIDIA GeForce RTX 2070 (Desktop) (n=1) | |
| Aorus GTX 1080 Gaming Box (XPS 15 9575) | |
| 1920x1080 Ultra Preset AA:T | |
| Asus Zephyrus S GX701GX | |
| Asus G752VS | |
| Aorus Gaming Box RTX 2070 | |
| Average NVIDIA GeForce RTX 2070 (Desktop) (n=1) | |
| Aorus GTX 1080 Gaming Box (XPS 15 9575) | |
| 3840x2160 Ultra Preset AA:T | |
| Asus Zephyrus S GX701GX | |
| Aorus Gaming Box RTX 2070 | |
| Average NVIDIA GeForce RTX 2070 (Desktop) (n=1) | |
| Asus G752VS | |
| Overwatch | |
| 1280x720 Low (Render Scale 100 %) AA:FX AF:1x | |
| MSI RTX 2070 Gaming Z 8G | |
| Average NVIDIA GeForce RTX 2070 (Desktop) (297 - 300, n=4) | |
| Aorus Gaming Box RTX 2070 | |
| MSI RTX 2060 Gaming Z 6G | |
| 1366x768 Medium (Render Scale 100 %) AA:FX AF:2x | |
| MSI RTX 2070 Gaming Z 8G | |
| Average NVIDIA GeForce RTX 2070 (Desktop) (290 - 300, n=4) | |
| Aorus Gaming Box RTX 2070 | |
| MSI RTX 2060 Gaming Z 6G | |
| 1920x1080 High (Render Scale 100 %) AA:SM AF:4x | |
| Asus Zephyrus S GX701GX | |
| MSI RTX 2060 Gaming Z 6G | |
| MSI RTX 2070 Gaming Z 8G | |
| Average NVIDIA GeForce RTX 2070 (Desktop) (201 - 228, n=4) | |
| Aorus Gaming Box RTX 2070 | |
| 1920x1080 Epic (Render Scale 100 %) AA:SM AF:16x | |
| MSI RTX 2070 Gaming Z 8G | |
| Asus Zephyrus S GX701GX | |
| Average NVIDIA GeForce RTX 2070 (Desktop) (141 - 206, n=4) | |
| Aorus GTX 1080 Gaming Box (XPS 15 9575) | |
| Aorus Gaming Box RTX 2070 | |
| MSI RTX 2060 Gaming Z 6G | |
| low | med. | high | ultra | 4K | |
|---|---|---|---|---|---|
| BioShock Infinite (2013) | 267.5 | 226.3 | 213.6 | 123 | |
| Metro: Last Light (2013) | 117.2 | 114.1 | 110.5 | 89.6 | |
| The Witcher 3 (2015) | 151.4 | 112.3 | 80 | 40.9 | |
| Batman: Arkham Knight (2015) | 122 | 119 | 101 | 45 | |
| Metal Gear Solid V (2015) | 60 | 60 | 60 | 60 | |
| Fallout 4 (2015) | 141.5 | 109.9 | 101.1 | ||
| Rise of the Tomb Raider (2016) | 147.9 | 117.8 | 90.4 | 79.1 | |
| Ashes of the Singularity (2016) | 64.9 | 53 | 52.4 | ||
| Overwatch (2016) | 296.9 | 290.1 | 200.6 | 147.8 | |
| Middle-earth: Shadow of War (2017) | 137 | 111 | 96 | 77 | 40 |
| Final Fantasy XV Benchmark (2018) | 106.5 | 83.9 | 60.8 | ||
| Monster Hunter World (2018) | 90.7 | 81.4 | 77.3 | 64.6 | |
| Shadow of the Tomb Raider (2018) | 88 | 63 | 61 | 58 | |
| Metro Exodus (2019) | 82.7 | 53.4 | 41 | 33.4 |
Emissions
System Noise
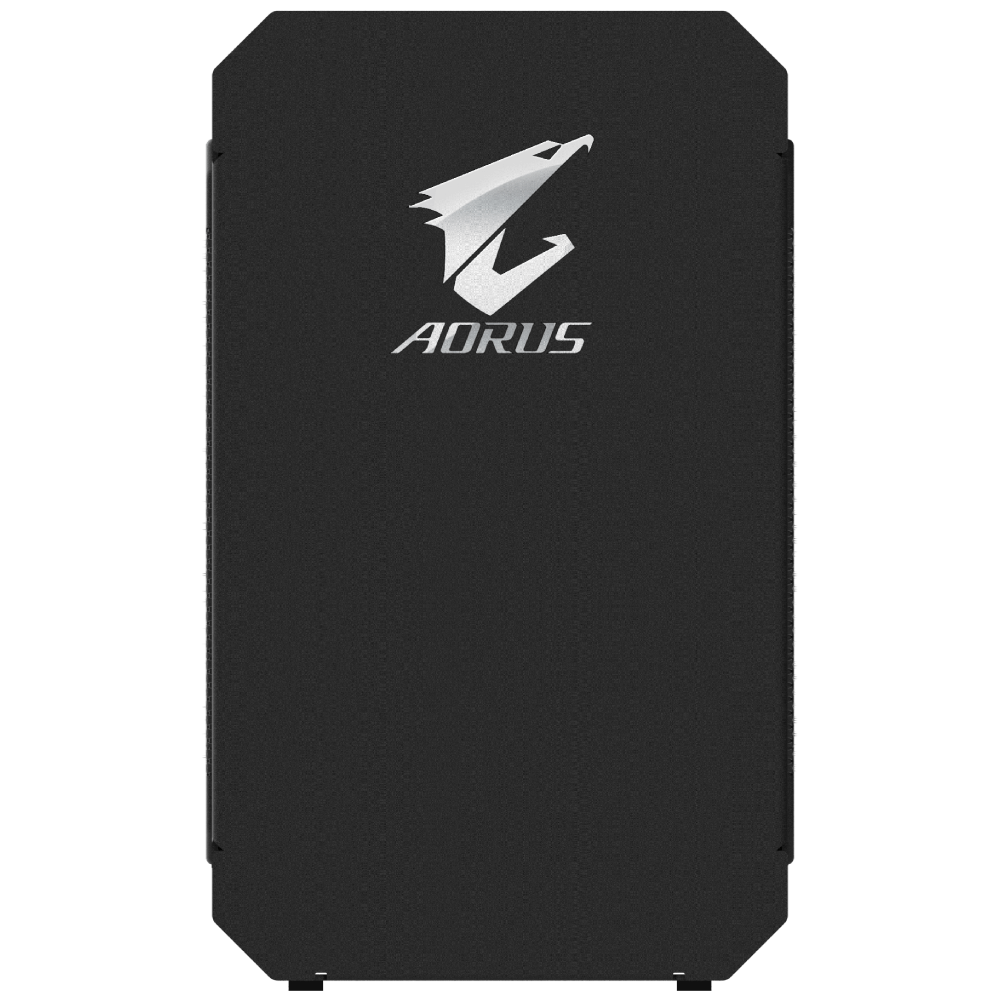
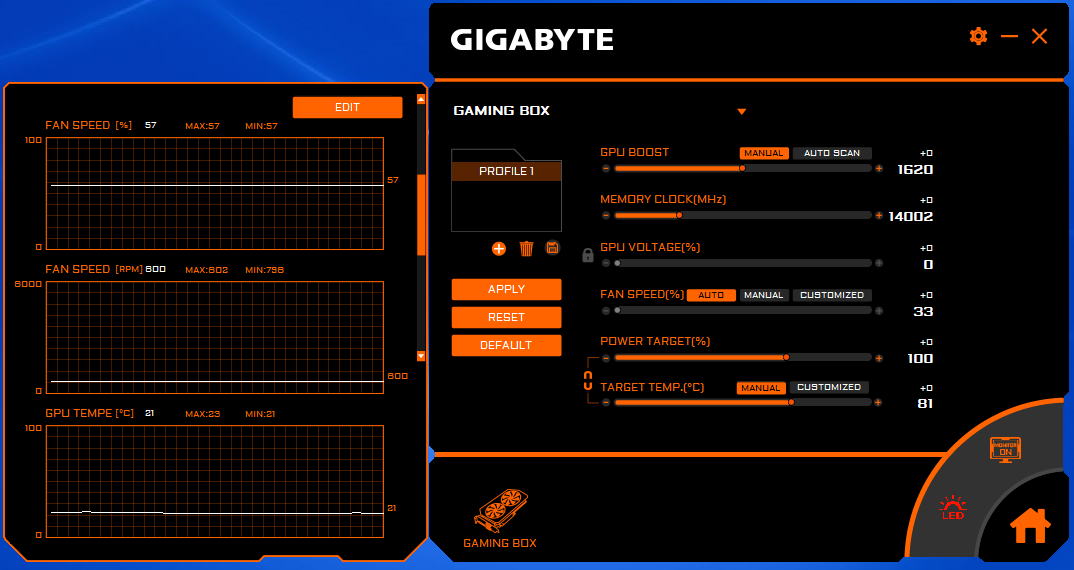
To measure fan noise, we place the front of the dock (the side with the Aorus logo) facing 15 cm away from our microphone. Noise is always present since the GPU fan never idles when the docking station is active. Strangely, the fan appears pulsate and rev more frequently than on the Gaming Box GTX 1080 during low-medium loads. The Aorus Engine software thankfully allows for manual fan control to address this.
When running Witcher 3 as our baseline gaming load, fan noise becomes about the same as what we measured on the Gaming Box GTX 1080 at 41 to 42 dB(A). Results are generally quieter than most gaming laptops especially since laptop fans are typically smaller and higher-pitched.
| Aorus Gaming Box RTX 2070 GeForce RTX 2070 (Desktop), i7-8565U, Samsung SSD PM981 MZVLB512HAJQ | Asus ROG G703GX GeForce RTX 2080 Mobile, i7-8750H, Samsung SSD PM981 MZVLB512HAJQ | MSI GT75 8RG-090 Titan GeForce GTX 1080 Mobile, i9-8950HK, 2x Samsung PM961 MZVLW256HEHP (RAID 0) | Lenovo Legion Y740-17ICH GeForce RTX 2080 Max-Q, i7-8750H, Samsung SSD PM981 MZVLB256HAHQ | MSI GE75 8SF GeForce RTX 2070 Mobile, i7-8750H, Kingston RBUSNS8154P3256GJ1 | Aorus GTX 1080 Gaming Box (XPS 15 9575) GeForce GTX 1080 (Desktop), | |
|---|---|---|---|---|---|---|
| Noise | -7% | -11% | 8% | -4% | 4% | |
| off / environment * (dB) | 30 | 30 -0% | 30 -0% | 28.3 6% | 28.3 6% | 28 7% |
| Idle Minimum * (dB) | 32.7 | 30 8% | 32 2% | 31.5 4% | 33.5 -2% | 32.6 -0% |
| Idle Average * (dB) | 37 | 35 5% | 34 8% | 31.6 15% | 33.6 9% | 32.6 12% |
| Idle Maximum * (dB) | 38.9 | 41 -5% | 37 5% | 31.6 19% | 35 10% | 32.7 16% |
| Load Average * (dB) | 39.6 | 44 -11% | 43 -9% | 32.3 18% | 38 4% | 32.7 17% |
| Witcher 3 ultra * (dB) | 41.6 | 51 -23% | 57 -37% | 43 -3% | 50 -20% | 42.2 -1% |
| Load Maximum * (dB) | 43 | 52 -21% | 62 -44% | 45.5 -6% | 56.9 -32% | 54.2 -26% |
* ... smaller is better
Noise level
| Idle |
| 32.7 / 37 / 38.9 dB(A) |
| Load |
| 39.6 / 43 dB(A) |
 | ||
30 dB silent 40 dB(A) audible 50 dB(A) loud |
||
min: | ||
Temperature
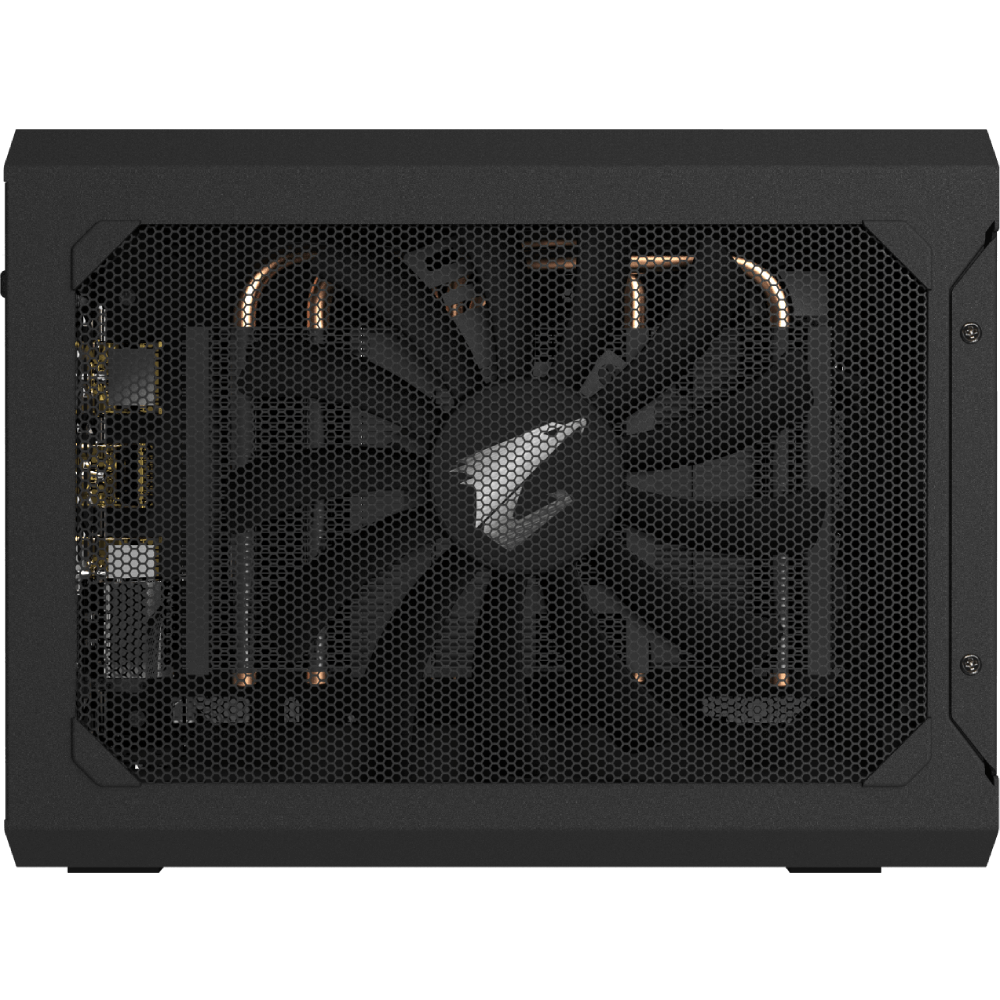
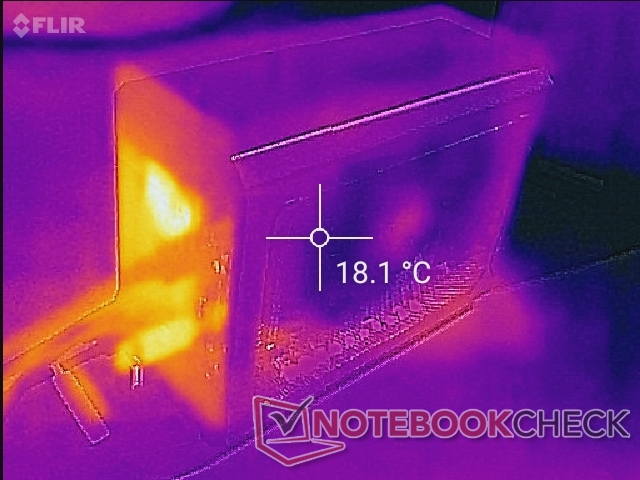
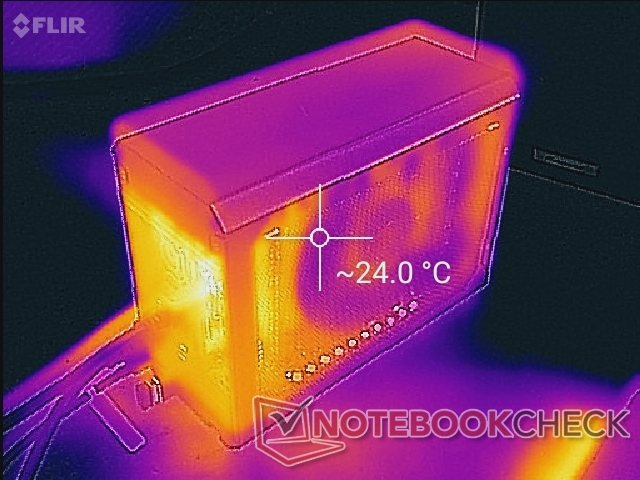
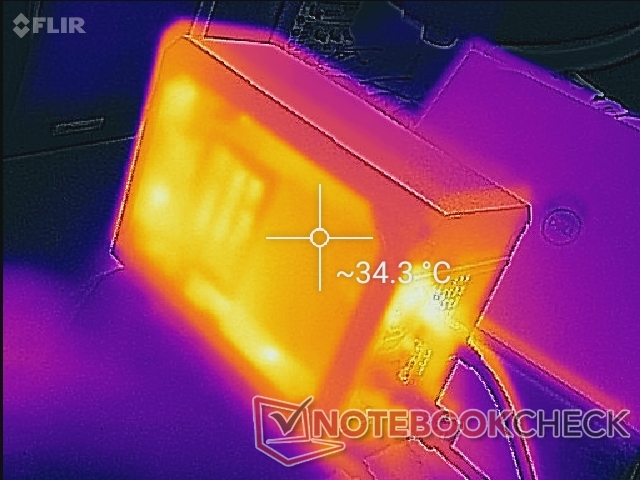
Surface temperatures are not an issue on the Gaming Box. Note that the unit should never be positioned on its side or against a wall or else ventilation will be blocked.

Stress Test
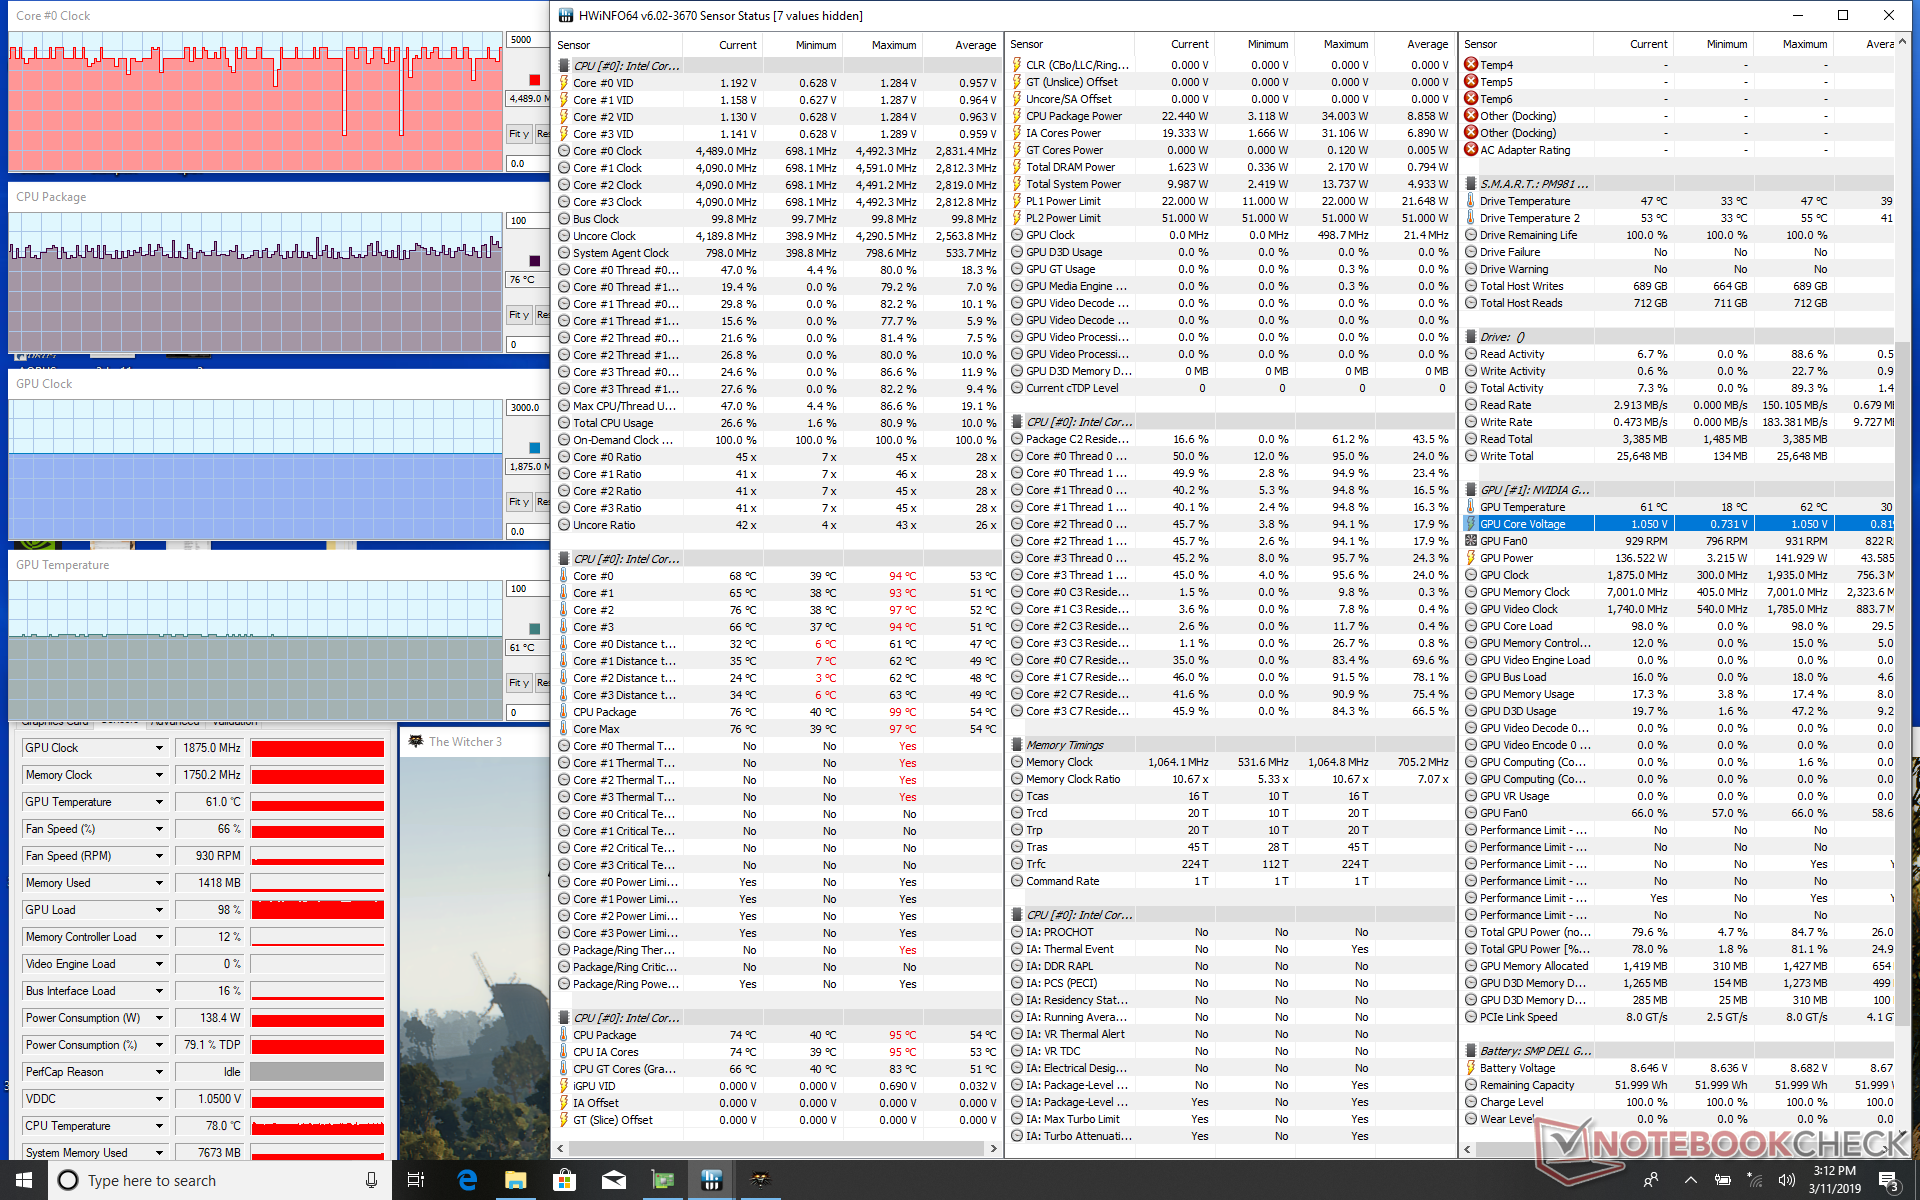
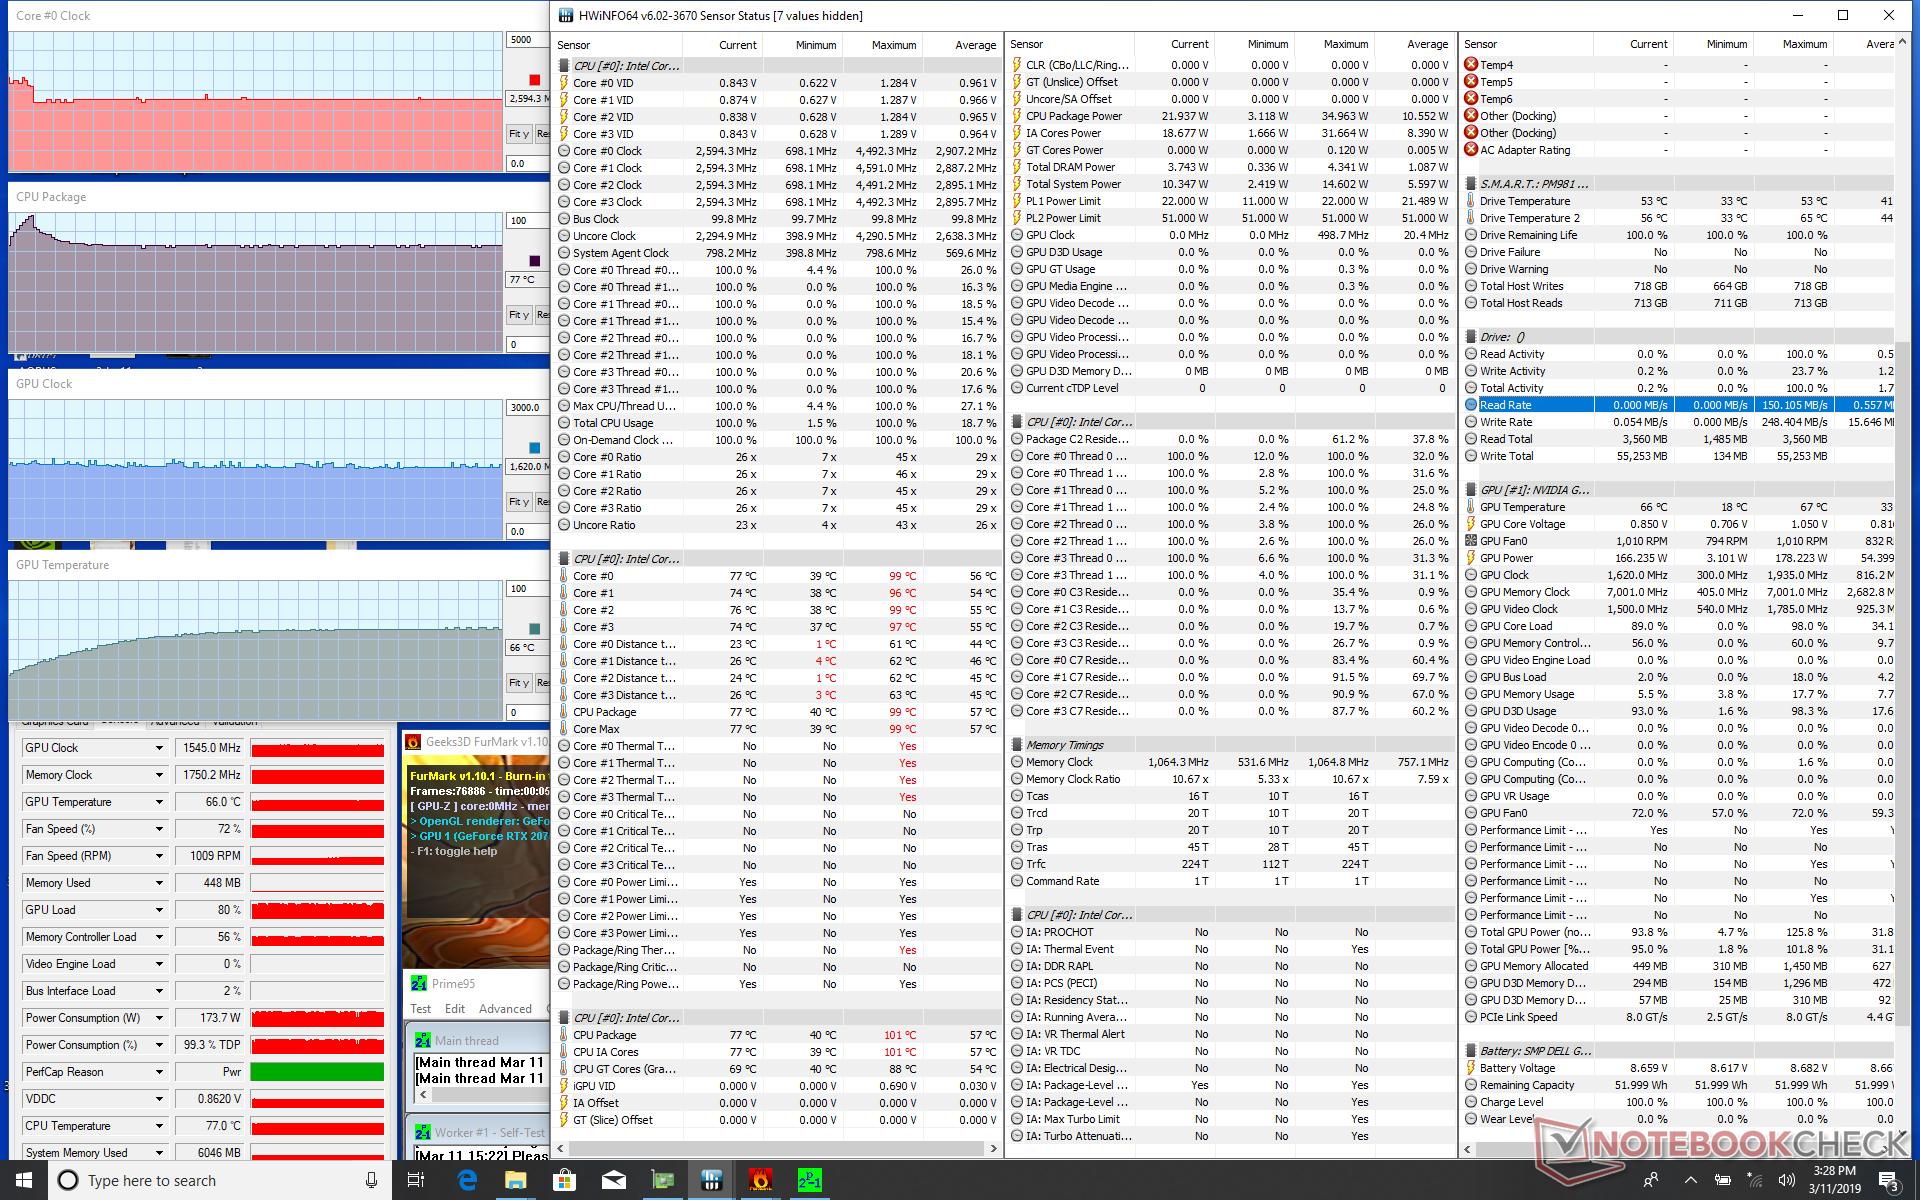
GPU temperature when running FurMark stabilizes at 66 C to be warmer than last year's Gaming Box GTX 1080 but still relatively cool when compared to laptop GPUs. Core temperature and clock rate are constant at 61 C and 1875 MHz, respectively, when running Witcher 3. In contrast, the mobile RTX 2070 in the MSI GE75 runs at 71 C and 1560 MHz when under the same Witcher 3 conditions. The Aorus Gaming Box should be faster on paper, but the performance edge still goes to the MSI laptop with its integrated RTX 2070 to suggest a CPU or Thunderbolt 3 bottleneck in the eGPU setup.
| CPU Clock (GHz) | GPU Clock (MHz) | Average CPU Temperature (°C) | Average GPU Temperature (°C) | |
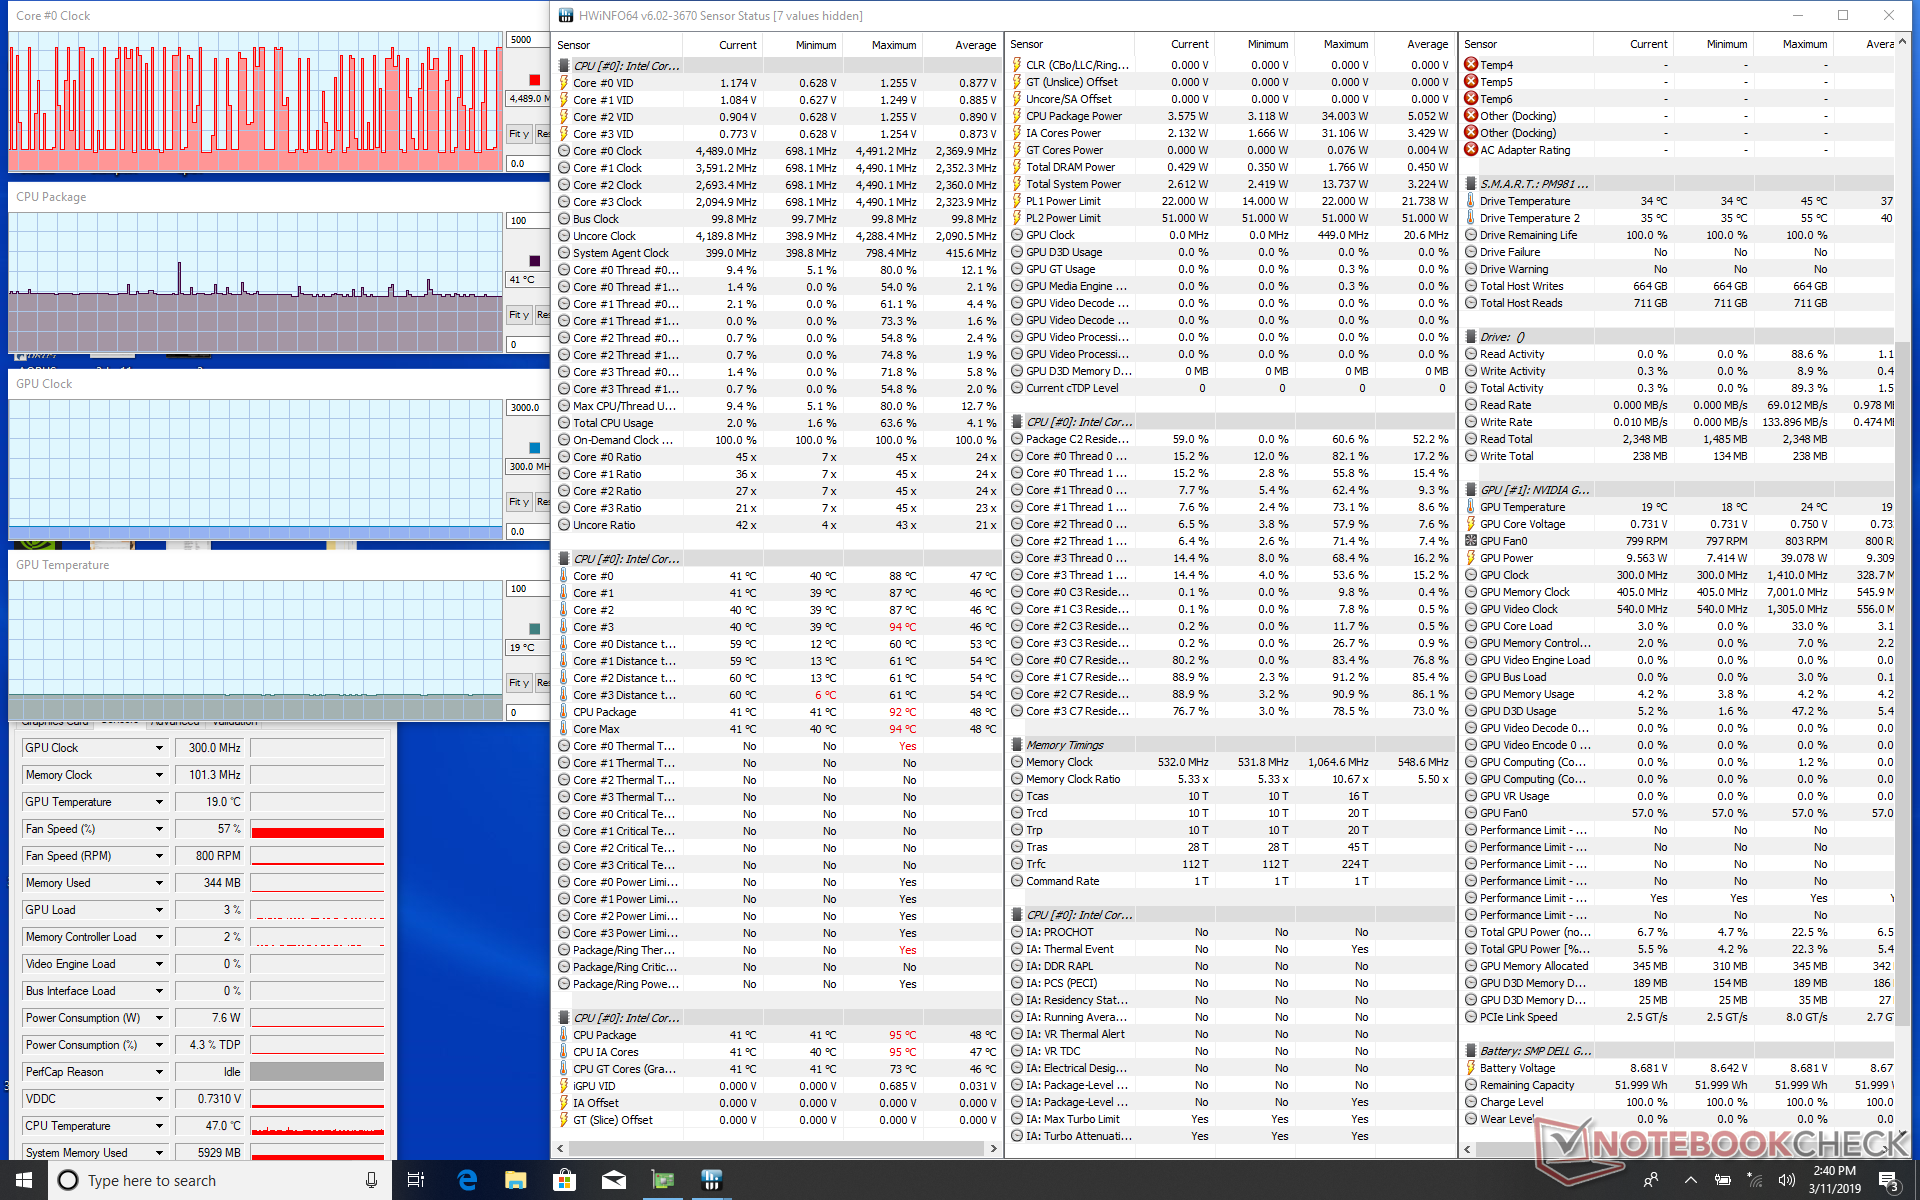
| System Idle | -- | 300 | 41 | 19 |
| Prime95 + FurMark Stress | 2.6 | 1545 | 77 | 66 |
| Witcher 3 Stress | 4.4 | 1875 | 76 | 61 |
Energy Management
Power Consumption
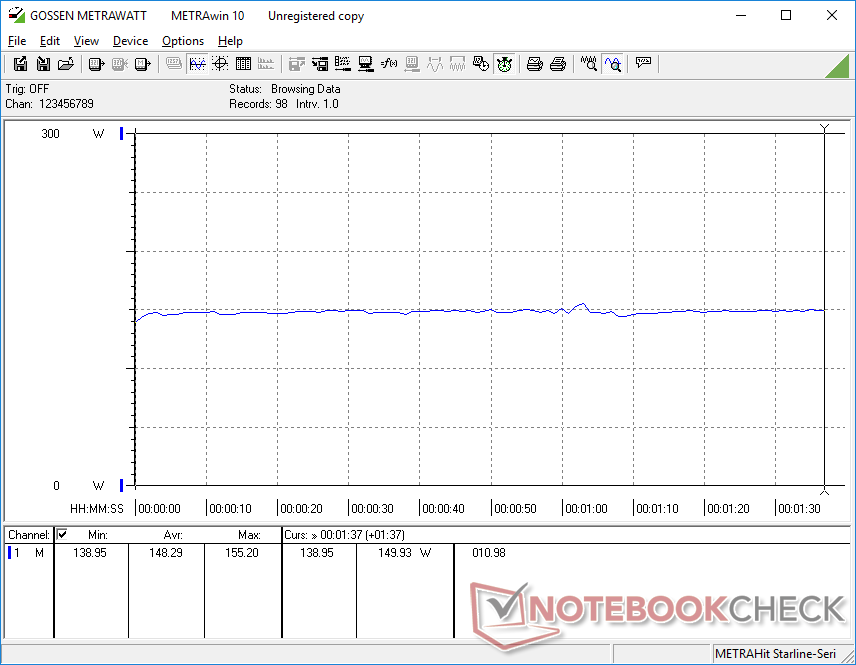
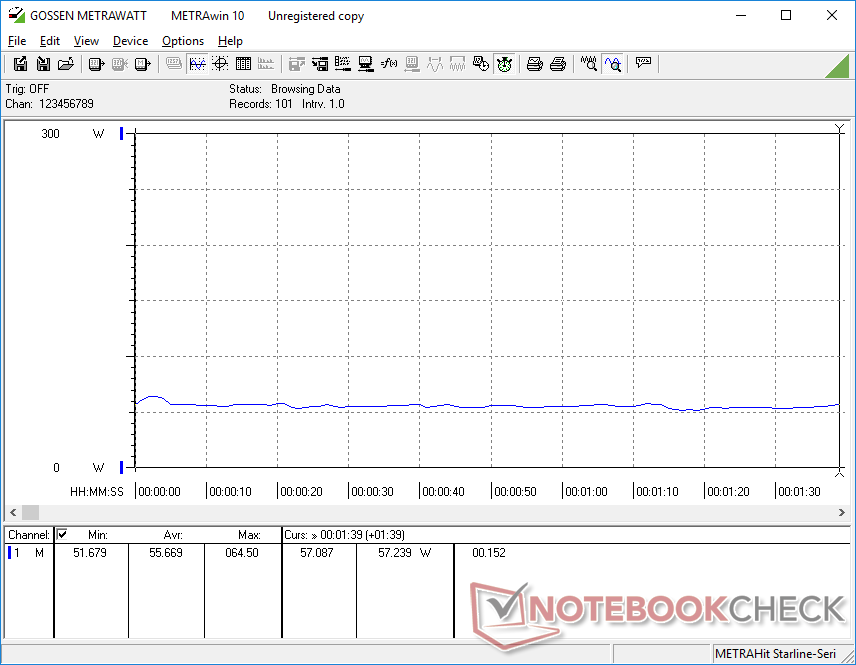
The Gaming Box RTX 2070 is more power efficient than the Gaming Box GTX 1080 when under medium loads, but consumption is otherwise very similar when gaming and during very heavy loads. We expected as much since gaming performance is nearly identical to the Gaming Box GTX 1080 in the majority of cases.
| Off / Standby | |
| Idle | |
| Load |
|
Key:
min: | |
| Aorus Gaming Box RTX 2070 i7-8565U, GeForce RTX 2070 (Desktop), Samsung SSD PM981 MZVLB512HAJQ, , 3840x2160, 13.3" | Asus Zephyrus S GX701GX i7-8750H, GeForce RTX 2080 Max-Q, Samsung SSD PM981 MZVLB1T0HALR, IPS, 1920x1080, 17.3" | MSI GE75 8SF i7-8750H, GeForce RTX 2070 Mobile, Kingston RBUSNS8154P3256GJ1, IPS, 1920x1080, 17.3" | Razer Blade 15 RTX 2070 Max-Q i7-8750H, GeForce RTX 2070 Max-Q, Samsung SSD PM981 MZVLB512HAJQ, IPS, 1920x1080, 15.6" | Dell XPS 13 9380 i7 4K i7-8565U, UHD Graphics 620, Samsung SSD PM981 MZVLB512HAJQ, IPS, 3840x2160, 13.3" | Aorus GTX 1080 Gaming Box (XPS 15 9575) GeForce GTX 1080 (Desktop), , , x, | |
|---|---|---|---|---|---|---|
| Power Consumption | -28% | -23% | 5% | 54% | -16% | |
| Idle Minimum * (Watt) | 19.3 | 19 2% | 16.4 15% | 10.4 46% | 5.2 73% | 21.1 -9% |
| Idle Average * (Watt) | 19.3 | 22 -14% | 21.9 -13% | 14.6 24% | 8.6 55% | 21.1 -9% |
| Idle Maximum * (Watt) | 19.3 | 30 -55% | 25.4 -32% | 16.3 16% | 10.5 46% | 21.1 -9% |
| Load Average * (Watt) | 55.7 | 104 -87% | 90.7 -63% | 88.5 -59% | 44.2 21% | 92.1 -65% |
| Witcher 3 ultra * (Watt) | 148.3 | 167 -13% | 203.3 -37% | 155.4 -5% | 150.3 -1% | |
| Load Maximum * (Watt) | 203 | 203 -0% | 222.9 -10% | 182.4 10% | 47.5 77% | 206 -1% |
* ... smaller is better
Pros
Cons
Verdict
The Aorus Gaming Box RTX 2070 can turn a compatible Ultrabook to a gaming machine so long as users remember that actual gaming performance will likely be bottlenecked by the CPU and Thunderbolt 3 port. Having the ability to play today's most demanding PC titles on an Ultrabook will inherently attract lots of attention, but real-world performance can range between a GTX 1060 to an RTX 2060 despite the fact that there is a full-blown RTX 2070 graphics card inside. The practicality of ray-tracing then becomes questionable because enabling it would simply tank frame rates even further.
Perhaps performance would be closer to a desktop RTX 2070 when connected to a larger Core i7-8750H or i9-8950HK laptop instead of our XPS 13. 3DMark benchmarks certainly suggest this with final scores being close to a proper RTX 2070 gaming laptop. Many laptops with these powerful Intel H-class processors, however, are typically already equipped with capable discrete graphics cards.
Lastly, we experienced a small handful of system crashes, freezes, and eGPU detection issues during our time with the unit. It's great when it works, but be prepared to reboot, plug, and unplug multiple times whenever something goes wrong. The experience is not quite seamless just yet.
You're buying a Gaming Box RTX 2070, but you're actually buying the gaming performance of an RTX 2060. The value comes in the ability to play demanding PC titles on your Ultrabook that would otherwise be limited to integrated Intel graphics only. Perhaps Aorus can offer a Gaming Box RTX 2060 option in the future instead for a better balance when paired with ULV CPUs.
Price comparison
