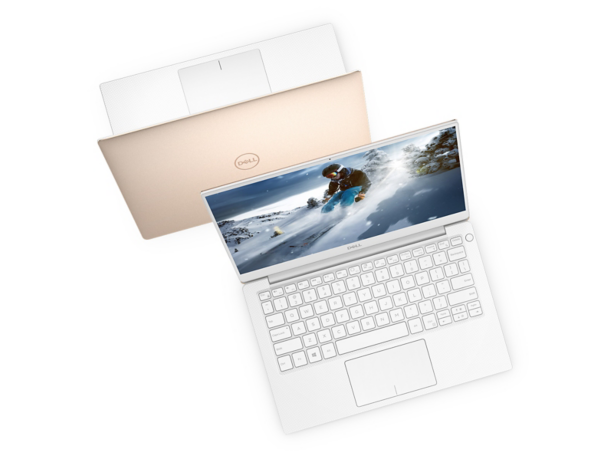
Dell XPS 13 9380 (i7-8565U, 4K UHD) Laptop Review
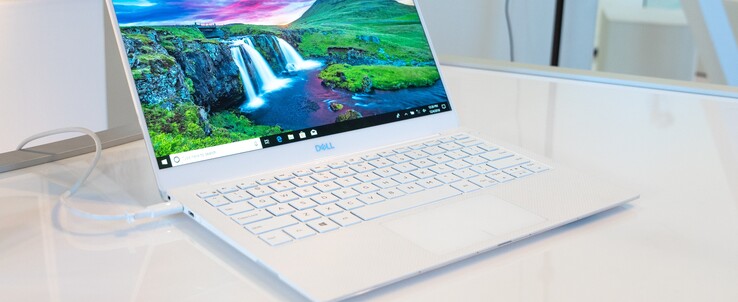
Dell introduced the XPS 13 9380 series at CES 2019 as a relatively minor update to last year's XPS 13 9370 series. Its two biggest upgrades are the re-positioned webcam (finally!) and the upgrade from Kaby Lake-R to Whiskey Lake-U. We've already checked out the Core i5 XPS 13 9380 and now we'll be checking out the pricier Core i7-8565U SKU to see how much of a performance differential actually exists between the two configurations. As of this writing, the price difference between the Core i5 and i7 SKUs is almost $250 USD.
We recommend reading up on our existing reviews of the Core i5 XPS 13 9380 and the last generation XPS 13 9370 series below for our take on the hardware since the chassis has remained essentially identical year-over-year. This review will instead dive into the performance of the Core i7 configuration.
- XPS 13 9380 (i5-8265U, 4K UHD)
- XPS 13 9370 (i7-8550U, 4K UHD)
- XPS 13 9370 (i5-8250U, 4K UHD)
- XPS 13 9370 (i5-8250U, FHD)
- XPS 13 9360 (i5-8250U, QHD)
- XPS 13 9360 (Intel Iris, FHD)
- XPS 13 9360 (i7-7500U, QHD)
- XPS 13 9360 (i5-7200U, FHD)
Update 3/12/19: we had the possibility to review the i7/FHD SKU, and have updated the display, power consumption, and battery life sections with our findings.
| SD Card Reader | |
| average JPG Copy Test (av. of 3 runs) | |
| Dell XPS 15 9570 Core i9 UHD (Toshiba Exceria Pro SDXC 64 GB UHS-II) | |
| Dell XPS 13 9380 i7 4K (Toshiba Exceria Pro M501 64 GB UHS-II) | |
| HP Spectre x360 15-ch011nr (Toshiba Exceria Pro SDXC 64 GB UHS-II) | |
| Samsung Notebook 9 NP930QAA (Toshiba Exceria Pro M501 microSDXC 64GB) | |
| Asus ZenBook 13 UX333FA (Toshiba Exceria Pro M501 microSDXC 64GB) | |
| maximum AS SSD Seq Read Test (1GB) | |
| HP Spectre x360 15-ch011nr (Toshiba Exceria Pro SDXC 64 GB UHS-II) | |
| Dell XPS 15 9570 Core i9 UHD (Toshiba Exceria Pro SDXC 64 GB UHS-II) | |
| Dell XPS 13 9380 i7 4K (Toshiba Exceria Pro M501 64 GB UHS-II) | |
| Samsung Notebook 9 NP930QAA (Toshiba Exceria Pro M501 microSDXC 64GB) | |
| Asus ZenBook 13 UX333FA (Toshiba Exceria Pro M501 microSDXC 64GB) | |
Display 4K UHD Touch
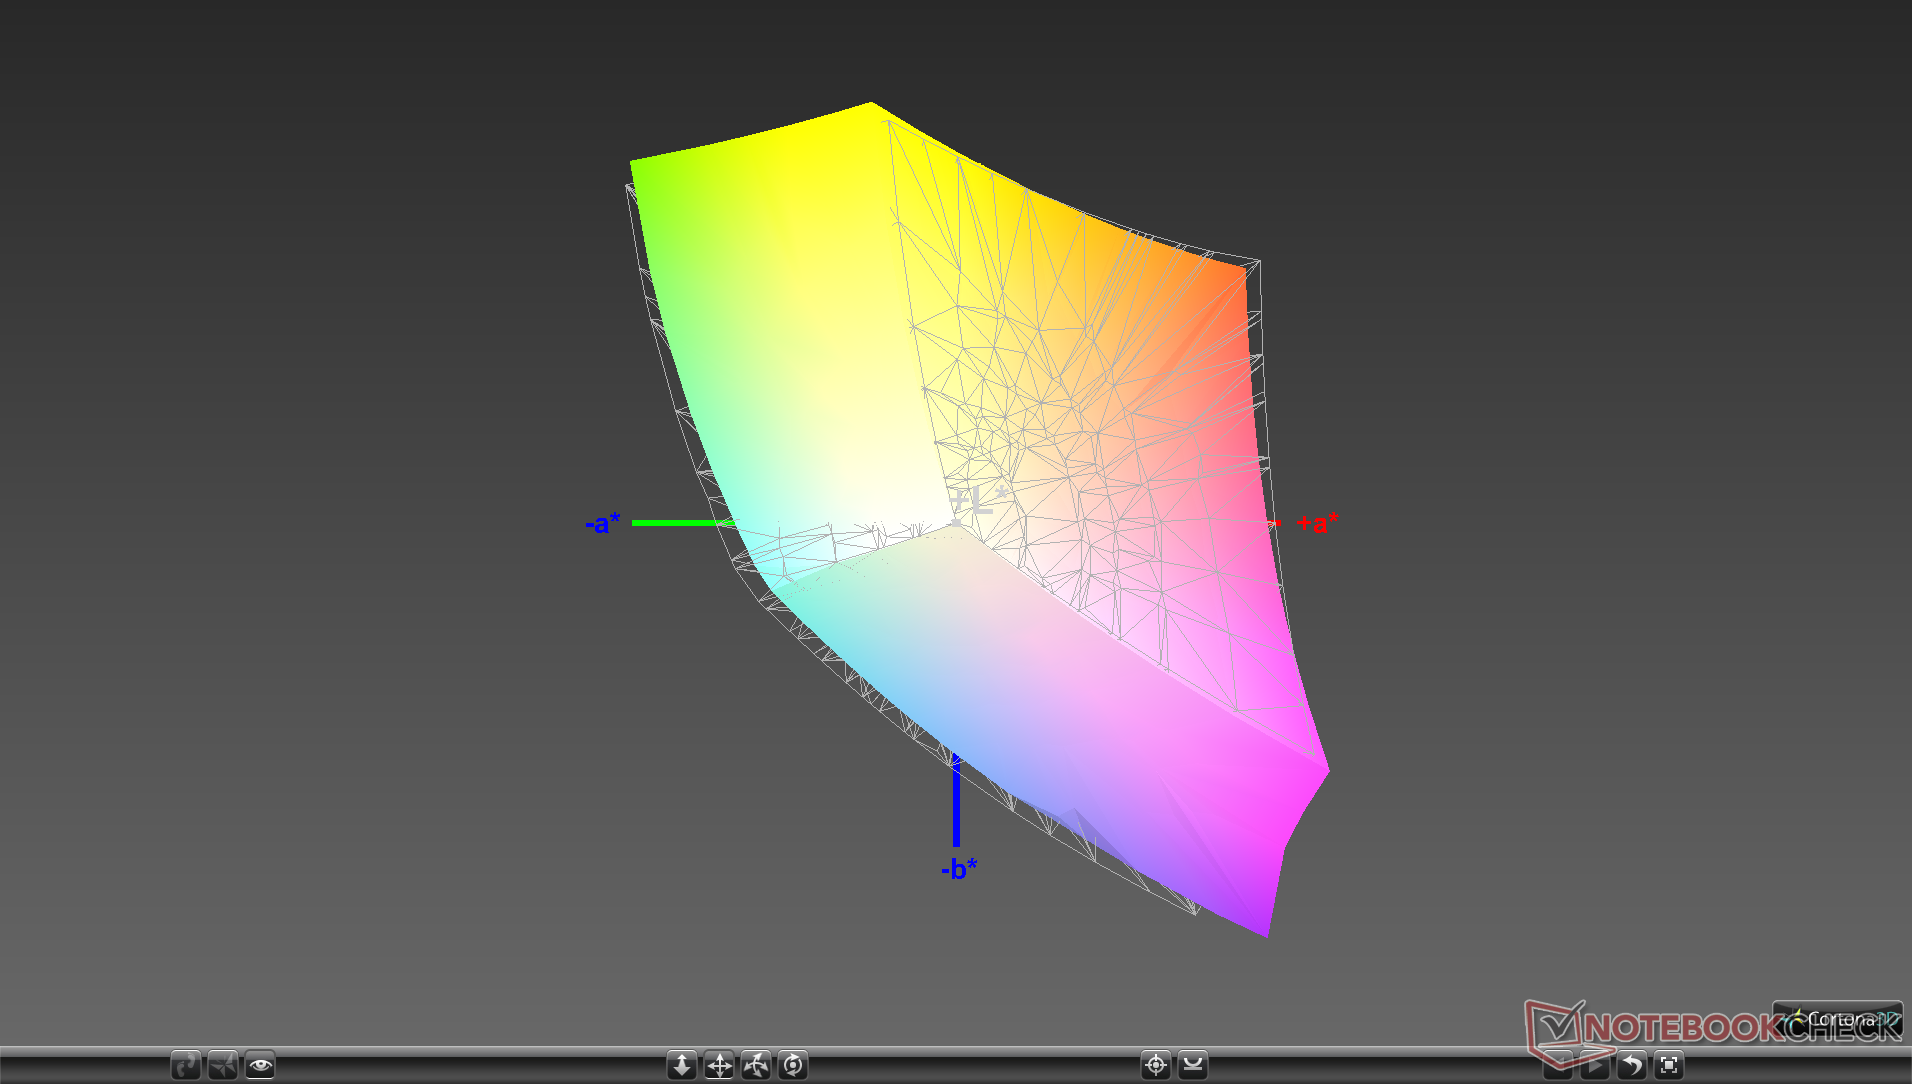
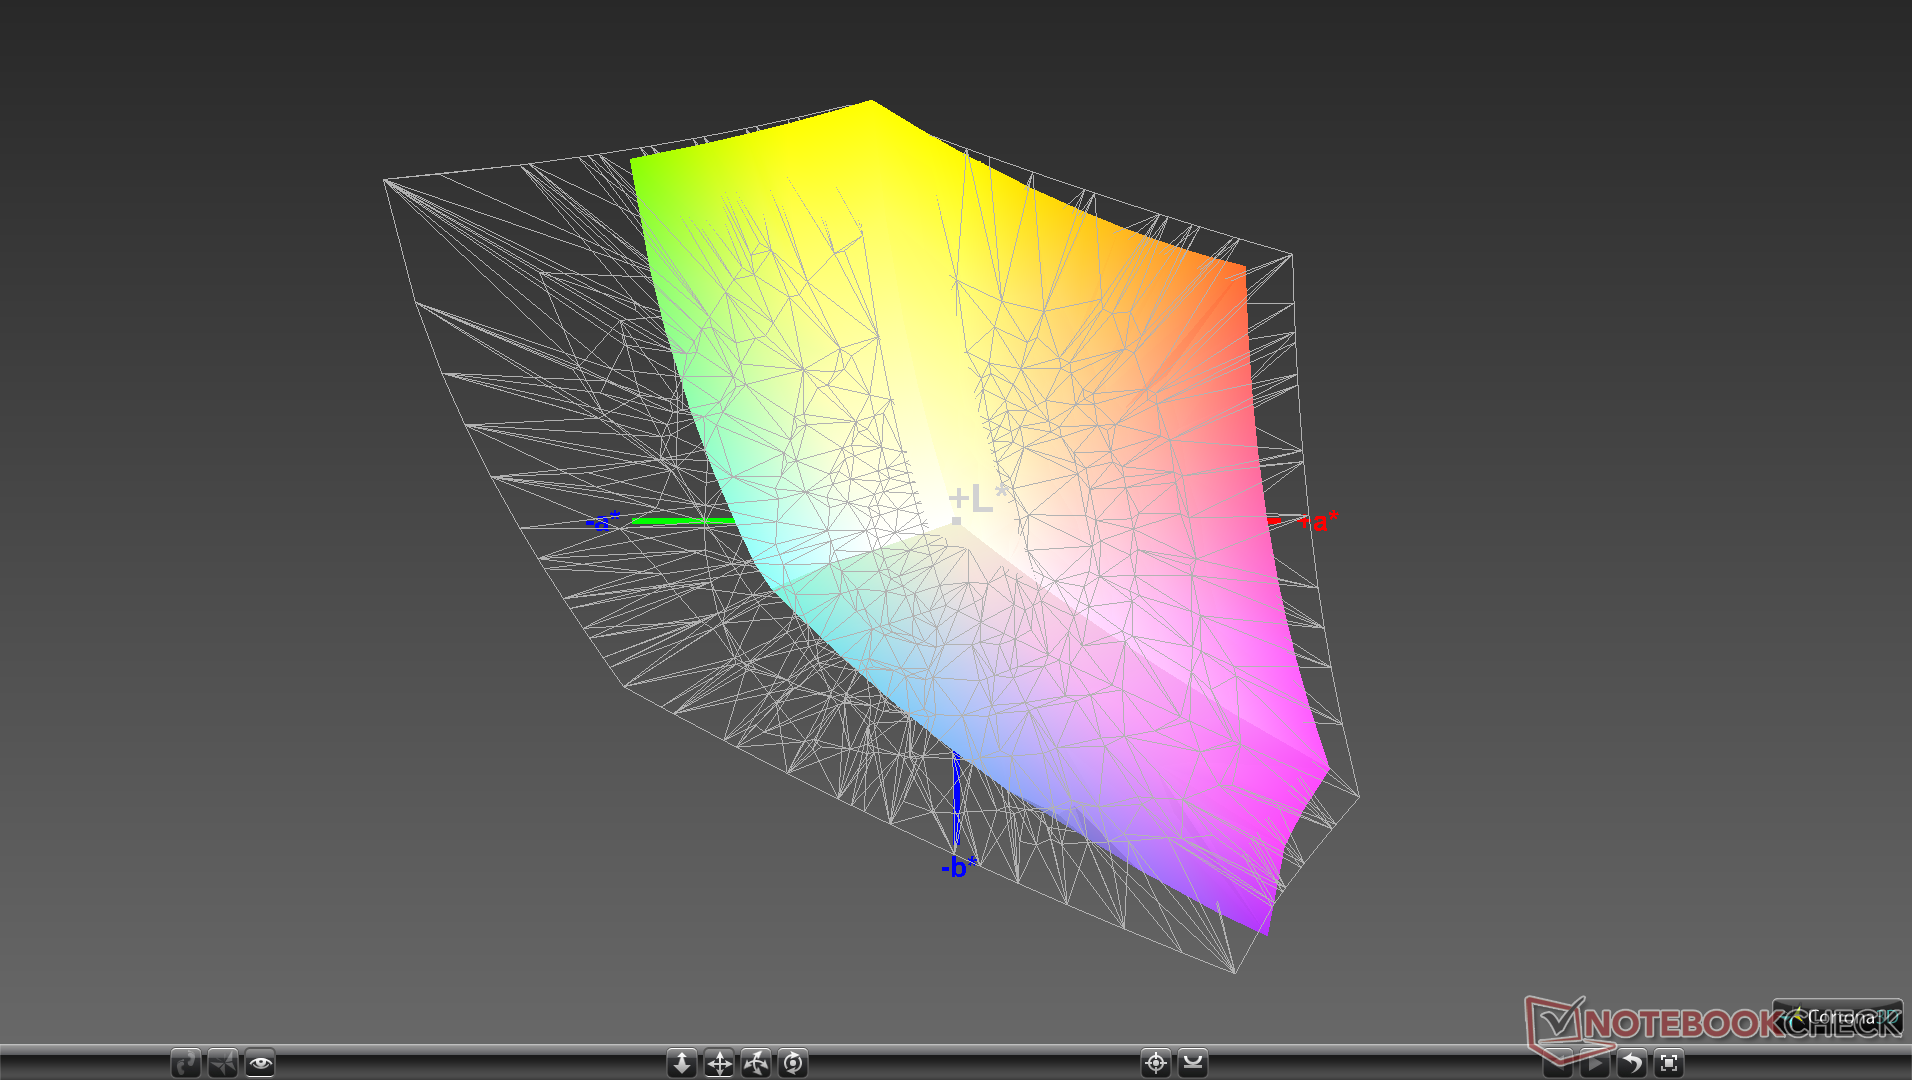
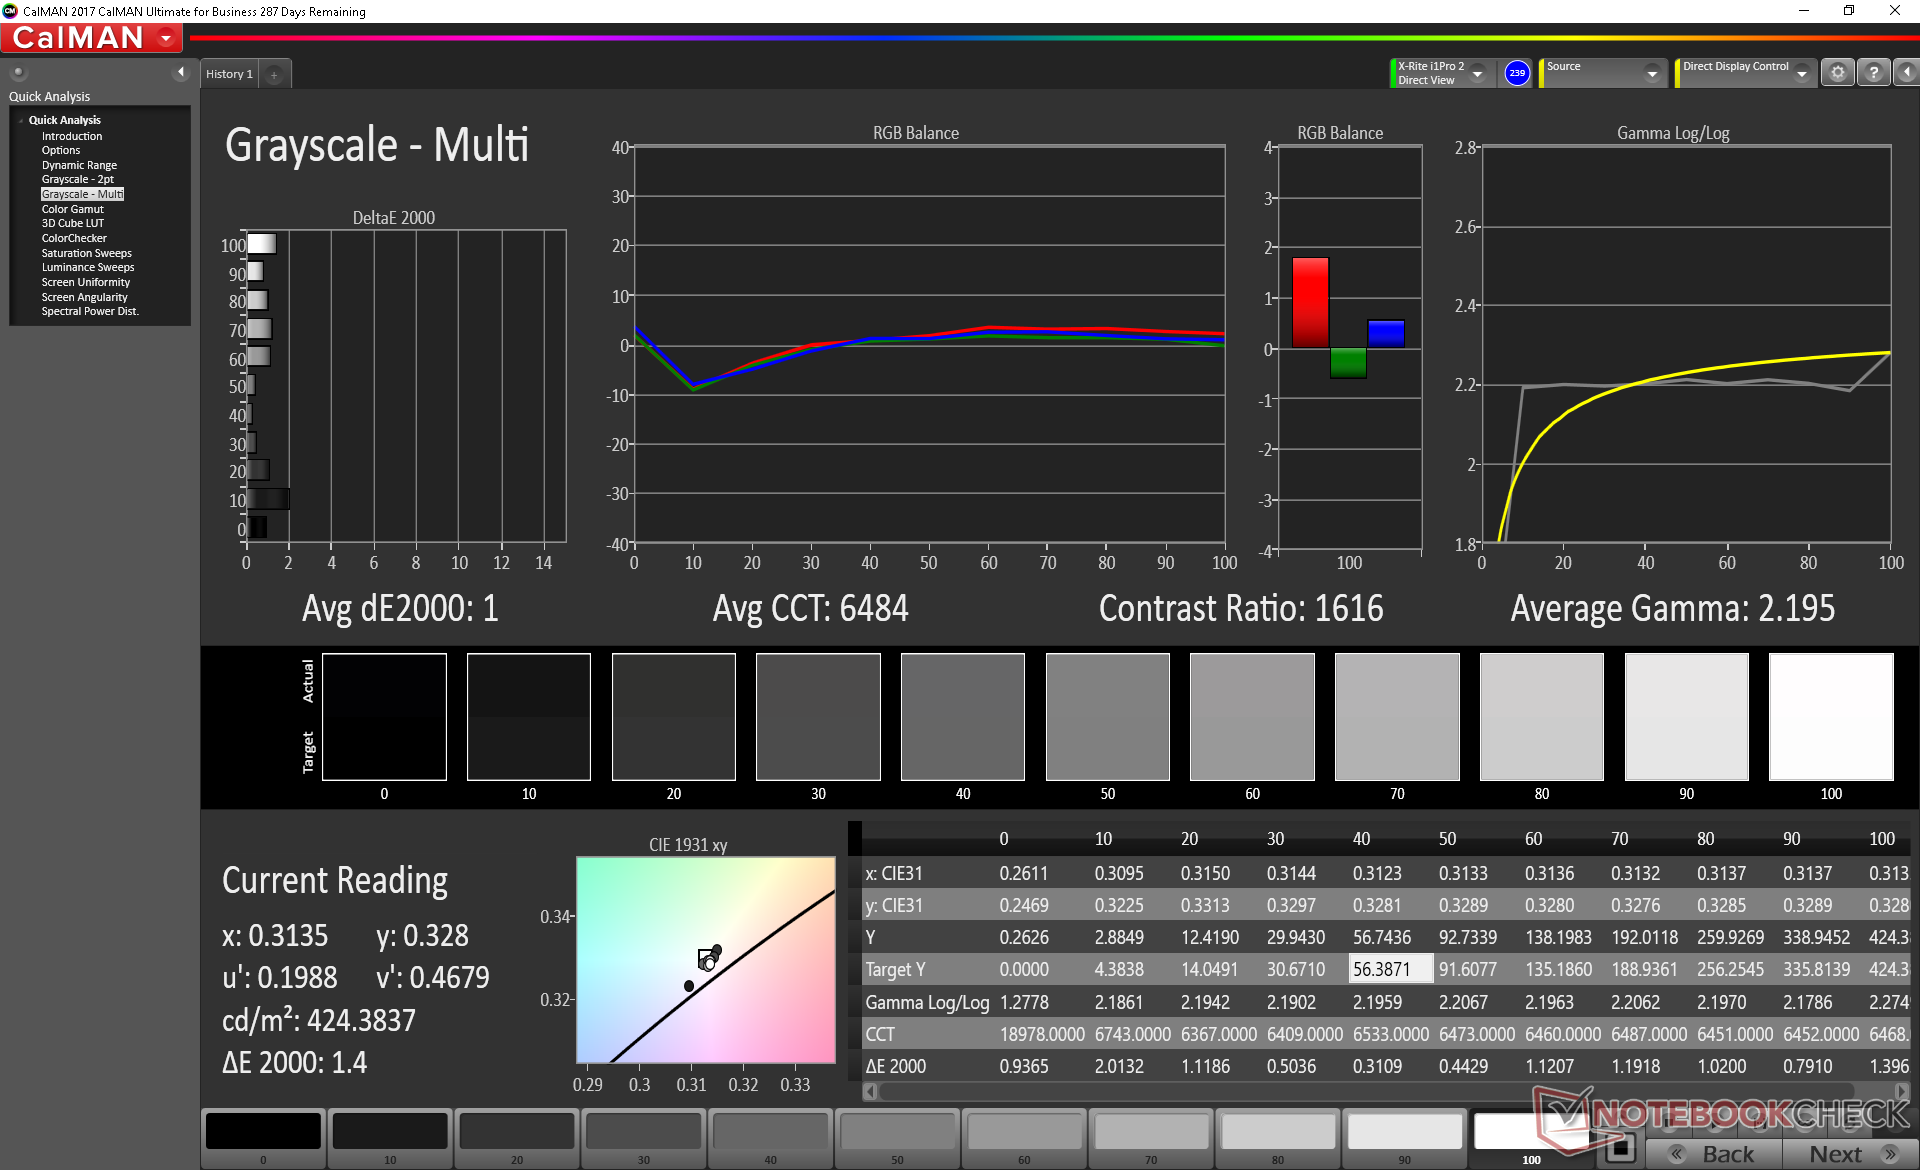
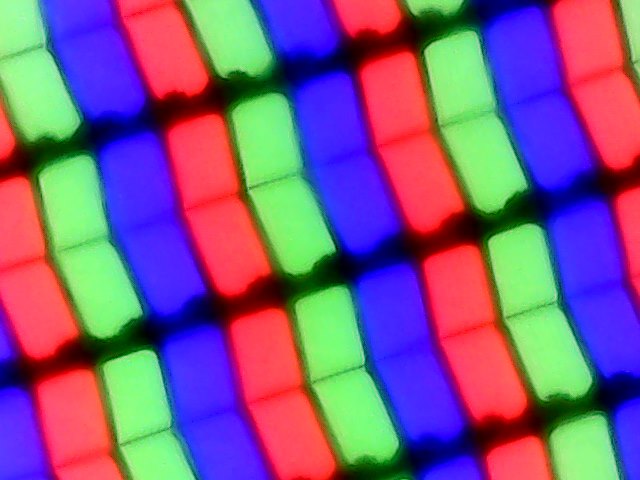
The 4K UHD touchscreen on our Core i7 SKU is the same high quality AU Optronics 282B B133ZAN IPS panel as found on our Core i5 SKU. Thus, all our existing comments still apply here. Dell advertises 100 percent sRGB coverage, a high 1500:1 contrast ratio, and a 400-nit backlight on its 4K UHD configuration. Our independent measurements more or less confirm these claims even though sRGB is closer to 95 percent than 100 percent.
The main drawback to the touchscreen continues to be its very slow black-white and gray-gray response times. Ghosting is more noticeable on the XPS 13 especially when compared to the 120 Hz panel on the EliteBook x360 1030 G3. Video playback becomes significantly smoother and clearer on other laptops where ghosting is less of an issue. We're hopeful that Dell will one day offer 120 Hz or 144 Hz panels with 5 ms or 3 ms response times in the future.
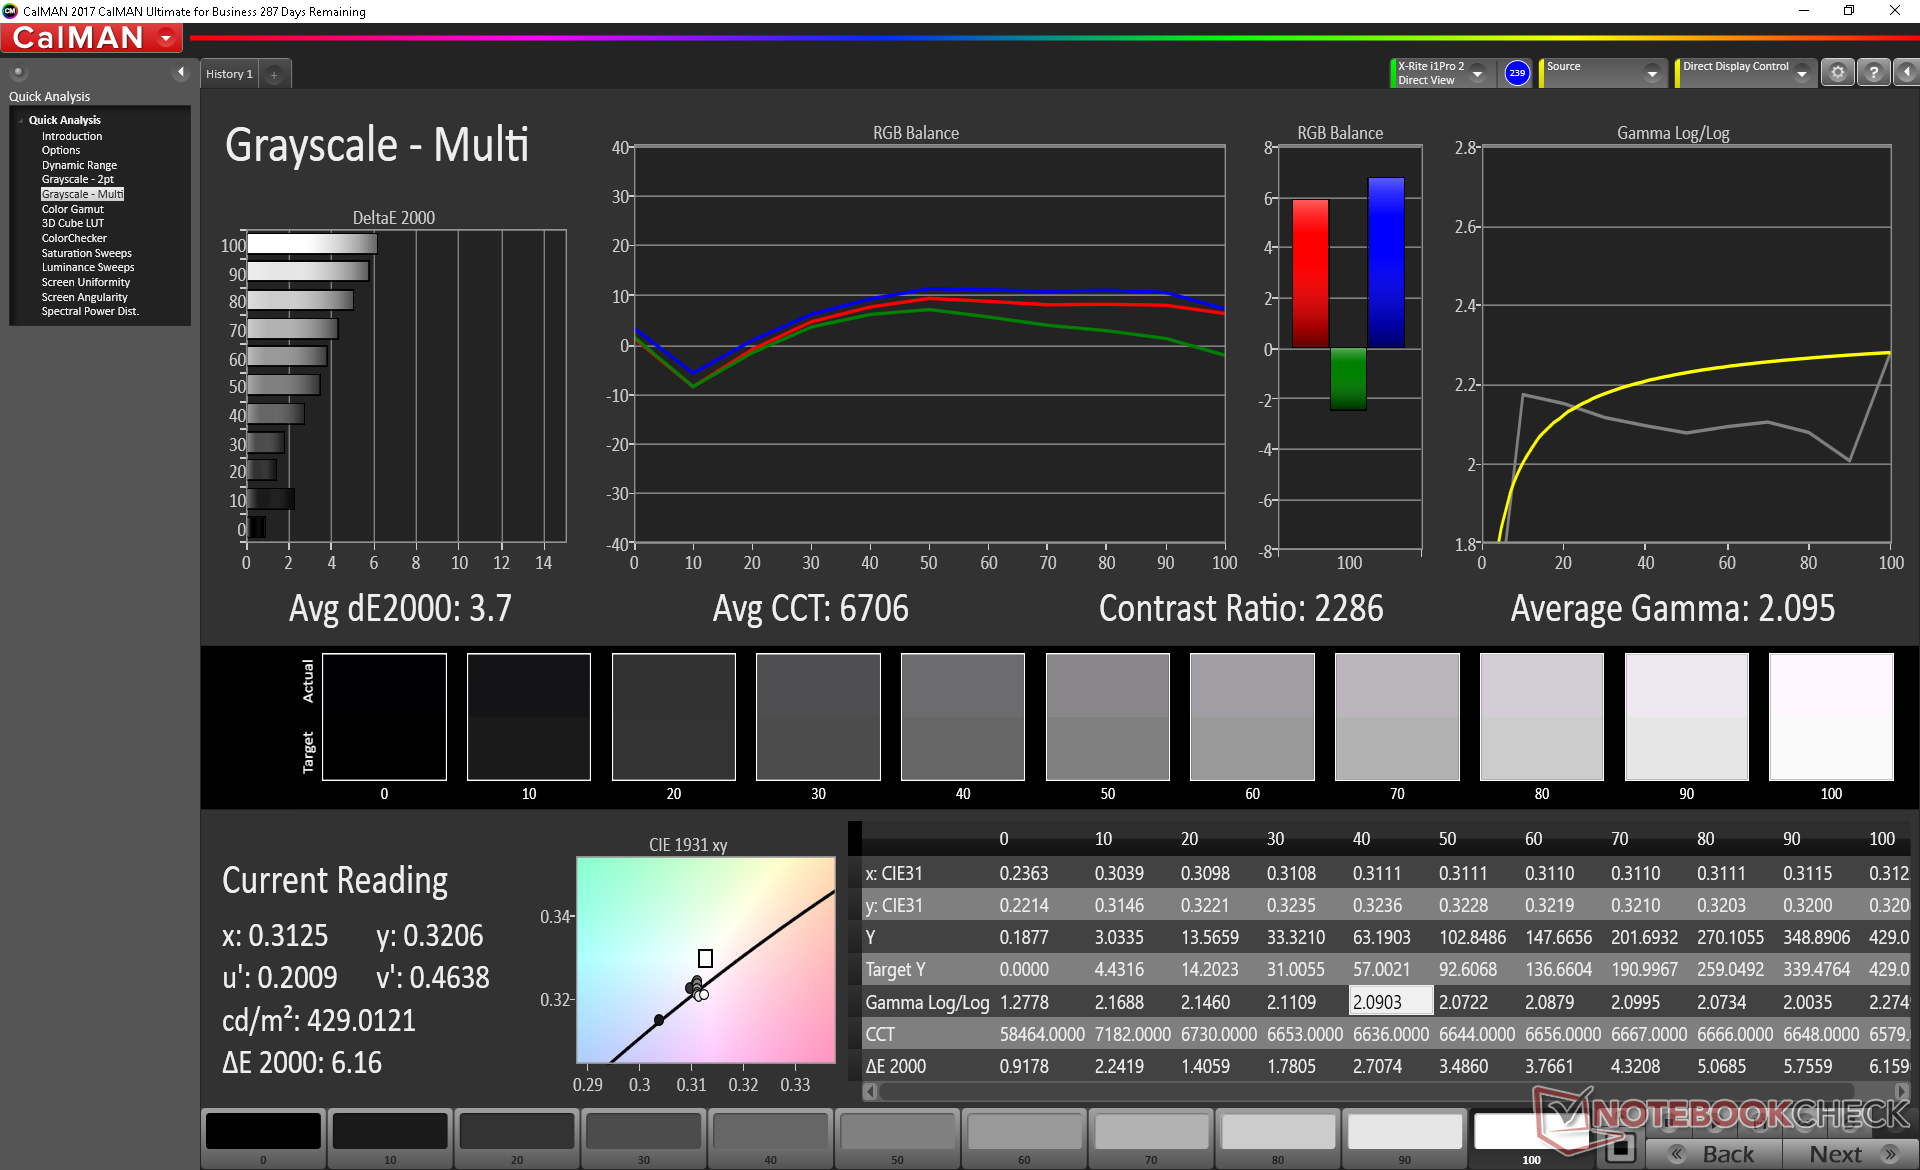
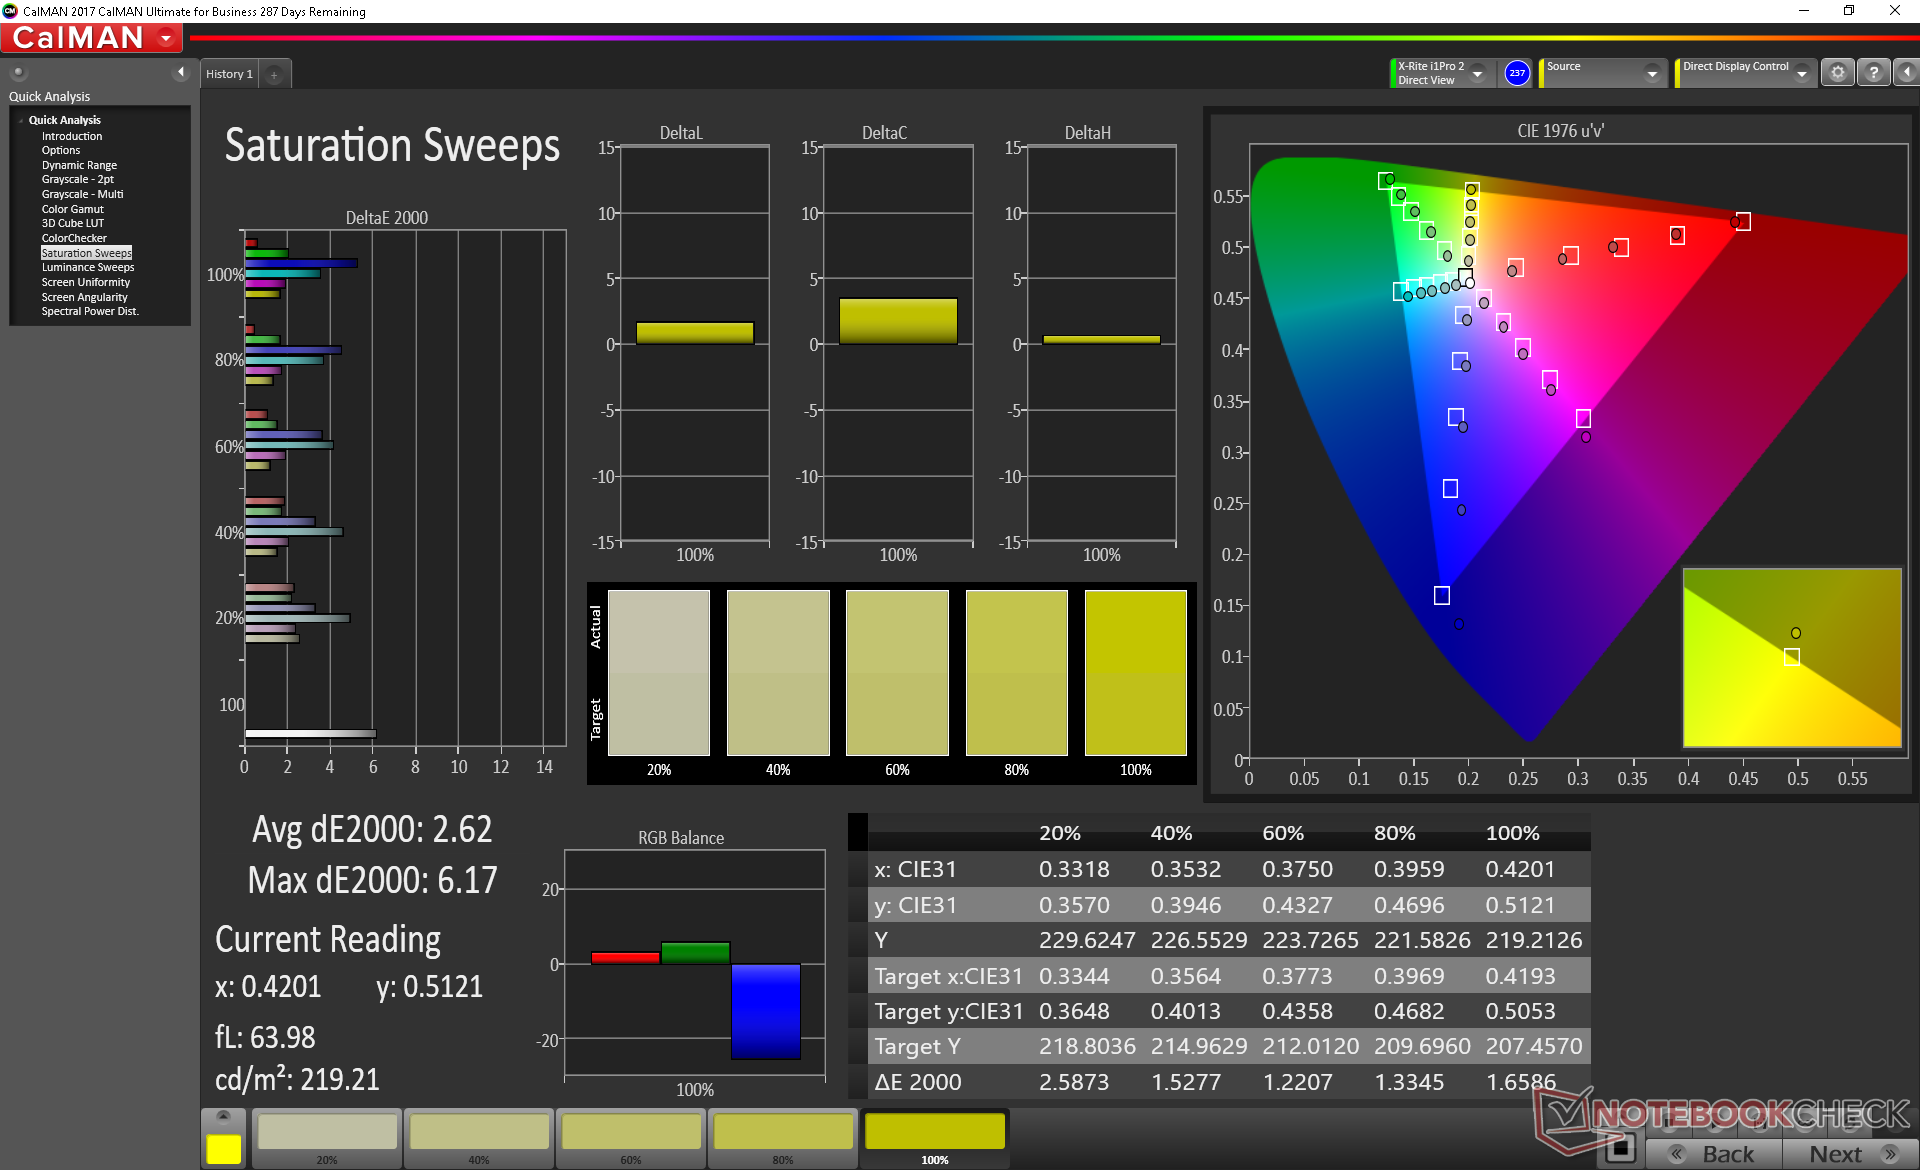
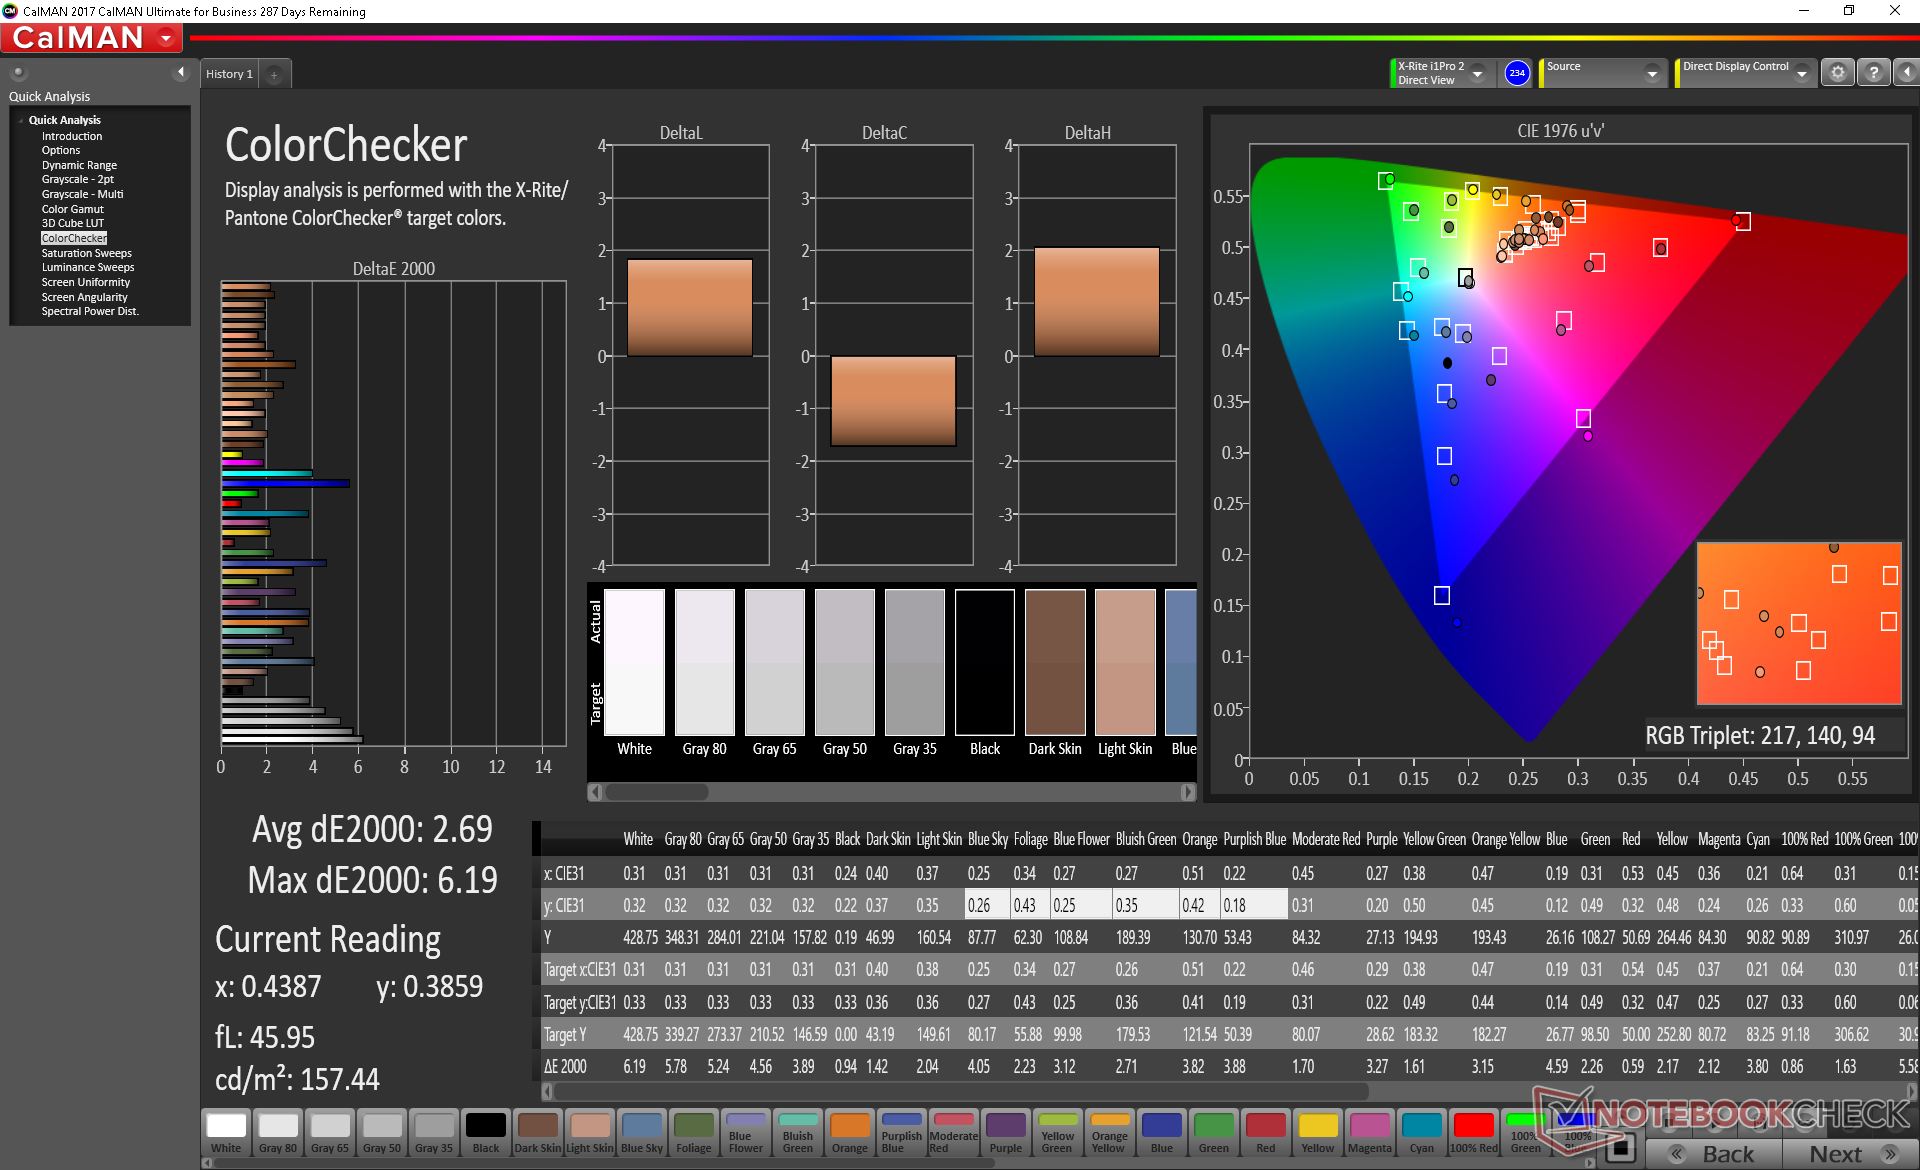
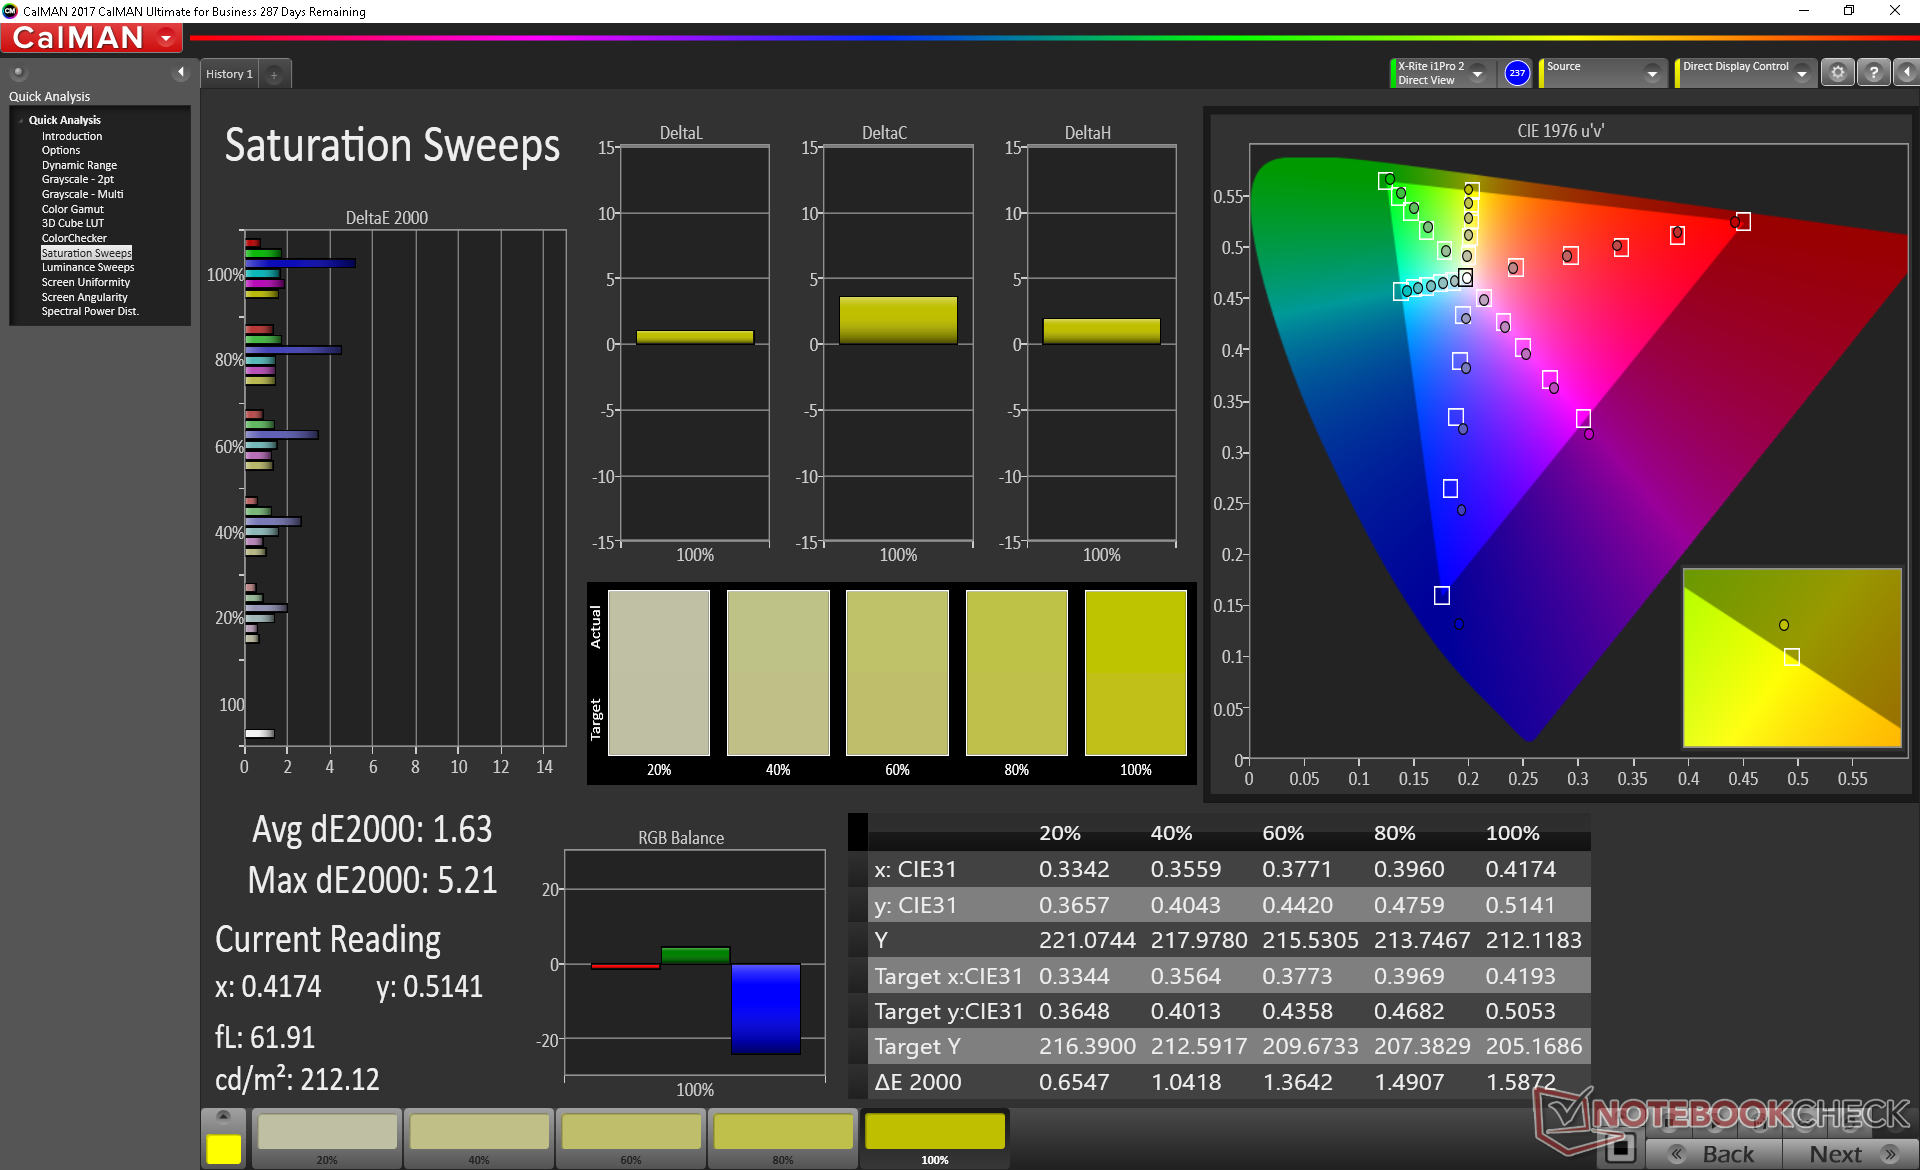
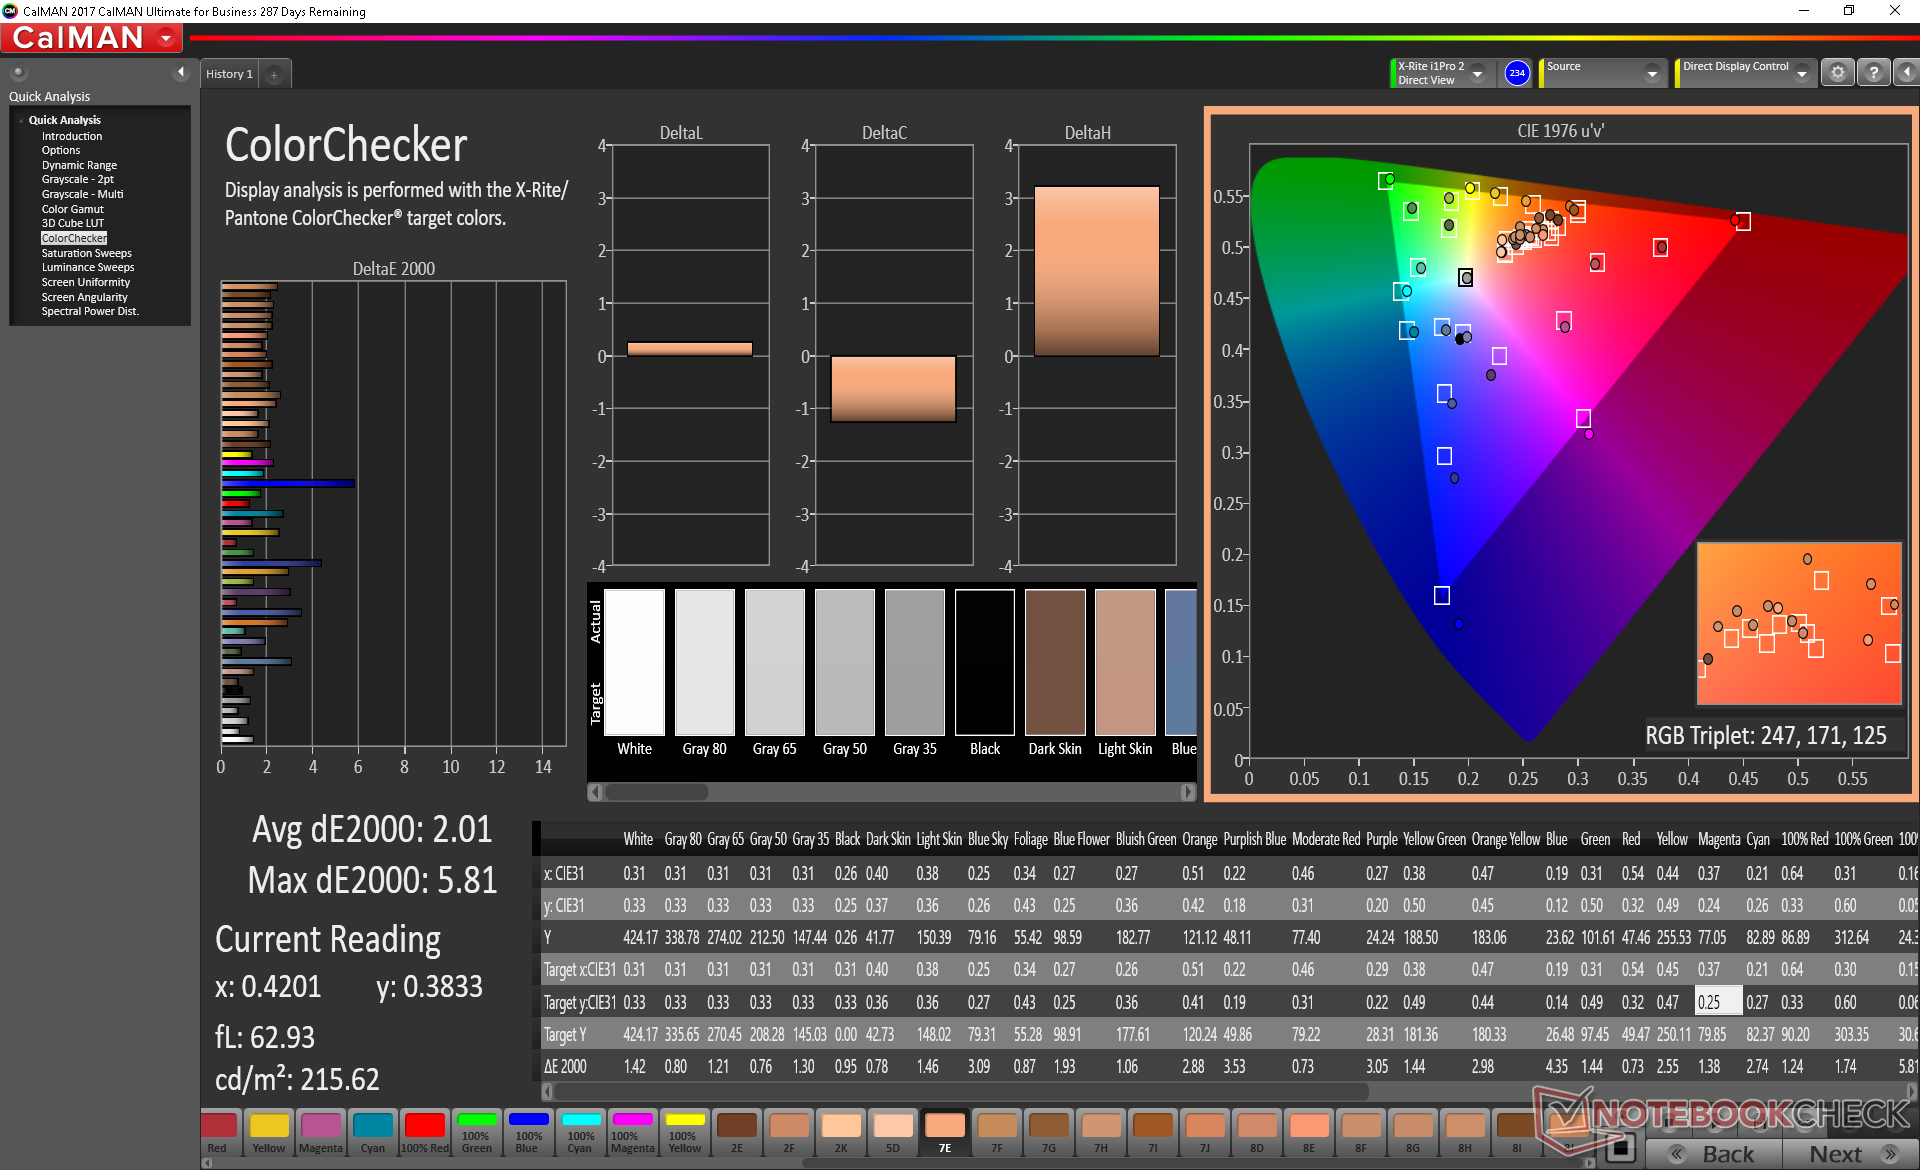
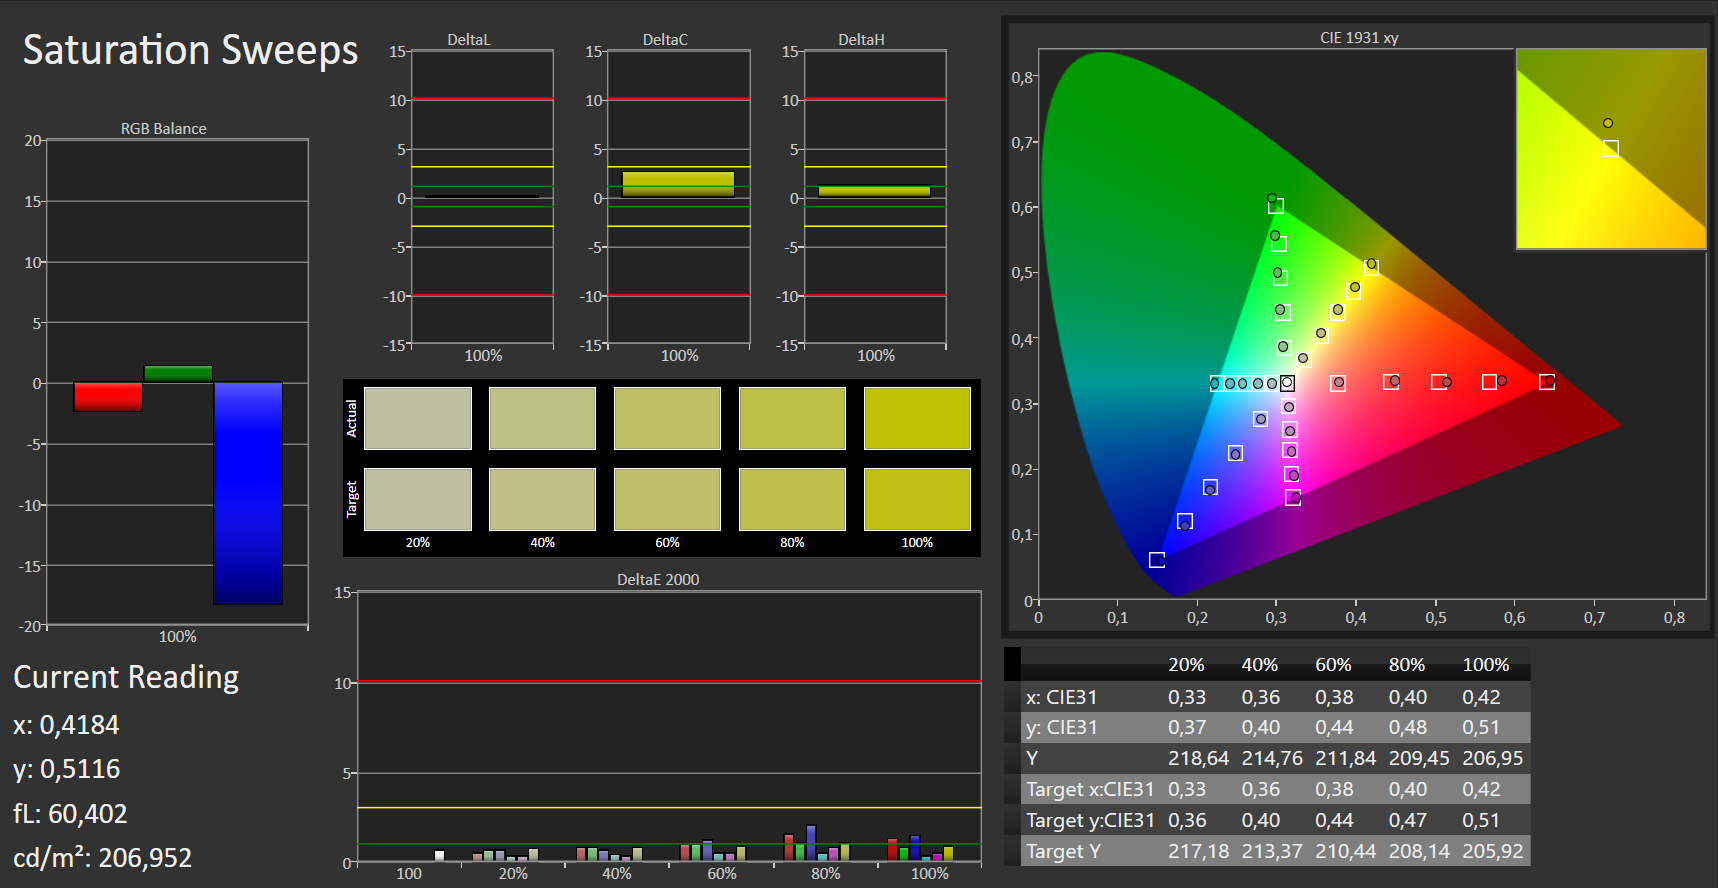
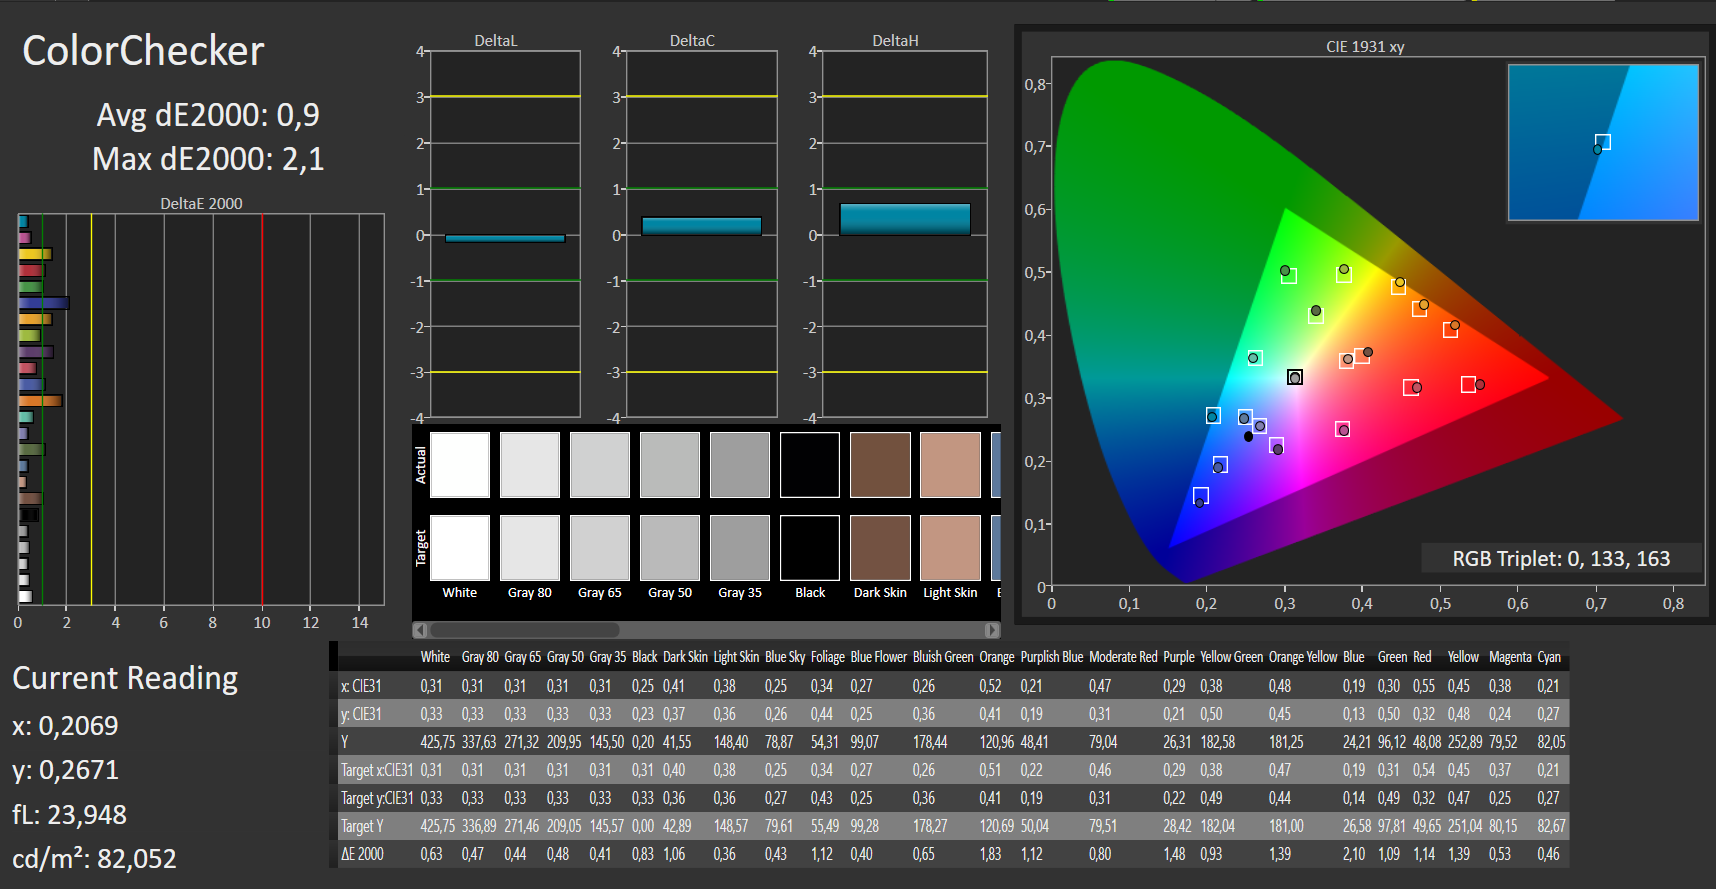
Further measurements with an X-Rite colorimeter reveal generally accurate colors and grayscale out of the box. Our own calibration improves grayscale and colors even further. Blue, however, appears to be the least accurate out of all all tested colors.
The pre-installed Dell CinemaColor software has preset color settings for Movie, Evening (blue-light filter), Sports, and Animation. It carries no manual sliders or any other controls.


| |||||||||||||||||||||||||
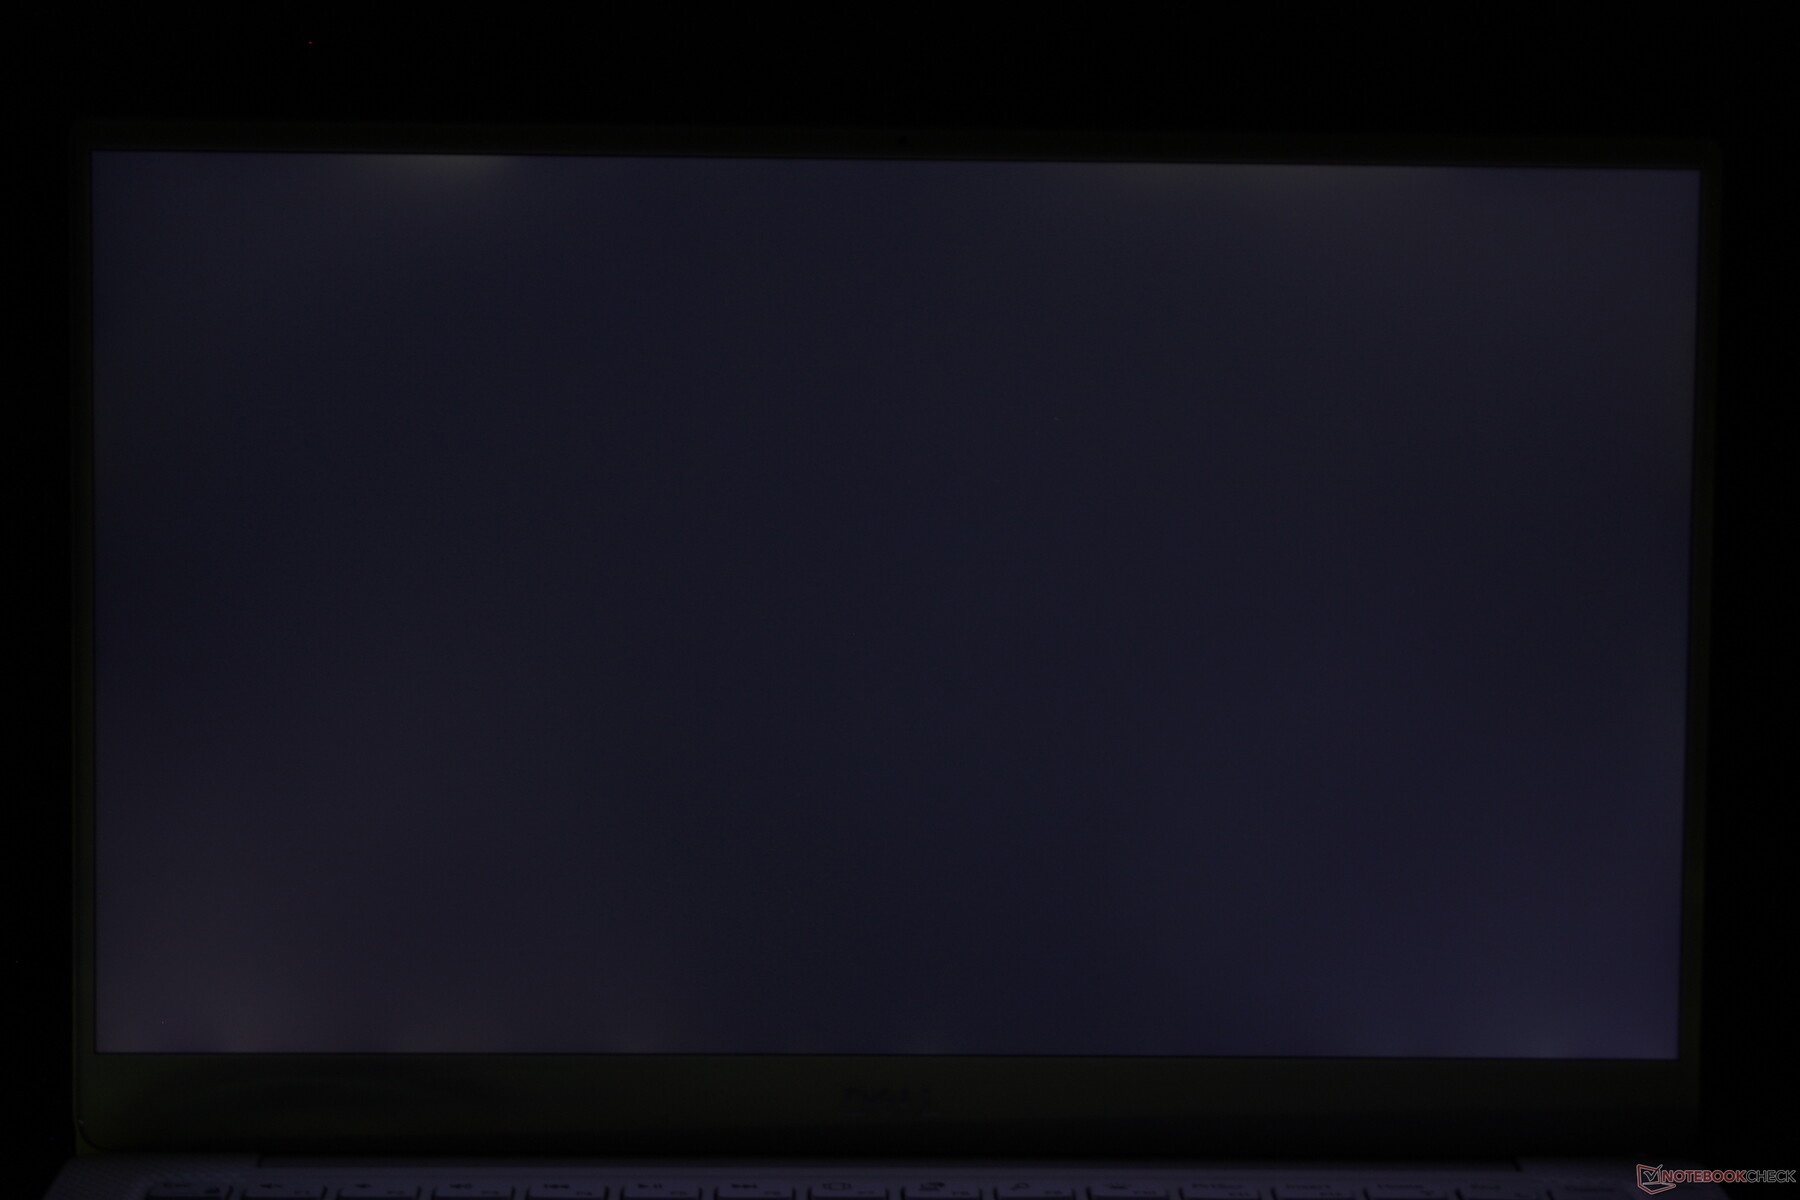
Brightness Distribution: 88 %
Center on Battery: 370.2 cd/m²
Contrast: 1586:1 (Black: 0.27 cd/m²)
ΔE ColorChecker Calman: 2.69 | ∀{0.5-29.43 Ø4.71}
calibrated: 2.01
ΔE Greyscale Calman: 3.7 | ∀{0.09-98 Ø4.96}
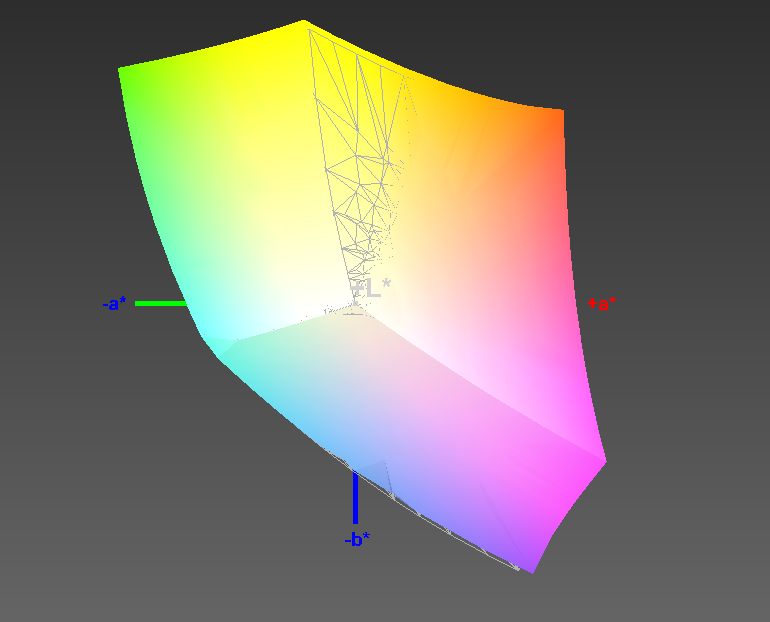
93.5% sRGB (Argyll 1.6.3 3D)
60.4% AdobeRGB 1998 (Argyll 1.6.3 3D)
65.8% AdobeRGB 1998 (Argyll 3D)
93.6% sRGB (Argyll 3D)
64.8% Display P3 (Argyll 3D)
Gamma: 2.1
CCT: 6706 K
| Dell XPS 13 9380 i7 4K ID: AUO 282B B133ZAN Dell: 90NTH, IPS, 13.3", 3840x2160 | Apple MacBook Pro 13 2018 Touchbar i5 APPA03E, IPS, 13.3", 2560x1600 | Asus ZenBook 13 UX333FA AU Optronics B133HAN05.C, IPS, 13.3", 1920x1080 | Dell XPS 13 9370 i7 UHD ID: Sharp SHP148B, Name: LQ133D1, Dell P/N: 8XDHY, IPS, 13.3", 3840x2160 | Dell XPS 13 9370 FHD i5 SHP1484, IPS, 13.3", 1920x1080 | Huawei MateBook 13 i7 Chi Mei CMN8201, IPS, 13", 2160x1440 | |
|---|---|---|---|---|---|---|
| Display | 31% | 5% | 6% | 5% | 5% | |
| Display P3 Coverage (%) | 64.8 | 98.5 52% | 67.9 5% | 68.9 6% | 68.9 6% | 68.1 5% |
| sRGB Coverage (%) | 93.6 | 99.9 7% | 97.4 4% | 98.4 5% | 96.6 3% | 97.7 4% |
| AdobeRGB 1998 Coverage (%) | 65.8 | 87.3 33% | 69.2 5% | 69.5 6% | 69.6 6% | 69.2 5% |
| Response Times | 23% | 9% | -12% | -8% | 25% | |
| Response Time Grey 50% / Grey 80% * (ms) | 64.8 ? | 46 ? 29% | 54.4 ? 16% | 69.6 ? -7% | 62.4 ? 4% | 43.2 ? 33% |
| Response Time Black / White * (ms) | 38 ? | 32 ? 16% | 37.6 ? 1% | 44 ? -16% | 45.6 ? -20% | 32 ? 16% |
| PWM Frequency (Hz) | 118000 ? | 3759 ? | 1008 ? | |||
| Screen | 21% | -19% | -2% | -6% | -8% | |
| Brightness middle (cd/m²) | 428.3 | 519 21% | 276 -36% | 478.5 12% | 428 0% | 366.6 -14% |
| Brightness (cd/m²) | 414 | 504 22% | 263 -36% | 466 13% | 405 -2% | 360 -13% |
| Brightness Distribution (%) | 88 | 95 8% | 89 1% | 86 -2% | 87 -1% | 93 6% |
| Black Level * (cd/m²) | 0.27 | 0.33 -22% | 0.21 22% | 0.43 -59% | 0.26 4% | 0.39 -44% |
| Contrast (:1) | 1586 | 1573 -1% | 1314 -17% | 1113 -30% | 1646 4% | 940 -41% |
| Colorchecker dE 2000 * | 2.69 | 1.4 48% | 4.85 -80% | 3.09 -15% | 3.8 -41% | 2.76 -3% |
| Colorchecker dE 2000 max. * | 6.19 | 2.8 55% | 8.24 -33% | 5.94 4% | 7.2 -16% | 6.19 -0% |
| Colorchecker dE 2000 calibrated * | 2.01 | 1.6 20% | 2.06 -2% | 1.53 24% | ||
| Greyscale dE 2000 * | 3.7 | 2.2 41% | 5.7 -54% | 2.4 35% | 4.4 -19% | 4.2 -14% |
| Gamma | 2.1 105% | 2.22 99% | 2.08 106% | 2.063 107% | 2.21 100% | 2.22 99% |
| CCT | 6706 97% | 6908 94% | 7424 88% | 6883 94% | 7067 92% | 6271 104% |
| Color Space (Percent of AdobeRGB 1998) (%) | 60.4 | 77.3 28% | 63 4% | 69.47 15% | 62.8 4% | 63.2 5% |
| Color Space (Percent of sRGB) (%) | 93.5 | 99.99 7% | 98 5% | 98.36 5% | 96.4 3% | 97.6 4% |
| Total Average (Program / Settings) | 25% /
23% | -2% /
-11% | -3% /
-2% | -3% /
-4% | 7% /
-2% |
* ... smaller is better
Display Response Times
| ↔ Response Time Black to White | ||
|---|---|---|
| 38 ms ... rise ↗ and fall ↘ combined | ↗ 19.2 ms rise | 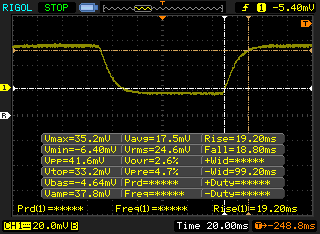 |
| ↘ 18.8 ms fall | ||
| The screen shows slow response rates in our tests and will be unsatisfactory for gamers. In comparison, all tested devices range from 0.1 (minimum) to 240 (maximum) ms. » 96 % of all devices are better. This means that the measured response time is worse than the average of all tested devices (19.8 ms). | ||
| ↔ Response Time 50% Grey to 80% Grey | ||
| 64.8 ms ... rise ↗ and fall ↘ combined | ↗ 31.6 ms rise | 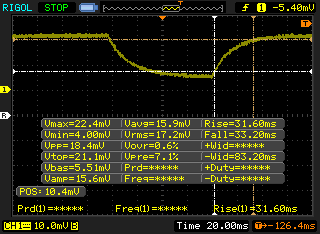 |
| ↘ 33.2 ms fall | ||
| The screen shows slow response rates in our tests and will be unsatisfactory for gamers. In comparison, all tested devices range from 0.165 (minimum) to 636 (maximum) ms. » 98 % of all devices are better. This means that the measured response time is worse than the average of all tested devices (30.9 ms). | ||
Screen Flickering / PWM (Pulse-Width Modulation)
| Screen flickering / PWM not detected | 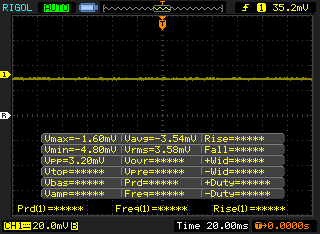 | ||
In comparison: 52 % of all tested devices do not use PWM to dim the display. If PWM was detected, an average of 7741 (minimum: 5 - maximum: 343500) Hz was measured. | |||
Display FHD Non-Touch

The matte FHD panel is also provided by AOU. Its resolution of 1920 x 1080 is obviously lower than on the 4K panel, however its brightness and contrast ratio remained identical 408 vs. 414 nits and 1,646:1 vs. 1,586:1.
Both panels are dimmed on battery as well, and the FHD panel’s brightness is reduced to 385 nits (4K: 370 nits). Brightness distribution is ever so slightly better on the 4K SKU (88 % vs. 84 %).
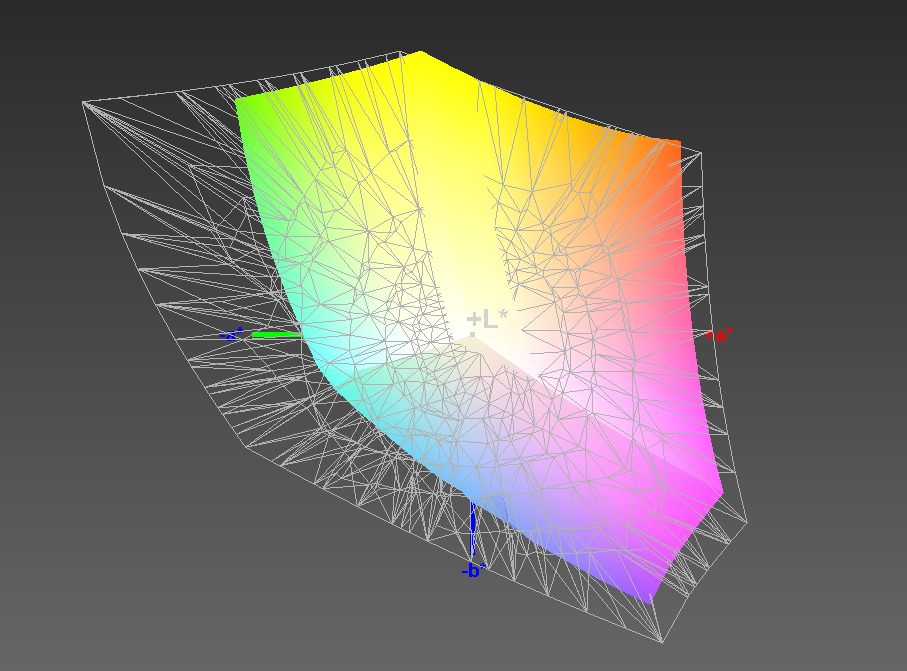
Color space coverage, on the other hand, is the FHD panel’s strong suit as it covers 65 % of AdobeRGB and 99 % of sRGB. Compare that to the 4K panel, which covered 60 % AdobeRGB and 93 % sRGB. In other words: the FHD SKU is much better suited for professional photo editing purposes where accurate color representation is key.
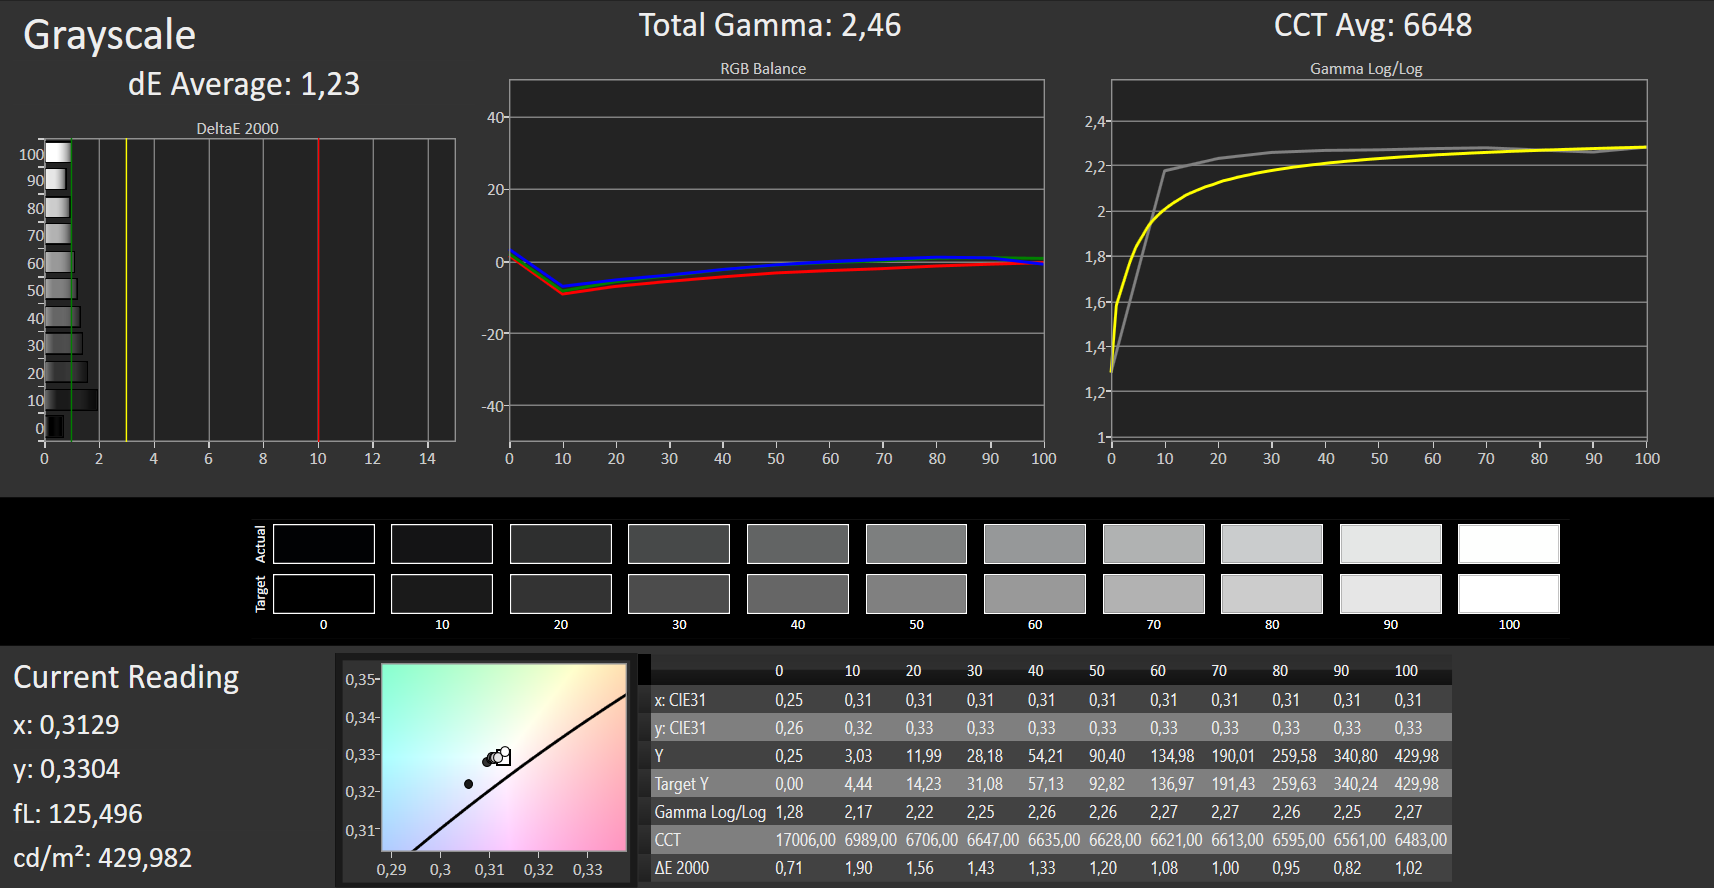
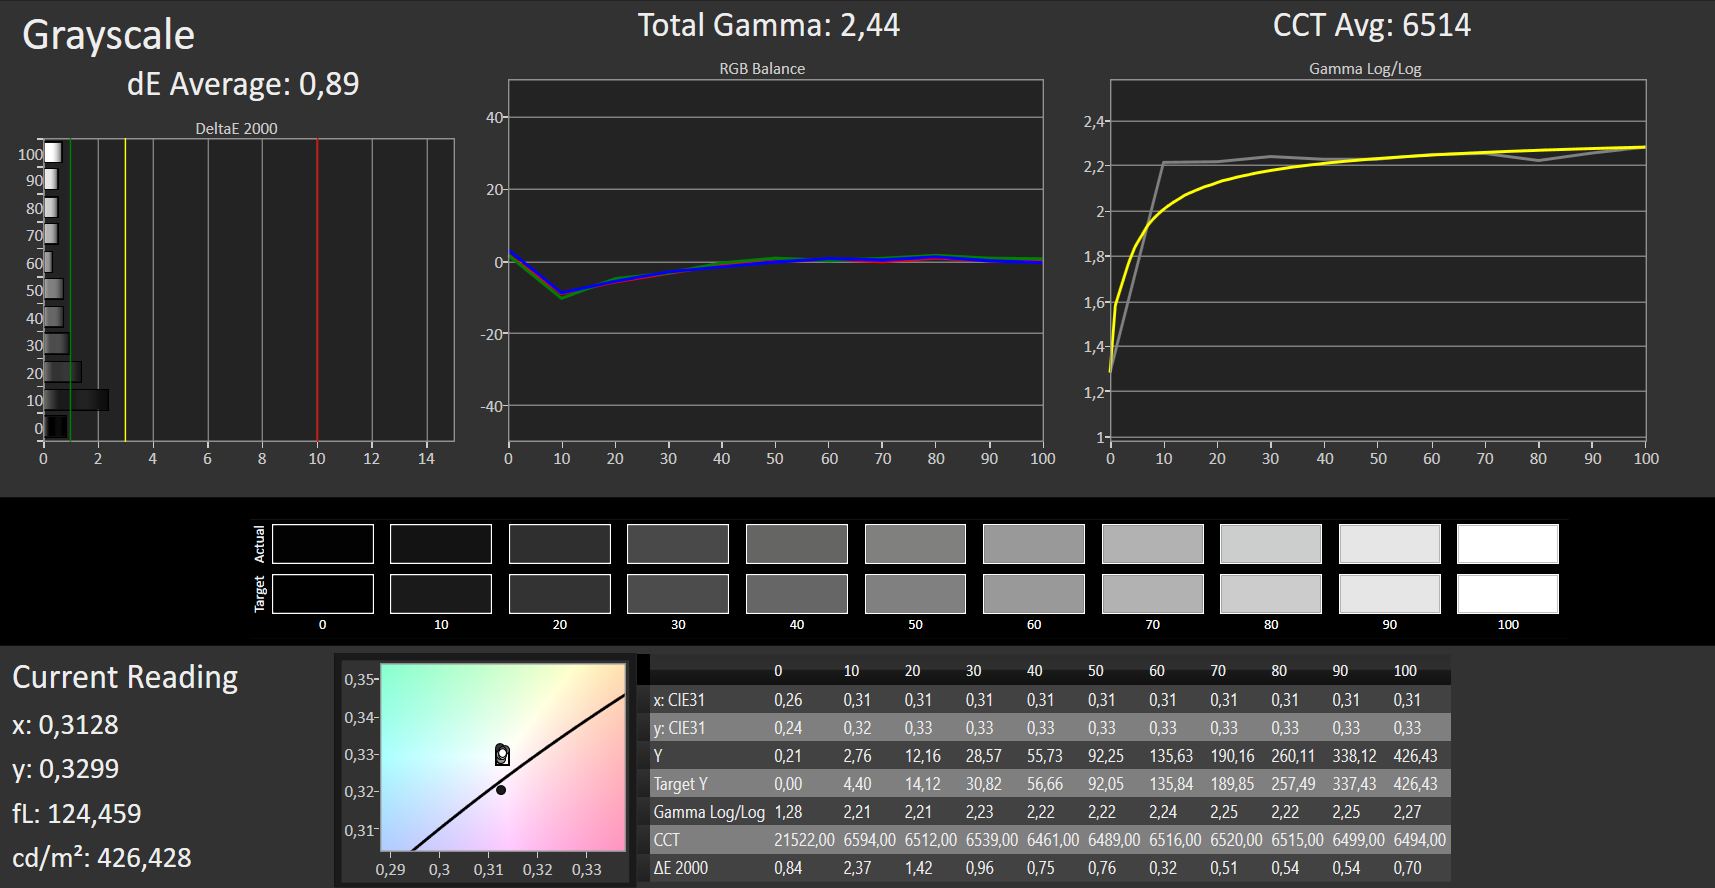
And while we are on the subject of accuracy, the FHD model was slightly more accurate out of the box already. The DeltaE for grayscale was just 1.23 (4: 3.7) prior to calibration, and we were able to lower it even further to 0.89 after calibration (4K: 1.0).
We failed to detect the blue tint that was present on the 4K panel, which explains the DeltaE of 3.7 for grayscale.
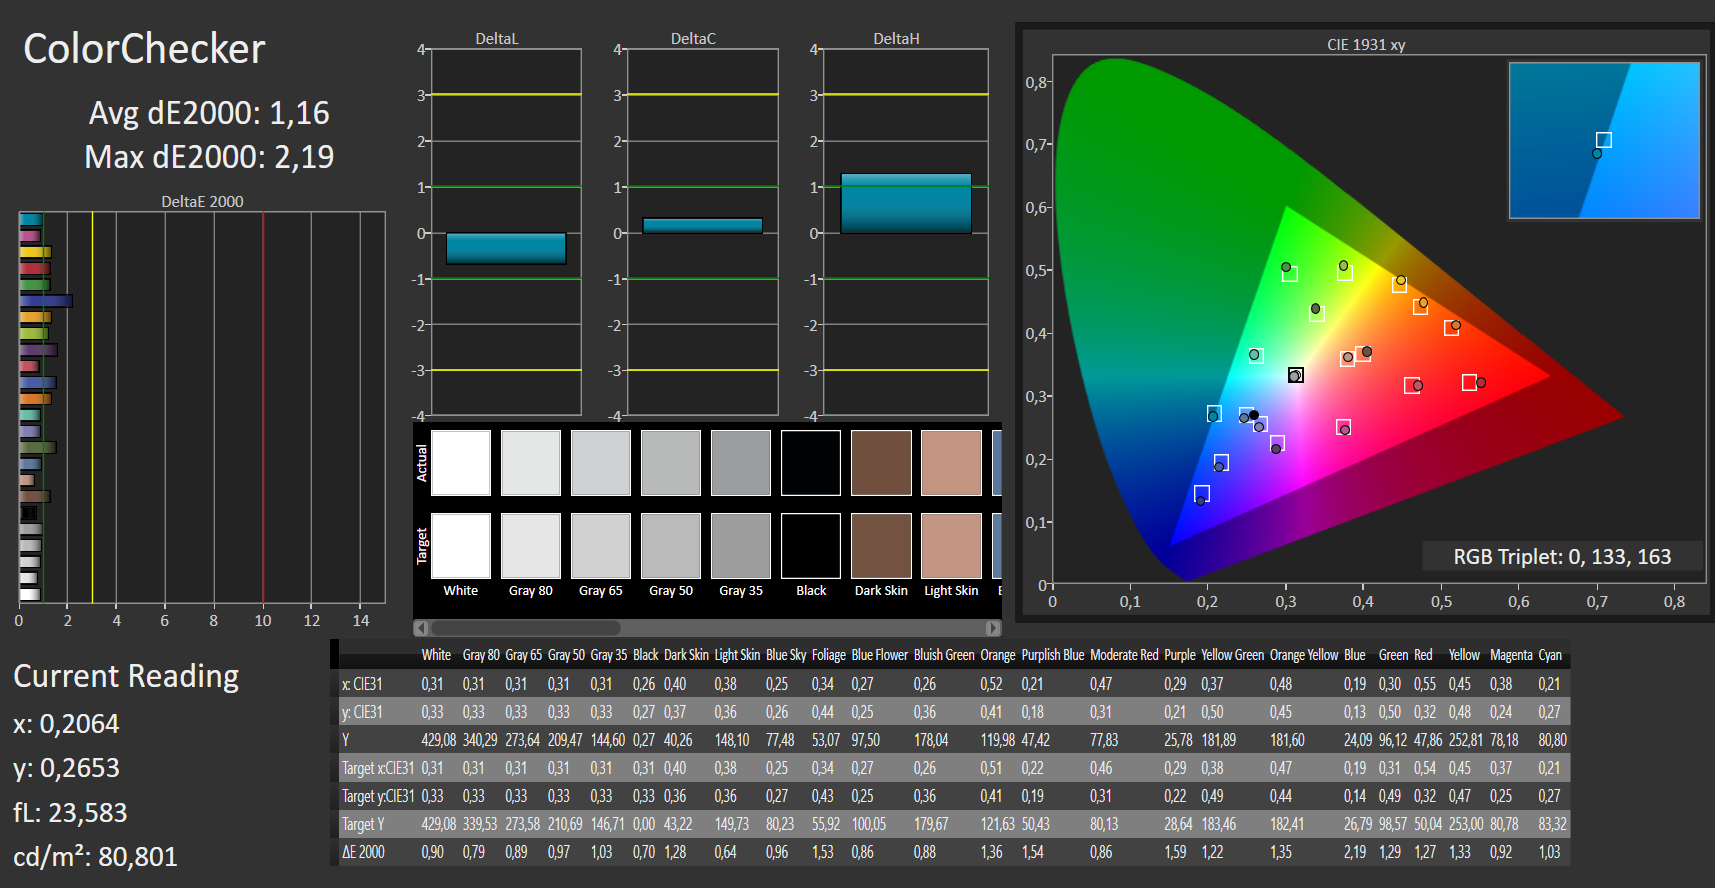
DeltaE for colors was just 1.2 and further reduced to 0.9 through calibration. Compare that to 2.7 prior to and 2.0 after calibration for the 4K SKU.
Just like on the 4K SKU we found no traces of PWM on the FHD SKU either. Response times were slightly lower but were still far from good and remained average for a typical IPS panel. Given that this is a standard 60 Hz panel the response times for black-to-black and gray-to-gray are far from ideal.
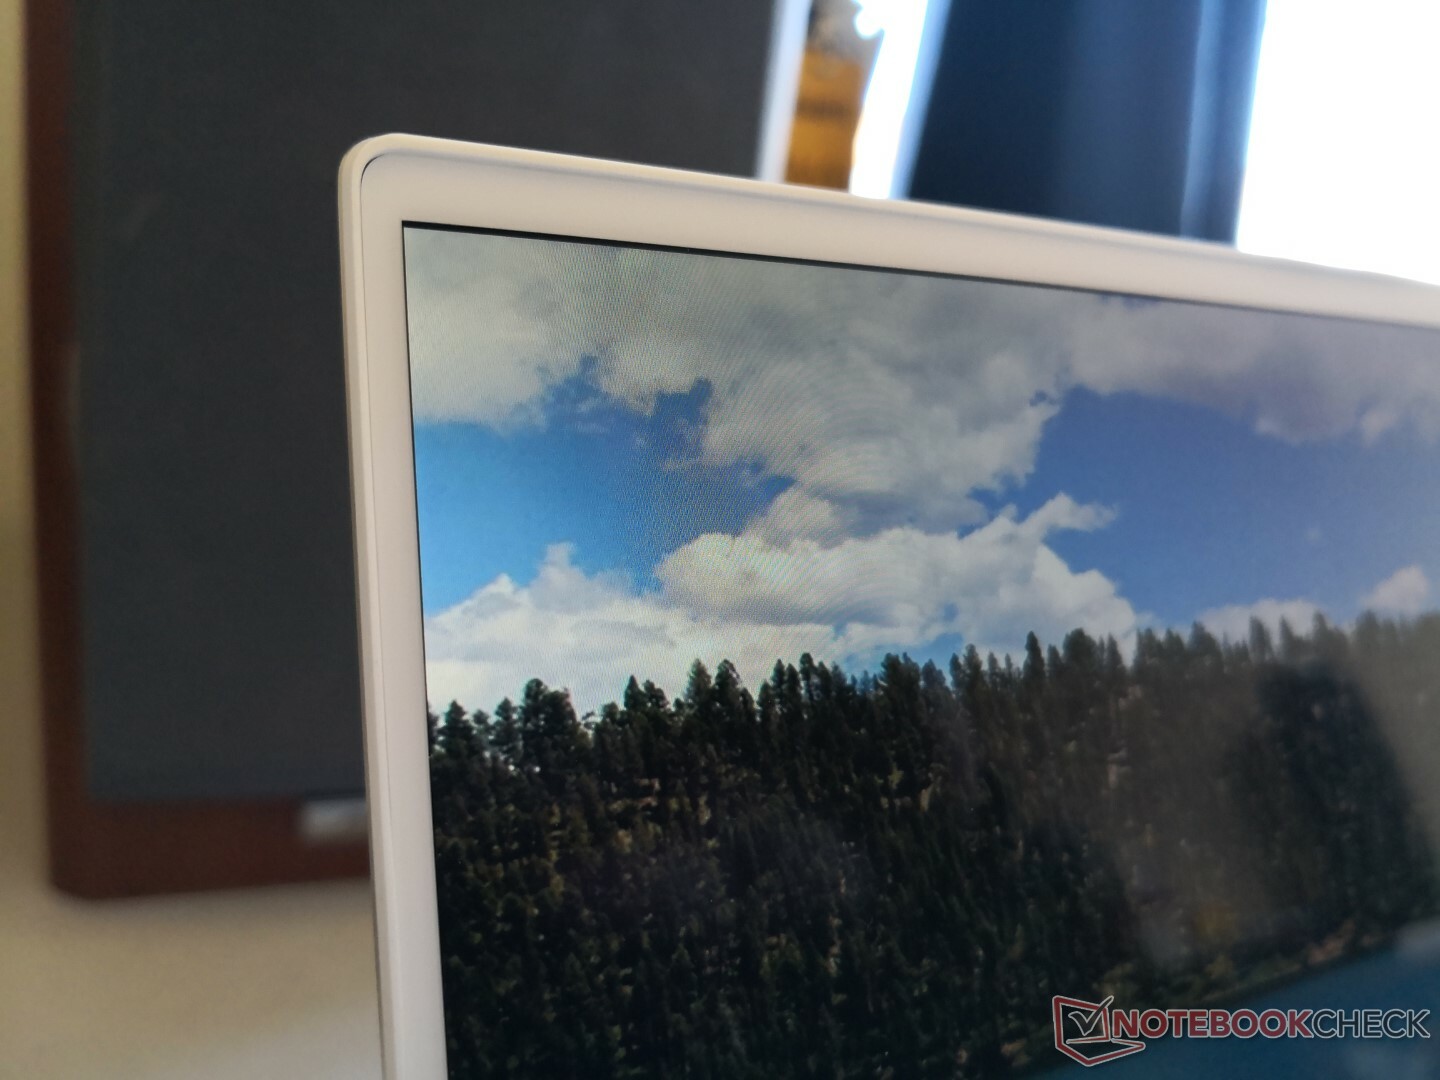
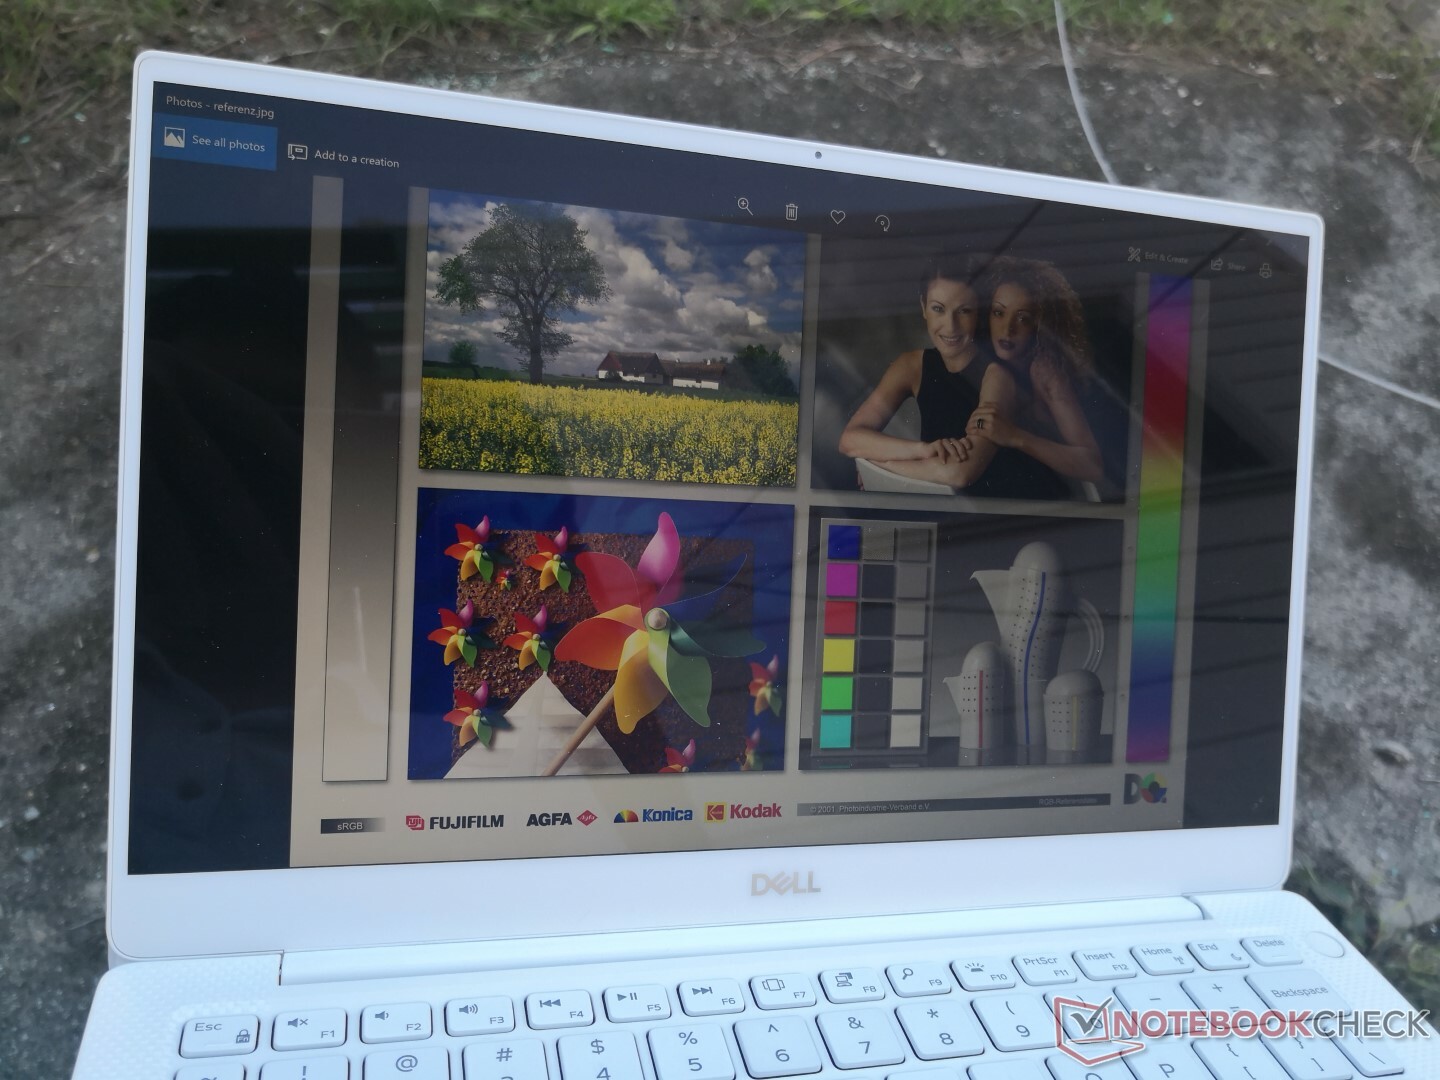
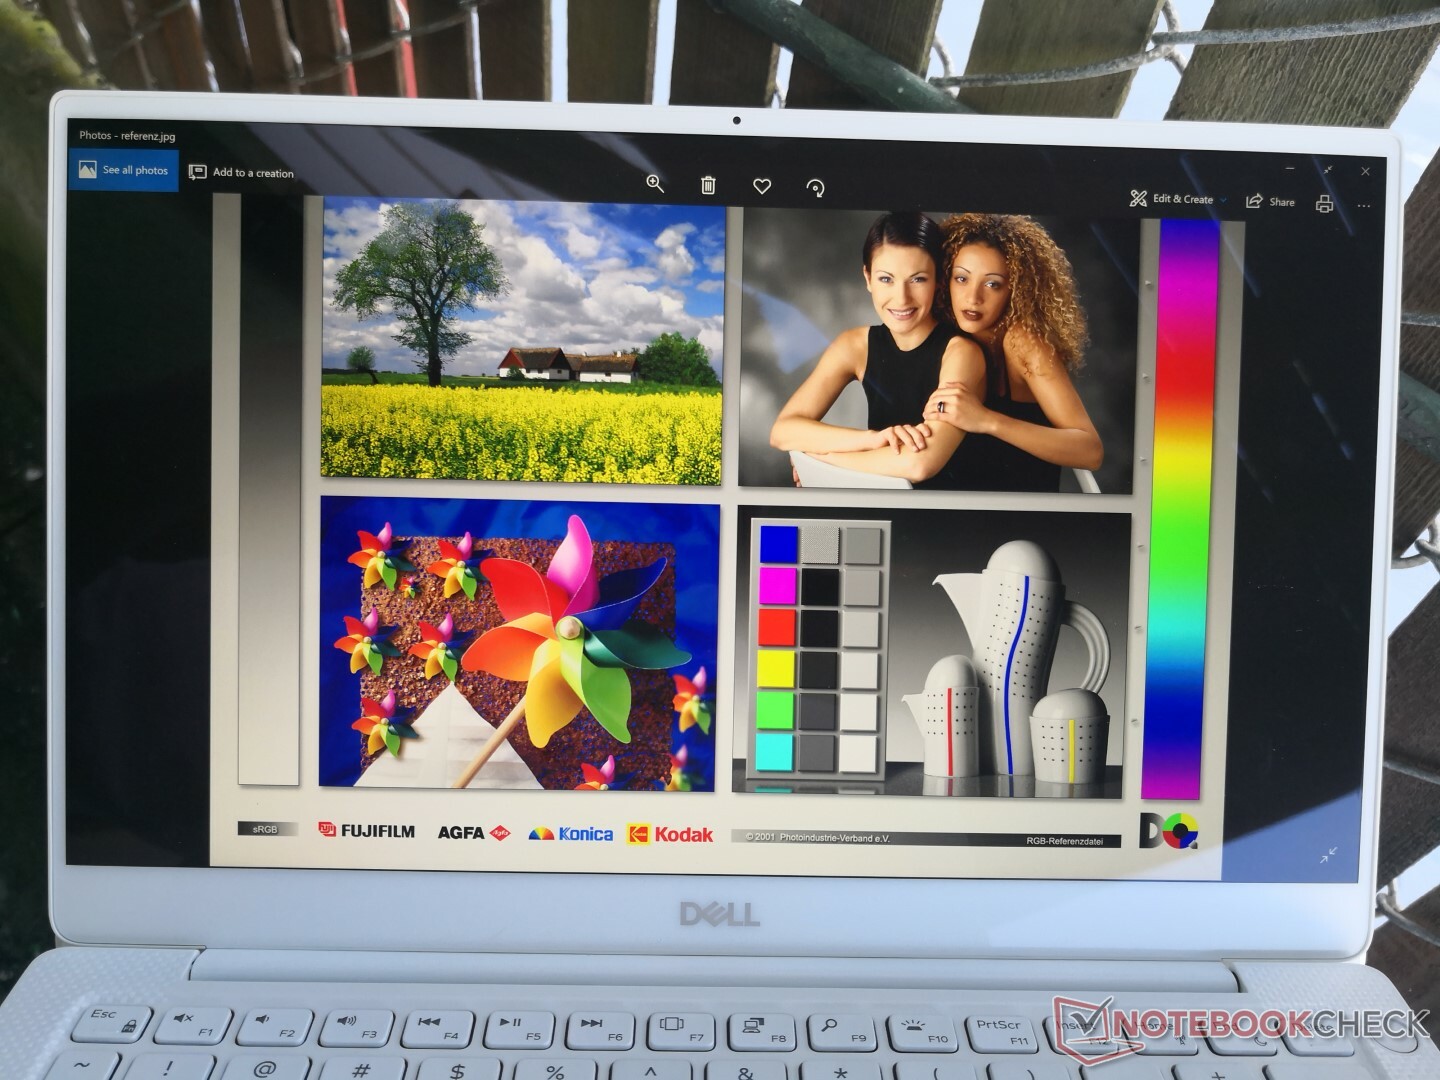
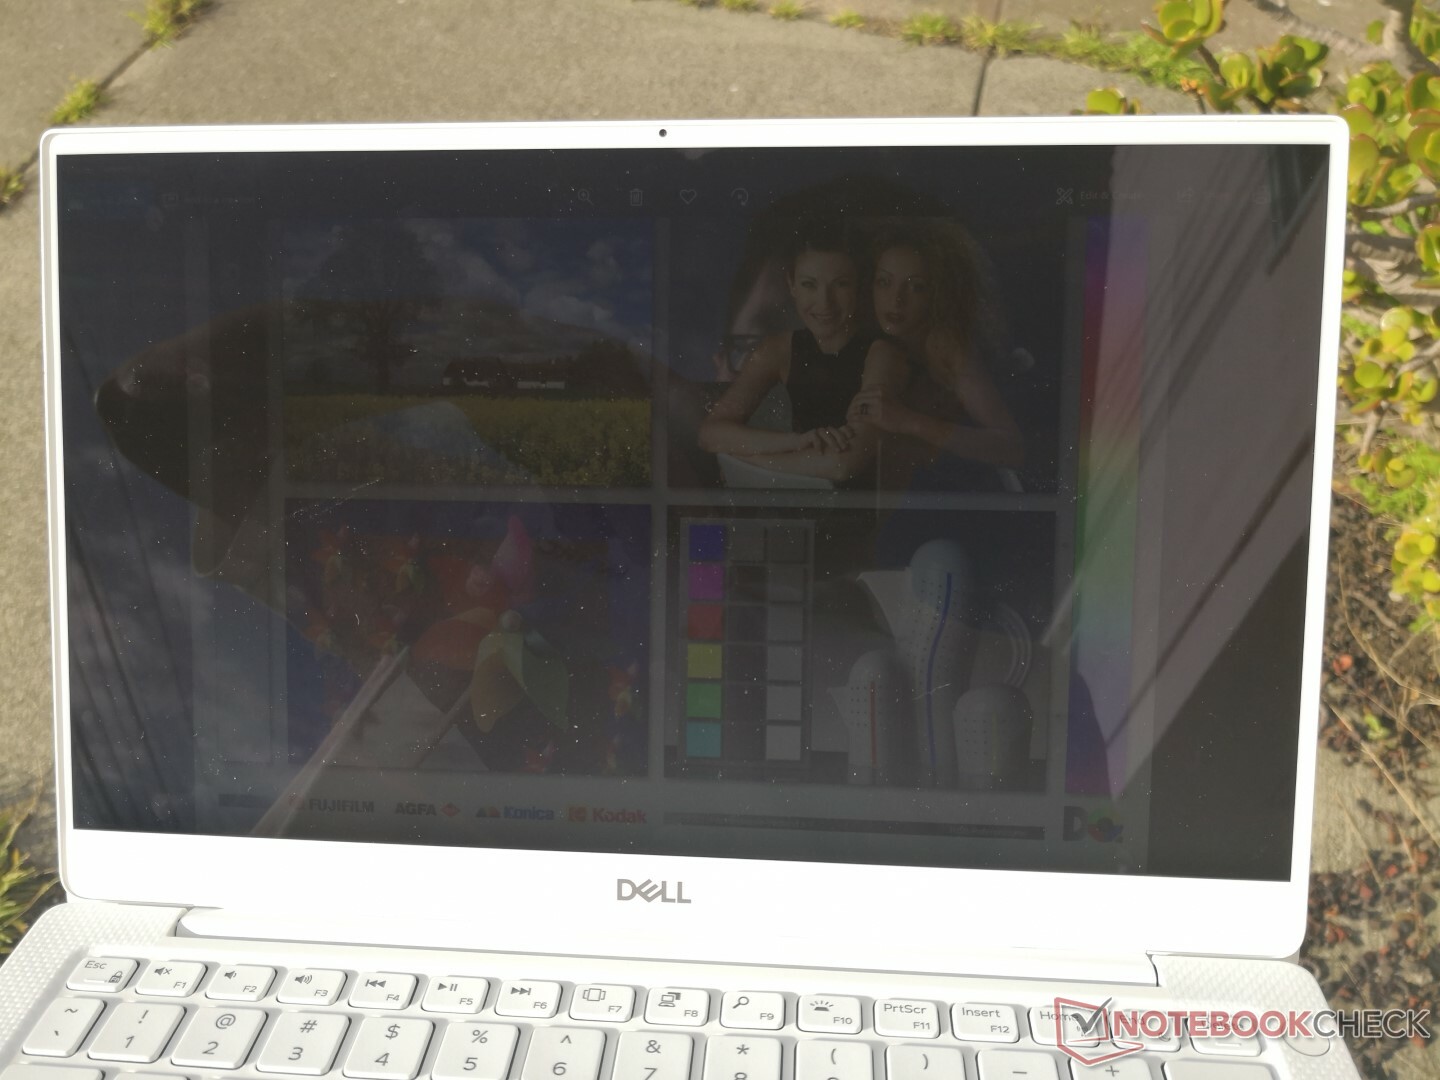
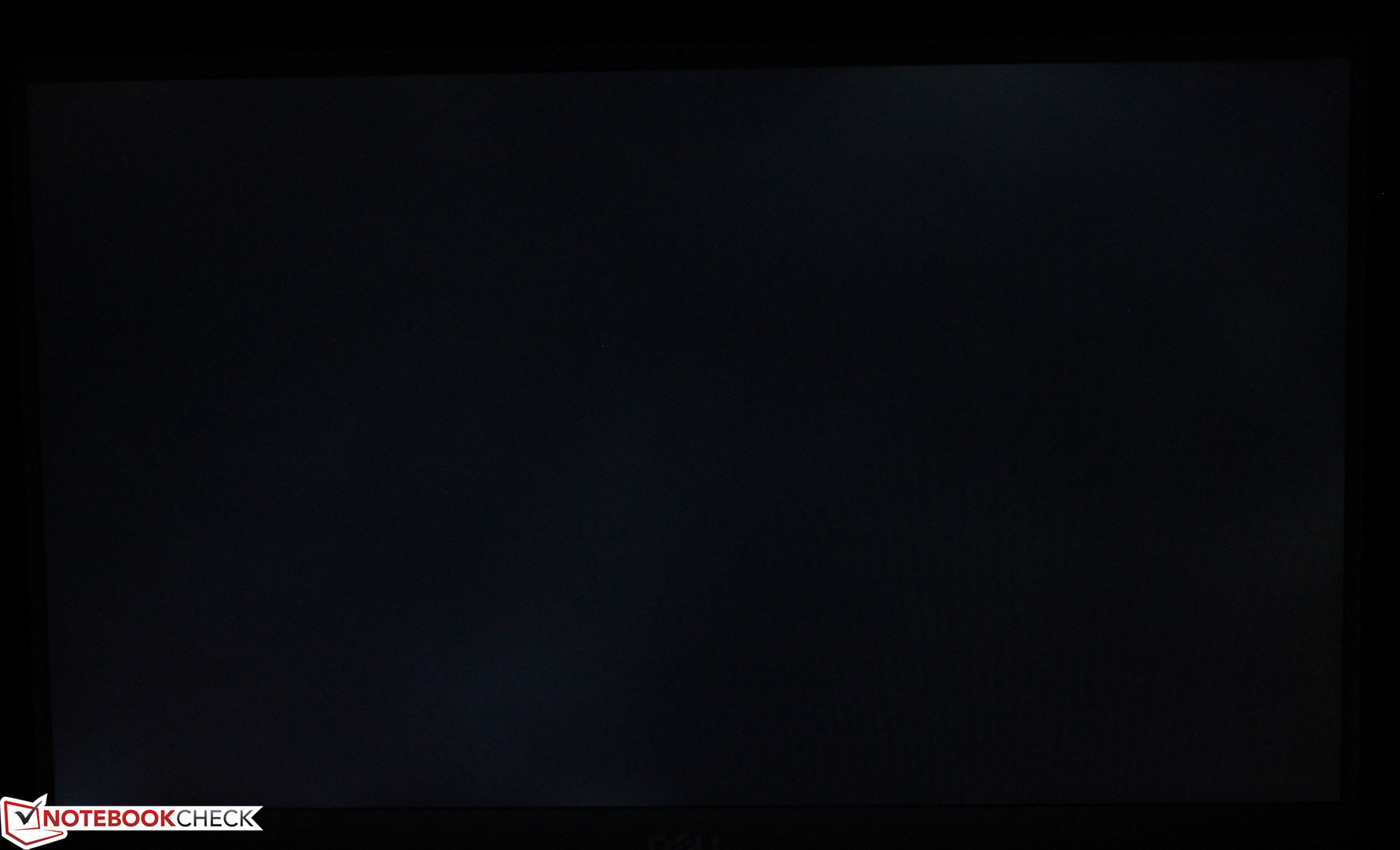
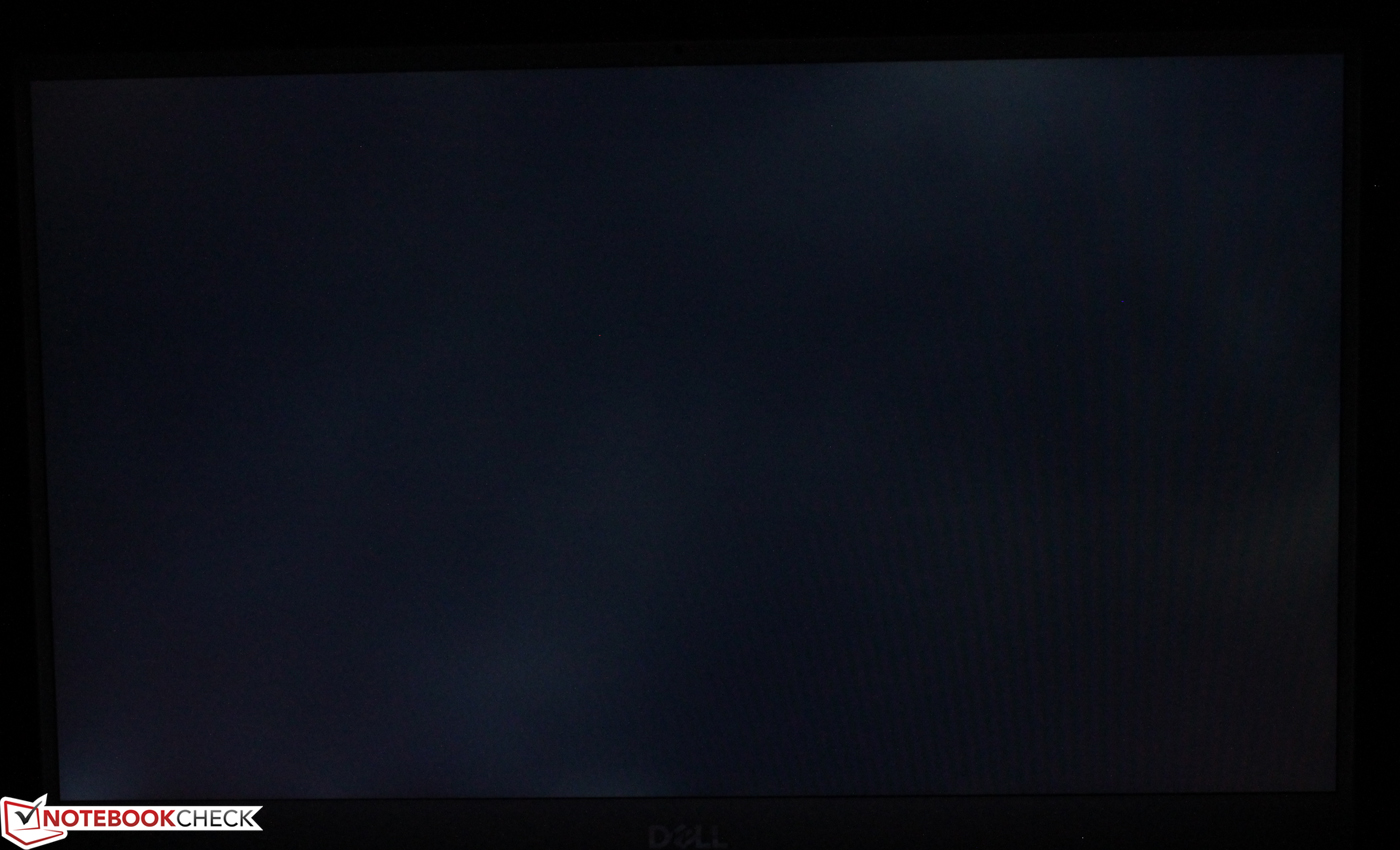
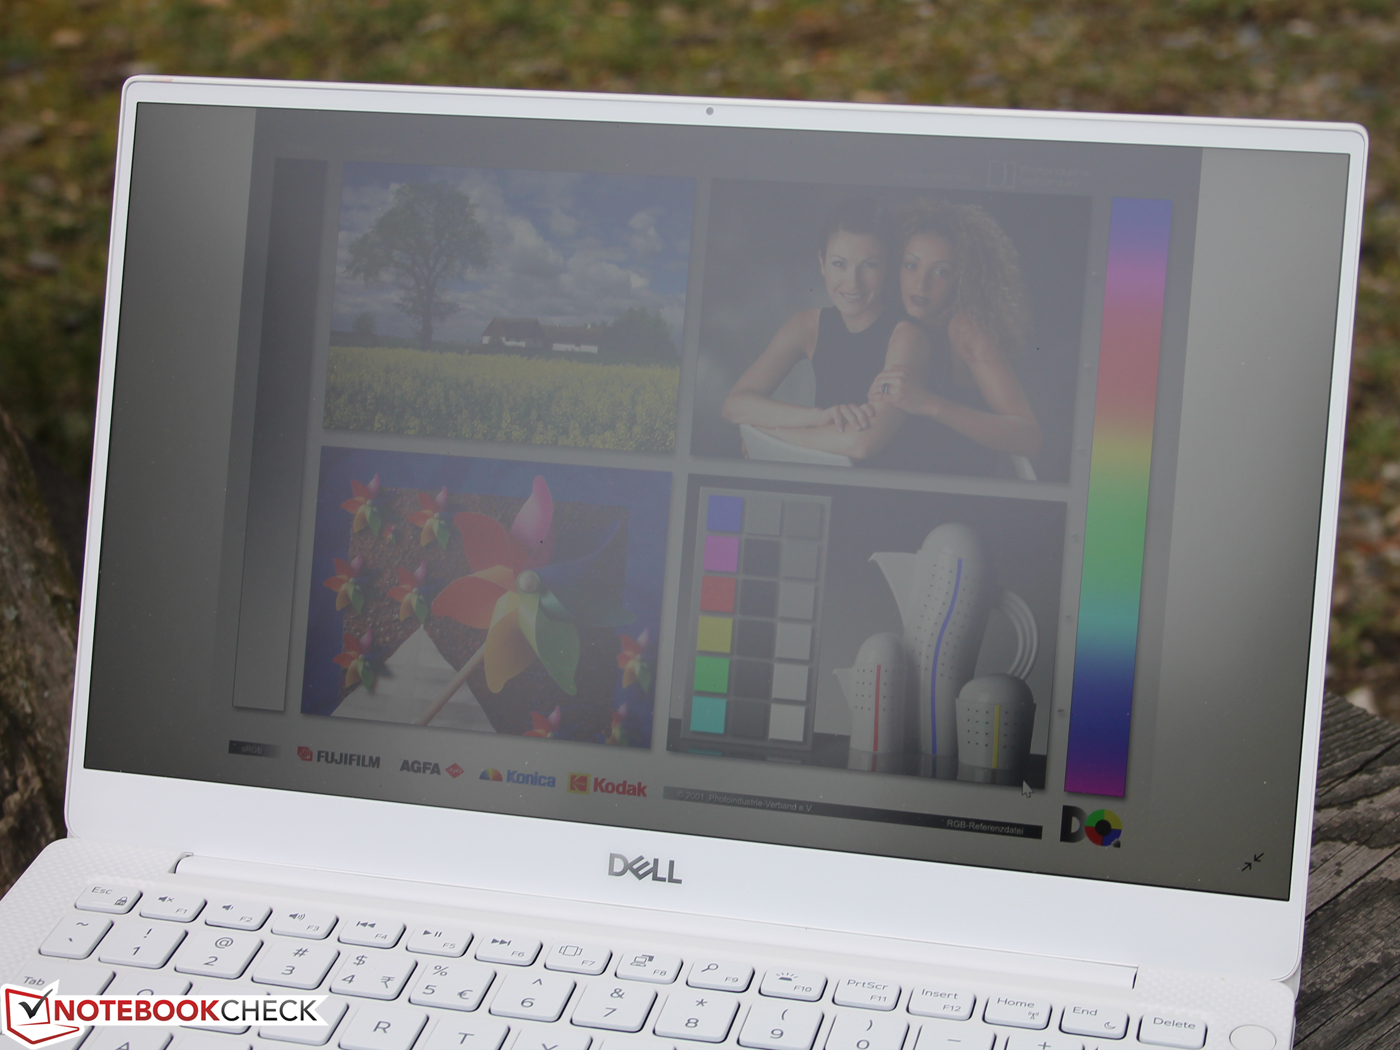
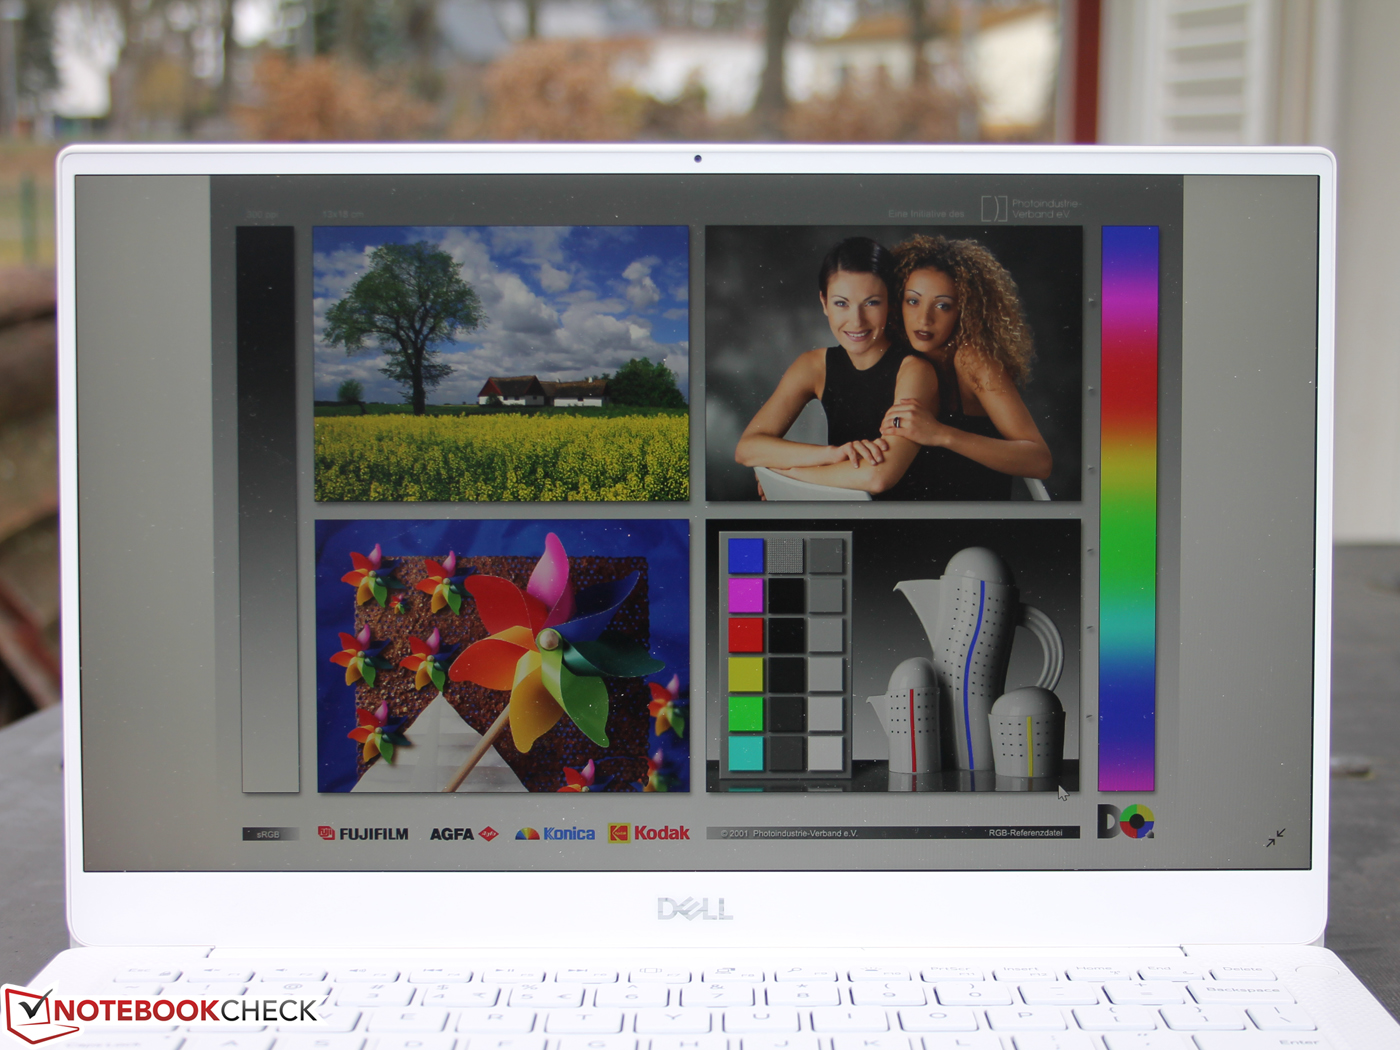
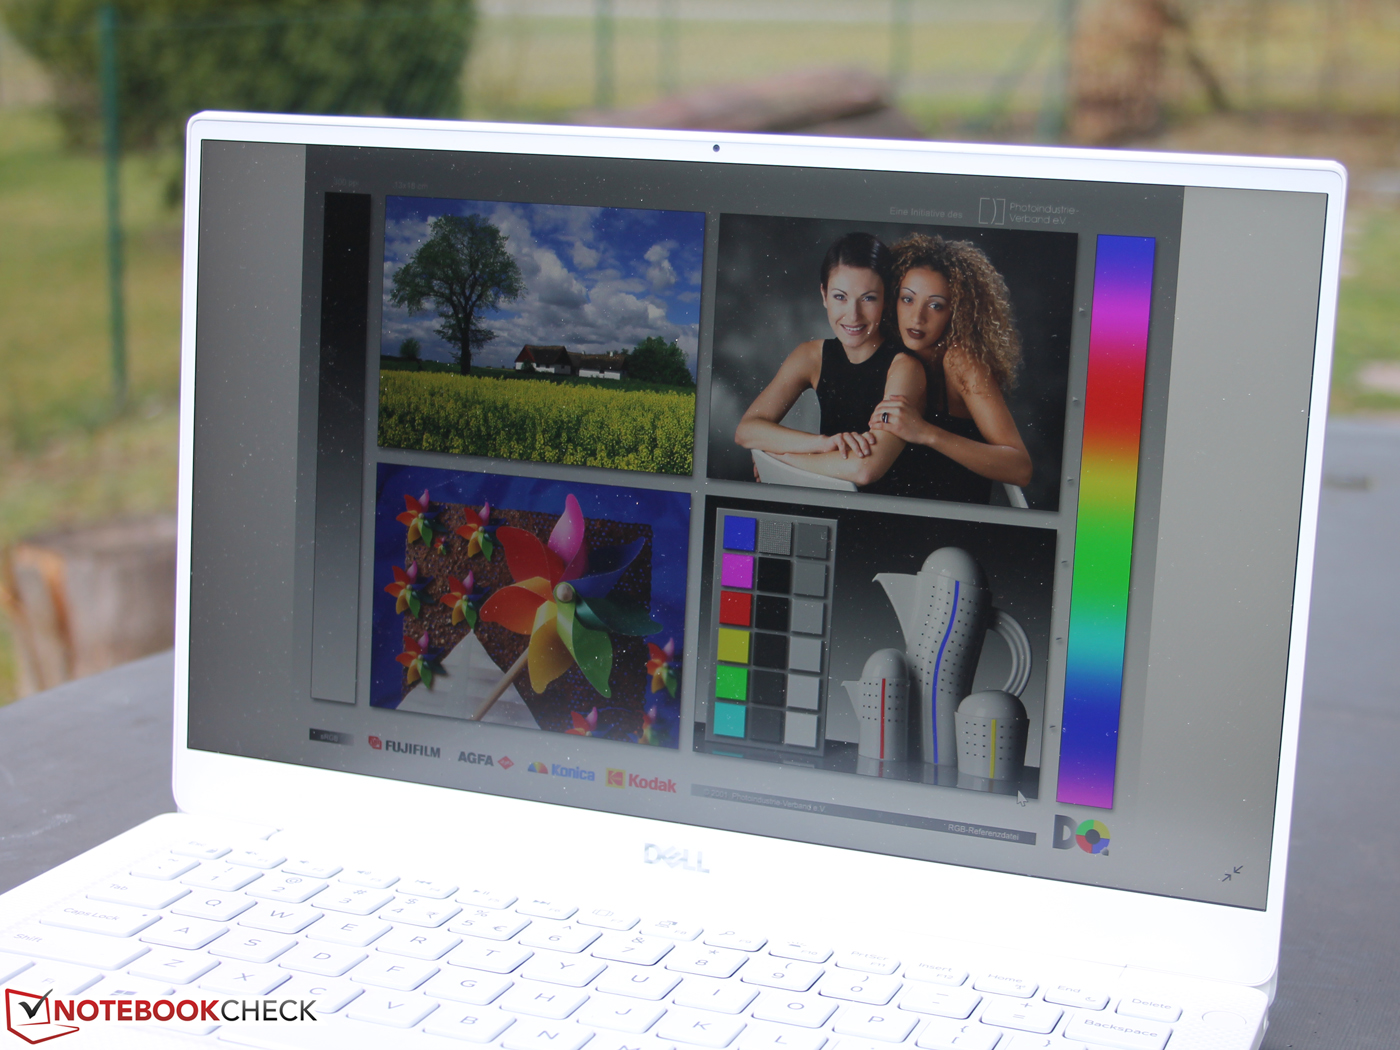
Outdoors and in bright sunlight, the FHD SKU turned out to be the better choice thanks to its matte finish. At its maximum brightness of 385 nits on battery at the center of the screen it was bright enough for almost all conditions. Our Photos were taken on an overcast day, and you might want to prefer a shady spot on a bright sunny day.
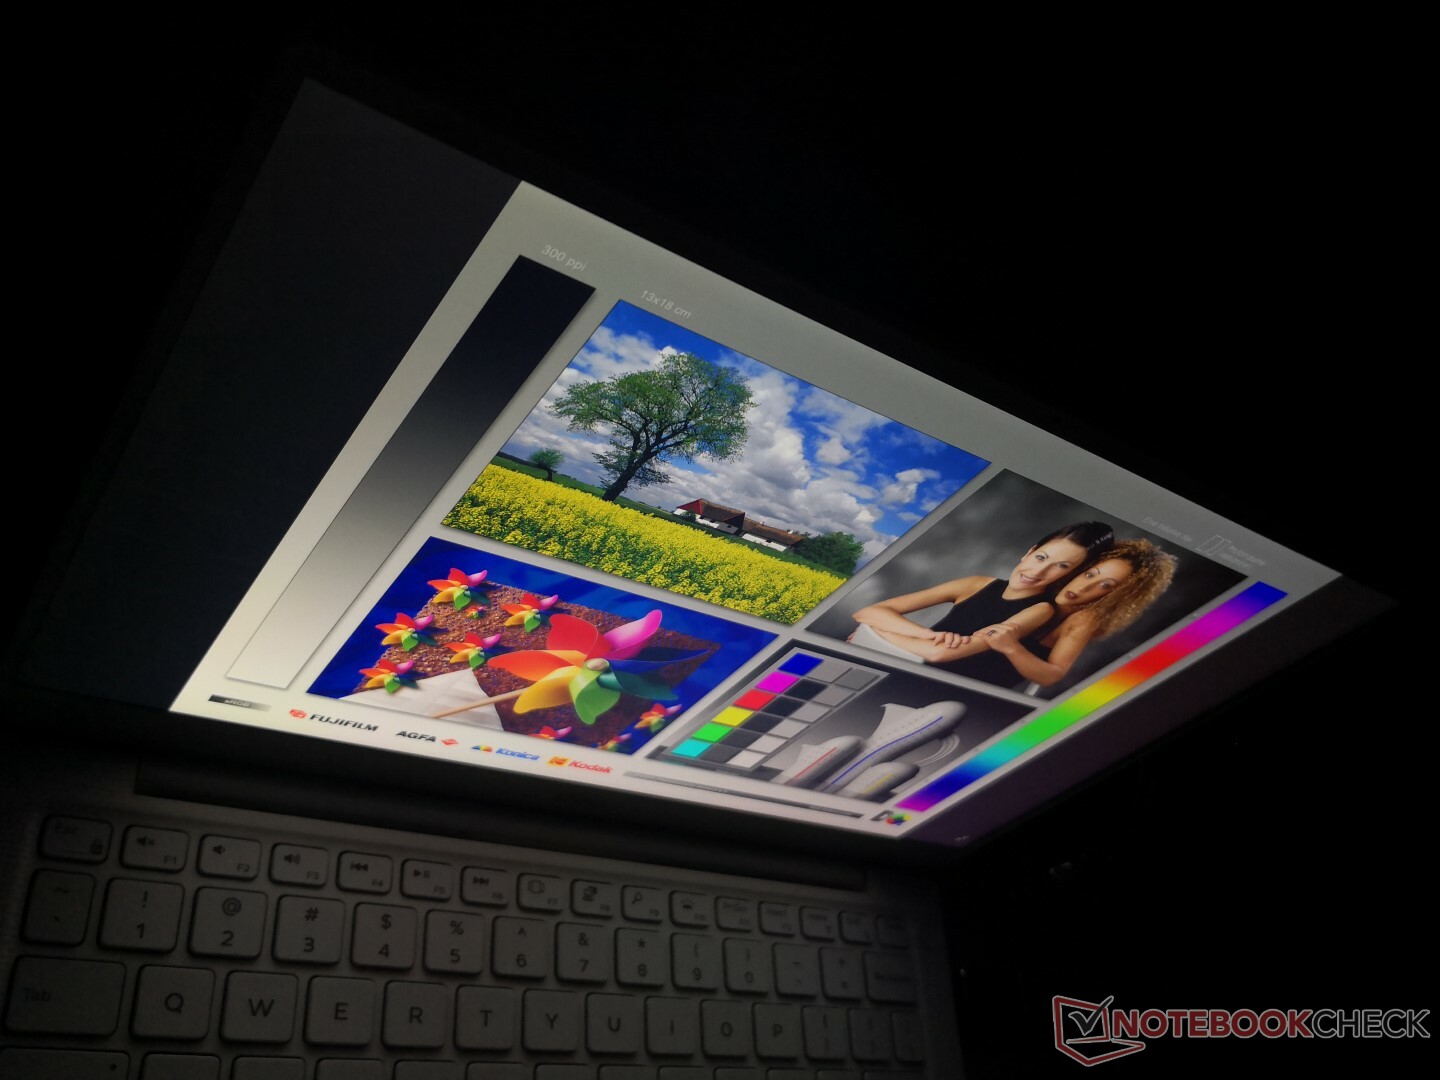
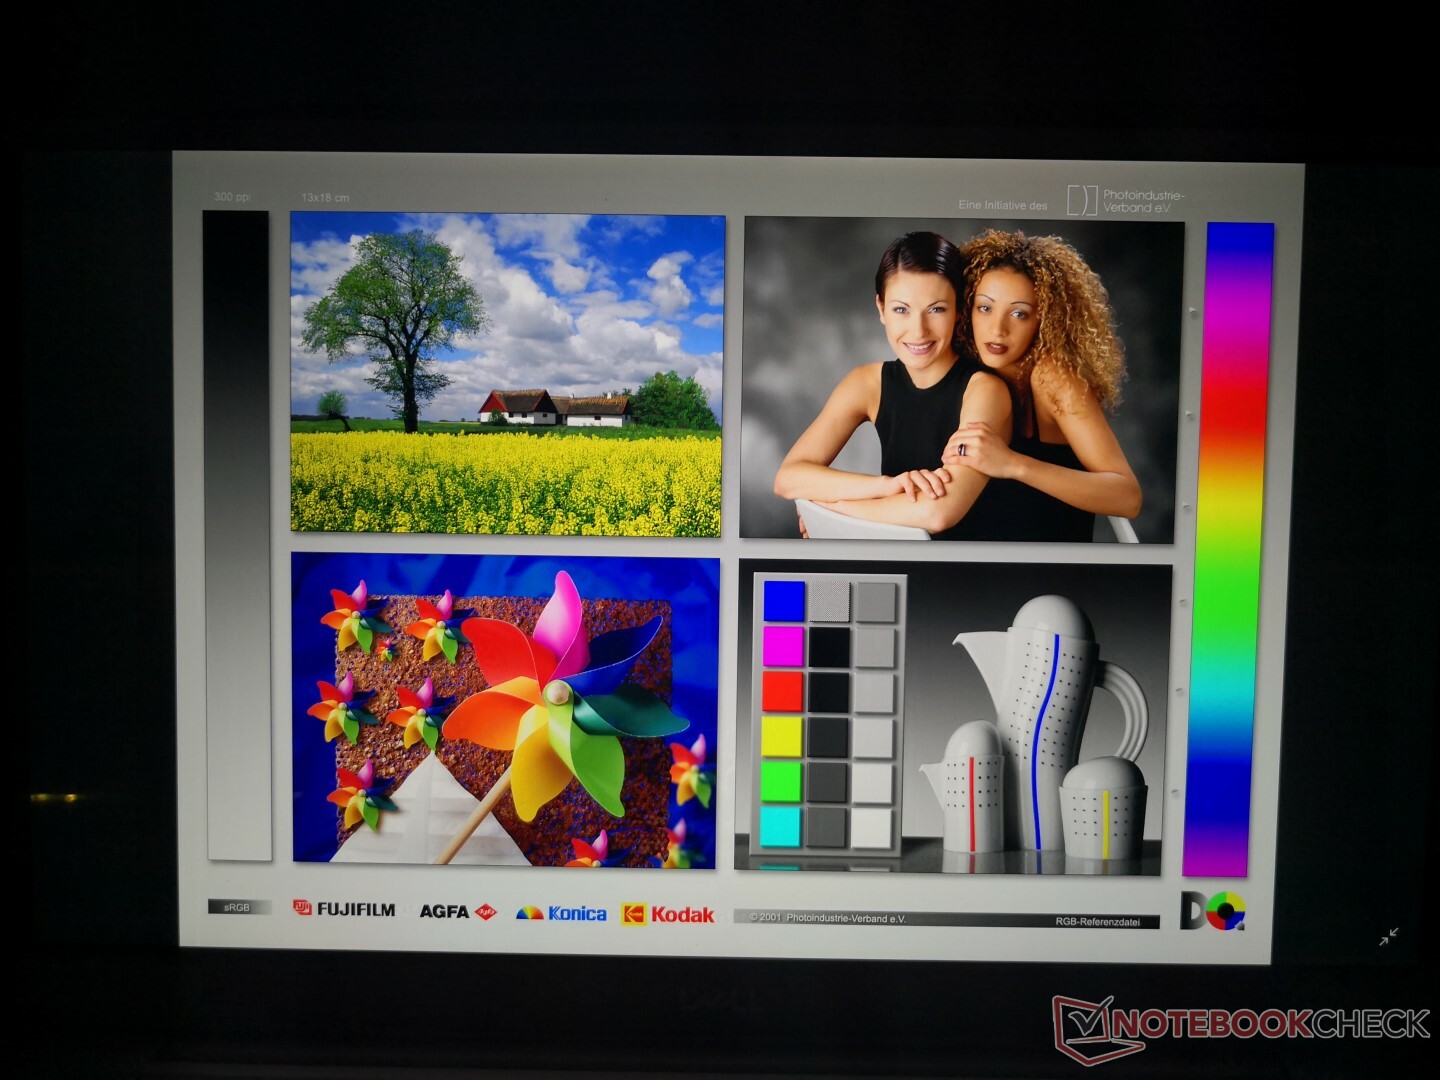
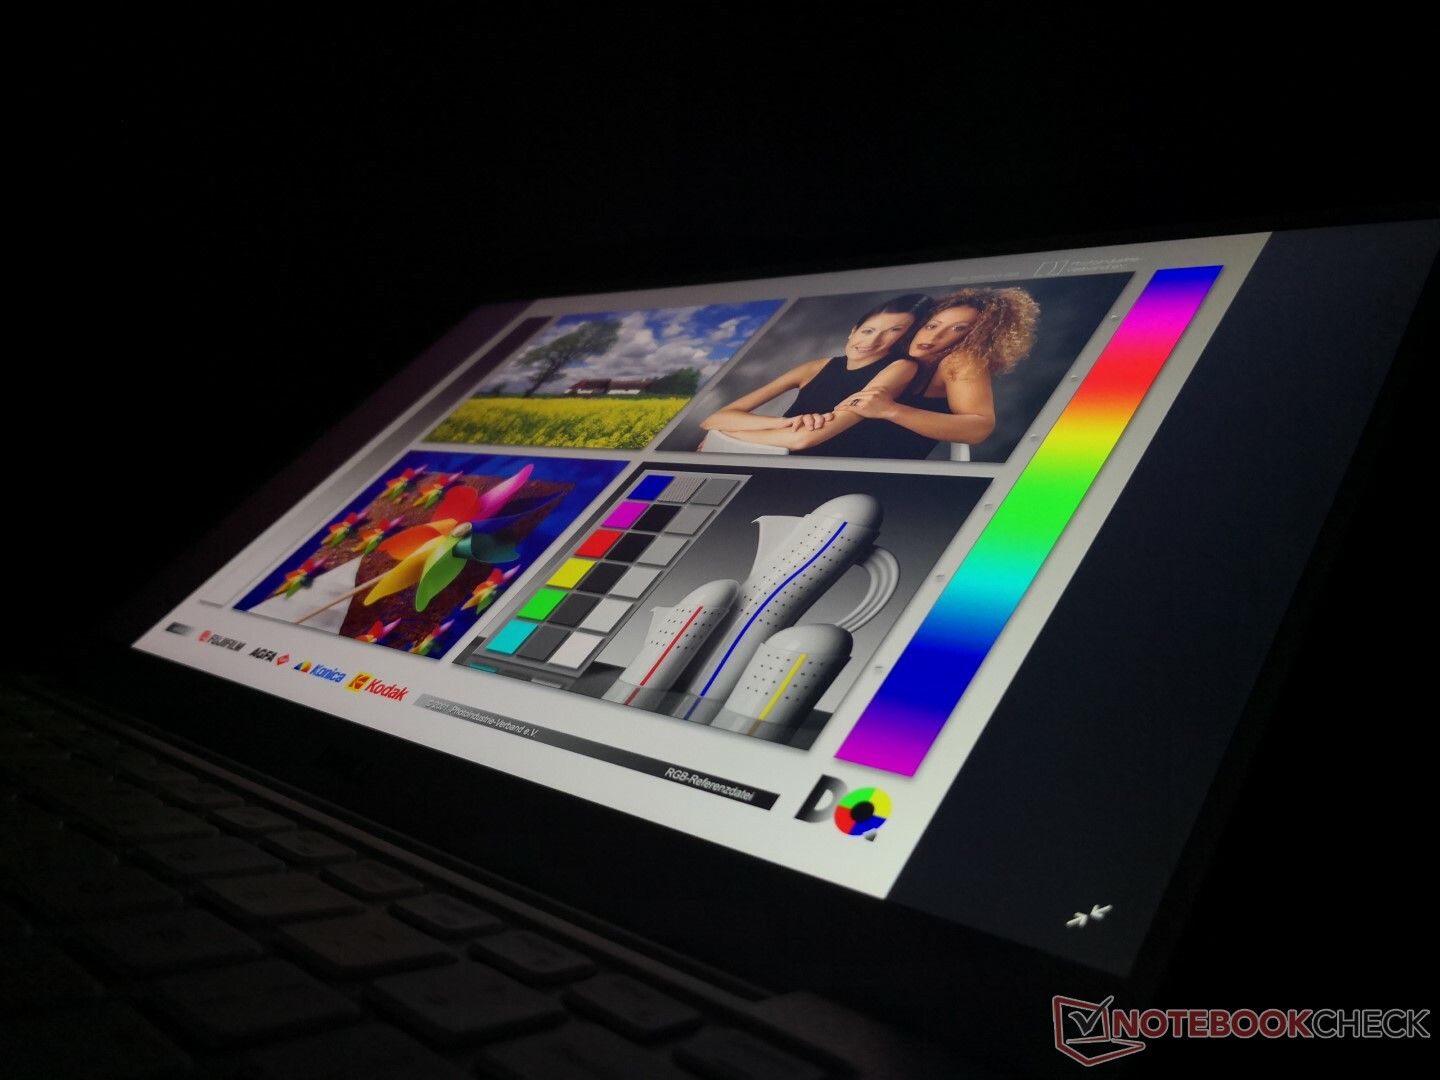
Viewing angles were as wide as expected of an IPS panel. Colors and contrasts remained undistorted regardless of angle and position.
| |||||||||||||||||||||||||
Brightness Distribution: 84 %
Center on Battery: 385 cd/m²
Contrast: 1646:1 (Black: 0.26 cd/m²)
ΔE ColorChecker Calman: 1.16 | ∀{0.5-29.43 Ø4.71}
calibrated: 0.9
ΔE Greyscale Calman: 1.23 | ∀{0.09-98 Ø4.96}
99% sRGB (Argyll 1.6.3 3D)
65% AdobeRGB 1998 (Argyll 1.6.3 3D)
Gamma: 2.46
CCT: 6648 K

Display Response Times
| ↔ Response Time Black to White | ||
|---|---|---|
| 33 ms ... rise ↗ and fall ↘ combined | ↗ 17 ms rise | 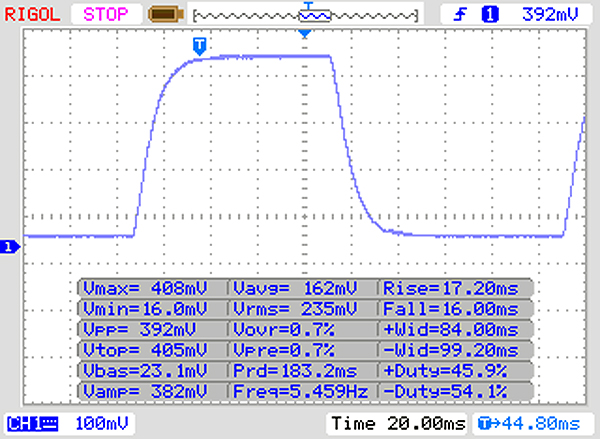 |
| ↘ 16 ms fall | ||
| The screen shows slow response rates in our tests and will be unsatisfactory for gamers. In comparison, all tested devices range from 0.1 (minimum) to 240 (maximum) ms. » 89 % of all devices are better. This means that the measured response time is worse than the average of all tested devices (19.8 ms). | ||
| ↔ Response Time 50% Grey to 80% Grey | ||
| 54 ms ... rise ↗ and fall ↘ combined | ↗ 26 ms rise | 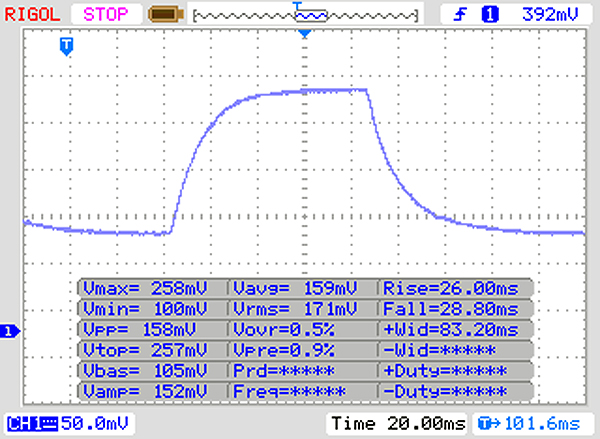 |
| ↘ 28 ms fall | ||
| The screen shows slow response rates in our tests and will be unsatisfactory for gamers. In comparison, all tested devices range from 0.165 (minimum) to 636 (maximum) ms. » 91 % of all devices are better. This means that the measured response time is worse than the average of all tested devices (30.9 ms). | ||
Screen Flickering / PWM (Pulse-Width Modulation)
| Screen flickering / PWM not detected | ≤ 100 % brightness setting |  | |
In comparison: 52 % of all tested devices do not use PWM to dim the display. If PWM was detected, an average of 7741 (minimum: 5 - maximum: 343500) Hz was measured. | |||

Performance
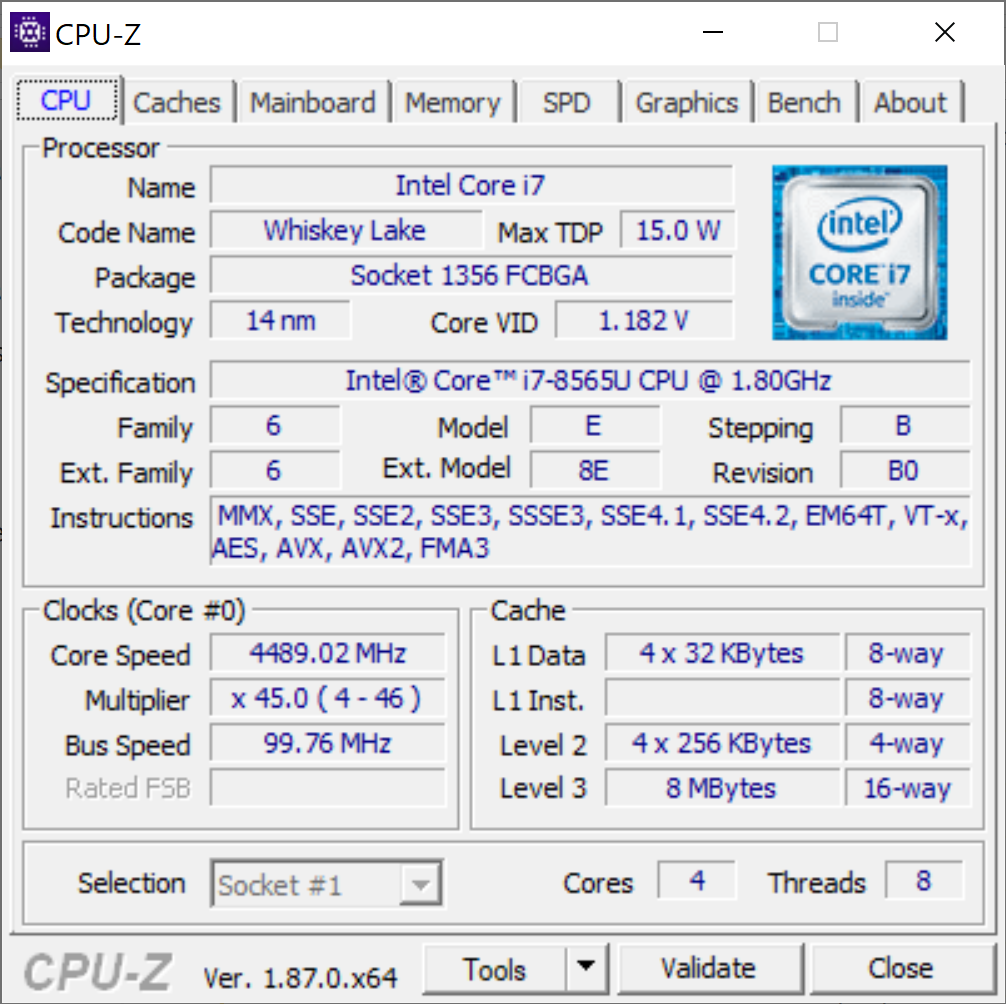
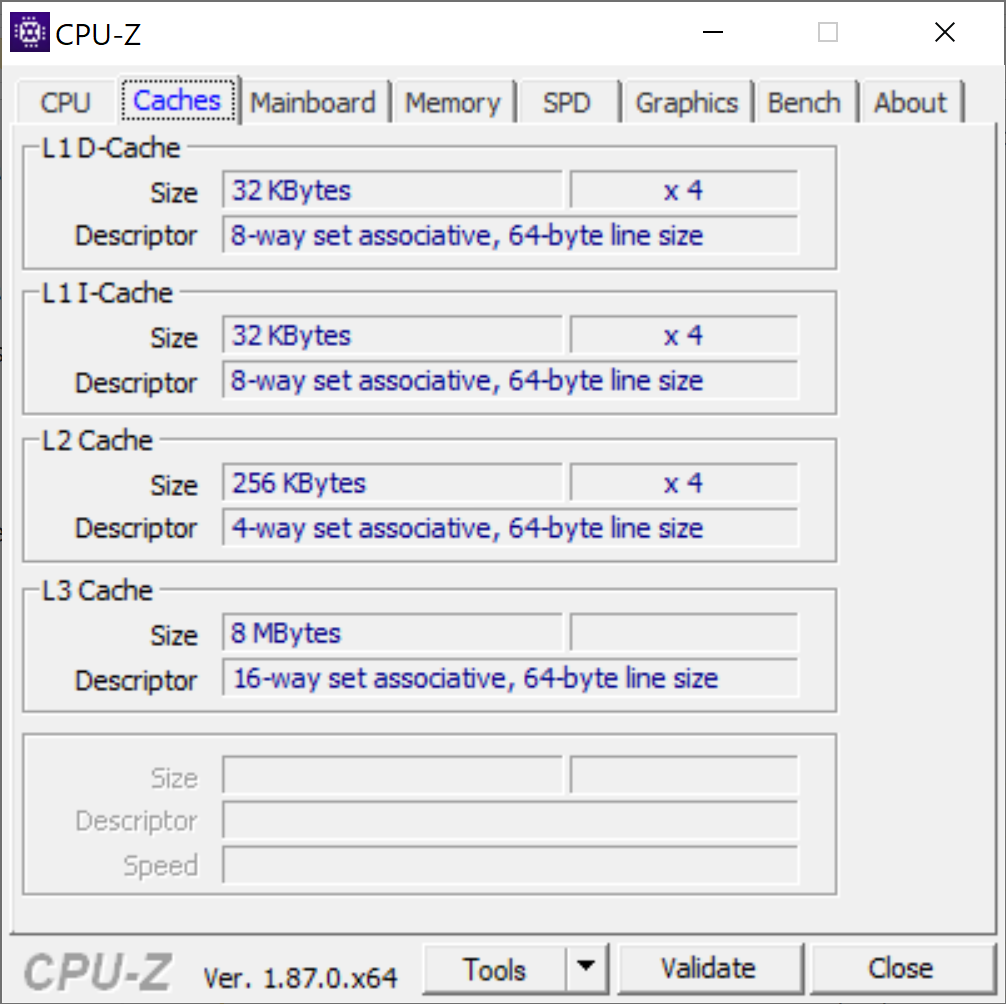
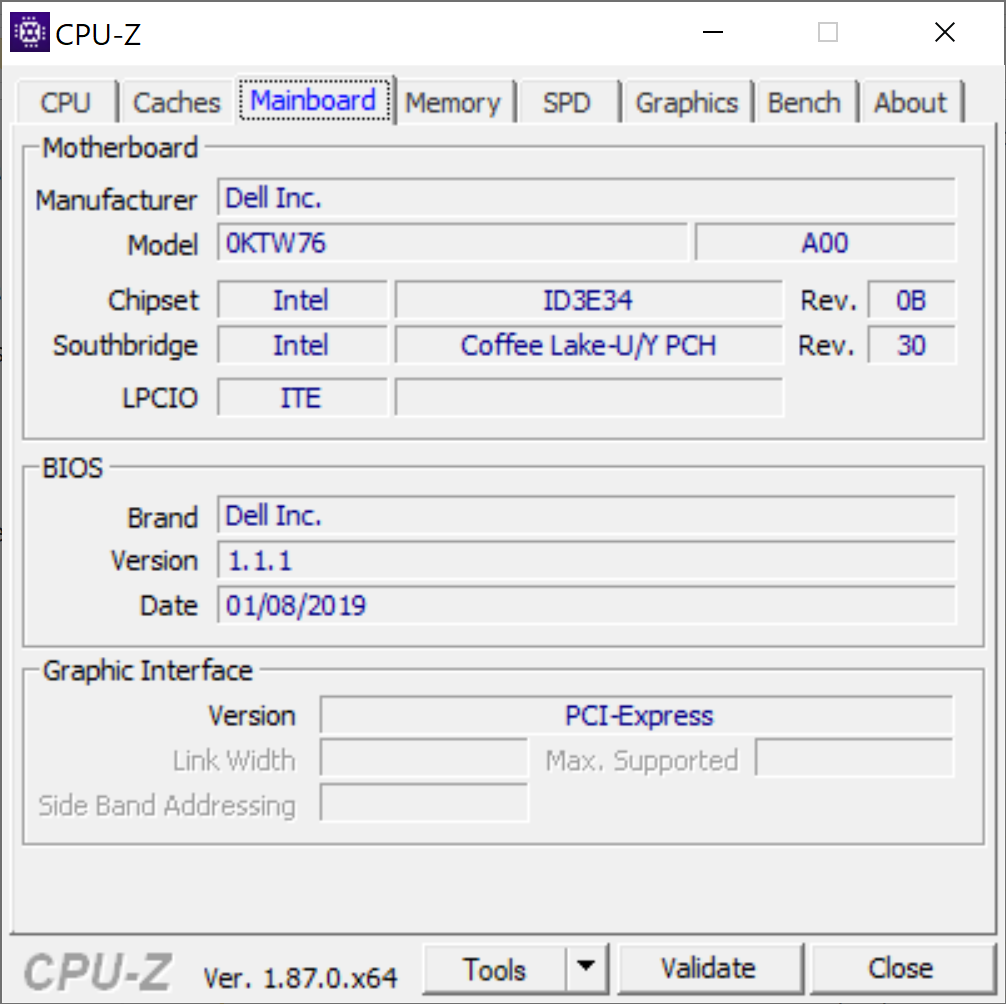
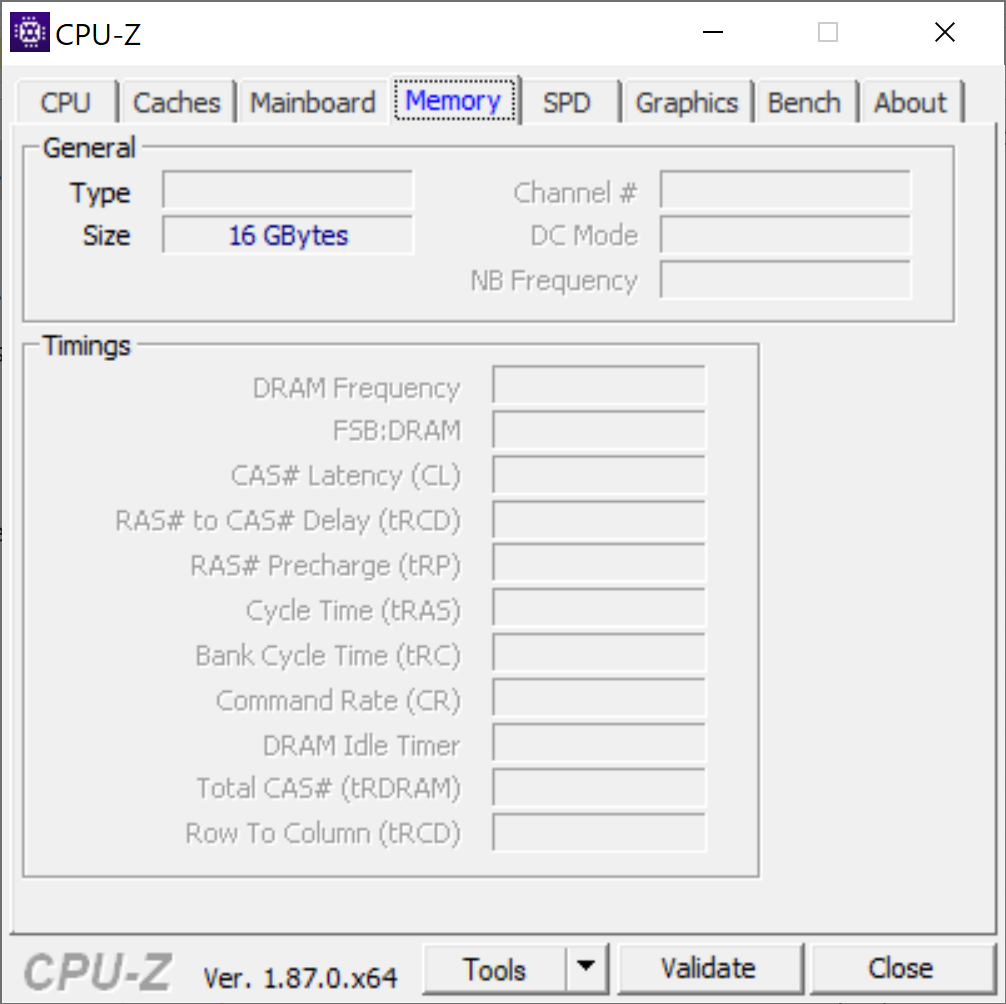
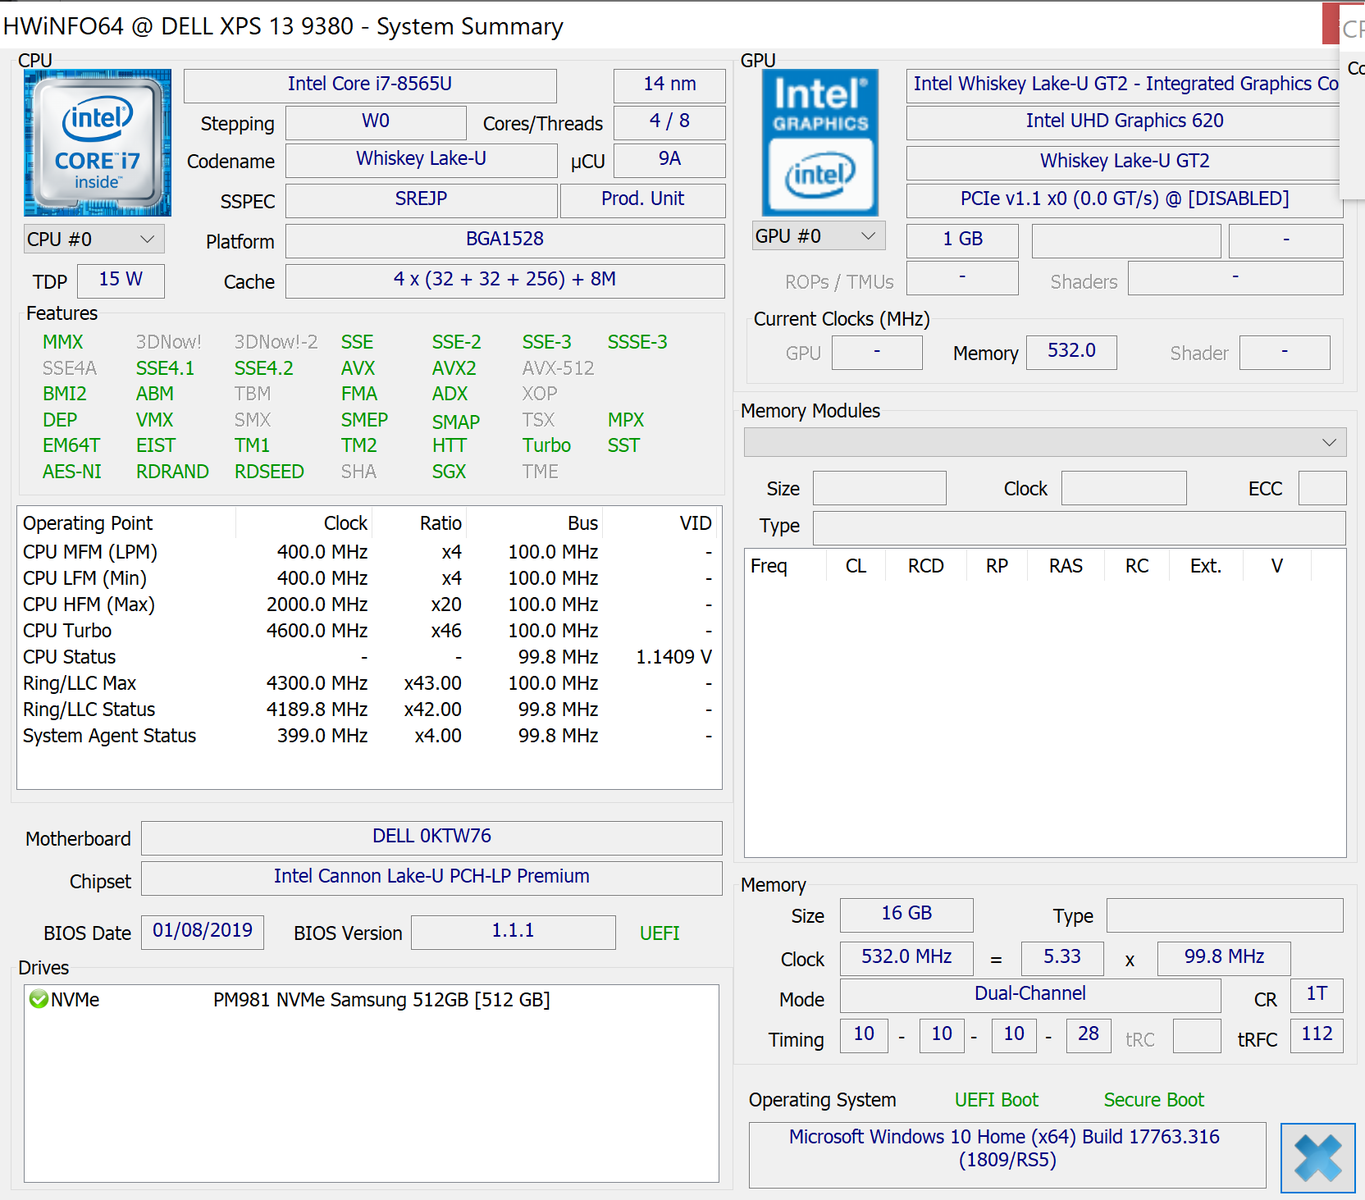
Processor options range from the Core i3-8145U up to the Core i5-8265U and i7-8565U with 4 GB to 16 GB of soldered (non-upgradeable) LPDDR3 2133MHz RAM. Note that most competing Ultrabooks tend to skip the lower-end Core i3 and 4 GB RAM SKUs whereas Dell is able to advertise lower starting prices with these bottom-of-the-barrel configurations.
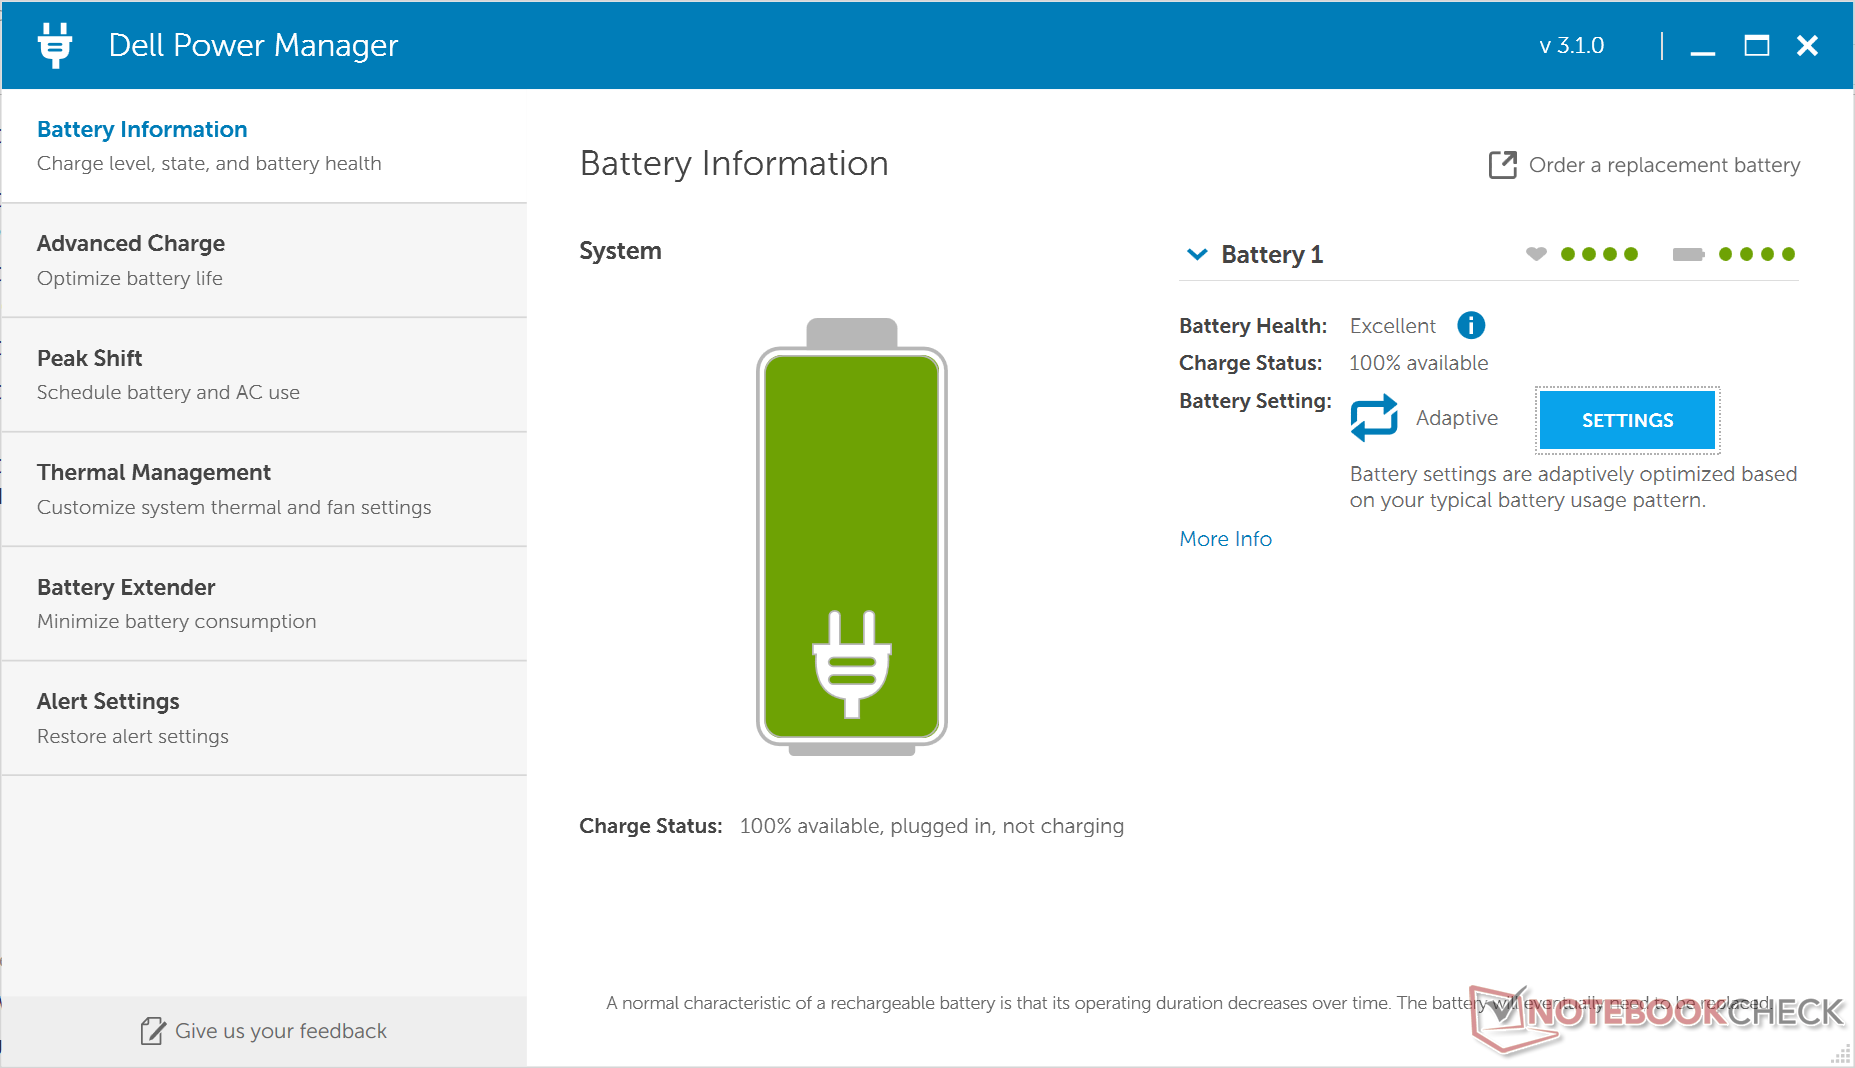
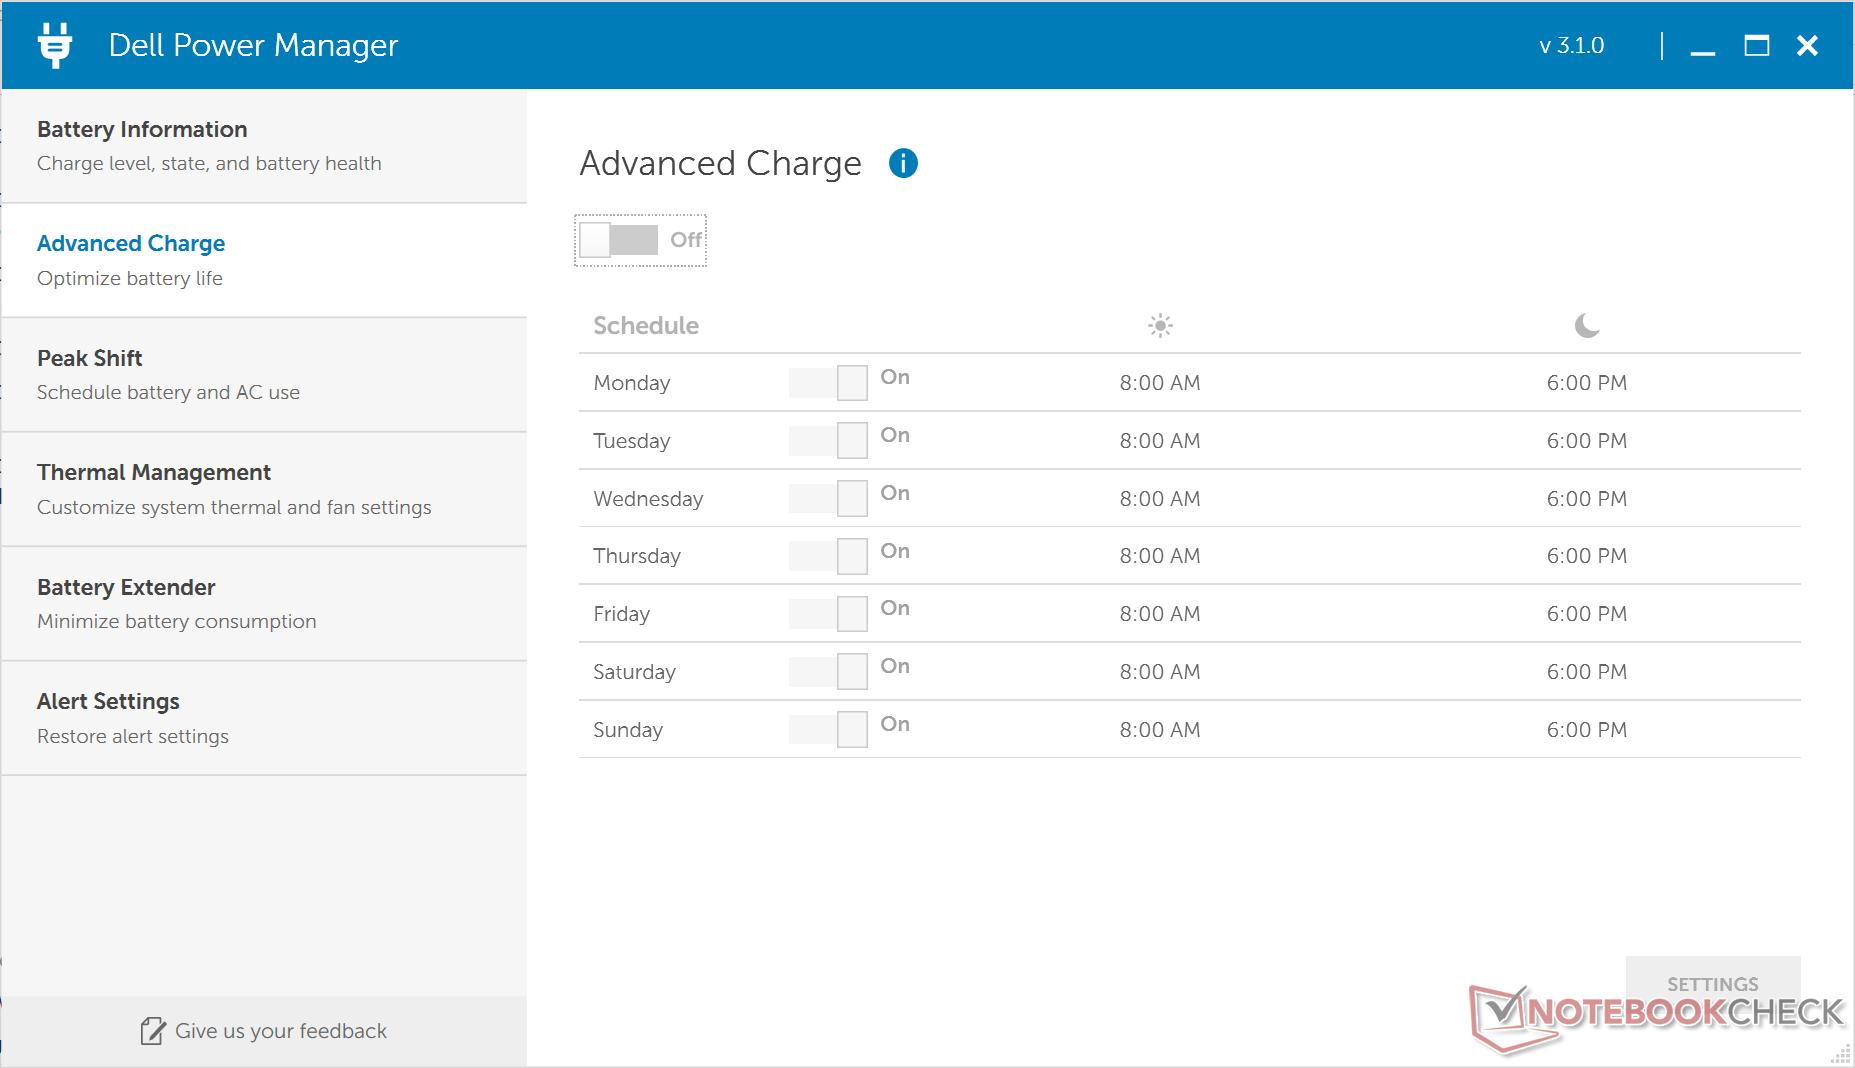
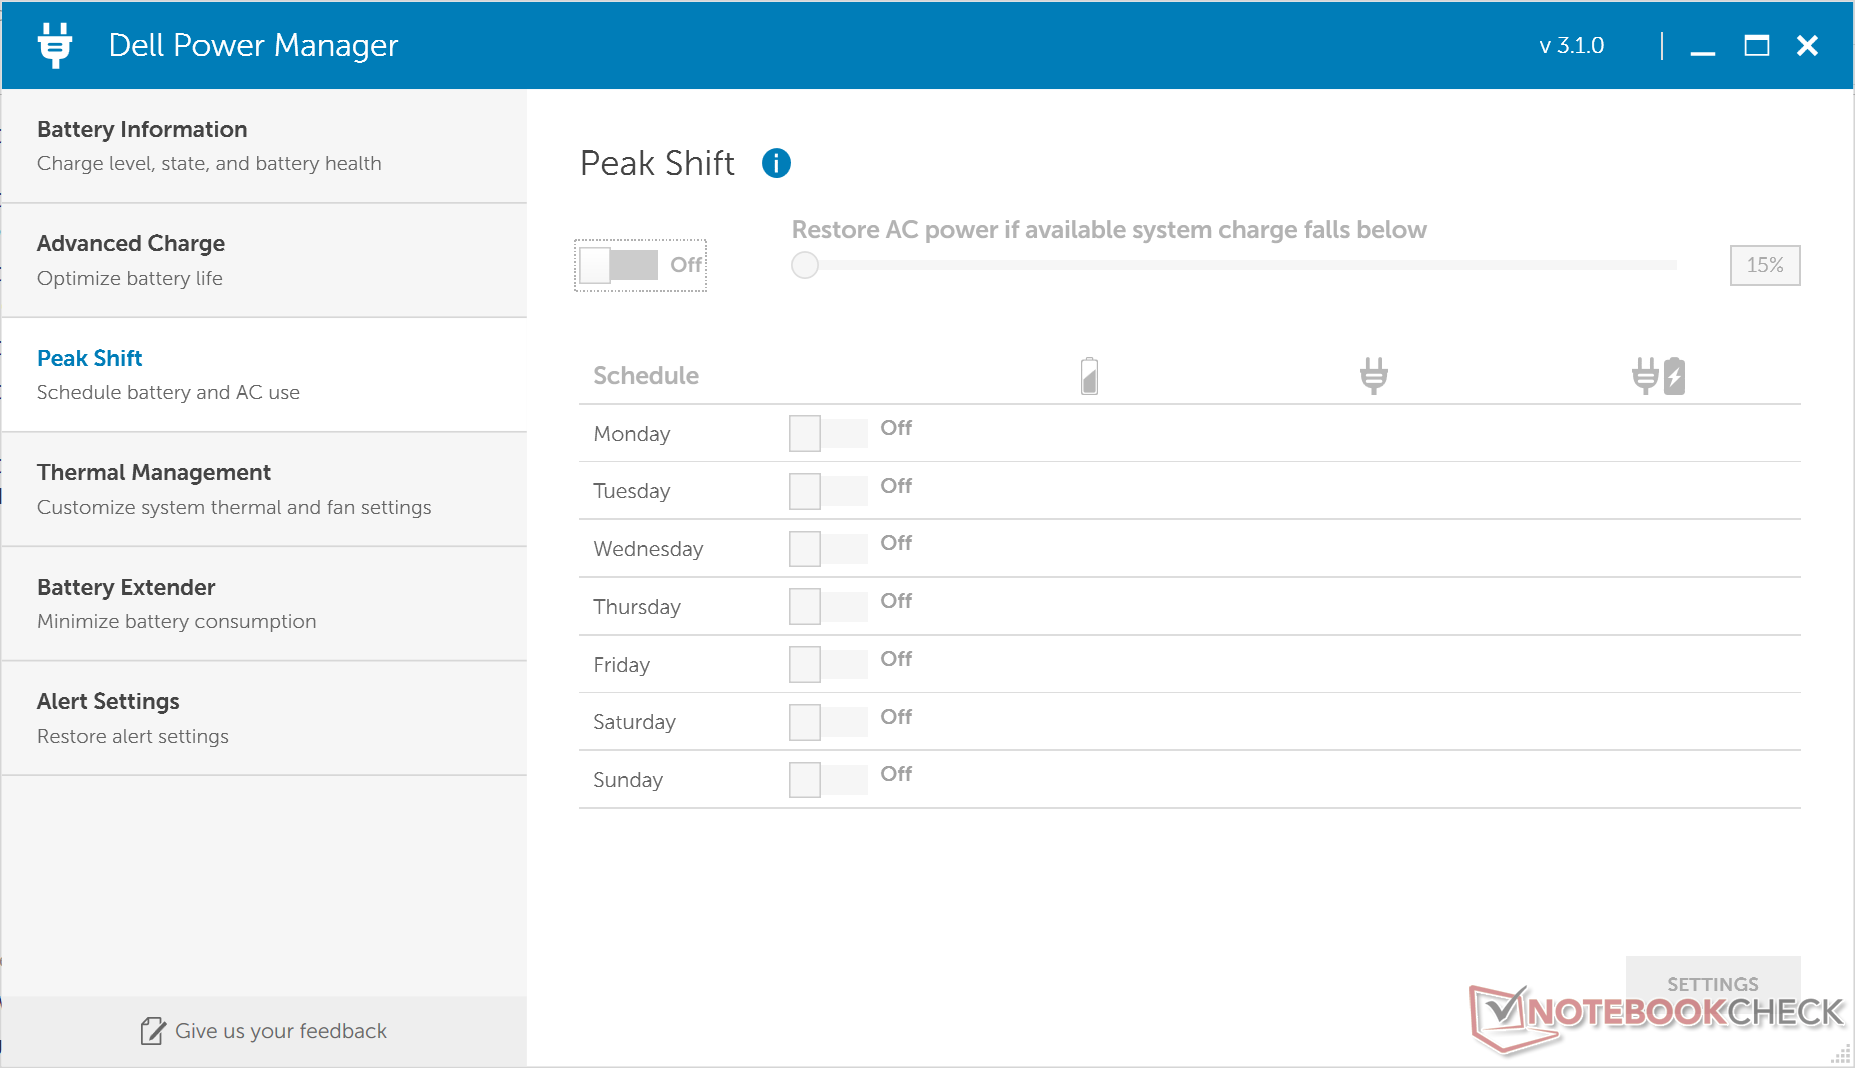
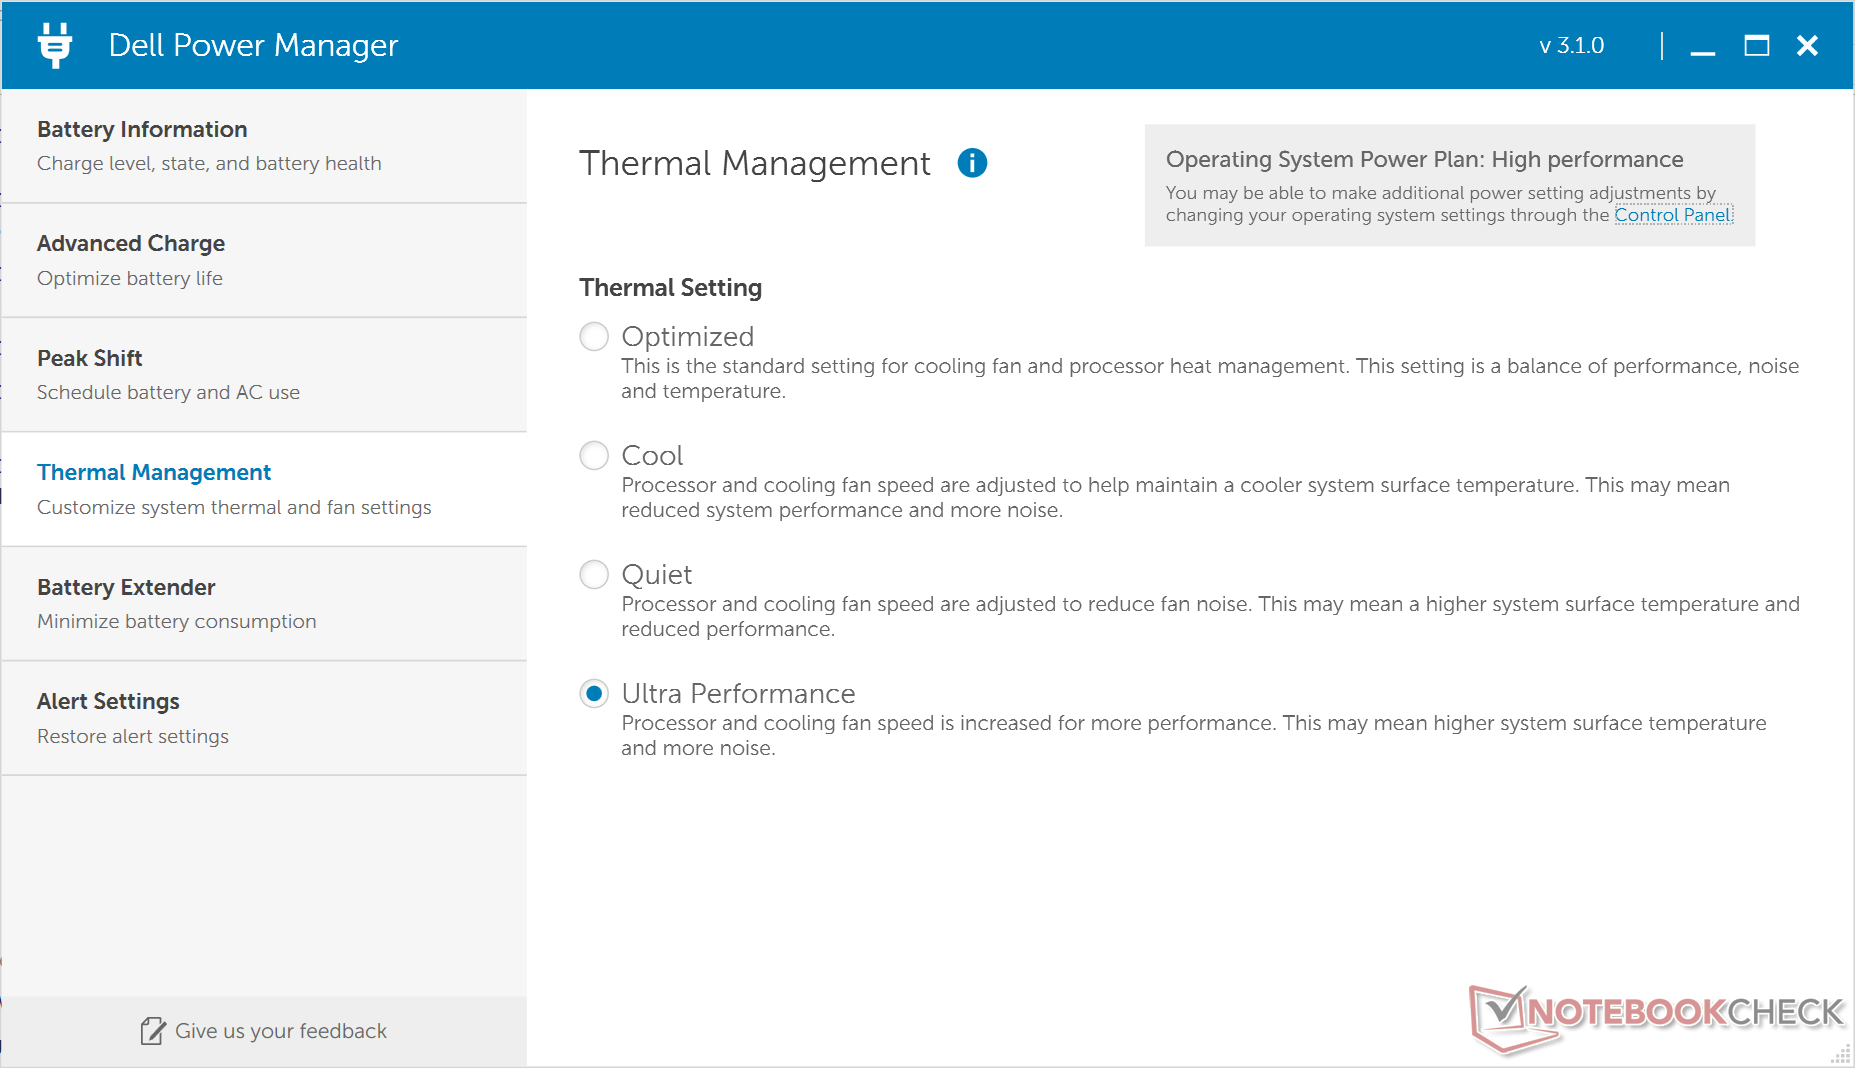
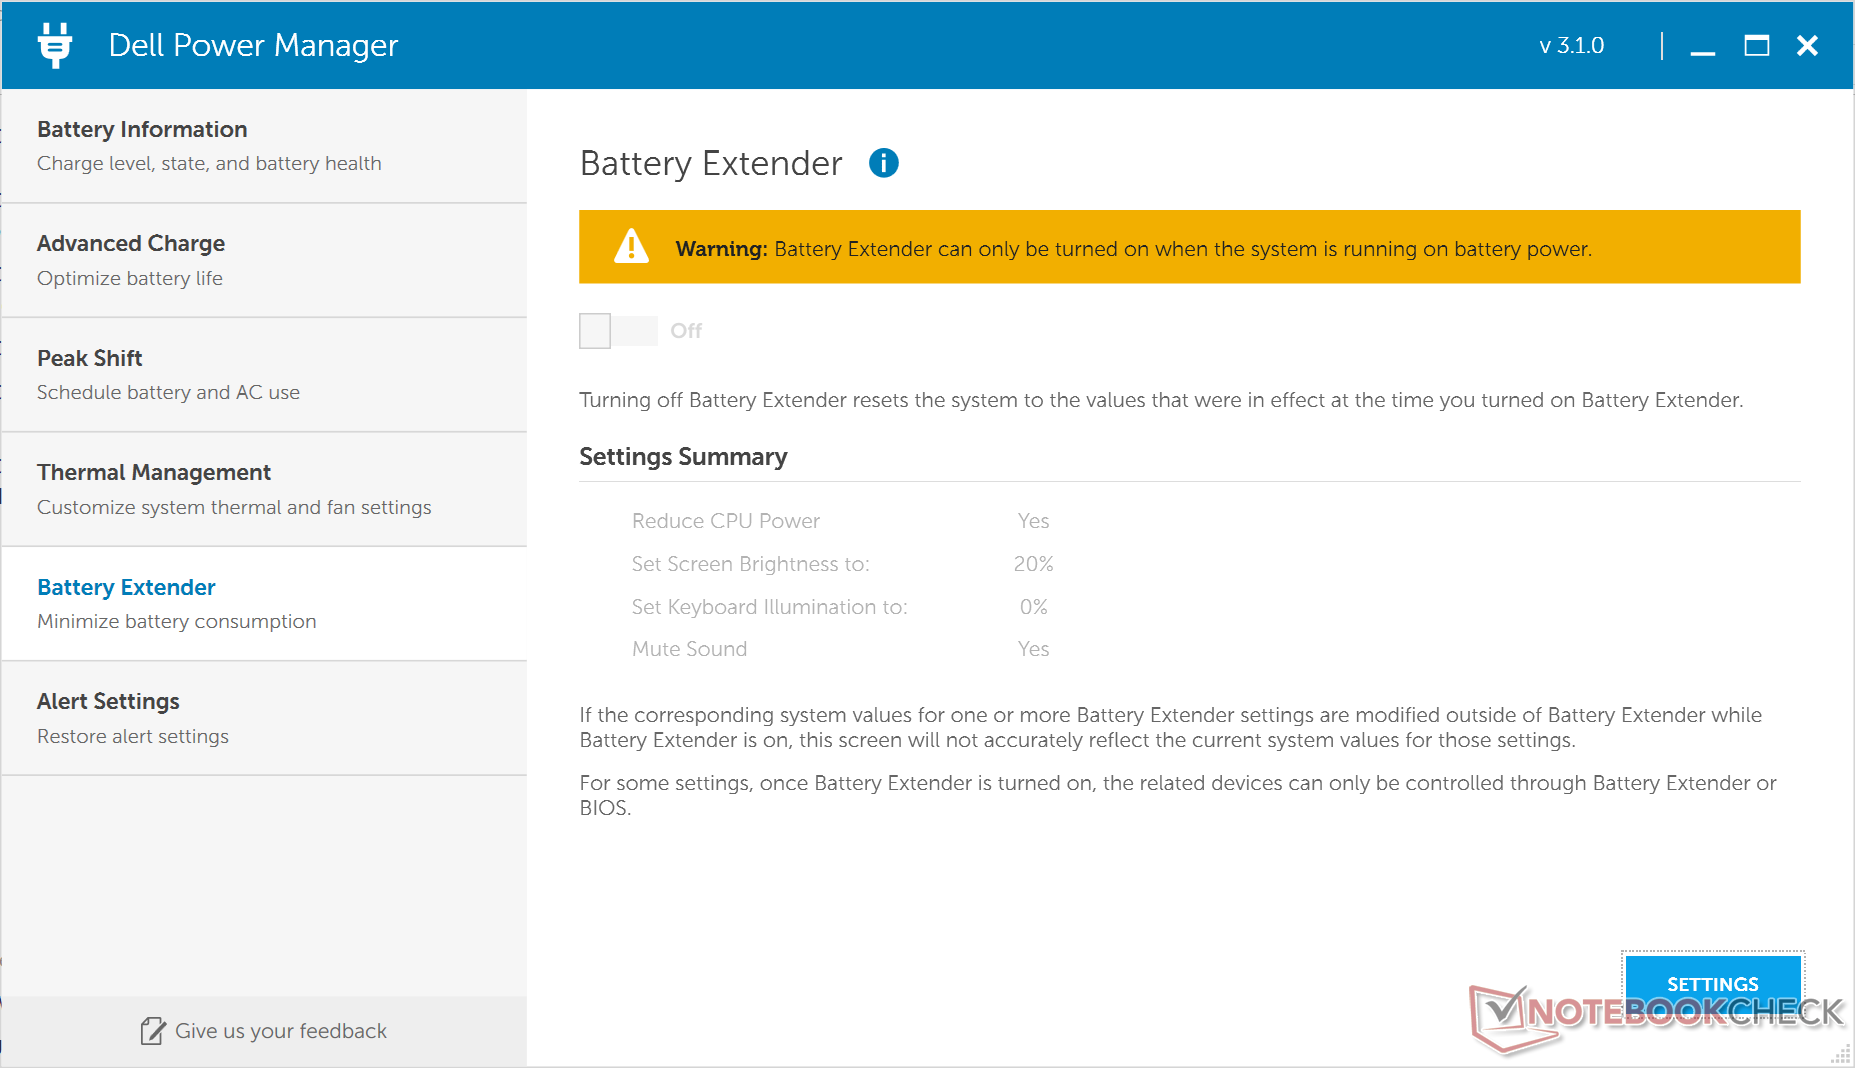
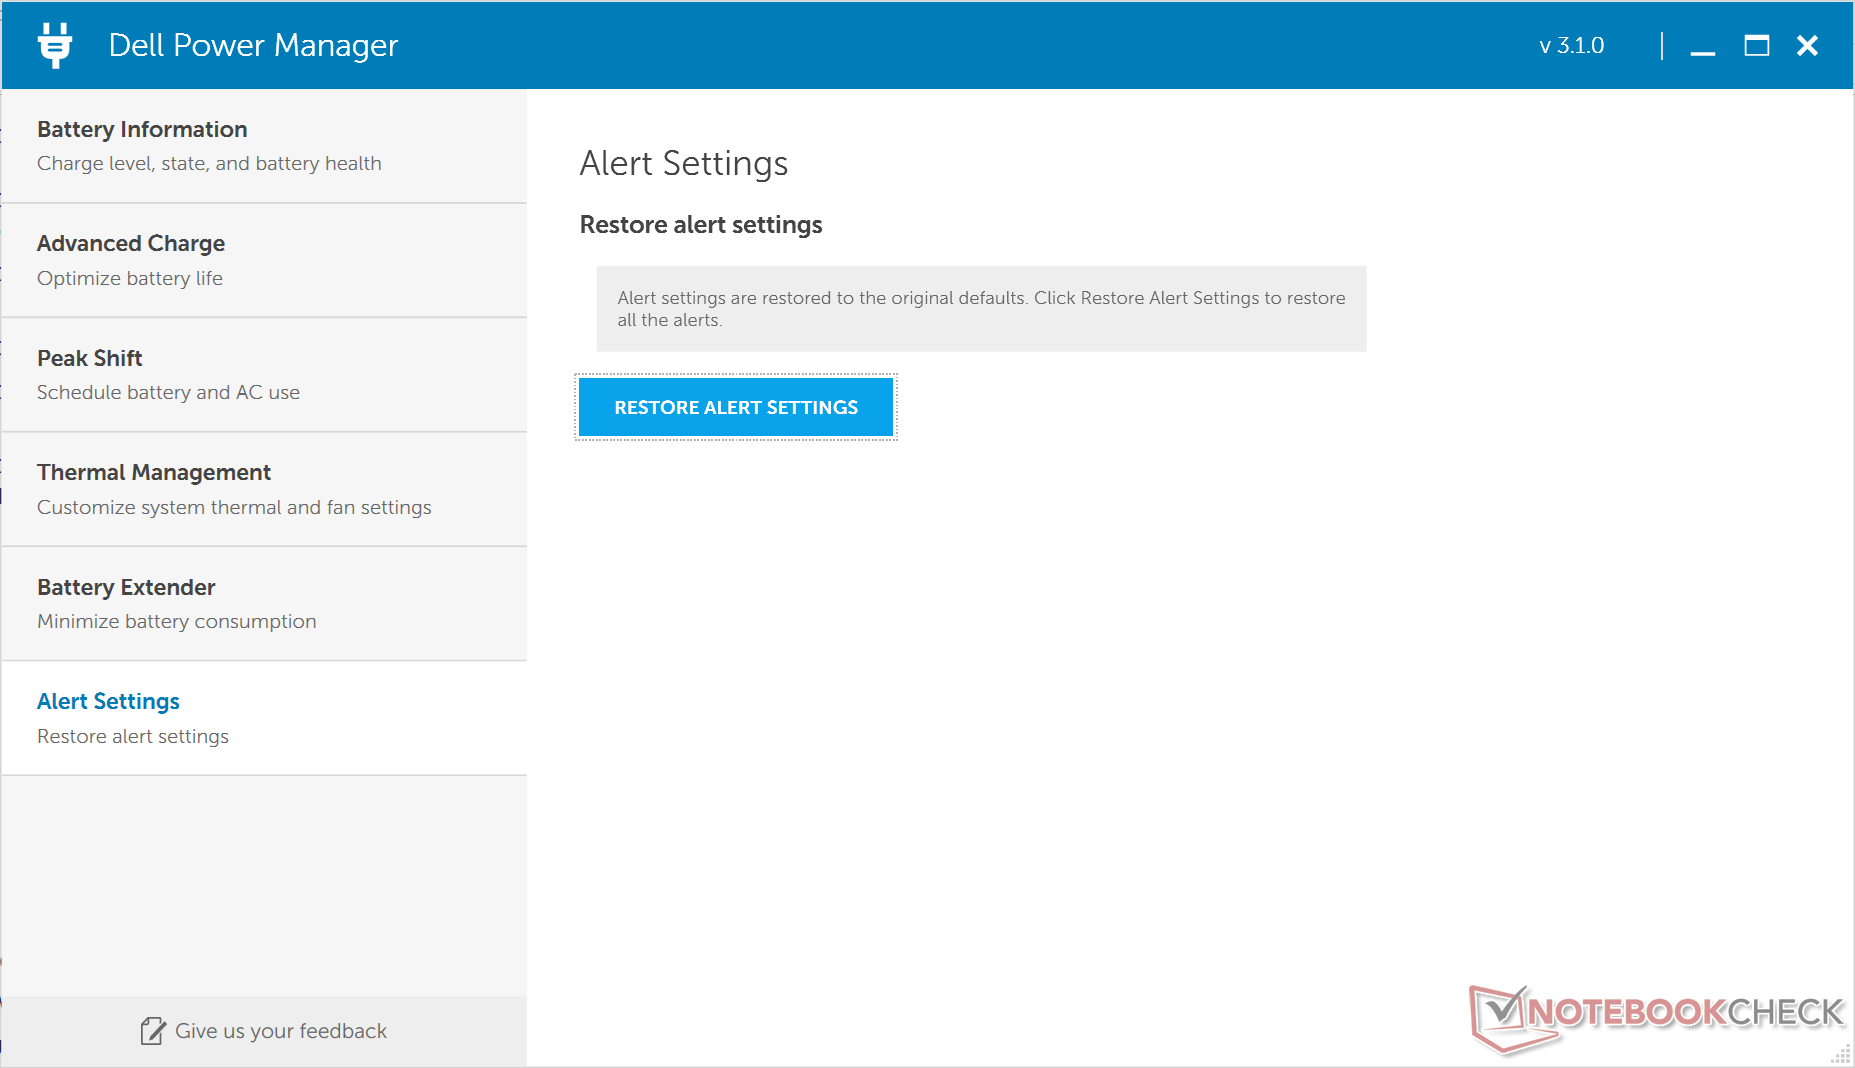
Dell doesn't talk about it much, but its Power Manager software is very important when it comes to adjusting the performance and battery life of the XPS 13. It allows users to monitor battery health and change recharge behavior, AC power behavior, performance, and brightness. Most importantly, it offers four different fan settings (Quiet, Cool, Optimized, And Ultra Performance) that directly affect CPU performance and fan noise. Since we're interested in obtaining the best possible performance out of our unit, we'll be diving into the differences between Optimized and Ultra Performance in our CPU benchmark below.
Processor
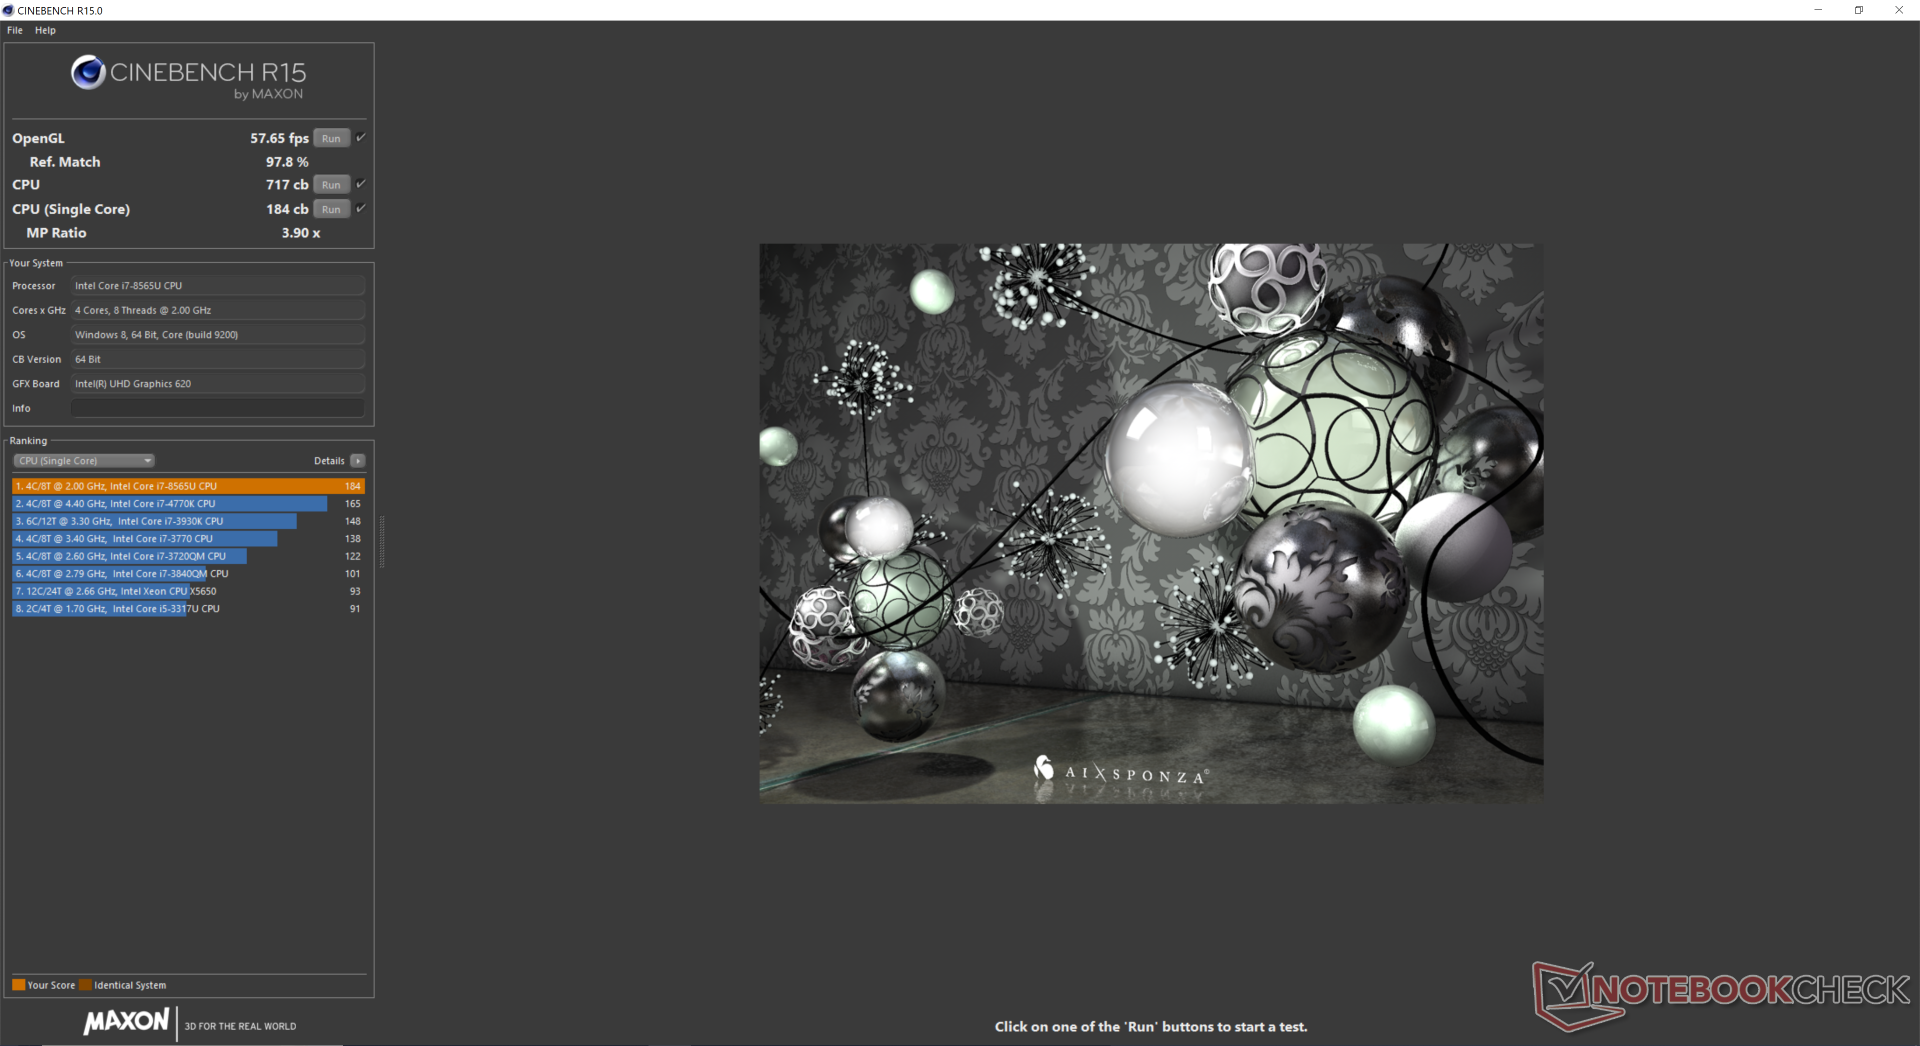
We run CineBench R15 Multi-Thread on a loop on both Optimized and Ultra Performance modes to see if there are any performance differences. The red line below are our results on Ultra Performance while the orange line are our results on Optimized. CPU performance is steadier for longer when on Ultra Performance before heavy clock rate cycling occurs. Scores can alternate from 585 to 705 points as a direct consequence for a rough average of 645 points.
When on the default Dell Optimized mode, CPU clock rates begin to throttle and alternate much sooner into the CineBench stress test loop. Scores alternate between lower values of about 540 and 680 points for a rough average of 610 points. Thus, the performance benefits between Optimized and Ultra Performance are generally minor at just a few percentage points on average after an extended period of time.
It's worth noting that Dell takes a unique approach to CPU Turbo Boost. The fluctuations in CineBench scores are much larger compared to other Ultrabooks equipped with Intel ULV CPUs. Whereas most OEMs avoid CPU temperatures reaching 100 C, Dell actually embraces it for short periods in order to run at higher clock rates at short bursts. Such a strategy allows the XPS 13 to perform faster than a competing subnotebook on average even if its clock rates are generally more unstable.
As an example, the Huawei MateBook 13 subnotebook is equipped with the same Core i7-8565U CPU as our Dell. Its Turbo Boost clock rates are narrower and stabler than the Dell for only minor clock rate fluctuations when running our CineBench R15 loop test. Overall CPU performance is about 10 percent slower than the Dell since Huawei prefers to maintain a cooler core temperature of 67 C.
See our dedicated page on the Core i7-8565U for more technical information and benchmark comparisons.
| Cinebench R15 | |
| CPU Single 64Bit | |
| Dell XPS 15 9570 Core i9 UHD | |
| Dell XPS 13 9380 i7 4K | |
| Average Intel Core i7-8565U (138.3 - 193, n=51) | |
| Dell G3 15 3579 | |
| Dell XPS 13 9370 i7 UHD | |
| Dell XPS 13 9380 2019 | |
| HP EliteBook 735 G5 3UN62EA | |
| Lenovo ThinkPad 13 20J1005TPB | |
| Dell Latitude 3490 | |
| CPU Multi 64Bit | |
| Dell XPS 15 9570 Core i9 UHD | |
| Dell G3 15 3579 | |
| Dell XPS 13 9380 i7 4K | |
| Dell XPS 13 9380 i7 4K | |
| Dell XPS 13 9380 2019 | |
| Dell Latitude 3490 | |
| HP EliteBook 735 G5 3UN62EA | |
| Dell XPS 13 9370 i7 UHD | |
| Average Intel Core i7-8565U (452 - 815, n=52) | |
| Lenovo ThinkPad 13 20J1005TPB | |
System Performance
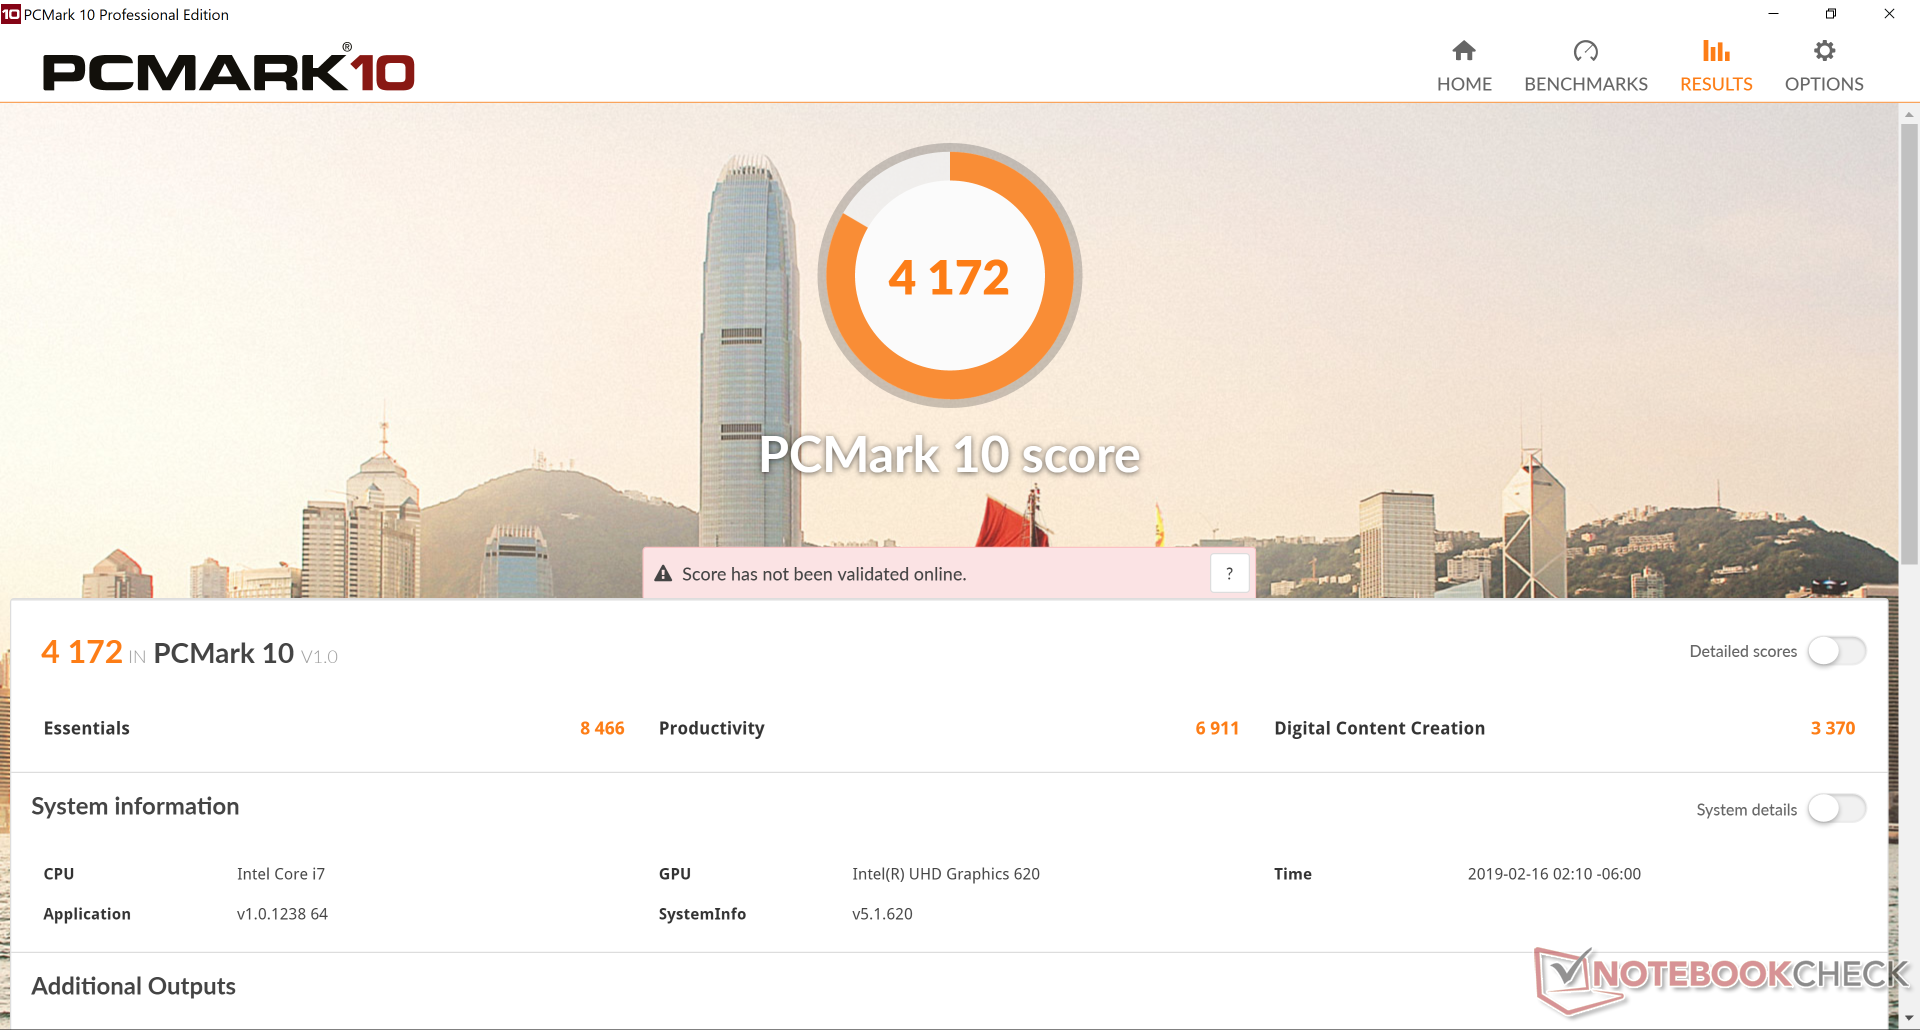
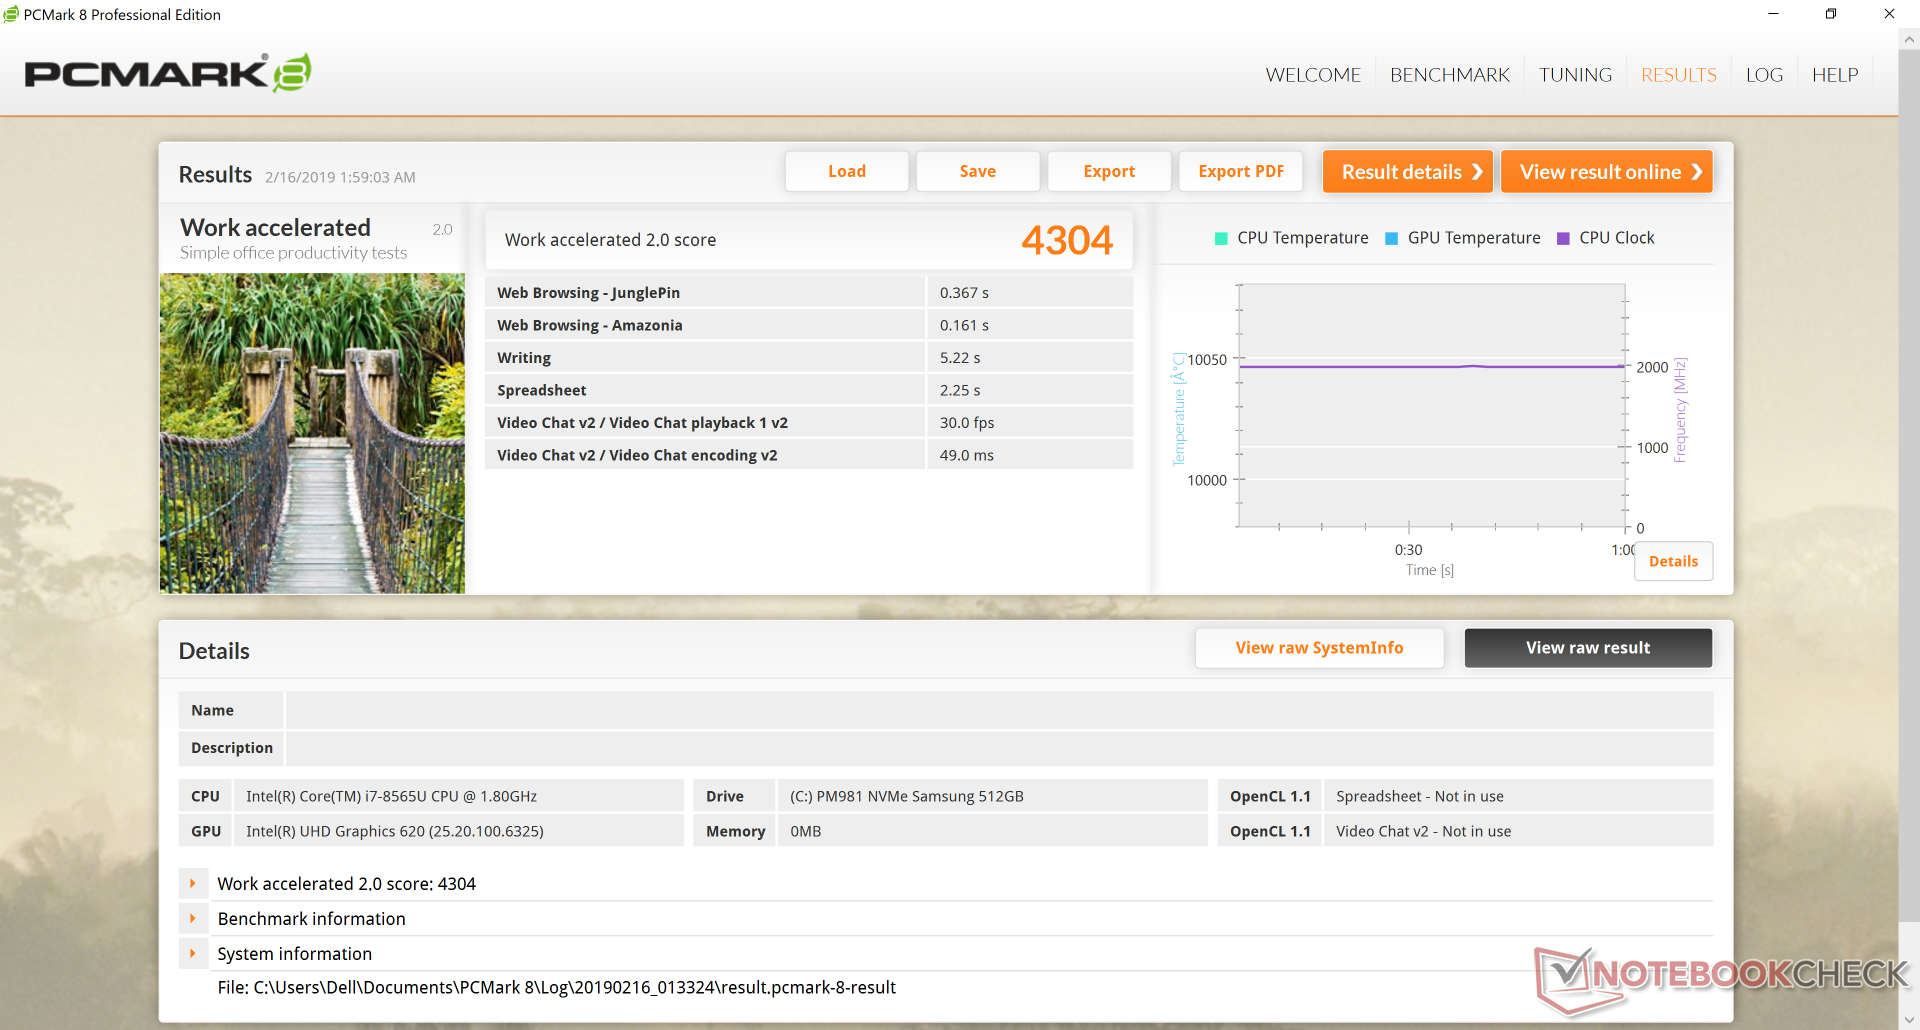
PCMark 10 benchmark results are consistently higher than last year's XPS 13 9370 by 12 to 26 percent. We didn't experience any software or hardware glitches on our unit unlike on the XPS 15 series. Some of the Dell applications, however, can take unusually long to launch including the Power Manager.
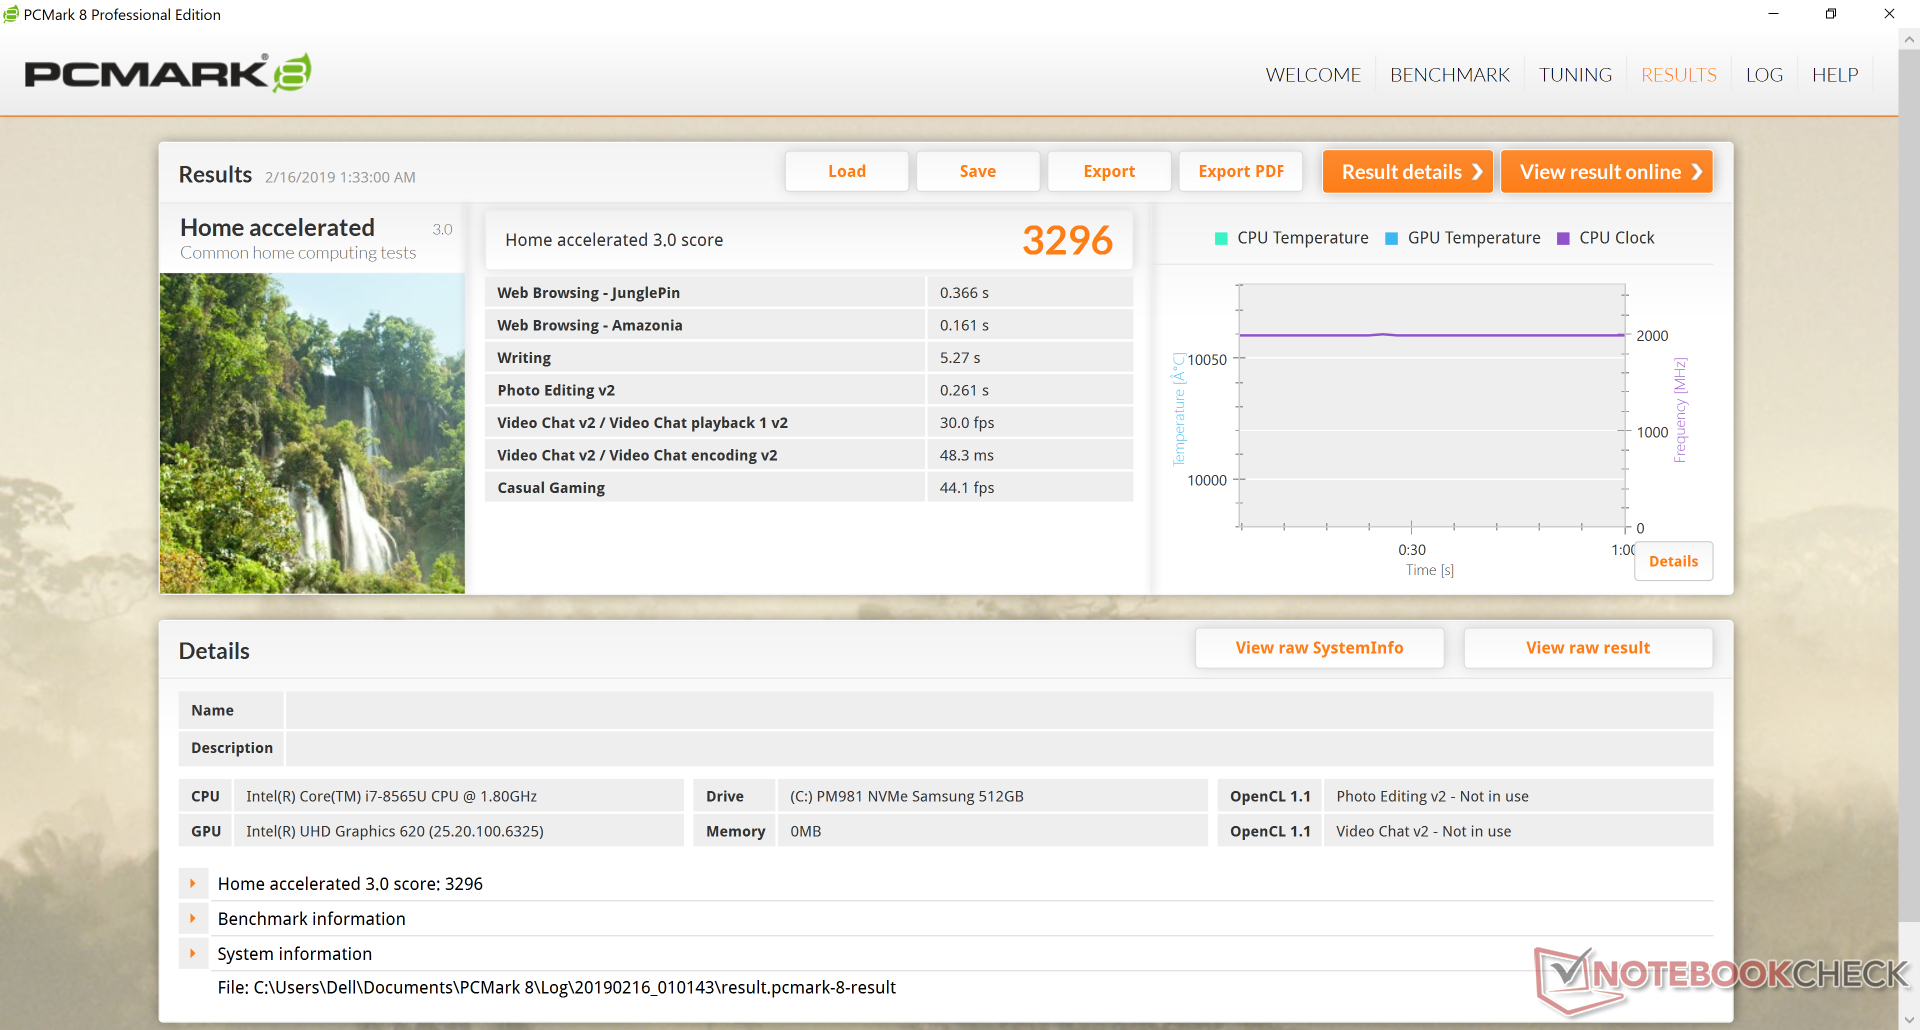
| PCMark 8 Home Score Accelerated v2 | 3296 points | |
| PCMark 8 Work Score Accelerated v2 | 4304 points | |
| PCMark 10 Score | 4172 points | |
Help | ||
Storage Devices
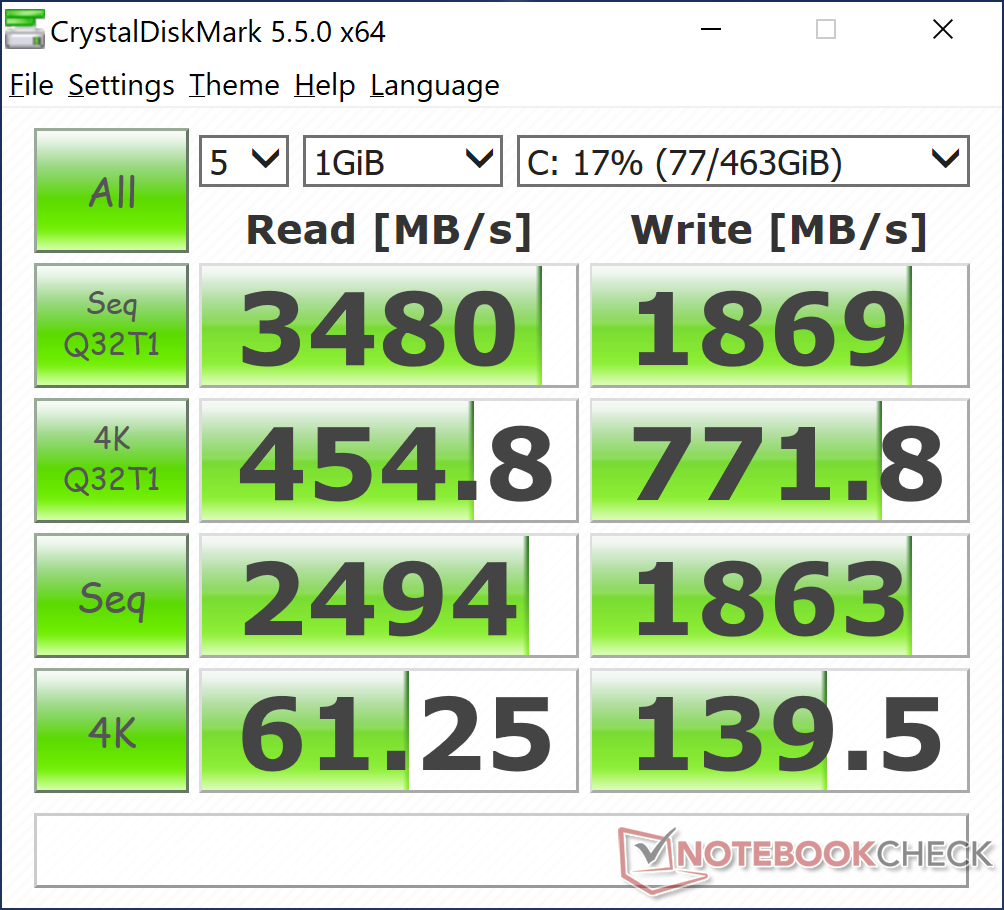
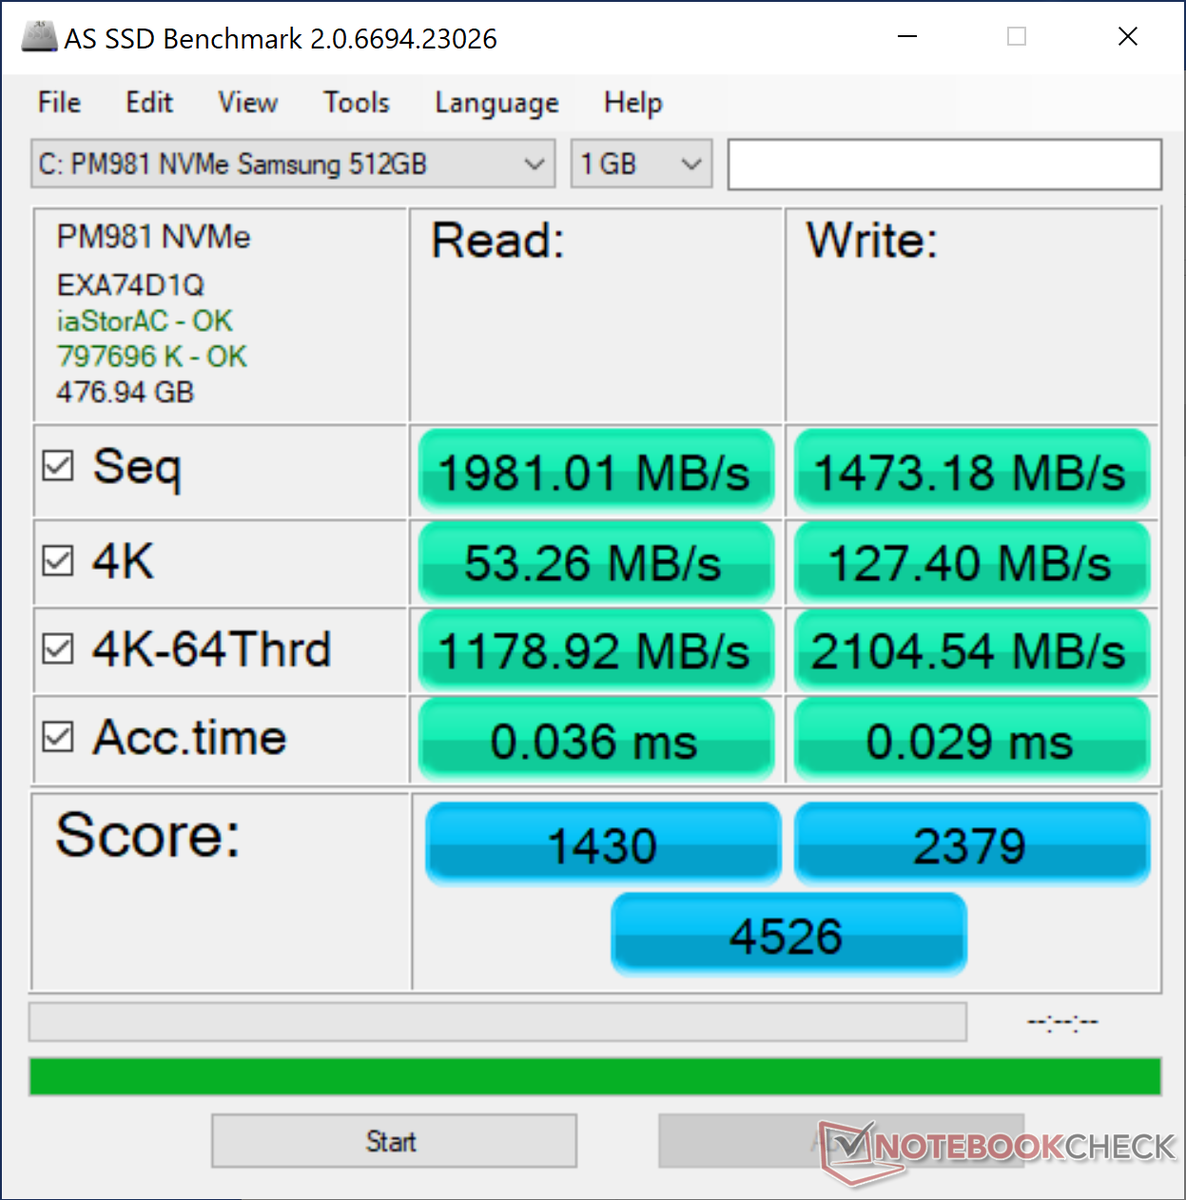
Our test unit carries the same 512 GB Samsung SSD PM981 NVMe SSD as on the Huawei MateBook 13 and Razer Blade 15. Samsung SSDs tend to perform faster than competing drives and this is no exception. The Western Digital and SK Hynix drives in the ZenBook 13 UX333 and HP Spectre x360 15, for example, have measurably slower sequential write rates. There are no secondary internal drive options as one would expect from a subnotebook.
Interestingly, our 9380 Core i5 SKU carries a slower 256 GB SSD from SK Hynix. It is therefore likely that Dell is sourcing its drives from multiple OEMs and not just from Samsung which is somewhat unfortunate.
See our table of HDDs and SSDs for more benchmark comparisons.
| Dell XPS 13 9380 i7 4K Samsung SSD PM981 MZVLB512HAJQ | Samsung Notebook 9 NP930QAA Samsung PM961 MZVLW256HEHP | Asus ZenBook 13 UX333FA WDC PC SN520 SDAPNUW-256G | Huawei MateBook 13 i7 Samsung SSD PM981 MZVLB512HAJQ | Dell XPS 15 9570 Core i9 UHD Samsung SSD PM981 MZVLB1T0HALR | HP Spectre x360 15-ch011nr SK hynix PC401 NVMe 500 GB | |
|---|---|---|---|---|---|---|
| AS SSD | -29% | -40% | -4% | -8% | -34% | |
| Seq Read (MB/s) | 1981 | 1824 -8% | 1186 -40% | 1889 -5% | 1320 -33% | 1739 -12% |
| Seq Write (MB/s) | 1473 | 986 -33% | 809 -45% | 1812 23% | 1500 2% | 1189 -19% |
| 4K Read (MB/s) | 53.3 | 41.84 -22% | 39.69 -26% | 55.5 4% | 30.73 -42% | 38.76 -27% |
| 4K Write (MB/s) | 127.4 | 104.1 -18% | 114 -11% | 118.4 -7% | 94.4 -26% | 93.2 -27% |
| 4K-64 Read (MB/s) | 1179 | 1196 1% | 618 -48% | 1257 7% | 1453 23% | 646 -45% |
| 4K-64 Write (MB/s) | 2105 | 739 -65% | 510 -76% | 1571 -25% | 1815 -14% | 545 -74% |
| Access Time Read * (ms) | 0.036 | 0.061 -69% | 0.068 -89% | 0.041 -14% | 0.061 -69% | 0.054 -50% |
| Access Time Write * (ms) | 0.029 | 0.036 -24% | 0.032 -10% | 0.032 -10% | 0.044 -52% | 0.051 -76% |
| Score Read (Points) | 1430 | 1420 -1% | 776 -46% | 1502 5% | 1616 13% | 859 -40% |
| Score Write (Points) | 2379 | 941 -60% | 705 -70% | 1871 -21% | 2059 -13% | 757 -68% |
| Score Total (Points) | 4526 | 3051 -33% | 1870 -59% | 4147 -8% | 4507 0% | 2037 -55% |
| Copy ISO MB/s (MB/s) | 1294 | 1103 -15% | 1090 -16% | 1800 39% | 2577 99% | 1668 29% |
| Copy Program MB/s (MB/s) | 503 | 541 8% | 714 42% | 385.6 -23% | 515 2% | 486.8 -3% |
| Copy Game MB/s (MB/s) | 1148 | 418.6 -64% | 413 -64% | 982 -14% | 1120 -2% | 1042 -9% |
* ... smaller is better

GPU Performance
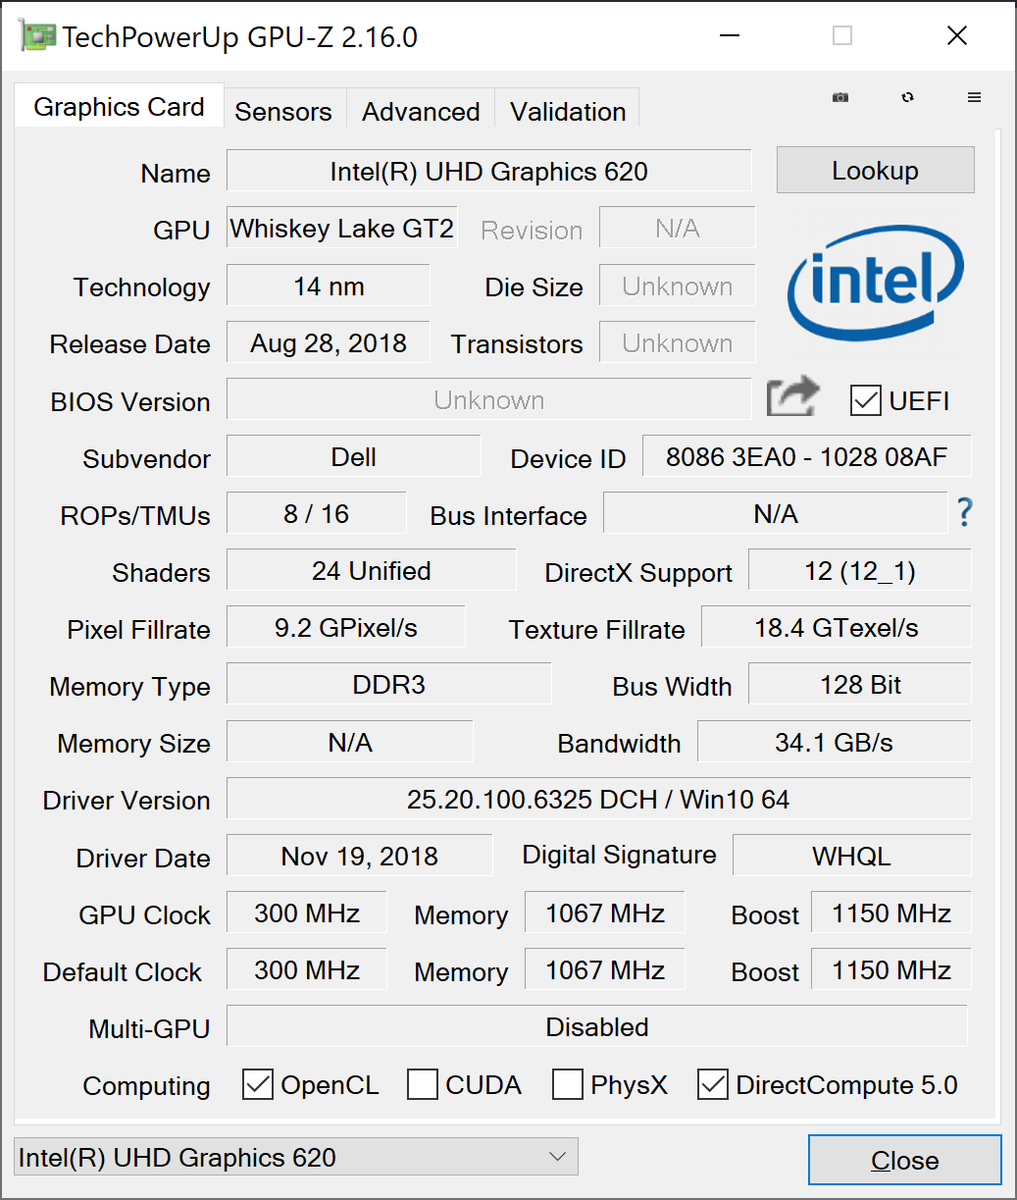
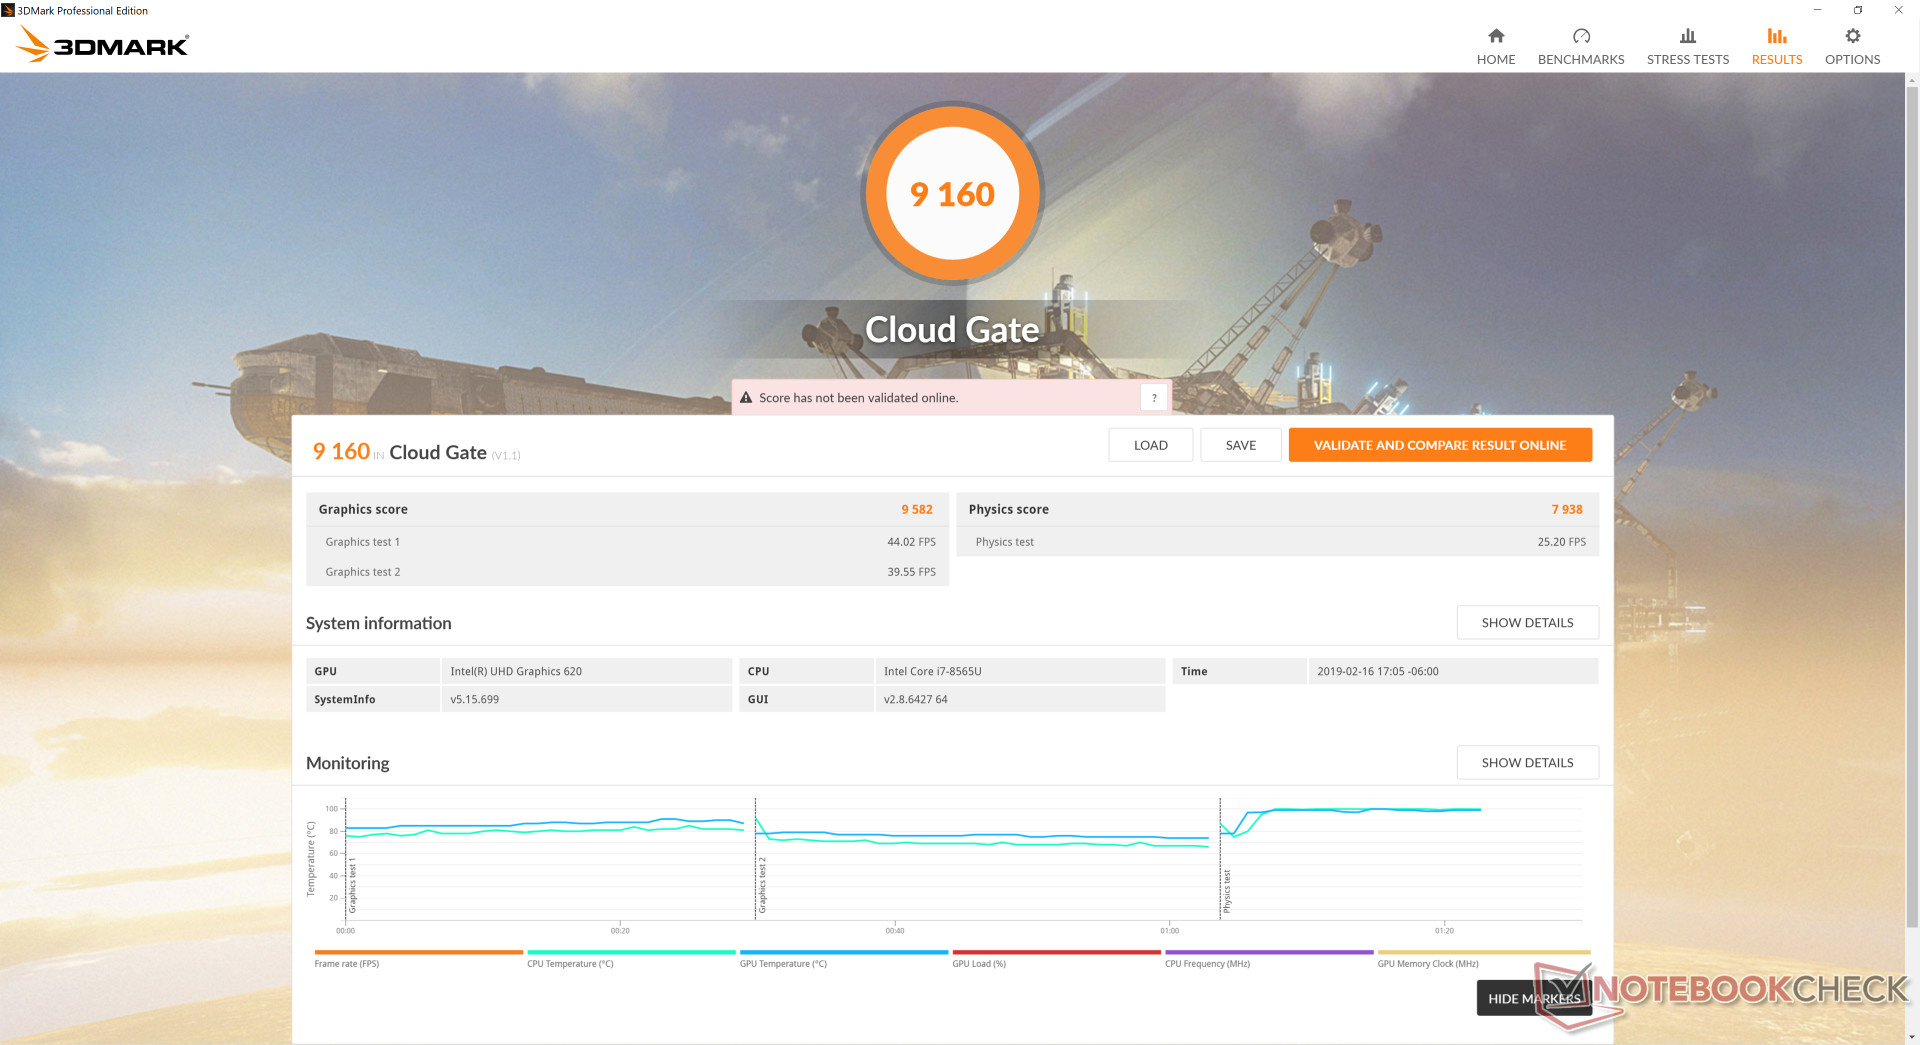
The XPS 13 holds no surprises here as its integrated UHD Graphics 620 is very common amongst Ultrabooks. 3DMark benchmarks reveal it to be nearly identical to the Core i5-8265U configuration and so users should not expect a graphics boost between the Core i5 and i7 SKUs. Dell has said that XPS 13 SKUs with more powerful Intel Iris or dedicated GeForce graphics are not in the works. Users who may desire such features are instead encouraged to consider the larger XPS 15 series.
See our dedicated page on the UHD Graphics 620 for more technical information and benchmark comparisons.
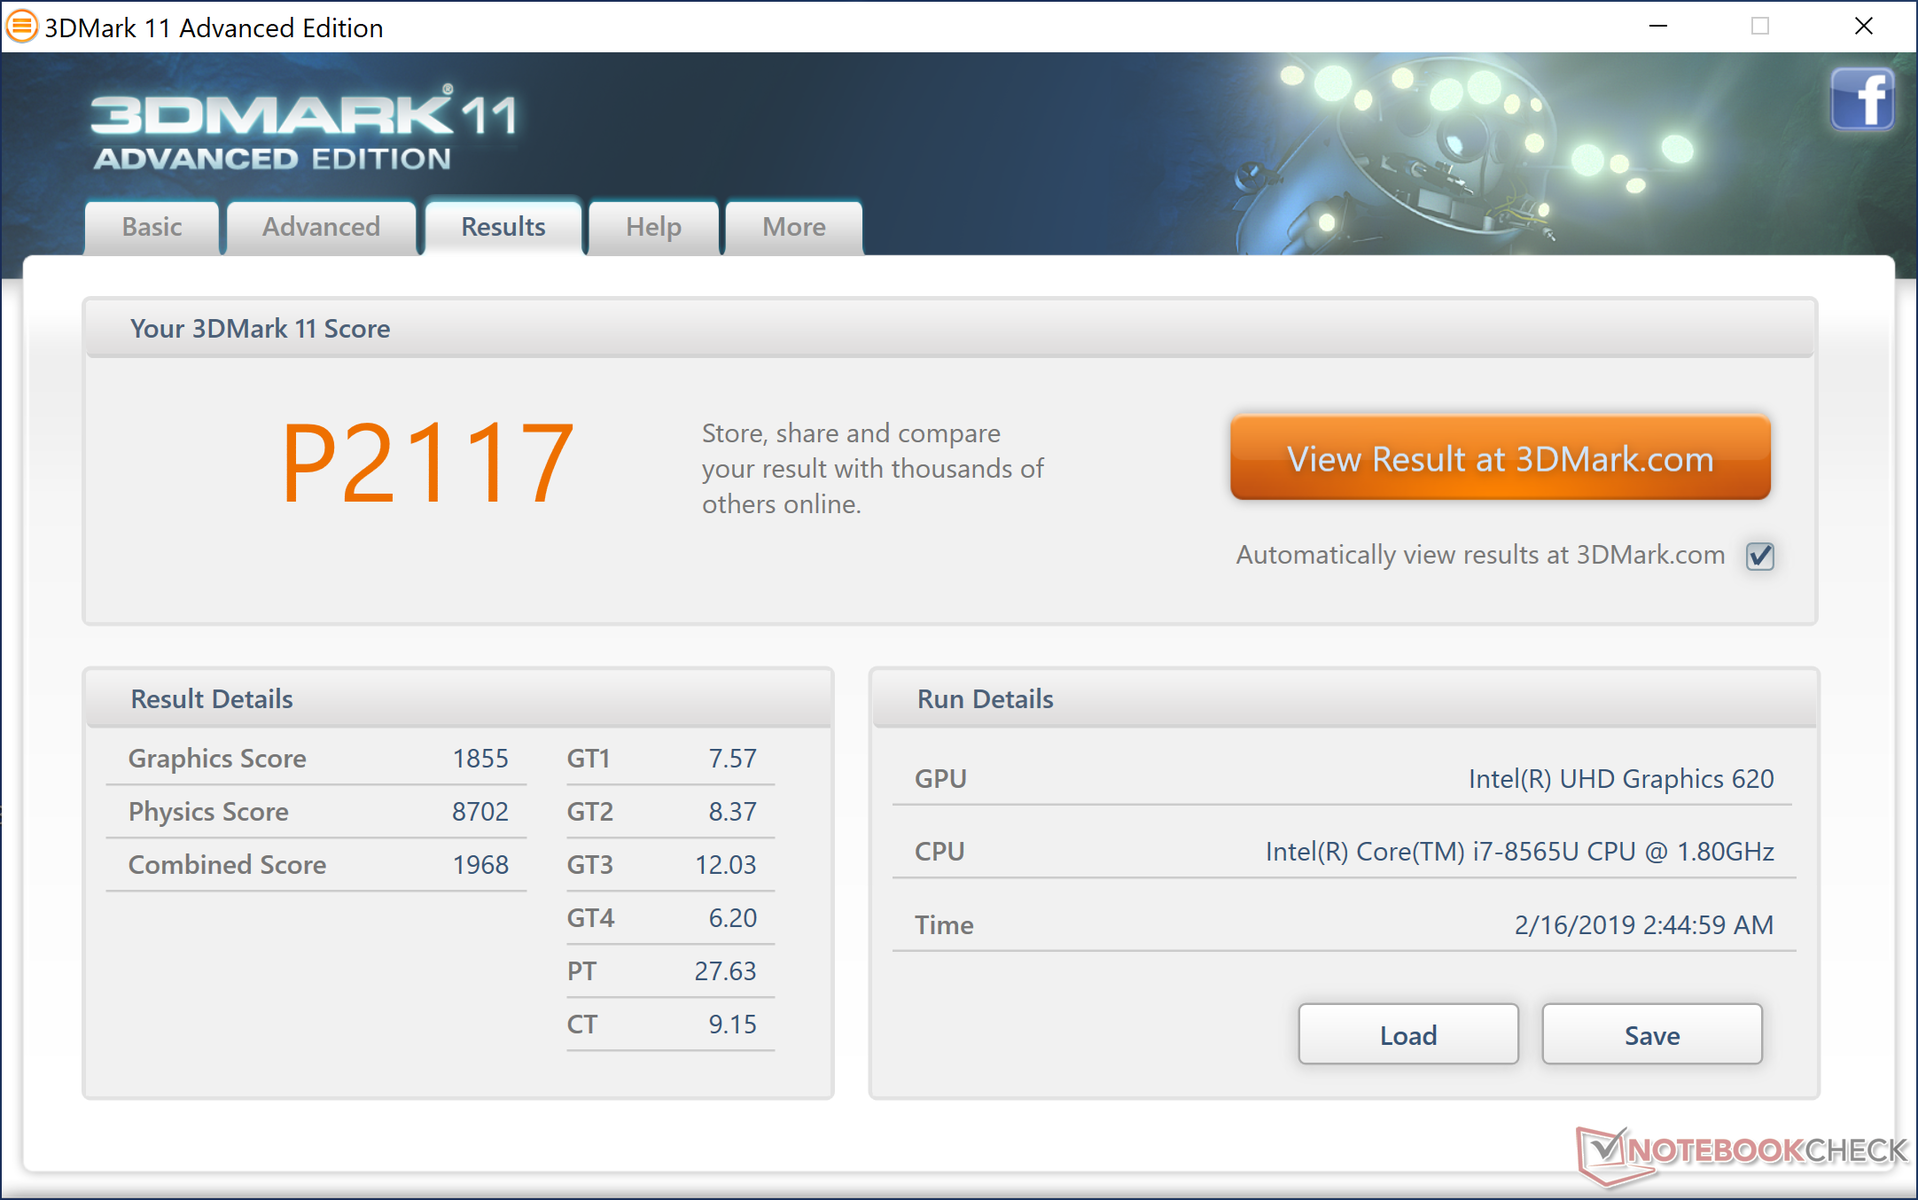
| 3DMark 11 Performance | 2117 points | |
| 3DMark Cloud Gate Standard Score | 9160 points | |
Help | ||
| low | med. | high | ultra | |
|---|---|---|---|---|
| BioShock Infinite (2013) | 81.5 | 39.1 | 32.5 | 10 |
Emissions
System Noise
The fans are idle and therefore silent during very low loads like browsing or streaming. Our particular test unit, however, exhibits slight but noticeable electronic noise and so it is never truly silent. We don't know if this is specific to our test unit or if it's present on retail units as well, but we suggest checking for electronic noise regardless.
Running 3DMark 06 will bump fan noise up to 34.6 dB(A) to be louder than on the Core i5 XPS 13 SKU. Fan noise appears to cap out at 34.6 to 36 dB(A) when running on the Dell Optimized power profile. When running on the Ultra Performance profile, fan noise will cycle between 34.6 to 46.8 dB(A) when under heavy sustained load like Prime95. This temporary maximum is louder than on most Ultrabooks which is the price to pay for squeezing out more performance out of the processor.
| Dell XPS 13 9380 i7 4K UHD Graphics 620, i7-8565U, Samsung SSD PM981 MZVLB512HAJQ | Huawei Matebook X Pro i5 GeForce MX150, i5-8250U, Samsung PM961 MZVLW256HEHP | Dell XPS 13 9370 i7 UHD UHD Graphics 620, i5-8550U, Toshiba XG5 KXG50ZNV512G | Apple MacBook Pro 13 2018 Touchbar i5 Iris Plus Graphics 655, i5-8259U | Razer Blade Stealth i7-8565U GeForce MX150, i7-8565U, Lite-On CA3-8D256-Q11 | Dell XPS 13 9380 2019 UHD Graphics 620, i5-8265U, SK hynix PC401 HFS256GD9TNG | |
|---|---|---|---|---|---|---|
| Noise | 3% | 5% | -2% | -1% | 2% | |
| off / environment * (dB) | 28.4 | 27.9 2% | 28 1% | 29.6 -4% | 28.4 -0% | 30.4 -7% |
| Idle Minimum * (dB) | 29.4 | 27.9 5% | 28 5% | 29.6 -1% | 28.5 3% | 30.4 -3% |
| Idle Average * (dB) | 29.4 | 27.9 5% | 28 5% | 29.6 -1% | 29 1% | 30.4 -3% |
| Idle Maximum * (dB) | 29.4 | 27.9 5% | 28 5% | 29.6 -1% | 29.1 1% | 30.4 -3% |
| Load Average * (dB) | 34.6 | 36.2 -5% | 32.5 6% | 36.7 -6% | 42.8 -24% | 31.7 8% |
| Load Maximum * (dB) | 46.8 | 45.2 3% | 42.2 10% | 46.7 -0% | 41.6 11% | 38.1 19% |
| Witcher 3 ultra * (dB) | 45 | 32.5 | 41.4 |
* ... smaller is better
Noise level
| Idle |
| 29.4 / 29.4 / 29.4 dB(A) |
| Load |
| 34.6 / 46.8 dB(A) |
 | ||
30 dB silent 40 dB(A) audible 50 dB(A) loud |
||
min: | ||
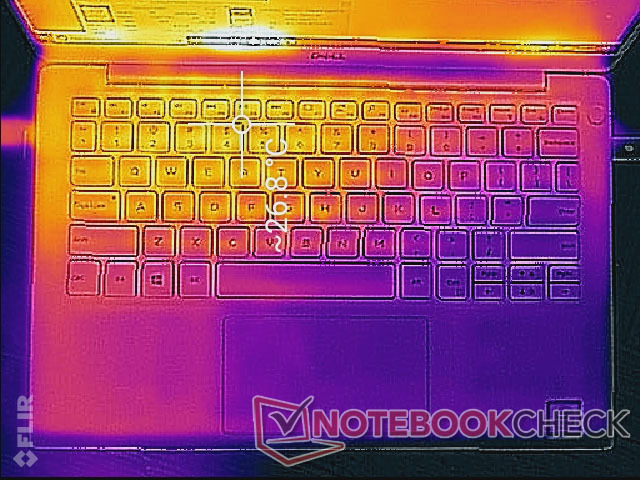
Temperature
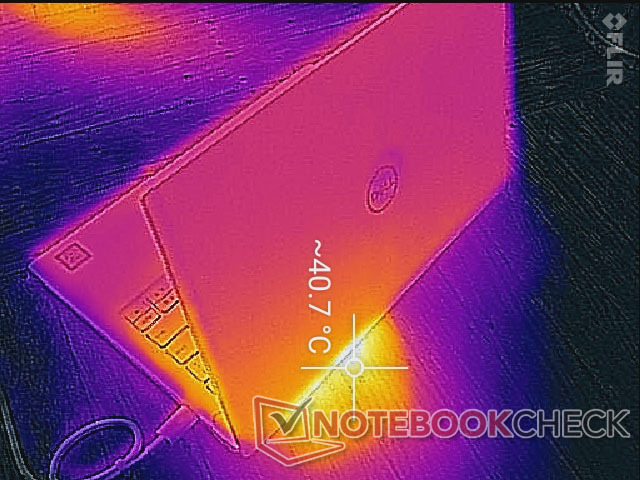
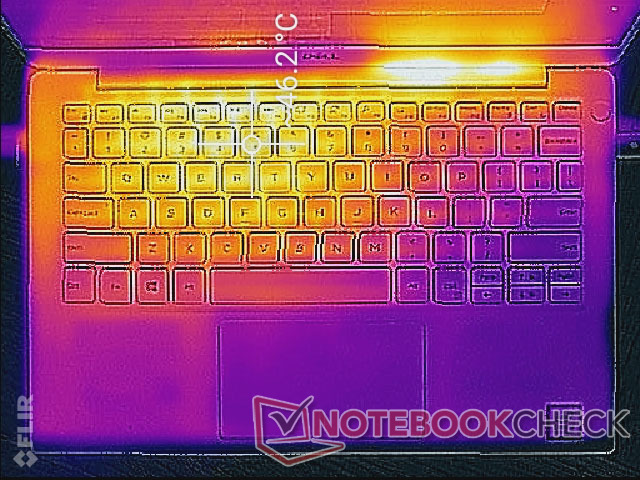
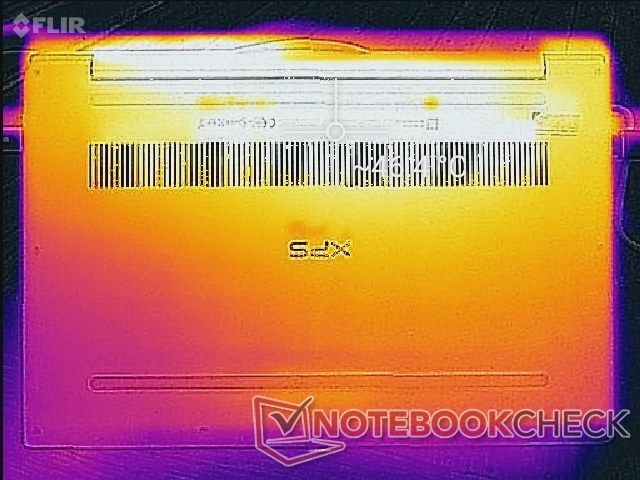
Surface temperature development remains essentially identical to last year's 9370 series since the internal GORE cooling solution has not changed. The left half of the laptop will generally always be warmer than the right half due to the positioning of the processor and heat sink inside. Thankfully, the palm rests remain relatively cool no matter the load. The keyboard can become much warmer on the Dell when under very high load compared to the competing Asus ZenBook 13 UX333 (46 C vs. 36 C).
Stress Test
We stress the laptop with synthetic loads to identify for any potential throttling or stability issues. Core temperature when idling can be as low as 39 C, but sudden increases in background activity can bump it over the 70 C range rather quickly.
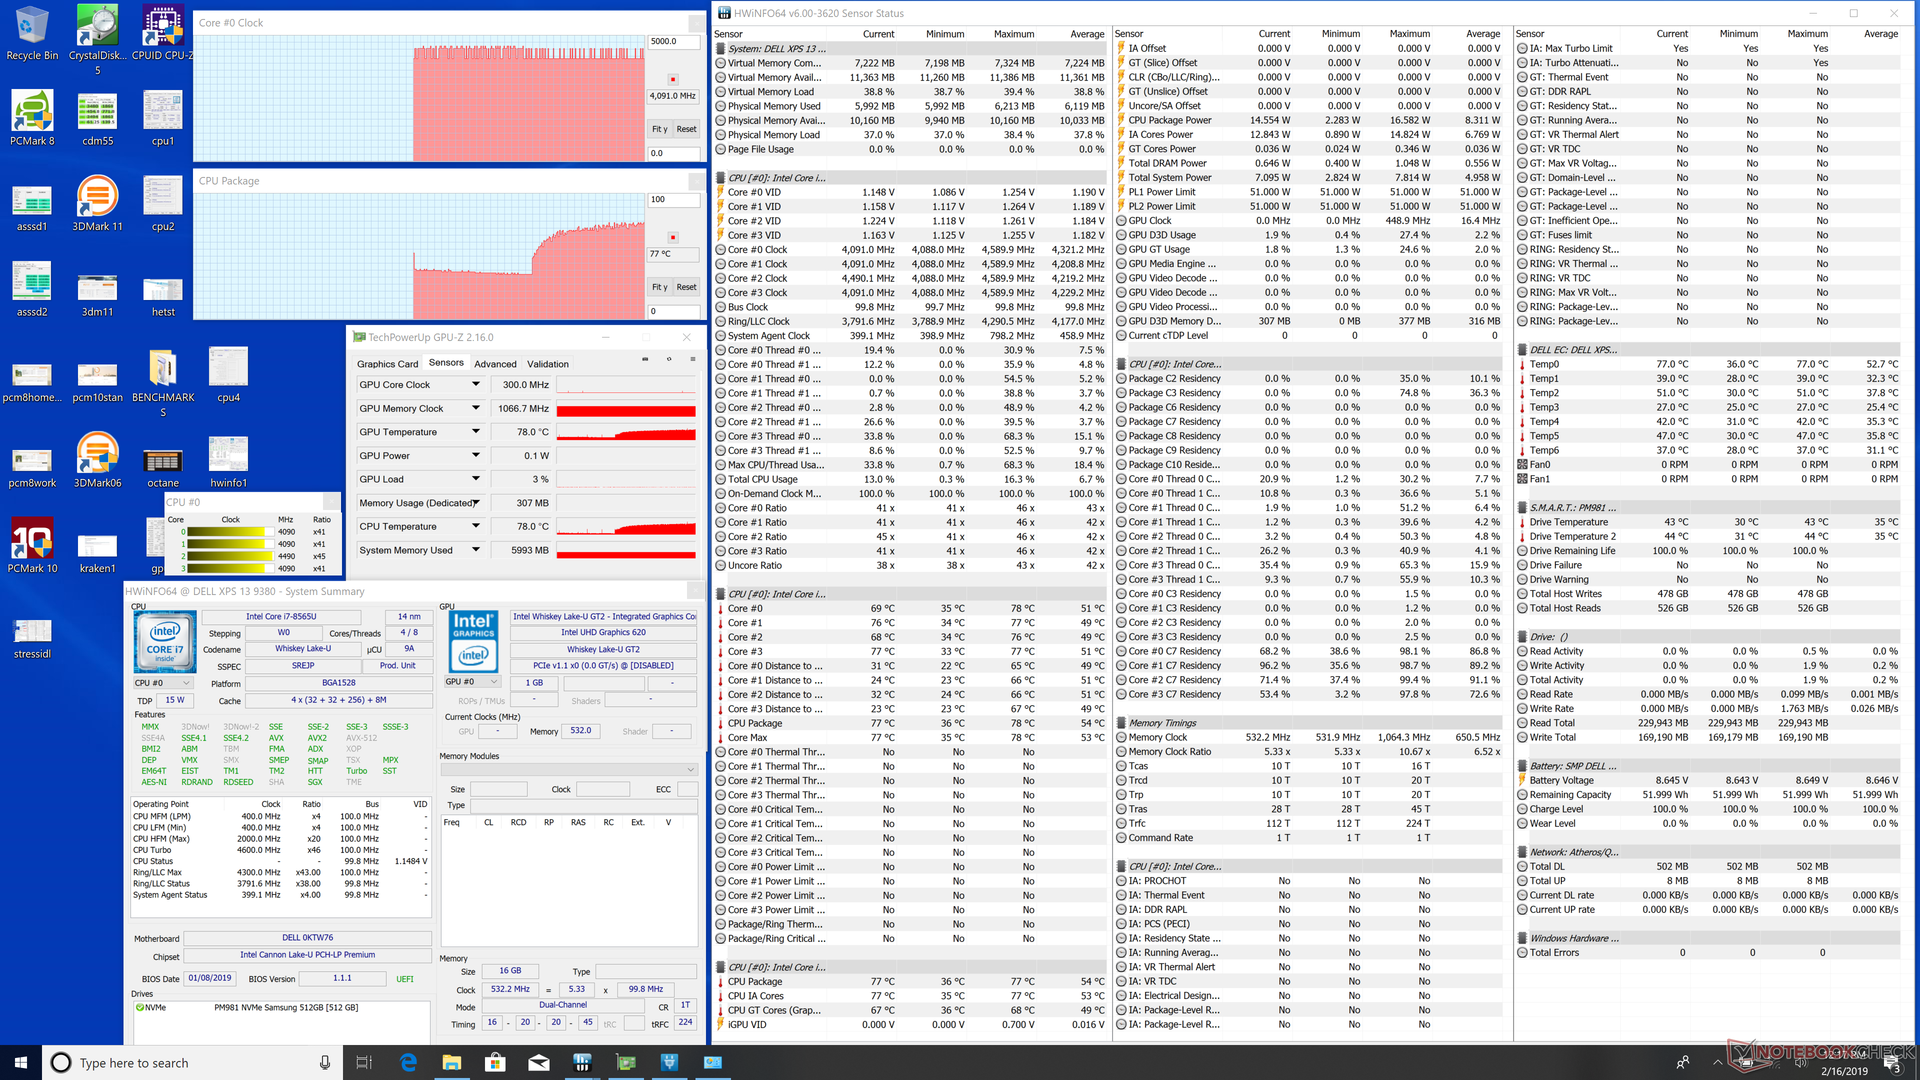
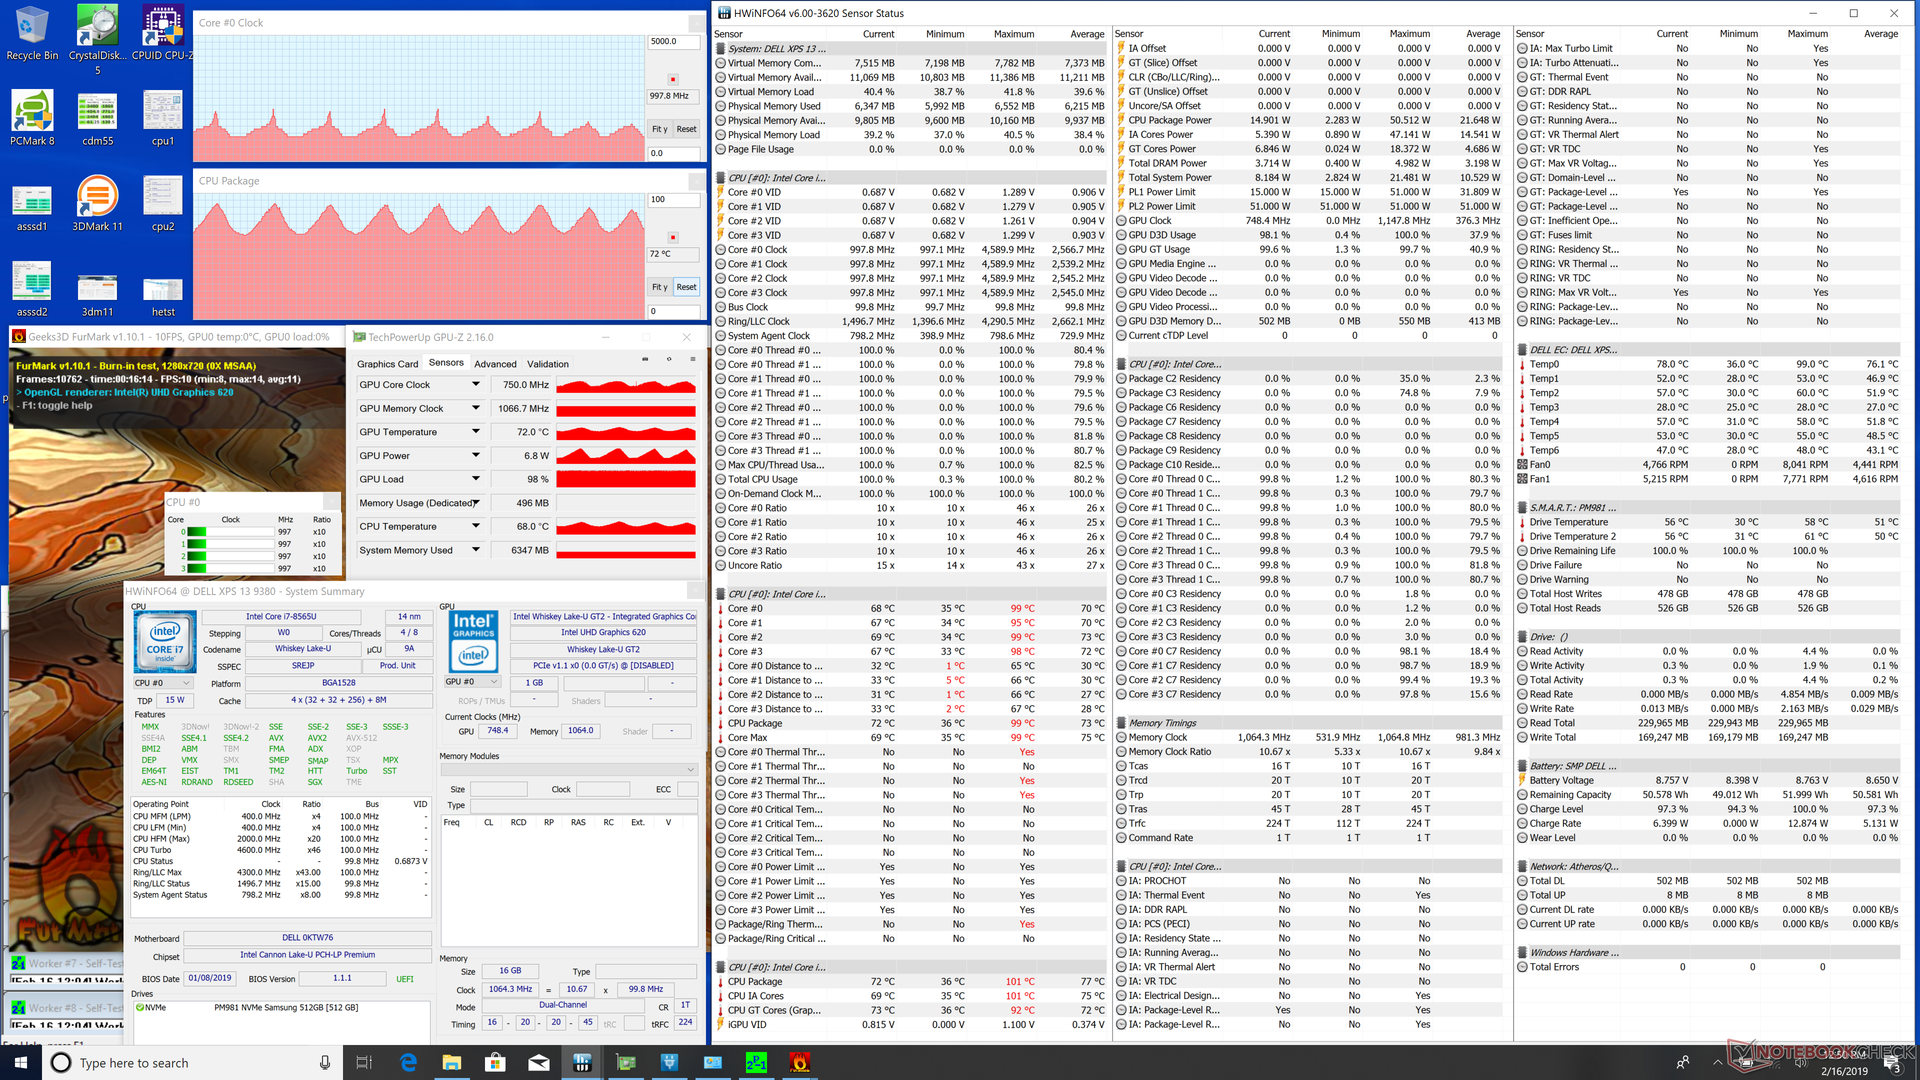
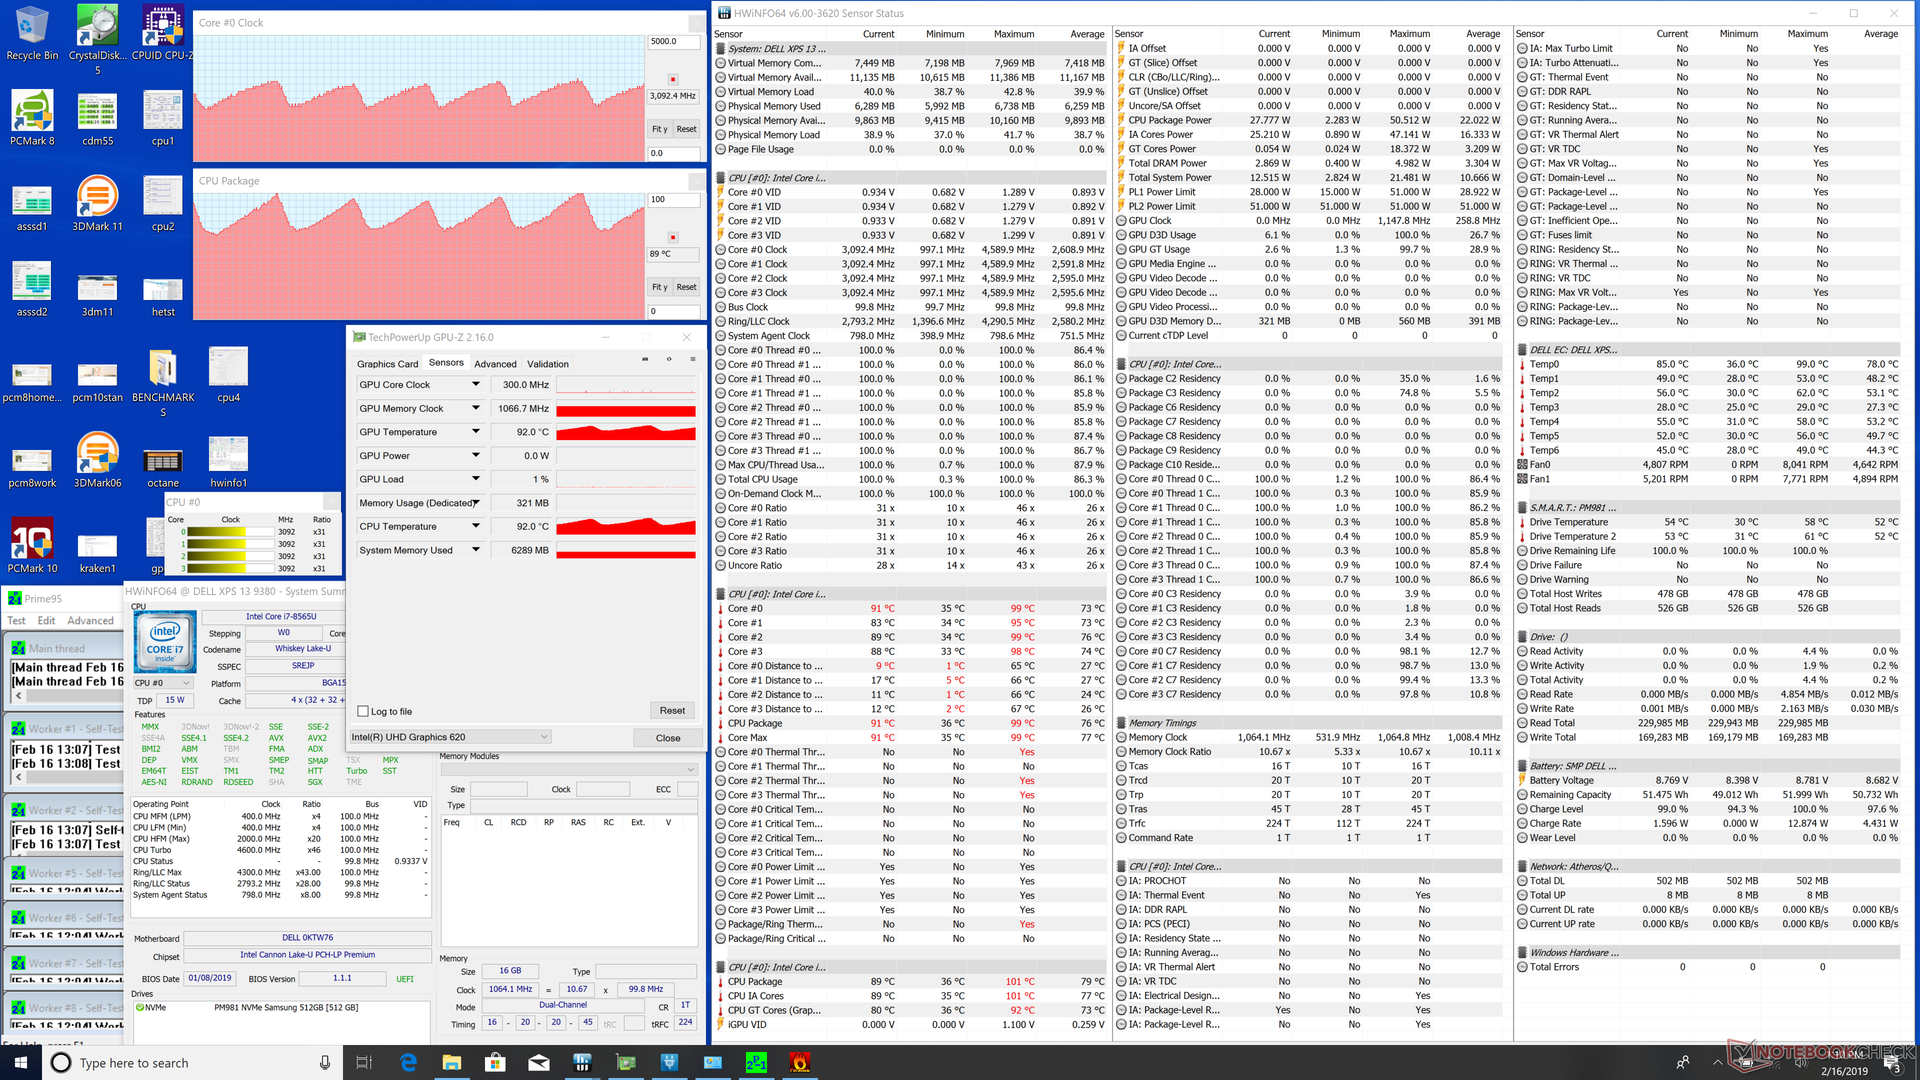
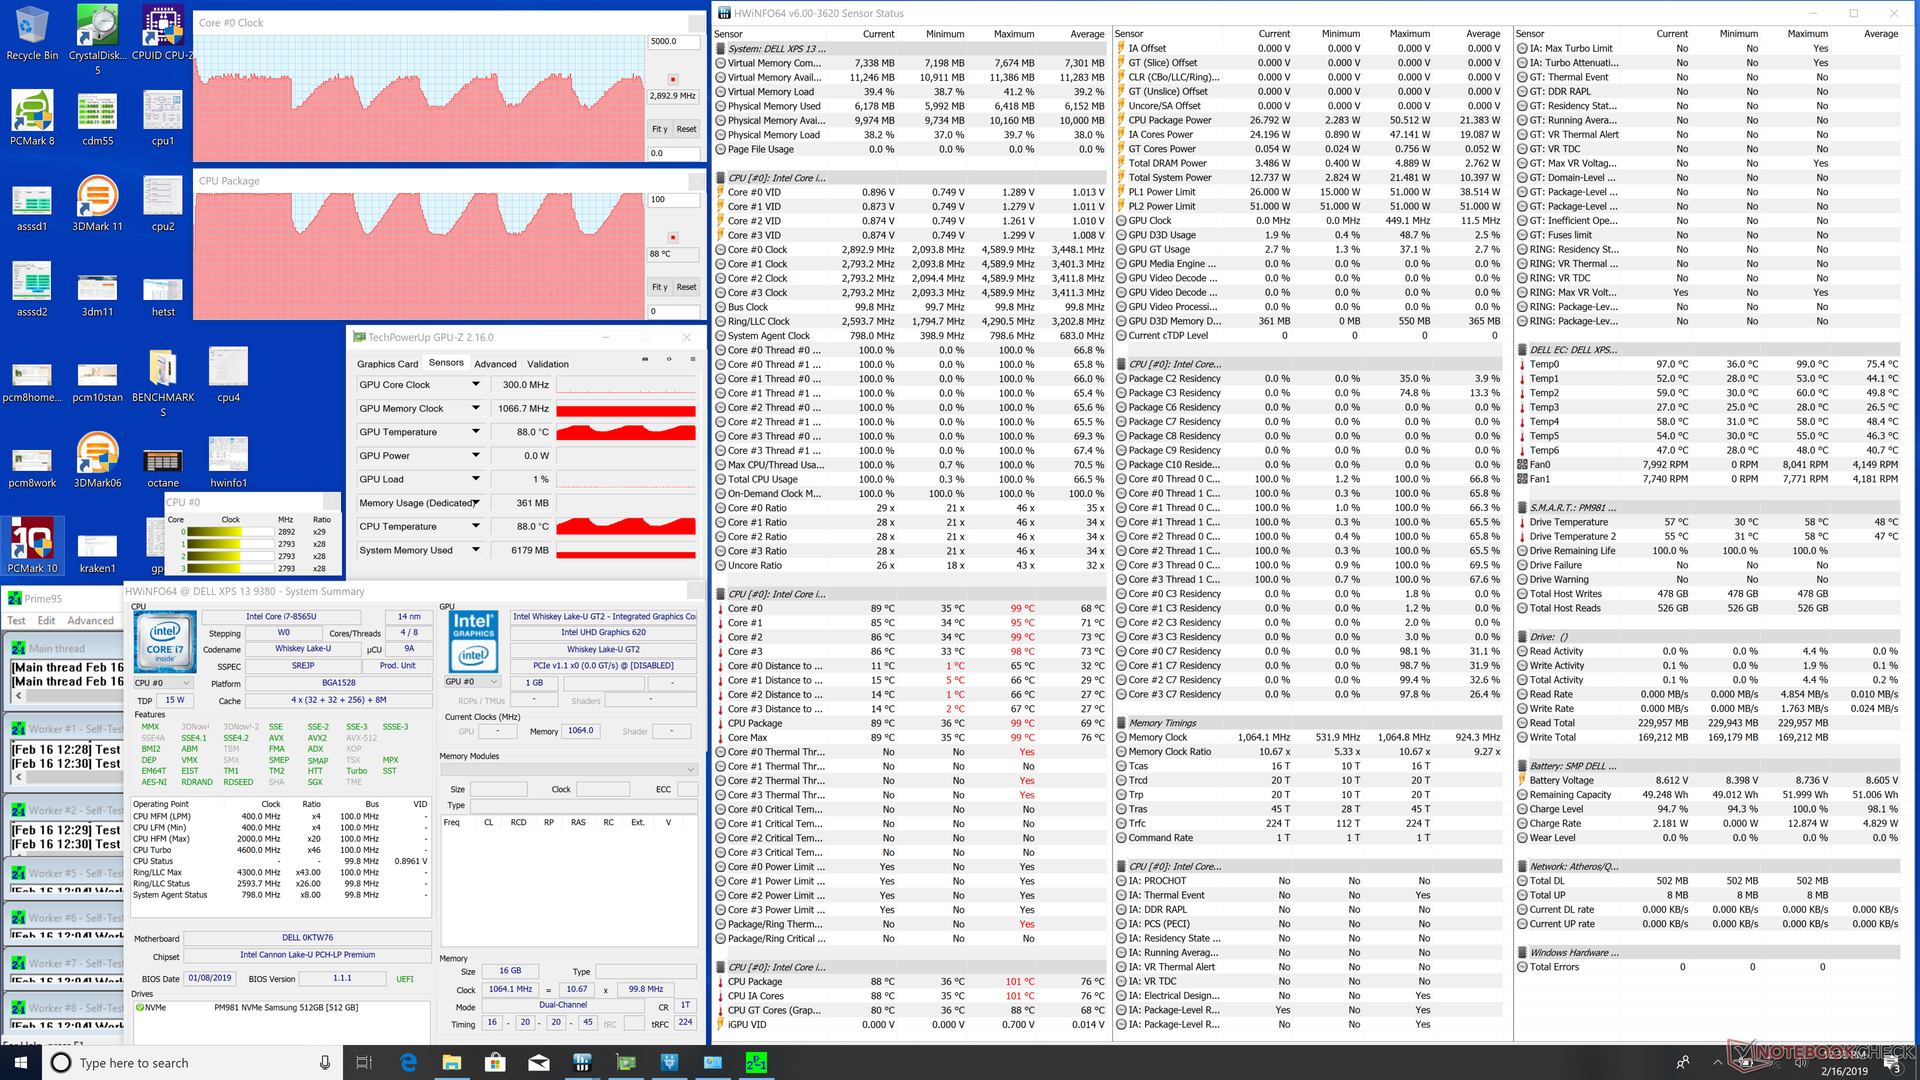
The XPS 13 is unique in that Dell offers two performance modes outside of the standard Windows power profiles: Optimized and Ultra Performance. As shown by our CineBench tests above, CPU performance is different depending on which mode is selected. Our HWiNFO screenshots below compare CPU performance in more detail when running Prime95 on Optimized and Ultra Performance modes. Unlike most other Ultrabooks that eventually stabilize at fixed CPU clock rates, the XPS 13 has a much wider Turbo Boost clock rate range in order to squeeze out more performance on average over time — even if that means having a more unsteady clock rate and core temperature.
Running Prime95 on Optimized mode results in a cycling CPU clock rate between 2.1 GHz and 3.2 GHz and a cycling core temperature ranging from 70 C to 100 C. When on Ultra Performance mode, the clock rate range is higher at 2.1 GHz to 3.5 GHz while the core temperature range is essentially the same. The main difference is that core temperature remains at 100 C for a few seconds longer in order to run at faster clock rates for longer periods of time. During the start of the stress test, the CPU will attempt to run at its fastest Turbo Boost clock rate of 3.5 to 3.6 GHz before inevitably falling and initializing its cycling behavior. These observations mirrors our sinusoidal CineBench loop test results.
Running on batteries will limit CPU power even when on the High Performance and Ultra Performance profiles. A 3DMark 11 run on battery power returns Physics and Graphics scores of 7576 and 1741 points, respectively, compared to 8702 and 1855 points when on mains.
| CPU Clock (GHz) | GPU Clock (MHz) | Average CPU Temperature (°C) | |
| System Idle | -- | -- | 36 |
| Prime95 Stress (Optimized mode) | 2.1 - 3.2 | -- | 70 - 100 |
| Prime95 Stress (Ultra Performance mode) | 2.2 - 3.5 | -- | 70 - 100 |
| Prime95 + FurMark Stress | 1.0 - 2.0 | 750 - 1100 | 69 - 91 |
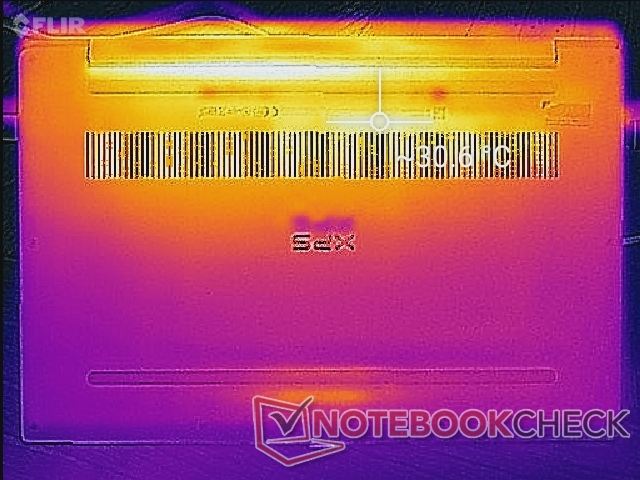
(-) The maximum temperature on the upper side is 46.2 °C / 115 F, compared to the average of 35.9 °C / 97 F, ranging from 21.4 to 59 °C for the class Subnotebook.
(-) The bottom heats up to a maximum of 46.2 °C / 115 F, compared to the average of 39.2 °C / 103 F
(+) In idle usage, the average temperature for the upper side is 23.3 °C / 74 F, compared to the device average of 30.8 °C / 87 F.
(+) The palmrests and touchpad are cooler than skin temperature with a maximum of 26 °C / 78.8 F and are therefore cool to the touch.
(+) The average temperature of the palmrest area of similar devices was 28.2 °C / 82.8 F (+2.2 °C / 4 F).
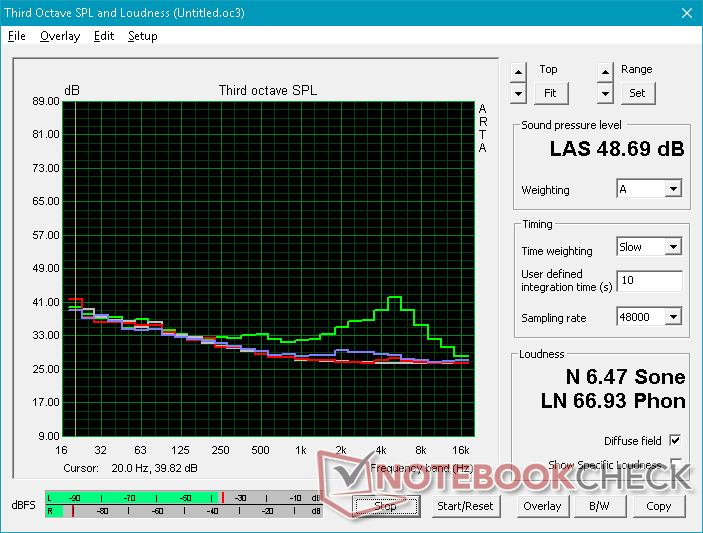
Speakers

Dell XPS 13 9380 i7 4K audio analysis
(±) | speaker loudness is average but good (75.3 dB)
Bass 100 - 315 Hz
(-) | nearly no bass - on average 18.5% lower than median
(±) | linearity of bass is average (8.1% delta to prev. frequency)
Mids 400 - 2000 Hz
(±) | higher mids - on average 7.7% higher than median
(±) | linearity of mids is average (11.5% delta to prev. frequency)
Highs 2 - 16 kHz
(±) | higher highs - on average 6.2% higher than median
(±) | linearity of highs is average (10.5% delta to prev. frequency)
Overall 100 - 16.000 Hz
(±) | linearity of overall sound is average (28.5% difference to median)
Compared to same class
» 90% of all tested devices in this class were better, 2% similar, 7% worse
» The best had a delta of 5%, average was 18%, worst was 53%
Compared to all devices tested
» 86% of all tested devices were better, 3% similar, 11% worse
» The best had a delta of 4%, average was 23%, worst was 134%
Apple MacBook 12 (Early 2016) 1.1 GHz audio analysis
(+) | speakers can play relatively loud (83.6 dB)
Bass 100 - 315 Hz
(±) | reduced bass - on average 11.3% lower than median
(±) | linearity of bass is average (14.2% delta to prev. frequency)
Mids 400 - 2000 Hz
(+) | balanced mids - only 2.4% away from median
(+) | mids are linear (5.5% delta to prev. frequency)
Highs 2 - 16 kHz
(+) | balanced highs - only 2% away from median
(+) | highs are linear (4.5% delta to prev. frequency)
Overall 100 - 16.000 Hz
(+) | overall sound is linear (10.2% difference to median)
Compared to same class
» 7% of all tested devices in this class were better, 2% similar, 90% worse
» The best had a delta of 5%, average was 18%, worst was 53%
Compared to all devices tested
» 5% of all tested devices were better, 1% similar, 94% worse
» The best had a delta of 4%, average was 23%, worst was 134%
Energy Management
Power Consumption
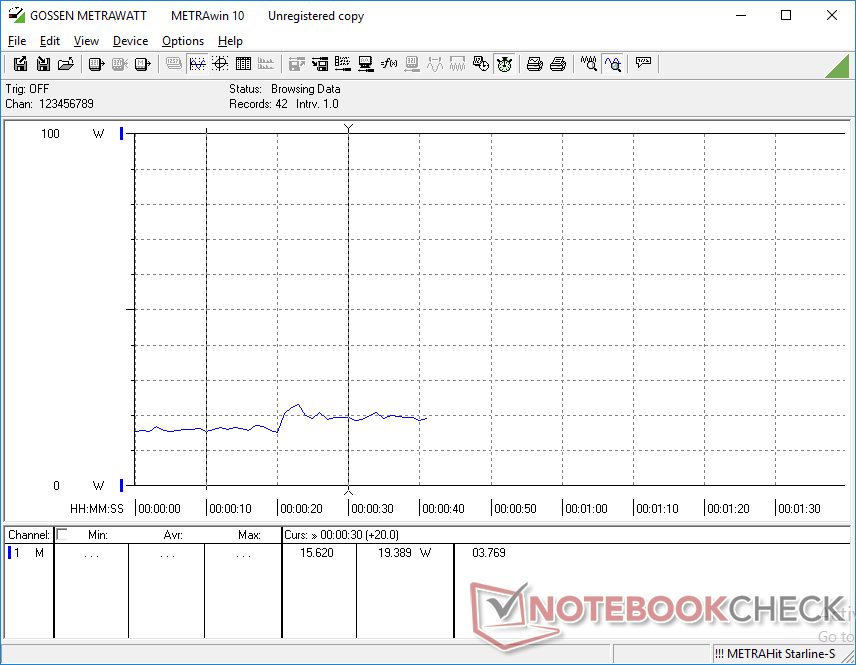
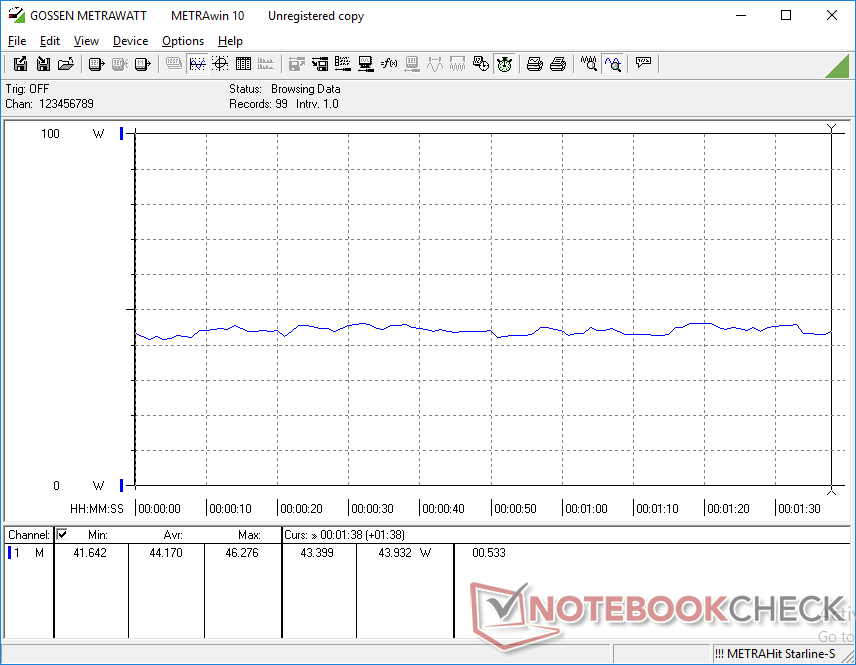
Power consumption when idling ranges from 5 W to 11 W depending on the brightness setting and power profile. Running the first benchmark scene of 3DMark 06 consumes about 44 W or over 6 W more than the lower-end Core i5-8265U SKU. Maximum consumption is about 48 W from the small (~6.0 x 5.5 x 2.3 cm) 45 W AC adapter. This is not constant, however, as power consumption dips and cycles when under such extreme processing loads in tandem with our CPU stress test observations above.
Note that the 3 W/3 A AC adapter can be used to quick charge other compatible USB Type-C devices as well including smartphones and tablets. Any of the three USB ports on the XPS 13 can be used to recharge the system.


Update 3/12/19: FHD is more efficient
As expected, the FHD SKU was more efficient when idle. It consistently required between 1 and 3 W less than the 4K SKU at identical levels of brightness.
| Off / Standby | |
| Idle | |
| Load |
|
Key:
min: | |
| Dell XPS 13 9380 i7 4K i7-8565U, UHD Graphics 620, Samsung SSD PM981 MZVLB512HAJQ, IPS, 3840x2160, 13.3" | Samsung Notebook 9 NP930QAA i5-8550U, UHD Graphics 620, Samsung PM961 MZVLW256HEHP, IPS, 1920x1080, 13.3" | Asus ZenBook 13 UX333FA i5-8265U, UHD Graphics 620, WDC PC SN520 SDAPNUW-256G, IPS, 1920x1080, 13.3" | Dell XPS 13 9370 i7 UHD i5-8550U, UHD Graphics 620, Toshiba XG5 KXG50ZNV512G, IPS, 3840x2160, 13.3" | Huawei MateBook 13 i7 i7-8565U, GeForce MX150, Samsung SSD PM981 MZVLB512HAJQ, IPS, 2160x1440, 13" | Apple MacBook Pro 13 2018 Touchbar i5 i5-8259U, Iris Plus Graphics 655, , IPS, 2560x1600, 13.3" | |
|---|---|---|---|---|---|---|
| Power Consumption | -8% | 33% | 3% | -11% | -3% | |
| Idle Minimum * (Watt) | 5.2 | 4.4 15% | 1.6 69% | 5 4% | 3.5 33% | 2.3 56% |
| Idle Average * (Watt) | 8.6 | 11.8 -37% | 4.6 47% | 8.3 3% | 7.5 13% | 8.7 -1% |
| Idle Maximum * (Watt) | 10.5 | 15.5 -48% | 7.3 30% | 8.8 16% | 12.4 -18% | 12.2 -16% |
| Load Average * (Watt) | 44.2 | 38 14% | 37.9 14% | 46.4 -5% | 64.2 -45% | 53.3 -21% |
| Load Maximum * (Watt) | 47.5 | 39.8 16% | 44.8 6% | 48.6 -2% | 65.7 -38% | 64 -35% |
| Witcher 3 ultra * (Watt) | 52.5 |
* ... smaller is better
Battery Life
Runtimes have not changed from last year's model. In fact, we recorded a WLAN runtime of 7 hours and 44 minutes — 1 minute shorter than on our XPS 13 9370. While still very good, anyone expecting longer battery life because of the new Whiskey Lake-U CPU won't find it here.
Note that the system recharges much more slowly when on higher loads. When running Prime95, for example, the recharge rate essentially grinds to a halt no matter the USB Type-C port used. Users who wish to recharge the laptop more quickly may want to avoid running very heavy loads.
Longer Battery Life Thanks to FHD Display
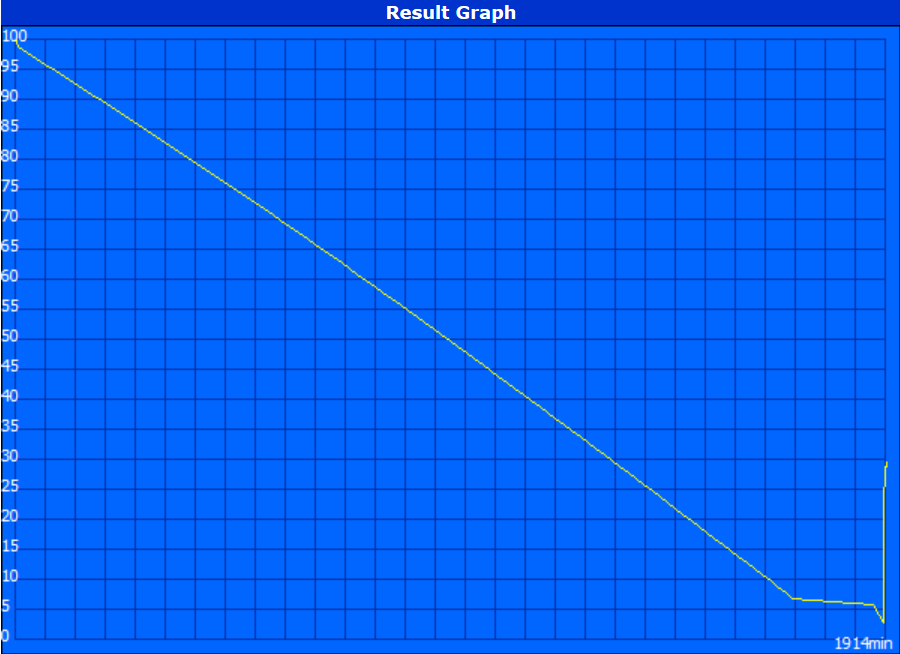
In addition to its matte display, another benefit of the FHD SKU is a much longer battery life. As already mentioned, we noticed a lower power consumption when idle, and it pays off: battery life was improved significantly.
In our idle test, the FHD SKU lasted for a whopping 900 minutes more than the UHD/i5 SKU despite its identical 52 Wh battery. In our Wi-Fi test, it lasted 70 % longer (or 13 instead of 8 hours). Opting for the FHD instead of the 4K panel thus translates into five extra hours of battery life in our real-world Wi-Fi test scenario.
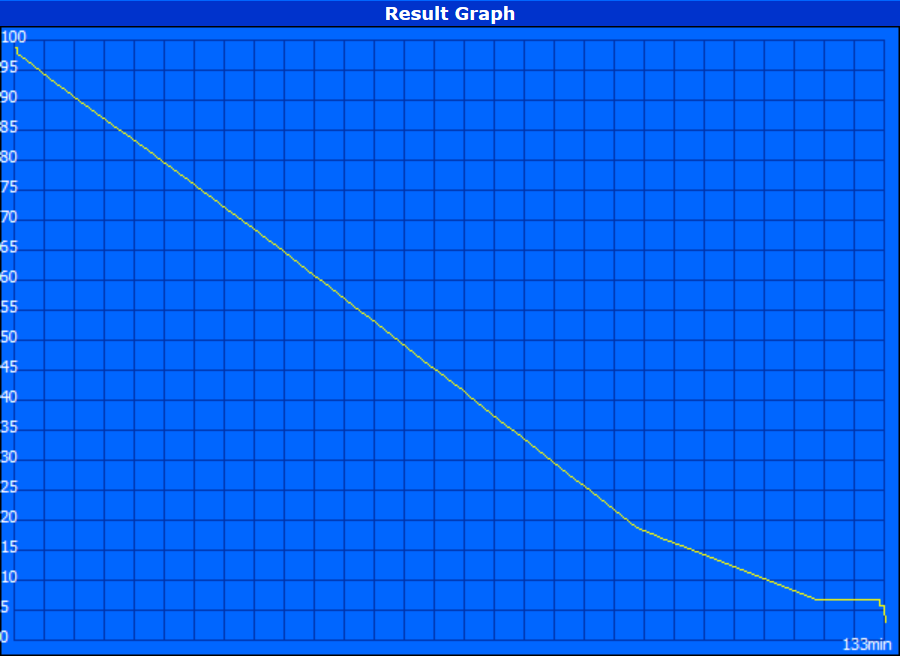
Battery life under load was almost identical and did not differ significantly. Both devices powered off after around 2 hours, the i7/FHD SKU lasted just 10 minutes longer than the i5/UHD SKU.
| Dell XPS 13 9380 i7 4K i7-8565U, UHD Graphics 620, 52 Wh | Asus ZenBook 13 UX333FA i5-8265U, UHD Graphics 620, 50 Wh | Huawei MateBook 13 i7 i7-8565U, GeForce MX150, 41.7 Wh | Apple MacBook Pro 13 2018 Touchbar i5 i5-8259U, Iris Plus Graphics 655, 58 Wh | Dell XPS 13 9370 i7 UHD i5-8550U, UHD Graphics 620, 52 Wh | Samsung Notebook 9 NP930QAA i5-8550U, UHD Graphics 620, 39 Wh | |
|---|---|---|---|---|---|---|
| Battery runtime | 29% | -1% | 26% | 1% | -14% | |
| WiFi v1.3 (h) | 7.7 | 9.9 29% | 7.6 -1% | 9.7 26% | 7.8 1% | 6.6 -14% |
| Reader / Idle (h) | 27.8 | 15.4 | 13.7 | 14.6 | ||
| Load (h) | 2.2 | 0.9 | 1.8 | 1.2 | ||
| Witcher 3 ultra (h) | 1.6 |
Pros
Cons
Verdict
The XPS 13 9380 is a solid subnotebook that directly addresses the webcam complaints of the 9360 and 9370 series. Everything we like and dislike about the 9370 series remain in effect here. We're instead interested in answering the question: Is the Core i7 SKU worth it over the Core i5 SKU?
Opting for the Core i7 configuration will bring an average performance boost of only 10 percent over the Core i5 configuration for $250 more. This wouldn't have been so bad if Dell had also doubled the RAM and/or storage between the two price points, but this is not the case. We highly recommend going for the Core i5 SKU and then investing in longer warranty or more RAM instead if possible.
Users who prefer the Core i7 SKU anyway will find that battery life and temperatures are not all that different when compared to the Core i5 SKU. Fan noise is louder, though this only becomes apparent when under higher loads. Thus, the small boost in CPU performance fortunately does not come with any major disadvantages.
The most expensive XPS 13 configuration is faster than the mid-tier configuration, but the delta is relatively minor in contrast to the wide price point differential between the two SKUs. We recommend investing those dollars on more tangible attributes for the system instead such as additional RAM, storage, or the 4K UHD touchscreen.
Update 3/12/19: Five Extra Hours With FHD
If you are out and about regularly and tend to work outdoors often, the matte FHD option is the much better choice. Not just because of its matte panel but also because it also gets you five extra hours of battery life (Wi-Fi test), which came as a very welcome surprise.
Besides the lower resolution and the lack of touch the FHD panel is not any worse than the 4K panel. It covers 99% of sRGB (94 % for the 4K model) and has a higher color accuracy to boot, regardless of whether it was calibrated or not.
If color accuracy and portability are important to you, we highly recommend the AOU FHD panel over the 4K panel.
Rating: the extra battery life would increase our battery rating from 90 to 96 % and the overall rating from 87.7 % to 88.4 %.
Dell XPS 13 9380 i7 4K
- 03/12/2019 v6 (old)
Allen Ngo
Price comparison
