HP EliteBook x360 1030 G3 (i7-8650U, FHD) Convertible Review
We checked out the HP EliteBook x360 1030 G3 convertible earlier this year as an entry-level configuration with the Core i5-8250U CPU, 128 GB SATA III SSD, and 8 GB of RAM. Today, we have the higher-end configuration with the Core i7-8650U CPU, 512 GB NVMe SSD, and 16 GB of RAM. We recommend reading up on our original review on the Core i5 version since this Core i7 version is identical in terms of chassis quality, input features, connectivity, and display.
For this review, we'll be focusing on the performance of the Core i7-8650U CPU and how it compares to the i5-8250U version. We'll also be comparing the system to newcomer competitors like the Lenovo Yoga C930, 2018 Surface Pro, and MateBook X Pro. Is it worth purchasing the higher-end Core i7-8650U configuration over the less expensive Core i5-8250U?
More HP EliteBook reviews:
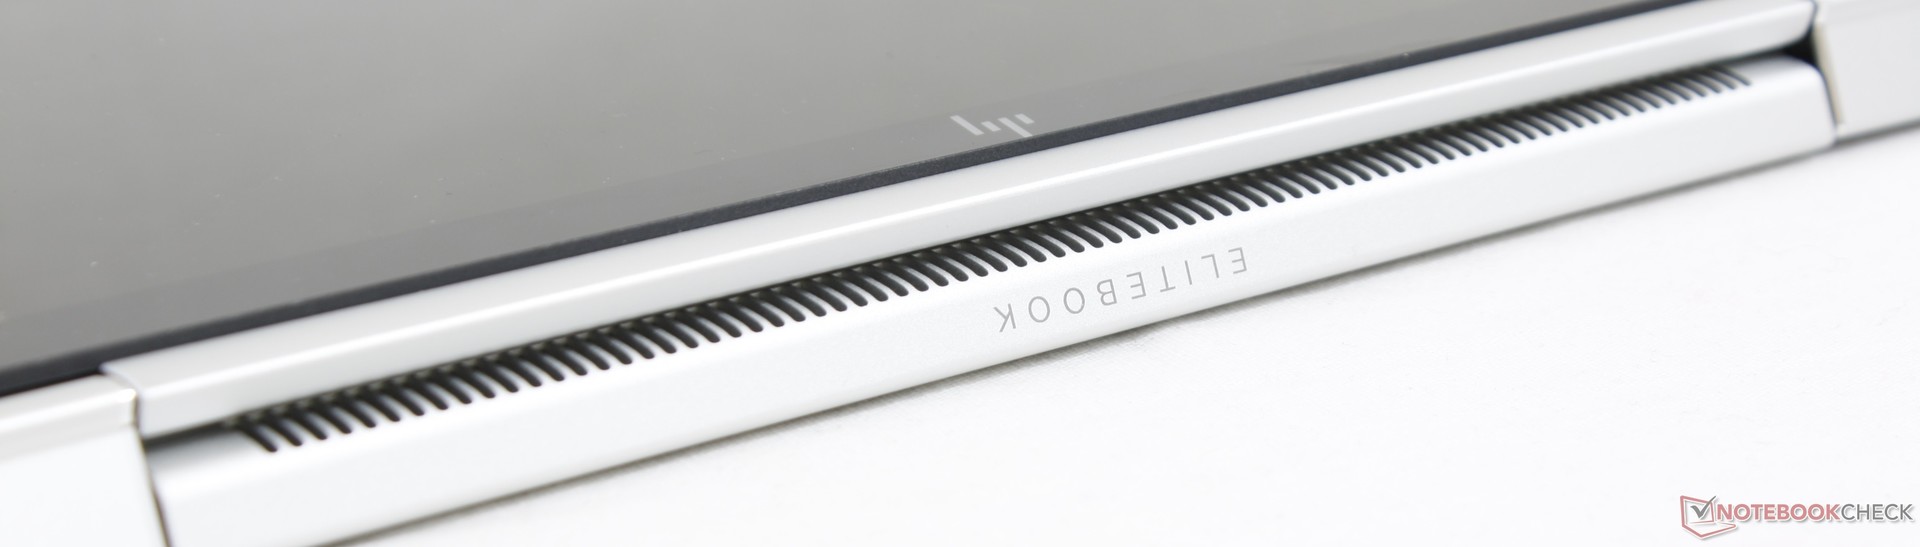
Case
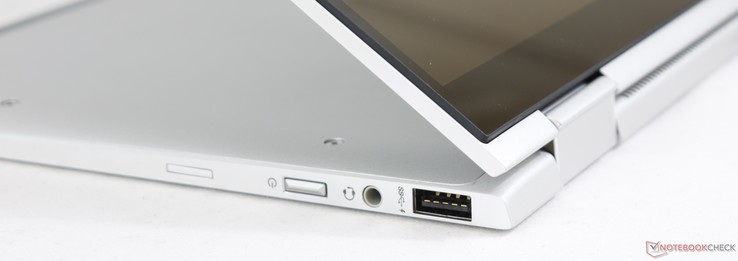
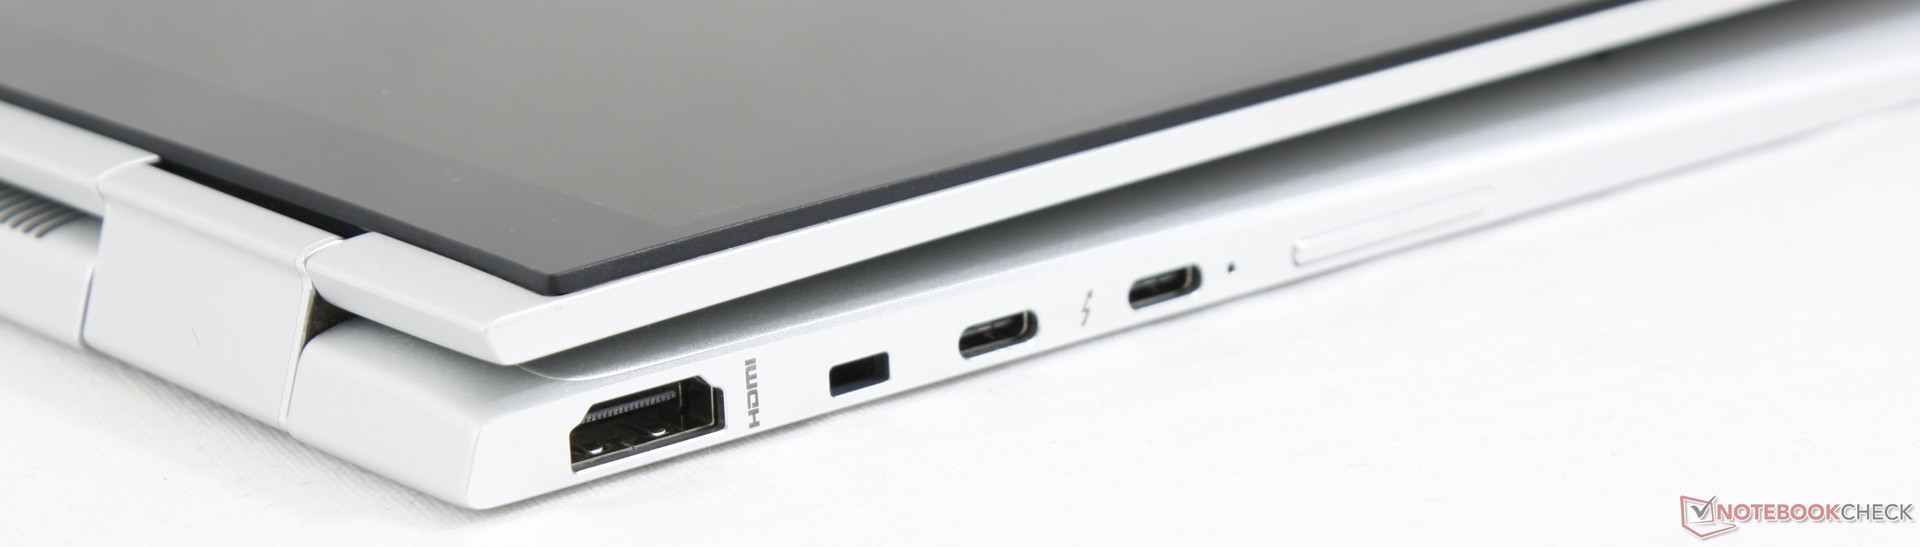
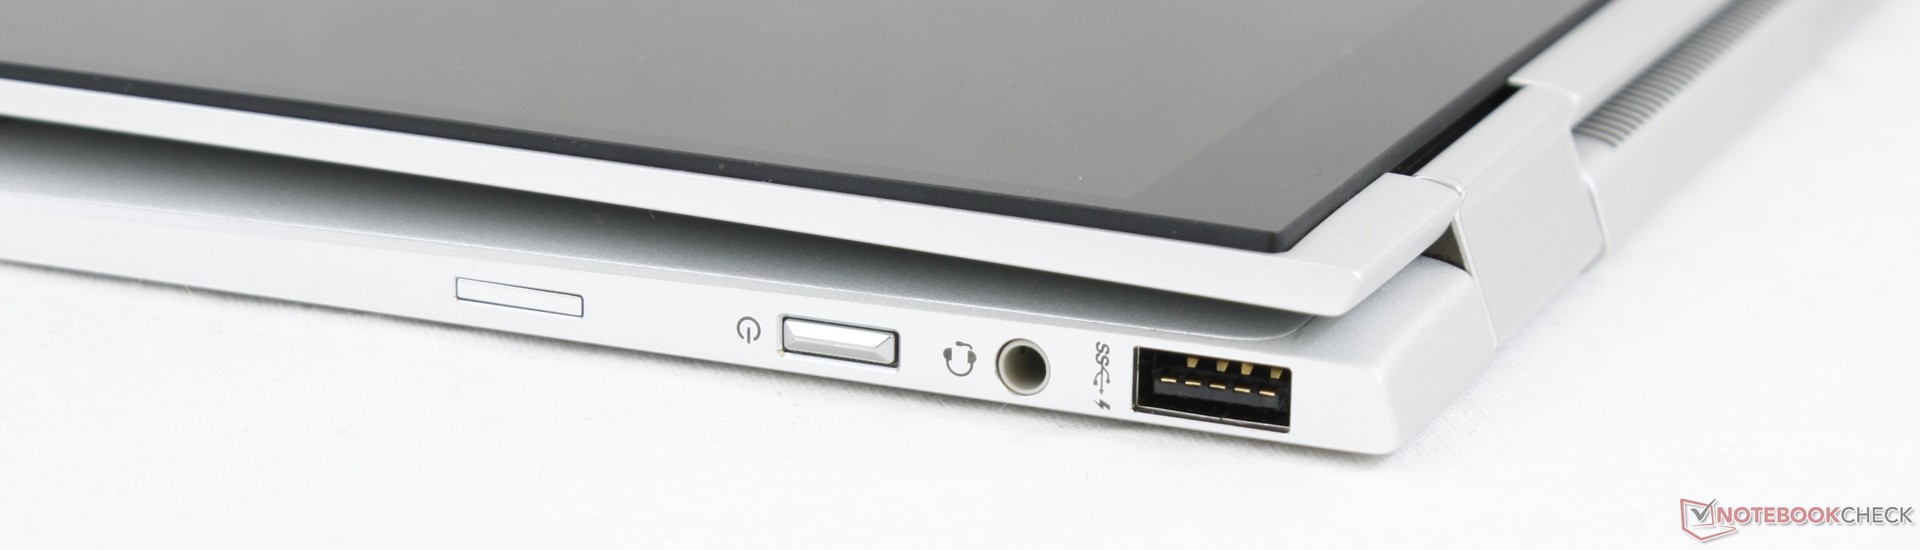
Connectivity
Communication
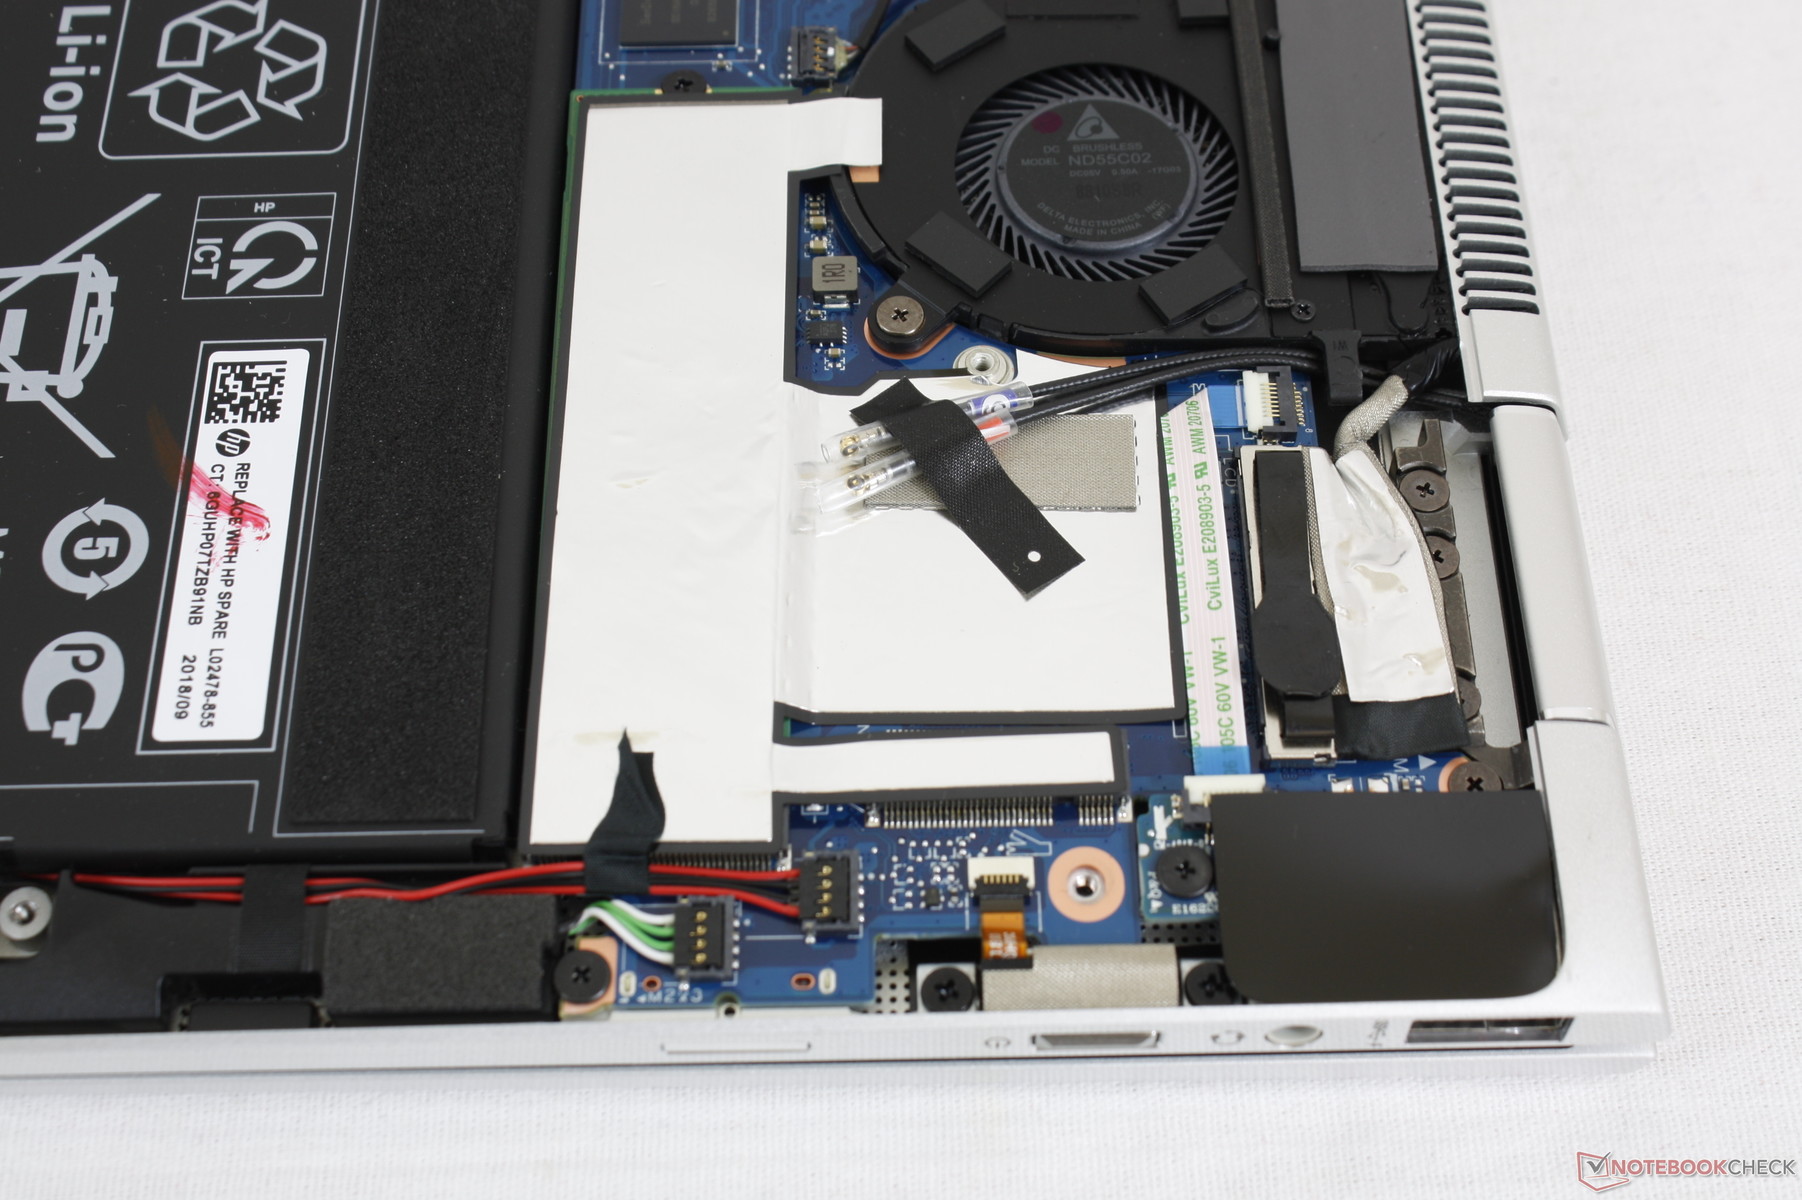
Empty M.2 slot for accepting a WAN module or 2230 SSD. The antennae are already installed on our unit despite the fact that our configuration is unable to accept SIM cards.
Intel 8265 comes standard whereas newer Ultrabooks are beginning to ship with 1.73 Gbps Intel 9260 modules.
Security
Security services separate the business-centric Elite series from other consumer-oriented models like the Pavilion or Spectre. The EliteBook x360 1030 G3 carries optional Sure View, fingerprint reader, BIOSphere, Sure Start, SpareKey, Client Security Manager, Sure Click, and many more to reduce online phishing or visual hacking while protecting the BIOS.
Accessories
Included extras are a USB-C to RJ-45 adapter, WACOM pen, and a USB-A to USB-C charging/data cable. HP is also pushing Thunderbolt docking stations in order to exploit the Thunderbolt 3 port of the EliteBook x360 1030 G3. The Thunderbolt Dock G2, for example, is a speaker with additional DisplayPort ports, USB ports, RJ-45, VGA, and more all in one. Compatible Thunderbolt-based docks and external monitors can also charge the laptop with nothing more than a single cable.
Maintenance
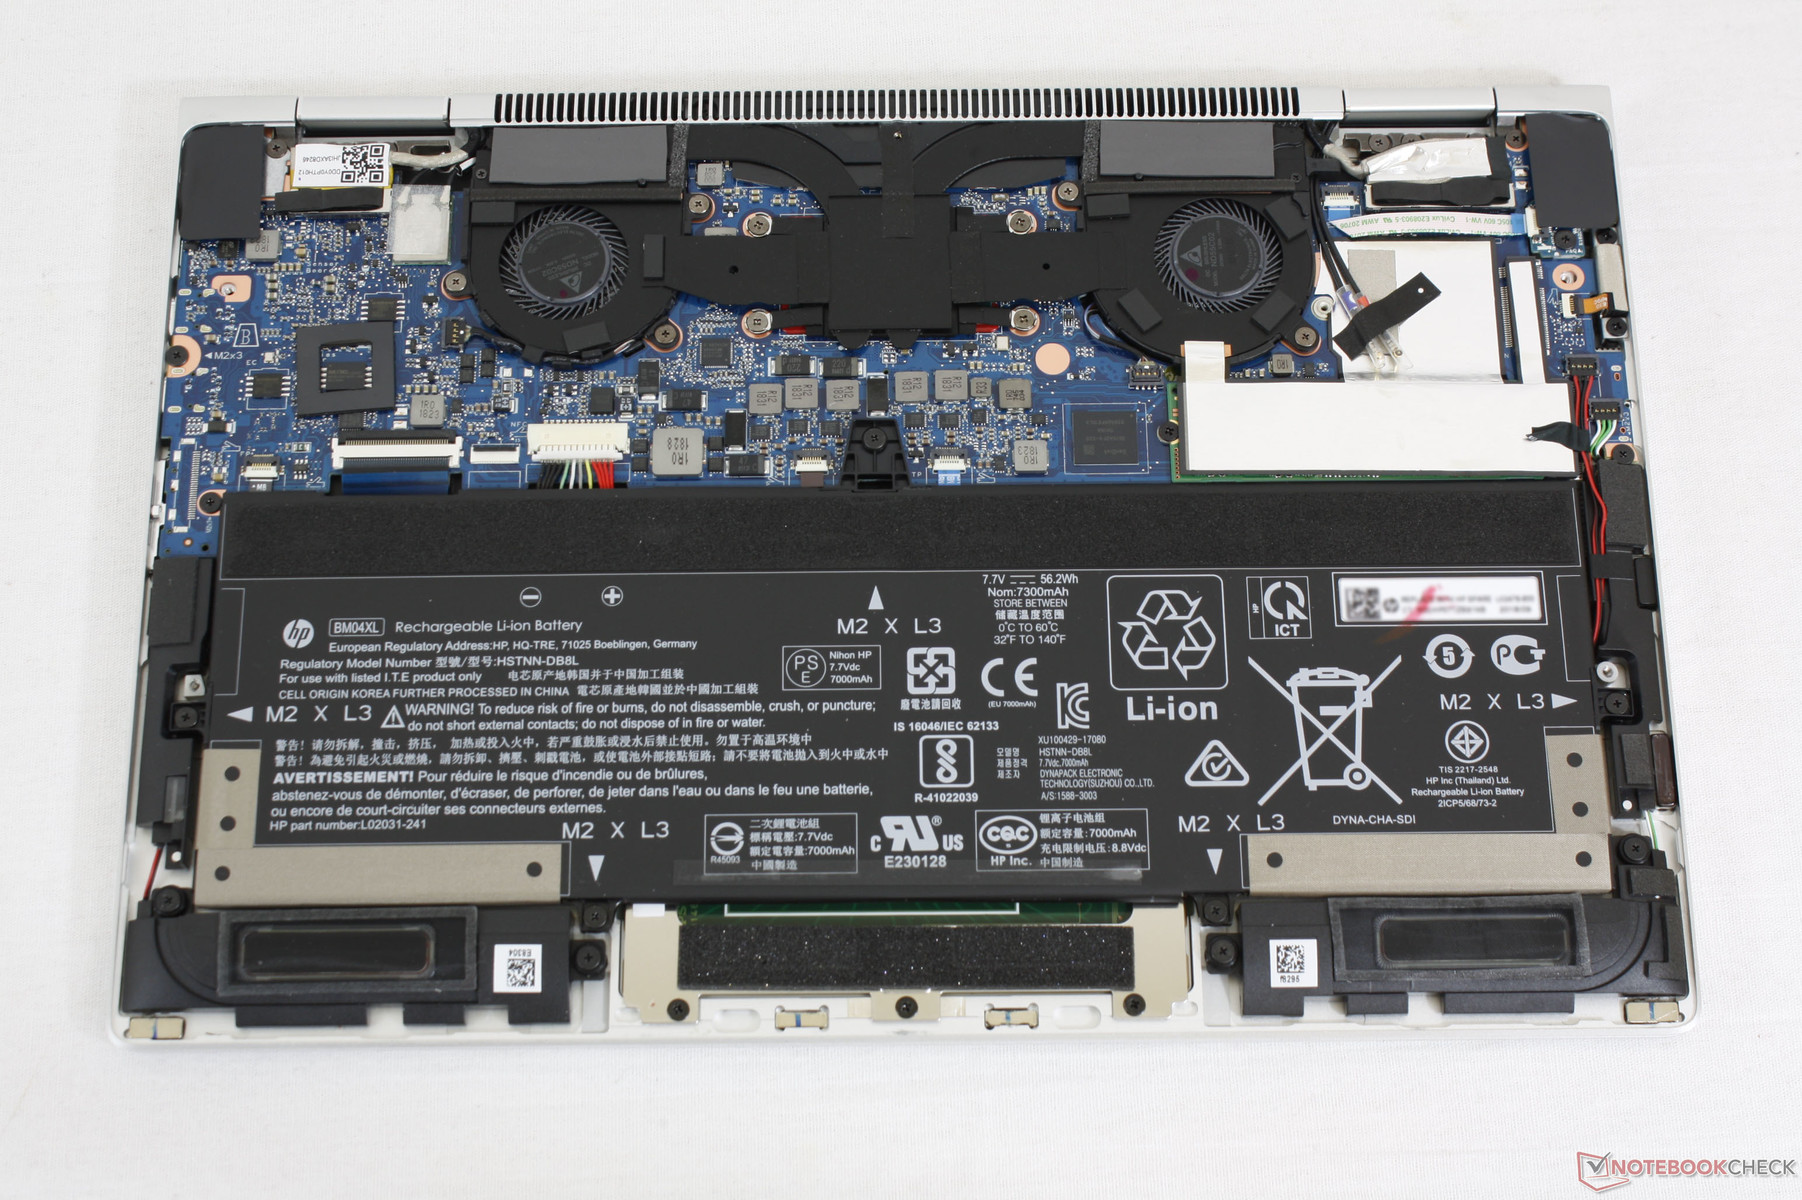
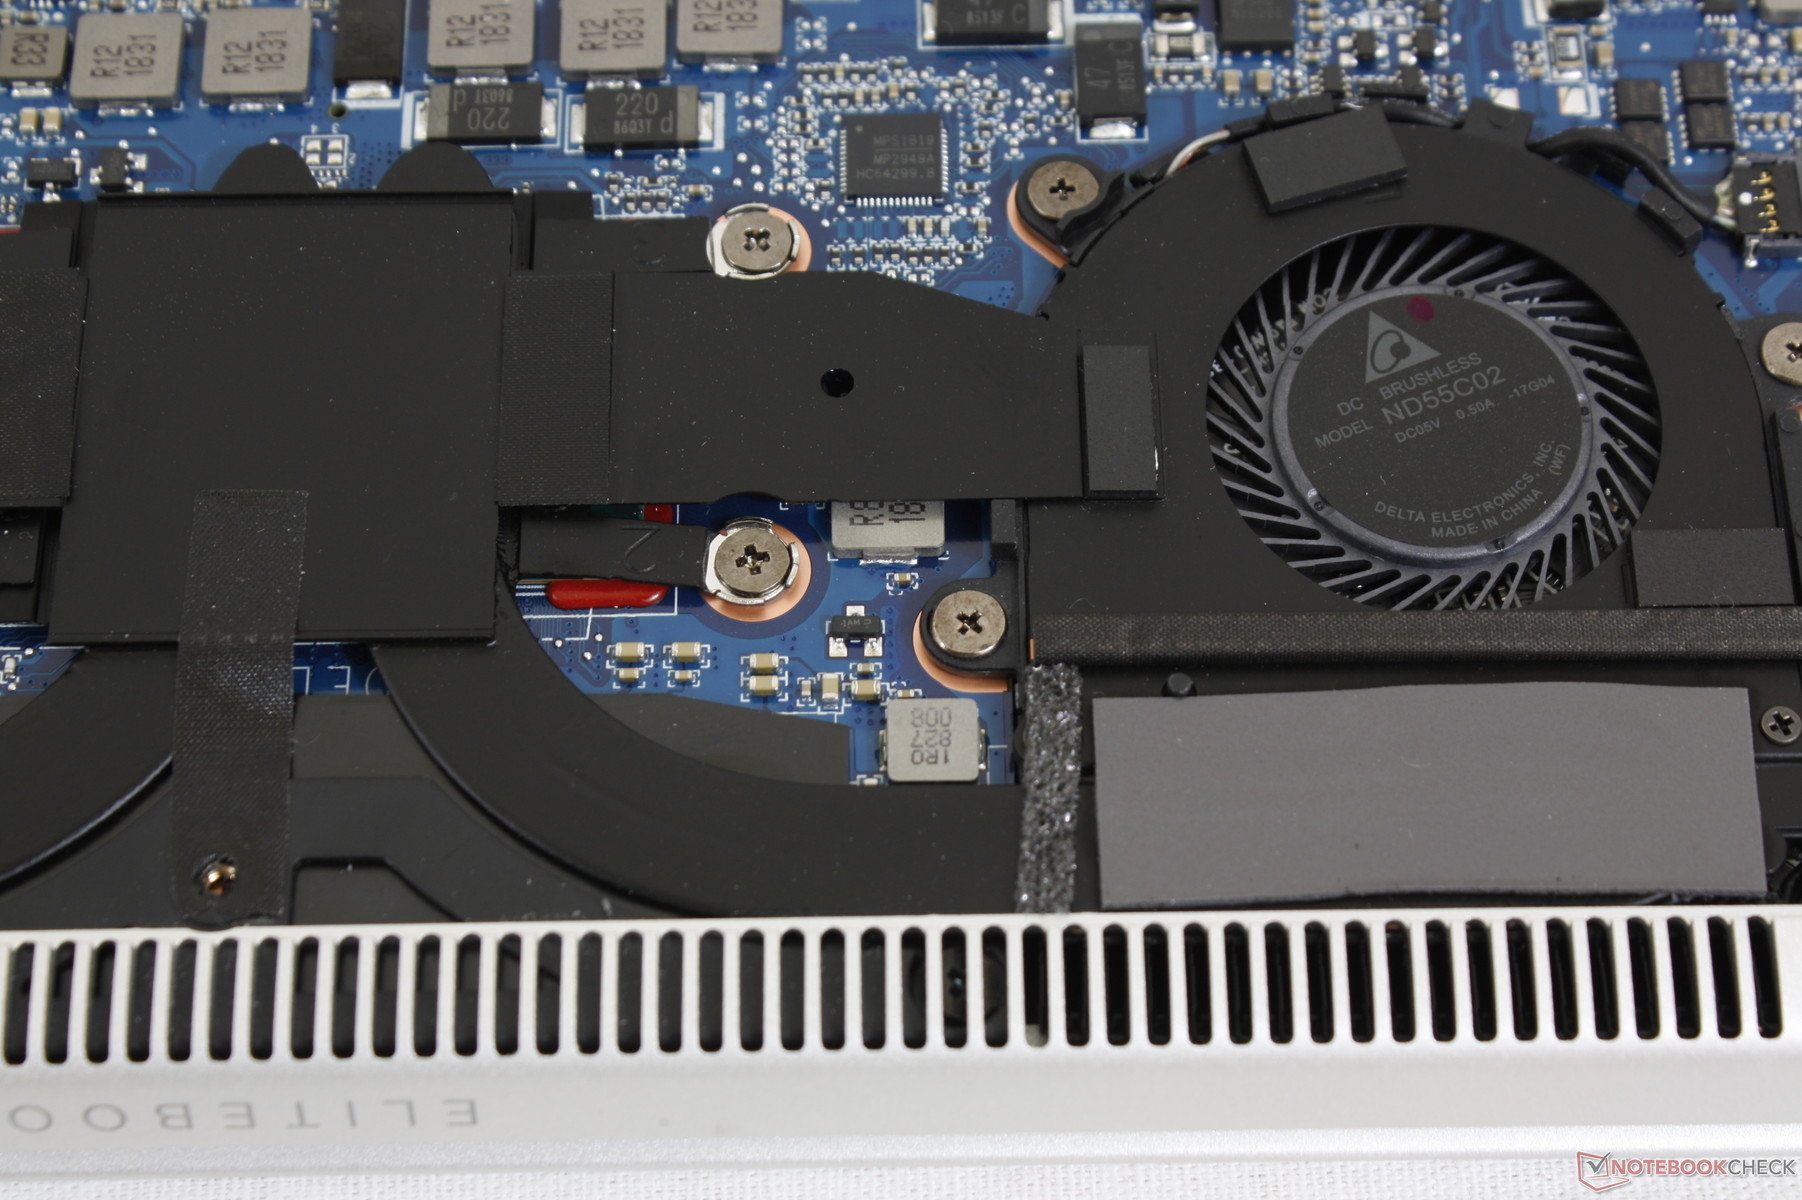
Serviceability is still difficult. With a more careful hand and sharp edge, however, the bottom panel can be popped off. The WLAN module form factor is M.2 1216 and so only the M.2 SSD and WAN modules are easily serviceable.
Warranty
Pre-configured EliteBook SKUs sold on HP.com have a 36-month base warranty. If user-configured, warranty will be only 12 months. Please see our Guarantees, Return policies and Warranties FAQ for country-specific information.
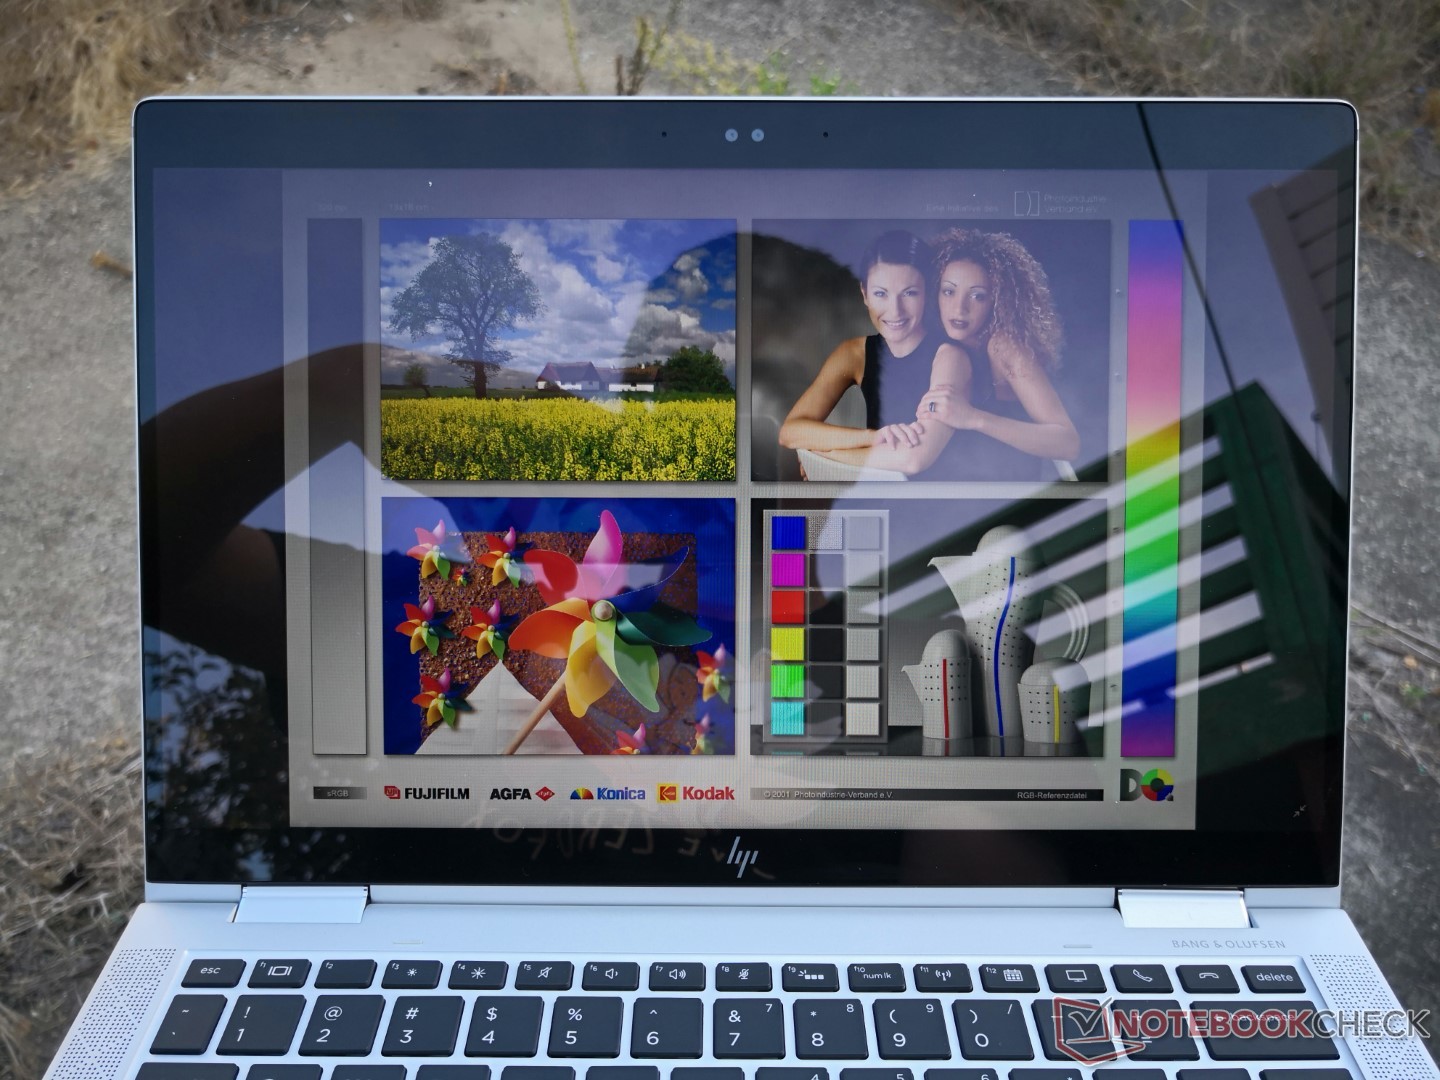
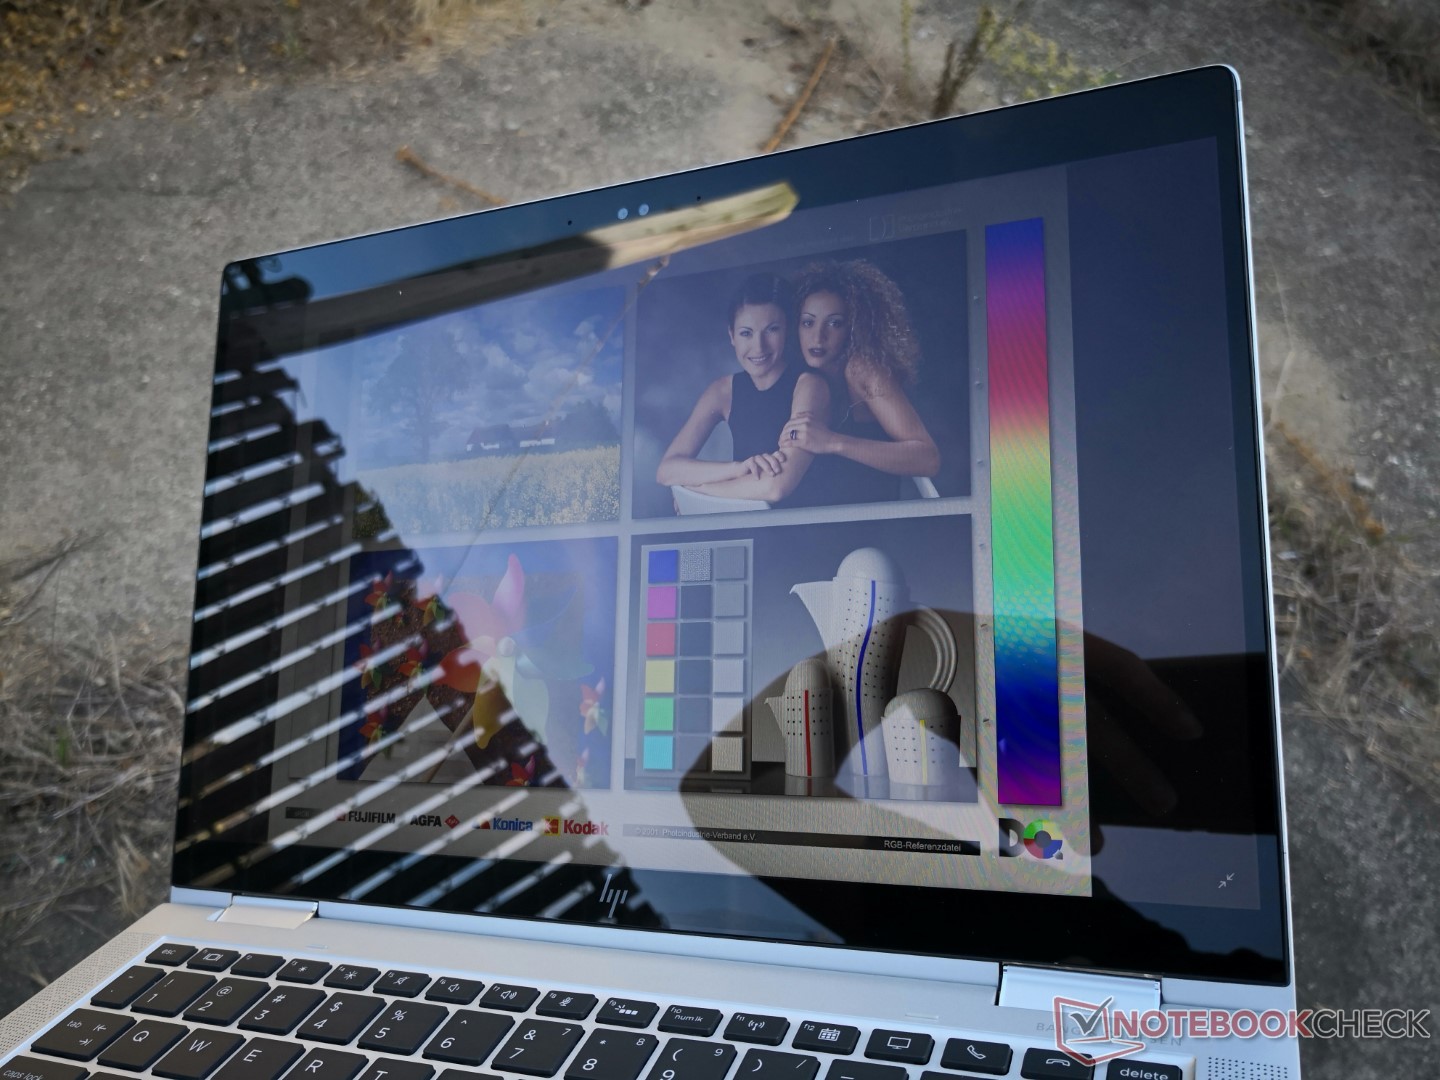
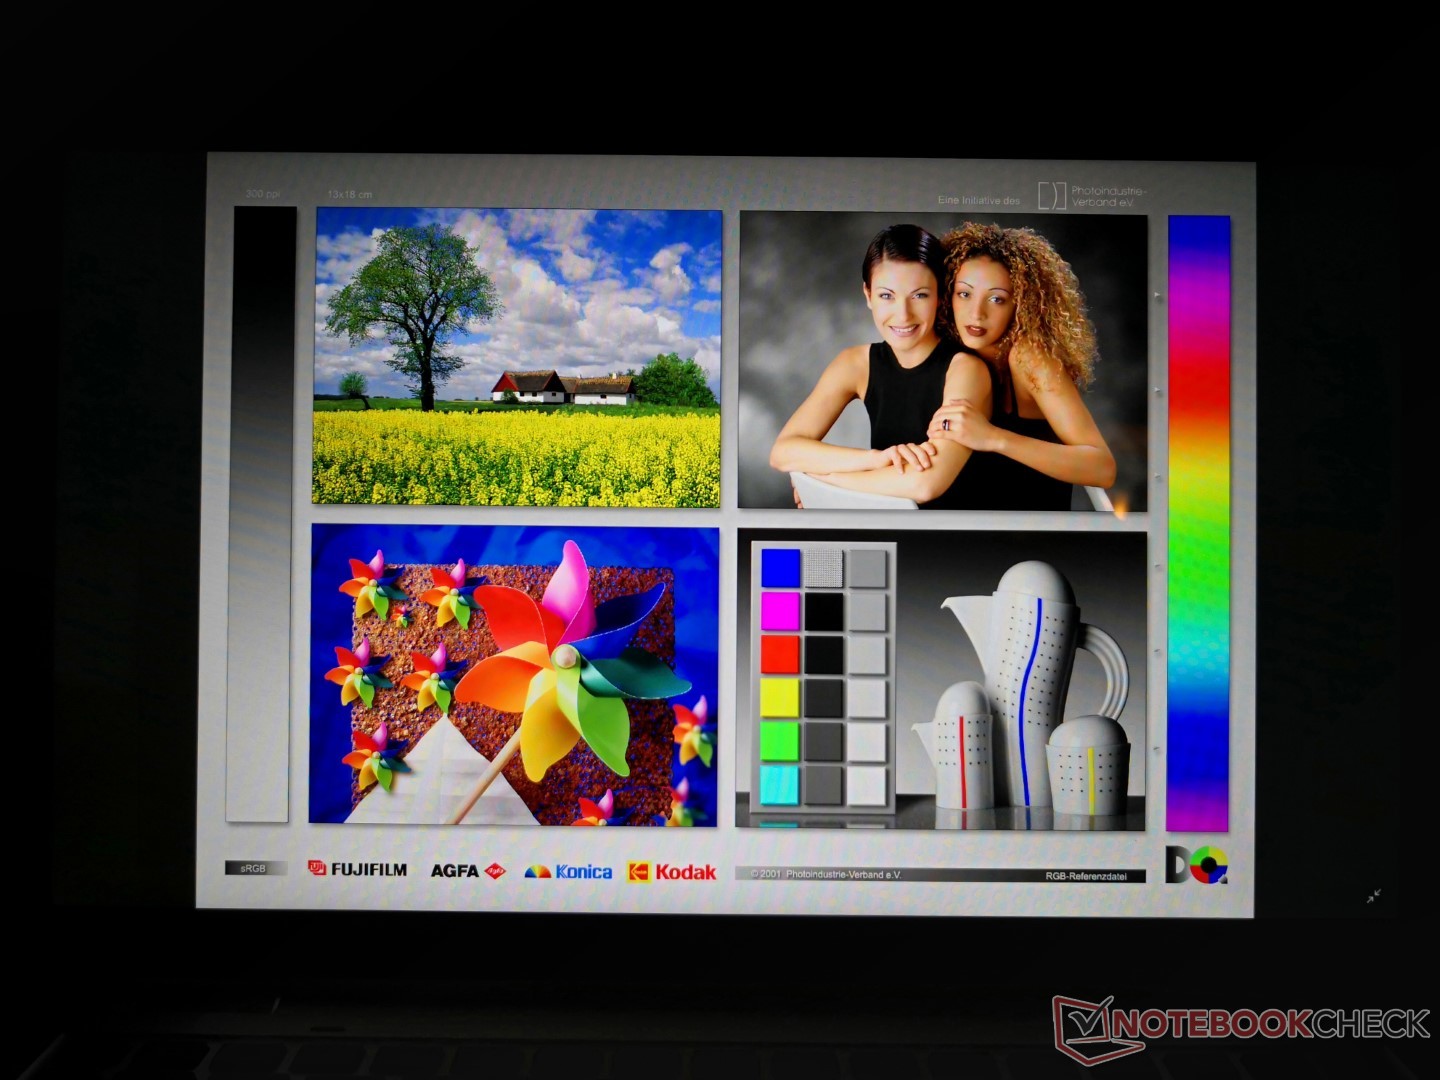
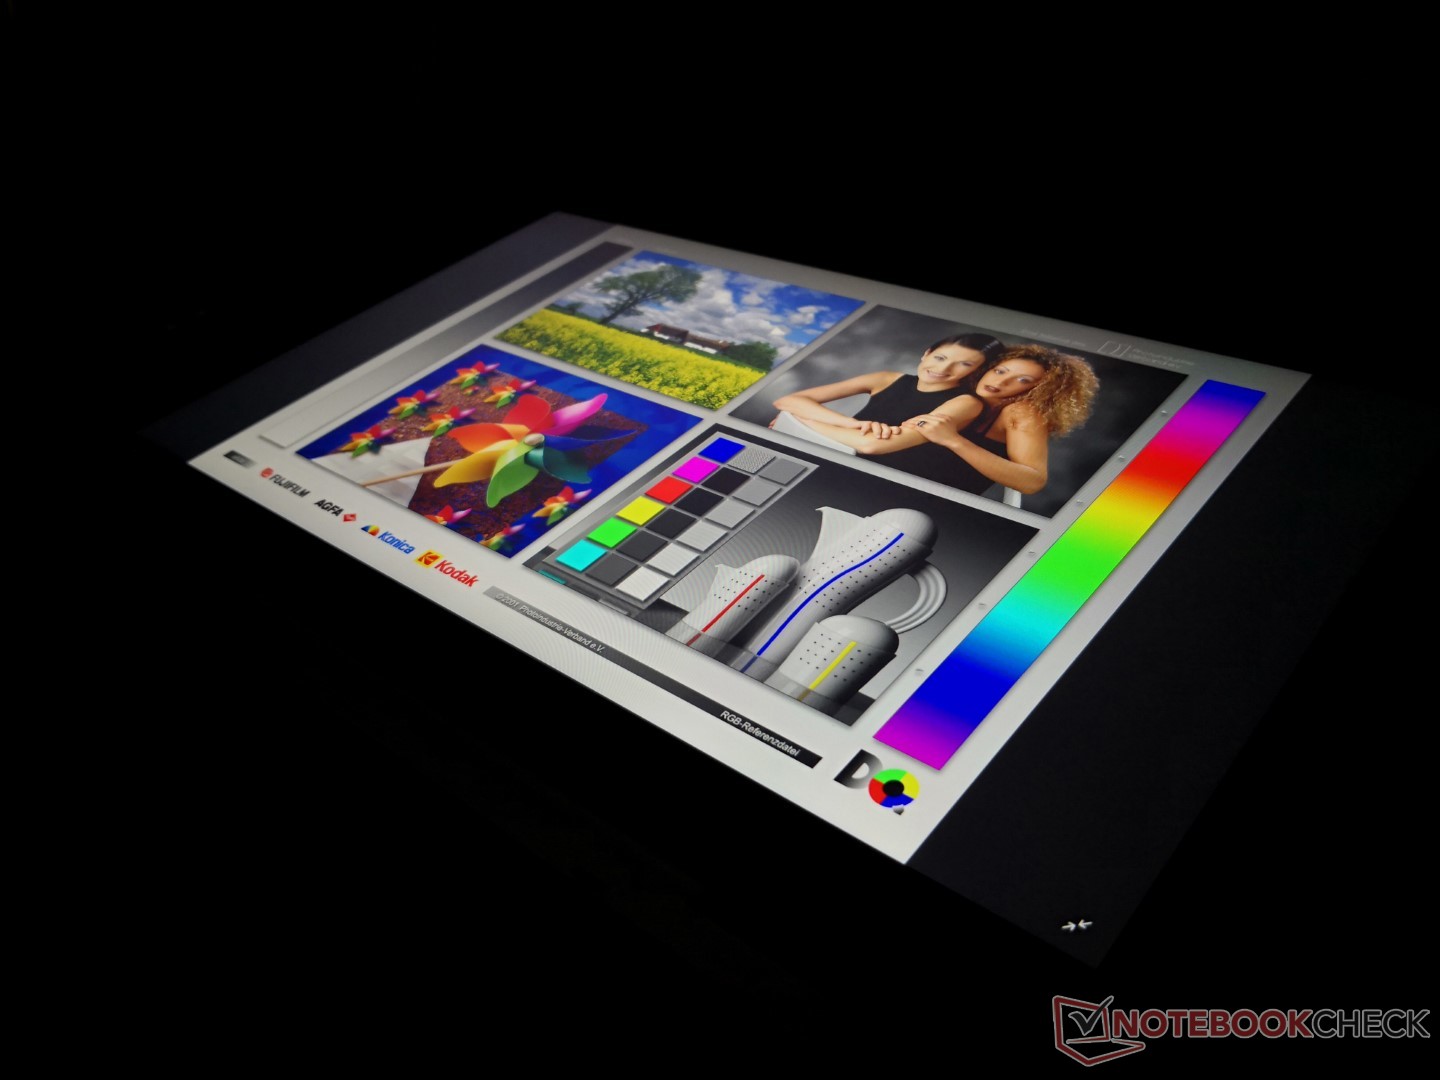
Display
Our Core i7 SKU utilizes the same Chi Mei CMN1380 IPS panel as our Core i5 SKU. A 4K UHD option is available that will likely carry different colors, contrast, response times, and brightness levels than what we've recorded for our FHD panel below. The 700-nit "Outdoor Mode" is reserved for certain FHD SKUs and it is not included on our particular test unit.
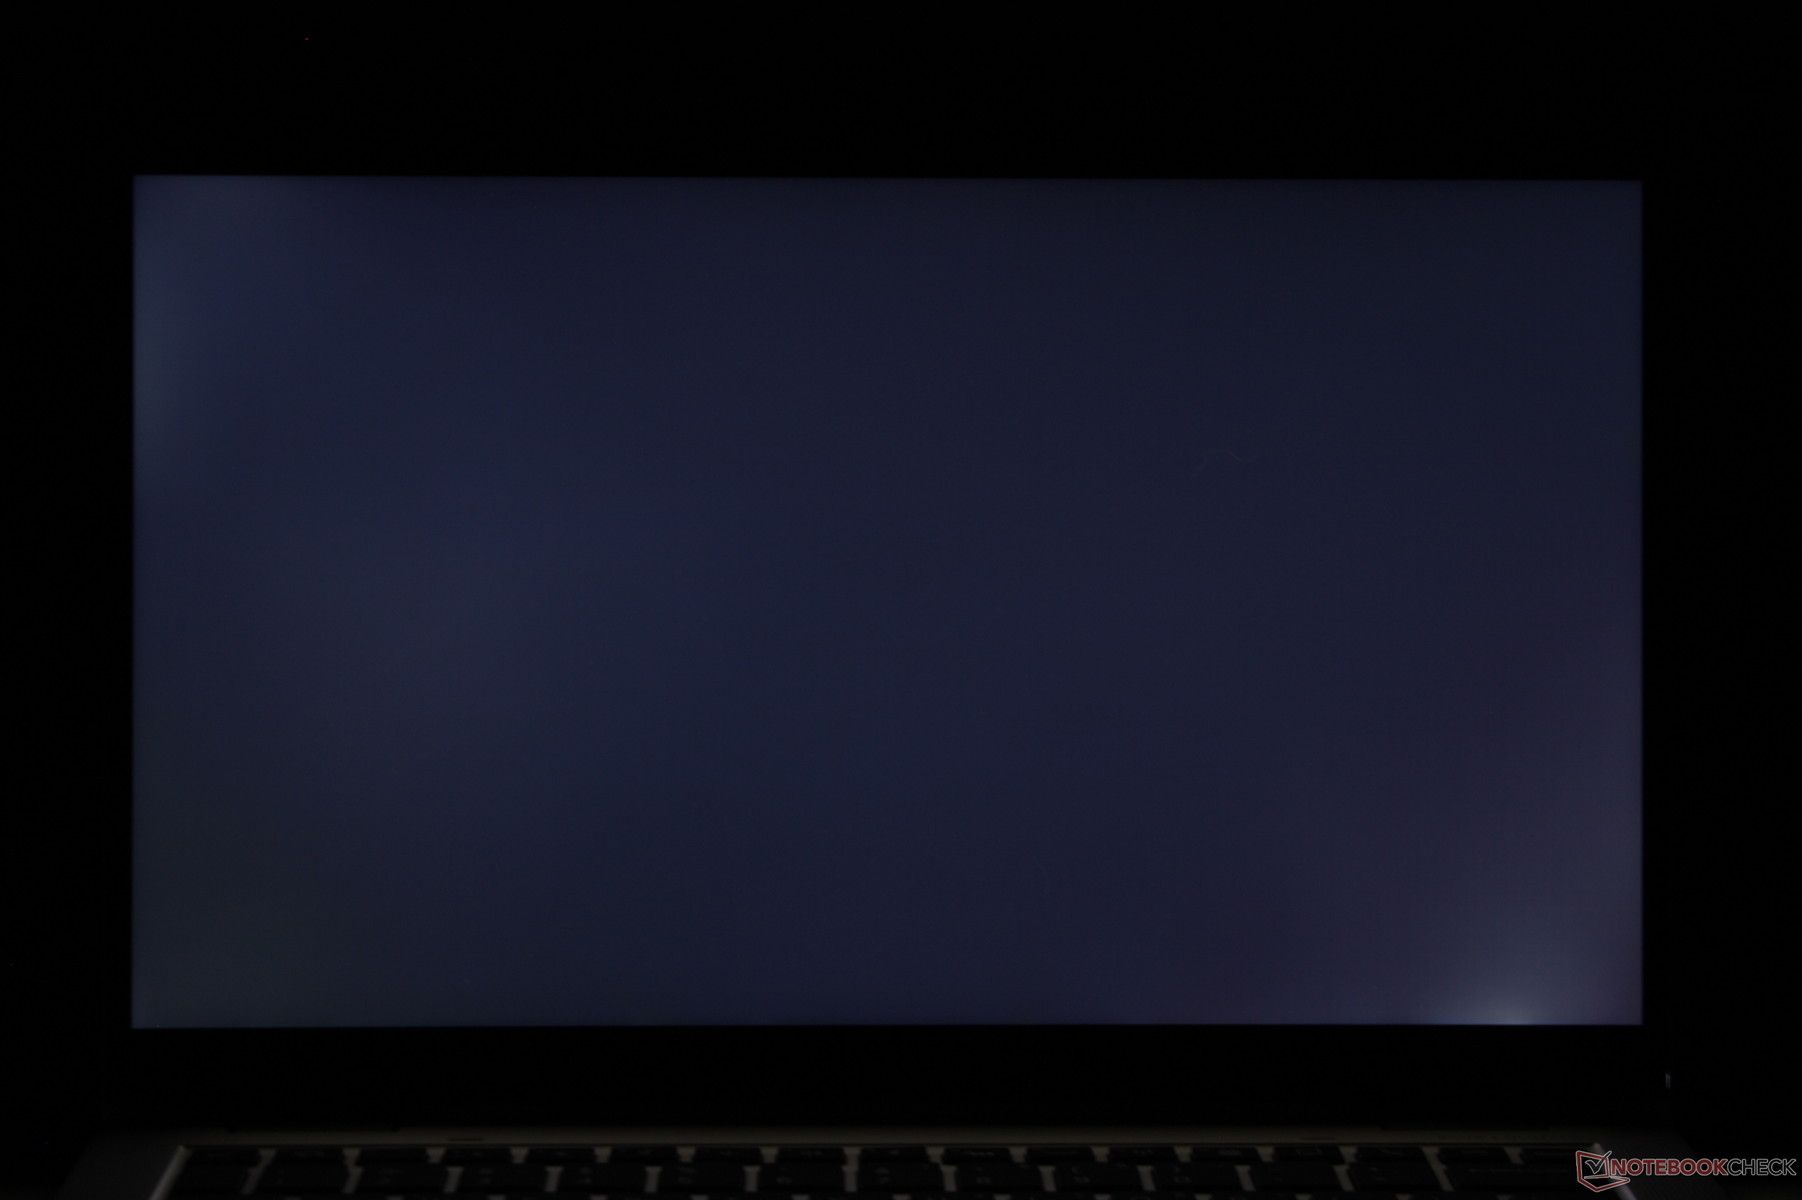
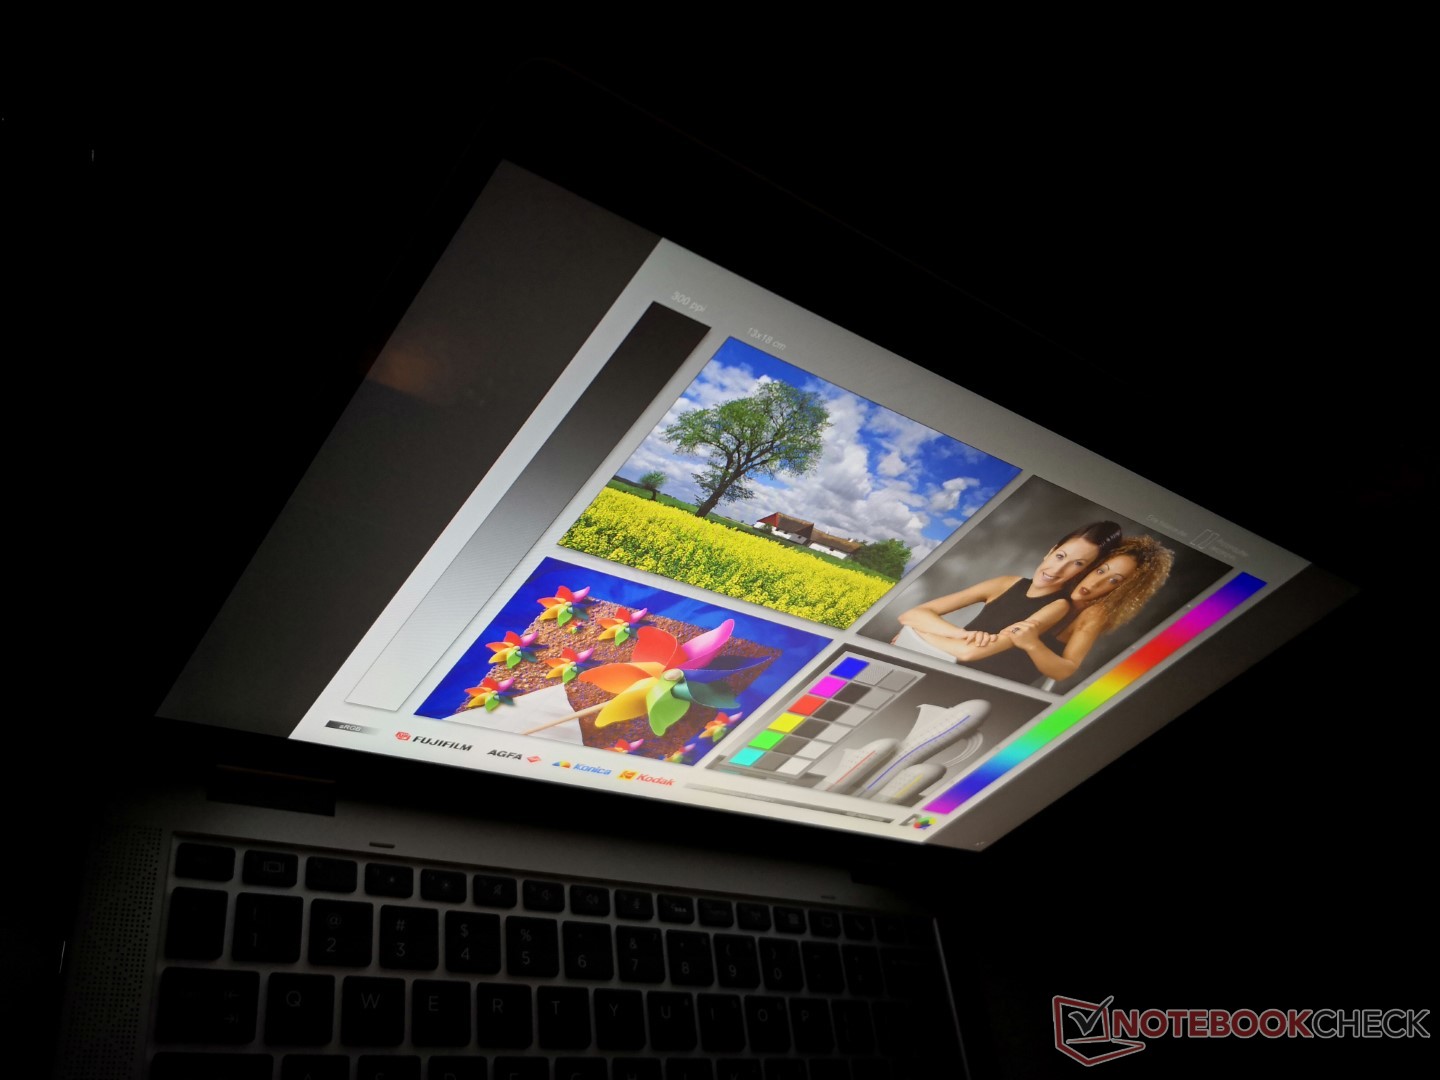
We were hoping for improved backlight bleeding as our original Core i5 unit had some moderate uneven bleeding. Unfortunately, this holds true yet again for our Core i7 unit as shown by the image below.
| |||||||||||||||||||||||||
Brightness Distribution: 91 %
Center on Battery: 467.2 cd/m²
Contrast: 1168:1 (Black: 0.4 cd/m²)
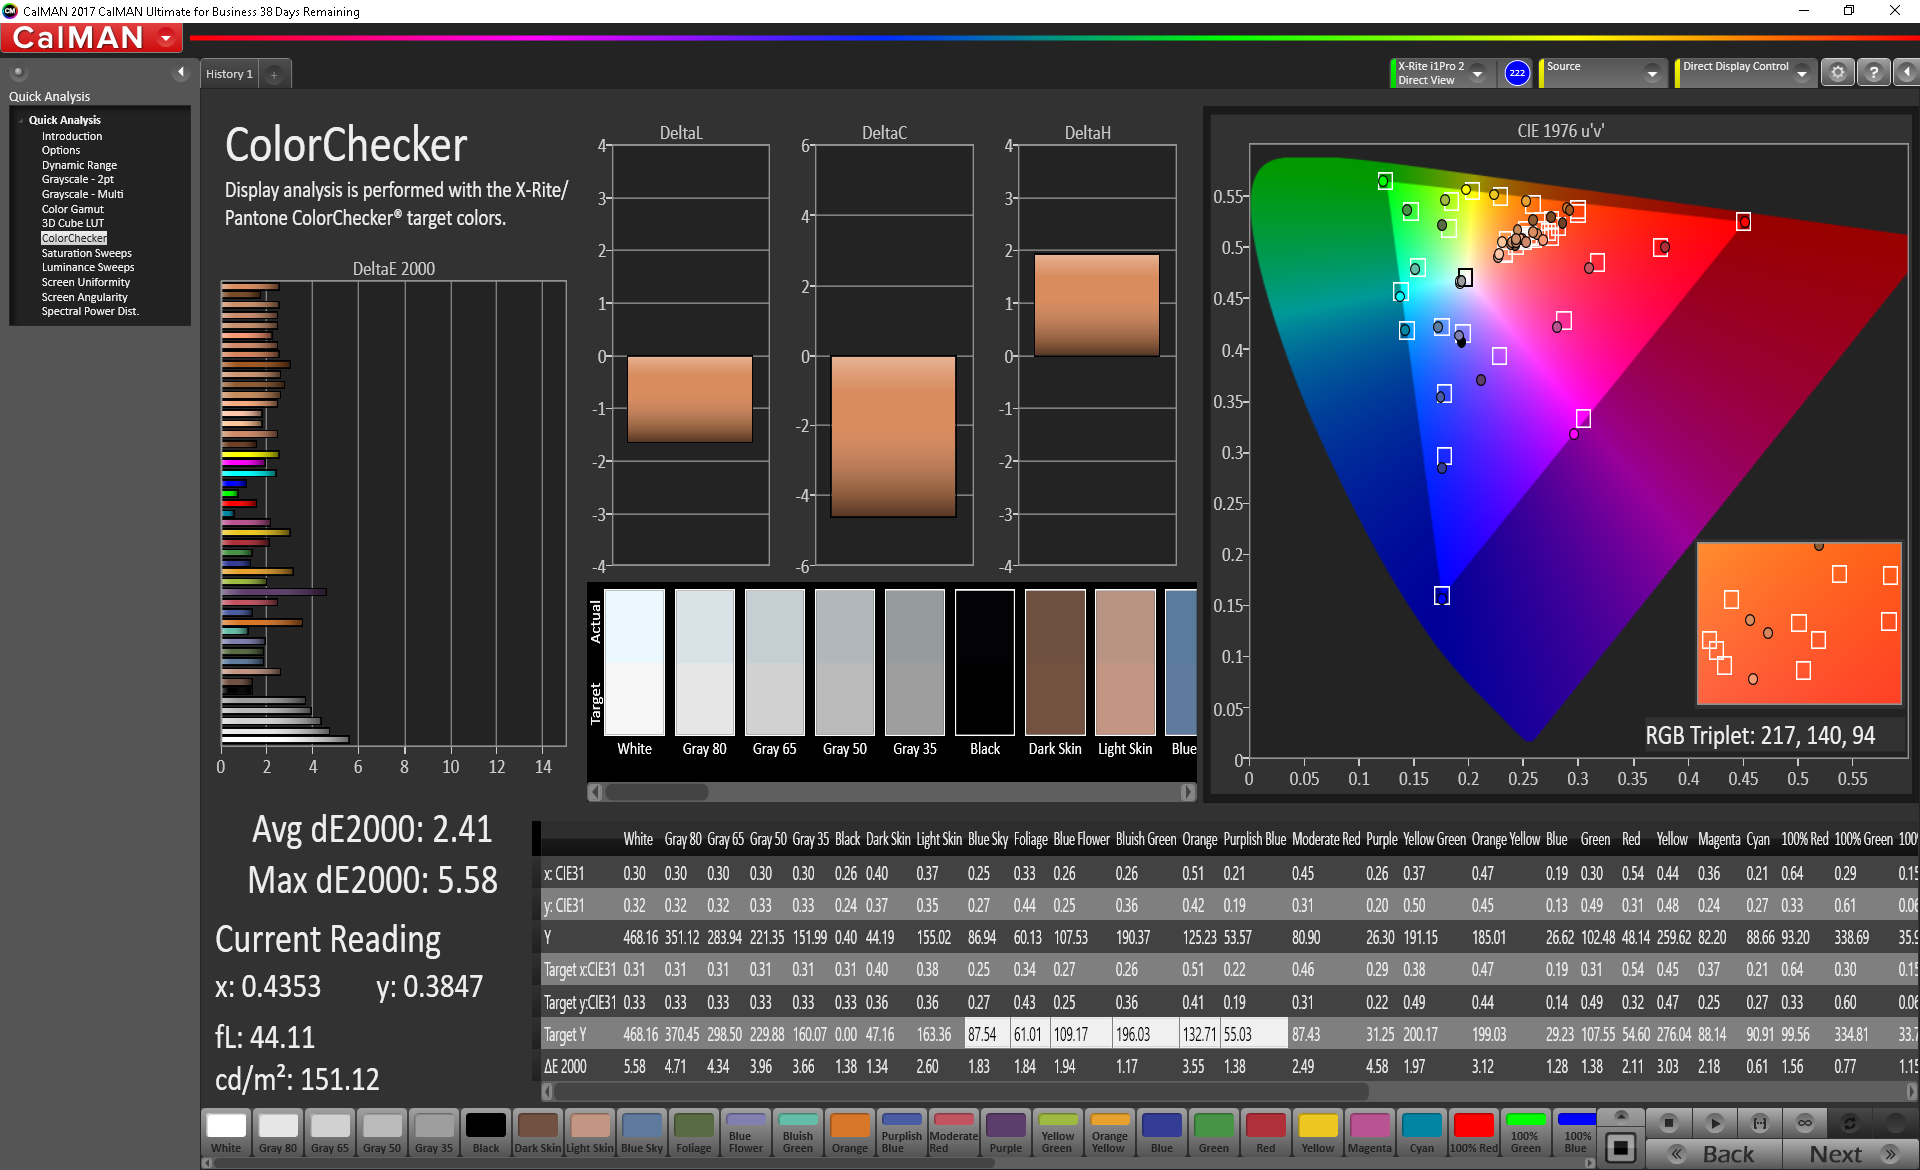
ΔE ColorChecker Calman: 2.41 | ∀{0.5-29.43 Ø4.73}
calibrated: 1.33
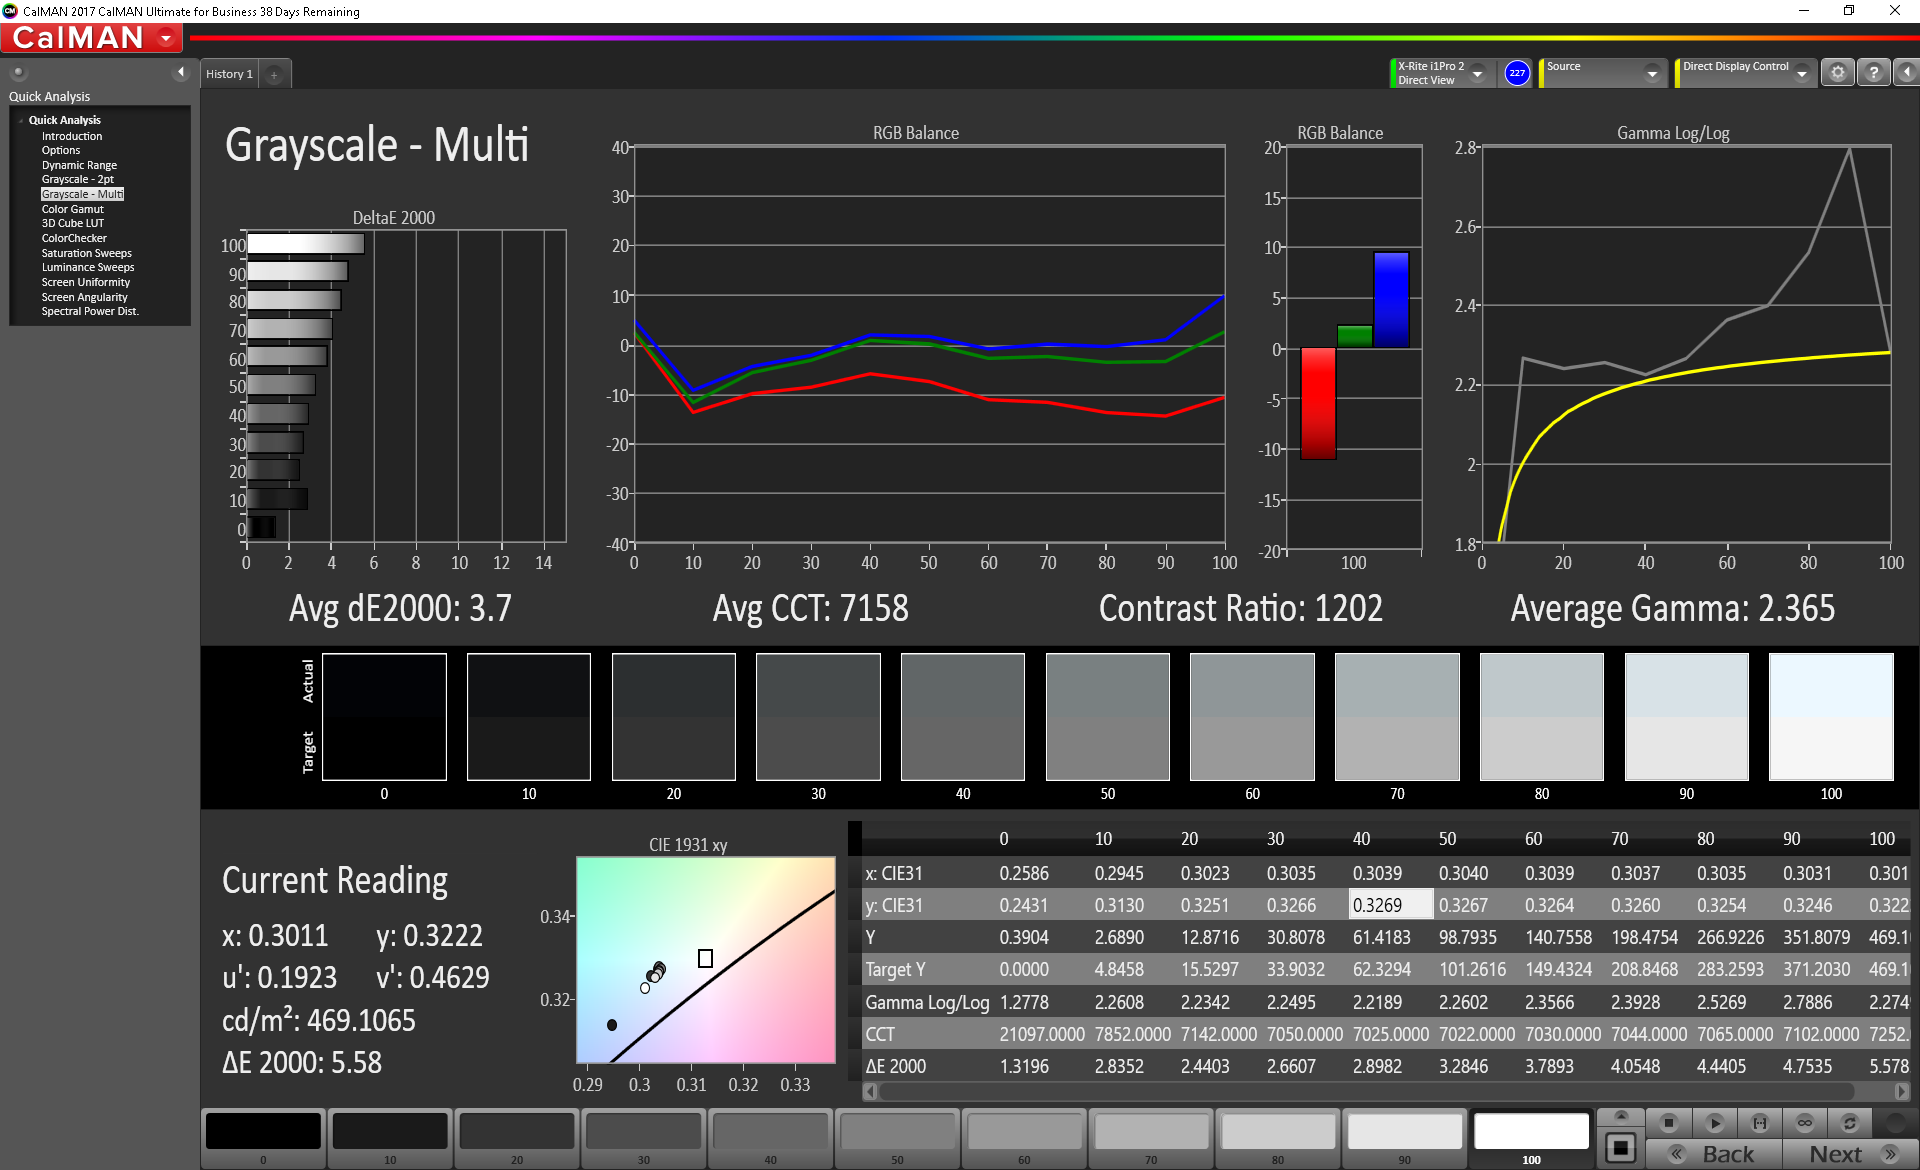
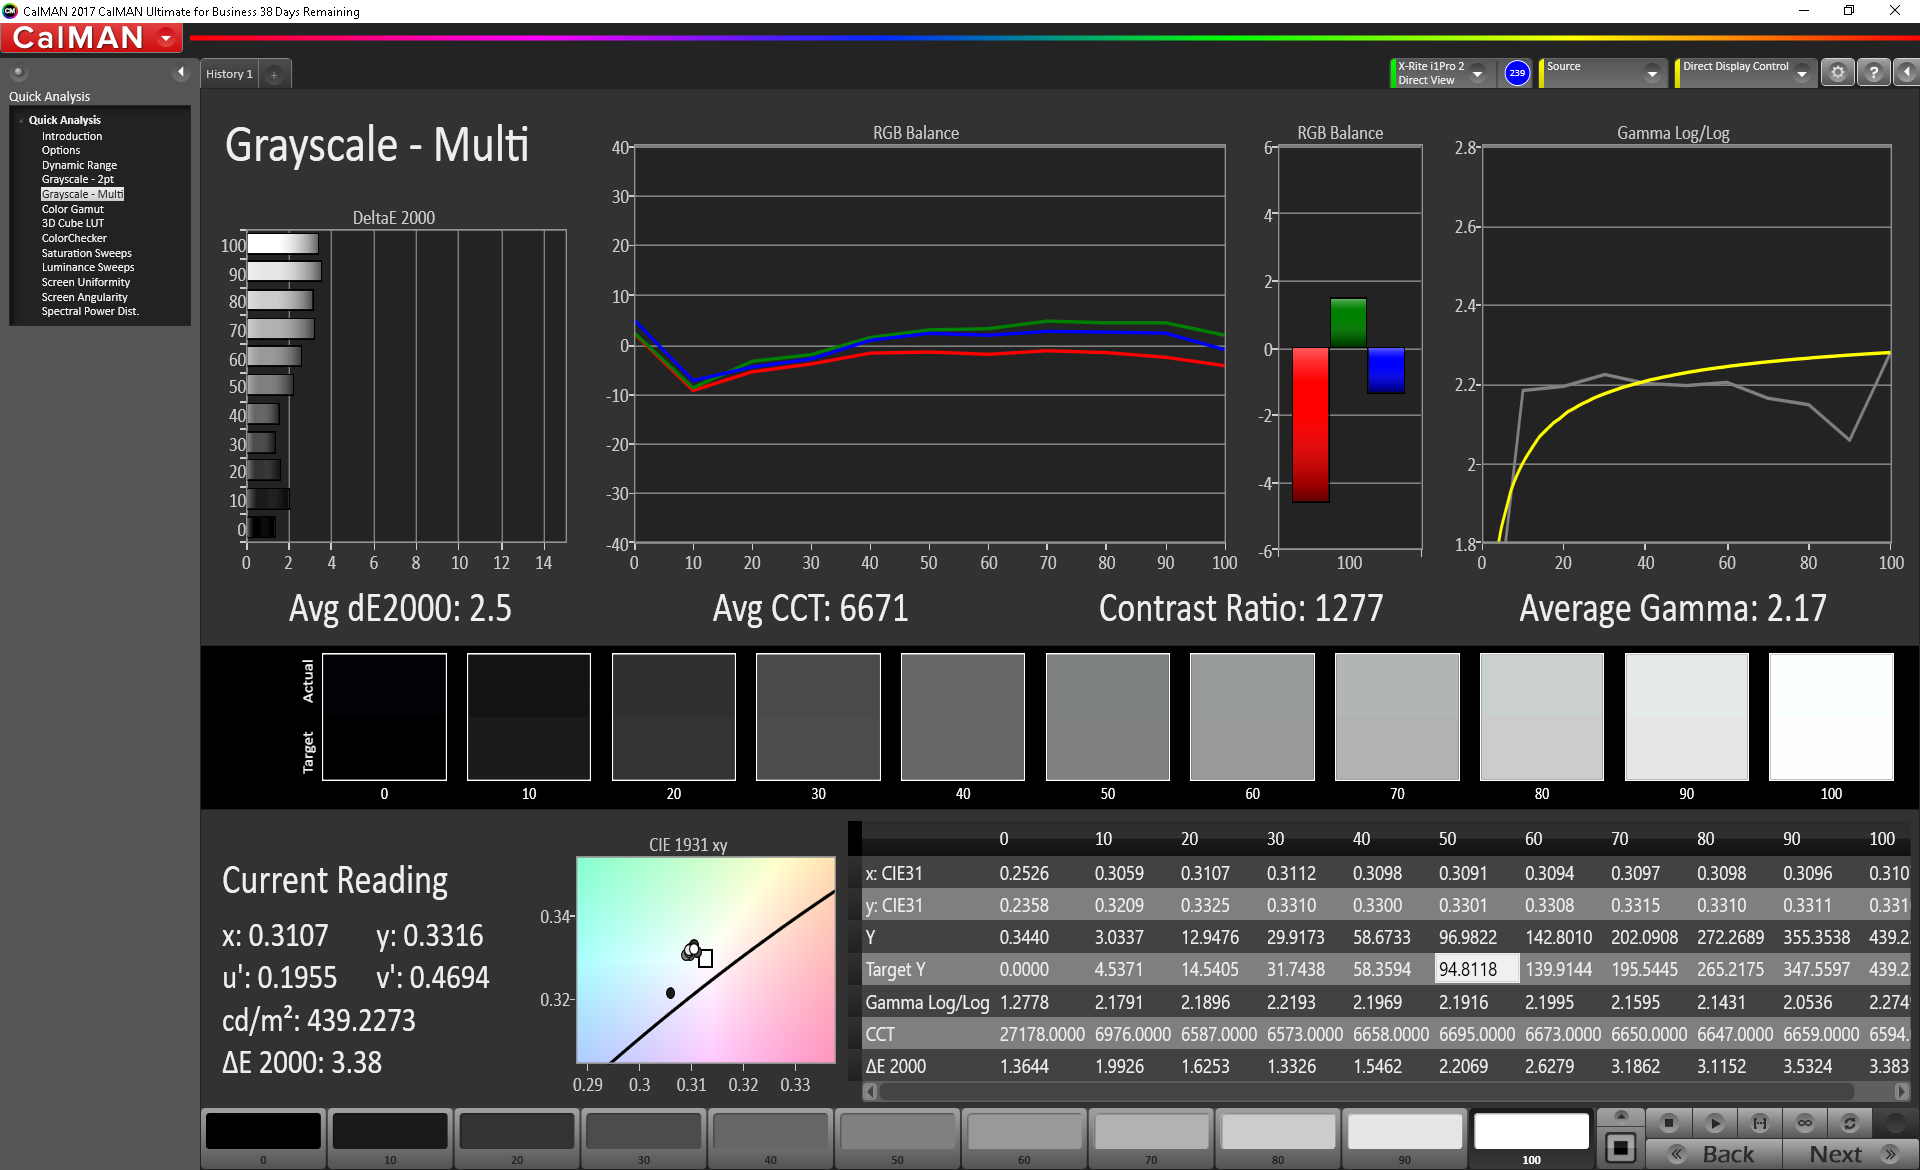
ΔE Greyscale Calman: 3.7 | ∀{0.09-98 Ø4.97}
99.6% sRGB (Argyll 1.6.3 3D)
62.5% AdobeRGB 1998 (Argyll 1.6.3 3D)
68.7% AdobeRGB 1998 (Argyll 3D)
98.6% sRGB (Argyll 3D)
66.7% Display P3 (Argyll 3D)
Gamma: 2.37
CCT: 7158 K
| HP EliteBook x360 1030 G3 45X96UT Chi Mei CMN1380, IPS, 13.3", 1920x1080 | Lenovo Yoga C930-13IKB B139HAN03_0, IPS, 13.9", 1920x1080 | Chuwi LapBook SE 13.3", 1920x1080 | Microsoft Surface Pro 6, Core i5, 128 GB LGPhilips LP123WQ112604, IPS, 12.3", 2736x1834 | Huawei Matebook X Pro i5 Tianma XM, IPS, 13.9", 3000x2000 | HP Elite x2 1013 G3-2TT14EA AU Optronics AUO101A, IPS, 13", 3000x2000 | |
|---|---|---|---|---|---|---|
| Display | -4% | -3% | -5% | -2% | -1% | |
| Display P3 Coverage (%) | 66.7 | 64.3 -4% | 65 -3% | 65.5 -2% | 65.9 -1% | 67.5 1% |
| sRGB Coverage (%) | 98.6 | 94.6 -4% | 94.8 -4% | 90.4 -8% | 95.2 -3% | 96.7 -2% |
| AdobeRGB 1998 Coverage (%) | 68.7 | 66.2 -4% | 66.5 -3% | 65.6 -5% | 67.6 -2% | 68.2 -1% |
| Response Times | -2% | -1% | 1% | 2% | -8% | |
| Response Time Grey 50% / Grey 80% * (ms) | 39.6 ? | 40.8 ? -3% | 39.2 ? 1% | 42 ? -6% | 40.4 ? -2% | 47 ? -19% |
| Response Time Black / White * (ms) | 27.2 ? | 27.6 ? -1% | 27.7 ? -2% | 25 ? 8% | 25.6 ? 6% | 26 ? 4% |
| PWM Frequency (Hz) | 26040 ? | 200 ? | 20800 ? | |||
| Screen | -46% | -69% | -14% | -13% | -18% | |
| Brightness middle (cd/m²) | 467.2 | 316 -32% | 227 -51% | 463 -1% | 442.7 -5% | 452 -3% |
| Brightness (cd/m²) | 445 | 291 -35% | 210 -53% | 450 1% | 428 -4% | 412 -7% |
| Brightness Distribution (%) | 91 | 83 -9% | 89 -2% | 83 -9% | 84 -8% | 85 -7% |
| Black Level * (cd/m²) | 0.4 | 0.36 10% | 0.44 -10% | 0.32 20% | 0.31 23% | 0.48 -20% |
| Contrast (:1) | 1168 | 878 -25% | 516 -56% | 1447 24% | 1428 22% | 942 -19% |
| Colorchecker dE 2000 * | 2.41 | 5.9 -145% | 6.6 -174% | 3.76 -56% | 2.24 7% | 4.05 -68% |
| Colorchecker dE 2000 max. * | 5.58 | 12.9 -131% | 12.2 -119% | 7.35 -32% | 7.19 -29% | 6.64 -19% |
| Colorchecker dE 2000 calibrated * | 1.33 | 1.3 2% | 1.9 -43% | 2.68 -102% | 1.11 17% | 1.56 -17% |
| Greyscale dE 2000 * | 3.7 | 8.6 -132% | 7.9 -114% | 3.18 14% | 9.7 -162% | 4.87 -32% |
| Gamma | 2.37 93% | 2.1 105% | 2.16 102% | 2.53 87% | 1.42 155% | 2.71 81% |
| CCT | 7158 91% | 6854 95% | 8879 73% | 6994 93% | 6227 104% | 7160 91% |
| Color Space (Percent of AdobeRGB 1998) (%) | 62.5 | 60.7 -3% | 59 -6% | 61.6 -1% | 62 -1% | |
| Color Space (Percent of sRGB) (%) | 99.6 | 94.5 -5% | 90 -10% | 95 -5% | 97 -3% | |
| Total Average (Program / Settings) | -17% /
-33% | -24% /
-45% | -6% /
-11% | -4% /
-9% | -9% /
-13% |
* ... smaller is better
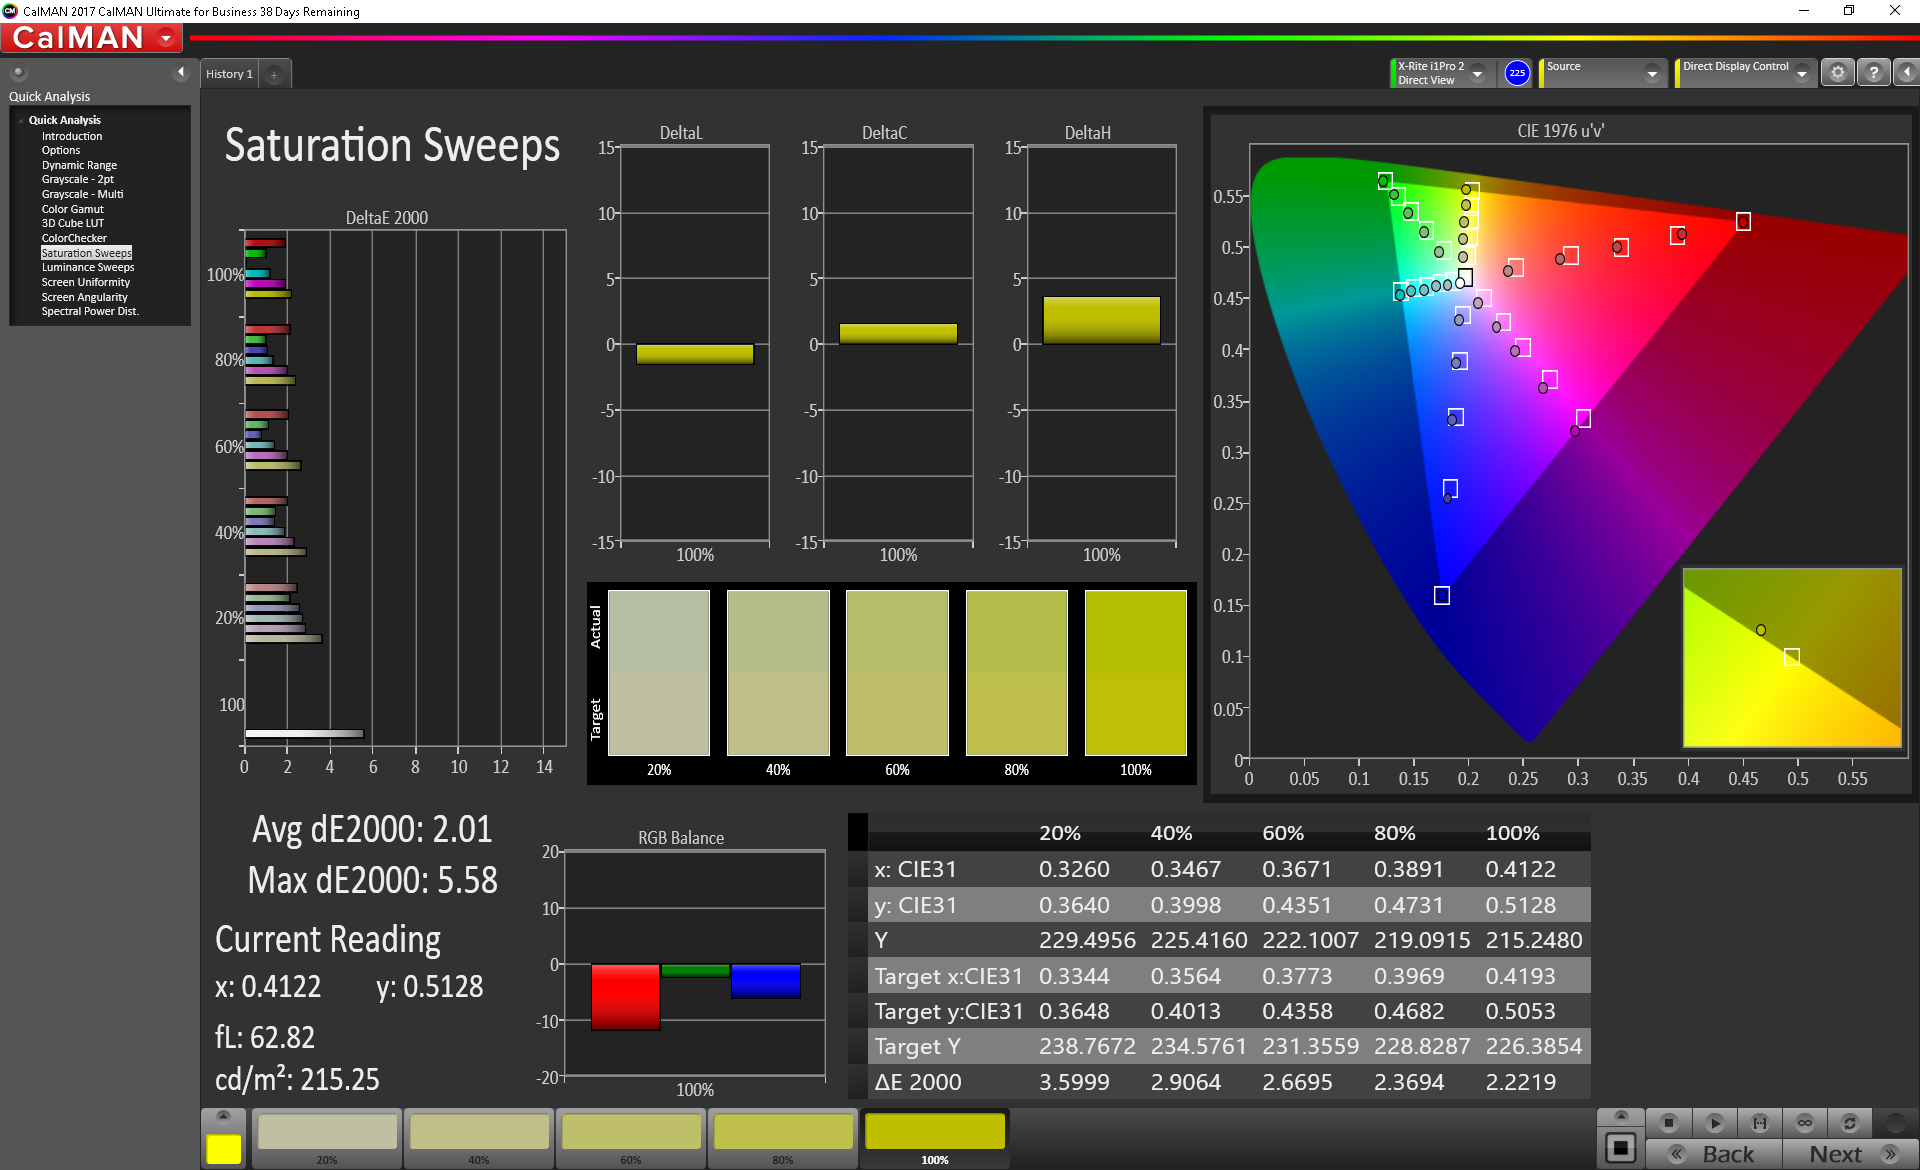
Color space covers all of sRGB and approximately 63 percent of AdobeRGB to be slightly better than the 12.3-inch display of the 2018 Surface Tablet.
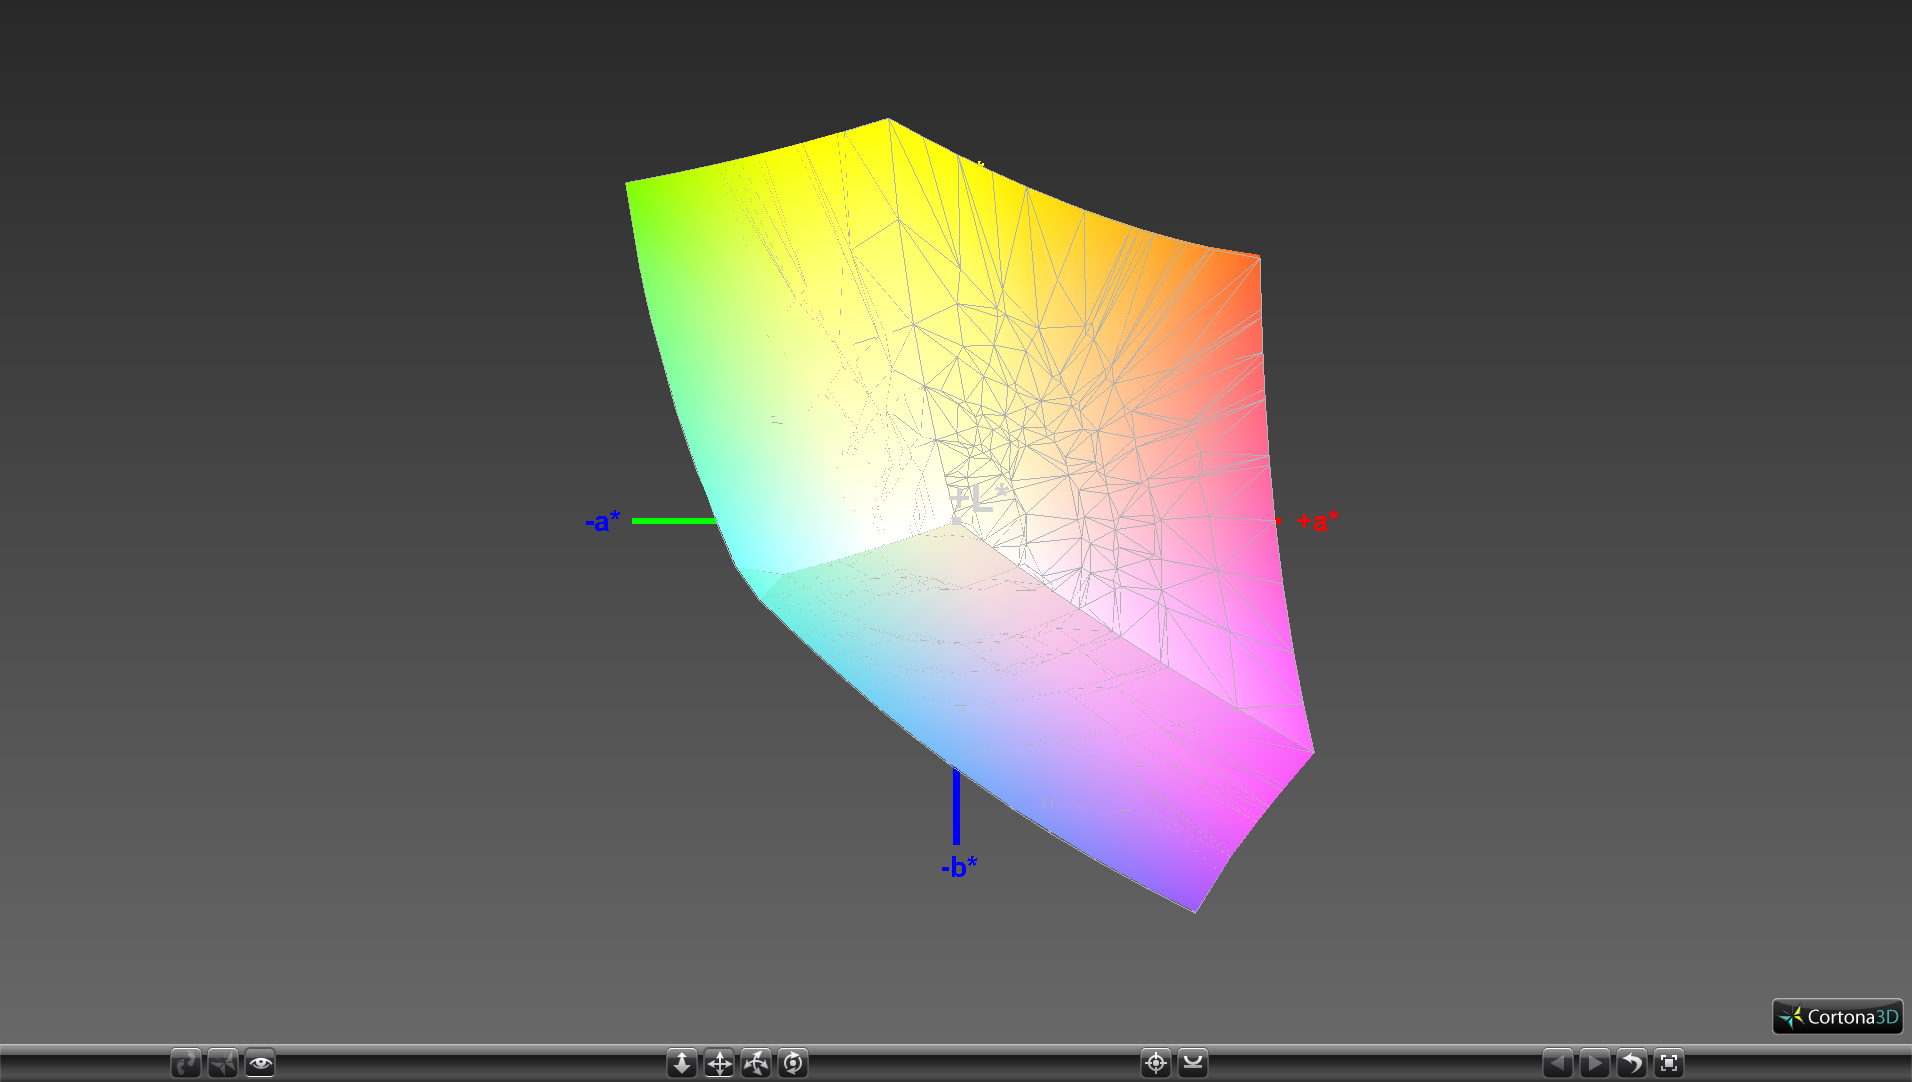
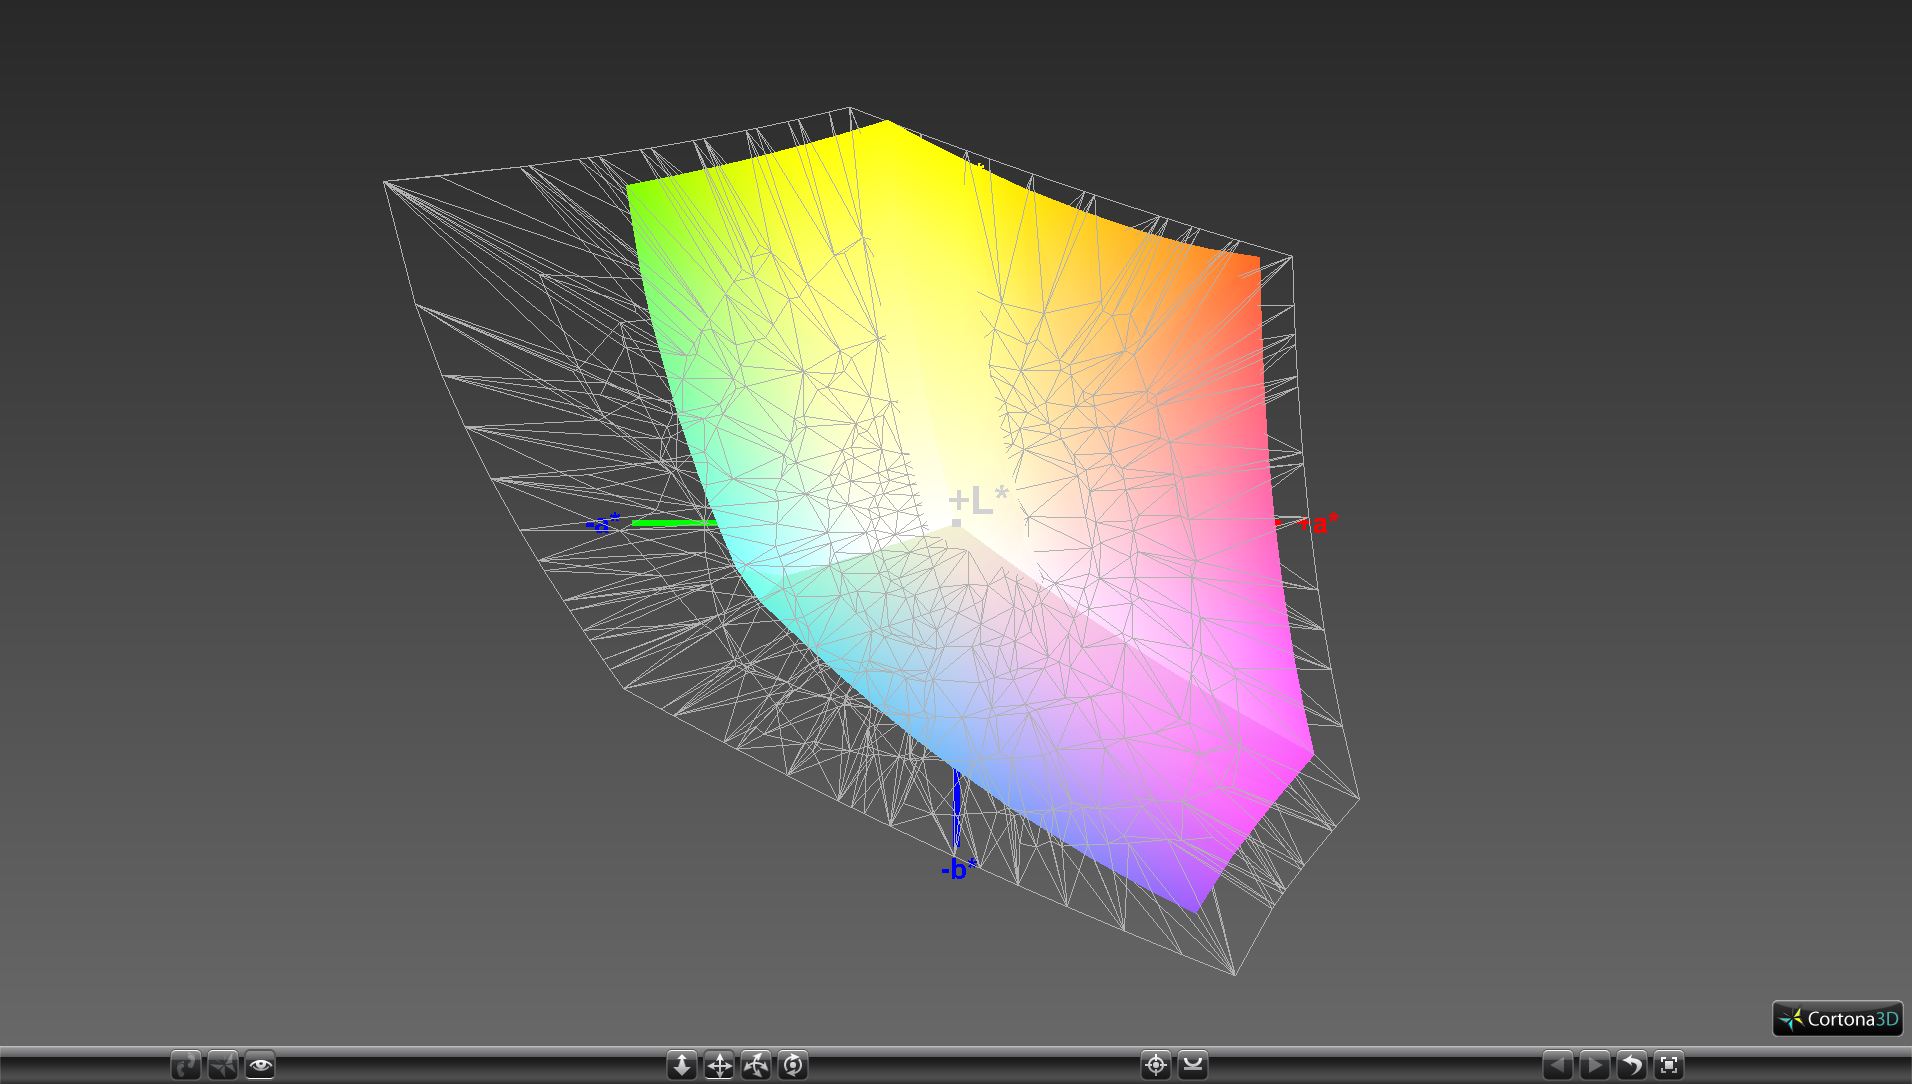
Color accuracy is very good out of the box across all tested saturation levels. The default color temperature is a bit too cool, but this can be easily corrected with a calibration.

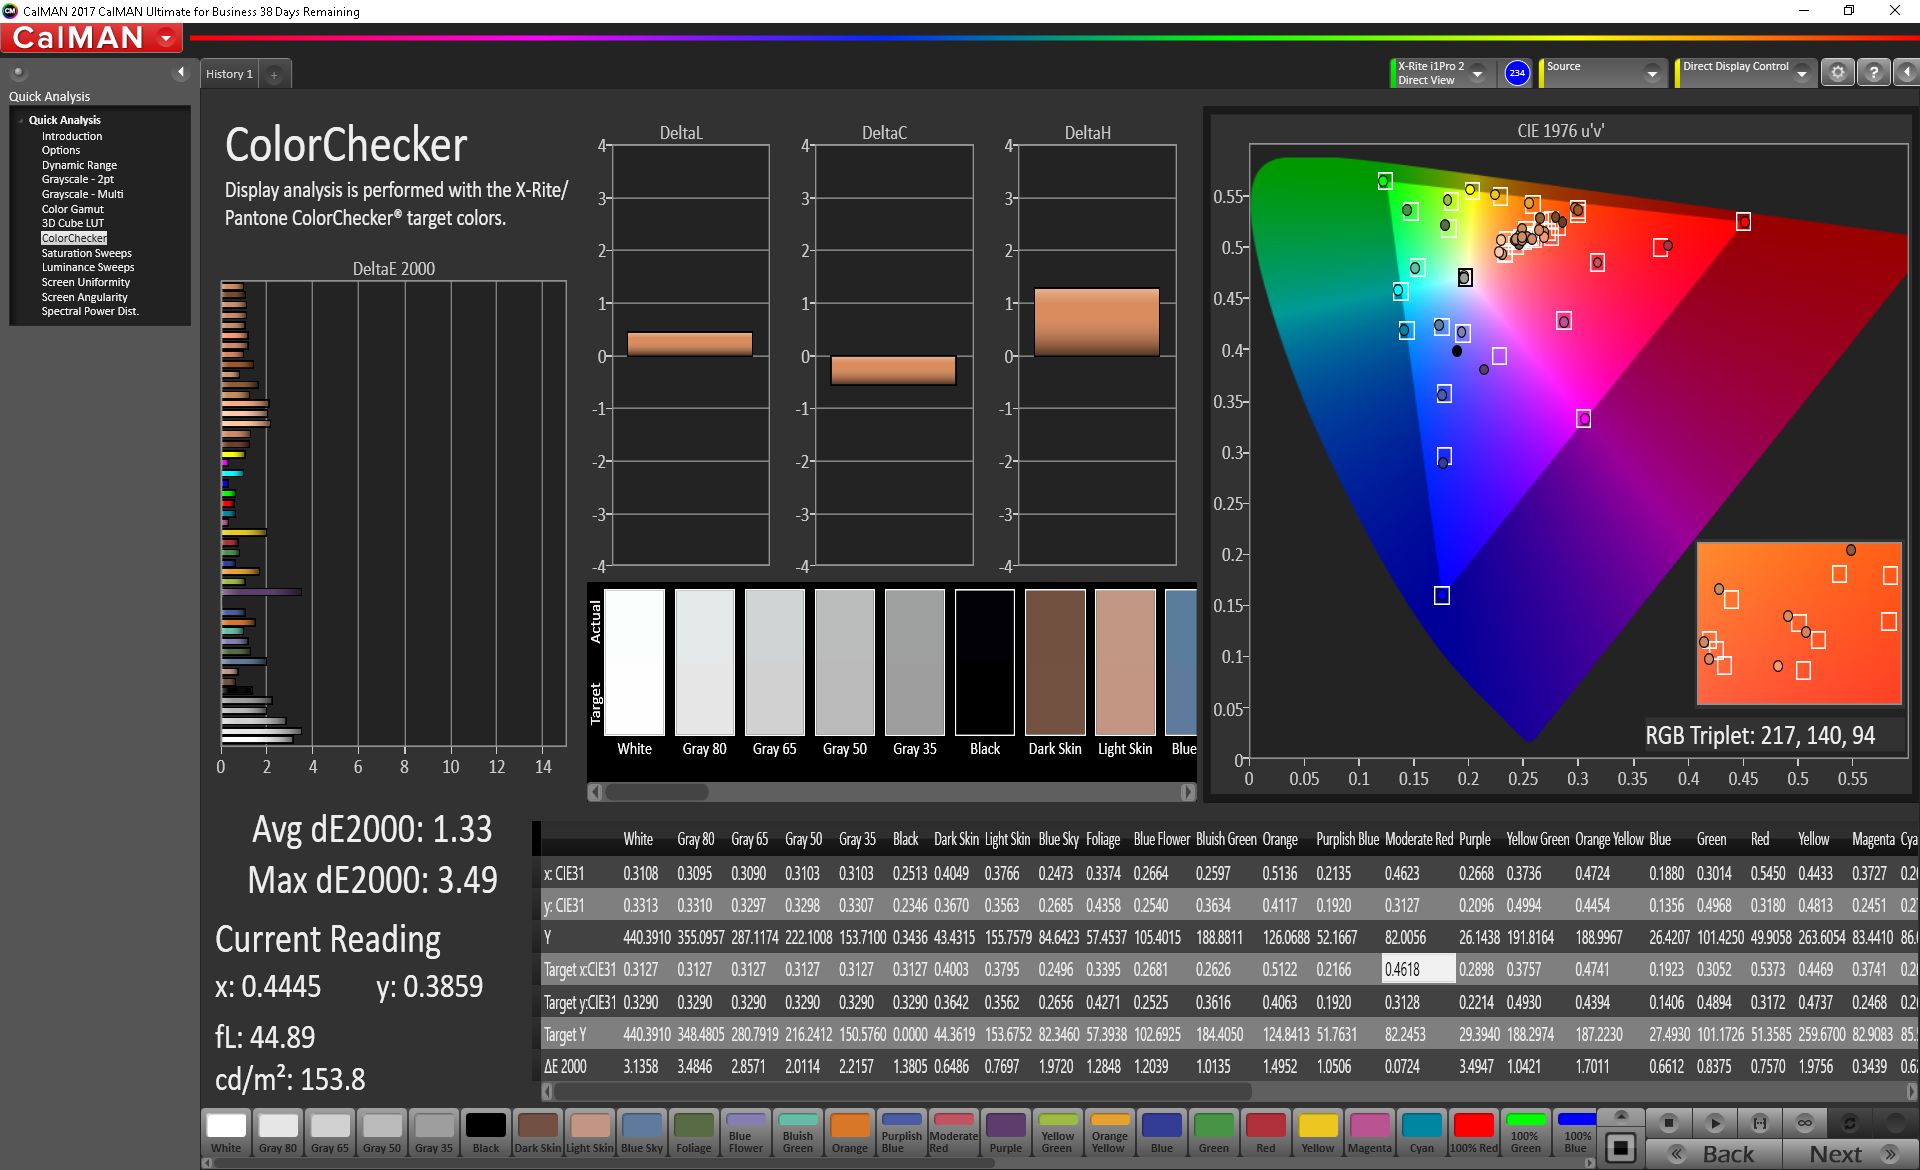
Display Response Times
| ↔ Response Time Black to White | ||
|---|---|---|
| 27.2 ms ... rise ↗ and fall ↘ combined | ↗ 14.8 ms rise | 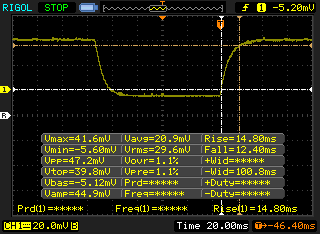 |
| ↘ 12.4 ms fall | ||
| The screen shows relatively slow response rates in our tests and may be too slow for gamers. In comparison, all tested devices range from 0.1 (minimum) to 240 (maximum) ms. » 69 % of all devices are better. This means that the measured response time is worse than the average of all tested devices (19.9 ms). | ||
| ↔ Response Time 50% Grey to 80% Grey | ||
| 39.6 ms ... rise ↗ and fall ↘ combined | ↗ 20.8 ms rise | 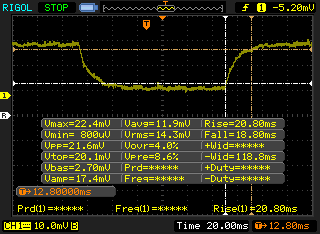 |
| ↘ 18.8 ms fall | ||
| The screen shows slow response rates in our tests and will be unsatisfactory for gamers. In comparison, all tested devices range from 0.165 (minimum) to 636 (maximum) ms. » 60 % of all devices are better. This means that the measured response time is worse than the average of all tested devices (31.1 ms). | ||
Screen Flickering / PWM (Pulse-Width Modulation)
| Screen flickering / PWM detected | 26040 Hz | ≤ 62 % brightness setting |  |
The display backlight flickers at 26040 Hz (worst case, e.g., utilizing PWM) Flickering detected at a brightness setting of 62 % and below. There should be no flickering or PWM above this brightness setting. The frequency of 26040 Hz is quite high, so most users sensitive to PWM should not notice any flickering. In comparison: 52 % of all tested devices do not use PWM to dim the display. If PWM was detected, an average of 7794 (minimum: 5 - maximum: 343500) Hz was measured. | |||

Performance
Processor
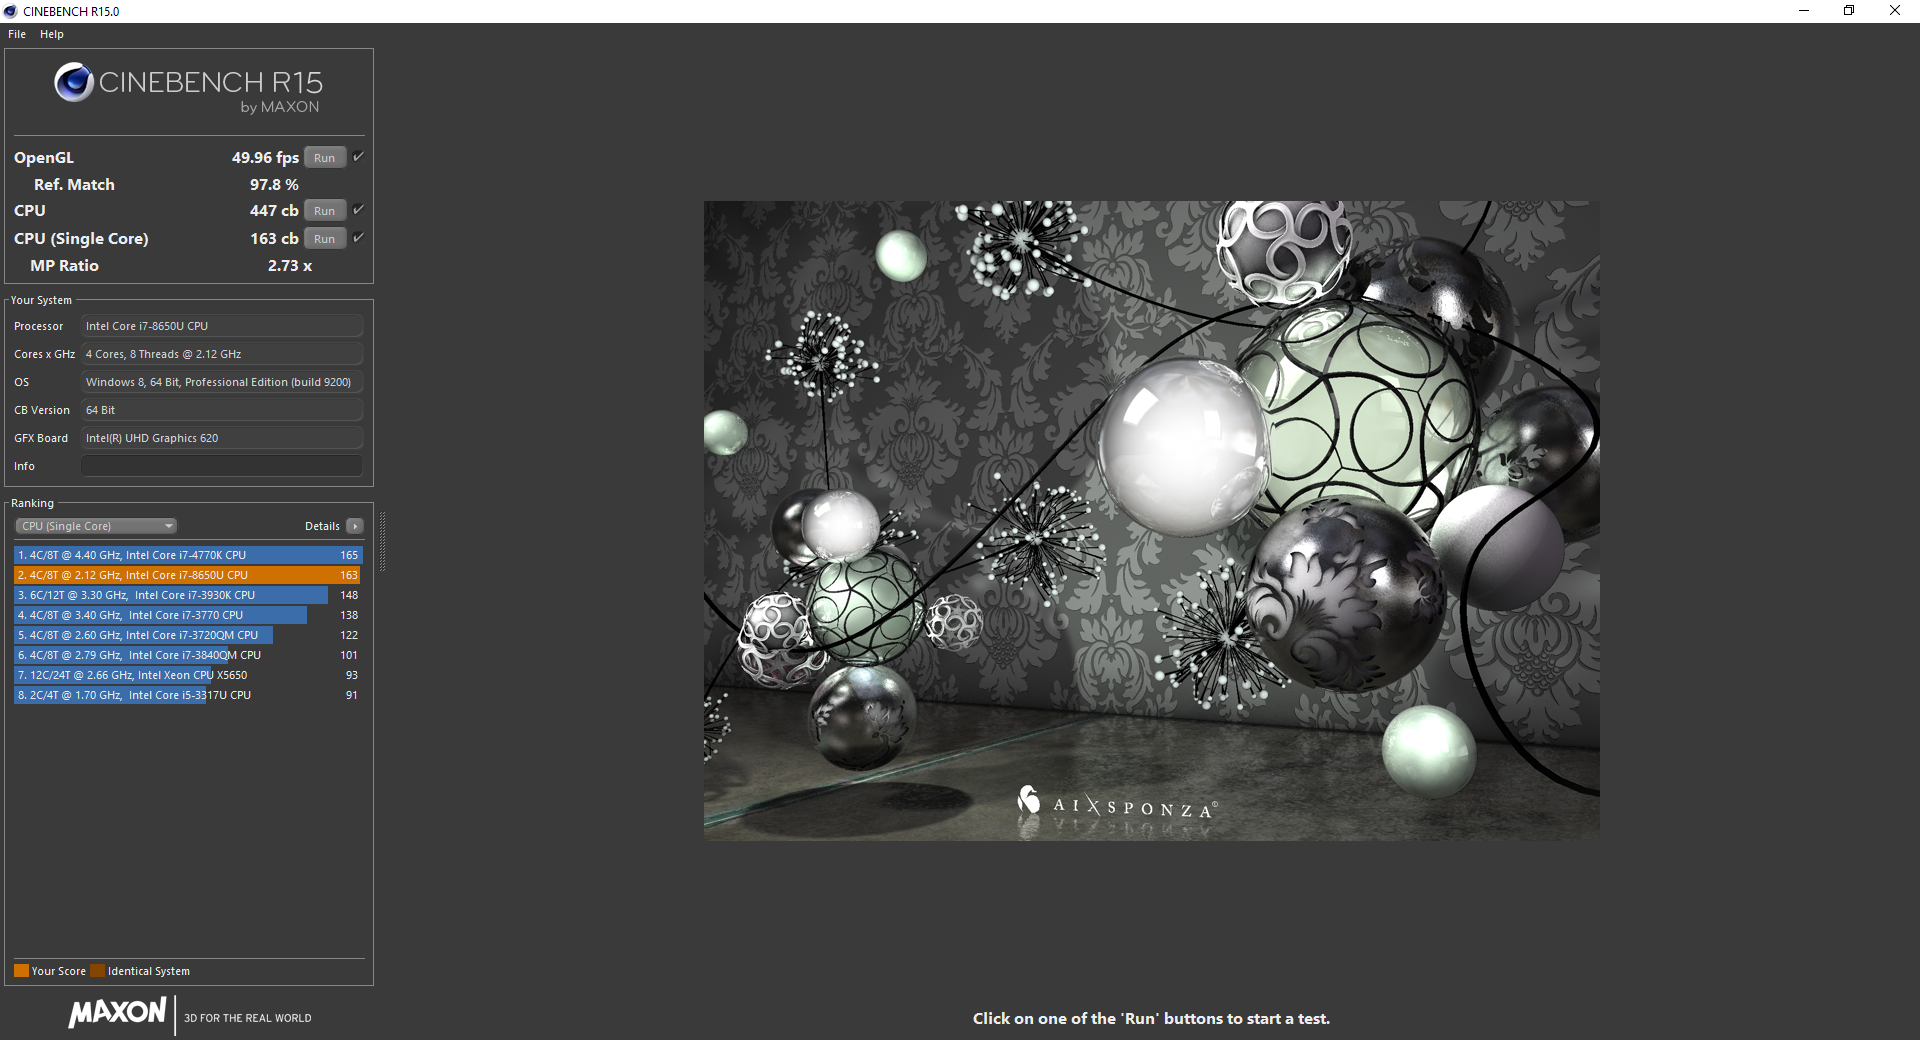
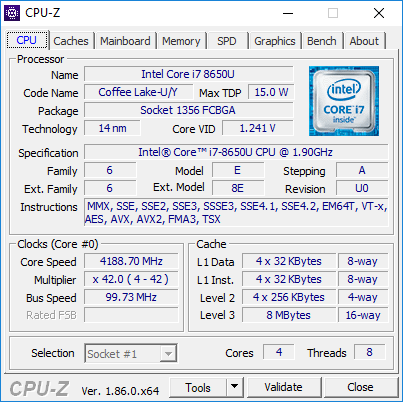
CPU performance is below average as the Core i7-8650U is consistently slower than the Core i5-8250U SKU we tested a few months ago. CineBench scores are disappointingly about 10 percent slower than the i5-8250U configuration despite being on the High Performance profile. The same Core i7-8650U CPU in the 2018 Surface Pro is faster than our HP by almost 45 percent as shown by our CineBench loop test results below.
See our dedicated page on the Core i7-8650U for more technical information and benchmark comparisons.
System Performance
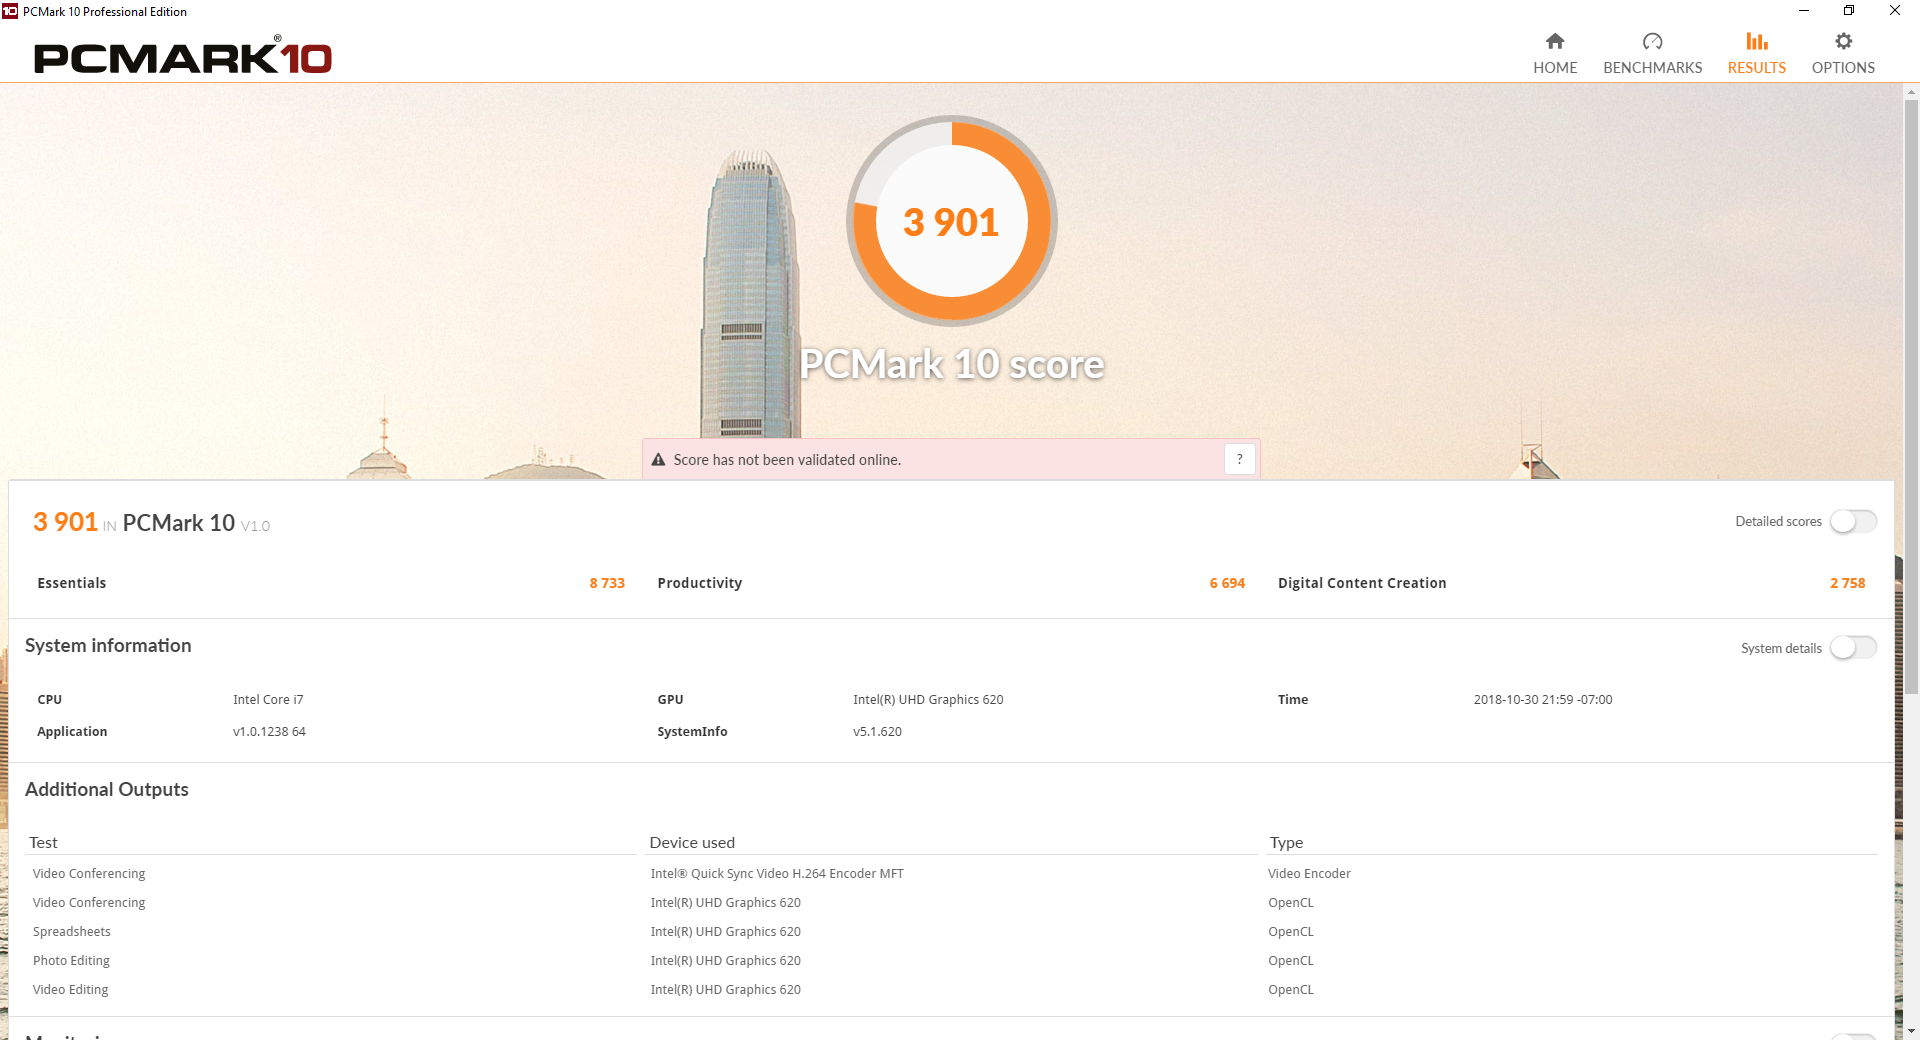
PCMark benchmarks are unsurprisingly very similar to the i5 SKU of the EliteBook x360 1030 G3. The notable exception is its much higher PCMark Productivity score due to the faster Samsung SSD.
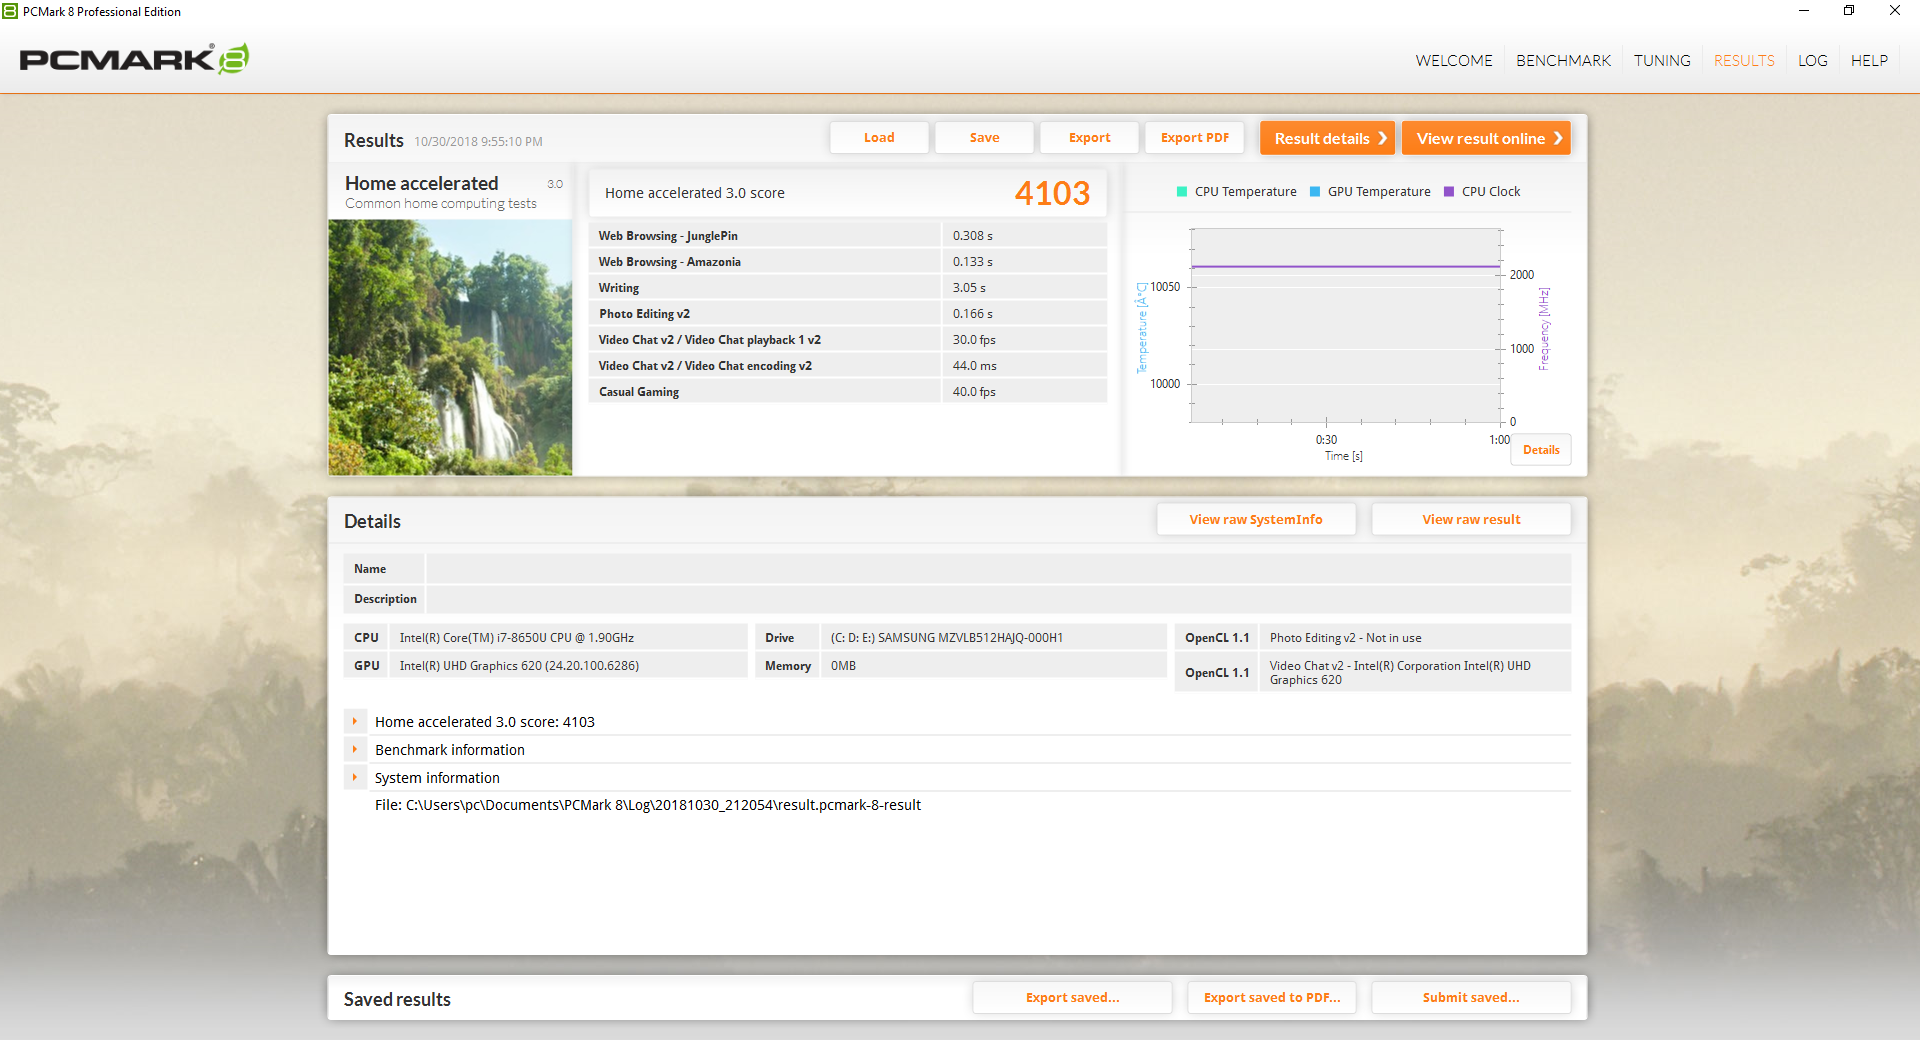
| PCMark 8 Home Score Accelerated v2 | 4103 points | |
| PCMark 10 Score | 3901 points | |
Help | ||
Storage Devices
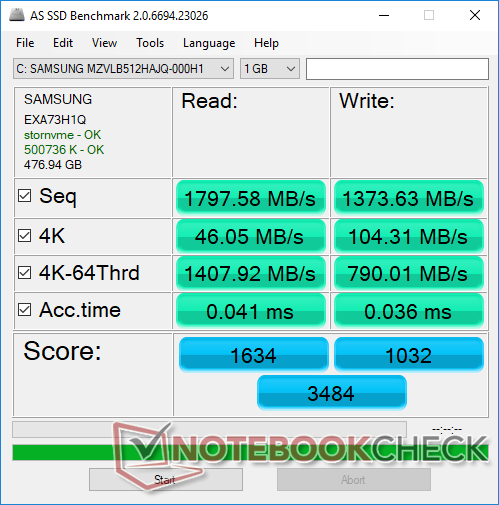
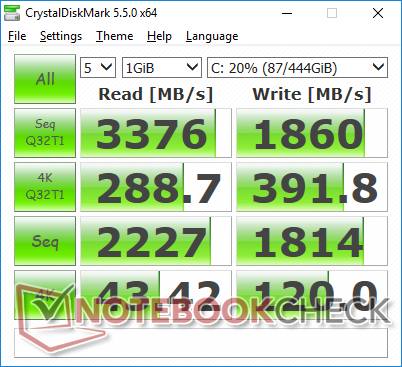
Whereas our Core i5 SKU housed a 128 GB Samsung PM871b SATA III SSD, our Core i7 SKU houses a 512 GB Samsung PM981 NVMe SSD for significantly faster performance. Sequential write rate in particular is impressive at almost 1400 MB/s.
See our table of HDDs and SSDs for more benchmark comparisons.
| HP EliteBook x360 1030 G3 45X96UT Samsung SSD PM981 MZVLB512HAJQ | Lenovo Yoga C930-13IKB SK hynix PC401 HFS256GD9TNG | Chuwi LapBook SE SanDisk DF4032 | Microsoft Surface Pro 6, Core i5, 128 GB Toshiba KBG30ZPZ128G | Huawei Matebook X Pro i5 Samsung PM961 MZVLW256HEHP | HP EliteBook x360 1030 G3 Samsung PM871b MZNLN128HAHQ | |
|---|---|---|---|---|---|---|
| AS SSD | -50% | -518% | -261% | -23% | -73% | |
| Seq Read (MB/s) | 1798 | 1850 3% | 264.1 -85% | 1114 -38% | 2416 34% | 488.2 -73% |
| Seq Write (MB/s) | 1374 | 661 -52% | 131.8 -90% | 340 -75% | 1170 -15% | 403.2 -71% |
| 4K Read (MB/s) | 46.05 | 38.04 -17% | 6.3 -86% | 40.46 -12% | 48.33 5% | 31.07 -33% |
| 4K Write (MB/s) | 104.3 | 95 -9% | 13.6 -87% | 80.6 -23% | 103.1 -1% | 70.8 -32% |
| 4K-64 Read (MB/s) | 1408 | 434.3 -69% | 25.65 -98% | 277.9 -80% | 1039 -26% | 255.1 -82% |
| 4K-64 Write (MB/s) | 790 | 266.3 -66% | 9.11 -99% | 129.3 -84% | 399.6 -49% | 156.5 -80% |
| Access Time Read * (ms) | 0.041 | 0.069 -68% | 0.671 -1537% | 0.913 -2127% | 0.058 -41% | 0.093 -127% |
| Access Time Write * (ms) | 0.036 | 0.056 -56% | 1.233 -3325% | 0.301 -736% | 0.036 -0% | 0.048 -33% |
| Score Read (Points) | 1634 | 657 -60% | 58 -96% | 430 -74% | 1329 -19% | 335 -79% |
| Score Write (Points) | 1032 | 427 -59% | 36 -97% | 244 -76% | 620 -40% | 268 -74% |
| Score Total (Points) | 3484 | 1373 -61% | 120 -97% | 870 -75% | 2575 -26% | 781 -78% |
| Copy ISO MB/s (MB/s) | 1947 | 539 -72% | 128.1 -93% | 739 -62% | 208.1 -89% | |
| Copy Program MB/s (MB/s) | 453.9 | 209.7 -54% | 94 -79% | 312.3 -31% | 74.3 -84% | |
| Copy Game MB/s (MB/s) | 990 | 340 -66% | 124.4 -87% | 486.3 -51% | 164.5 -83% |
* ... smaller is better

GPU Performance
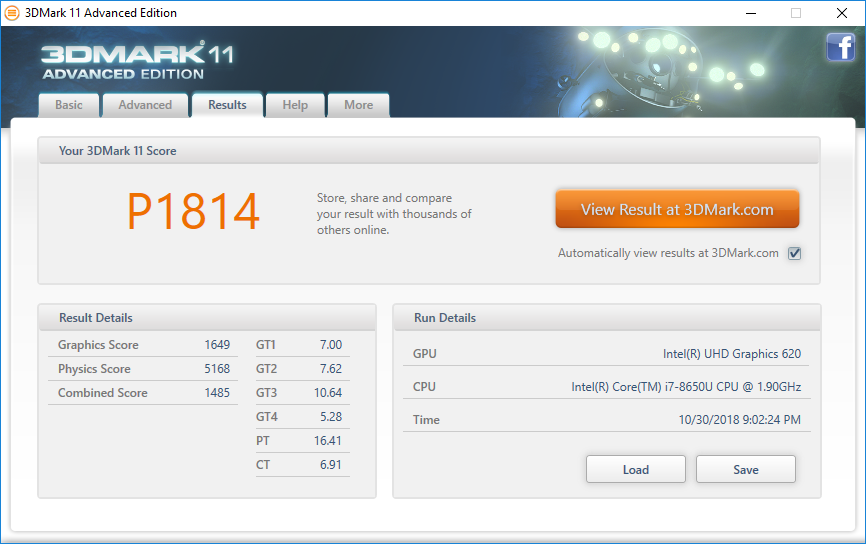
Performance from the UHD Graphics 620 in the HP is within 5 percent of the average UHD Graphics 620 in our database. Users will see almost no performance benefits if jumping from the last generation HD Graphics 620. If more GPU performance is needed, then alternative laptops with the AMD Vega 8 or GeForce MX150 should do the trick without resorting to significantly thicker or heavier designs.
See our dedicated page on the UHD Graphics 620 for more technical information and benchmark comparisons.
| 3DMark 11 Performance | 1814 points | |
Help | ||
| low | med. | high | ultra | |
|---|---|---|---|---|
| BioShock Infinite (2013) | 70.9 | 32.9 | 28.5 | 8.9 |
Emissions
System Noise
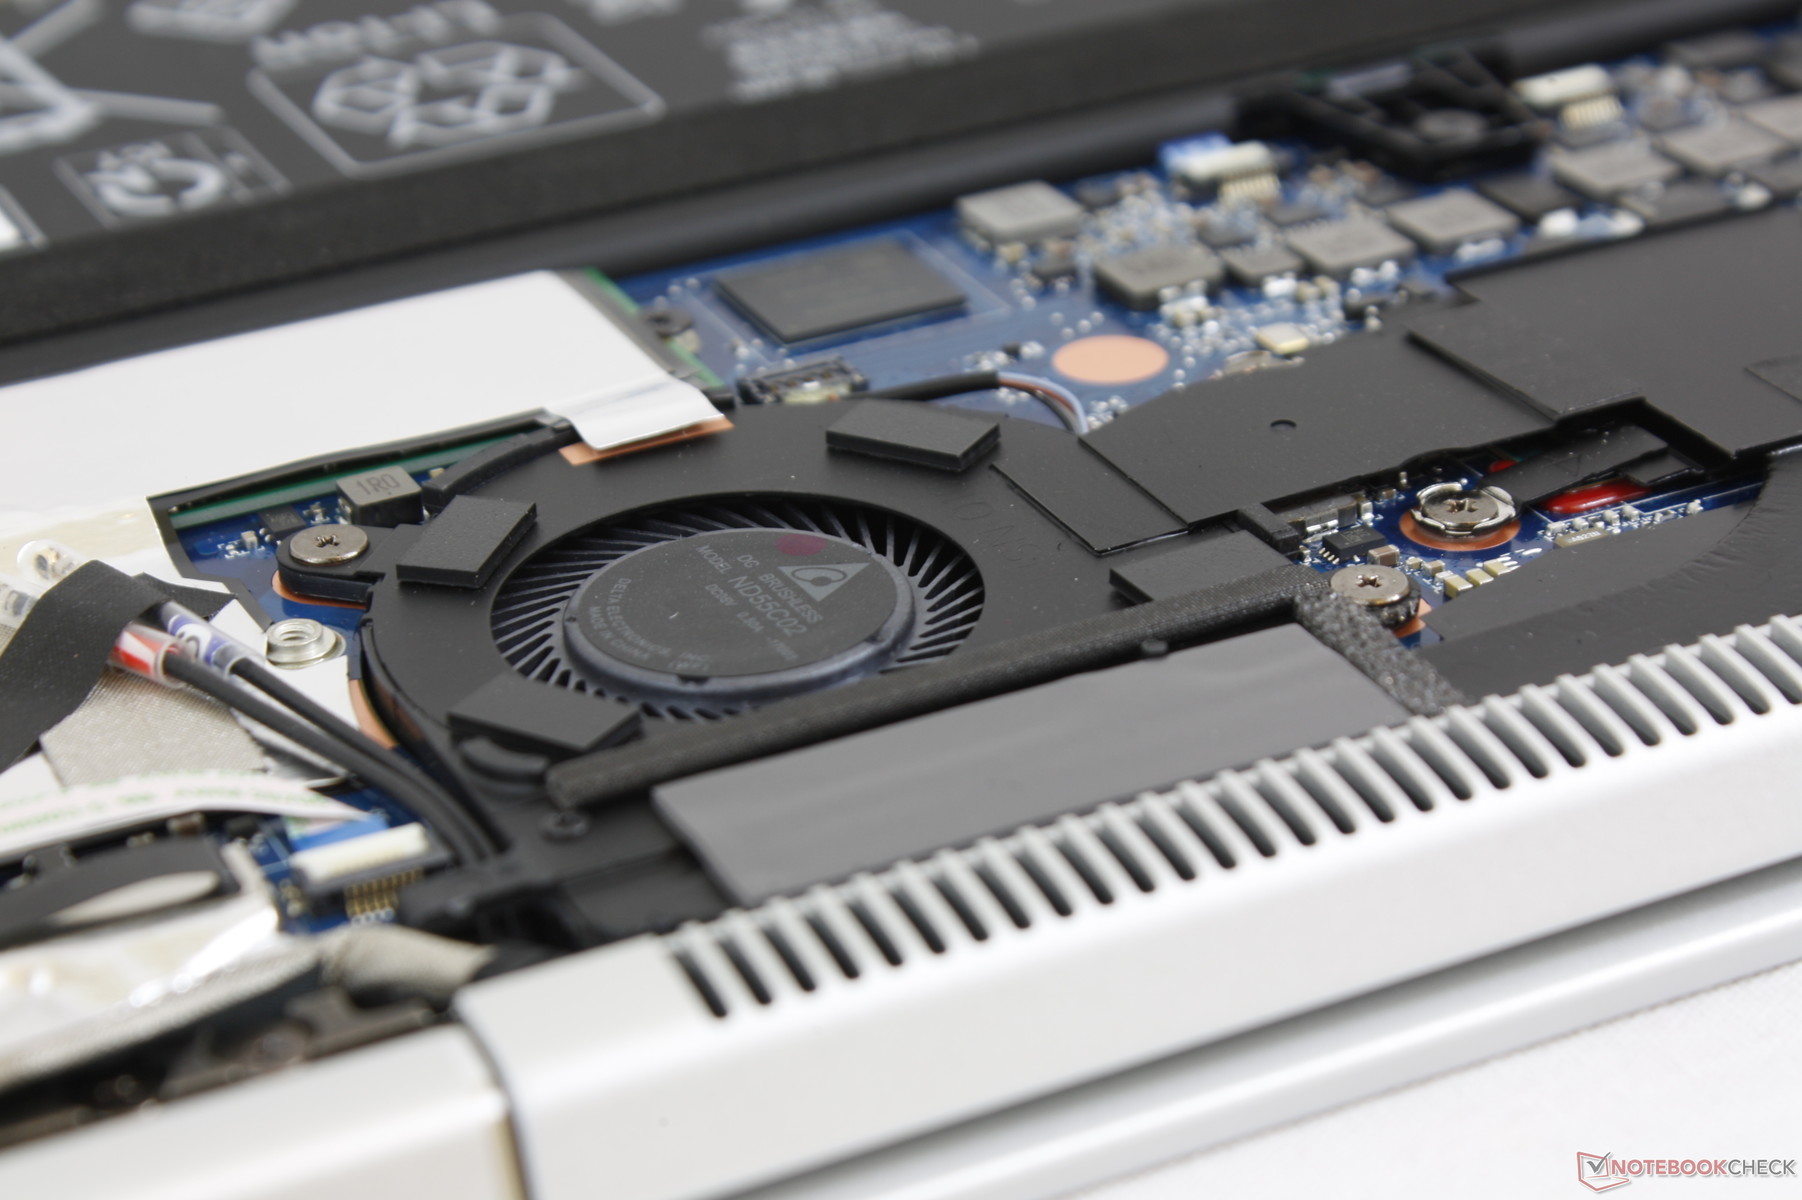
The cooling solution consists of two small fans and two heat pipes between them. Both fans remain idle during low to low-medium loads like browsing or streaming. For heavier loads like 3DMark 06 or gaming, fan noise jumps to about 30 to 33 dB(A). Fan noise never becomes an issue and the system is almost always silent for word processing and office-type loads.
Our unit does not suffer from any noticeable electronic noise.
Noise level
| Idle |
| 28.5 / 28.5 / 28.5 dB(A) |
| Load |
| 30.8 / 32.8 dB(A) |
 | ||
30 dB silent 40 dB(A) audible 50 dB(A) loud |
||
min: | ||
| HP EliteBook x360 1030 G3 45X96UT UHD Graphics 620, i7-8650U, Samsung SSD PM981 MZVLB512HAJQ | Lenovo Yoga C930-13IKB UHD Graphics 620, i5-8250U, SK hynix PC401 HFS256GD9TNG | HP EliteBook x360 1030 G3 UHD Graphics 620, i5-8250U, Samsung PM871b MZNLN128HAHQ | HP Envy x360 15-bq102ng Vega 8, R5 2500U, Samsung PM961 MZVLW256HEHP | HP Spectre x360 13-ac033dx HD Graphics 620, i7-7500U, Samsung PM961 NVMe MZVLW512HMJP | Microsoft Surface Pro 6, Core i7, 512 GB UHD Graphics 620, i7-8650U, Toshiba KBG30ZPZ512G | |
|---|---|---|---|---|---|---|
| Noise | -3% | -1% | -11% | -14% | -6% | |
| off / environment * (dB) | 28.5 | 29.3 -3% | 28.5 -0% | 30.13 -6% | 28.7 -1% | 30.3 -6% |
| Idle Minimum * (dB) | 28.5 | 29.3 -3% | 28.5 -0% | 30.13 -6% | 28.7 -1% | 30.3 -6% |
| Idle Average * (dB) | 28.5 | 29.3 -3% | 28.5 -0% | 30.13 -6% | 34.2 -20% | 30.3 -6% |
| Idle Maximum * (dB) | 28.5 | 29.7 -4% | 28.5 -0% | 30.13 -6% | 35.8 -26% | 30.3 -6% |
| Load Average * (dB) | 30.8 | 31.8 -3% | 31.3 -2% | 38.8 -26% | 35.8 -16% | 33.5 -9% |
| Load Maximum * (dB) | 32.8 | 32.7 -0% | 33.5 -2% | 38.8 -18% | 39.6 -21% | 33.5 -2% |
* ... smaller is better
Temperature
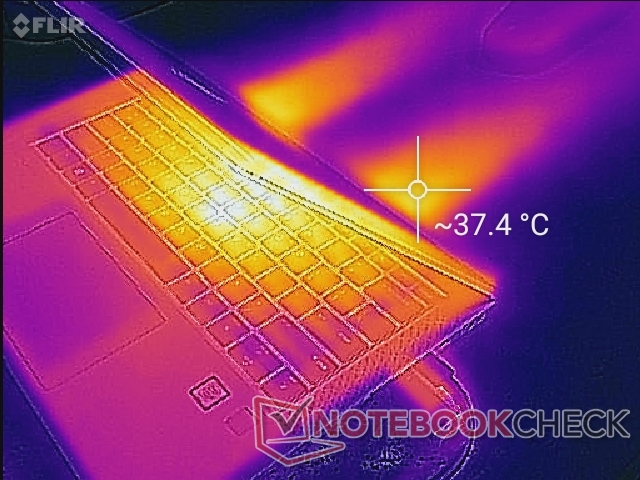
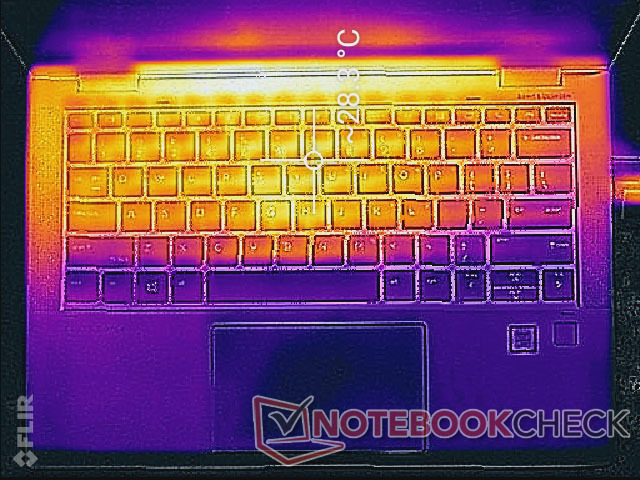
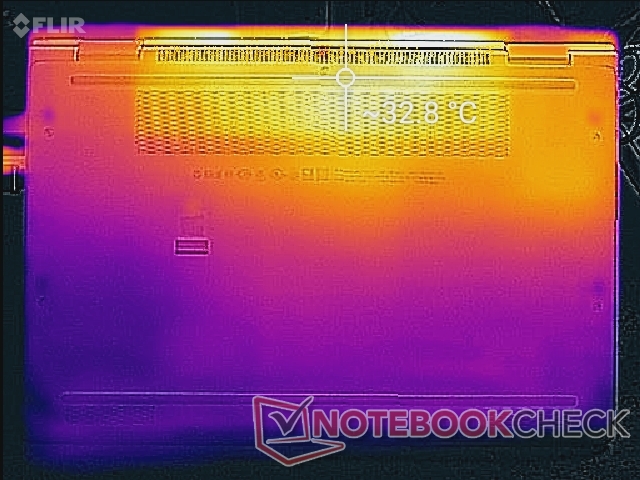
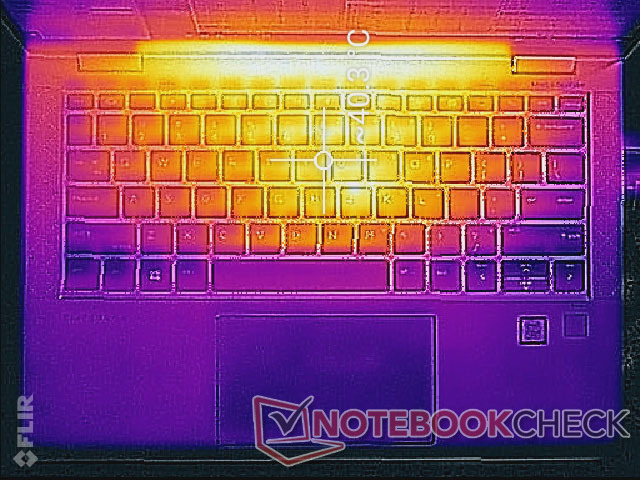
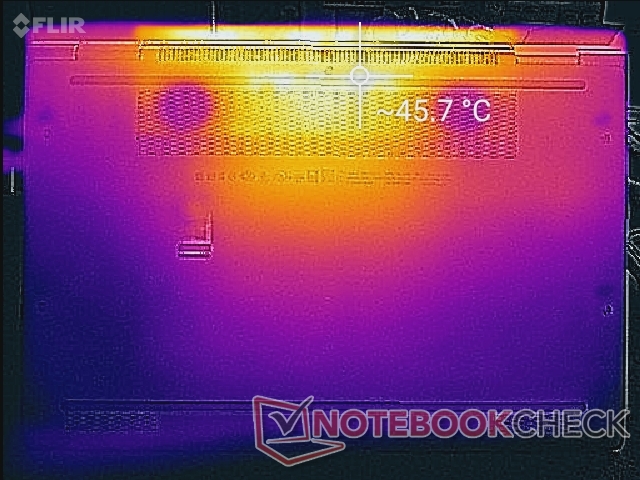
Surface temperature development is mostly symmetrical due to the symmetrical cooling solution underneath. Its warmest areas when idling are about 29 C and 33 C on the top and underside surfaces, respectively, as shown by the temperature maps below. These same hot spots can become as warm as 40 C to 46 C when under very high loads not unlike on the Lenovo Yoga C930. Fortunately, the front half of the notebook remains cool no matter the processing load.
Our stress test shows why the i7-8650U SKU is performing slower than the i5-8250U SKU in our CineBench tests above. When running Prime95, we can observe the i7 CPU operating at 2.8 GHz for the first few seconds before dropping and stabilizing at 1.7 GHz. In comparison, the i5 SKU will stabilize at 2.1 GHz when subjected to the same load conditions. The Core i7 configuration throttles more heavily than the Core i5 configuration without any major temperature benefits.
Running on battery power will limit both CPU and GPU performance. A 3DMark 11 run on batteries returns Physics and Graphics scores of 4802 and 1161 points, respectively, compared to 5168 and 1649 points when on mains.
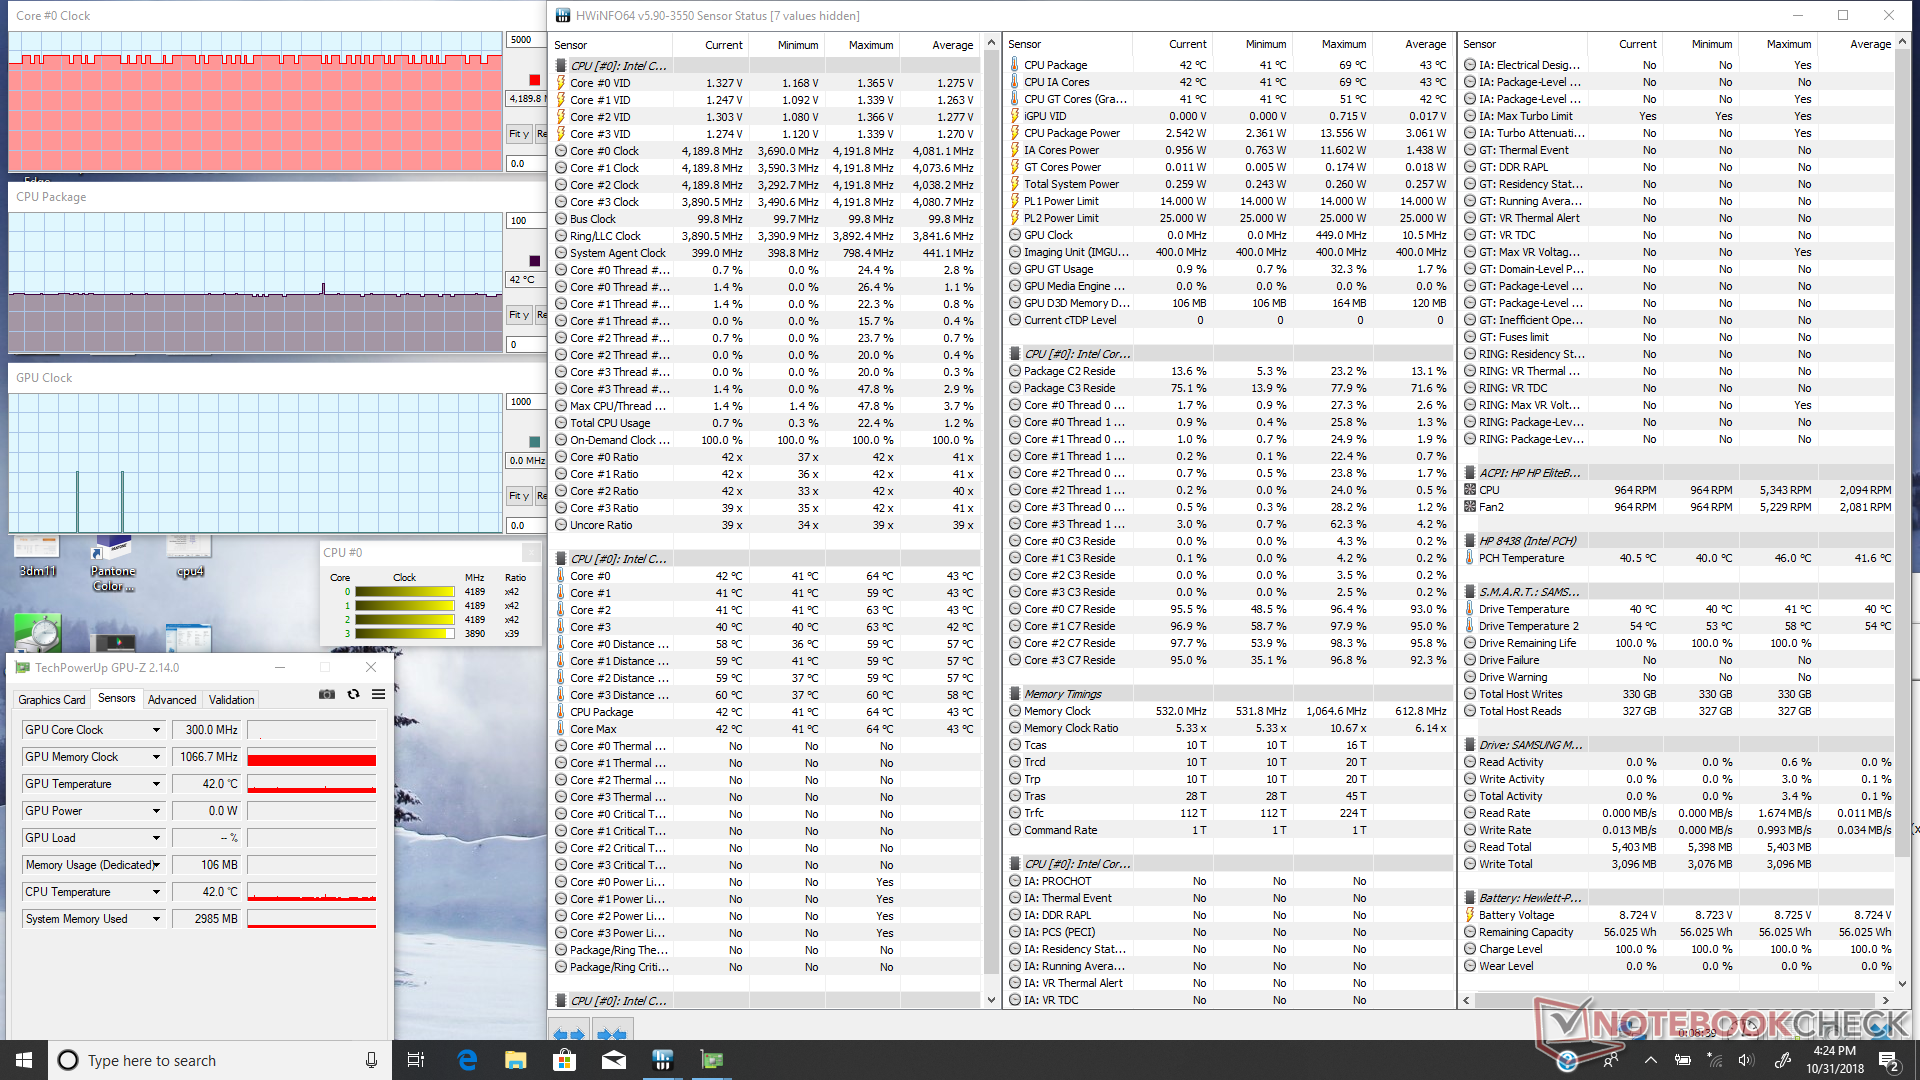
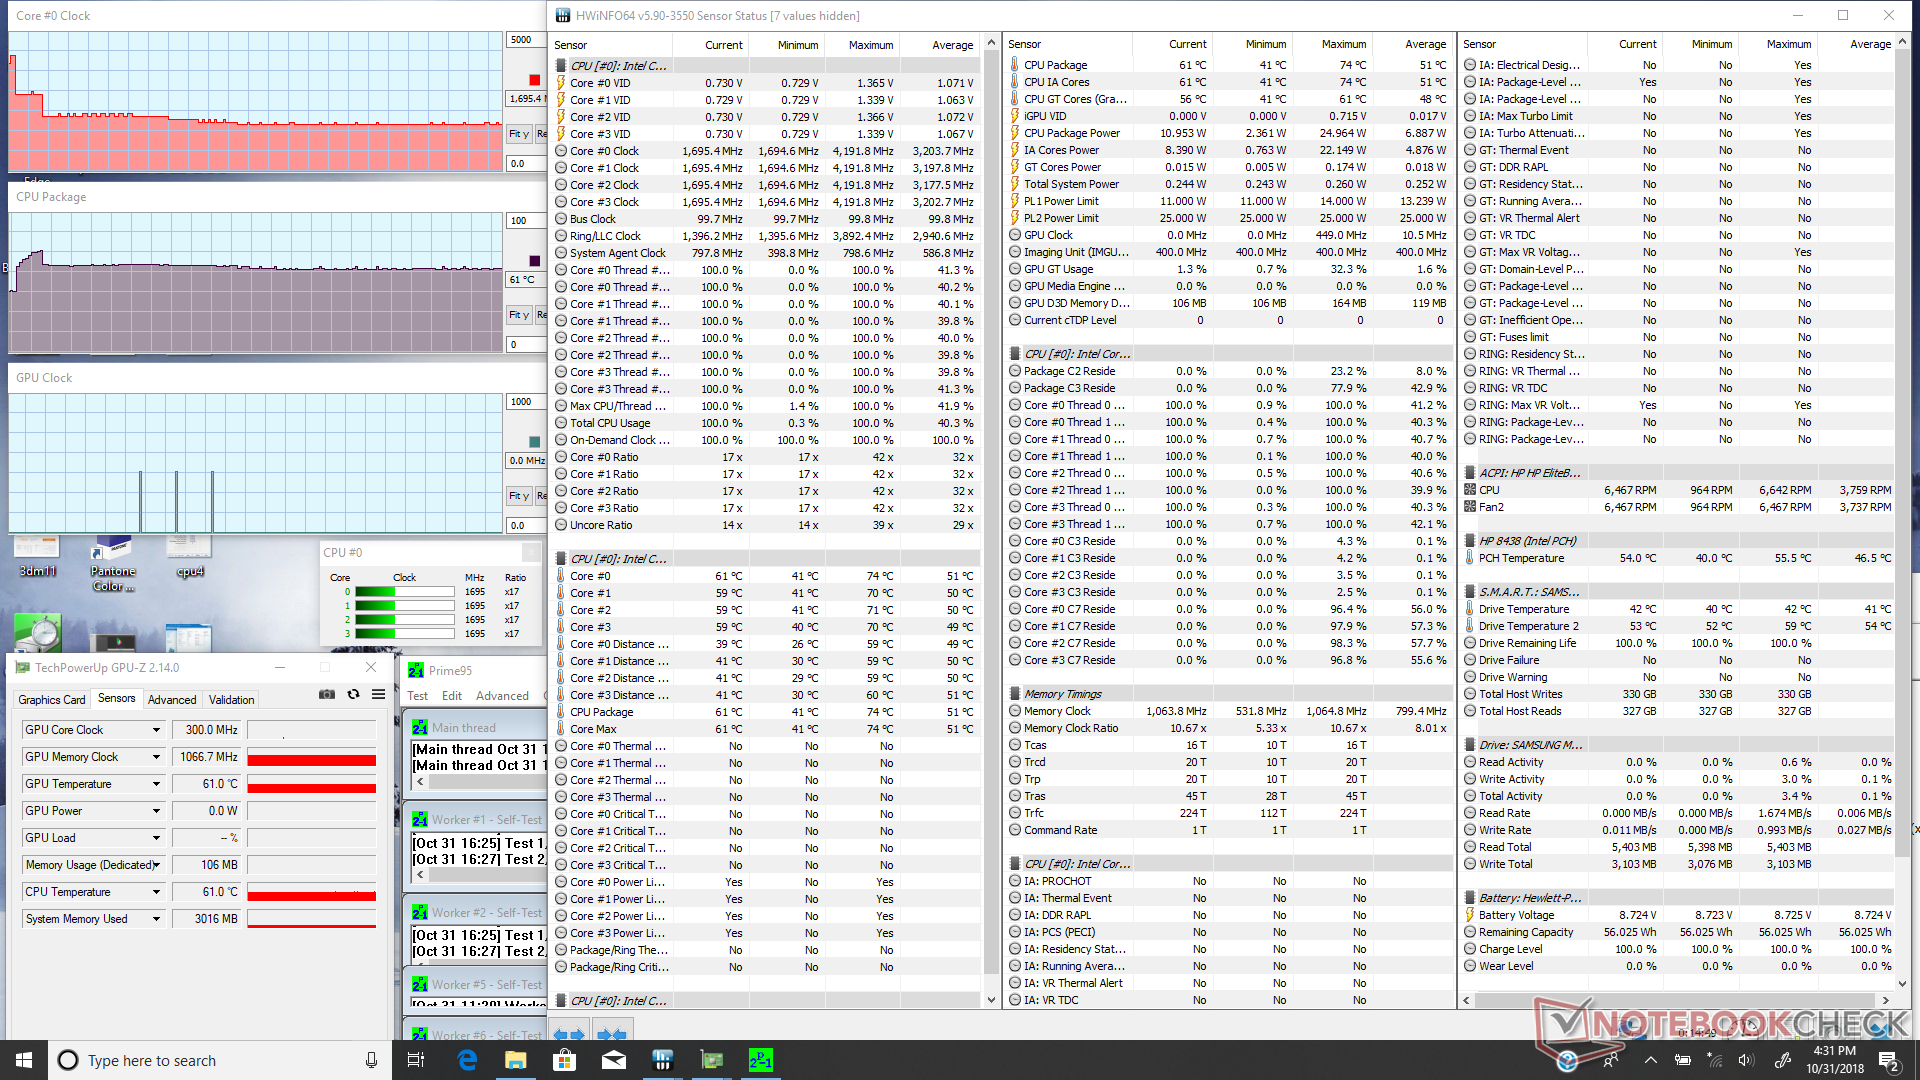
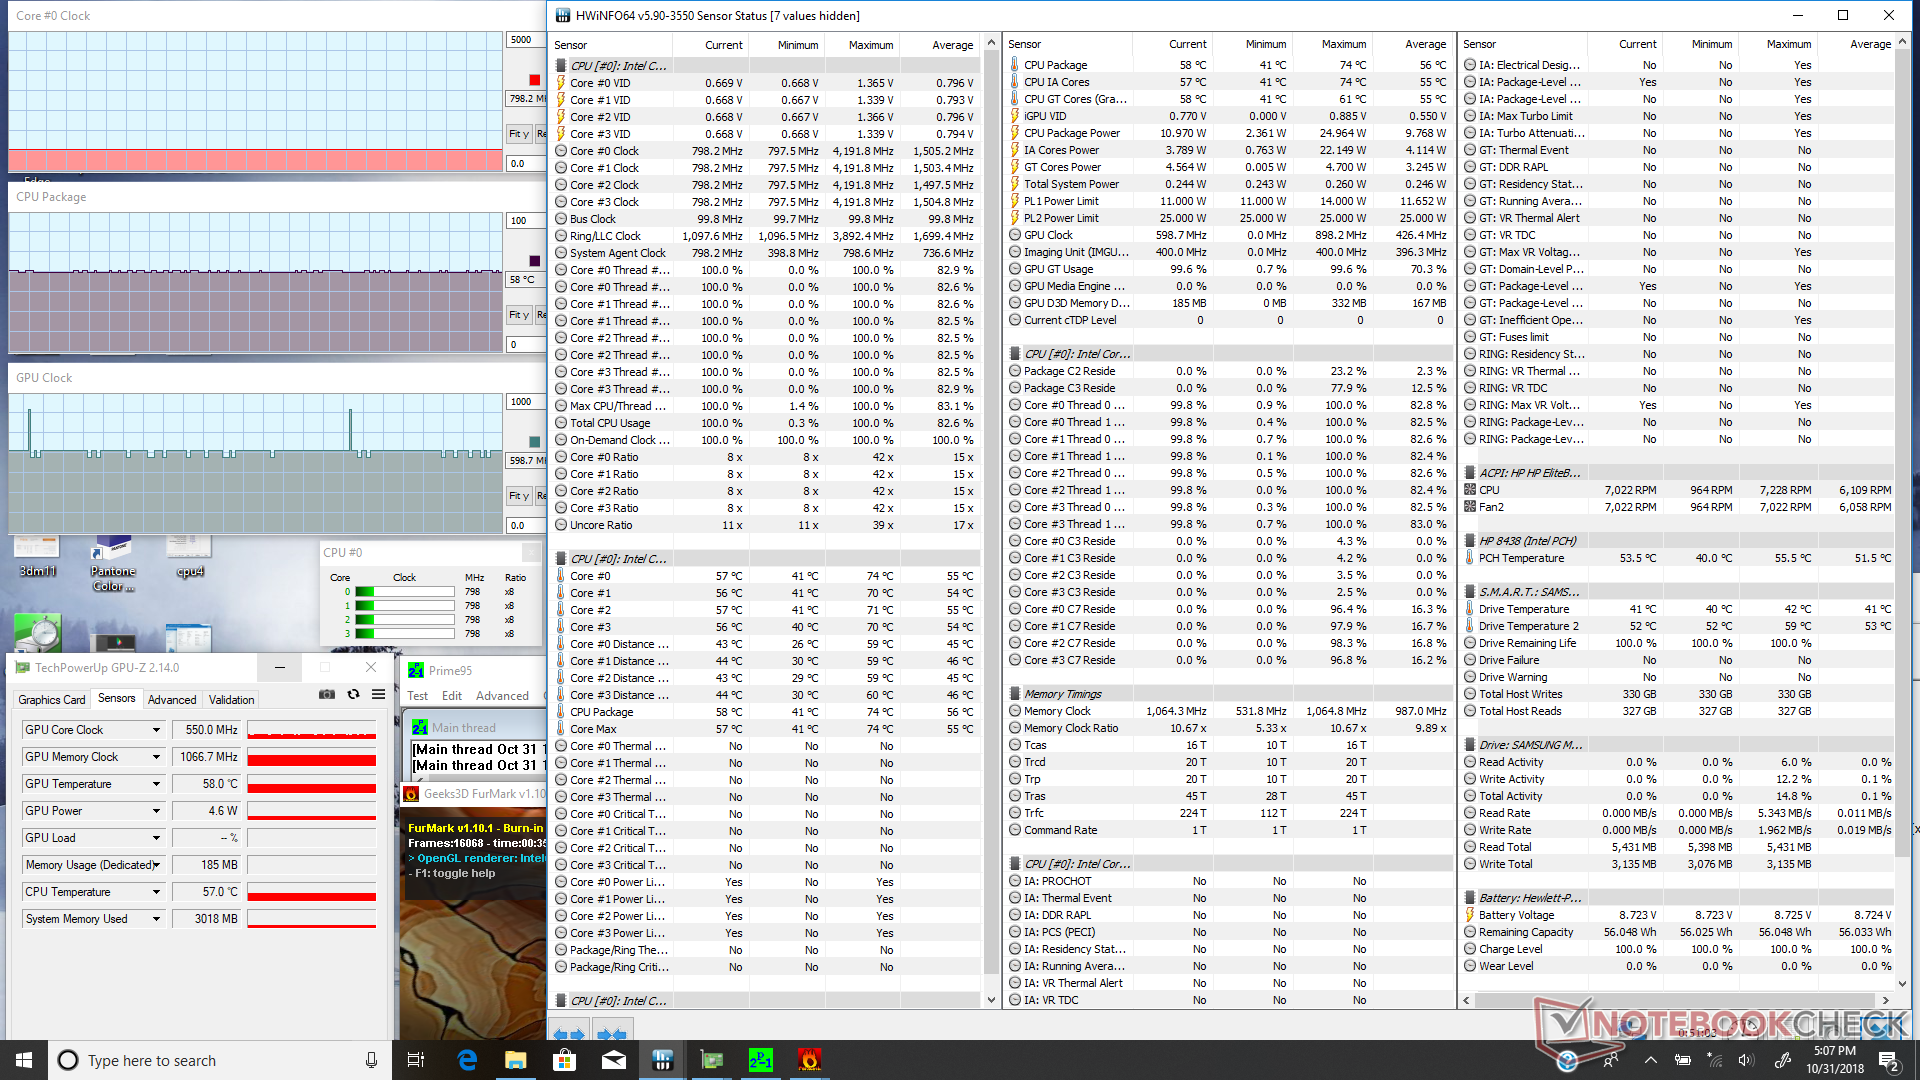
| CPU Clock (GHz) | GPU Clock (MHz) | Average CPU Temperature (°C) | |
| System Idle | -- | -- | 42 |
| Prime95 Stress | 1.7 | -- | 61 |
| Prime95 + FurMark Stress | 0.8 | 599 | 58 |
(±) The maximum temperature on the upper side is 40 °C / 104 F, compared to the average of 35.4 °C / 96 F, ranging from 19.6 to 60 °C for the class Convertible.
(-) The bottom heats up to a maximum of 46.2 °C / 115 F, compared to the average of 36.9 °C / 98 F
(+) In idle usage, the average temperature for the upper side is 26.6 °C / 80 F, compared to the device average of 30.3 °C / 87 F.
(+) The palmrests and touchpad are cooler than skin temperature with a maximum of 27 °C / 80.6 F and are therefore cool to the touch.
(±) The average temperature of the palmrest area of similar devices was 28 °C / 82.4 F (+1 °C / 1.8 F).
Speakers


HP EliteBook x360 1030 G3 45X96UT audio analysis
(±) | speaker loudness is average but good (78.2 dB)
Bass 100 - 315 Hz
(±) | reduced bass - on average 9.8% lower than median
(±) | linearity of bass is average (13.4% delta to prev. frequency)
Mids 400 - 2000 Hz
(+) | balanced mids - only 2% away from median
(+) | mids are linear (4.4% delta to prev. frequency)
Highs 2 - 16 kHz
(+) | balanced highs - only 4.6% away from median
(±) | linearity of highs is average (7.4% delta to prev. frequency)
Overall 100 - 16.000 Hz
(+) | overall sound is linear (11.5% difference to median)
Compared to same class
» 9% of all tested devices in this class were better, 3% similar, 88% worse
» The best had a delta of 6%, average was 20%, worst was 57%
Compared to all devices tested
» 8% of all tested devices were better, 2% similar, 90% worse
» The best had a delta of 4%, average was 24%, worst was 134%
Apple MacBook 12 (Early 2016) 1.1 GHz audio analysis
(+) | speakers can play relatively loud (83.6 dB)
Bass 100 - 315 Hz
(±) | reduced bass - on average 11.3% lower than median
(±) | linearity of bass is average (14.2% delta to prev. frequency)
Mids 400 - 2000 Hz
(+) | balanced mids - only 2.4% away from median
(+) | mids are linear (5.5% delta to prev. frequency)
Highs 2 - 16 kHz
(+) | balanced highs - only 2% away from median
(+) | highs are linear (4.5% delta to prev. frequency)
Overall 100 - 16.000 Hz
(+) | overall sound is linear (10.2% difference to median)
Compared to same class
» 7% of all tested devices in this class were better, 2% similar, 91% worse
» The best had a delta of 5%, average was 18%, worst was 53%
Compared to all devices tested
» 5% of all tested devices were better, 1% similar, 94% worse
» The best had a delta of 4%, average was 24%, worst was 134%
Energy Management
Power Consumption
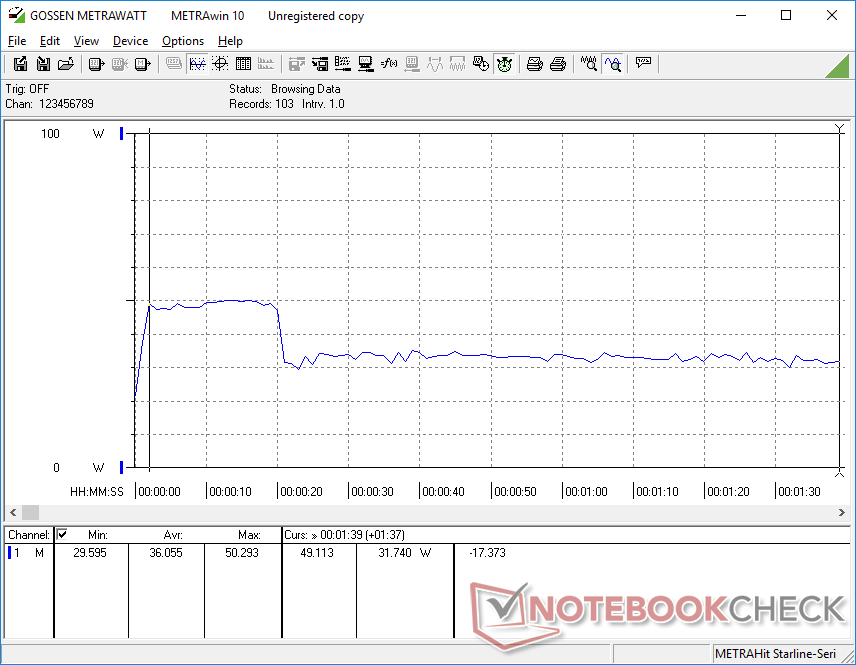
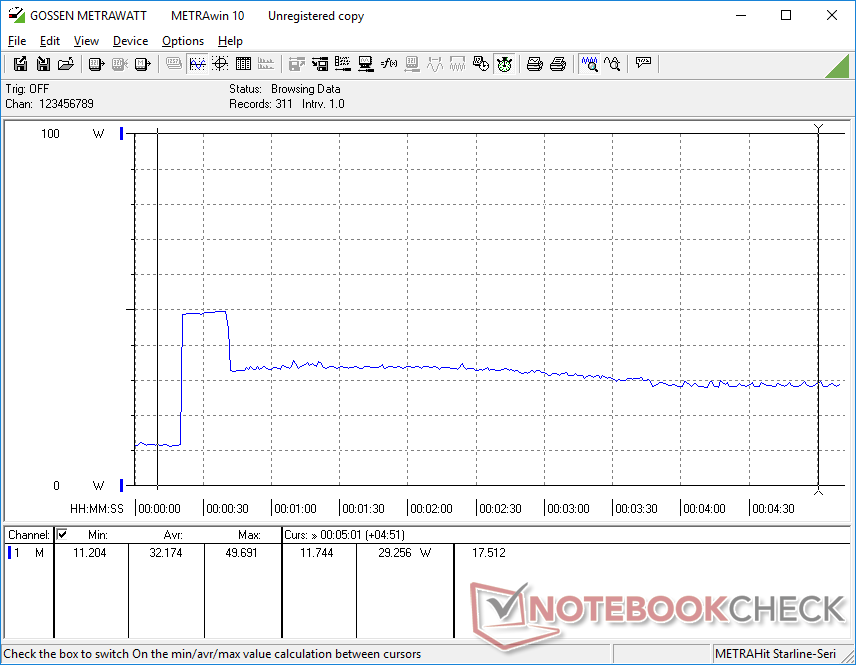
Power consumption is generally higher than the Core i5 SKU under all conditions even though it is performance is slower. Consumption is higher than the 2018 Surface Pro i7 but lower than the Yoga C930 when subjected to similar medium loads.
The highest we are able to record is 51.9 W from the small (~7.5 x 7.5 x 2.8 cm) 65 W AC adapter. However, this is unsustainable and consumption eventually drops to a stable 30 W due to throttling.
| Off / Standby | |
| Idle | |
| Load |
|
Key:
min: | |
| HP EliteBook x360 1030 G3 45X96UT i7-8650U, UHD Graphics 620, Samsung SSD PM981 MZVLB512HAJQ, IPS, 1920x1080, 13.3" | Lenovo Yoga C930-13IKB i5-8250U, UHD Graphics 620, SK hynix PC401 HFS256GD9TNG, IPS, 1920x1080, 13.9" | Chuwi LapBook SE Celeron N4100, UHD Graphics 600, SanDisk DF4032, , 1920x1080, 13.3" | Microsoft Surface Pro 6, Core i7, 512 GB i7-8650U, UHD Graphics 620, Toshiba KBG30ZPZ512G, IPS, 2736x1824, 12.3" | HP Elite x2 1013 G3-2TT14EA i5-8350U, UHD Graphics 620, Samsung PM961 MZVLW256HEHP, IPS, 3000x2000, 13" | HP EliteBook x360 1030 G3 i5-8250U, UHD Graphics 620, Samsung PM871b MZNLN128HAHQ, IPS, 1920x1080, 13.3" | |
|---|---|---|---|---|---|---|
| Power Consumption | 1% | 38% | 8% | -3% | 12% | |
| Idle Minimum * (Watt) | 3.4 | 3.3 3% | 2.7 21% | 3.2 6% | 4.9 -44% | 3.8 -12% |
| Idle Average * (Watt) | 7.6 | 6.8 11% | 6.3 17% | 8.7 -14% | 8.9 -17% | 7.5 1% |
| Idle Maximum * (Watt) | 11.5 | 9.5 17% | 7.6 34% | 10.4 10% | 11 4% | 8.6 25% |
| Load Average * (Watt) | 35.4 | 40.8 -15% | 12.6 64% | 29.2 18% | 32 10% | 33.1 6% |
| Load Maximum * (Watt) | 51.9 | 57 -10% | 24.6 53% | 40.8 21% | 36 31% | 31.8 39% |
* ... smaller is better
Battery Life
Runtimes are excellent and slightly longer than both the Yoga C930 and 2018 Surface Pro. Users can expect almost 10 hours of real-world WLAN use when on the Balanced profile and at a screen brightness of 150 nits. SKUs with the 700-nit backlight option will indubitably have shorter runtimes.
| HP EliteBook x360 1030 G3 45X96UT i7-8650U, UHD Graphics 620, 56.2 Wh | Lenovo Yoga C930-13IKB i5-8250U, UHD Graphics 620, 60 Wh | Chuwi LapBook SE Celeron N4100, UHD Graphics 600, 37 Wh | Huawei Matebook X Pro i5 i5-8250U, GeForce MX150, 57.4 Wh | Microsoft Surface Pro 6, Core i7, 512 GB i7-8650U, UHD Graphics 620, 45 Wh | HP EliteBook x360 1030 G3 i5-8250U, UHD Graphics 620, 56.2 Wh | |
|---|---|---|---|---|---|---|
| Battery runtime | -6% | -24% | -5% | -13% | 2% | |
| WiFi v1.3 (h) | 9.8 | 9.2 -6% | 7.4 -24% | 9.3 -5% | 8.5 -13% | 10 2% |
| Reader / Idle (h) | 23.9 | 20.7 | 18.1 | 23 | ||
| Load (h) | 2.1 | 5.8 | 2.2 | 2.2 | 3.2 |
Verdict
Pros
Cons
In our original review of the Core i5 EliteBook x360 1030 G3, we said it was the best 13-inch business convertible with more features and a brighter display than your typical flagship Ultrabook. This still remains true for the Core i7 configuration but with one key drawback: it's not all that much faster than the less expensive Core i5-8250U option. In fact, our results show the i7 CPU to be consistently slower than the i5 CPU due to steeper throttling on the Core i7. In contrast, the Core i7 Yoga C930 is faster than the Core i5 Yoga C930 especially when subjected to high processing stress, so we're disappointed to see the opposite on one of HP's best subnotebooks.
The EliteBook x360 1030 G3 is still highly recommendable as its redeeming qualities far outweigh and outnumber the few negatives. With that said, we suggest skipping the Core i7-8650U SKU and to use the extra funds for more utilitarian options instead like Sure View, the 700-nit "Outdoor Mode" backlight, 4G LTE, and even an external Thunderbolt Dock G2 or monitor.
The Core i7 SKU is at least $200 or $300 more than the Core i5 SKU and its performance benefits - or lack thereof - don't justify the price premium. The Core i5 SKU continues to be the best that the EliteBook x360 1030 G3 has to offer.
HP EliteBook x360 1030 G3 45X96UT
- 11/06/2018 v6 (old)
Allen Ngo
Price comparison
