Lenovo IdeaPad 720 (i5-7200U, RX 560) Laptop Review

Lenovo is striving for a piece of the mid-range multimedia notebook market with its IdeaPad 720-15IKB. The IdeaPad 720 must combine a premium case with impressive system performance to stand out in this competitive segment. Lenovo describes the IdeaPad 720 as a device where “premium performance meets stylish design”. Our test device is equipped with an Intel Core i5-7200U processor, an AMD Radeon RX 560 (Laptop) GPU, 8 GB RAM, a 256 GB SSD and a 1 TB HDD. This configuration costs 950 Euros (~$1108), putting it just shy of the premium level 1,000-Euro mark (~$1166).
We will be comparing the IdeaPad 720 against several competitors. We have chosen the Xiaomi Mi Notebook Pro i5, which costs 1,100 Euros (~$1283) but packs a powerful Intel Core i5 CPU, an Nvidia GeForce MX150 GPU, and 16 GB DDR4-2400 RAM. We will also be comparing the IdeaPad 720 against the ASUS ZenBook UX3430UN as it has comparable hardware to the Mi Notebook Pro. The UX3430UN has a 14-inch display in comparison to the IdeaPad 720’s 15.6-inch display.
The final two main devices against which we will be comparing the IdeaPad 720 are the HP Pavilion Power 15t-cb2000 and the Acer Aspire 7 A715-71G-53TU. Both devices offer more graphics performance thanks to their Nvidia GeForce GTX 1050 GPUs. The Pavilion Power 15 is priced closely to the IdeaPad 720, while the Aspire 7 is slightly cheaper at around 900 Euros (~$1049).
Case
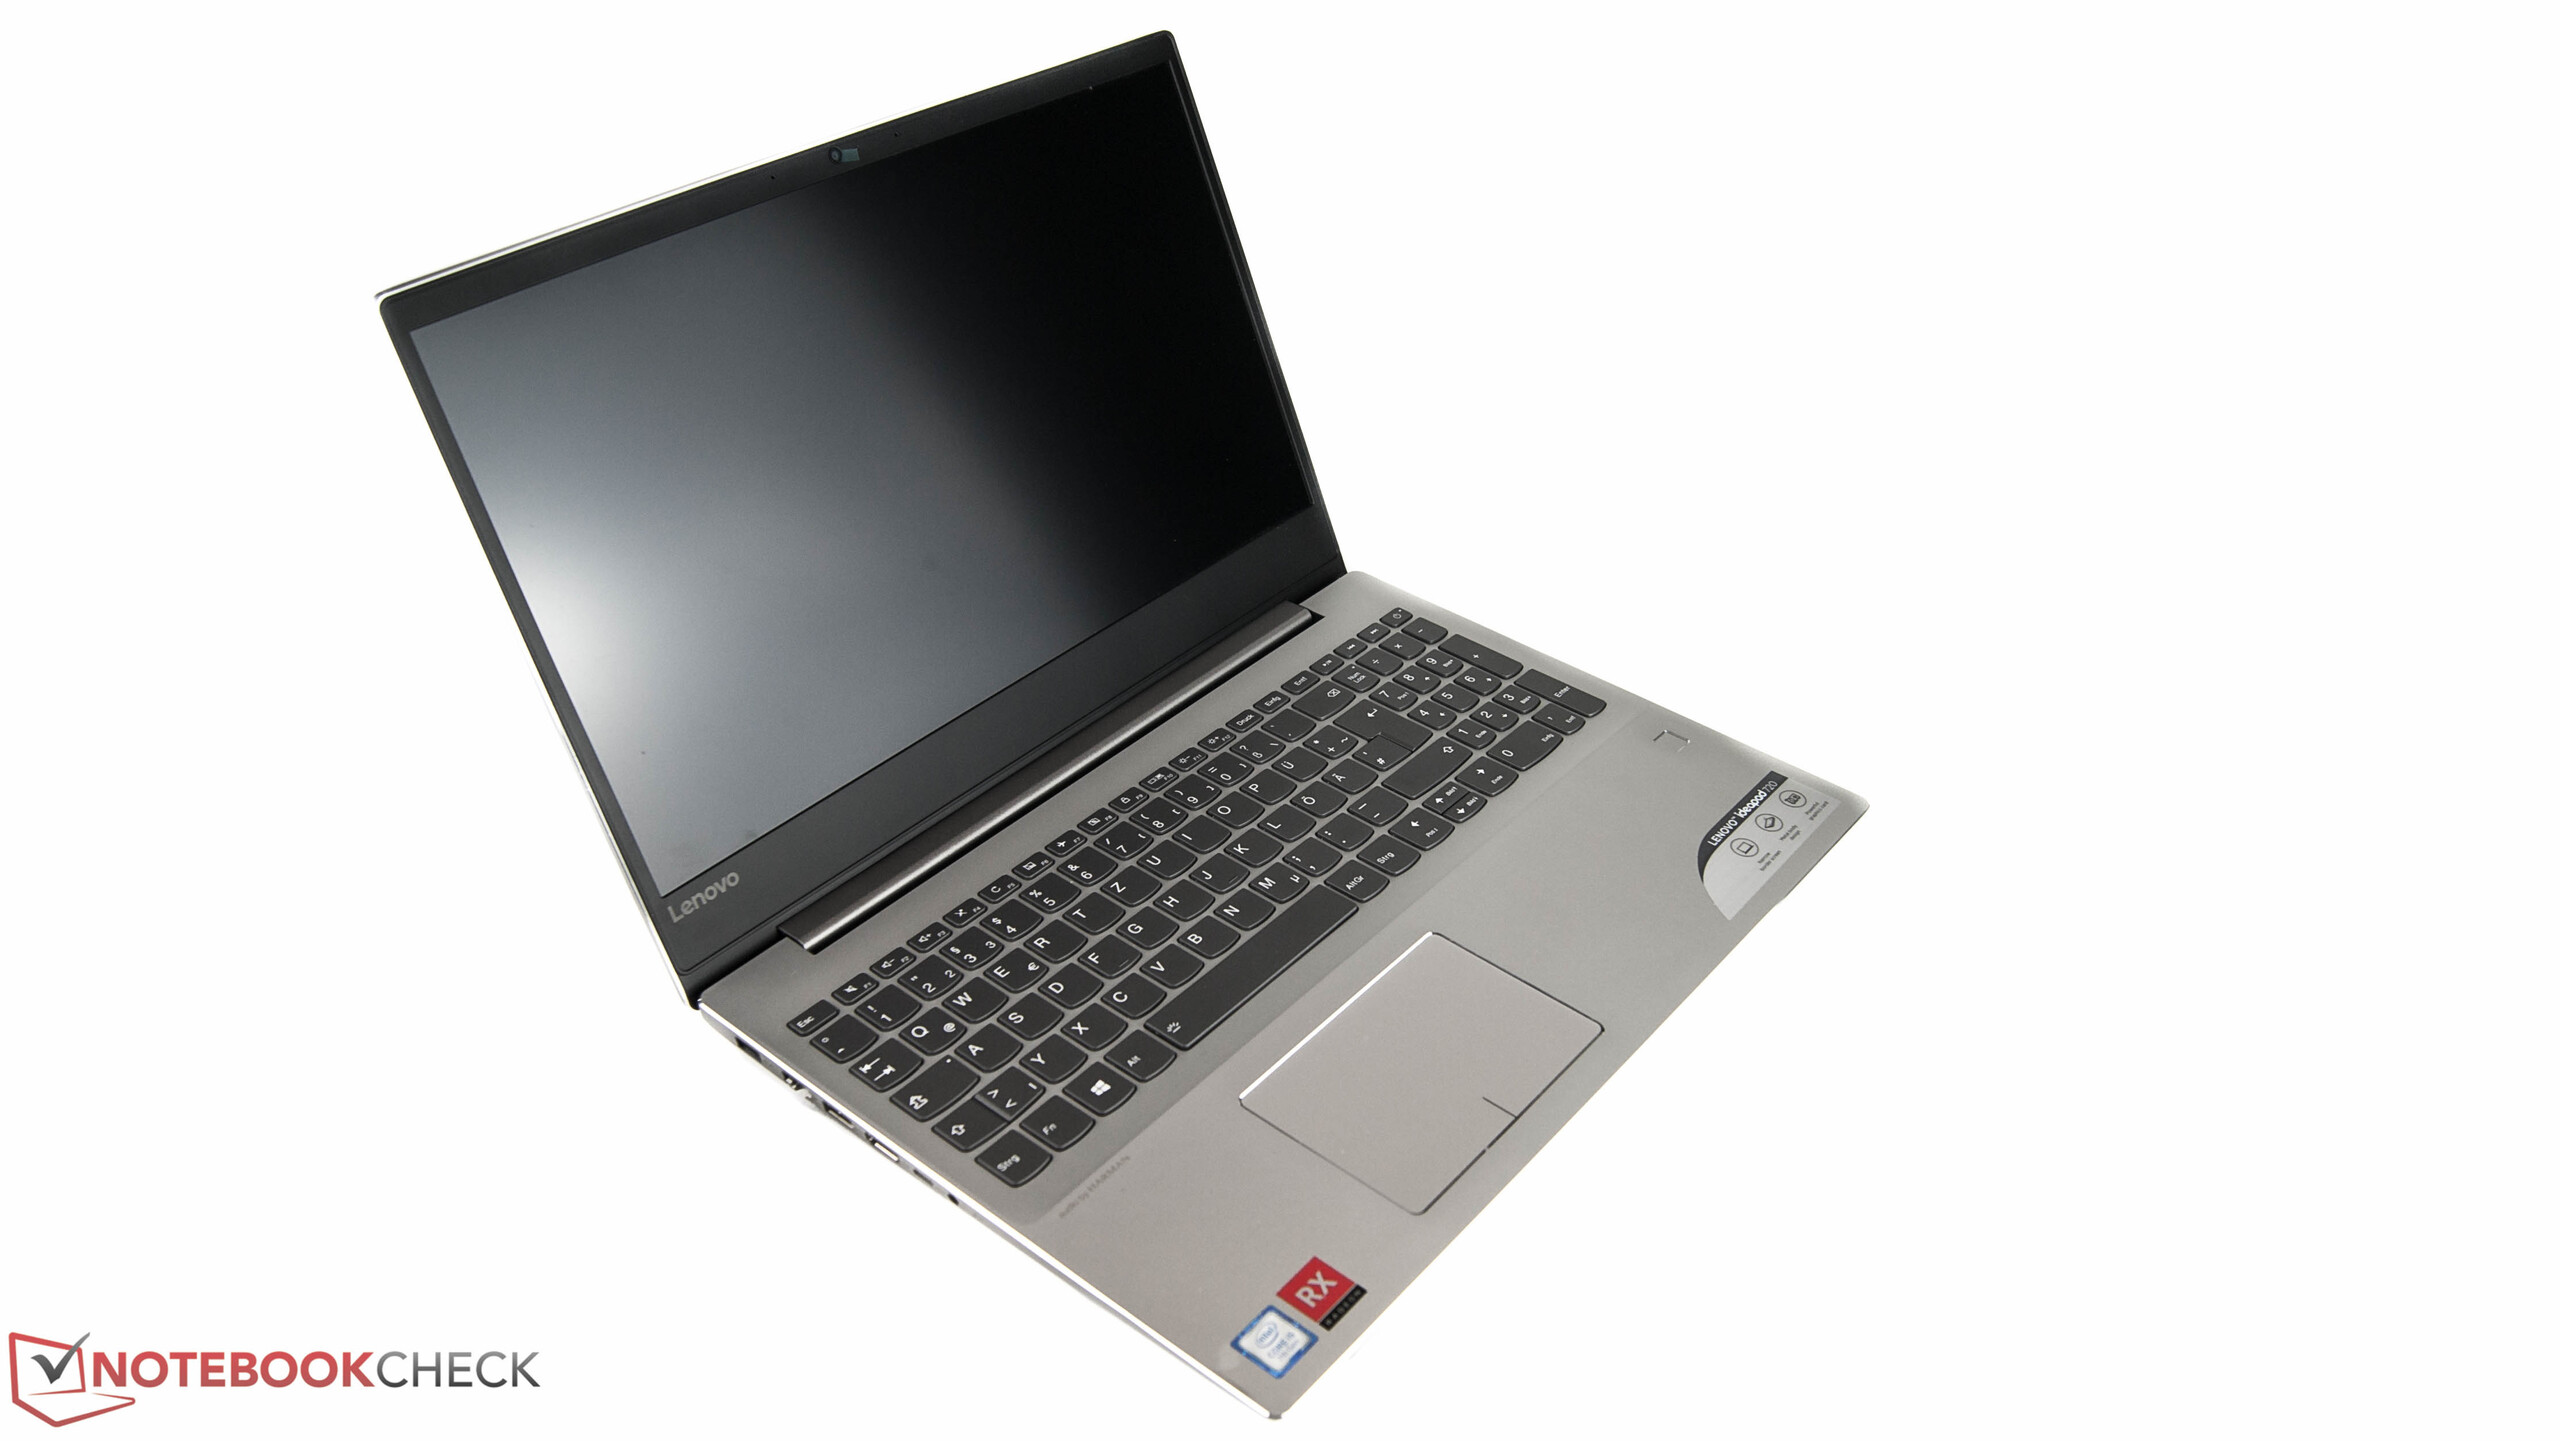
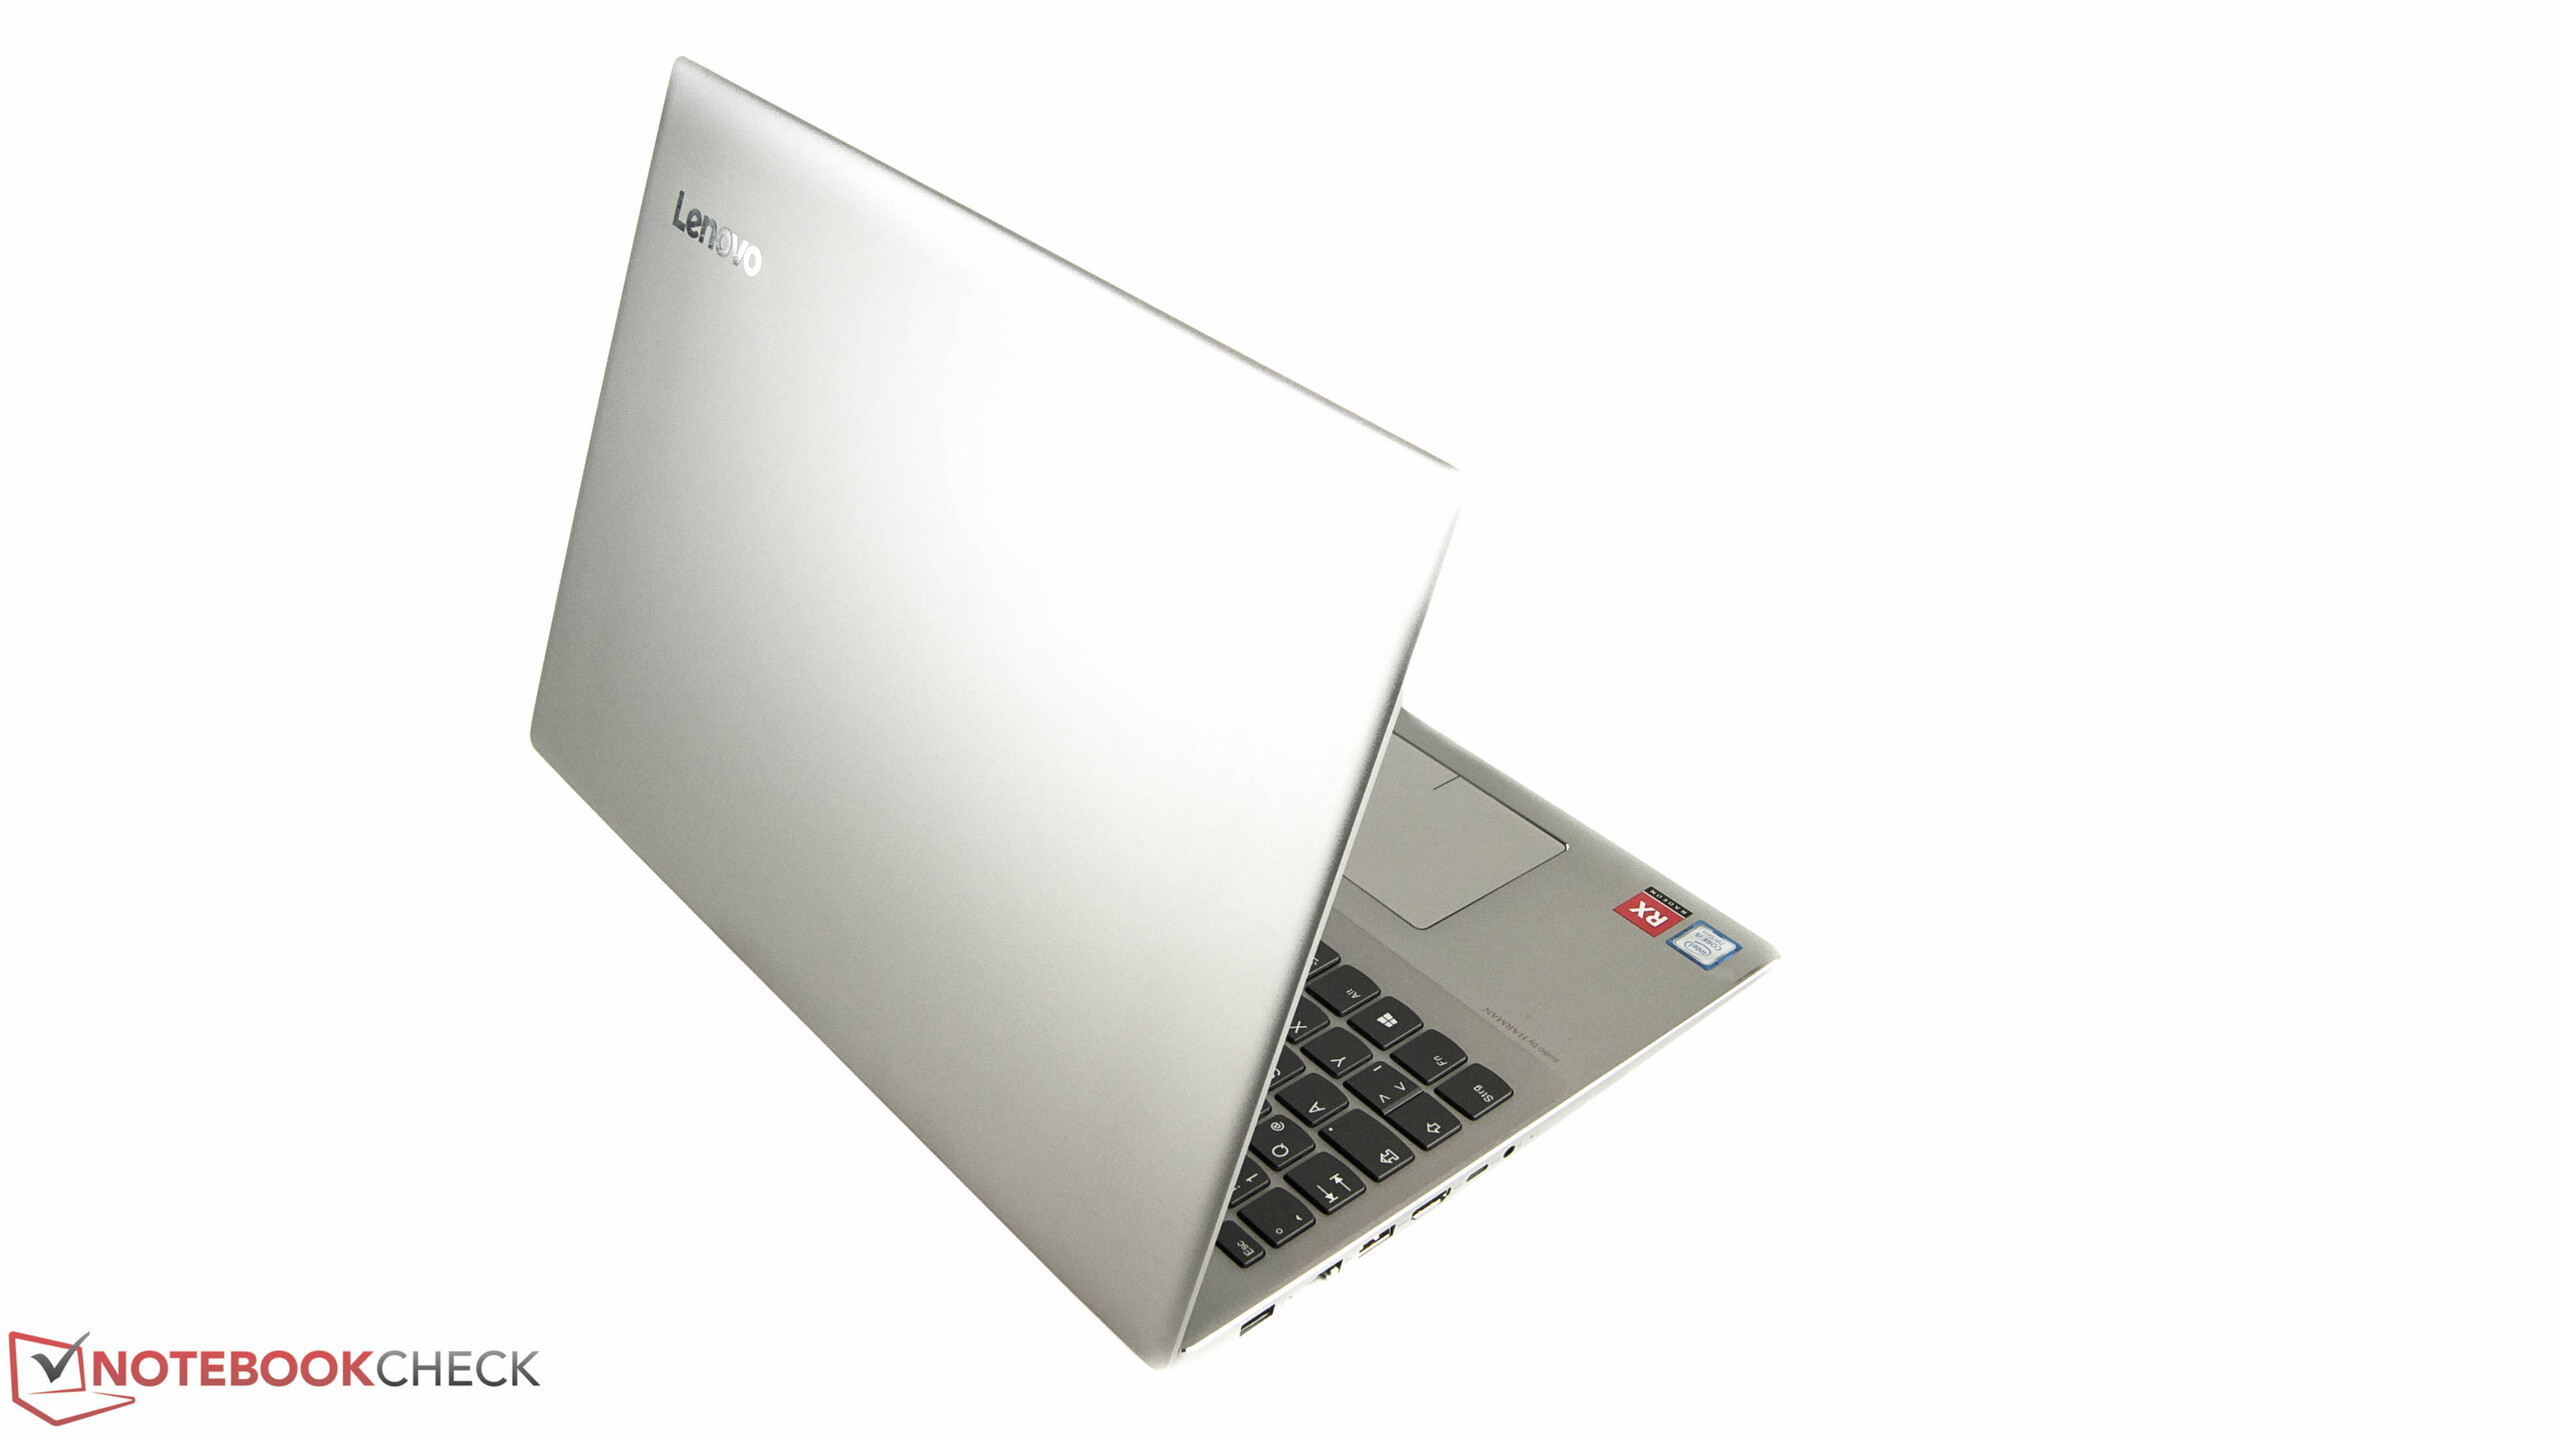
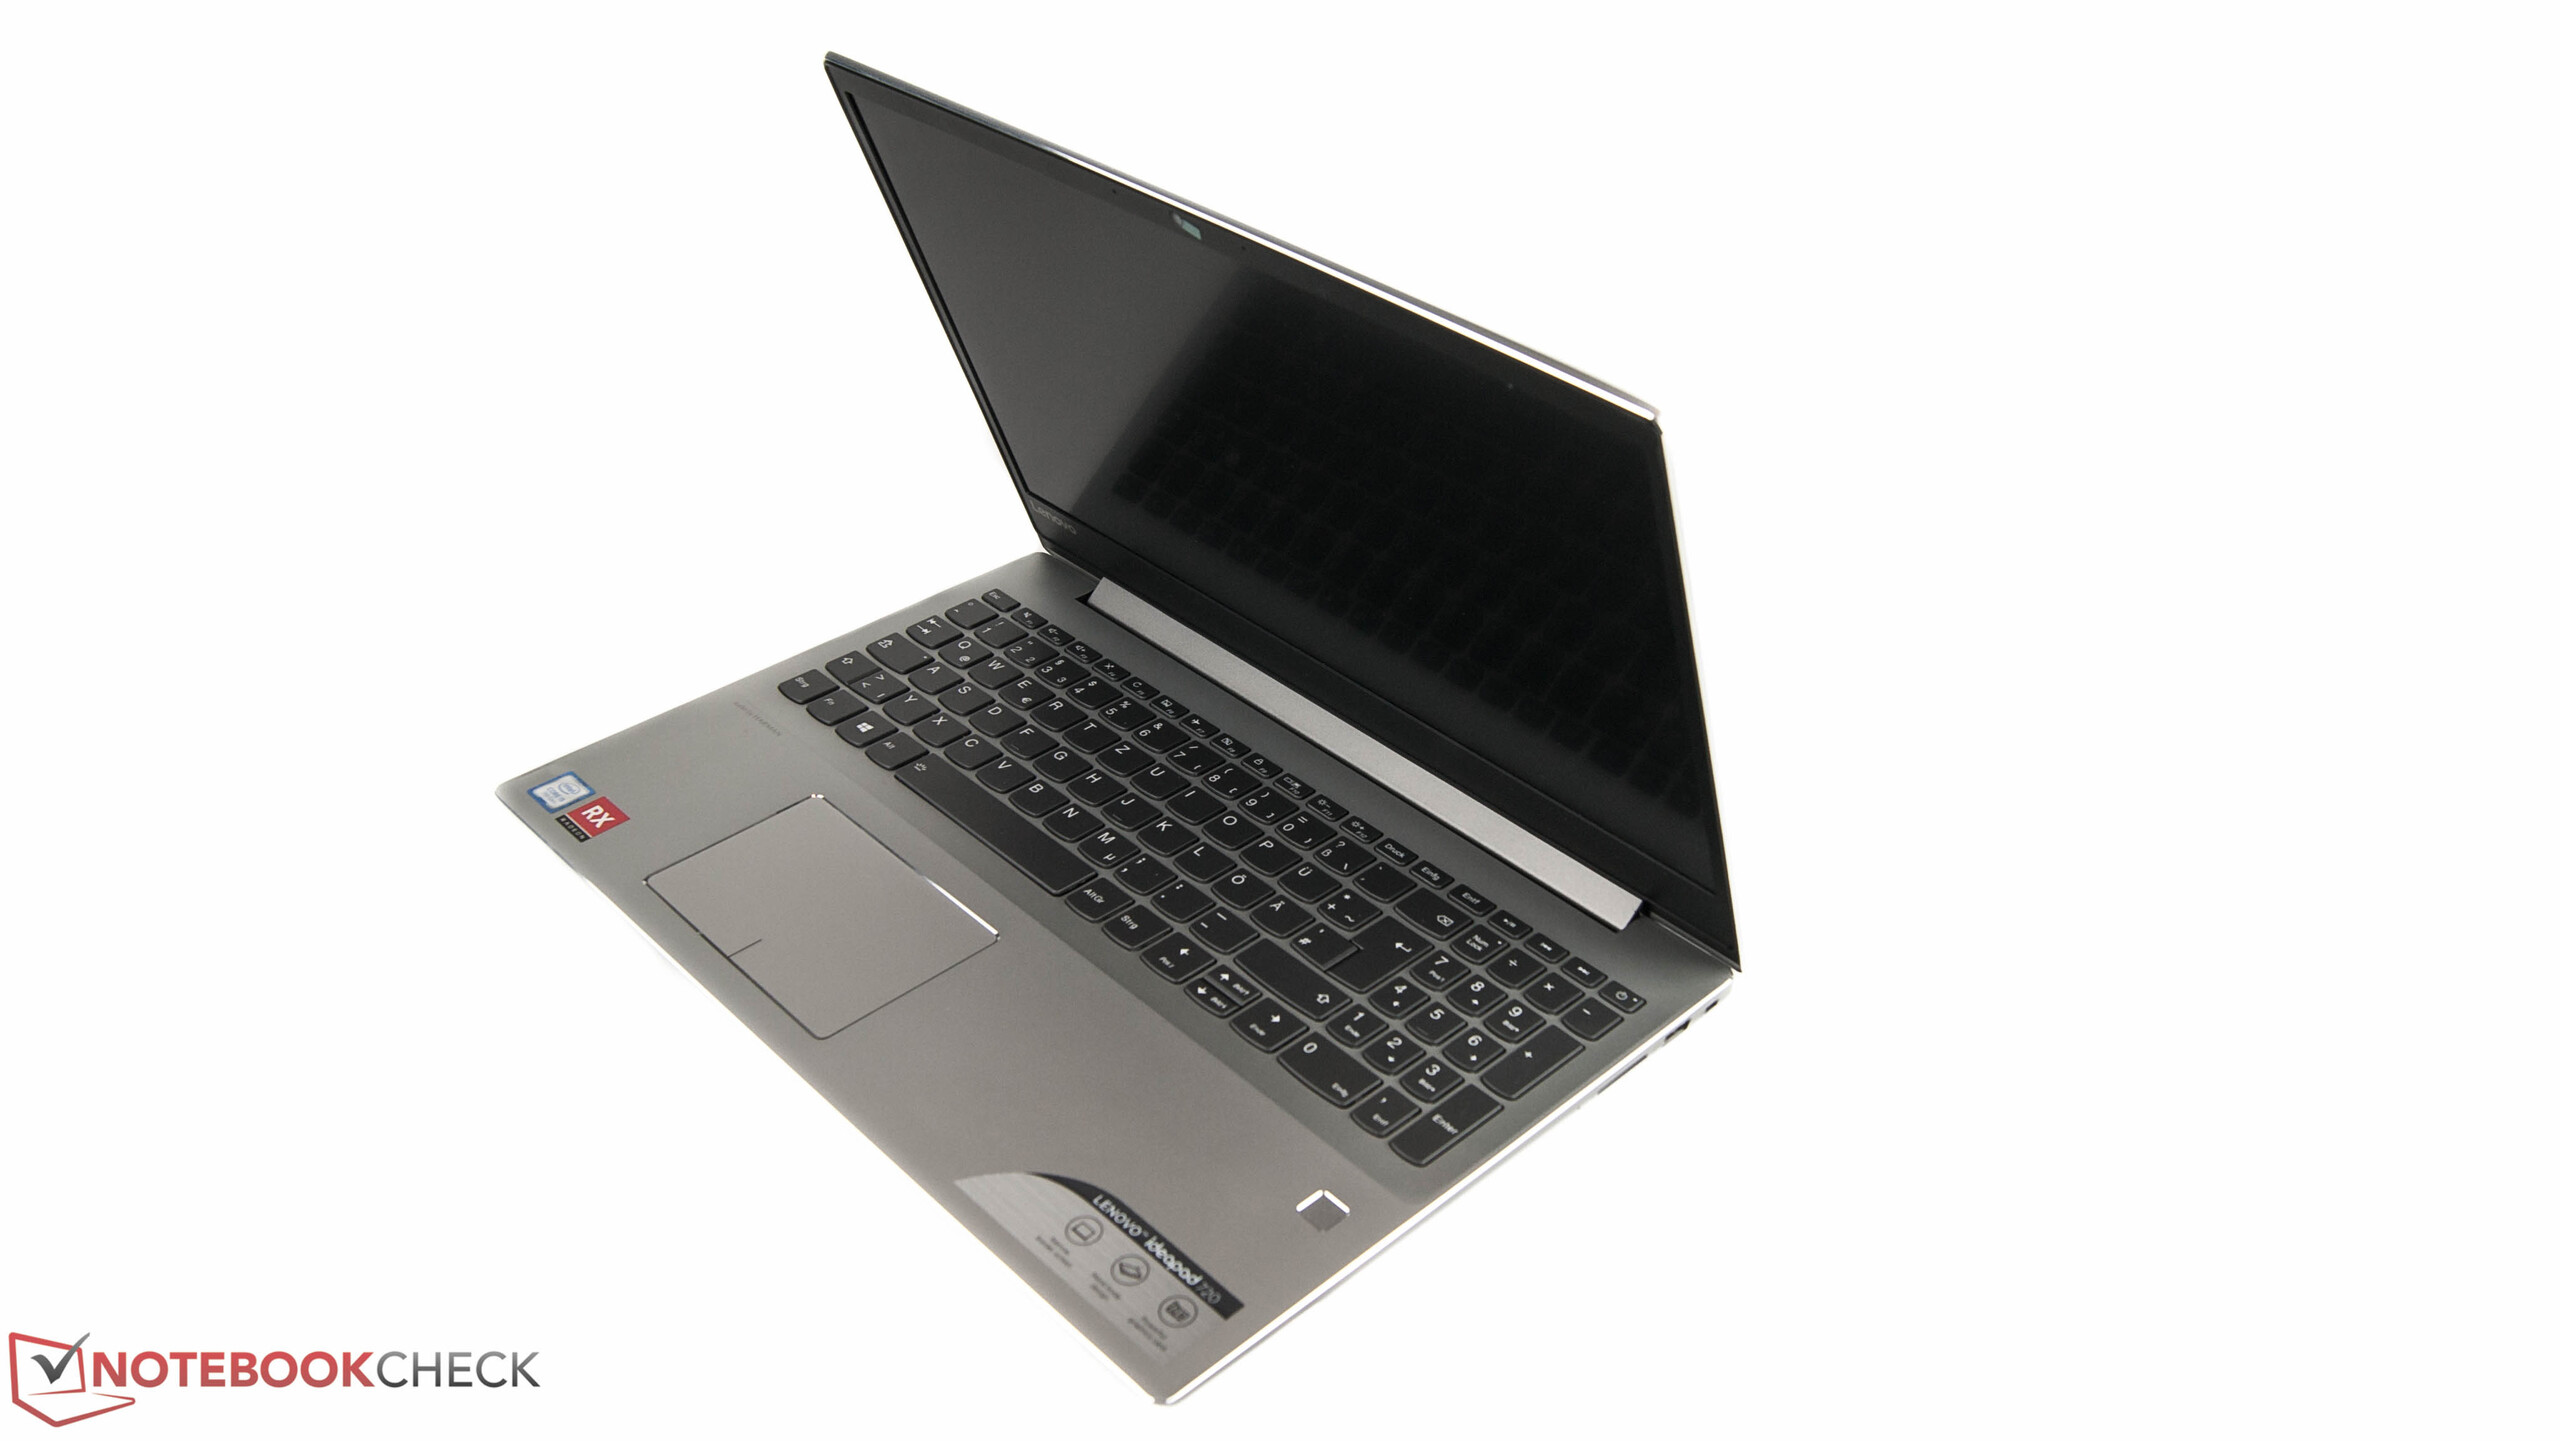
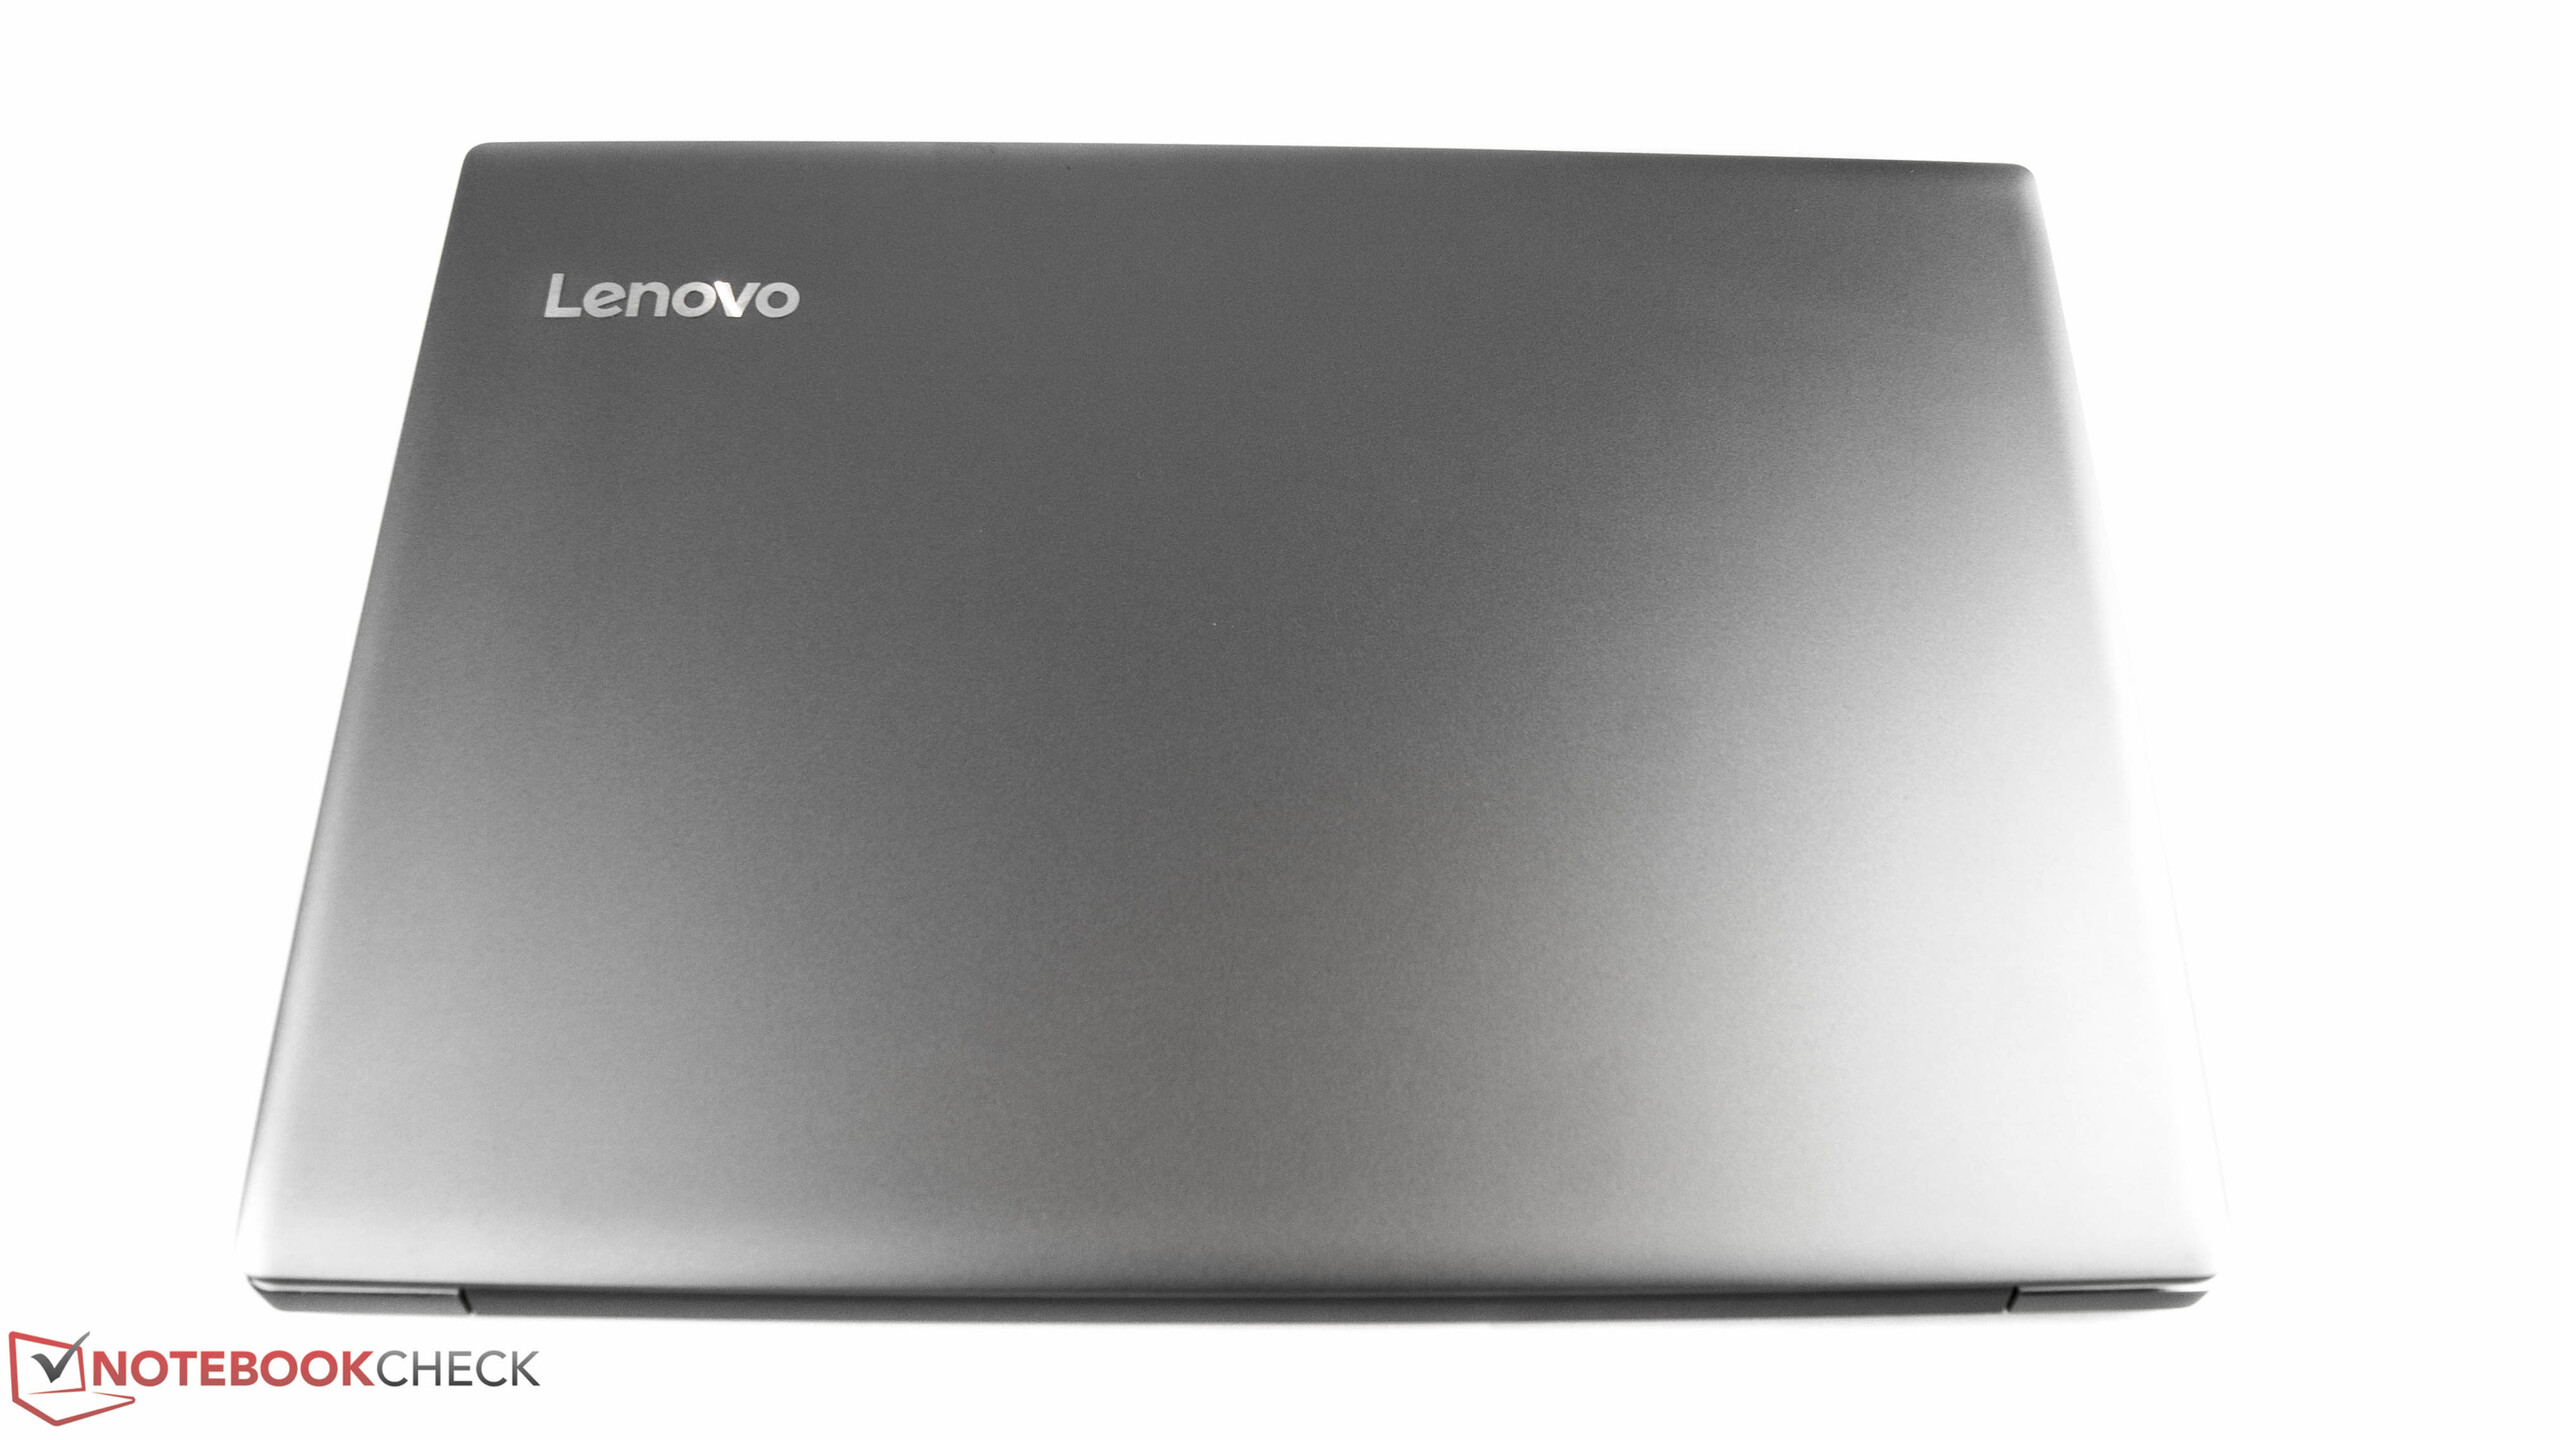
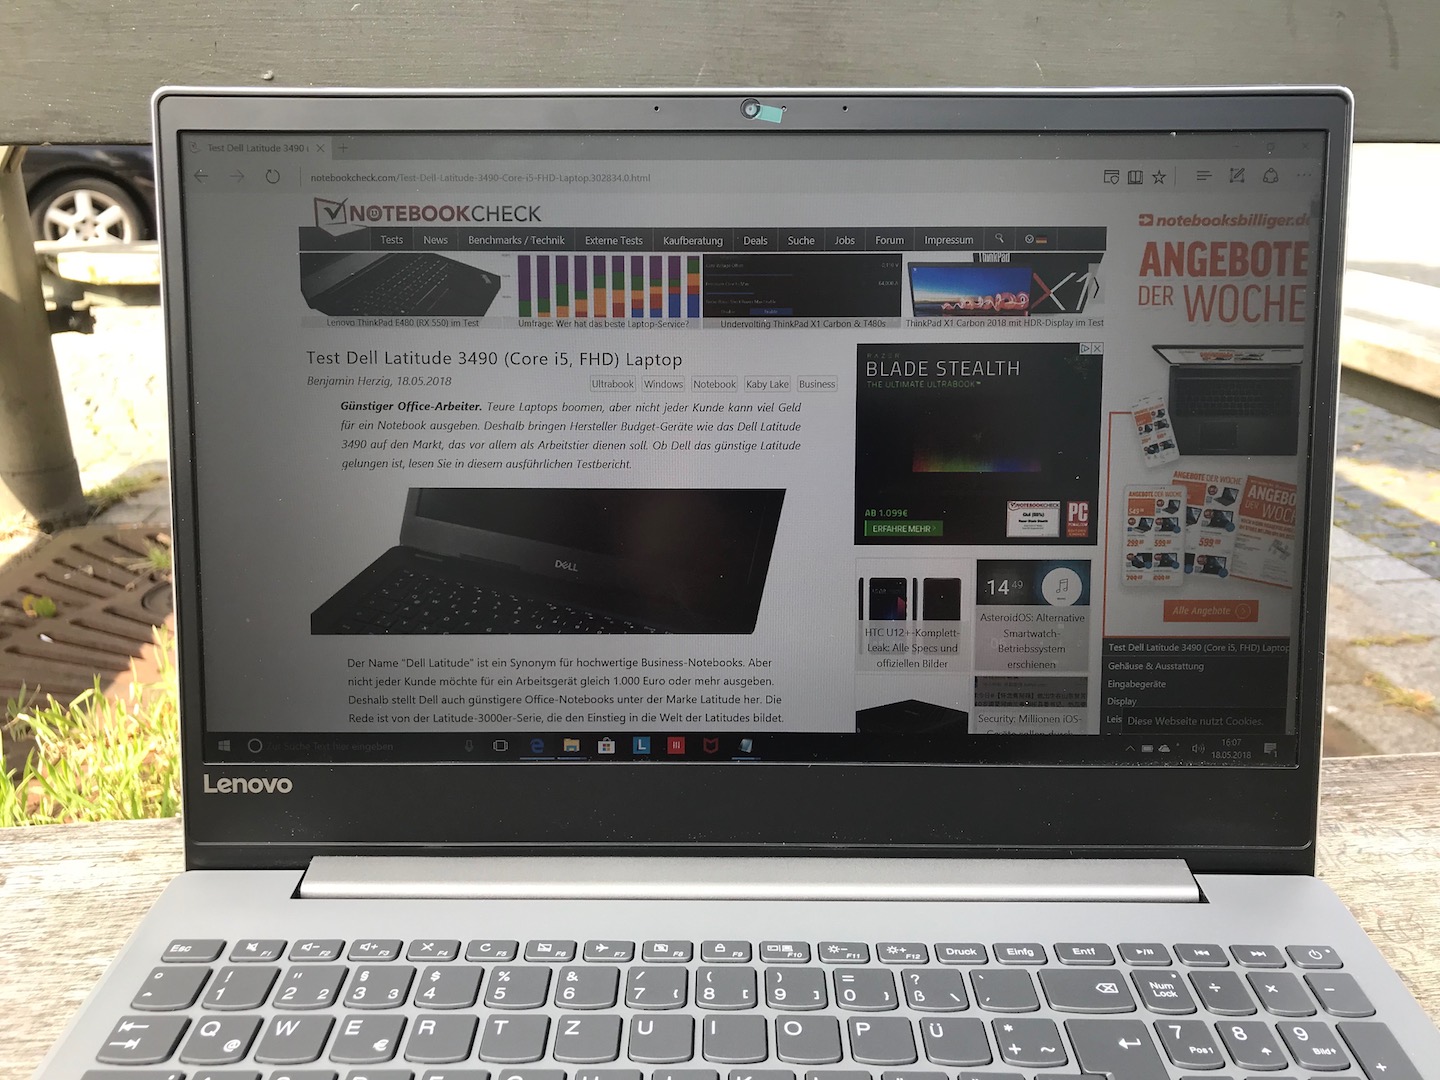
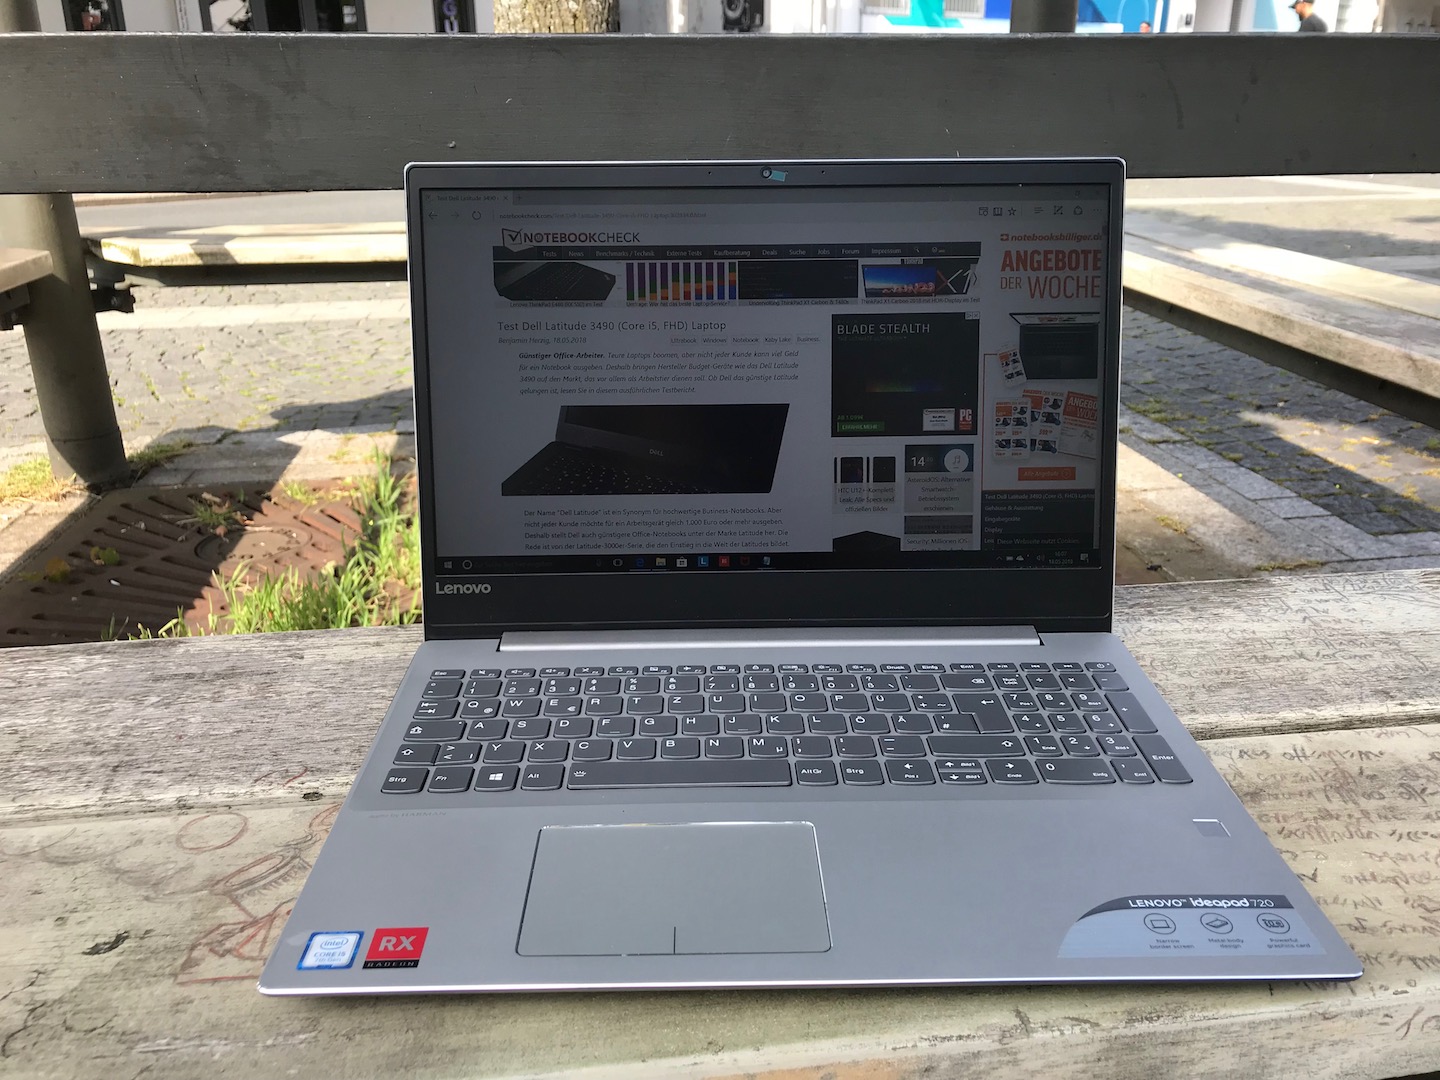
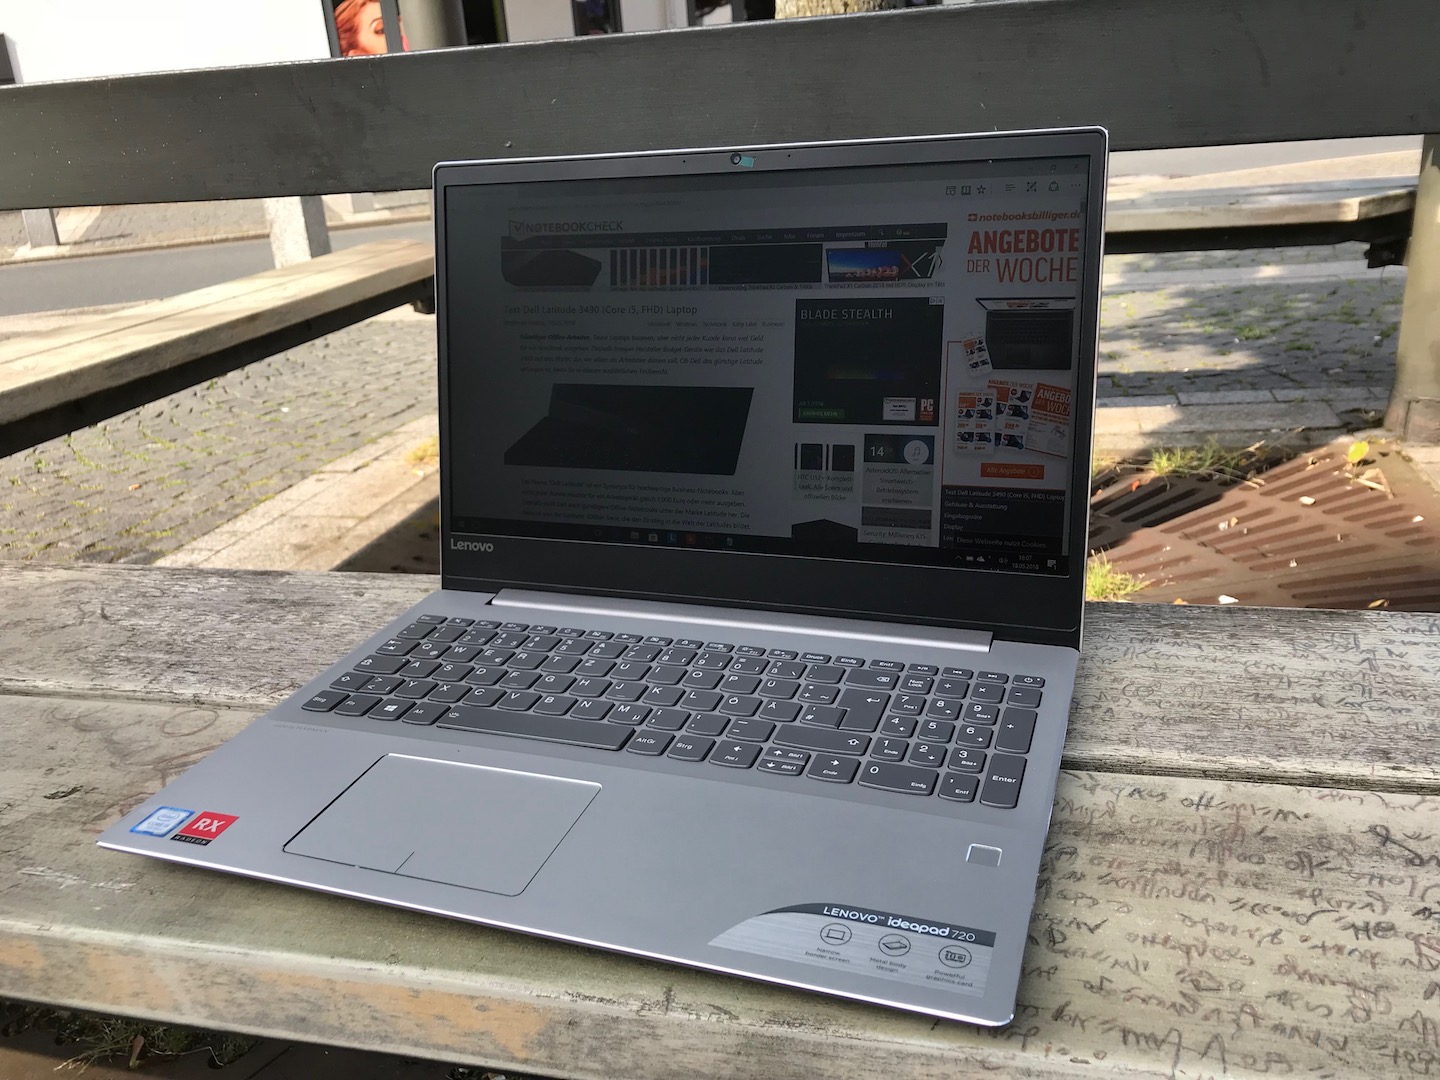
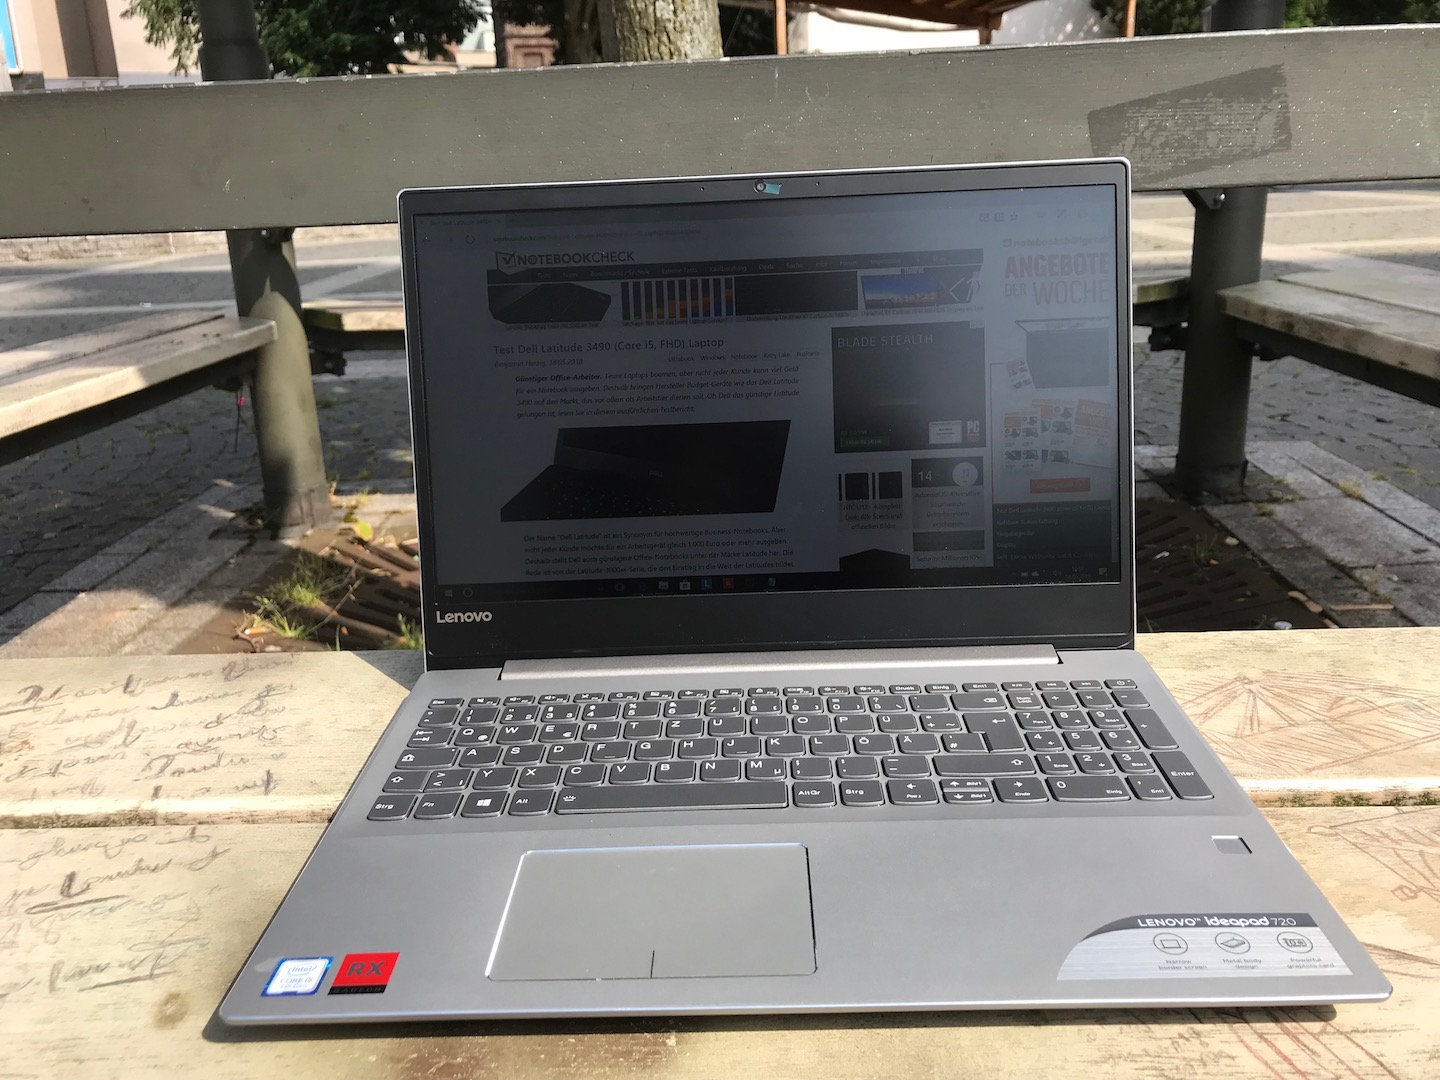
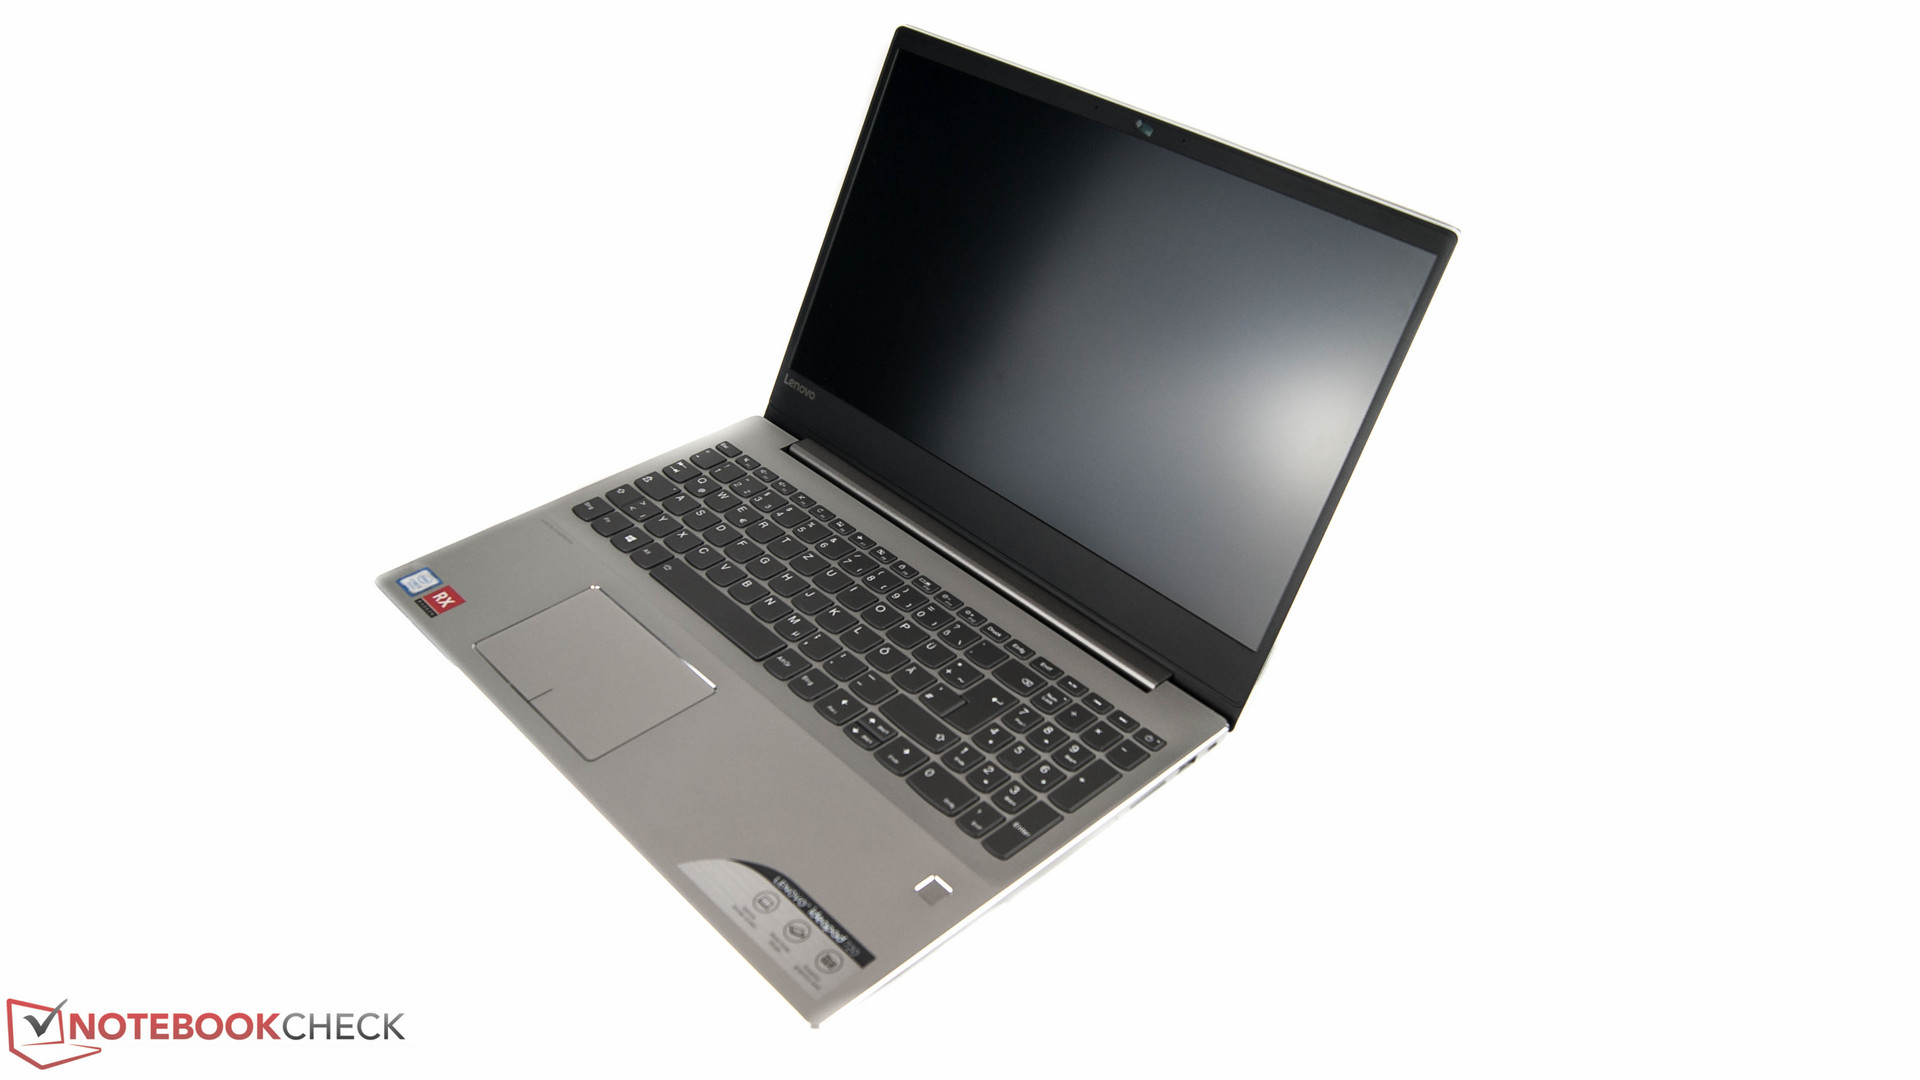
At first glance, it appears that Lenovo has spared neither costs nor effort in designing the IdeaPad 720. The case is made from high-quality aluminum with a mineral-gray finish that gives the device a robust well-crafted appearance. Flipping the device over highlights some economizing though. Lenovo has fitted the IdeaPad 720 with a plastic bottom case rather than machine one from the same aluminum that has been used elsewhere.
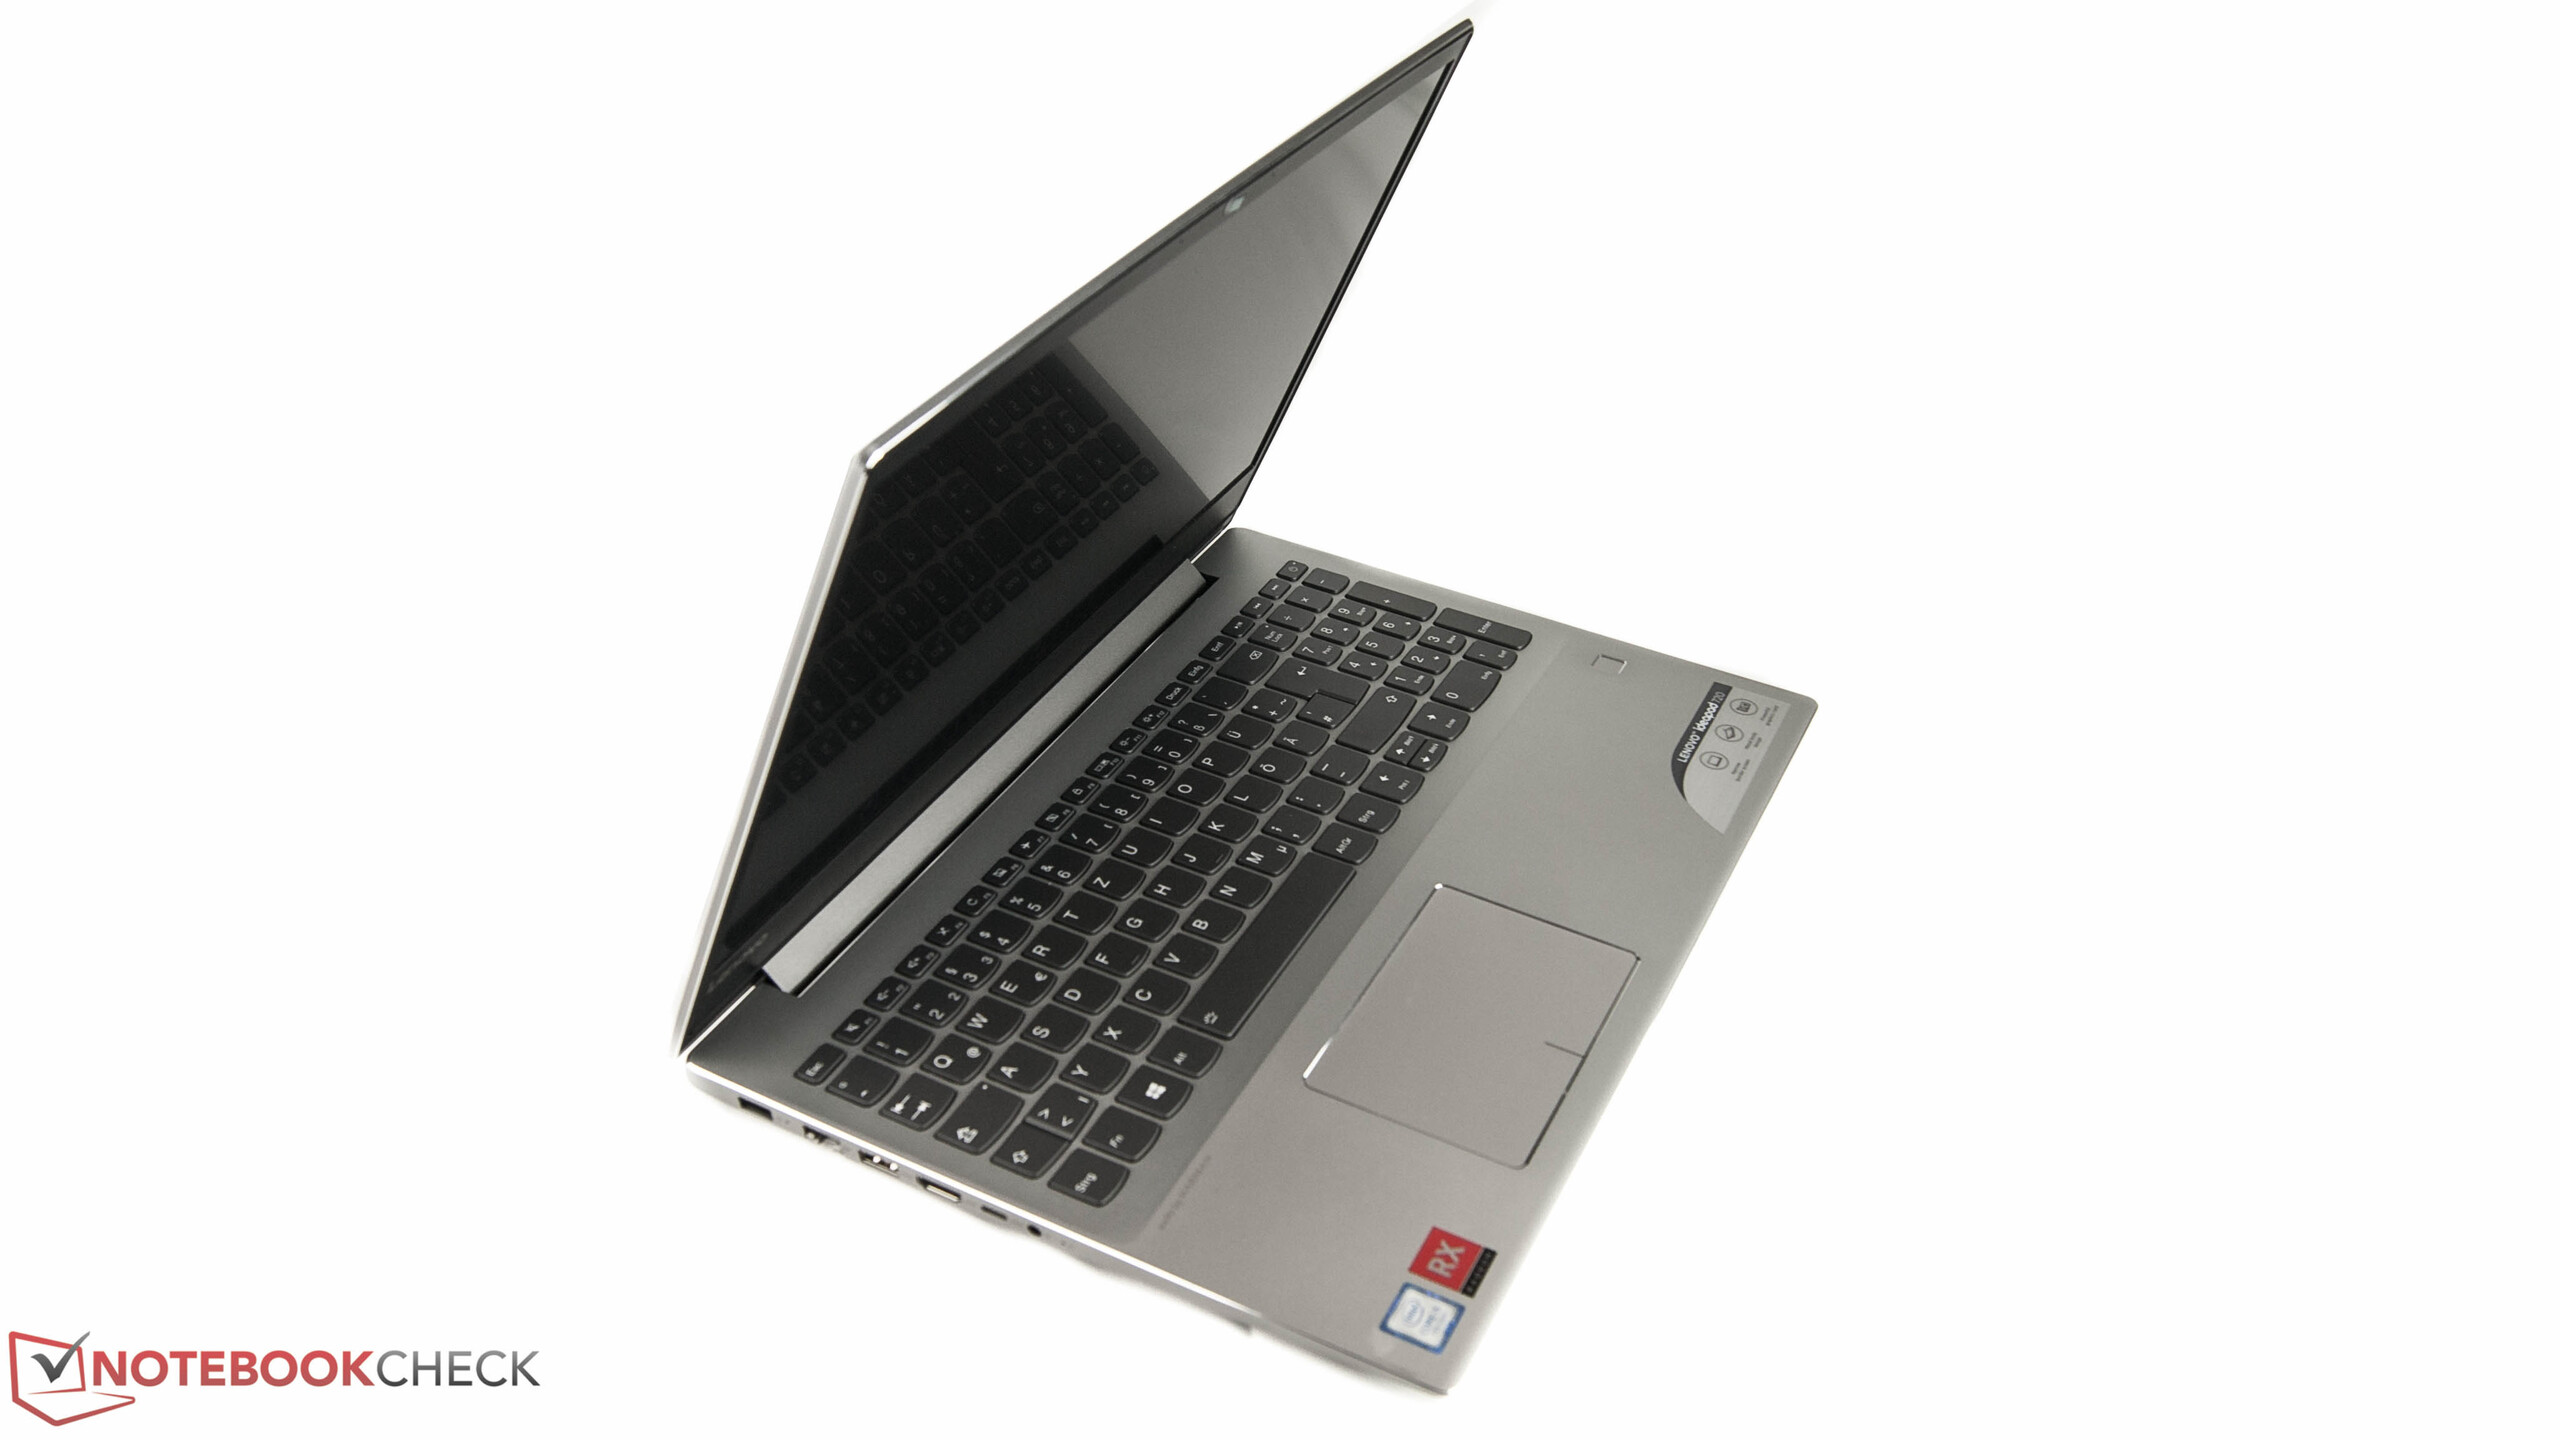
The impressive workmanship continues with the display hinge too. The hinge is relatively stiff, so much so that we had to use two hands to open our test device. A benefit of this stiffness is that the display opens with hardly any wobbling. Opening the display reveals chrome borders around the trackpad, fingerprint reader and the display hinge. We can only speculate that these are intended to give the IdeaPad 720 a more premium look as they bring no additional functionality.
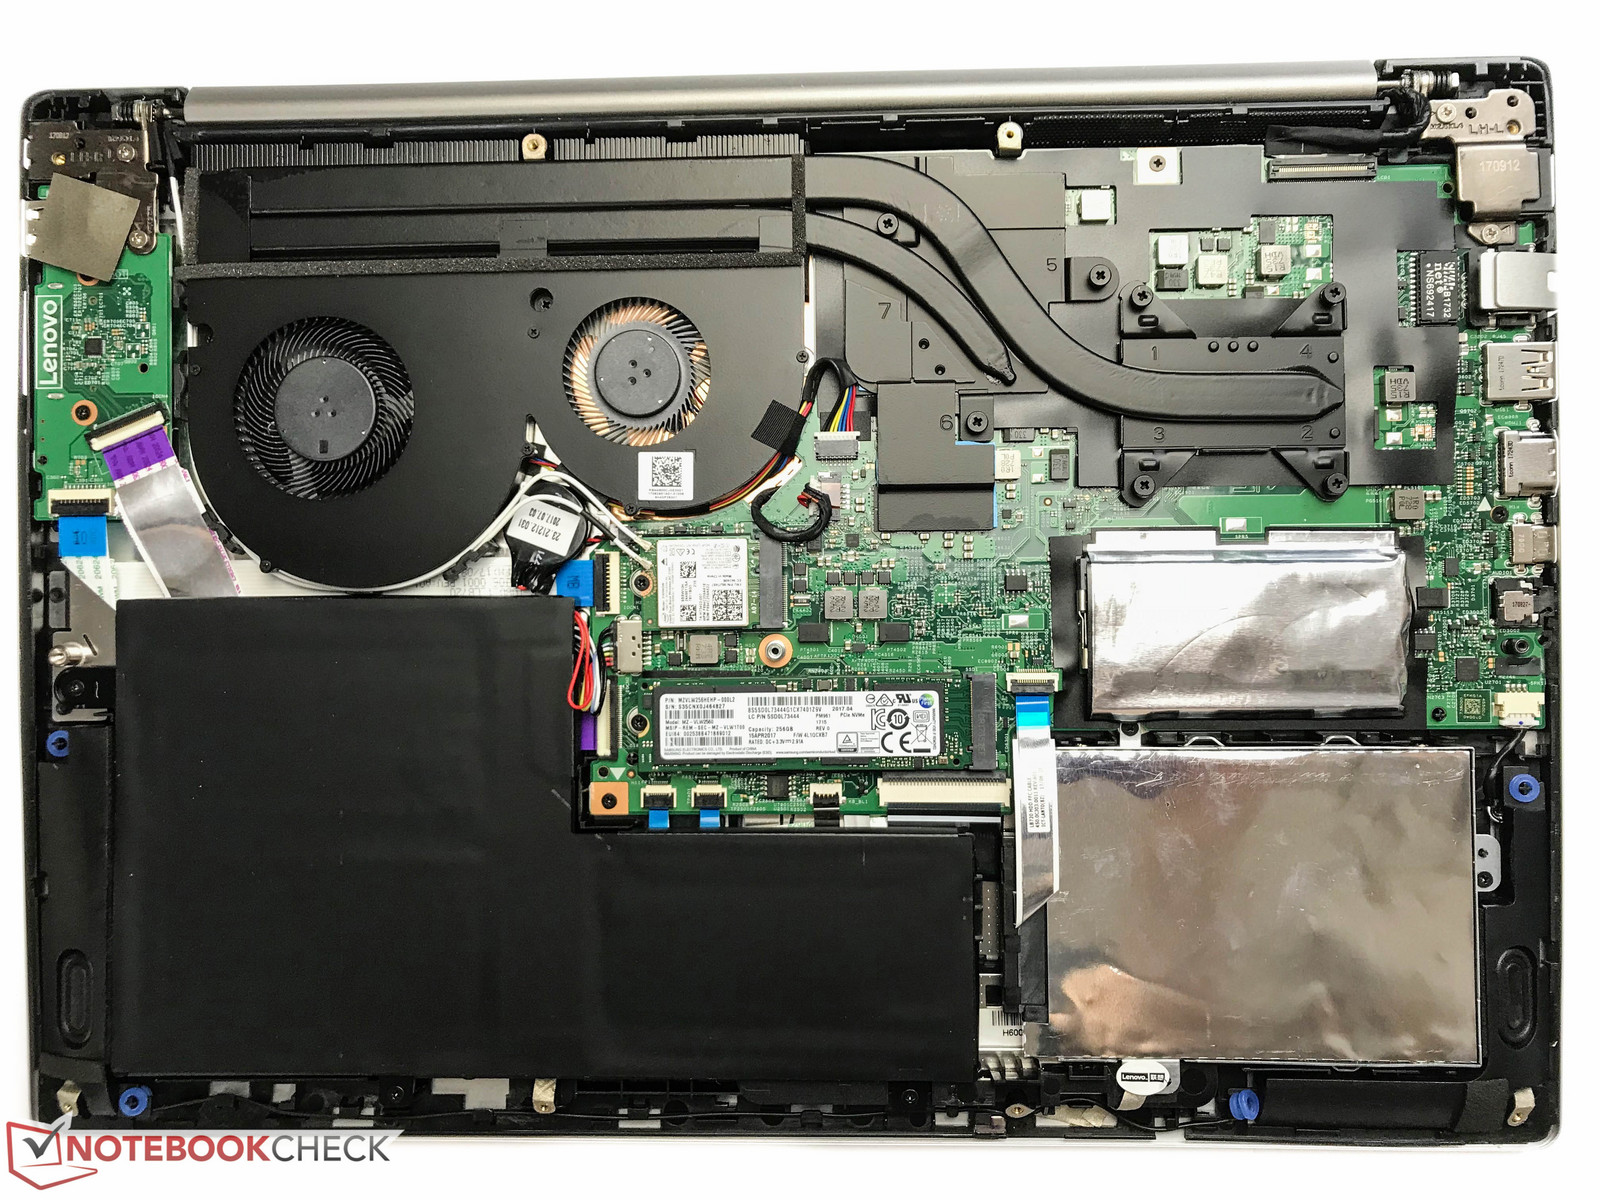
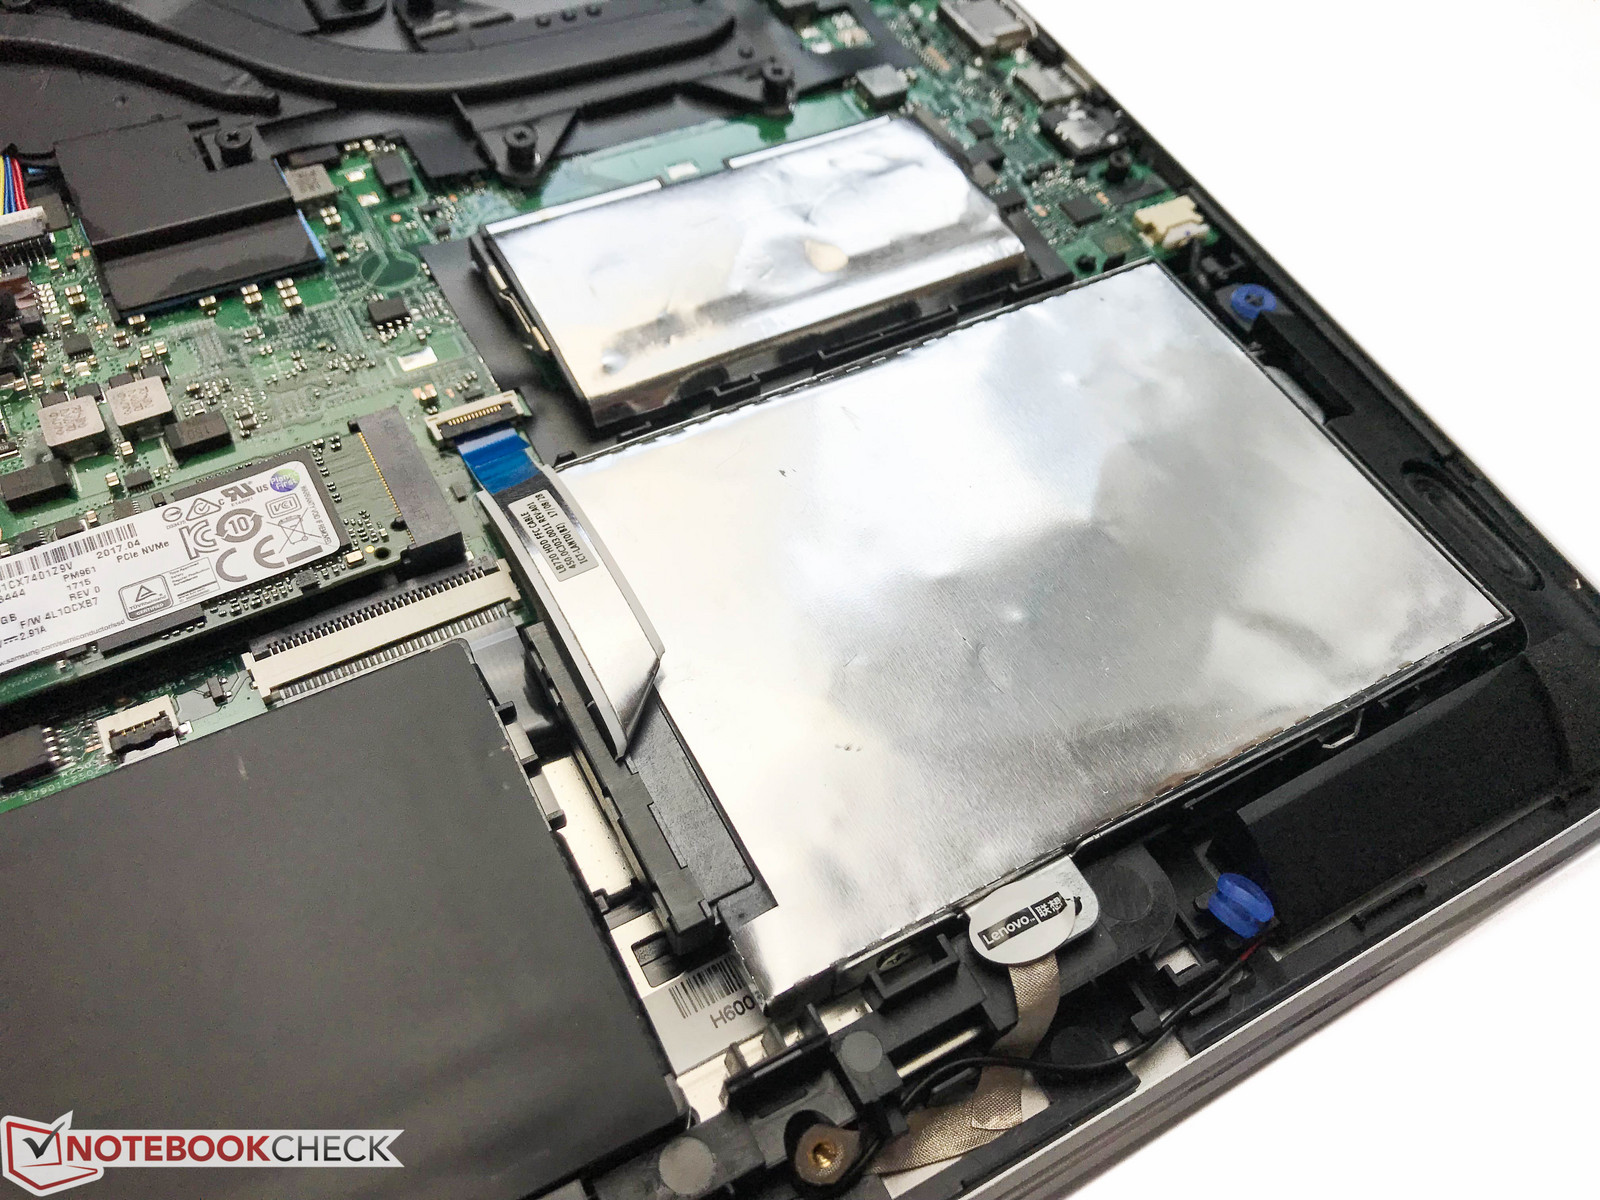
The battery is built-in. Accessing the battery and other components requires removing the plastic bottom case. There are no maintenance covers as we tend to see on business notebooks.
Overall, the IdeaPad 720 has a high-quality case. The Mi Notebook Pro i5 is the only comparable comparison device in this regard. By contrast, the Aspire 7 and Pavilion Power 5 have plastic cases, while the ZenBook UX3430UN only has an aluminum display lid.
The IdeaPad 720 measures 362.5 mm x 225 mm x 23 and weighs 2 kg. The relatively slim design and low weight make the device portable enough to be a welcome travel companion. The IdeaPad 720 is thicker than both the Mi Notebook Pro i5 and the ZenBook UX3430UN, with the former weighing the same as the IdeaPad 720. The Aspire 7 and the Pavilion Power 15 both weigh around 400 g more than the IdeaPad 720. Both devices have considerably larger footprints too.
Connectivity
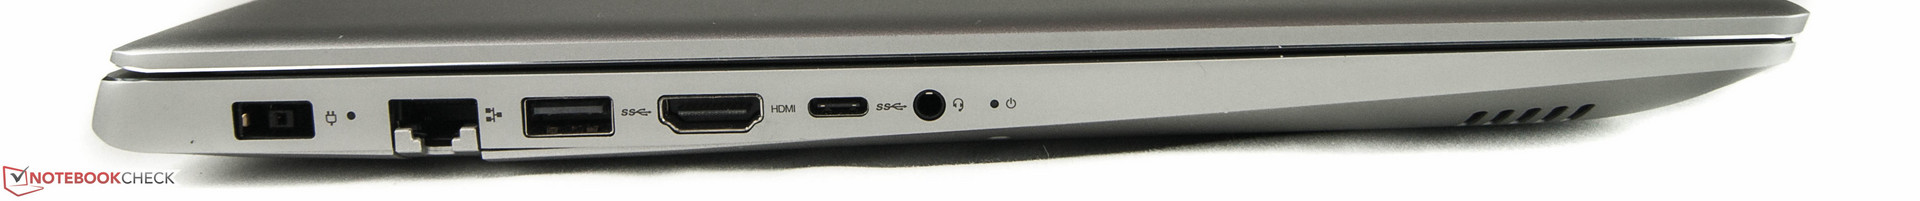
The IdeaPad 720 has enough ports for typical everyday needs. Lenovo has equipped the device with two USB 3.0 Type-A ports, one USB 3.0 Type-C port, an HDMI port, an SD card reader and an RJ45 Ethernet port among others.

SD Card Reader
The IdeaPad 720 has a full-sized SD card slot that we tested using our Toshiba Exceria Pro SDXC 64 GB UHS-II reference SD card in two scenarios. Firstly, we run AS SSD benchmark, in which our test device averaged 88 MB/s over three runs. This score is 27% better than the average performance of the multimedia notebooks that we have tested at the time of writing. The IdeaPad 720 has better SD card performance in AS SSD benchmark than all our comparison devices except for the Pavilion Power 15, which scored 50% higher than the IdeaPad 720. Our second SD card test is more practical. We copied a series of JPEG files that were approximately 5 MB each and measured the transmission speed. Our test device scored 80 MB/s in this test, which is 55% faster than the average performance of the multimedia laptops that we have tested and faster than all our comparison devices too.
| SD Card Reader | |
| average JPG Copy Test (av. of 3 runs) | |
| Average of class Multimedia (23 - 531, n=43, last 2 years) | |
| Lenovo IdeaPad 720-15IKB (Toshiba Exceria Pro SDXC 64 GB UHS-II) | |
| Acer Aspire 7 A715-71G-53TU (Toshiba Exceria Pro SDXC 64 GB UHS-II) | |
| HP Pavilion Power 15t-cb2000 (Toshiba Exceria Pro SDXC 64 GB UHS-II) | |
| Asus Zenbook UX430UN (Toshiba Exceria Pro SDXC 64 GB UHS-II) | |
| Acer Extensa 2540-580K (Toshiba Exceria Pro SDXC 64 GB UHS-II) | |
| Dell Vostro 15 3568 (Toshiba Exceria Pro SDXC 64 GB UHS-II) | |
| Xiaomi Mi Notebook Pro i5 | |
| maximum AS SSD Seq Read Test (1GB) | |
| Average of class Multimedia (27.9 - 1455, n=42, last 2 years) | |
| HP Pavilion Power 15t-cb2000 (Toshiba Exceria Pro SDXC 64 GB UHS-II) | |
| Lenovo IdeaPad 720-15IKB (Toshiba Exceria Pro SDXC 64 GB UHS-II) | |
| Acer Aspire 7 A715-71G-53TU (Toshiba Exceria Pro SDXC 64 GB UHS-II) | |
| Asus Zenbook UX430UN (Toshiba Exceria Pro SDXC 64 GB UHS-II) | |
| Acer Extensa 2540-580K (Toshiba Exceria Pro SDXC 64 GB UHS-II) | |
| Dell Vostro 15 3568 (Toshiba Exceria Pro SDXC 64 GB UHS-II) | |
| Xiaomi Mi Notebook Pro i5 | |
Communication
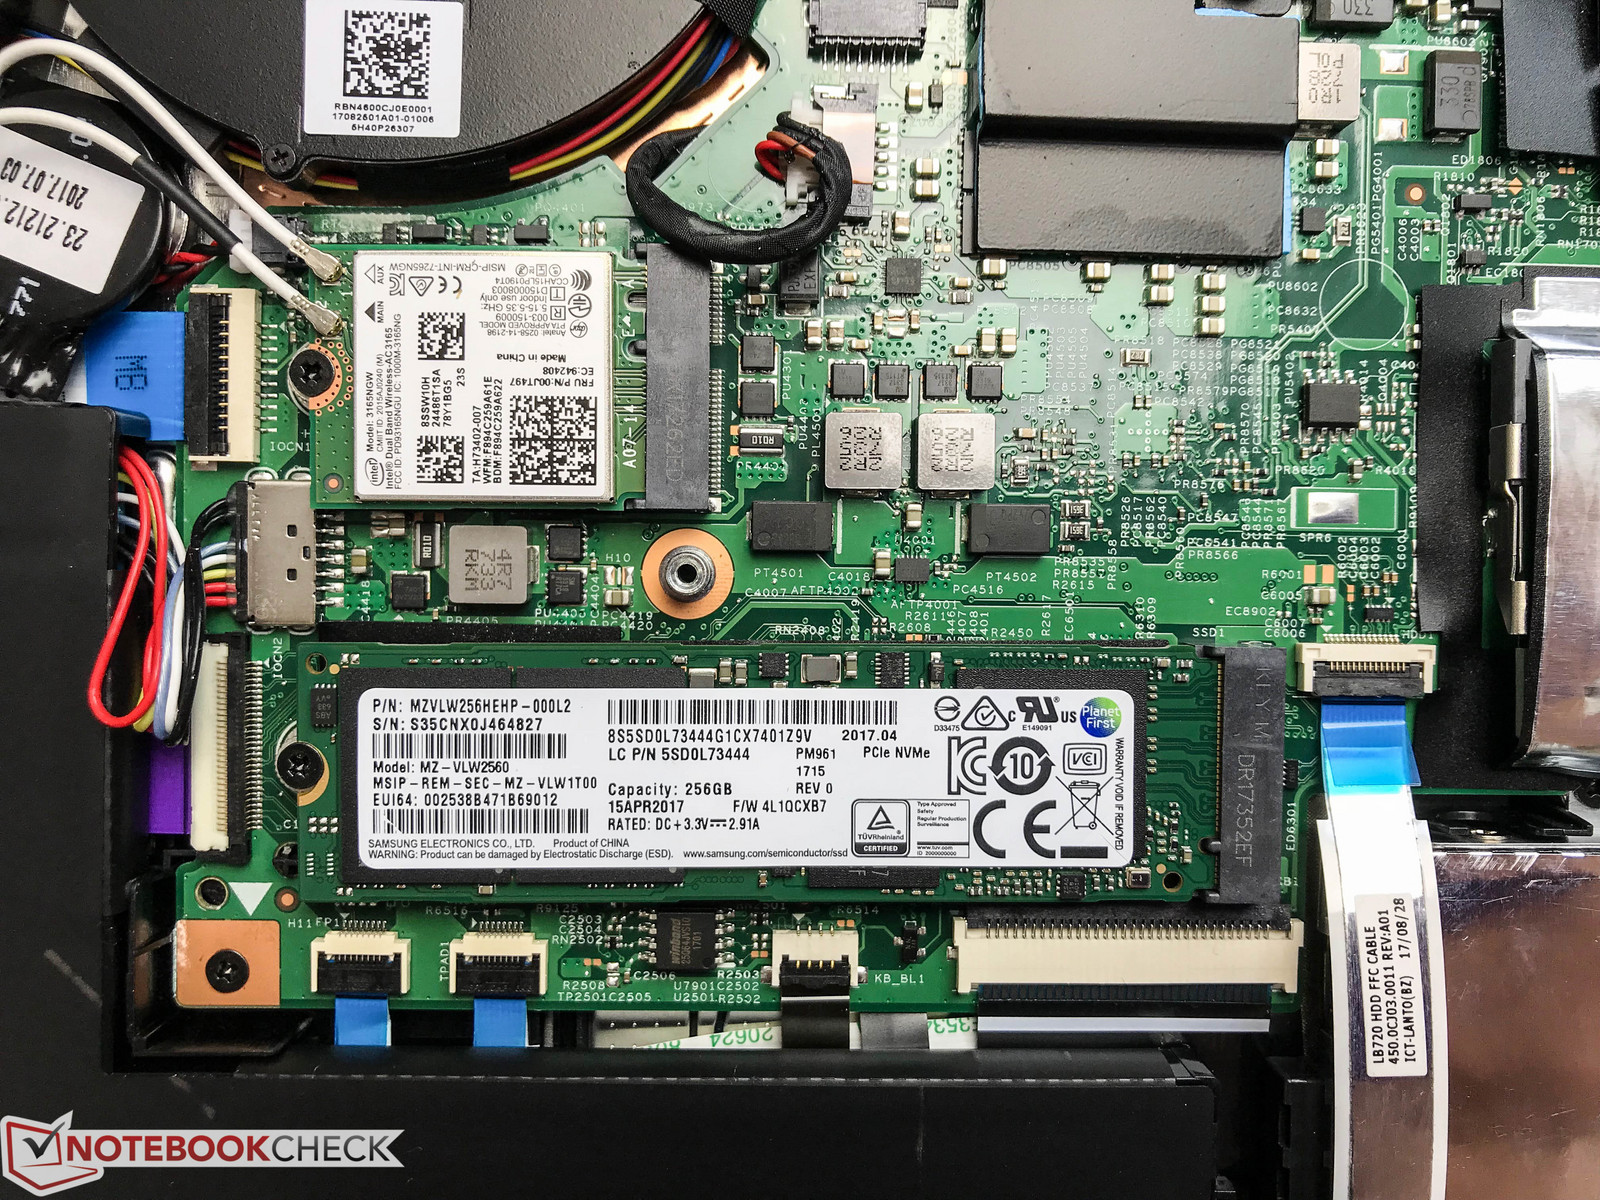
The IdeaPad 720 has an Intel Dual Band Wireless AC-3165 module that has 2X2 MIMO antennas and Bluetooth 4.1 support. This is a frequently used Wi-Fi modem, but for some reason, our test device performed notably poorly in iperf3 Client Wi-Fi tests. Our test device achieved a meager 174 Mb/s receive speed and a shockingly poor 48 Mb/s transmission speed. All our comparison devices are more than 200% quicker than our test device in terms of receive speeds, a gap which increases to 800% in most cases for transmission speeds.
These shockingly low speeds were not a one-off either as we were able to replicate the results at different times. We have seen similar speeds with other laptops, albeit rarely. Perhaps a driver update would help, but we cannot rule out a hardware defect as these Wi-Fi speeds are far too low for an Intel AC-3165.
Alternatively, the Ethernet port theoretically supports up to 1,000 Mb/s transfer speeds.
The IdeaPad 720 has an HD 720p webcam for which we cannot find any positive words. The colors and details are distorted while image noise increases dramatically in darker environments.


Accessories
The IdeaPad 720 comes with a 90 W power supply, some security information and a card detailing Lenovo’s technical support telephone number. Lenovo offers no accessories specific to the IdeaPad 720 on its website.
Maintenance
Accessing the internal hardware requires removing 11 screws from the bottom case and carefully prying the plastic bottom case from the rest of the device. We would recommend using specialist tools for this like a plastic spudger as the bottom case is also secured to the rest of the device with plastic fasteners, which could break if you use too much force. Removing the bottom case gives you access to the internal components including the internal storage, the battery and the fans among others.
Warranty
The IdeaPad 720 has two years manufacturer’s warranty, which can be extended to three years for 27 Euros (~$31). Lenovo also offers accidental cover for 56 Euros (~$65) which covers against drops and liquid damage. Please see our Guarantees, Return policies and Warranties FAQ for country-specific information.
Input Devices
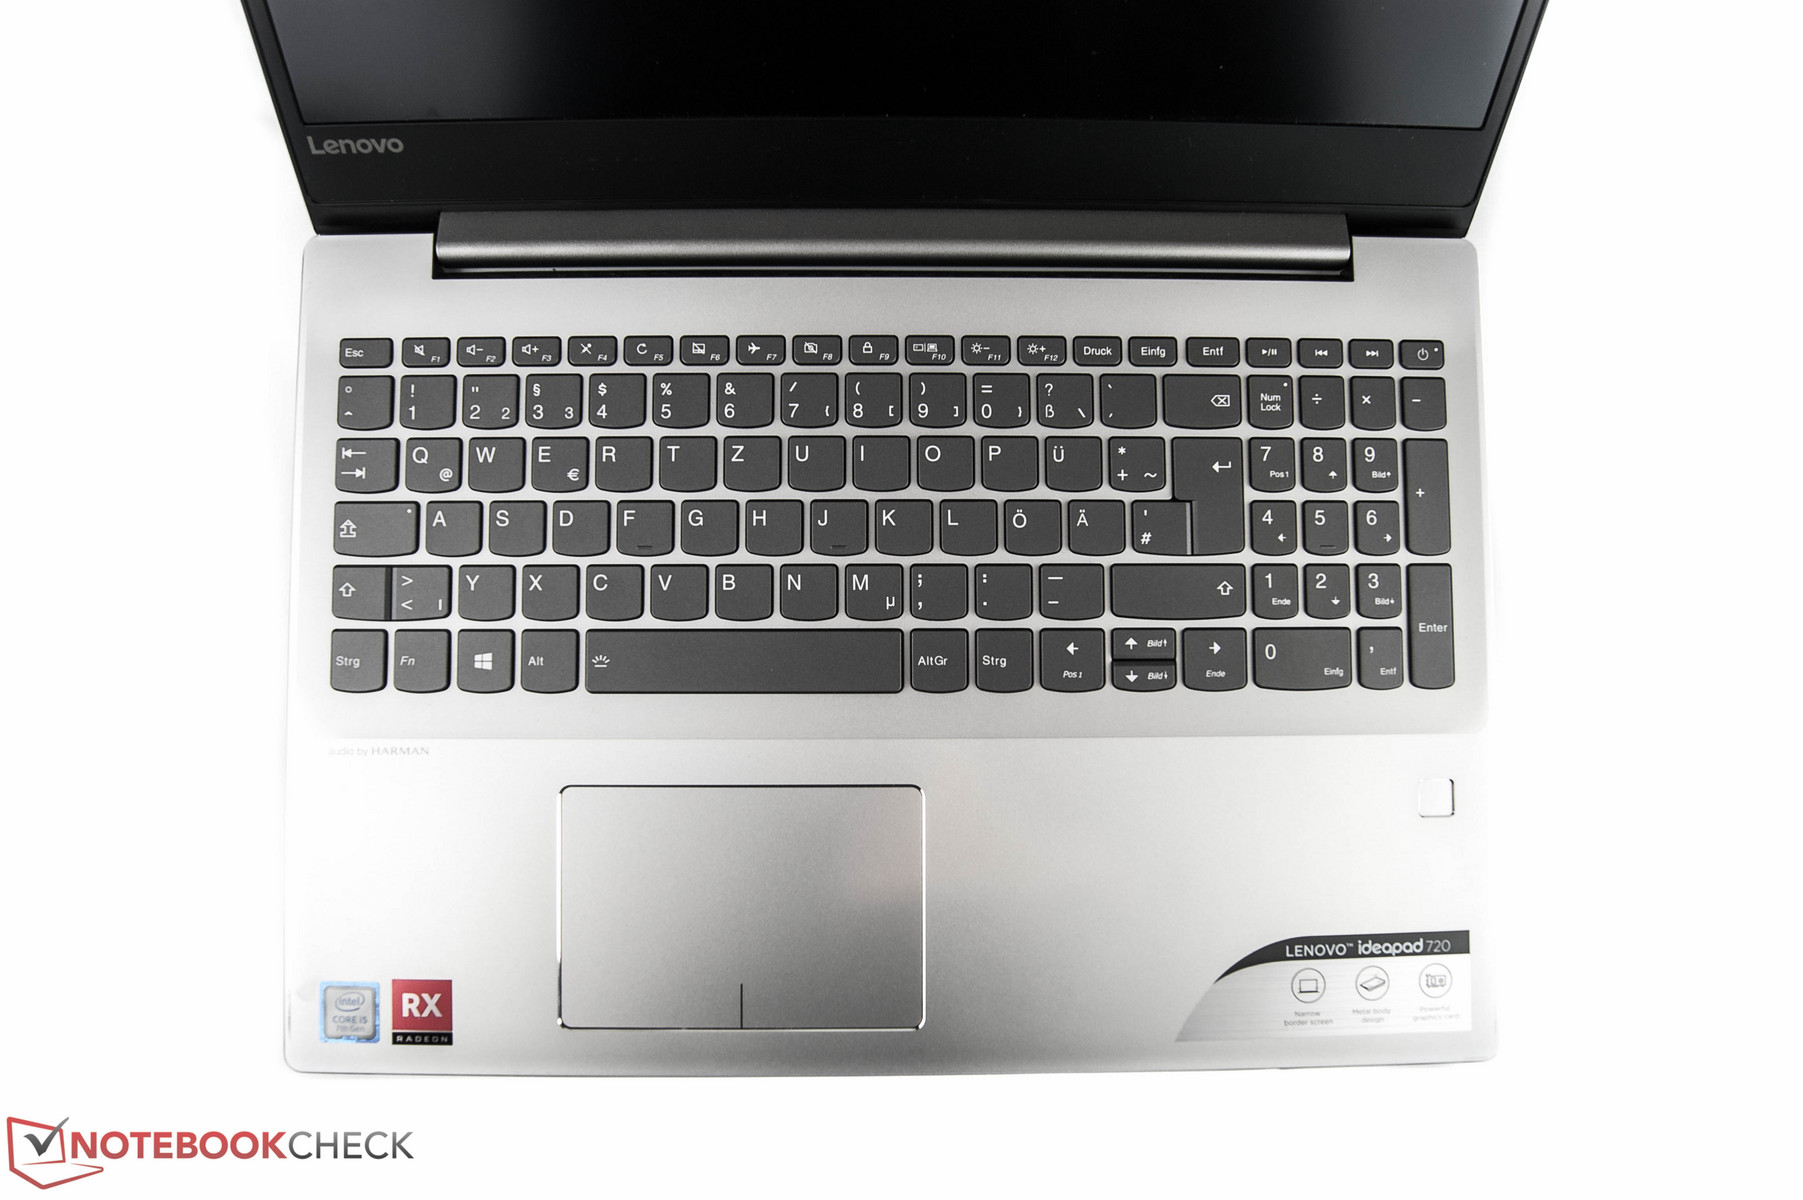
Keyboard
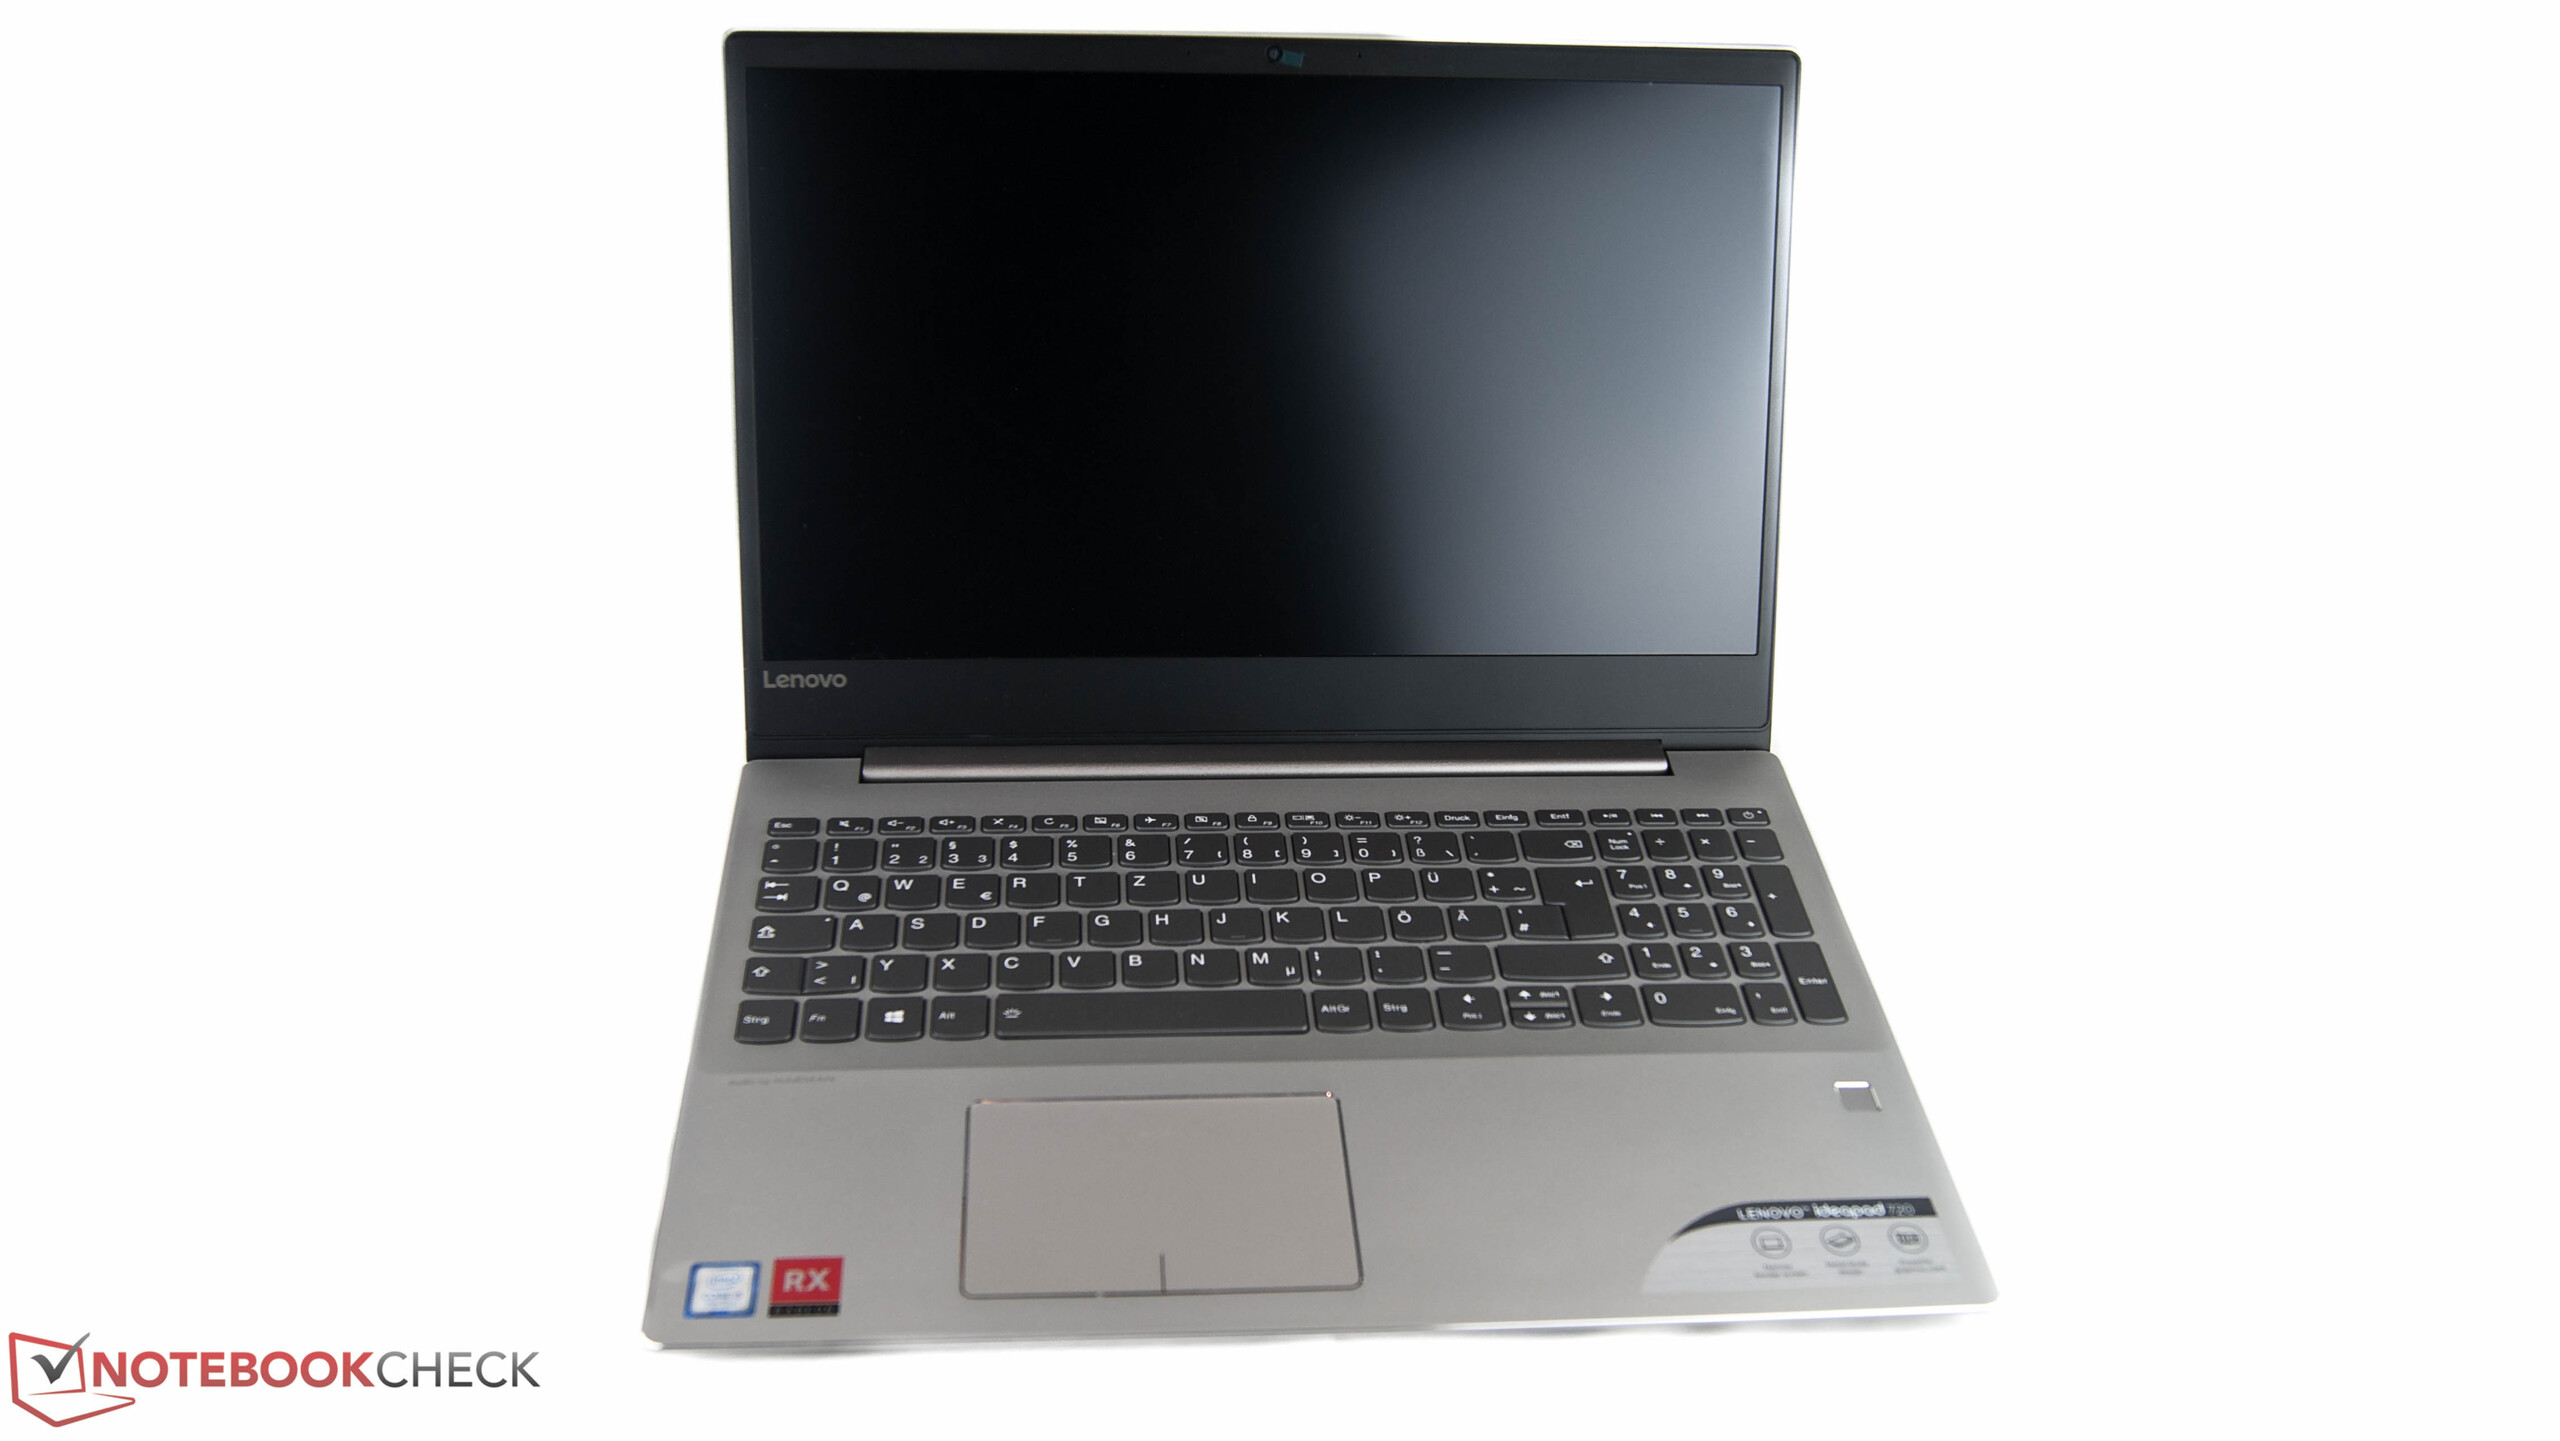
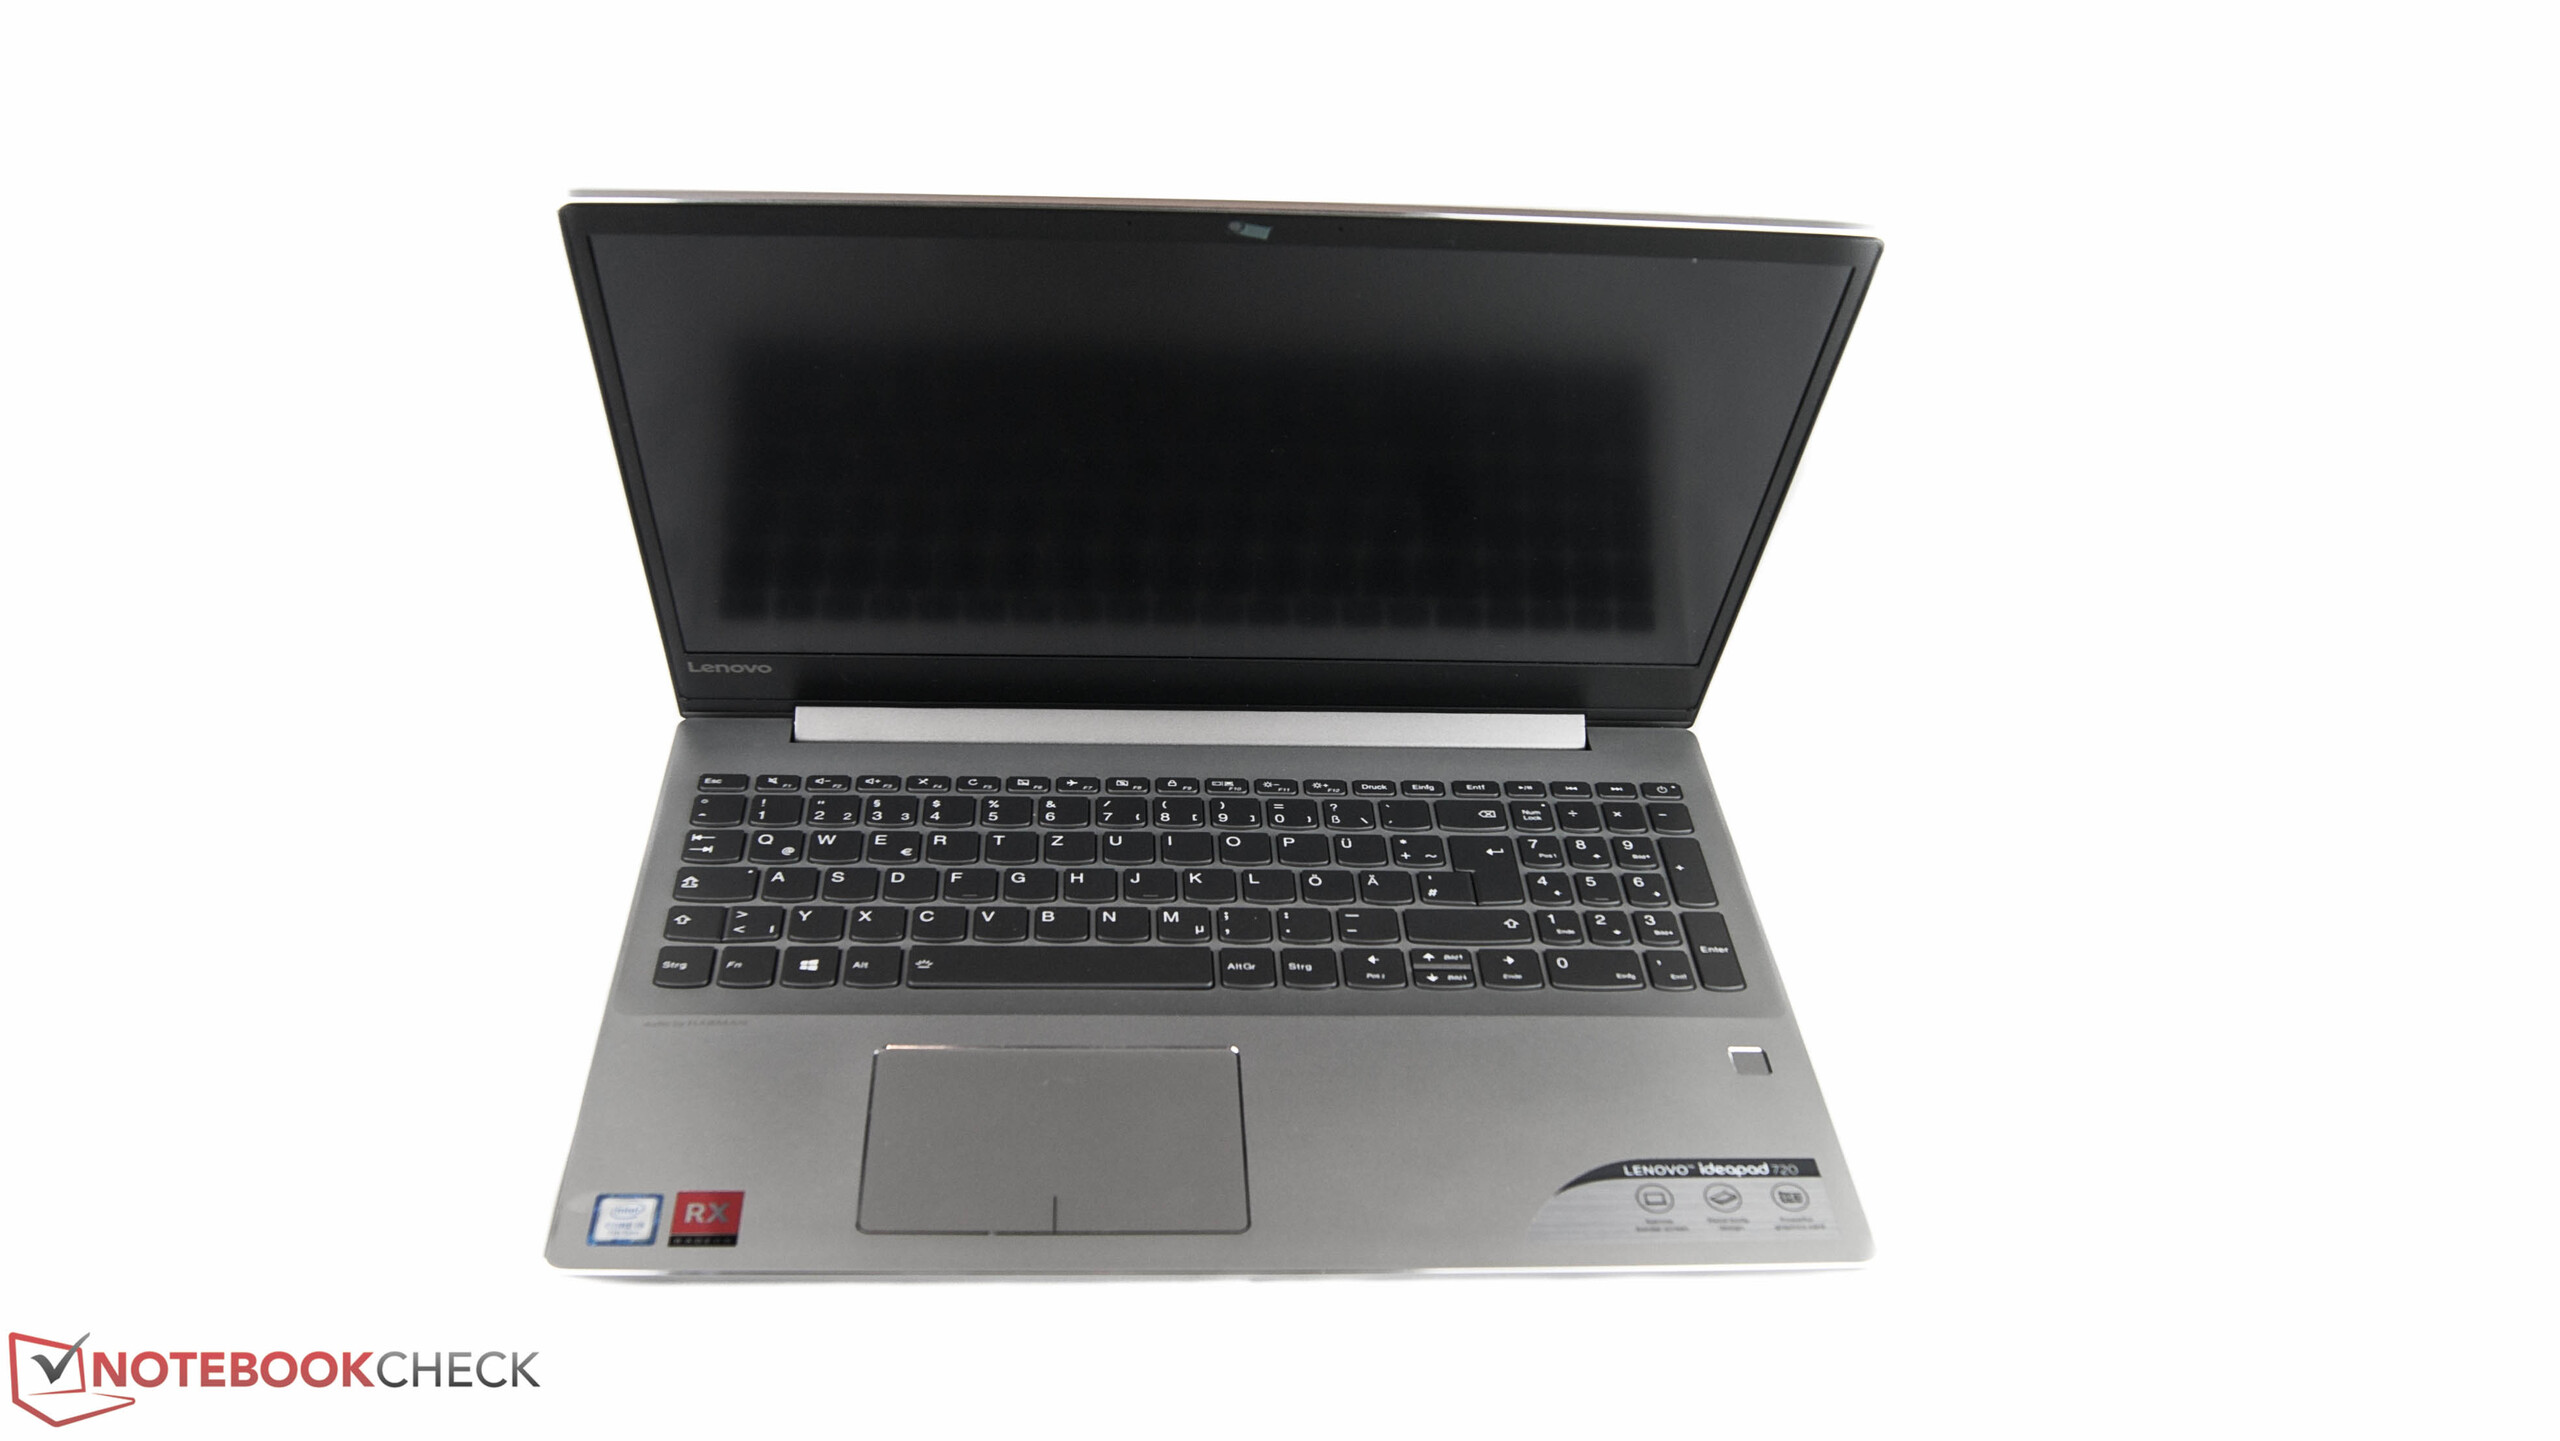
The IdeaPad 720 has a full-sized chiclet keyboard and numpad about which we can only speak positively. The keys are a decent size, with the numpad keys being slightly narrower than the rest. The overall writing experience is pleasant thanks to each key’s crisp and precise pressure point. The stroke is a bit shallow for our liking, but this does not detract from the writing experience overall. Key noise is dull except for the space bar too, which adds to the experience of writing on the IdeaPad 720. The only gripe that we have for the keyboard is the lack of backlighting, which we would have liked.
Touchpad
The IdeaPad 720 has a decent touchpad too. The touchpad has a smooth finish and measures 7.5 x 10 cm, which should be sufficiently large for most users. Tracking and gestures work well even into the corners of the touchpad.
The overall impression of the touchpad is let down by Lenovo’s craftsmanship though. The gap between the top case and the lower part of the touchpad is inconsistent, which results in part of the touchpad not being quite flush with the top case. This is just an aesthetic issue, but one which is noticeable nonetheless.
Display

Our test device has a Full HD 1080p display. This is the highest resolution display that Lenovo offers for the IdeaPad 720, with the only other option being an HD 720p display (1366x768).
We recorded an average maximum display luminosity of 249.8 cd/m² on both battery and mains power using X-Rite i1Pro 2. This value is typical of devices at this price and in this segment. The average maximum luminosity of all the 15-inch multimedia laptops that we have tested in the last 12 months is around 300 cd/m², so the IdeaPad 720 is around 20% below average in this regard. This is represented among our comparison devices too, where the IdeaPad 720 finishes third out of five, trailing the Mi Notebook Pro i5 and the ZenBook UX3430UN by 15% and 21%, respectively.
Positively, Lenovo has equipped the IdeaPad 720 with a matte display, which should help diffuse reflections when using the device. We would recommend checking out the Mi Notebook Pro i5 if you need a display with better color reproduction.
| |||||||||||||||||||||||||
Brightness Distribution: 87 %
Center on Battery: 270 cd/m²
Contrast: 1080:1 (Black: 0.25 cd/m²)
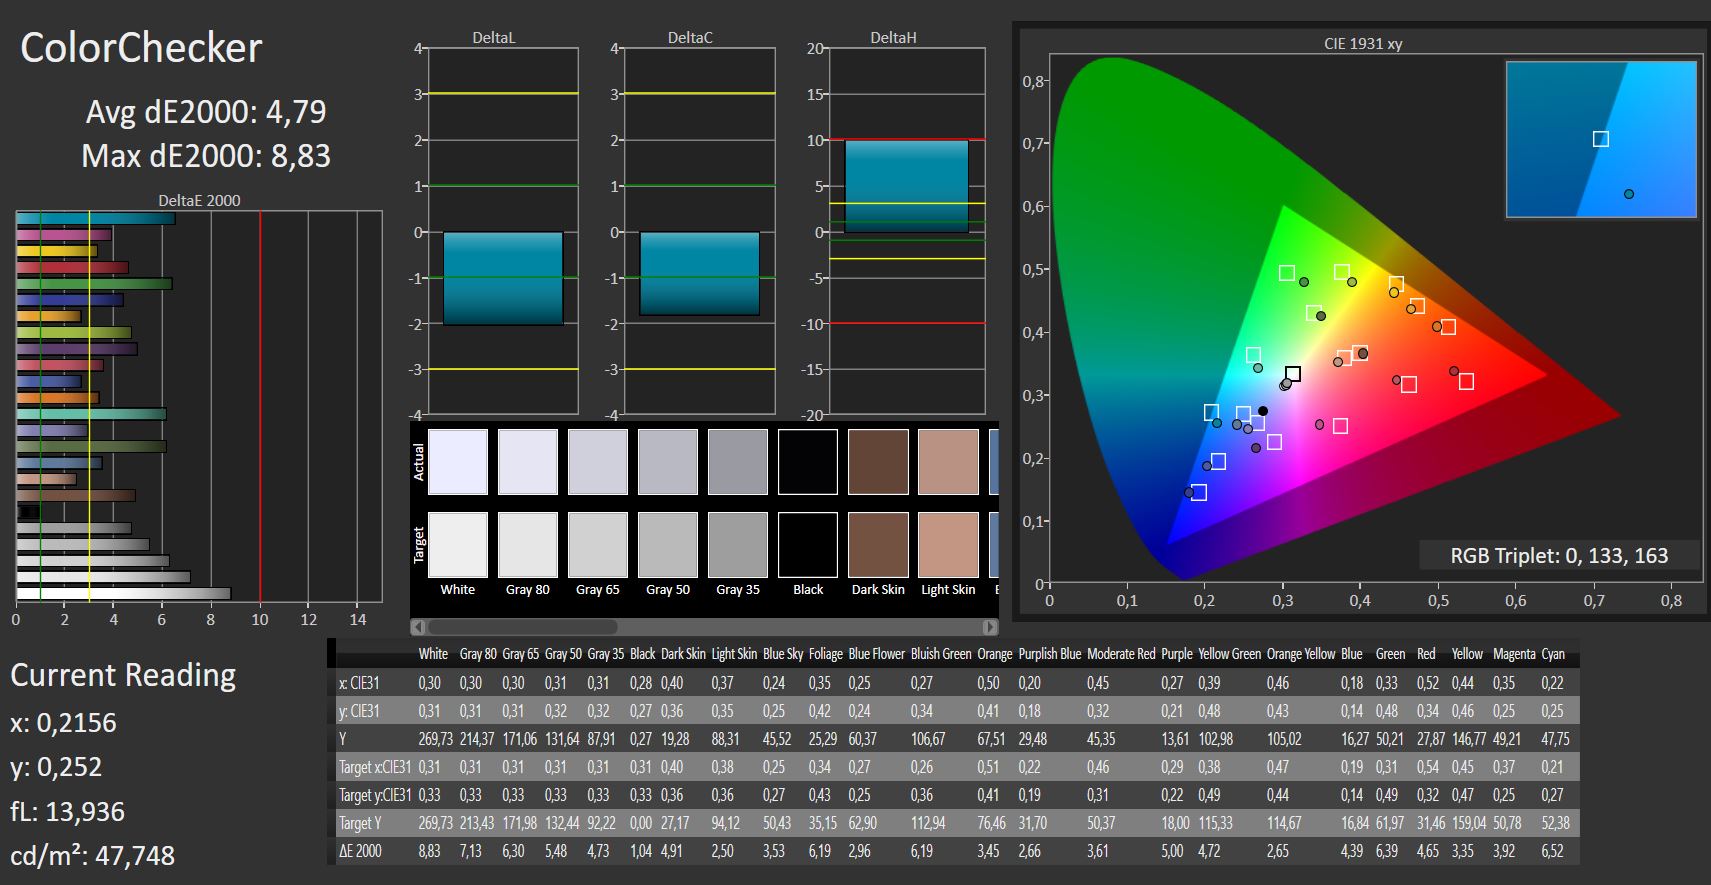
ΔE ColorChecker Calman: 4.79 | ∀{0.5-29.43 Ø4.73}
ΔE Greyscale Calman: 5.66 | ∀{0.09-98 Ø4.97}
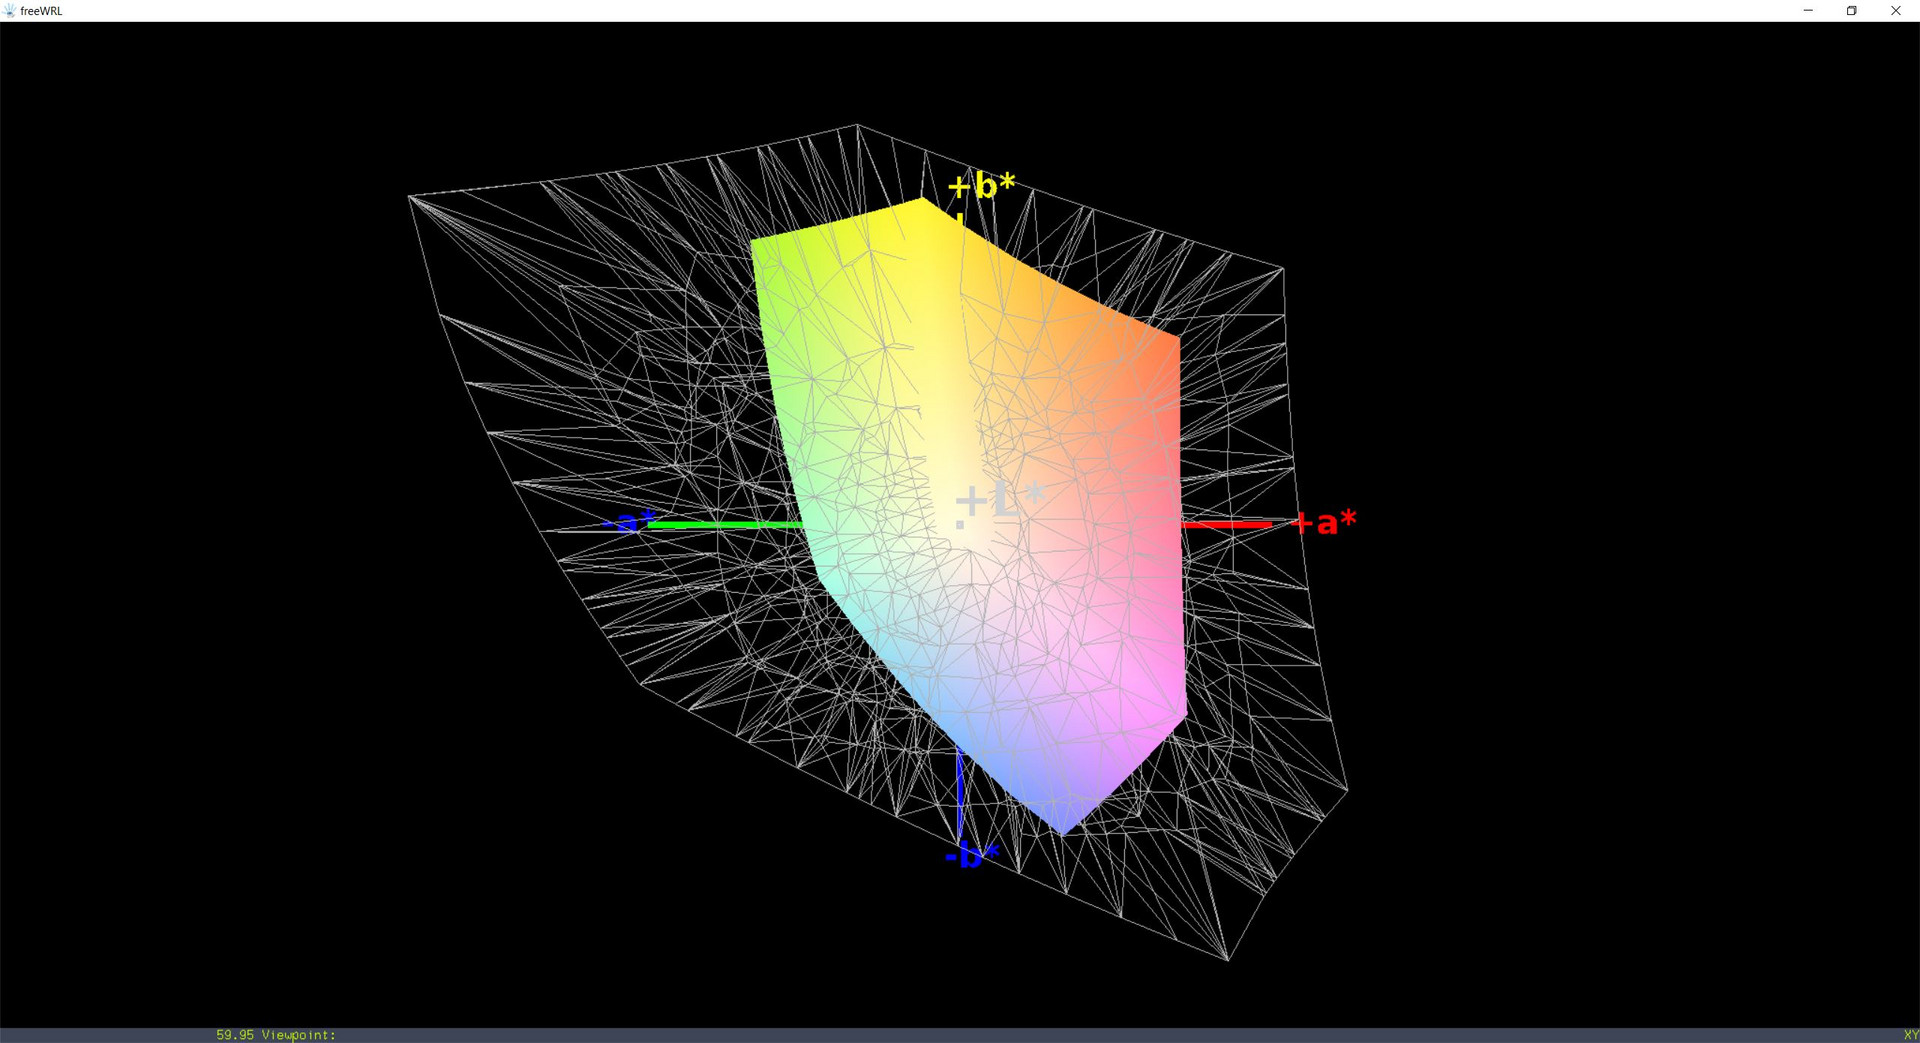
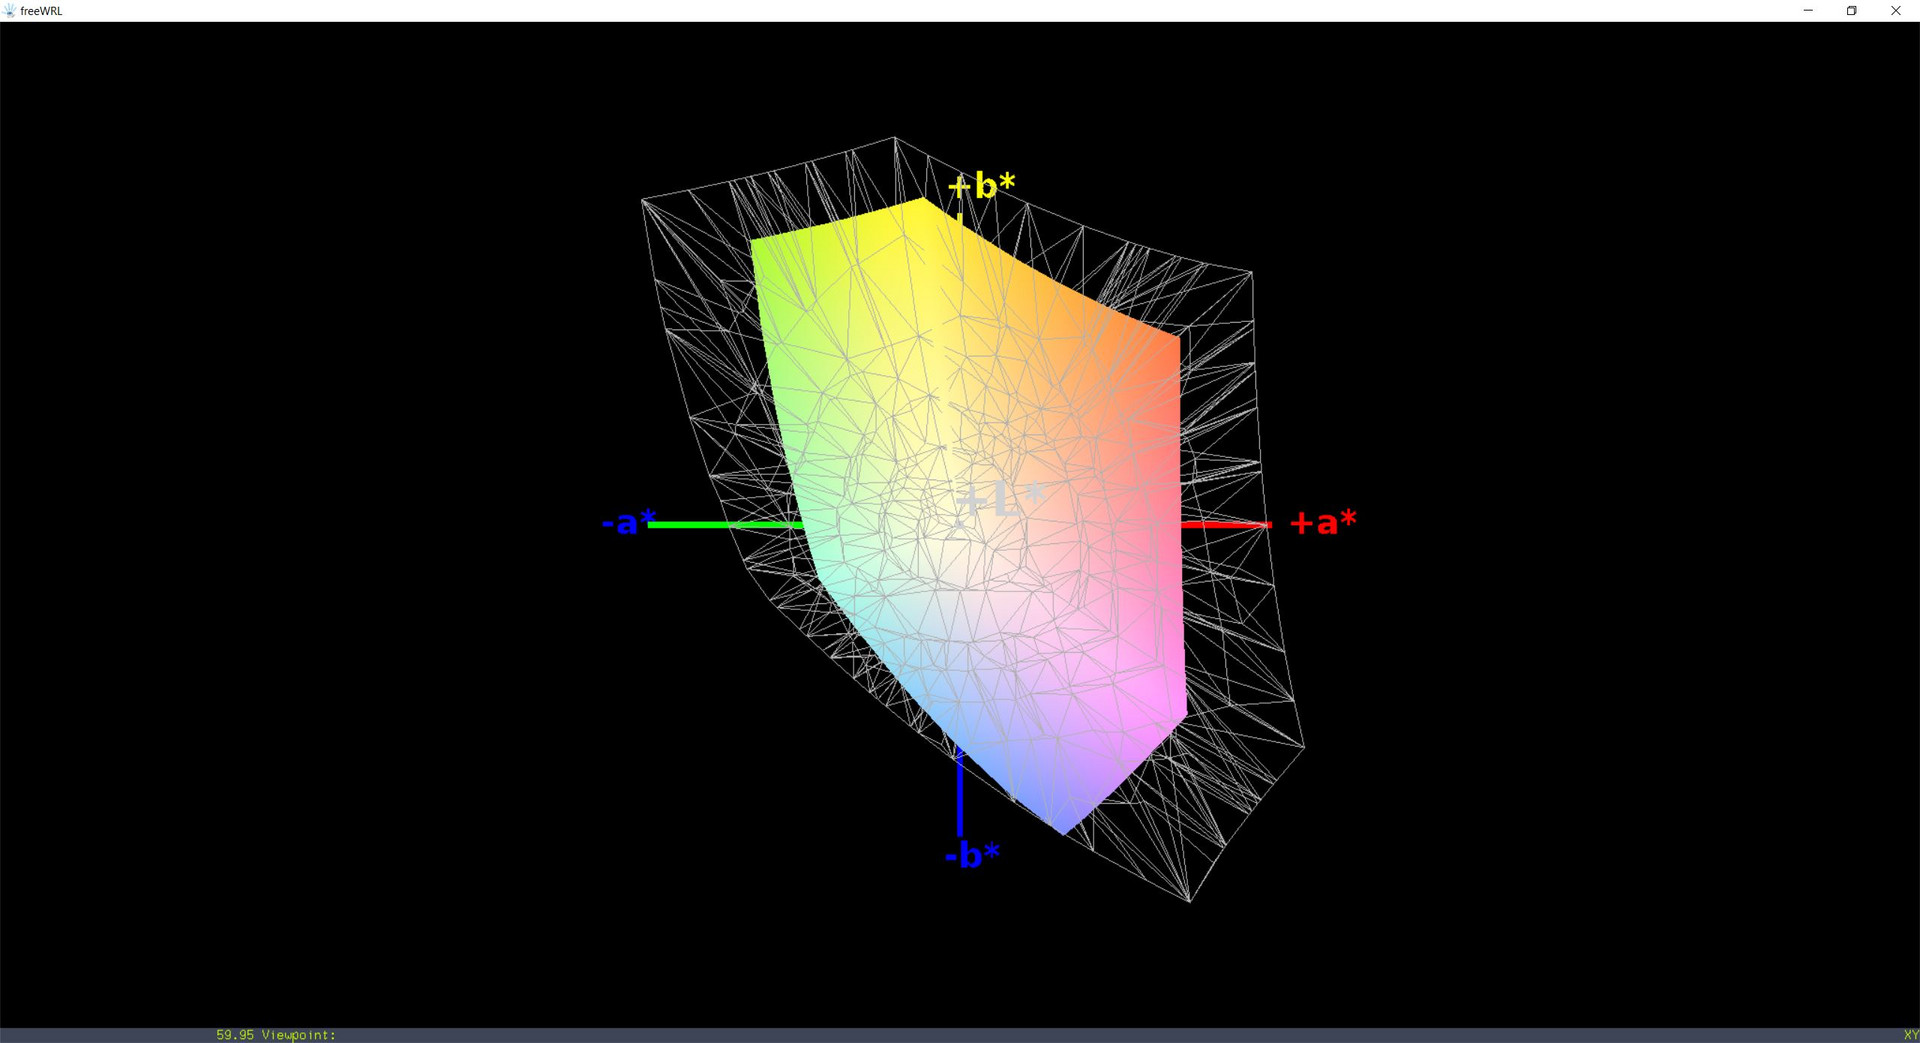
59% sRGB (Argyll 1.6.3 3D)
37% AdobeRGB 1998 (Argyll 1.6.3 3D)
39.91% AdobeRGB 1998 (Argyll 3D)
58.1% sRGB (Argyll 3D)
38.62% Display P3 (Argyll 3D)
Gamma: 2.64
CCT: 7179 K
| Lenovo IdeaPad 720-15IKB LG Philips LGD0573 LP156WF9-SPK2, , 1920x1080, 15.6" | Xiaomi Mi Notebook Pro i5 BOE0747 NV156FHM-N61, , 1920x1080, 15.6" | Asus Zenbook UX3430UN-GV174T Chi Mei CMN14D2 / N140HCE-EN1, , 1920x1080, 14" | HP Pavilion 15 Power 1GK62AV ID: AU Optronics AUO41ED, , 1920x1080, 15.6" | Acer Aspire 7 A715-71G-53TU BOE NV156FHM-N42 , , 1920x1080, 15.6" | |
|---|---|---|---|---|---|
| Display | 60% | 69% | 0% | 4% | |
| Display P3 Coverage (%) | 38.62 | 66.5 72% | 65.6 70% | 38.81 0% | 40.53 5% |
| sRGB Coverage (%) | 58.1 | 86.9 50% | 97.4 68% | 57.9 0% | 59.9 3% |
| AdobeRGB 1998 Coverage (%) | 39.91 | 63.5 59% | 67.8 70% | 40.03 0% | 41.87 5% |
| Response Times | -22% | 17% | 0% | -28% | |
| Response Time Grey 50% / Grey 80% * (ms) | 42 ? | 47.9 ? -14% | 30 ? 29% | 38.8 ? 8% | 49 ? -17% |
| Response Time Black / White * (ms) | 26 ? | 33.7 ? -30% | 25 ? 4% | 28 ? -8% | 36 ? -38% |
| PWM Frequency (Hz) | 21800 ? | 20000 ? | |||
| Screen | 14% | 18% | -5% | 2% | |
| Brightness middle (cd/m²) | 270 | 296 10% | 377 40% | 256.6 -5% | 267 -1% |
| Brightness (cd/m²) | 250 | 288 15% | 339 36% | 243 -3% | 250 0% |
| Brightness Distribution (%) | 87 | 89 2% | 76 -13% | 81 -7% | 82 -6% |
| Black Level * (cd/m²) | 0.25 | 0.32 -28% | 0.4 -60% | 0.19 24% | 0.31 -24% |
| Contrast (:1) | 1080 | 925 -14% | 943 -13% | 1351 25% | 861 -20% |
| Colorchecker dE 2000 * | 4.79 | 4.3 10% | 3.33 30% | 5 -4% | 4.65 3% |
| Colorchecker dE 2000 max. * | 8.83 | 8.7 1% | 8.02 9% | 20.1 -128% | 8.2 7% |
| Greyscale dE 2000 * | 5.66 | 3 47% | 4.89 14% | 2.7 52% | 2.65 53% |
| Gamma | 2.64 83% | 2.1 105% | 2.37 93% | 2.32 95% | 2.44 90% |
| CCT | 7179 91% | 7100 92% | 7620 85% | 6599 98% | 6820 95% |
| Color Space (Percent of AdobeRGB 1998) (%) | 37 | 56.83 54% | 62 68% | 36.7 -1% | 38 3% |
| Color Space (Percent of sRGB) (%) | 59 | 86.86 47% | 98 66% | 57.7 -2% | 59 0% |
| Colorchecker dE 2000 calibrated * | 3.5 | ||||
| Total Average (Program / Settings) | 17% /
19% | 35% /
28% | -2% /
-3% | -7% /
-2% |
* ... smaller is better
Our test device has a decent 0.25 cd/m² black value that is significantly lower than all our comparison devices except for the Pavilion Power 15, which has a black value that is 24% lower. This low black value ensures that the IdeaPad 720 reproduces deep blacks. This also benefits the contrast ratio, which we measured at 1,080:1. Again, the IdeaPad 720 has a better contrast ratio than its competitors except for the Pavilion Power 15.
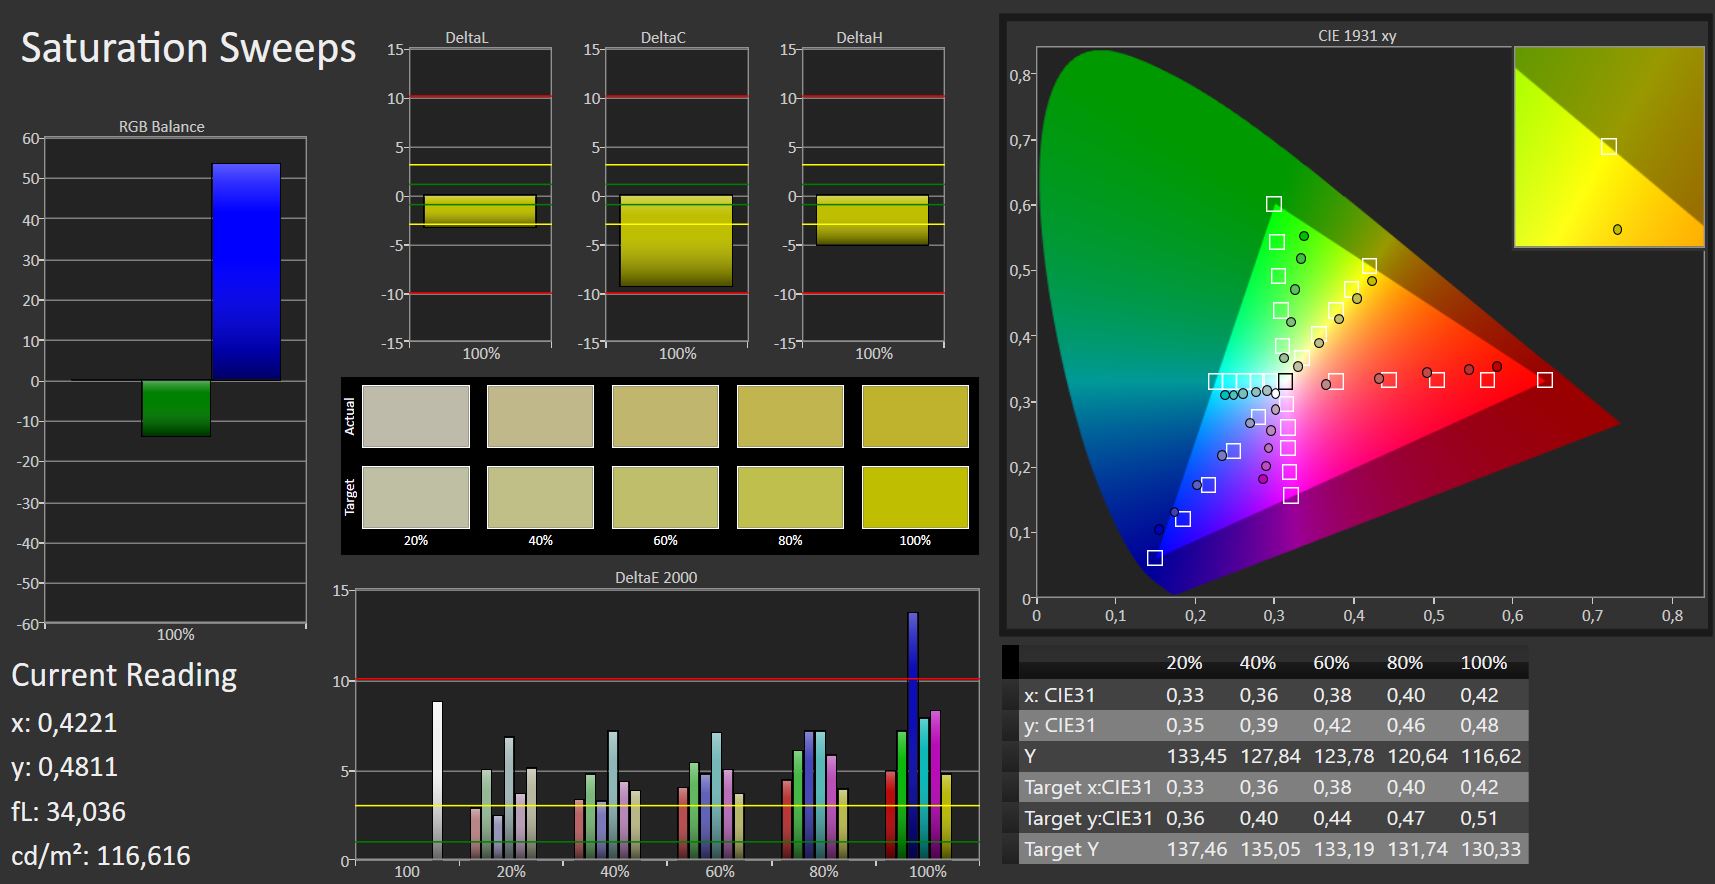
Our test device has satisfactory color reproduction too. Using CalMAN software and a photo spectrometer, we measured 37% AdobeRGB accuracy and 59% sRGB accuracy. Our test device does have comparatively high grayscale deviations though, with a 5.66 DeltaE value. This is significantly higher than most of our comparison devices and results in a blue tint that is slightly noticeable to the naked eye.
Color values have similar DeltaE deviations, but these are typical for an IPS panel. Good color representation tends to be one of the characteristics of IPS panels.
Positively, the IdeaPad 720 does not use pulse-width modulation (PWM) to regulate display brightness. Low PWM frequencies can cause eye strain and dizziness for those who are PWM sensitive. This is particularly present in the ZenBook UX3430UN, which has a 200 Hz PWM frequency. A frequency this low is likely to cause problems for those who are PWM sensitive.

The matte display means that we could use our test device in shady spots. However, the display brightness is too low to use the IdeaPad 720 in direct and indirect sunlight.
Display Response Times
| ↔ Response Time Black to White | ||
|---|---|---|
| 26 ms ... rise ↗ and fall ↘ combined | ↗ 15 ms rise | 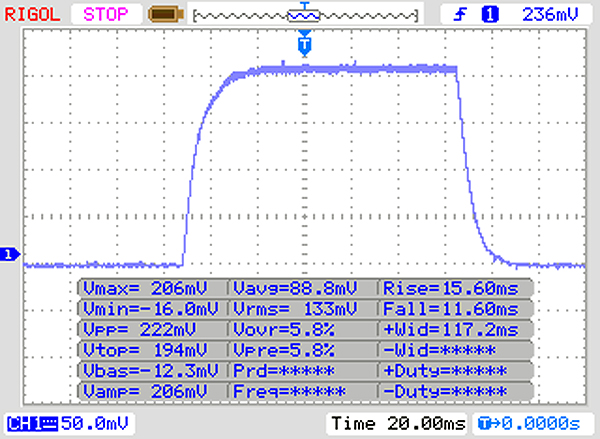 |
| ↘ 11 ms fall | ||
| The screen shows relatively slow response rates in our tests and may be too slow for gamers. In comparison, all tested devices range from 0.1 (minimum) to 240 (maximum) ms. » 62 % of all devices are better. This means that the measured response time is worse than the average of all tested devices (19.9 ms). | ||
| ↔ Response Time 50% Grey to 80% Grey | ||
| 42 ms ... rise ↗ and fall ↘ combined | ↗ 22 ms rise | 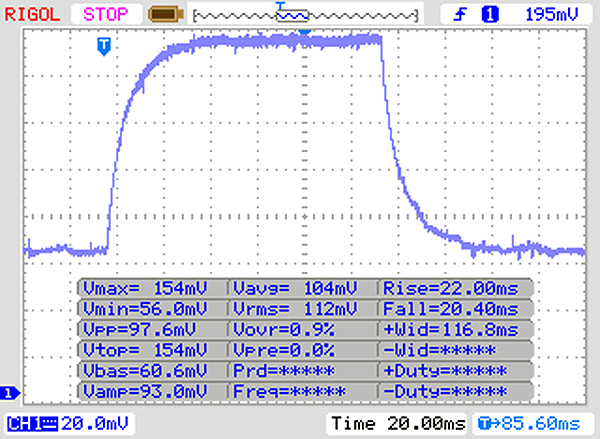 |
| ↘ 20 ms fall | ||
| The screen shows slow response rates in our tests and will be unsatisfactory for gamers. In comparison, all tested devices range from 0.165 (minimum) to 636 (maximum) ms. » 67 % of all devices are better. This means that the measured response time is worse than the average of all tested devices (31.1 ms). | ||
Screen Flickering / PWM (Pulse-Width Modulation)
| Screen flickering / PWM not detected |  | ||
In comparison: 52 % of all tested devices do not use PWM to dim the display. If PWM was detected, an average of 7798 (minimum: 5 - maximum: 343500) Hz was measured. | |||
The IdeaPad 720 has stable viewing angles thanks to its IPS panel and its 180 ° display hinge.

Performance
Lenovo has equipped the IdeaPad 720 with an Intel seventh-generation Core i5 processor released in summer 2016 rather than upgrading to the eighth-generation Intel Core processors. Lenovo combines the outdated CPU with a mid-range dedicated GPU, which should provide enough power for daily tasks and some gaming. The IdeaPad 720 has dual-channel RAM and a PCIe SSD for fast system performance.
Other configurations are not available for purchase at the time of writing, but Lenovo does list a few hardware options on its website. These include the choice between an Intel Core i5 or i7 CPU, an AMD Radeon RX 550 that is weaker than the GPU in our test device, and multiple internal storage options. Interestingly, Lenovo even lists a 16 GB Intel Optane SSD as an option too.

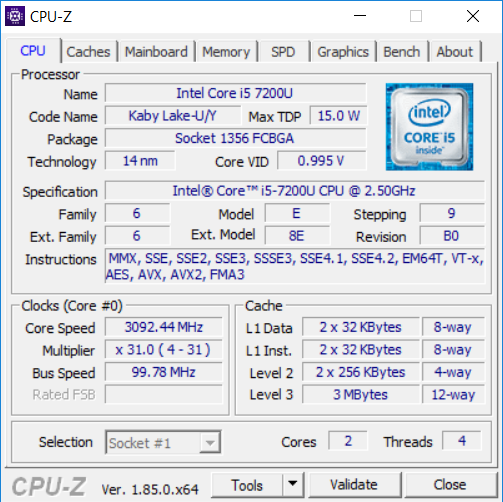

Processor
Our test device is powered by an Intel Core i5-7200U, a seventh-generation Intel Core Kaby Lake processor. The U suffix signifies that the Core i5-7200U is an ultra-low voltage (ULV) CPU.
The Core i5-7200U is a dual-core CPU that clocks between 2.5 and 3.1 GHz. The IdeaPad 720 trails many of our comparison devices principally because they have more powerful CPUs. The Mi Notebook Pro i5 and the ZenBook UX3430UN are both powered by the Intel Core i5-8250U, which is the direct successor to the Core i5-7200U. The Core i5-8250U is not only a quad-core processor, but it also clocks up to 3.6 GHz. This increase in power across Intel Core generations is reflected in our comparison tables.
The same applies to the Pavilion Power 15 and the Aspire 7, which have more powerful seventh-generation Intel Core HQ processors. It is worth bearing in mind though that HQ-series processors consume significantly more power than their U-series counterparts. Devices that are powered by HQ-series processors often have comparatively poor battery life as a result.
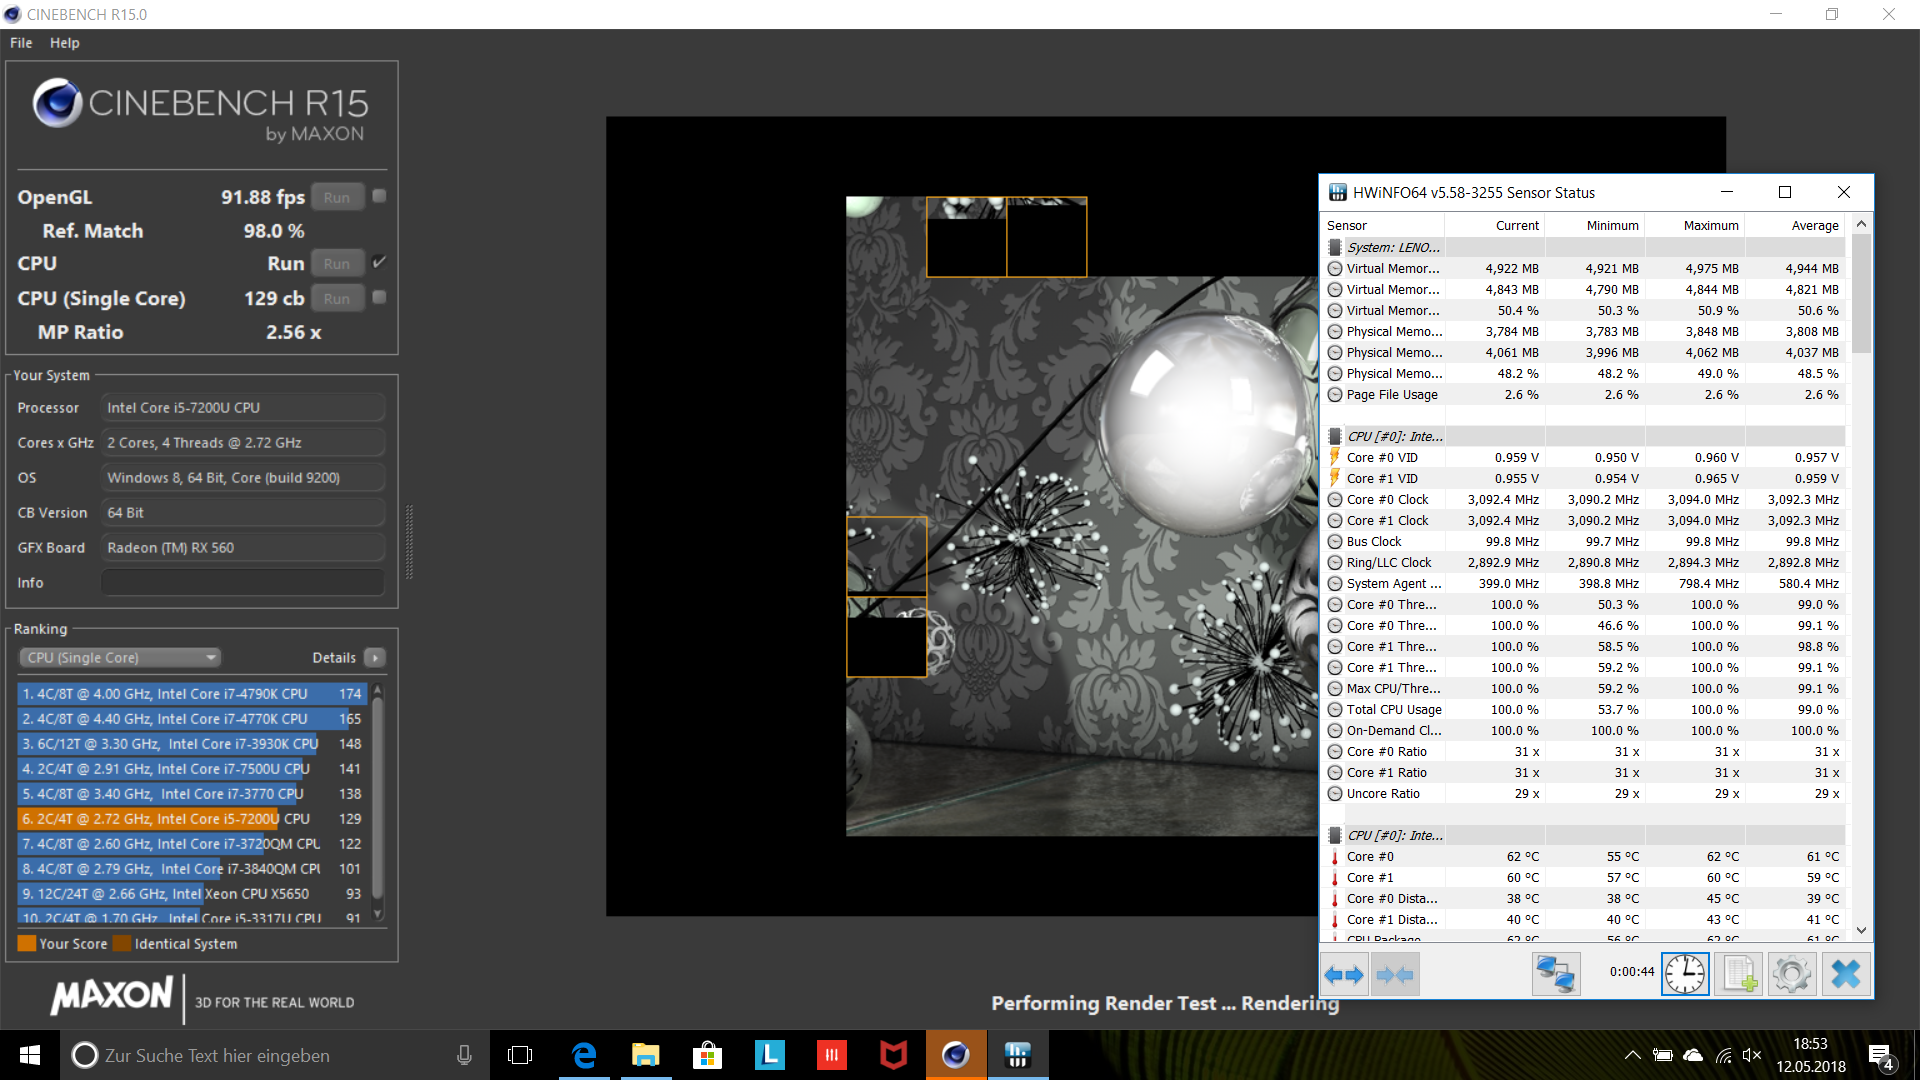
Our test device achieves a consistent score of 331 in Cinebench R15. Even the clock speed stays constant at 3.1 GHz. This is marginally faster than the average of Core i5-7200U-powered devices that we have tested. The IdeaPad 720 matches the other Core i5-7200U-powered device in Cinebench R15, namely the Acer Extensa 2540-580K.
The Core i5-8250U-powered devices perform much better in Cinebench R15, particularly in multi-core tests. By comparison to the 331 scored by our test device, the Mi Notebook Pro i5 scores almost 580 points for a short time that then averages out to 545 in the long run. The ZenBook UX3430UN scores slightly higher, while the Pavilion Power 15 leads the pack with 740 points. The IdeaPad 720 sits behind the Core i5-8250U and HQ-series processor in Cinebench R15 single core tests too.
The IdeaPad 720 performed just as well on battery power as it does on mains power.
Apparently, Lenovo is planning to release an IdeaPad 720 with an eighth-generation Intel Core processor. We currently do not know when this variant will be released nor do we know its price.
Please see our CPU benchmark page for further comparisons and analyses of current notebook processors.
System Performance
The IdeaPad 720 performed well during our testing, with system performance always feeling fast to us. PCMark 8 Home results confirmed our subjective impression. The IdeaPad 720 performs better than some of its more powerful competitors thanks to its fast PCIe SSD.
| PCMark 8 Home Score Accelerated v2 | 4464 points | |
| PCMark 8 Creative Score Accelerated v2 | 5657 points | |
| PCMark 8 Work Score Accelerated v2 | 4882 points | |
Help | ||
Storage Devices
The IdeaPad 720 has two internal storage drives, the largest of which is a 1 TB Western Digital HDD. This is a 5,400 RPM HDD that achieved 113 MB/s read and 111 MB/s write speeds in CrystalDiskMark.
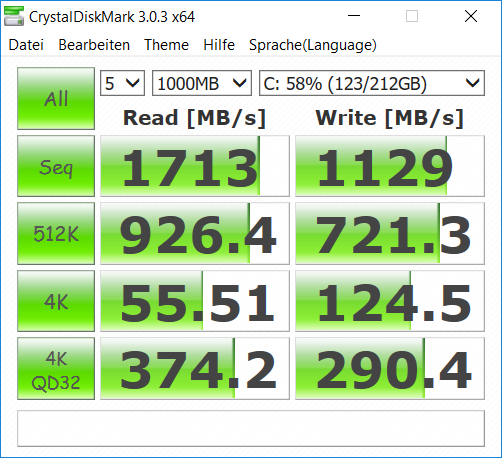
The other drive is a 256 GB Samsung PM961 PCIe NVMe SSD, which is significantly faster than the 1 TB HDD. The PM961 in our test device achieved 1,713 MB/s read speeds and 1,129 MB/s write speeds. This performance is on par with the average of PM961 drives that we have tested and is significantly faster than the Mi Notebook Pro i5, which has a SATA rather than an NVMe connection.
| Lenovo IdeaPad 720-15IKB Samsung PM961 MZVLW256HEHP | Asus Zenbook UX3430UN-GV174T SK Hynix HFS256G39TND-N210A | Xiaomi Mi Notebook Pro i5 Samsung PM961 MZVLW256HEHP | HP Pavilion 15 Power 1GK62AV SK Hynix HFS256G39TND-N210A | Average Samsung PM961 MZVLW256HEHP | |
|---|---|---|---|---|---|
| CrystalDiskMark 3.0 | -51% | 17% | -60% | 5% | |
| Read Seq (MB/s) | 1713 | 480.3 -72% | 1260 -26% | 491.6 -71% | 1627 ? -5% |
| Write Seq (MB/s) | 1129 | 263.9 -77% | 1241 10% | 141.7 -87% | 1136 ? 1% |
| Read 512 (MB/s) | 926 | 266.9 -71% | 1039 12% | 345.6 -63% | 887 ? -4% |
| Write 512 (MB/s) | 721 | 263.2 -63% | 827 15% | 142.6 -80% | 781 ? 8% |
| Read 4k (MB/s) | 55.5 | 29.58 -47% | 60 8% | 18.83 -66% | 53 ? -5% |
| Write 4k (MB/s) | 124.5 | 68.4 -45% | 154 24% | 76.3 -39% | 126.7 ? 2% |
| Read 4k QD32 (MB/s) | 374.2 | 322.2 -14% | 526 41% | 348.5 -7% | 419 ? 12% |
| Write 4k QD32 (MB/s) | 290.4 | 243.3 -16% | 435 50% | 104.8 -64% | 384 ? 32% |

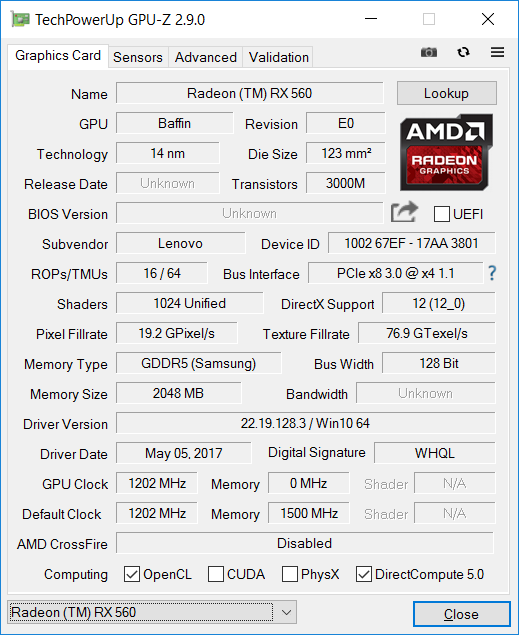
Graphics Card
Our test device is equipped with an AMD Radeon RX 560, a dedicated GPU with 2 GB GDDR5 VRAM. According to GPU-Z, the RX 560 in our test device has a 1,202 MHz clock speed. Our test device performs equivalently to the average of RX 560-equipped devices that we have tested in most benchmarks. The one minor exception is the IdeaPad 720’s performance in 3DMark Fire Strike at 1920x1080, where our test device trails the average by around 3%. Overall, the RX 560 is about 10% weaker than the Nvidia GeForce GTX 1050 and around 60% more powerful than the Nvidia GeForce MX150.
It is worth bearing in mind that graphics performance is 22% worse on the battery than it is on mains power.
Please see our GPU benchmark page for further comparisons between various GPUs.
| 3DMark 11 Performance | 6828 points | |
| 3DMark Cloud Gate Standard Score | 11994 points | |
| 3DMark Fire Strike Score | 4699 points | |
Help | ||
Gaming Performance
While the Radeon RX 560 falls short of the Nvidia GeForce GTX 1050, newer games can still be played smoothly at medium graphics.
Please see our gaming benchmarks for a detailed look at which games can be played smoothly on the RX 560 and how it compares against other GPUs.
| Dragon Age: Inquisition - 1920x1080 High Graphics Quality | |
| Lenovo IdeaPad 720-15IKB | |
| Average AMD Radeon RX 560 (Laptop) (34.9 - 40.3, n=2) | |
| HP Envy 17-ae143ng | |
| The Witcher 3 - 1920x1080 High Graphics & Postprocessing (Nvidia HairWorks Off) | |
| Average of class Multimedia (22 - 224, n=13, last 2 years) | |
| Gigabyte Aero 14-K8 | |
| Acer Predator Helios 300 PH317-52-51M6 | |
| Asus FX504GD | |
| HP Pavilion 15 Power 1GK62AV | |
| Dell XPS 15 2018 i5 FHD 97Wh | |
| Average AMD Radeon RX 560 (Laptop) (34.1 - 35.2, n=2) | |
| Lenovo IdeaPad 720-15IKB | |
| Xiaomi Mi Notebook Pro i5 | |
| Lenovo ThinkPad T480s-20L8S02E00 | |
| Doom - 1366x768 Medium Preset | |
| HP Pavilion 15 Power 1GK62AV | |
| Lenovo IdeaPad 720-15IKB | |
| Average AMD Radeon RX 560 (Laptop) (n=1) | |
| Lenovo ThinkPad T480s-20L8S02E00 | |
| HP Pavilion Power 15t-cb2000 | |
| Battlefield 1 - 1920x1080 High Preset AA:T | |
| Lenovo IdeaPad 720-15IKB | |
| Average AMD Radeon RX 560 (Laptop) (n=1) | |
| Dirt 4 - 1920x1080 High Preset AA:2xMS AF:8x | |
| Dell XPS 15 2018 i5 FHD 97Wh | |
| Lenovo IdeaPad 720-15IKB | |
| Average AMD Radeon RX 560 (Laptop) (n=1) | |
| Playerunknown's Battlegrounds (PUBG) - 1920x1080 High Preset | |
| Acer Predator Helios 300 PH317-52-51M6 | |
| Lenovo IdeaPad 720-15IKB | |
| Average AMD Radeon RX 560 (Laptop) (n=1) | |
| Xiaomi Mi Notebook Pro i5 | |
| F1 2017 | |
| 1920x1080 High Preset AA:T AF:8x | |
| Dell XPS 15 2018 i5 FHD 97Wh | |
| Lenovo IdeaPad 720-15IKB | |
| Average AMD Radeon RX 560 (Laptop) (n=1) | |
| 1920x1080 Ultra High Preset AA:T AF:16x | |
| Dell XPS 15 2018 i5 FHD 97Wh | |
| Lenovo IdeaPad 720-15IKB | |
| Average AMD Radeon RX 560 (Laptop) (n=1) | |
| Destiny 2 - 1920x1080 Highest Preset AA:SM AF:16x | |
| Lenovo IdeaPad 720-15IKB | |
| Average AMD Radeon RX 560 (Laptop) (n=1) | |
| Assassin´s Creed Origins - 1920x1080 Medium Preset | |
| Lenovo IdeaPad 720-15IKB | |
| Average AMD Radeon RX 560 (Laptop) (n=1) | |
| Xiaomi Mi Notebook Air 13.3 2018 | |
| Need for Speed Payback - 1920x1080 Ultra Preset | |
| Gigabyte Aero 14-K8 | |
| Lenovo IdeaPad 720-15IKB | |
| Average AMD Radeon RX 560 (Laptop) (n=1) | |
| Star Wars Battlefront 2 - 1920x1080 High Preset | |
| Gigabyte Aero 14-K8 | |
| Lenovo IdeaPad 720-15IKB | |
| Average AMD Radeon RX 560 (Laptop) (n=1) | |
| Lenovo ThinkPad T480s-20L8S02E00 | |
| Final Fantasy XV Benchmark - 1920x1080 Standard Quality | |
| Average of class Multimedia (11.4 - 181.1, n=66, last 2 years) | |
| Gigabyte Aero 14-K8 | |
| Dell XPS 15 2018 i5 FHD 97Wh | |
| Lenovo IdeaPad 720-15IKB | |
| Average AMD Radeon RX 560 (Laptop) (n=1) | |
| Asus Zenbook UX430UN | |
| Kingdom Come: Deliverance - 1920x1080 Medium Preset | |
| Lenovo IdeaPad 720-15IKB | |
| Average AMD Radeon RX 560 (Laptop) (n=1) | |
| Xiaomi Mi Notebook Air 13.3 2018 | |
| Far Cry 5 - 1920x1080 Medium Preset AA:T | |
| Average of class Multimedia (21 - 161, n=23, last 2 years) | |
| Lenovo IdeaPad 720-15IKB | |
| Average AMD Radeon RX 560 (Laptop) (n=1) | |
| Asus Zenbook UX3430UN-GV174T | |
| low | med. | high | ultra | 4K | |
|---|---|---|---|---|---|
| BioShock Infinite (2013) | 151.4 | 141 | 129.6 | 44.2 | |
| Dragon Age: Inquisition (2014) | 83.1 | 70 | 40.3 | 26.4 | |
| The Witcher 3 (2015) | 99.5 | 64.4 | 34.1 | 19.6 | |
| Rise of the Tomb Raider (2016) | 71.9 | 51.6 | 30.6 | 24.1 | |
| Doom (2016) | 38.7 | 60.9 | 22.2 | 15.4 | |
| Overwatch (2016) | 224.2 | 176.1 | 95.4 | 47.9 | |
| Battlefield 1 (2016) | 79 | 63.2 | 36.7 | 29.3 | |
| Rocket League (2017) | 196.3 | 96.8 | 69 | ||
| Dirt 4 (2017) | 176.5 | 83.6 | 49.8 | 28.6 | |
| Playerunknown's Battlegrounds (PUBG) (2017) | 108.2 | 49.4 | 45.4 | 12.5 | |
| F1 2017 (2017) | 100 | 66 | 47 | 24 | |
| FIFA 18 (2017) | 154.3 | 144.1 | 125.1 | 124.3 | |
| Destiny 2 (2017) | 106 small graphical problems (no fullscreen-mode) | 47 small graphical problems (no fullscreen-mode) | 44.1 | 36.2 | |
| Assassin´s Creed Origins (2017) | 36 | 23 | 19 | 9 | |
| Call of Duty WWII (2017) | 56 () | 39 () | 21 () | ||
| Need for Speed Payback (2017) | 59 | 49.7 | 41.4 | 36.3 | |
| Star Wars Battlefront 2 (2017) | 70.1 | 47 | 43 | 17 | |
| Fortnite (2018) | 151.3 | 87.4 | 63 | 50.2 | 35.9 |
| Final Fantasy XV Benchmark (2018) | 54.4 | 26.1 | 6.5 | ||
| Kingdom Come: Deliverance (2018) | 53.3 | 32.5 | 28.3 | 21.4 | |
| Far Cry 5 (2018) | 63 | 35 | 30 | 27 |
Emissions
Fan Noise
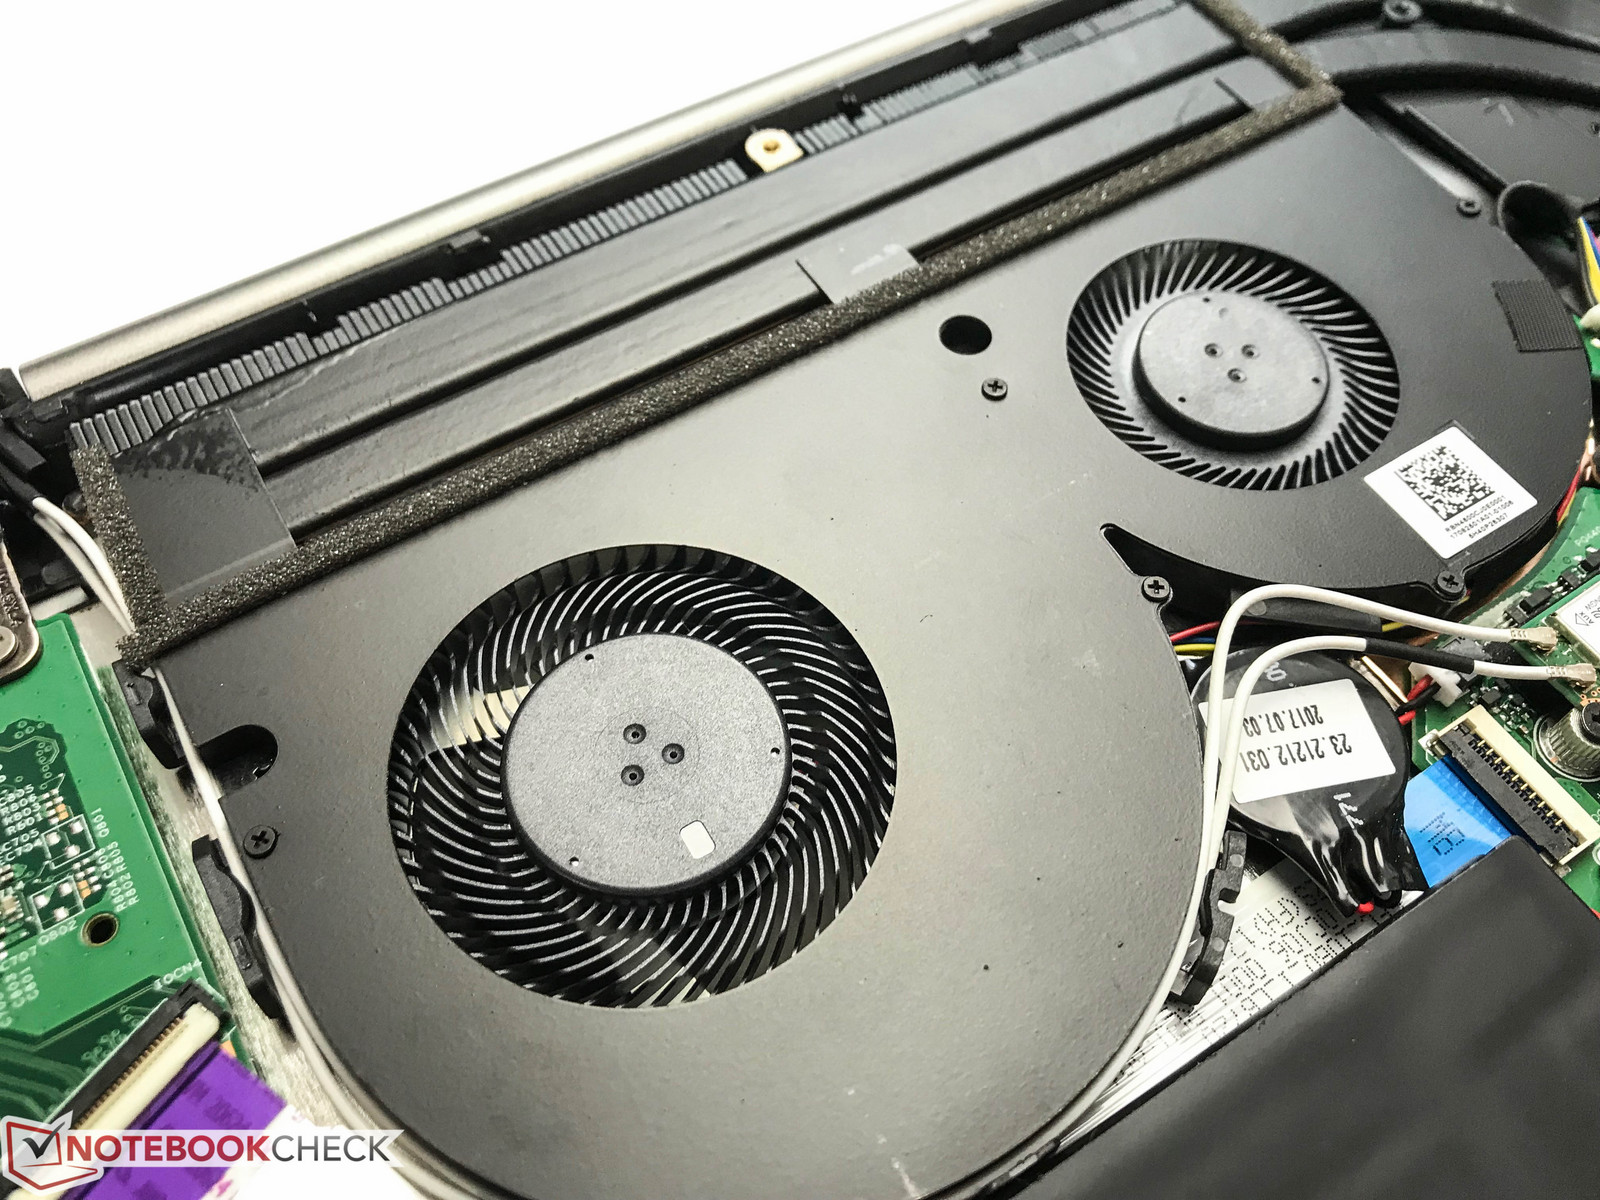
The IdeaPad 720 has two fans and manages their noise well overall. The fans are practically always off at idle and only occasionally reach 30.3 dB(A). Fan noise is only noticeable under load, where we recorded it reaching 39.2 dB(A). Overall, the IdeaPad 720 is a relatively quiet device, as its peak fan noise is somewhat quieter than its competitors. The only criticism we have of the fans is the frequency at which they operate. The frequency is relatively high-pitched once both fans spin up. This is particularly annoying in quiet environments.
Noise level
| Idle |
| 30.3 / 30.3 / 30.3 dB(A) |
| Load |
| 39.2 / 39.2 dB(A) |
 | ||
30 dB silent 40 dB(A) audible 50 dB(A) loud |
||
min: | ||
Temperature
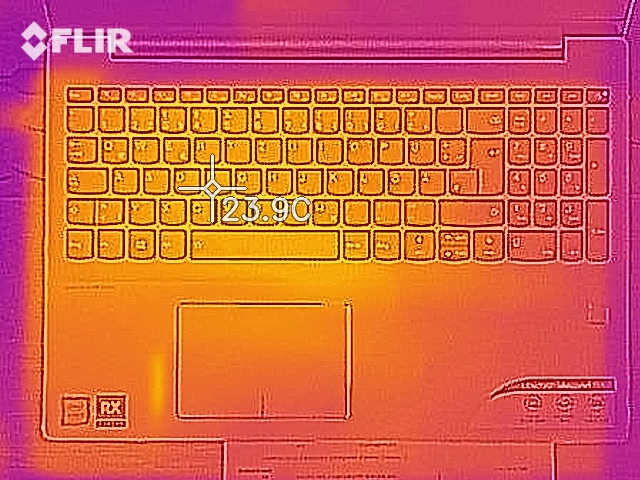
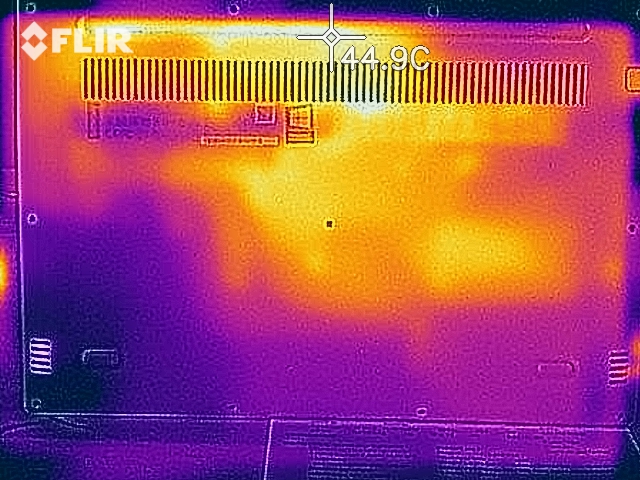
The IdeaPad 720 has relatively cool surface temperatures at idle, with our test device averaging 21.5 °C on the top case and 21.8 °C on the underside. Maximum idle temperatures are not much higher either, with the top reaching 22 °C, while the bottom can heat up to 23.6 °C.
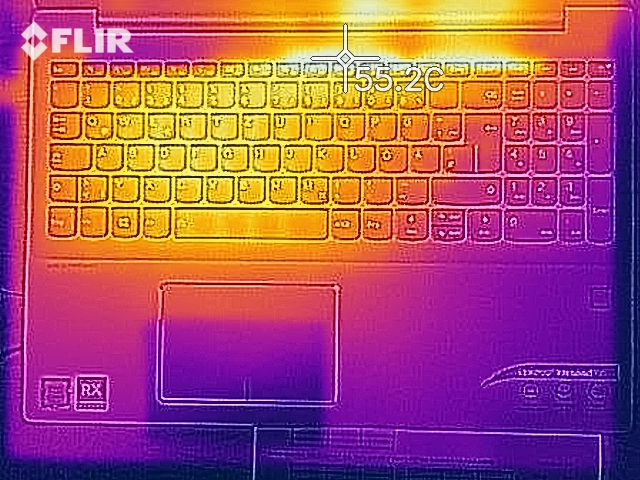
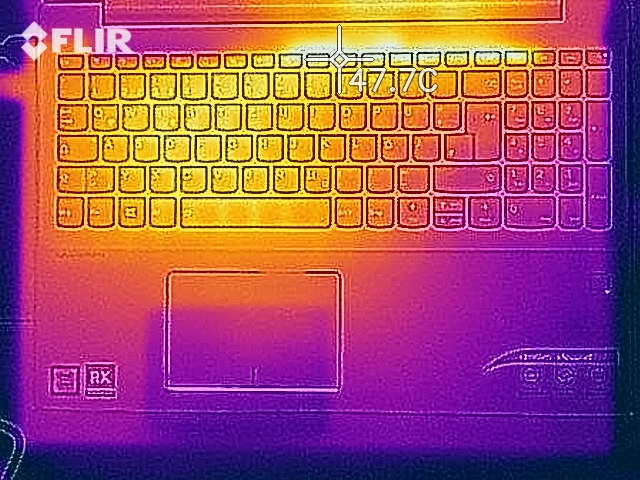
Unfortunately, the IdeaPad 720 is worse at managing its surface temperatures under load. Heat distribution is uneven. Top case surface temperatures average 33.2 °C under load, while the hottest part reaches 41.2 °C. The hottest area is the centre and the left-hand side of the keyboard deck, while the palm rest and trackpad area average 25.6 °C.
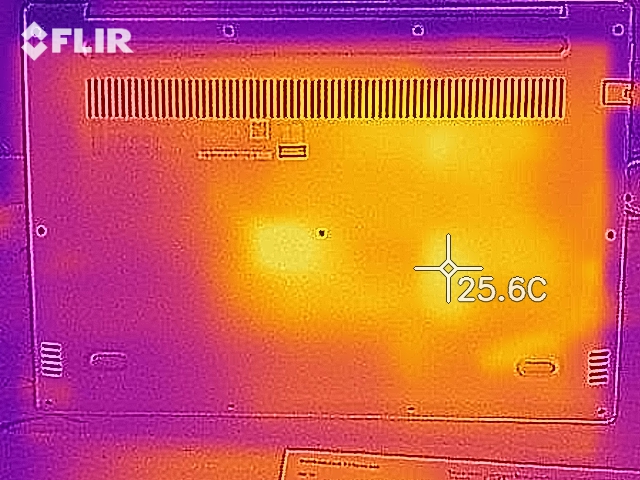
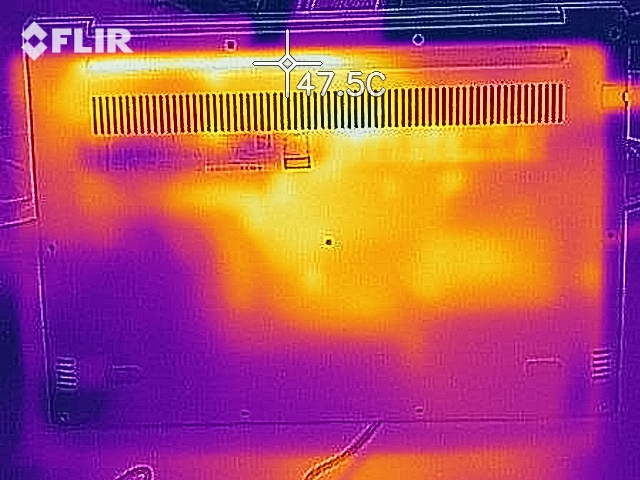
The bottom case is largely cooler under load, with it only reaching a maximum of 36.4 °C and averaging 27.8 °C. Heat distribution is just as uneven though.
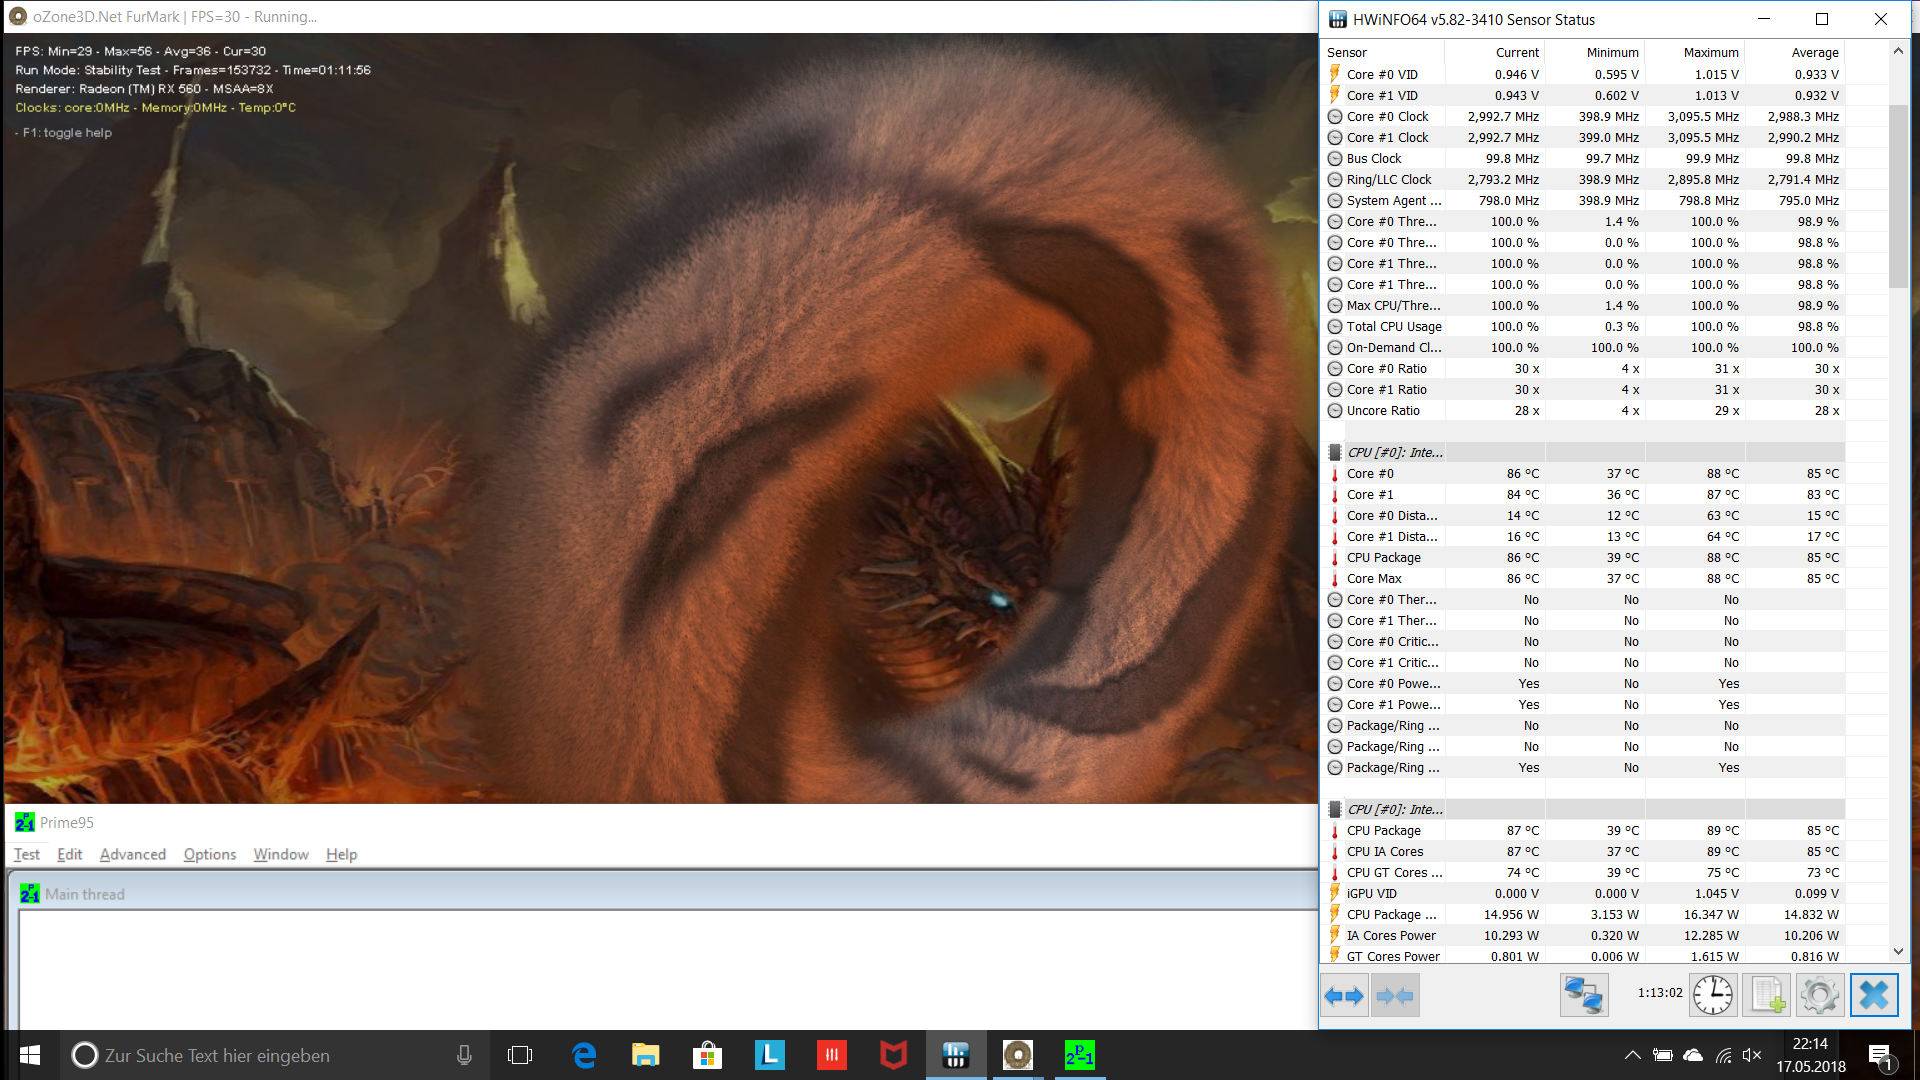
We subjected our test device to an hour-long combined FurMark and Prime95 stress test to achieve these surface temperatures. This is an extreme load scenario that you should not see in daily use. A more practical representation of surface temperatures under load is in our one-hour The Witcher 3 benchmark, during which our test device averaged 33 °C on top and 30.2 °C. Maximum temperatures were marginally lower too at 40.8 °C and 35.9 °C, respectively.
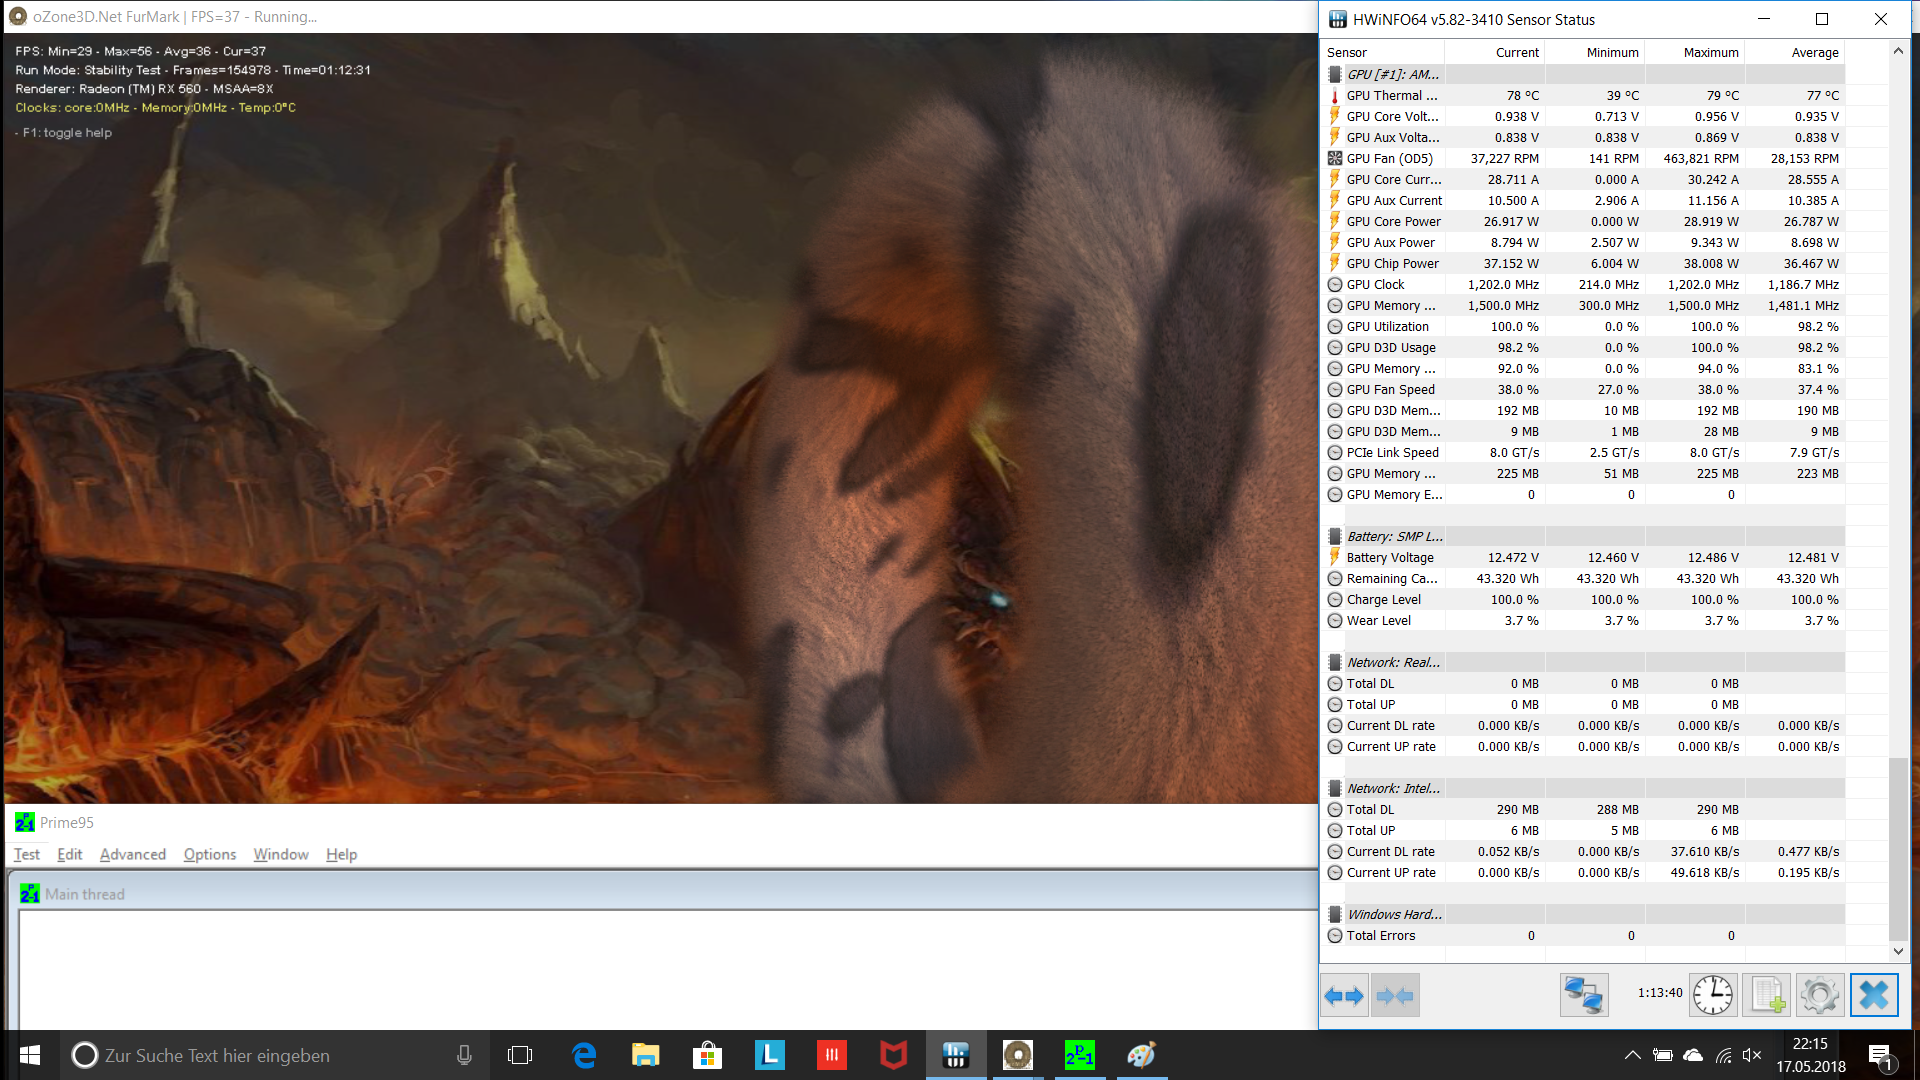
We also used FurMark and Prime95 stress tests to evaluate core temperatures. The CPU runs consistently at around 3 GHz during these stress tests and reaches 88 °C while doing so. The GPU performs equally well too and manages to maintain an average clock speed of just under 1.2 GHz.
Our test device performed equally as well in 3DMark11 and The Witcher 3 after running our FurMark and Prime95 stress tests than when we ran the former from a cold start. Overall, the IdeaPad 720 has a good cooling system, albeit it with uneven surface temperatures.
(±) The maximum temperature on the upper side is 41.2 °C / 106 F, compared to the average of 36.8 °C / 98 F, ranging from 21 to 71 °C for the class Multimedia.
(+) The bottom heats up to a maximum of 36.4 °C / 98 F, compared to the average of 39.1 °C / 102 F
(+) In idle usage, the average temperature for the upper side is 21.5 °C / 71 F, compared to the device average of 31.3 °C / 88 F.
(±) Playing The Witcher 3, the average temperature for the upper side is 33 °C / 91 F, compared to the device average of 31.3 °C / 88 F.
(+) The palmrests and touchpad are cooler than skin temperature with a maximum of 27.3 °C / 81.1 F and are therefore cool to the touch.
(±) The average temperature of the palmrest area of similar devices was 28.7 °C / 83.7 F (+1.4 °C / 2.6 F).
Speakers
Unfortunately, the stereo speakers only have average sound quality despite the case being adorned with “Audio by HARMAN”. The speakers lack volume. We recorded an average 75.9 dB(A) maximum volume. The speakers lack presence too, although the mid and high tones are balanced.
Lenovo IdeaPad 720-15IKB audio analysis
(-) | not very loud speakers (68.7 dB)
Bass 100 - 315 Hz
(-) | nearly no bass - on average 23% lower than median
(±) | linearity of bass is average (14.6% delta to prev. frequency)
Mids 400 - 2000 Hz
(+) | balanced mids - only 4% away from median
(+) | mids are linear (6% delta to prev. frequency)
Highs 2 - 16 kHz
(+) | balanced highs - only 3.9% away from median
(±) | linearity of highs is average (8.5% delta to prev. frequency)
Overall 100 - 16.000 Hz
(±) | linearity of overall sound is average (23.3% difference to median)
Compared to same class
» 82% of all tested devices in this class were better, 5% similar, 13% worse
» The best had a delta of 5%, average was 17%, worst was 45%
Compared to all devices tested
» 70% of all tested devices were better, 5% similar, 25% worse
» The best had a delta of 4%, average was 24%, worst was 134%
Acer Aspire 7 A715-71G-53TU audio analysis
(-) | not very loud speakers (67.8 dB)
Bass 100 - 315 Hz
(-) | nearly no bass - on average 15.4% lower than median
(±) | linearity of bass is average (12.6% delta to prev. frequency)
Mids 400 - 2000 Hz
(+) | balanced mids - only 3.6% away from median
(±) | linearity of mids is average (8.5% delta to prev. frequency)
Highs 2 - 16 kHz
(+) | balanced highs - only 3.9% away from median
(±) | linearity of highs is average (7.9% delta to prev. frequency)
Overall 100 - 16.000 Hz
(±) | linearity of overall sound is average (19.7% difference to median)
Compared to same class
» 65% of all tested devices in this class were better, 6% similar, 29% worse
» The best had a delta of 5%, average was 17%, worst was 45%
Compared to all devices tested
» 50% of all tested devices were better, 7% similar, 43% worse
» The best had a delta of 4%, average was 24%, worst was 134%
HP Pavilion 15 Power 1GK62AV audio analysis
(-) | not very loud speakers (68.5 dB)
Bass 100 - 315 Hz
(-) | nearly no bass - on average 17.7% lower than median
(±) | linearity of bass is average (13.4% delta to prev. frequency)
Mids 400 - 2000 Hz
(+) | balanced mids - only 4.2% away from median
(±) | linearity of mids is average (8.8% delta to prev. frequency)
Highs 2 - 16 kHz
(+) | balanced highs - only 3.5% away from median
(±) | linearity of highs is average (11.6% delta to prev. frequency)
Overall 100 - 16.000 Hz
(±) | linearity of overall sound is average (26.8% difference to median)
Compared to same class
» 92% of all tested devices in this class were better, 2% similar, 6% worse
» The best had a delta of 5%, average was 17%, worst was 45%
Compared to all devices tested
» 82% of all tested devices were better, 4% similar, 14% worse
» The best had a delta of 4%, average was 24%, worst was 134%
Power Management
Power Consumption
Strikingly, the IdeaPad 720 has particularly high power consumption. Our test device consumes close to 10 W at idle, which is comparable only with the Pavilion Power 15, a device that has a much more powerful CPU. All our other comparison devices consume far less at idle than the IdeaPad 720.
Power consumption increases drastically to 86.7 W under maximum load and 84 W while playing The Witcher 3. Notably, devices like the Mi Notebook Pro i5 and the ZenBook UX3430UN have more powerful CPUs, but they are far more power-efficient under load.
| Off / Standby | |
| Idle | |
| Load |
|
Key:
min: | |
| Lenovo IdeaPad 720-15IKB i5-7200U, Radeon RX 560 (Laptop), Samsung PM961 MZVLW256HEHP, IPS, 1920x1080, 15.6" | Xiaomi Mi Notebook Pro i5 i5-8250U, GeForce MX150, Samsung PM961 MZVLW256HEHP, IPS LED, 1920x1080, 15.6" | Asus Zenbook UX3430UN-GV174T i5-8250U, GeForce MX150, SK Hynix HFS256G39TND-N210A, IPS, 1920x1080, 14" | HP Pavilion 15 Power 1GK62AV i7-7700HQ, GeForce GTX 1050 Mobile, SK Hynix HFS256G39TND-N210A, IPS, 1920x1080, 15.6" | Acer Aspire 7 A715-71G-53TU i5-7300HQ, GeForce GTX 1050 Mobile, Kingston RBUSNS8180DS3128GH, a-Si TFT-LCD, IPS, 1920x1080, 15.6" | HP Pavilion Power 15t-cb2000 i7-7700HQ, Radeon RX 550 (Laptop), HGST Travelstar 7K1000 HTS721010A9E630, IPS, 1920x1080, 15.6" | Asus Zenbook UX430UN i5-8550U, GeForce MX150, SanDisk SD8SN8U512G1002, IPS, 1920x1080, 14" | MSI PL62 MX150 7300HQ i5-7300HQ, GeForce MX150, , TN LED, 1920x1080, 15.6" | HP Envy 17-ae143ng i5-8250U, GeForce MX150, Liteonit CV3-8D128, IPS, 1920x1080, 17.3" | Average AMD Radeon RX 560 (Laptop) | Average of class Multimedia | |
|---|---|---|---|---|---|---|---|---|---|---|---|
| Power Consumption | 34% | 29% | -17% | 8% | -47% | 41% | -16% | 14% | 5% | -3% | |
| Idle Minimum * (Watt) | 9.9 | 3.7 63% | 4.5 55% | 9.4 5% | 4 60% | 18.7 -89% | 3 70% | 9.2 7% | 4.8 52% | 7.3 ? 26% | 5.71 ? 42% |
| Idle Average * (Watt) | 9.5 | 7.5 21% | 7.8 18% | 9.7 -2% | 6.9 27% | 19.6 -106% | 5.8 39% | 13.6 -43% | 8.3 13% | 8.65 ? 9% | 10.1 ? -6% |
| Idle Maximum * (Watt) | 10.7 | 8 25% | 8.1 24% | 16.8 -57% | 9.4 12% | 21.7 -103% | 6.2 42% | 14.7 -37% | 10.3 4% | 9.55 ? 11% | 12.4 ? -16% |
| Load Average * (Watt) | 62 | 49 21% | 52 16% | 76.5 -23% | 72.6 -17% | 60.1 3% | 54.1 13% | 64 -3% | 61 2% | 69.3 ? -12% | 65 ? -5% |
| Witcher 3 ultra * (Watt) | 84 | 50.6 40% | 86.5 -3% | 80.5 4% | 45.9 45% | ||||||
| Load Maximum * (Watt) | 86.7 | 55.2 36% | 59 32% | 105.6 -22% | 122 -41% | 80.6 7% | 56.4 35% | 89.2 -3% | 86 1% | 96.4 ? -11% | 112.2 ? -29% |
* ... smaller is better
Battery Life
Lenovo does not confirm battery capacity on either its website nor on the IdeaPad 720’s specification sheet. HWInfo informs us that our test device has a 40 Wh battery with a 45 Wh design capacity. Curiously, we can only find 30 Wh replacement batteries. Regardless, Lenovo promises up to 10 hours of battery life.
We set our test device to airplane mode and set brightness to its lowest level to measure our test device’s maximum idle runtime. We then run a script using Battery Eater. Our test device lasts 16 hours in this test, which is significantly better than the average idle runtime of multimedia laptops that we have tested.
We also subjected our test device to a more practical battery test that simulates the load required to render websites. We left all connectivity on and set display luminosity to 150 cd/m². Our test device lasted just over seven hours, which isn’t all that impressive. The Mi Notebook Pro i5, for example, lasts three hours longer than the IdeaPad 720.
Finally, we tested the minimum expected battery runtime by setting the display at maximum brightness and running the Battery Classic test. Our test device lasted only 50 minutes in this battery runtime under load test, which is a shorter runtime than all our comparison devices.
Our test device takes 2 h 24 m to fully recharge with the included 90 W power supply. Charging is nonlinear though, as it only took 54 minutes to charge the battery up to 50%, but it took almost 90 minutes to get past 80% charge.
| Lenovo IdeaPad 720-15IKB i5-7200U, Radeon RX 560 (Laptop), 40 Wh | Asus Zenbook UX3430UN-GV174T i5-8250U, GeForce MX150, 48 Wh | Xiaomi Mi Notebook Pro i5 i5-8250U, GeForce MX150, 60 Wh | HP Pavilion 15 Power 1GK62AV i7-7700HQ, GeForce GTX 1050 Mobile, 70 Wh | Acer Aspire 7 A715-71G-53TU i5-7300HQ, GeForce GTX 1050 Mobile, 48 Wh | Average of class Multimedia | |
|---|---|---|---|---|---|---|
| Battery runtime | 43% | 68% | 46% | -1% | 78% | |
| Reader / Idle (h) | 16.1 | 22.8 42% | 16.2 1% | 9.9 -39% | 25.2 ? 57% | |
| H.264 (h) | 9.2 | 8.4 -9% | 10.5 14% | 5.1 -45% | 16.4 ? 78% | |
| WiFi v1.3 (h) | 7.1 | 8.1 14% | 10 41% | 8 13% | 5.6 -21% | 12 ? 69% |
| Load (h) | 0.8 | 1.8 125% | 2 150% | 1.8 125% | 1.6 100% | 1.675 ? 109% |
| Witcher 3 ultra (h) | 1.4 |
Verdict
Pros
Cons
The Lenovo IdeaPad 720-15IKB joins the ranks of other 15-inch multimedia notebooks. Lenovo has tried to garner interest in the device by using a mostly aluminum case to give the IdeaPad 720 a solid appearance. All our comparison devices have plastic cases except for the Mi Notebook Pro i5.
Lenovo has put some effort into the IdeaPad 720’s input devices too. The keyboard has defined and crisp pressure points and a decent touchpad. The IdeaPad 720 should be suitable for office work on the strength of its input devices.
We would have preferred a brighter display as Lenovo has equipped the IdeaPad 720 with one that is only average for its class.
Our test device’s performance has left us somewhat conflicted though. While the Intel Core i5-7200U cannot compete with newer CPUs, the combination of a dedicated GPU and fast PCIe storage means that the IdeaPad 720 has excellent system performance.
Equally, there are positives and negatives regarding emissions too. While fan noise is minimal, the occasional high-pitched frequency is annoying, and surface temperatures are largely relatively cool albeit there are hot spots.
Battery life is nothing of note either. The IdeaPad 720 managed around seven hours in our Wi-Fi battery test, which puts the device among the midfield of all the 15-inch multimedia notebooks that we have tested in the last 12 months.
The Lenovo IdeaPad 720-15IKB is a device that is greater than the sum of its parts. The device lacks a stand-out feature, but Lenovo has done a good job. Overall, the IdeaPad 720 is a multimedia device that is suitable for daily use.
We would recommend that you look at the HP Pavilion Power 15 if you are looking for more power and a better gaming experience. Likewise, the Xiaomi Mi Notebook Pro i5 has better battery life and a better display. In short, the Lenovo IdeaPad 720-15IKB does nothing to set itself out from the competition.
Lenovo IdeaPad 720-15IKB
- 06/13/2018 v6 (old)
Nino Ricchizzi
Price comparison

