Asus ZenBook UX430UN (i7-8550U, GeForce MX150) Laptop Review
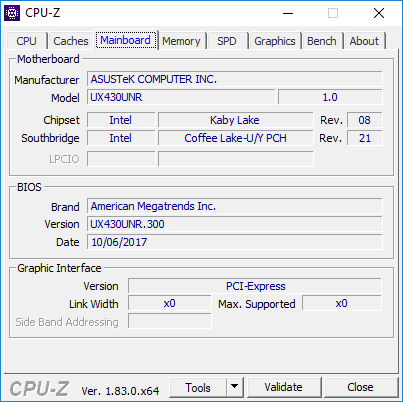
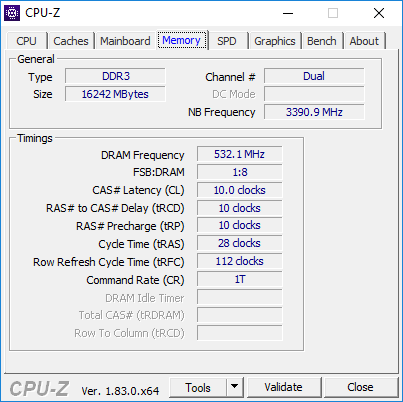
The 14-inch Asus Zenbook UX430 series can be seen as the more affordable version of the flagship 14-inch Zenbook UX490 series. Whereas the latter is thinner, lighter, and with just USB Type-C ports, the former includes more connectivity ports and the much faster GeForce MX150 option for superior gaming performance. Users can choose between the UX430UA with HD Graphics 620, UX430UN with GeForce MX150, or the UX430UQ with the aging GeForce 940MX. All SKUs are otherwise identical in appearance with matte FHD displays, Kaby Lake or Kaby Lake-R CPUs, and up to 16 GB of LPDDR3 RAM and 512 GB of M.2 SATA III storage. Our test model today is the highest-end UX430UN SKU retailing for $1200 USD.
The UX430 competes directly against the 13.3-inch XPS 13 9370, 15-inch Samsung NP900X5T, 15.4-inch MacBook Pro 15, 13.9-inch Lenovo Yoga 920, 13.3-inch HP Spectre 13, and the 14-inch Acer Swift 3 in the ultra thin-and-light notebook category.
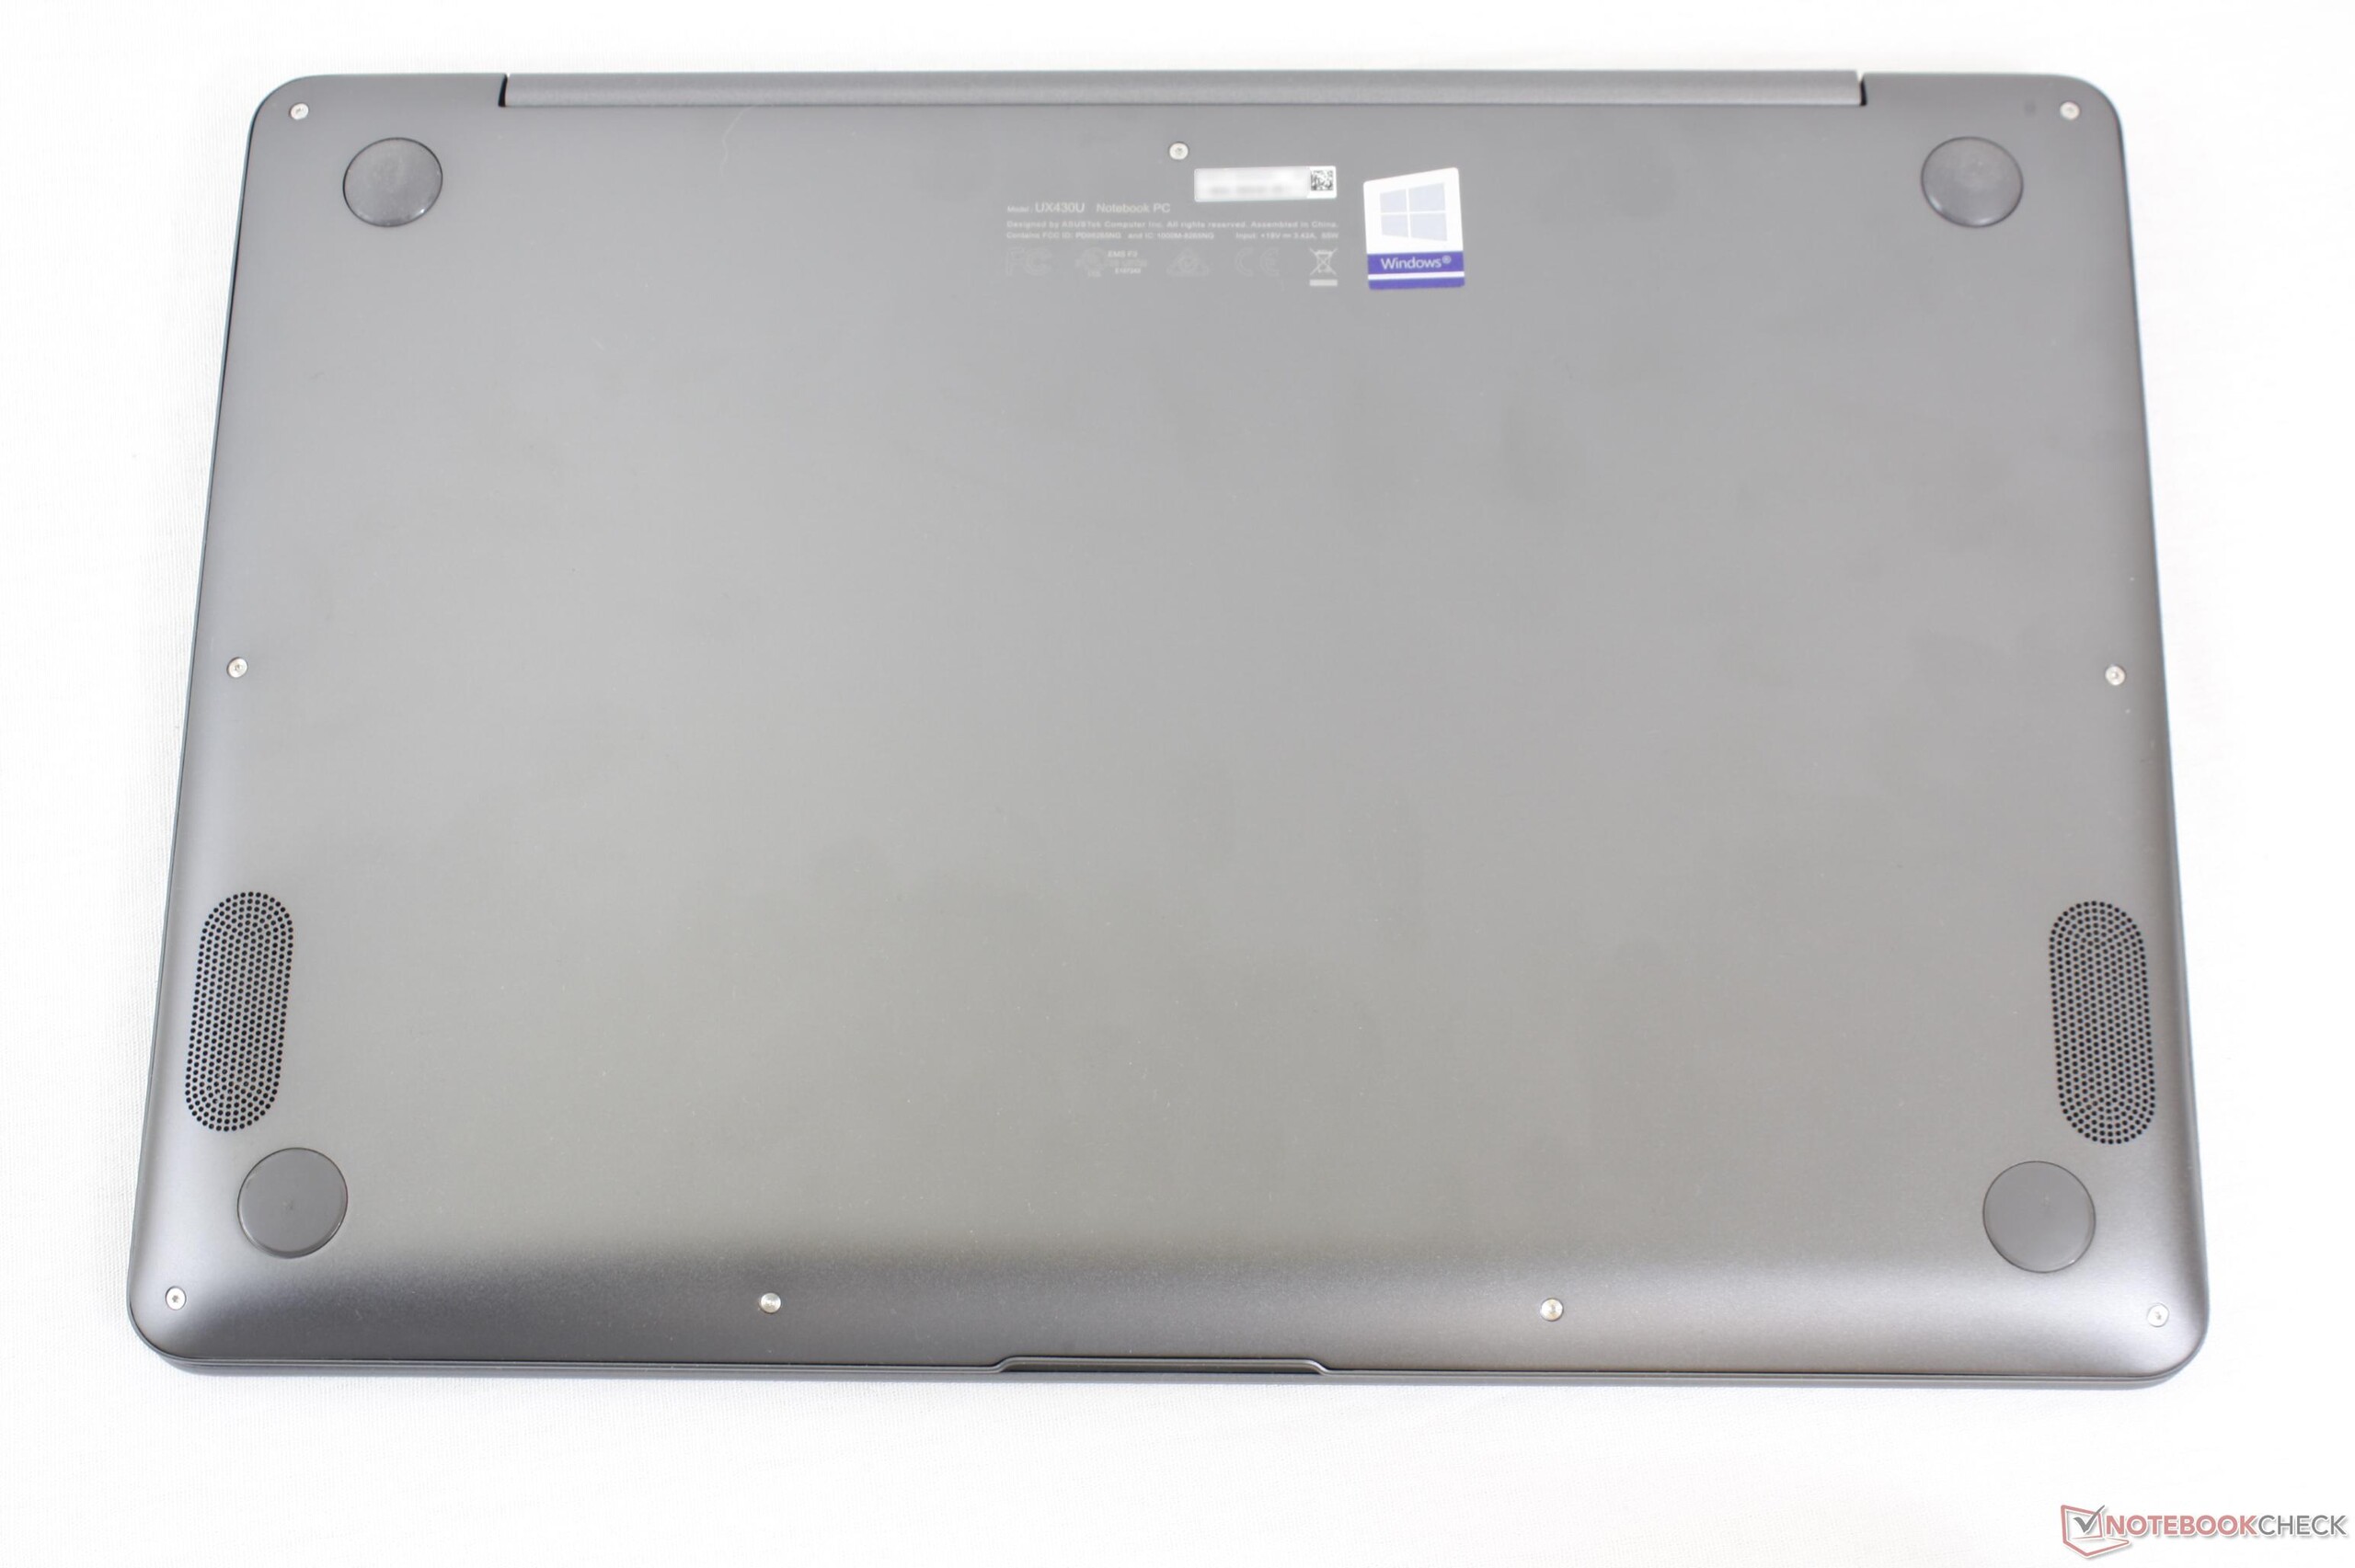
Case
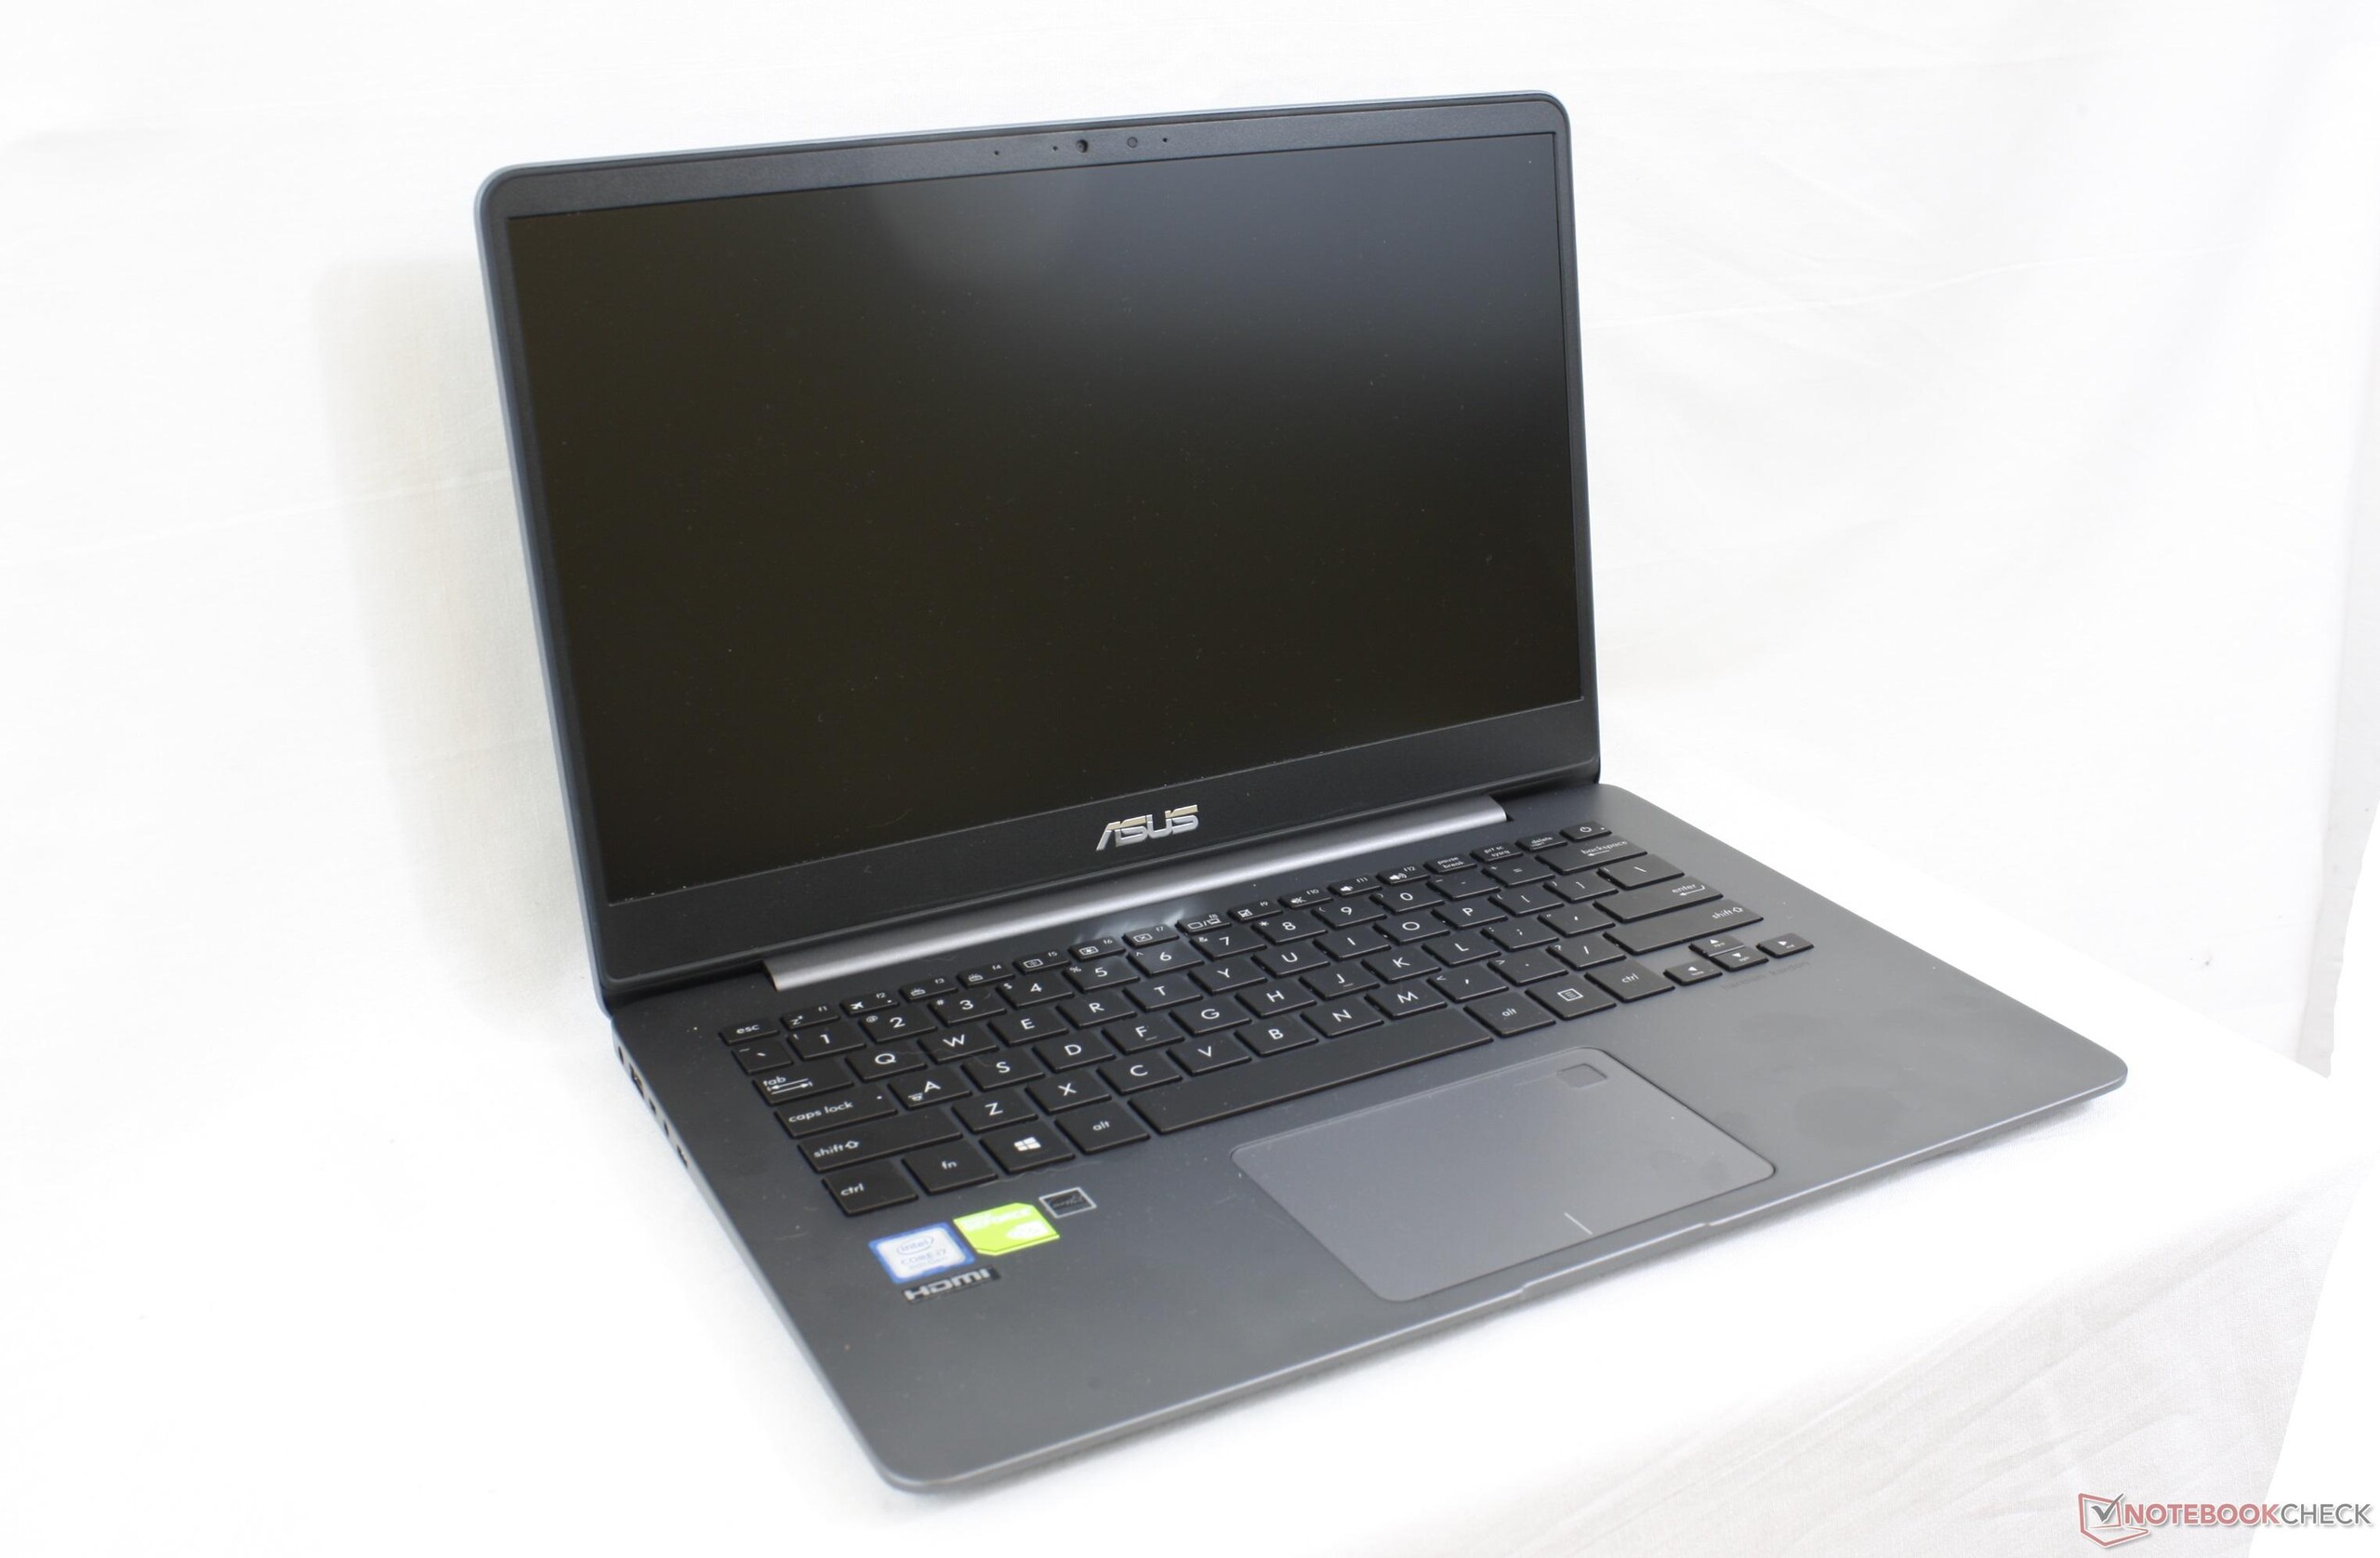
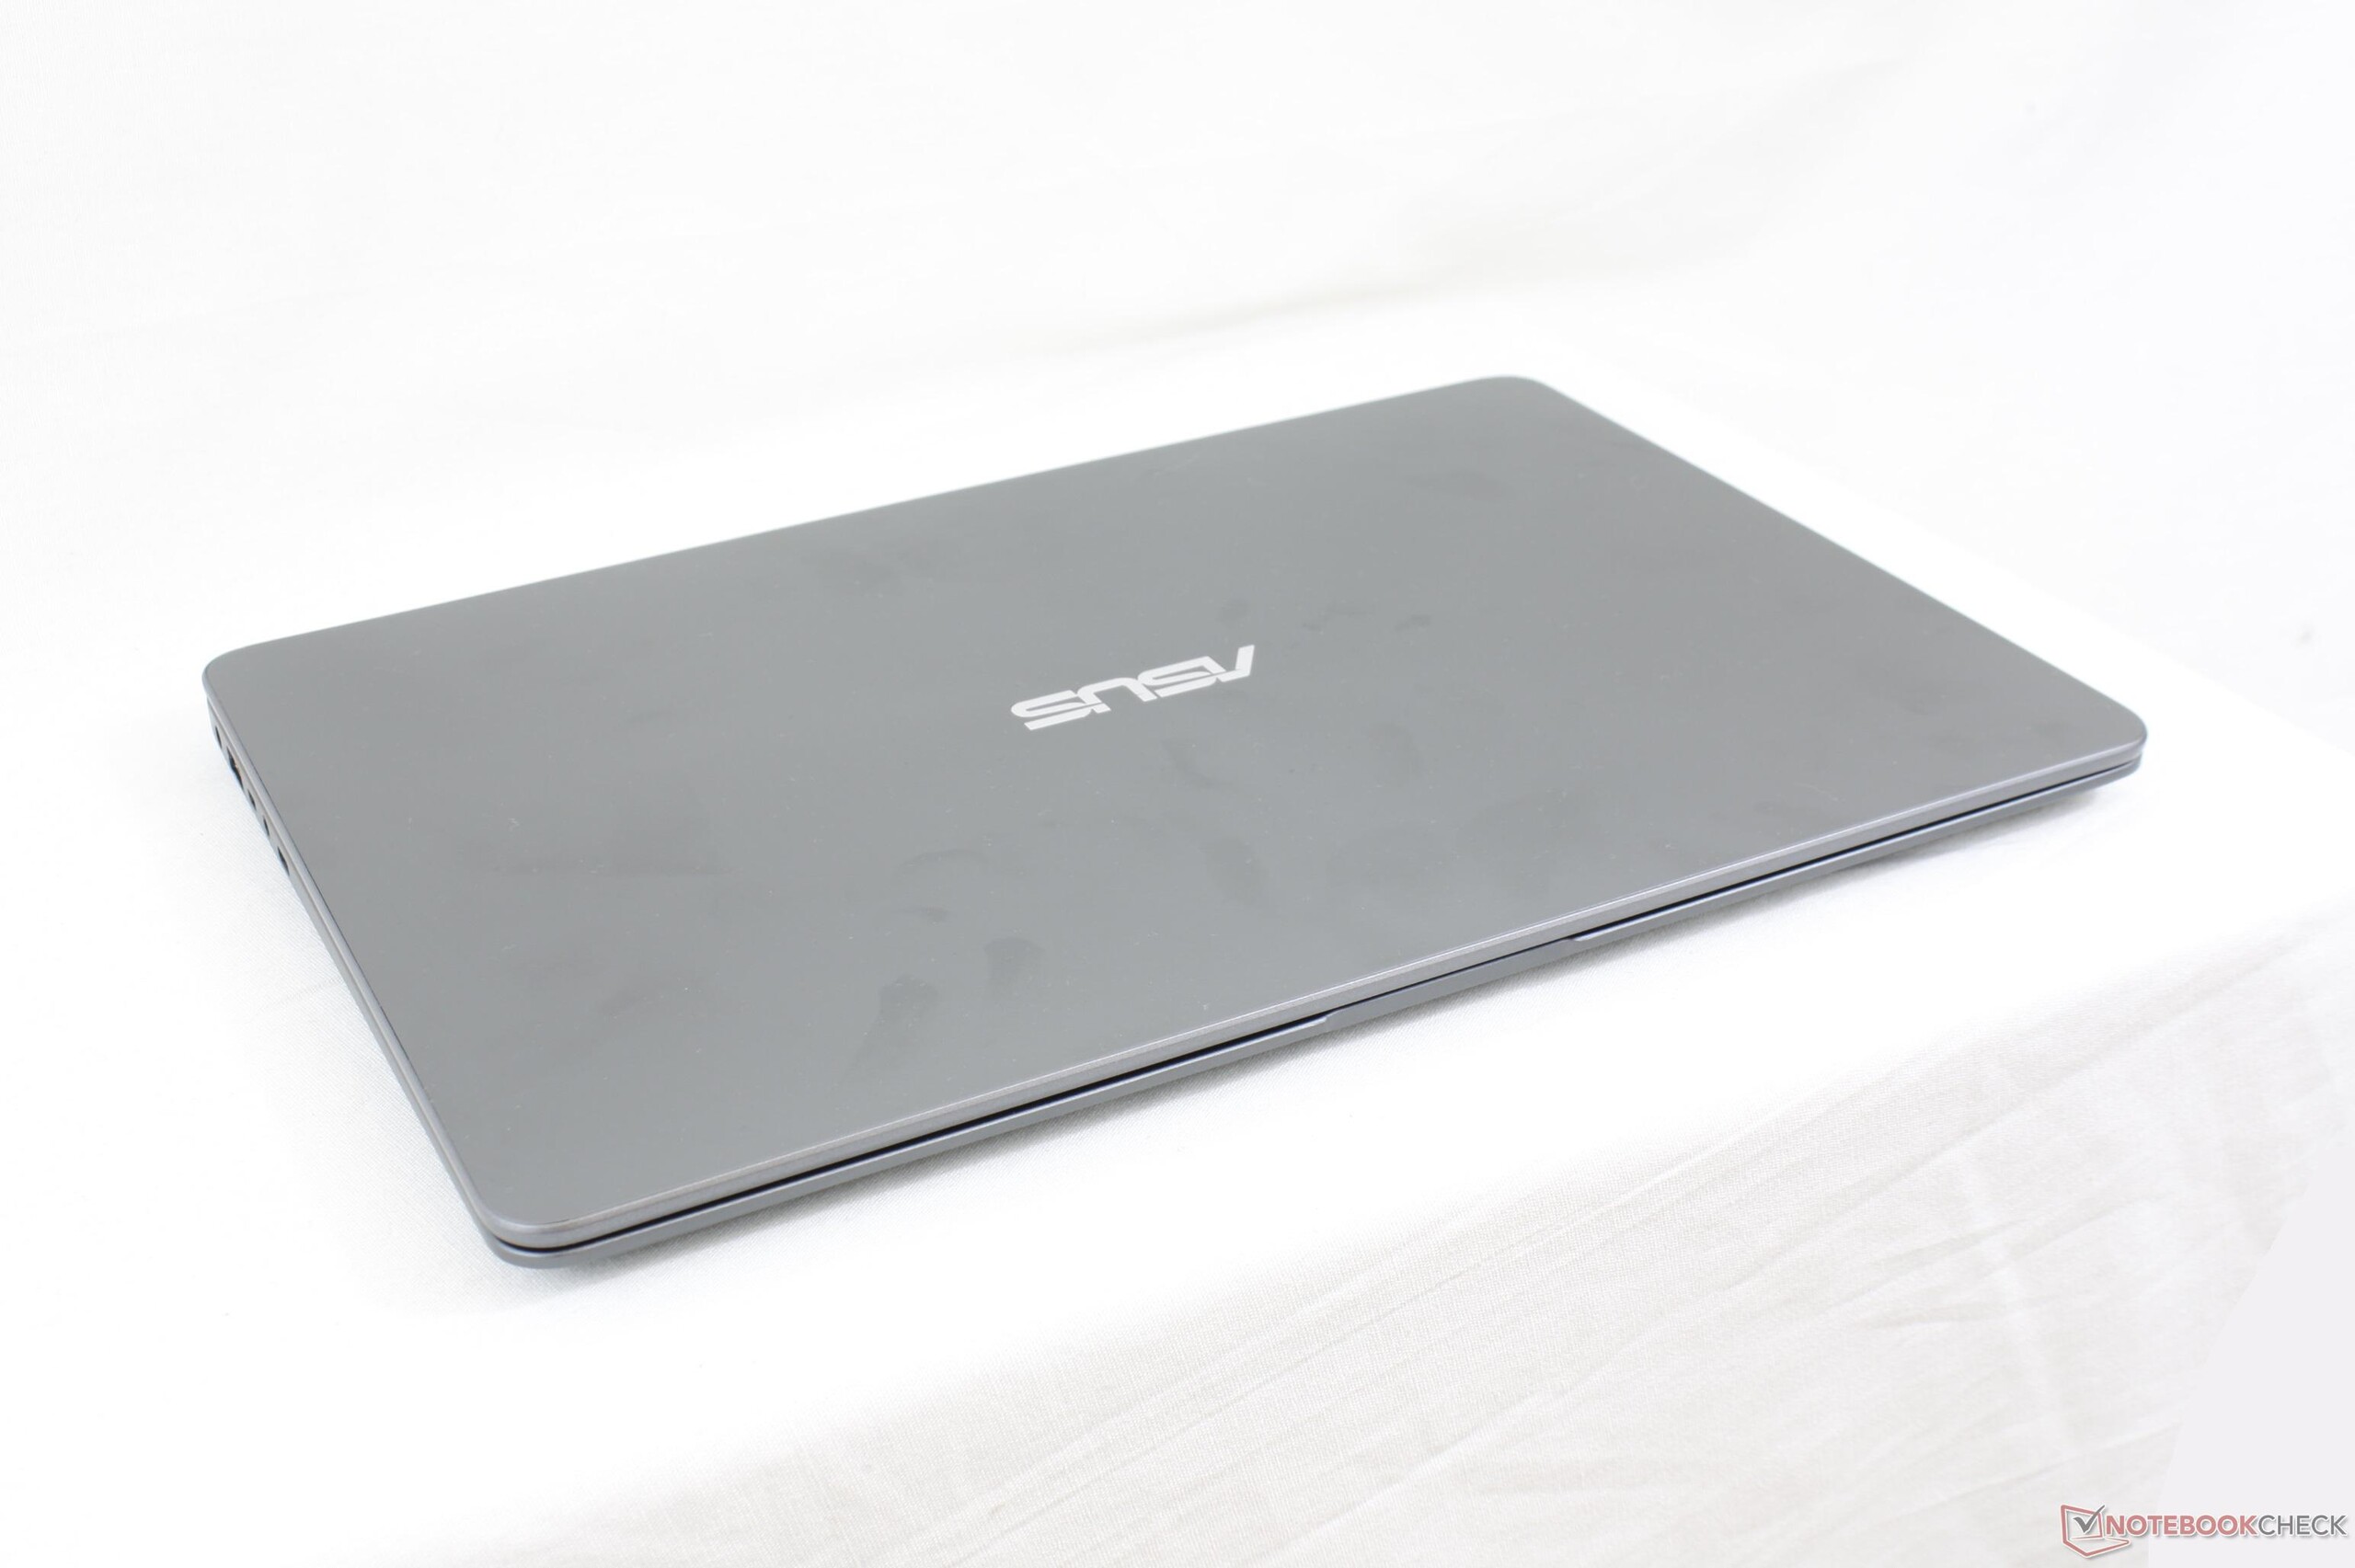
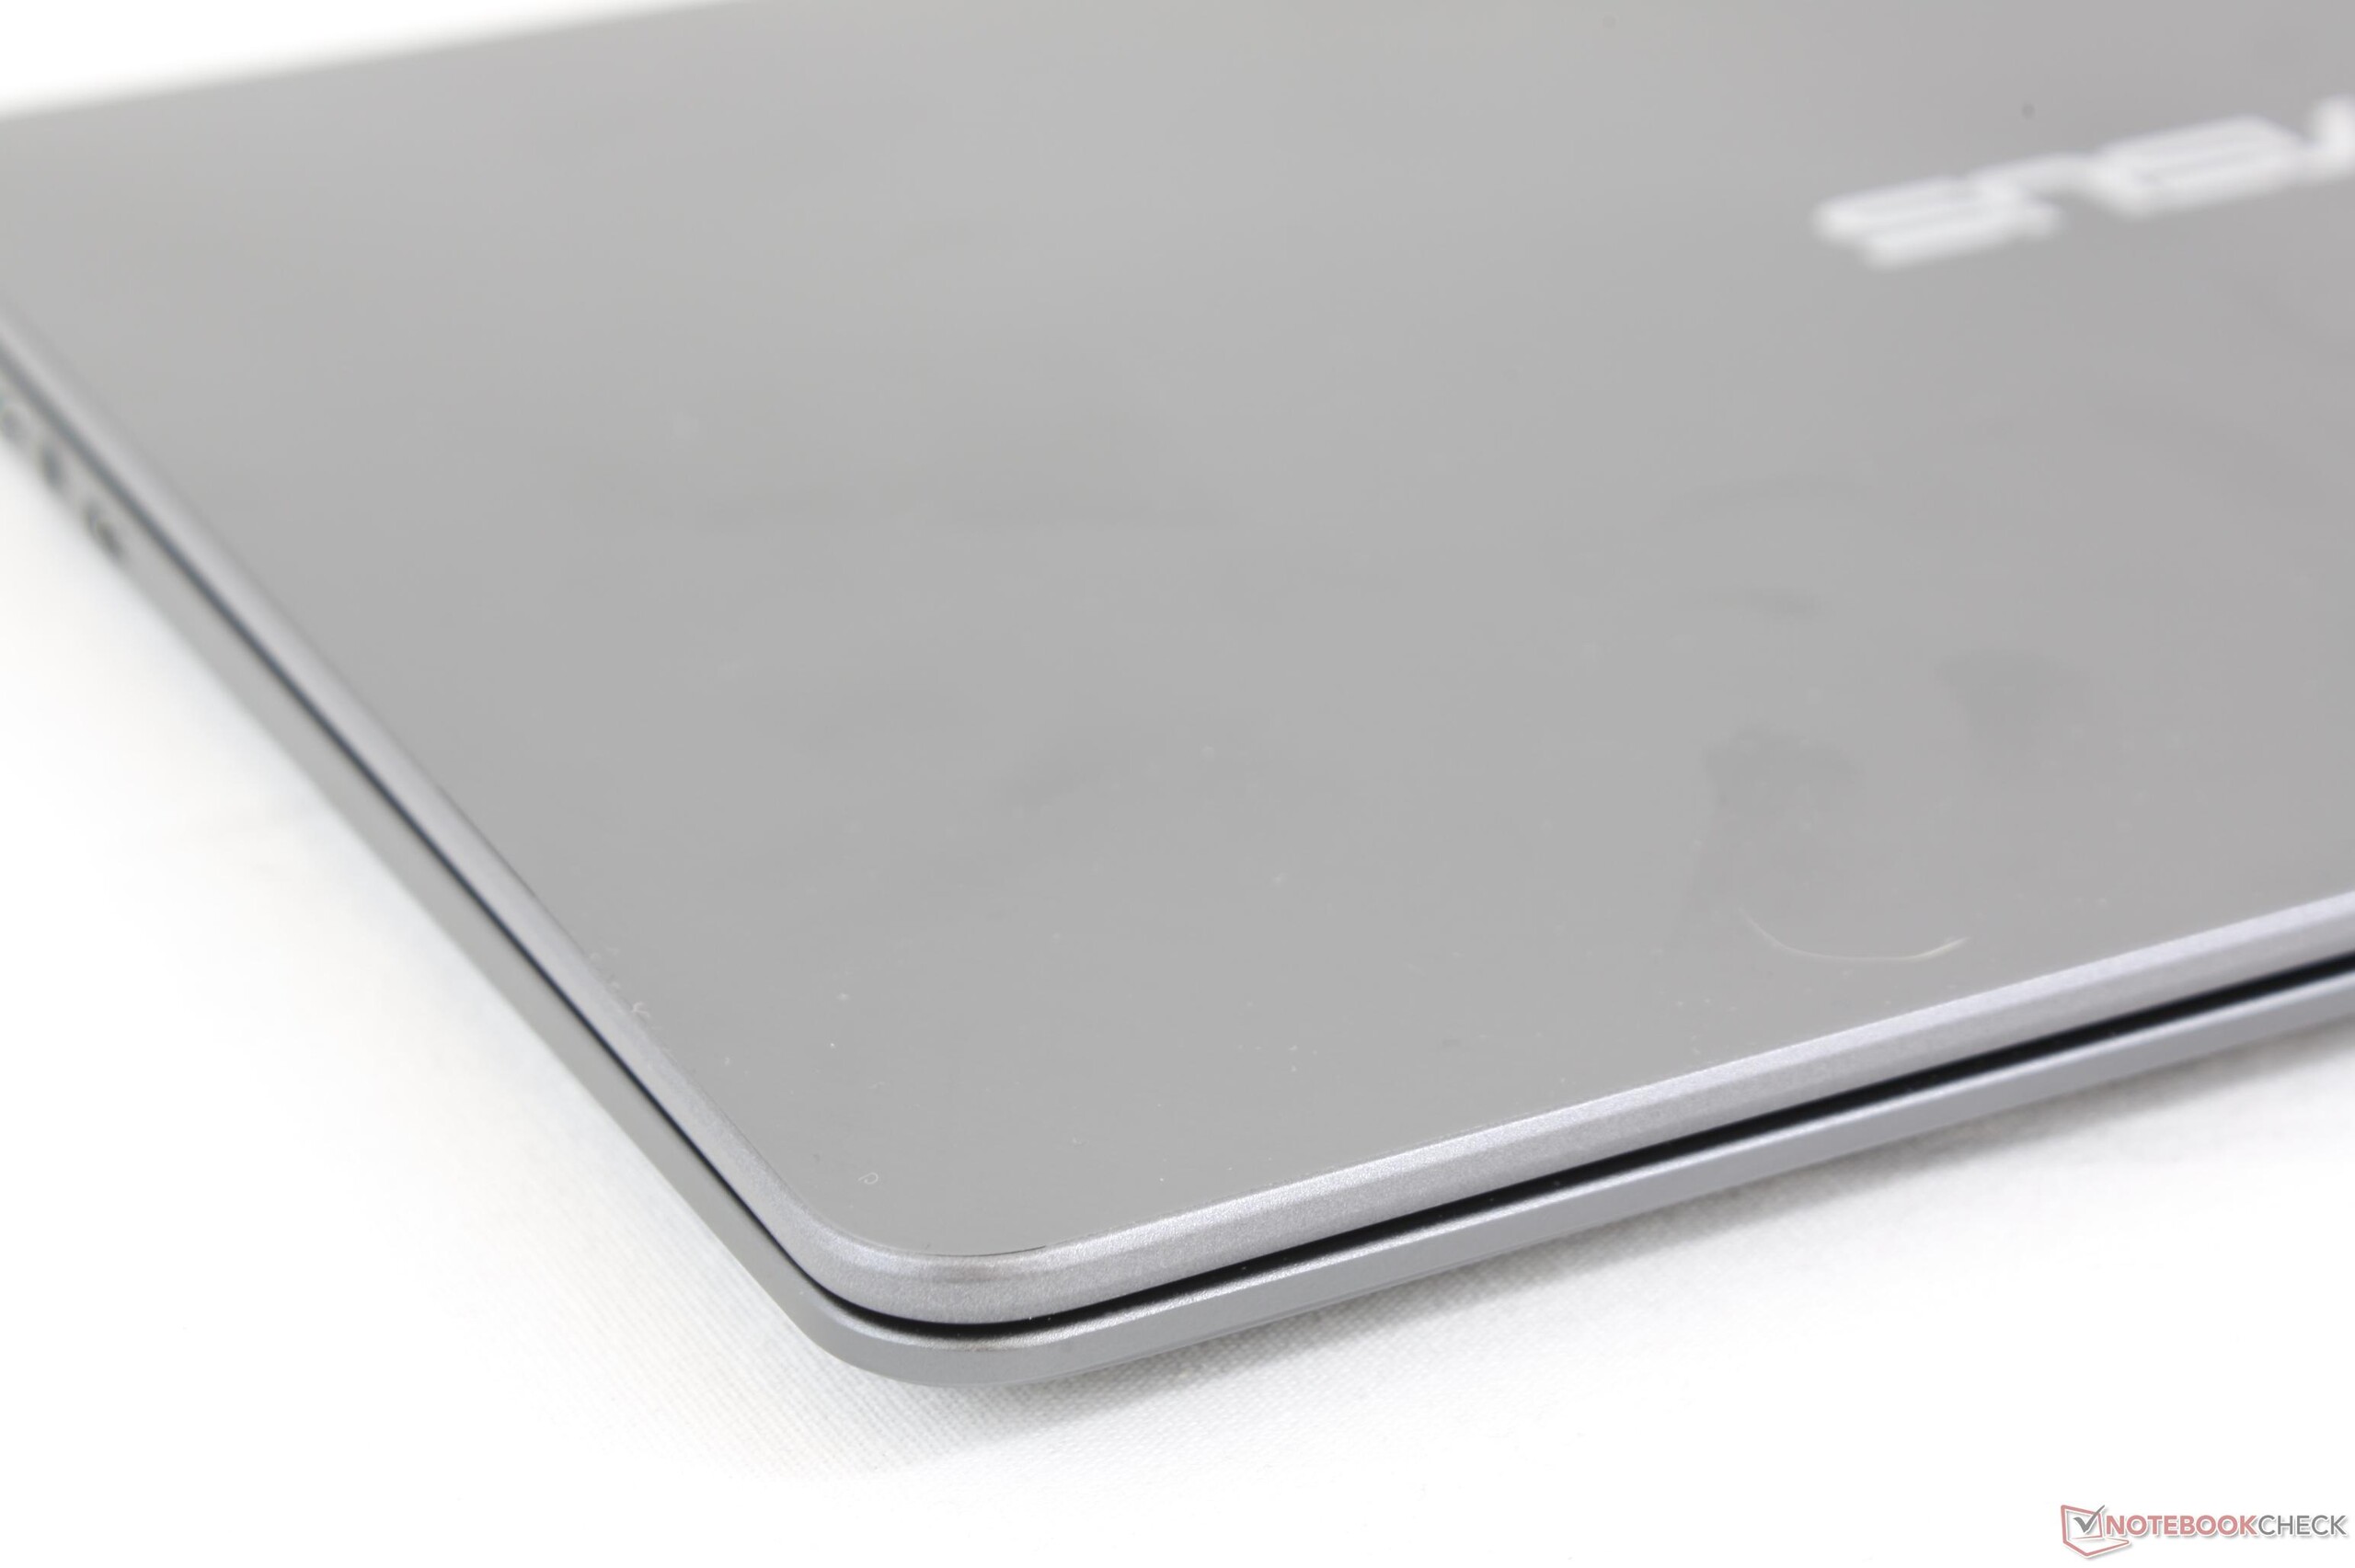
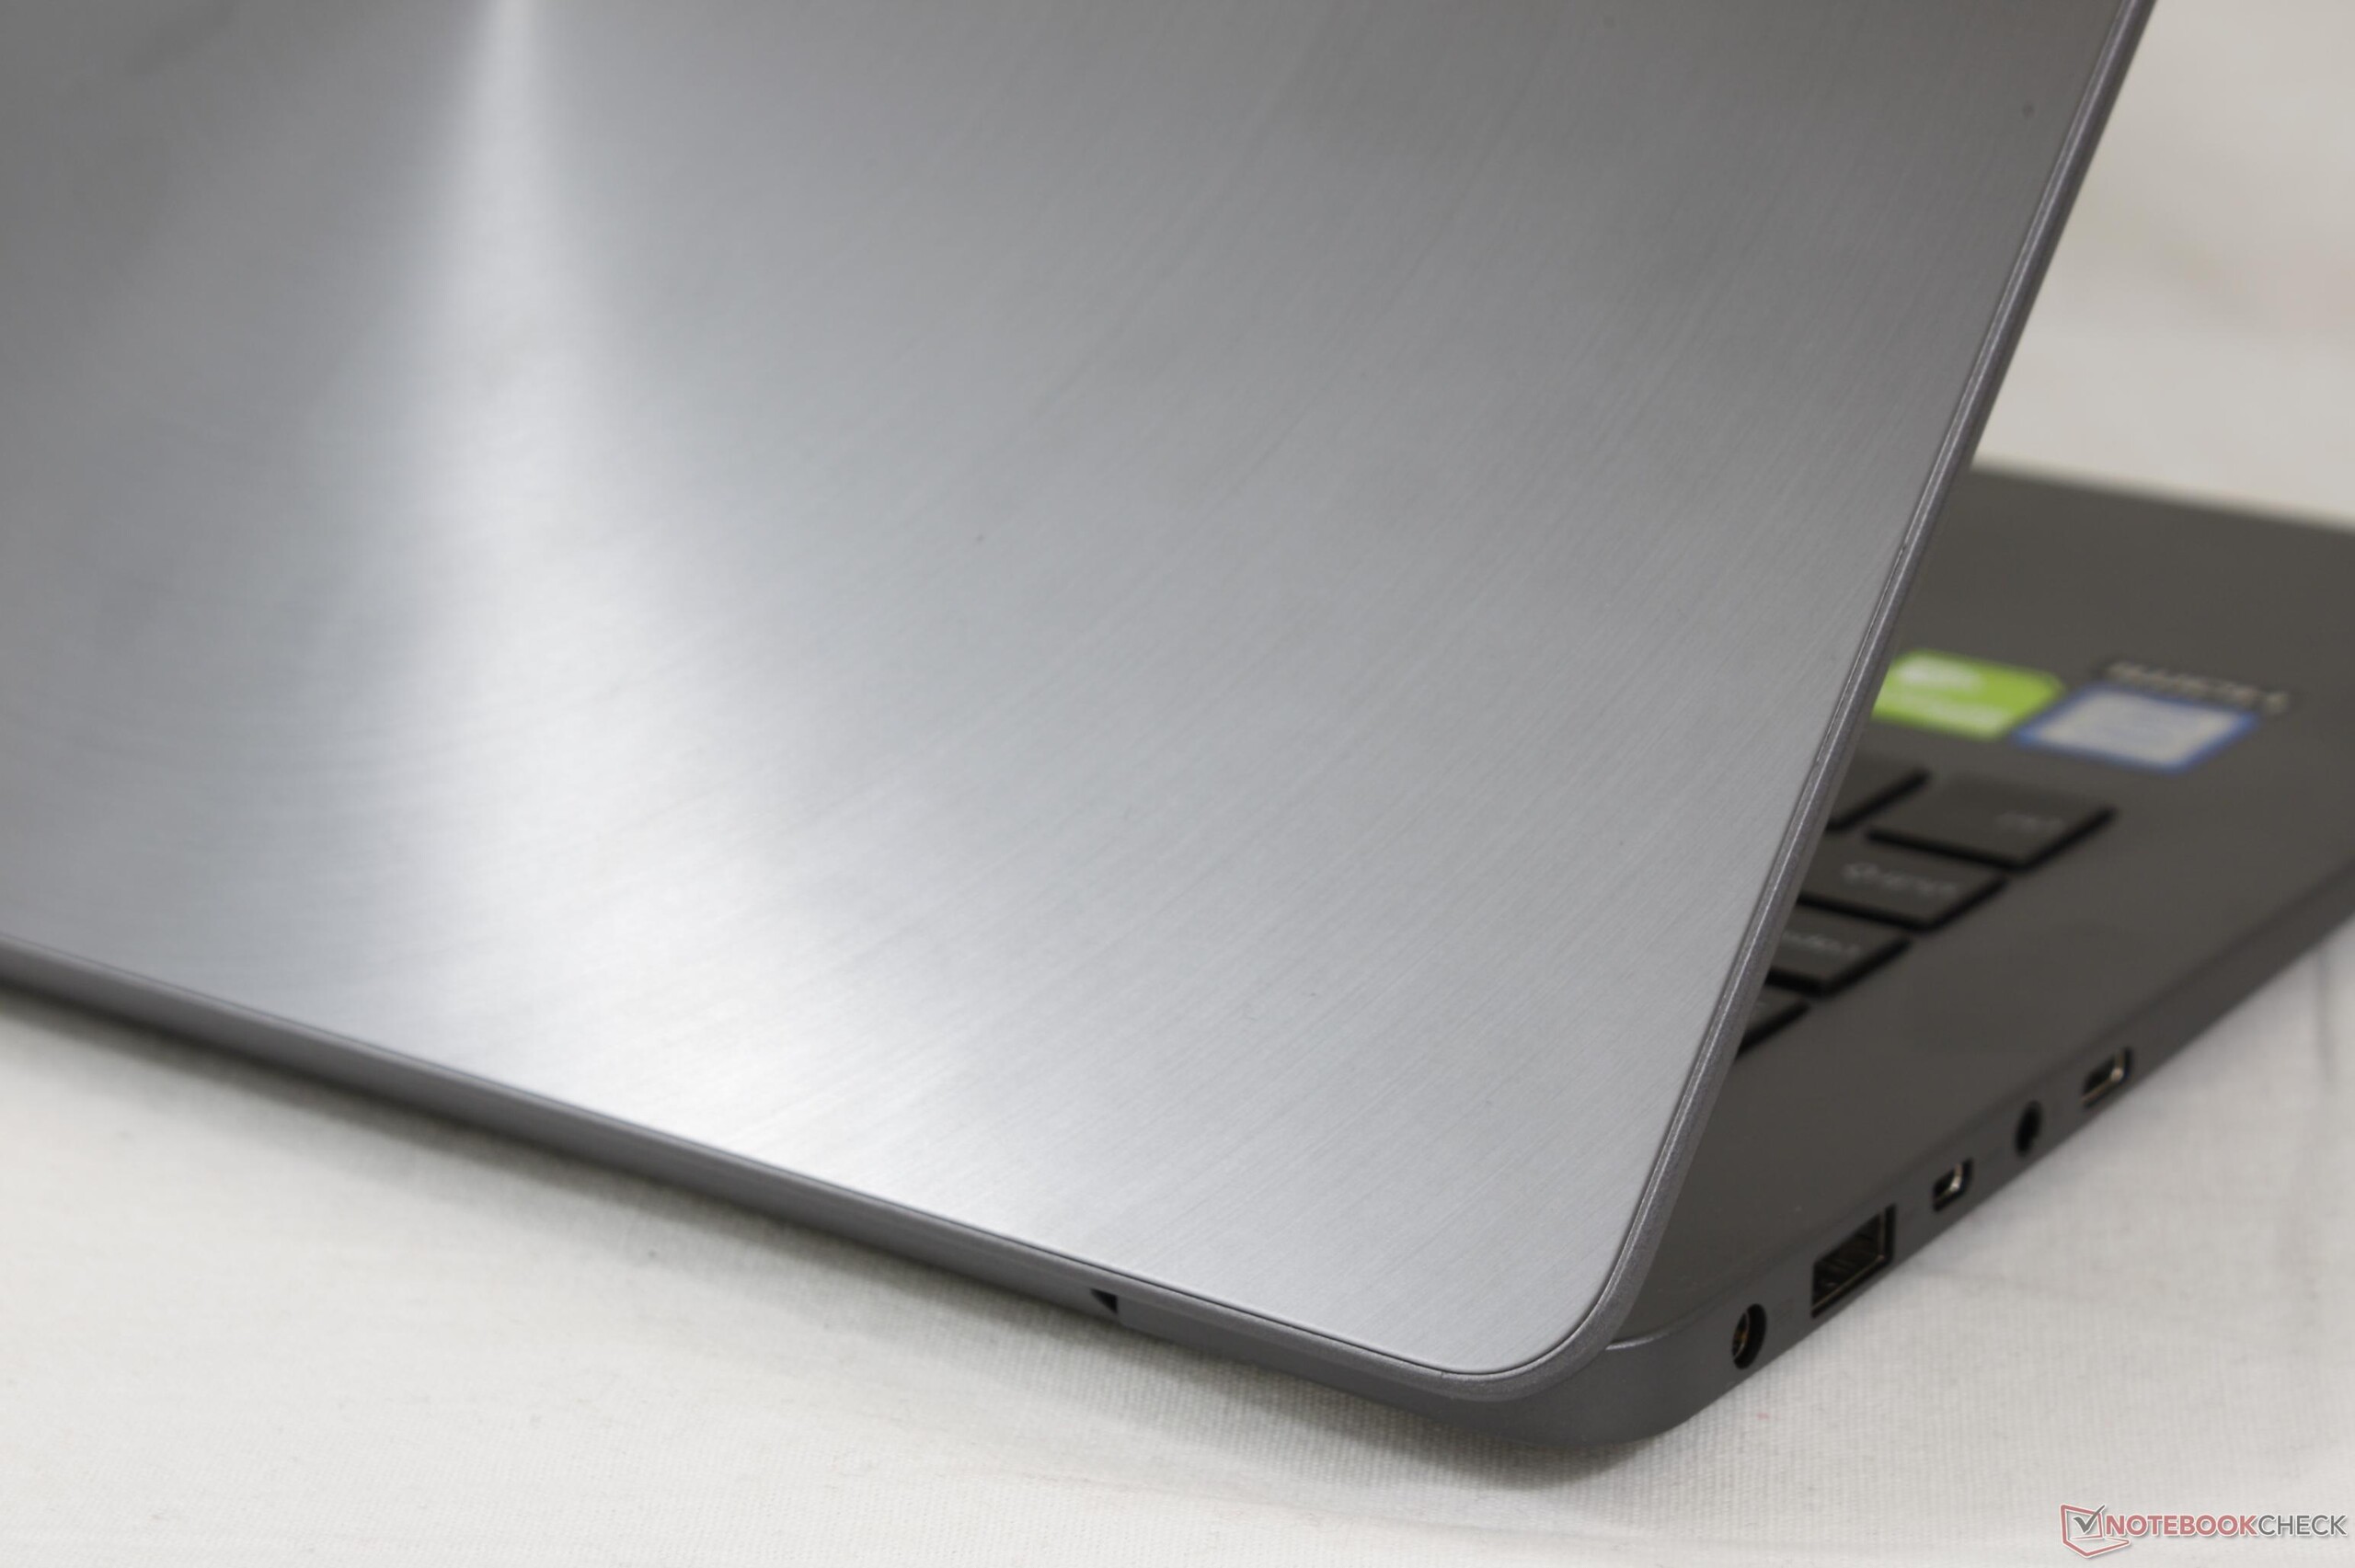
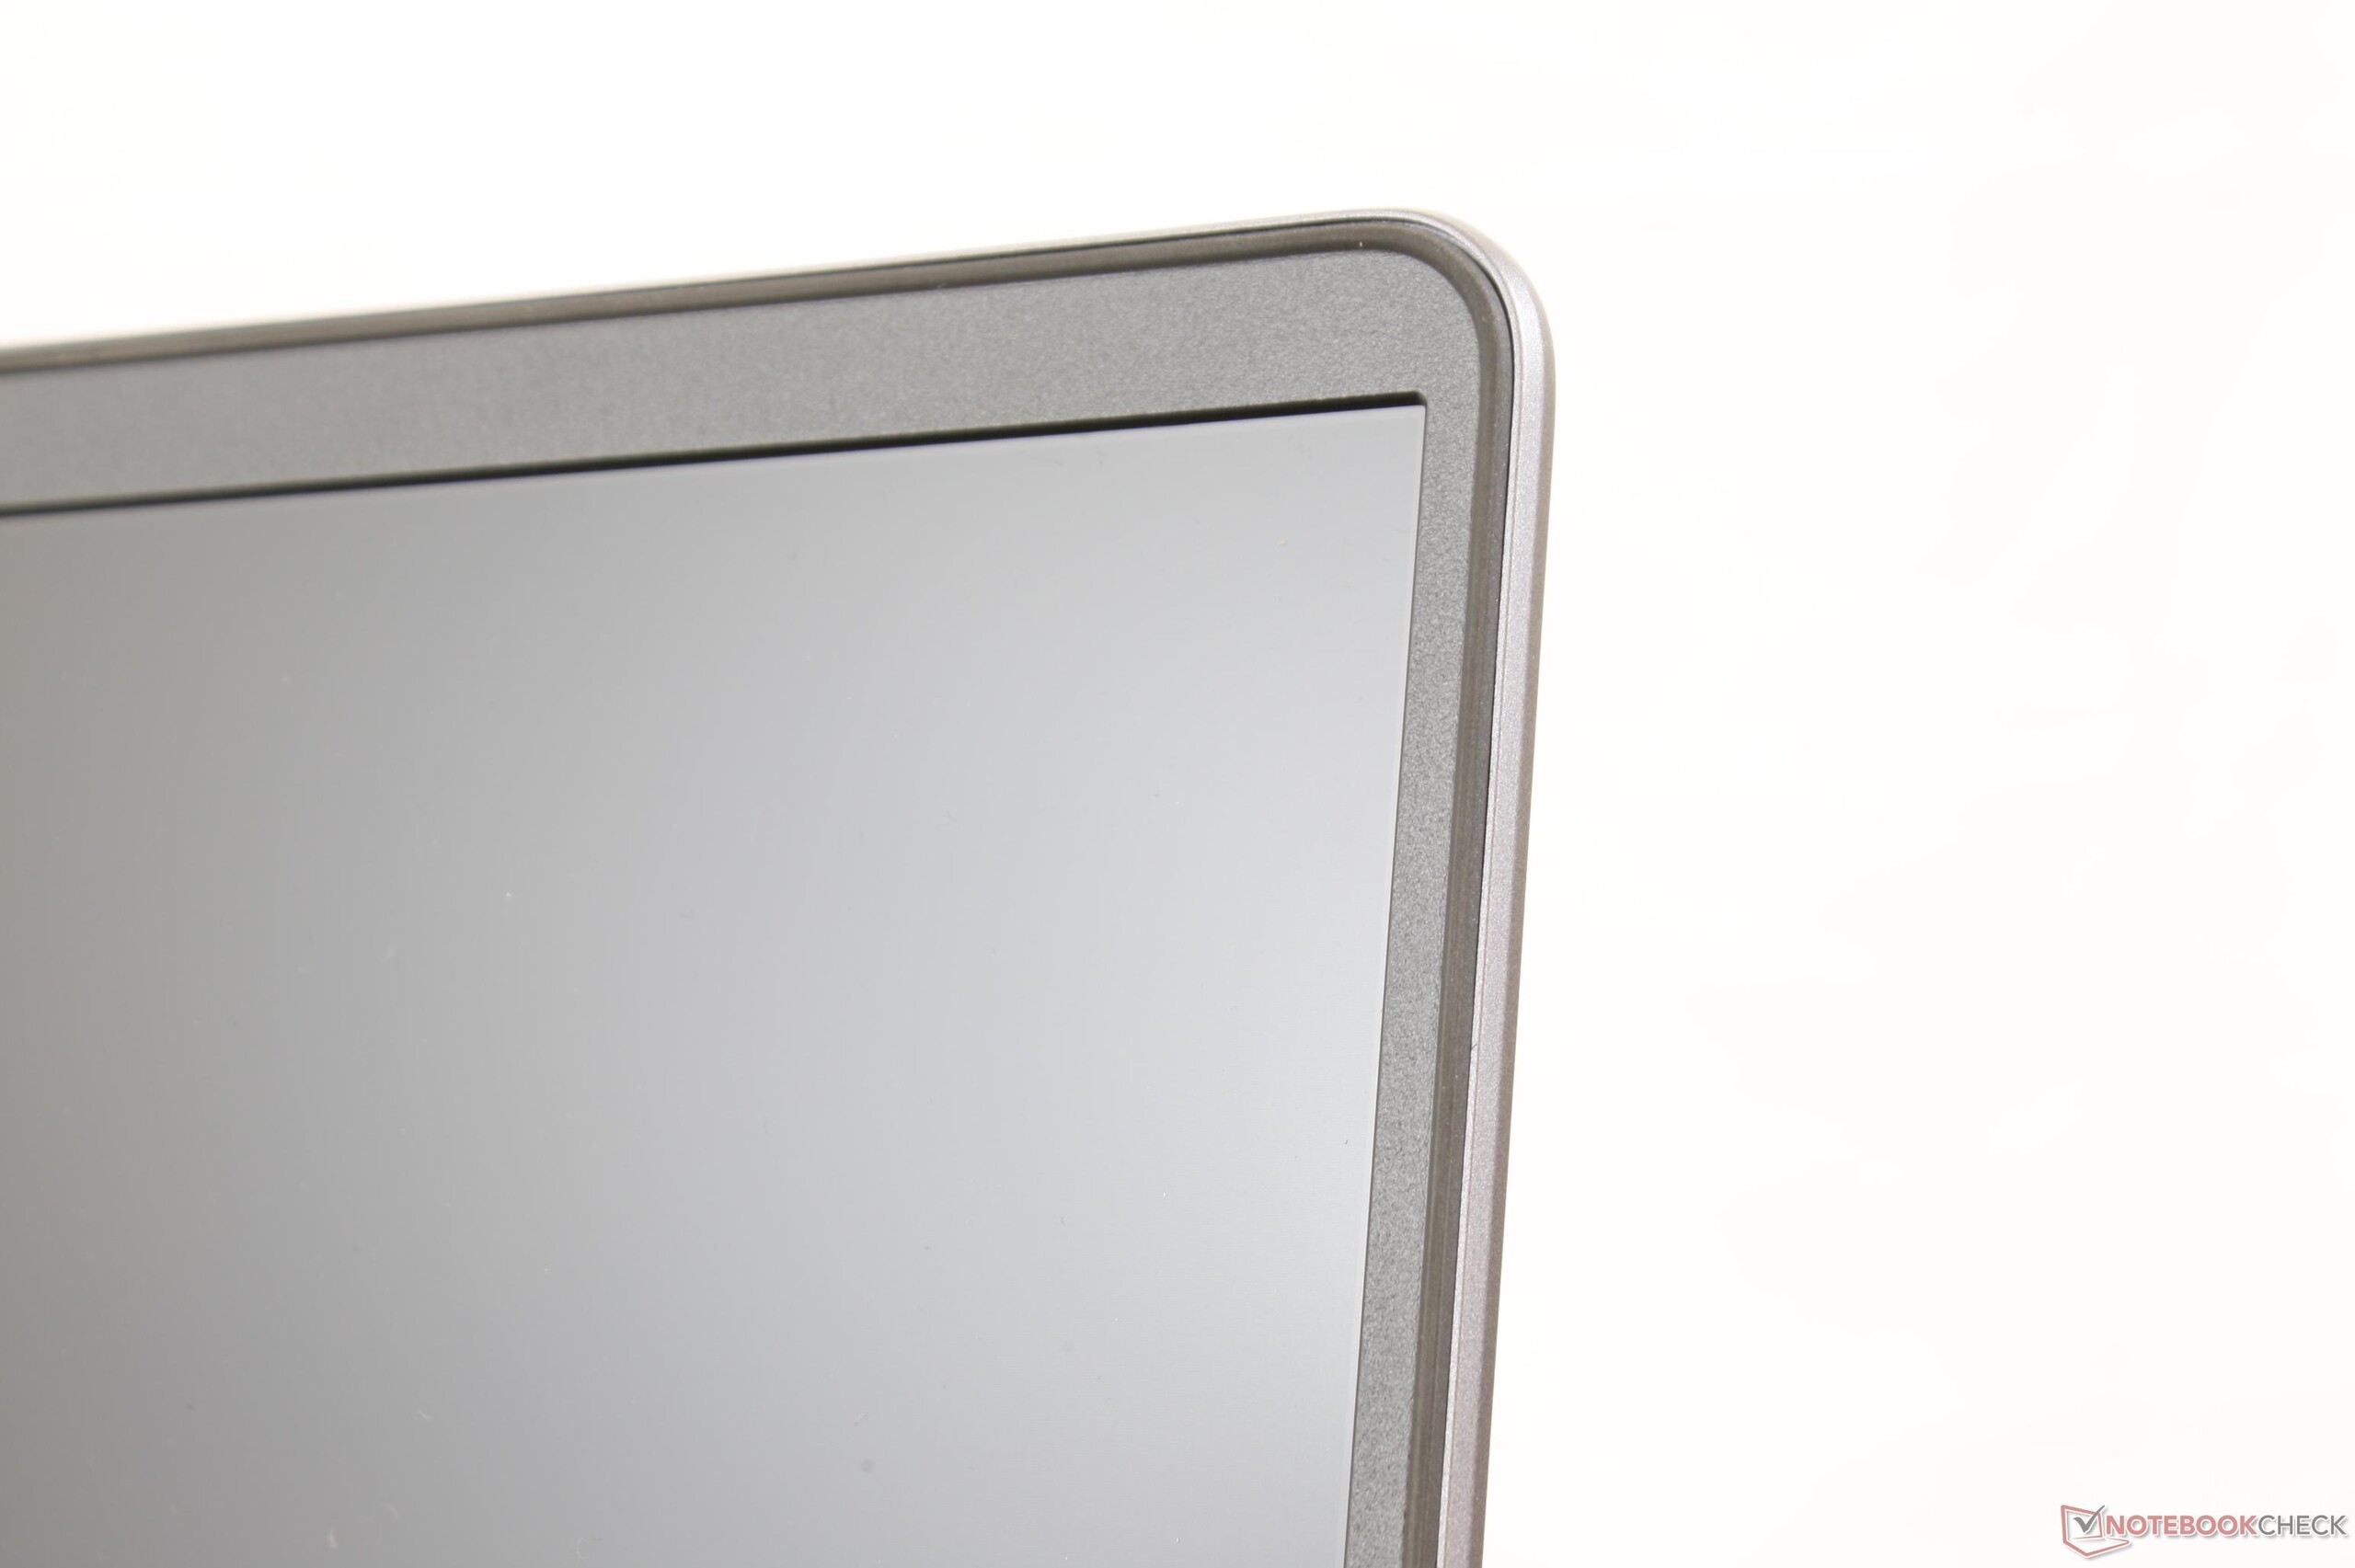
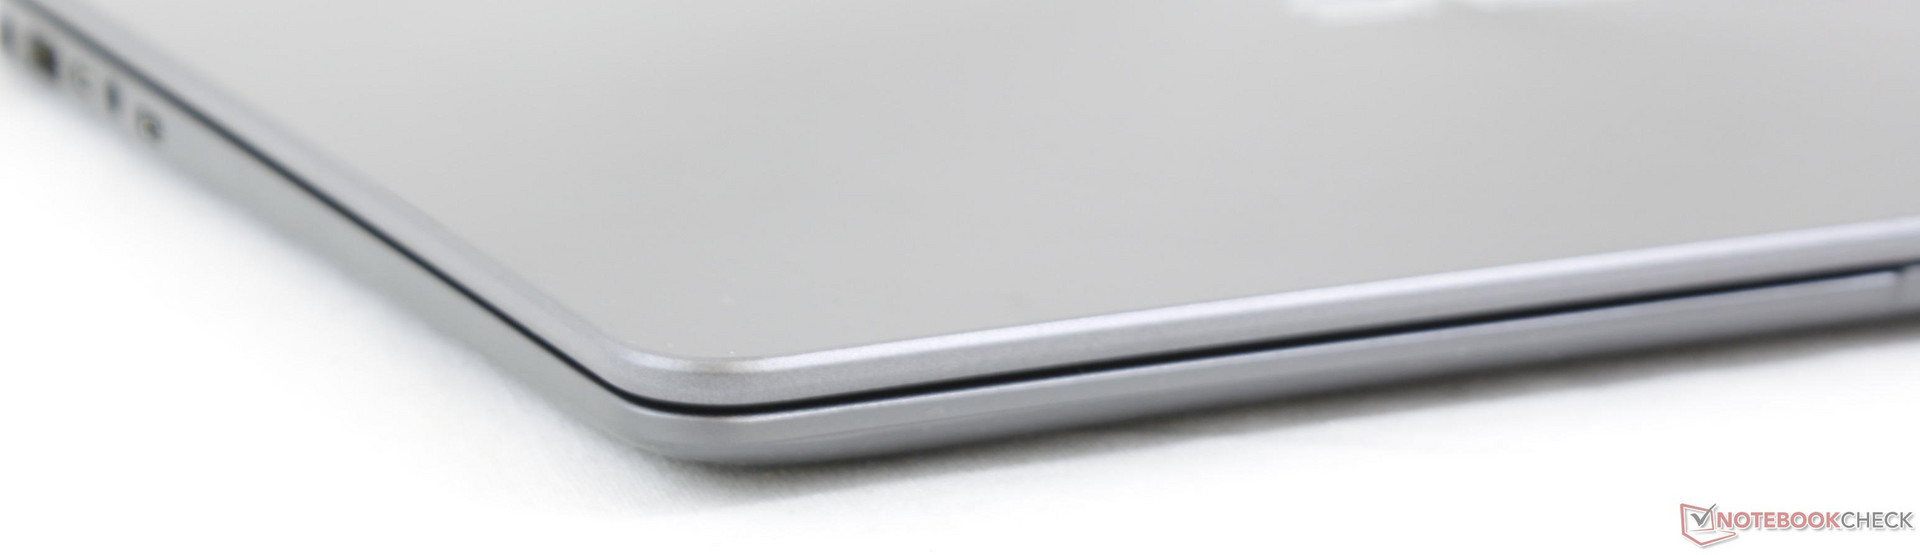
The chassis draws obvious inspirations from the costlier Zenbook 3 UX490UA. The signature concentric brushed aluminum outer lid, tapered design, smooth surfaces, and "NanoEdge" narrow bezels all return for a very familiar visual style that is shared across the ZenBook family. Omitted are the superficial gold chrome-cut edges and corners for a more unicolor and subtle look.
Chassis rigidity is similar to the Samsung NP900X5T but weaker than the XPS 13 9360 and 9370. Attempting to twist the base from its front corners, for example, will result in slight bending and a small amount of creaking. Applying moderate force on the palm rests or center of the keyboard will also slightly but visibly warp the surface. Meanwhile, the lid is more flexible than we would like due to its narrow bezels and lack of Gorilla Glass reinforcement. Though the distortions are minimal and far from severe when applying pressure, competing notebooks in this size category like the Spectre x360 13, Razer Blade 14, XPS 13, or MacBook Pro 13 all offer sturdier designs.
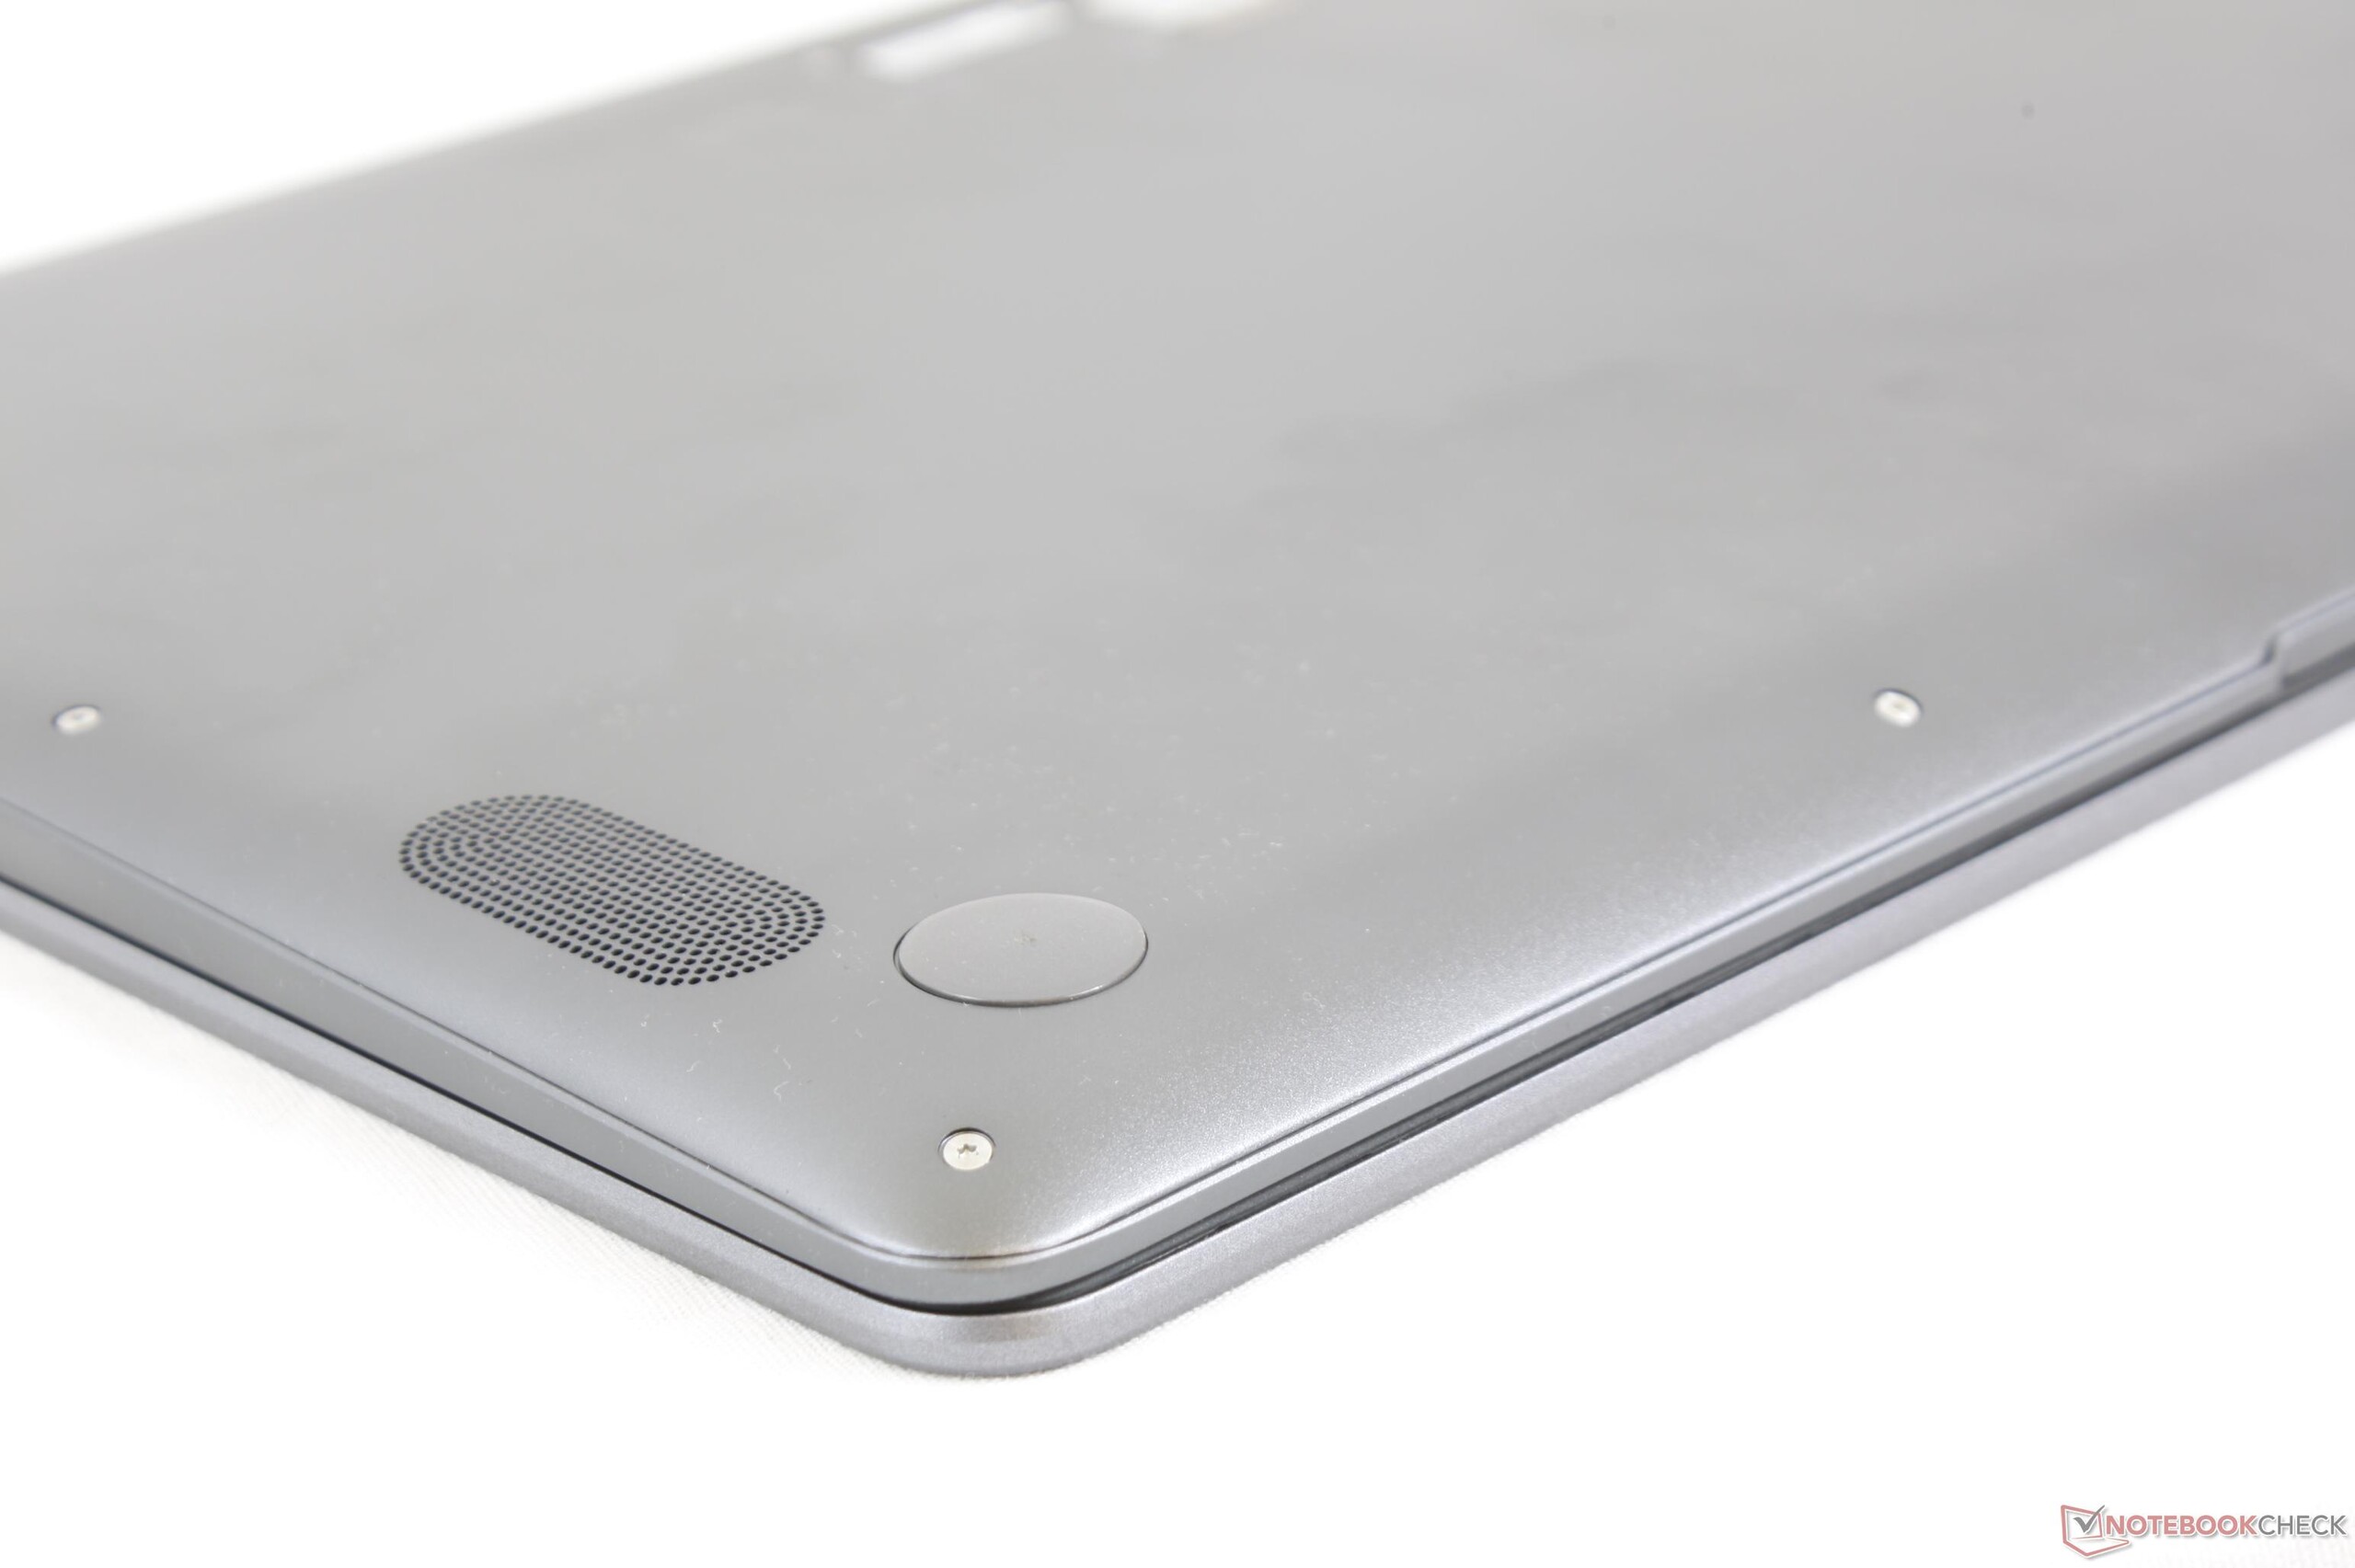
Build quality is excellent from top to bottom on our test unit save for some minor unevenness on the rear corner of the bottom lid. Fortunately, this is barely noticeable and only cosmetic.
In terms of size and weight, the UX430 is about 200 grams heavier and 3 mm thicker than the UX490 that costs hundreds more. Note that the Lenovo Yoga 920 is very similar in dimensions and weight to the UX430 while offering both 360-degree hinges and touchscreen features that the Asus is missing. The 14-inch notebook weighs about the same as many 13-inch convertibles while being a lot lighter than popular 15-inch models like the XPS 15 or MacBook Pro 15.
Connectivity
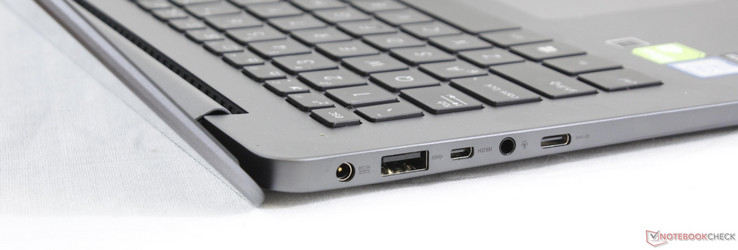
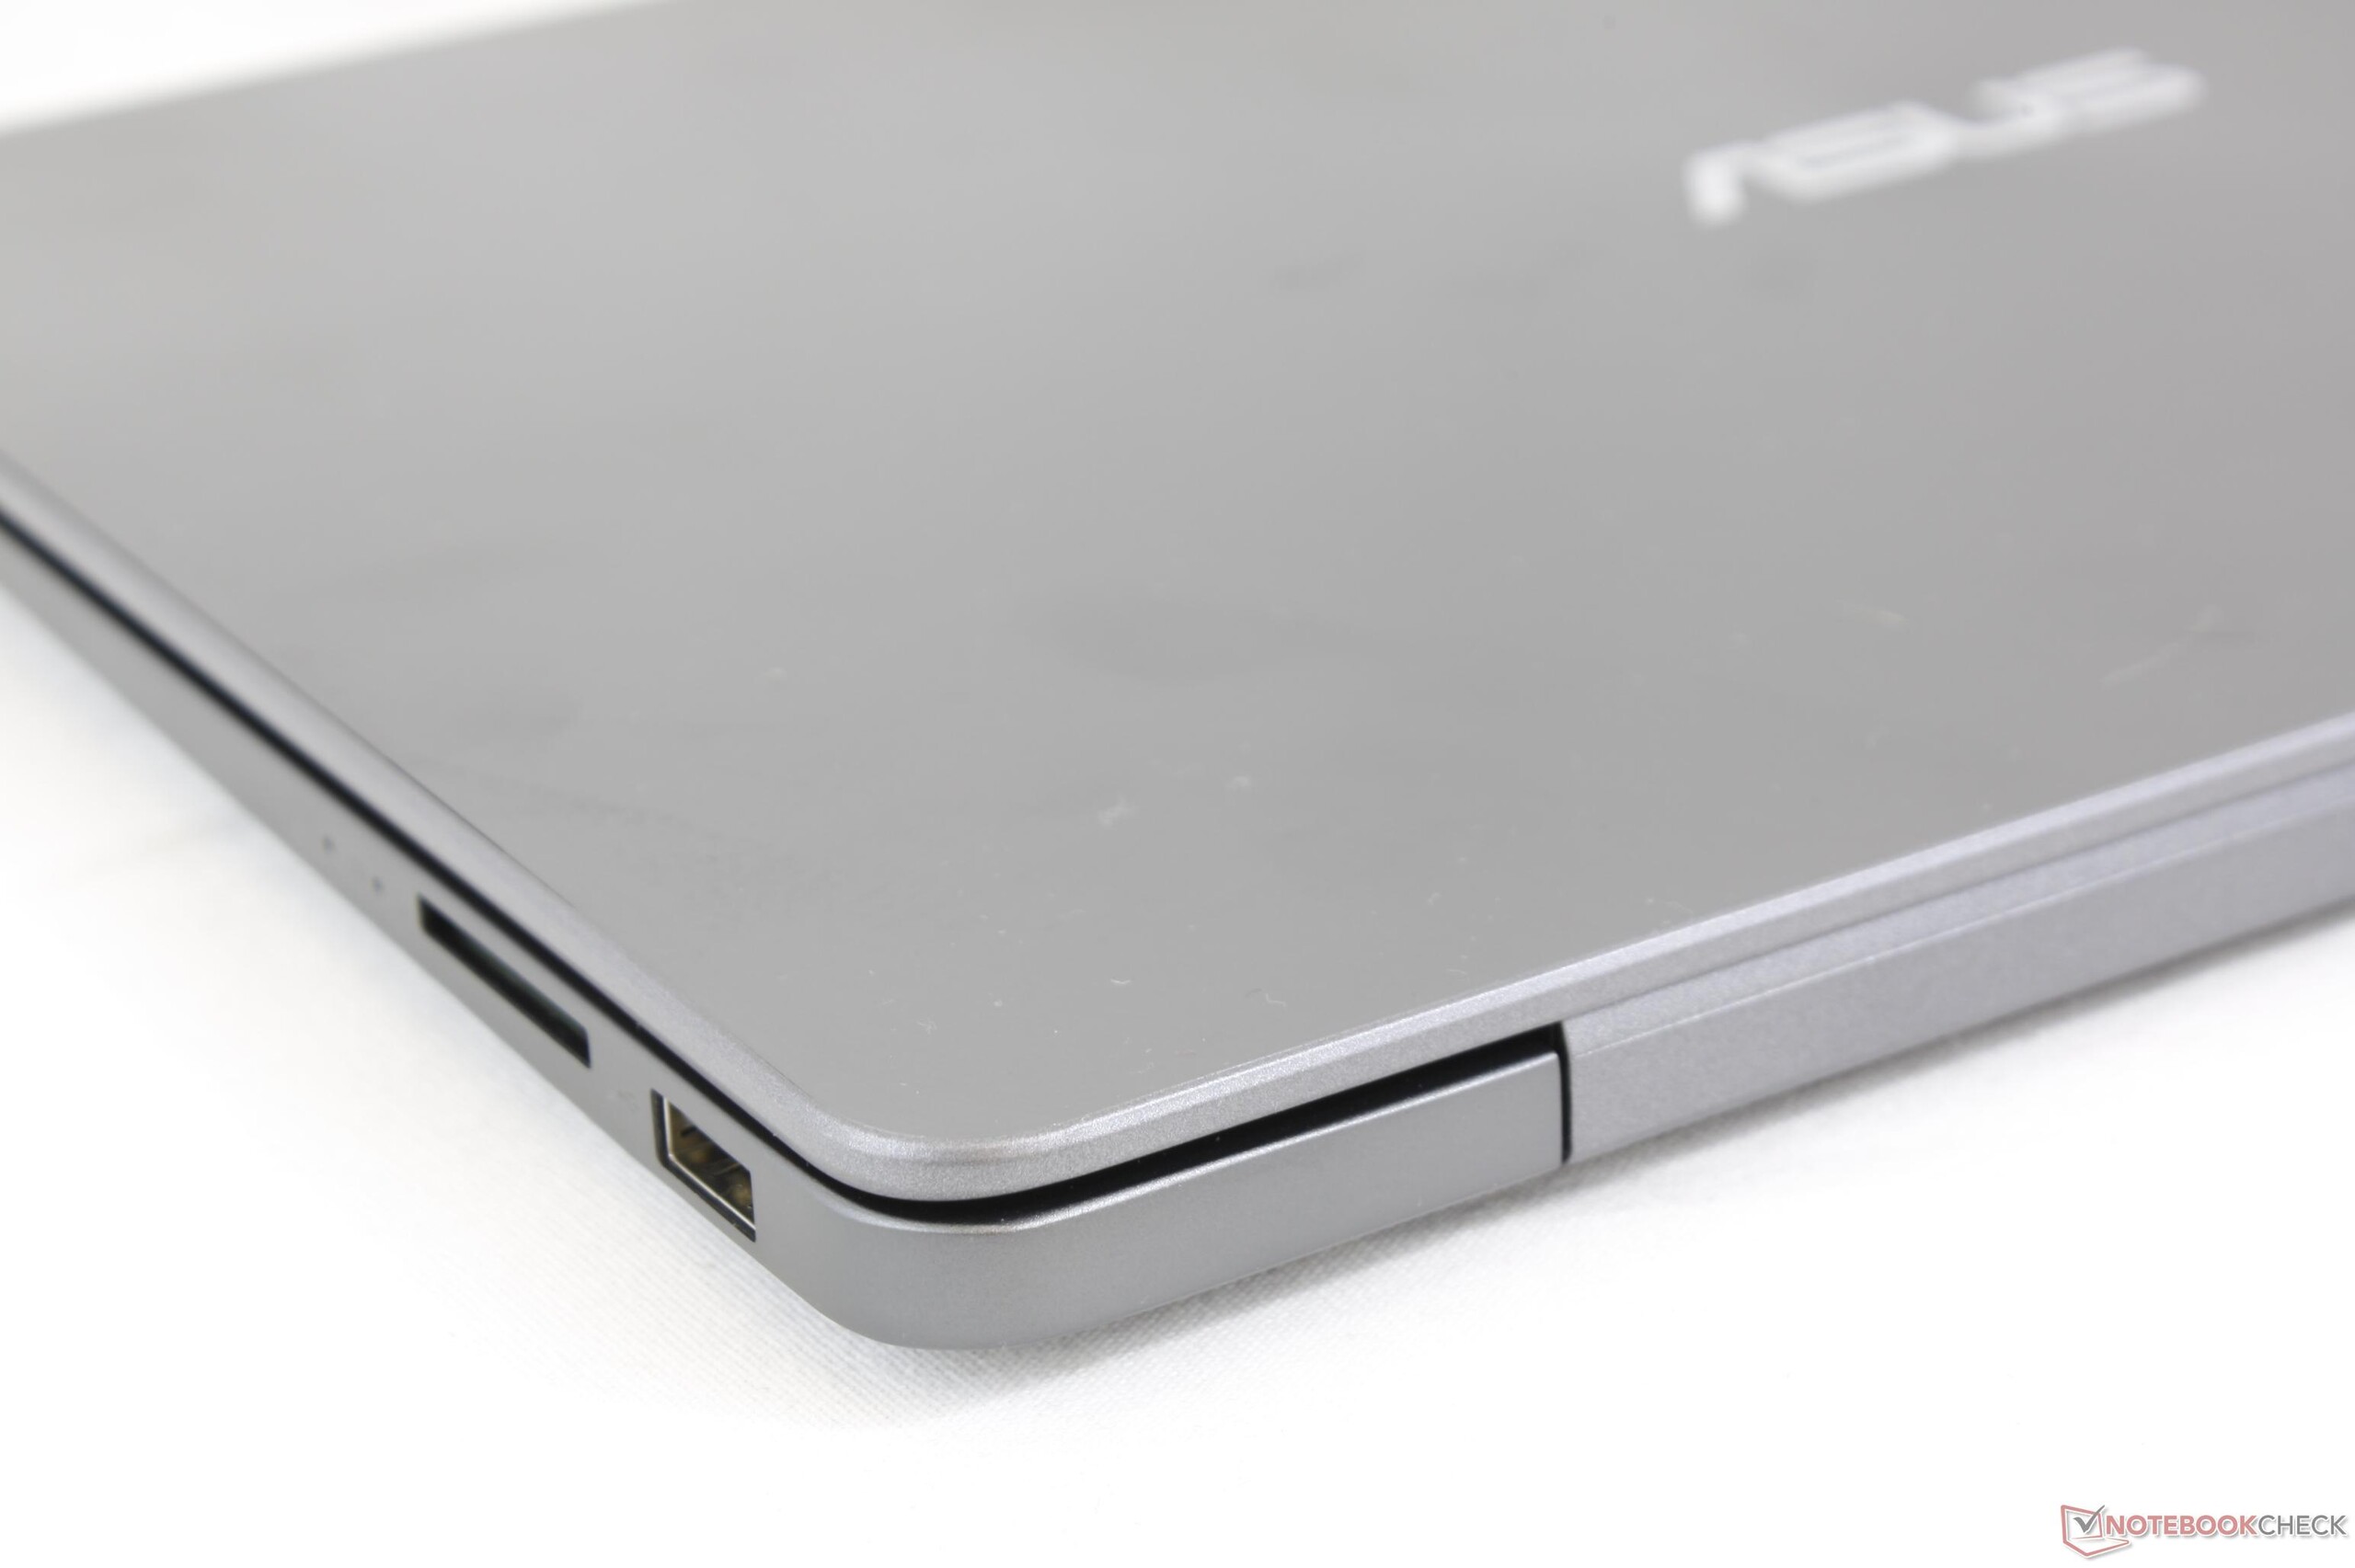
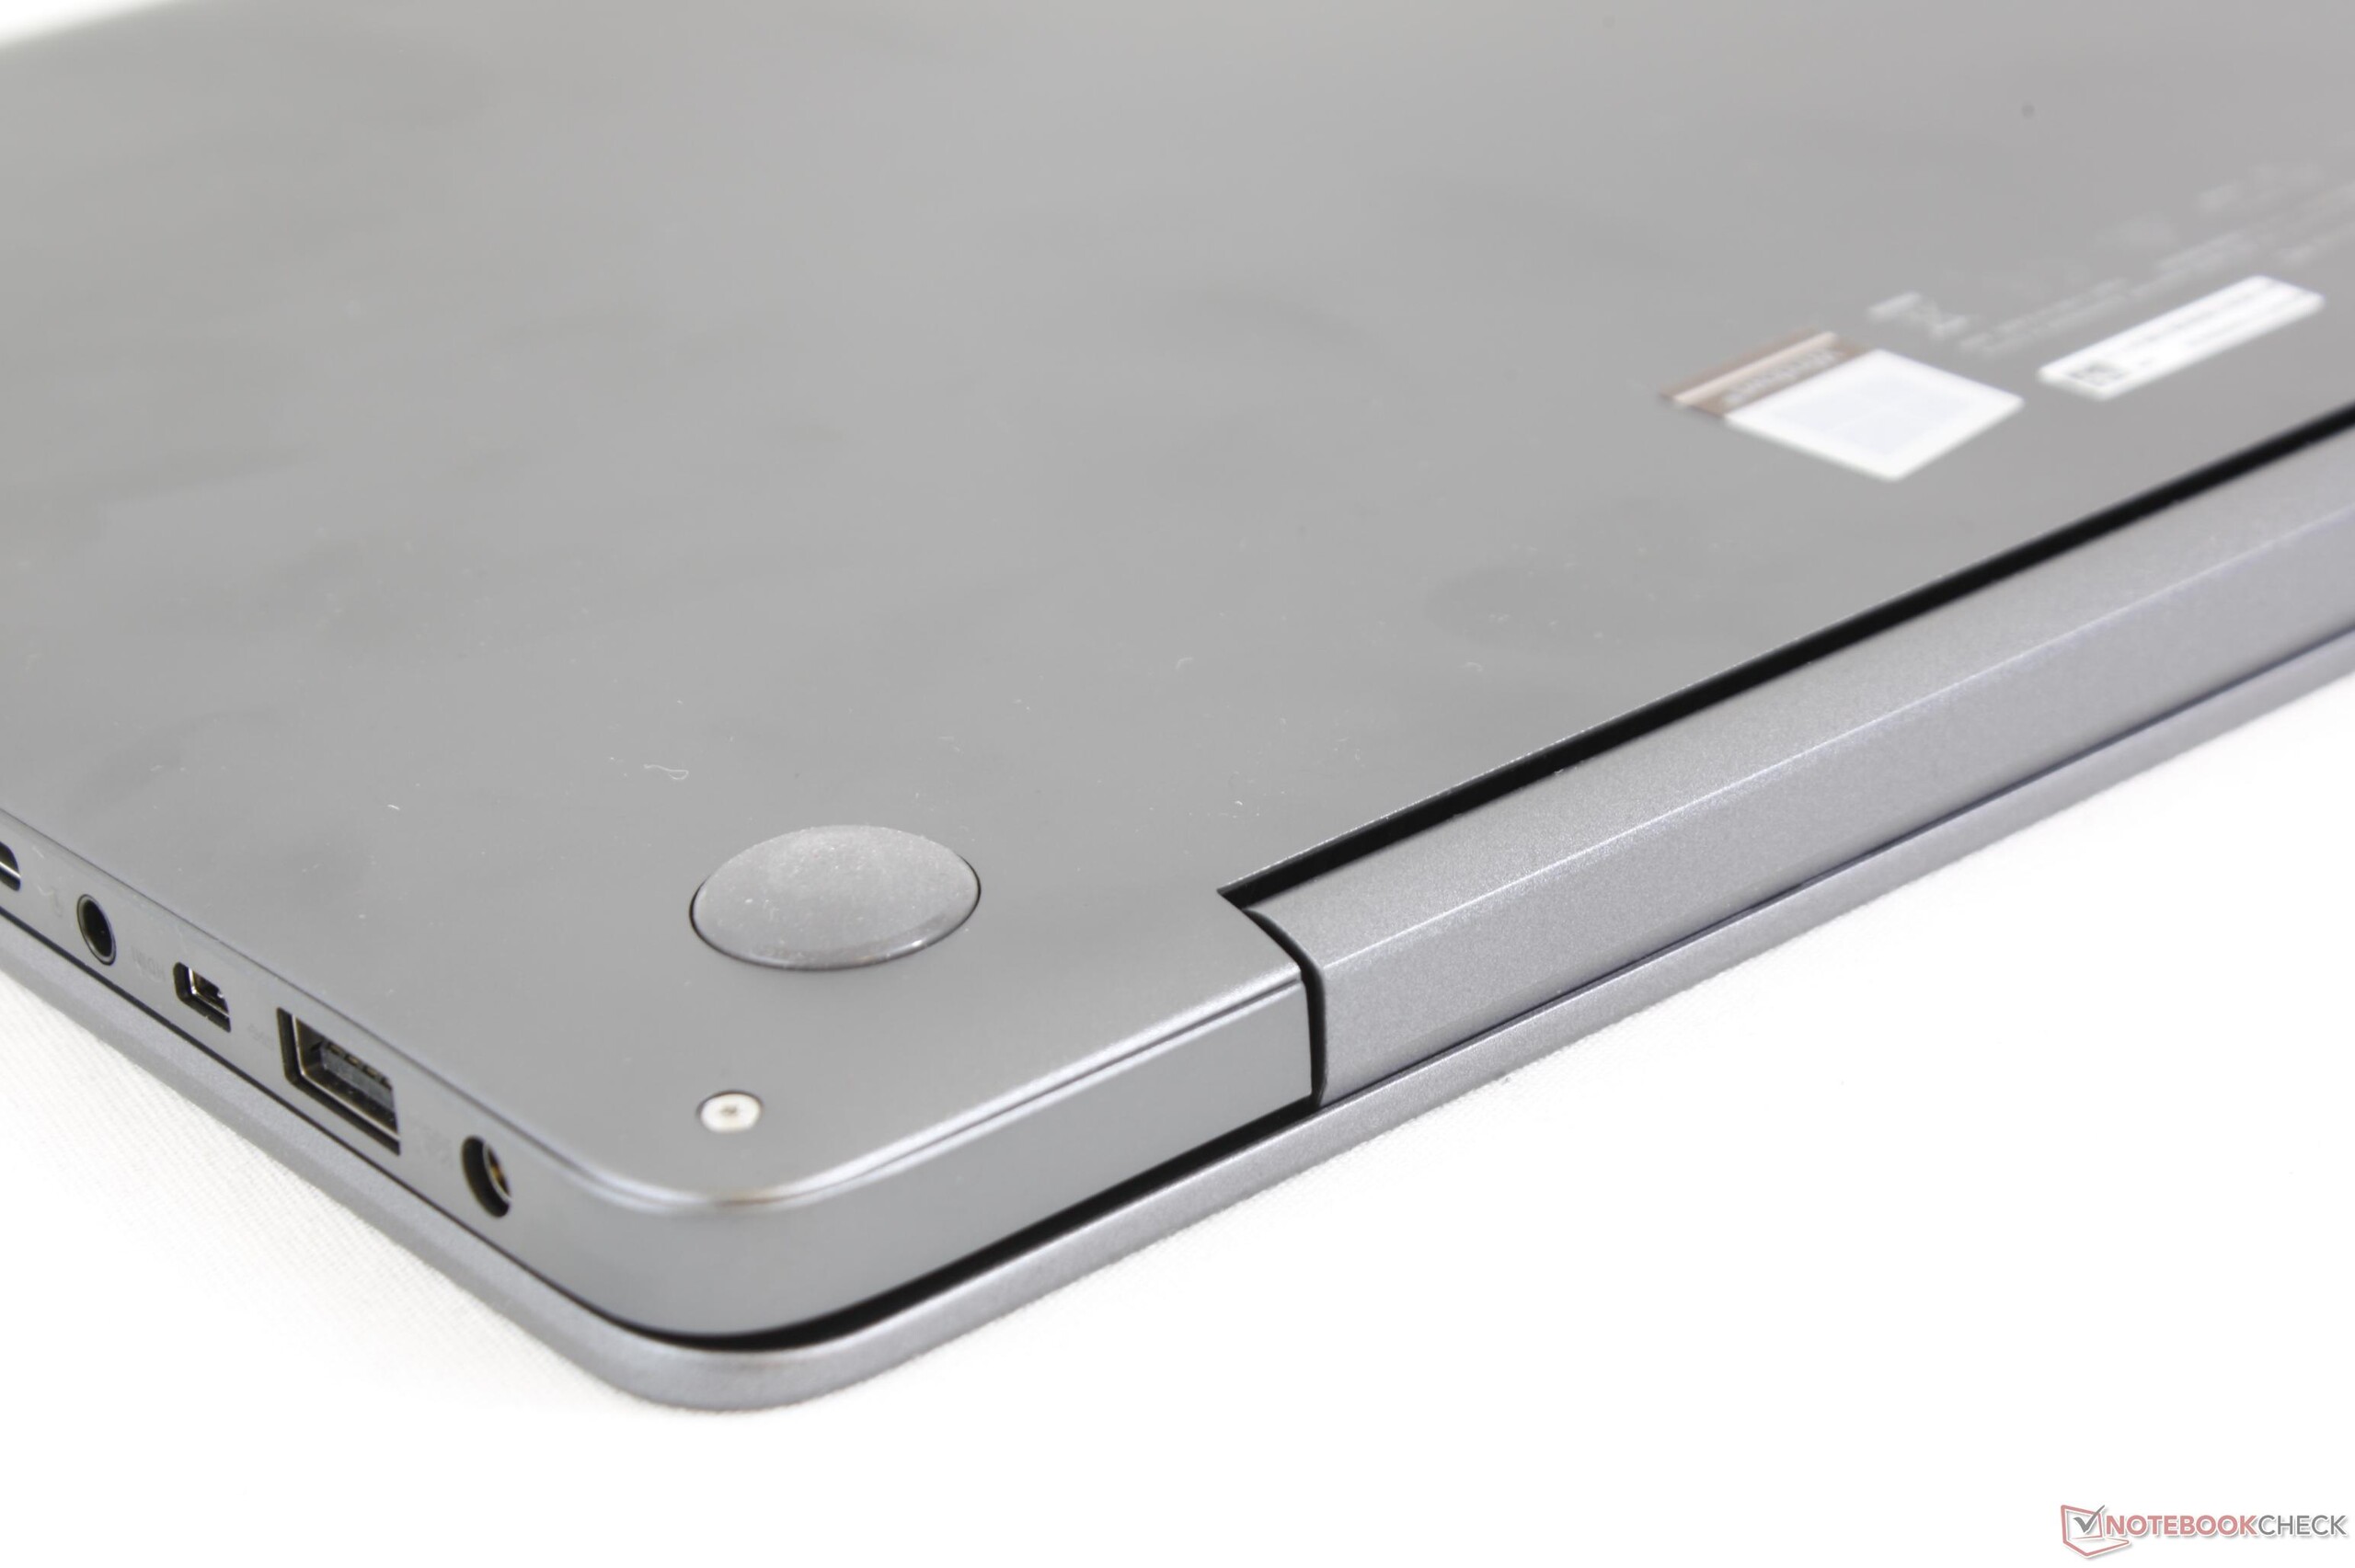
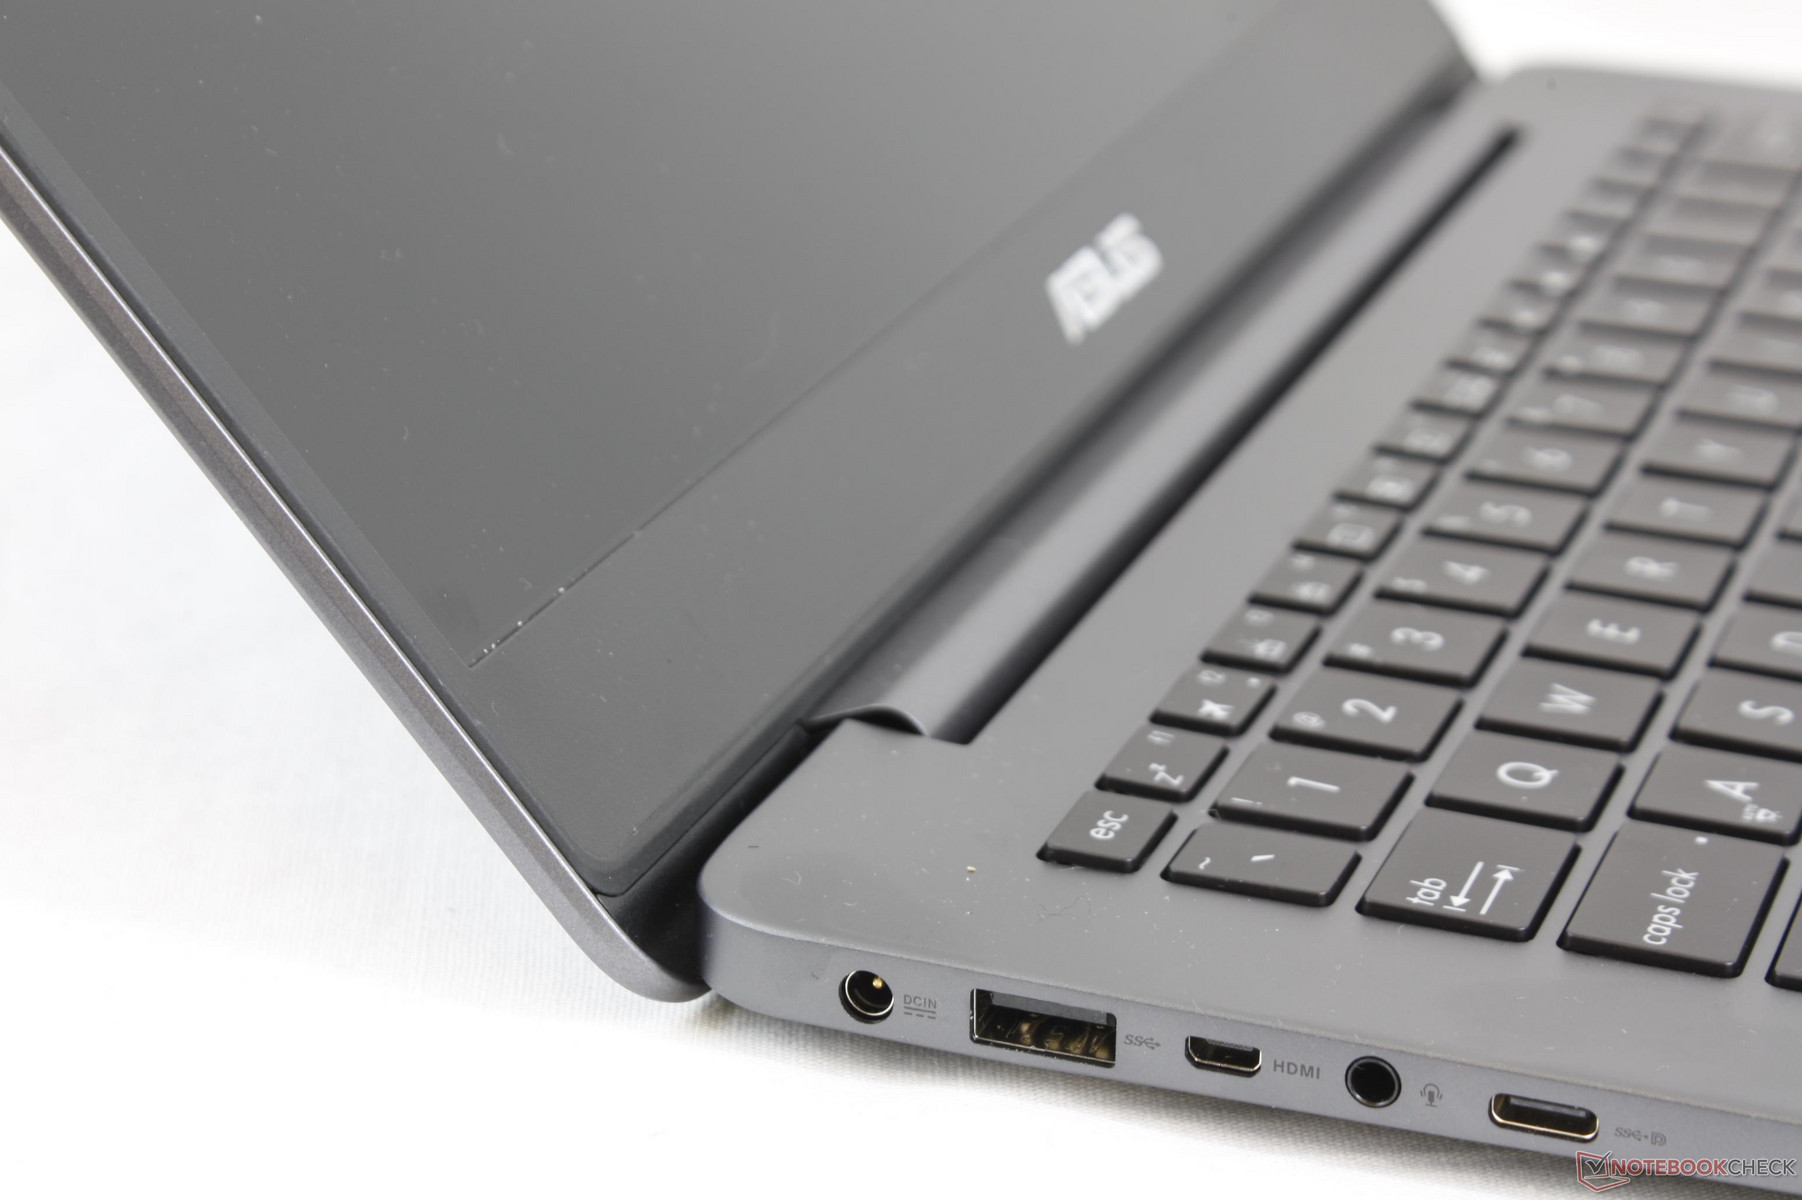
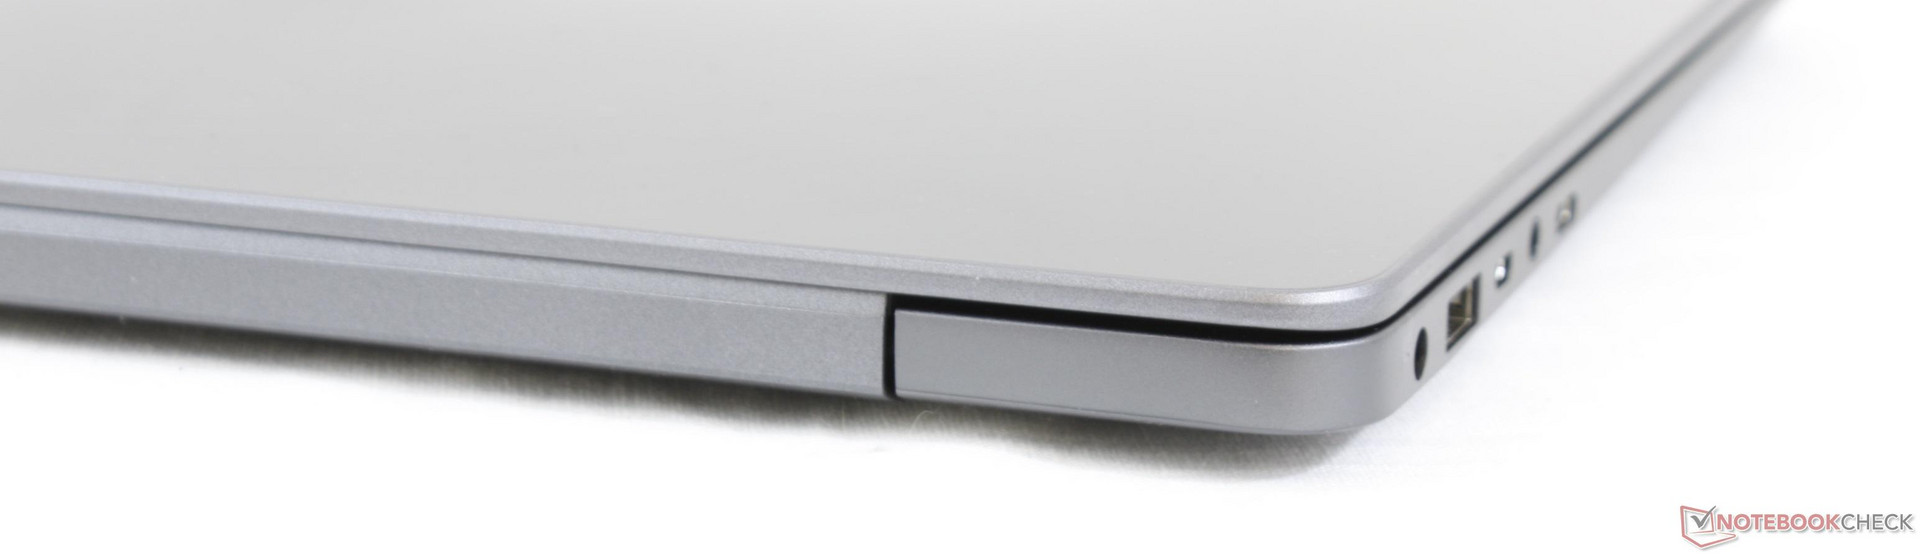
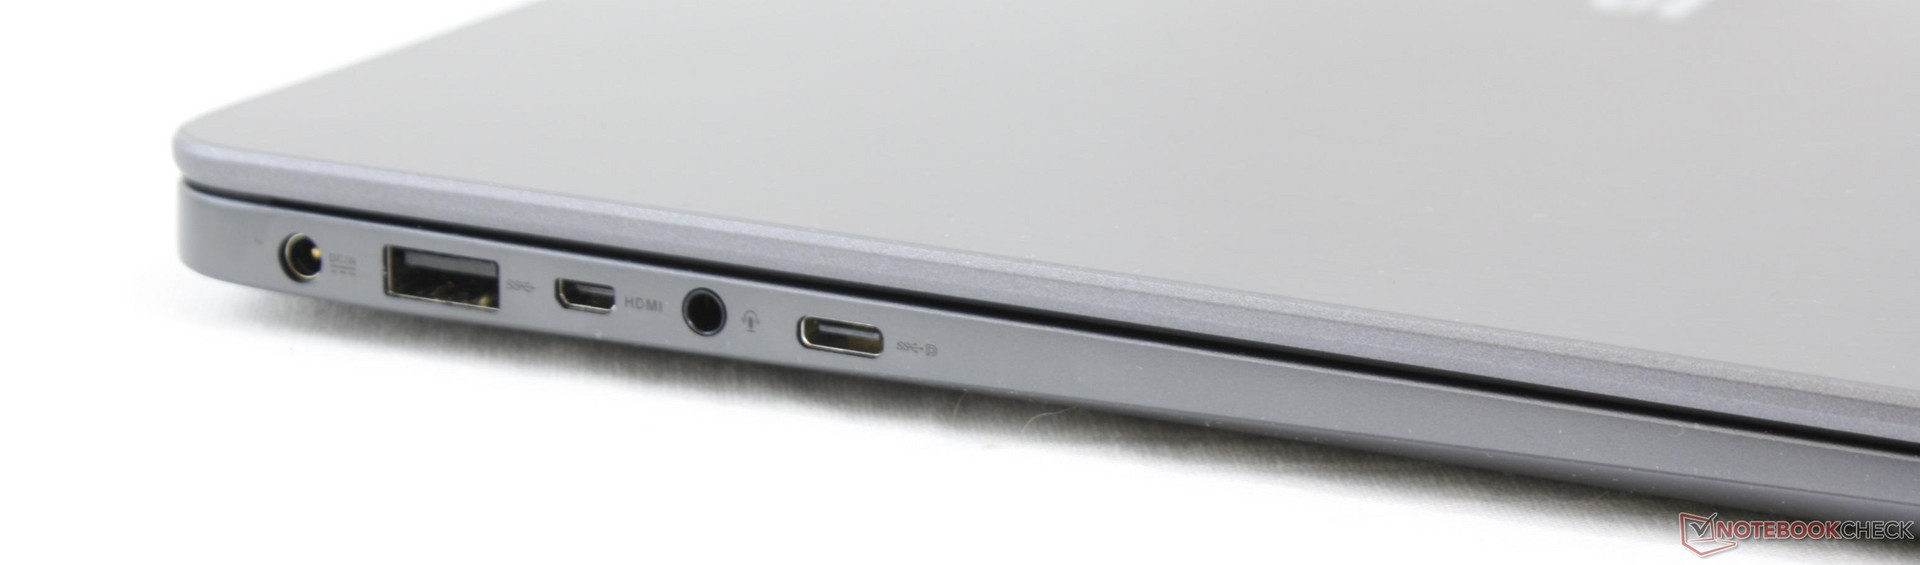
Available ports are plentiful considering the size class with some glaring omissions. Instead of a full-size HDMI port, for example, there is an uncommon micro HDMI port. The lack of both a Kensington Lock and support for Thunderbolt 3 will likely irk users down the line as well. We would like to see multiple USB Type-C ports in the future for both charging and data in lieu of the dedicated AC adapter port.
Port positioning is otherwise excellent with USB Type-A on both sides and none that are too close to the front edge.
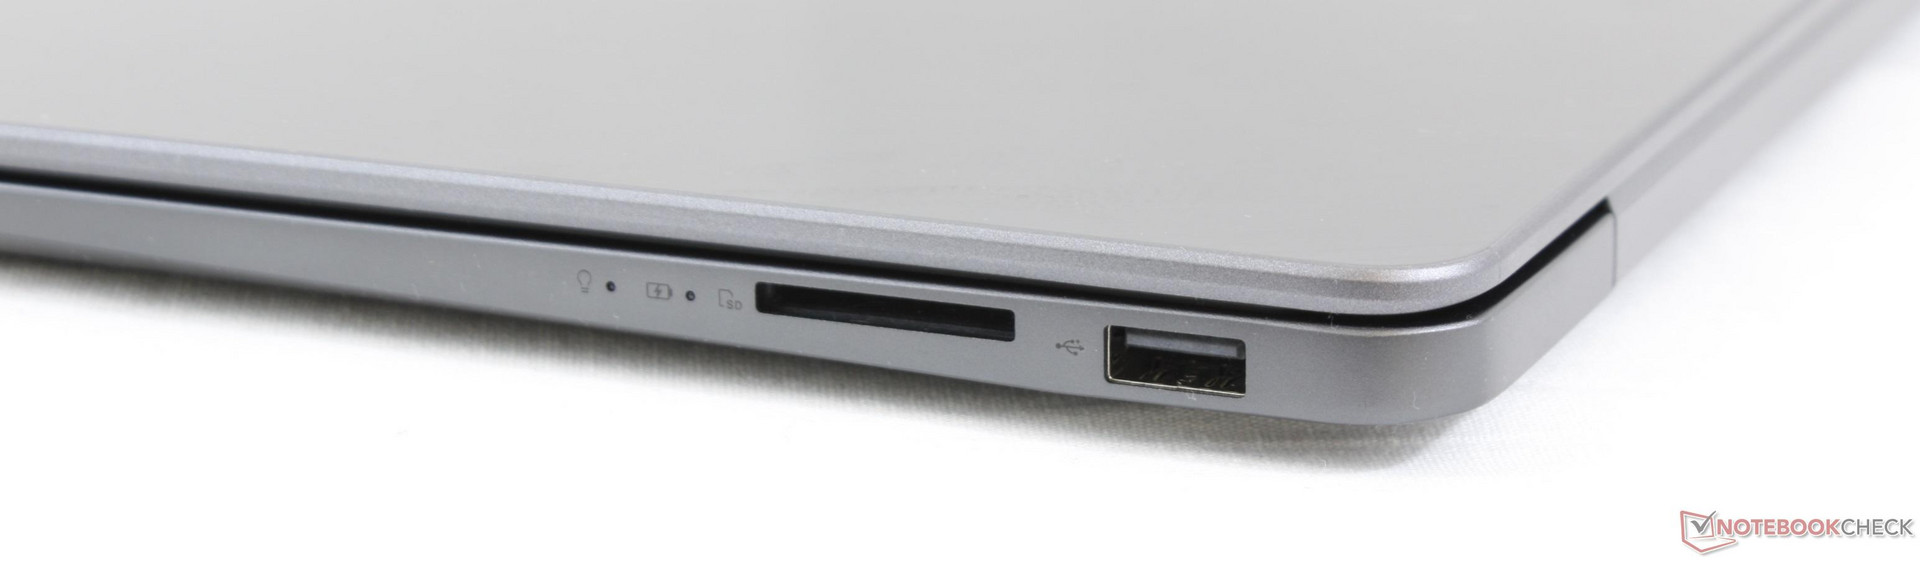
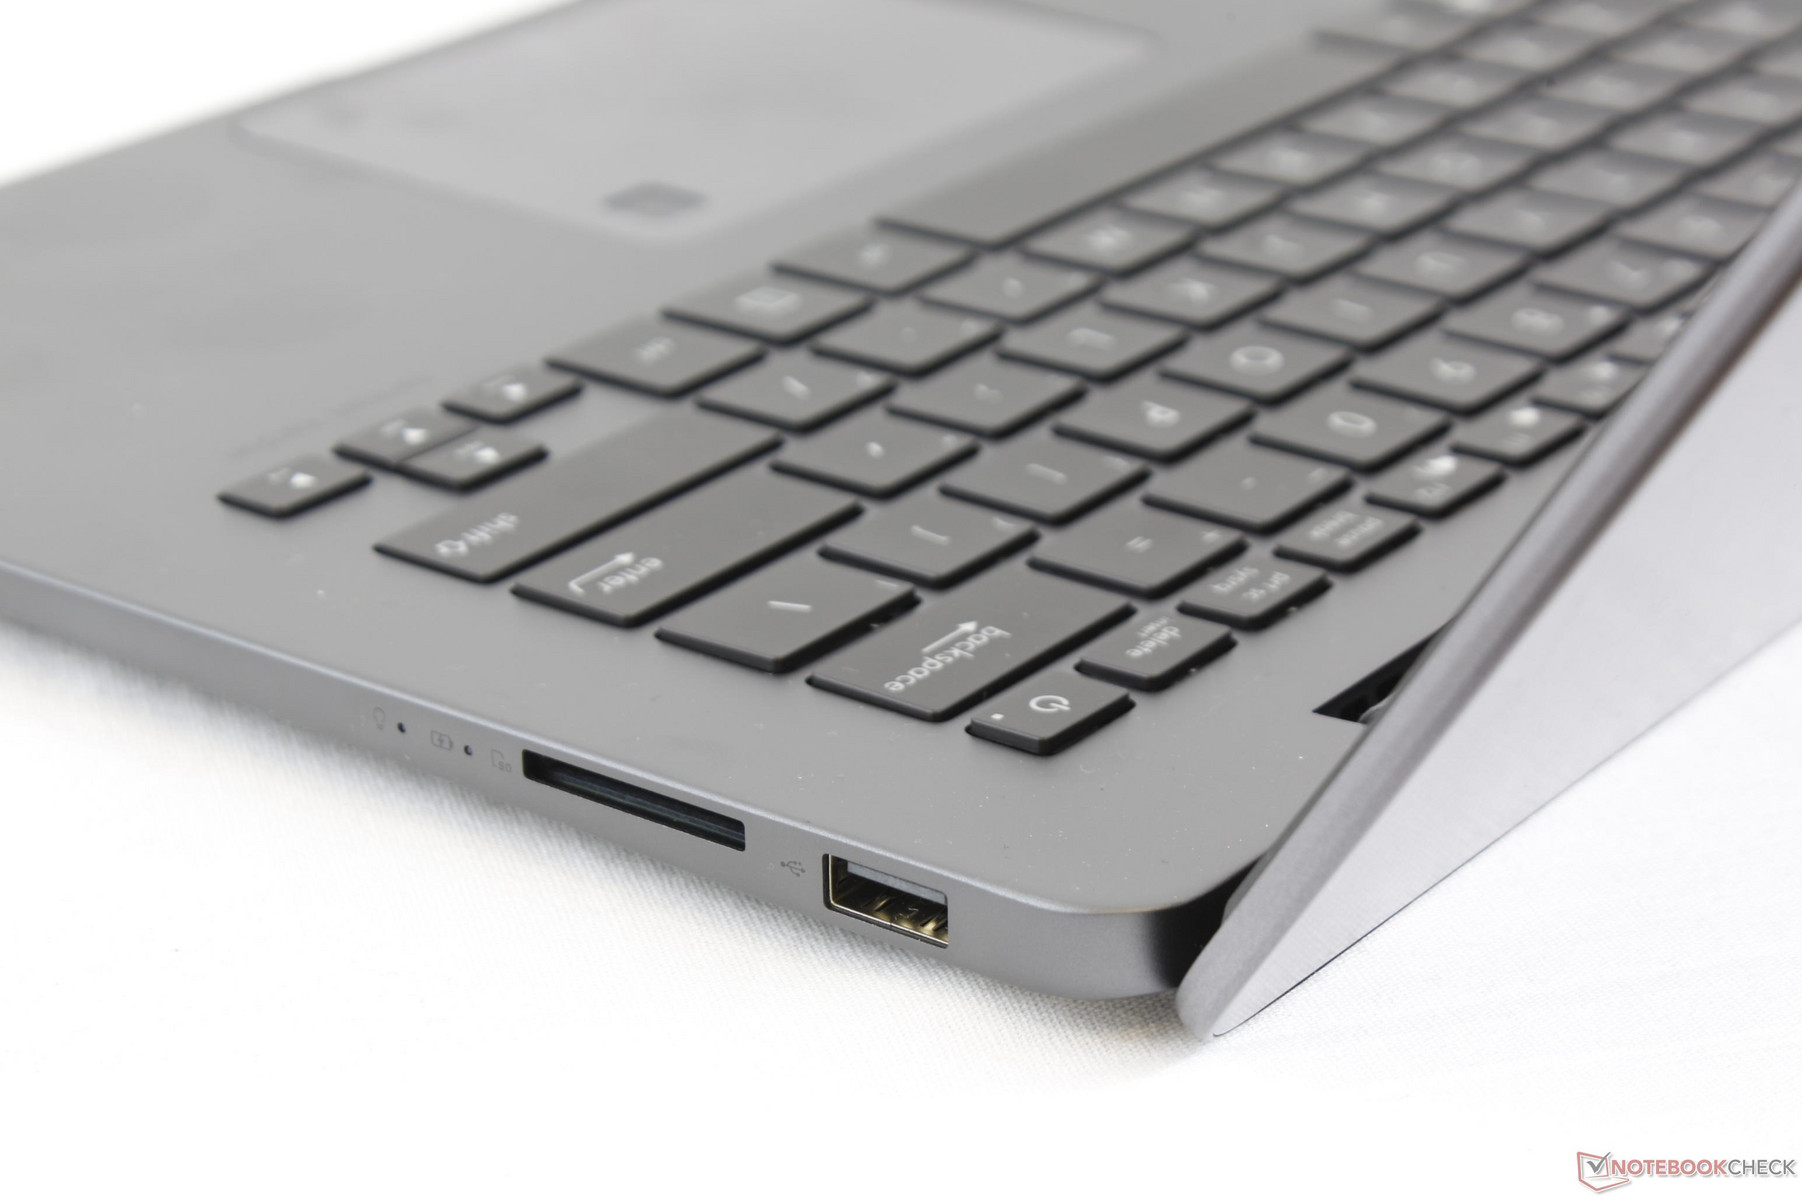
SD Card Reader
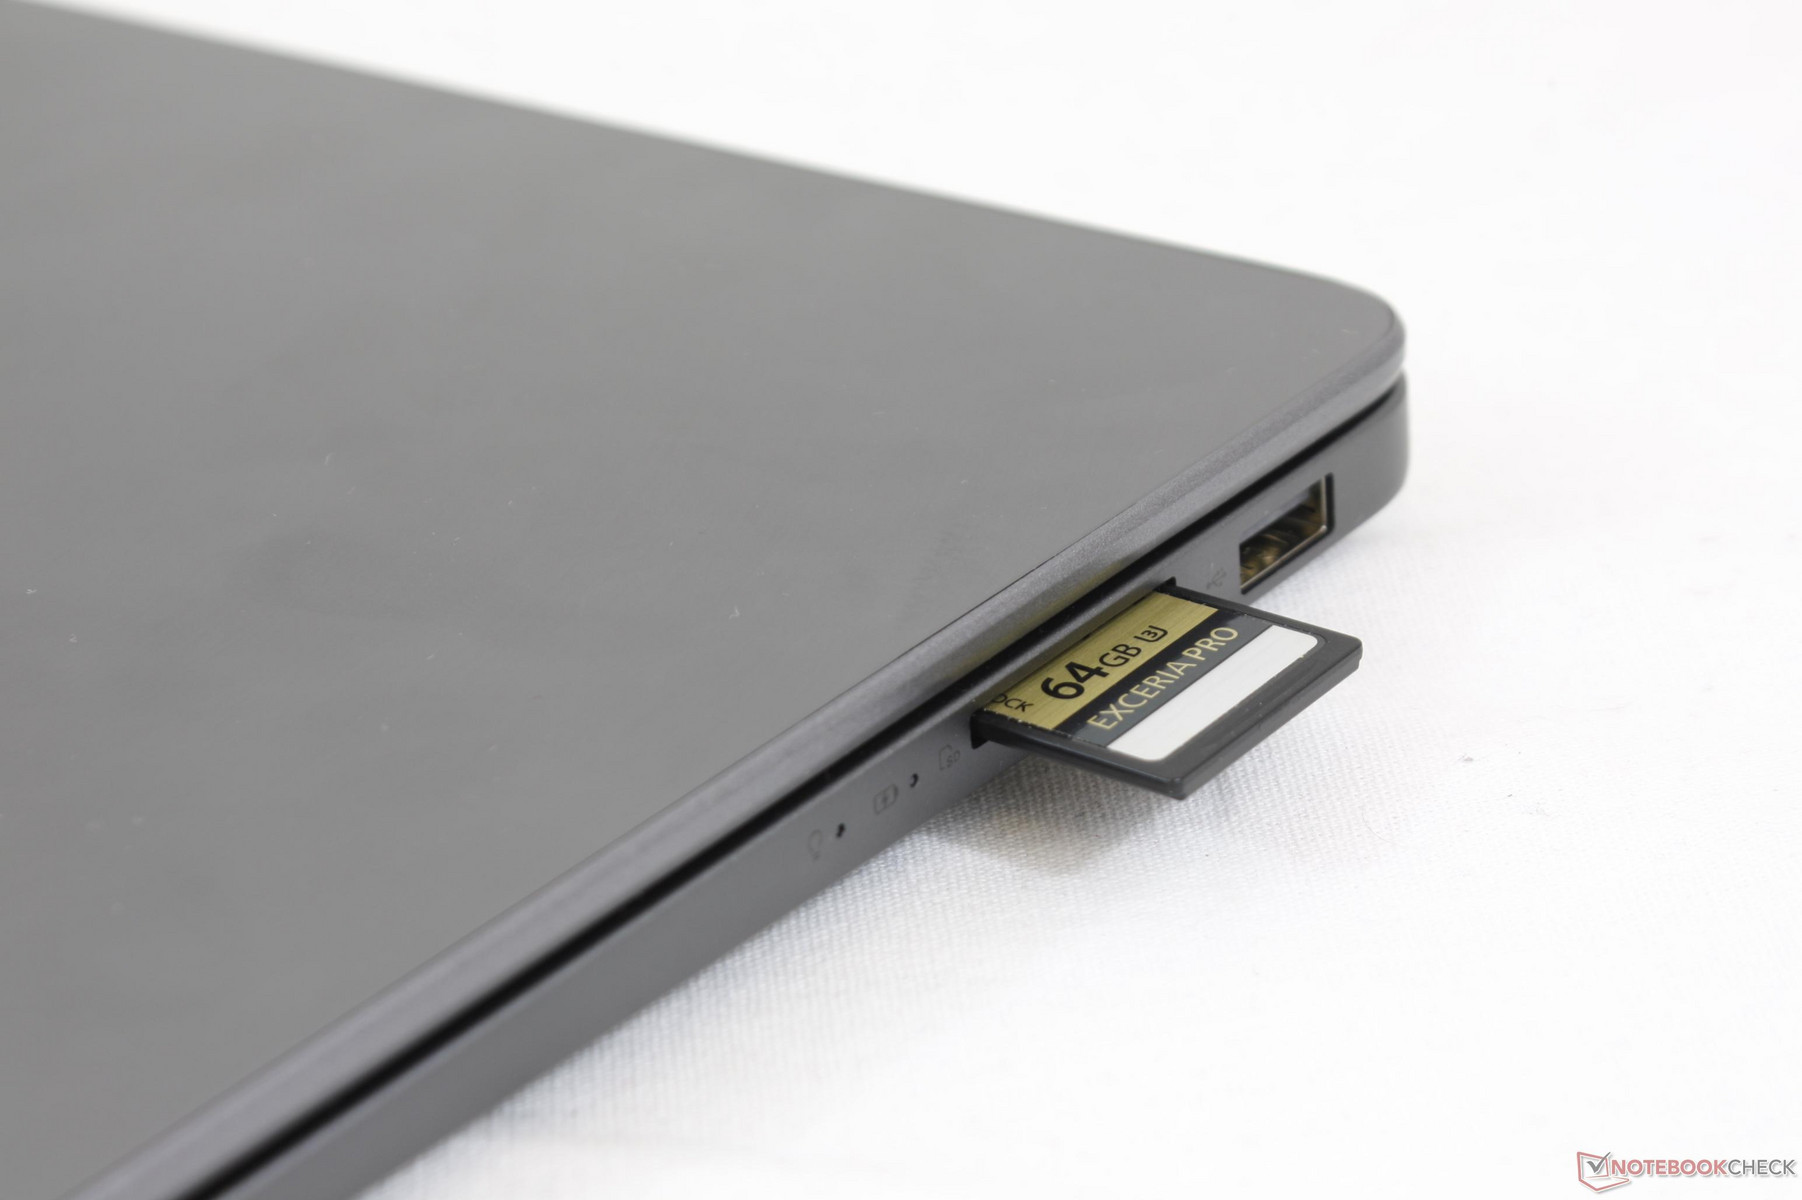
Average transfer rates from the integrated card reader are disappointing at just 36 MB/s when using our Toshiba Exceria Pro SDXC 64 GB UHS-II test card. Moving 1 GB worth of photos from the card to desktop will take about 29 seconds compared to only 5 to 6 seconds on the XPS 13 9370. We can, however, appreciate the fact that Asus has included a full-size SD reader instead of a MicroSD solution like on the latest XPS 13 or Samsung NP900X5T.
An fully inserted SD card will still protrude by about two-thirds of its length. A spring-loaded reader would have been ideal for transporting purposes.
| SD Card Reader | |
| average JPG Copy Test (av. of 3 runs) | |
| Dell XPS 13 9370 i5 UHD (Toshiba Exceria Pro M501 64 GB UHS-II) | |
| Samsung Notebook 9 NP900X5T-X01US (Toshiba Exceria Pro M501 UHS-II) | |
| Asus Zenbook UX430UN (Toshiba Exceria Pro SDXC 64 GB UHS-II) | |
| maximum AS SSD Seq Read Test (1GB) | |
| Dell XPS 13 9370 i5 UHD (Toshiba Exceria Pro M501 64 GB UHS-II) | |
| Samsung Notebook 9 NP900X5T-X01US (Toshiba Exceria Pro M501 UHS-II) | |
| Asus Zenbook UX430UN (Toshiba Exceria Pro SDXC 64 GB UHS-II) | |
Communication
The Intel 8265 WLAN module connects without any issues to our Linksys EA8500 test router. Real-world transfer rates are comparable to both the XPS 13 and Samsung NP900X5T but without the gaming-centric software features found on the Killer 1435/1535 series.
There are no 4G LTE or GPS options.
| Networking | |
| iperf3 transmit AX12 | |
| Dell XPS 13 9370 i5 UHD | |
| Samsung Notebook 9 NP900X5T-X01US | |
| Asus Zenbook UX430UN | |
| iperf3 receive AX12 | |
| Samsung Notebook 9 NP900X5T-X01US | |
| Asus Zenbook UX430UN | |
| Dell XPS 13 9370 i5 UHD | |
Accessories
There are no included extras outside of the warranty card and User's guide whereas the higher-end Zenbook 3 may throw in a carrying case and USB Type-C adapter for free.
Maintenance
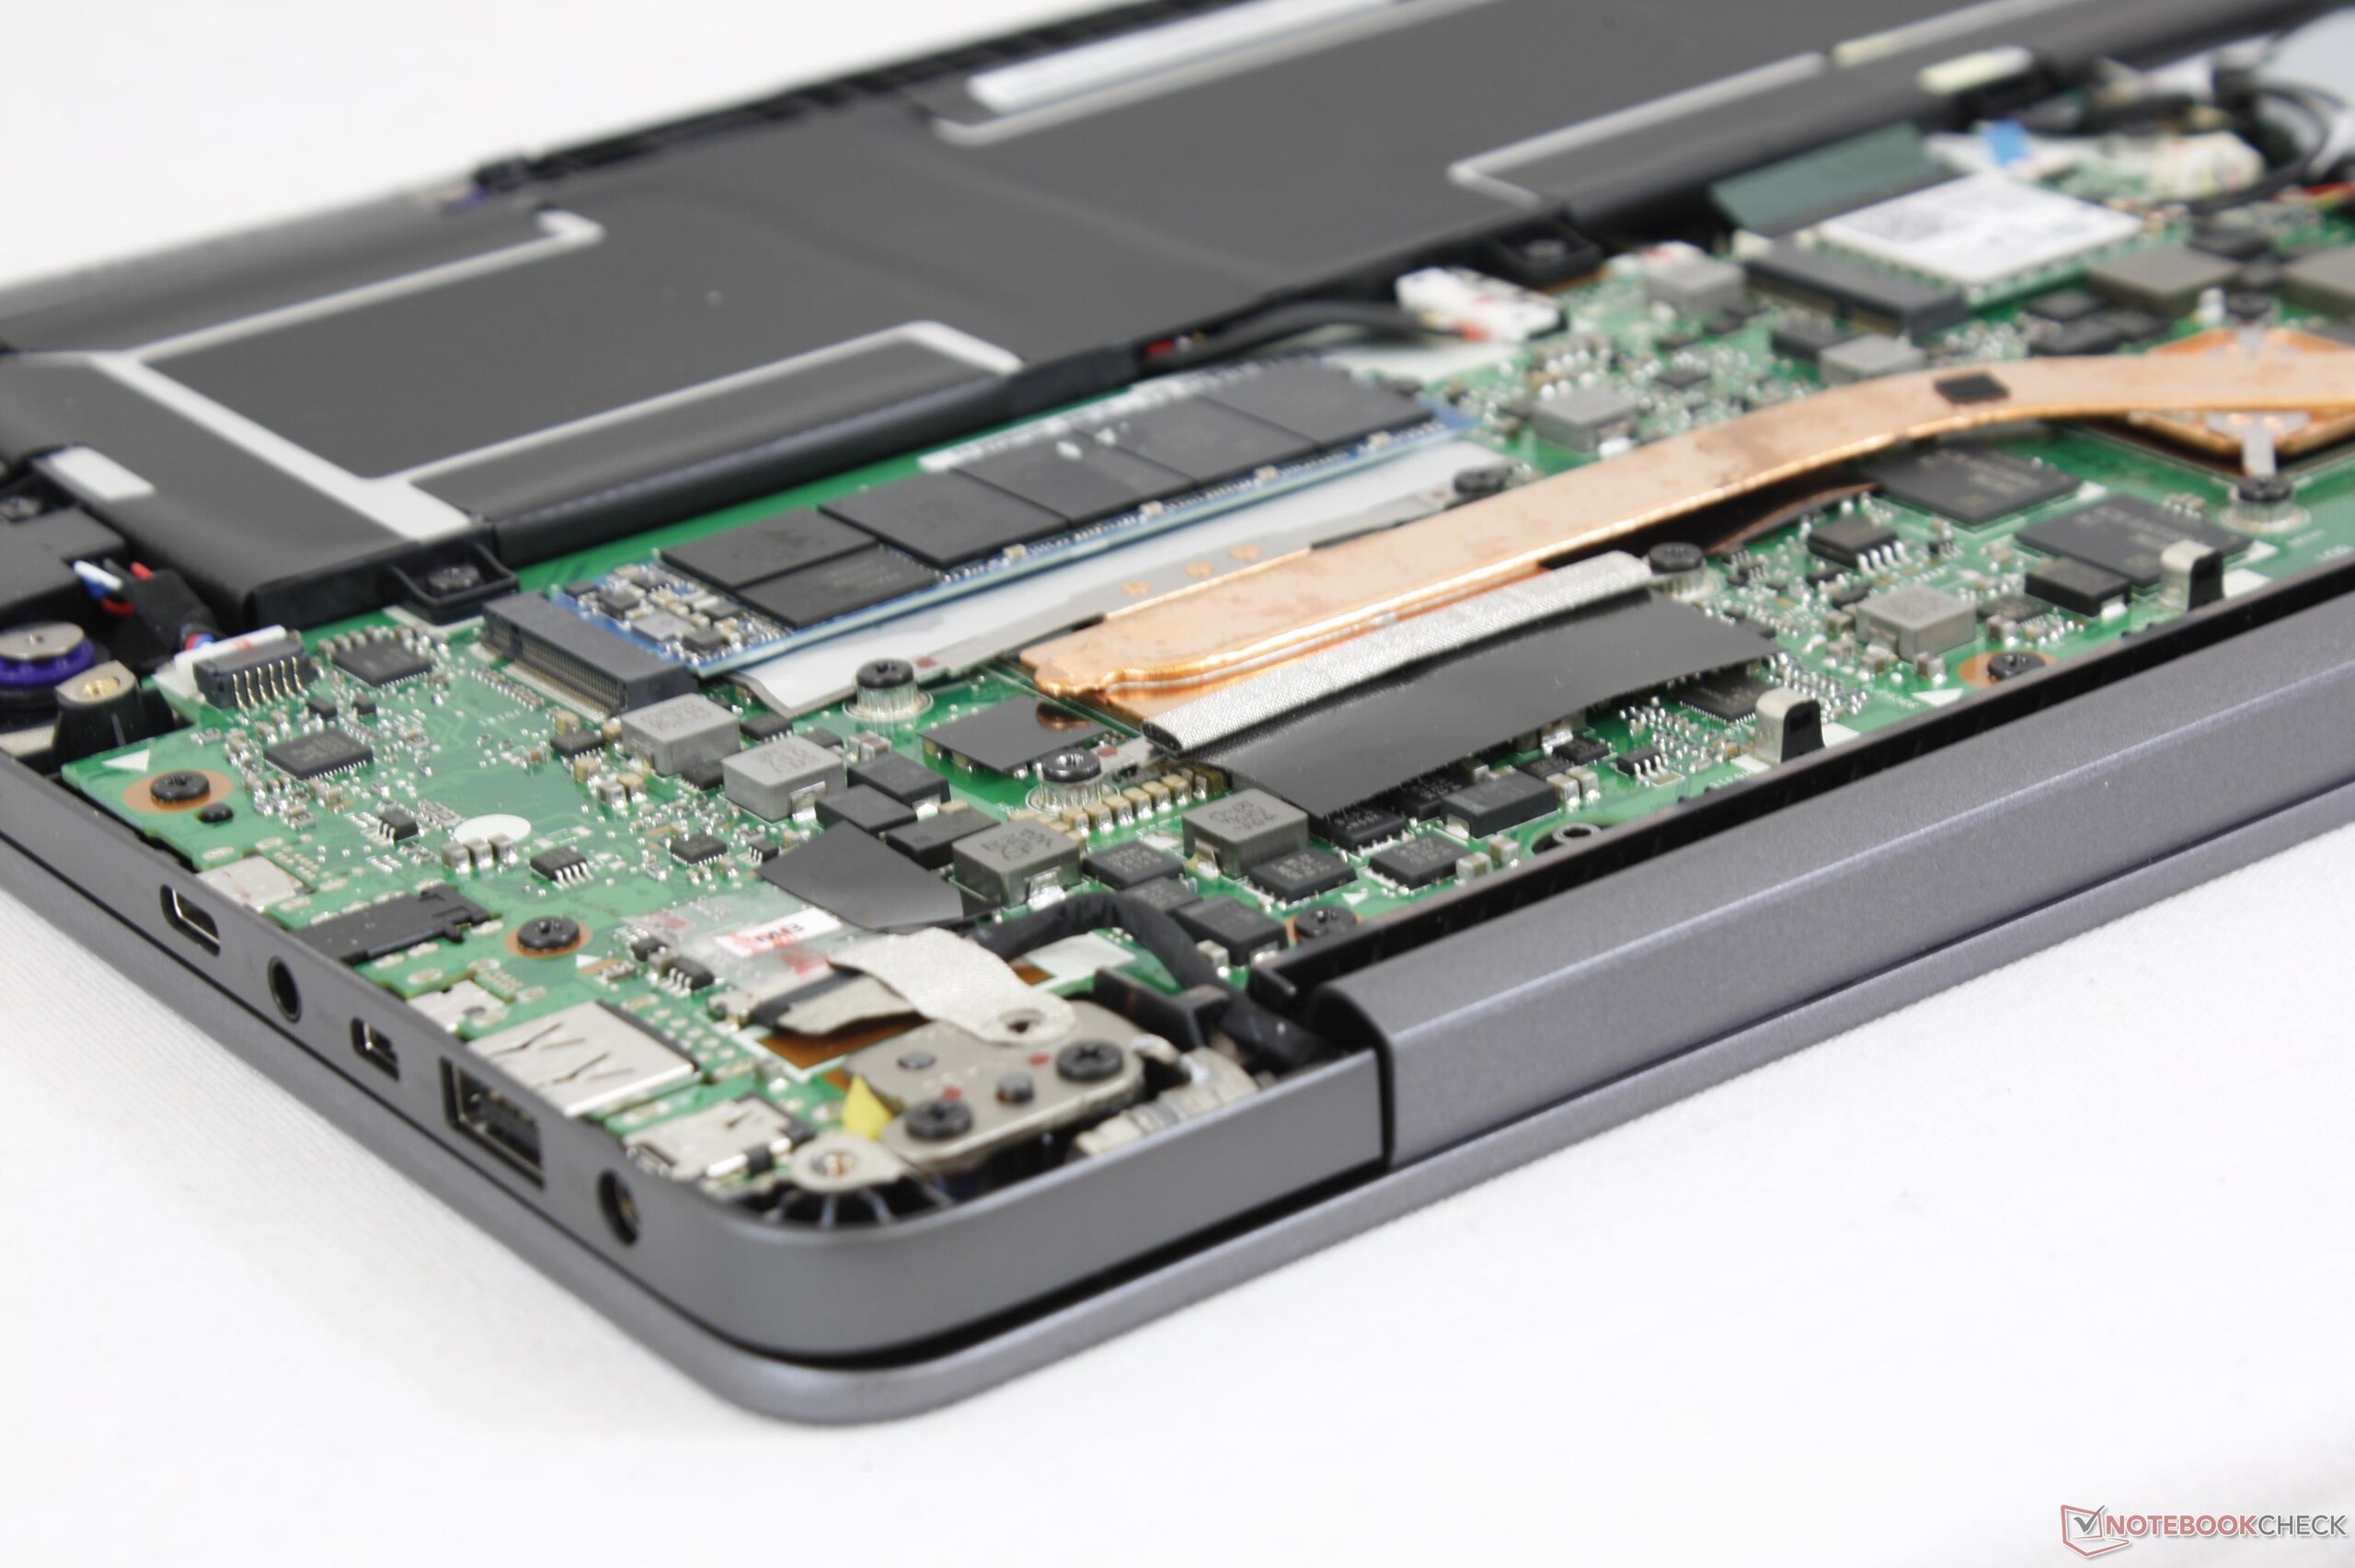
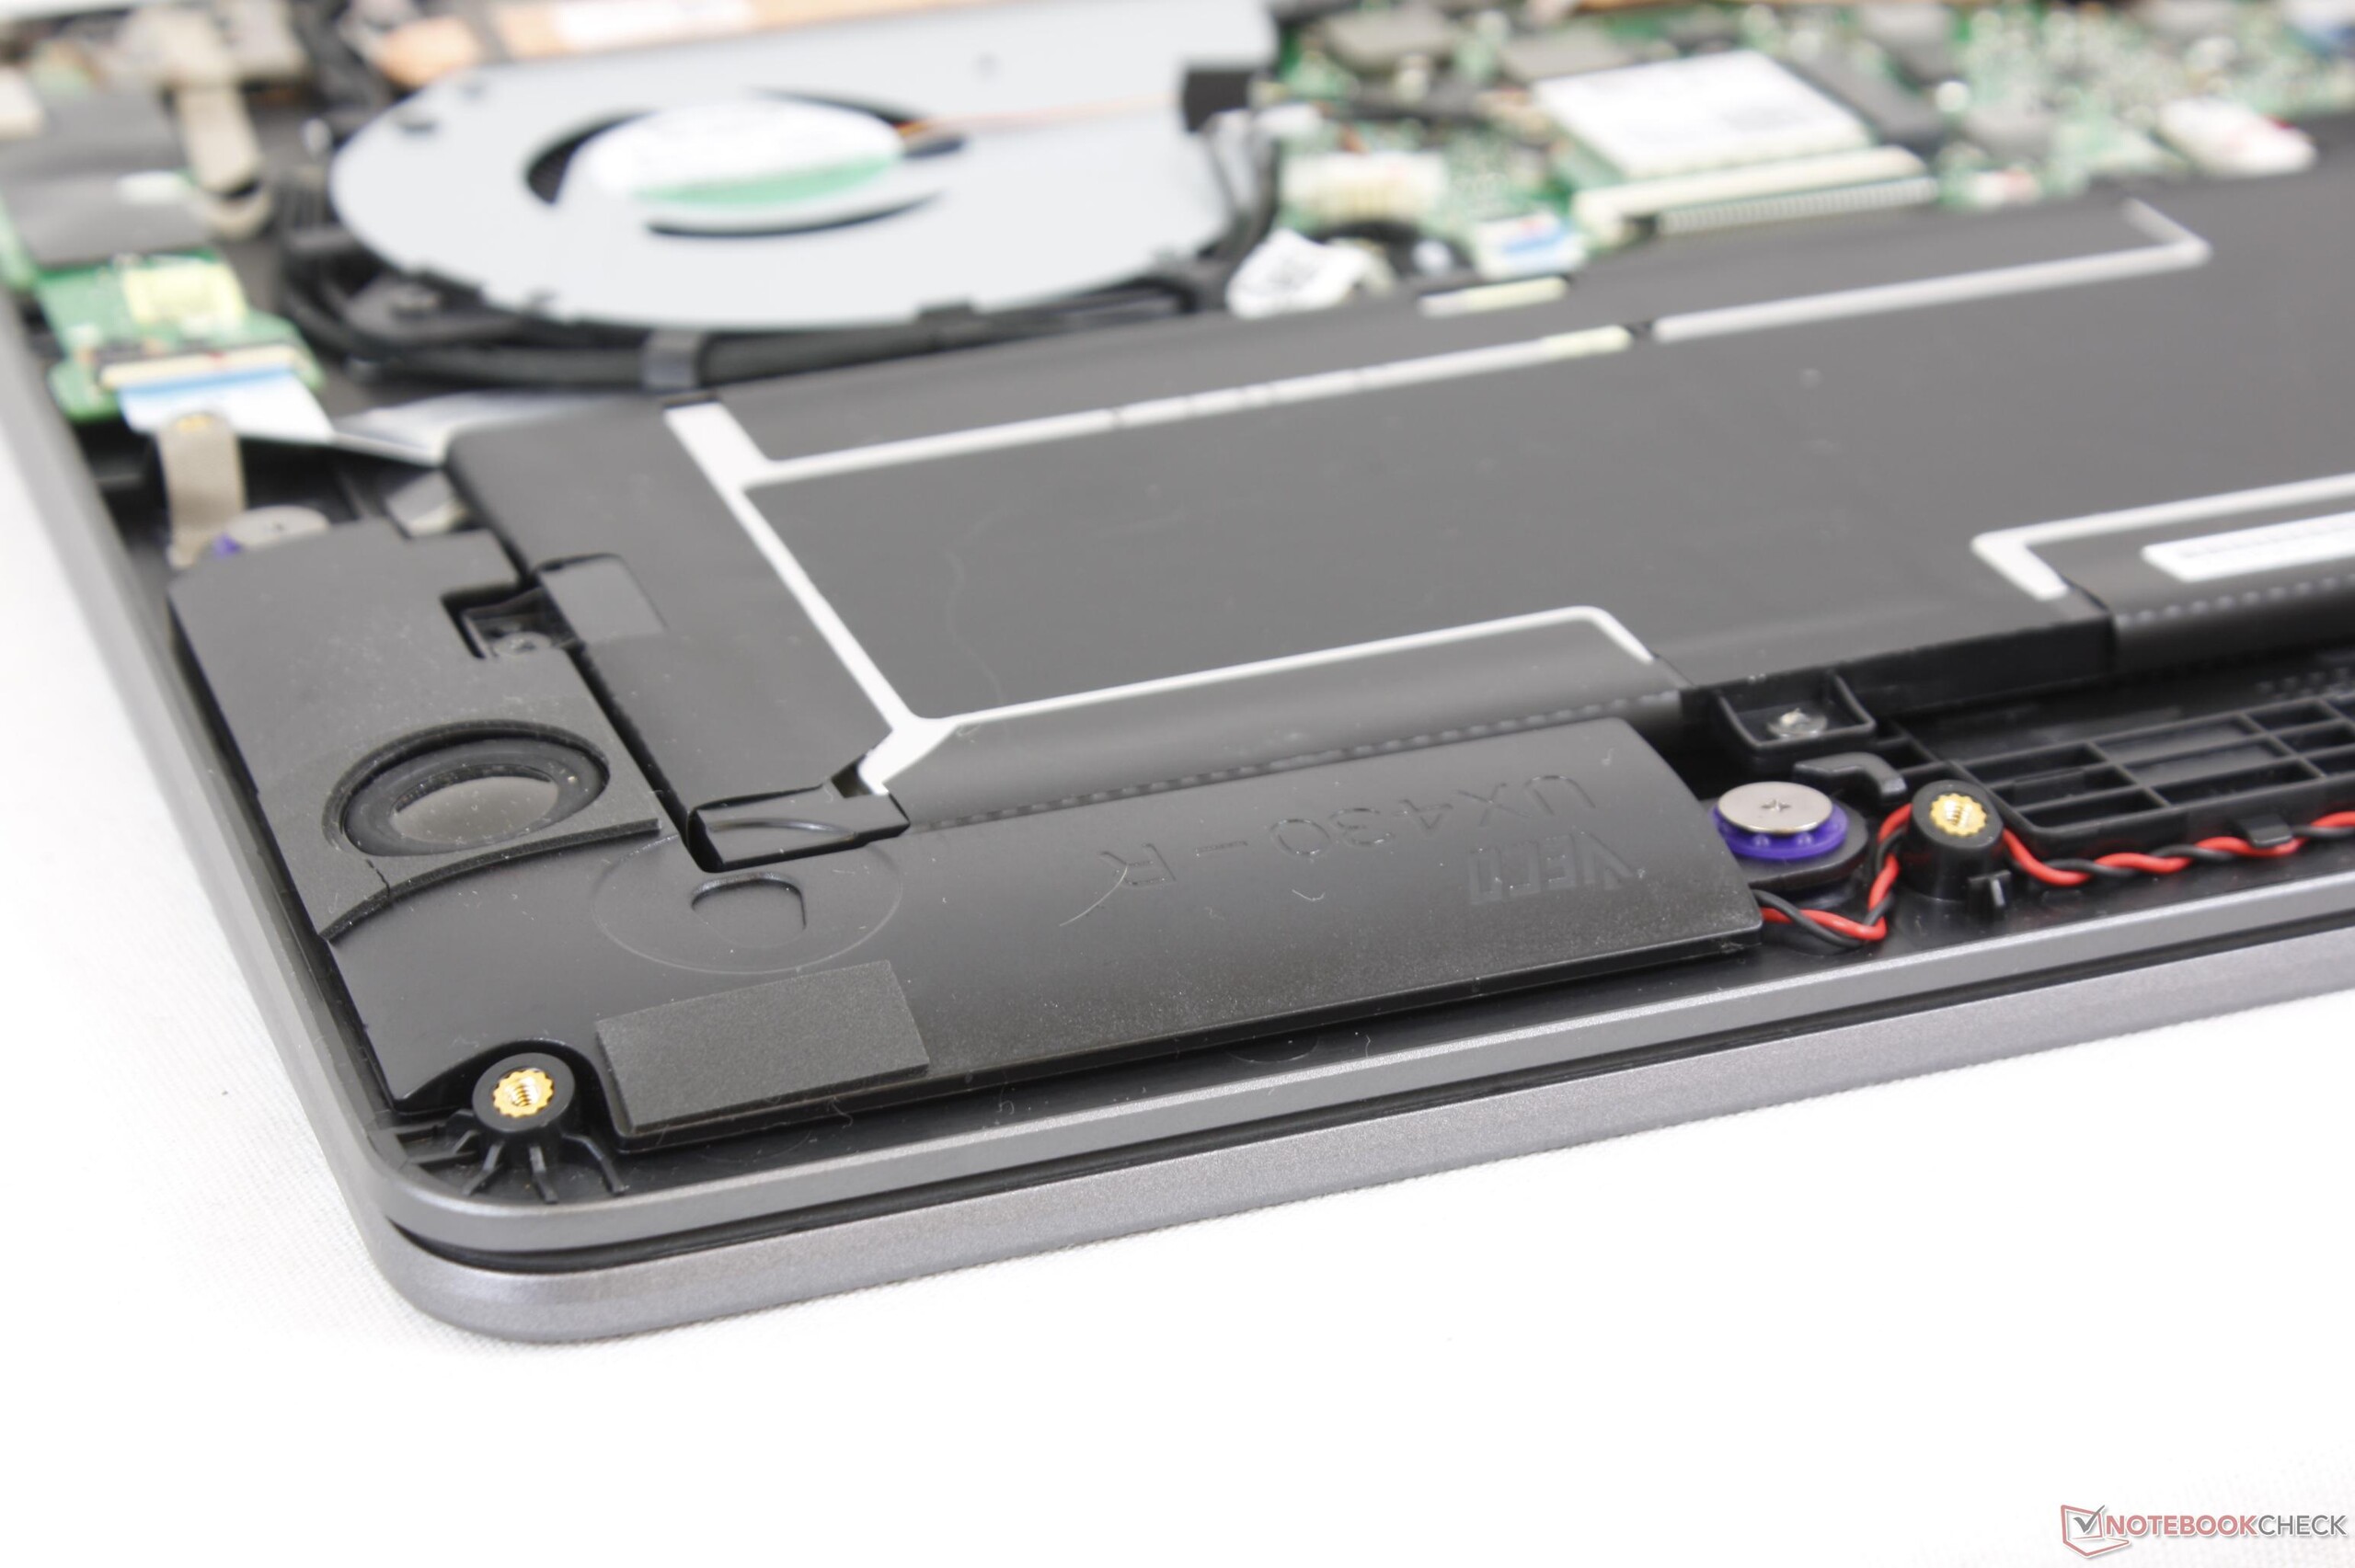
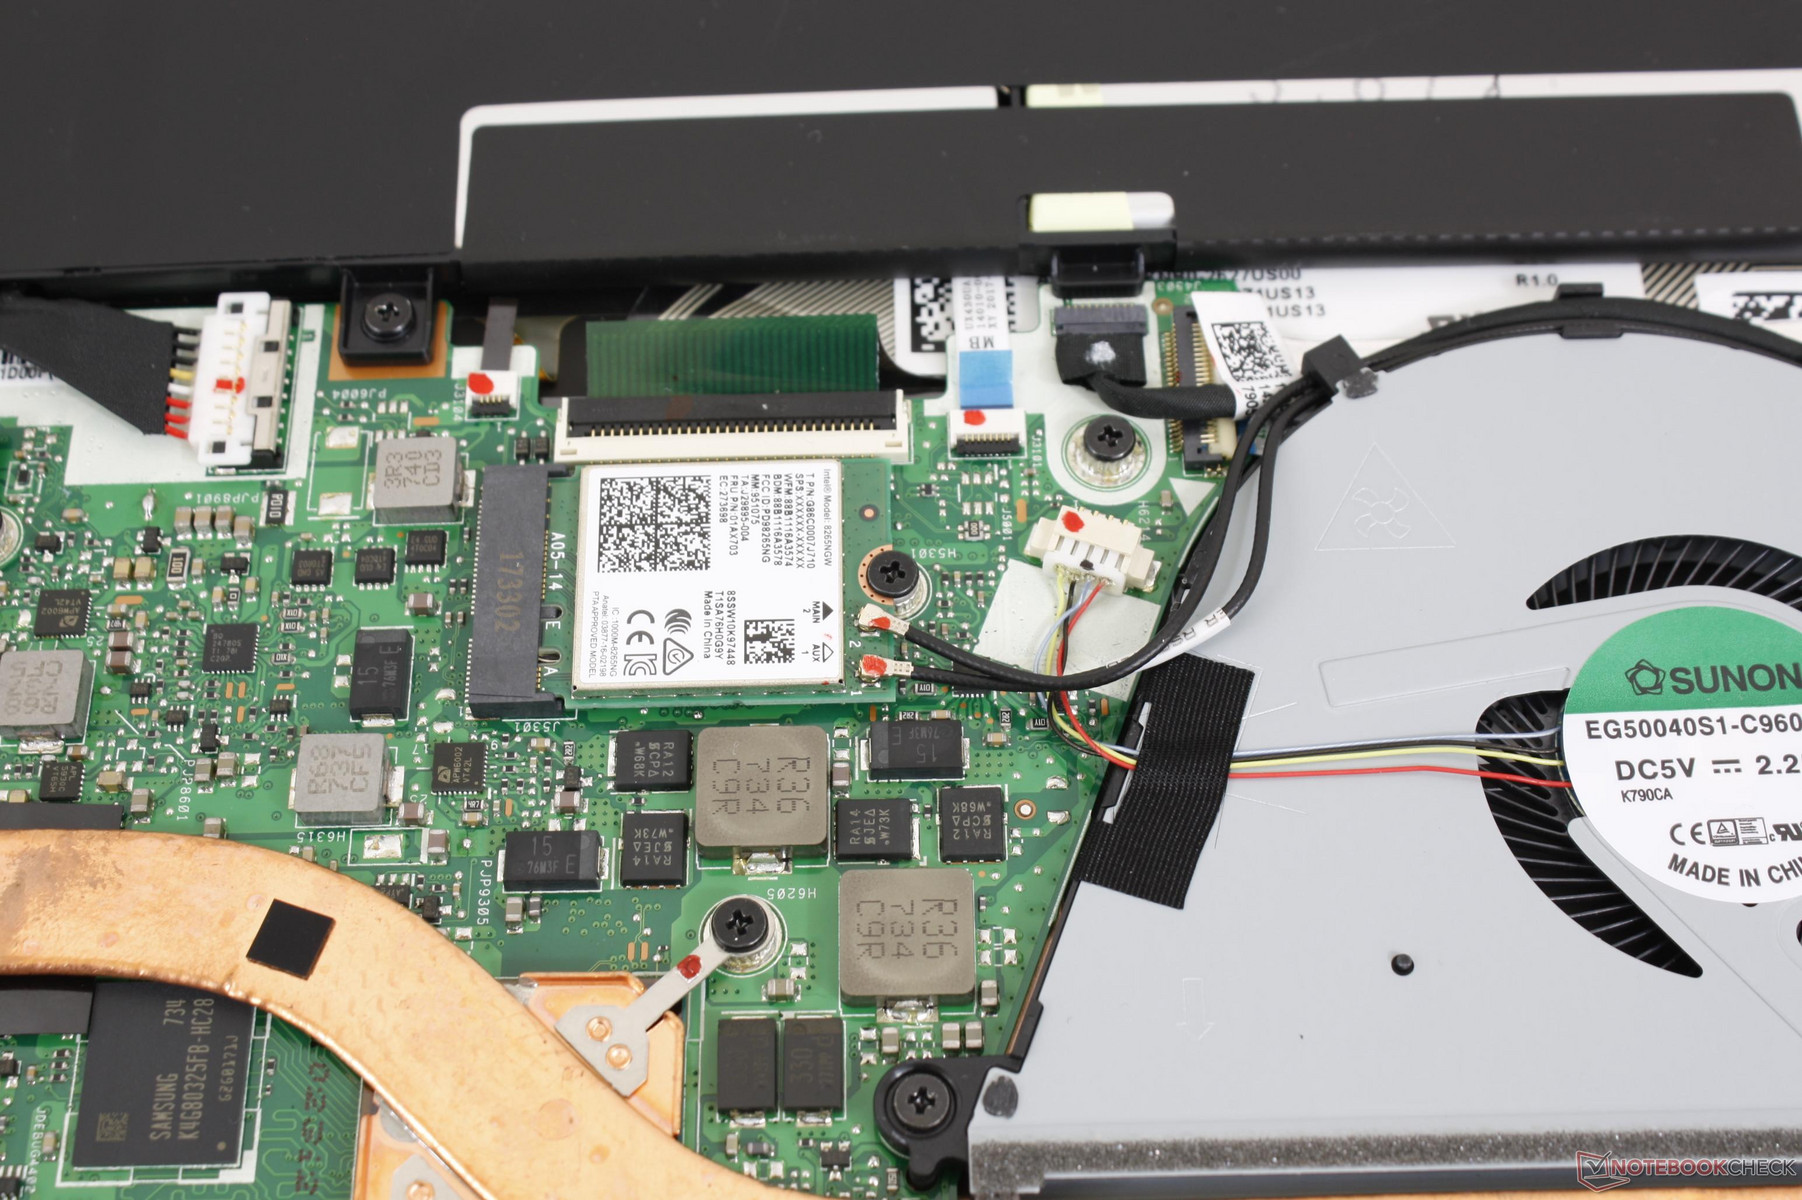
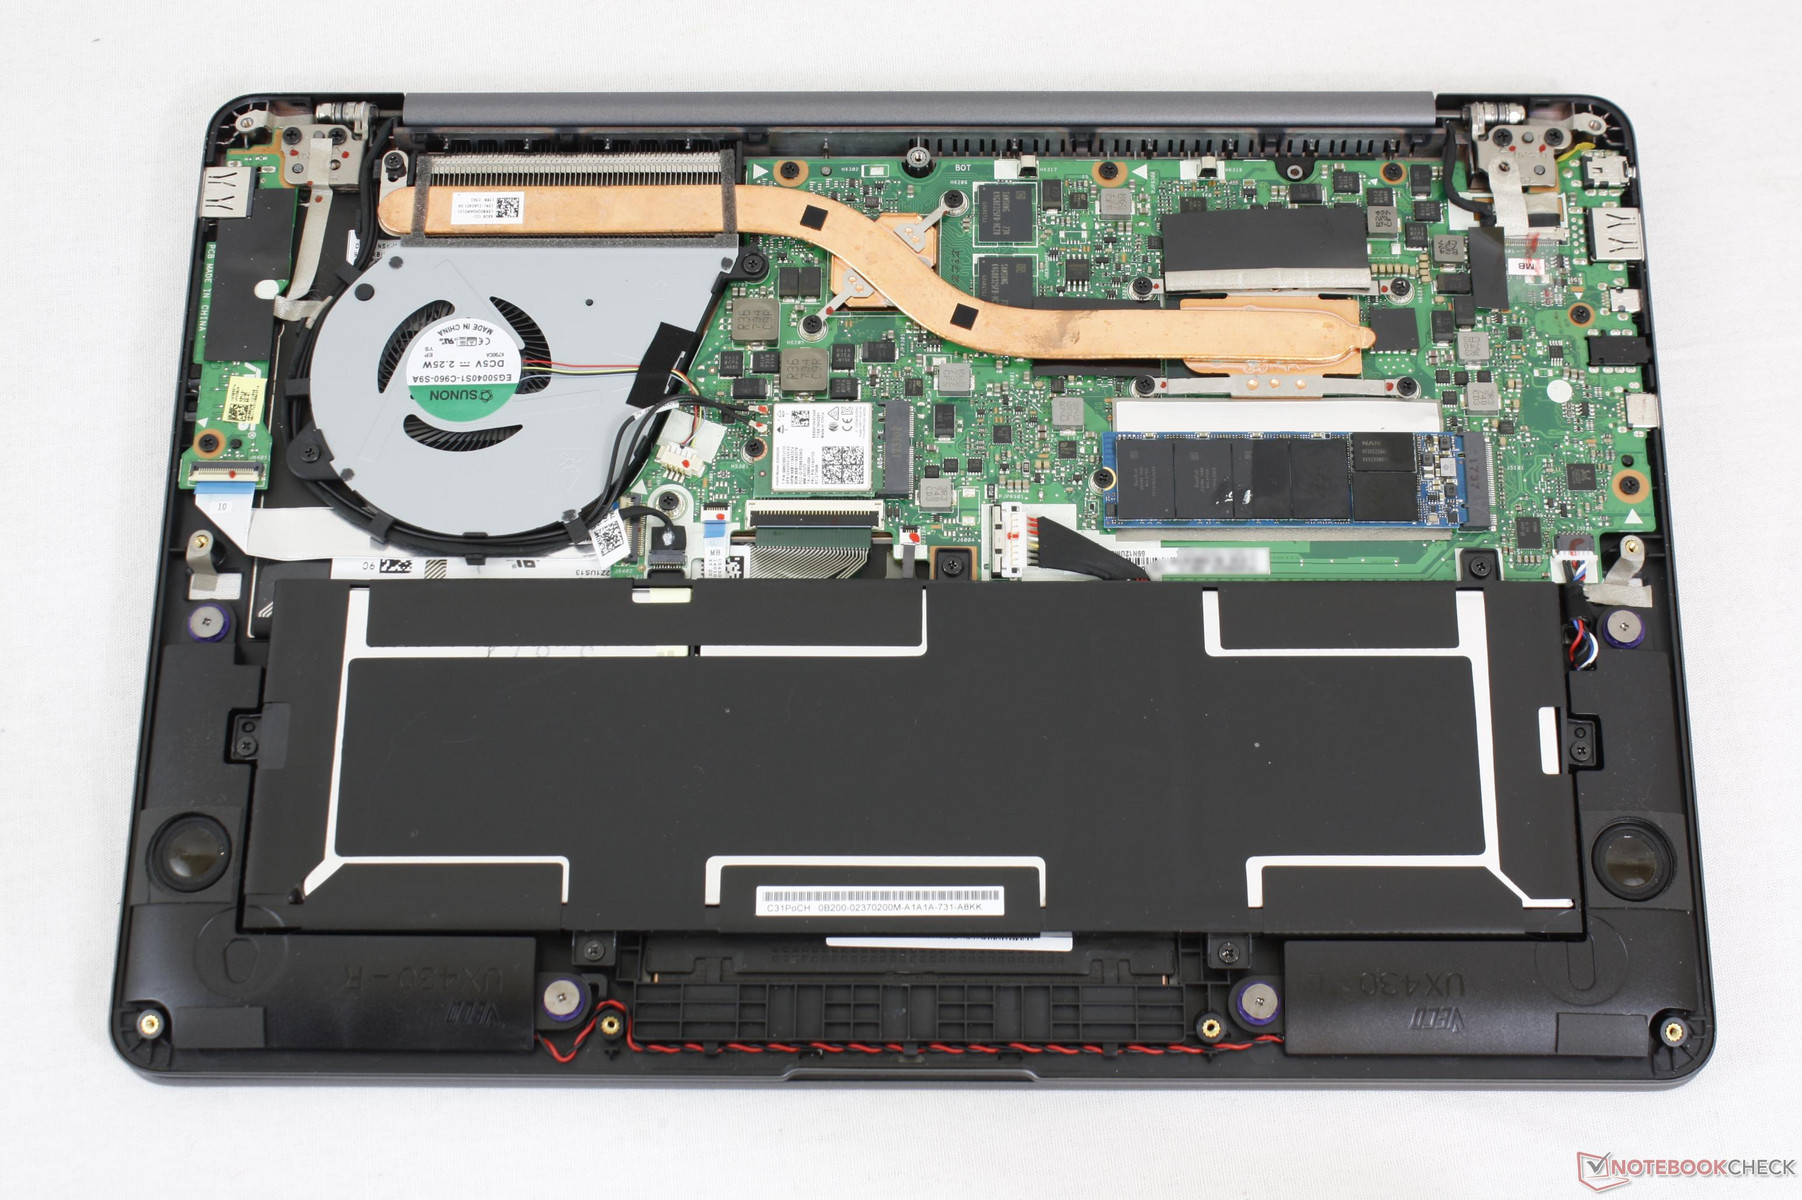
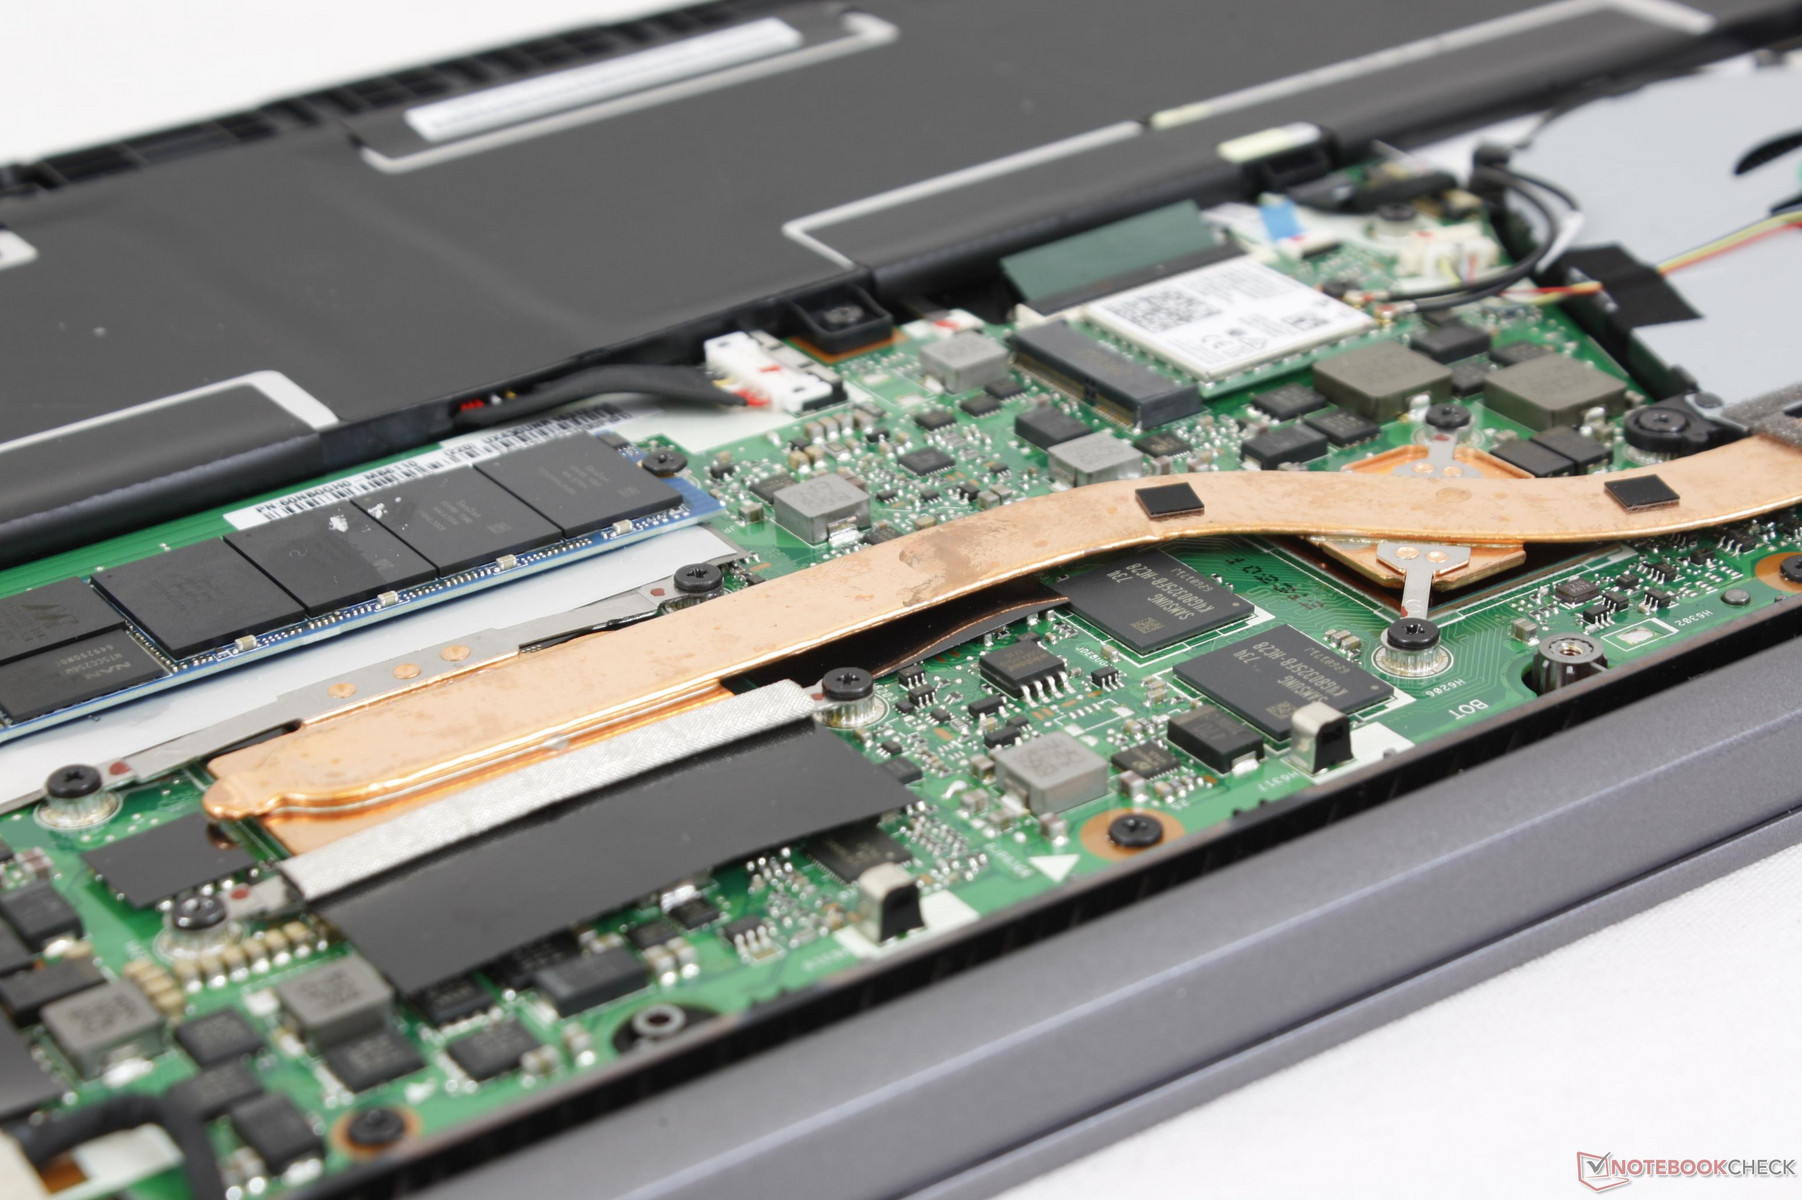
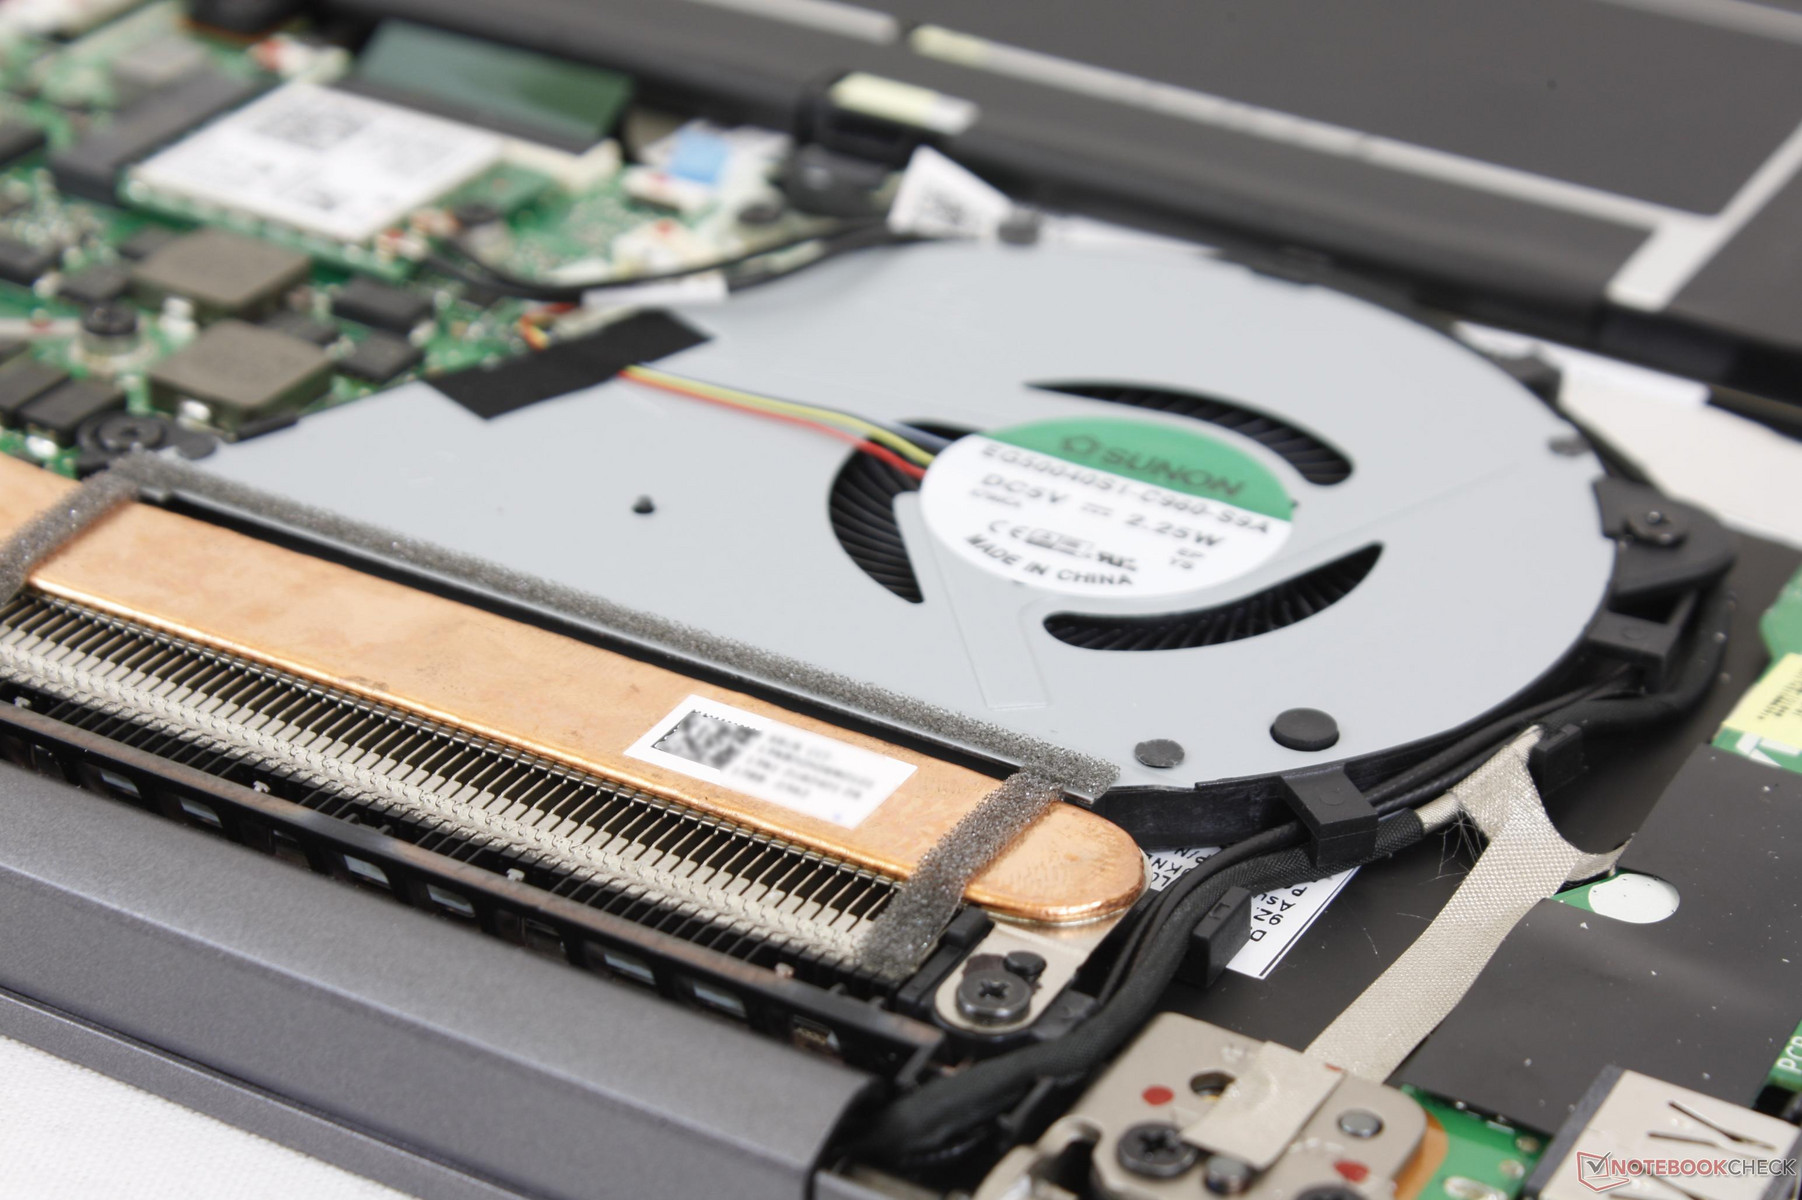
The bottom panel requires a Philips screwdriver and the same T5 hex wrench as on the Razer Blade or XPS 13 to remove. Note that there are additional screws hidden underneath the rear rubber footing for a total of 10 screws. Once removed, users are granted direct access to the internal battery, M.2 2230 WLAN module, M.2 2280 SSD, and cooling solution. System RAM is soldered.
Warranty
The standard one-year limited warranty applies. Asus recommends registering new purchases online to take advantage of benefits. The full text on the warranty card can be found here.
Please see our Guarantees, Return Policies and Warranties FAQ for country-specific information.
Input Devices
Keyboard
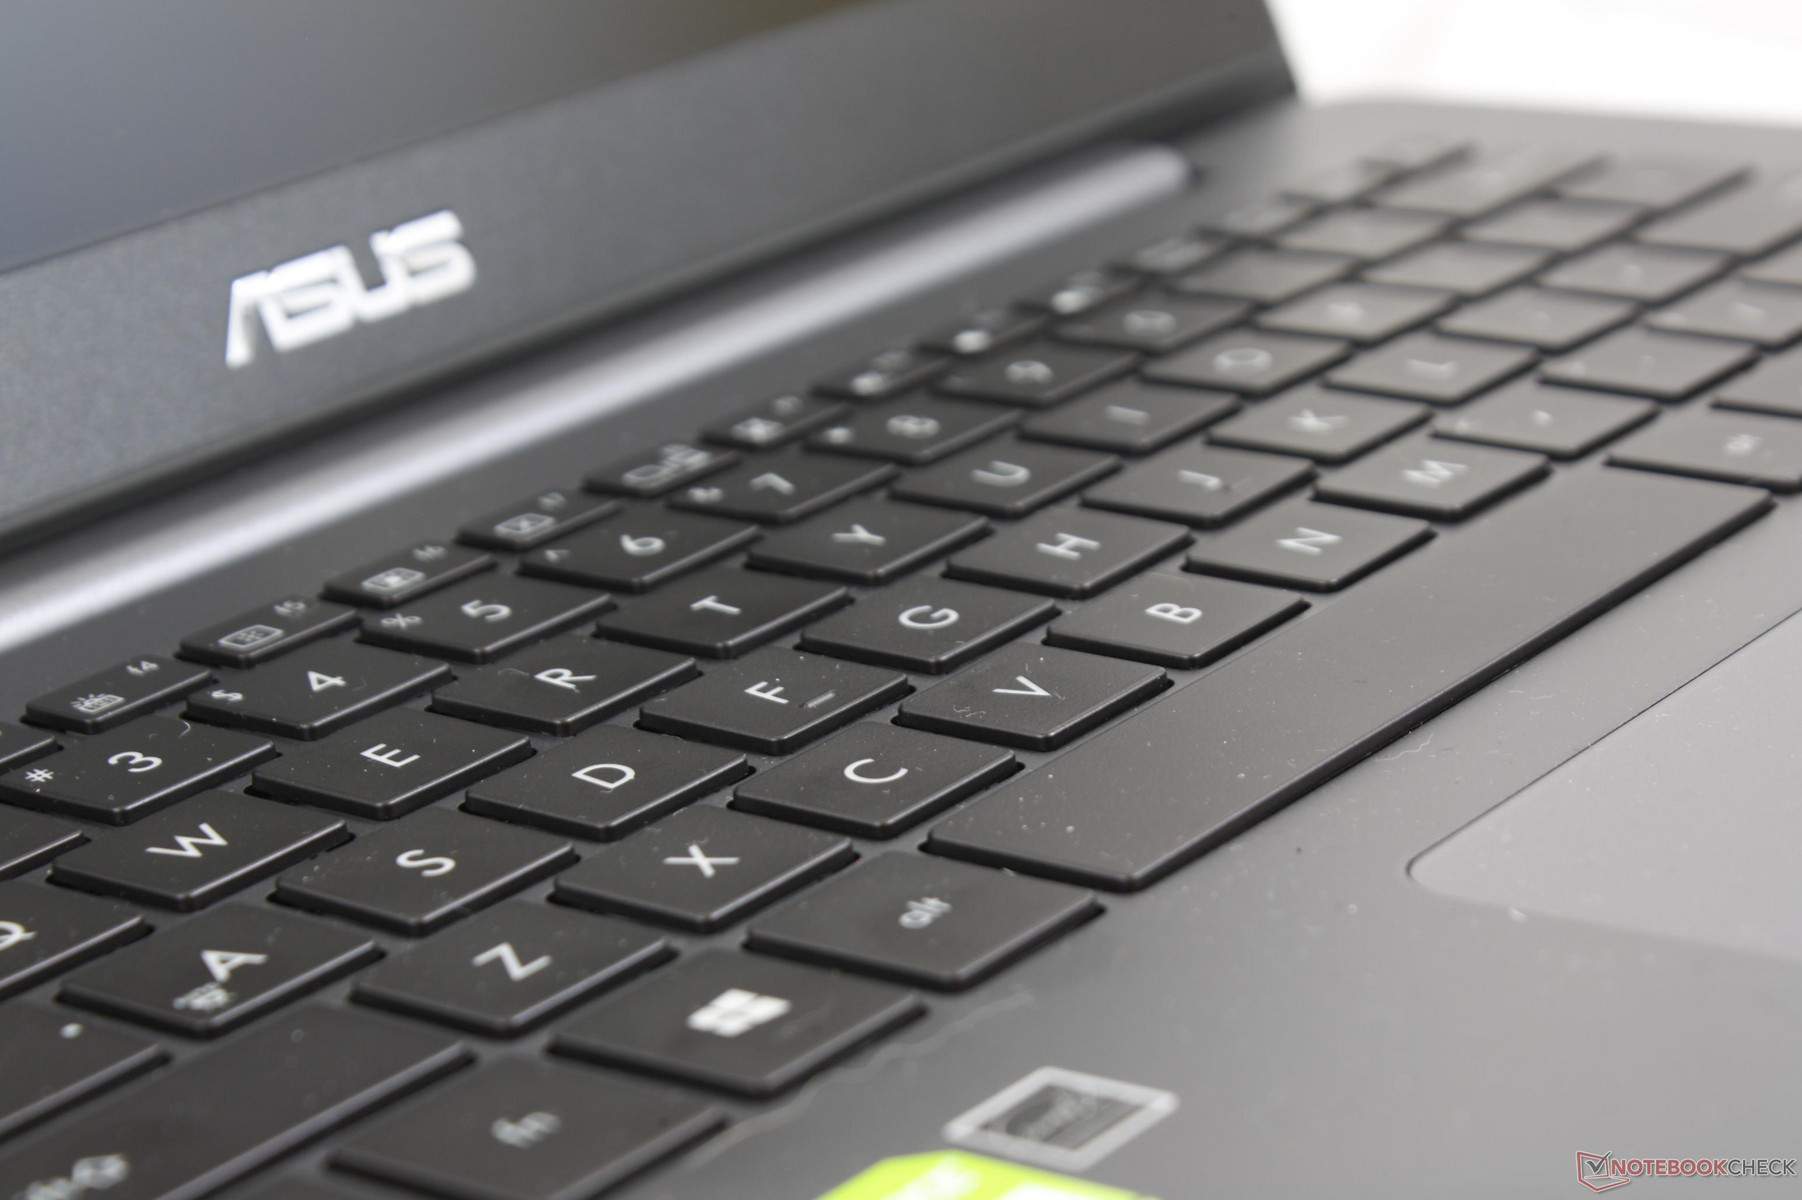
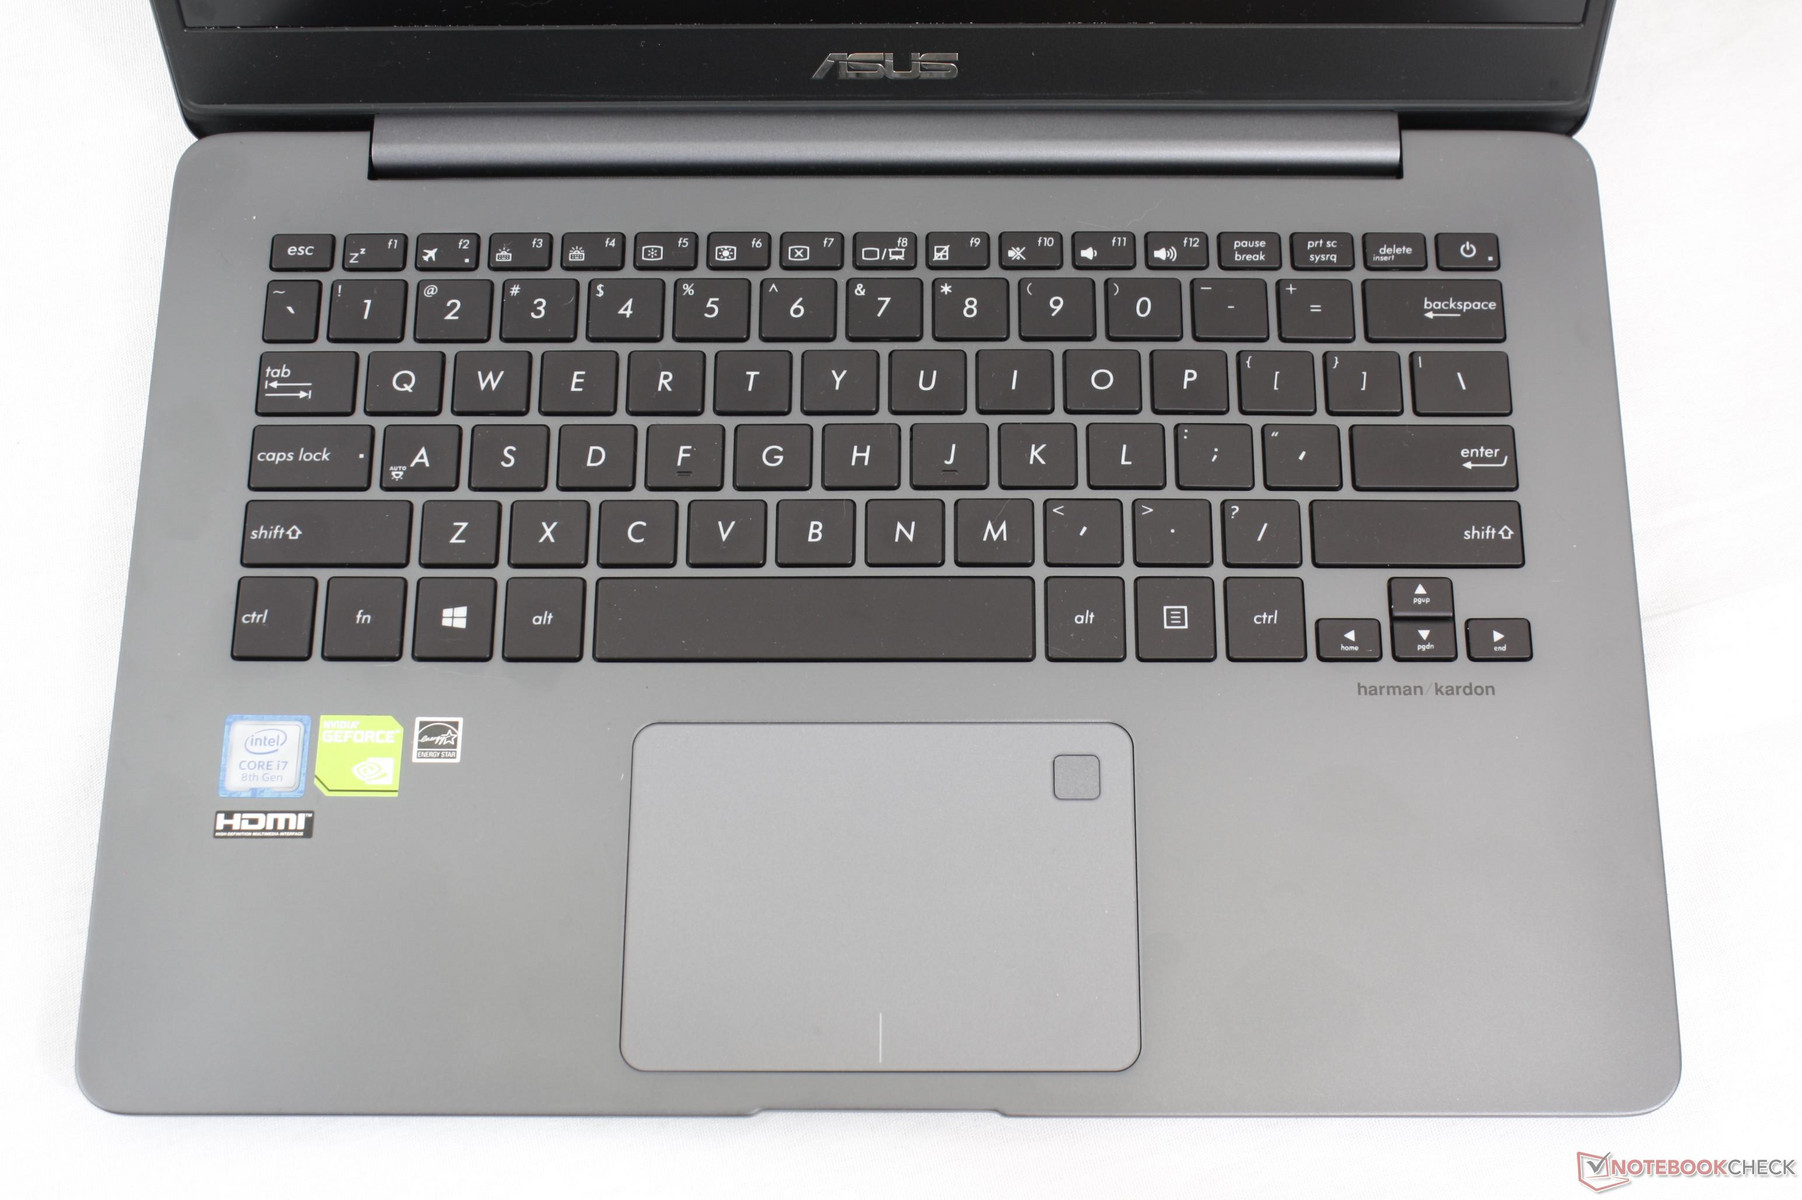
The chiclet keyboard (~27.8 x 10.2 cm) integrates a three-level white backlight with a nearly identical layout to the UX490. This unfortunately means that the Power button is still inconveniently close to both the Delete and Space keys and that the Directional keys are uncomfortably small. Tactile feedback from the individual plastic keys is lighter and spongier than what we're used to on the XPS 13, Spectre 13, or Lenovo ThinkPad series. Travel is shallow (1.4 mm) even for a thin Ultrabook and the overall typing experience is notably inferior to a cheap desktop keyboard. It will take some time for typists to become fully accustomed to the weak feel of the keyboard. On the bright side, clatter is relatively quiet and muffled.
Touchpad
The trackpad (10.5 x 7.5 cm) suffers a similar fate to the keyboard. While its surface area is only slightly narrower than the trackpad on the XPS 15 (10.5 x 8.5 cm), the integrated click keys are horrible to use. Travel is very shallow, clatter is loud, and feedback is weak. The surface appears to stick after each click and so inputting clicks in rapid succession is very difficult on the clickpad. We highly recommend tapping on the clickpad surface instead or an external mouse if possible. Fortunately, glide is uniformly smooth for reliable cursor control and two-finger scrolling.
Display
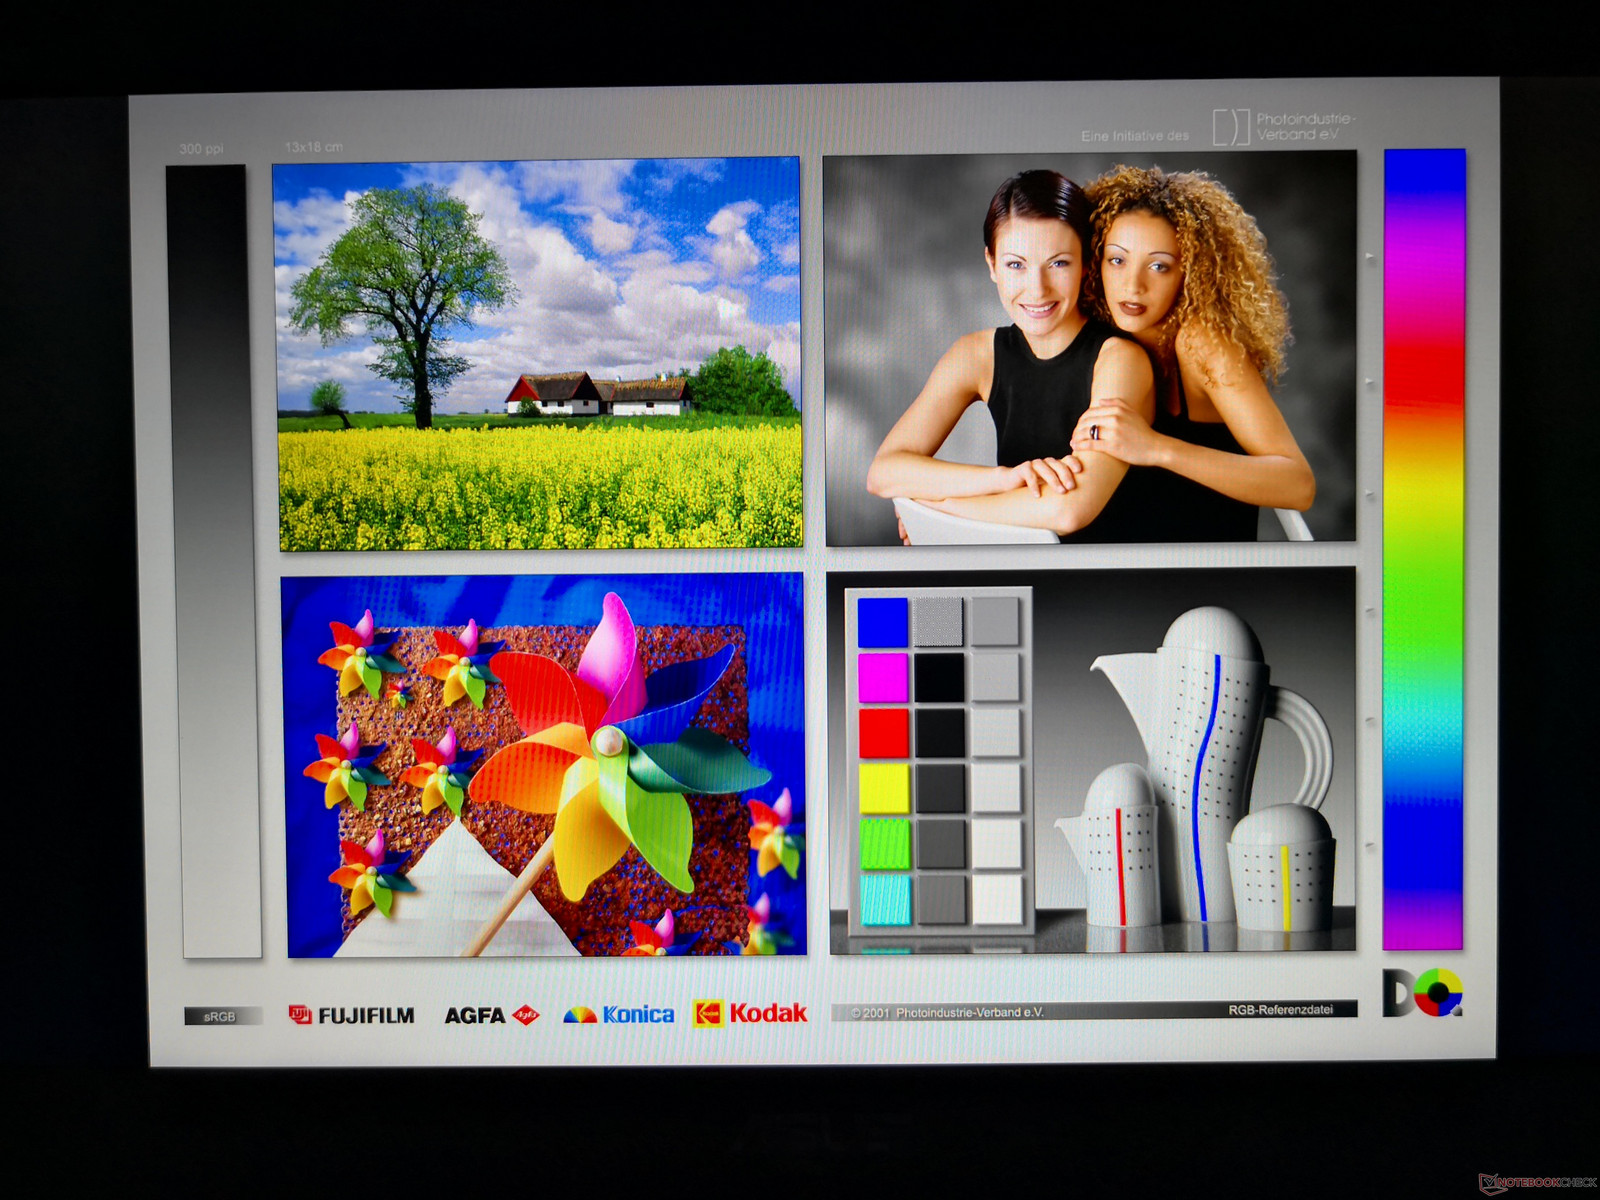
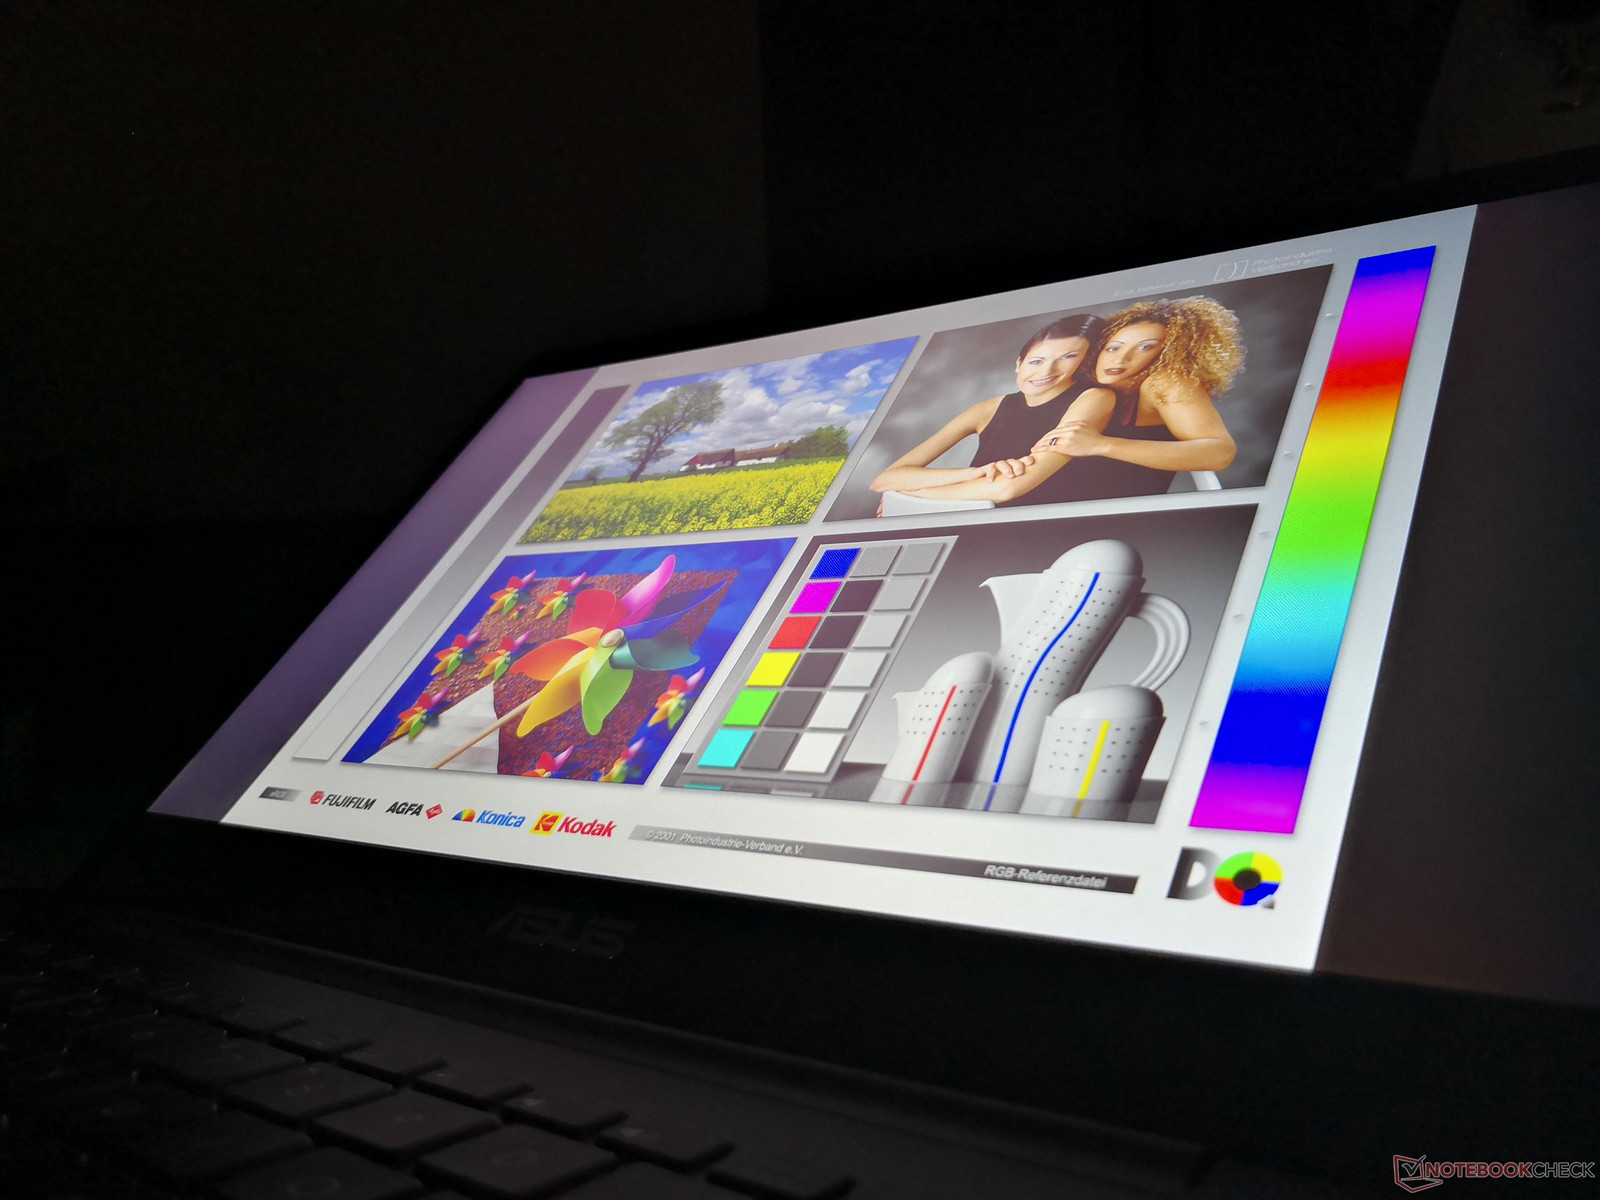
The UX430 series includes no display options other than matte 1080p whereas most Ultrabooks in this price range can have FHD or 4K UHD touchscreens. Despite the lack of choices, the display is comparable to those on competing Ultrabooks if not a bit worse. While contrast is excellent at about 1000:1, ghosting is somewhat more prevalent and color space is slightly narrower on the Asus. The most notable drawback is the relatively dim backlight of just 300 nits maximum that negatively impacts visibility when outdoors.
Subjectively, the matte display is nearly as sharp as a glossy display since it suffers from no major graininess issues commonly found on most other matte panels. On the other hand, there is irrefutable pulse-width modulation on all brightness levels up to 99 percent and so users who may be sensitive to onscreen flickering may want to avoid this notebook altogether.
Note that the UX430 uses a similar NV140FHM IPS panel from BOE Display as do the Lenovo Yoga 520 and ThinkPad Yoga 460. Consequently, these three notebooks share somewhat similar display characteristics.

| |||||||||||||||||||||||||
Brightness Distribution: 89 %
Center on Battery: 310.4 cd/m²
Contrast: 1001:1 (Black: 0.31 cd/m²)
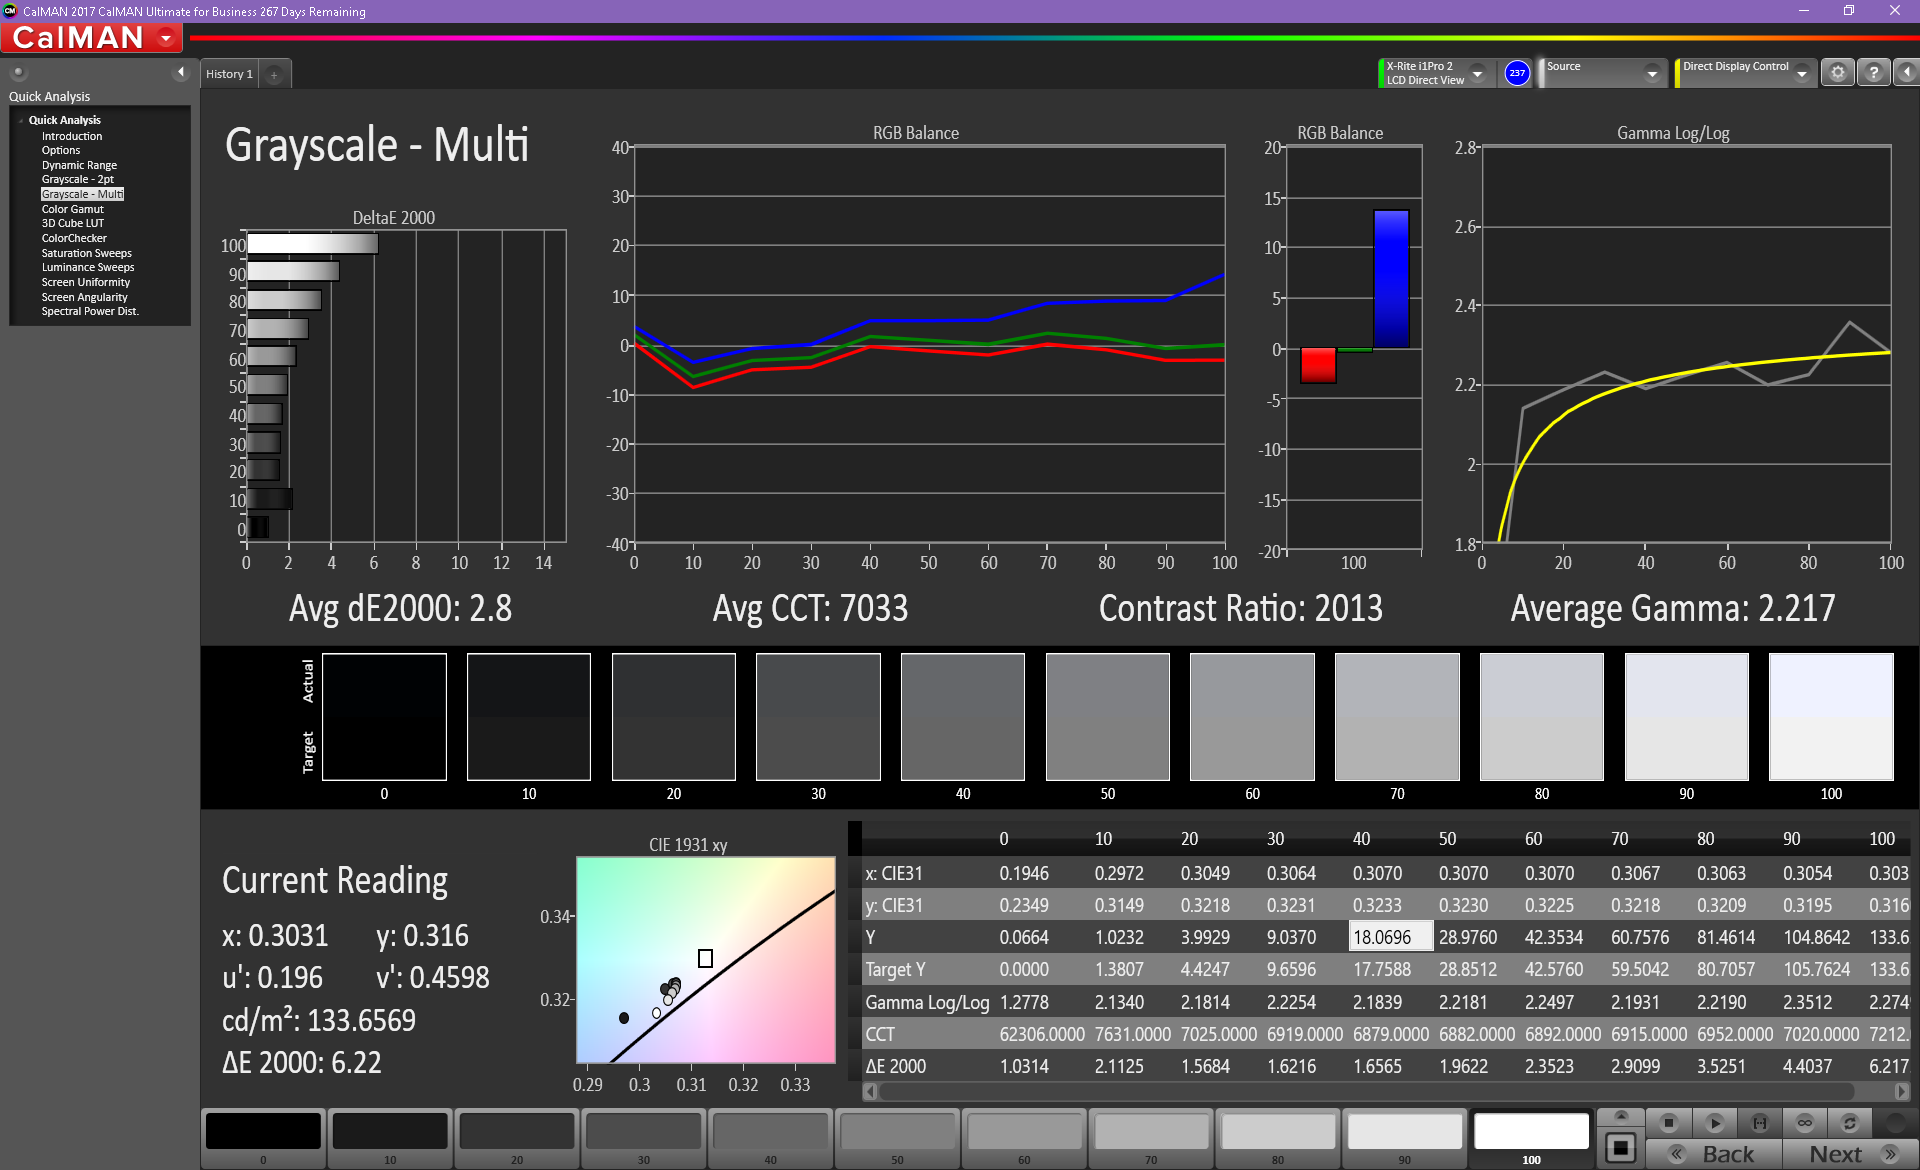
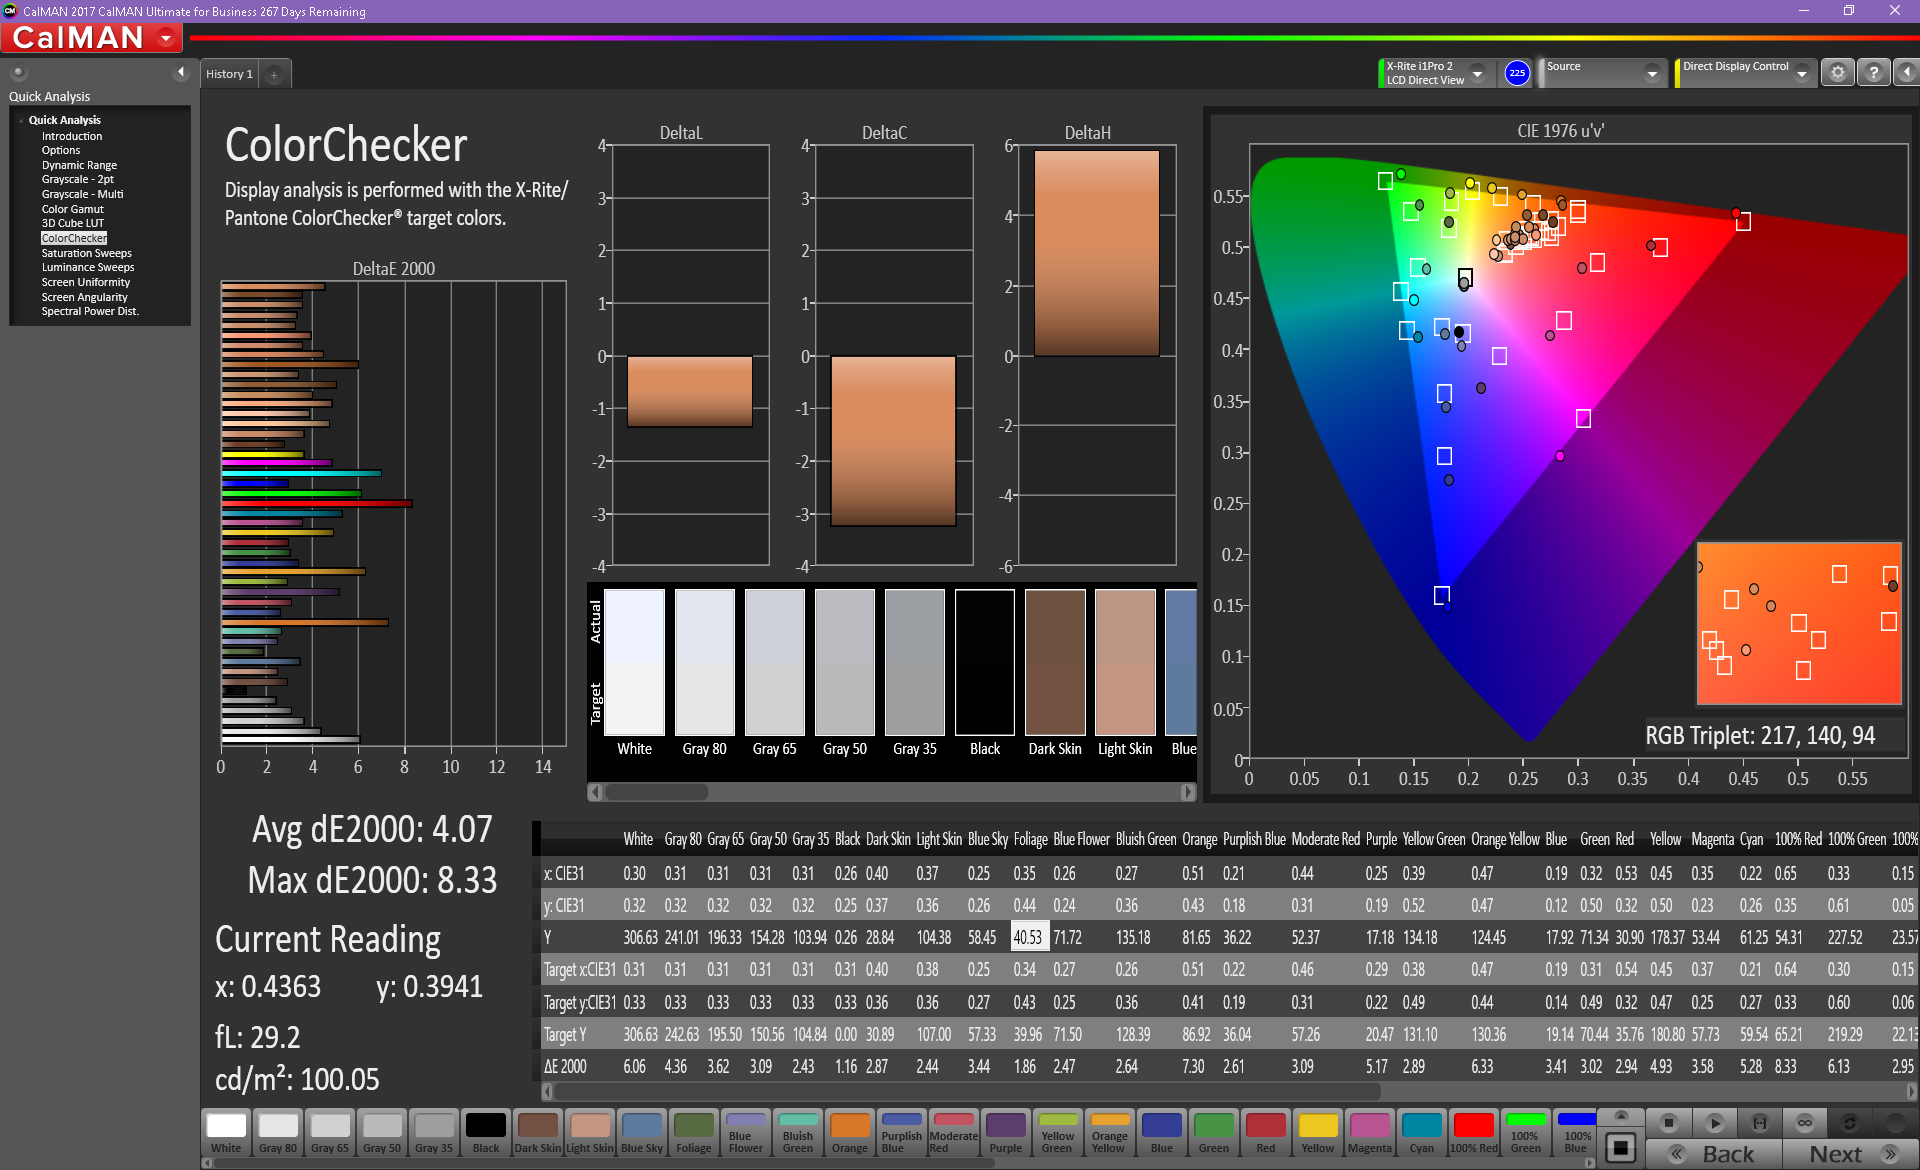
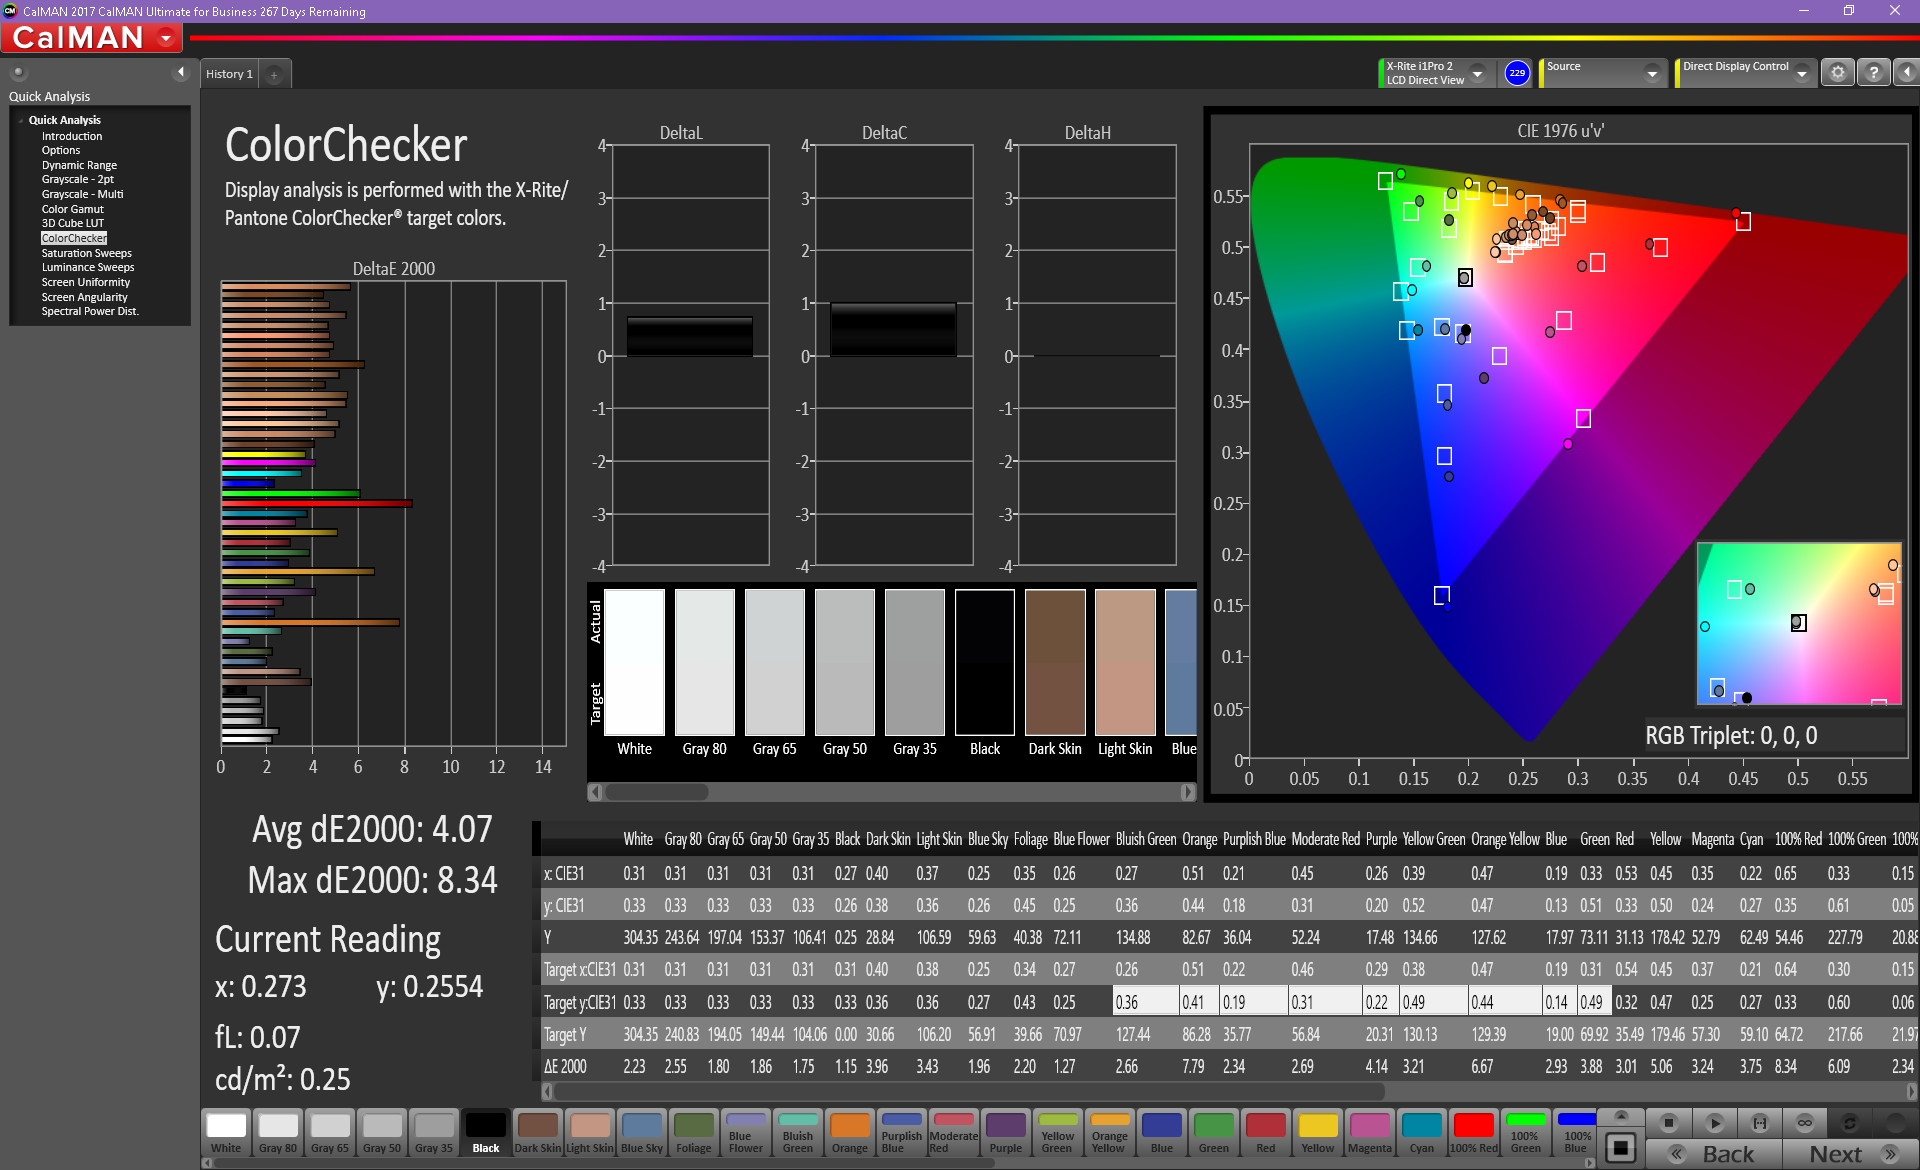
ΔE ColorChecker Calman: 4.07 | ∀{0.5-29.43 Ø4.73}
calibrated: 4.07
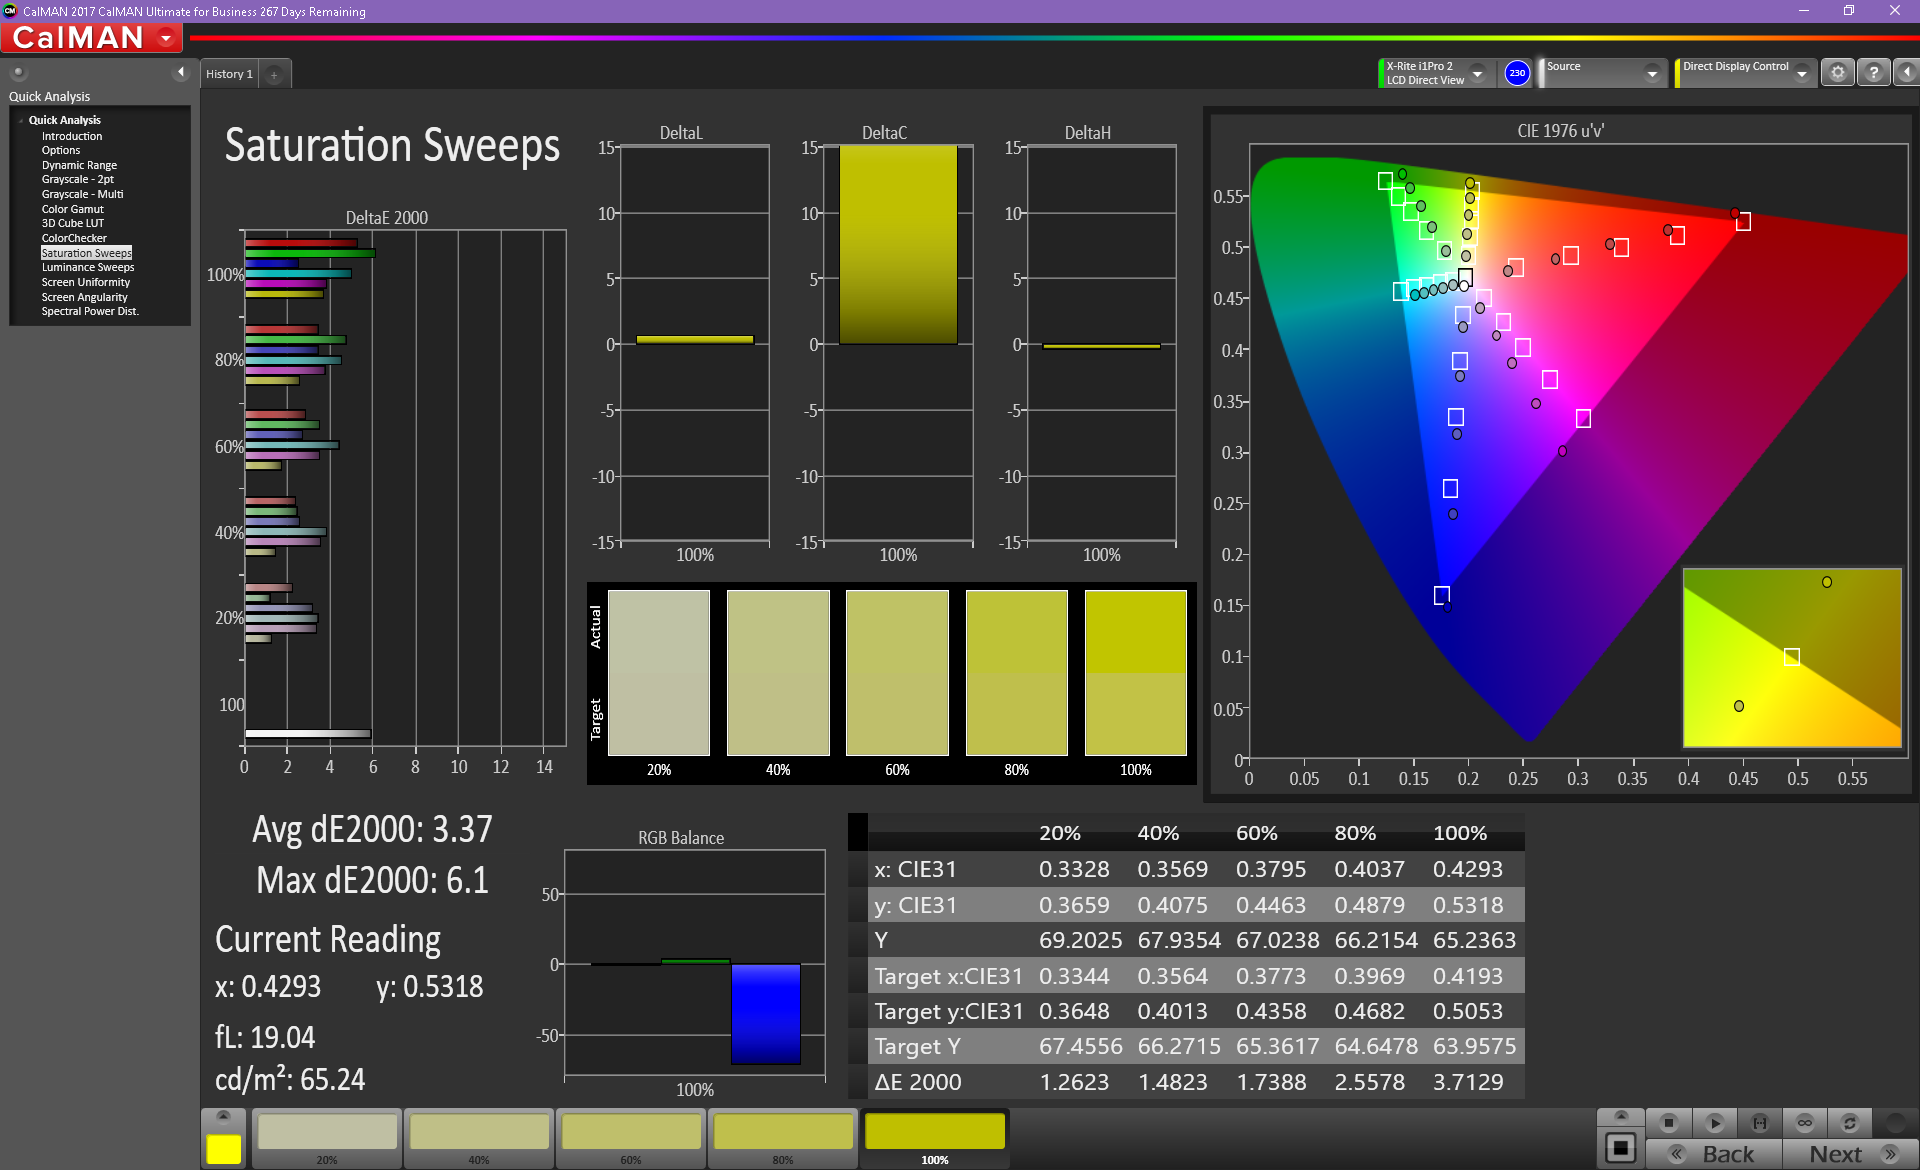
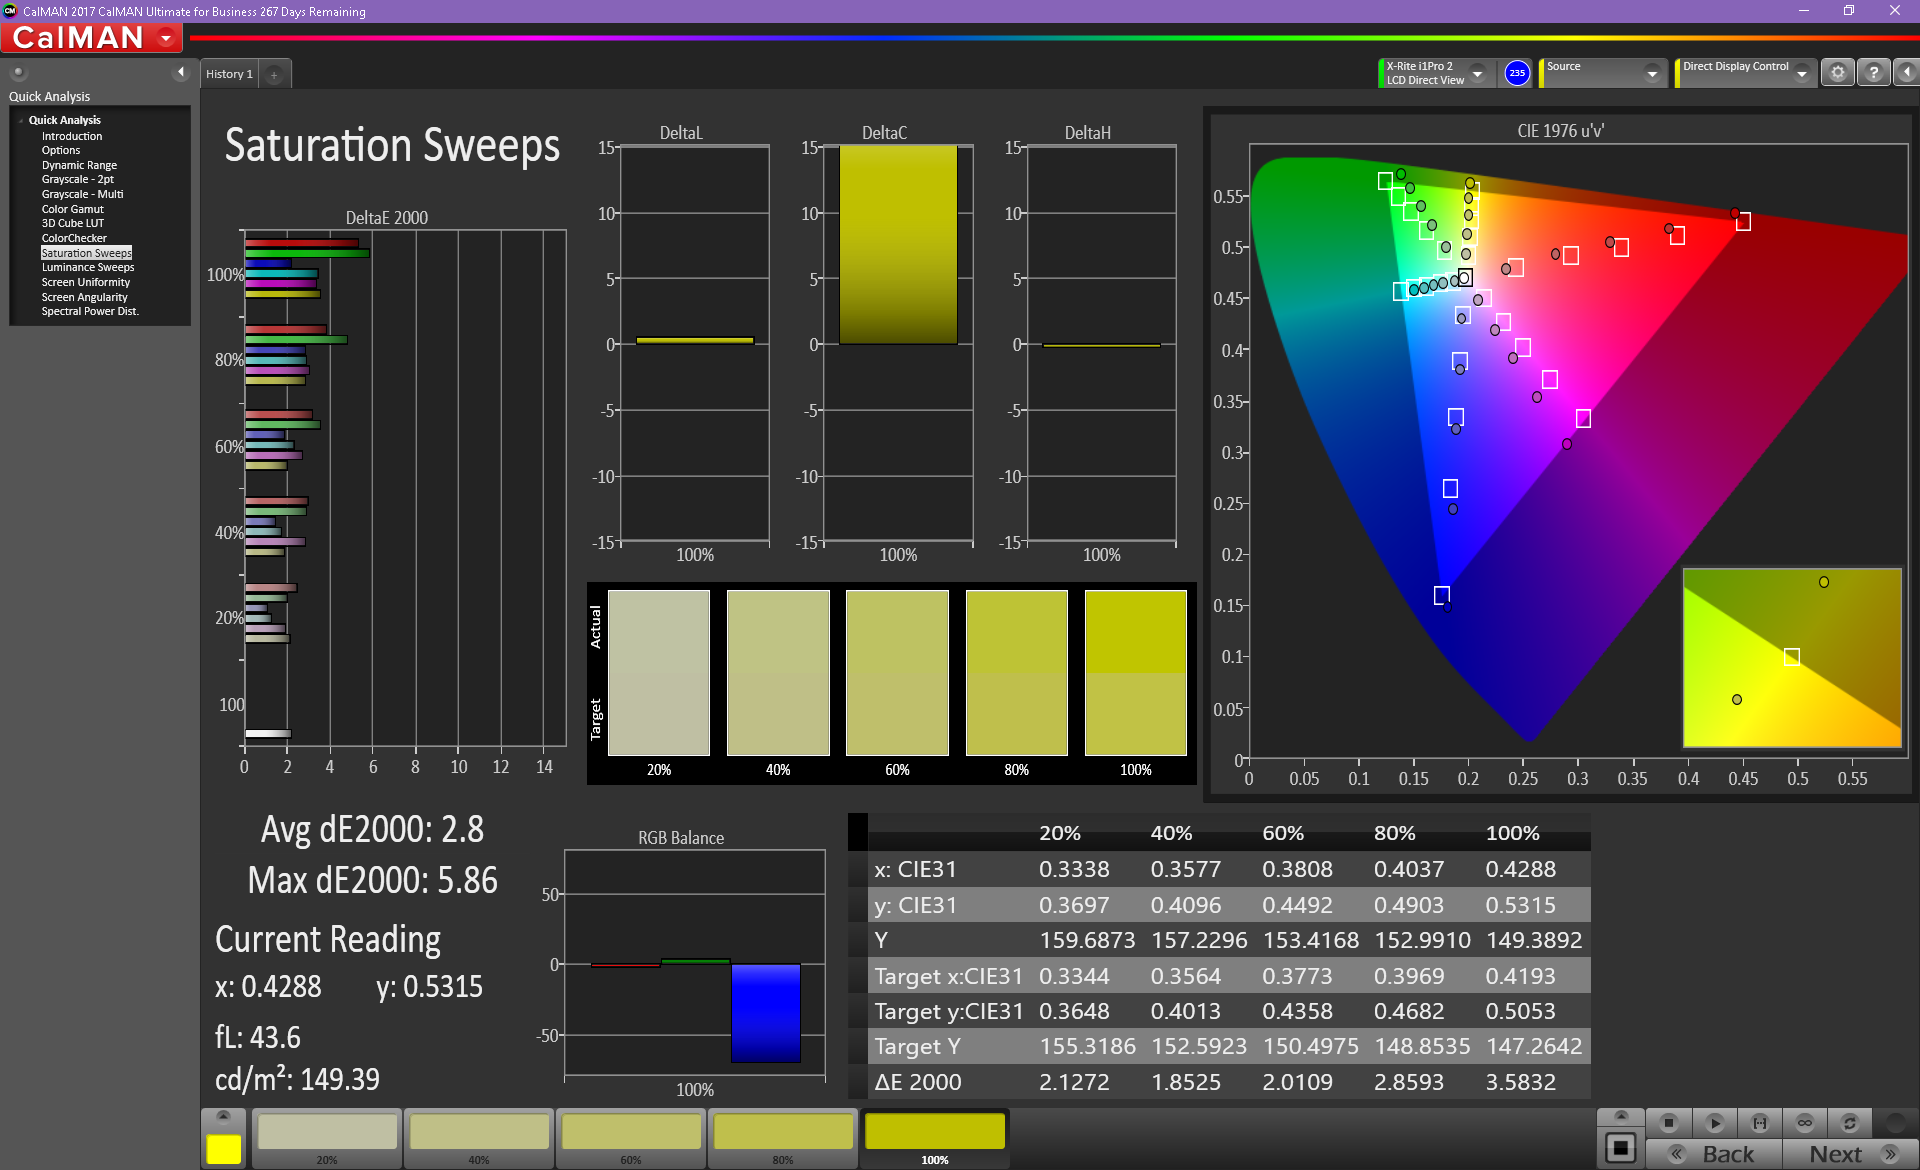
ΔE Greyscale Calman: 2.8 | ∀{0.09-98 Ø4.97}
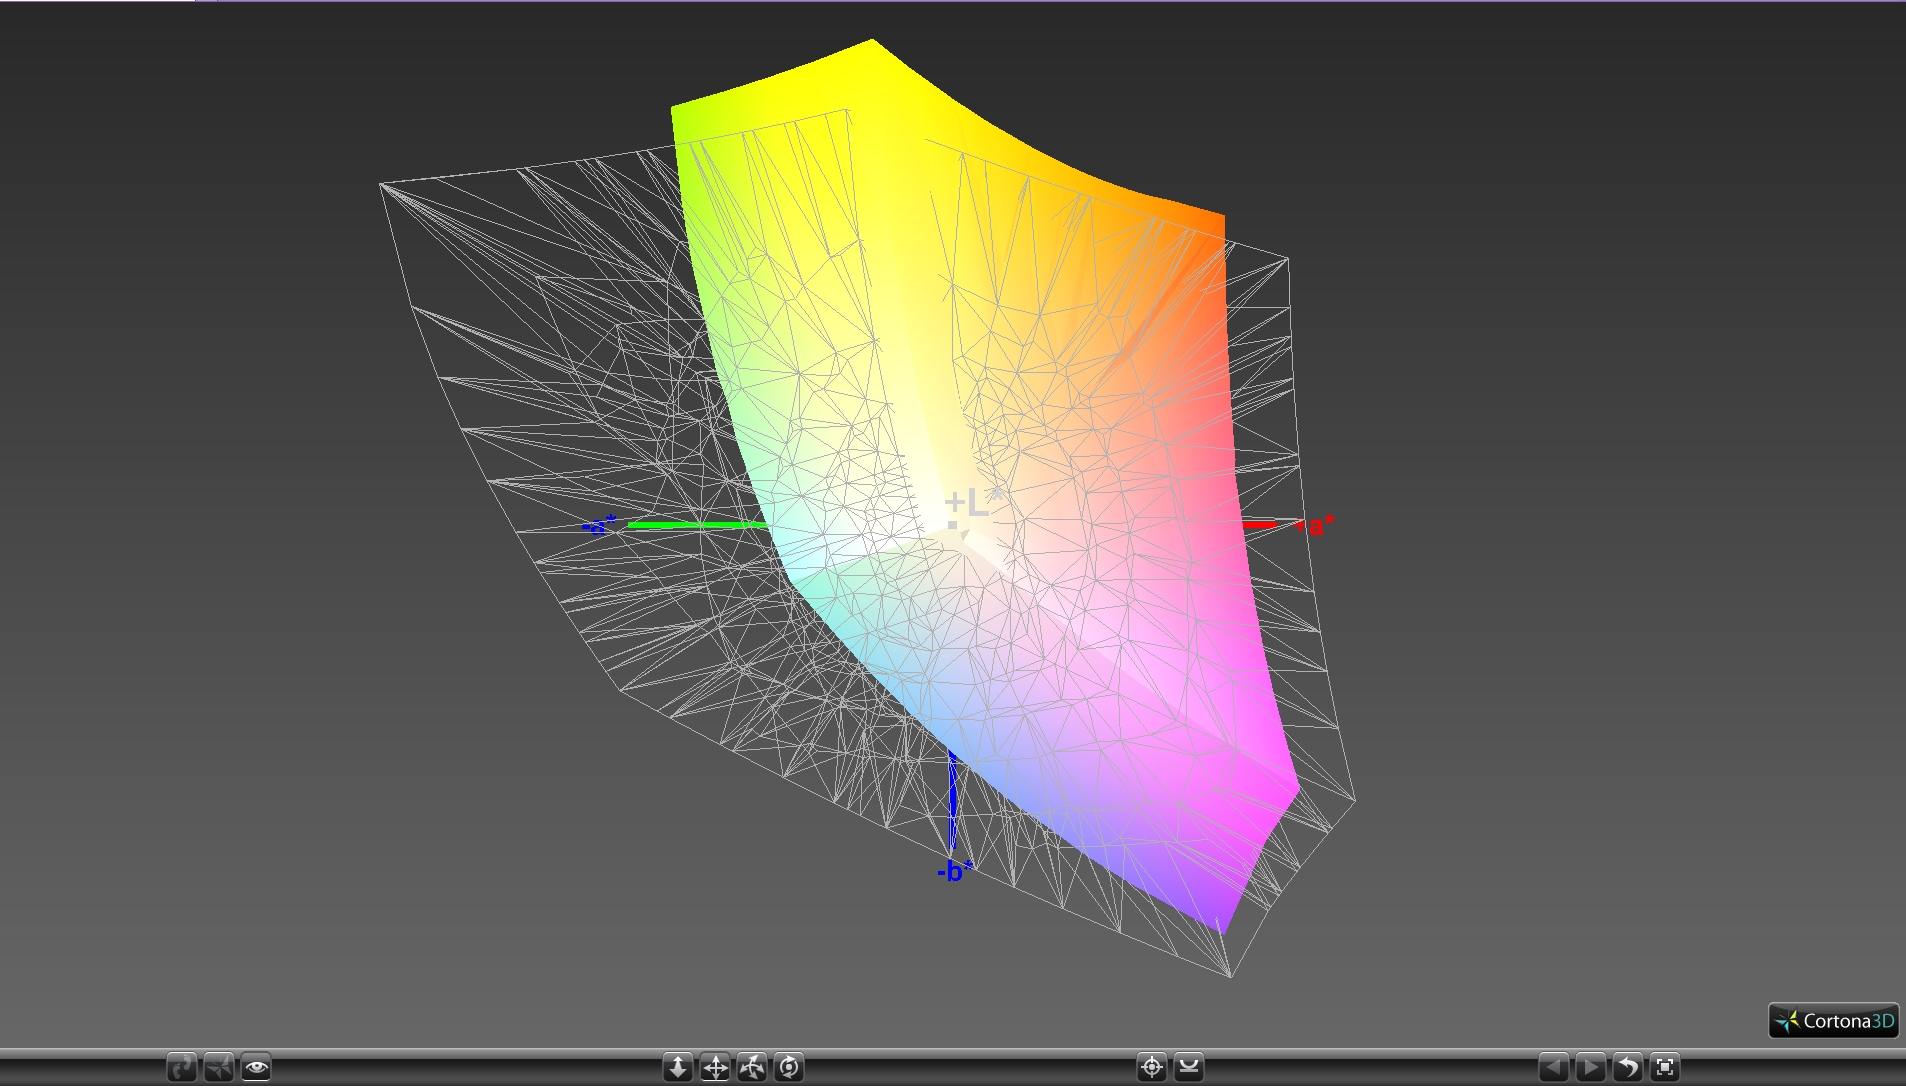
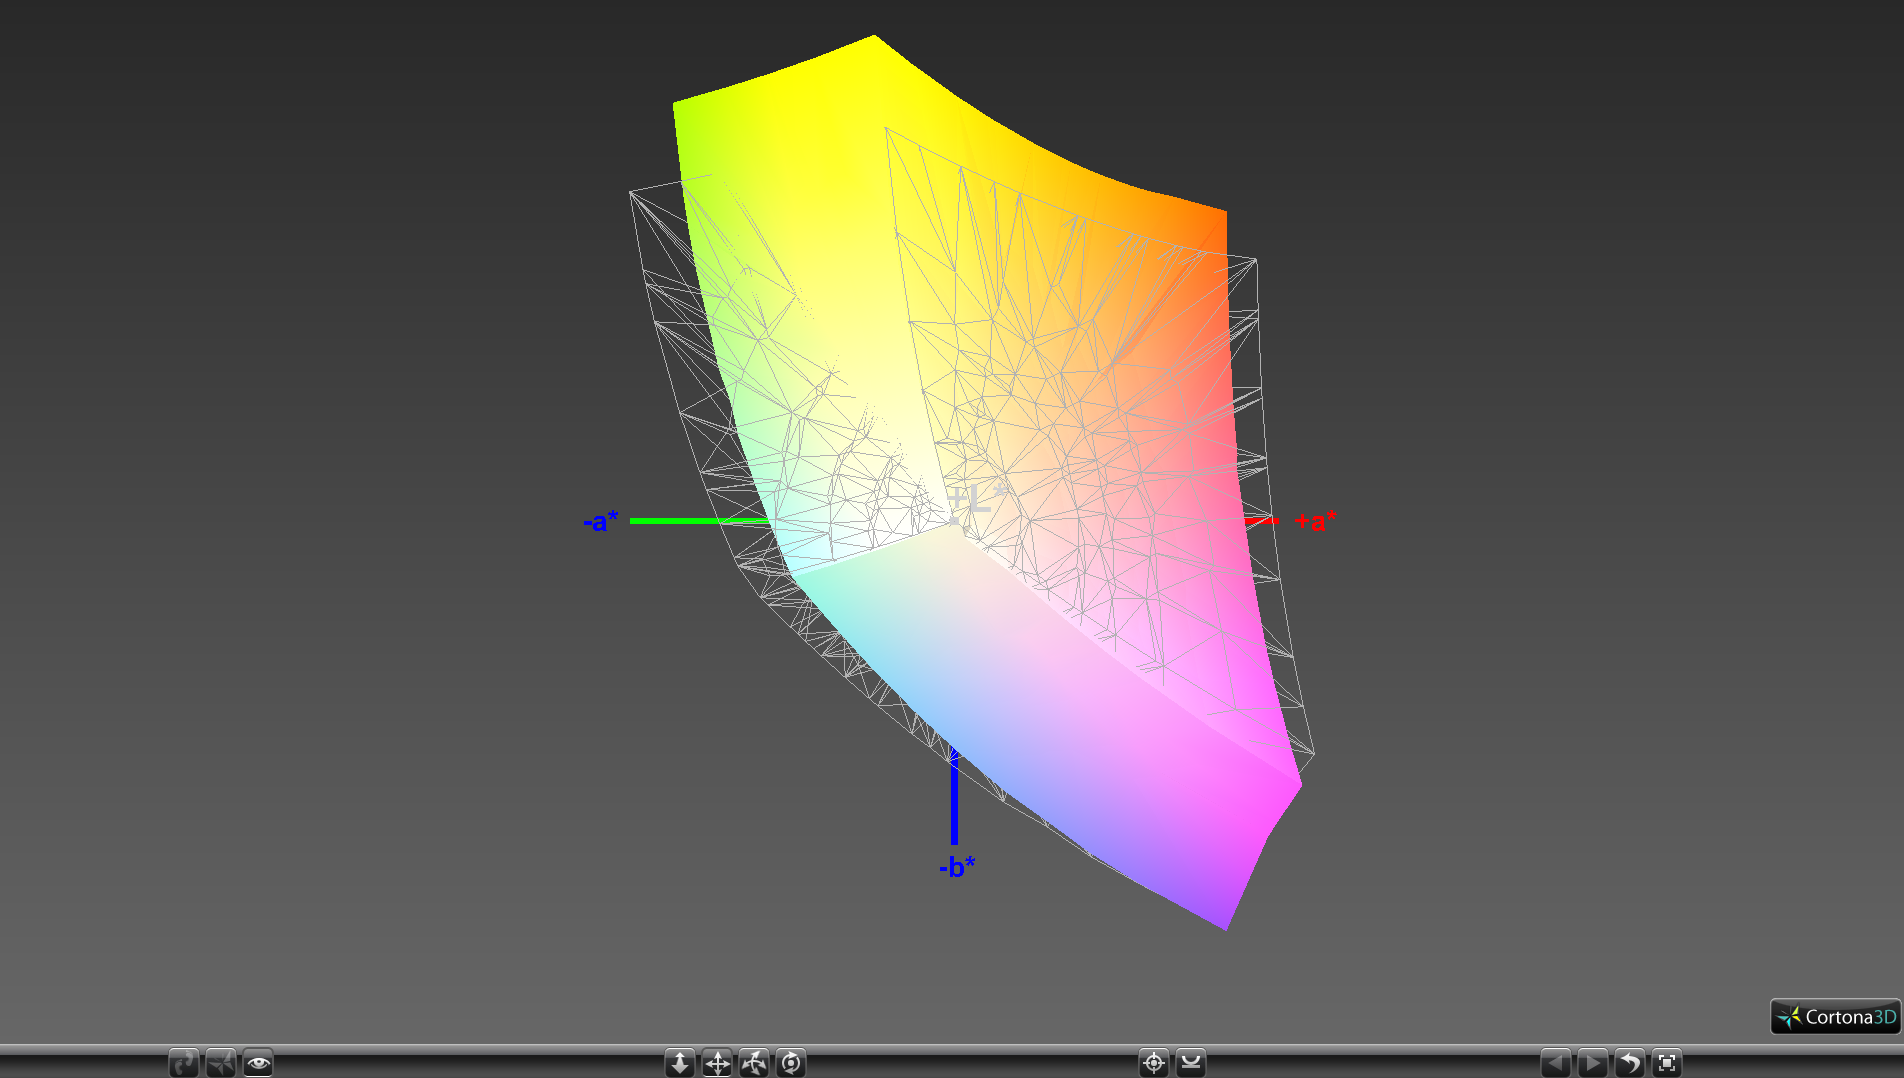
84.6% sRGB (Argyll 1.6.3 3D)
55.3% AdobeRGB 1998 (Argyll 1.6.3 3D)
62% AdobeRGB 1998 (Argyll 3D)
84.8% sRGB (Argyll 3D)
64.6% Display P3 (Argyll 3D)
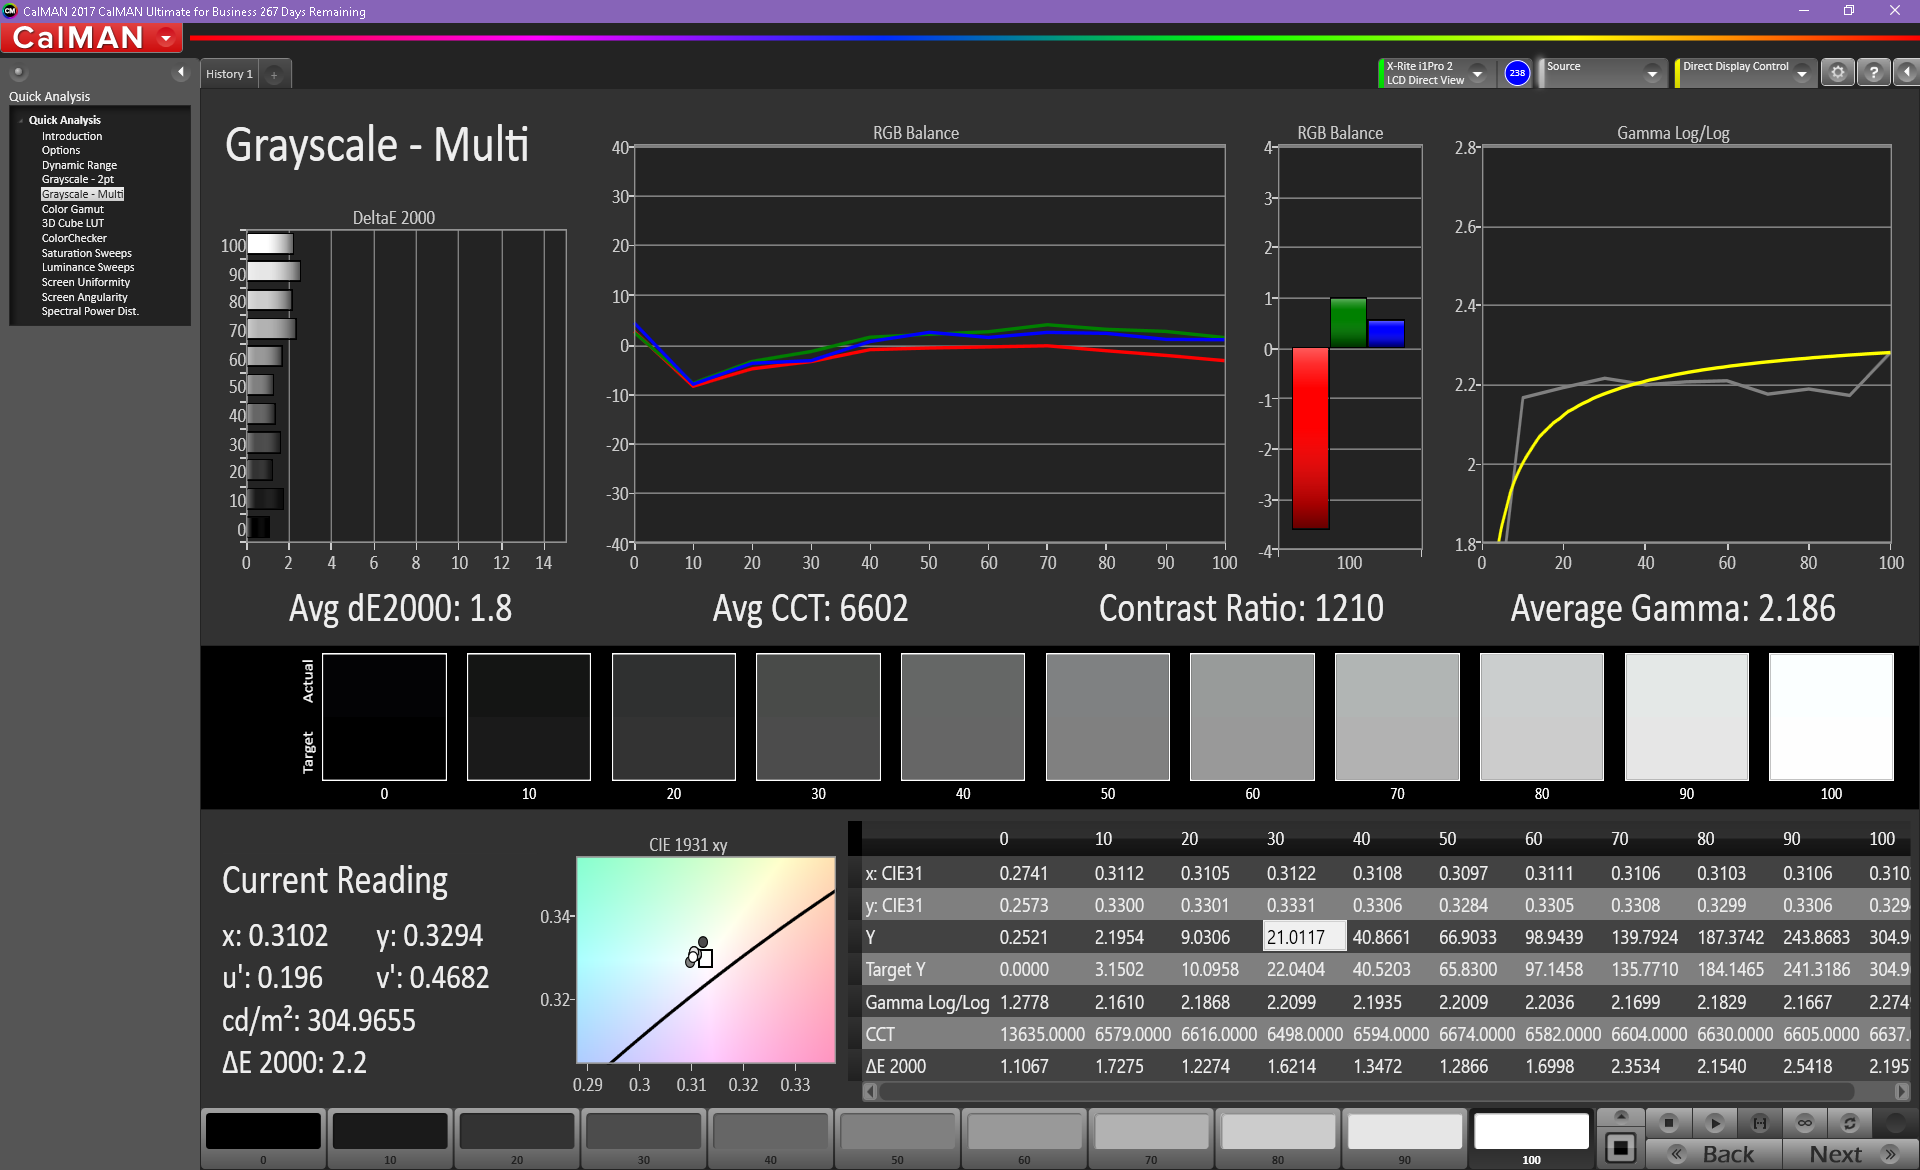
Gamma: 2.217
CCT: 7033 K
| Asus Zenbook UX430UN NV140FHM-N62, BOE0718, IPS, 14", 1920x1080 | Dell XPS 13 9370 i5 UHD ID: Sharp SHP148B, Name: LQ133D1, Dell P/N: 8XDHY, IPS, 13.3", 3840x2160 | Samsung Notebook 9 NP900X5T-X01US ID: BOE06E8, Name: BOE HF NV150FHB-N31, IPS, 15", 1920x1080 | Asus Zenbook 3 Deluxe UX490UA AU Optronics AUO383D / B140HAN03.8, IPS, 14", 1920x1080 | Huawei MateBook X Chi Mei CMN8201 / P130ZDZ-EF1, , 13.3", 2160x1440 | Microsoft Surface Laptop i5 ID: MEI96A2, Name: Panasonic VVX14T092N00, IPS, 13.5", 2256x1504 | |
|---|---|---|---|---|---|---|
| Display | 12% | 8% | -3% | 8% | 9% | |
| Display P3 Coverage (%) | 64.6 | 68.9 7% | 65.2 1% | 58.7 -9% | 65.8 2% | 67.8 5% |
| sRGB Coverage (%) | 84.8 | 98.4 16% | 97.4 15% | 86.9 2% | 96.2 13% | 94.3 11% |
| AdobeRGB 1998 Coverage (%) | 62 | 69.5 12% | 66.8 8% | 59.9 -3% | 66.8 8% | 69.5 12% |
| Response Times | -30% | 9% | 37% | 32% | -6% | |
| Response Time Grey 50% / Grey 80% * (ms) | 43.6 ? | 67.2 ? -54% | 46 ? -6% | 24 ? 45% | 33 ? 24% | 50.8 ? -17% |
| Response Time Black / White * (ms) | 39.2 ? | 41.6 ? -6% | 29.6 ? 24% | 28 ? 29% | 24 ? 39% | 37.2 ? 5% |
| PWM Frequency (Hz) | 200 ? | 2500 ? | 2976 ? | |||
| Screen | 11% | -2% | 2% | 20% | 23% | |
| Brightness middle (cd/m²) | 310.4 | 496.4 60% | 558.2 80% | 337 9% | 408 31% | 384.2 24% |
| Brightness (cd/m²) | 303 | 469 55% | 528 74% | 295 -3% | 395 30% | 378 25% |
| Brightness Distribution (%) | 89 | 84 -6% | 92 3% | 81 -9% | 88 -1% | 90 1% |
| Black Level * (cd/m²) | 0.31 | 0.5 -61% | 0.46 -48% | 0.21 32% | 0.45 -45% | 0.36 -16% |
| Contrast (:1) | 1001 | 993 -1% | 1213 21% | 1605 60% | 907 -9% | 1067 7% |
| Colorchecker dE 2000 * | 4.07 | 2.9 29% | 4.41 -8% | 4.89 -20% | 1.55 62% | 1.8 56% |
| Colorchecker dE 2000 max. * | 8.33 | 5.26 37% | 10.91 -31% | 8.43 -1% | 2.19 74% | 4.2 50% |
| Colorchecker dE 2000 calibrated * | 4.07 | |||||
| Greyscale dE 2000 * | 2.8 | 3.9 -39% | 6.6 -136% | 4.28 -53% | 1.91 32% | 1.2 57% |
| Gamma | 2.217 99% | 2.066 106% | 2.19 100% | 2.25 98% | 2.34 94% | 2.21 100% |
| CCT | 7033 92% | 7169 91% | 7615 85% | 7352 88% | 6491 100% | 6708 97% |
| Color Space (Percent of AdobeRGB 1998) (%) | 55.3 | 63.9 16% | 61.3 11% | 56 1% | 61 10% | 63.7 15% |
| Color Space (Percent of sRGB) (%) | 84.6 | 98.2 16% | 97.2 15% | 87 3% | 96 13% | 94.2 11% |
| Total Average (Program / Settings) | -2% /
5% | 5% /
2% | 12% /
6% | 20% /
19% | 9% /
16% |
* ... smaller is better
Color space is approximately 85 percent and 55 percent of the sRGB and AdobeRGB standards, respectively, which is very similar to the pricier Zenbook 3 UX490UA. Note that we are unable to record the promised 100 percent sRGB coverage that Asus is advertising. While more than sufficient for video playback and web browsing, digital artists may want a wider color gamut that many competing Ultrabooks offer such as the ones above.

Further analyses with a spectrophotometer reveal a generally accurate display even before calibration. RGB balance and grayscale improve slightly after our calibration attempts, but the changes are difficult to notice in practice. Color accuracy still decreases with increasing saturation level due to imperfect sRGB coverage.
Display Response Times
| ↔ Response Time Black to White | ||
|---|---|---|
| 39.2 ms ... rise ↗ and fall ↘ combined | ↗ 22.8 ms rise | 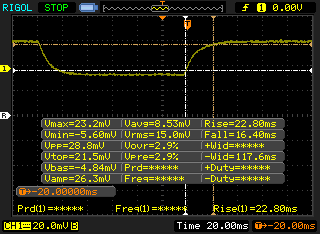 |
| ↘ 16.4 ms fall | ||
| The screen shows slow response rates in our tests and will be unsatisfactory for gamers. In comparison, all tested devices range from 0.1 (minimum) to 240 (maximum) ms. » 97 % of all devices are better. This means that the measured response time is worse than the average of all tested devices (19.9 ms). | ||
| ↔ Response Time 50% Grey to 80% Grey | ||
| 43.6 ms ... rise ↗ and fall ↘ combined | ↗ 24.4 ms rise | 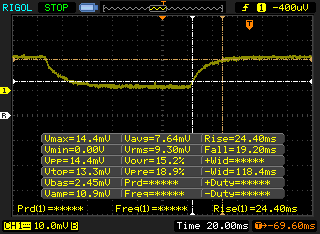 |
| ↘ 19.2 ms fall | ||
| The screen shows slow response rates in our tests and will be unsatisfactory for gamers. In comparison, all tested devices range from 0.165 (minimum) to 636 (maximum) ms. » 73 % of all devices are better. This means that the measured response time is worse than the average of all tested devices (31.1 ms). | ||
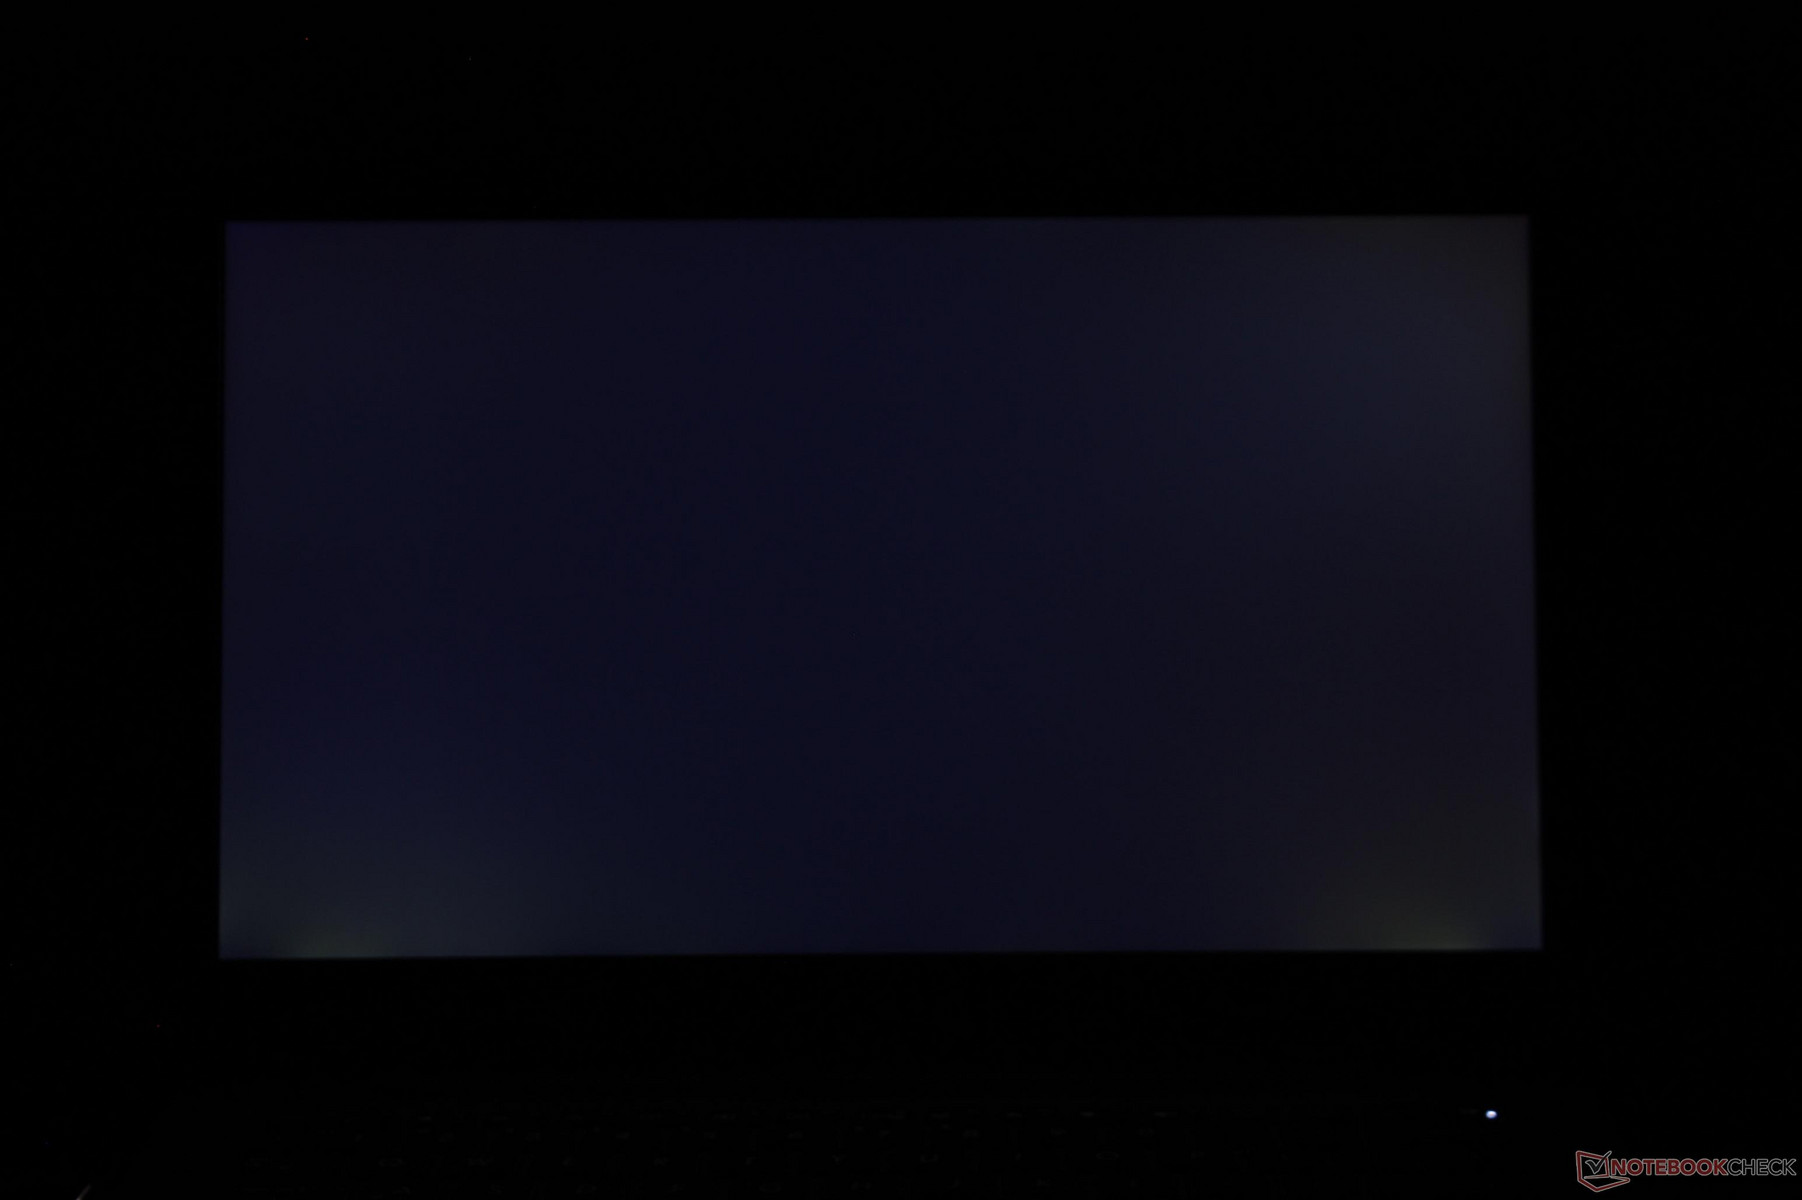
Screen Flickering / PWM (Pulse-Width Modulation)
| Screen flickering / PWM detected | 200 Hz | ≤ 99 % brightness setting | 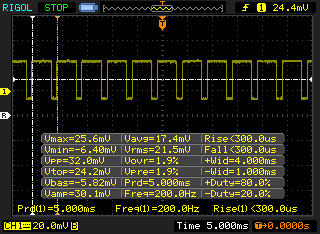 |
The display backlight flickers at 200 Hz (worst case, e.g., utilizing PWM) Flickering detected at a brightness setting of 99 % and below. There should be no flickering or PWM above this brightness setting. The frequency of 200 Hz is relatively low, so sensitive users will likely notice flickering and experience eyestrain at the stated brightness setting and below. In comparison: 52 % of all tested devices do not use PWM to dim the display. If PWM was detected, an average of 7798 (minimum: 5 - maximum: 343500) Hz was measured. | |||
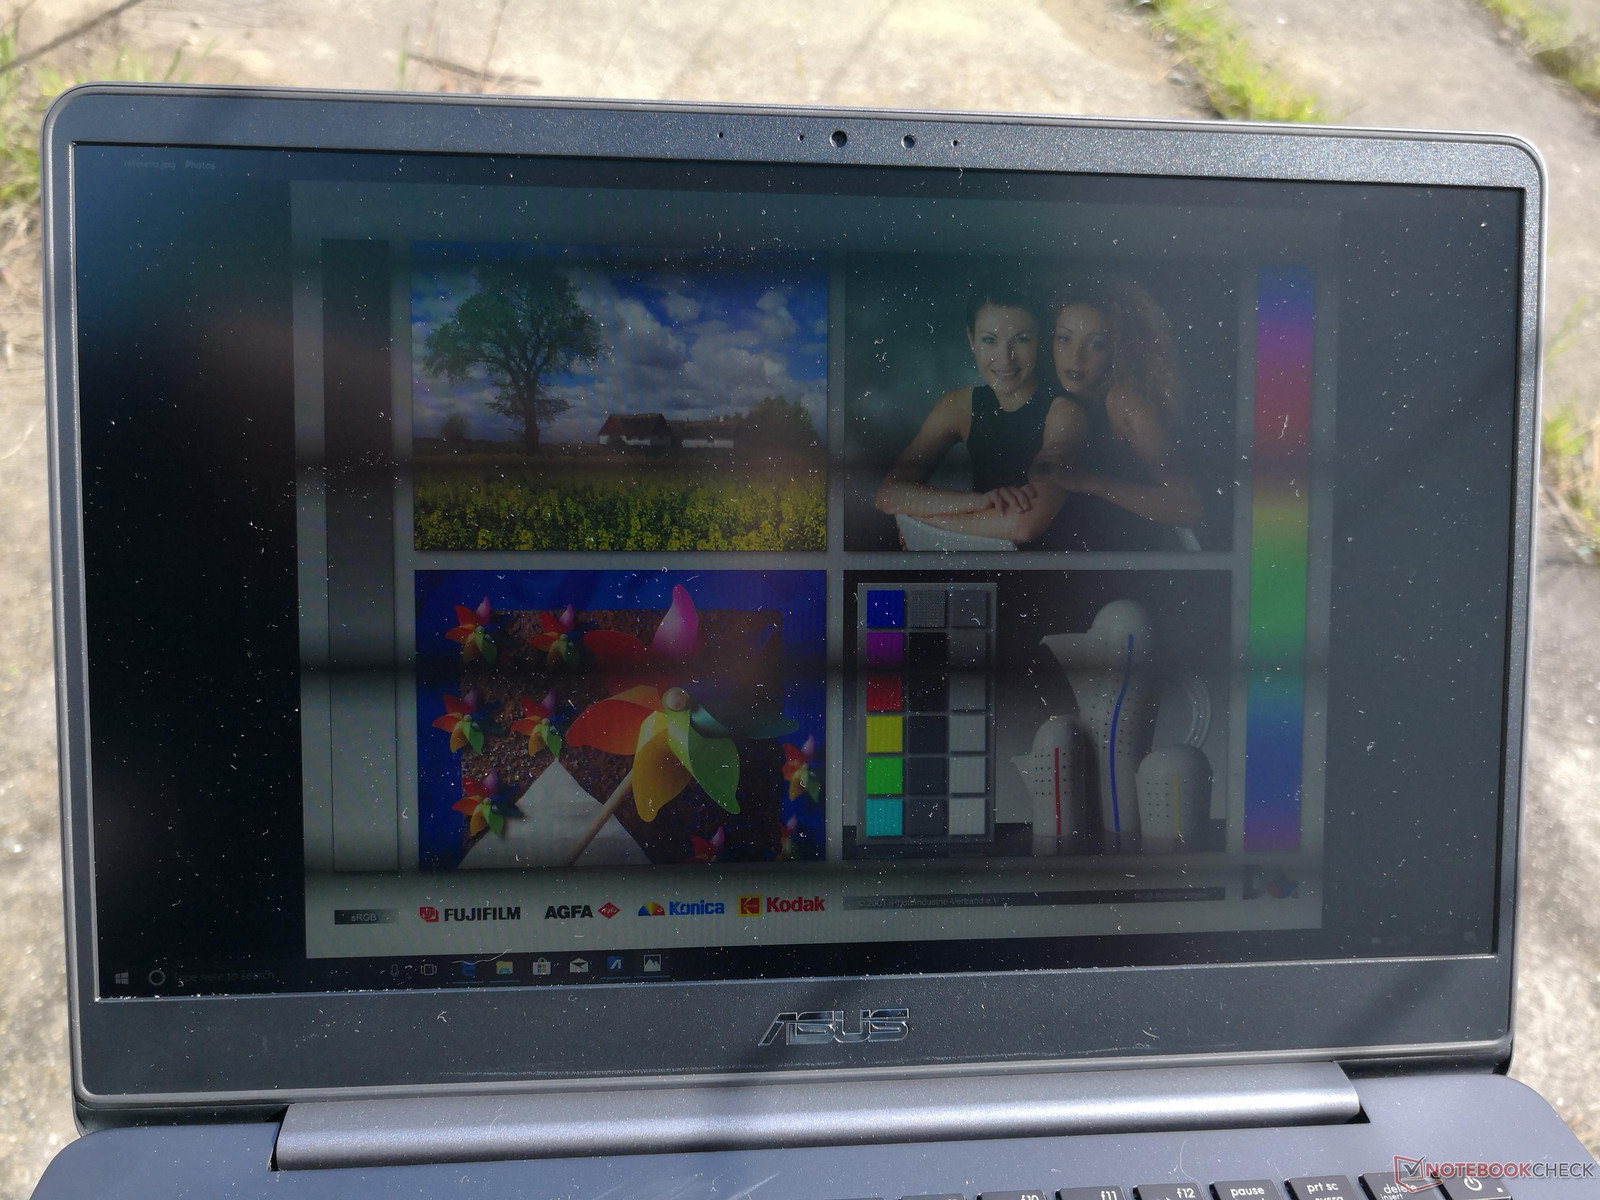
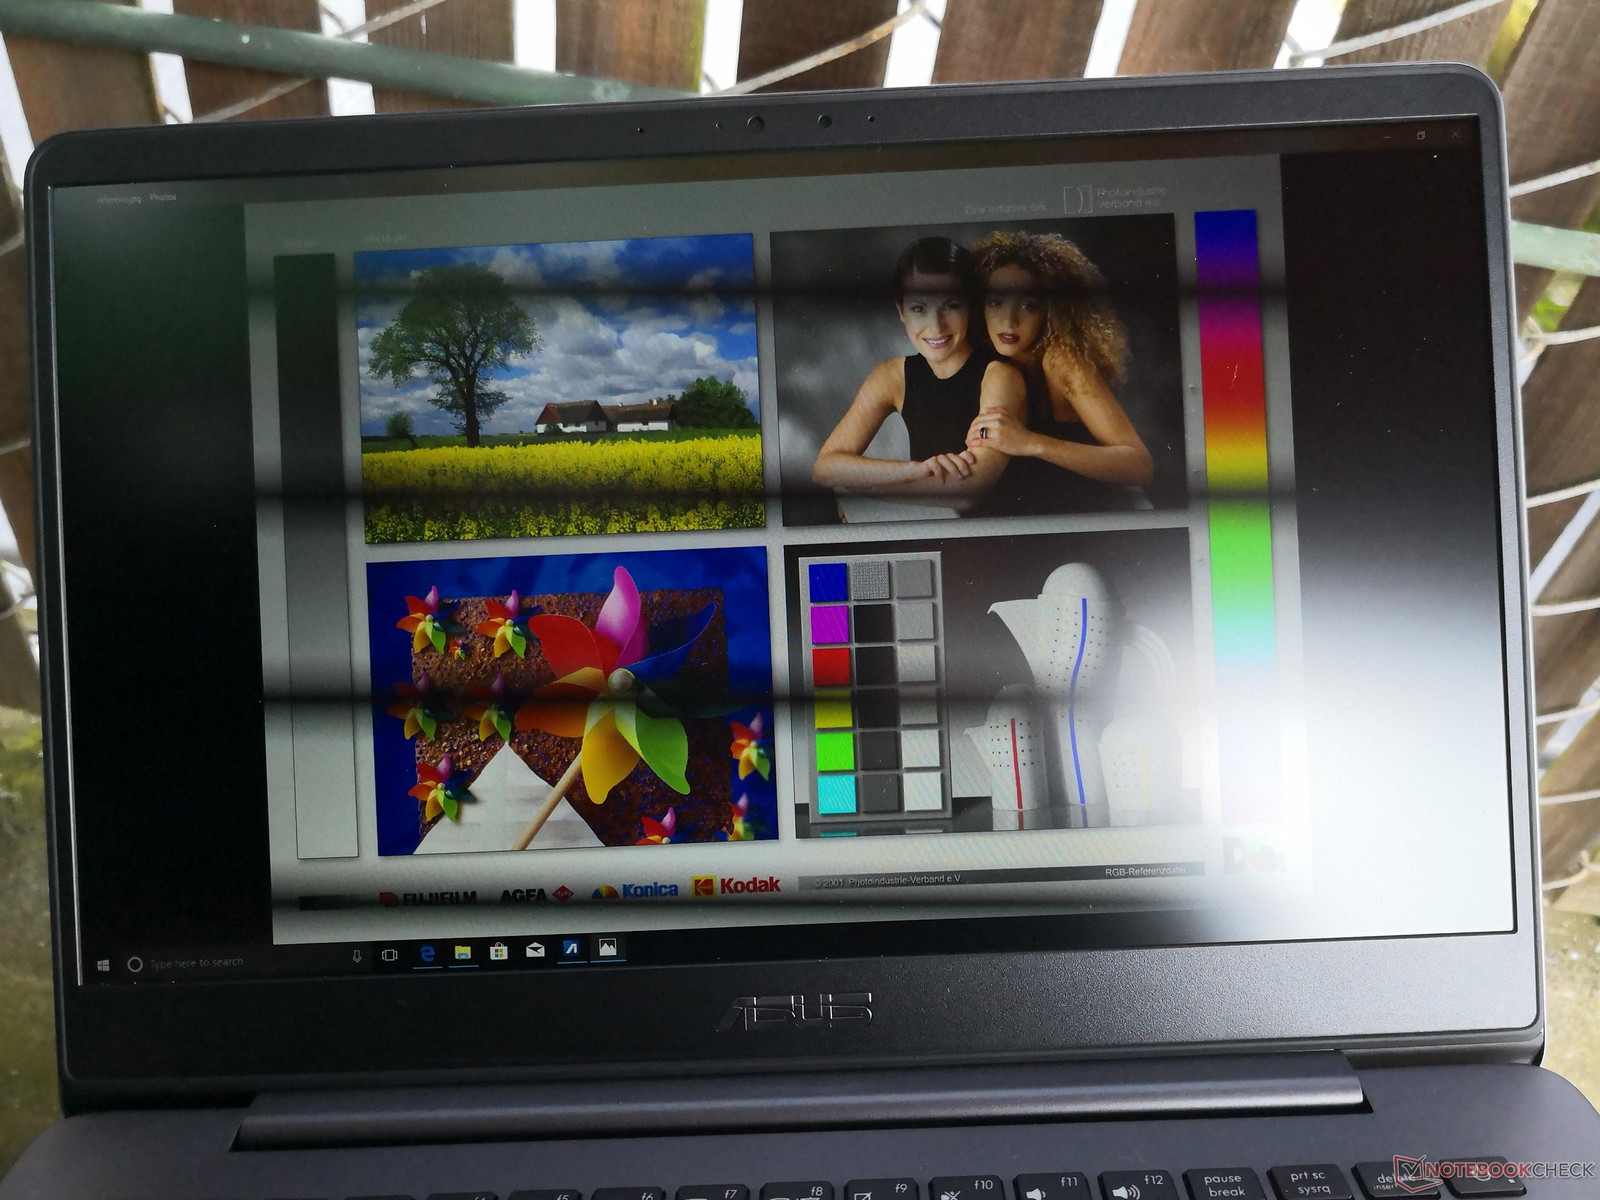
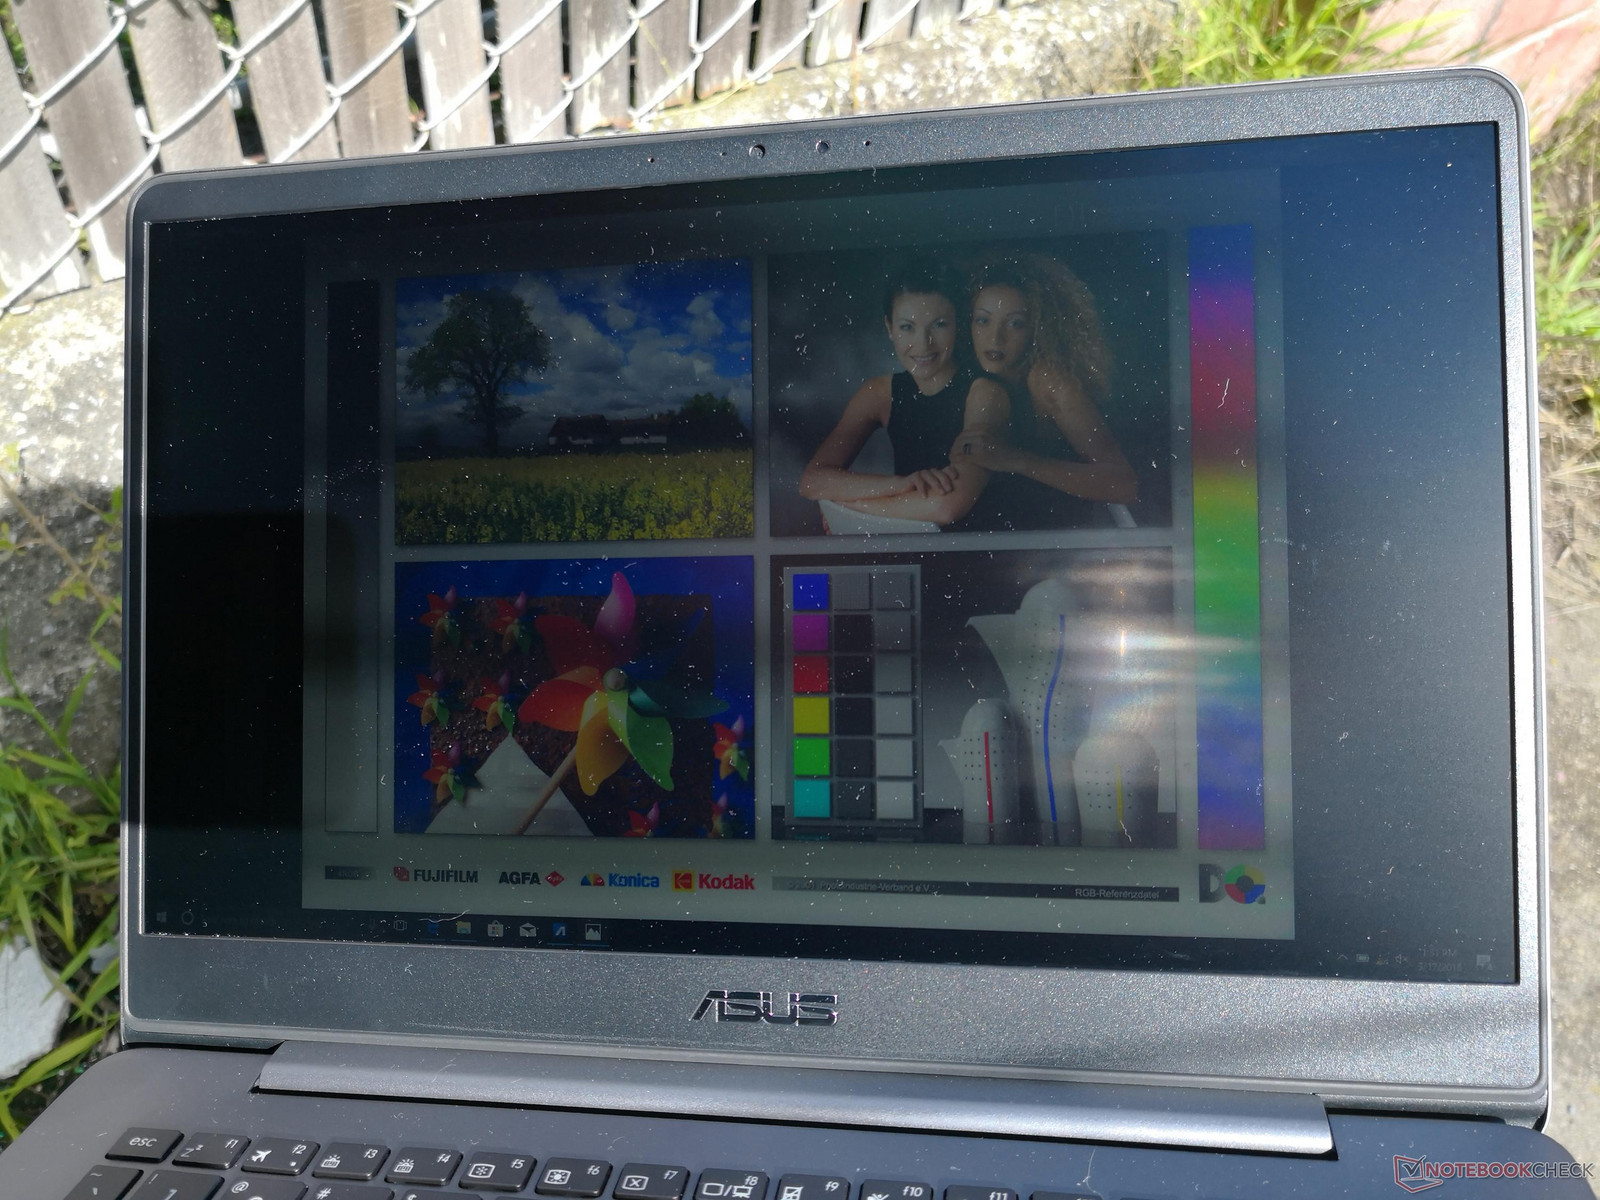
Outdoor visibility is average at best even when under shade. The display backlight is relatively dim compared to 500 nits or brighter on the MacBook Pro 15, XPS 13, or Samsung NP900X5T. To Asus' credit, the matte panel helps in reducing glare compared to the glossy panels on the aforementioned examples, but this advantage is diminished by the dimmer backlight. We recommend avoiding direct sunlight if working outdoors as much as possible. Fortunately, the backlight is more than sufficient for indoor ambient conditions.
Performance
The UX430 series is currently shipping with i3-7100U, i5-7200U, i7-7500U, i5-8250U, and i7-8550U CPU options with either integrated (U)HD Graphics 620 only or discrete GeForce MX150 with Optimus. Our test model is the higher-end option that should cater well to casual gamers because of the Nvidia Pascal GPU. System RAM is fixed and so we recommend avoiding the lower-end configurations that are equipped with just 4 GB of DDR4 2133 MHz RAM.
Processor
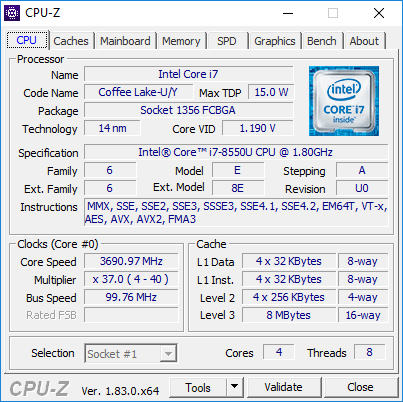
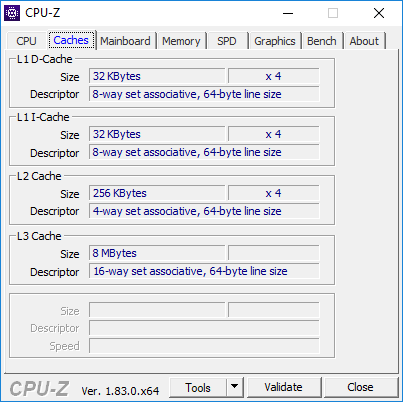
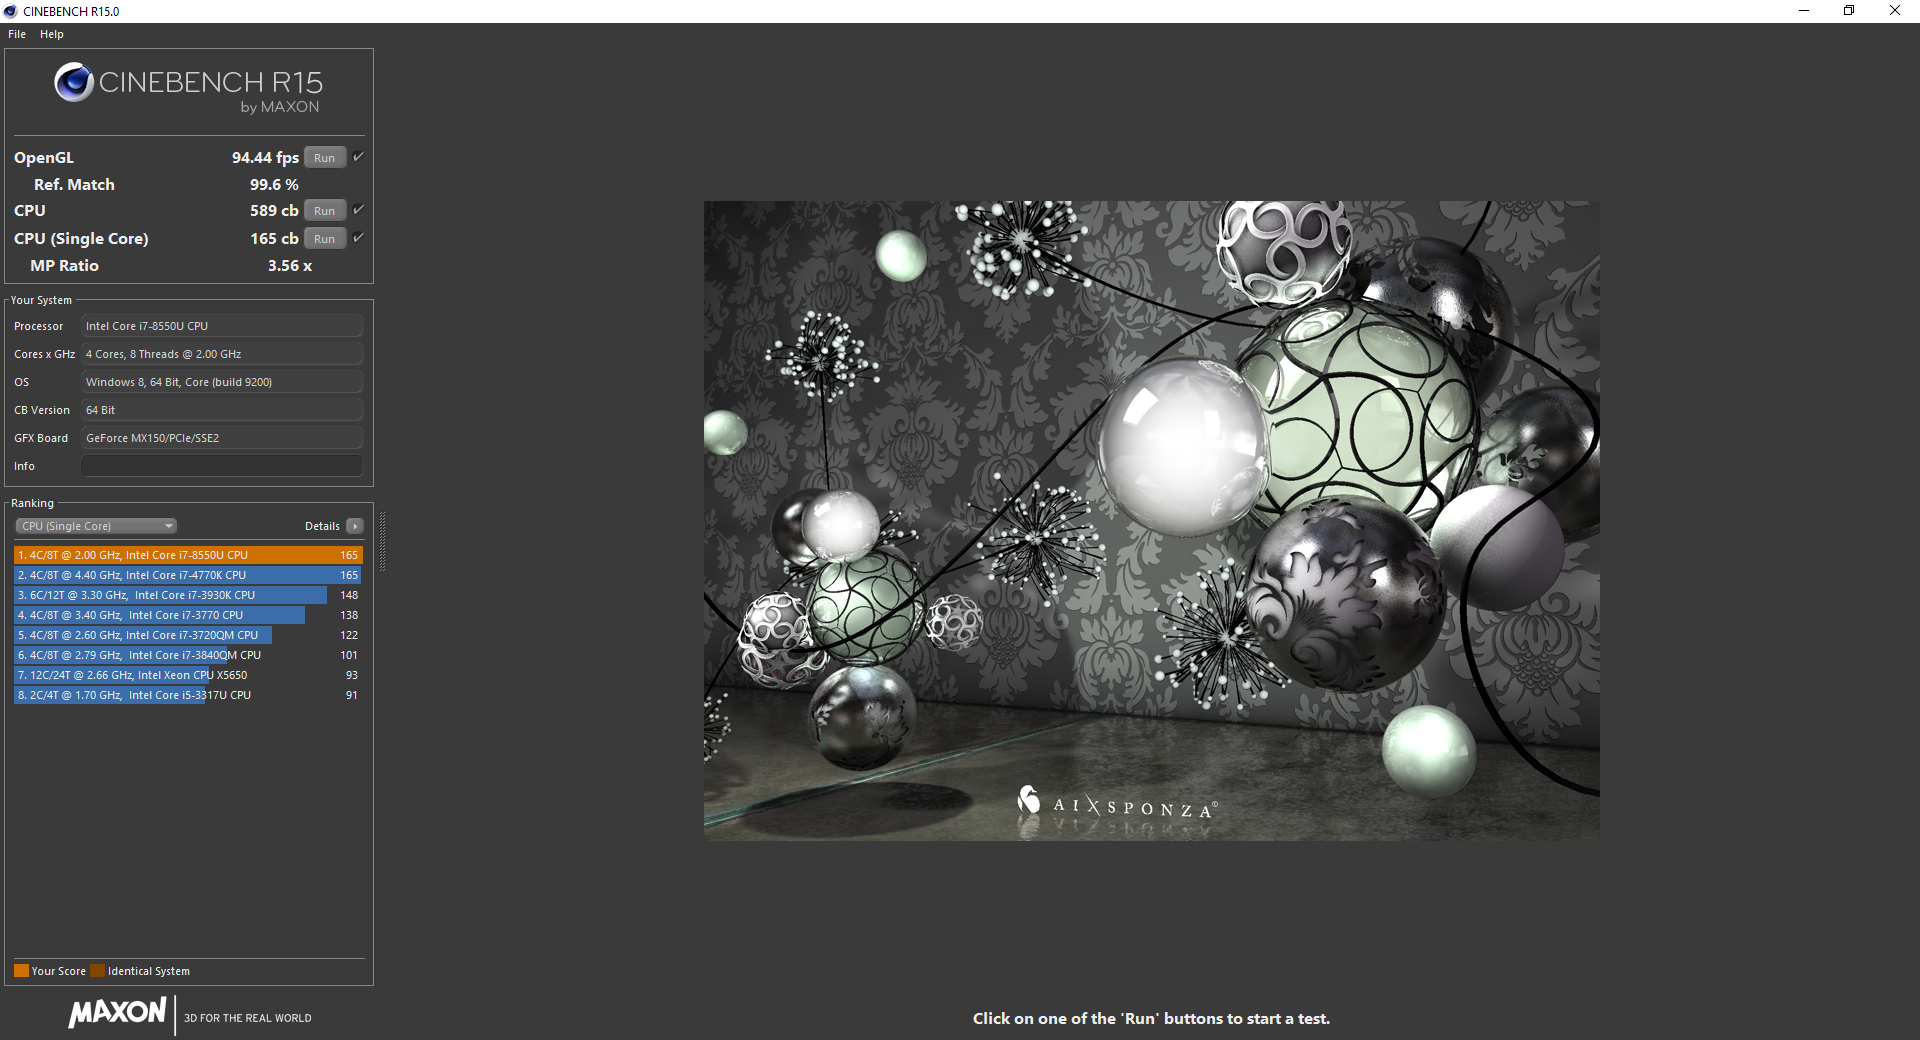
CPU performance is where we expect it to be for an i7-8550U. CineBench scores are about 10 to 20 percent faster than the competing Ryzen 5 2500U depending on the workload and even faster than the more power-demanding i5-7300HQ found on many budget gaming notebooks like the Inspiron 15 7577. Users who may be considering the lower-end SKUs of the UX430 with the 7th gen Kaby Lake i3-7100U or i5-7200U will be losing out on almost half the multi-thread performance and about 15 to 20 percent of single-threaded performance when compared to the i7-8550U.
As with most Ultrabooks, Turbo Boost potential is limited on the Asus. Running CineBench R15 Multi-Thread in a loop results in a very high initial score of 623 points before steadily falling to an average of 550 points as shown by our graph below. The rough 12 percent decrease in performance is about in line with the average CineBench score of dozens of other notebooks sporting the same CPU. Still, it's a bit unfortunate that maximum Turbo Boost is unsustainable.
See our dedicated page on the Core i7-8550U for more technical information and benchmark comparisons.
| wPrime 2.10 - 1024m | |
| Average Intel Core i7-8550U (258 - 435, n=11) | |
| Samsung Notebook 9 NP900X5T-X01US | |
| Asus Zenbook UX430UN | |
| Eurocom Tornado F5 Killer Edition | |
| Asus Strix GL703VM-DB74 | |
* ... smaller is better
System Performance
PCMark benchmarks rank the Asus within single-digit percentage points of many of its closest Ultrabook competitors. Subjectively, we can notice no performance hitches or software problems during our time with the test unit.
| PCMark 10 - Score | |
| Samsung Notebook 9 NP900X5T-X01US | |
| Asus Zenbook UX430UN | |
| Dell XPS 13 9370 i5 UHD | |
| Average Intel Core i7-8550U, NVIDIA GeForce MX150 (3056 - 4106, n=19) | |
| Asus Zenbook 3 Deluxe UX490UA | |
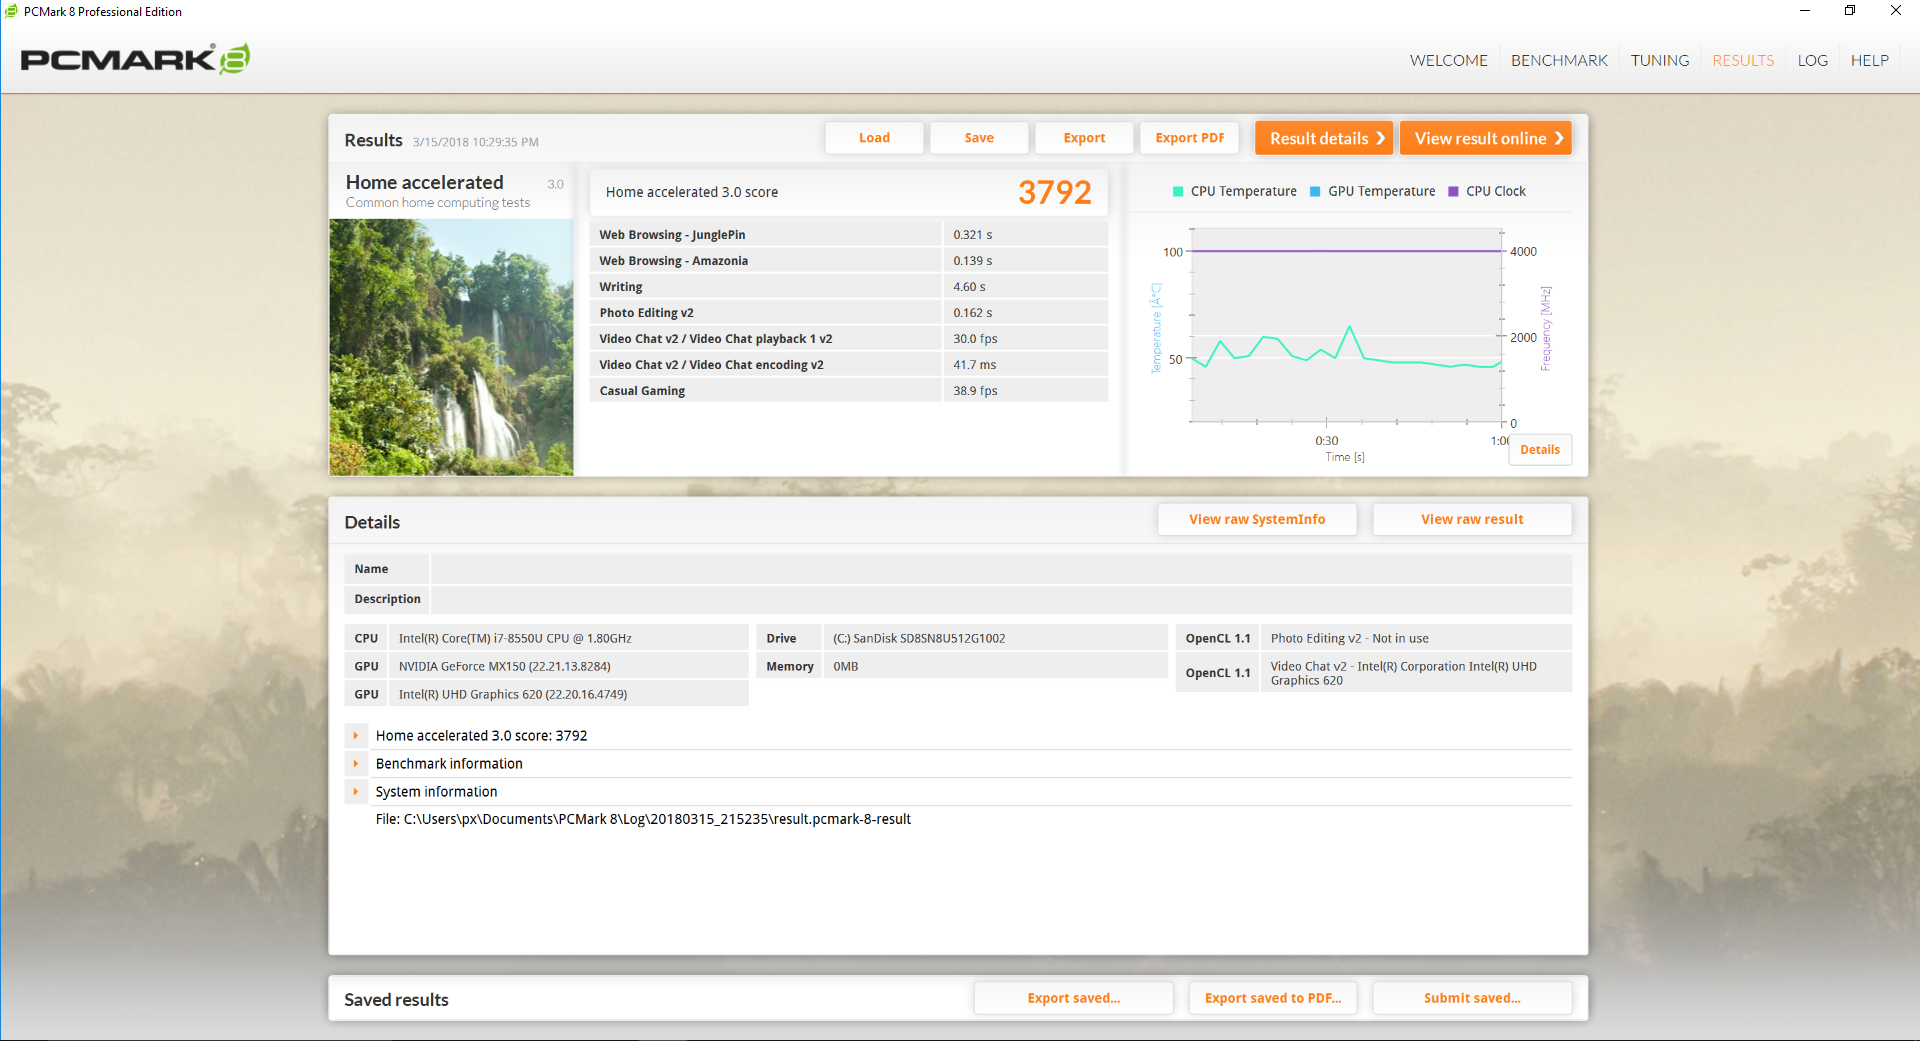
| PCMark 8 Home Score Accelerated v2 | 3792 points | |
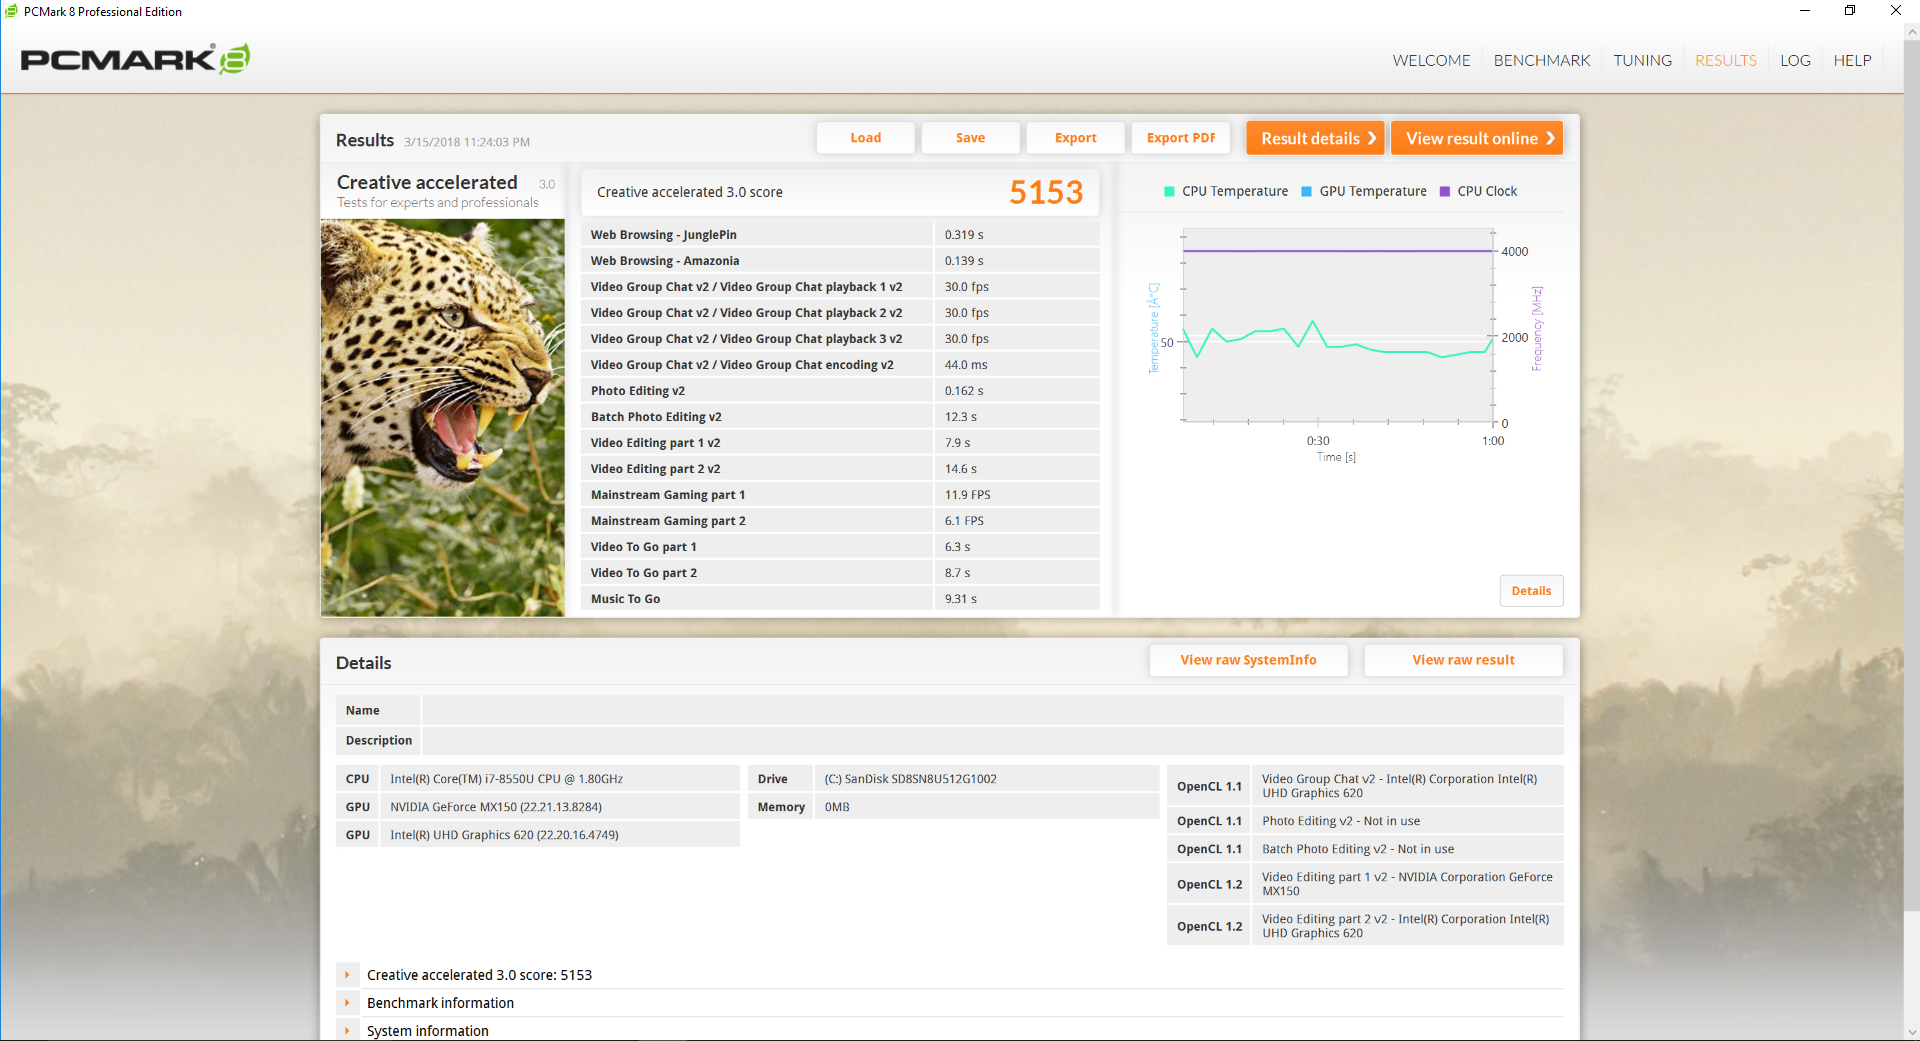
| PCMark 8 Creative Score Accelerated v2 | 5153 points | |
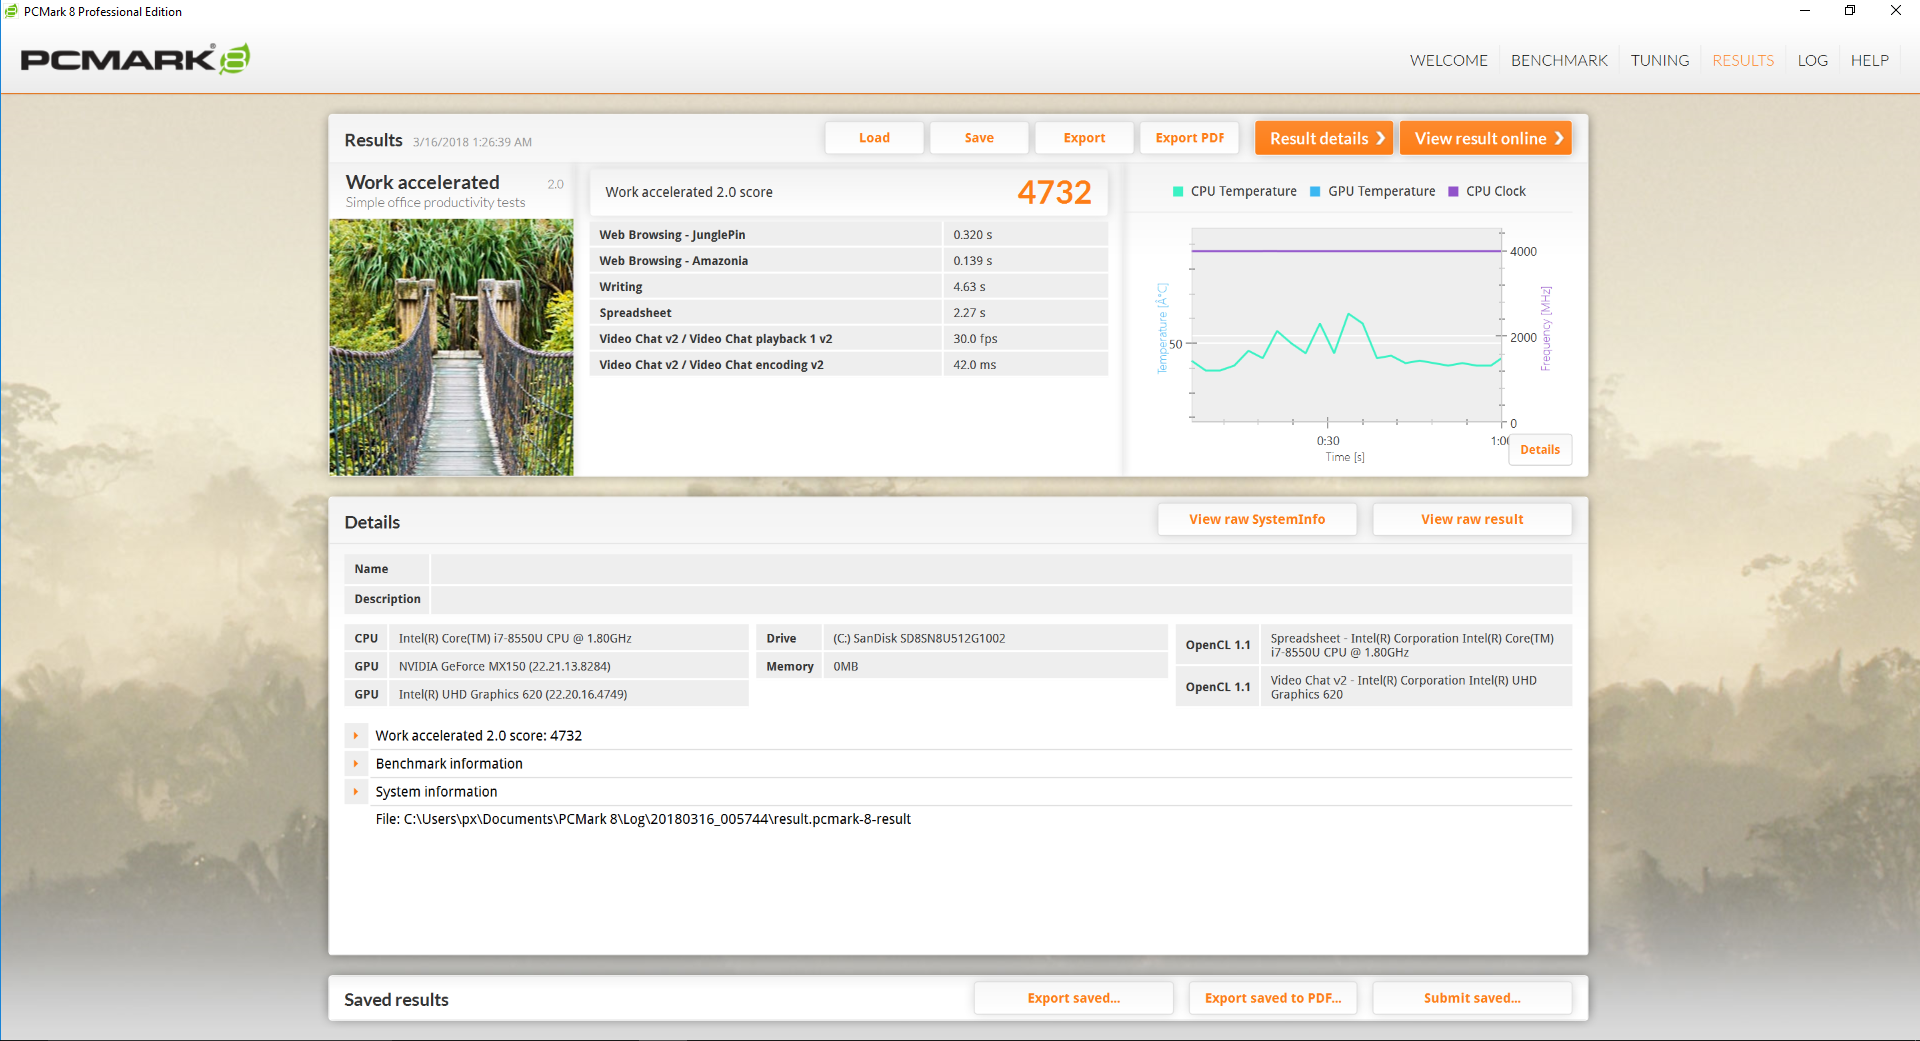
| PCMark 8 Work Score Accelerated v2 | 4732 points | |
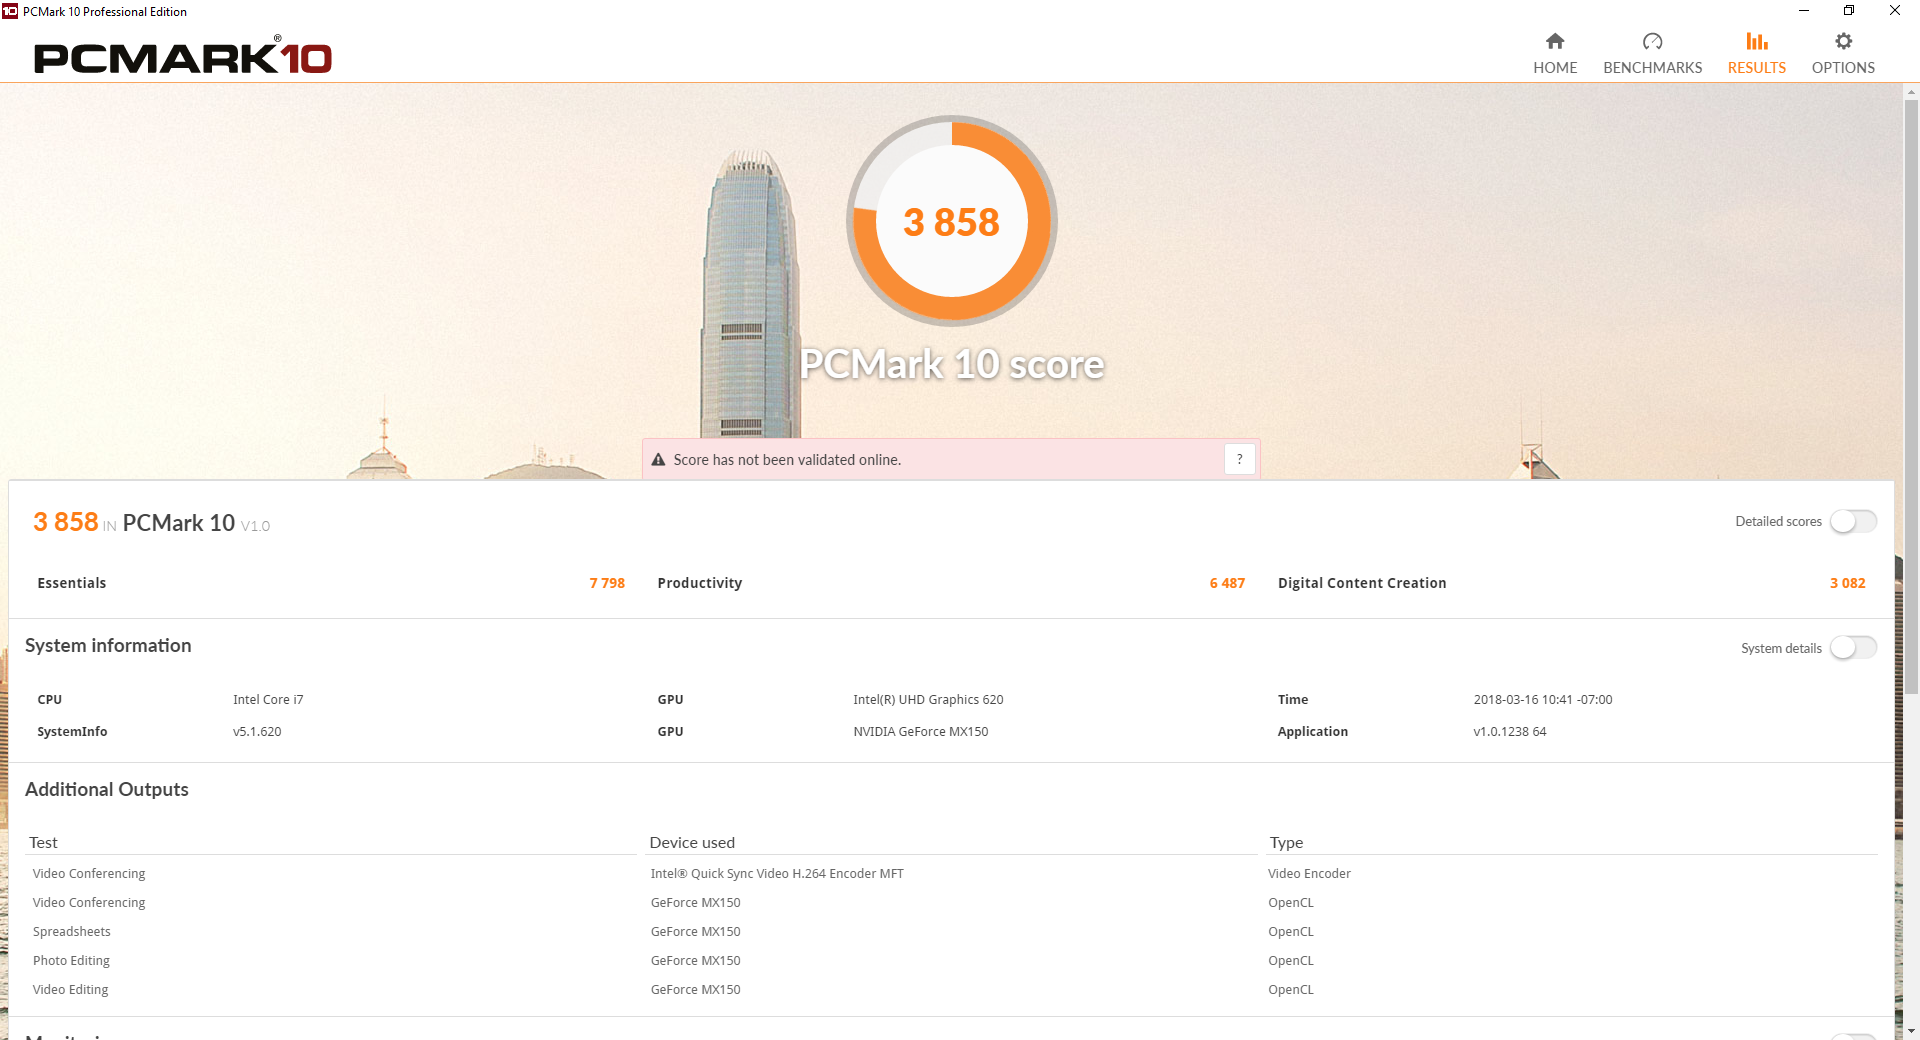
| PCMark 10 Score | 3858 points | |
Help | ||
Storage Devices
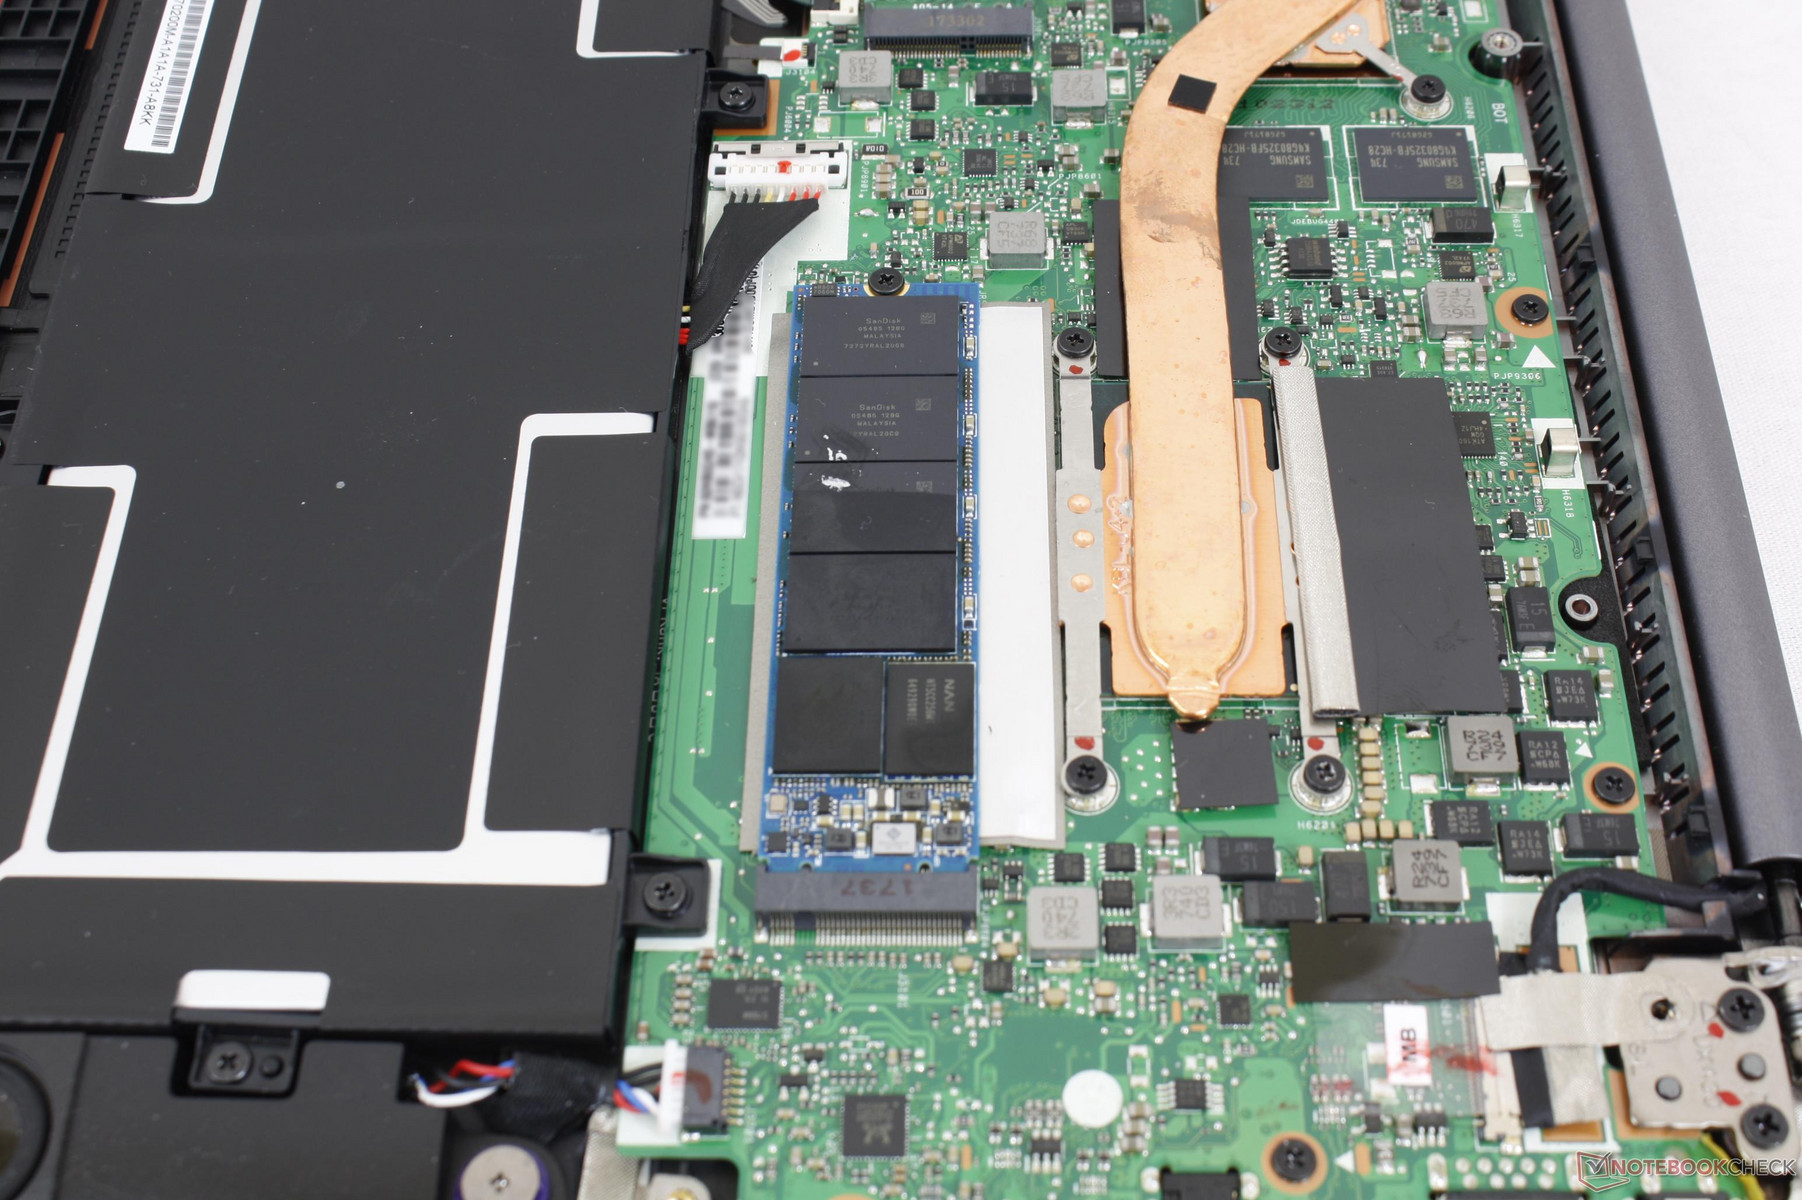
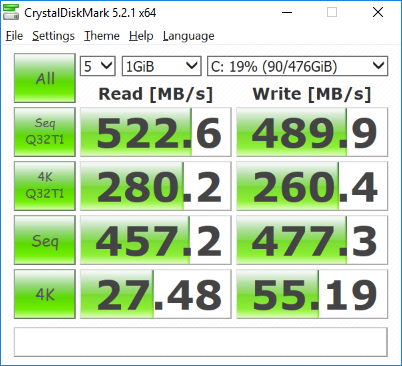
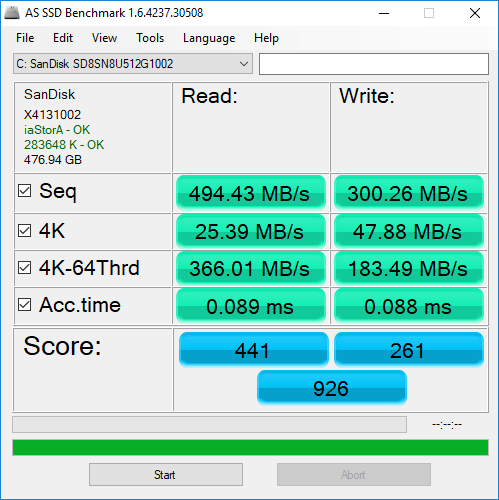
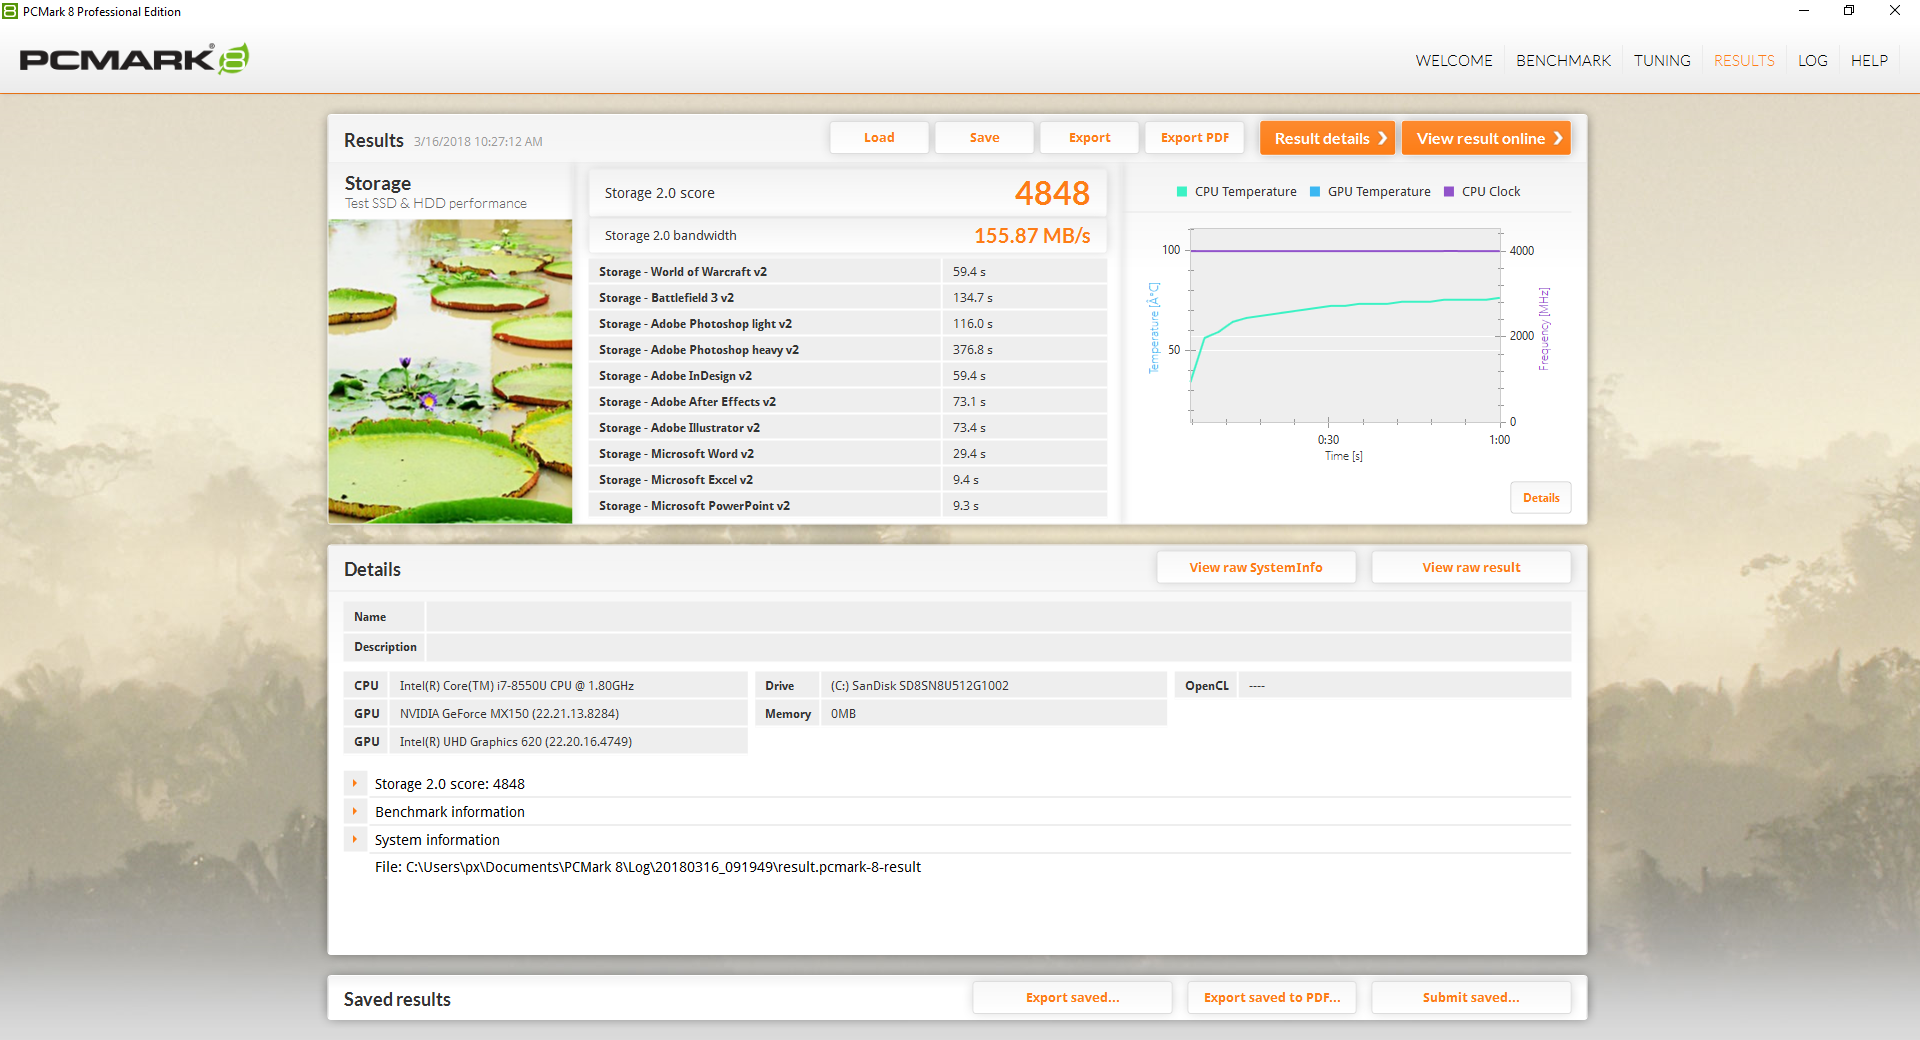
Internal storage is limited to a single M.2 2280 slot with no secondary options. Asus is shipping SKUs with storage capacities in the 128 GB to 512 GB range sans NVMe options. Thus, sequential transfer rates will be limited to SATA III speeds at about 500 MB/s read and write. Competing Ultrabooks in this price range tend to offer NVMe as standard for almost 4x the transfer rates.
See our table of HDDs and SSDs for more benchmark comparisons.
| Asus Zenbook UX430UN SanDisk SD8SN8U512G1002 | Dell XPS 13 9370 i5 UHD Toshiba XG5 KXG50ZNV256G | Samsung Notebook 9 NP900X5T-X01US Samsung PM961 MZVLW256HEHP | Asus Zenbook 3 Deluxe UX490UA Micron 1100 MTFDDAV256TBN | Asus ZenBook 13 UX331UN SK Hynix HFS256G39TND-N210A | Microsoft Surface Laptop i5 Toshiba THNSN0128GTYA | |
|---|---|---|---|---|---|---|
| AS SSD | 131% | 184% | 15% | -16% | -74% | |
| Copy Game MB/s (MB/s) | 225.1 | 291.4 29% | 1058 370% | 154.1 -32% | 80.5 -64% | |
| Copy Program MB/s (MB/s) | 270.5 | 207 -23% | 479.5 77% | 129.7 -52% | 62.7 -77% | |
| Copy ISO MB/s (MB/s) | 467.6 | 357.4 -24% | 1751 274% | 192.4 -59% | 87.1 -81% | |
| Score Total (Points) | 926 | 2437 163% | 2646 186% | 855 -8% | 991 7% | 309 -67% |
| Score Write (Points) | 261 | 1135 335% | 628 141% | 382 46% | 323 24% | 86 -67% |
| Score Read (Points) | 441 | 894 103% | 1367 210% | 308 -30% | 445 1% | 157 -64% |
| Access Time Write * (ms) | 0.088 | 0.038 57% | 0.032 64% | 0.056 36% | 0.23 -161% | 0.369 -319% |
| Access Time Read * (ms) | 0.089 | 0.063 29% | 0.054 39% | 0.09 -1% | 0.09 -1% | 0.128 -44% |
| 4K-64 Write (MB/s) | 183.5 | 937 411% | 392.6 114% | 257.5 40% | 233.1 27% | 35.48 -81% |
| 4K-64 Read (MB/s) | 366 | 657 80% | 1085 196% | 234.5 -36% | 368.4 1% | 80.4 -78% |
| 4K Write (MB/s) | 47.88 | 107.2 124% | 115 140% | 77.2 61% | 68.9 44% | 39.07 -18% |
| 4K Read (MB/s) | 25.39 | 33.81 33% | 48.71 92% | 24.89 -2% | 27.98 10% | 20.15 -21% |
| Seq Write (MB/s) | 300.3 | 907 202% | 1206 302% | 470 57% | 213.7 -29% | 117.2 -61% |
| Seq Read (MB/s) | 494.4 | 2037 312% | 2337 373% | 487.2 -1% | 483.7 -2% | 561 13% |
* ... smaller is better

GPU Performance
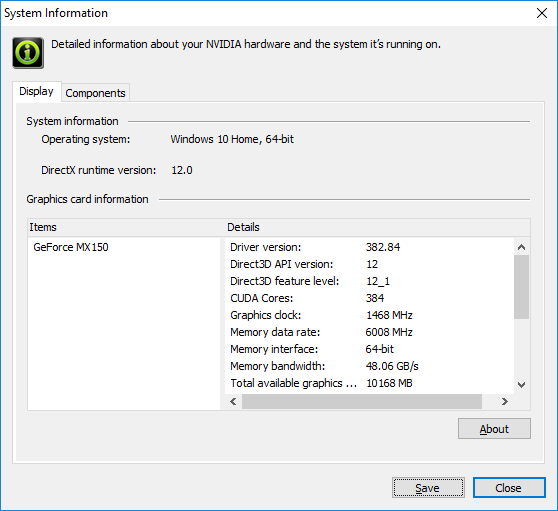
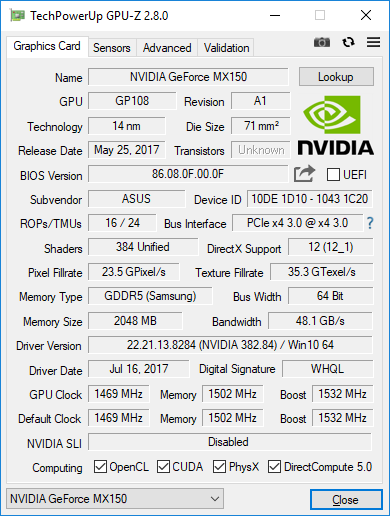
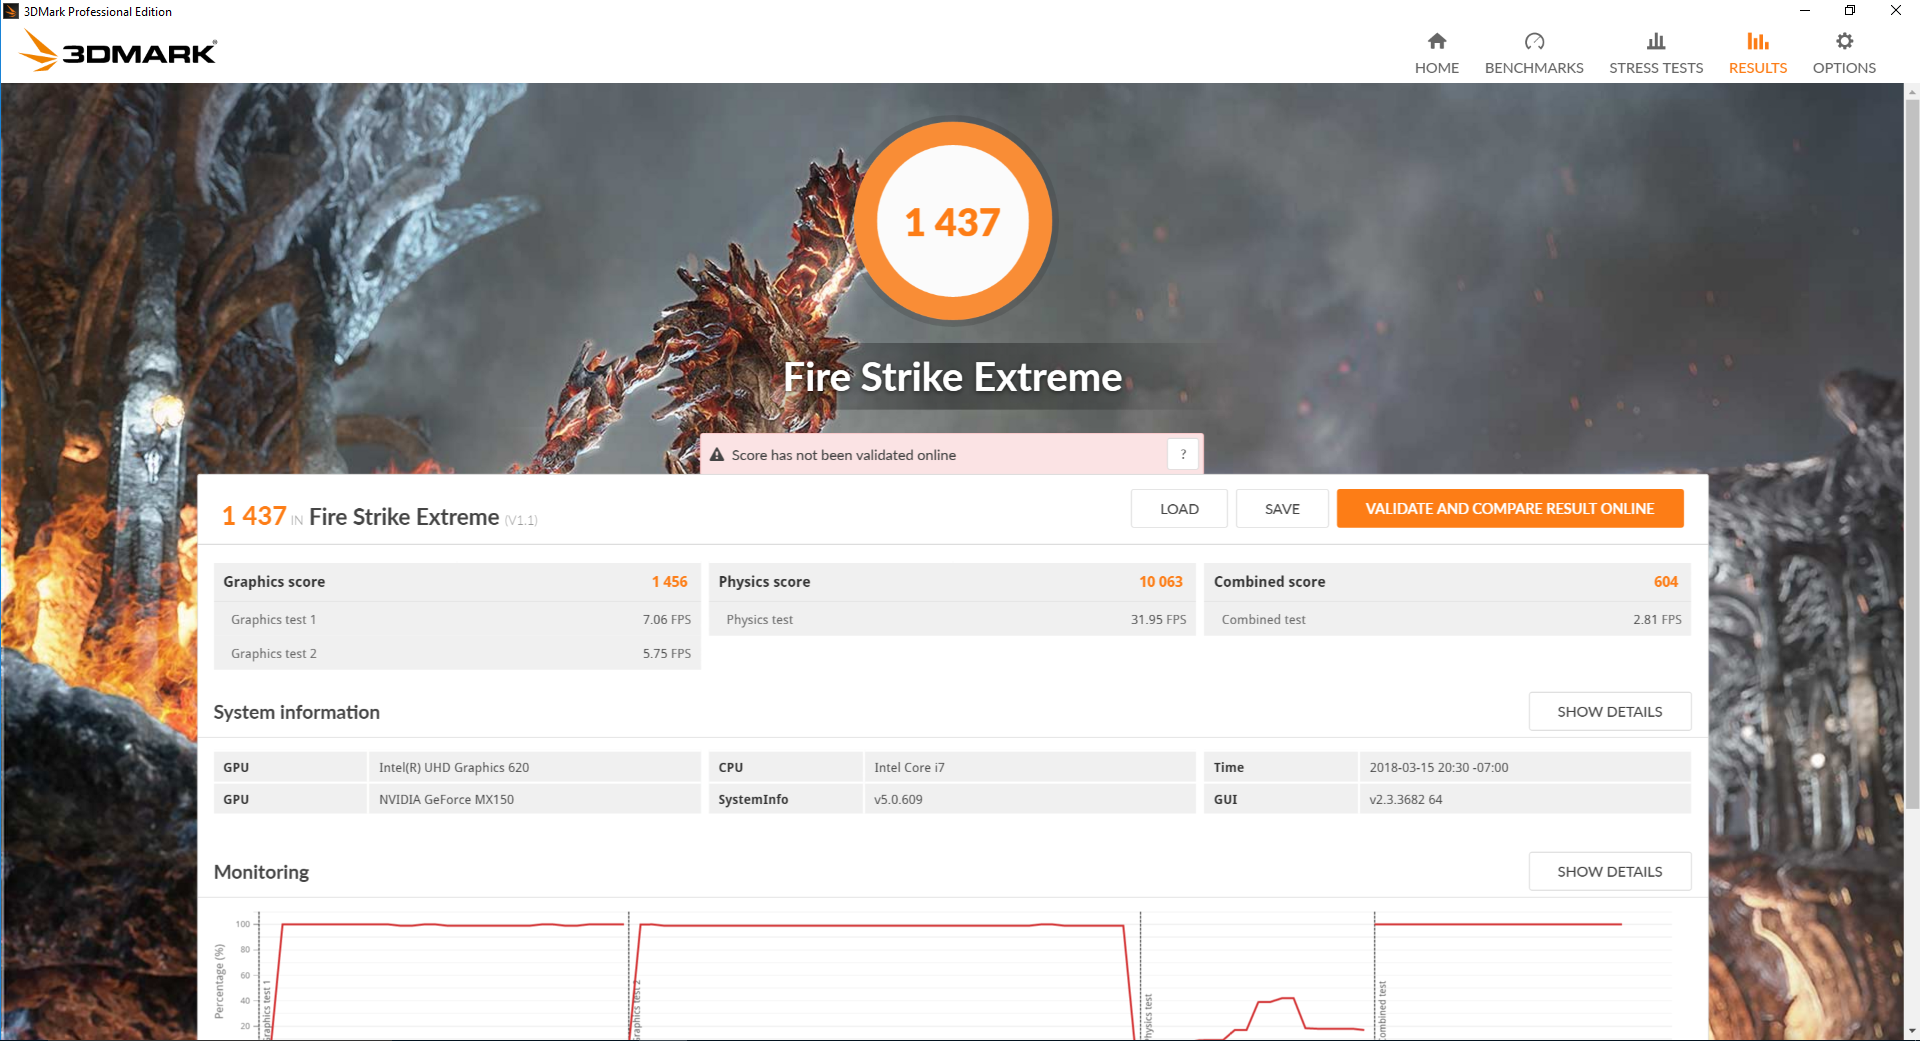
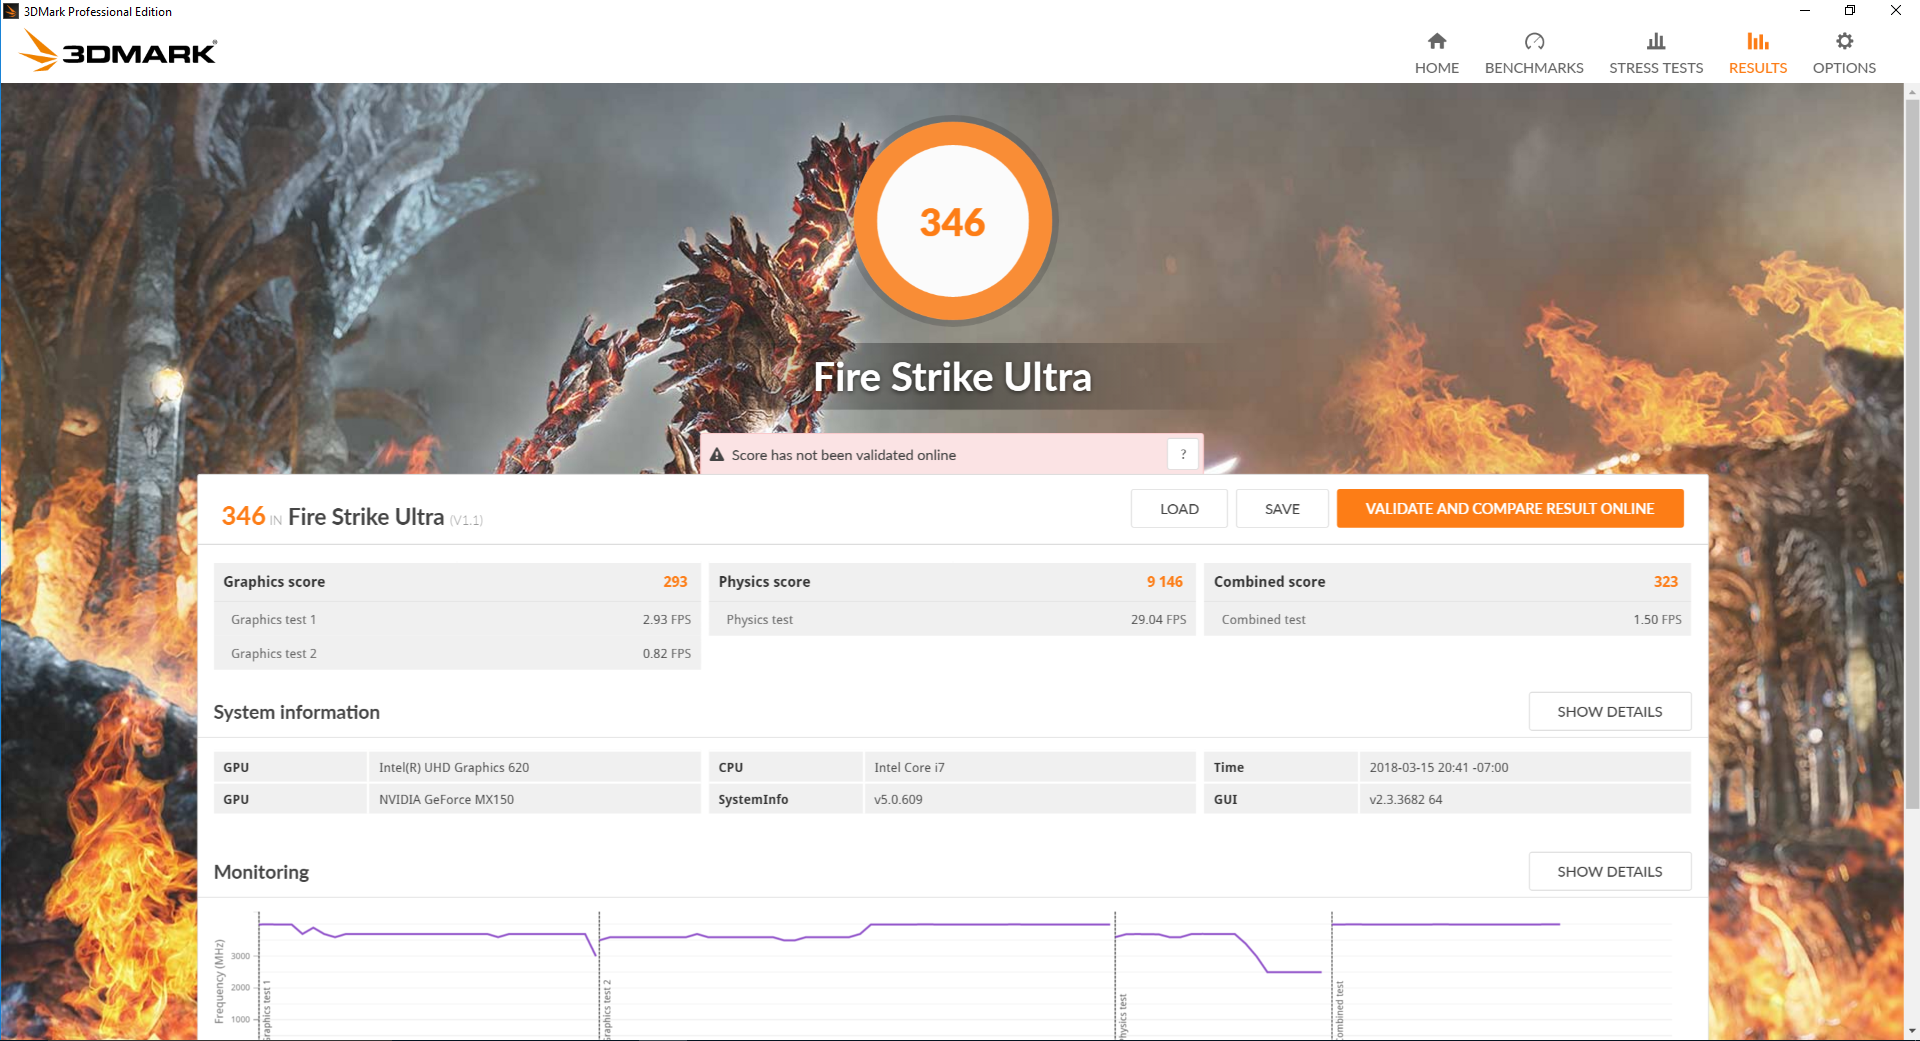
The Asus integrates a GeForce MX150 of the '1D10' variant with base and memory clock rates of 1469 MHz and 1502 MHz, respectively. 3DMark scores, however, are slightly below the average MX150 since core clock rates are throttled over time to as slow as 1126 MHz. The MSI PL62 with the same GPU, for example, consistently outscores our Asus in both synthetic benchmarks and games due in part to its ability to maintain higher GPU clock rates. Nonetheless, the raw performance boost over the GeForce 940MX and especially the (U)HD Graphics 620 is still massive despite the pitfalls in clock rate. Most demanding titles are playable at native 1080p so long as owners are satisfied with 30 FPS and Low graphical settings.
See our dedicated page on the GeForce MX150 for more information.
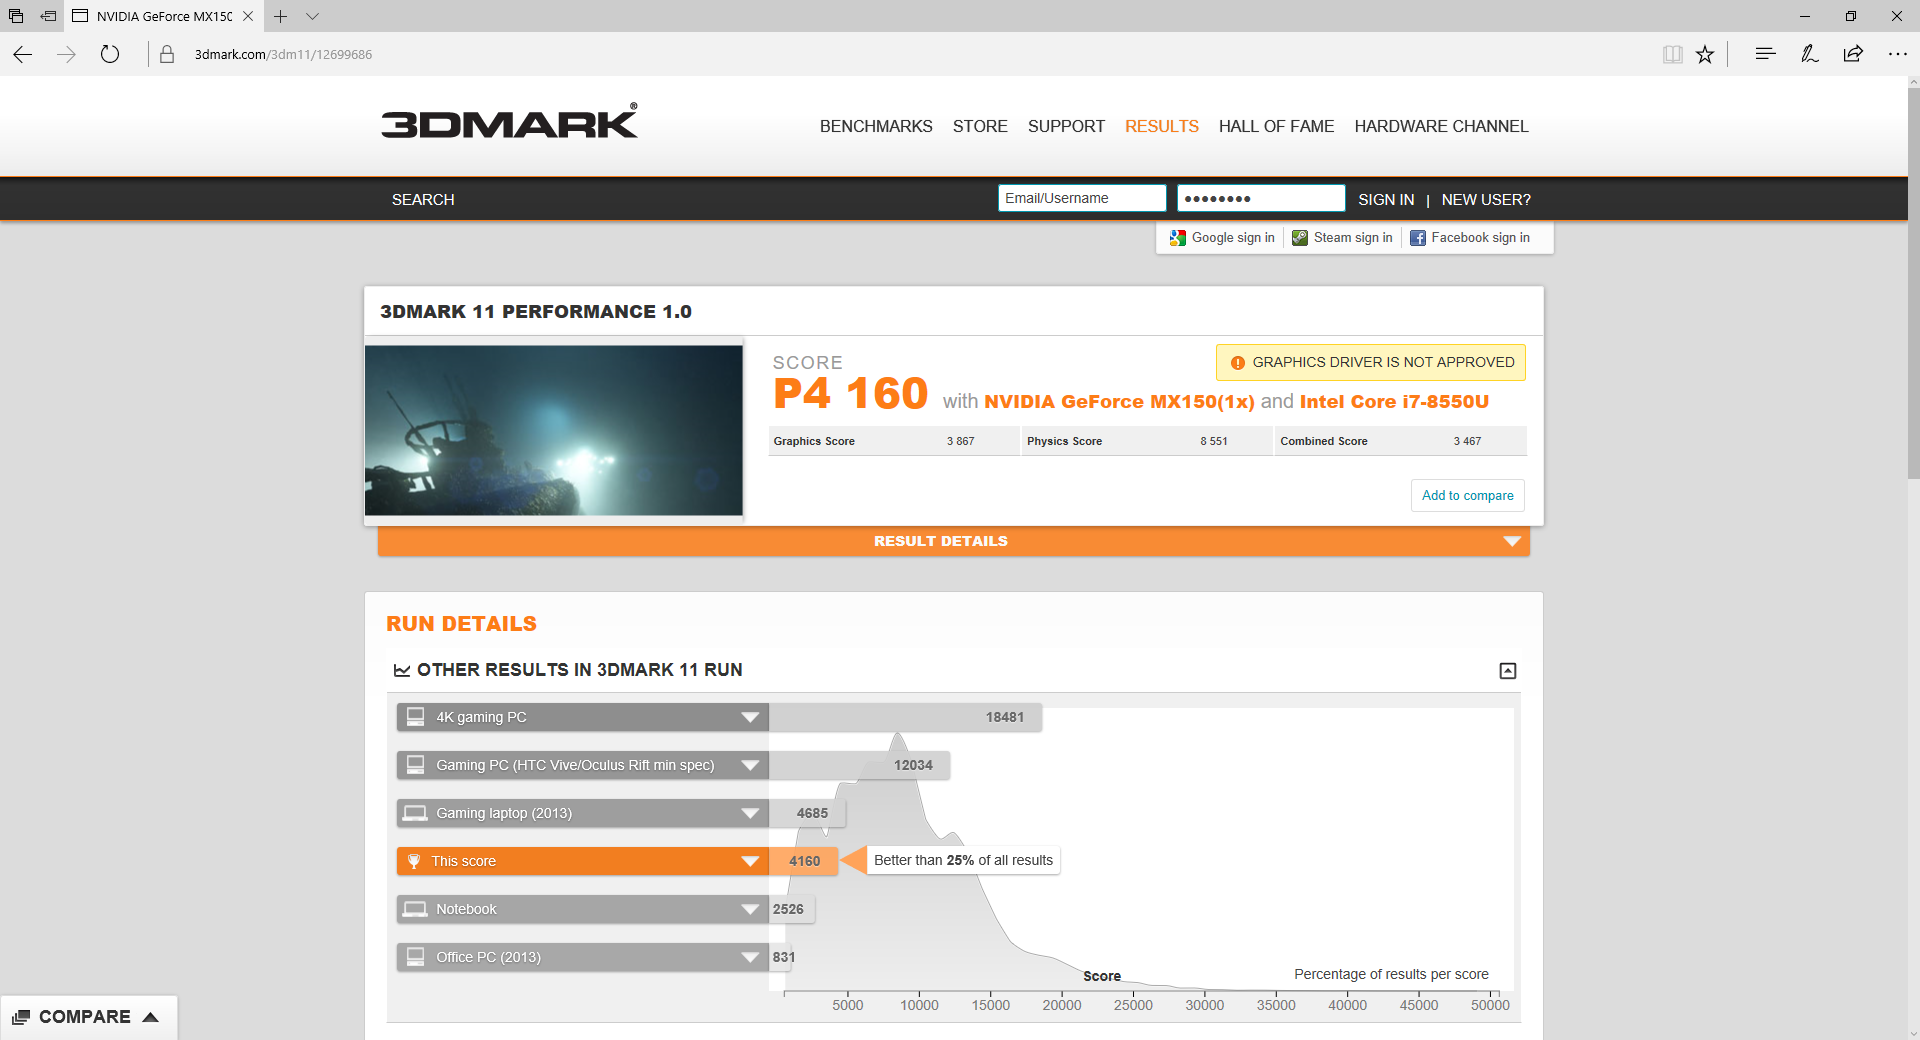
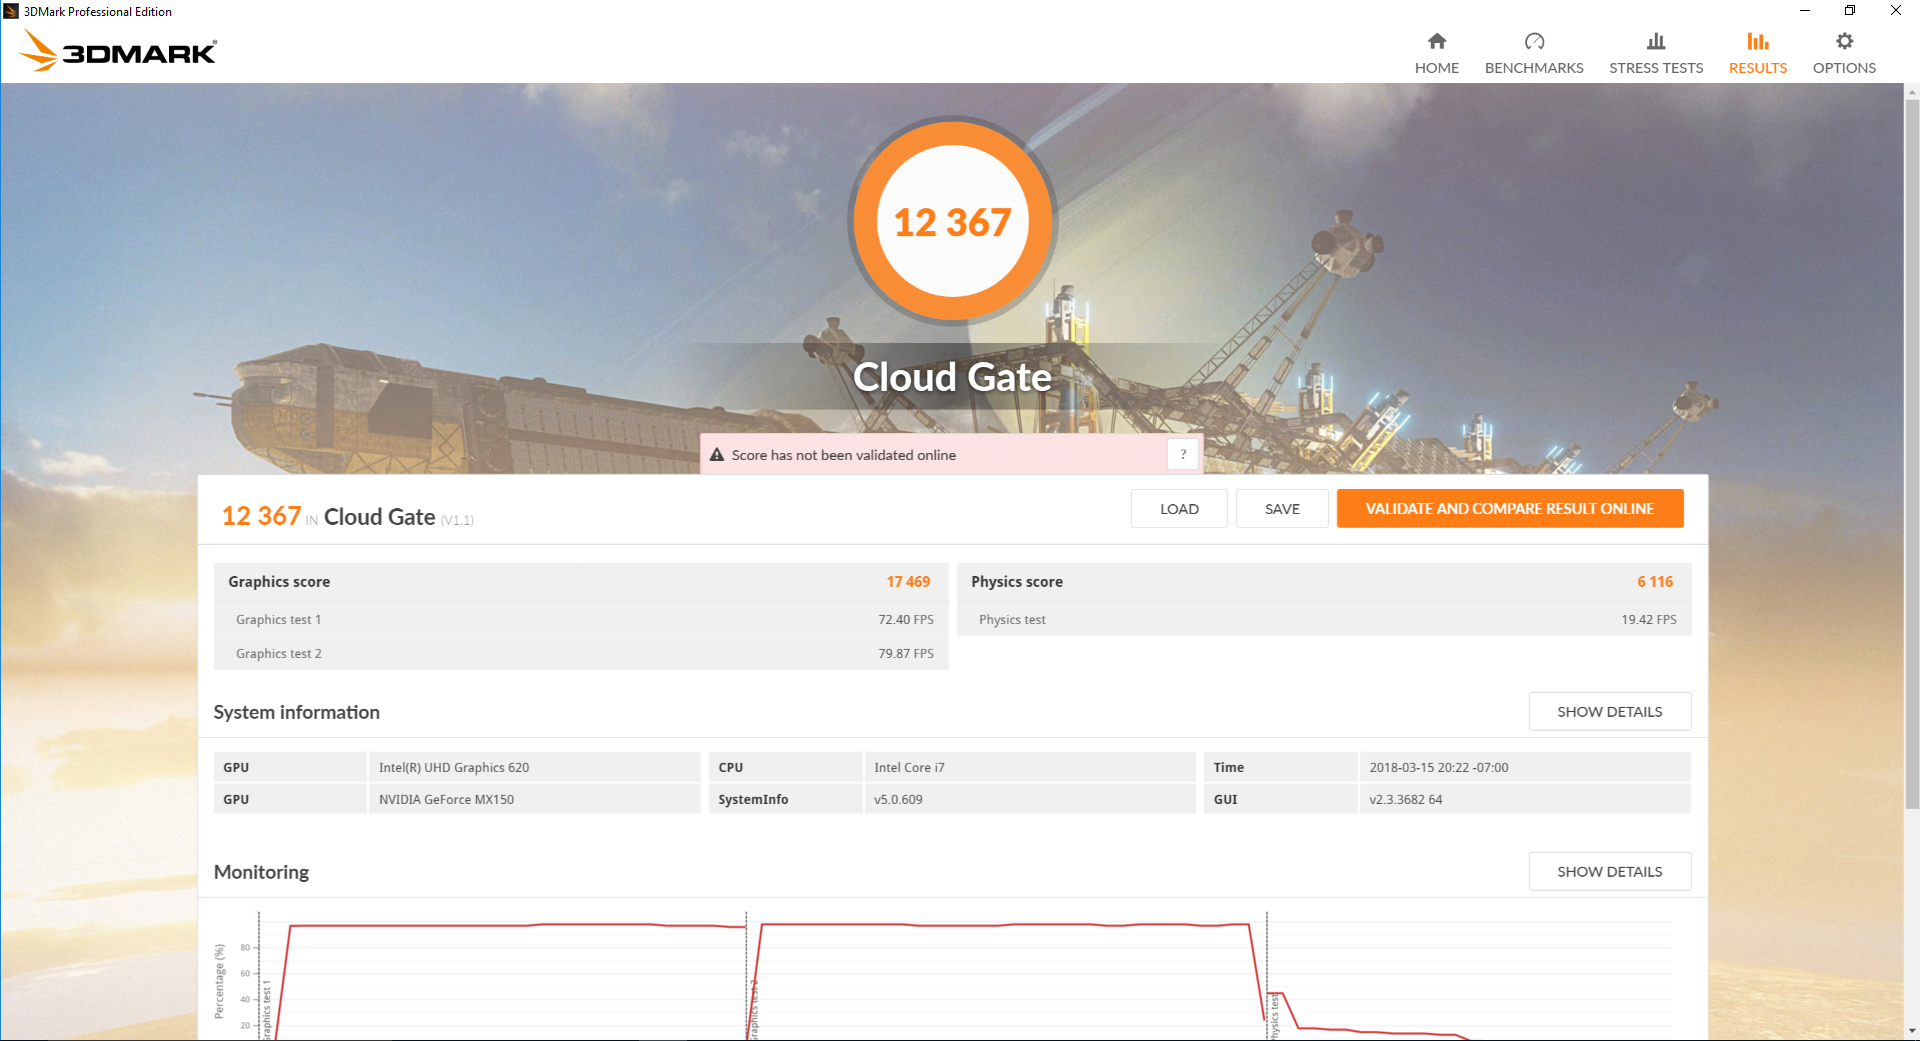
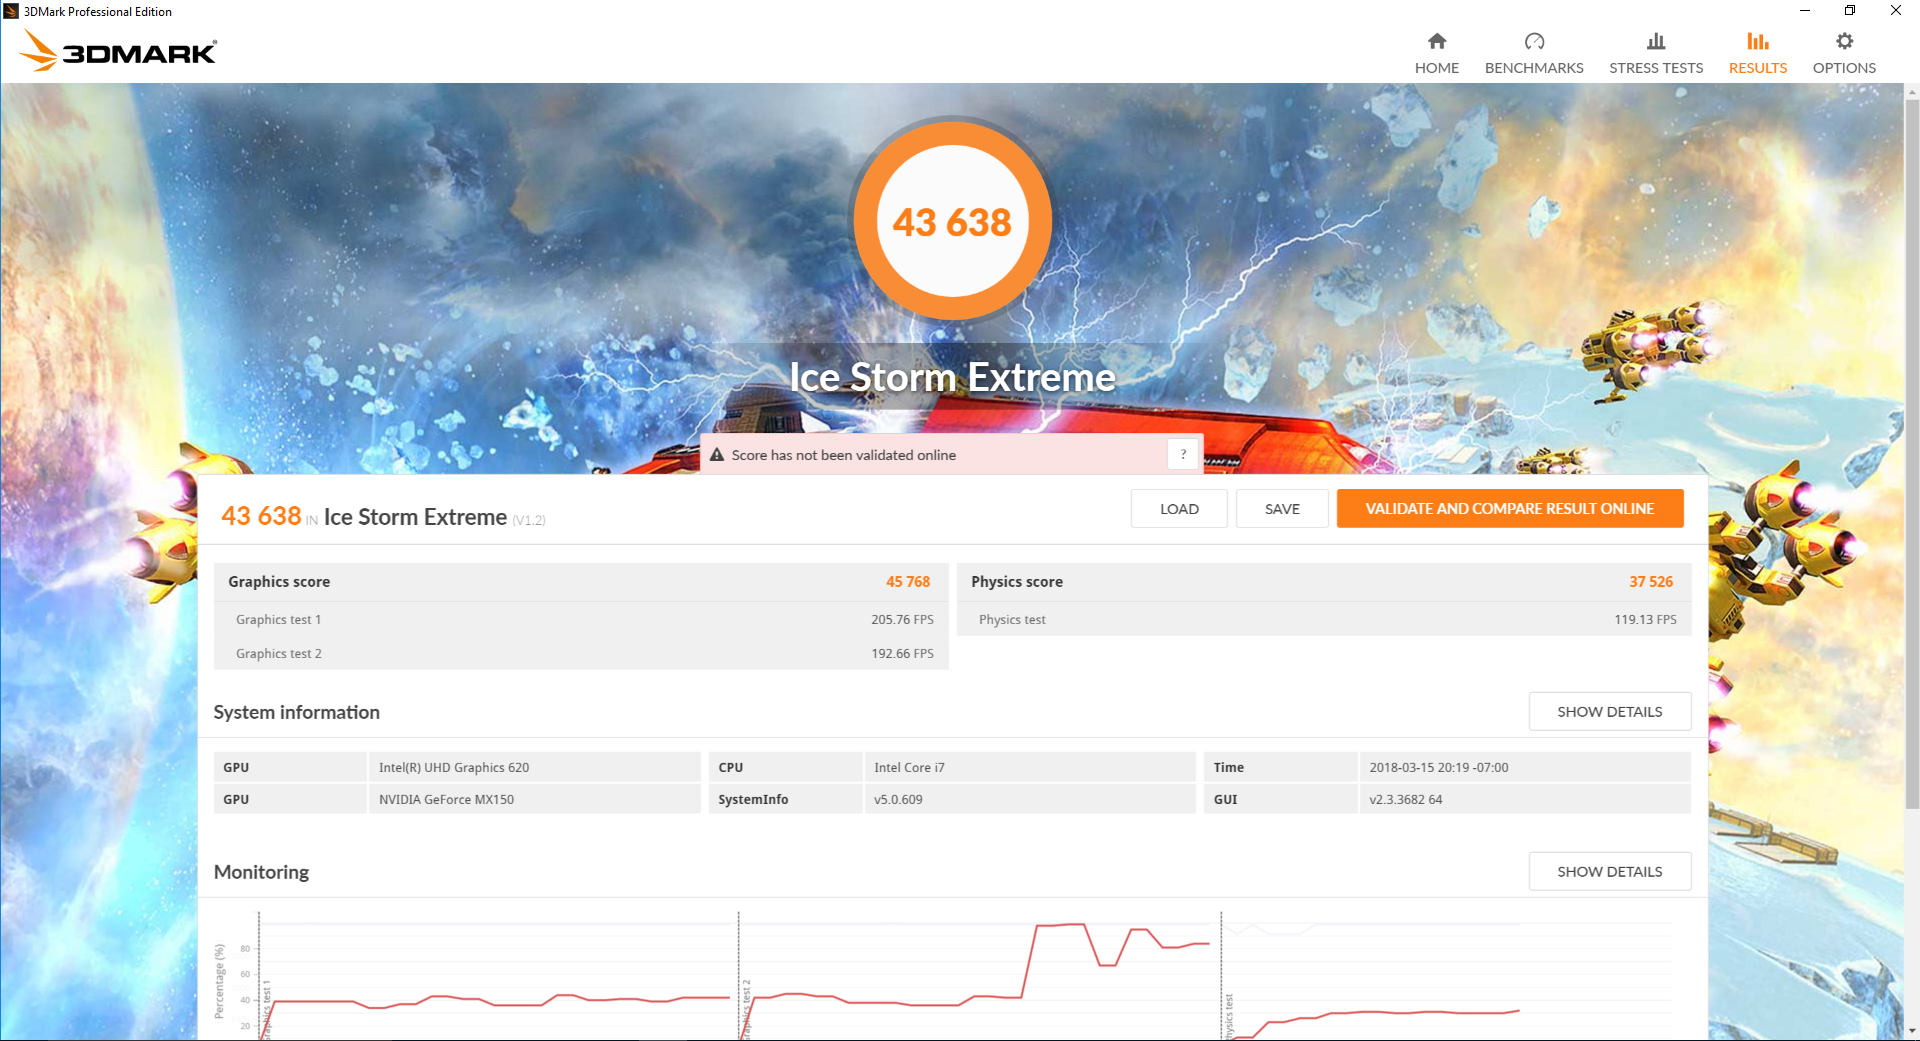
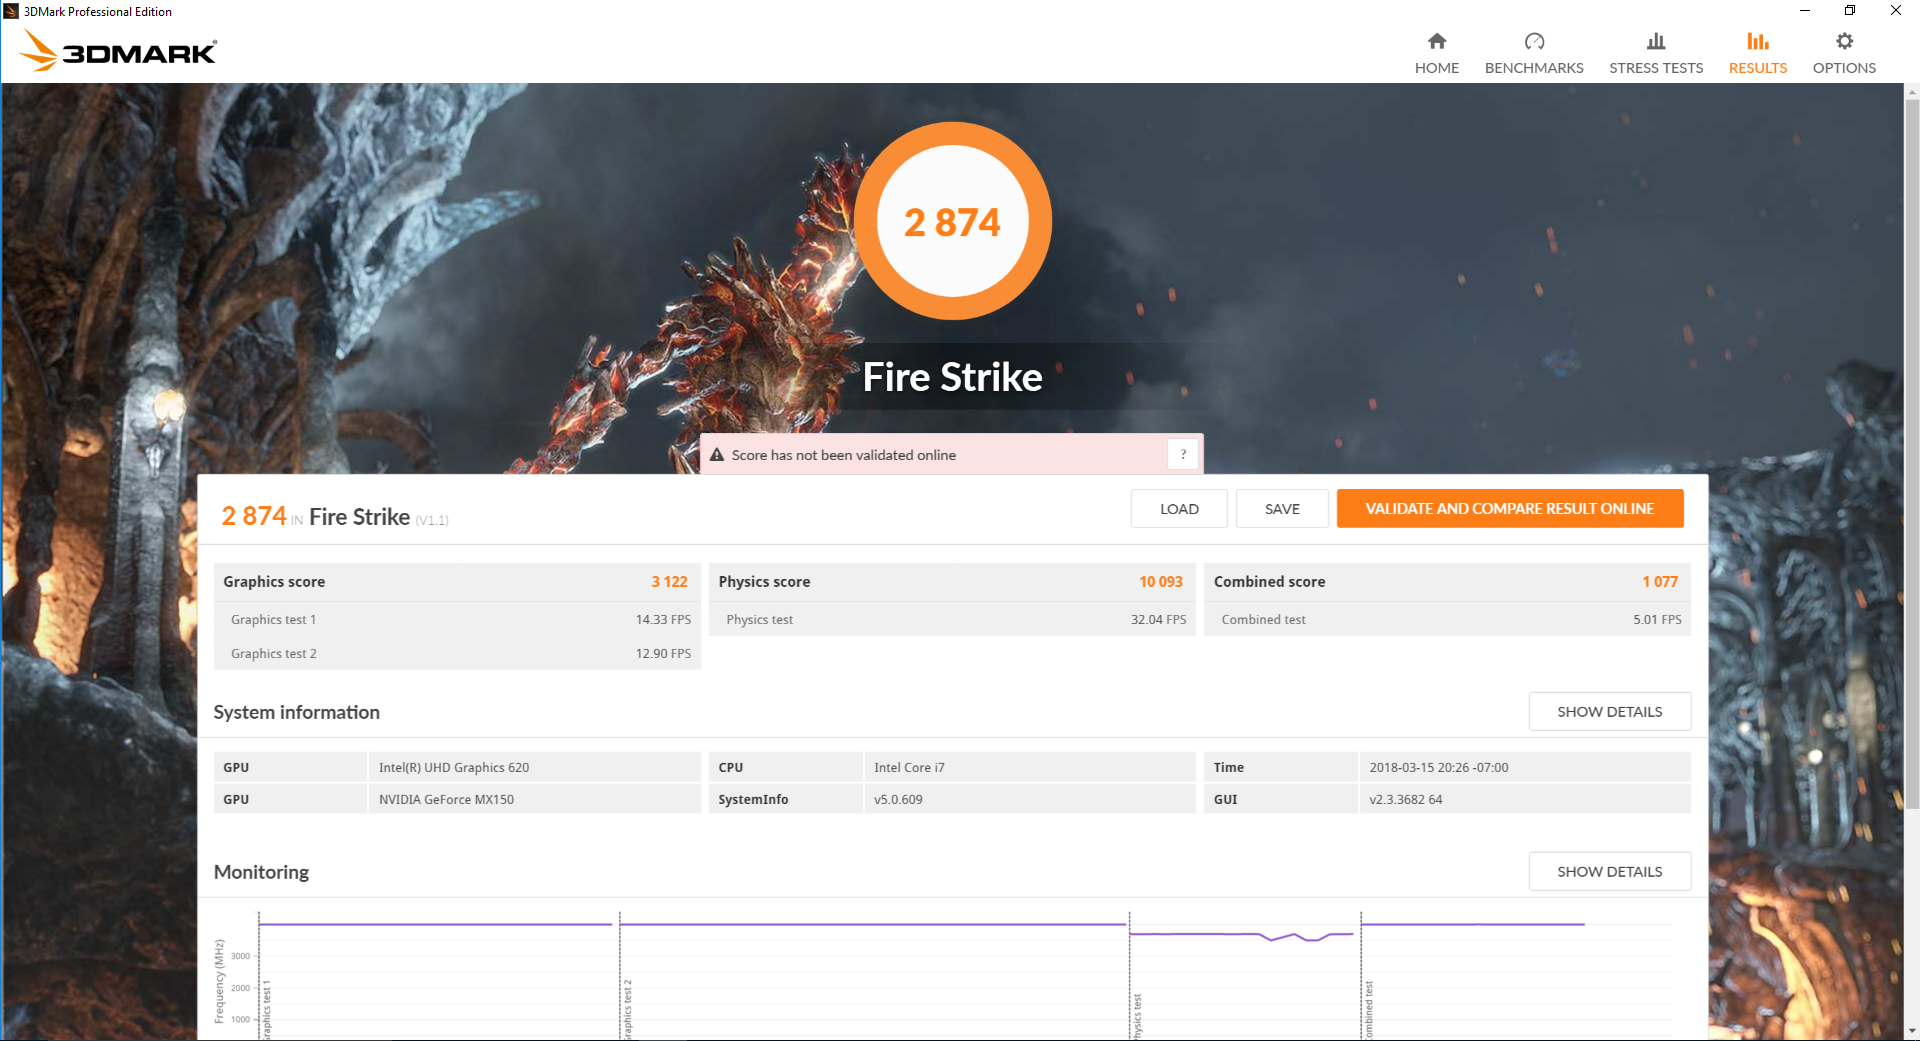
| 3DMark 11 Performance | 4160 points | |
| 3DMark Ice Storm Standard Score | 44383 points | |
| 3DMark Cloud Gate Standard Score | 12367 points | |
| 3DMark Fire Strike Score | 2874 points | |
| 3DMark Fire Strike Extreme Score | 1437 points | |
Help | ||
| low | med. | high | ultra | |
|---|---|---|---|---|
| BioShock Infinite (2013) | 141.4 | 77.2 | 66.9 | 28.9 |
| Metro: Last Light (2013) | 85.7 | 61.4 | 36.4 | 21.6 |
| Thief (2014) | 61 | 35.8 | 30.2 | 16.7 |
| The Witcher 3 (2015) | 32 | |||
| Batman: Arkham Knight (2015) | 41 | 36 | 16 | |
| Metal Gear Solid V (2015) | 60 | 60 | 34 | 24 |
| Fallout 4 (2015) | 51 | 35.7 | 19.2 | 14.9 |
| Rise of the Tomb Raider (2016) | 44.9 | 31.7 | 16.4 | 14.8 |
| Ashes of the Singularity (2016) | 25.7 | 15 | 12.8 | |
| Overwatch (2016) | 121.2 | 75.4 | 38.2 | 32.4 |
| Final Fantasy XV Benchmark (2018) | 25.4 | 12.6 | 7 |
Stress Test
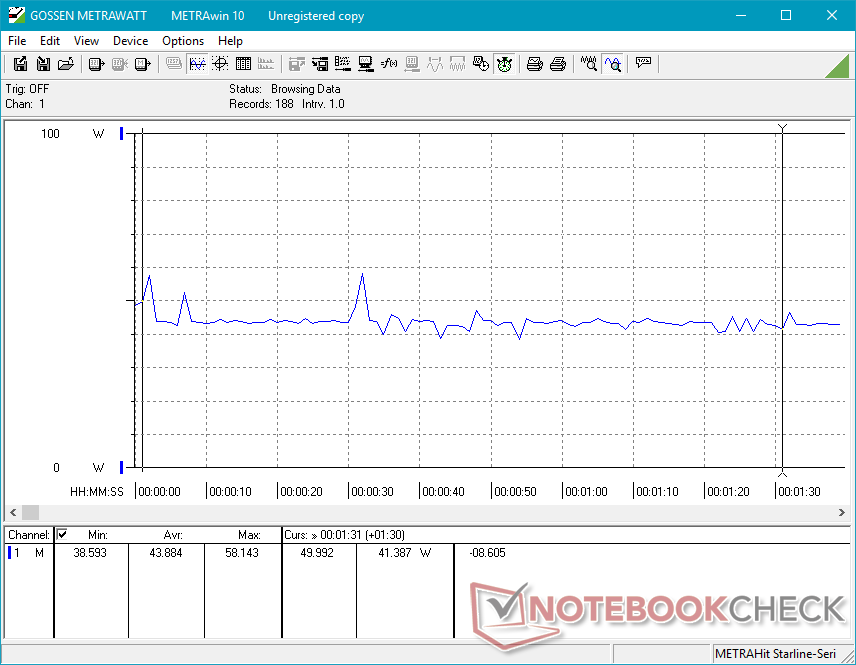
We stress the notebook to identify for any potential throttling or stability issues. When subjected to Prime95 load to stress the CPU, clock rates can be observed operating at up to 3.1 GHz for the first 30 seconds or so before dropping down to a steady 2.1 GHz. The results are in line with our CineBench loop test above where the highest score was on the first run only to decline steadily thereafter. While the drop to 2.1 GHz is steep, this is still above the base clock rate of the i7-8550U by 300 MHz and so the system is at least able to maintain a tiny amount of Turbo Boost.
Running both Prime95 and FurMark simultaneously will throttle the processors accordingly. Note that CPU clock rate, GPU clock rate, and CPU temperature may cycle when under such demanding loads. Core temperatures for both the CPU and GPU are steady in the mid 60 C to 70 C range even if one processor is not under high load since they share the same heat pipe.
Running Witcher 3 is more representative of real-world gaming loads. Unfortunately, the GPU is unable to maintain its rated GPU Boost of 1532 MHz for very long as the clock rate eventually throttles to just 1126 MHz over time or 343 MHz slower than its rated base clock rate. Our graph below shows that the initial 33 FPS is only achievable for the first few minutes or so before dropping down to the 28 to 30 FPS range. Note that there are periodic dips to the low 20 FPS range likely due to background activity from pre-installed applications. The lower-than-expected FPS count is disappointing for anyone hoping to get the full performance of the MX150 without any performance dips after long gaming sessions. It is, however, steady compared to the heavy throttling we recorded on the Samsung NP900X5T.
CPU performance is throttled when on battery power. A 3DMark 11 run on batteries returns Physics and Graphics scores of 6001 and 3694 points, respectively, compared to 8551 and 3867 points when on mains.
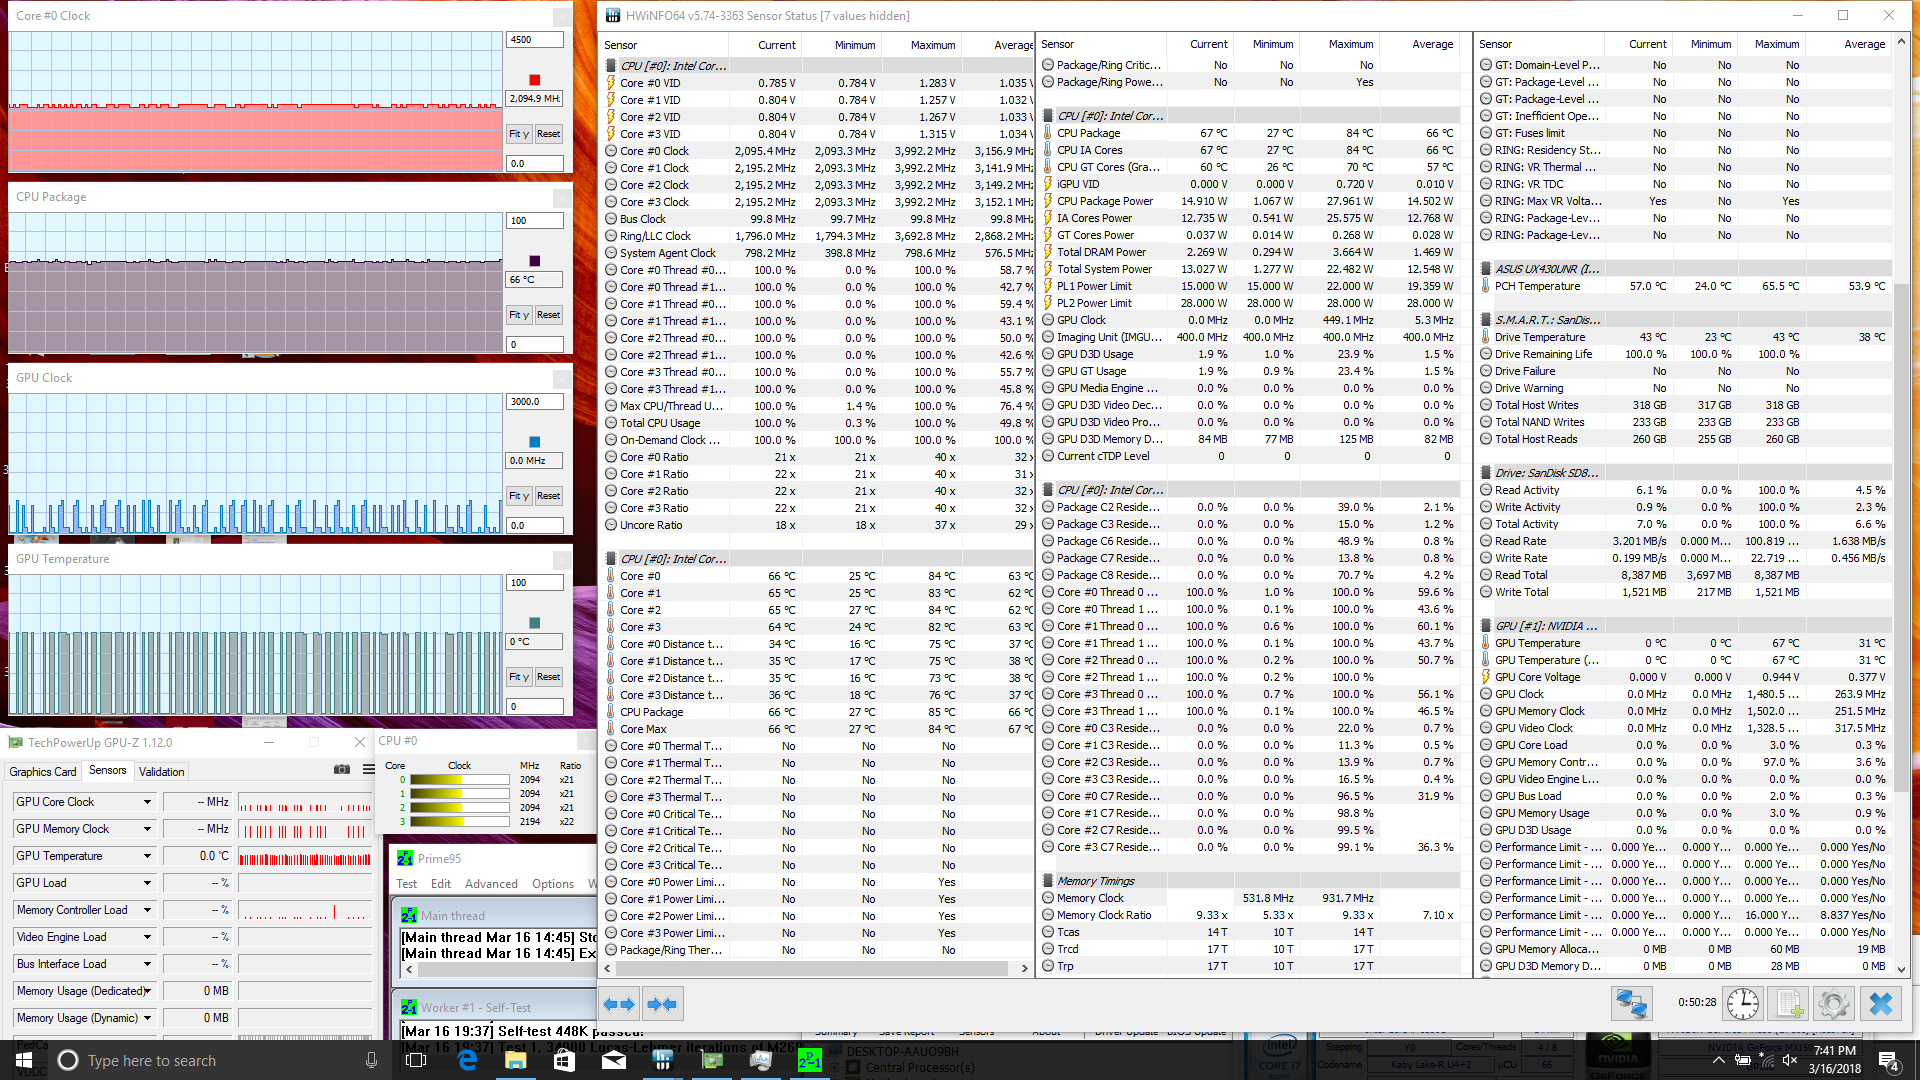
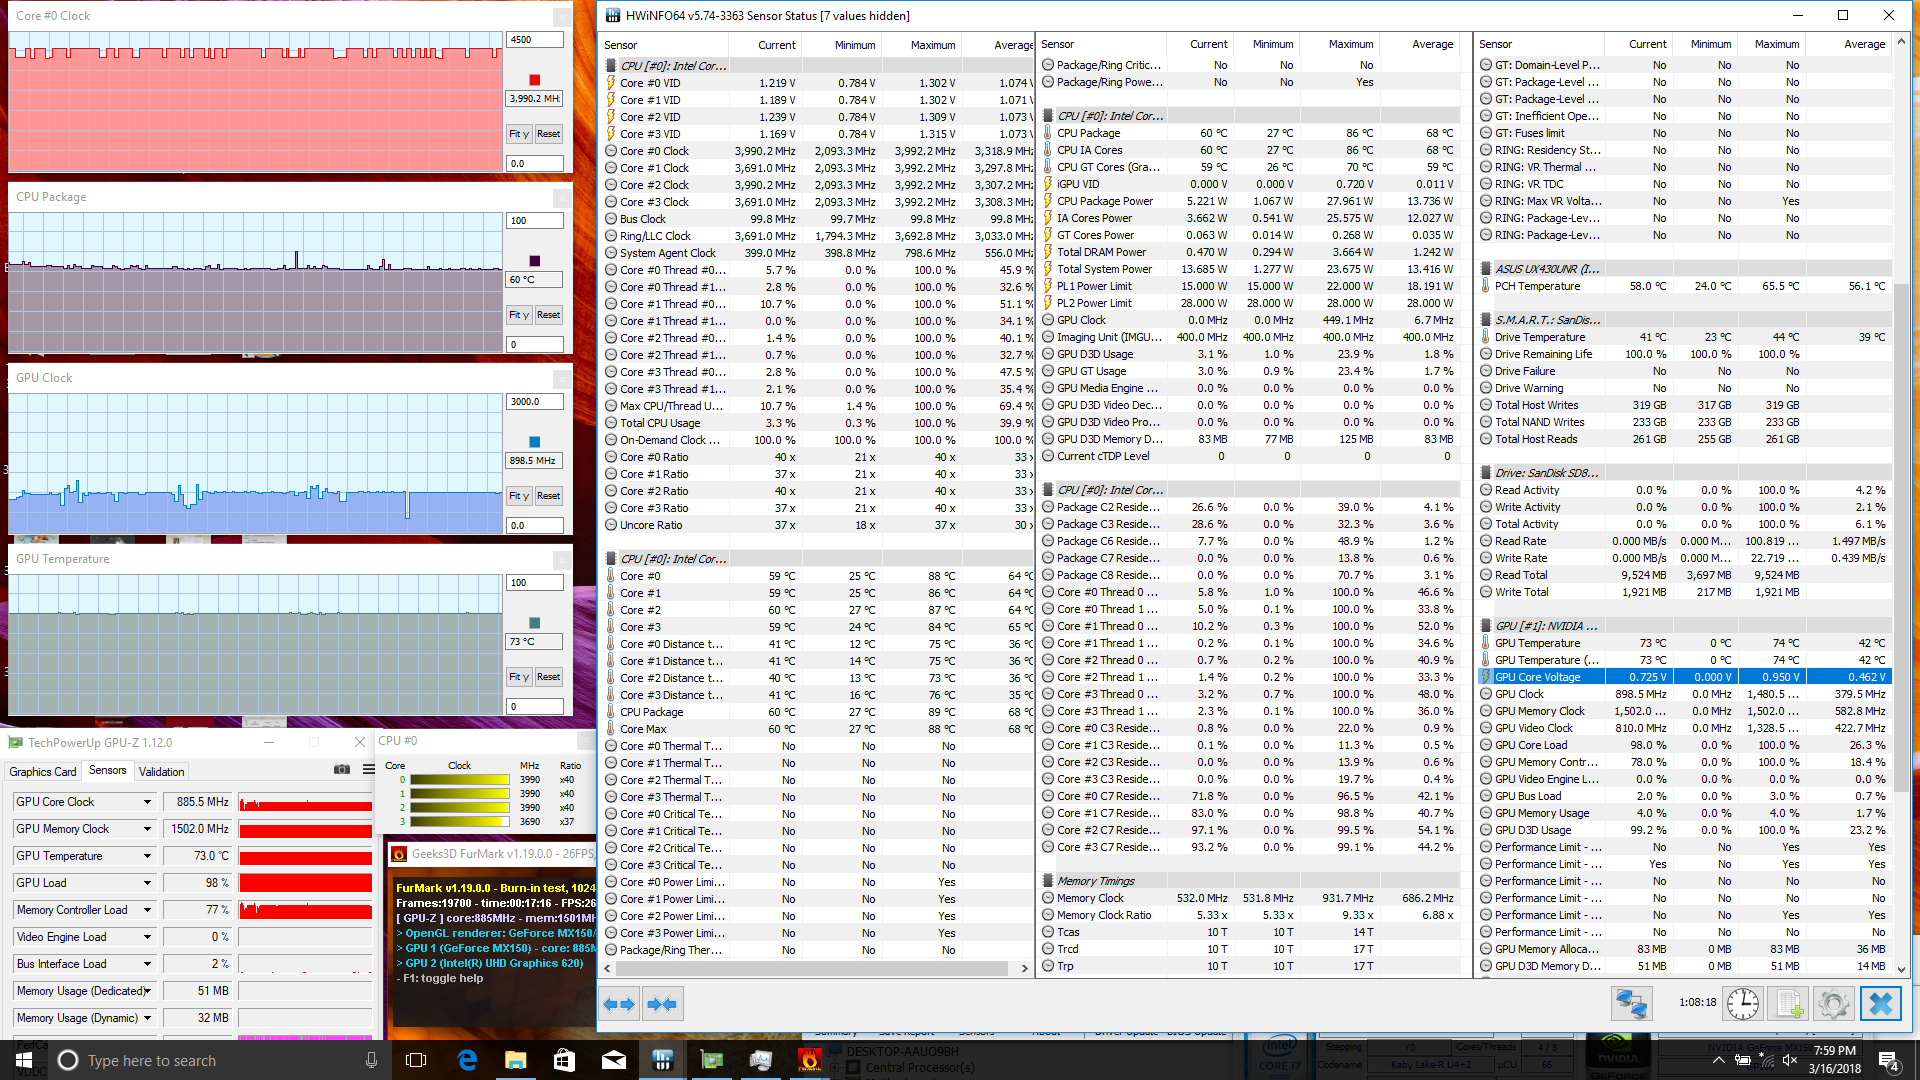
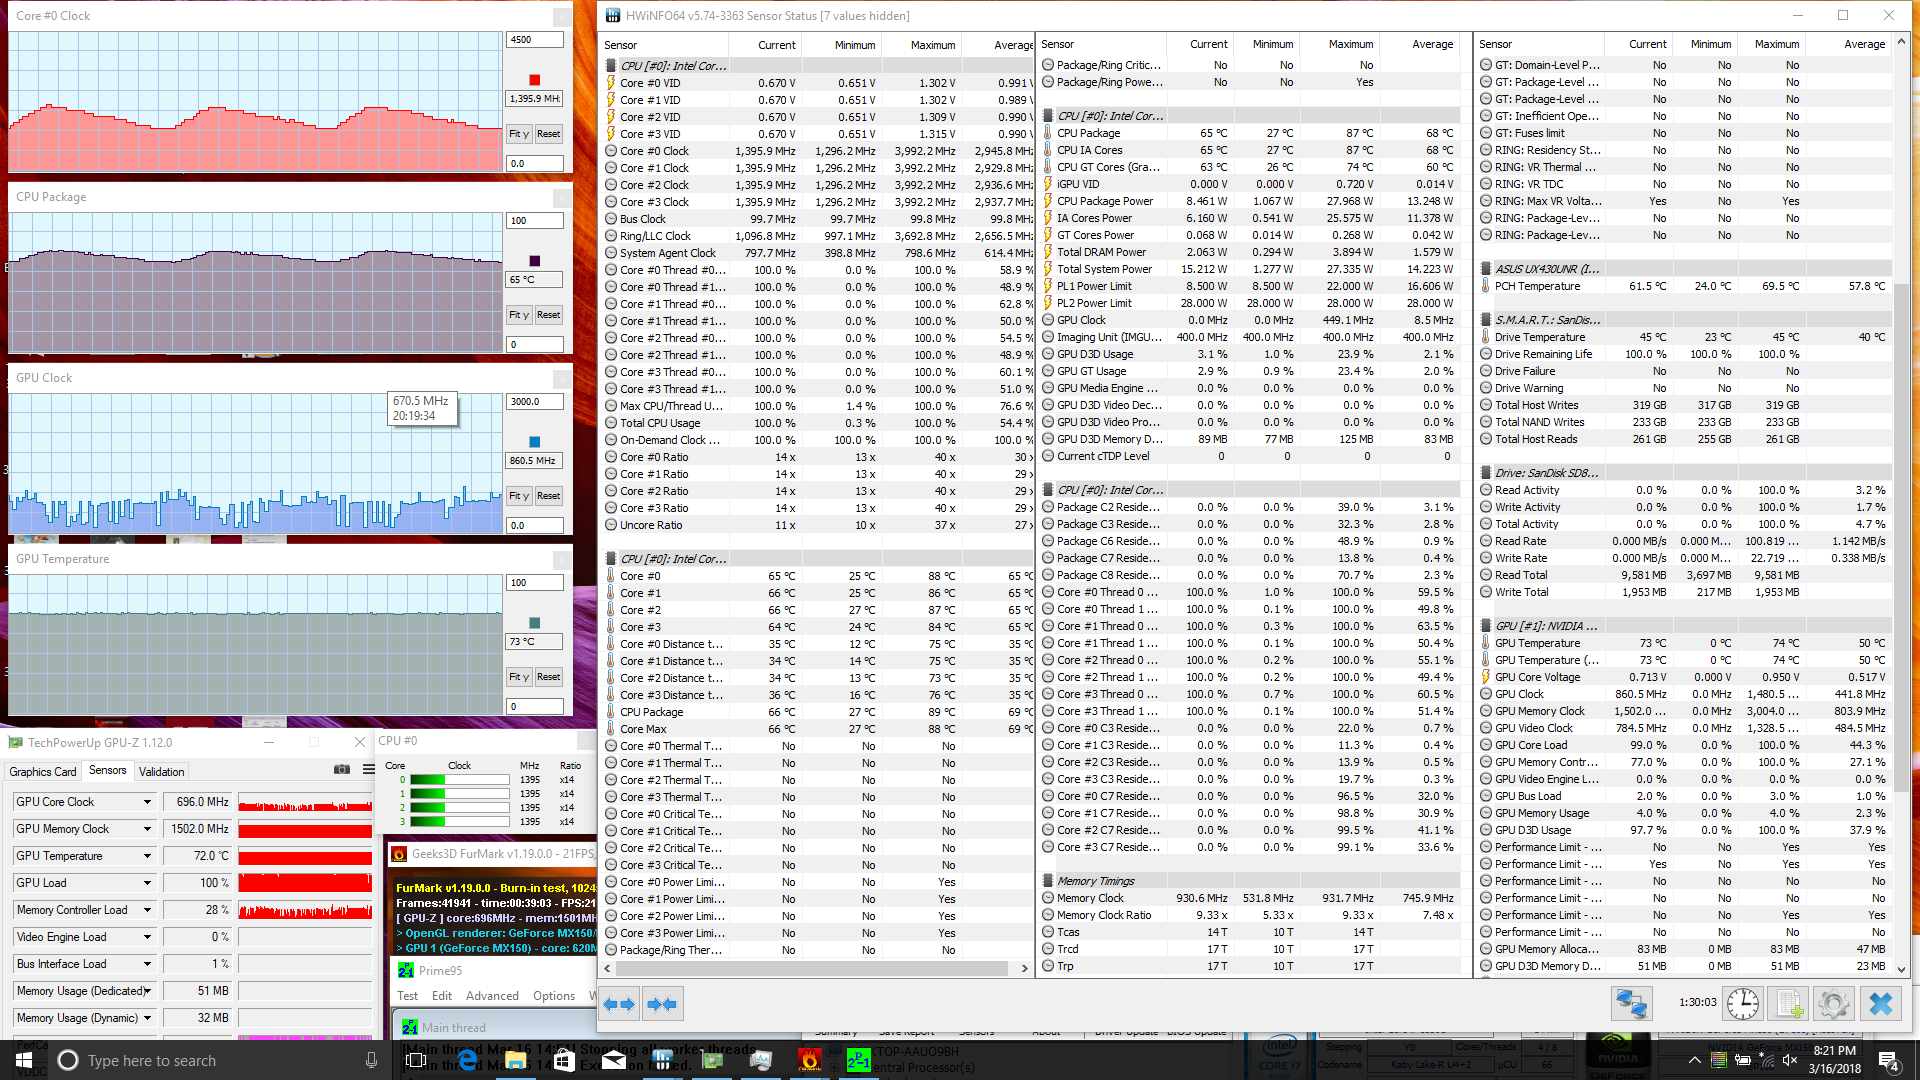
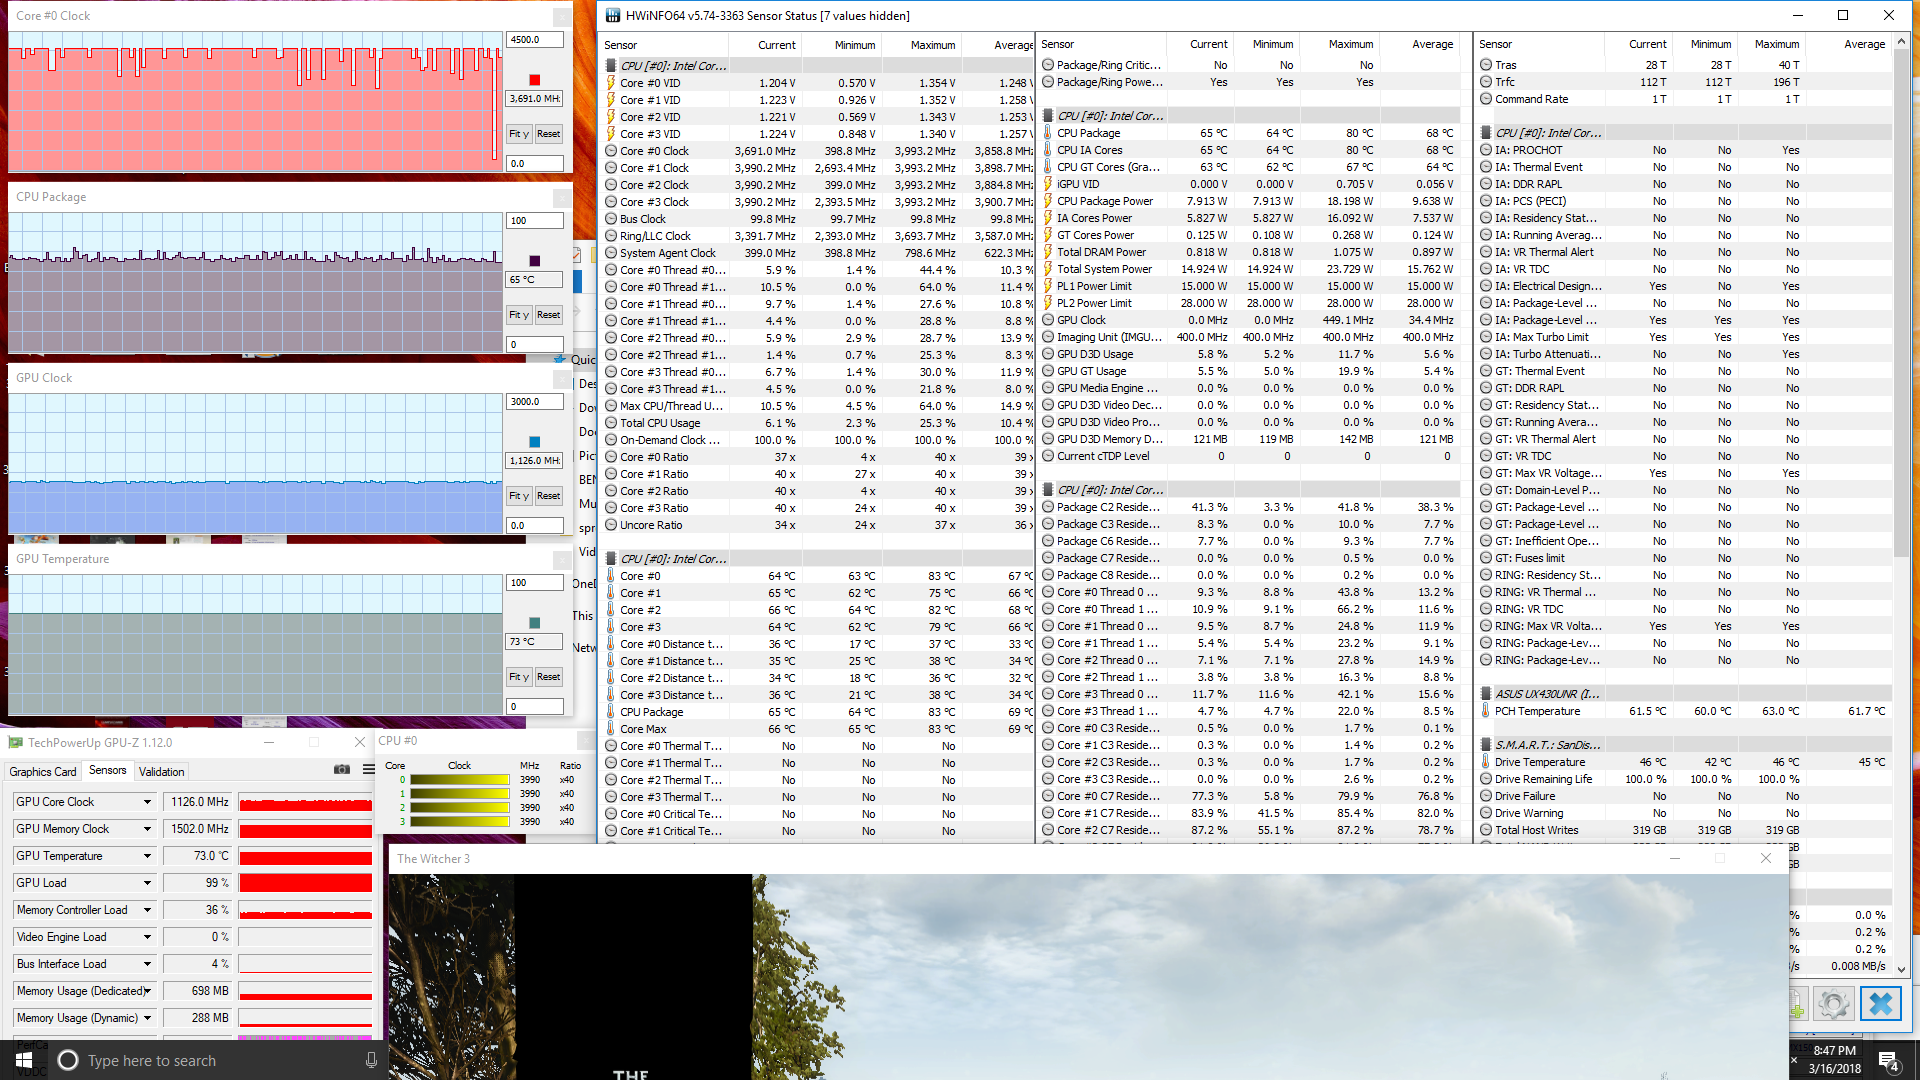
| CPU Clock (GHz) | GPU Clock (MHz) | Average CPU Temperature (°C) | Average GPU Temperature (°C) | |
| Prime95 Stress | 2.1 - 2.2 | -- | 66 | 63 |
| FurMark Stress | -- | 899 | 60 | 73 |
| Prime95 + FurMark Stress | 1.4 - 2.1 | 140 - 885 | 66 - 73 | 73 |
| Witcher 3 Stress | 2.7 - 4.0 | 1126 | 66 | 73 |
Emissions
System Noise
The cooling solution consists of a single fan and heat pipe located towards the rear of the unit. The fan is generally always active and only inactive upon the first few minutes of boot up. It's barely audible if simply web browsing or word processing for a near-silent experience.
Running higher loads like 3DMark 06 will slowly but surely bump fan noise up to 41.8 dB(A) by the end of the first benchmark scene. This behavior is expected since the benchmark is quite demanding on Ultrabooks and low-power GPUs. Competing Ultrabooks with weaker integrated GPUs like the Zenbook UX490 or Yoga 920 run quieter by several decibels when subjected to similar loads. Users can expect a steady fan noise of 42 dB(A) when gaming to be comparable to many Max-Q gaming notebooks.
High-pitched electronic noise or coil whine is present on our test unit even when the system is simply idling on desktop. The noise is only audible when in a quiet room or with an ear placed closely on the keyboard keys, but the fact that it is present in the first place can be irritating to some users.
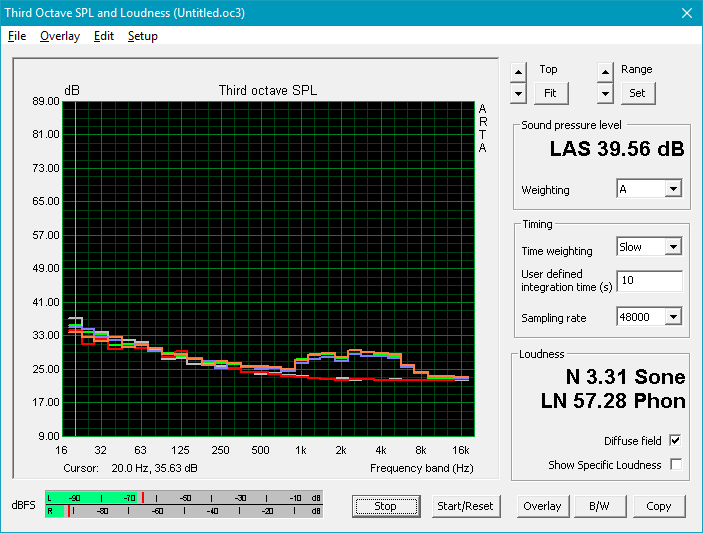
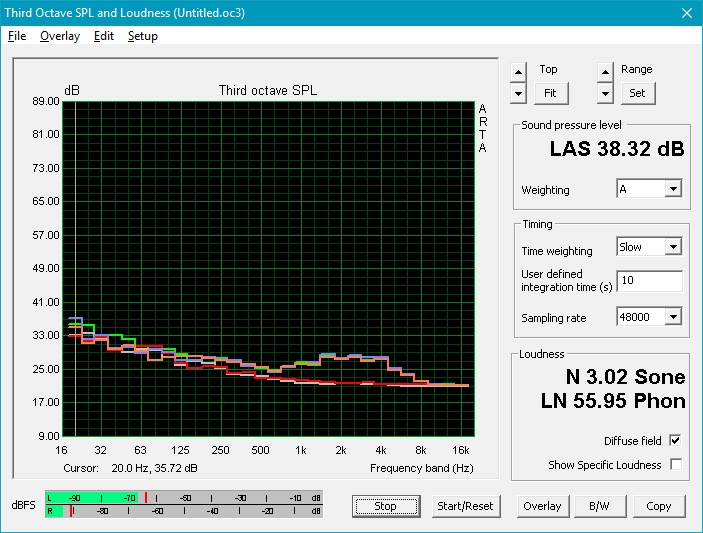
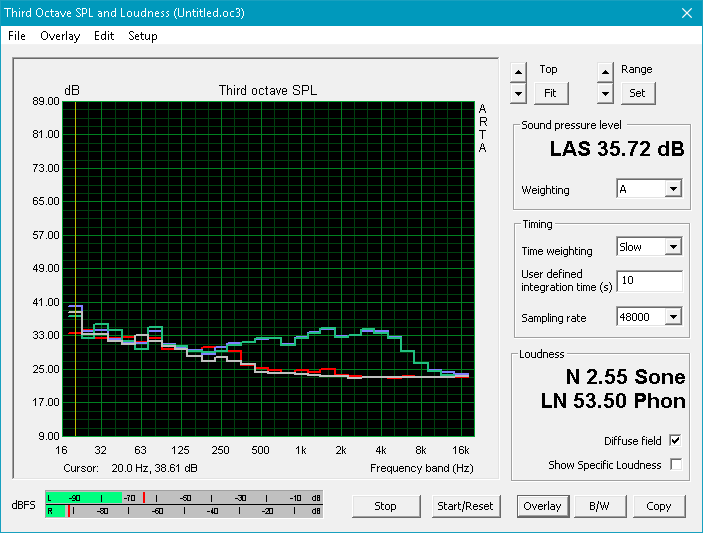
Noise level
| Idle |
| 28.9 / 30 / 30.2 dB(A) |
| Load |
| 41.8 / 42 dB(A) |
 | ||
30 dB silent 40 dB(A) audible 50 dB(A) loud |
||
min: | ||
| Asus Zenbook UX430UN GeForce MX150, i5-8550U, SanDisk SD8SN8U512G1002 | Dell XPS 13 9370 i5 UHD UHD Graphics 620, i5-8250U, Toshiba XG5 KXG50ZNV256G | Samsung Notebook 9 NP900X5T-X01US GeForce MX150, i5-8550U, Samsung PM961 MZVLW256HEHP | Asus Zenbook 3 Deluxe UX490UA HD Graphics 620, i5-7200U, Micron 1100 MTFDDAV256TBN | Lenovo Yoga 920-13IKB-80Y7 UHD Graphics 620, i5-8550U, Samsung PM961 MZVLW256HEHP | Apple MacBook Pro 15 2017 (2.9 GHz, 560) Radeon Pro 560, i7-7820HQ | |
|---|---|---|---|---|---|---|
| Noise | 6% | 1% | 3% | 7% | 1% | |
| off / environment * (dB) | 28.3 | 29 -2% | 29.6 -5% | 30.2 -7% | 28 1% | 30.8 -9% |
| Idle Minimum * (dB) | 28.9 | 29 -0% | 29.6 -2% | 30.2 -4% | 28 3% | 31 -7% |
| Idle Average * (dB) | 30 | 29 3% | 29.6 1% | 30.2 -1% | 28.8 4% | 31 -3% |
| Idle Maximum * (dB) | 30.2 | 29 4% | 30.3 -0% | 31.2 -3% | 30.3 -0% | 31 -3% |
| Load Average * (dB) | 41.8 | 32 23% | 40 4% | 35.7 15% | 34.5 17% | 31.3 25% |
| Witcher 3 ultra * (dB) | 42 | 40 5% | ||||
| Load Maximum * (dB) | 42 | 40.1 5% | 40 5% | 34.2 19% | 34.3 18% | 41.8 -0% |
* ... smaller is better
Temperature
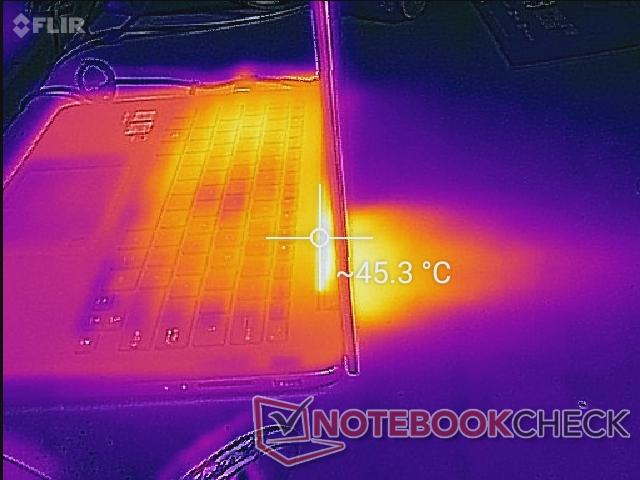
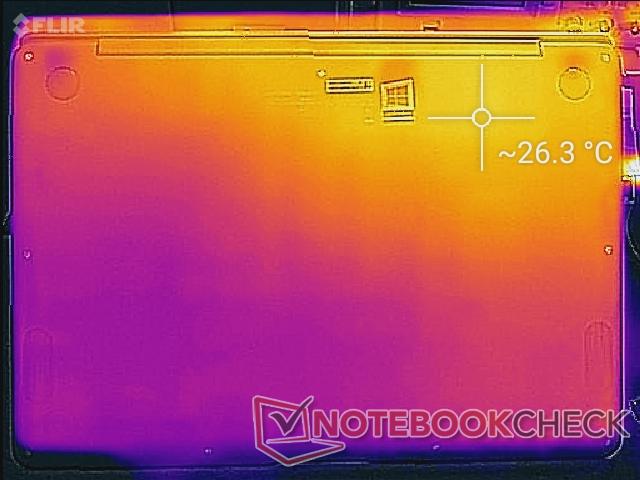
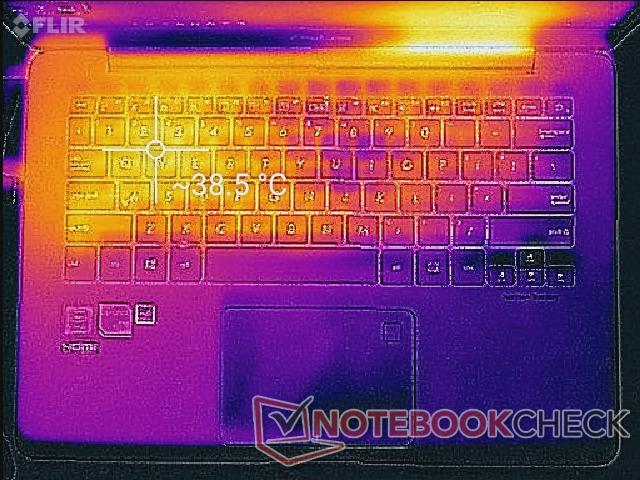
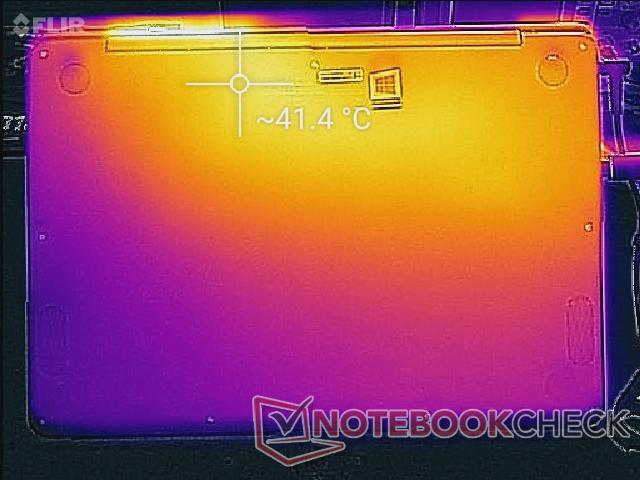
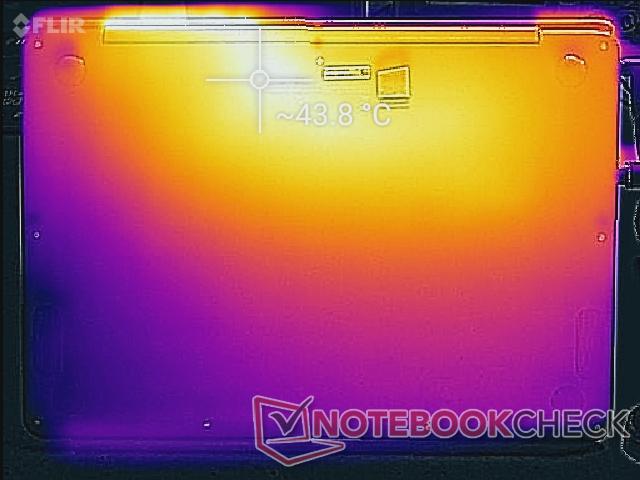
Surface temperatures are generally flat on both sides of the notebook when idling with the rear being only a few degrees warmer than the front. When subjected to heavier loads, the hot spots can be as warm as 44 C. One of these hot spots is very close to the WASD keys since the CPU is located directly underneath. As such, users will find the left side of the keyboard to be noticeably warmer than the right which is less than ideal when gaming. Alternative Ultrabooks like the Spectre 13 have more symmetrical temperature development compared to the Asus.
For word processing or streaming purposes, the Asus never becomes uncomfortable to use even if a table is unavailable.
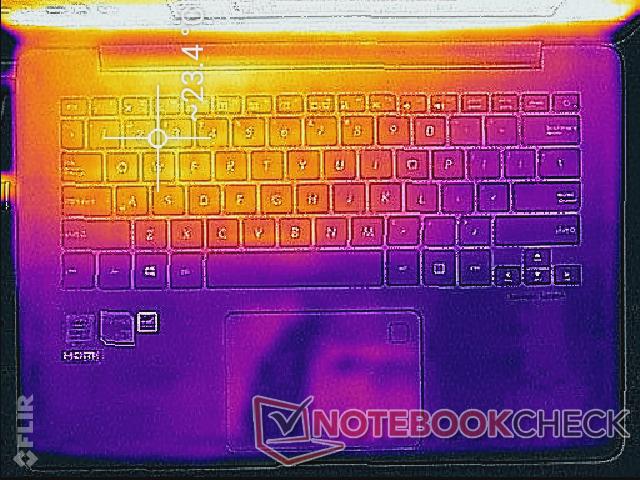
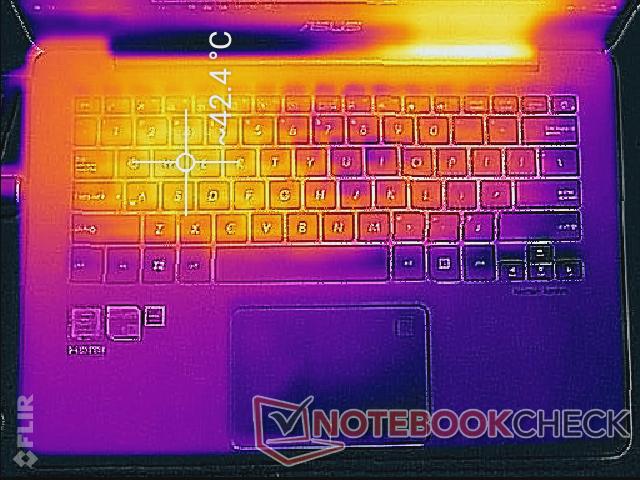
(±) The maximum temperature on the upper side is 43.6 °C / 110 F, compared to the average of 36.8 °C / 98 F, ranging from 21 to 71 °C for the class Multimedia.
(±) The bottom heats up to a maximum of 44 °C / 111 F, compared to the average of 39.1 °C / 102 F
(+) In idle usage, the average temperature for the upper side is 21.5 °C / 71 F, compared to the device average of 31.3 °C / 88 F.
(+) Playing The Witcher 3, the average temperature for the upper side is 31.1 °C / 88 F, compared to the device average of 31.3 °C / 88 F.
(+) The palmrests and touchpad are cooler than skin temperature with a maximum of 30.6 °C / 87.1 F and are therefore cool to the touch.
(±) The average temperature of the palmrest area of similar devices was 28.7 °C / 83.7 F (-1.9 °C / -3.4 F).
Speakers

The 1.5 W stereo Harman Kardon speakers are above average for the size with deeper bass and a wider range than the speakers of the Samsung Notebook 9. Maximum volume is sufficiently loud to fill a small conference room and introduces no static or noticeable distortion. The main issue is that the palm rests will vibrate slightly even when on lower volume settings that some users may find distracting.
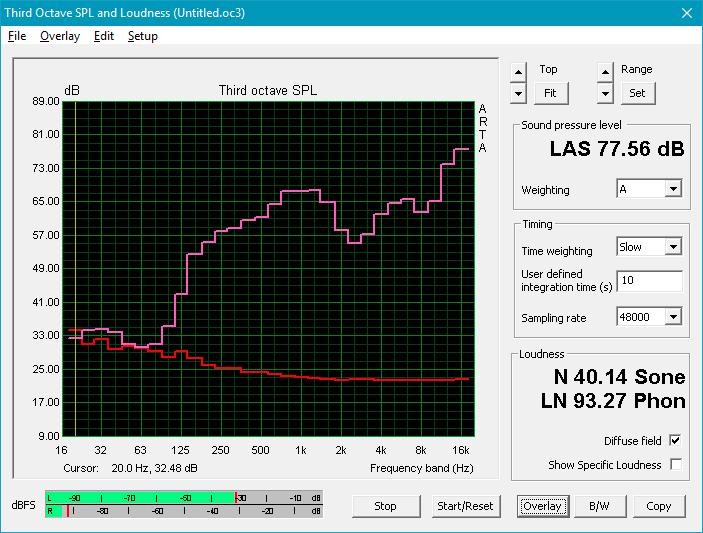
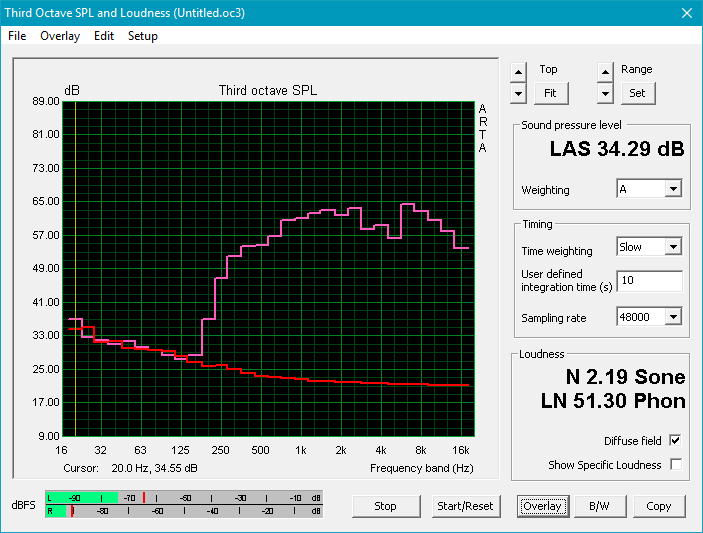
Asus Zenbook UX430UN audio analysis
(-) | not very loud speakers (64.5 dB)
Bass 100 - 315 Hz
(-) | nearly no bass - on average 21.3% lower than median
(±) | linearity of bass is average (12.6% delta to prev. frequency)
Mids 400 - 2000 Hz
(+) | balanced mids - only 3.4% away from median
(+) | mids are linear (4.2% delta to prev. frequency)
Highs 2 - 16 kHz
(+) | balanced highs - only 3.3% away from median
(±) | linearity of highs is average (9.3% delta to prev. frequency)
Overall 100 - 16.000 Hz
(±) | linearity of overall sound is average (25.1% difference to median)
Compared to same class
» 89% of all tested devices in this class were better, 3% similar, 8% worse
» The best had a delta of 5%, average was 17%, worst was 45%
Compared to all devices tested
» 77% of all tested devices were better, 5% similar, 18% worse
» The best had a delta of 4%, average was 24%, worst was 134%
Apple MacBook 12 (Early 2016) 1.1 GHz audio analysis
(+) | speakers can play relatively loud (83.6 dB)
Bass 100 - 315 Hz
(±) | reduced bass - on average 11.3% lower than median
(±) | linearity of bass is average (14.2% delta to prev. frequency)
Mids 400 - 2000 Hz
(+) | balanced mids - only 2.4% away from median
(+) | mids are linear (5.5% delta to prev. frequency)
Highs 2 - 16 kHz
(+) | balanced highs - only 2% away from median
(+) | highs are linear (4.5% delta to prev. frequency)
Overall 100 - 16.000 Hz
(+) | overall sound is linear (10.2% difference to median)
Compared to same class
» 7% of all tested devices in this class were better, 2% similar, 91% worse
» The best had a delta of 5%, average was 18%, worst was 53%
Compared to all devices tested
» 5% of all tested devices were better, 1% similar, 94% worse
» The best had a delta of 4%, average was 24%, worst was 134%
Frequency Comparison (Checkbox selectable!)
Graph 1: Pink Noise 100% Vol.; Graph 2: Audio off
Energy Management
Power Consumption
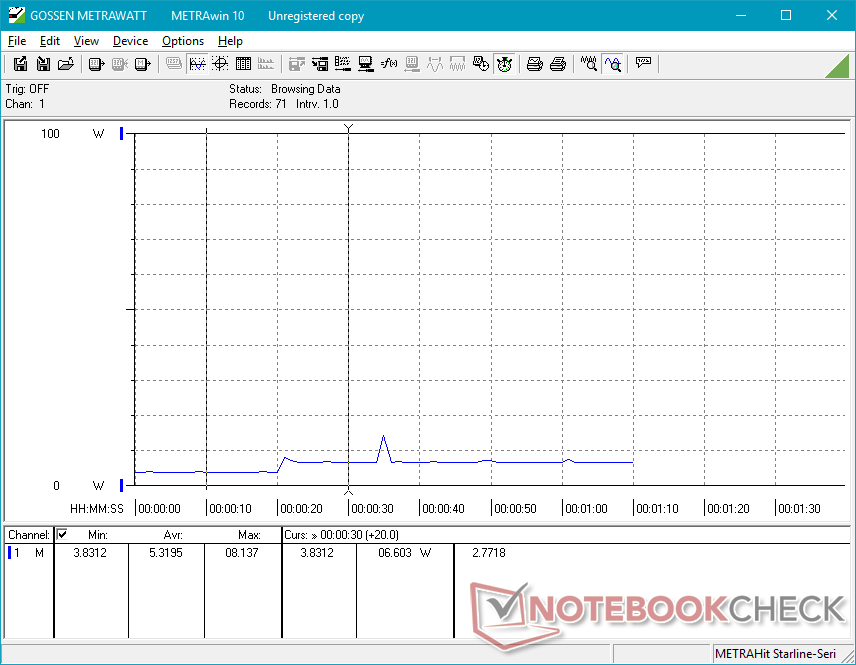
Idling on desktop will draw anywhere between 3 W and 6 W depending on the Power profile and brightness setting. Medium load as represented by 3DMark 06 will demand about 54 W or around 10 W to 15 W more than many competing 13-inch Ultrabooks. Note that power consumption when running Witcher 3 is slightly lower since GPU Boost and CPU demands are different between Witcher 3 and 3DMark 06.
Power consumption is measurably higher during the first minute or so of stress testing because higher Turbo Boost clock rates are only achievable during this period.
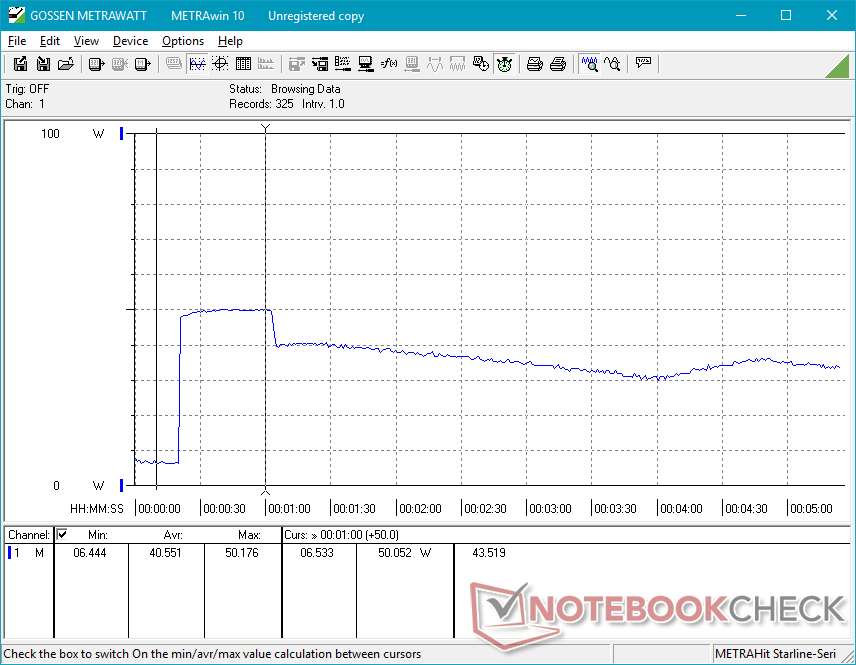
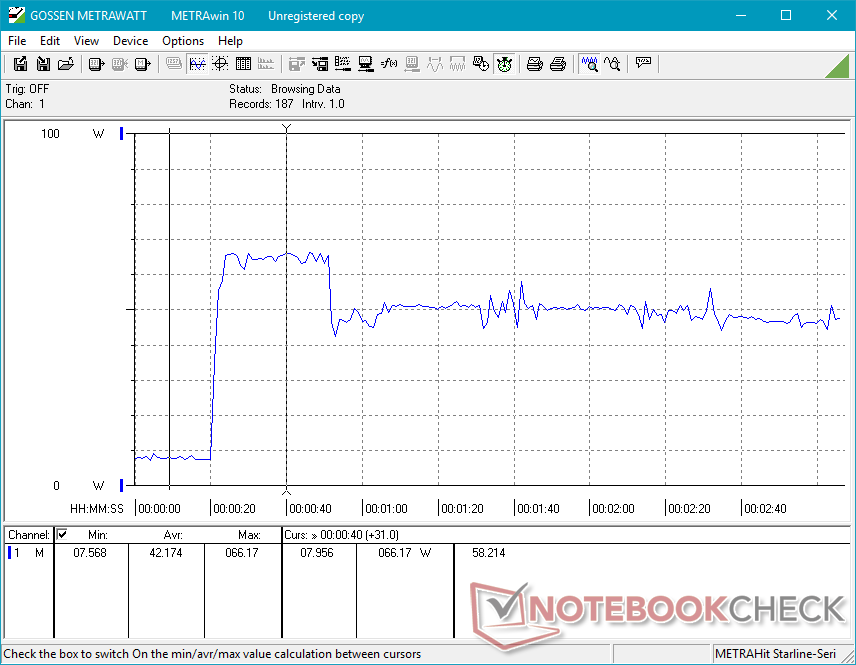
Average power consumption when running both Prime95 and FurMark simultaneously over a 90-second period is 56 W from a small (7.5 x 7.5 x 3.0 cm) AC adapter rated for 65 W. It's worth noting that we recorded a maximum draw of 66 W as shown by our graph below, but this occurred very early in our stress test for a very short period.
| Off / Standby | |
| Idle | |
| Load |
|
Key:
min: | |
| Asus Zenbook UX430UN i5-8550U, GeForce MX150, SanDisk SD8SN8U512G1002, IPS, 1920x1080, 14" | Dell XPS 13 9370 i5 UHD i5-8250U, UHD Graphics 620, Toshiba XG5 KXG50ZNV256G, IPS, 3840x2160, 13.3" | Samsung Notebook 9 NP900X5T-X01US i5-8550U, GeForce MX150, Samsung PM961 MZVLW256HEHP, IPS, 1920x1080, 15" | Asus Zenbook 3 Deluxe UX490UA i5-7200U, HD Graphics 620, Micron 1100 MTFDDAV256TBN, IPS, 1920x1080, 14" | Huawei MateBook X i5-7200U, HD Graphics 620, LITEON CB1-SD256, , 2160x1440, 13.3" | Microsoft Surface Laptop i5 i5-7200U, HD Graphics 620, Toshiba THNSN0128GTYA, IPS, 2256x1504, 13.5" | Asus ZenBook 13 UX331UN i5-8550U, GeForce MX150, SK Hynix HFS256G39TND-N210A, IPS, 1920x1080, 13.3" | |
|---|---|---|---|---|---|---|---|
| Power Consumption | -17% | -42% | 8% | -34% | 11% | 13% | |
| Idle Minimum * (Watt) | 3 | 4.3 -43% | 3.5 -17% | 3.3 -10% | 4.6 -53% | 3.2 -7% | 2.2 27% |
| Idle Average * (Watt) | 5.8 | 8 -38% | 11.3 -95% | 6.1 -5% | 11 -90% | 6.5 -12% | 5 14% |
| Idle Maximum * (Watt) | 6.2 | 8.1 -31% | 14.2 -129% | 10.1 -63% | 12 -94% | 6.8 -10% | 8 -29% |
| Load Average * (Watt) | 54.1 | 46.6 14% | 53.3 1% | 24.6 55% | 39.5 27% | 28.2 48% | 33 39% |
| Witcher 3 ultra * (Watt) | 45.9 | 50.6 -10% | |||||
| Load Maximum * (Watt) | 56.4 | 49.8 12% | 56.2 -0% | 22 61% | 34.6 39% | 36 36% | 49.4 12% |
* ... smaller is better
Battery Life
Runtimes from the non-removable 50 Wh battery are respectable at about 9 hours of real-world WLAN use on the Balanced profile setting or even longer for simpler tasks. Results are unsurprisingly comparable to Asus' other 14-inch Ultrabook, the ZenBook UX490, while being a bit better than the XPS 13 and its higher resolution 4K UHD display.
Charging from near empty to full capacity is very slow on the UX430 at about 3 hours with the included AC adapter. In comparison, most notebooks take only 1.5 to 2 hours to charge.
| Asus Zenbook UX430UN i5-8550U, GeForce MX150, 50 Wh | Dell XPS 13 9370 i5 UHD i5-8250U, UHD Graphics 620, 52 Wh | Samsung Notebook 9 NP900X5T-X01US i5-8550U, GeForce MX150, 75 Wh | Asus Zenbook 3 Deluxe UX490UA i5-7200U, HD Graphics 620, 46 Wh | Huawei MateBook X i5-7200U, HD Graphics 620, 40 Wh | Microsoft Surface Laptop i5 i5-7200U, HD Graphics 620, 45 Wh | |
|---|---|---|---|---|---|---|
| Battery runtime | -10% | 40% | 21% | -7% | 23% | |
| Reader / Idle (h) | 17.3 | 14.5 -16% | 30.2 75% | 17.2 -1% | 8.5 -51% | 22.5 30% |
| WiFi v1.3 (h) | 9.3 | 6.8 -27% | 10.6 14% | 9.4 1% | 5.6 -40% | 10 8% |
| Load (h) | 1.6 | 1.8 13% | 2.1 31% | 2.6 63% | 2.7 69% | 2.1 31% |
Pros
Cons
Verdict
The positives don't outweigh the longer list of negatives on the UX430. The few standout features are the crisp matte display and thin design, but nearly everything else is average at best or unremarkable. Brightness is dimmer than competing Ultrabooks, the chassis is comparatively more flexible, the trackpad is soft, and the keyboard keys could have been firmer. When diving deeper into the hardware, it is disappointing to find coil whine and a throttling GPU that is unable to sustain even its base clock rate over time.
The main advantage of the UX430UN is its price of $1200. Its specifications are impressive with an 8th gen Core i7 CPU, 16 GB of RAM, 512 GB SSD, and even dedicated GeForce Pascal graphics. A system with comparable specifications like the Samsung NP900X5T or Spectre x360 15 retail for hundreds more each and even the XPS 13 begins at $1000 USD with just a fraction of the core specifications. From this perspective, the UX430UN can be considered excellent value for the performance so long as users are aware of its laundry list of drawbacks.
Great specs for a great price. The actual hardware, however, could use improvement on nearly all fronts to better compete in the 4-digit price range. We hope to see a more rigid design and a brighter display for improved outdoor usability in future iterations.
Asus Zenbook UX430UN
- 03/23/2018 v6 (old)
Allen Ngo
