Asus Zenbook Pro UX550VE (i7-7700HQ, GTX 1050 Ti) Laptop Review
A few months back, we evaluated the 2017 Zenbook Pro, which we praised (among other things) for its solid and attractive build quality, good performance, bright IPS screen, and reasonable battery life. Today, we’ll be taking a look at an updated configuration featuring an NVIDIA GeForce GTX 1050 Ti and a 1920x1080 touchscreen—alongside the same Intel Core i7-7700HQ CPU and 512 GB NVMe SSD. This unit retails currently for around $1,700. XOTIC PC has provided today's unit, but they assure us that no software or hardware modifications have been performed that would impact performance.
We’ll briefly recap our thoughts on the casing and other fundamentals, but the focus of today’s article will be what’s changed in the realms of performance and those items which are affected by higher-powered components: battery life, heat, noise, et al.
Case, Connectivity, and other preliminary notes
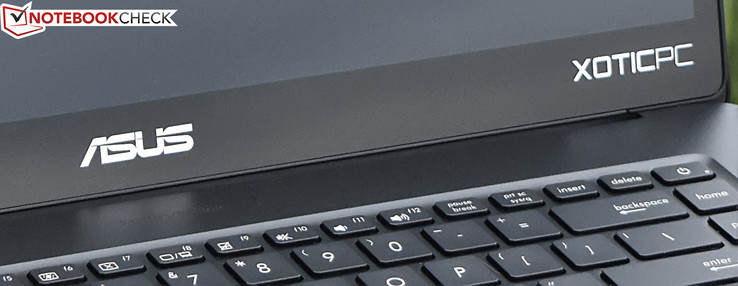
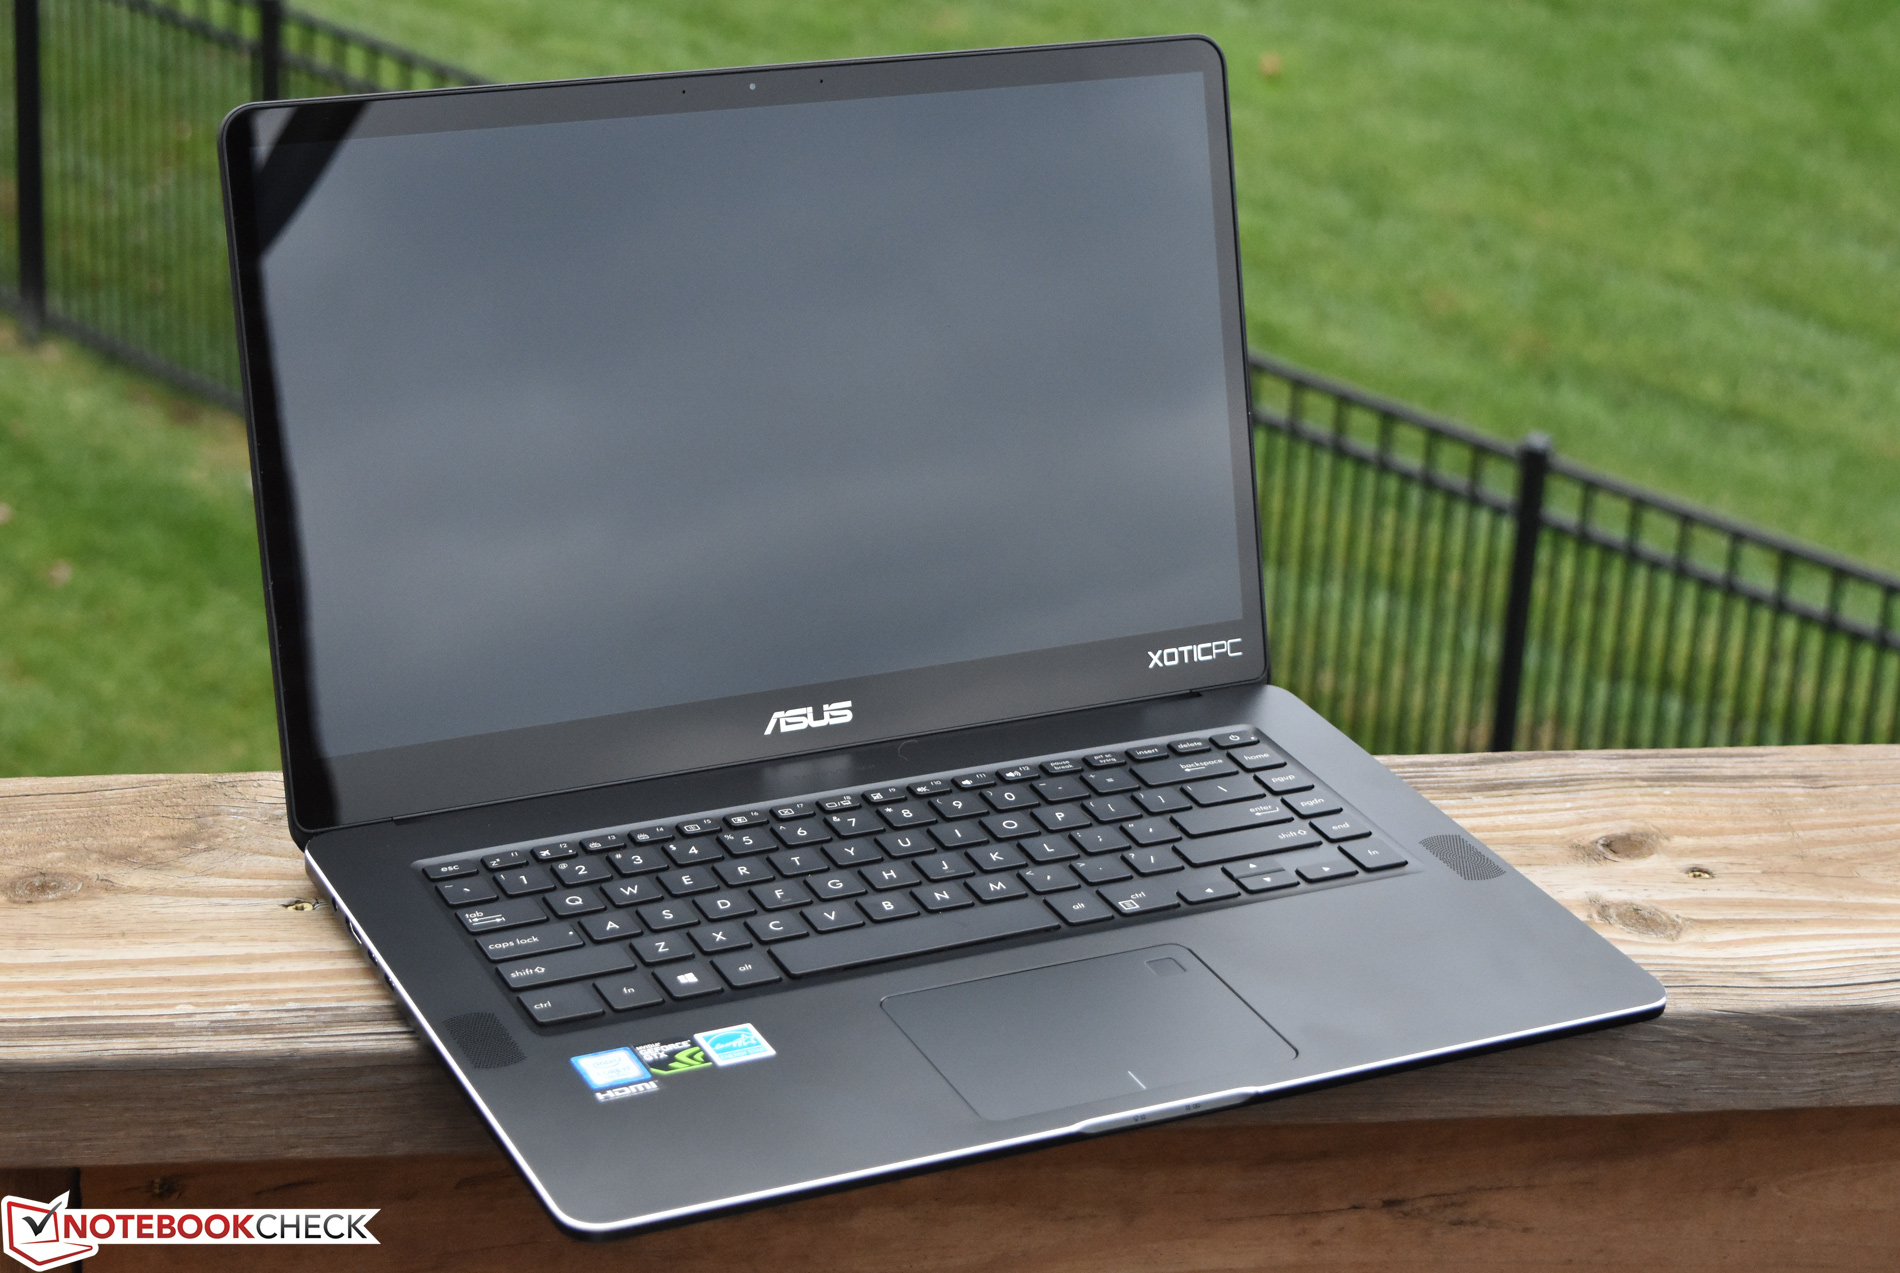
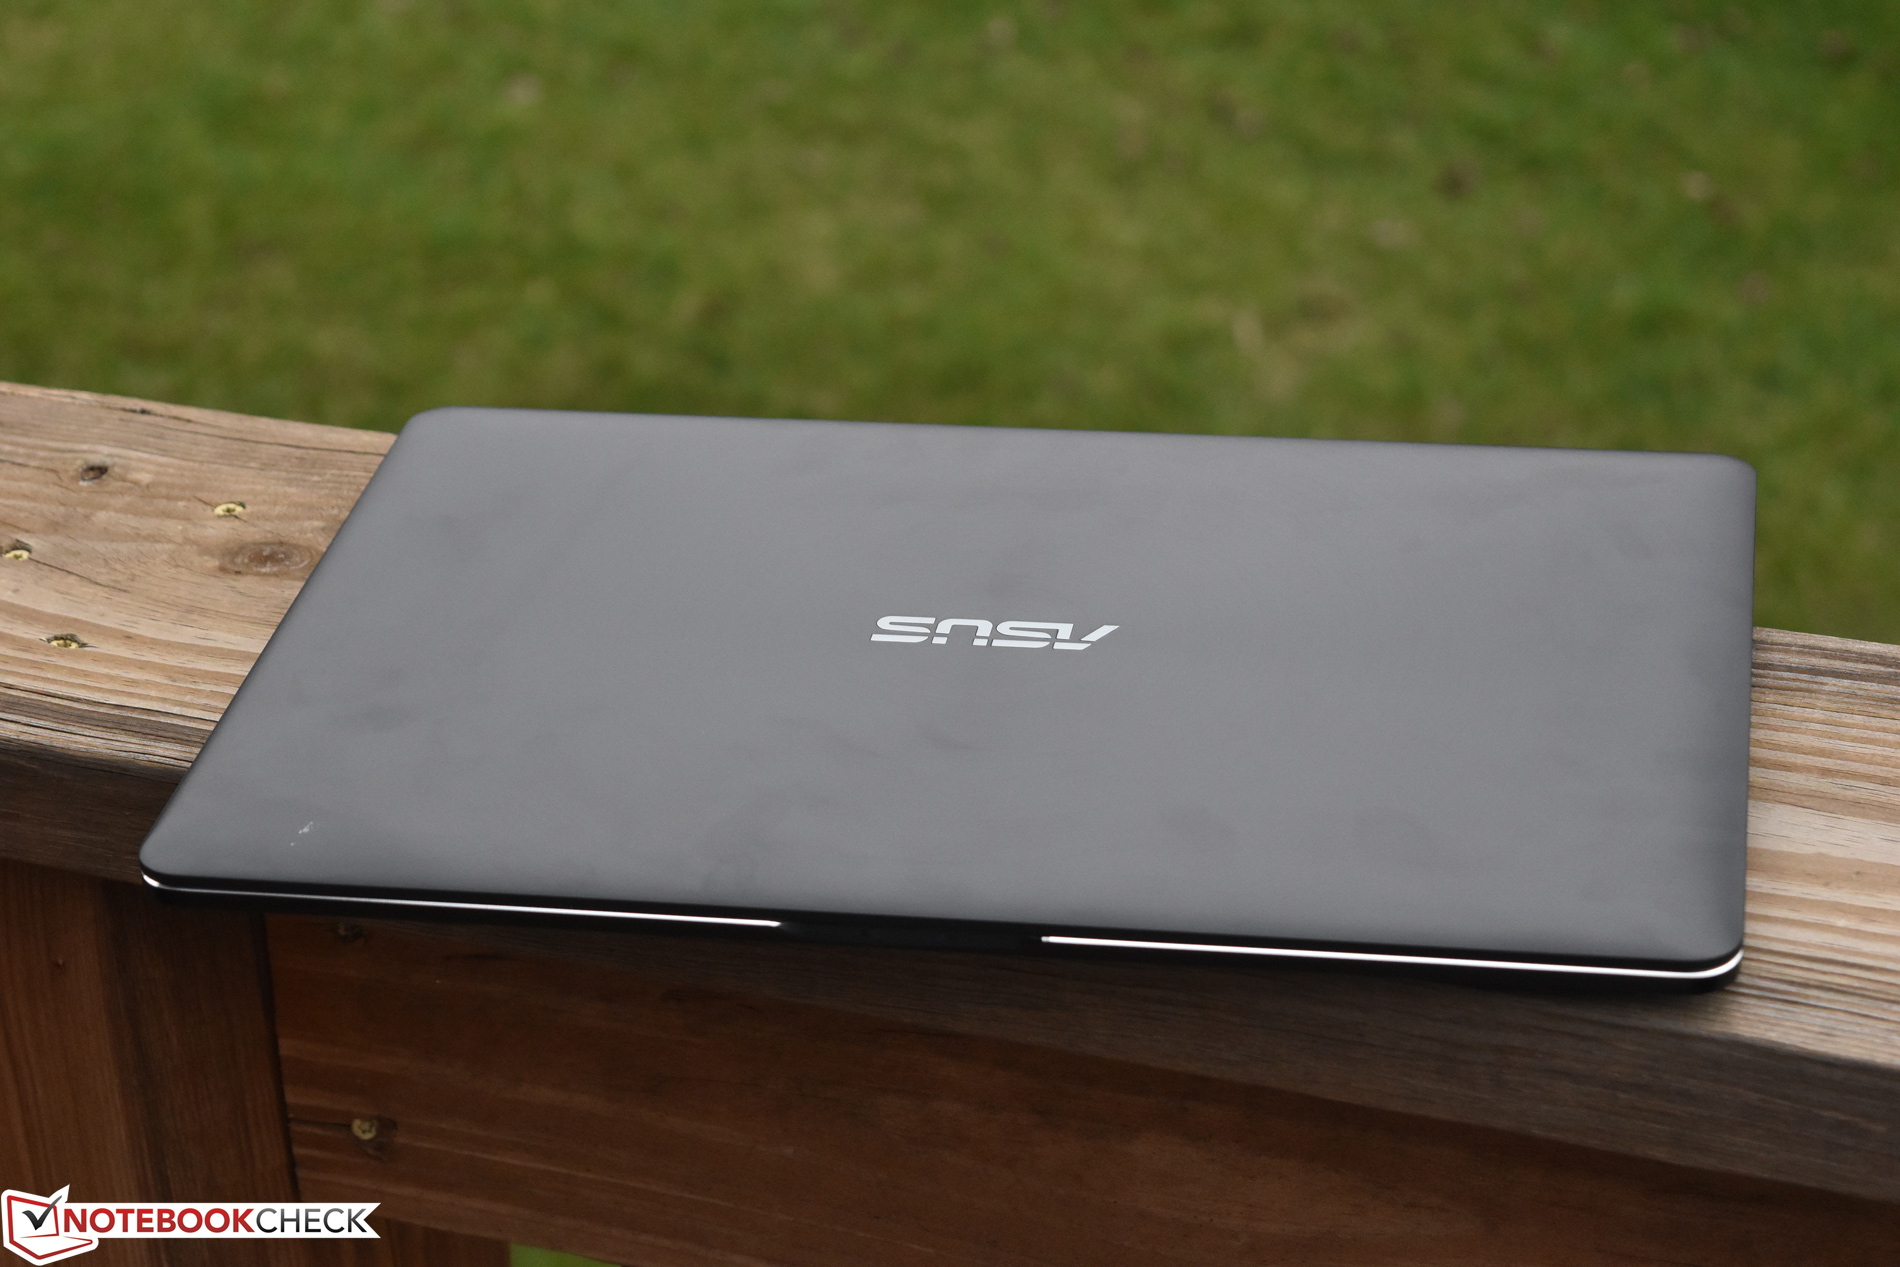
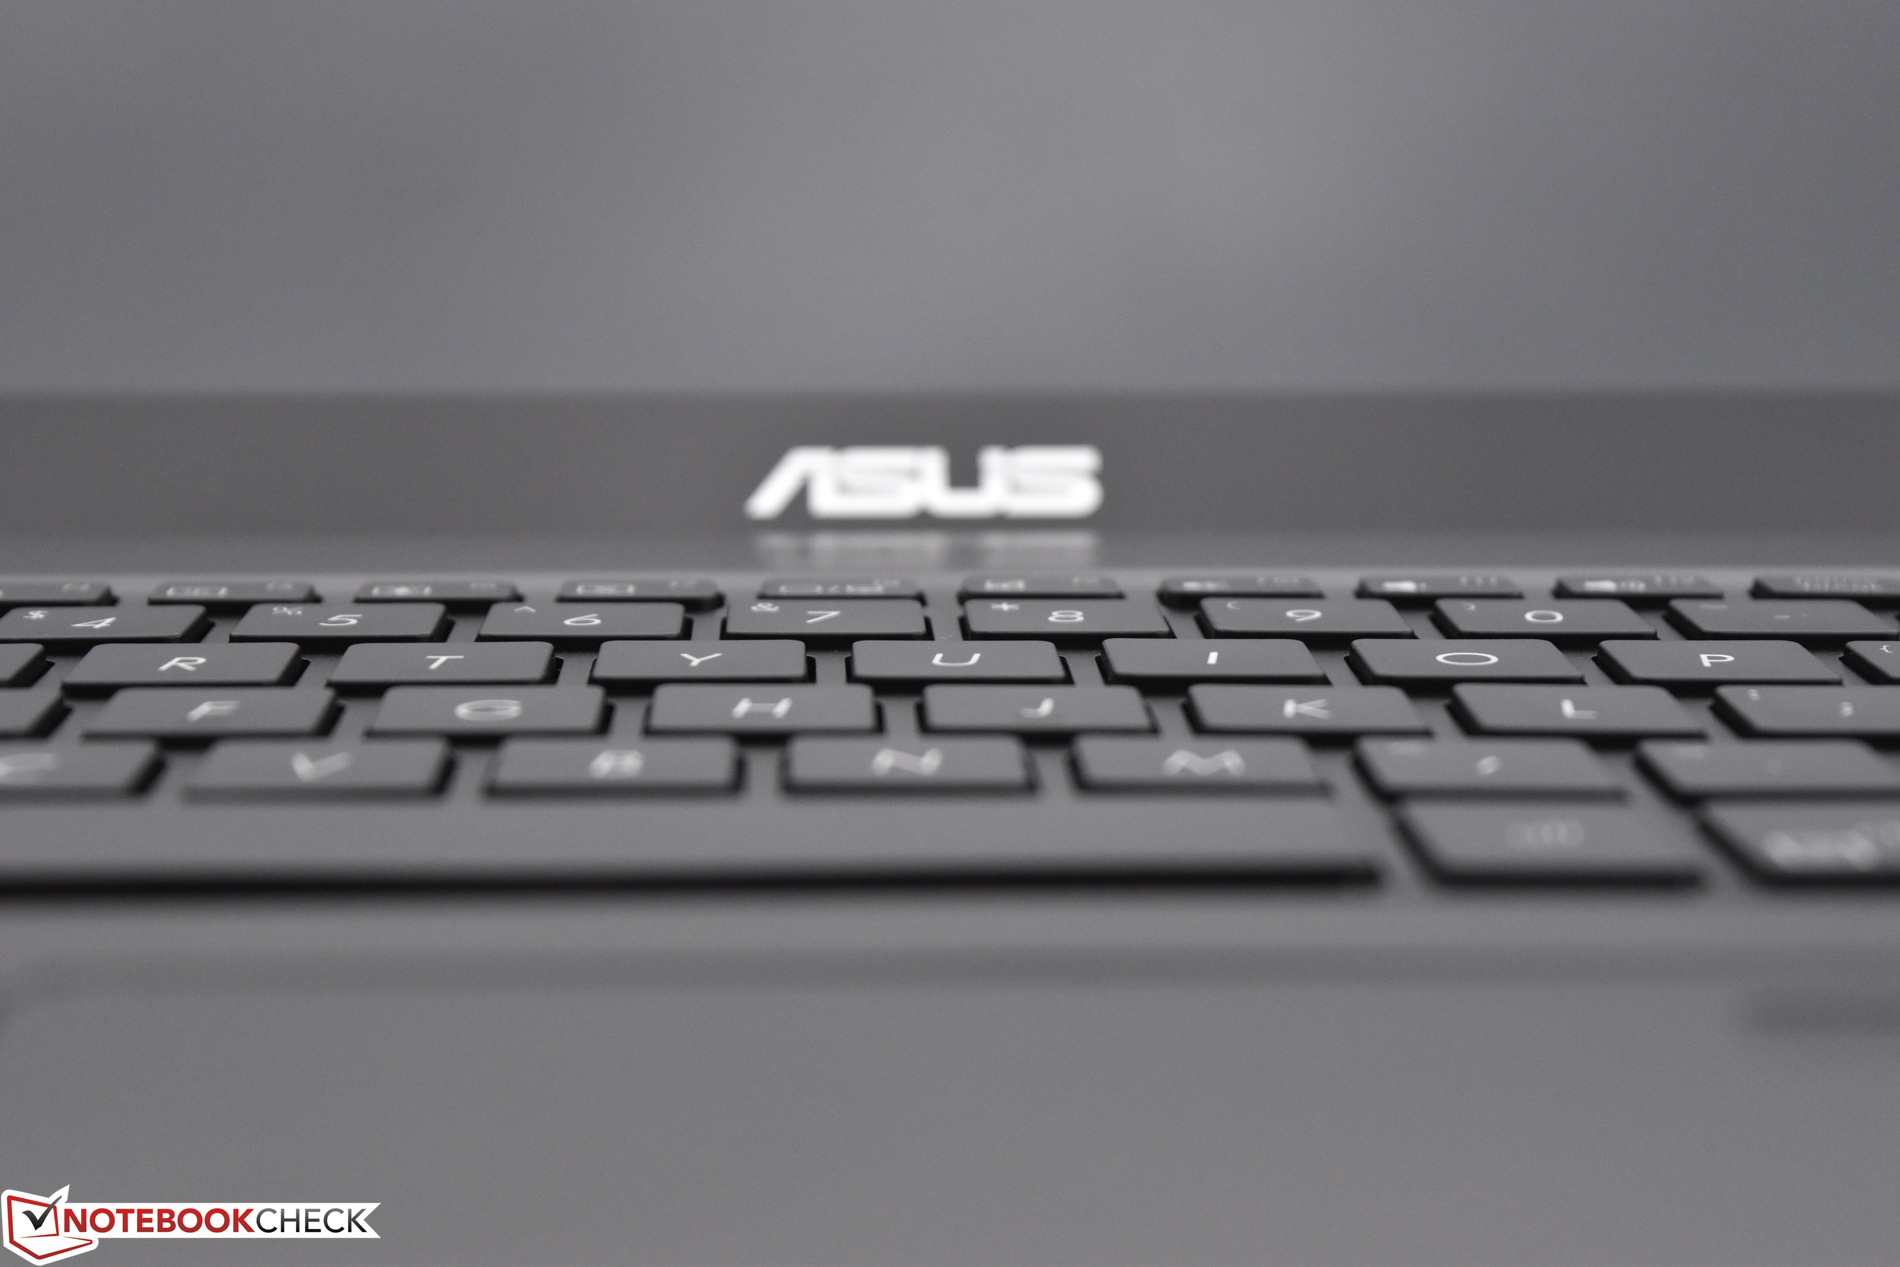
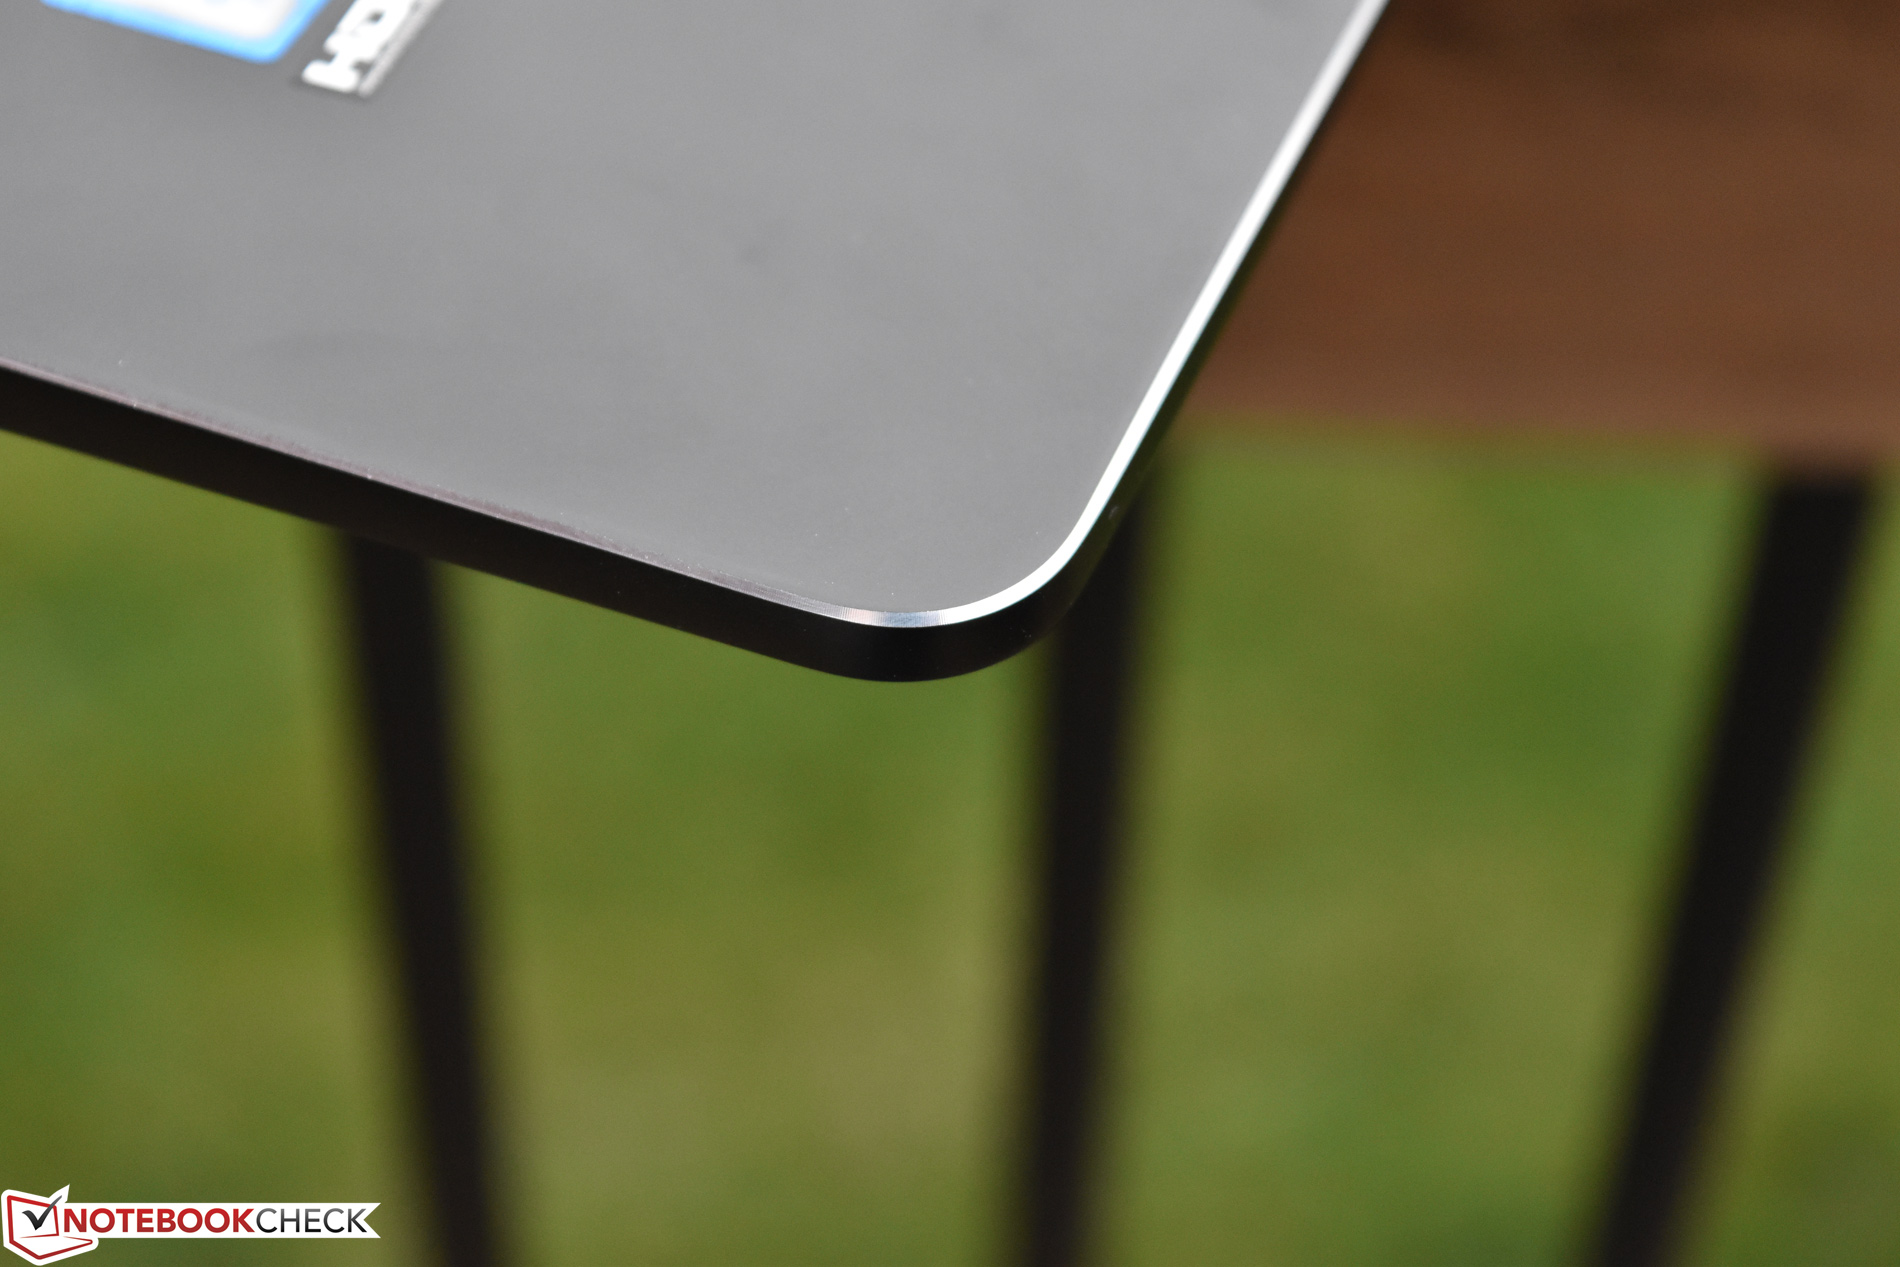
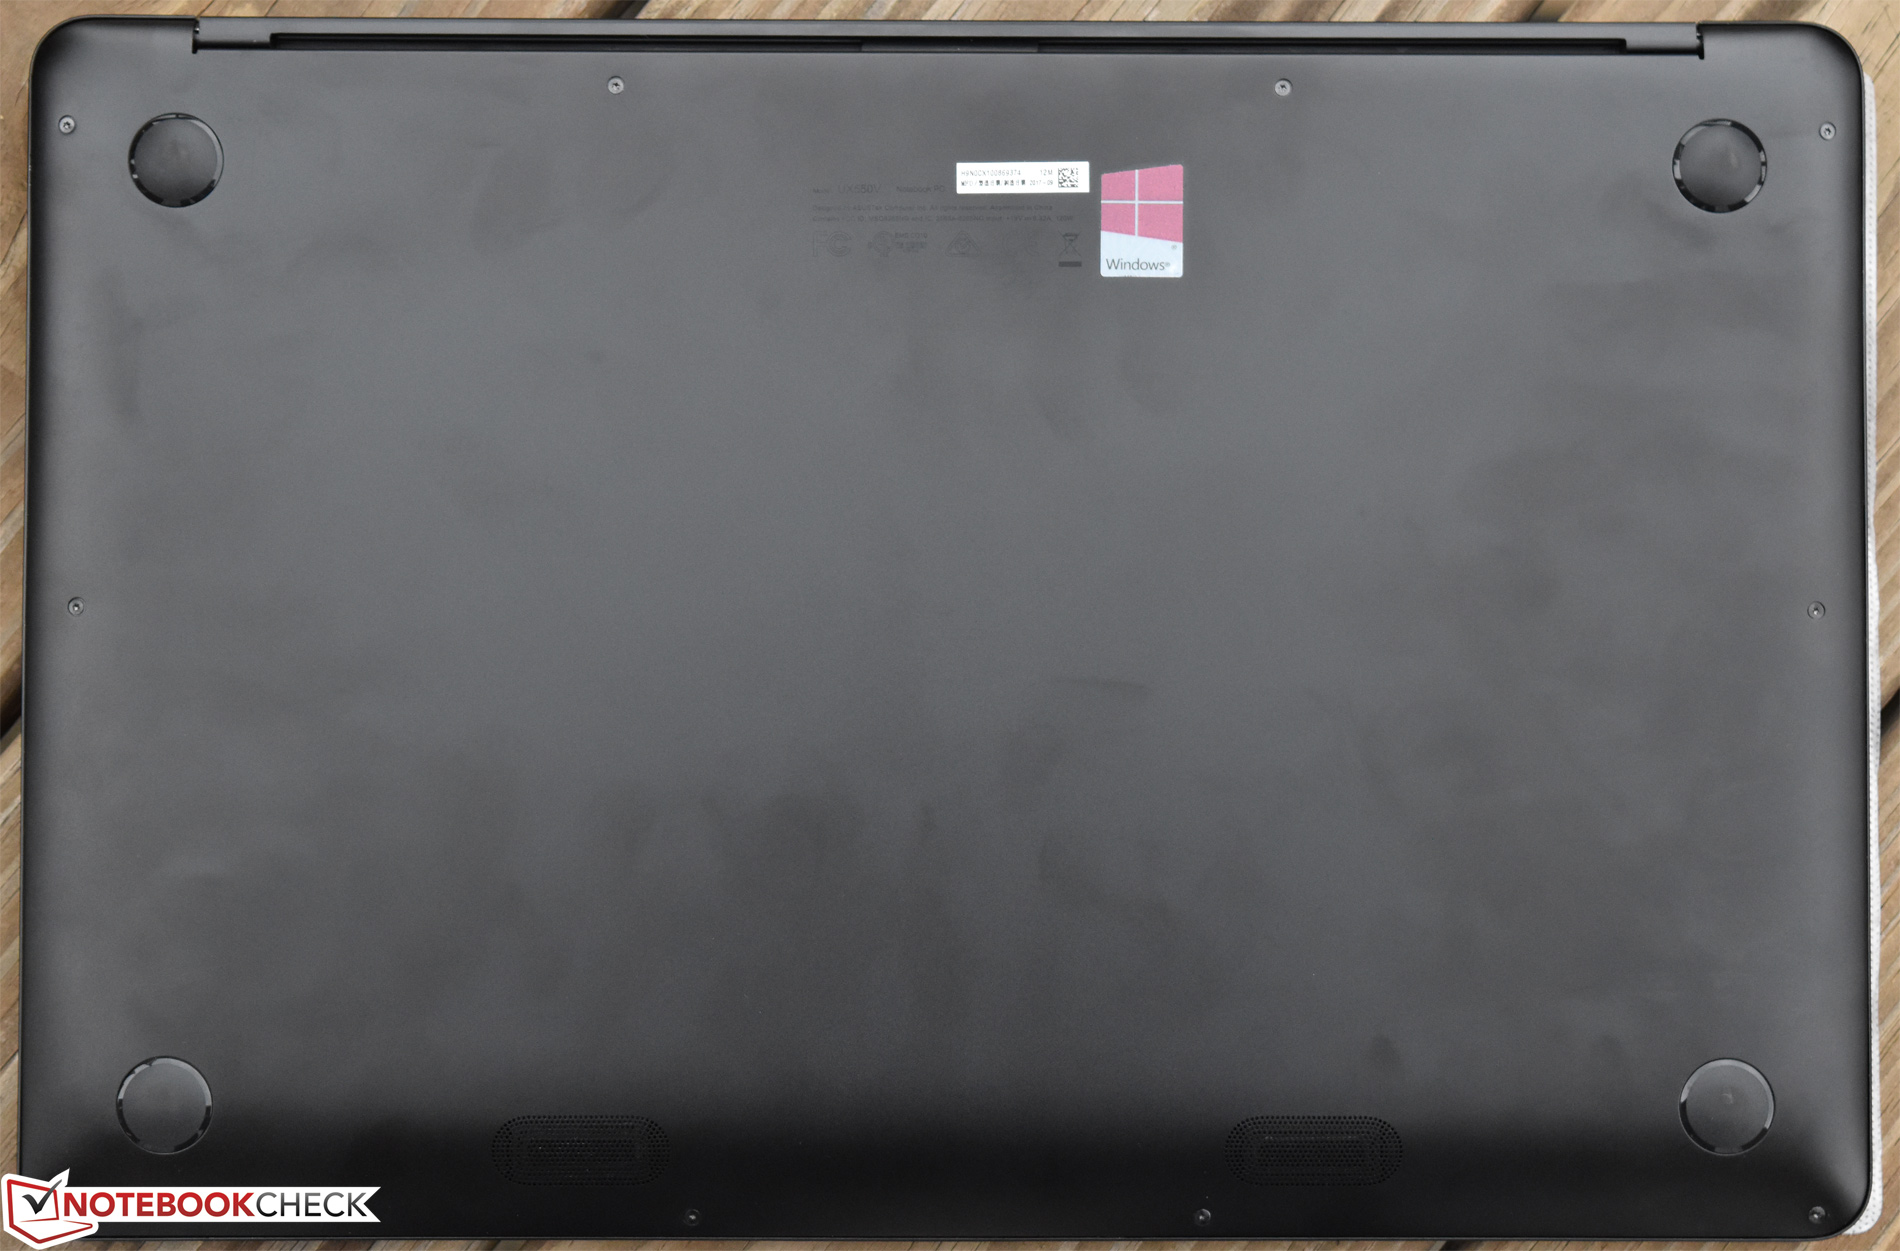
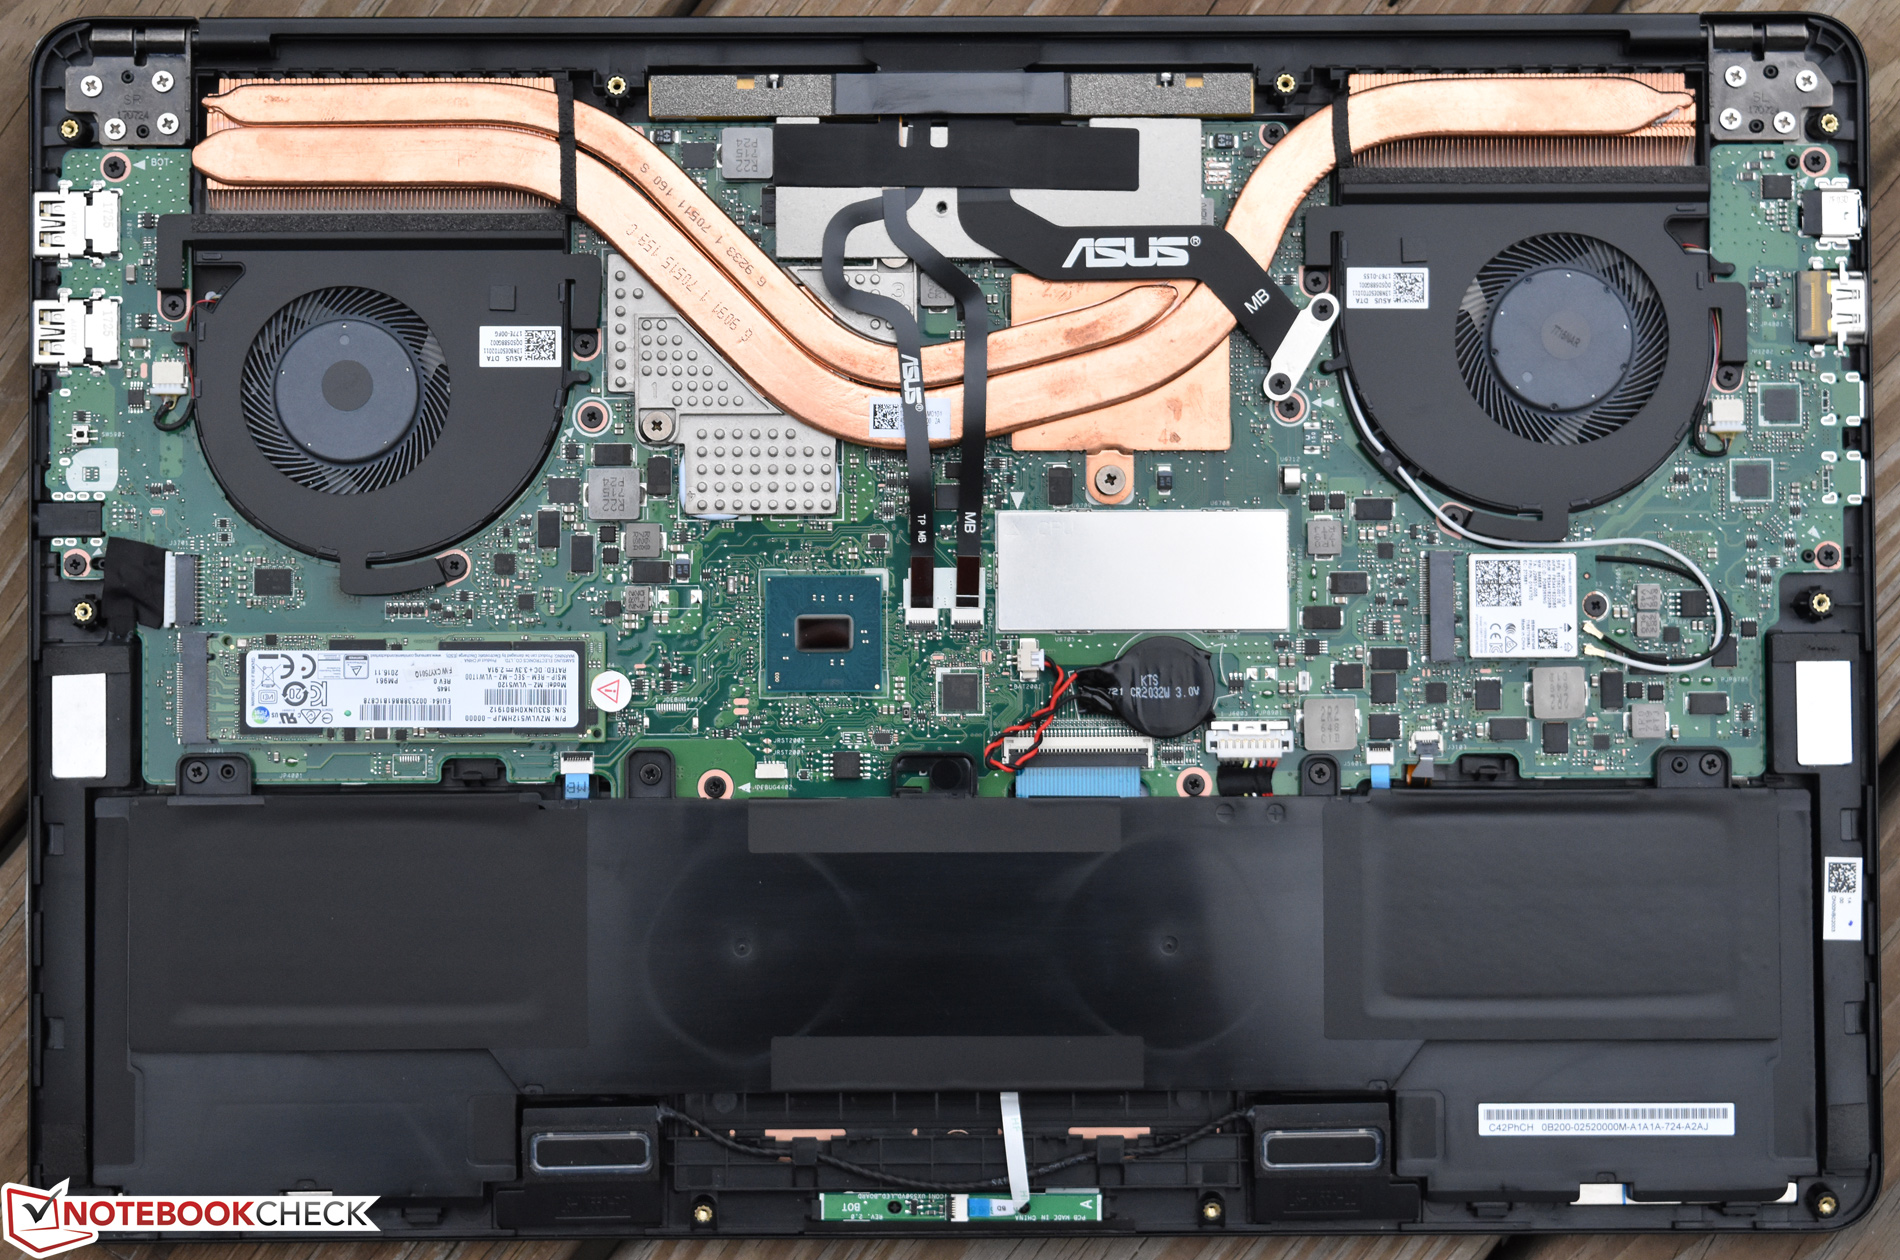
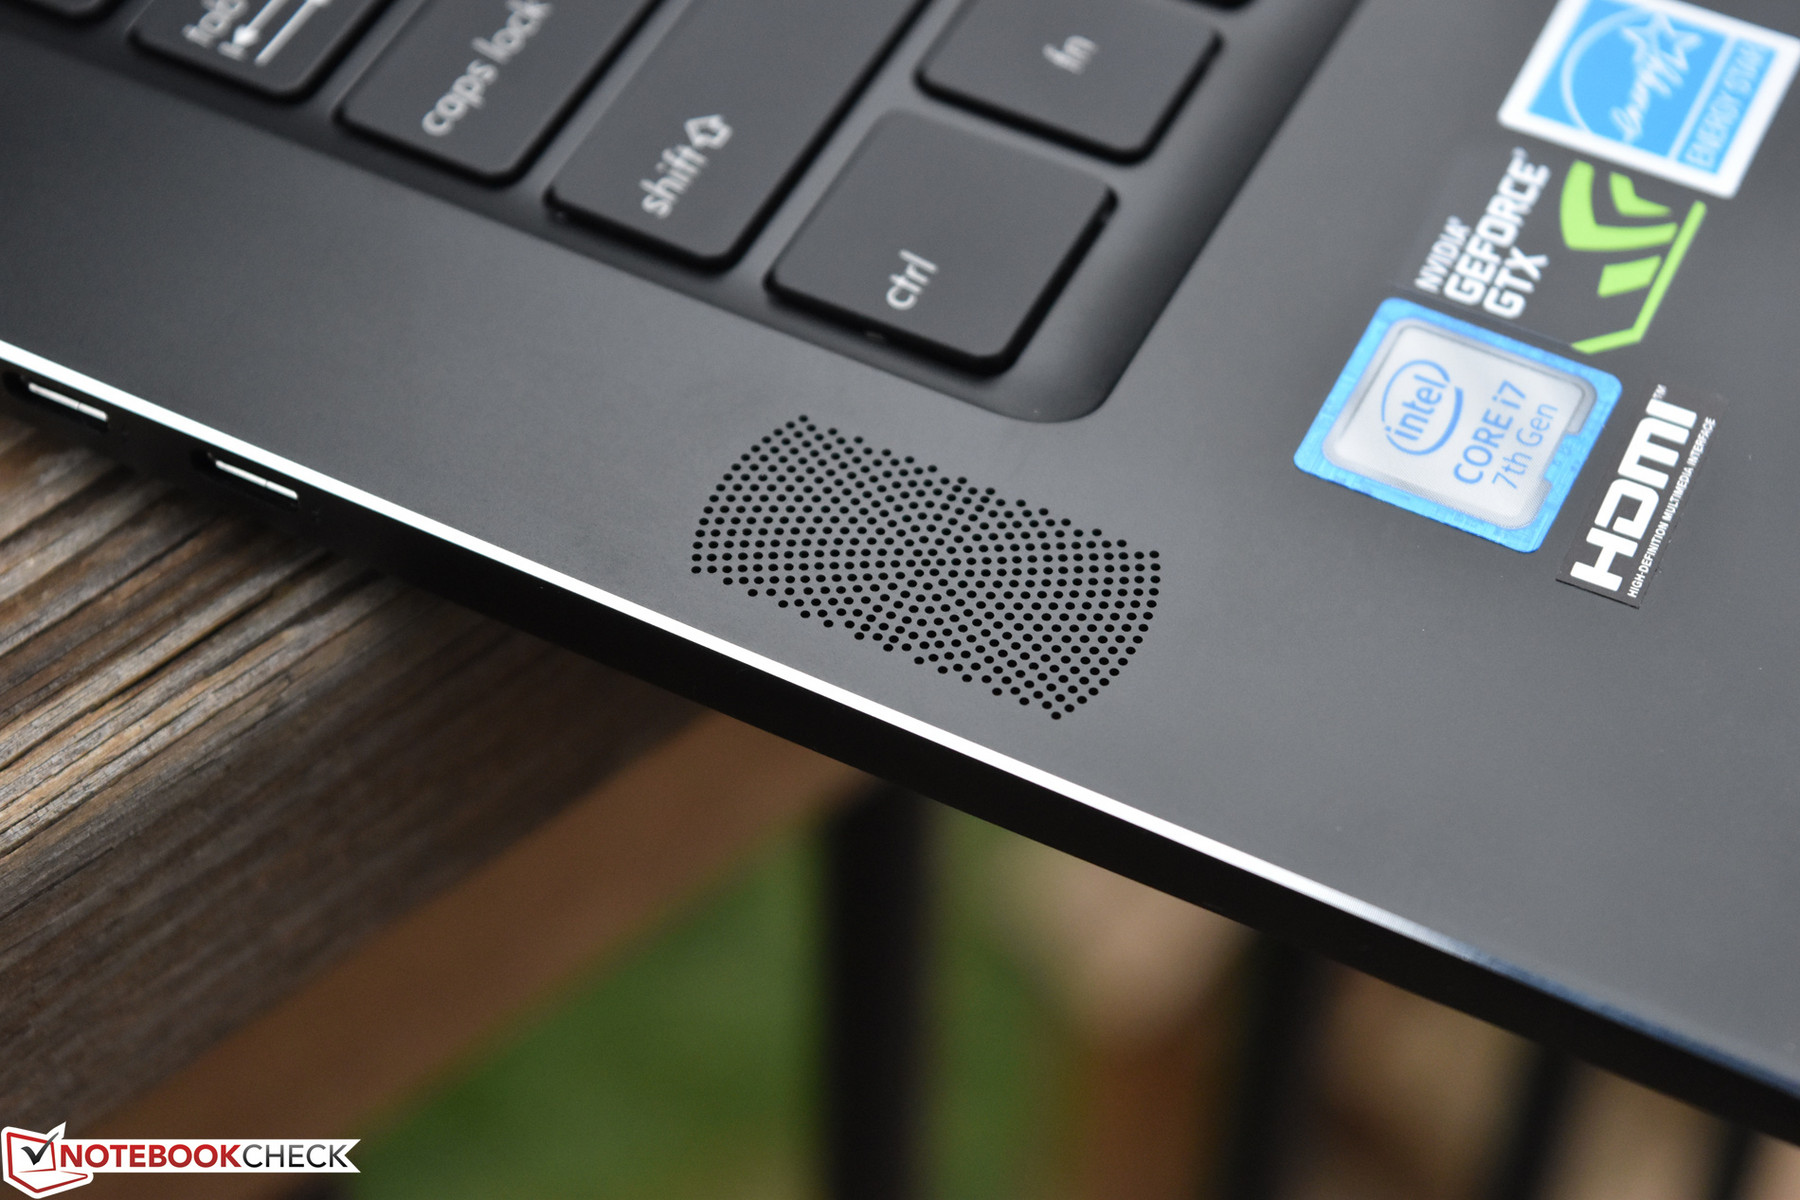
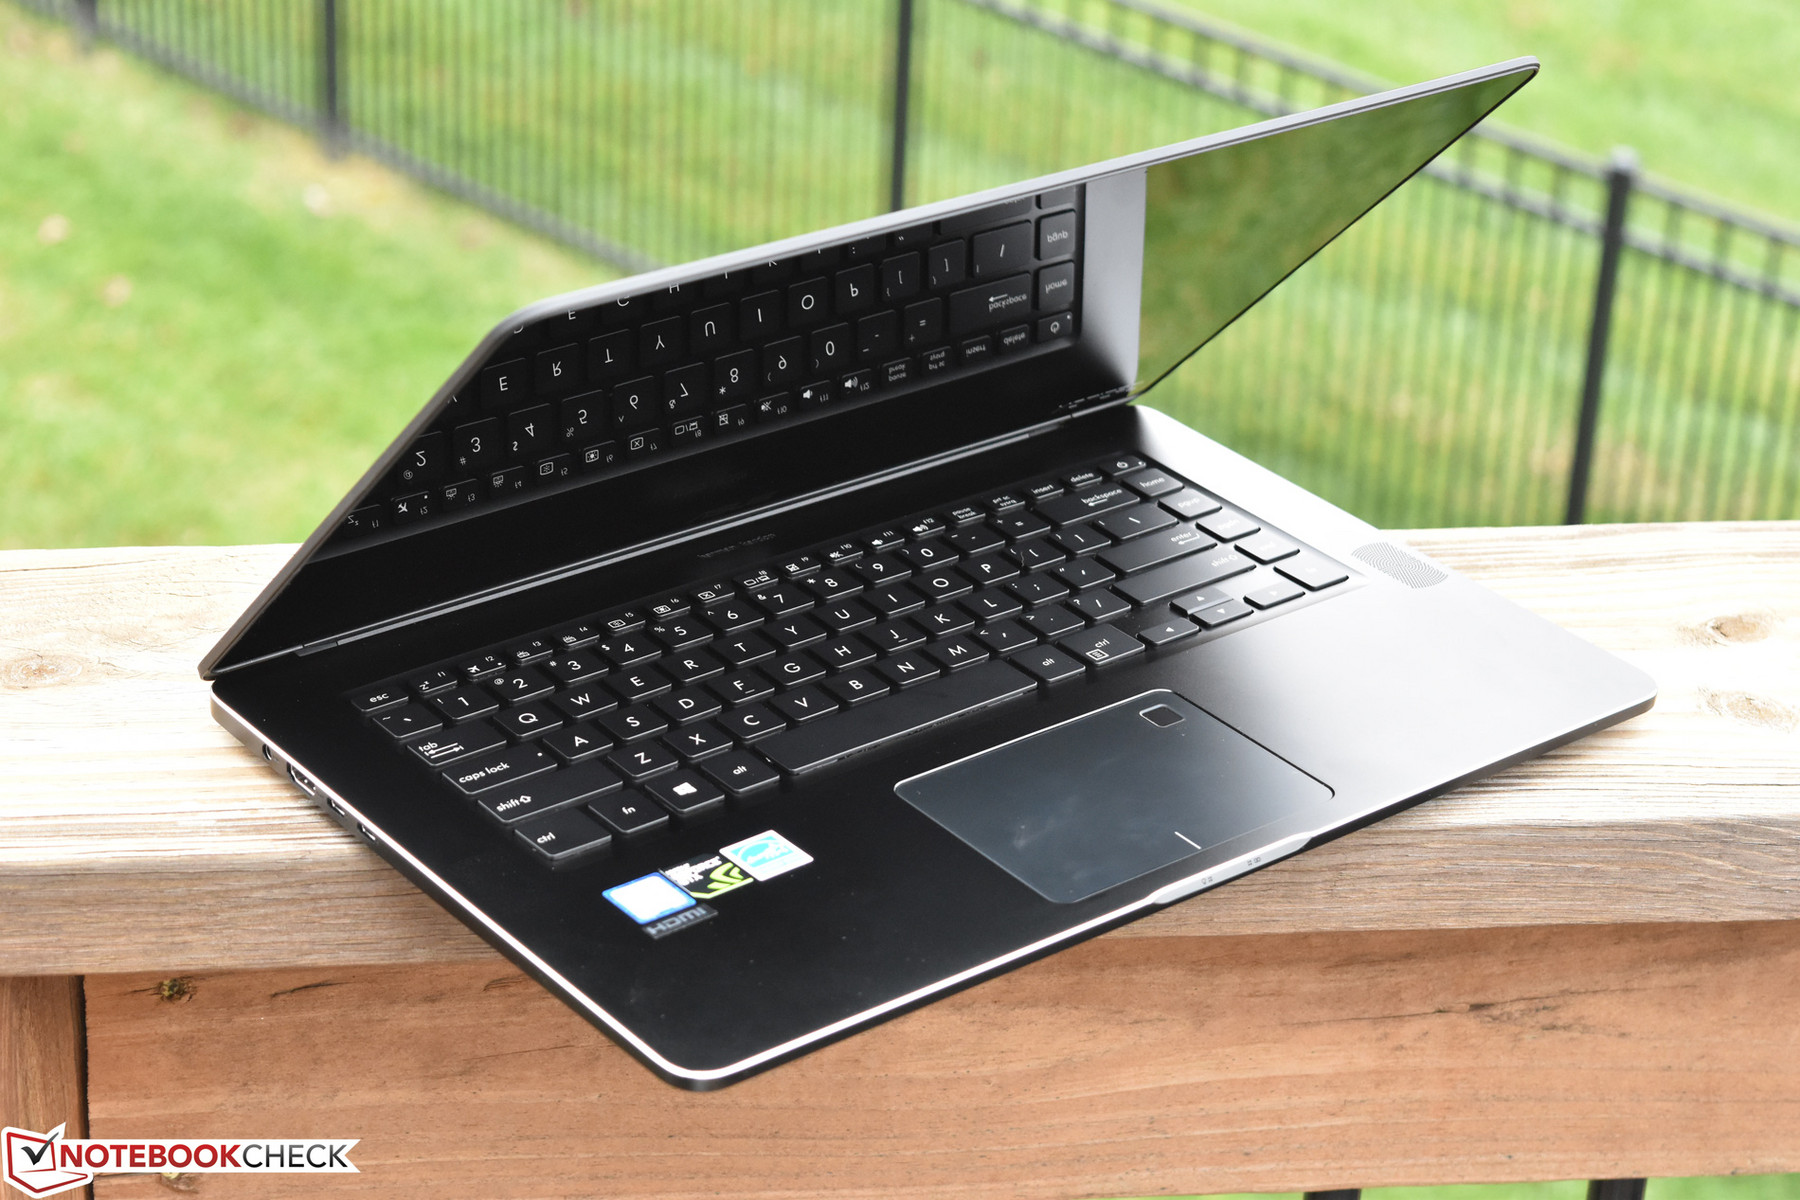
We appreciate the aluminum casing and affiliated high-end aesthetics—but as before, although stability is good around the edges, the center of the base is susceptible to flex under moderate pressure. The display is held in place firmly by the central hinge, but conversely, it’s not possible to open it single-handedly. Fortunately, in spite of its relative thinness, the lid is quite rigid. Maintenance remains relatively easy (with 10 Torx screws securing the bottom panel to the machine), though options once inside are somewhat limited thanks to the soldered RAM and CPU/GPU.
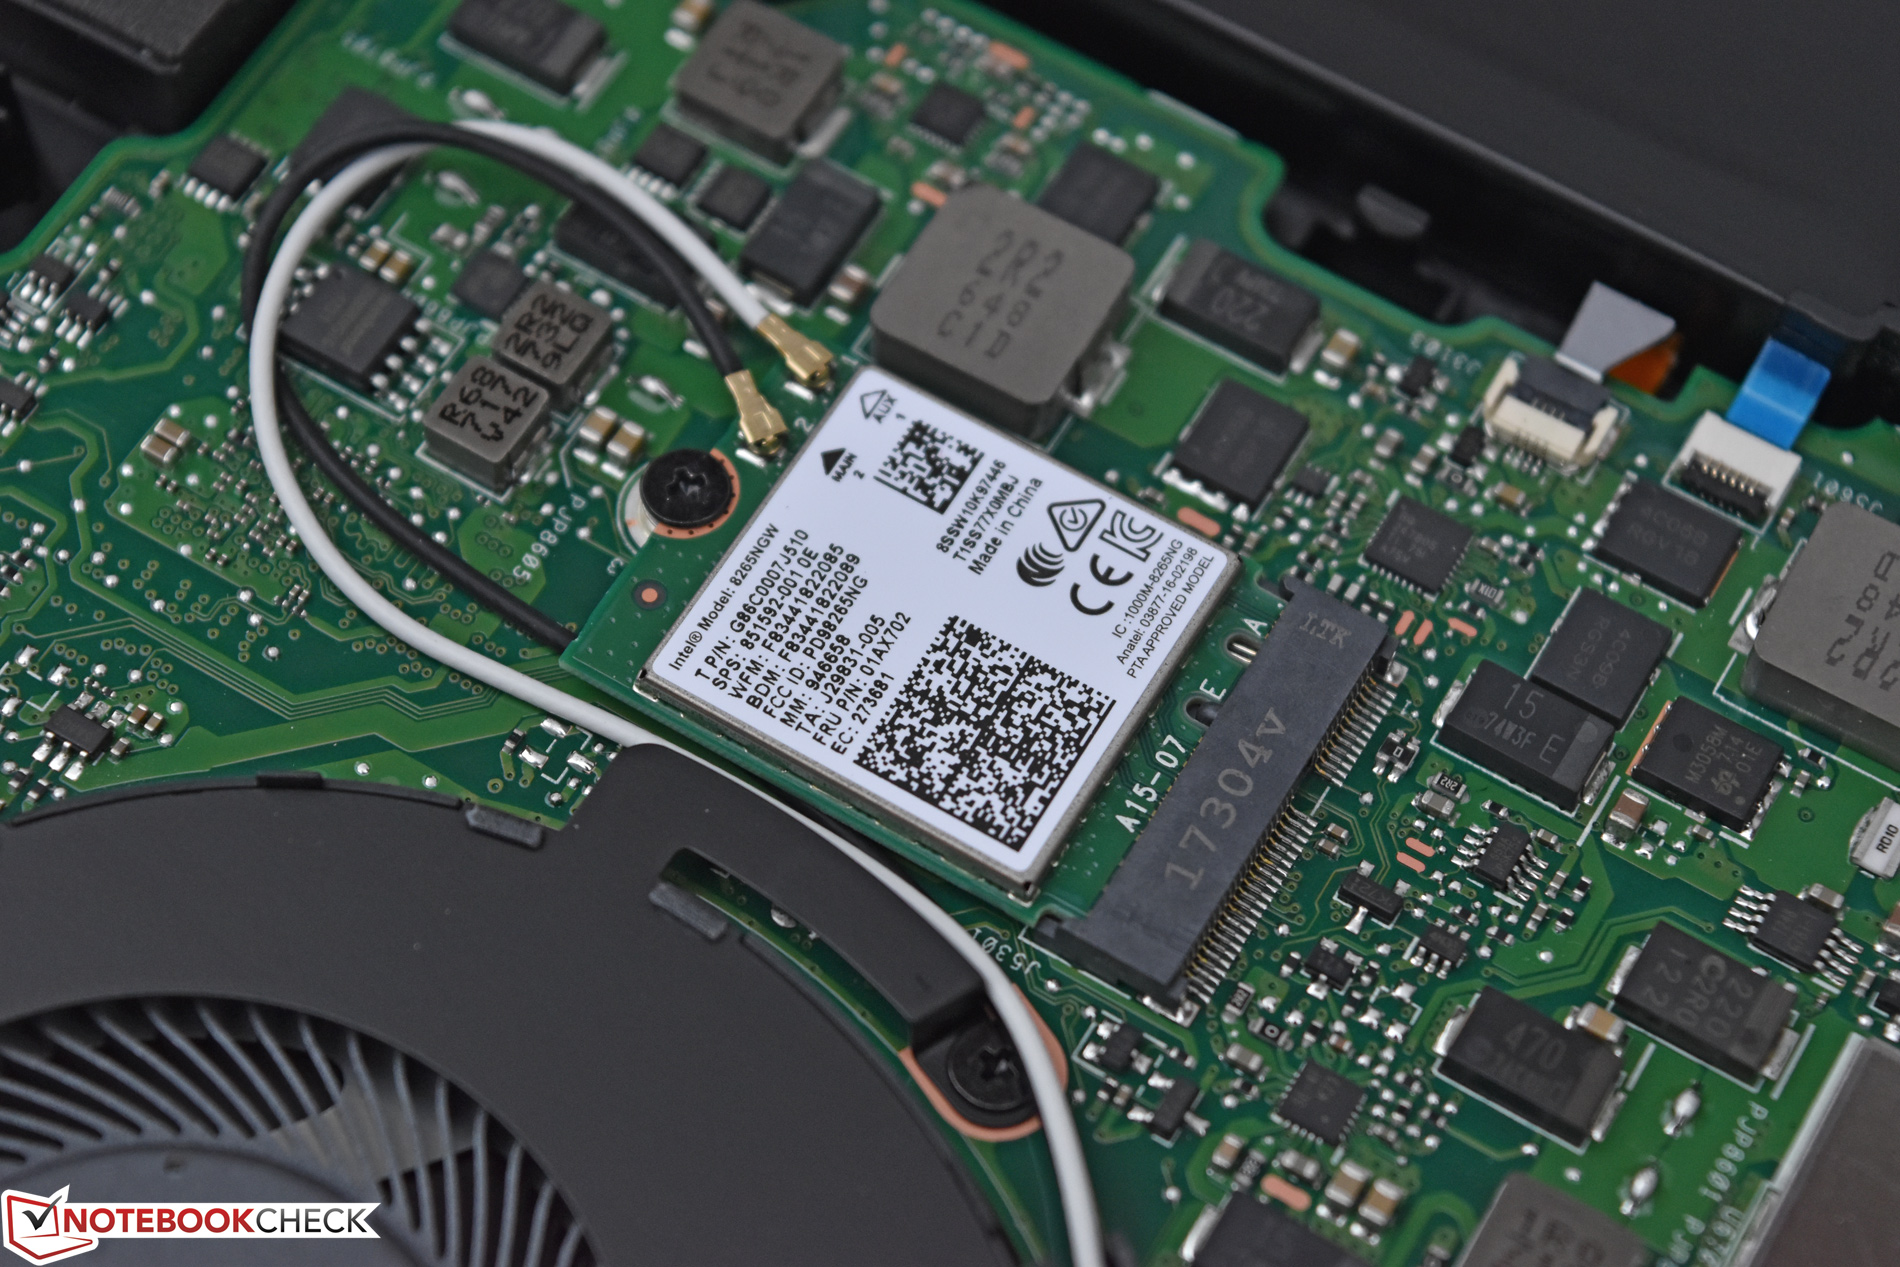
Connectivity is good overall with not one, but two Thunderbolt 3/USB 3.1 Gen 2 Type-C ports, though the lack of a third conventional USB Type-A port will prove inconvenient to some users. As before, SD card reader transfer speeds as well as wireless networking speeds are good overall, but not among the fastest of the notebooks in this category.
| SD Card Reader | |
| average JPG Copy Test (av. of 3 runs) | |
| Microsoft Surface Book 2 | |
| Dell XPS 15 9560 (i7-7700HQ, UHD) | |
| Asus ZenBook Pro UX550VD | |
| Asus Zenbook Pro UX550VE-DB71T | |
| MSI GS63VR 7RF-228US | |
| maximum AS SSD Seq Read Test (1GB) | |
| Dell XPS 15 9560 (i7-7700HQ, UHD) | |
| Microsoft Surface Book 2 | |
| Asus Zenbook Pro UX550VE-DB71T | |
| MSI GS63VR 7RF-228US | |
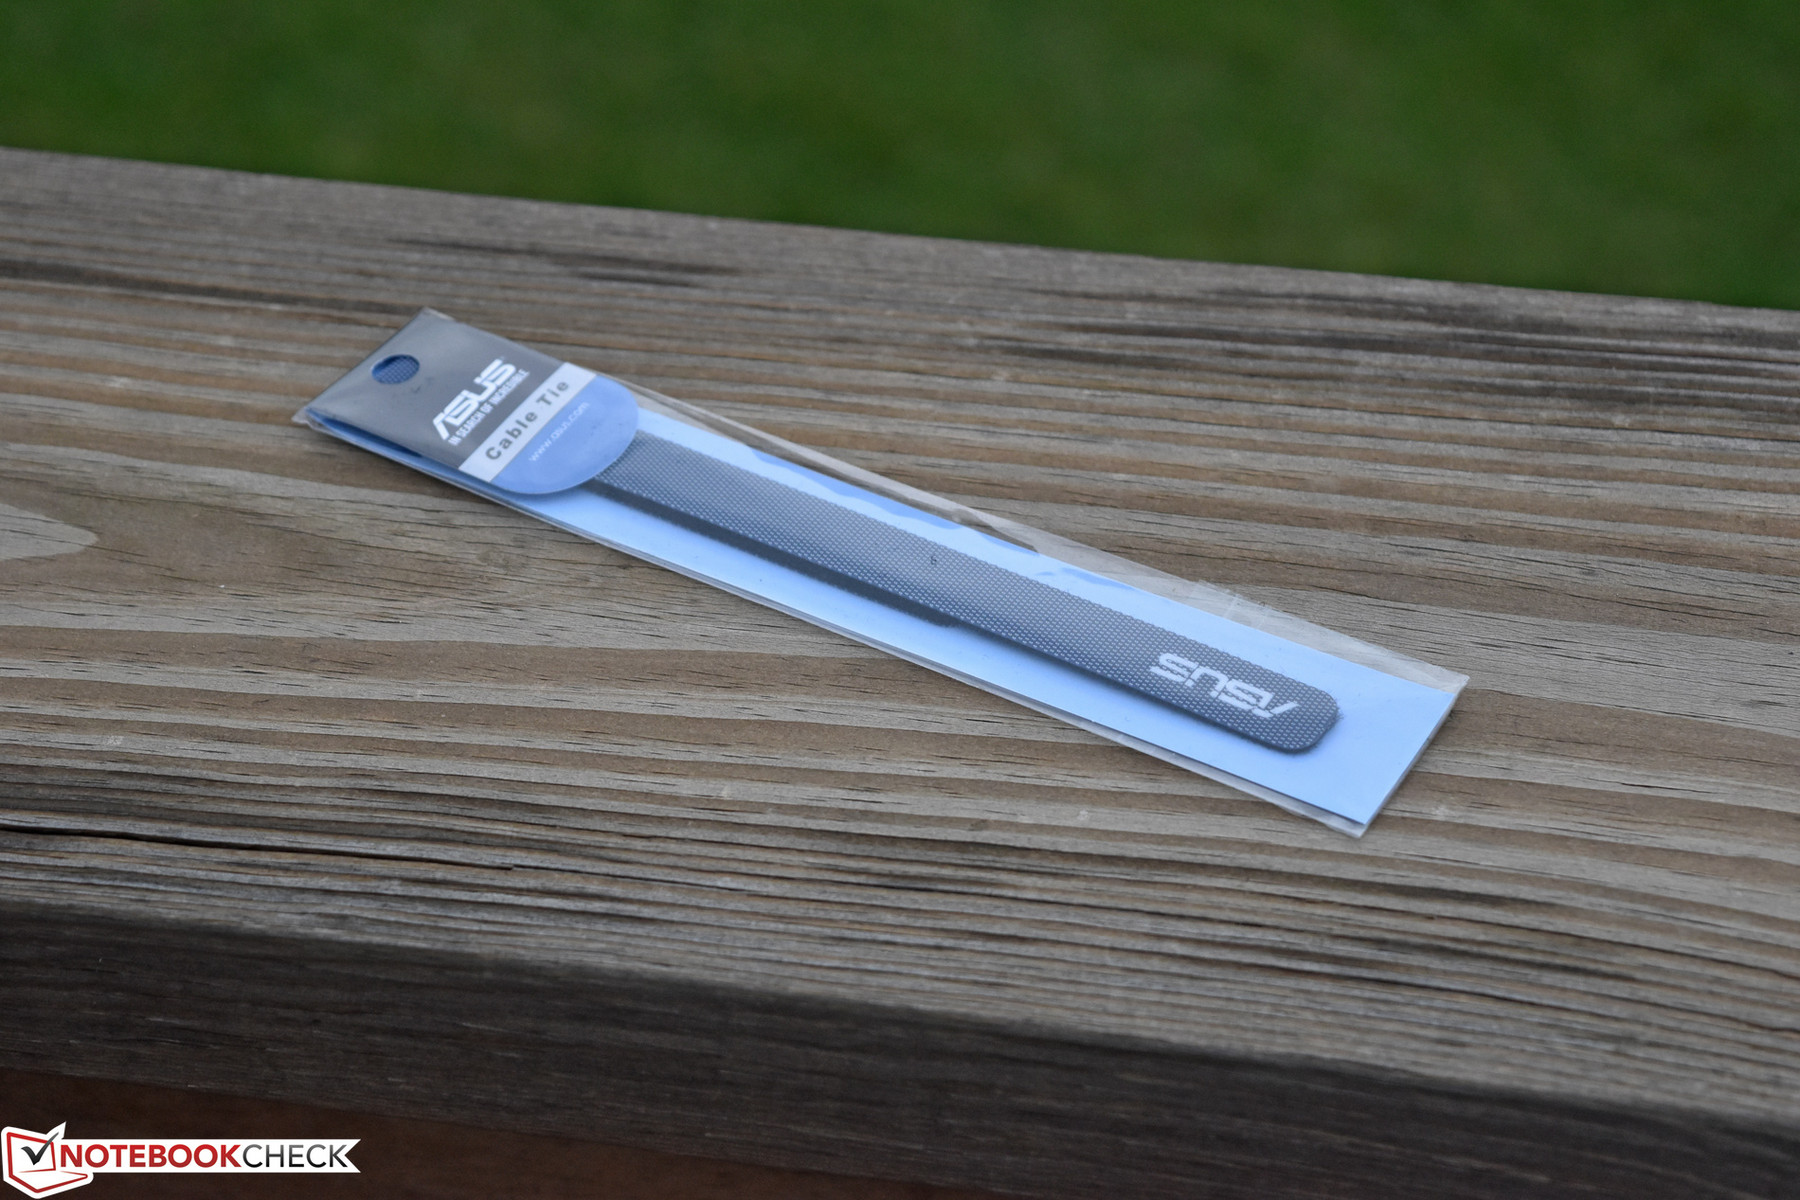
Accessories
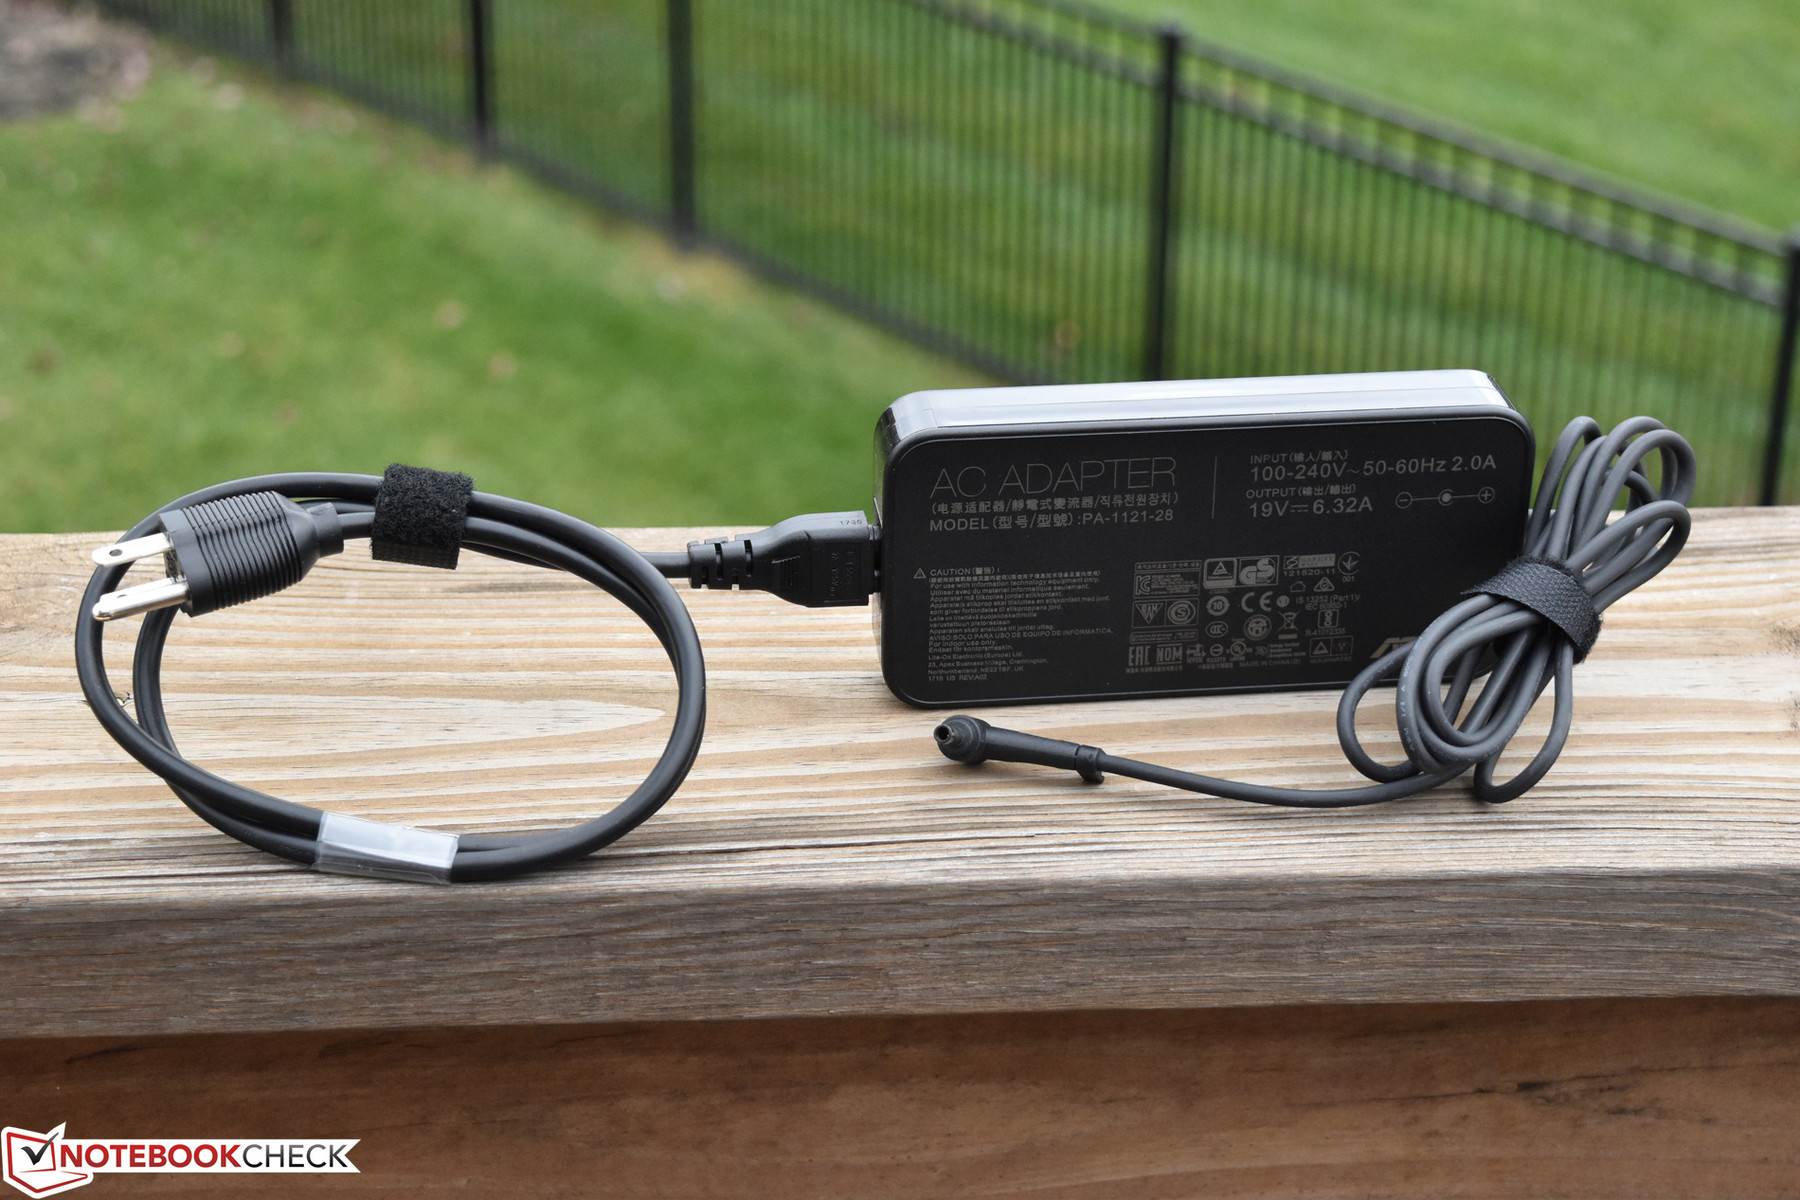
Despite the higher-end GPU in today’s review unit, the included AC adapter remains the same 120 W model we saw previously, weighing in at 580 g. Apart from that, ASUS includes one of their signature cable ties.
Warranty
A 1-year limited global warranty (depot service) is included with the Zenbook Pro UX500VE. Please see our Guarantees, Return Policies and Warranties FAQ for country-specific information.
Display
Whereas our previous Zenbook Pro featured a matte IPS 1080p display, today’s instead includes a glossy touchscreen display. The resolution remains 1920x1080, and it’s still an IPS panel—in fact, the same panel that we evaluated in the previous unit. Colors seems moderately vivid and brightness and contrast make an overall decent impression. The calculated PPI is nothing groundbreaking, but it’s sufficient nonetheless. Backlight bleed is virtually nonexistent on our review unit—just a very small amount on the lower right side of the screen.


| |||||||||||||||||||||||||
Brightness Distribution: 75 %
Center on Battery: 288.2 cd/m²
Contrast: 961:1 (Black: 0.3 cd/m²)
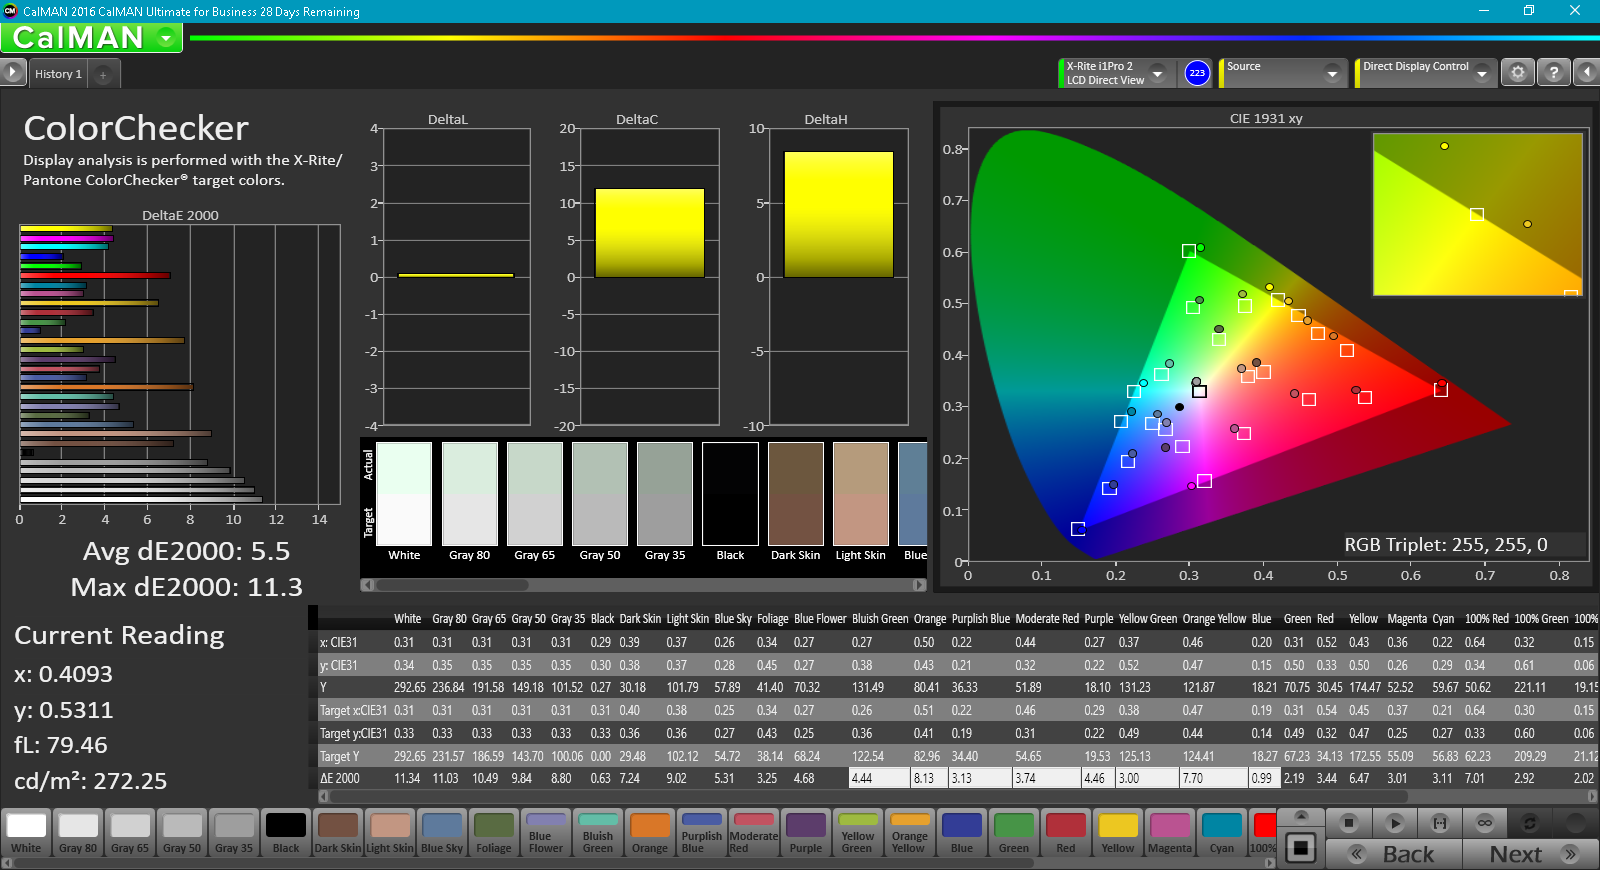
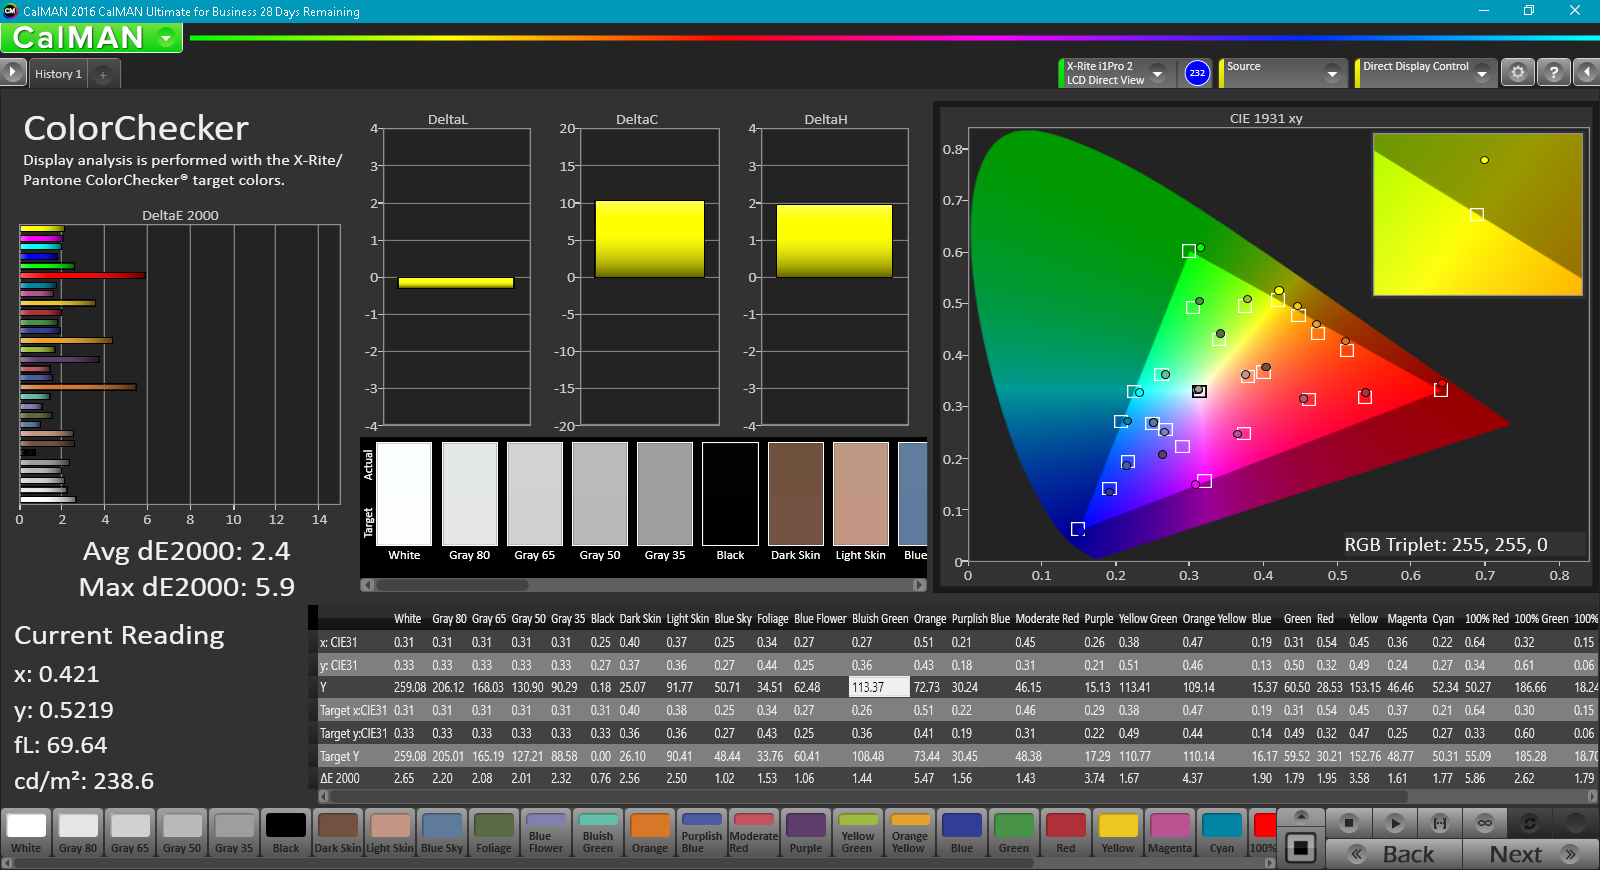
ΔE ColorChecker Calman: 5.5 | ∀{0.5-29.43 Ø4.73}
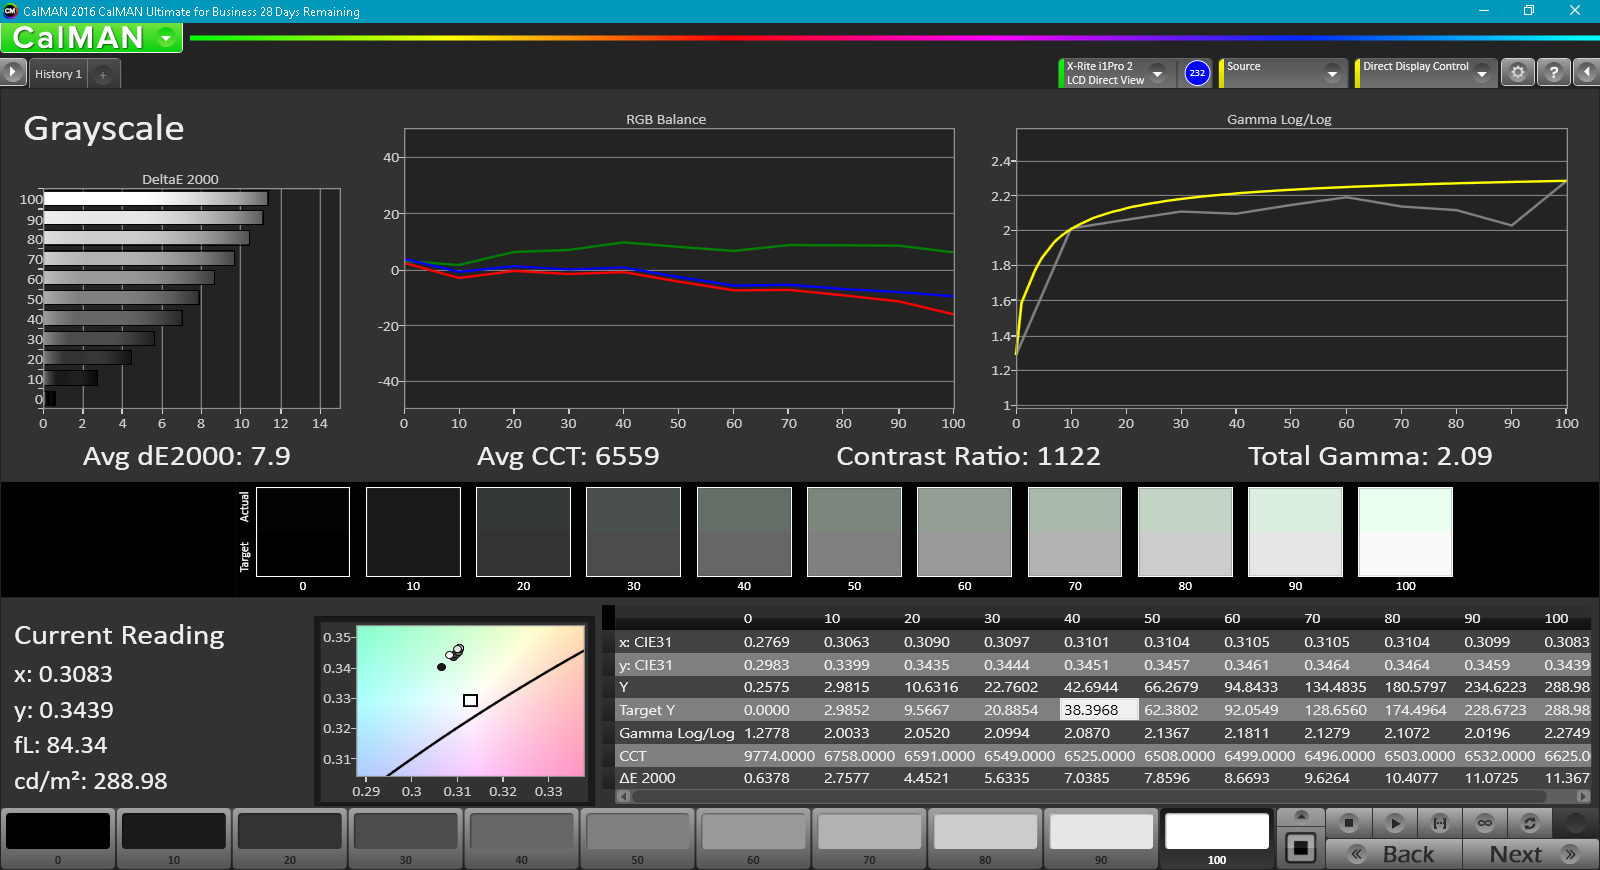
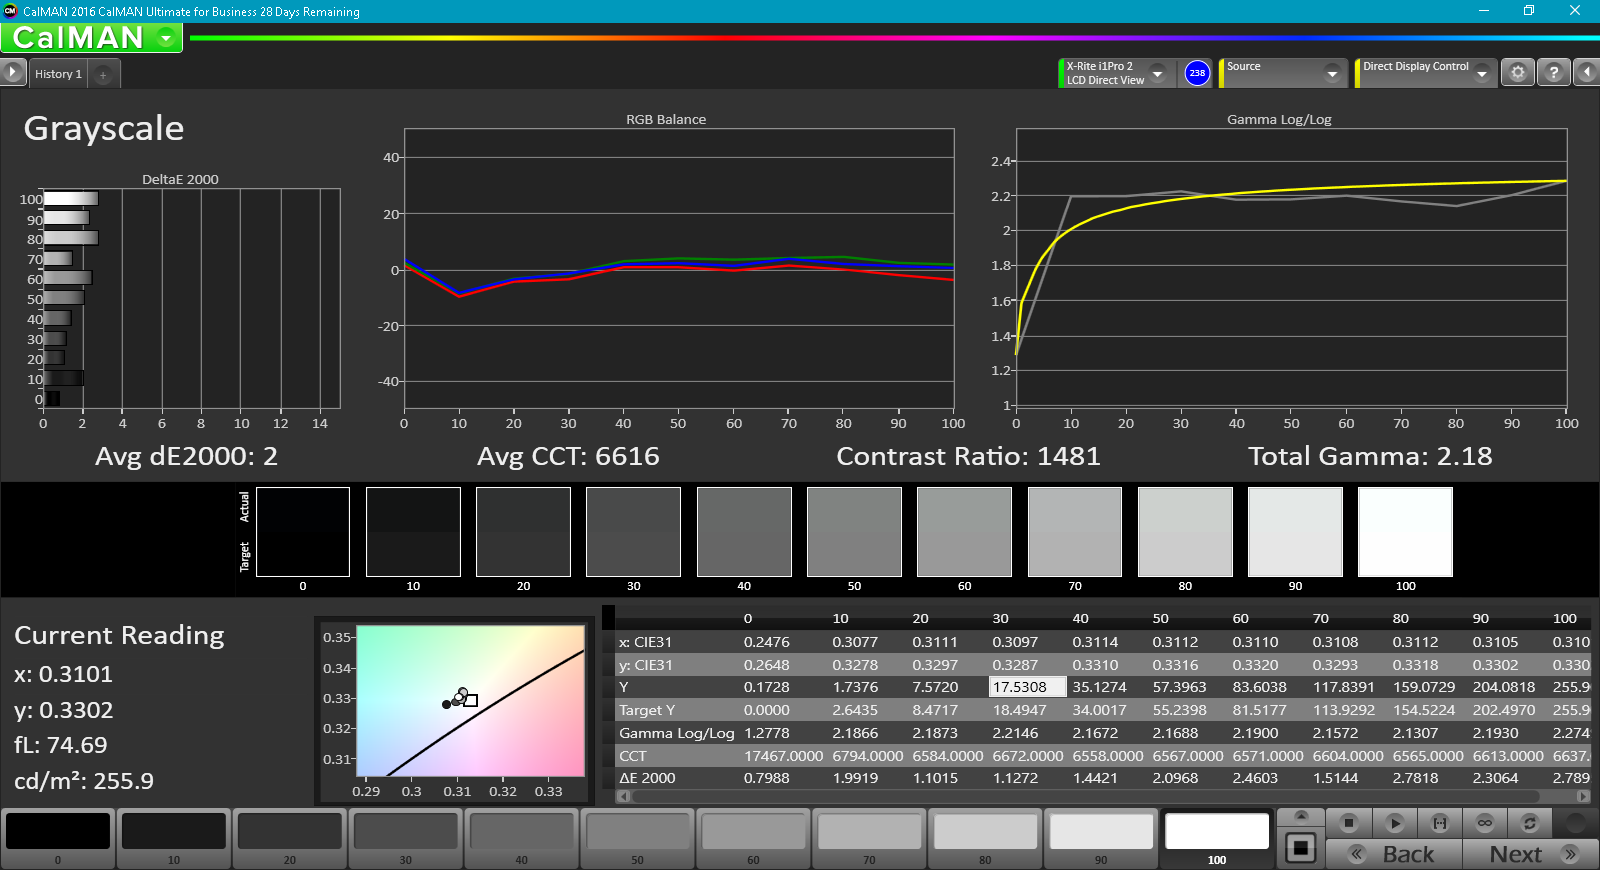
ΔE Greyscale Calman: 7.9 | ∀{0.09-98 Ø4.97}
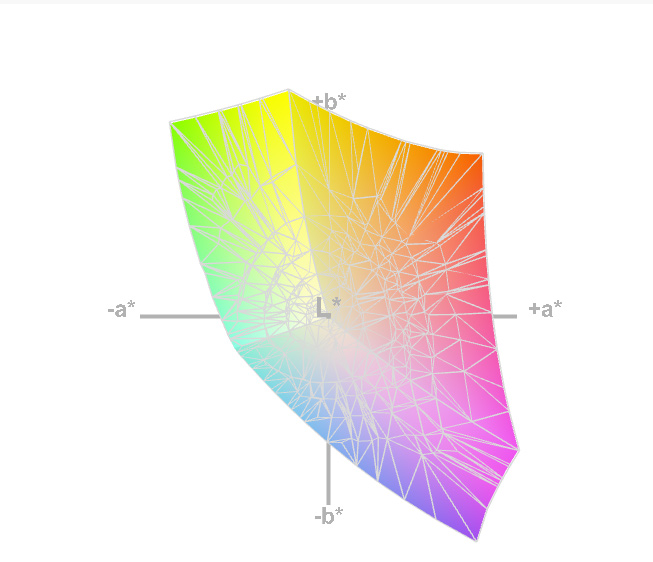
90% sRGB (Argyll 1.6.3 3D)
58.5% AdobeRGB 1998 (Argyll 1.6.3 3D)
65.3% AdobeRGB 1998 (Argyll 3D)
90.4% sRGB (Argyll 3D)
64.3% Display P3 (Argyll 3D)
Gamma: 2.09
CCT: 6559 K
| Asus Zenbook Pro UX550VE-DB71T N156HCE-EN1 (CMN15E8), IPS, 15.6", 1920x1080 | Lenovo Yoga 720-15IKB-80X7 Chi Mei CMN N156HCE-EN1, IPS, 15.6", 1920x1080 | MSI GS63VR 7RF-228US IPS, 15.6", 3840x2160 | Dell XPS 15 9560 (i7-7700HQ, UHD) IGZO IPS, 15.6", 3840x2160 | Microsoft Surface Book 2 Panasonic MEI96A2 , IPS, 13.5", 3000x2000 | |
|---|---|---|---|---|---|
| Display | 1% | -23% | 35% | 6% | |
| Display P3 Coverage (%) | 64.3 | 65 1% | 48.21 -25% | 89.7 40% | 67.9 6% |
| sRGB Coverage (%) | 90.4 | 90.8 0% | 72.6 -20% | 100 11% | 95.7 6% |
| AdobeRGB 1998 Coverage (%) | 65.3 | 65.8 1% | 49.81 -24% | 100 53% | 69.4 6% |
| Response Times | 26% | 32% | -26% | -7% | |
| Response Time Grey 50% / Grey 80% * (ms) | 43.2 ? | 29.6 ? 31% | 28 ? 35% | 57.2 ? -32% | 52.8 ? -22% |
| Response Time Black / White * (ms) | 32.8 ? | 26.4 ? 20% | 23.6 ? 28% | 39.2 ? -20% | 30 ? 9% |
| PWM Frequency (Hz) | 25510 ? | 25510 ? | 1351 ? | 962 | |
| Screen | 12% | -20% | 18% | 44% | |
| Brightness middle (cd/m²) | 288.2 | 300.9 4% | 274.2 -5% | 370.1 28% | 385 34% |
| Brightness (cd/m²) | 266 | 285 7% | 263 -1% | 356 34% | 372 40% |
| Brightness Distribution (%) | 75 | 92 23% | 92 23% | 87 16% | 89 19% |
| Black Level * (cd/m²) | 0.3 | 0.24 20% | 0.44 -47% | 0.37 -23% | 0.21 30% |
| Contrast (:1) | 961 | 1254 30% | 623 -35% | 1000 4% | 1833 91% |
| Colorchecker dE 2000 * | 5.5 | 5 9% | 8 -45% | 5.3 4% | 1.6 71% |
| Colorchecker dE 2000 max. * | 11.3 | 10.2 10% | 14.6 -29% | 9.9 12% | 4.5 60% |
| Greyscale dE 2000 * | 7.9 | 7 11% | 9.1 -15% | 4.6 42% | 1.5 81% |
| Gamma | 2.09 105% | 2.34 94% | 2.24 98% | 2.31 95% | 2.22 99% |
| CCT | 6559 99% | 6578 99% | 5020 129% | 6284 103% | 6502 100% |
| Color Space (Percent of AdobeRGB 1998) (%) | 58.5 | 59 1% | 45.7 -22% | 88.3 51% | 64 9% |
| Color Space (Percent of sRGB) (%) | 90 | 90 0% | 72.1 -20% | 100 11% | 95.9 7% |
| Total Average (Program / Settings) | 13% /
11% | -4% /
-13% | 9% /
15% | 14% /
30% |
* ... smaller is better
We measured an average brightness of 266 cd/m², which is decent, as well as a brightness distribution of 75%, which is merely average. The lower quadrants of the display in our measurements were quite a bit dimmer than the top quadrants, but as usual, in daily use, it’s difficult to notice the difference. The contrast ratio of 961:1 is more positive, as is the corresponding low black value of just 0.3 cd/m².
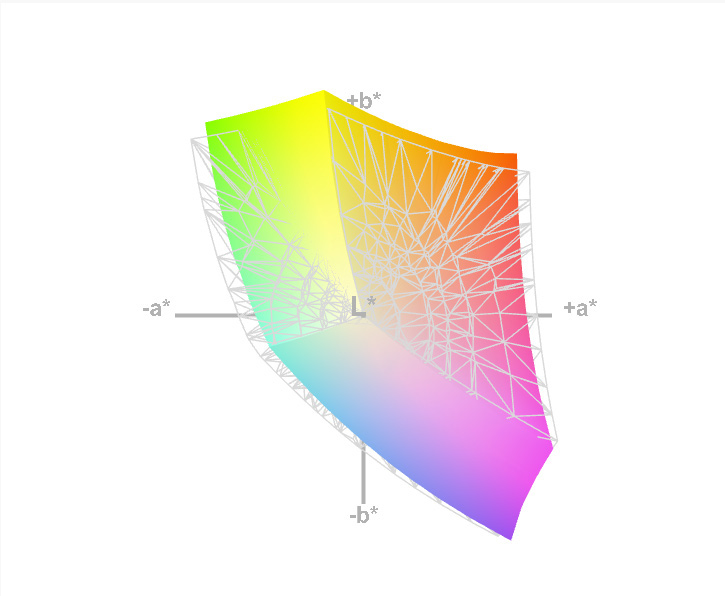
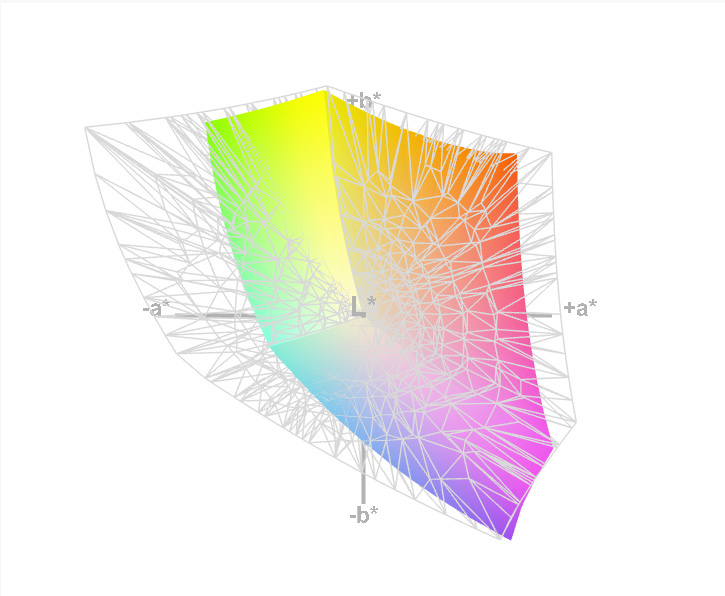
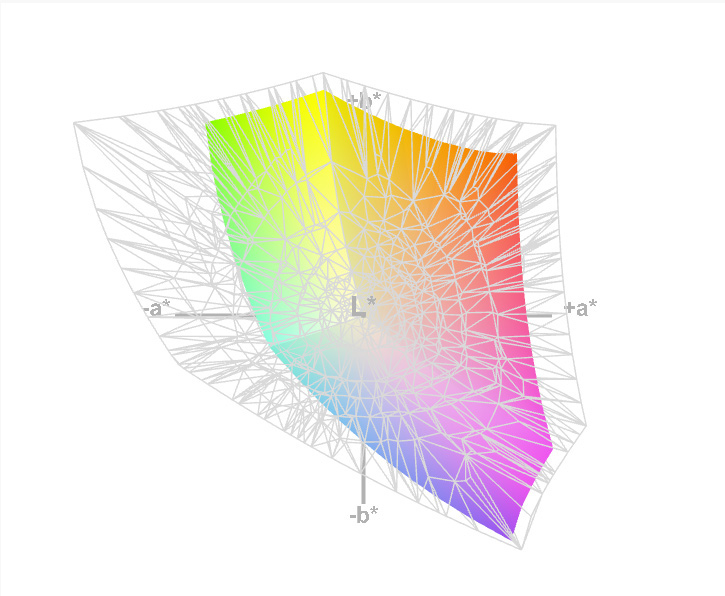
The display can reproduce around 90 percent of the sRGB color spectrum and roughly 58.5 percent of AdobeRGB. This isn’t a bad result for general use, though it’s a far cry from the Dell XPS 15’s excellent 100/88.3 percent in those same categories.
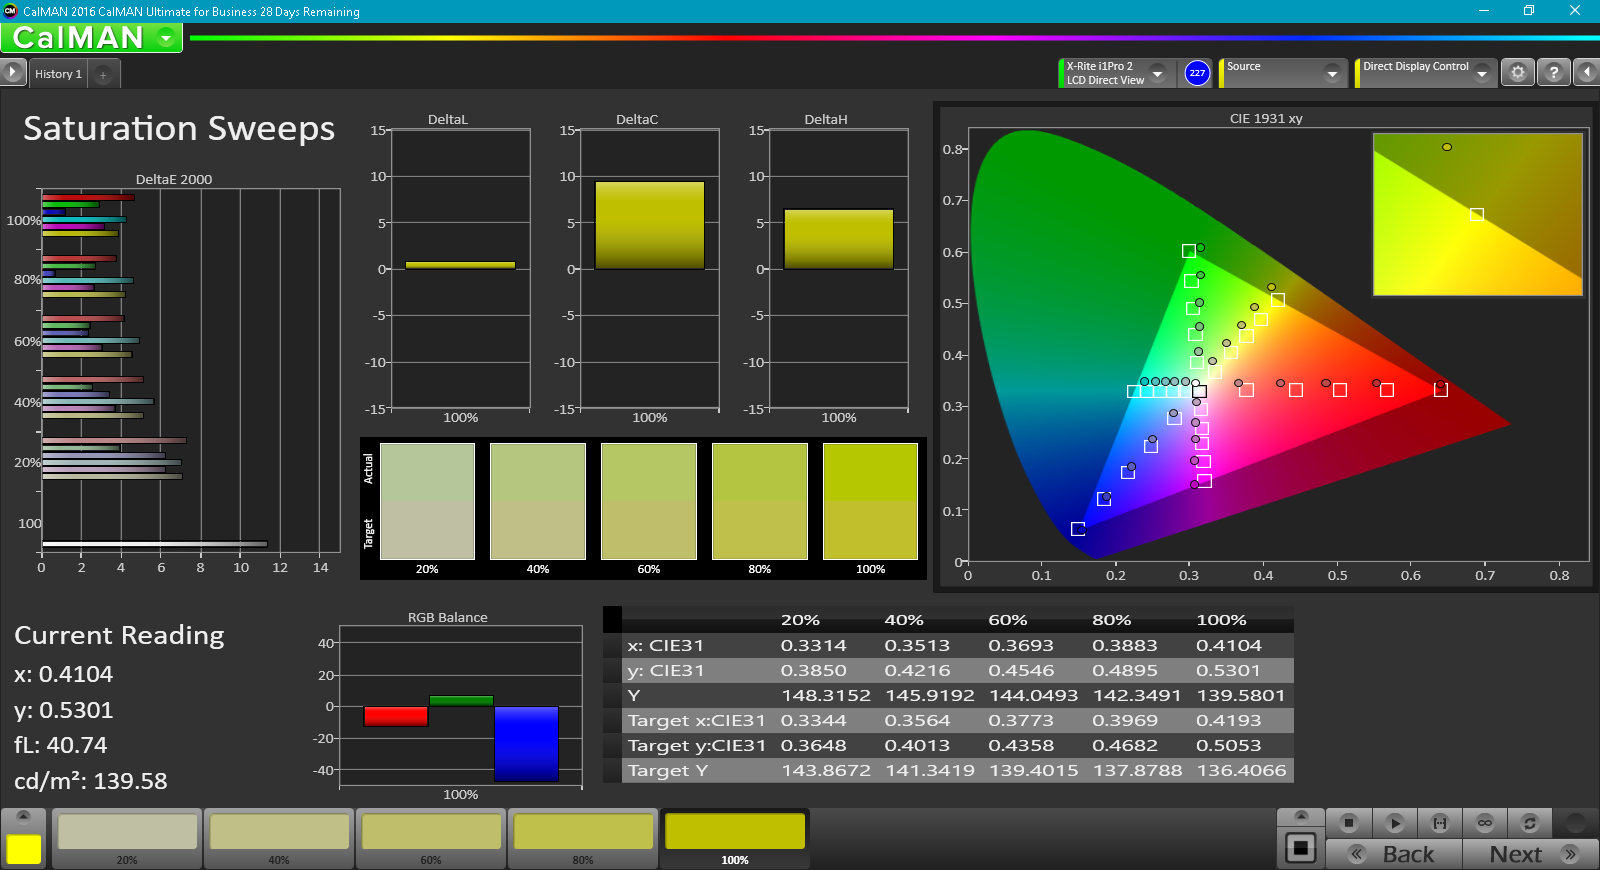
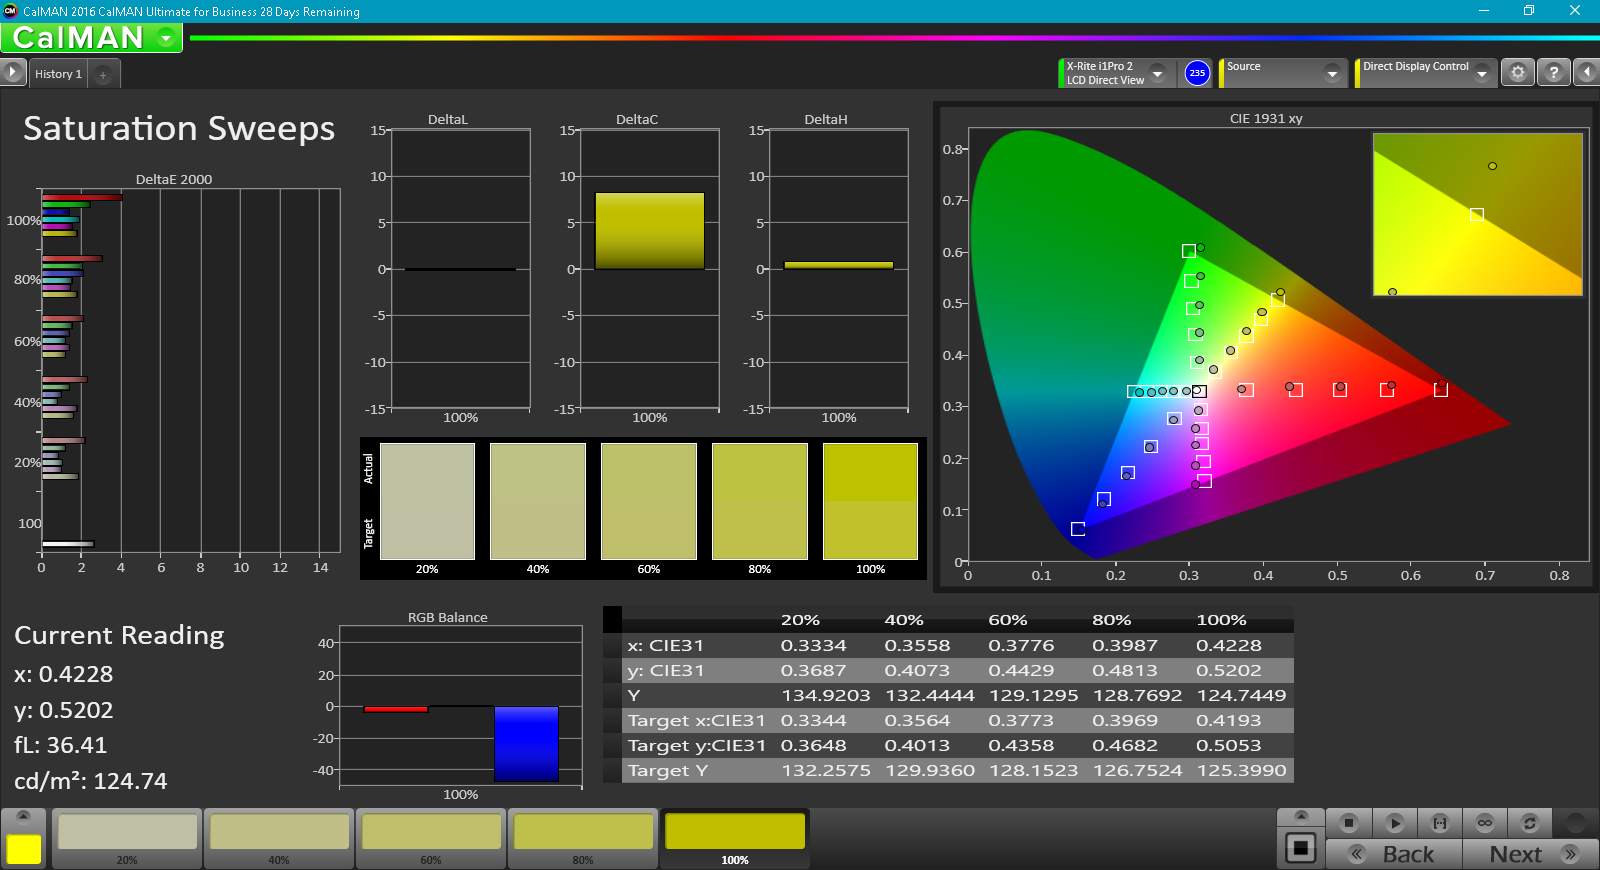
Our CalMAN 5 measurements reveal decent panel attributes out of the box, with ColorChecker and Greyscale DeltaE values of 5.5 and 7.9 (ideal: 0), respectively, alongside a Total Gamma reading of 2.09, and a CCT average of 6559 (ideal: 6500). A bit of calibration improves things further, but for general use, it’s really more optional.
Display Response Times
| ↔ Response Time Black to White | ||
|---|---|---|
| 32.8 ms ... rise ↗ and fall ↘ combined | ↗ 18 ms rise | 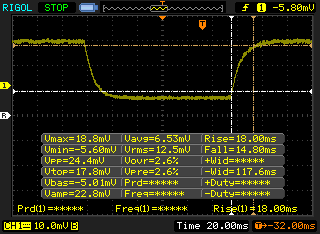 |
| ↘ 14.8 ms fall | ||
| The screen shows slow response rates in our tests and will be unsatisfactory for gamers. In comparison, all tested devices range from 0.1 (minimum) to 240 (maximum) ms. » 88 % of all devices are better. This means that the measured response time is worse than the average of all tested devices (19.9 ms). | ||
| ↔ Response Time 50% Grey to 80% Grey | ||
| 43.2 ms ... rise ↗ and fall ↘ combined | ↗ 20.4 ms rise |  |
| ↘ 22.8 ms fall | ||
| The screen shows slow response rates in our tests and will be unsatisfactory for gamers. In comparison, all tested devices range from 0.165 (minimum) to 636 (maximum) ms. » 72 % of all devices are better. This means that the measured response time is worse than the average of all tested devices (31.1 ms). | ||
Screen Flickering / PWM (Pulse-Width Modulation)
| Screen flickering / PWM detected | 25510 Hz | ≤ 29 % brightness setting | 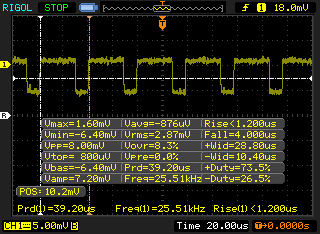 |
The display backlight flickers at 25510 Hz (worst case, e.g., utilizing PWM) Flickering detected at a brightness setting of 29 % and below. There should be no flickering or PWM above this brightness setting. The frequency of 25510 Hz is quite high, so most users sensitive to PWM should not notice any flickering. In comparison: 52 % of all tested devices do not use PWM to dim the display. If PWM was detected, an average of 7801 (minimum: 5 - maximum: 343500) Hz was measured. | |||
Response times are relatively slow, which renders the panel less than ideal for serious gaming purposes. PWM was detected at brightness settings of 29% and below, but the quite high frequency of 25510 Hz means that it’s unlikely most users will find themselves bothered by it.
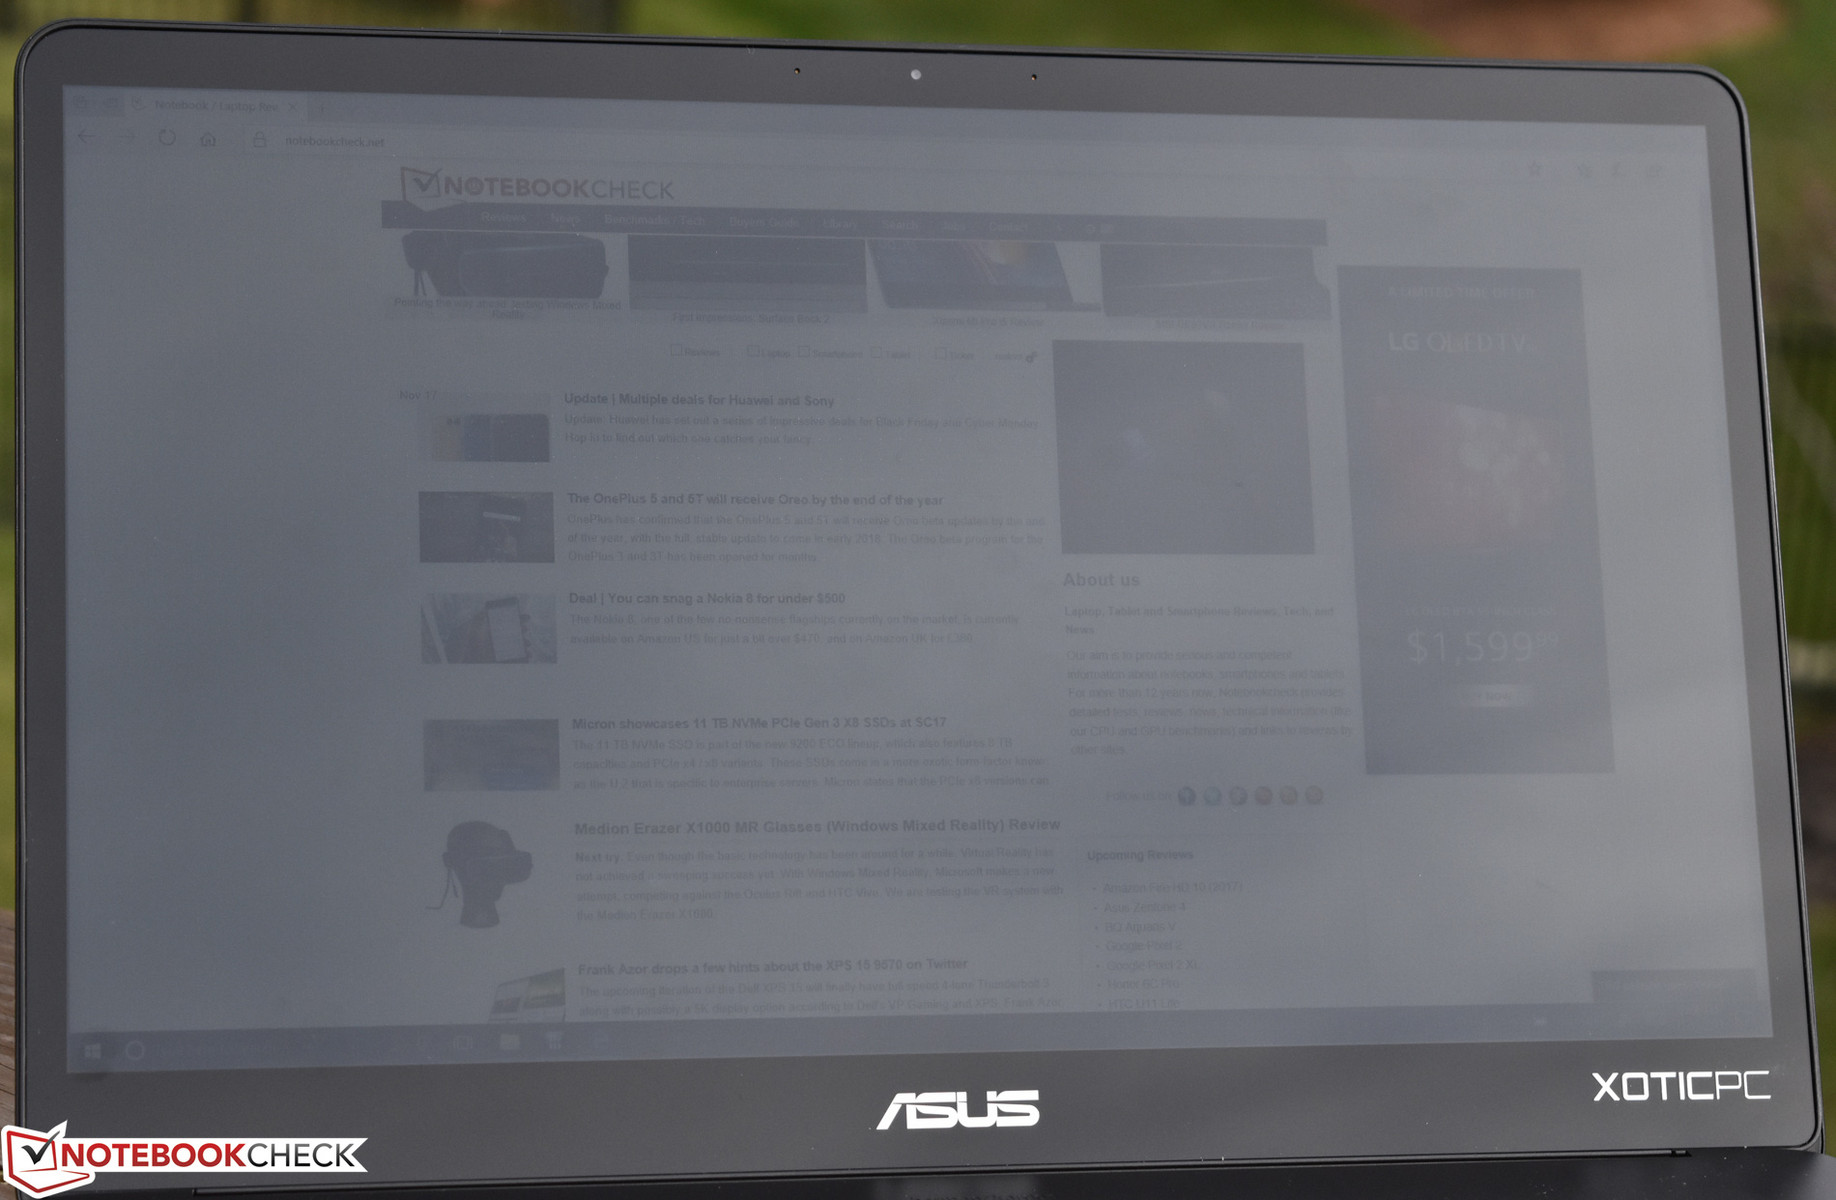
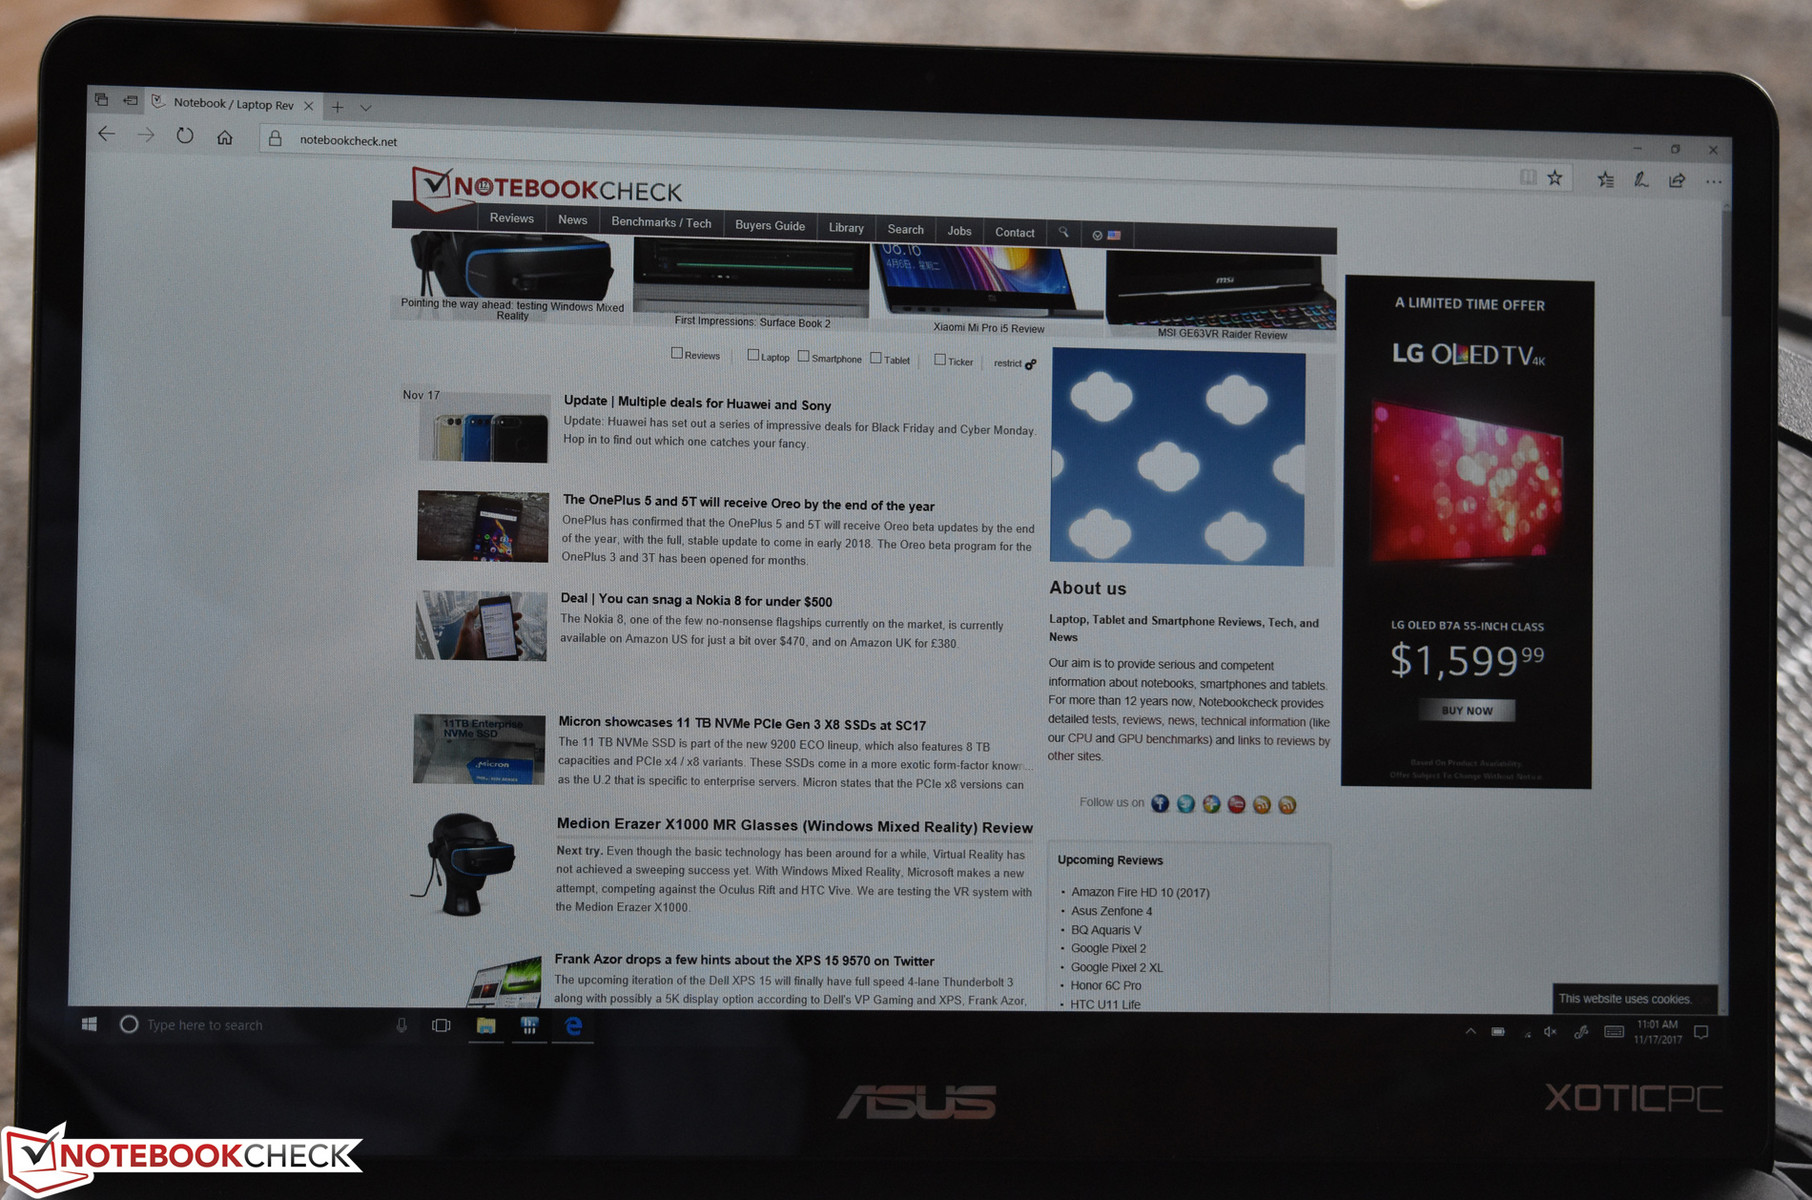
Outdoors, the panel unsurprisingly struggles more than the matte display of our previous review unit—but it’s still perfectly usable in the shade. Viewing angles remain excellent thanks to the incorporation of an IPS panel.
Performance
The CPU in today’s Zenbook Pro review unit—the Intel Core i7-7700HQ—remains the same as that of the previous model, but we do have a more powerful GPU accompanying it (which may prove problematic considering that our last review unit suffered from throttling under combined load). Likewise, we’re granted a new BIOS/firmware version of 303 which reportedly adjusts performance (the previous model was on 302), so it’s possible that may also affect how well the machine handles the load.
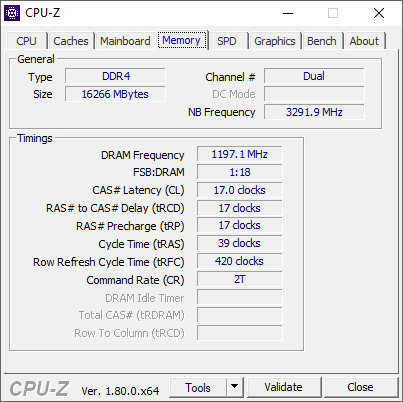
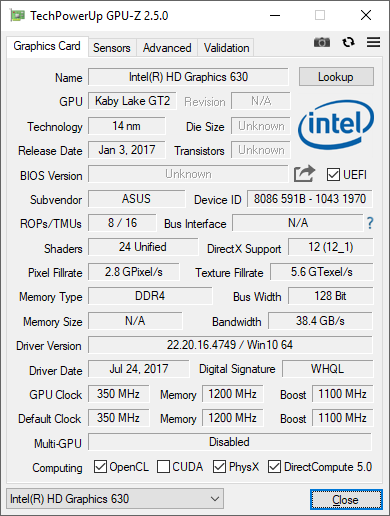
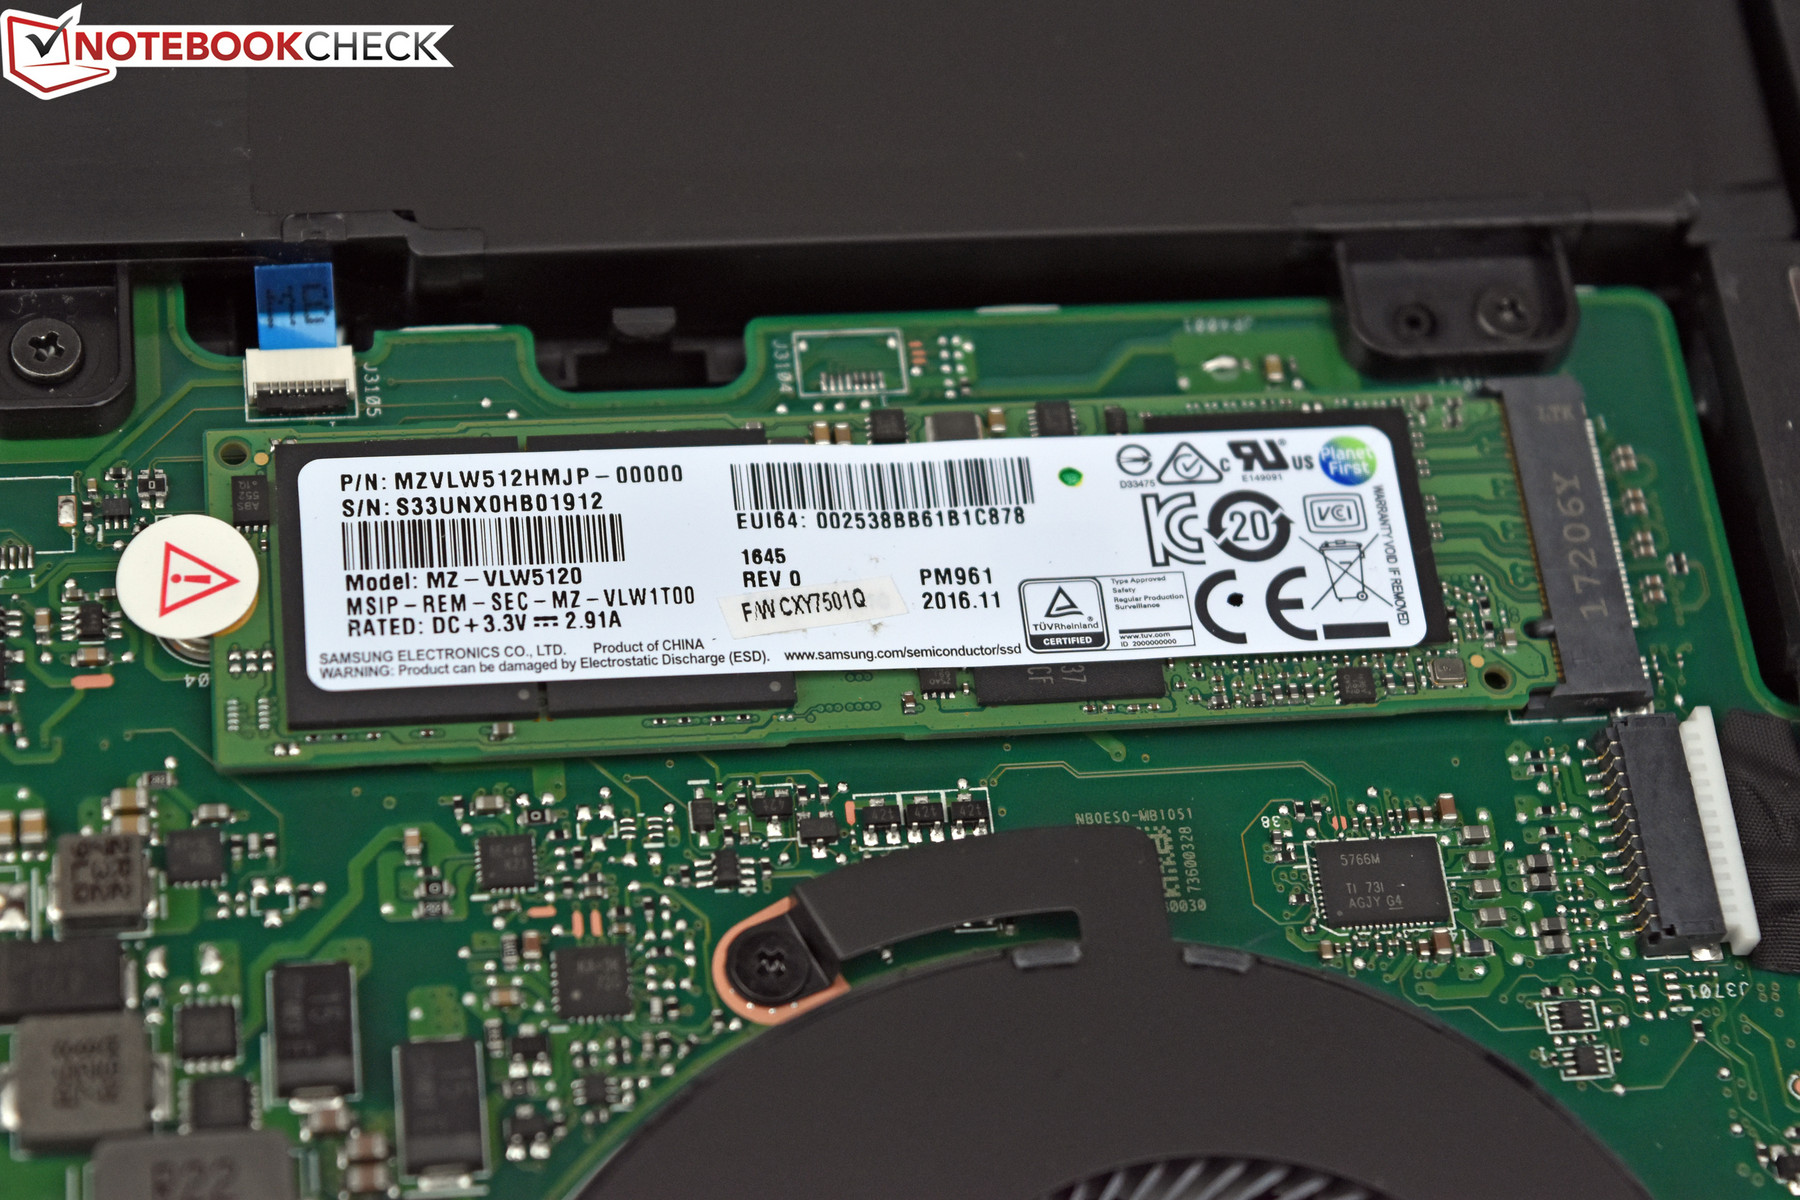
The i7-7700HQ is accompanied once again by 16 GB of DDR4-2400 RAM and the same 512 GB NVMe SSD from Samsung. New to the equation is the NVIDIA GeForce GTX 1050 Ti, which represents the biggest upgrade over September’s test unit. We’ll cover that in greater detail in a bit, but for now, let’s address the basics.
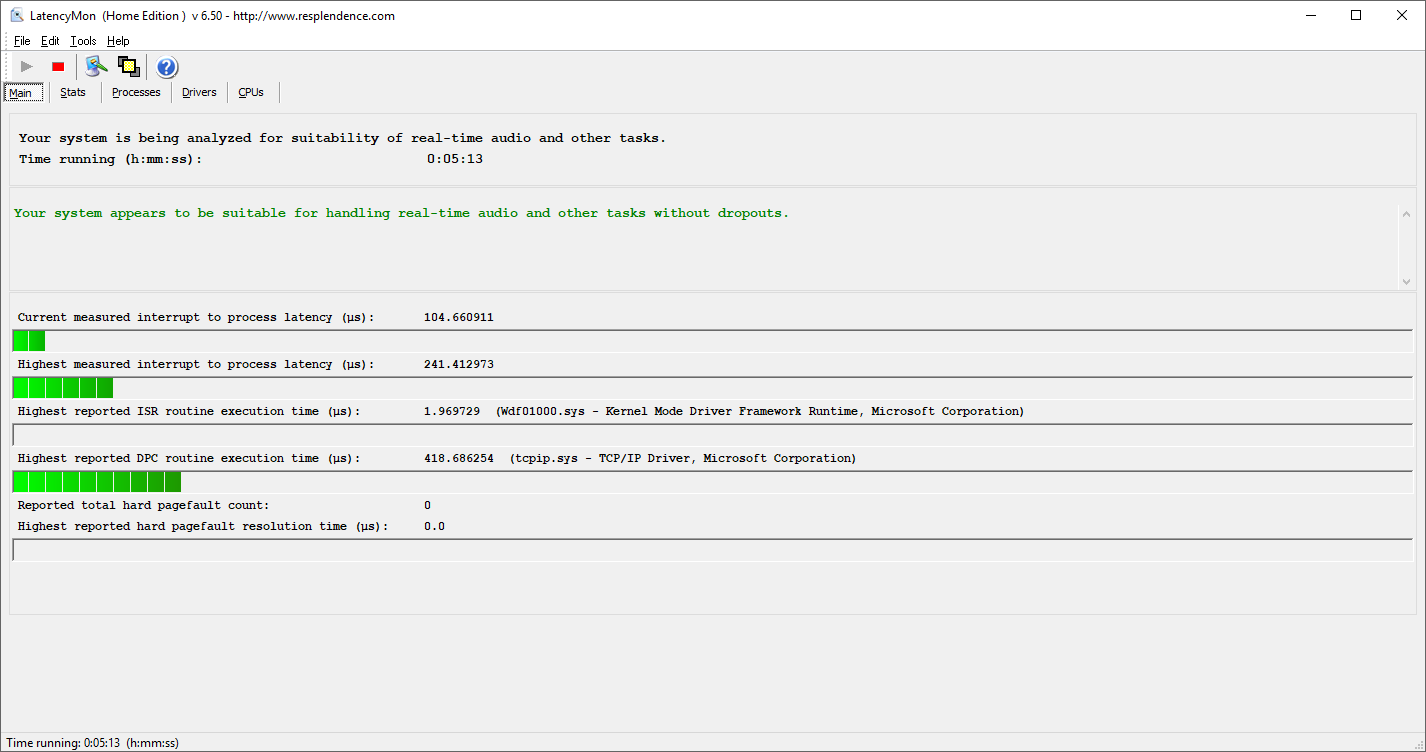
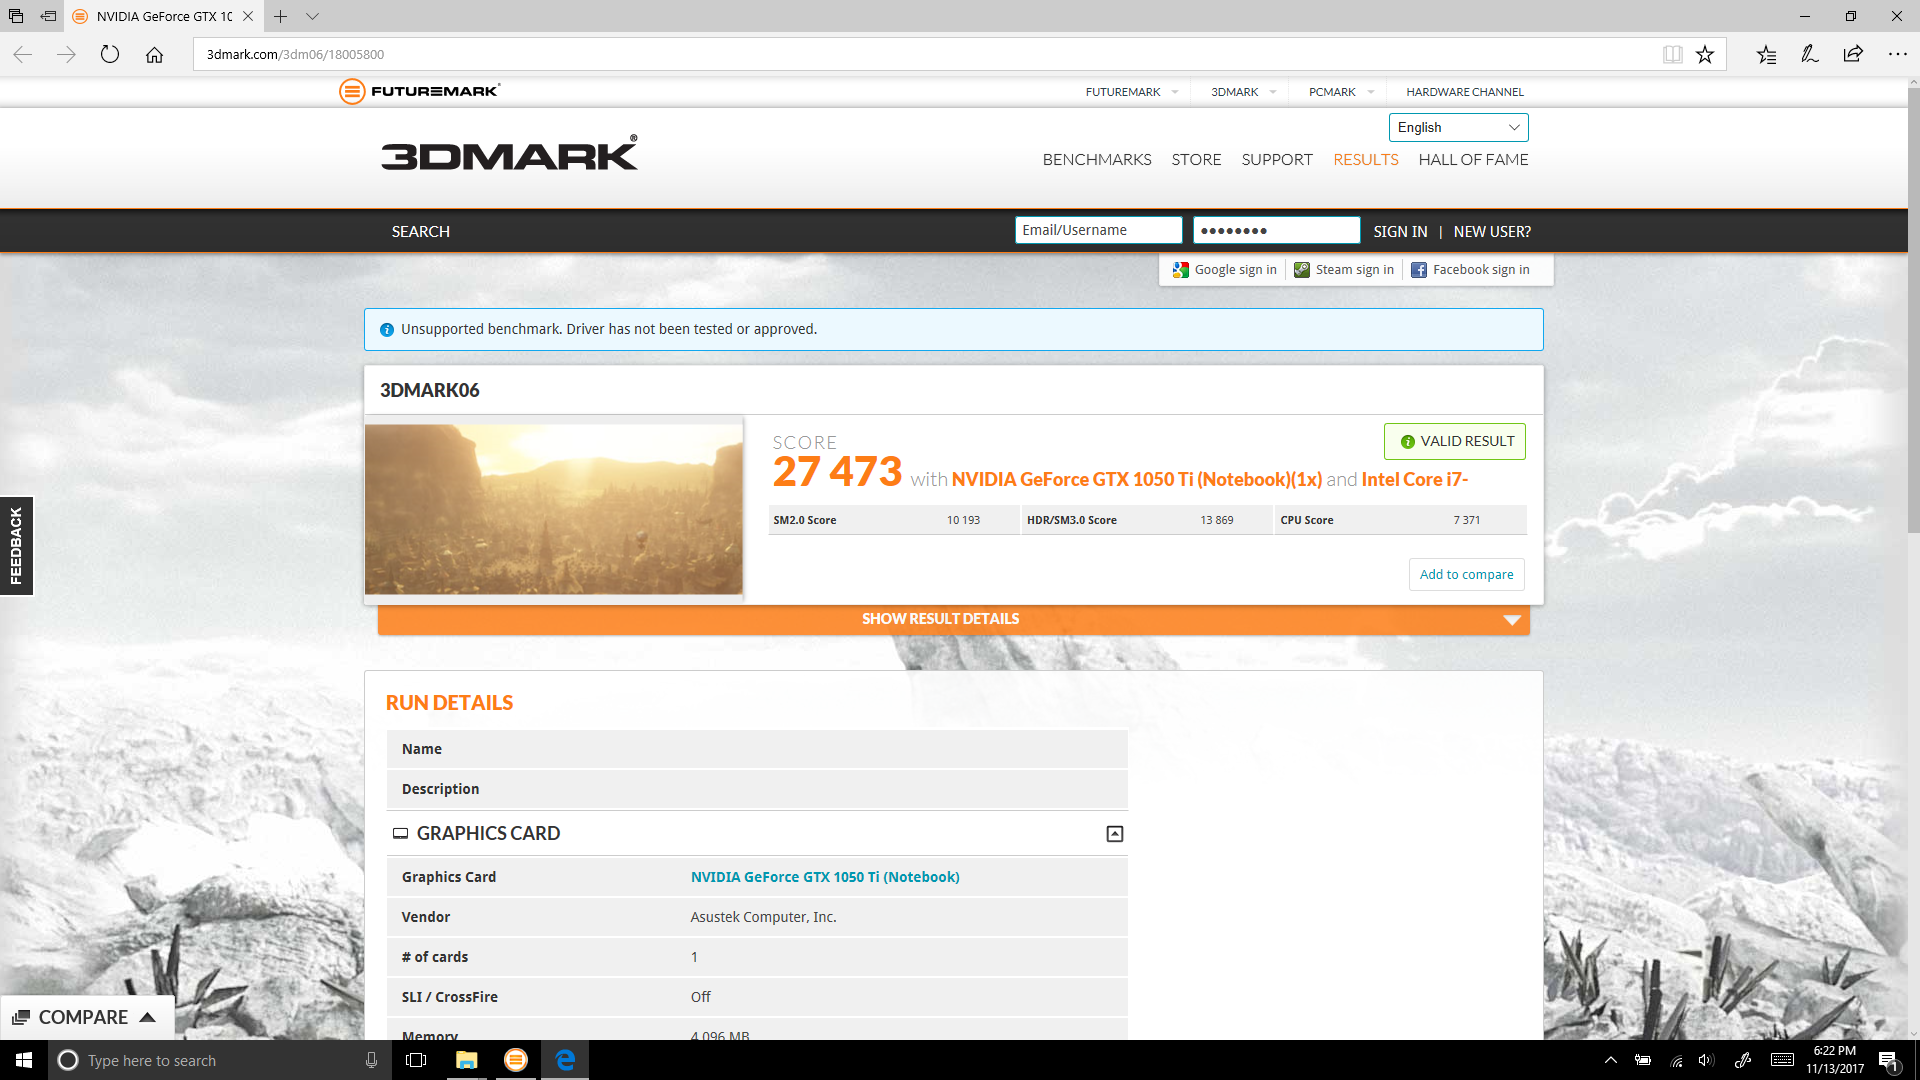
Before we continue, we performed a secondary run of 3DMark 06 on battery power to test performance while unplugged. The results were expectedly below those while on AC power with a result of just 18326—roughly 33% less. Meanwhile, unlike our previous review unit, we encountered no issues with DPC Latencies (as judged by LatencyMon) on the UX550VE machine.
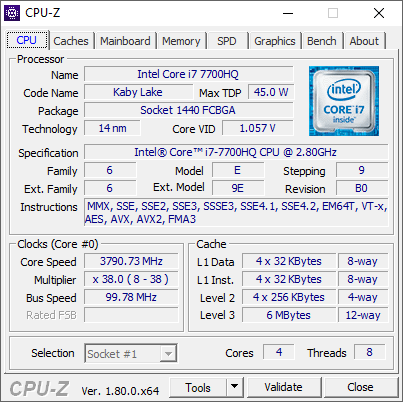
Processor
The Intel Core i7-7700HQ is a quad-core CPU with a base frequency of 2.8 GHz and a turbo clock rate of 3.8 GHz, and it’s been tested numerous times here at Notebookcheck previously since it’s one of the most popular current high-end mobile CPUs. It’s also the only processor currently offered in this Zenbook model.
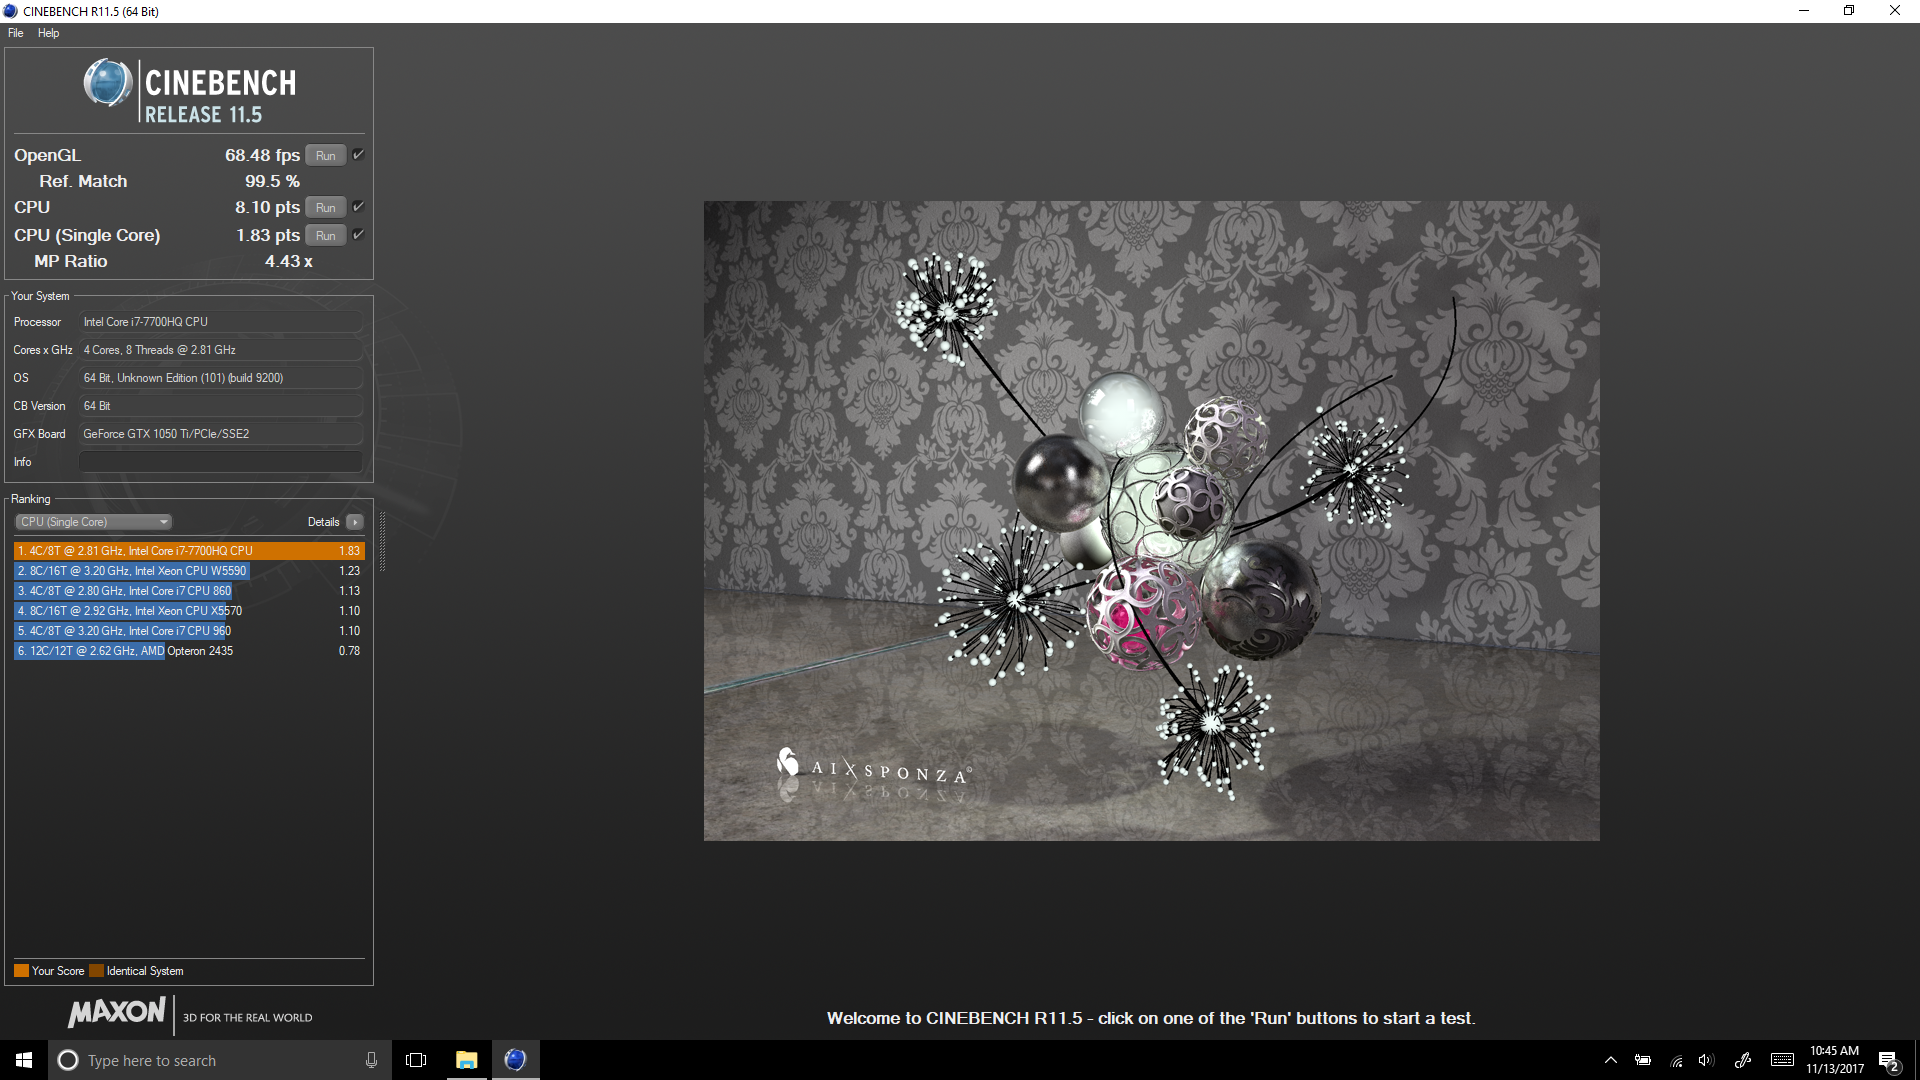
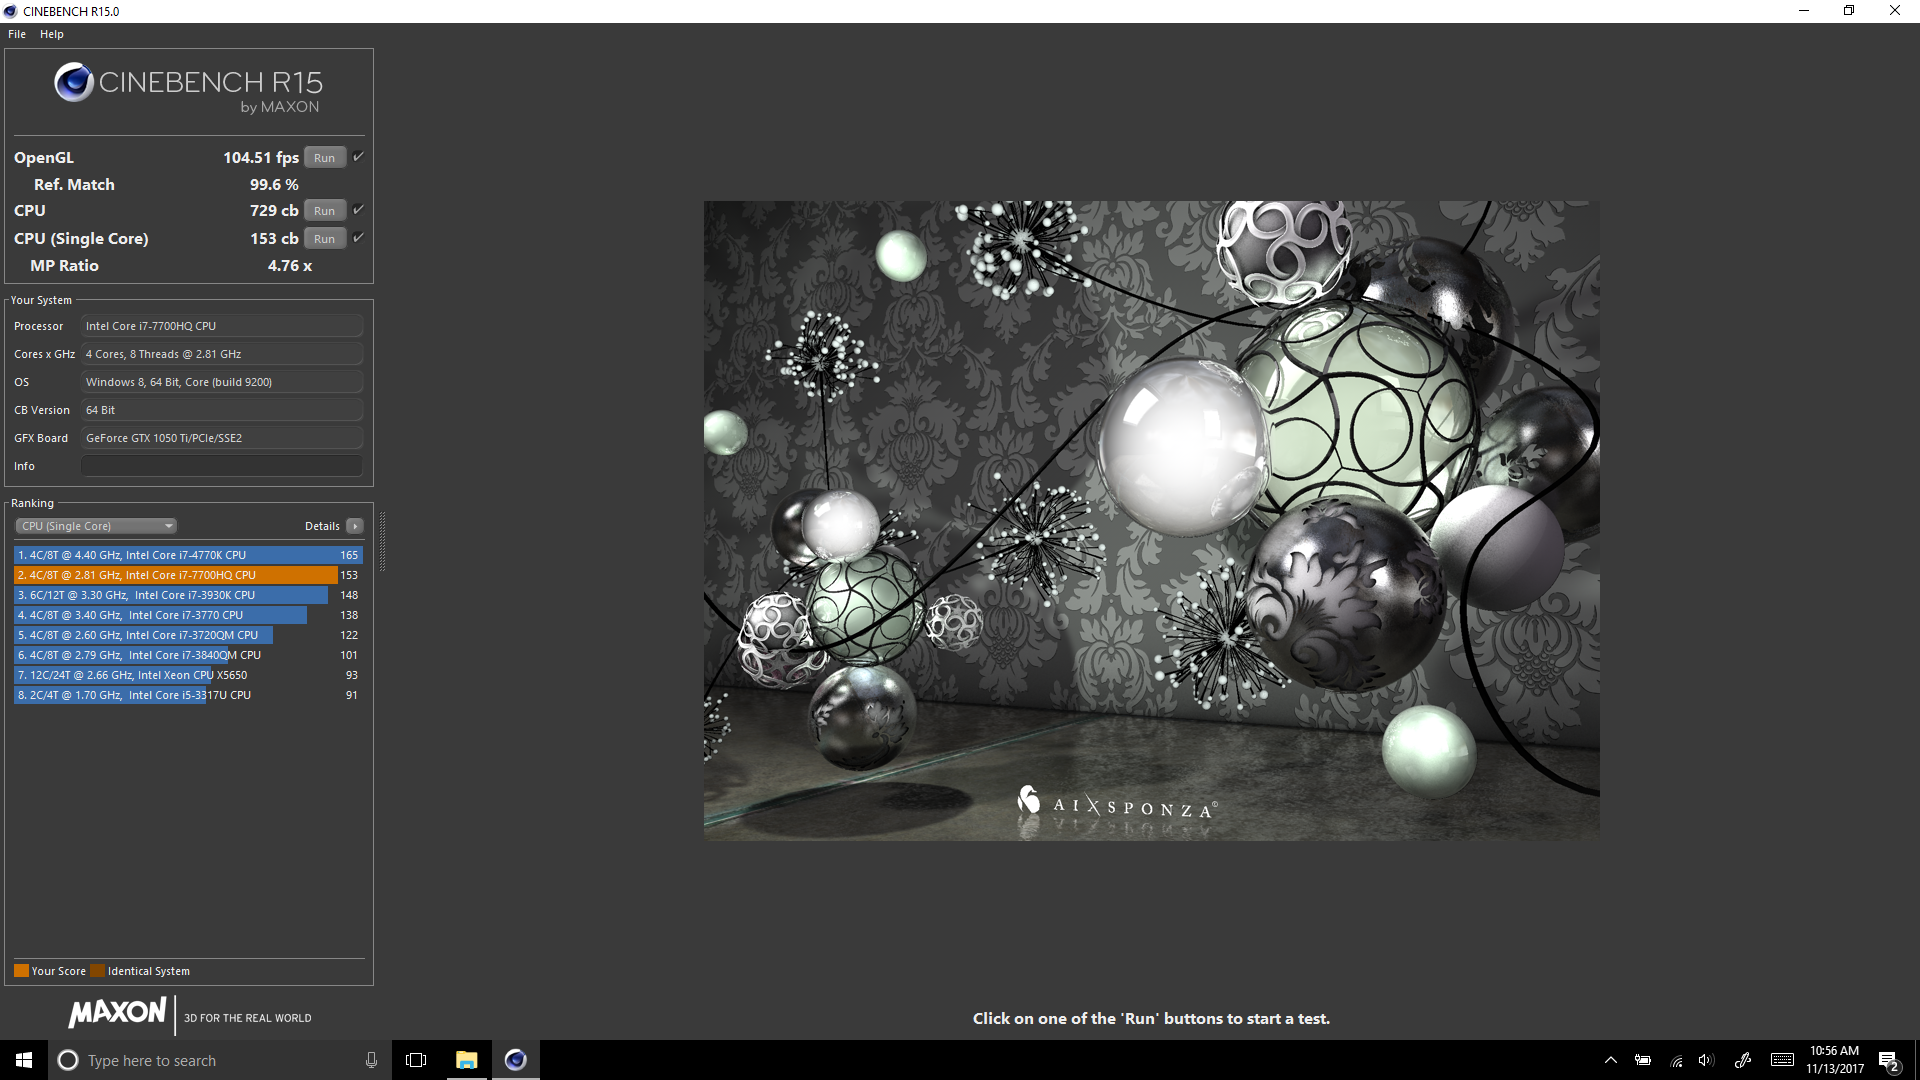
Oddly enough, CPU performance was actually a bit below that of the previous review unit, though the differences in short-term burst performance weren’t significant enough to stoke any sort of concern. Our result of 153 points in Cinebench R15 single-CPU is below the average for this processor and around 6% below that of the Zenbook Pro UX550VD, but the multi-CPU score of 736 is virtually identical.
What’s perhaps a bit more relevant is the sustained performance, where today’s review unit fell short by nearly 5% over the long term. This may prove more relevant to those interested in real-world CPU capabilities; while the UX550VD managed scores averaging 739 points over the course of a few dozen back-to-back iterations, the UX550VE we have with us today only produced one result above 710 (the first one—736) before quickly dropping down into the 699 – 709 range for the remainder of the test period. That’s still a drop of only around 5 percent from peak performance, but it’s nevertheless a meaningful discrepancy. On the other hand, neither machine came anywhere close to the performance throttling we witnessed on the passively-cooled Surface Book 2, which was closer to 23% over the long term (after the first couple of consecutive runs).
| wPrime 2.10 - 1024m | |
| Asus Zenbook Pro UX550VE-DB71T | |
| Lenovo Yoga 720-15IKB-80X7 | |
| MSI GS63VR 7RF-228US | |
| Dell XPS 15 9560 (i7-7700HQ, UHD) | |
* ... smaller is better
System Performance
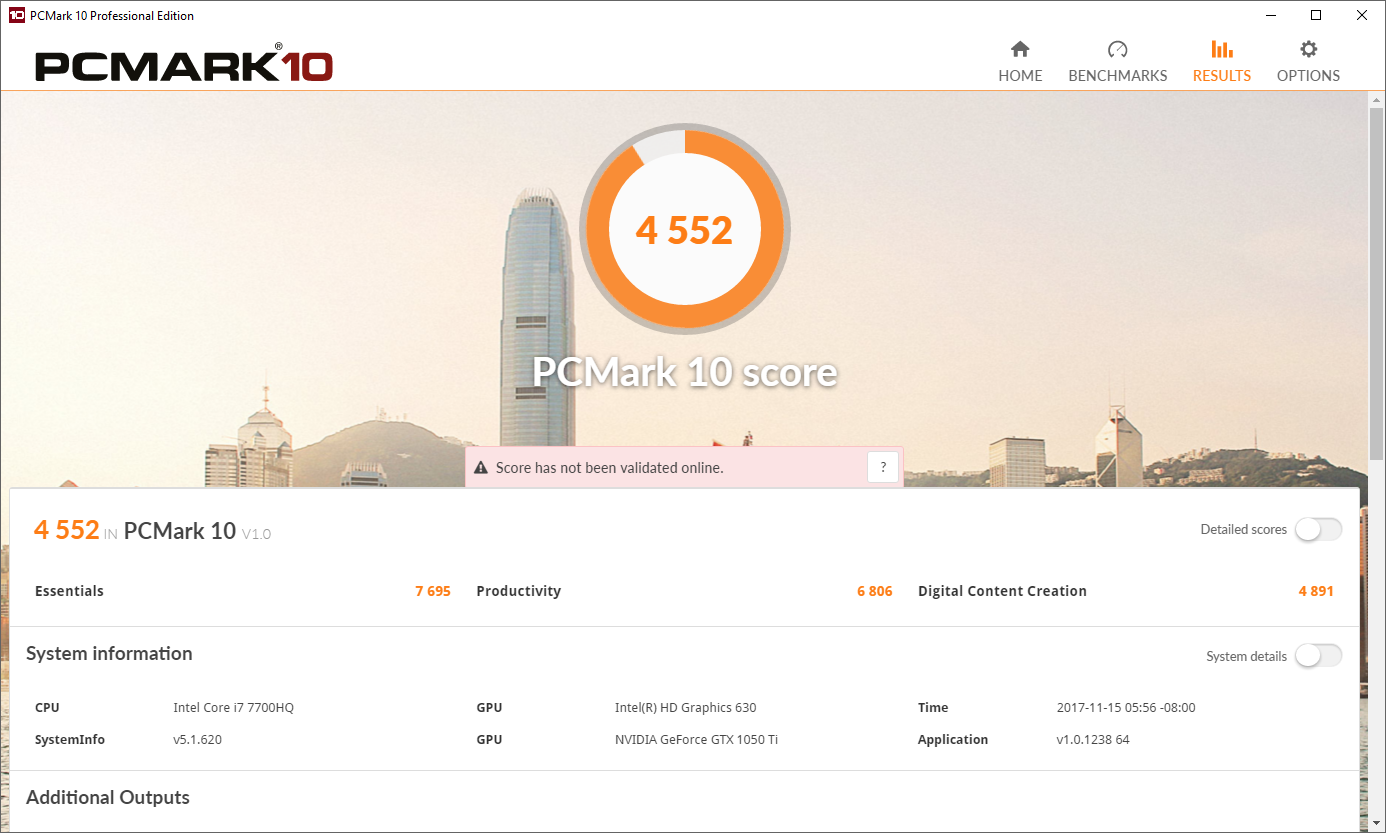
Overall PCMark system performance scores were just a notch below those of the UX550VD model, but by dwelling on the difference we’d be seriously splitting hairs. Considering that the CPU, storage device, and RAM are all identical in this machine, it’s no surprise that results are within a couple of percentage points of each other. Perhaps the same forces which played into the slight slip in CPU performance above are also responsible for the minor discrepancies here.
PCMark 10 scored our UX550VE a very respectable 4552, which is actually a percentage point above that of the UX550VD.
| PCMark 10 - Score | |
| Asus Zenbook Pro UX550VE-DB71T | |
| Asus ZenBook Pro UX550VD | |
| Microsoft Surface Book 2 | |
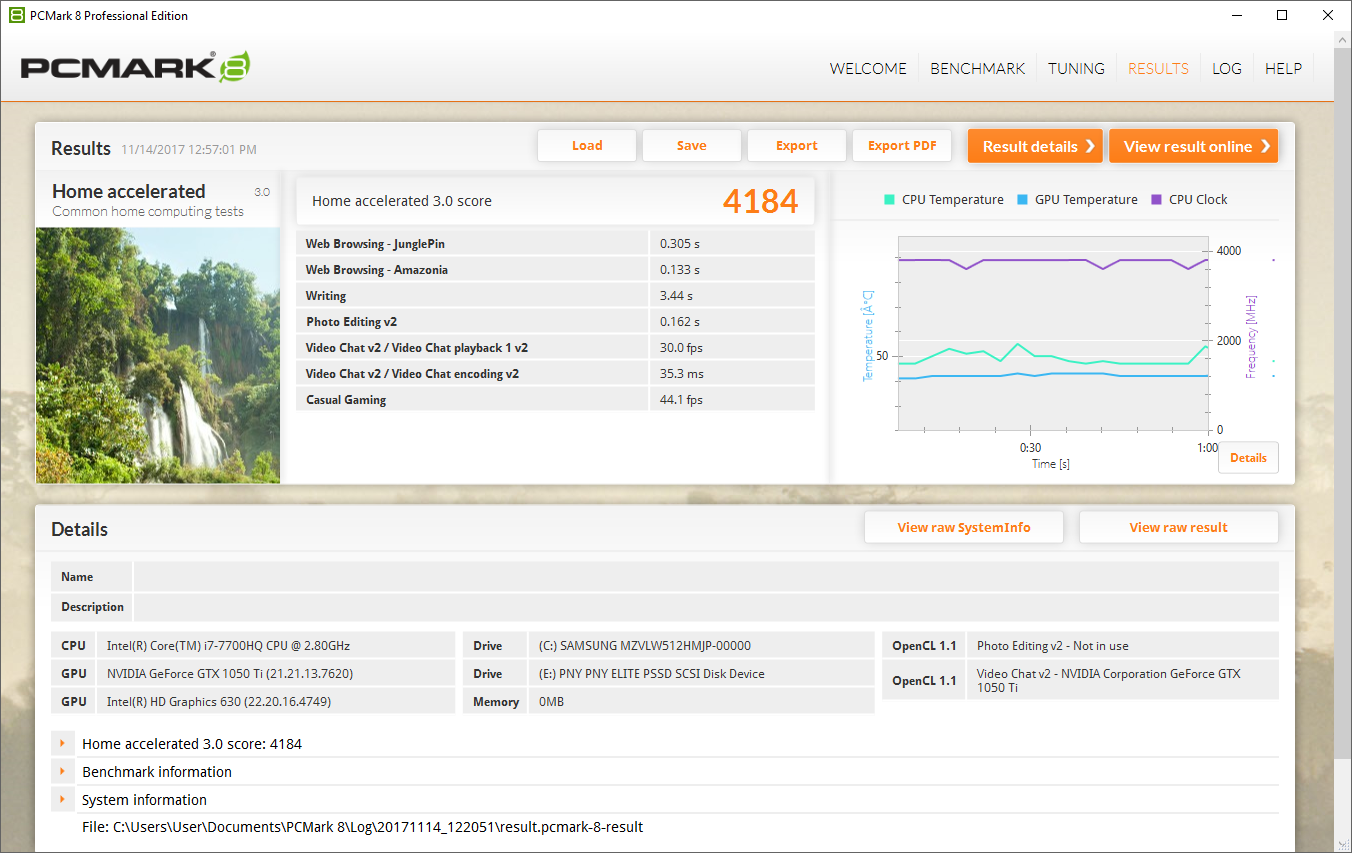
| PCMark 8 Home Score Accelerated v2 | 4184 points | |
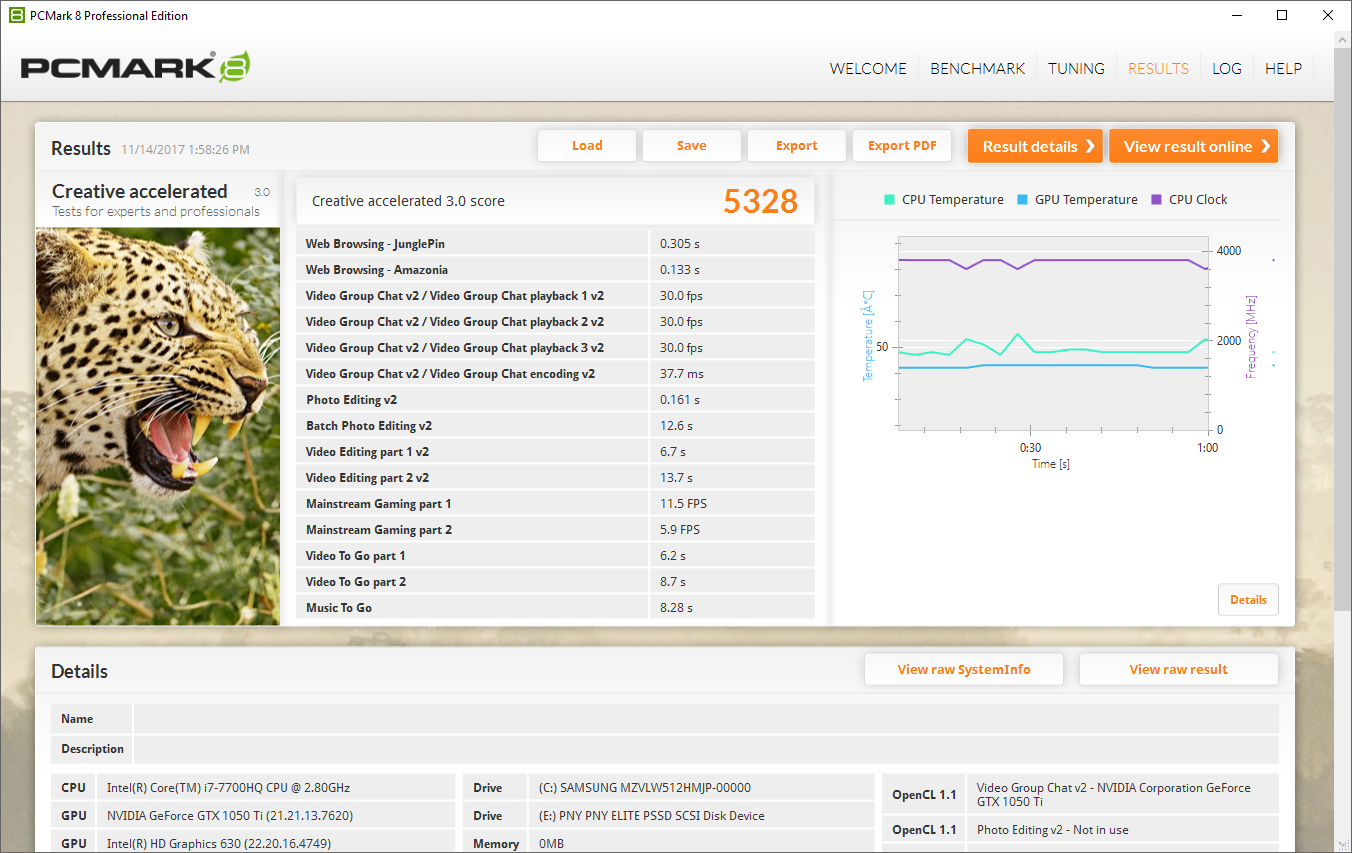
| PCMark 8 Creative Score Accelerated v2 | 5328 points | |
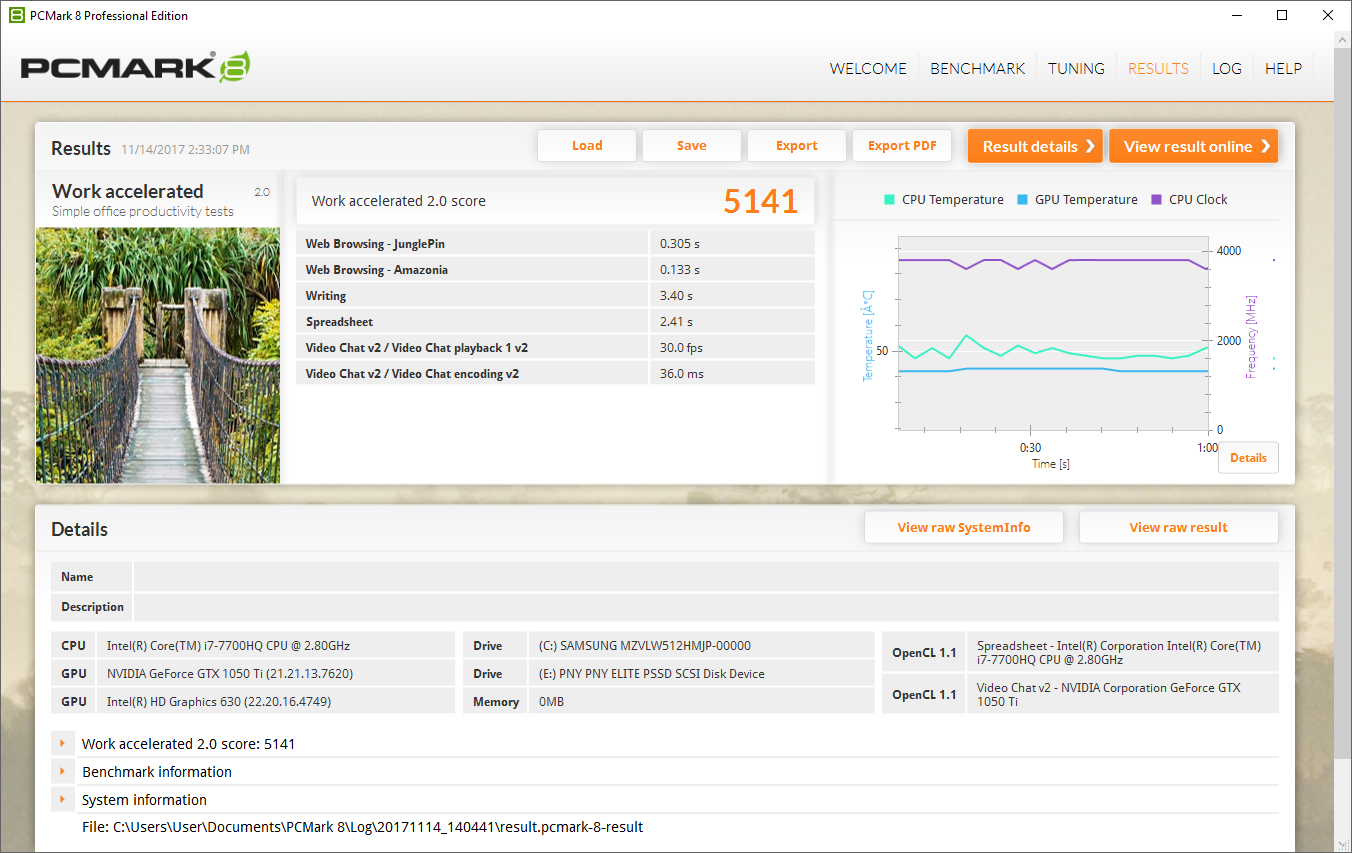
| PCMark 8 Work Score Accelerated v2 | 5141 points | |
| PCMark 10 Score | 4552 points | |
Help | ||
Storage Devices
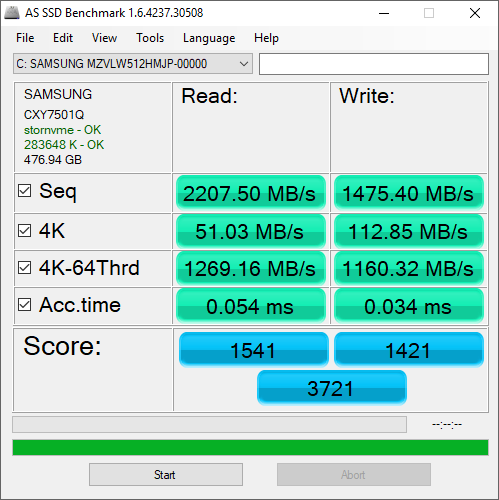
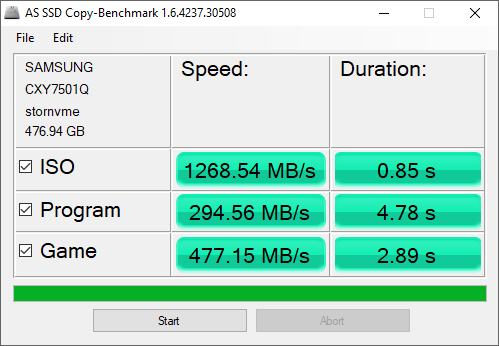
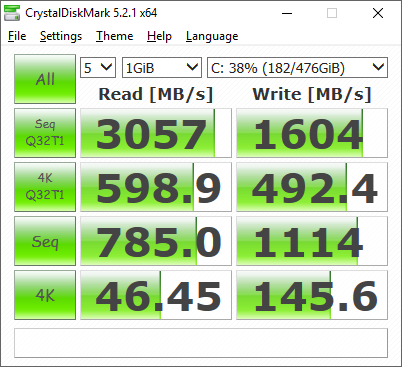
The Samsung PM961 employed by our Zenbook Pro remains one of the fastest popular SSD choices among modern notebooks. AS SSD awarded it a total score of 3721, fueled by very fast sequential read/write speeds of 2207.5/1475.4 MB/s and comparably great 4K-64 Read/Write values of 1269.16/1160.32 MB/s.
| Asus Zenbook Pro UX550VE-DB71T Samsung PM961 NVMe MZVLW512HMJP | Asus ZenBook Pro UX550VD Samsung PM961 NVMe MZVLW512HMJP | Lenovo Yoga 720-15IKB-80X7 Samsung PM961 MZVLW256HEHP | MSI GS63VR 7RF-228US Samsung SM961 MZVKW512HMJP m.2 PCI-e | Dell XPS 15 9560 (i7-7700HQ, UHD) Lite-On CX2-8B512-Q11 | |
|---|---|---|---|---|---|
| AS SSD | 15% | -1158% | 19% | -6% | |
| Copy Game MB/s (MB/s) | 477.1 | 889 86% | 1082 127% | 540 13% | |
| Copy Program MB/s (MB/s) | 294.6 | 336.4 14% | 401.9 36% | 411.5 40% | |
| Copy ISO MB/s (MB/s) | 1269 | 1678 32% | 1666 31% | 1272 0% | |
| Score Total (Points) | 3721 | 3731 0% | 942 -75% | 3756 1% | 2810 -24% |
| Score Write (Points) | 1421 | 1158 -19% | 48 -97% | 1468 3% | 1022 -28% |
| Score Read (Points) | 1541 | 1727 12% | 646 -58% | 1549 1% | 1206 -22% |
| Access Time Write * (ms) | 0.034 | 0.028 18% | 4.15 -12106% | 0.029 15% | 0.034 -0% |
| Access Time Read * (ms) | 0.054 | 0.031 43% | 0.08 -48% | 0.041 24% | 0.034 37% |
| 4K-64 Write (MB/s) | 1160 | 870 -25% | 15.3 -99% | 1185 2% | 789 -32% |
| 4K-64 Read (MB/s) | 1269 | 1430 13% | 371.6 -71% | 1229 -3% | 962 -24% |
| 4K Write (MB/s) | 112.8 | 133.2 18% | 1.2 -99% | 127.6 13% | 112.2 -1% |
| 4K Read (MB/s) | 51 | 54 6% | 47.1 -8% | 48.01 -6% | 41.34 -19% |
| Seq Write (MB/s) | 1475 | 1540 4% | 311.7 -79% | 1550 5% | 1207 -18% |
| Seq Read (MB/s) | 2208 | 2429 10% | 2277 3% | 2719 23% | 2026 -8% |
* ... smaller is better

GPU Performance
The biggest upgrade to today’s review unit over our last test machine is the GPU. Whereas the UX550VD packed a mid-range NVIDIA GTX 1050, today’s UX550VE kicks it up a notch to the GTX 1050 Ti. This GPU is notably behind, say, the GTX 1060, but it’s also quite a bit more capable than the GTX 1050, generally posting scores around 30 percent faster. With clock speeds of 1493 – 1620 MHz (boost) and 4 GB of GDDR5 RAM, it also carries a somewhat higher (20 to 30 W) power consumption than the GTX 1050, coming in at around 70 W estimated consumption. It will be interesting to see whether such performance improvements are possible in the Zenbook Pro considering that the previous model was already among the slower of the GTX 1050 participants.
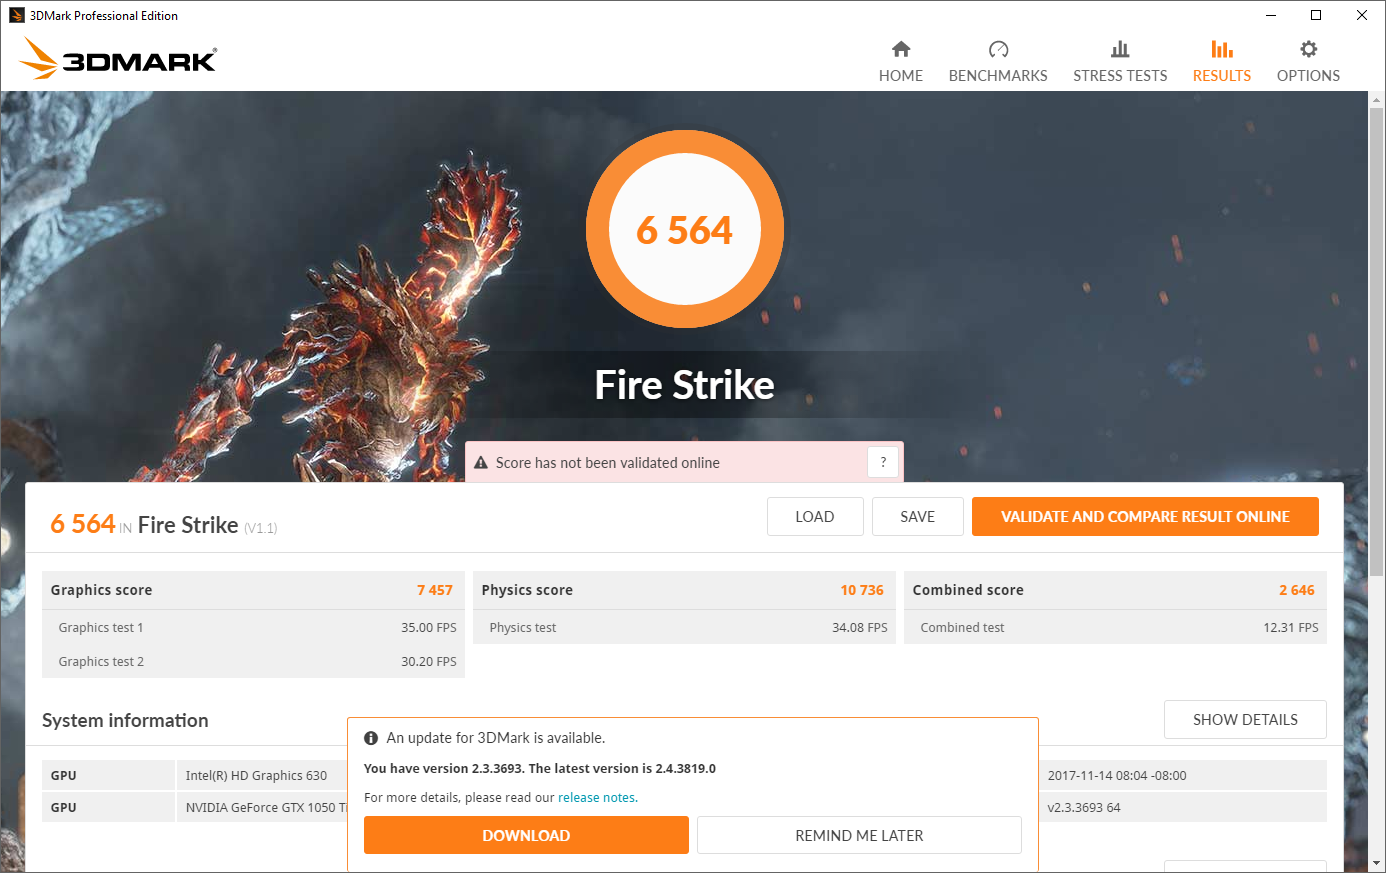
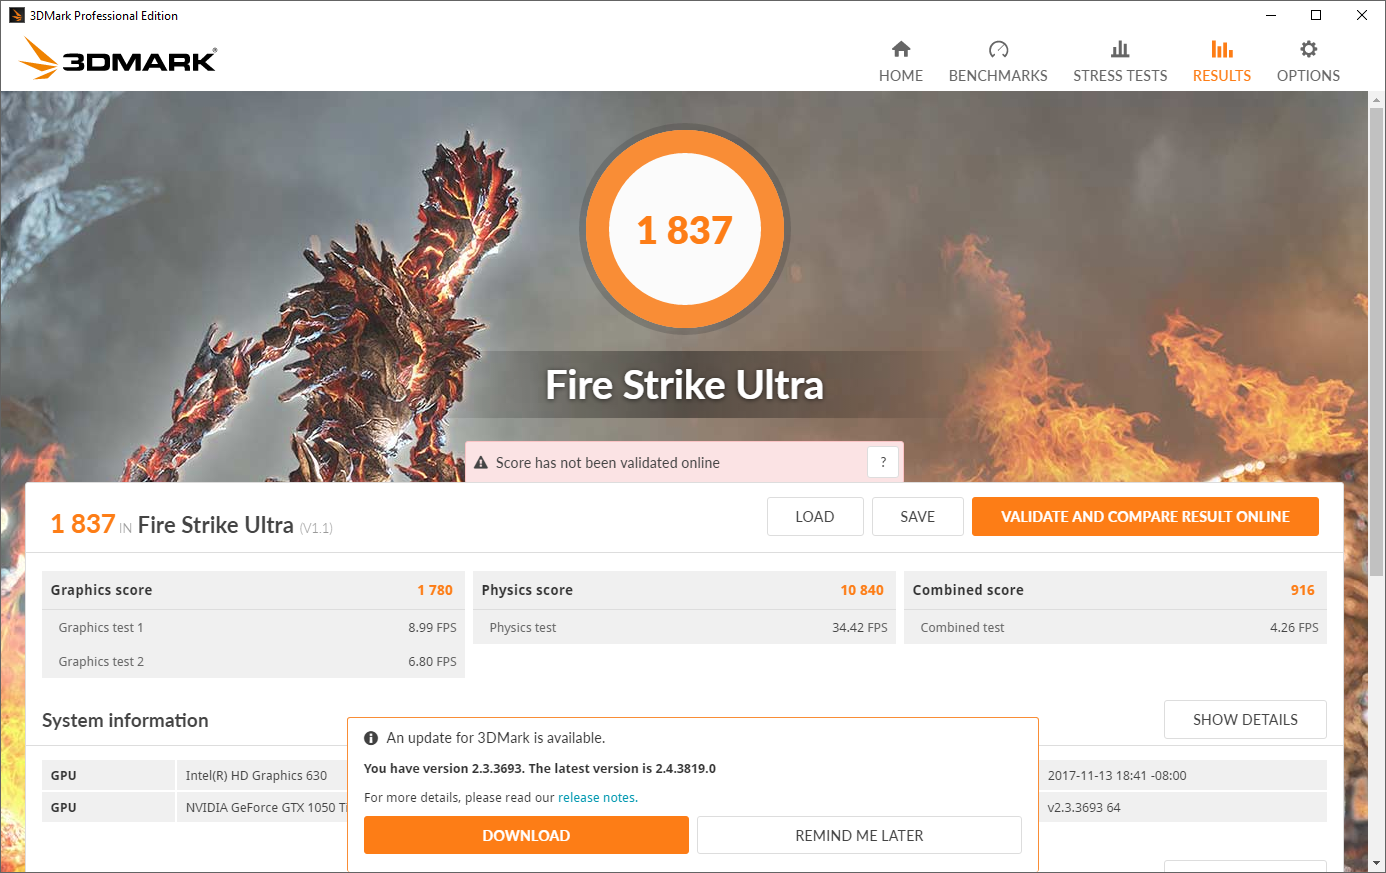
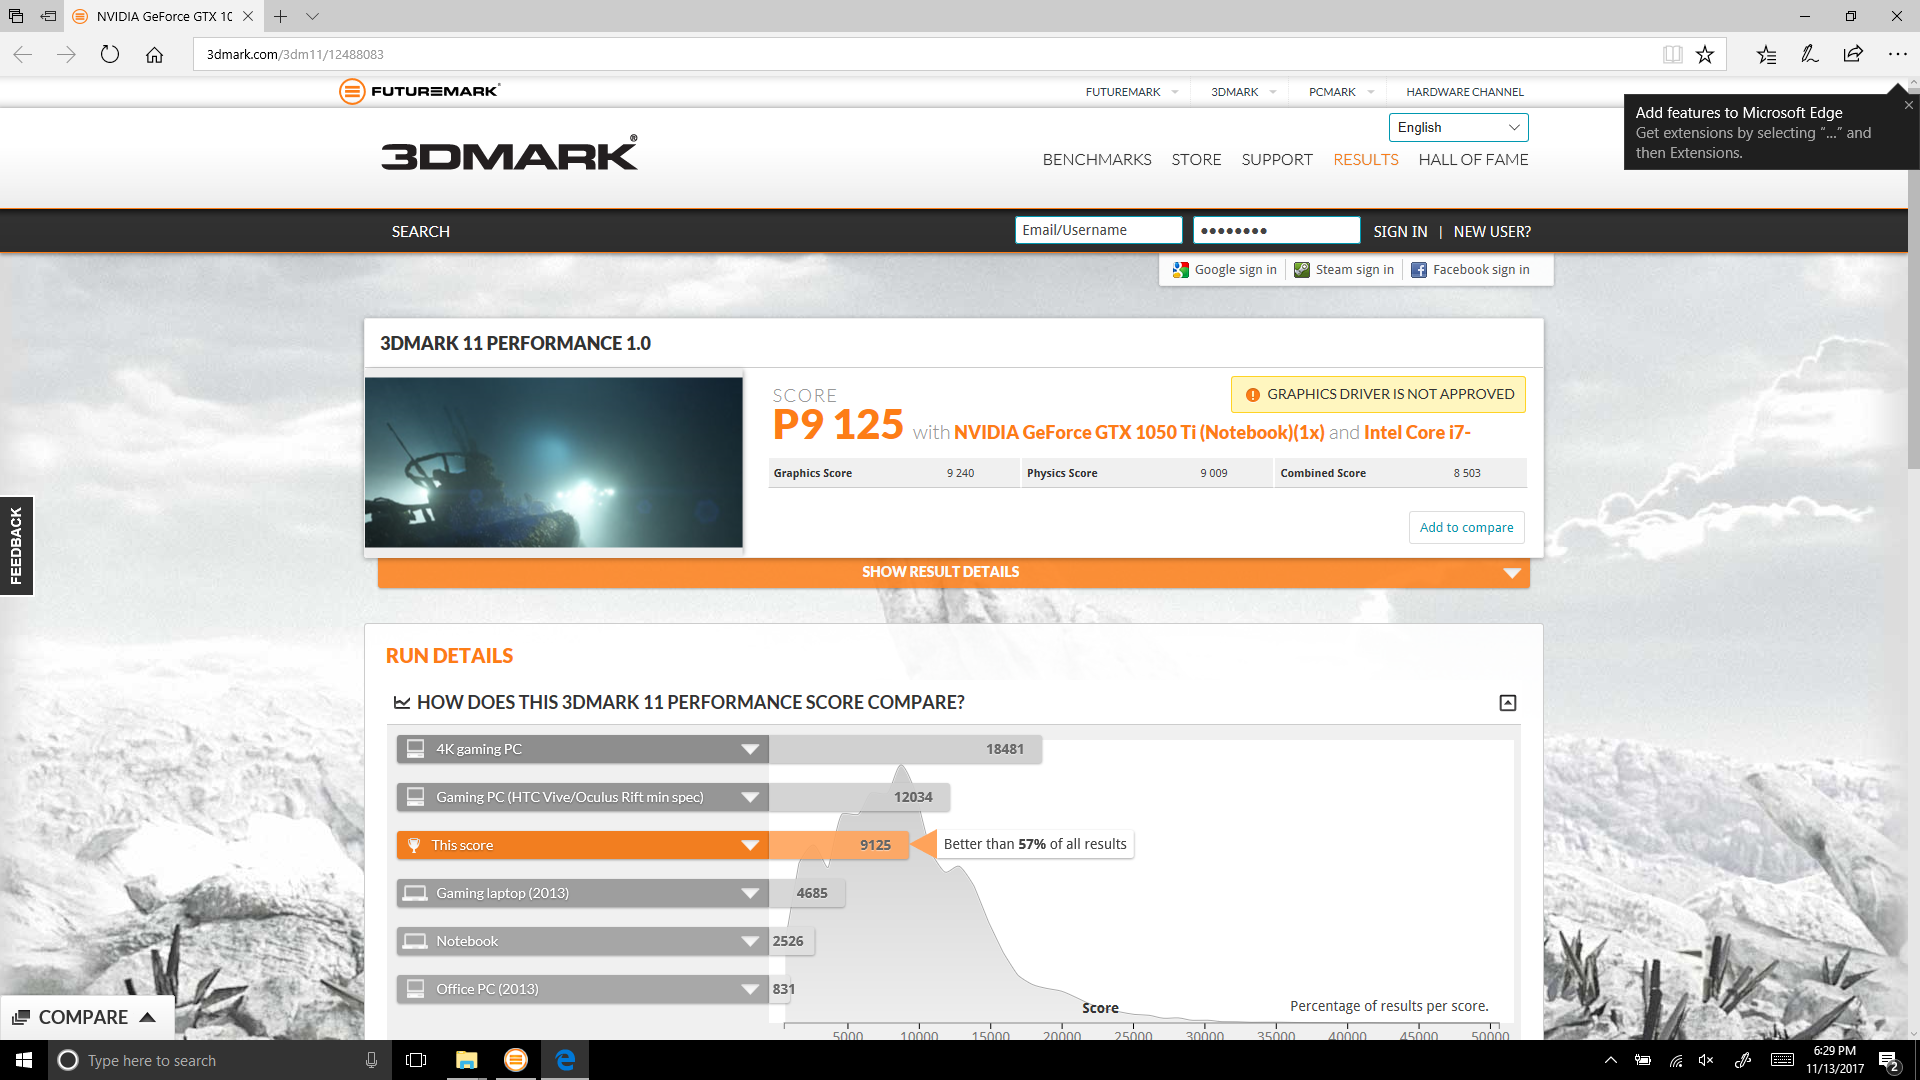
As it turns out, while overall the scores are significantly better, the UX550VE once again disappoints in context with its peers as to synthetic GPU performance. The 3DMark Fire Strike Graphics score of 7457, for instance, is well above the 6032 of the GTX 1050 model (a 24% improvement), but it’s still some 4% below the median in our database for this benchmark among GTX 1050 Ti machines. The same goes for 3DMark 11: although the score of 8503 is 15% better than the 7442 of the UX550VD, it is nevertheless 7% shy of the 9125 category median value.
None of this is terribly surprising given the thin profile of the Zenbook—chip temperatures climb quickly under load, provoking a slight reduction in clock rates until the cooling system can wrest control over them once more—and it must be taken in context with the results of the GTX 1050-equipped competition, where top-rated peers like the Dell XPS 15 are between 19 and 43 percent slower in these same tests. The Surface Book 2, which leverages a GTX 1050 in its actively-cooled keyboard base, also comes in around 22% behind the Zenbook in Fire Strike Graphics. Still, the nature of these synthetic results suggests that the performance limitations represent untapped potential of the upgraded GPU in real-world situations as well. In our Stress Test section next, we’ll witness the evidence for this.

| 3DMark 11 | |
| 1280x720 Performance GPU | |
| MSI GS63VR 7RF-228US | |
| Asus Zenbook Pro UX550VE-DB71T | |
| Microsoft Surface Book 2 | |
| Asus ZenBook Pro UX550VD | |
| 1280x720 Performance Combined | |
| MSI GS63VR 7RF-228US | |
| Asus Zenbook Pro UX550VE-DB71T | |
| Asus ZenBook Pro UX550VD | |
| Microsoft Surface Book 2 | |
| 3DMark | |
| 1280x720 Cloud Gate Standard Graphics | |
| Asus Zenbook Pro UX550VE-DB71T | |
| Lenovo Yoga 720-15IKB-80X7 | |
| Asus ZenBook Pro UX550VD | |
| MSI GS63VR 7RF-228US | |
| Dell XPS 15 9560 (i7-7700HQ, UHD) | |
| Microsoft Surface Book 2 | |
| 1920x1080 Fire Strike Graphics | |
| MSI GS63VR 7RF-228US | |
| Asus Zenbook Pro UX550VE-DB71T | |
| Dell XPS 15 9560 (i7-7700HQ, UHD) | |
| Asus ZenBook Pro UX550VD | |
| Lenovo Yoga 720-15IKB-80X7 | |
| Microsoft Surface Book 2 | |
| 1920x1080 Ice Storm Extreme Graphics | |
| Asus Zenbook Pro UX550VE-DB71T | |
| Dell XPS 15 9560 (i7-7700HQ, UHD) | |
| Lenovo Yoga 720-15IKB-80X7 | |
| Microsoft Surface Book 2 | |
| 3DMark 06 Standard Score | 27473 points | |
| 3DMark 11 Performance | 9125 points | |
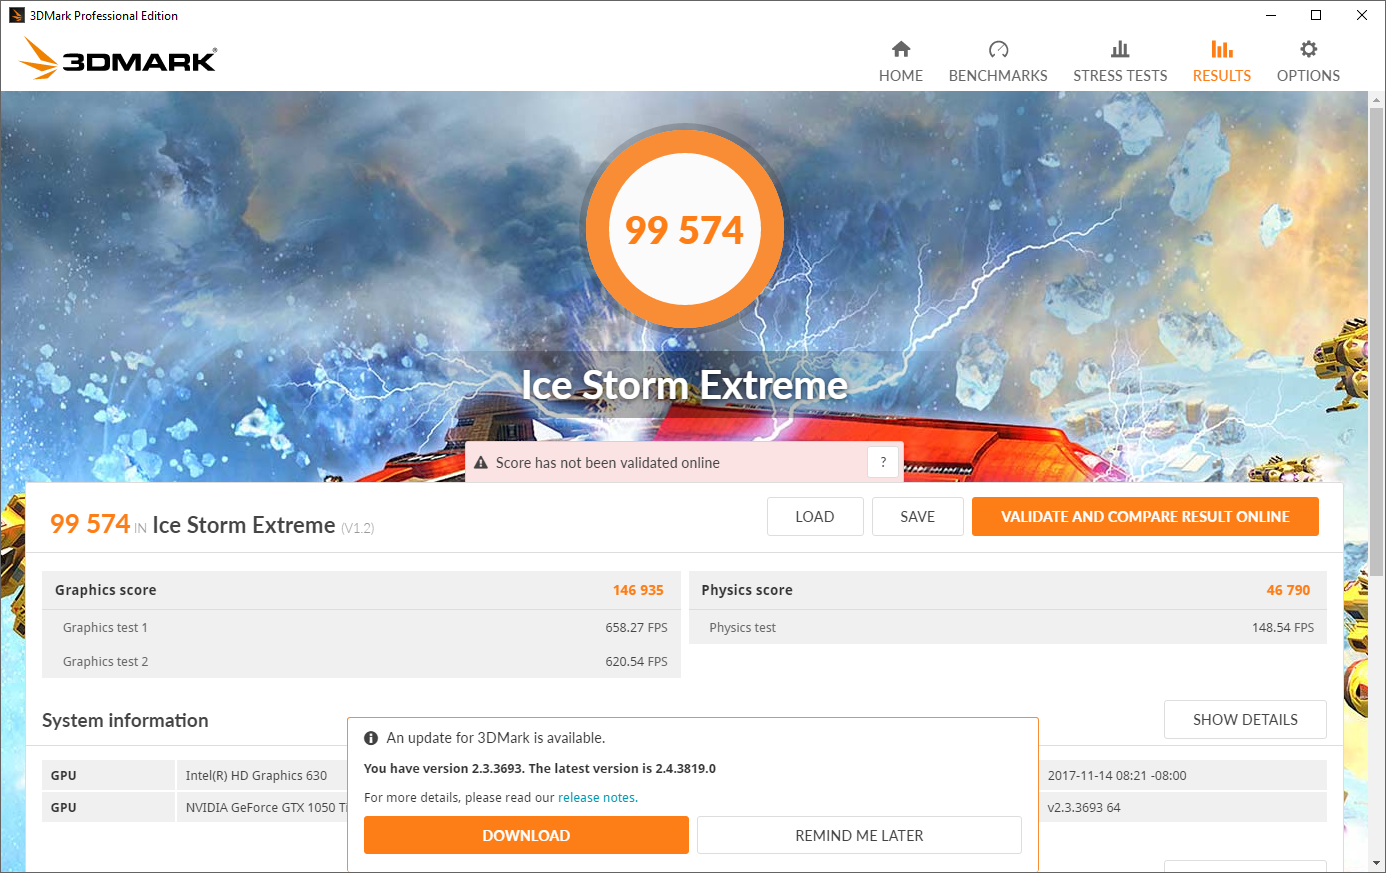
| 3DMark Ice Storm Standard Score | 104111 points | |
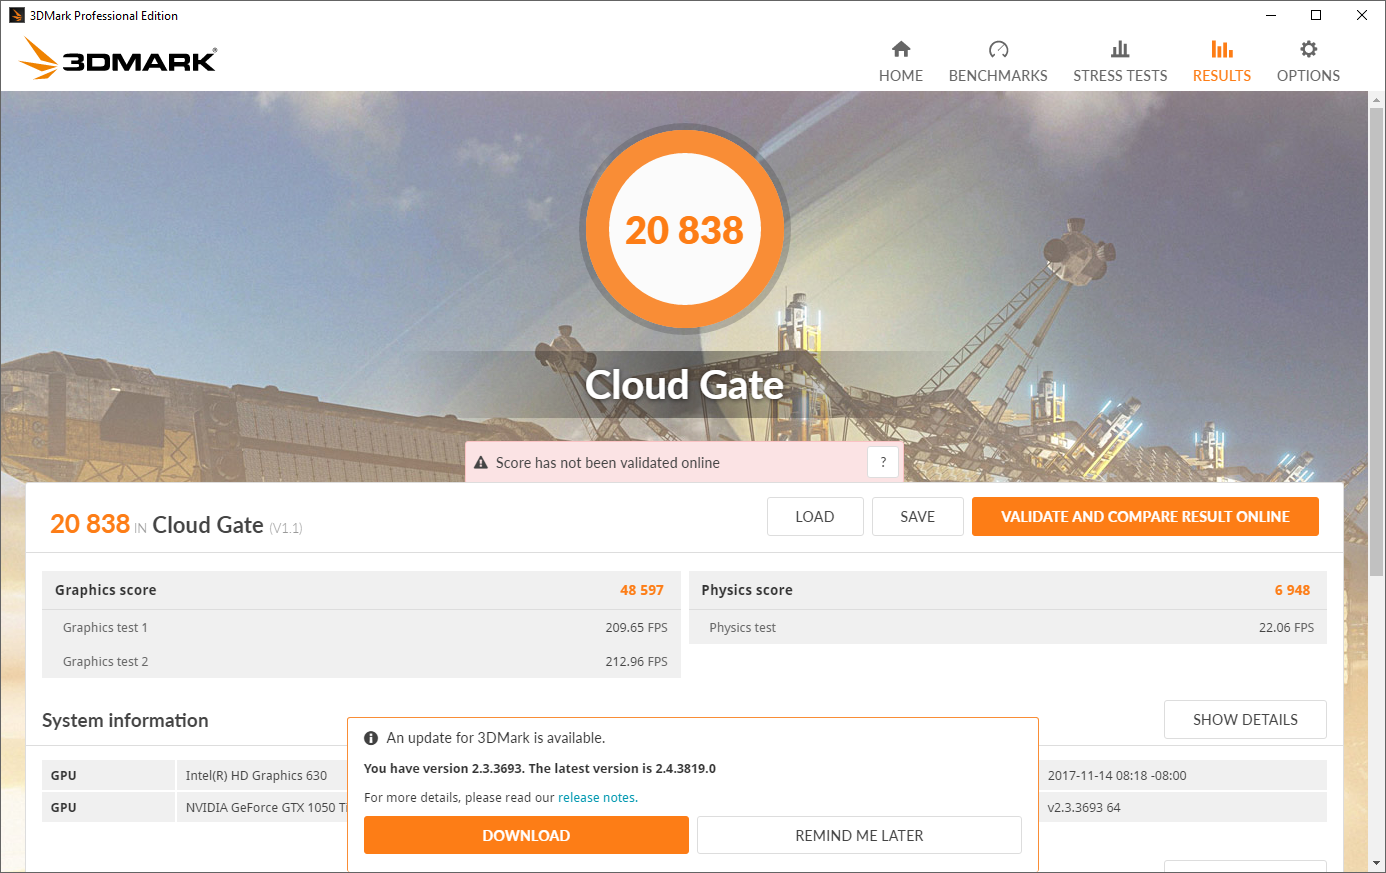
| 3DMark Cloud Gate Standard Score | 20838 points | |
| 3DMark Fire Strike Score | 6564 points | |
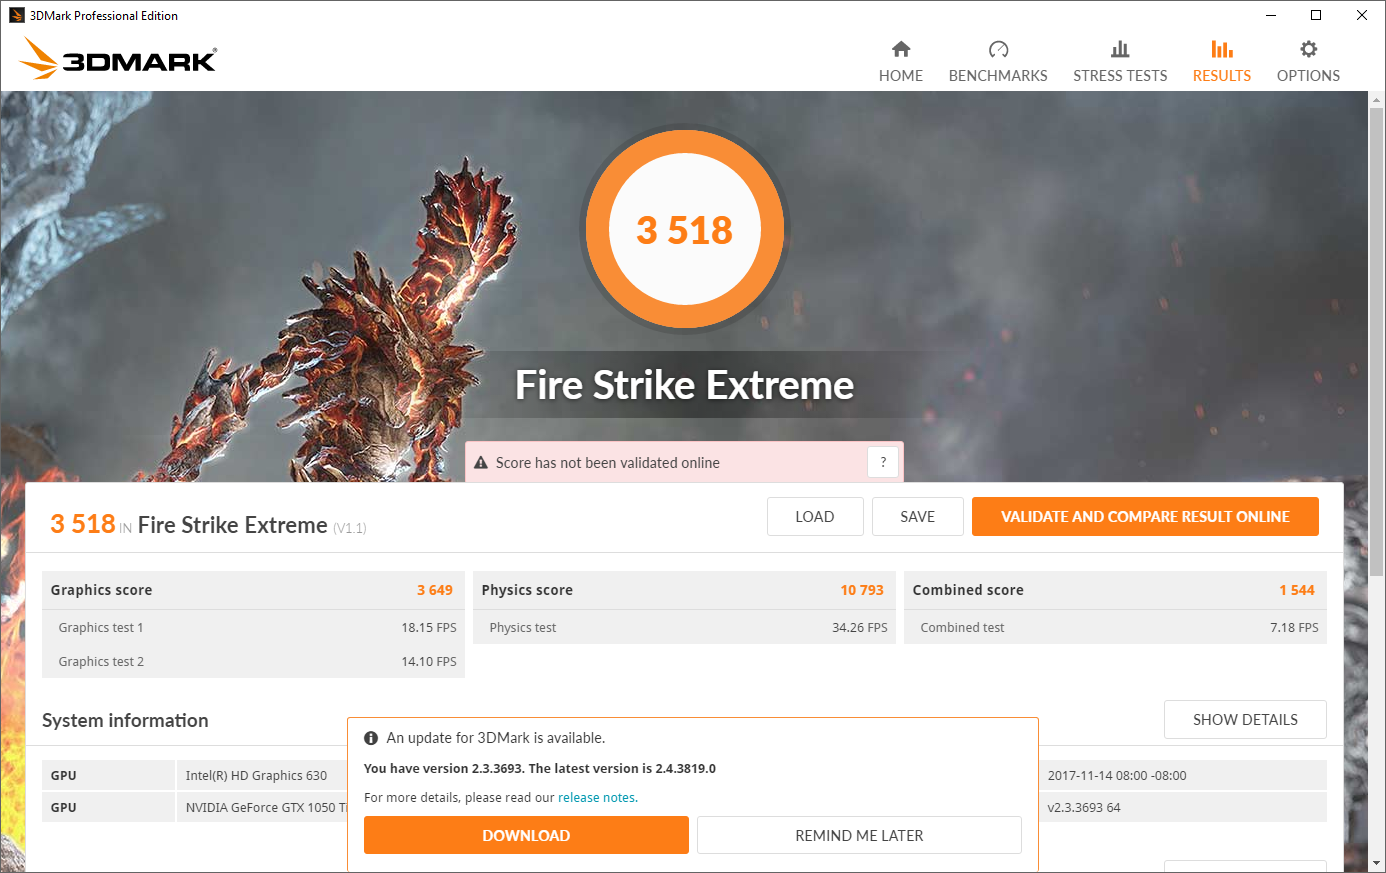
| 3DMark Fire Strike Extreme Score | 3518 points | |
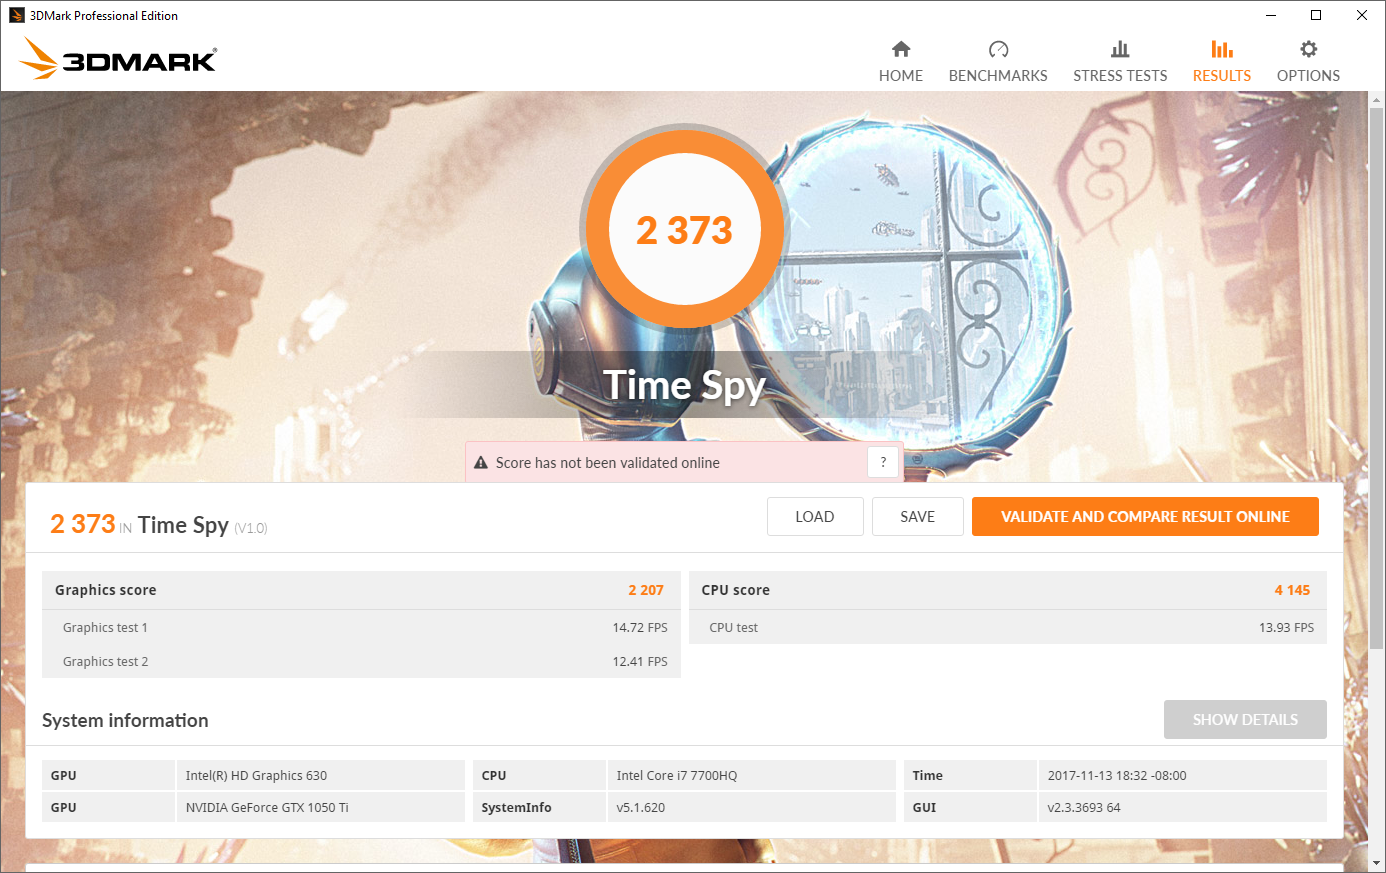
| 3DMark Time Spy Score | 2373 points | |
Help | ||
Gaming Performance
As we have come to expect from the GTX 1050 Ti, the UX550VE handles most games at native resolution (1920x1080) on high settings or below with ease. As shown below in our benchmarks, even Ultra settings are a possibility as long as the user is all right with a little bit of a performance hit.
| Batman: Arkham Knight - 1920x1080 High / On AA:SM AF:16x (sort by value) | |
| Asus Zenbook Pro UX550VE-DB71T | |
| MSI GS63VR 7RF-228US | |
| Dell XPS 15 9560 (i7-7700HQ, UHD) | |
| Doom - 1920x1080 Ultra Preset AA:SM (sort by value) | |
| Asus Zenbook Pro UX550VE-DB71T | |
| Lenovo Yoga 720-15IKB-80X7 | |
| MSI GS63VR 7RF-228US | |
| Dell XPS 15 9560 (i7-7700HQ, UHD) | |
| Rise of the Tomb Raider - 1920x1080 Very High Preset AA:FX AF:16x (sort by value) | |
| Asus Zenbook Pro UX550VE-DB71T | |
| Asus ZenBook Pro UX550VD | |
| Lenovo Yoga 720-15IKB-80X7 | |
| MSI GS63VR 7RF-228US | |
| Dell XPS 15 9560 (i7-7700HQ, UHD) | |
| Microsoft Surface Book 2 | |
| The Witcher 3 - 1920x1080 Ultra Graphics & Postprocessing (HBAO+) (sort by value) | |
| Asus Zenbook Pro UX550VE-DB71T | |
| Asus ZenBook Pro UX550VD | |
| Lenovo Yoga 720-15IKB-80X7 | |
| MSI GS63VR 7RF-228US | |
| Dell XPS 15 9560 (i7-7700HQ, UHD) | |
| Microsoft Surface Book 2 | |
| low | med. | high | ultra | |
|---|---|---|---|---|
| The Witcher 3 (2015) | 24 | |||
| Batman: Arkham Knight (2015) | 37 | |||
| Rise of the Tomb Raider (2016) | 39 | |||
| Doom (2016) | 54 |
Stress Test
Our previous Zenbook Pro review unit struggled to maintain CPU frequencies for more than a minute or two when CPU stress was combined with GPU stress. We’ll be interested to see how the UX550VE, with its newer BIOS version and even more powerful GPU, manages this.
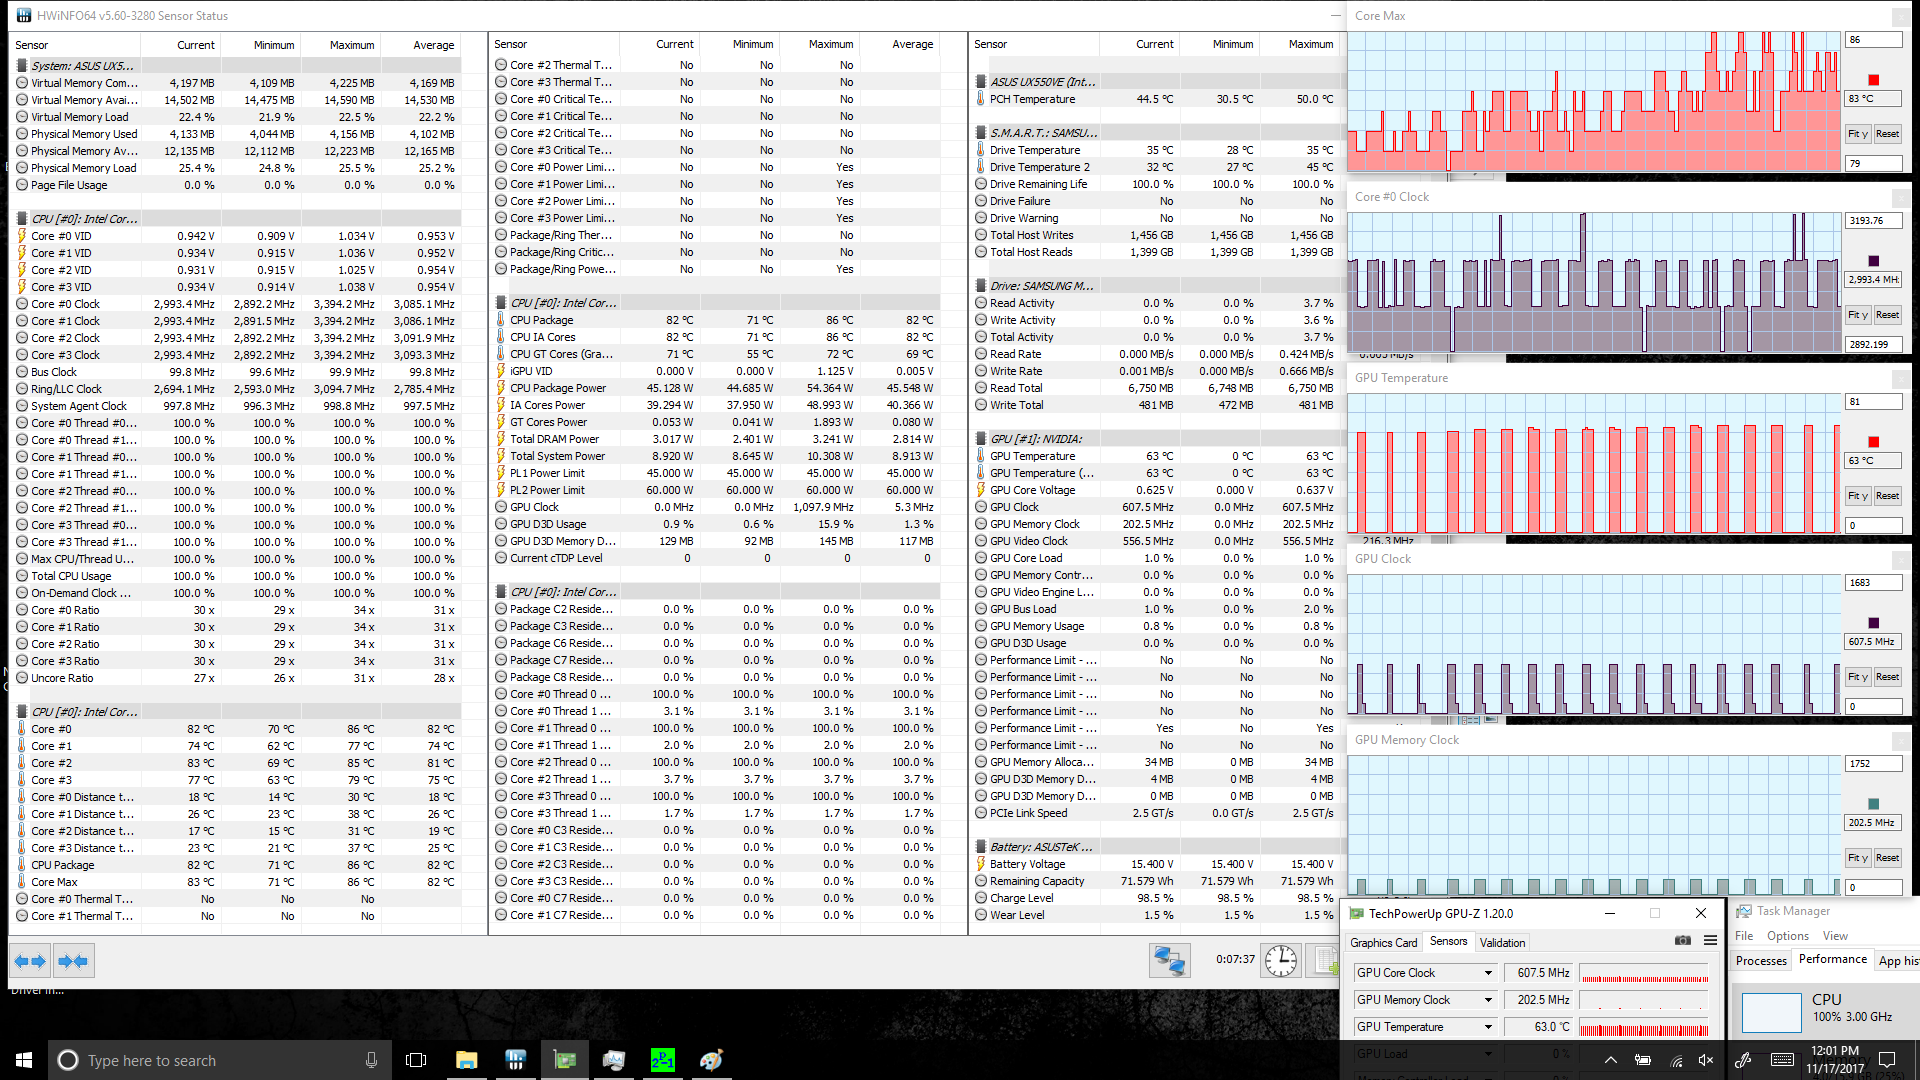
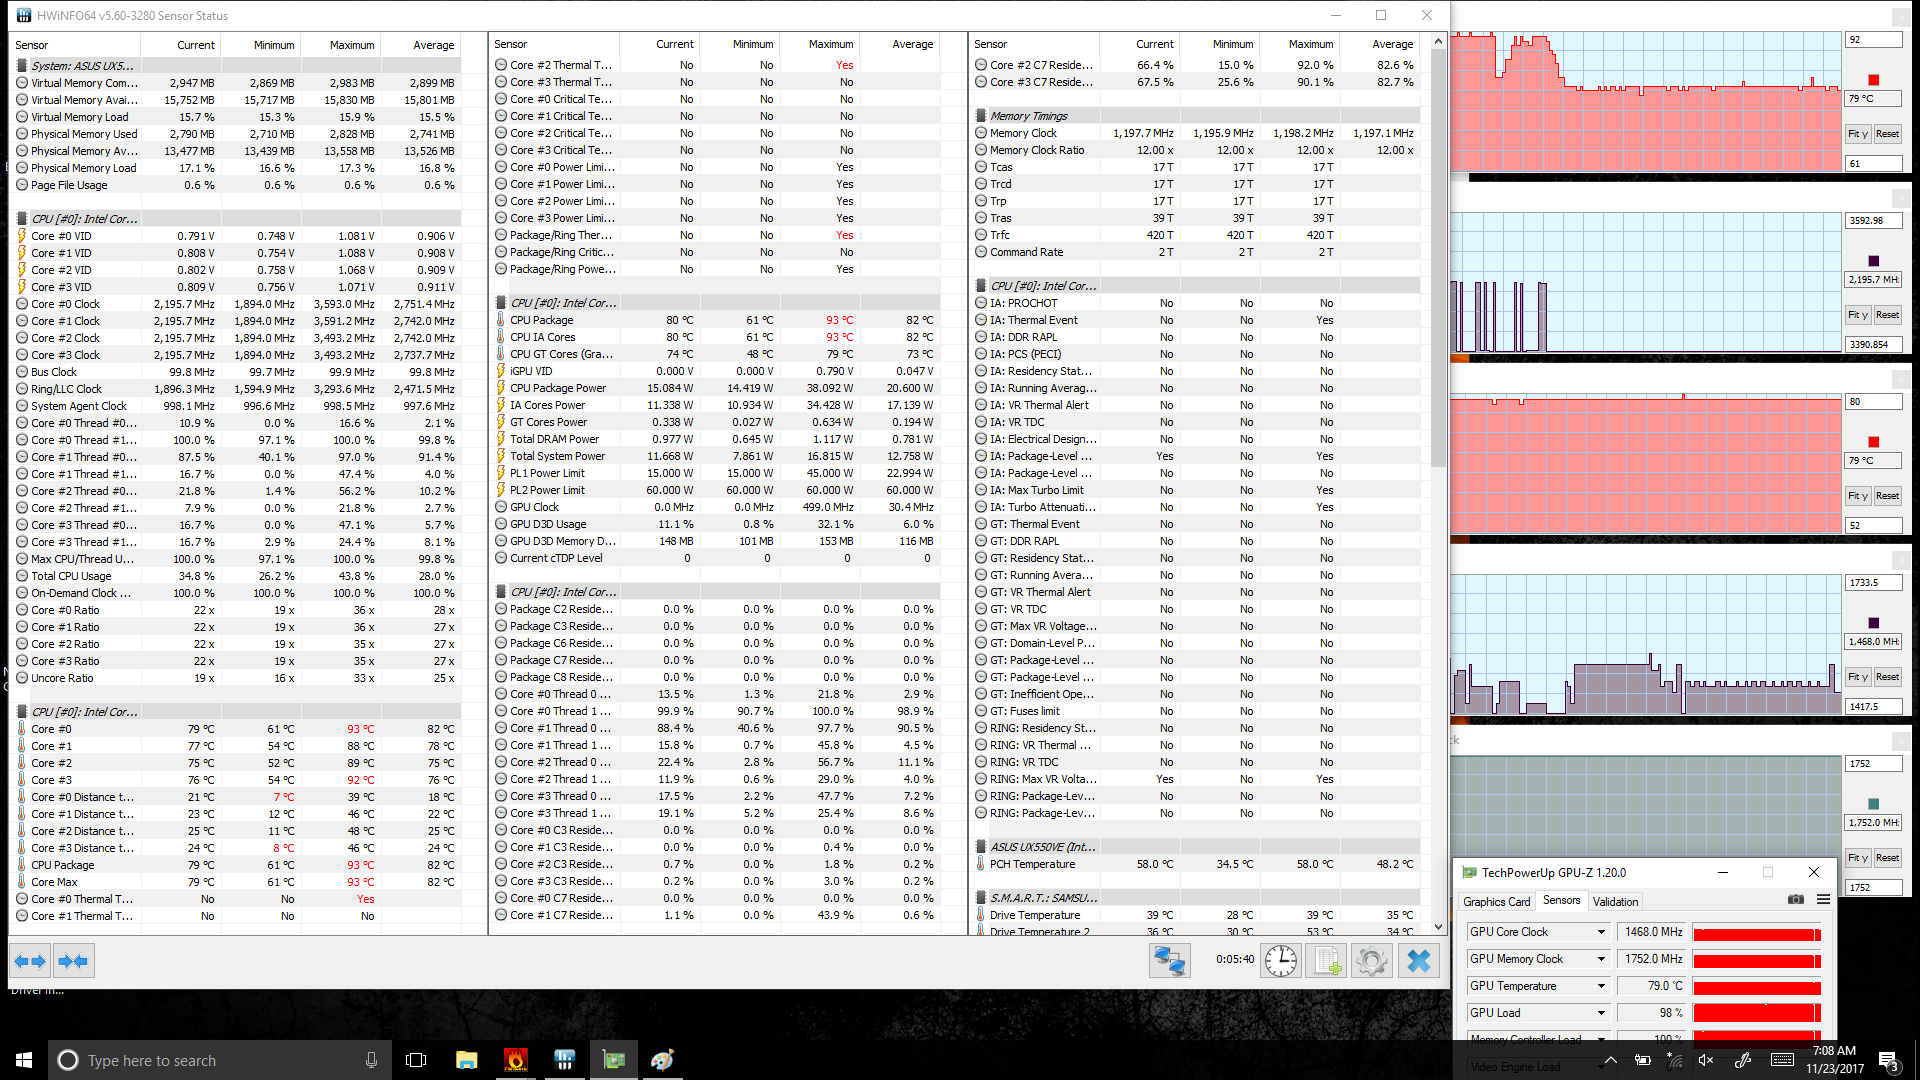
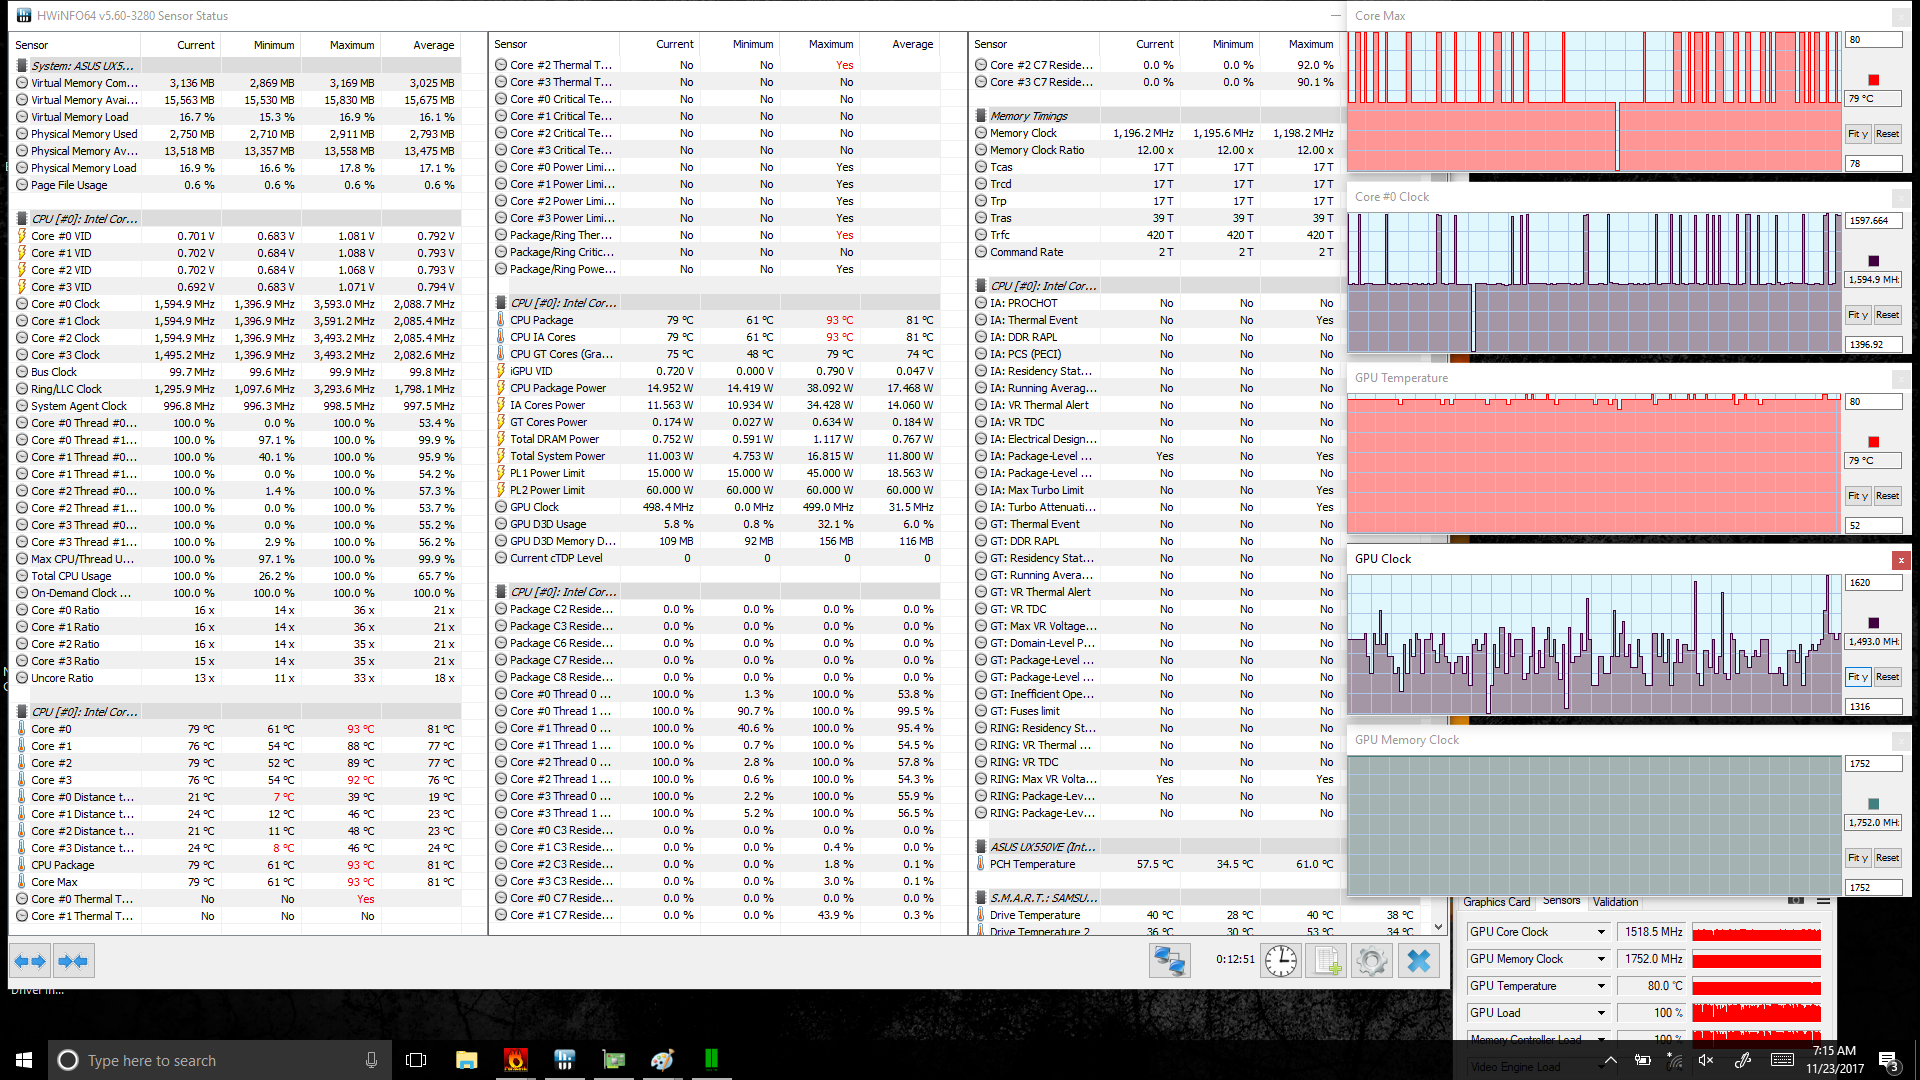
CPU stress by itself is handled slightly better by this latest configuration, with temperatures climbing to around 86 °C and clock rates stabilizing between 3.0 GHz and 3.1 GHz (with occasional spikes to 3.2 GHz). GPU stress, meanwhile, eventually results in clock rates near the base frequency of 1493, with occasional dips below as well as short spikes. Temperatures are stable at 80 °C, which appears to be the firmware-limited maximum for the GPU.
Combined CPU and GPU stress sees chip temperatures of 79 °C and 80 °C for CPU and GPU, respectively, with the GPU maintaining average clock rates in the 1400-1500 MHz range, which mostly amount to frequencies below the base clock rate of 1493 MHz (and thus qualifying as throttling). CPU frequencies are between 1.5 and 1.6 GHz, which is well below the base frequency of 2.8 GHz.
This is synthetic stress, so it’s helpful to be able to discern how much harsh conditions might actually affect real-world performance. A secondary run of 3DMark 06 immediately following full system stress resulted in a score of 26807, only slightly shy of the 27473 we received initially. That’s because it isn’t necessarily high temperatures which are limiting the machine’s performance, but rather moderate temperatures amounting to around 80 °C on average across CPU/GPU and associated power limits. We also monitored clock rates and temperatures during an hour of The Witcher 3 (ultra settings) as a part of our newer Witcher 3 sustained stress test, and though we saw a slight decline in frame rates over the course of the hour, it was only around 1 fps overall (from 24-25 fps down to 23-24).
These two final “real world” assessments of sustained performance potential do seem to confirm a small negative influence on overall performance—but the bottom line is that the upgrade to the GTX 1050 Ti does still yield tangible benefits, even if they aren’t as great as they might have been given better cooling or less restrictive thermal and power limits.
| CPU Clock (GHz) | GPU Clock (MHz) | Average CPU Temperature (°C) | Average GPU Temperature (°C) | |
| Prime95 Stress | 3.0 - 3.1 | - | 86 | - |
| FurMark Stress | - | 1493 | - | 80 |
| Prime95 + FurMark Stress | 1.5 - 1.6 | 1400 - 1500 | 79 | 80 |
Emissions
System Noise
Noise levels were a bit higher than the UX550VD across the board, but the Zenbook Pro still isn’t really any louder than the competition. We measured an idle average of 31 dB(A)—and a maximum of 31.2 dB(A)—which is just slightly above the 28.3 dB(A) ambient noise level. Under load, the noise readings swelled to 46.2 maximum and 43.3 dB(A) average, well above the 39.6 / 38.3 dB(A) values we measured from the UX550VD. Again, though, with max readings from the other three competitors also in the 46-47 dB(A) range, none of this is unreasonable.
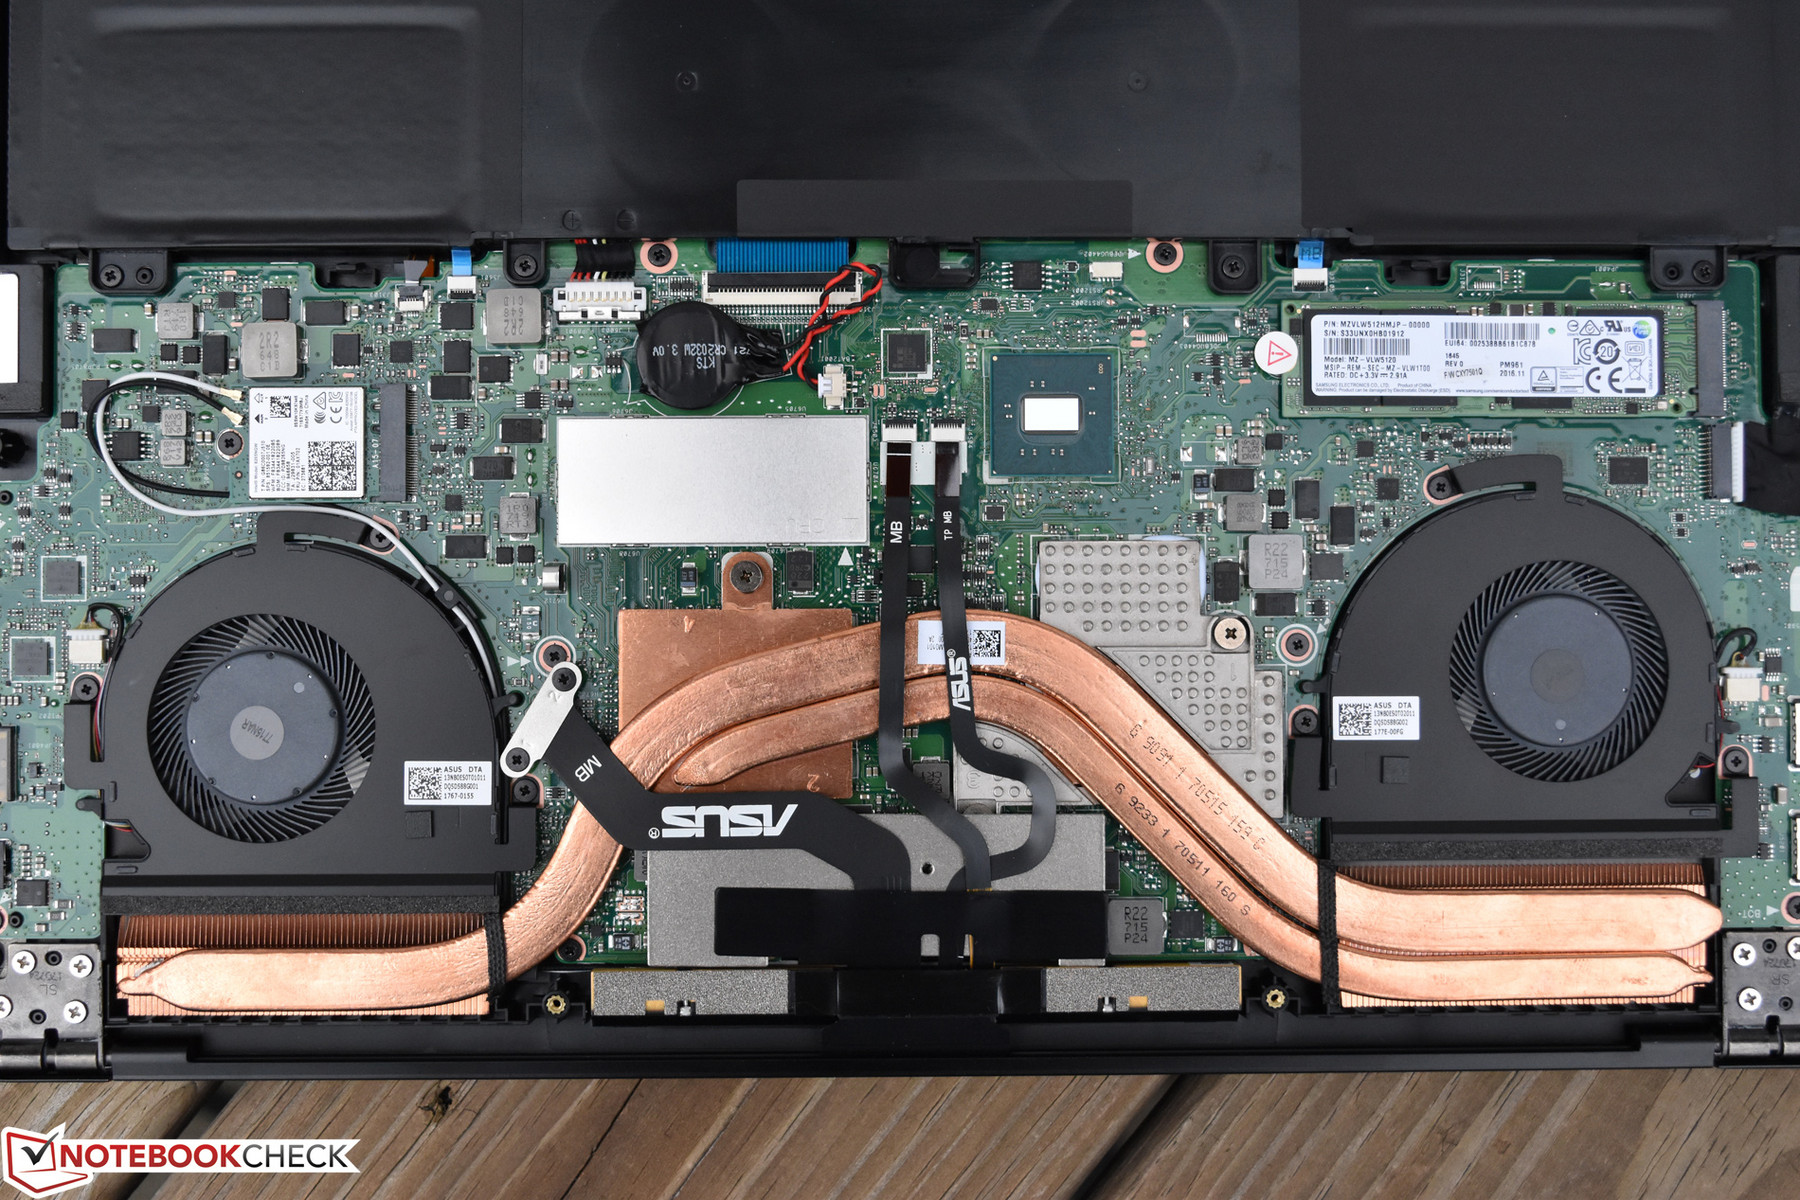
We should mention that our review unit exhibited a conspicuous rattling from one of the two dual fans that resembled a bearings failure. This obviously isn’t something which affects all units, however.
Noise level
| Idle |
| 30.4 / 31 / 31.2 dB(A) |
| Load |
| 43.3 / 46.2 dB(A) |
 | ||
30 dB silent 40 dB(A) audible 50 dB(A) loud |
||
min: | ||
| Asus Zenbook Pro UX550VE-DB71T GeForce GTX 1050 Ti Mobile, i7-7700HQ, Samsung PM961 NVMe MZVLW512HMJP | Asus ZenBook Pro UX550VD GeForce GTX 1050 Mobile, i7-7700HQ, Samsung PM961 NVMe MZVLW512HMJP | Lenovo Yoga 720-15IKB-80X7 GeForce GTX 1050 Mobile, i7-7700HQ, Samsung PM961 MZVLW256HEHP | MSI GS63VR 7RF-228US GeForce GTX 1060 Mobile, i7-7700HQ, Samsung SM961 MZVKW512HMJP m.2 PCI-e | Dell XPS 15 9560 (i7-7700HQ, UHD) GeForce GTX 1050 Mobile, i7-7700HQ, Lite-On CX2-8B512-Q11 | |
|---|---|---|---|---|---|
| Noise | 7% | 6% | -2% | -2% | |
| off / environment * (dB) | 28.3 | 29.4 -4% | 28.2 -0% | 28.8 -2% | 28.4 -0% |
| Idle Minimum * (dB) | 30.4 | 29.4 3% | 28.2 7% | 33.1 -9% | 29 5% |
| Idle Average * (dB) | 31 | 29.9 4% | 28.2 9% | 33.1 -7% | 29 6% |
| Idle Maximum * (dB) | 31.2 | 29.9 4% | 28.2 10% | 34 -9% | 32.2 -3% |
| Load Average * (dB) | 43.3 | 38.3 12% | 39 10% | 37.2 14% | 47.1 -9% |
| Witcher 3 ultra * (dB) | 46.2 | 39.8 14% | 46.1 -0% | 52 -13% | |
| Load Maximum * (dB) | 46.2 | 39.6 14% | 46.3 -0% | 47.1 -2% | 47.1 -2% |
* ... smaller is better
Temperature
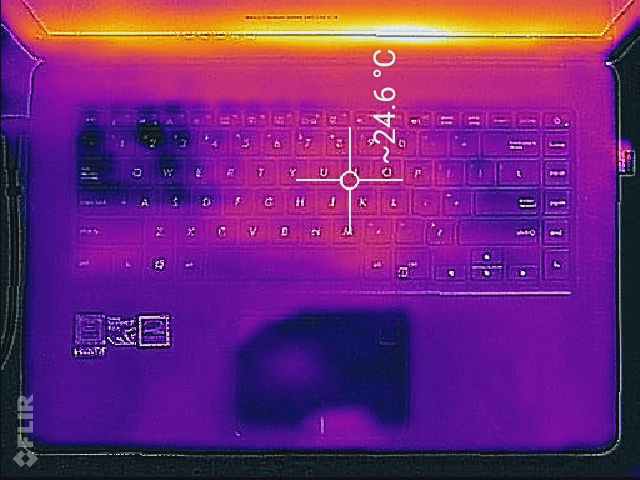
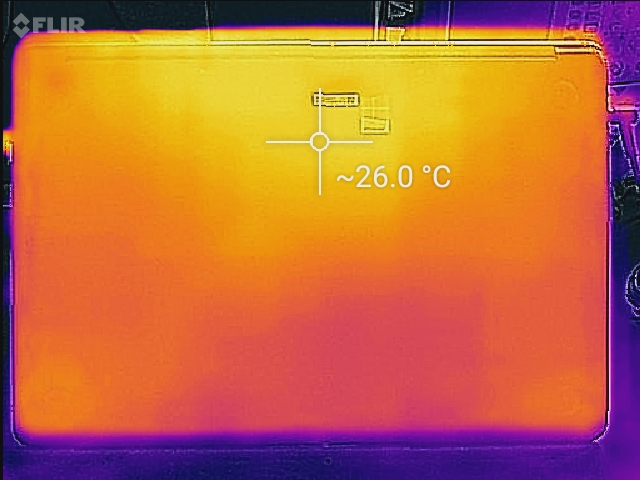
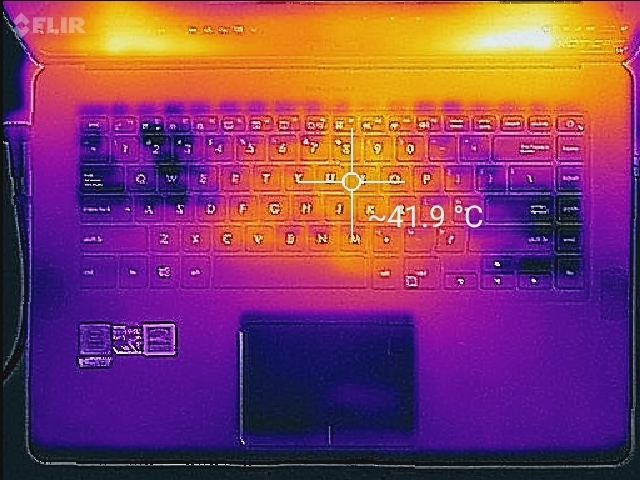
With slightly higher noise levels comes slightly lower temperatures than it predecessor, even in spite of the more powerful GTX 1050 Ti GPU (part of this is a discrepancy in ambient room temperatures of close to 3 °C, so that should also be noted). We measured averages on top and bottom of 33.9 °C and 37.8 °C, with hot spots in the 40s °C, all located across the back edge of the machine (this is compared with 35.6 °C / 38 °C on the UX550VD). The palm rest and touchpad remain cool to the touch under all circumstances, which is a commendable accomplishment by the manufacturer. The center of the keyboard gets quite a bit warmer, but we can’t expect too much from such a slim machine.
(±) The maximum temperature on the upper side is 43.2 °C / 110 F, compared to the average of 36.8 °C / 98 F, ranging from 21 to 71 °C for the class Multimedia.
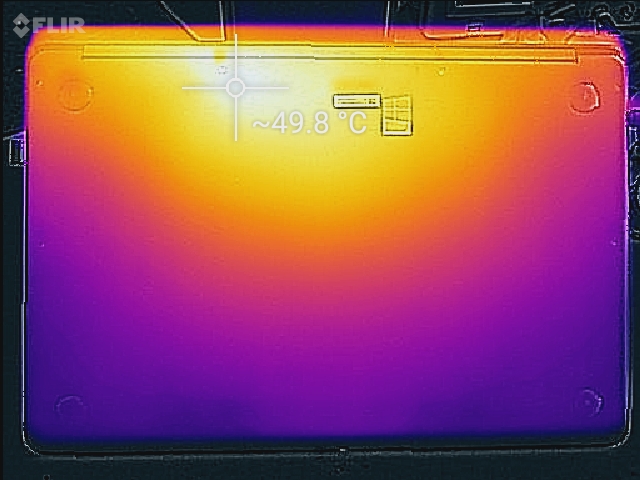
(-) The bottom heats up to a maximum of 49.8 °C / 122 F, compared to the average of 39.1 °C / 102 F
(+) In idle usage, the average temperature for the upper side is 24 °C / 75 F, compared to the device average of 31.3 °C / 88 F.
(+) Playing The Witcher 3, the average temperature for the upper side is 31.7 °C / 89 F, compared to the device average of 31.3 °C / 88 F.
(+) The palmrests and touchpad are cooler than skin temperature with a maximum of 28.4 °C / 83.1 F and are therefore cool to the touch.
(±) The average temperature of the palmrest area of similar devices was 28.7 °C / 83.7 F (+0.3 °C / 0.6 F).
Speakers
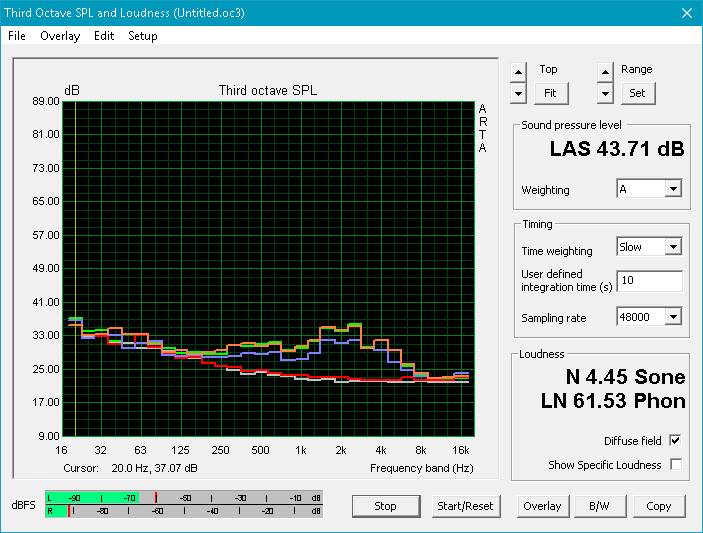
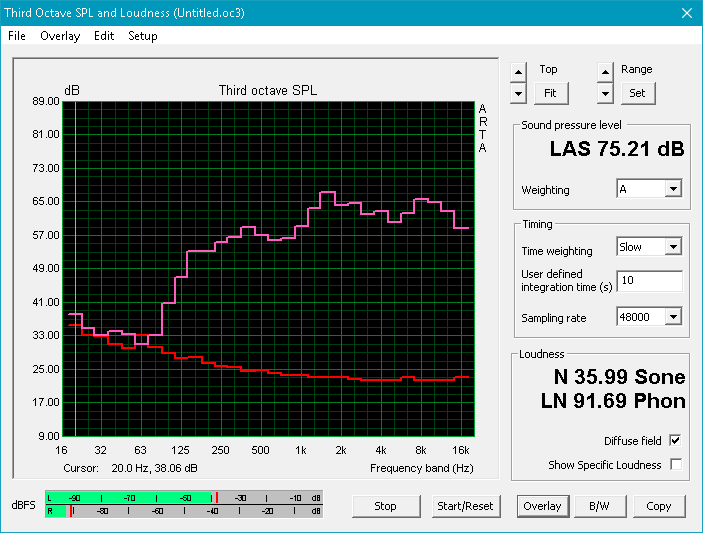
The Zenbook Pro impresses with quality audio for its size especially. We measured 75.21 dB of volume—which is certainly sufficient—and the shape of the sound is fairly linear to boot. Of course, low frequencies are lacking, but overall, the audio from the quad-speaker setup is pleasant and well-balanced.
Asus Zenbook Pro UX550VE-DB71T audio analysis
(±) | speaker loudness is average but good (75.2 dB)
Bass 100 - 315 Hz
(±) | reduced bass - on average 8.2% lower than median
(±) | linearity of bass is average (10.9% delta to prev. frequency)
Mids 400 - 2000 Hz
(+) | balanced mids - only 3.2% away from median
(±) | linearity of mids is average (7% delta to prev. frequency)
Highs 2 - 16 kHz
(+) | balanced highs - only 4.1% away from median
(+) | highs are linear (5.3% delta to prev. frequency)
Overall 100 - 16.000 Hz
(±) | linearity of overall sound is average (16.3% difference to median)
Compared to same class
» 41% of all tested devices in this class were better, 8% similar, 51% worse
» The best had a delta of 5%, average was 17%, worst was 45%
Compared to all devices tested
» 27% of all tested devices were better, 6% similar, 68% worse
» The best had a delta of 4%, average was 24%, worst was 134%
Dell XPS 15 9560 (i7-7700HQ, UHD) audio analysis
(-) | not very loud speakers (70.9 dB)
Bass 100 - 315 Hz
(±) | reduced bass - on average 12.9% lower than median
(±) | linearity of bass is average (14.3% delta to prev. frequency)
Mids 400 - 2000 Hz
(+) | balanced mids - only 3.5% away from median
(±) | linearity of mids is average (8.9% delta to prev. frequency)
Highs 2 - 16 kHz
(+) | balanced highs - only 2.3% away from median
(±) | linearity of highs is average (7.3% delta to prev. frequency)
Overall 100 - 16.000 Hz
(±) | linearity of overall sound is average (16.2% difference to median)
Compared to same class
» 41% of all tested devices in this class were better, 7% similar, 51% worse
» The best had a delta of 5%, average was 17%, worst was 45%
Compared to all devices tested
» 26% of all tested devices were better, 6% similar, 68% worse
» The best had a delta of 4%, average was 24%, worst was 134%
Frequency Comparison (Checkbox selectable!)
Graph 1: Pink Noise 100% Vol.; Graph 2: Audio off
Energy Management
Power Consumption
Idle power consumption was once again very low on the Zenbook Pro GTX 1050 Ti configuration, with an idle average of just 7.9 W. Meanwhile, we recorded a load maximum of 102.4 W, which is oddly enough below the measurement of 120 W we have in our database from the UX550VD. This is likely due to the proclivity of the system to throttle at conservative temperature limits; either as a result of BIOS differences or the temperature of the machine upon the start of the power consumption test, today's review unit likely began the throttling behavior earlier than our previous test machine.
| Off / Standby | |
| Idle | |
| Load |
|
Key:
min: | |
| Asus Zenbook Pro UX550VE-DB71T i7-7700HQ, GeForce GTX 1050 Ti Mobile, Samsung PM961 NVMe MZVLW512HMJP, IPS, 1920x1080, 15.6" | Asus ZenBook Pro UX550VD i7-7700HQ, GeForce GTX 1050 Mobile, Samsung PM961 NVMe MZVLW512HMJP, IPS, 1920x1080, 15.6" | Lenovo Yoga 720-15IKB-80X7 i7-7700HQ, GeForce GTX 1050 Mobile, Samsung PM961 MZVLW256HEHP, IPS, 1920x1080, 15.6" | MSI GS63VR 7RF-228US i7-7700HQ, GeForce GTX 1060 Mobile, Samsung SM961 MZVKW512HMJP m.2 PCI-e, IPS, 3840x2160, 15.6" | Dell XPS 15 9560 (i7-7700HQ, UHD) i7-7700HQ, GeForce GTX 1050 Mobile, Lite-On CX2-8B512-Q11, IGZO IPS, 3840x2160, 15.6" | |
|---|---|---|---|---|---|
| Power Consumption | -8% | -14% | -82% | -60% | |
| Idle Minimum * (Watt) | 6.3 | 5.05 20% | 8.3 -32% | 14.5 -130% | 11.9 -89% |
| Idle Average * (Watt) | 7.9 | 8.2 -4% | 10.2 -29% | 17.3 -119% | 17.1 -116% |
| Idle Maximum * (Watt) | 8.1 | 12.2 -51% | 10.4 -28% | 17.4 -115% | 17.3 -114% |
| Load Average * (Watt) | 84.9 | 82 3% | 67.5 20% | 93 -10% | 94.7 -12% |
| Witcher 3 ultra * (Watt) | 96.3 | 93.1 3% | 96.5 -0% | 128.8 -34% | 104.8 -9% |
| Load Maximum * (Watt) | 102.4 | 120 -17% | 117.2 -14% | 122 -19% |
* ... smaller is better
Battery Life
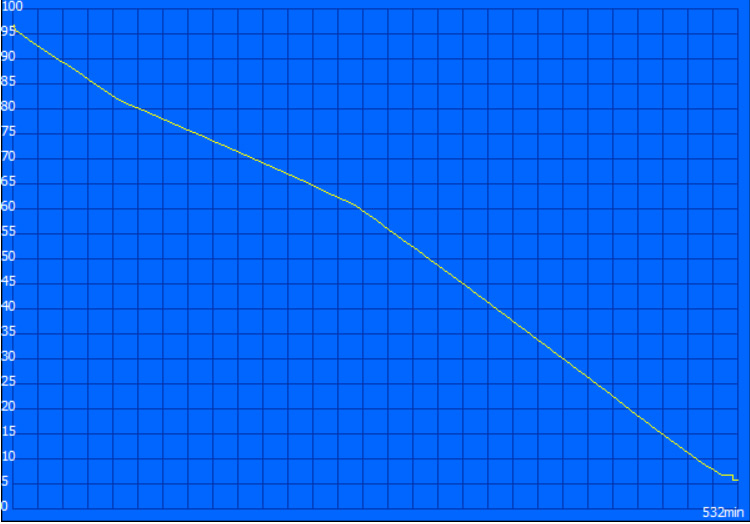
Battery life was, rather unsurprisingly, essentially identical to that of the Zenbook Pro UX550VD. The machine lasted 8 hours and 52 minutes in our web surfing benchmark, which is notably better than most of the competition, with the exception of the passively-cooled Microsoft Surface Book 2 (which managed 11 hours and 3 minutes. Top-rated competitors like the Dell XPS 15 yield more than an hour less in terms of battery runtimes in this test.
Meanwhile, under minimal load, the device lasted for 17 hours and 3 minutes, whereas the Battery Eater Classic Test (heavy load) lasted for 1 hour and 10 minutes.


| Asus Zenbook Pro UX550VE-DB71T i7-7700HQ, GeForce GTX 1050 Ti Mobile, 73 Wh | Asus ZenBook Pro UX550VD i7-7700HQ, GeForce GTX 1050 Mobile, 73 Wh | Lenovo Yoga 720-15IKB-80X7 i7-7700HQ, GeForce GTX 1050 Mobile, 72 Wh | MSI GS63VR 7RF-228US i7-7700HQ, GeForce GTX 1060 Mobile, 65 Wh | Dell XPS 15 9560 (i7-7700HQ, UHD) i7-7700HQ, GeForce GTX 1050 Mobile, 97 Wh | Microsoft Surface Book 2 i7-8650U, GeForce GTX 1050 Mobile, 75 Wh | |
|---|---|---|---|---|---|---|
| Battery runtime | 1% | 9% | -37% | 1% | 78% | |
| Reader / Idle (h) | 17.1 | 17.7 4% | 17.8 4% | 6.4 -63% | 13.9 -19% | 24.5 43% |
| WiFi v1.3 (h) | 8.9 | 8.9 0% | 8.1 -9% | 3.9 -56% | 7.2 -19% | 11.1 25% |
| Load (h) | 1.2 | 1.2 0% | 1.6 33% | 1.3 8% | 1.7 42% | 3.2 167% |
| Witcher 3 ultra (h) | 1.1 | 3.8 |
Pros
Cons
Verdict

The $1,700 ASUS Zenbook Pro UX550VE, with its GTX 1050 Ti, improves upon the performance of the GTX 1050-equipped UX550VD with very few associated drawbacks. We’re granted the same attractive unibody aluminum case, which provides reasonable weight and size as well as a versatile port selection (though the latter, which substitutes two conventional USB Type-A ports for Thunderbolt/Type-C, may be slightly ahead of its time). The device also manages strong performance in short bursts (as well as for general application use) all while maintaining battery runtimes which fare well against those of the competition. On top of it all, the machine is relatively easily maintained via the removable back panel.
Overall, the Zenbook Pro nevertheless remains a compelling package, without any major negatives apart from some unfortunate performance throttling under sustained load.
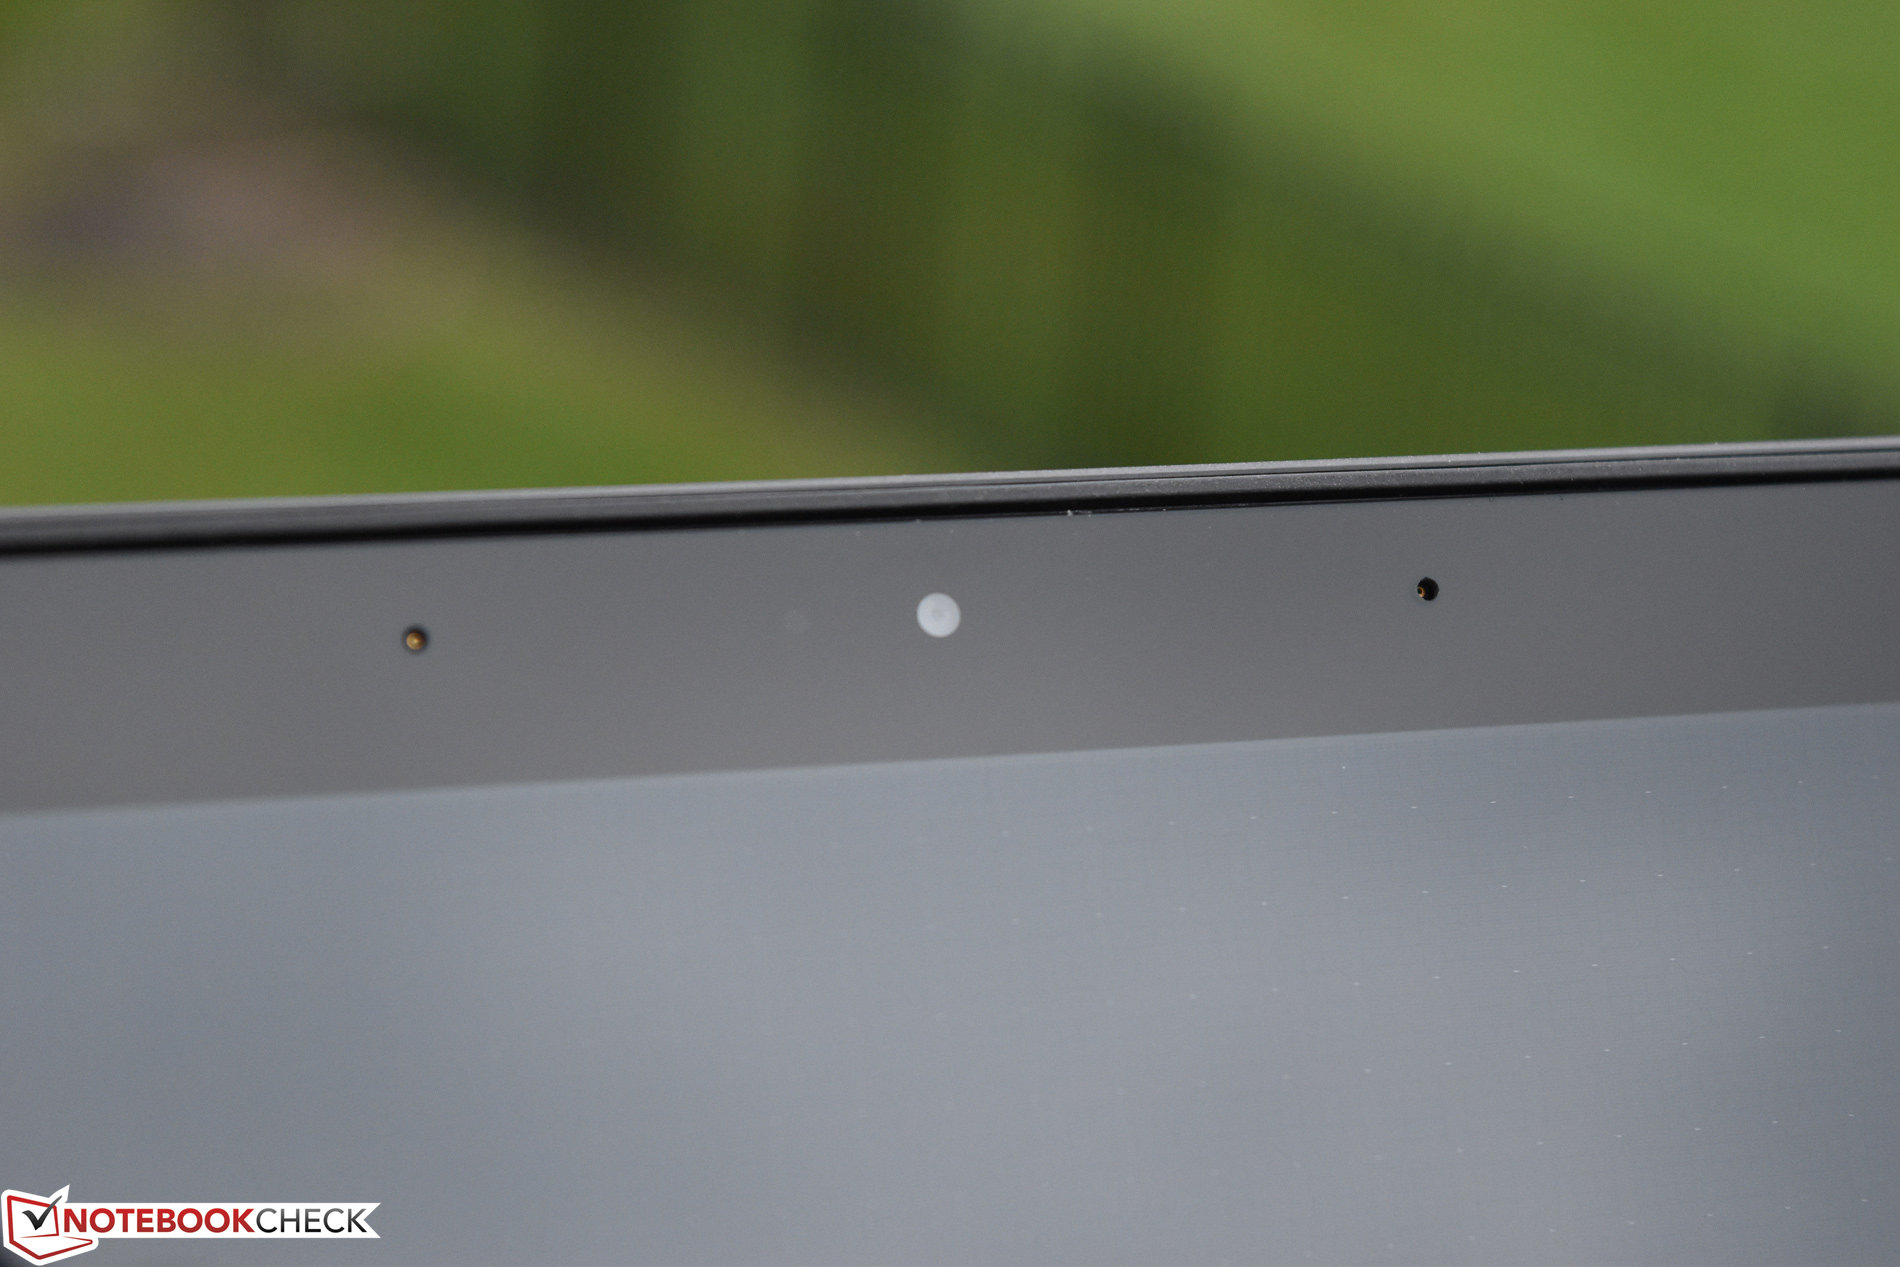
Returning complaints from our previous review unit include CPU and GPU throttling under combined load, as well as the fact that the GTX 1050 Ti never shows its full potential in the Zenbook Pro even when stressed independently. Performance is still well above the GTX 1050 model—as well as most other competitors of comparable size in its class—but it could have been even better with a bit more aggressive cooling. Noise levels were also quite a bit higher under load (as measured via today's review unit, which, of course, was hobbled by what appeared to be a bad cooling fan), so that's another potential shortfall versus the previous model. Apart from this, a few other minor grievances apply—such as the poor webcam and the use of PWM (albeit, high frequency) at brightness settings below 30%, but that’s really the only other significant negatives.
Sturdier cases, better input devices, and higher-quality screens can all be had on pricier competing notebooks as well. Some worthwhile alternatives include—among others—the Dell XPS 15 9560, Lenovo Yoga 720, MSI GS63VR, and Microsoft Surface Book 2. But overall, the Zenbook Pro nevertheless remains a compelling package, without any major negatives apart from some unfortunate performance throttling under sustained load.
Asus Zenbook Pro UX550VE-DB71T
- 11/23/2017 v6 (old)
Steve Schardein
Price comparison
