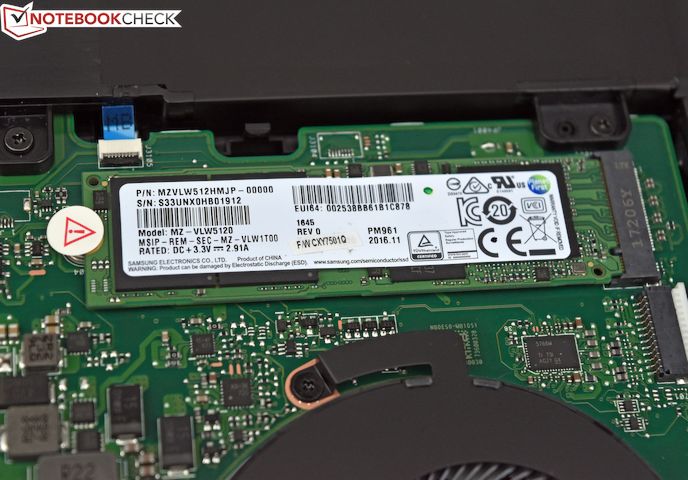
Notebook reviews with Samsung PM961 NVMe MZVLW512HMJP
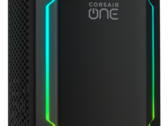
Corsair One i160 Gaming PC Review: A 12 litre machine with a Core i9-9900K and RTX 2080 Ti
The Corsair One i160 is a compact gaming PC that packs extremely powerful hardware into an impressively small case. Corsair has included a proprietary and patented liquid cooling system to keep the Core i9-9900K and RTX 2080 Ti cool even during long gaming sessions, which it complements with 32 GB of DDR4-2666 RAM and plenty of storage. Read on to find out how well the Corsair One i160 performs in our tests and whether its liquid cooling system is up to scratch.
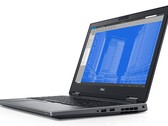
Intel Core i9-9900K, NVIDIA GeForce RTX 2080 Ti (Desktop), 32", 7.4 kgDell Precision 7530 (i9-8950HK, Quadro P3200) Workstation Review
Dell crams in one of the fastest mobile Intel CPUs into a thinner chassis than the last generation Precision 7510. Can owners really get the full performance out of the processor? Or is it throttle city?
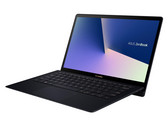
Intel Core i9-8950HK, NVIDIA Quadro P3200, 15.6", 2.6 kgAsus ZenBook S UX391U (Core i7, FHD) Laptop Review
The ZenBook S (UX391) is a particularly light 13.3-inch laptop from Asus. It tips the scale at just 1 kg, but the manufacturer says the performance is not affected. We review the rival for the XPS 13.
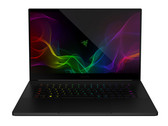
Intel Core i7-8550U, UHD Graphics 620, 13.3", 1 kgRazer Blade 15 (i7-8750H, GTX 1070 Max-Q, FHD) Laptop Review
Overachiever. As a successor to the high-class 14-inch Blade, Razer has introduced a new compact gaming notebook with 15-inch edge-to-edge display. Find out how well the slim gaming notebook performed against its competitors in our extensive review.
Intel Core i7-8750H, NVIDIA GeForce GTX 1070 Max-Q, 15.6", 2.1 kgAsus VivoBook Pro 17 N705UD (i7-8550U, GTX 1050) Laptop Review
Power on a budget. The 17-inch counterpart to the VivoBook Pro we reviewed last year is now in our labs. Now equipped with an 8th-gen Intel CPU, IPS display, and NVMe SSD, can it resolve the quibbles which plagued the previous unit? Our full review awaits.
Intel Core i7-8550U, NVIDIA GeForce GTX 1050 Mobile, 17.3", 2.3 kgHP Spectre 13-af033ng: Intel Core i7-8550U Intel UHD Graphics 620, 13.30", 1.1 kg
Review » HP Spectre 13-af033 (i7-8550U, FHD) Laptop Review
Lenovo ThinkPad P71-20HK0004GE: Intel Core i7-7820HQ NVIDIA Quadro P3000, 17.30", 3.5 kg
Review » Lenovo ThinkPad P71 (i7, P3000, 4K) Workstation Review
HP EliteBook x360 1020 G2: Intel Core i7-7600U Intel HD Graphics 620, 12.50", 1.1 kg
Review » HP EliteBook x360 1020 G2 (i7-7600U, FHD Sure View) Convertible Review
Lenovo IdeaPad 320S-13IKB: Intel Core i5-8250U NVIDIA GeForce MX150, 13.30", 1.2 kg
Review » Lenovo IdeaPad 320S-13IKBR (i5-8250U, MX150) Laptop Review
Razer Blade (2017) UHD: Intel Core i7-7700HQ NVIDIA GeForce GTX 1060 Mobile, 14.00", 1.9 kg
Review » Razer Blade (2017) UHD Laptop Review
Razer Blade Stealth QHD i7-8550U: Intel Core i7-8550U Intel UHD Graphics 620, 13.30", 1.4 kg
Review » Razer Blade Stealth (QHD i7-8550U) Laptop Review
Asus Zenbook Pro UX550VE-DB71T: Intel Core i7-7700HQ NVIDIA GeForce GTX 1050 Ti Mobile, 15.60", 1.9 kg
Review » Asus Zenbook Pro UX550VE (i7-7700HQ, GTX 1050 Ti) Laptop Review
HP Spectre x360 15t-bl100: Intel Core i7-8550U NVIDIA GeForce MX150, 15.60", 2 kg
Review » HP Spectre x360 15t-bl100 (i7-8550U, MX150) Convertible Review
Dell Inspiron 15 7570: Intel Core i7-8550U NVIDIA GeForce 940MX, 15.60", 2 kg
Review » Dell Inspiron 15 7570 (i7-8550U, 940MX) Laptop Review
Asus ZenBook Pro UX550VD: Intel Core i7-7700HQ NVIDIA GeForce GTX 1050 Mobile, 15.60", 1.9 kg
Review » Asus ZenBook Pro UX550VD (i7, GTX 1050, Full HD) Laptop Review
Lenovo ThinkPad X1 Carbon 2017-20HR006FGE: Intel Core i5-7200U Intel HD Graphics 620, 14.00", 1.1 kg
Review » Display Check: Lenovo ThinkPad X1 Carbon 2017 (i5, WQHD) Laptop
Lenovo ThinkPad P51 20HH0016GE: Intel Xeon E3-1505M v6 NVIDIA Quadro M2200, 15.60", 2.6 kg
Review » Lenovo ThinkPad P51 (Xeon, 4K) Workstation Review
Lenovo ThinkPad T470p-20J7S00000 : Intel Core i7-7700HQ NVIDIA GeForce 940MX, 14.00", 1.9 kg
Review » Lenovo ThinkPad T470p (Core i7, GeForce 940MX) Laptop Review
Lenovo ThinkPad T570-20HAS01E00: Intel Core i7-7500U NVIDIA GeForce 940MX, 15.60", 2 kg
Review » Lenovo ThinkPad T570 (Core i7, 4K, 940MX) Laptop Review
Lenovo Thinkpad L570 20J9S01600: Intel Core i5-7200U Intel HD Graphics 620, 15.60", 2.4 kg
Review » Lenovo ThinkPad L570 (7200U, Full HD) Laptop Review
HP Spectre x360 13-ac033dx: Intel Core i7-7500U Intel HD Graphics 620, 13.30", 1.3 kg
Review » HP Spectre x360 13 (7500U, 4K UHD) Convertible Review
HP Spectre 13-v131ng: Intel Core i7-7500U Intel HD Graphics 620, 13.30", 1.1 kg
Review » HP Spectre 13 (Core i7, Full-HD) Laptop Review
Lenovo ThinkPad X1 Carbon 2017-20HQS03P00: Intel Core i7-7500U Intel HD Graphics 620, 14.00", 1.1 kg
Review » Lenovo ThinkPad X1 Carbon 2017 (Core i7, Full-HD) Laptop Review
Lenovo ThinkPad T470-20HD002HGE: Intel Core i5-7200U Intel HD Graphics 620, 14.00", 1.7 kg
Review » Lenovo ThinkPad T470 (Core i5, Full-HD) Notebook Review
Lenovo IdeaPad 710S Plus-13IKB: Intel Core i7-7500U NVIDIA GeForce 940MX, 13.30", 1.1 kg
Review » Lenovo IdeaPad 710S Plus (Core i7) Subnotebook Review
HP ZBook x2 G4-3KK88AA: Intel Core i7-8650U NVIDIA Quadro M620, 14.00"
External Review » HP ZBook x2 G4-3KK88AA
Asus VivoBook Pro 17 N705UD-EH76: Intel Core i7-8550U NVIDIA GeForce GTX 1050 Mobile, 17.30", 2.3 kg
External Review » Asus VivoBook Pro 17 N705UD-EH76
Asus ZenBook S UX391U: Intel Core i7-8550U Intel UHD Graphics 620, 13.30", 1 kg
External Review » Asus ZenBook S UX391U
Razer Blade 15 2018: Intel Core i7-8750H NVIDIA GeForce GTX 1070 Max-Q, 15.60", 2.1 kg
External Review » Razer Blade 15 2018
Razer Blade (2017) UHD: Intel Core i7-7700HQ NVIDIA GeForce GTX 1060 Mobile, 14.00", 1.9 kg
External Review » Razer Blade (2017) UHD
HP Spectre 13-af033ng: Intel Core i7-8550U Intel UHD Graphics 620, 13.30", 1.1 kg
External Review » HP Spectre 13-af033ng
Asus Zenbook Pro UX550VE-DB71T: Intel Core i7-7700HQ NVIDIA GeForce GTX 1050 Ti Mobile, 15.60", 1.9 kg
External Review » Asus Zenbook Pro UX550VE-DB71T
Razer Blade Stealth QHD i7-8550U: Intel Core i7-8550U Intel UHD Graphics 620, 13.30", 1.4 kg
External Review » Razer Blade Stealth QHD i7-8550U
HP Spectre x360 15t-bl100: Intel Core i7-8550U NVIDIA GeForce MX150, 15.60", 2 kg
External Review » HP Spectre x360 15t-bl100
HP EliteBook x360 1020 G2: Intel Core i7-7600U Intel HD Graphics 620, 12.50", 1.1 kg
External Review » HP EliteBook x360 1020 G2
HP Spectre x360 13-ac033dx: Intel Core i7-7500U Intel HD Graphics 620, 13.30", 1.3 kg
External Review » HP Spectre x360 13-ac033dx
Dell Inspiron 15 7570: Intel Core i7-8550U NVIDIA GeForce 940MX, 15.60", 2 kg
External Review » Dell Inspiron 15-7570
Medion Erazer X7857: Intel Core i7-7820HK NVIDIA GeForce GTX 1070 Mobile, 17.30", 3.1 kg
External Review » Medion Erazer X7857
Lenovo ThinkPad T470-20HD002HGE: Intel Core i5-7200U Intel HD Graphics 620, 14.00", 1.7 kg
External Review » Lenovo ThinkPad T470-20HD002HGE
Lenovo IdeaPad 710S Plus-13IKB: Intel Core i7-7500U NVIDIA GeForce 940MX, 13.30", 1.1 kg
External Review » Lenovo IdeaPad 710S Plus-13IKB
Lenovo ThinkPad X1 Carbon 2017-20HQS03P00: Intel Core i7-7500U Intel HD Graphics 620, 14.00", 1.1 kg
External Review » Lenovo ThinkPad X1 Carbon 2017-20HQS03P00
Lenovo ThinkPad T470p-20J7S00000 : Intel Core i7-7700HQ NVIDIA GeForce 940MX, 14.00", 1.9 kg
Article » Comparison: NVIDIA GeForce MX150 vs NVIDIA GeForce 940MX