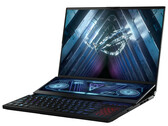
Asus ROG Zephyrus Duo 16 review: An unusual gaming laptop with a good battery life
A Ryzen 9 6900HX APU and GeForce RTX 3080 Ti Laptop GPU bring all the current games smoothly to the matte 4k screen (IPS, DCI P3, FreeSync) in the 16:10 format. They are accompanied by 4 TB of storage (RAID 0), 64 GB of working memory, and a surprisingly good battery life.
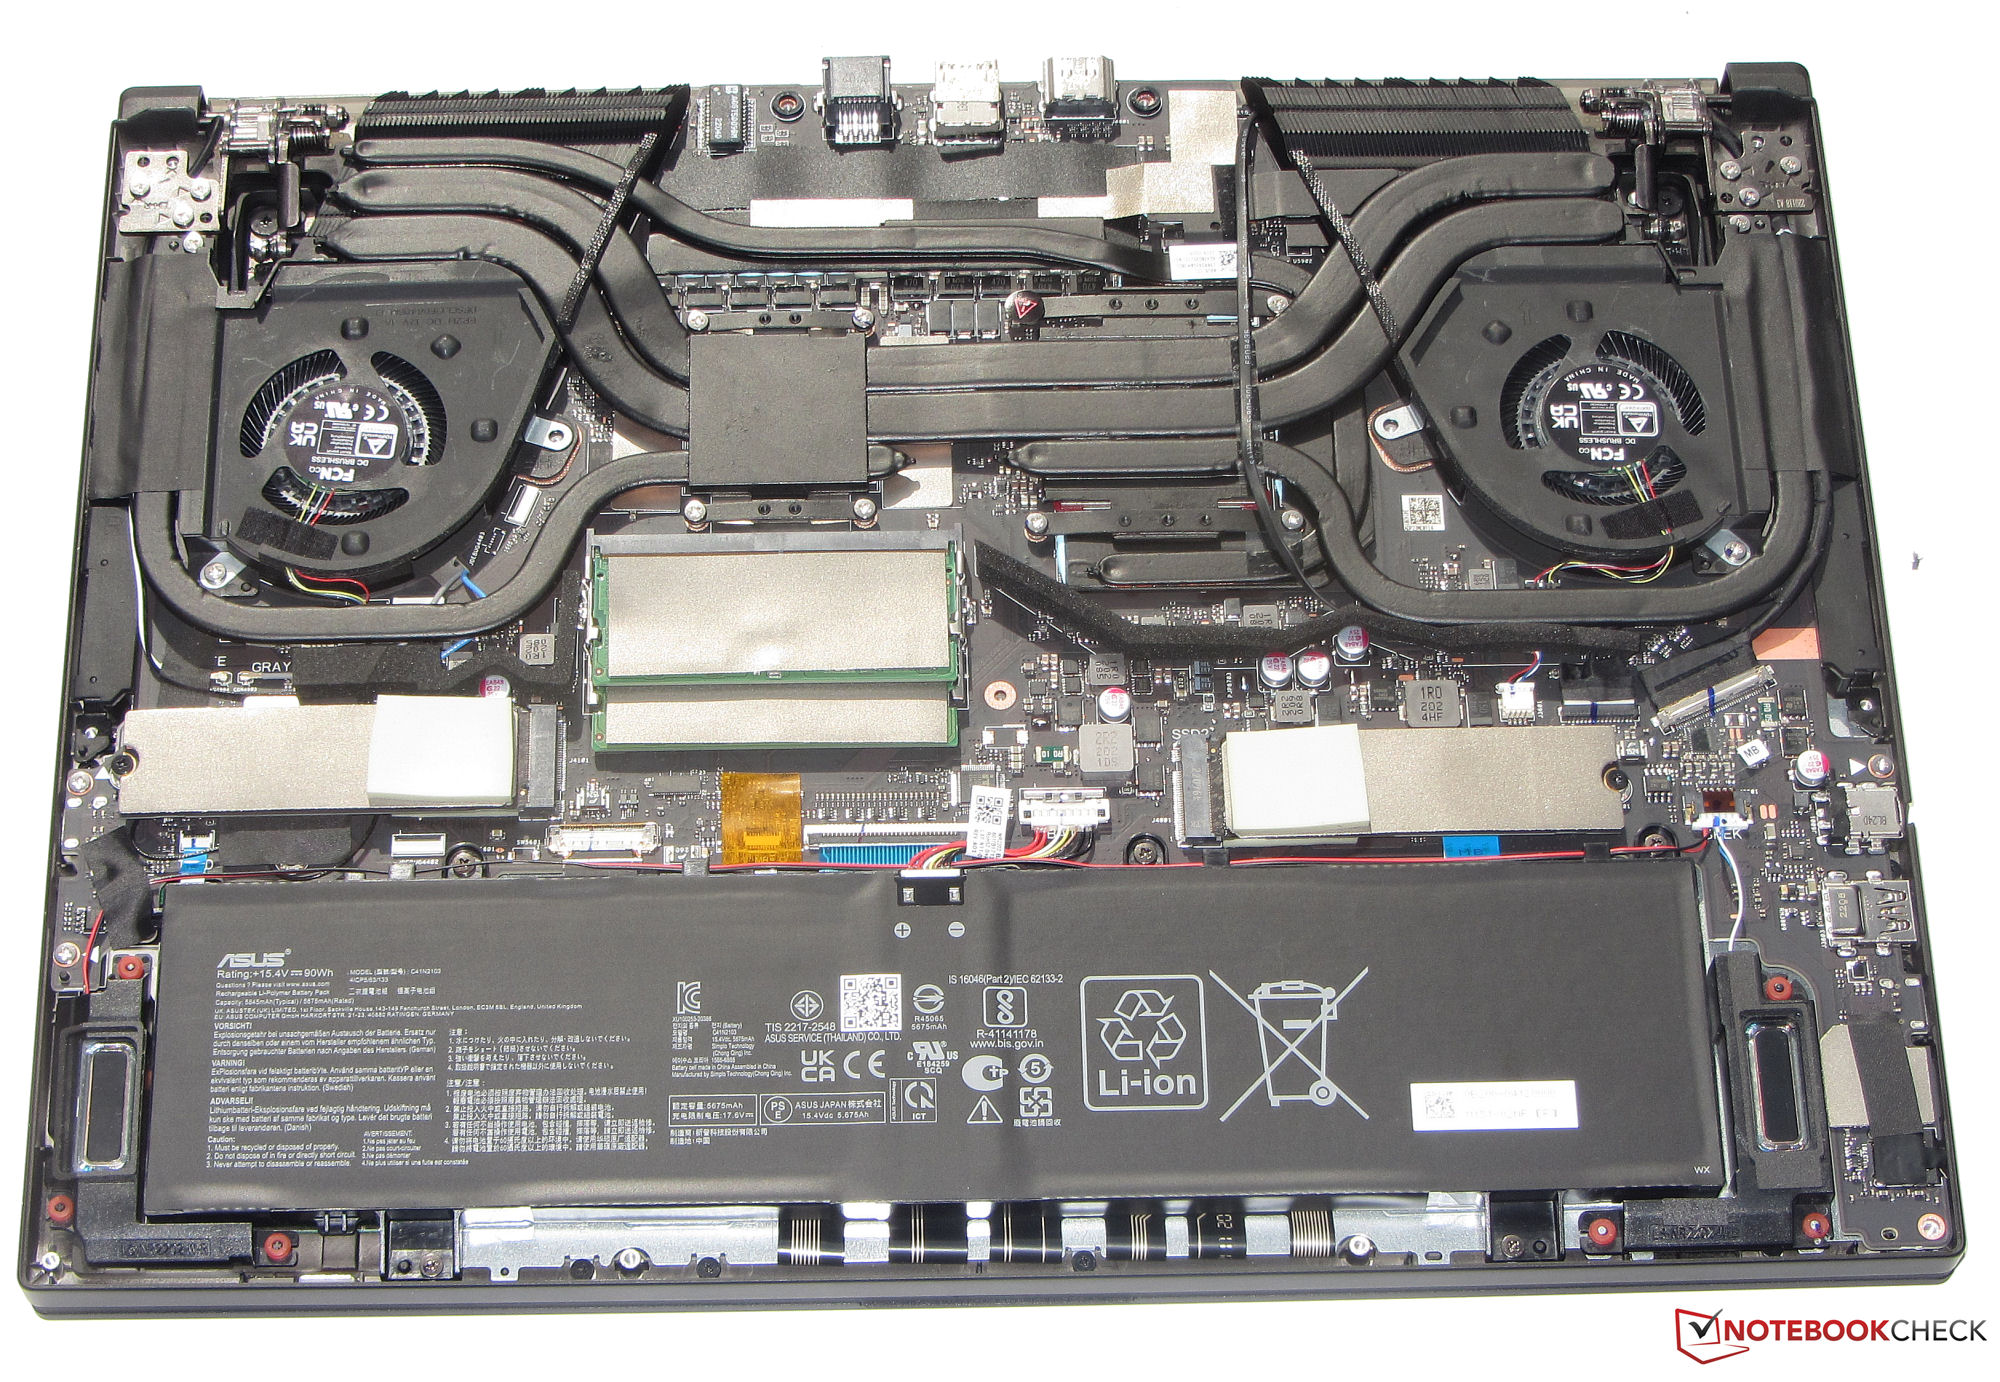
AMD Ryzen 9 6900HX, NVIDIA GeForce RTX 3080 Ti Laptop GPU, 16", 2.6 kg