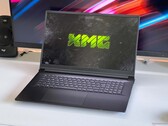
Kingston Fury Renegade SFYRS500G

The 500G Kingston FURY Renegade PCIe 4.0 NVMe M.2 SSD is a fast high end solid disk drive with the part number SFYRS500G. It is specified with a maximum read write of 7,300 MB/s and write of 3,900 MB/s (down from 6,000 of the 1TB version). It is available with a heatsink or a low-profile heat spreader and rated as "PS5 ready".
| Type | NVMe |
| Size | M.2-2280 |
| Capacity | 500 GB |
| Interface | NVMe |
| Controller | Phison PS5018-E18, 8 Kanäle |
| Announced | 07.03.2023 |
| Link | Kingston Fury Renegade SFYRS500G |
Benchmarks
Performance Rating - DiskSpd
44.9 pt (51%)
Seagate ST1000LM014 Solid State Hybrid Drive
...
Acer N7000 2 TB
YMTC PC411-1TB
Kingston Fury Renegade SFYRS500G
Corsair MP600 GS
...
Kingston Fury Renegade G5 8TB
0%
100%
AS SSD - Copy Game
min: 2097.34 avg: 2574 median: 2573.7 (43%) max: 3050.08 MB/s
AS SSD - Copy Program
min: 935.78 avg: 969 median: 968.8 (36%) max: 1001.9 MB/s
AS SSD - Copy ISO
min: 3139.6 avg: 3350 median: 3350.1 (12%) max: 3560.61 MB/s
AS SSD - Score Total
min: 7758 avg: 8036 median: 8036 (49%) max: 8314 Points
AS SSD - Score Write
min: 3574 avg: 3880 median: 3879.5 (54%) max: 4185 Points
AS SSD - Score Read
min: 2781 avg: 2797 median: 2796.5 (45%) max: 2812 Points
AS SSD - Access Time Write *
min: 0.017 avg: 0 median: 0 (0%) max: 0.021 ms
AS SSD - Access Time Read *
min: 0.023 avg: 0.1 median: 0.1 (0%) max: 0.085 ms
AS SSD - 4K-64 Write
min: 2967 avg: 3283 median: 3282.5 (56%) max: 3598 MB/s
AS SSD - 4K-64 Read
min: 2148 avg: 2169 median: 2169 (43%) max: 2190 MB/s
AS SSD - 4K Write
min: 239 avg: 242.5 median: 242.5 (47%) max: 246 MB/s
AS SSD - 4K Read
min: 97.4 avg: 98.6 median: 98.6 (31%) max: 99.7 MB/s
AS SSD - Sequential Write
min: 3480 avg: 3546 median: 3545.5 (31%) max: 3611 MB/s
AS SSD - Sequential Read
min: 5241 avg: 5290 median: 5290 (41%) max: 5339 MB/s
CrystalDiskMark 3.0 - 4K QD32 Write
605 MB/s (56%)
CrystalDiskMark 3.0 - 4K QD32 Read
860 MB/s (67%)
CrystalDiskMark 3.0 - 4K Write
263 MB/s (8%)
CrystalDiskMark 3.0 - 4K Read
84.4 MB/s (1%)
CrystalDiskMark 3.0 - 512K Write
2668 MB/s (29%)
CrystalDiskMark 3.0 - 512K Read
2993 MB/s (63%)
CrystalDiskMark 3.0 - Sequential Write
3398 MB/s (32%)
CrystalDiskMark 3.0 - Sequential Read
3825 MB/s (43%)
CrystalDiskMark 5.2 / 6 - CDM 5/6 Write 4K
min: 256.7 avg: 266.8 median: 256.7 (23%) max: 287 MB/s
CrystalDiskMark 5.2 / 6 - CDM 5/6 Read 4K
min: 56.46 avg: 62.9 median: 56.5 (2%) max: 75.7 MB/s
CrystalDiskMark 5.2 / 6 - CDM 5 Write Seq
3849 MB/s (21%)
CrystalDiskMark 5.2 / 6 - CDM 5 Read Seq
2572 MB/s (29%)
CrystalDiskMark 5.2 / 6 - CDM 5/6 Write 4K Q32T1
min: 396.4 avg: 559 median: 396.4 (8%) max: 883 MB/s
CrystalDiskMark 5.2 / 6 - CDM 5/6 Read 4K Q32T1
min: 680.2 avg: 801 median: 680.2 (10%) max: 1044 MB/s
CrystalDiskMark 5.2 / 6 - CDM 5/6 Write Seq Q32T1
min: 3866.7 avg: 3889 median: 3866.7 (26%) max: 3933 MB/s
CrystalDiskMark 5.2 / 6 - CDM 5/6 Read Seq Q32T1
min: 7075.5 avg: 7085 median: 7075.5 (38%) max: 7103 MB/s
CrystalDiskMark 5.2 / 6 - CDM 6 Write 4K Q8T8
min: 1901.5 avg: 2285 median: 1901.5 (38%) max: 3051 MB/s
CrystalDiskMark 5.2 / 6 - CDM 6 Read 4K Q8T8
min: 921.8 avg: 1146 median: 921.8 (14%) max: 1595 MB/s
DiskSpd - DiskSpd 4k_q1t1_write
min: 291 avg: 319 median: 319 (73%) max: 347 MB/s
DiskSpd - DiskSpd 4k_q1t1_read
min: 76.3 avg: 81.4 median: 81.5 (24%) max: 86.6 MB/s
DiskSpd - DiskSpd 4k_q32t16_write
min: 3825 avg: 3828 median: 3827.5 (57%) max: 3830 MB/s
DiskSpd - DiskSpd 4k_q32t16_read
min: 1948 avg: 1949 median: 1949 (24%) max: 1950 MB/s
DiskSpd - DiskSpd seq_write
min: 3870 avg: 3881 median: 3880.5 (38%) max: 3891 MB/s
DiskSpd - DiskSpd seq_read
min: 3630 avg: 3653 median: 3653 (43%) max: 3676 MB/s
DiskSpd - DiskSpd seq_q8t1_write
min: 3876 avg: 3895 median: 3894.5 (27%) max: 3913 MB/s
DiskSpd - DiskSpd seq_q8t1_read
min: 6979 avg: 7009 median: 7008.5 (44%) max: 7038 MB/s
DiskSpd - DiskSpd Loop seq_q8t1_read
min: 6957 avg: 6979 median: 6978.5 (43%) max: 7000 MB/s
- Range of benchmark values
- Average benchmark values
* Smaller numbers mean a higher performance
v1.35
Notebook reviews with Kingston Fury Renegade SFYRS500G

The new XMG Focus 17 M25 is the most affordable way to get the new Nvidia GeForce RTX 5070 Ti laptop GPU. The 17-inch gaming laptop is out now starting at €1,849 (current exchange rate around $2,100) but what compromises will you have to live with for that price?
Intel Core i9-13900HX, NVIDIA GeForce RTX 5070 Ti Laptop, 17.3", 2.8 kg
Intel Serpent Canyon NUC 12 review: Fast mini PC with Intel Core i7-12700H and Intel Arc A770M
We have put the Intel NUC 12 Enthusiast Kit - a compact desktop PC with an up-to-date Alder Lake SoC - to the test. The actual highlight, however, is the Intel Arc A770M - but the test sadly showed a lot of wasted potential with this. Find out more in this review with comprehensive benchmarks and measurements.
Intel Core i7-12700H, A770M, 2 kgSchenker XMG Focus 17 M25: Intel Core i9-13900HX NVIDIA GeForce RTX 5070 Ti Laptop, 17.30", 2.8 kg
» XMG's Focus 17 M25 with the RTX 5070 Ti is currently the best value gaming laptop
Intel NUC 12, NUC12SNKi72_Serpent Canyon: Intel Core i7-12700H Intel Arc A770M, 2 kg
» Noticeably better Intel ARC A770 performance showcased as updated drivers deliver 9% more average fps in DirectX 11/12 games