Notebook reviews with WD PC SN740 SDDPTQD-1T00
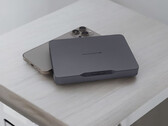
Khadas Mind 2 review: Portable mini PC now with Intel Core Ultra 7 155H, Thunderbolt 4 and USB4
Khadas is updating its current model range of the Mind series and is now equipping it with new Intel processors. We take a closer look at the Khadas Mind 2 with Intel Core Ultra 7 155H and evaluate the performance based on numerous measurements and benchmarks. As it turns out, the manufacturer has not only updated the SoC.
Intel Core Ultra 7 155H, Arc 8-Core, 437 gAsus ProArt PZ13 review - The durable OLED convertible with a Snapdragon X Plus
Asus' new ProArt PZ13 is a relatively robust convertible for creative users who also want to be able to do their work in adverse conditions. The new 8-core Snapdragon X Plus from Qualcomm powers the device, which ensures long runtimes, among other things. However, the same as on the other ProArt models, its OLED touchscreen is limited to 60 Hz.
Qualcomm Snapdragon X Plus X1P-42-100, Adreno X1-45 1.7 TFLOPS, 13.3", 874 gQualcomm Snapdragon X Plus 8-core analysis - The X1P-42-100 is smaller and cheaper, but not very efficient
Just over two months after the launch of the Snapdragon X Elite processors and the 10-core Snapdragon X Plus, Qualcomm has now released further ARM processors for laptops, including the Snapdragon X Plus 8-core variants with slower GPUs. We have tested the cheaper X1P-42-100.
Qualcomm Snapdragon X Plus X1P-42-100, Adreno X1-45 1.7 TFLOPS, 13.3", 874 gAMD Zen 5 Strix Point CPU analysis - Ryzen AI 9 HX 370 versus Intel Core Ultra, Apple M3 and Qualcomm Snapdragon X Elite
Around one month after the launch of Qualcomm’s latest ARM chips, AMD has now release its new Zen 5 mobile processors codenamed Strix Point. We tested out the new Ryzen AI 9 HX 370 with various TDPs.
AMD Ryzen AI 9 HX 370, NVIDIA GeForce RTX 4070 Laptop GPU, 13.3", 1.4 kgAsus ProArt PX13 review - The world's fastest 13.3-inch 2-in-1 thanks to AMD Zen 5 and RTX 4070 laptop
With the ProArt PX13, Asus has a new 13.3-inch 2-in-1 with powerful hardware in its range. In addition to the brand new AMD Zen 5 mobile processors, it also comes with a GeForce 4070 laptop. However, the OLED touchscreen only offers a 60 Hz frequency which raises questions given the high asking price. Update: Photo/video editing benchmark results added
AMD Ryzen AI 9 HX 370, NVIDIA GeForce RTX 4070 Laptop GPU, 13.3", 1.4 kgDell Inspiron 14 Plus 7440: Intel Core Ultra 7 155H Intel Arc 8-Core iGPU, 14.00", 1.6 kg
Review » Dell Inspiron 14 Plus 7440 laptop review: Dropping GeForce RTX for integrated Intel Arc
Dell Inspiron 16 Plus 7630: Intel Core i7-13700H NVIDIA GeForce RTX 4060 Laptop GPU, 16.00", 2.2 kg
Review » Dell Inspiron 16 Plus 7630 laptop review: 60 W GeForce RTX 4060 isn't so bad
Khadas Mind: Intel Core i7-1360P Intel Iris Xe Graphics G7 96EUs, 0.4 kg
Review » Khadas Mind workstation review: Can this portable mini PC with a battery and a Core i7-1360P replace a laptop?
Asus ROG Flow Z13 GZ301V: Intel Core i9-13900H NVIDIA GeForce RTX 4060 Laptop GPU, 13.40", 1.6 kg
Review » Asus ROG Flow Z13 in review: Madness - RTX 4060 in an impressive gaming tablet
Asus ROG Flow Z13 ACRNM: Intel Core i9-13900H NVIDIA GeForce RTX 4070 Laptop GPU, 13.40", 1.7 kg
Review » Asus ROG Flow Z13 ACRNM Review - Gaming Convertible with RTX 4070 Laptop
Asus ProArt PX13 HN7306: AMD Ryzen AI 9 HX 370 NVIDIA GeForce RTX 4070 Laptop GPU, 13.30", 1.4 kg
External Review » Asus ProArt PX13 HN7306
Asus ProArt PZ13 HT5306: Qualcomm Snapdragon X Plus X1P-42-100 Qualcomm SD X Adreno X1-45 1.7 TFLOPS, 13.30", 0.9 kg
External Review » Asus ProArt PZ13 HT5306
Dell Inspiron 14 Plus 7440: Intel Core Ultra 7 155H Intel Arc 8-Core iGPU, 14.00", 1.6 kg
External Review » Dell Inspiron 14 Plus 7440
Dell Inspiron 16 Plus 7630: Intel Core i7-13700H NVIDIA GeForce RTX 4060 Laptop GPU, 16.00", 2.2 kg
External Review » Dell Inspiron 16 Plus 7630
Asus ROG Flow Z13 GZ301V: Intel Core i9-13900H NVIDIA GeForce RTX 4060 Laptop GPU, 13.40", 1.6 kg
External Review » Asus ROG Flow Z13 GZ301V
Asus ROG Flow Z13 ACRNM: Intel Core i9-13900H NVIDIA GeForce RTX 4070 Laptop GPU, 13.40", 1.7 kg
External Review » Asus ROG Flow Z13 ACRNM
Asus ProArt PZ13 HT5306: Qualcomm Snapdragon X Plus X1P-42-100 Qualcomm SD X Adreno X1-45 1.7 TFLOPS, 13.30", 0.9 kg
» Asus ProArt PZ13 with detachable 3K OLED display drops back to record-low price of $850
Asus ProArt PX13 HN7306: AMD Ryzen AI 9 HX 370 NVIDIA GeForce RTX 4070 Laptop GPU, 13.30", 1.4 kg
» Asus ProArt P16 4K OLED laptop with Ryzen AI 9 HX 370 and RTX 4060 now on sale at lowest ever price
Asus ProArt PZ13 HT5306: Qualcomm Snapdragon X Plus X1P-42-100 Qualcomm SD X Adreno X1-45 1.7 TFLOPS, 13.30", 0.9 kg
» Asus ProArt P16 4K OLED laptop with Ryzen AI 9 HX 370 and RTX 4060 now on sale at lowest ever price
Asus ProArt PX13 HN7306: AMD Ryzen AI 9 HX 370 NVIDIA GeForce RTX 4070 Laptop GPU, 13.30", 1.4 kg
» Latest Asus ProArt PX13 OLED creator laptop with Ryzen AI 9 HX 370 drops to lowest price ever
Asus ProArt PZ13 HT5306: Qualcomm Snapdragon X Plus X1P-42-100 Qualcomm SD X Adreno X1-45 1.7 TFLOPS, 13.30", 0.9 kg
» Latest Asus ProArt PX13 OLED creator laptop with Ryzen AI 9 HX 370 drops to lowest price ever
Khadas Mind: Intel Core i7-1360P Intel Iris Xe Graphics G7 96EUs, 0.4 kg
» Sleek-looking Khadas Mind 2 released with up to Core Ultra 7 155H CPU, 64 GB of memory, and excellent expandability for a premium price
Dell Inspiron 14 Plus 7440: Intel Core Ultra 7 155H Intel Arc 8-Core iGPU, 14.00", 1.6 kg
» Dell Inspiron 16 Plus 7630 multimedia laptop with RTX 4060 and 120 Hz screen is now down by massive 27% vs list price
Asus ProArt PX13 HN7306: AMD Ryzen AI 9 HX 370 NVIDIA GeForce RTX 4070 Laptop GPU, 13.30", 1.4 kg
» Strix Point APU handheld performance simulation: Ryzen AI 9 HX 370 shines in gaming even when tested at just 17 W
Asus ROG Flow Z13 GZ301V: Intel Core i9-13900H NVIDIA GeForce RTX 4060 Laptop GPU, 13.40", 1.6 kg
» This AAA gaming tablet has us convinced: Asus ROG Flow Z13 with RTX 4060 reviewed.