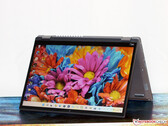
Notebookcheck Logo

Micron 2450 512GB MTFDKBA512TFK

Micron 2450 512GB MTFDKBA512TFK 2450 512GB

The Micron 2450 512GB (MTFDKBA512TFK) is a fast M.2 SSD using the NVMe 1.3 protocol. The Micron 2450 SSD is built with Micron 176-layer NAND and rated at 3mW sleep power state and less than 400mW in active idle power state.

TypeSSD
SizeM.2 2280
Capacity512 GB
InterfaceM.2
Announced24.02.2022

Benchmarks

Performance Rating - DiskSpd
33.6 pt (44%)
64 GB eMMC Flash
2.37 -93%
...
31.5 -6%
31.7 -6%
32 -5%
Intel SSD 760p SSDPEKKW010T8
32.1 -4%
33 -2%
33.1 -1%
33.3 -1%
Samsung SSD PM981 MZVLB2T0HMLB
33.5 0%
33.6 0%
Micron 2450 512GB MTFDKBA512TFK
33.6
33.8 1%
33.8 1%
Samsung SSD PM981 MZVLB1T0HALR
33.9 1%
Samsung SSD 980 1TB MZ-V8V1T0BW
34 1%
34.4 2%
34.5 3%
34.8 4%
34.9 4%
35.2 5%
...
75.8 126%
0%
100%
AS SSD - Copy Game
min: 567.36     avg: 821     median: 912.6 (15%)     max: 975.1 MB/s
AS SSD - Copy Program
min: 309.58     avg: 377.6     median: 407.8 (15%)     max: 417.6 MB/s
AS SSD - Copy ISO
min: 273.89     avg: 1032     median: 828.6 (8%)     max: 2047 MB/s
AS SSD - Score Total
min: 3300     avg: 4108     median: 4023 (38%)     max: 5170 Points
AS SSD - Score Write
min: 966     avg: 1891     median: 1934.5 (34%)     max: 2563 Points
AS SSD - Score Read
min: 1008     avg: 1473     median: 1514.5 (42%)     max: 1878 Points
AS SSD - Access Time Write *
min: 0.132     avg: 0.2     median: 0.2 (0%)     max: 0.4 ms
AS SSD - Access Time Read *
min: 0.024     avg: 0.1     median: 0.1 (0%)     max: 0.106 ms
AS SSD - 4K-64 Write
min: 433.42     avg: 1465     median: 1491 (29%)     max: 2101 MB/s
AS SSD - 4K-64 Read
min: 686.43     avg: 1133     median: 1217.5 (40%)     max: 1469 MB/s
AS SSD - 4K Write
min: 132.18     avg: 206.6     median: 168.9 (46%)     max: 363.5 MB/s
AS SSD - 4K Read
min: 35.24     avg: 67.5     median: 65.3 (21%)     max: 95.9 MB/s
AS SSD - Sequential Write
min: 1359.49     avg: 2193     median: 2179.2 (25%)     max: 3008.29 MB/s
AS SSD - Sequential Read
min: 1509.64     avg: 2720     median: 2946 (30%)     max: 3127 MB/s
CrystalDiskMark 5.2 / 6 - CDM 5/6 Write 4K
min: 76.18     avg: 198.8     median: 203.1 (18%)     max: 313.4 MB/s
CrystalDiskMark 5.2 / 6 - CDM 5/6 Read 4K
min: 39.27     avg: 63.4     median: 65.7 (2%)     max: 74.8 MB/s
CrystalDiskMark 5.2 / 6 - CDM 5 Write Seq
min: 1699     avg: 2669     median: 2636 (14%)     max: 3336 MB/s
CrystalDiskMark 5.2 / 6 - CDM 5 Read Seq
min: 1742     avg: 2092     median: 2153 (26%)     max: 2280 MB/s
CrystalDiskMark 5.2 / 6 - CDM 5/6 Write 4K Q32T1
min: 308.6     avg: 467.9     median: 458.4 (17%)     max: 632 MB/s
CrystalDiskMark 5.2 / 6 - CDM 5/6 Read 4K Q32T1
min: 388.1     avg: 567     median: 532.8 (8%)     max: 887 MB/s
CrystalDiskMark 5.2 / 6 - CDM 5/6 Write Seq Q32T1
min: 315.4     avg: 2798     median: 3307 (32%)     max: 3355 MB/s
CrystalDiskMark 5.2 / 6 - CDM 5/6 Read Seq Q32T1
min: 453.8     avg: 3082     median: 3695.5 (29%)     max: 3714 MB/s
CrystalDiskMark 5.2 / 6 - CDM 6 Write 4K Q8T8
min: 1498.6     avg: 1909     median: 1909.3 (38%)     max: 2320 MB/s
CrystalDiskMark 5.2 / 6 - CDM 6 Read 4K Q8T8
min: 977.3     avg: 1021     median: 1021.2 (15%)     max: 1065 MB/s
DiskSpd - DiskSpd 4k_q1t1_write
min: 66.6     avg: 208     median: 196.2 (46%)     max: 421 MB/s
DiskSpd - DiskSpd 4k_q1t1_read
min: 18.6     avg: 52.1     median: 55.5 (16%)     max: 71.5 MB/s
DiskSpd - DiskSpd 4k_q32t16_write
min: 365     avg: 1351     median: 1124 (25%)     max: 3249 MB/s
DiskSpd - DiskSpd 4k_q32t16_read
min: 416     avg: 1076     median: 1226 (21%)     max: 1550 MB/s
DiskSpd - DiskSpd seq_write
min: 830     avg: 2446     median: 2505.5 (32%)     max: 3301 MB/s
DiskSpd - DiskSpd seq_read
min: 756     avg: 1837     median: 2027.5 (36%)     max: 2309 MB/s
DiskSpd - DiskSpd seq_q8t1_write
min: 934     avg: 2748     median: 3231.5 (31%)     max: 3351 MB/s
DiskSpd - DiskSpd seq_q8t1_read
min: 1023     avg: 2946     median: 3425.5 (26%)     max: 3613 MB/s
DiskSpd - DiskSpd Loop seq_q8t1_read
min: 1029     avg: 2823     median: 3287.5 (25%)     max: 3598 MB/s
0100200300400500600700800900100011001200130014001500160017001800190020002100220023002400250026002700280029003000310032003300340035003600Tooltip
- Range of benchmark values for this graphics card
- Average benchmark values for this graphics card
* Smaller numbers mean a higher performance

Add one or more devices and compare

In the following list you can select (and also search for) devices that should be added to the comparison. You can select more than one device.

restrict list:

show all (including archived), 2023, 2022
v1.22
log 28. 04:02:01

#0 no ids found in url (should be separated by "_") +0s ... 0s

#1 not redirecting to Ajax server +0s ... 0s

#2 did not recreate cache, as it is less than 5 days old! Created at Thu, 25 May 2023 20:10:36 +0200 +0.001s ... 0.001s

#3 composed specs +0.005s ... 0.006s

#4 did output specs +0s ... 0.006s

#5 getting avg benchmarks for device 3808 +0.011s ... 0.016s

#6 got single benchmarks 3808 +0.022s ... 0.038s

#7 got avg benchmarks for devices +0s ... 0.038s

#8 min, max, avg, median took s +0.541s ... 0.58s

#9 return log +0.01s ... 0.59s