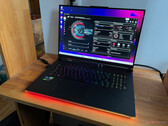
Notebookcheck Logo

2x Samsung PM9A1 MZVL21T0HCLR (RAID 0)

2x Samsung PM9A1 MZVL21T0HCLR (RAID 0) 2x PM9A1 MZVL21T0HCLR (RAID 0)

Two Samsung OEM Client SSD PM9A1 1TB in RAID 0 combination offer 2 TB of storage and a higher performance than a single drive but at the cost of a higher power consumption and a higher risk  of data loss (data lost if one drive has a failure). Each drive uses the Samsung Elpis (S4LV003) Controller with 8 channels and 512 MB LPDDR4. The memory modules are from Samsung (3D-NAND TLC 136 layers). The 1TB version is specified at 7000 MB/s and 5100 MB/s write (SLC cached). The power consumption is specified at 0.005 W (sleep) and 0.035W (idle) for each drive.

TypeSSD
SizeM.2 2280
Capacity2048 GB
InterfaceNVMe
Announced26.02.2021

Benchmarks

Performance Rating - DiskSpd
41.7 pt (63%)
AS SSD - Copy Game
min: 1199     avg: 1251     median: 1250.5 (21%)     max: 1302 MB/s
AS SSD - Copy Program
min: 428     avg: 432.5     median: 432.5 (16%)     max: 437 MB/s
AS SSD - Copy ISO
min: 2582     avg: 2602     median: 2602 (24%)     max: 2622 MB/s
AS SSD - Score Total
min: 4119     avg: 5058     median: 4364 (40%)     max: 6691 Points
AS SSD - Score Write
min: 1656     avg: 1993     median: 1691 (30%)     max: 2631 Points
AS SSD - Score Read
min: 1715     avg: 2100     median: 1858 (7%)     max: 2728 Points
AS SSD - Access Time Write *
min: 0.021     avg: 0     median: 0 (0%)     max: 0.036 ms
AS SSD - Access Time Read *
min: 0.021     avg: 0     median: 0 (0%)     max: 0.044 ms
AS SSD - 4K-64 Write
min: 1072     avg: 1273     median: 1134 (22%)     max: 1613.52 MB/s
AS SSD - 4K-64 Read
min: 974     avg: 1222     median: 1011 (30%)     max: 1679.76 MB/s
AS SSD - 4K Write
min: 112.8     avg: 141.6     median: 114.7 (22%)     max: 197.41 MB/s
AS SSD - 4K Read
min: 56.4     avg: 65     median: 58 (18%)     max: 80.52 MB/s
AS SSD - Sequential Write
min: 4091     avg: 5779     median: 5041 (45%)     max: 8205.5 MB/s
AS SSD - Sequential Read
min: 6844     avg: 8138     median: 7888 (62%)     max: 9681.3 MB/s
DiskSpd - DiskSpd 4k_q1t1_write
min: 102.4     avg: 147.7     median: 103.7 (24%)     max: 237 MB/s
DiskSpd - DiskSpd 4k_q1t1_read
min: 56.9     avg: 68.3     median: 57.5 (17%)     max: 90.6 MB/s
DiskSpd - DiskSpd 4k_q32t16_write
min: 342     avg: 845     median: 350 (7%)     max: 1842 MB/s
DiskSpd - DiskSpd 4k_q32t16_read
min: 706     avg: 1133     median: 711 (12%)     max: 1982 MB/s
DiskSpd - DiskSpd seq_write
min: 3988     avg: 5285     median: 4199 (46%)     max: 7667 MB/s
DiskSpd - DiskSpd seq_read
min: 4837     avg: 5074     median: 4842 (69%)     max: 5544 MB/s
DiskSpd - DiskSpd seq_q8t1_write
min: 8297     avg: 8968     median: 8404 (58%)     max: 10203 MB/s
DiskSpd - DiskSpd seq_q8t1_read
min: 10774     avg: 11432     median: 11380 (71%)     max: 12143 MB/s
DiskSpd - DiskSpd Loop seq_q8t1_read
min: 7580     avg: 10135     median: 10730 (66%)     max: 12096 MB/s
0100200300400500600700800900100011001200130014001500160017001800190020002100220023002400250026002700280029003000310032003300340035003600370038003900400041004200430044004500460047004800490050005100520053005400550056005700580059006000610062006300640065006600670068006900700071007200730074007500760077007800790080008100820083008400850086008700880089009000910092009300940095009600970098009900Tooltip
- Range of benchmark values for this graphics card
- Average benchmark values for this graphics card
* Smaller numbers mean a higher performance

Add one or more devices and compare

In the following list you can select (and also search for) devices that should be added to the comparison. You can select more than one device.

restrict list:

show all (including archived), 2024, 2023
v1.26
log 17. 04:07:24

#0 no ids found in url (should be separated by "_") +0s ... 0s

#1 not redirecting to Ajax server +0s ... 0s

#2 did not recreate cache, as it is less than 5 days old! Created at Tue, 12 Mar 2024 16:12:25 +0100 +0.001s ... 0.001s

#3 composed specs +0.006s ... 0.007s

#4 did output specs +0s ... 0.007s

#5 getting avg benchmarks for device 3868 +0.017s ... 0.024s

#6 got single benchmarks 3868 +0.011s ... 0.035s

#7 got avg benchmarks for devices +0s ... 0.035s

#8 min, max, avg, median took s +0.809s ... 0.844s

#9 return log +0.012s ... 0.856s

Please share our article, every link counts!
> Expert Reviews and News on Laptops, Smartphones and Tech Innovations > Benchmarks / Tech > Laptop harddisks (HDD, SSD) benchmarks > 2x Samsung PM9A1 MZVL21T0HCLR (RAID 0) SSD Benchmarks
Klaus Hinum (Update: 2022-08- 4)