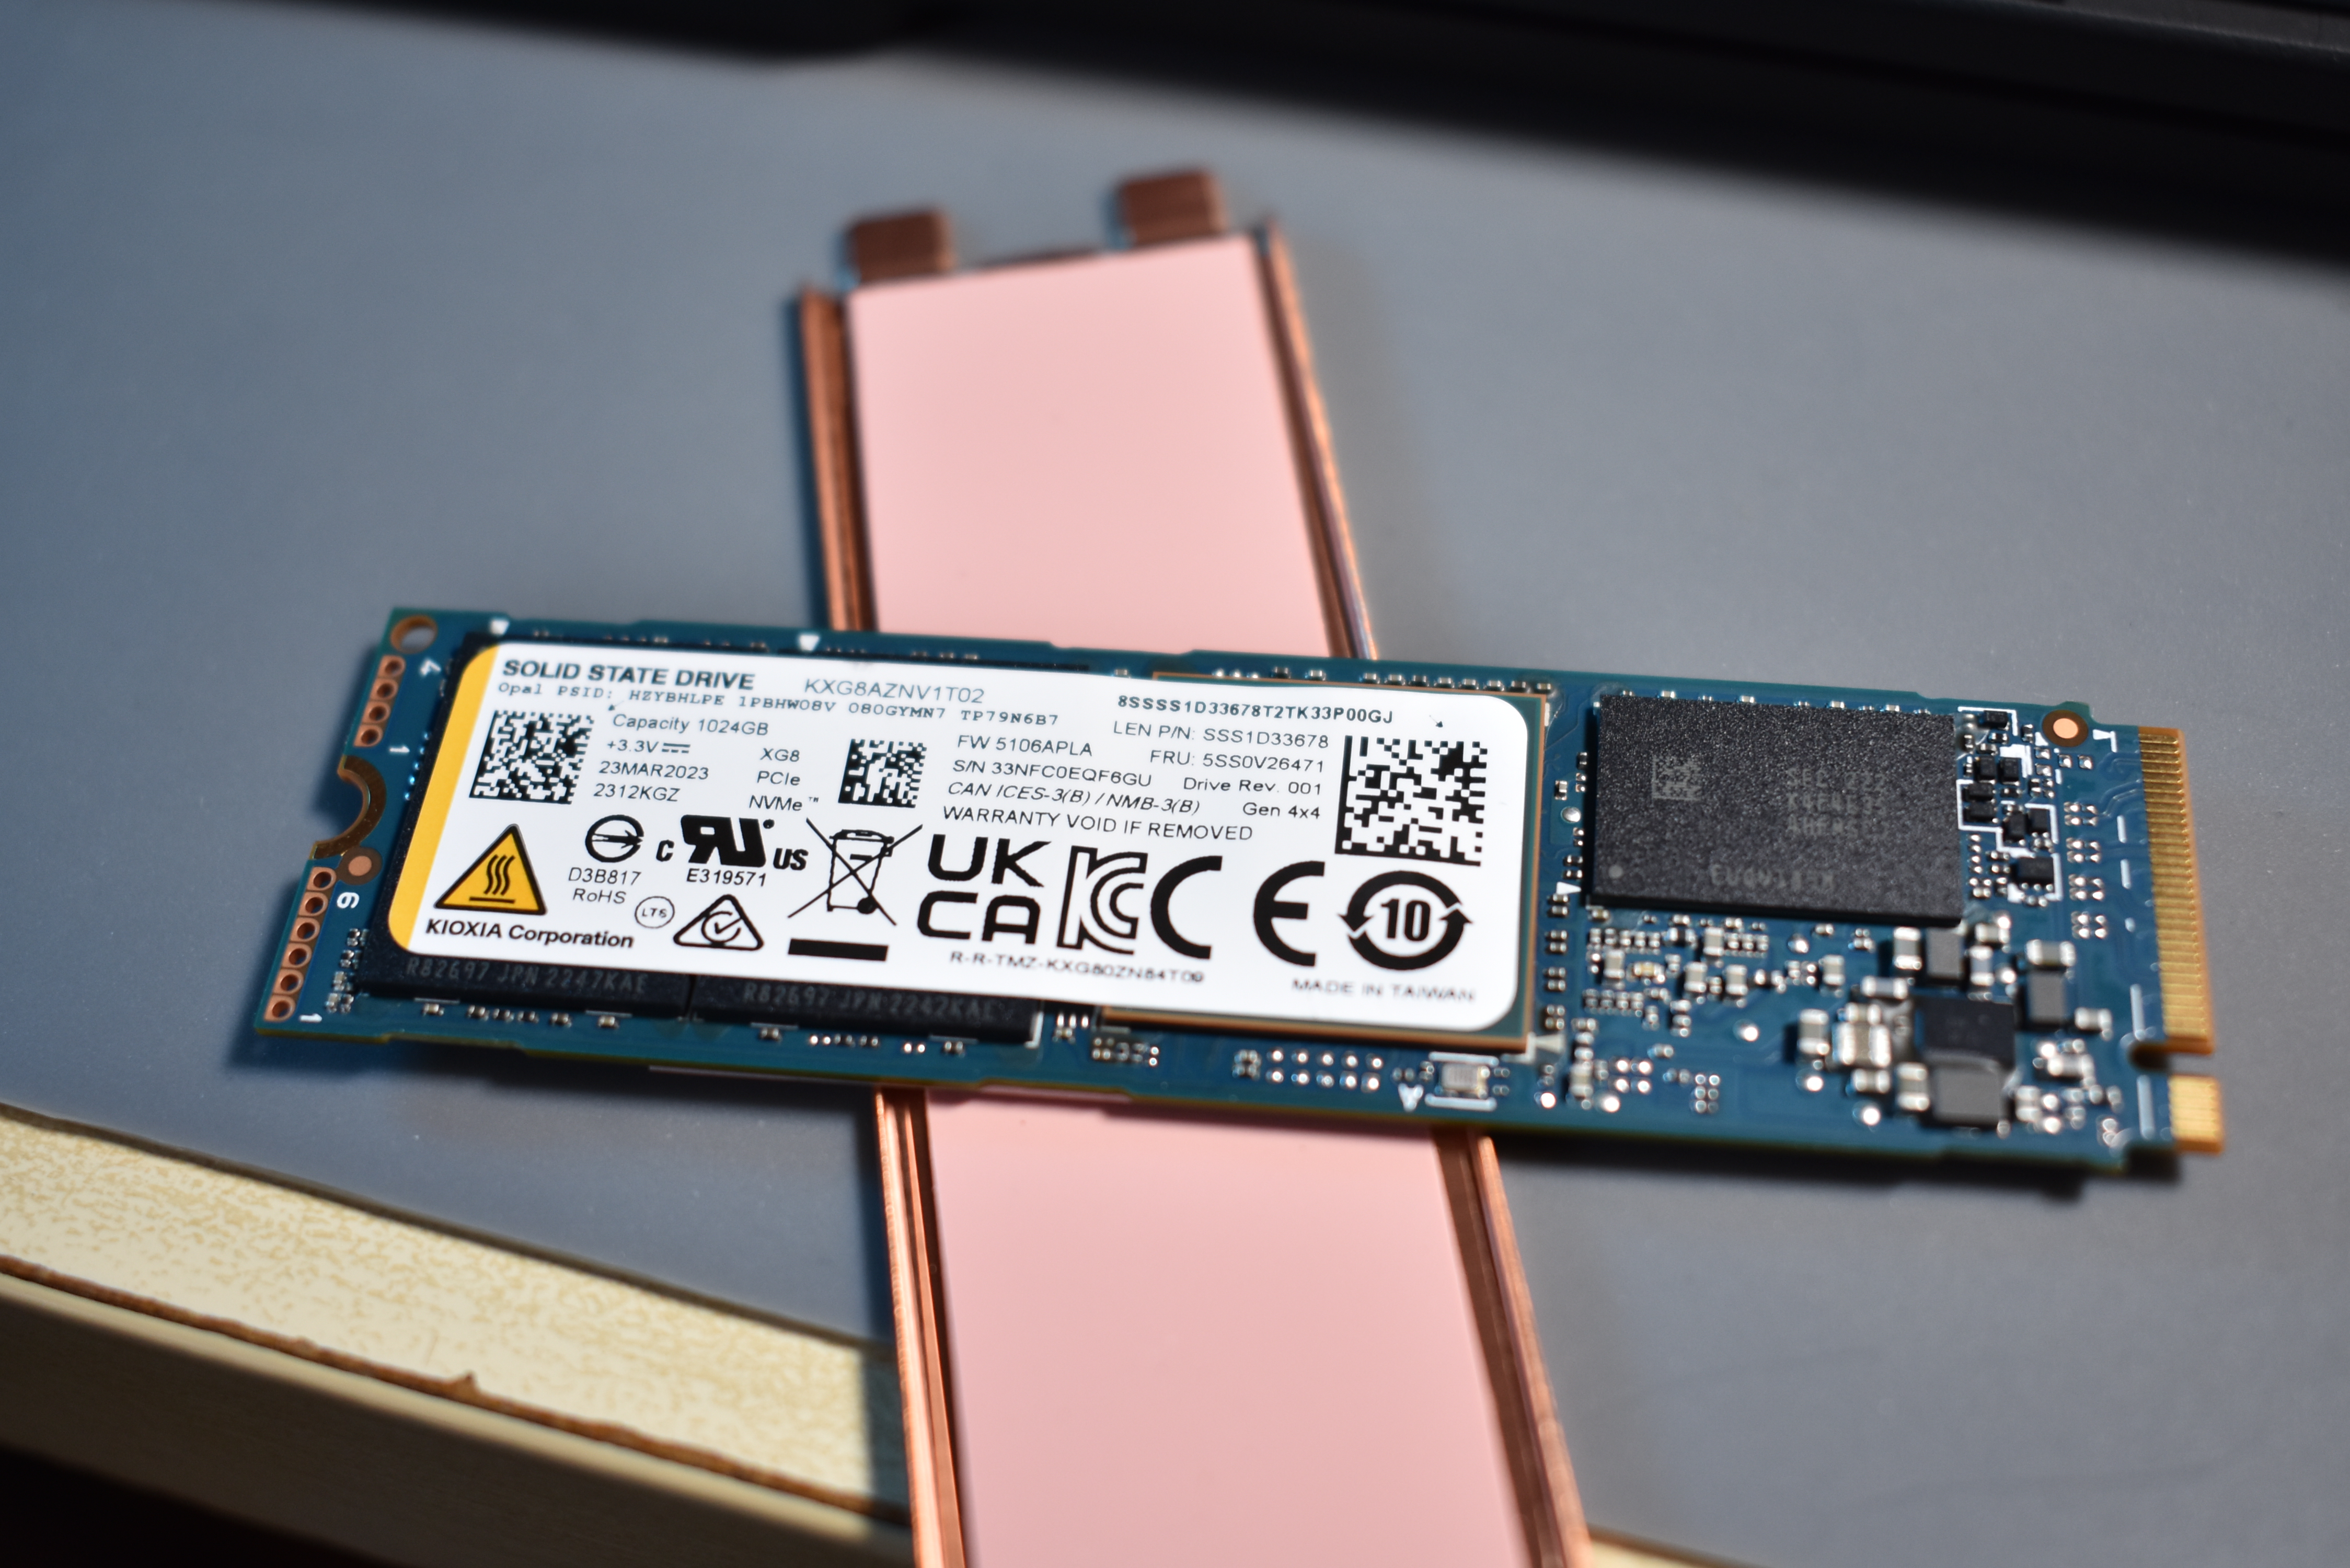
Notebook reviews with Kioxia XG8 KXG8AZNV1T02
Lenovo ThinkPad T14s Gen 6 laptop review: The AMD version returns with the Ryzen AI 7 Pro 360
After a year of absence from the ThinkPad T14s line, Lenovo's premium office line, AMD returns with Strix Point. The new Lenovo ThinkPad T14s Gen 6 AMD with the Ryzen AI 7 Pro 360 delivers a great balance between performance and efficiency, outperforming the ThinkPad T14s Gen 5 Intel on both counts.
AMD Ryzen AI 7 PRO 360, Radeon 880M, 14", 1.3 kgLenovo ThinkPad P1 Gen 7 review: Without TrackPoint buttons, with Nvidia GeForce RTX 4060
For the new Lenovo ThinkPad P1 Gen 7, the new design is the main attraction. The high-end workstation is more premium, repairable and easier to use. At its core lies the new haptic Sensel touchpad, which successfully takes over the function of the formerly dedicated TrackPoint buttons.
Intel Core Ultra 7 155H, NVIDIA GeForce RTX 4060 Laptop GPU, 16", 2 kgLenovo ThinkPad X1 2in1 G9 review - The high-end business convertible with 120-Hz OLED and without TrackPoint buttons
Lenovo has dropped the name Yoga from its flagship convertible for business customers, now calling it the ThinkPad X1 2in1. AI marketing aside, its new Meteor Lake processor offers little performance and its high-resolution OLED touchscreen isn't entirely good. Lenovo also offers an optional haptic touchpad without TrackPoint buttons.
Intel Core Ultra 7 165U, Graphics 4-Core iGPU (Arrow Lake), 14", 1.3 kgLenovo ThinkPad X1 Carbon G12 laptop review: First major refresh in three years
The ThinkPad X1 Carbon gets a major facelift this year to accompany the new Meteor Lake-H CPU and OLED panel with double the refresh rate of the previous generation. It's the best Carbon yet, but some performance problems remain unsolved.
Intel Core Ultra 7 155H, Arc 8-Core, 14", 1.1 kgRadeon RX 6550M performance debut: Lenovo ThinkPad Z16 Gen 2 laptop review
RDNA2 isn't necessarily bad for an entry-level Radeon GPU, but it's getting long in the tooth and difficult to recommend at such a high $1600+ price tag. The fast Ryzen 9 Pro Zen 4 CPU and 4K OLED touchscreen are otherwise highlights for the ThinkPad Z16 Gen 2 model.
AMD Ryzen 9 PRO 7940HS, Radeon RX 6550M, 16", 1.8 kgLenovo ThinkPad P1 G6 21FV001KUS: Intel Core i7-13800H NVIDIA GeForce RTX 4080 Laptop GPU, 16.00", 1.9 kg
Review » Lenovo ThinkPad P1 G6 review: 80 W GeForce RTX 4080 for ultrathin workstation
Lenovo ThinkPad X13 G4 21EX004QGE: Intel Core i7-1355U Intel Iris Xe Graphics G7 96EUs, 13.30", 1.2 kg
Review » Lenovo ThinkPad X13 G4 Intel Laptop Review: Compact 5G traveler with OLED
Lenovo ThinkPad T14s Gen 6 21M2S00G00: AMD Ryzen AI 7 PRO 360 AMD Radeon 880M, 14.00", 1.3 kg
External Review » Lenovo ThinkPad T14s Gen 6 21M2S00G00
Lenovo ThinkPad P1 Gen 7 21KV001SGE: Intel Core Ultra 7 155H NVIDIA GeForce RTX 4060 Laptop GPU, 16.00", 2 kg
External Review » Lenovo ThinkPad P1 Gen 7 21KV001SGE
Lenovo ThinkPad X1 2in1 G9 21KE004AGE: Intel Core Ultra 7 165U Intel Graphics 4-Core iGPU (Meteor / Arrow Lake), 14.00", 1.3 kg
External Review » Lenovo ThinkPad X1 2in1 G9 21KE004AGE
Lenovo ThinkPad X1 Carbon G12: Intel Core Ultra 7 155H Intel Arc 8-Core iGPU, 14.00", 1.1 kg
External Review » Lenovo ThinkPad X1 Carbon G12
Lenovo ThinkPad Z16 Gen 2: AMD Ryzen 9 PRO 7940HS AMD Radeon RX 6550M, 16.00", 1.8 kg
External Review » Lenovo ThinkPad Z16 Gen 2
Lenovo ThinkPad X13 G4 21EX004QGE: Intel Core i7-1355U Intel Iris Xe Graphics G7 96EUs, 13.30", 1.2 kg
External Review » Lenovo ThinkPad X13 G4 21EX004QGE
Lenovo ThinkPad X1 Carbon G12: Intel Core Ultra 7 155H Intel Arc 8-Core iGPU, 14.00", 1.1 kg
» Lenovo ThinkPad X1 Carbon gets huge 47% Black Friday discount
Lenovo ThinkPad P1 G6 21FV001KUS: Intel Core i7-13800H NVIDIA GeForce RTX 4080 Laptop GPU, 16.00", 1.9 kg
» RTX 4080-powered Lenovo ThinkPad P1 Gen 6 with 4K OLED and 64GB DDR5 gets another price cut
» 4K OLED, up to 64GB RAM and RTX 4080: Lenovo ThinkPad P1 and P16s get steep discounts
Lenovo ThinkPad T14s Gen 6 21M2S00G00: AMD Ryzen AI 7 PRO 360 AMD Radeon 880M, 14.00", 1.3 kg
» Lenovo ThinkPad T14s with 32GB RAM and Ryzen AI 7 Pro 360 now 54% off
» AMD-powered Lenovo ThinkPad T14s Gen 6 with 32GB memory back on sale with 50% discount
Lenovo ThinkPad P1 Gen 7 21KV001SGE: Intel Core Ultra 7 155H NVIDIA GeForce RTX 4060 Laptop GPU, 16.00", 2 kg
» Lenovo ThinkPad P1 G7 mobile workstation with RTX 1000 Ada Generation GPU experiences big price drop
Lenovo ThinkPad T14s Gen 6 21M2S00G00: AMD Ryzen AI 7 PRO 360 AMD Radeon 880M, 14.00", 1.3 kg
» Lenovo ThinkPad T14s Gen 6 with 32GB RAM and AMD Ryzen AI 7 Pro 360 gets big 46% discount
» AMD Ryzen AI 7 Pro 360 makes its review-debut in the Lenovo ThinkPad T14s Gen 6 AMD
Lenovo ThinkPad X1 Carbon G12: Intel Core Ultra 7 155H Intel Arc 8-Core iGPU, 14.00", 1.1 kg
» Lenovo ThinkPad X1 Carbon Gen 12 with 120Hz OLED and 32GB RAM gets whopping 50% discount
Lenovo ThinkPad P1 Gen 7 21KV001SGE: Intel Core Ultra 7 155H NVIDIA GeForce RTX 4060 Laptop GPU, 16.00", 2 kg
» ThinkPad P1 Gen 7's 165 Hz screen leads to lower battery life: Why did Lenovo not implement Dynamic Refresh Rate?
Lenovo ThinkPad X1 Carbon G12: Intel Core Ultra 7 155H Intel Arc 8-Core iGPU, 14.00", 1.1 kg
» Lenovo ThinkPad X1 Carbon Gen 12 with 2.8K OLED, Core Ultra 7 and 32GB RAM already discounted by 51%
Lenovo ThinkPad X13 G4 21EX004QGE: Intel Core i7-1355U Intel Iris Xe Graphics G7 96EUs, 13.30", 1.2 kg
» Lenovo ThinkPad X13 Gen 4: OLED screen profits a lot from dark mode