Lexar NM610 1 TB NVMe PCIe x4 SSD Benchmarked
")
Options are growing if you're looking to upgrade your SSD. Though nearly all laptops come with drives from Samsung, Intel, Toshiba, Lite-On, or SK Hynix, lots of aftermarket parts are available like Kingston, Western Digital, or the Lexar we have here.
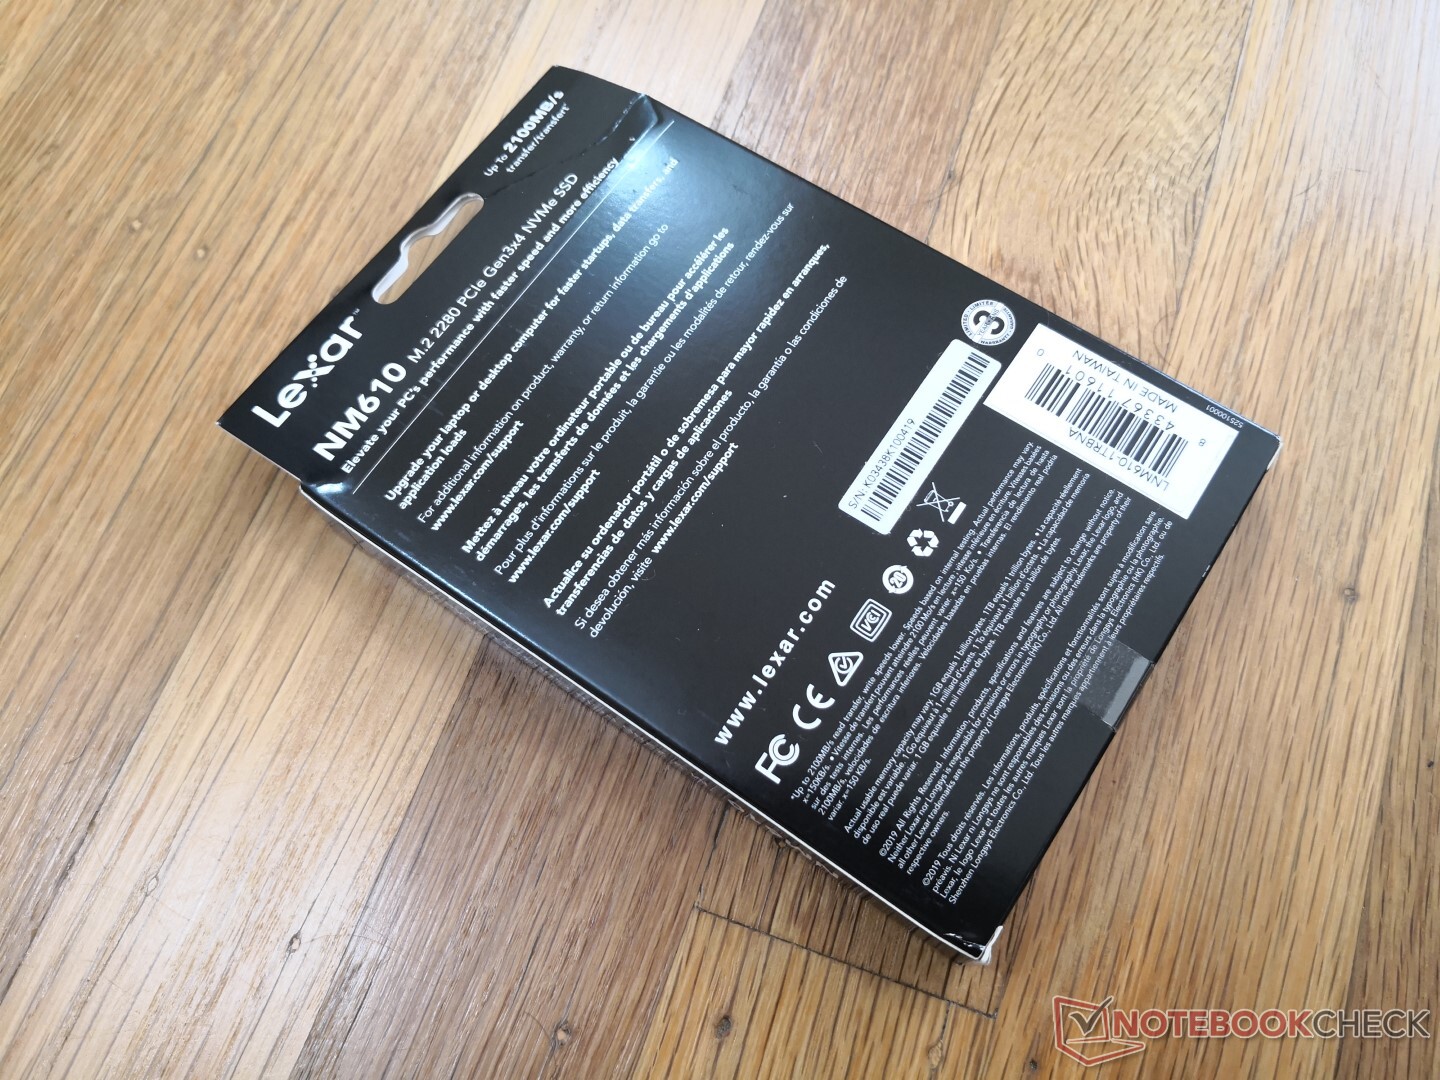
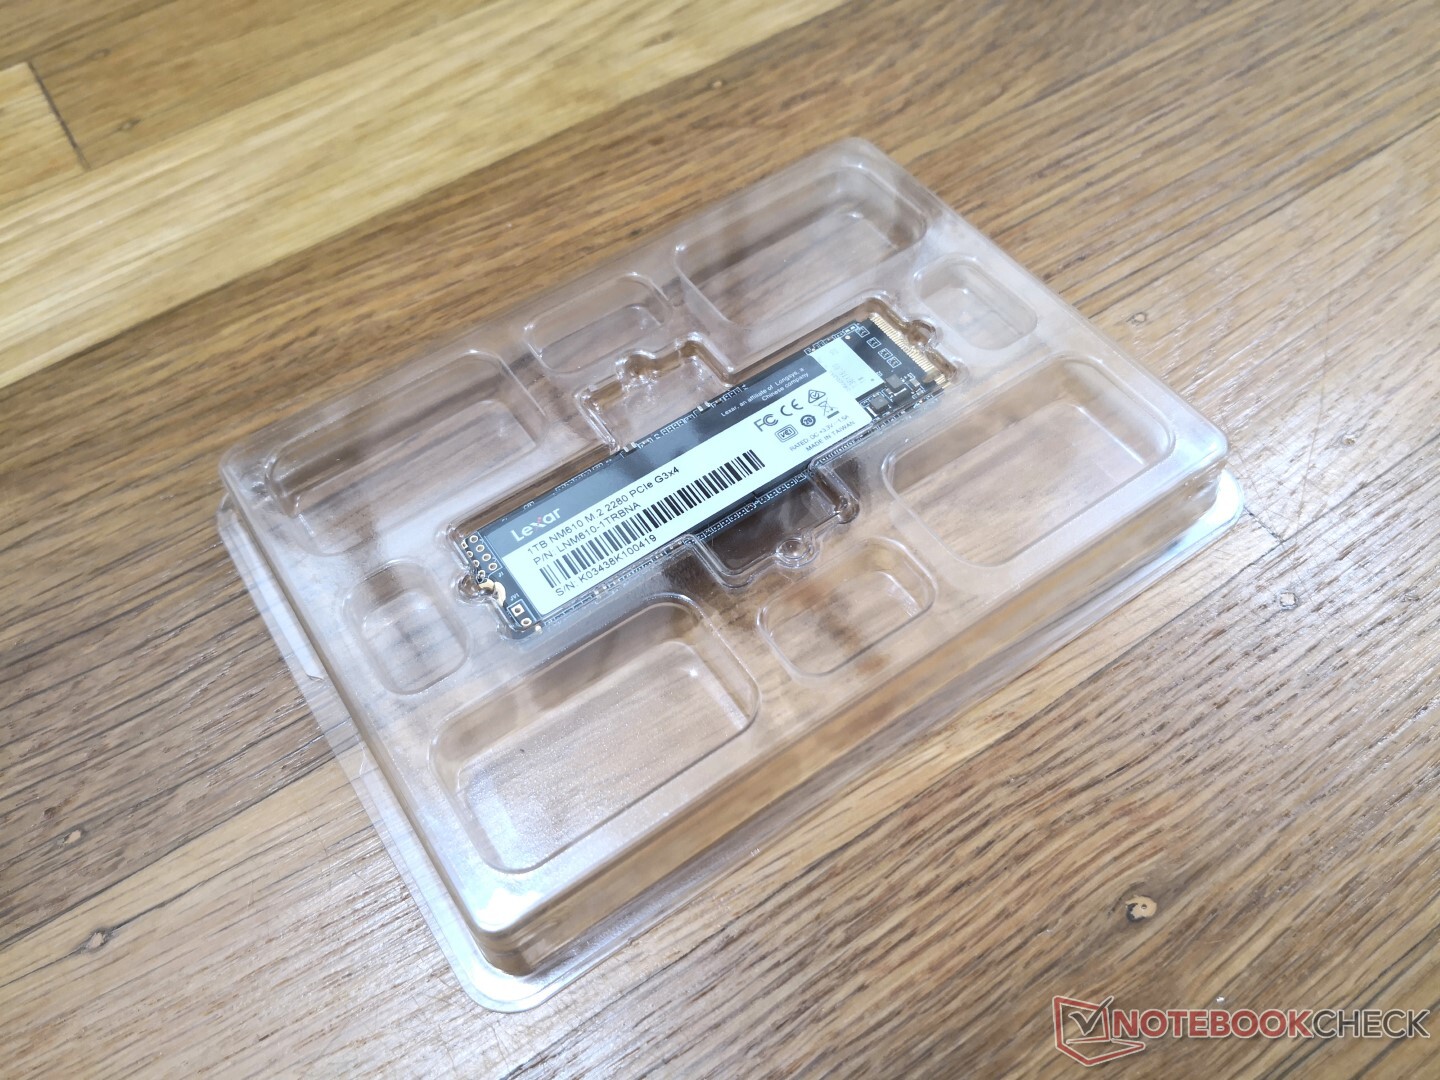
The Lexar NM610 is a series of affordable M.2 NVMe SSDs ranging from 250 GB up to 1 TB for a starting price of $59 with 3-year warranty as standard. Most sizes offer read and write rates of up to 2100 MB/s and 1600 MB/s, respectively, compared to just 1650 MB/s and 1000 MB/s on the older NM500 series. The NM610 series offers additional capacities over the NM600 series without impacting performance or IOPS.
See the official product page here for a more detailed spec sheet of the NM610. Alternatives include other entry-level NVMe drives like the Kingston A2000, Western Digital SN550, or the Intel SSD 660p.
| Lexar NM510 | Sequential Read/Write | IOPS Random Read/Write | MTBF (hours) | TBW | DWPD |
|---|---|---|---|---|---|
| 250 GB | 2000 MB/s, 1200 MB/s | 110K, 151K | 1,500,000 | 125 | 0.46 |
| 500 GB | 2100 MB/s, 1600 MB/s | 188K, 156K | 1,500,000 | 250 | 0.46 |
| 1 TB | 2100 MB/s, 1600 MB/s | 188K, 156K | 1,500,000 | 500 | 0.46 |
Test System
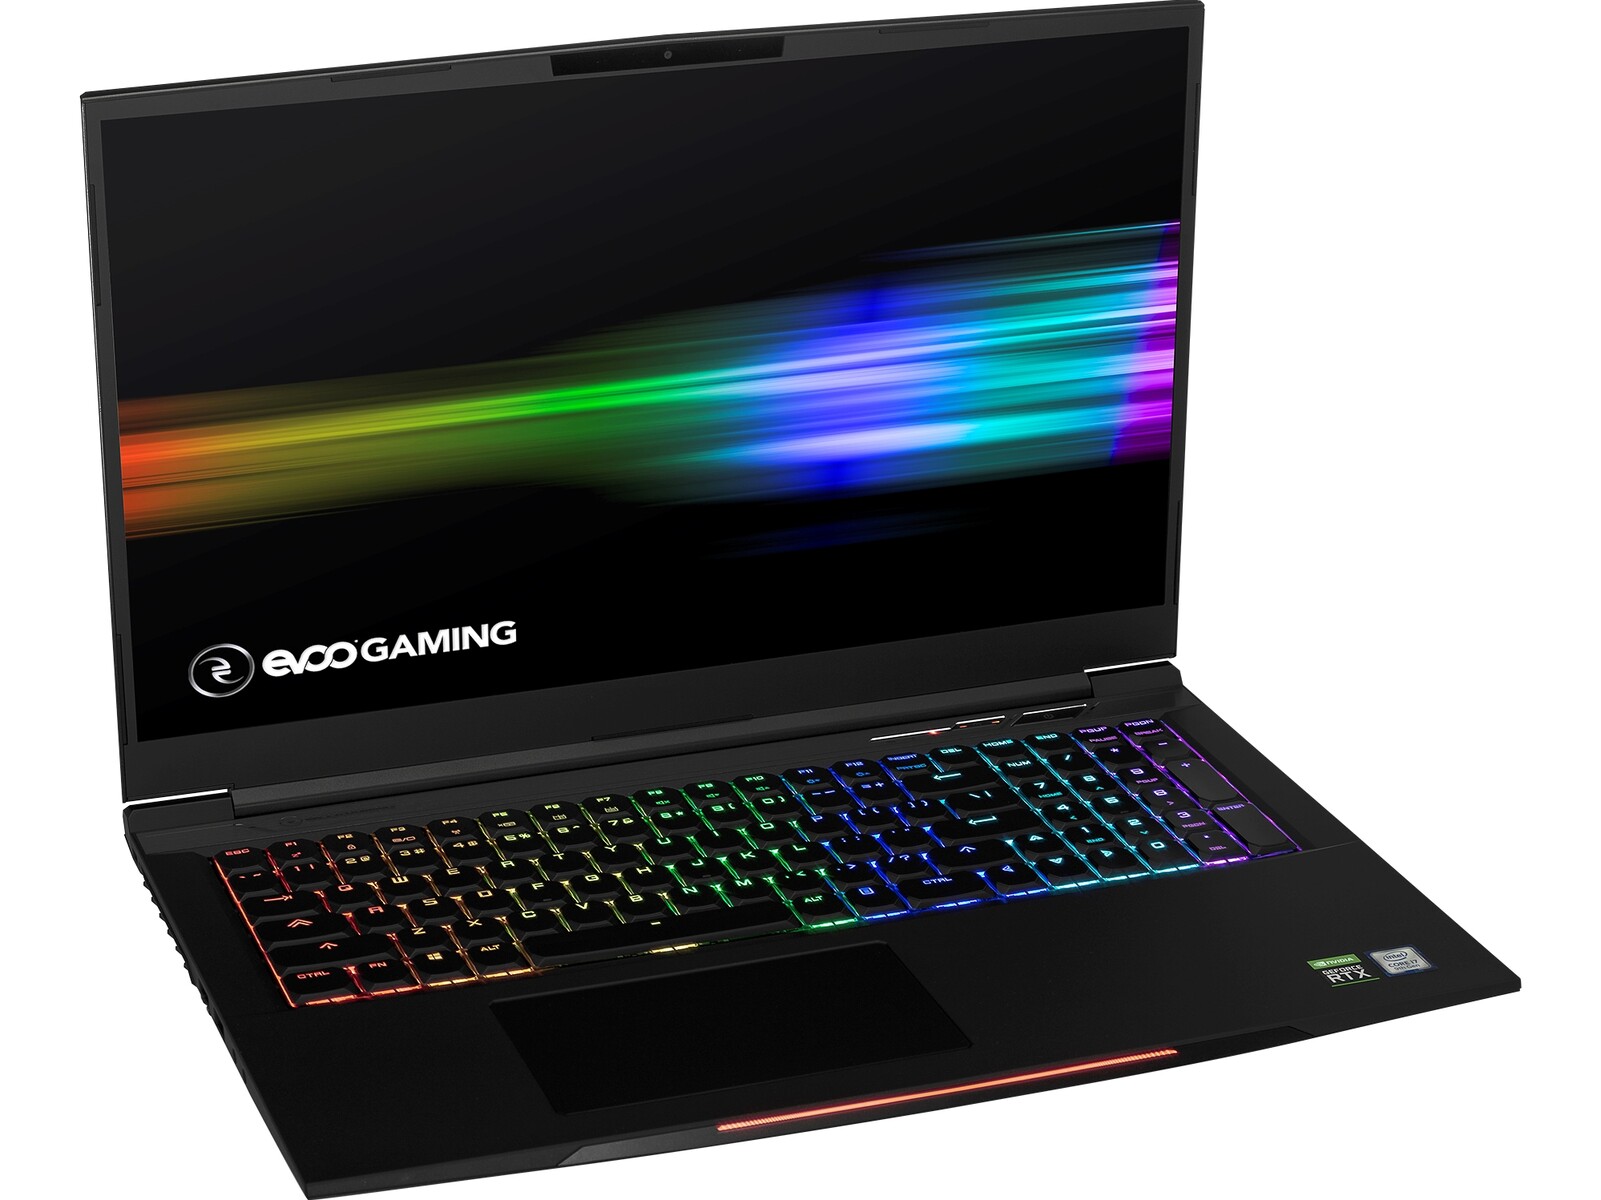
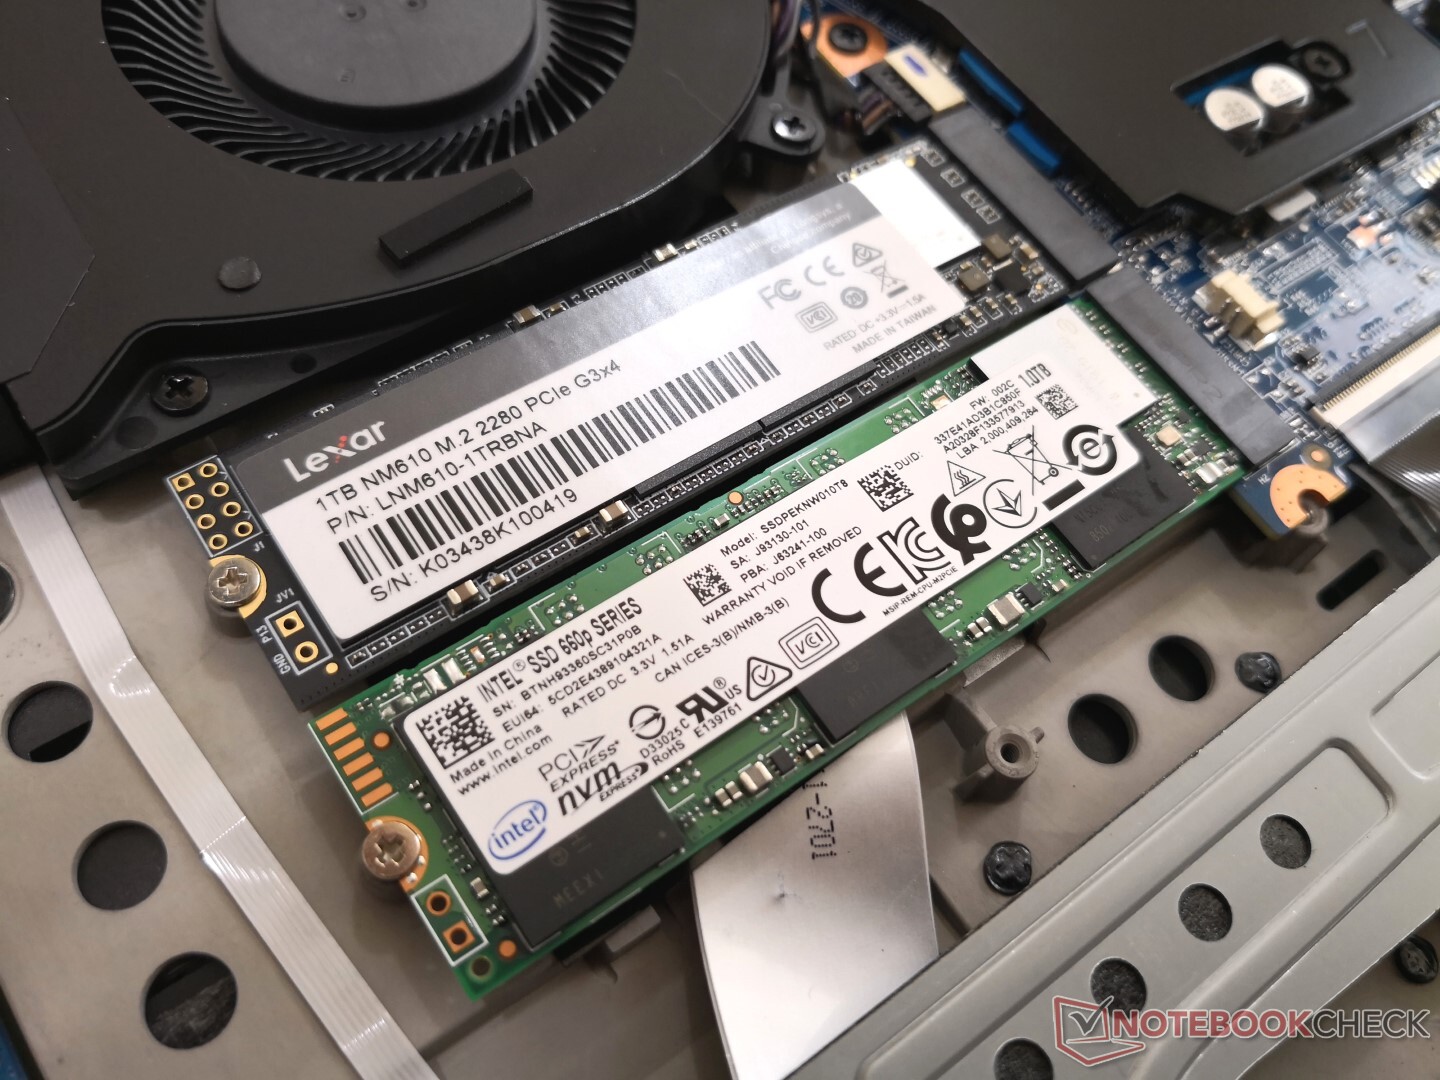
Our host system is the 17.3-inch Walmart EVOO Gaming 17 laptop which houses two M.2 2280 PCIe x4 bays to support two individual NVMe drives. For our setup, the Lexar is installed as a secondary drive. Users will need to initialize the drive through Disk Management first before it can be used.
Owners will also need their own screws to secure the drive in place once installed since Lexar does not include one in the box. Depending on the laptop or desktop, however, that extra screw may not be available.

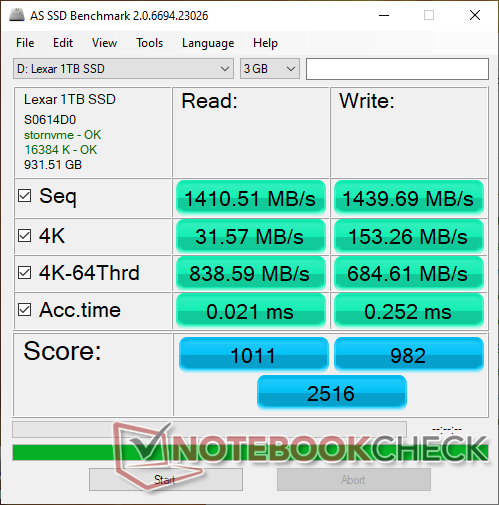
AS SSD & CrystalDiskMark
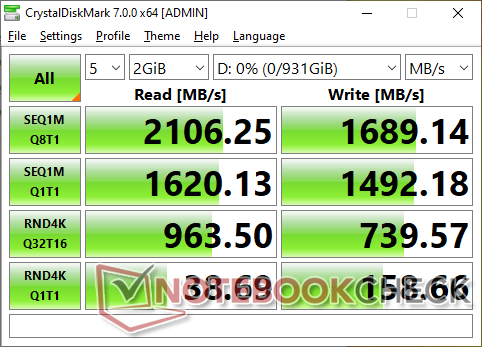
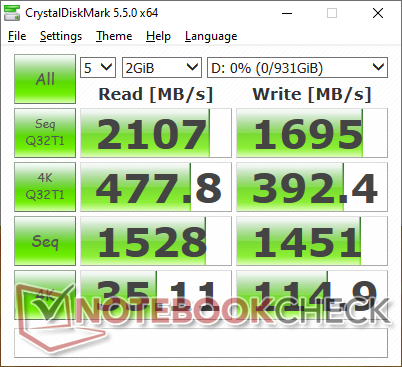
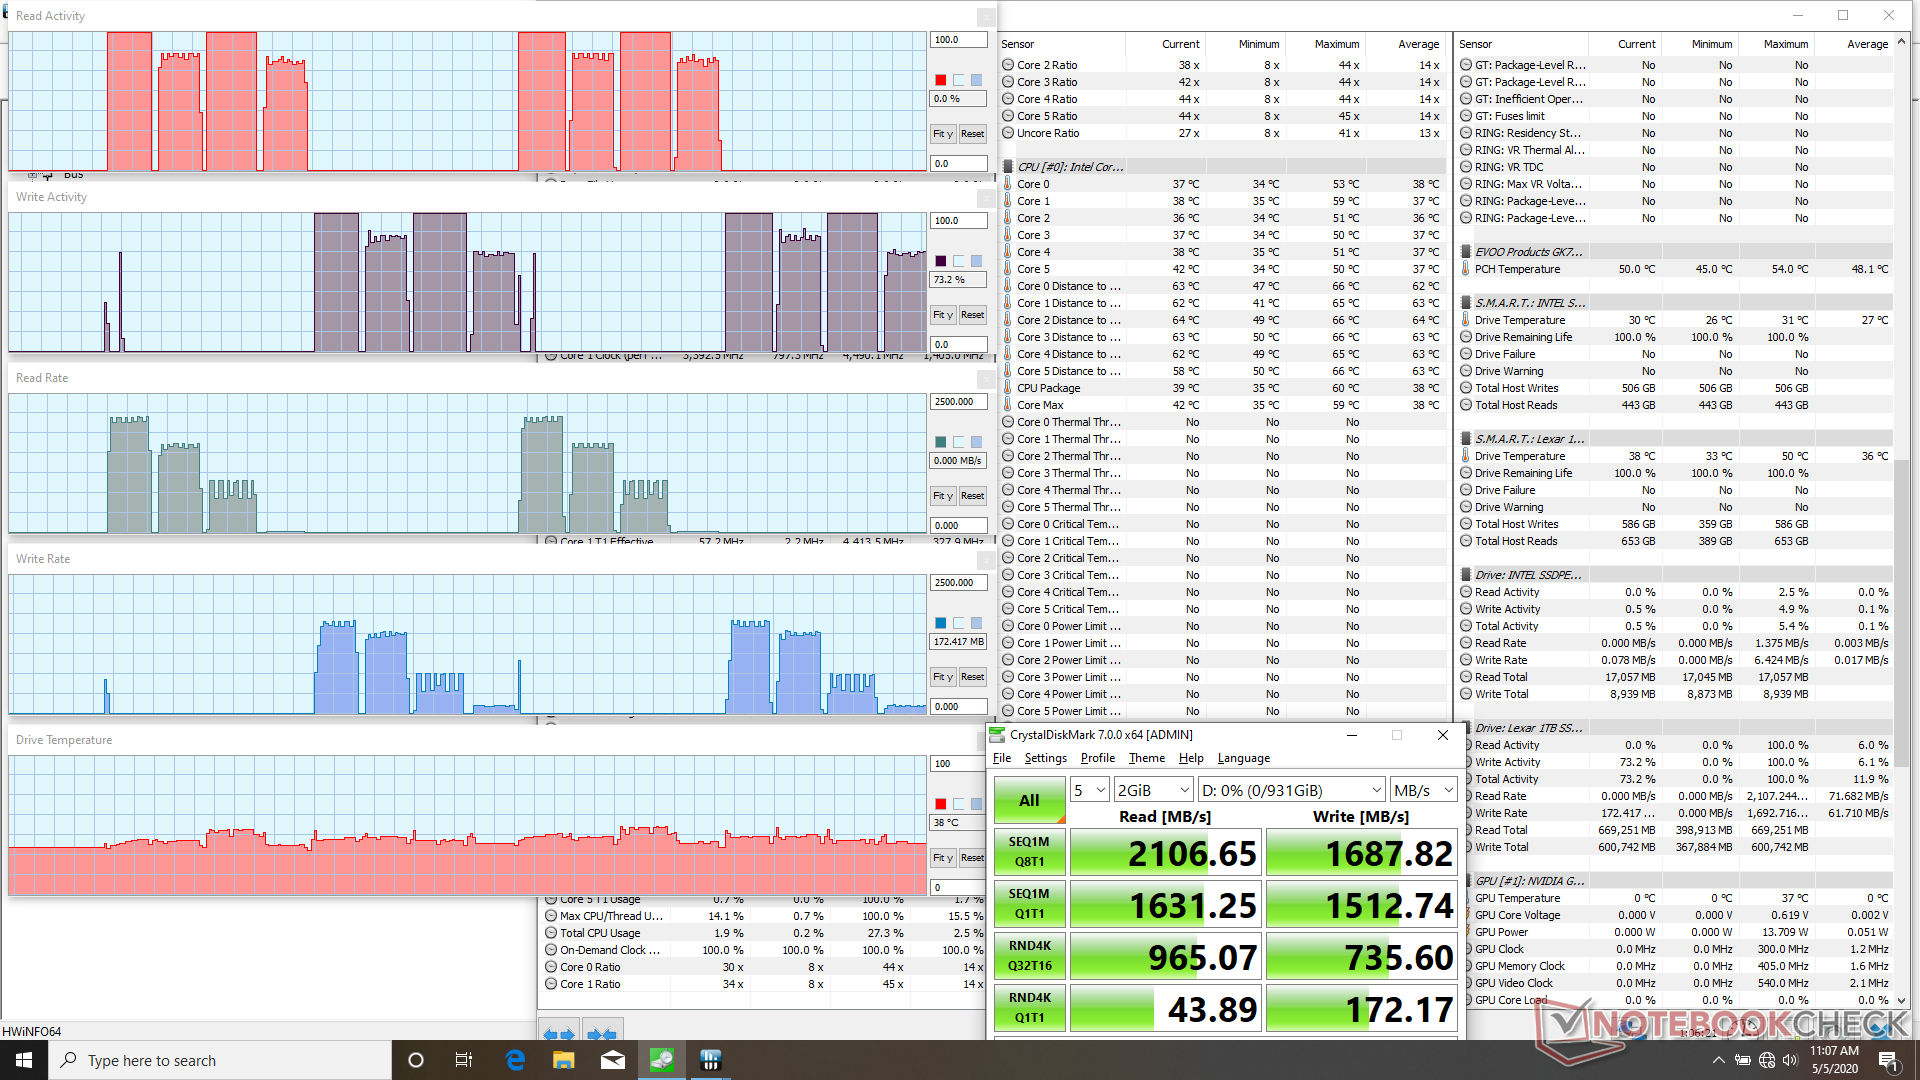
We're able to reach the manufacturer claim of 2100 MB/s read and 1600 MB/s write when running CrystalDiskMark with a queue depth of 32 on a single thread. Read rate of smaller 4K blocks is slightly slower than expected at only about 35 MB/s compared to over 50 MB/s on the Western Digital Blue SN550 or Intel 660p.
| Walmart EVOO Gaming 17 Lexar NM610 Lexar NM610 1TB | Walmart EVOO Gaming 17 HP SSD EX950 HP SSD EX950 PCIe x4 NVMe 2TB 5MS24AA#ABC | Western Digital Blue SN550 NVMe Western Digital Blue SN550 NVMe SSD 1 TB WDS100T2B0C | MSI GP65 10SFK-047US Samsung SSD PM981 MZVLB1T0HALR | Asus ZenBook Duo UX481FL Intel SSD 660p 1TB SSDPEKNW010T8 | |
|---|---|---|---|---|---|
| AS SSD | 14% | 5% | 63% | -10% | |
| Seq Read (MB/s) | 1411 | 987 -30% | 1852 31% | 2066 46% | 1237 -12% |
| Seq Write (MB/s) | 1440 | 2085 45% | 1322 -8% | 2418 68% | 1069 -26% |
| 4K Read (MB/s) | 31.57 | 47.99 52% | 26.84 -15% | 54.2 72% | 52.1 65% |
| 4K Write (MB/s) | 153.3 | 121.2 -21% | 165.7 8% | 129 -16% | 134.7 -12% |
| 4K-64 Read (MB/s) | 839 | 1279 52% | 386.4 -54% | 1865 122% | 585 -30% |
| 4K-64 Write (MB/s) | 685 | 826 21% | 1098 60% | 1878 174% | 854 25% |
| Access Time Read * (ms) | 0.021 | 0.025 -19% | 0.024 -14% | 0.042 -100% | 0.05 -138% |
| Access Time Write * (ms) | 0.252 | 0.088 65% | 0.096 62% | 0.091 64% | 0.117 54% |
| Score Read (Points) | 1011 | 1426 41% | 598 -41% | 2126 110% | 761 -25% |
| Score Write (Points) | 982 | 1156 18% | 1396 42% | 2249 129% | 1095 12% |
| Score Total (Points) | 2516 | 3373 34% | 2280 -9% | 5482 118% | 2255 -10% |
| Copy ISO MB/s (MB/s) | 1633 | 1772 9% | 1496 -8% | 2927 79% | 1714 5% |
| Copy Program MB/s (MB/s) | 737 | 147.2 -80% | 799 8% | 728 -1% | 511 -31% |
| Copy Game MB/s (MB/s) | 1458 | 1587 9% | 1488 2% | 1614 11% | 1187 -19% |
| CrystalDiskMark 5.2 / 6 | 12% | 38% | 38% | 10% | |
| Write 4K (MB/s) | 114.9 | 109 -5% | 234.3 104% | 145 26% | 140.7 22% |
| Read 4K (MB/s) | 35.11 | 52.7 50% | 53.1 51% | 46.84 33% | 55.6 58% |
| Write Seq (MB/s) | 1451 | 1922 32% | 1978 36% | 2377 64% | 1415 -2% |
| Read Seq (MB/s) | 1528 | 850 -44% | 1102 -28% | 2185 43% | 1516 -1% |
| Write 4K Q32T1 (MB/s) | 392.4 | 425.3 8% | 573 46% | 463.5 18% | 474.5 21% |
| Read 4K Q32T1 (MB/s) | 477.8 | 488.5 2% | 763 60% | 527 10% | 403.4 -16% |
| Write Seq Q32T1 (MB/s) | 1695 | 2689 59% | 2011 19% | 2395 41% | 1796 6% |
| Read Seq Q32T1 (MB/s) | 2107 | 1907 -9% | 2355 12% | 3470 65% | 1913 -9% |
| Write 4K Q8T8 (MB/s) | 1469 | ||||
| Read 4K Q8T8 (MB/s) | 1434 | ||||
| Total Average (Program / Settings) | 13% /
13% | 22% /
17% | 51% /
53% | 0% /
-3% |
* ... smaller is better

ATTO
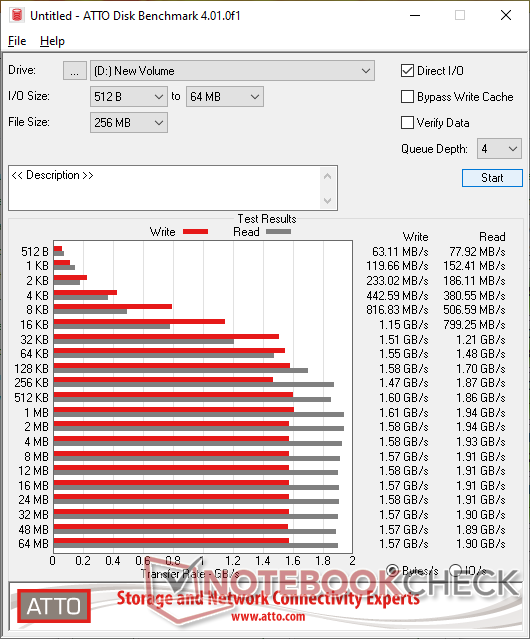
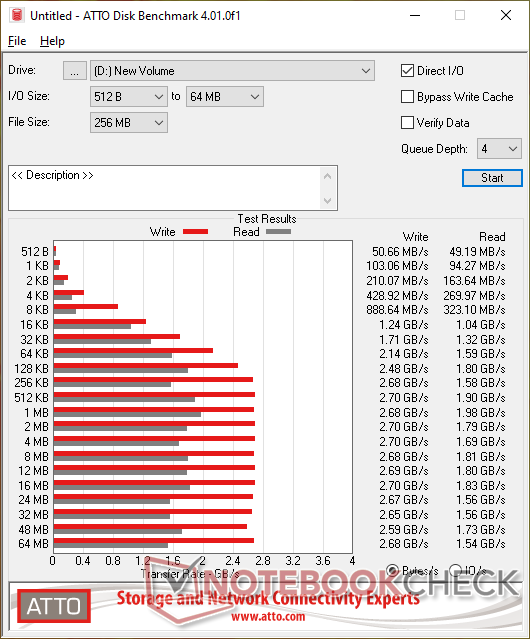
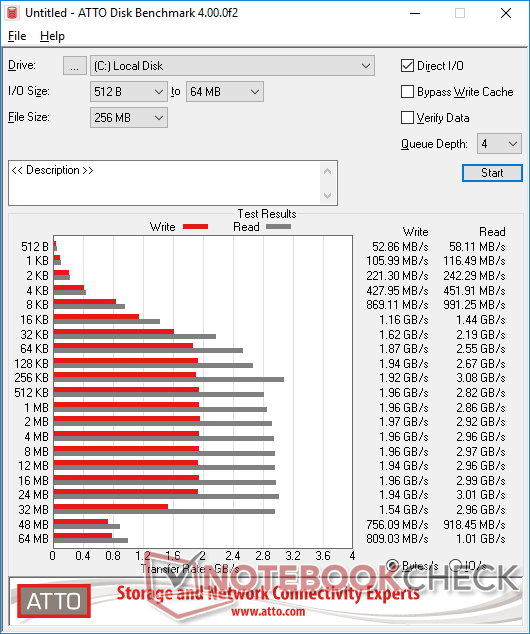
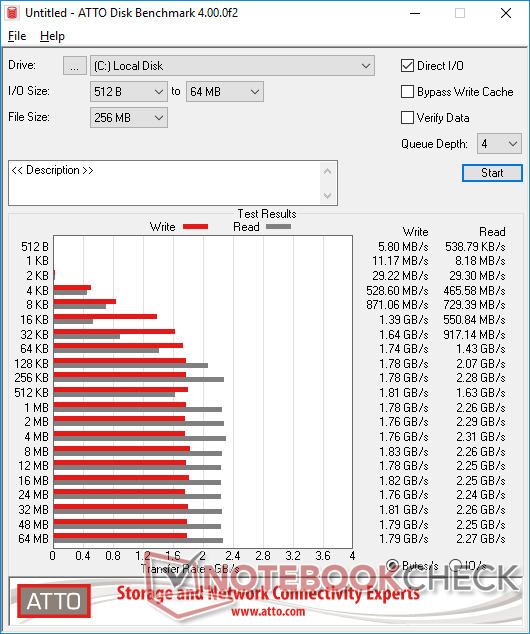
ATTO tests read and write speeds of multiple I/O sizes ranging from half a kilobyte to 64 MB or greater to paint a bigger picture of SSD performance. In this scenario, we can observe that read performance stabilizes at around 256 KB or higher while write performance would stabilize even sooner at around 32 KB.
| Walmart EVOO Gaming 17 Lexar NM610 , , Lexar NM610 1TB | Walmart EVOO Gaming 17 HP SSD EX950 , , HP SSD EX950 PCIe x4 NVMe 2TB 5MS24AA#ABC | Western Digital Blue SN550 NVMe , , Western Digital Blue SN550 NVMe SSD 1 TB WDS100T2B0C | Intel NUC8i7BEH Asura NVMe SSD Iris Plus Graphics 655, i7-8559U, Asura Genesis Xtreme NVMe M.2 SSD 1 TB | Samsung 960 Pro 1TB Titan X Pascal, E5-2680 v4, Samsung SSD 960 Pro 1TB m.2 NVMe | |
|---|---|---|---|---|---|
| ATTO Disk Benchmark | 28% | 9% | 41% | 49% | |
| 8192KB write (KB/s) | 1570000 | 2680000 71% | 1830000 17% | 1960000 25% | 2079890 32% |
| 4096KB write (KB/s) | 1580000 | 2700000 71% | 1760000 11% | 1960000 24% | 2090010 32% |
| 2048KB write (KB/s) | 1580000 | 2700000 71% | 1760000 11% | 1970000 25% | 2090010 32% |
| 1024KB write (KB/s) | 1610000 | 2680000 66% | 1780000 11% | 1960000 22% | 2100230 30% |
| 512KB write (KB/s) | 1600000 | 2700000 69% | 1810000 13% | 1960000 23% | 2090010 31% |
| 256KB write (KB/s) | 1470000 | 2680000 82% | 1780000 21% | 1920000 31% | 2098690 43% |
| 128KB write (KB/s) | 1580000 | 2480000 57% | 1780000 13% | 1940000 23% | 2078800 32% |
| 64KB write (KB/s) | 1550000 | 2140000 38% | 1740000 12% | 1870000 21% | 2073620 34% |
| 32KB write (KB/s) | 1510000 | 1710000 13% | 1640000 9% | 1620000 7% | 2054220 36% |
| 16KB write (KB/s) | 1150000 | 1240000 8% | 1390000 21% | 1160000 1% | 1102410 -4% |
| 8192KB read (KB/s) | 1910000 | 1810000 -5% | 2260000 18% | 2970000 55% | 2960680 55% |
| 4096KB read (KB/s) | 1930000 | 1690000 -12% | 2310000 20% | 2960000 53% | 3019900 56% |
| 2048KB read (KB/s) | 1940000 | 1790000 -8% | 2290000 18% | 2920000 51% | 3026480 56% |
| 1024KB read (KB/s) | 1940000 | 1980000 2% | 2260000 16% | 2860000 47% | 3263860 68% |
| 512KB read (KB/s) | 1860000 | 1900000 2% | 1630000 -12% | 2820000 52% | 3197250 72% |
| 256KB read (KB/s) | 1870000 | 1580000 -16% | 2280000 22% | 3080000 65% | 3230230 73% |
| 128KB read (KB/s) | 1700000 | 1800000 6% | 2070000 22% | 2670000 57% | 3003310 77% |
| 64KB read (KB/s) | 1480000 | 1590000 7% | 1430000 -3% | 2550000 72% | 2458920 66% |
| 32KB read (KB/s) | 1210000 | 1320000 9% | 917140 -24% | 2190000 81% | 2432300 101% |
| 16KB read (KB/s) | 799250 | 1040000 30% | 550840 -31% | 1440000 80% | 1257110 57% |
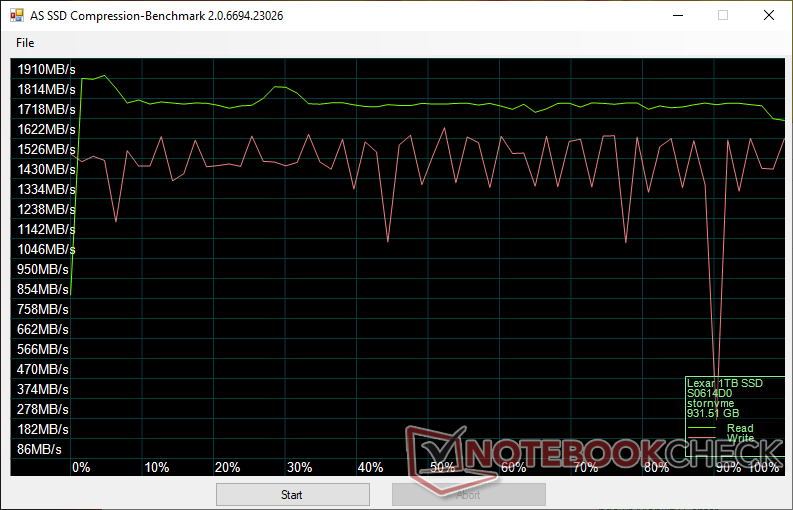
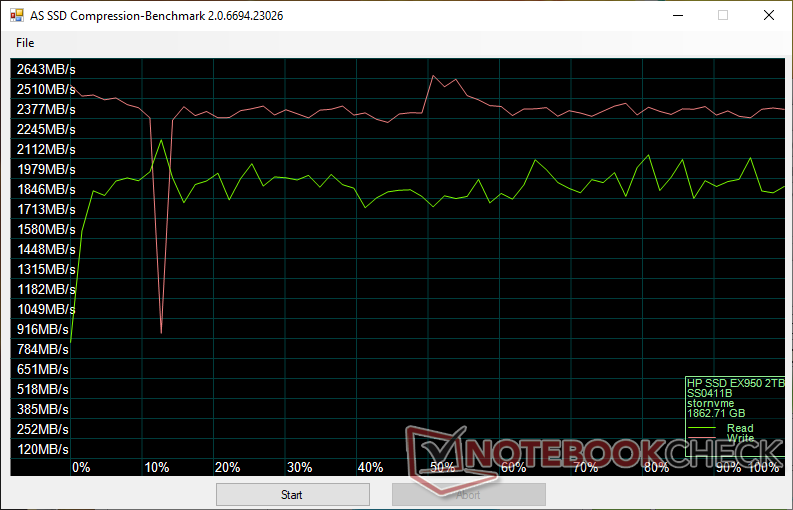
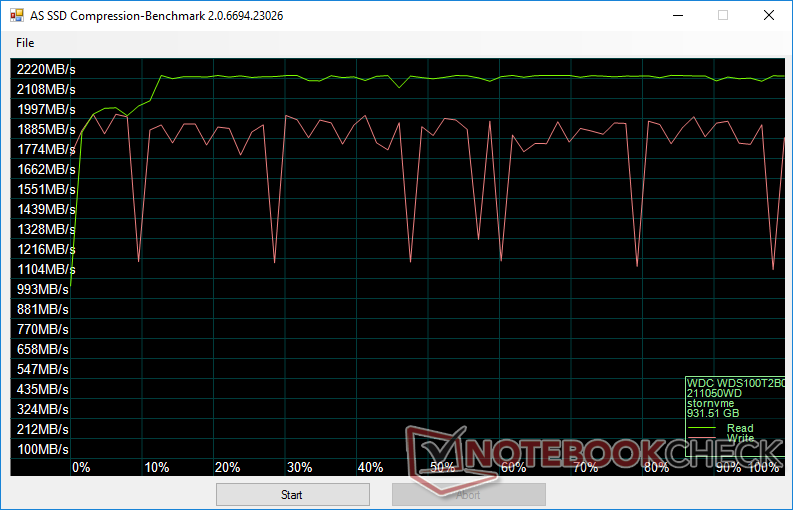
Data Compression
Data compression could have been more stable when writing. While fluctuations are common, the Lexar would occasionally dip down the 300 MB/s range even after multiple retries.

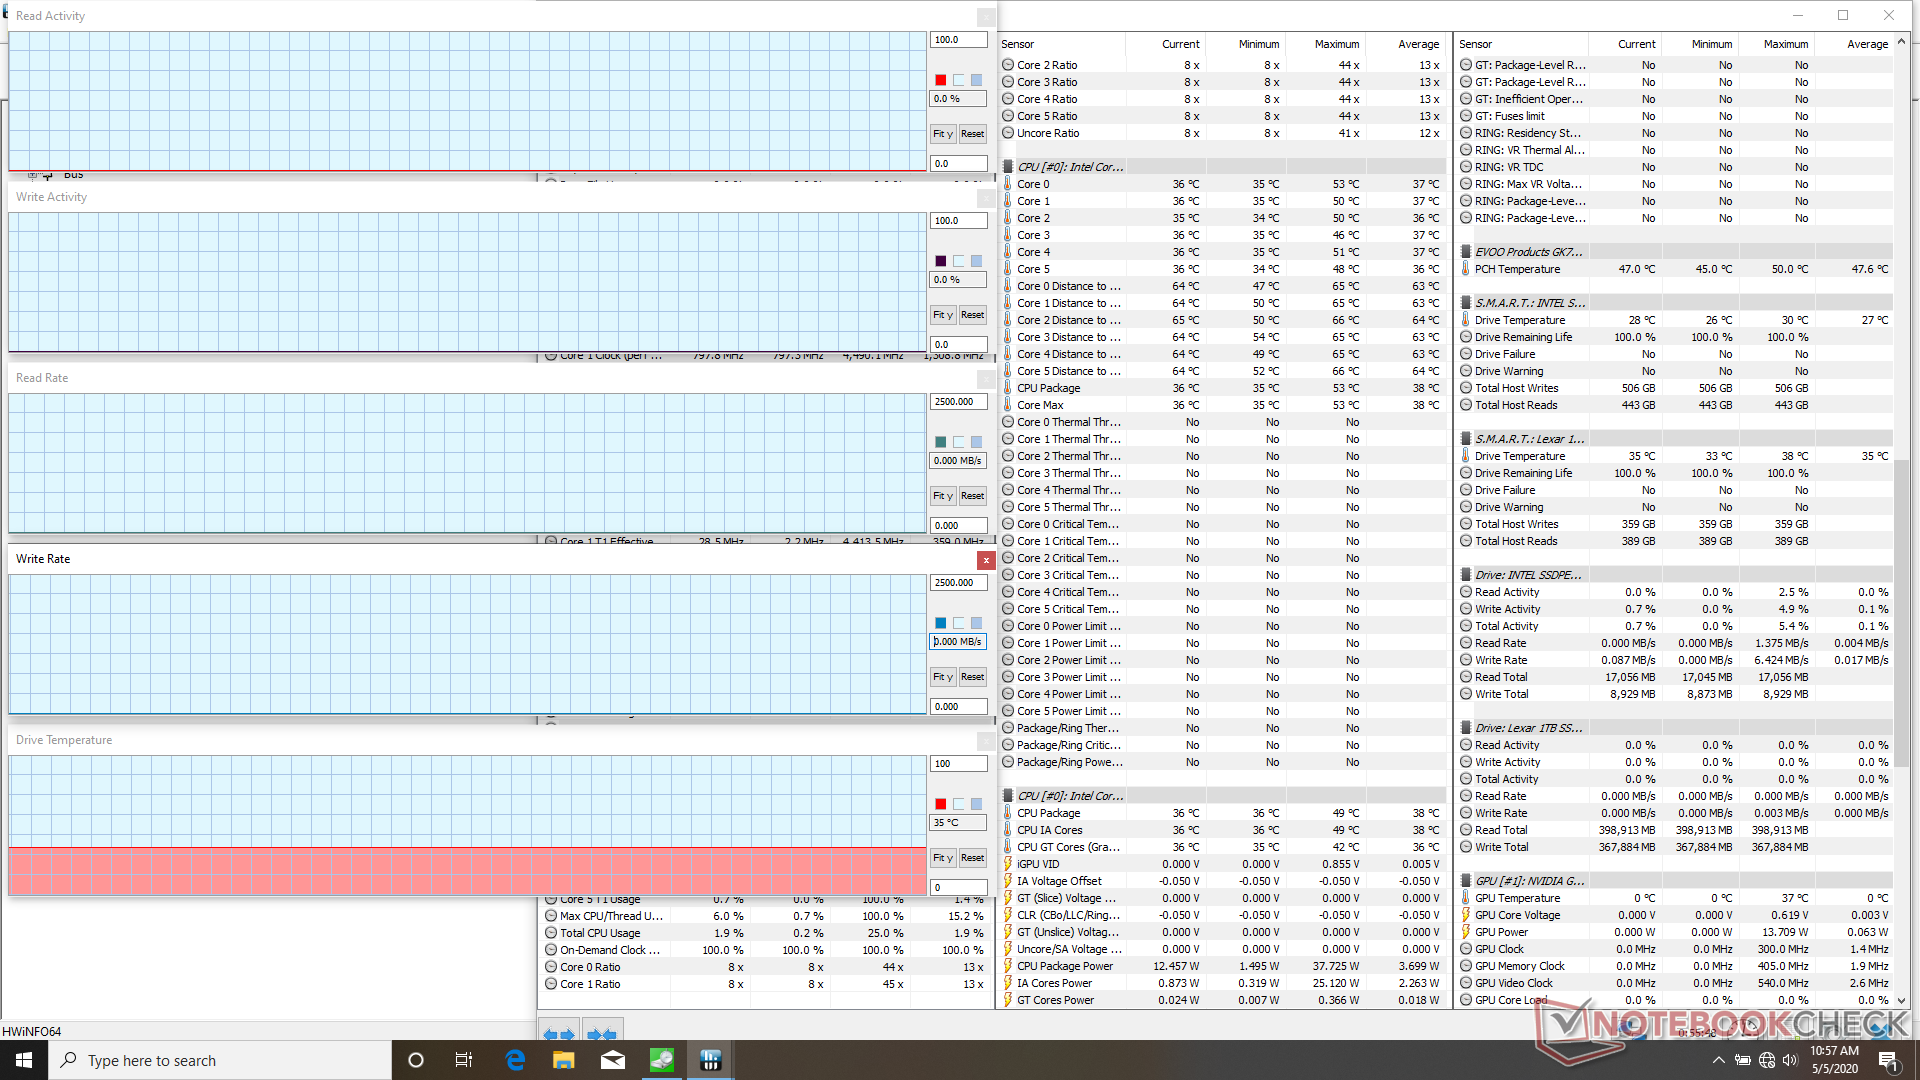
Temperature
SSD temperature peaks at around 50 C when running CDM 7 compared to the advertised operating temperature of up to 70 C. Results will likely be higher if the drive is reading and writing at its sequential Q32T1 peak for extended periods. Still, temperature is generally not an issue on budget-oriented M.2 SSDs.
Verdict
Competition in the 1 TB space is fierce at the moment. The Western Digital SN550, for example, offers faster read and write rates, longer TBW, longer base warranty, and a cheaper price than our NM610. That's not to say that the Lexar drive isn't a good value, but the target audience of price sensitive users might easily overlook the new Lexar drives since cheaper and potentially faster alternatives are already available.
Price comparison
