Walmart EVOO Gaming 17 Review: Chinese Laptop with Walmart's Name Slapped On
Walmart wants to make gaming PCs more affordable by introducing its own branded models. Last year saw the launch of the Walmart Overpowered series of gaming laptops derived from white label Tongfang chassis designs. This year, Walmart has launched its EVOO Gaming series derived from the Tongfang GK7CP0S.
The Walmart system is specially tuned by THX for optimal visual and audio quality. Tuned by THX ensures a well-calibrated display while THX Spatial Audio allows for 360-degree spherical sound for improved audio. Other gaming laptops may have similar enhancements such as Pantone certification or Dynaudio speakers, but these alternatives tend to cost more than the EVOO.
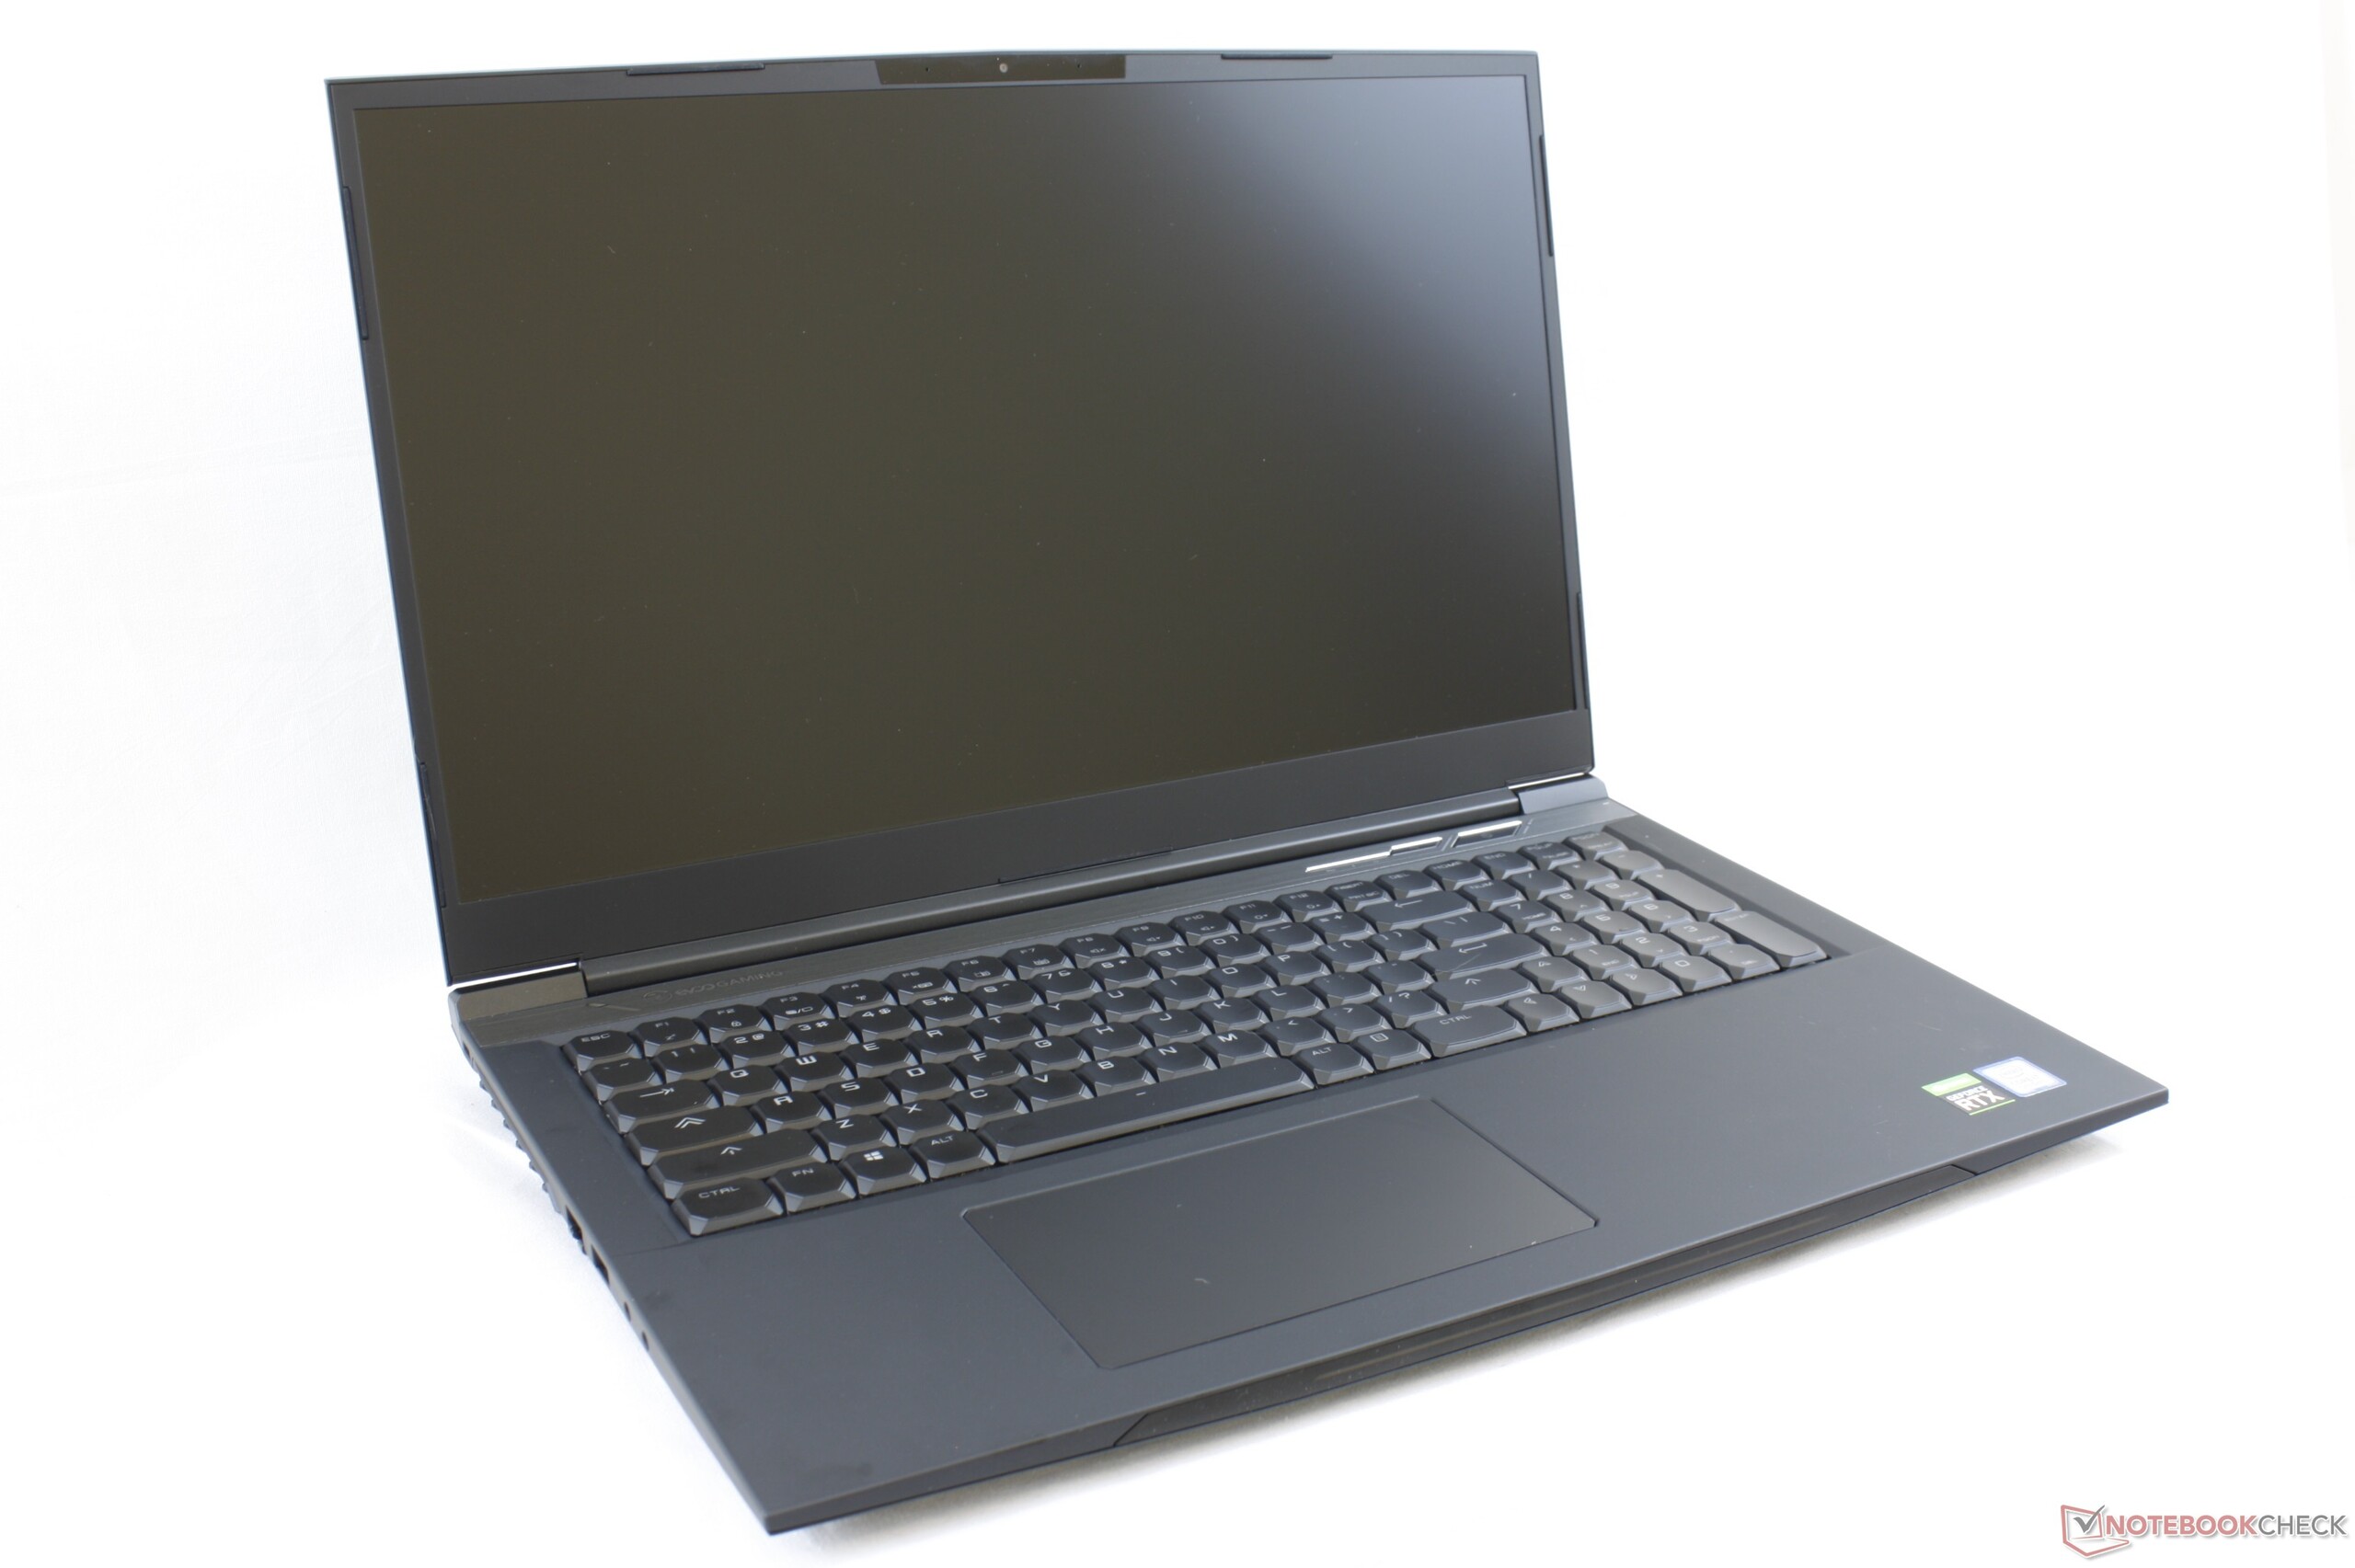
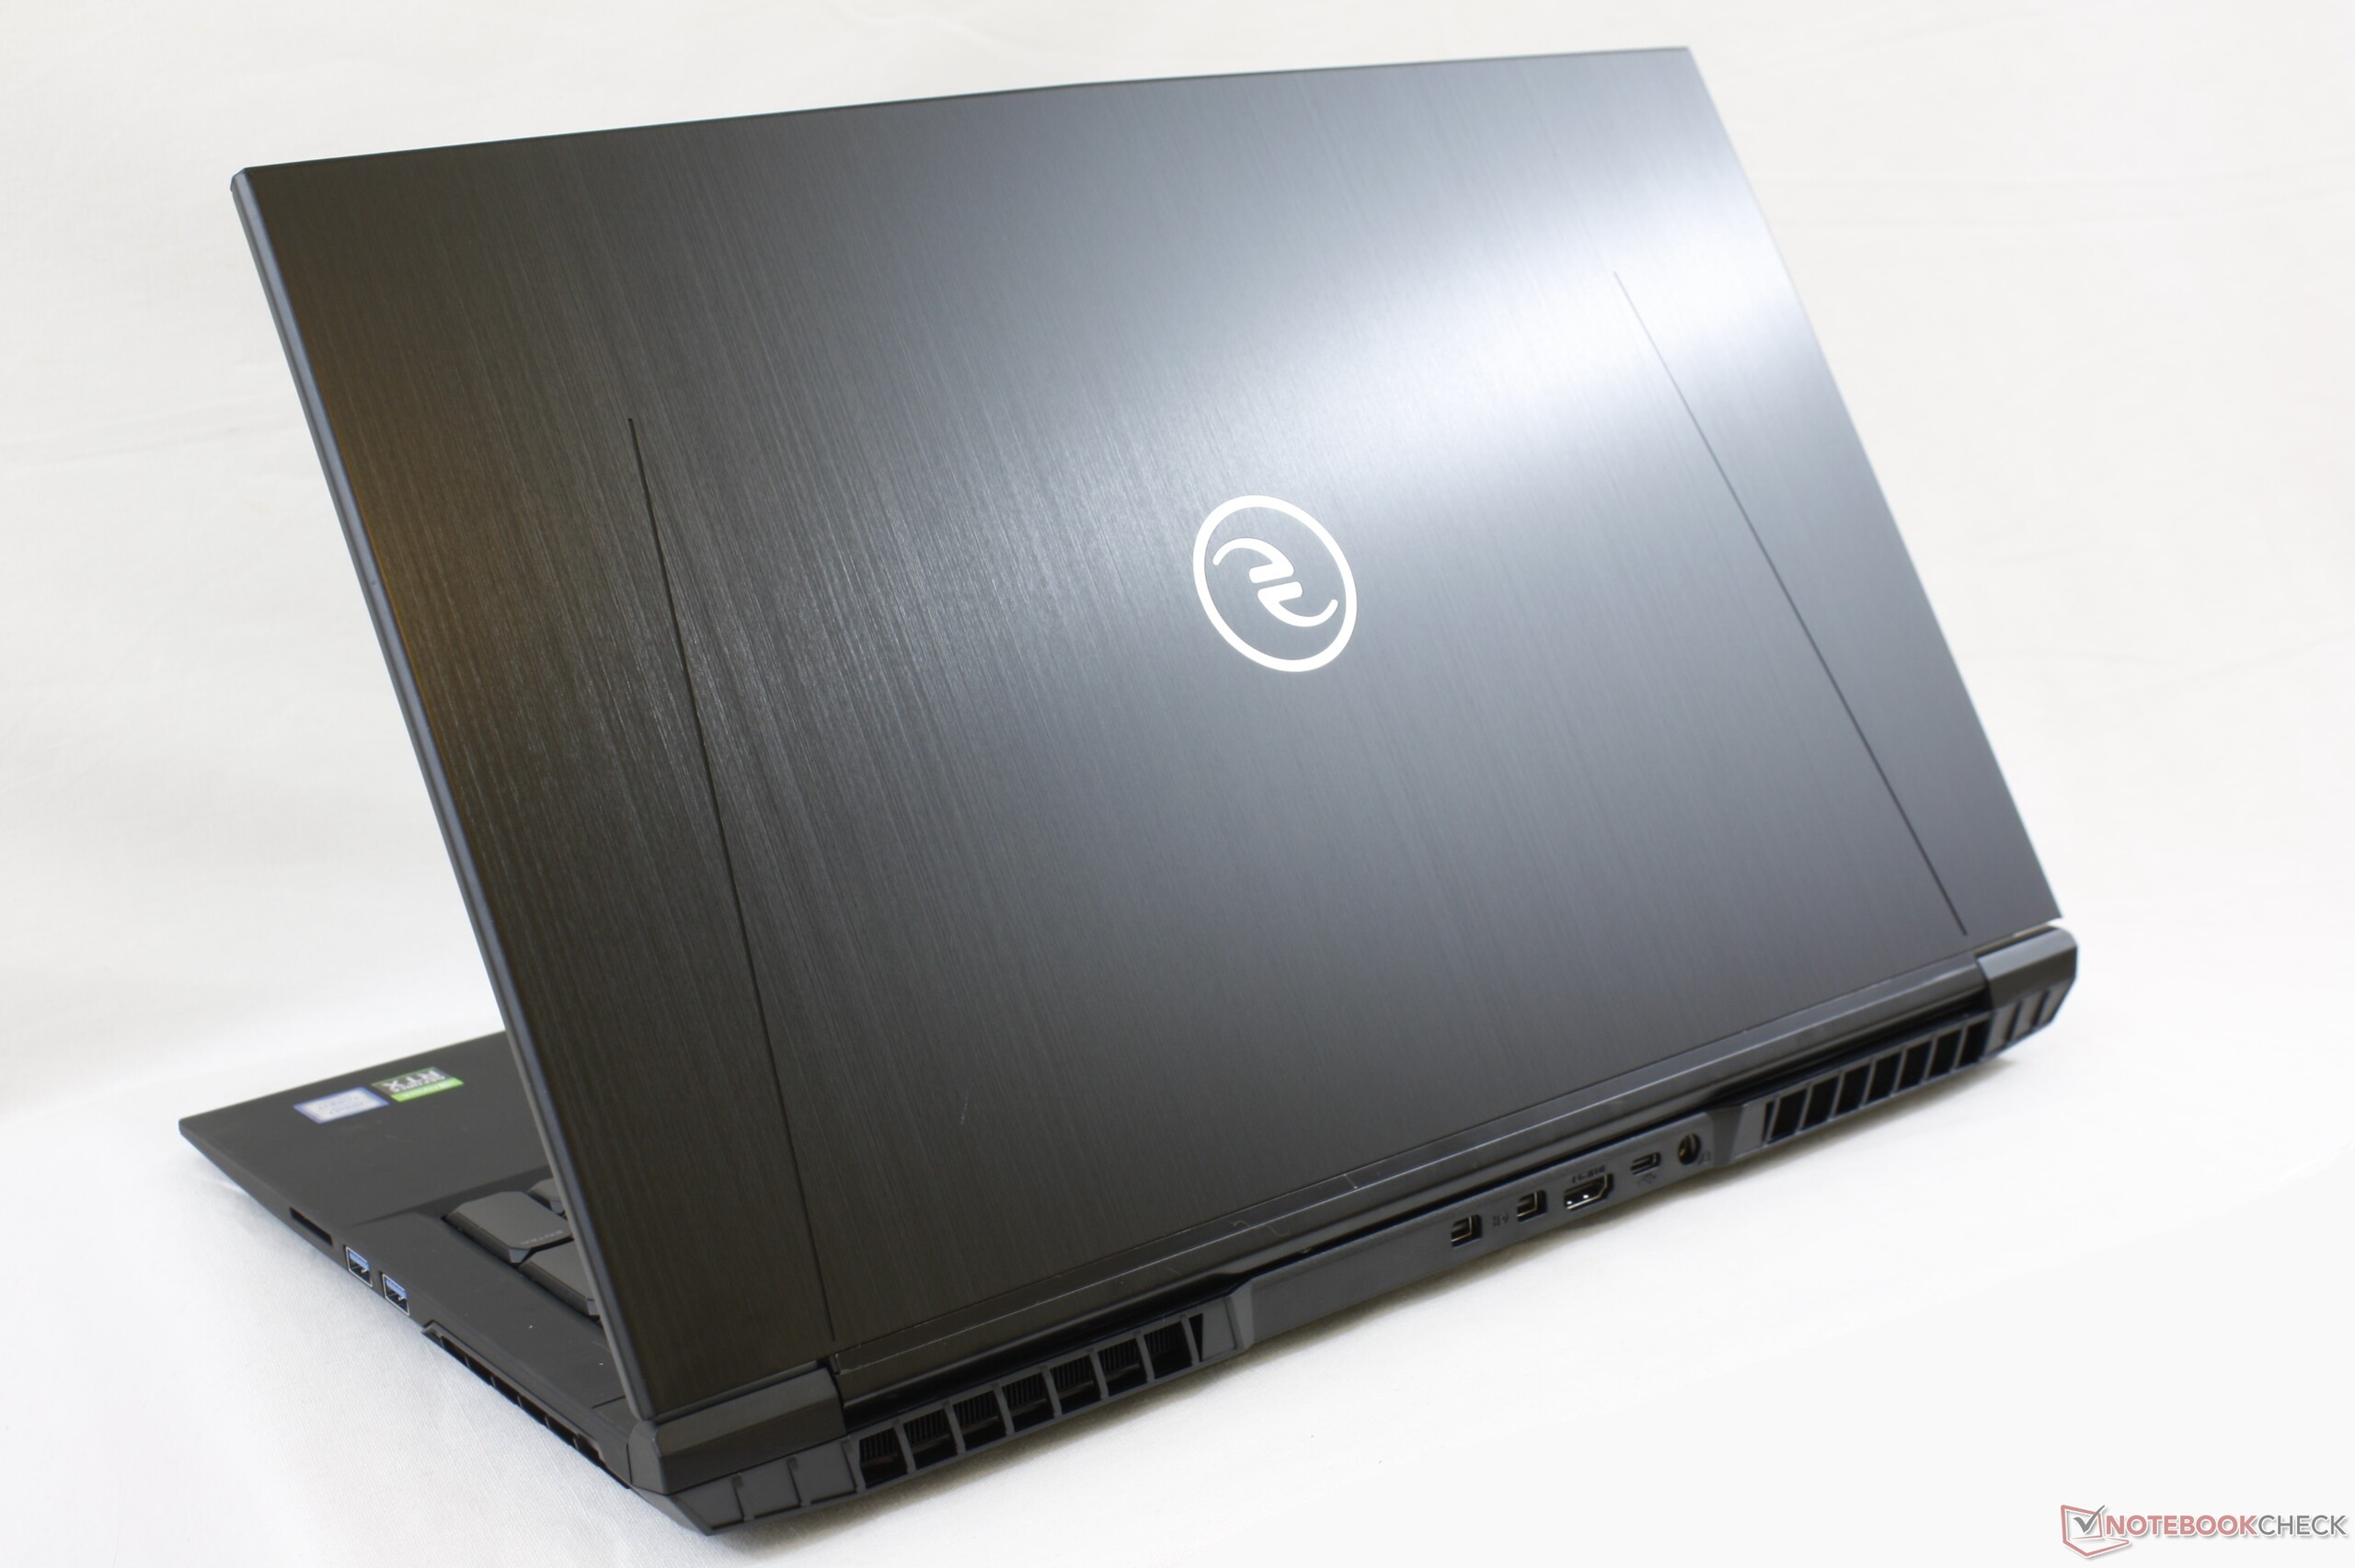
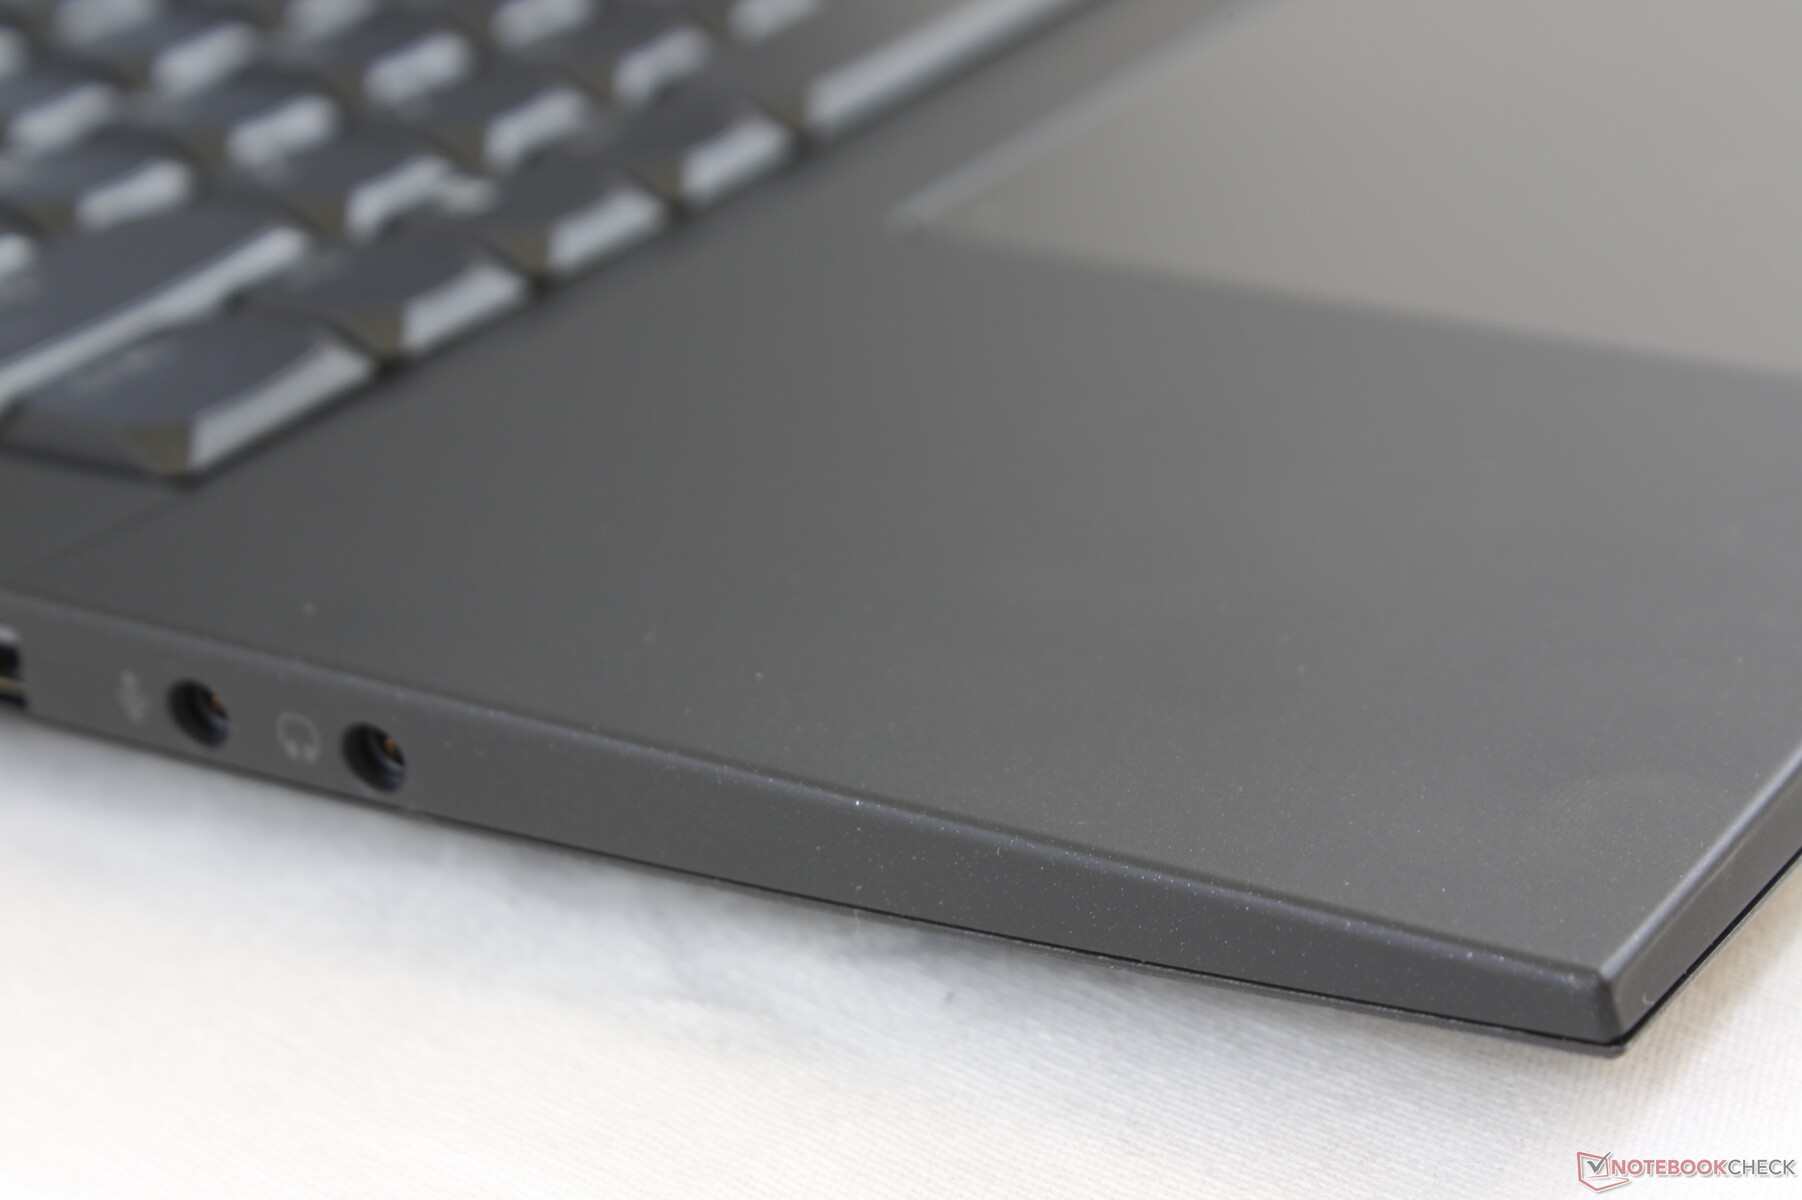
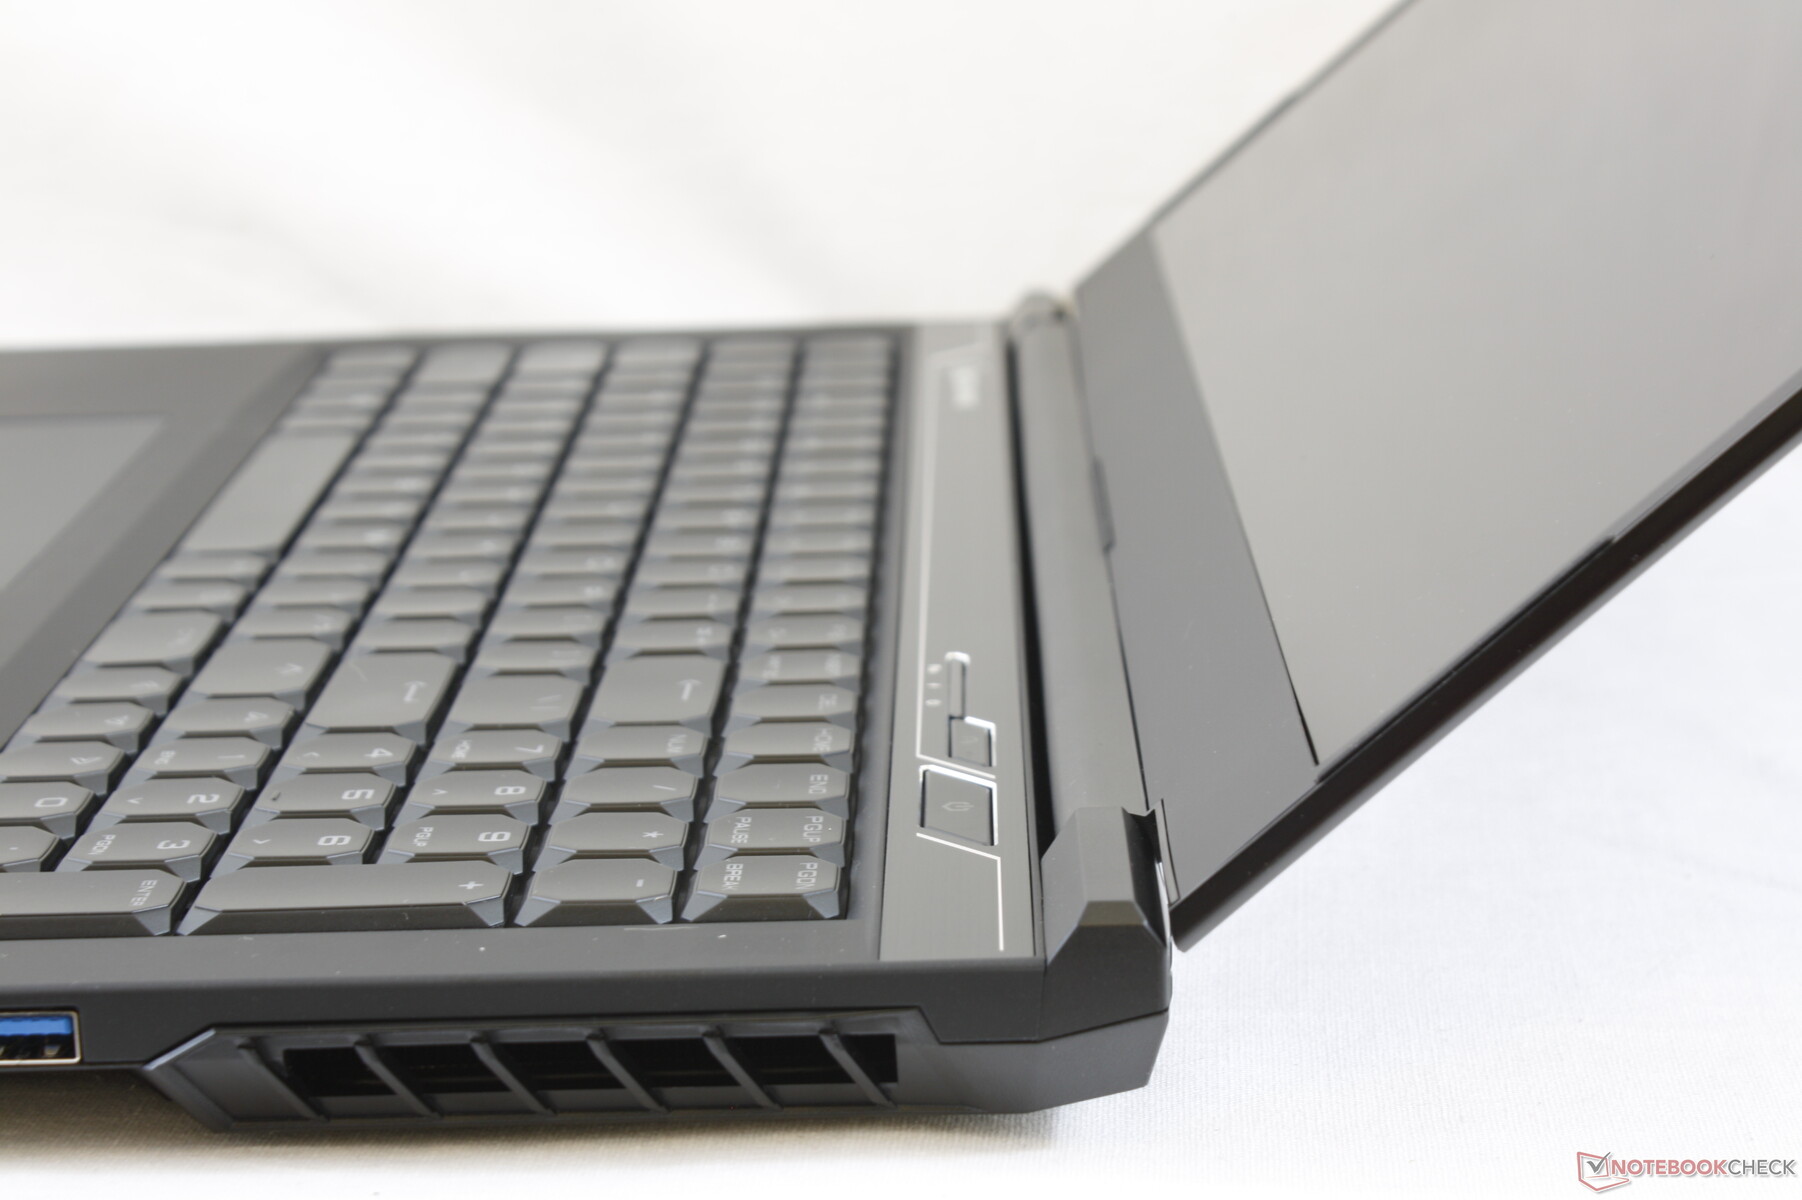
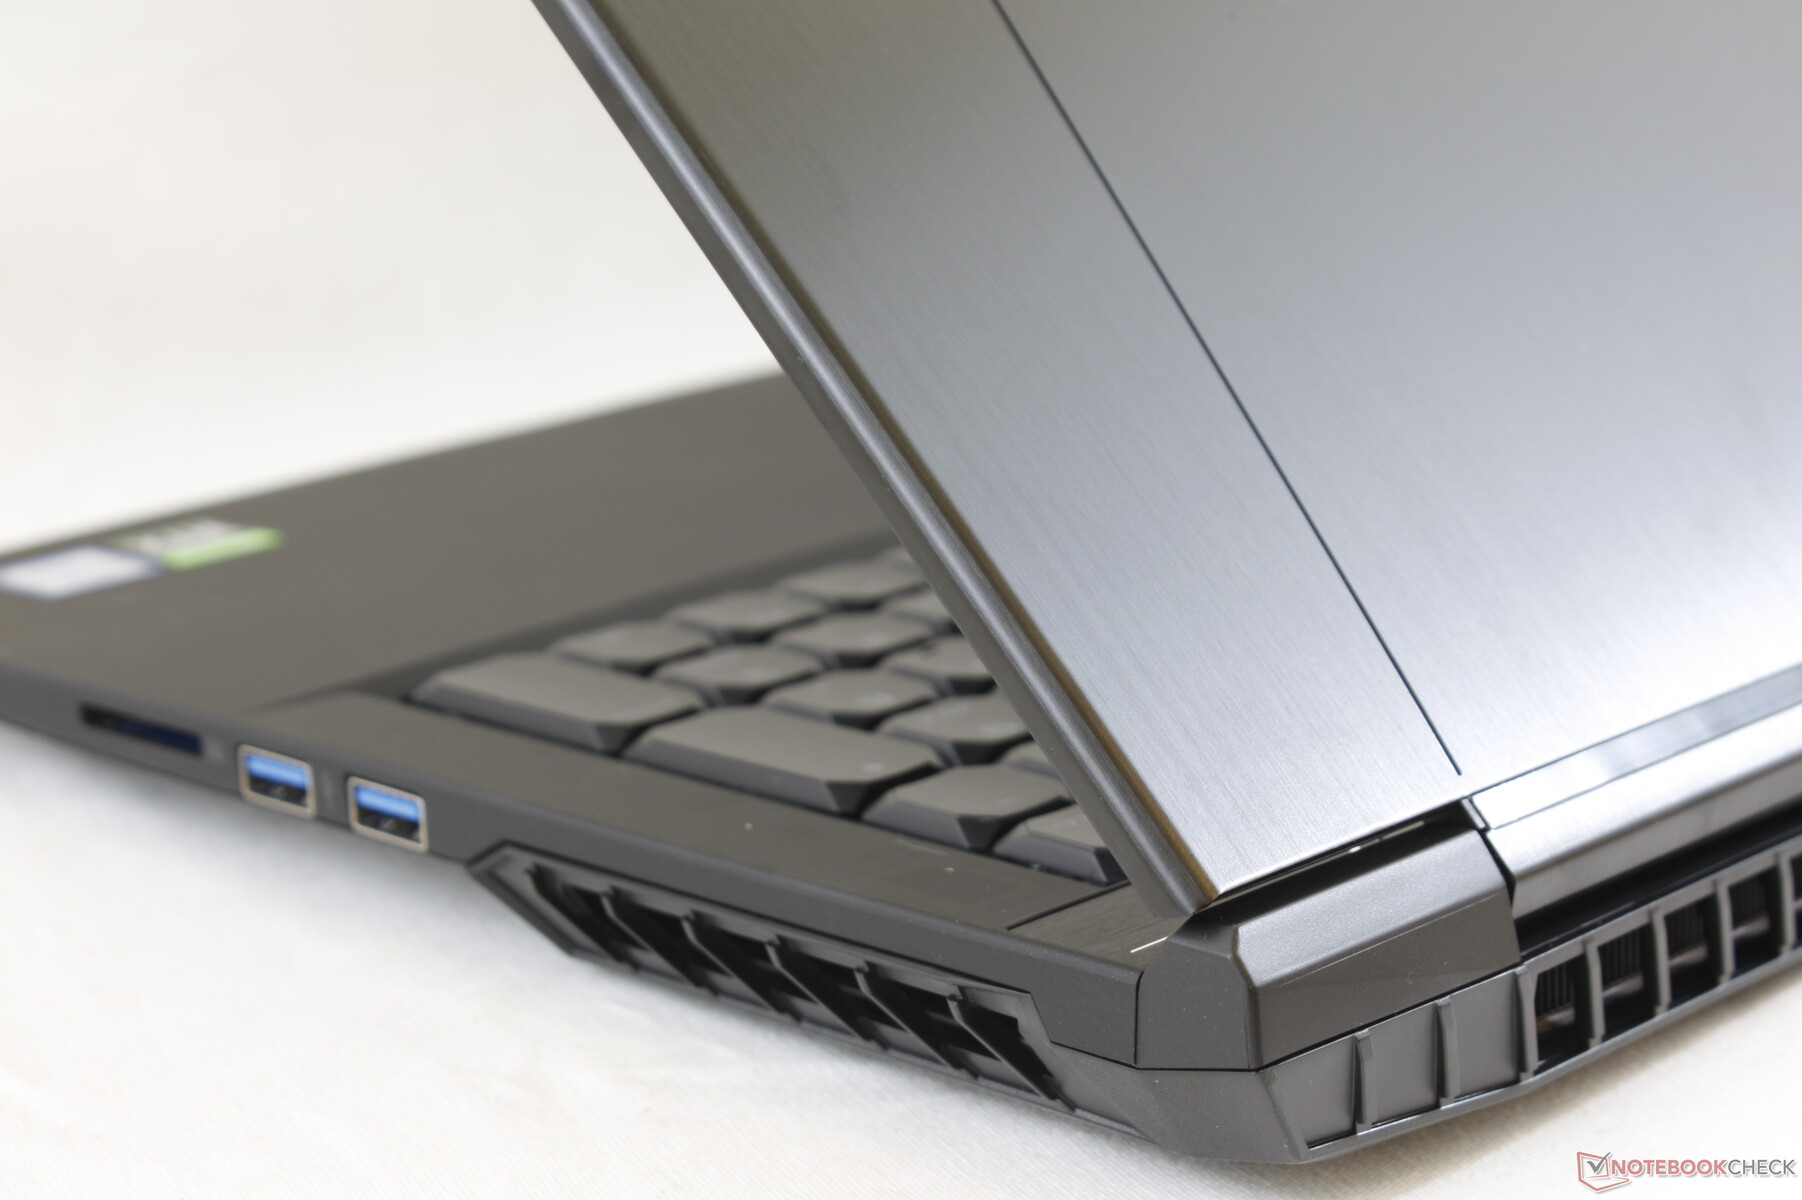
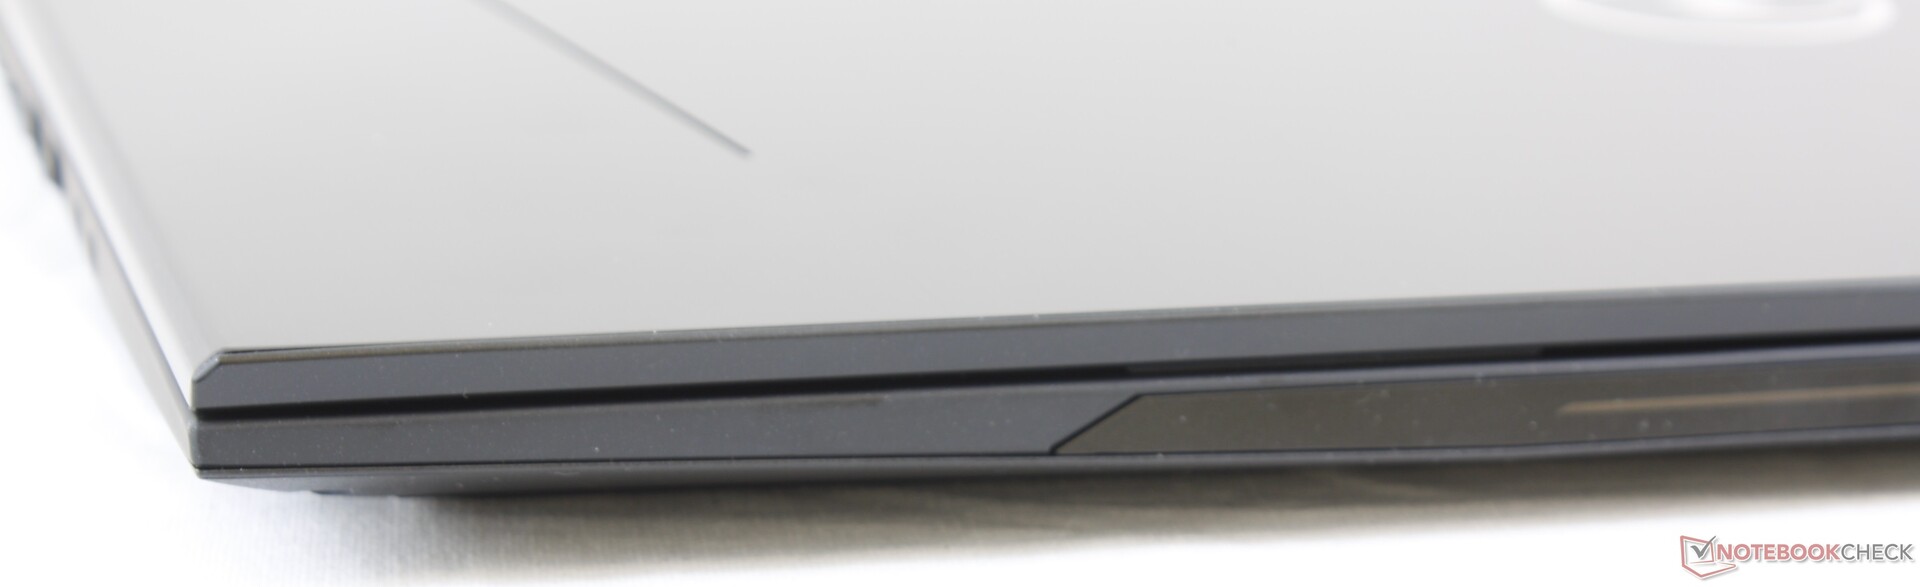
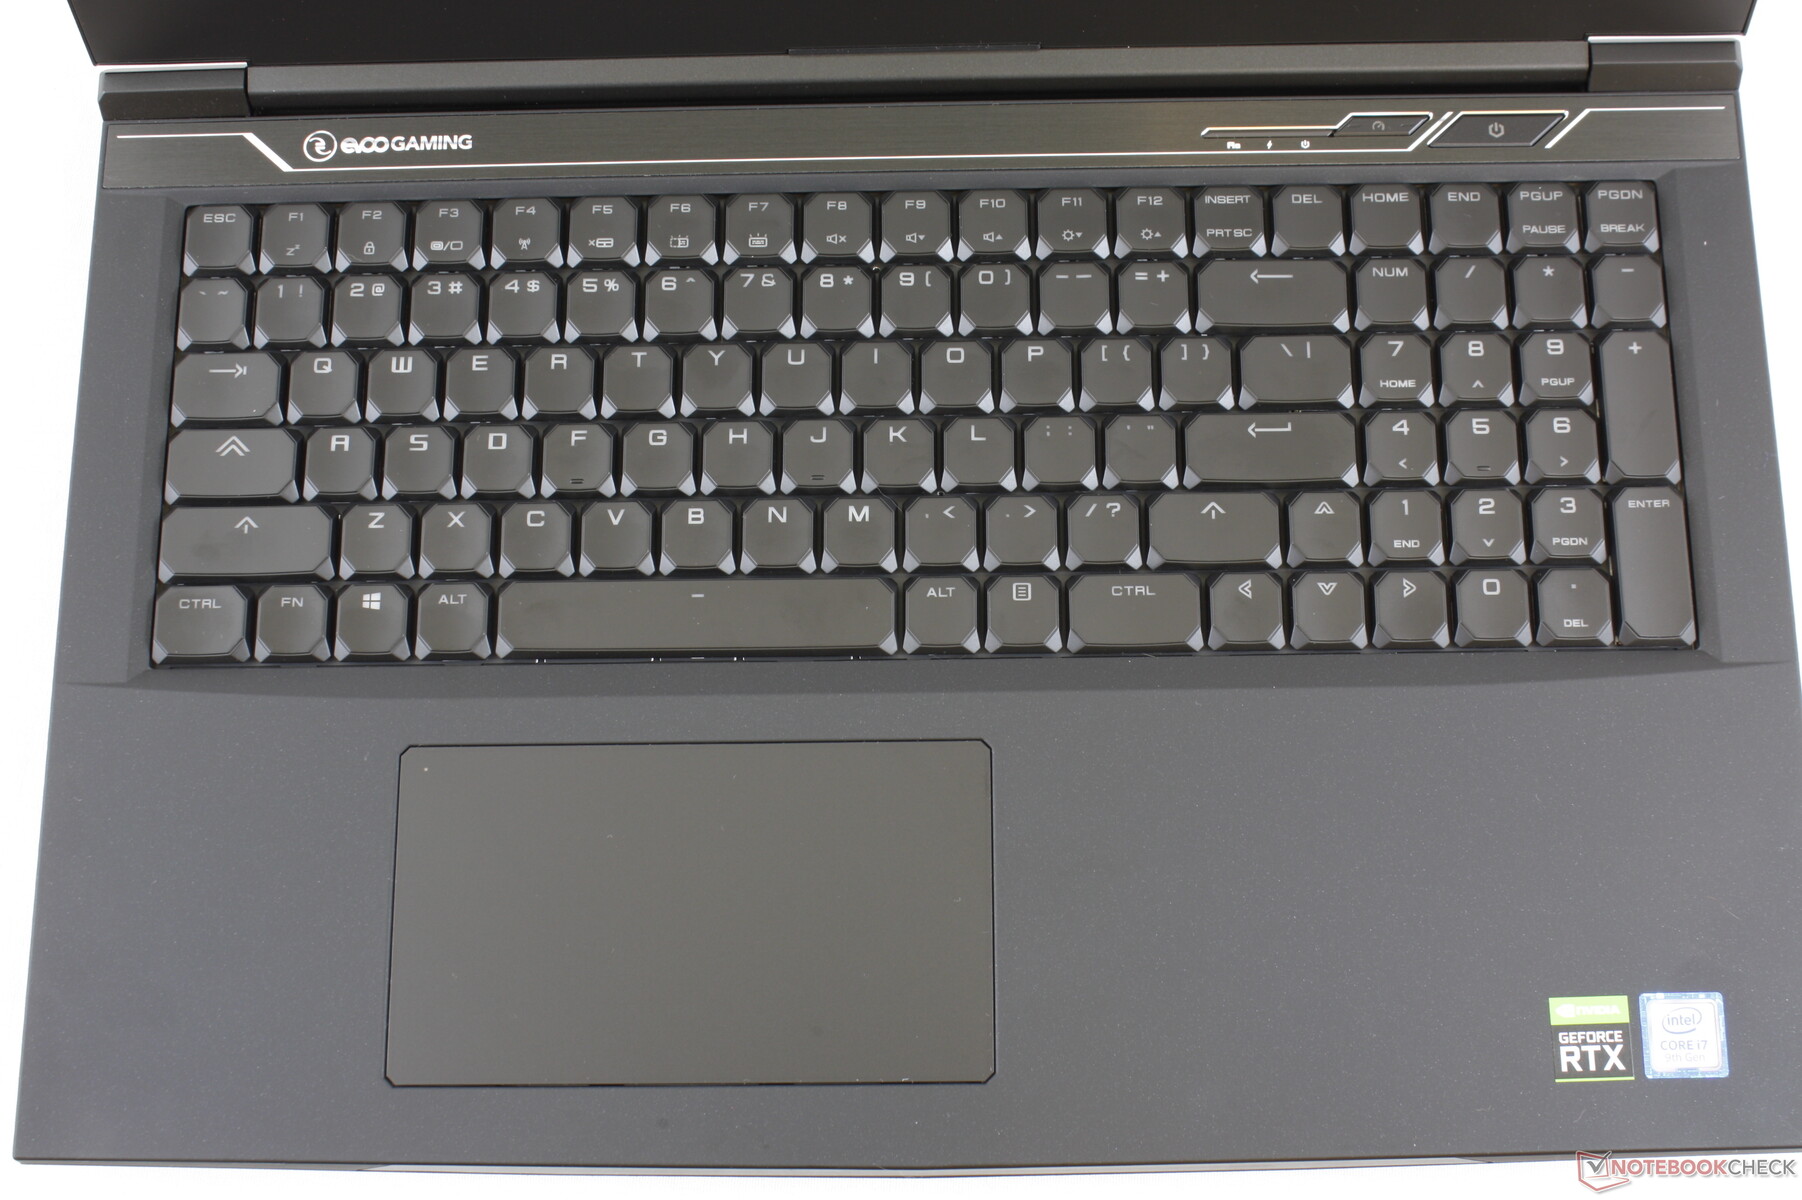
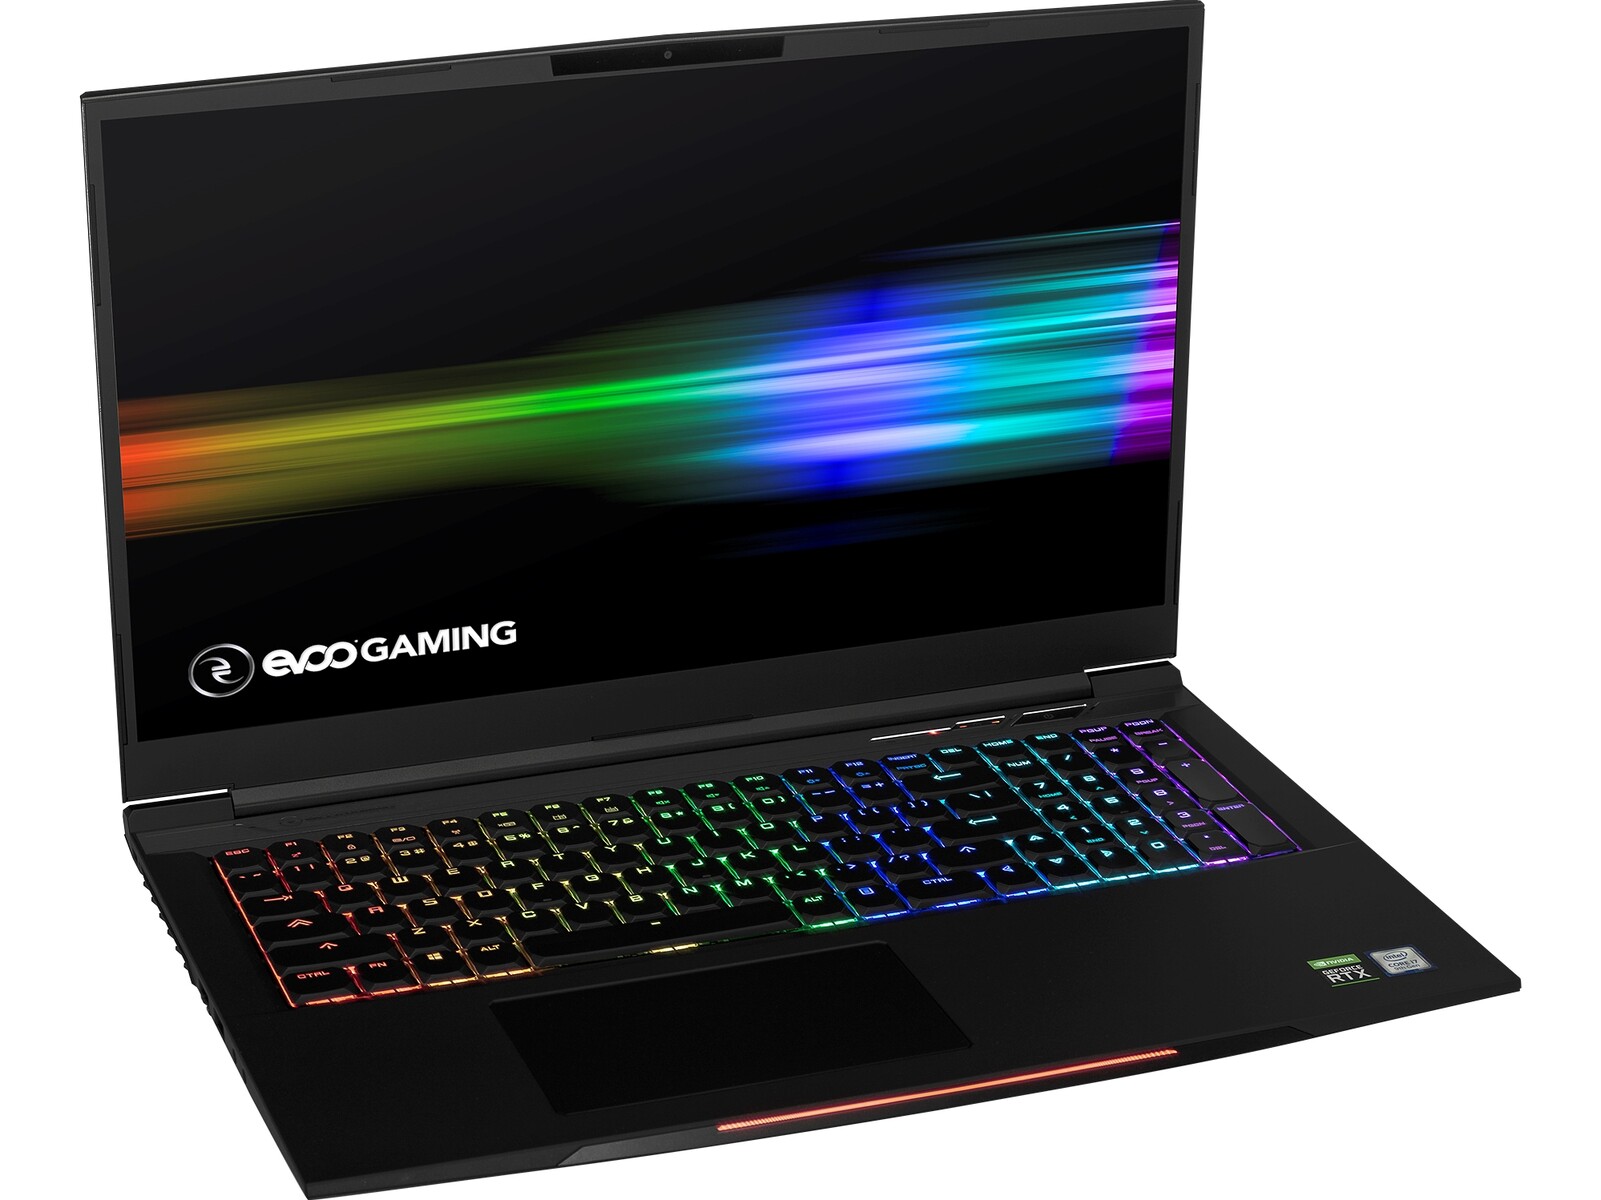
Since the mid-range EVOO Gaming 17 uses the exact same chassis as the Schenker XMG Neo 17, we recommend checking out our existing review to learn more about the physical features of the Walmart laptop.
More Walmart Tongfang reviews:
Rating | Date | Model | Weight | Height | Size | Resolution | Price |
|---|---|---|---|---|---|---|---|
| 84.5 % v7 (old) | 12 / 2019 | Walmart EVOO Gaming 17 i7-9750H, GeForce RTX 2060 Mobile | 2.5 kg | 27.5 mm | 17.30" | 1920x1080 | |
| 83.3 % v7 (old) | 03 / 2019 | Schenker XMG Neo 17 i7-8750H, GeForce RTX 2070 Mobile | 2.5 kg | 27.5 mm | 17.30" | 1920x1080 | |
| 87.4 % v6 (old) | 04 / 2019 | Alienware m17 P37E i9-8950HK, GeForce RTX 2080 Max-Q | 2.6 kg | 23 mm | 17.30" | 3840x2160 | |
| 83.2 % v7 (old) | 10 / 2019 | Lenovo Legion Y740-17IRH i7-9750H, GeForce RTX 2060 Mobile | 3 kg | 23 mm | 17.30" | 1920x1080 | |
| 89.4 % v6 (old) | 08 / 2019 | Razer Blade Pro 17 RTX 2060 i7-9750H, GeForce RTX 2060 Mobile | 2.8 kg | 19.9 mm | 17.30" | 1920x1080 |
Case
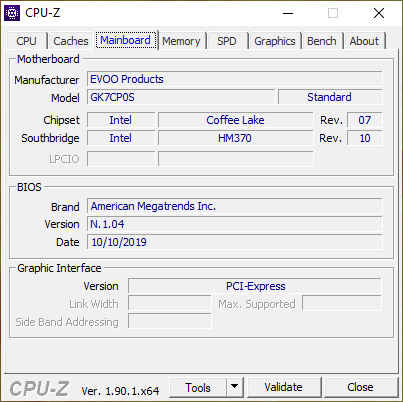
As mentioned above, the Walmart EVOO Gaming 17 shares the same chassis as the Schenker XMG Neo 17. How can two very different companies have the same laptop design? Unlike HP, Dell or Lenovo, Walmart and Schenker are resellers and so they do not design their own laptops. Instead, they purchase white label laptops to rebrand as their own. Walmart and Schenker have coincidentally sourced the same Chinese original design manufacturer (ODM) Tongfang for their EVOO and XMG Neo series, respectively. Thus, our existing comments on the Schenker XMG Neo 17 apply here on the Walmart EVOO Gaming 17.


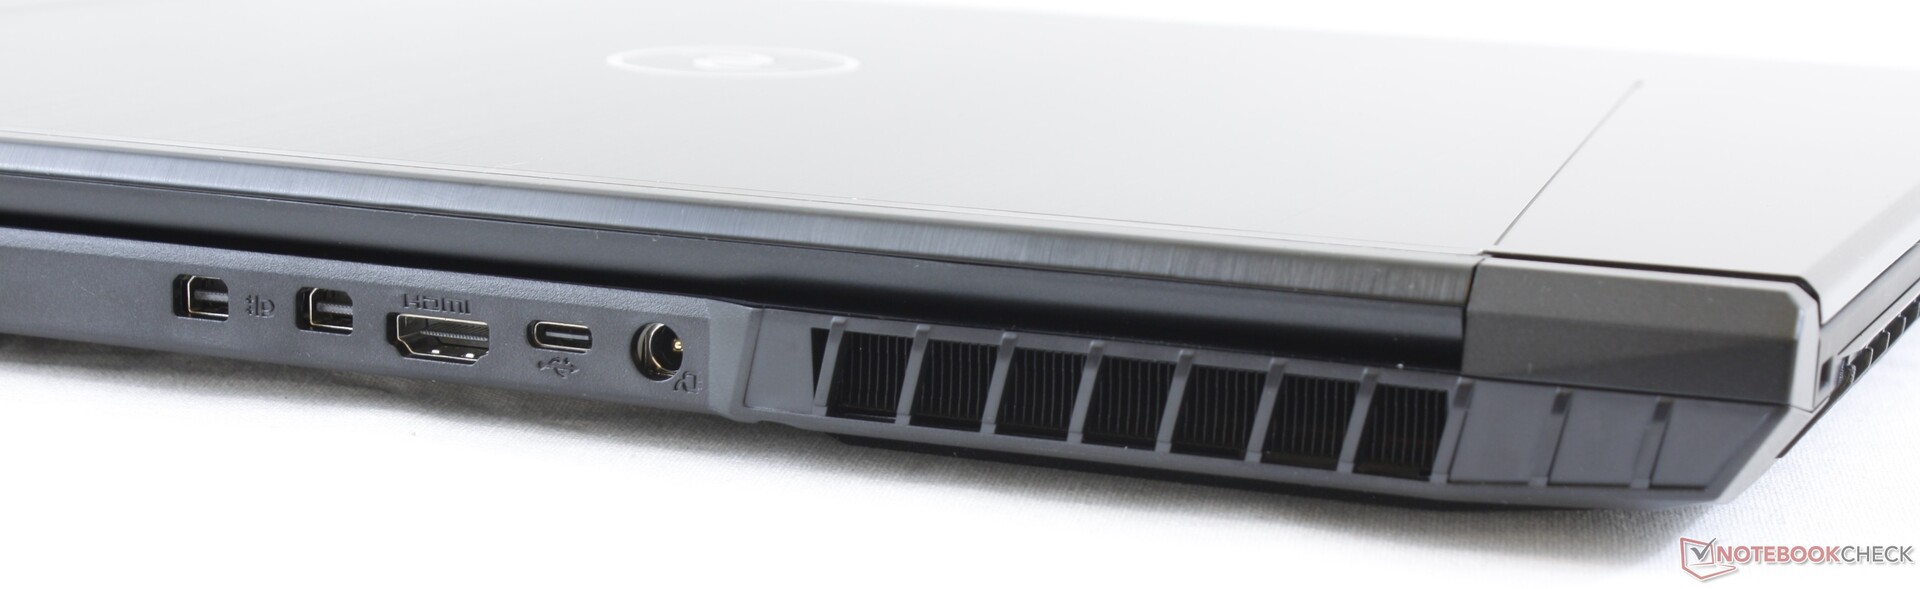
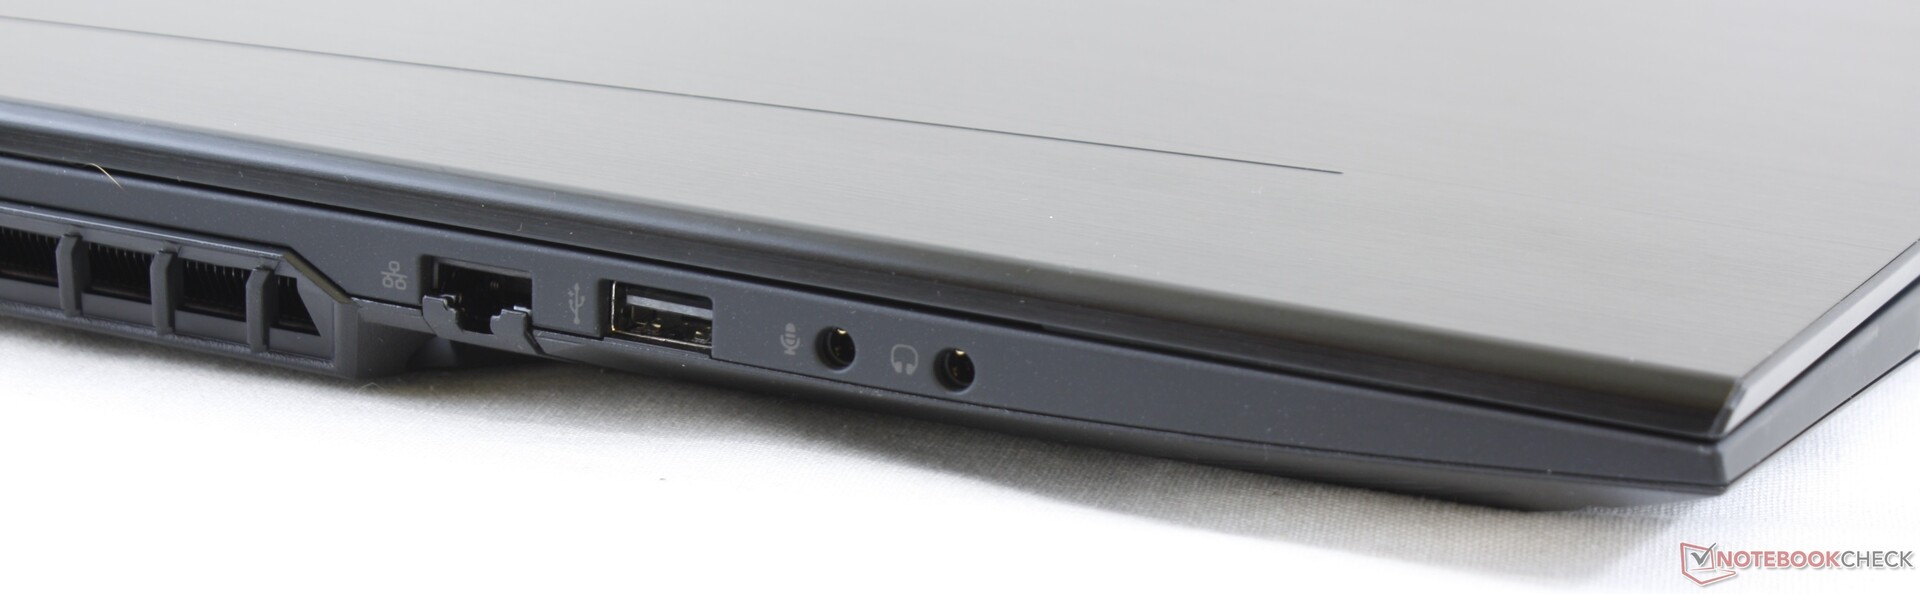
Connectivity
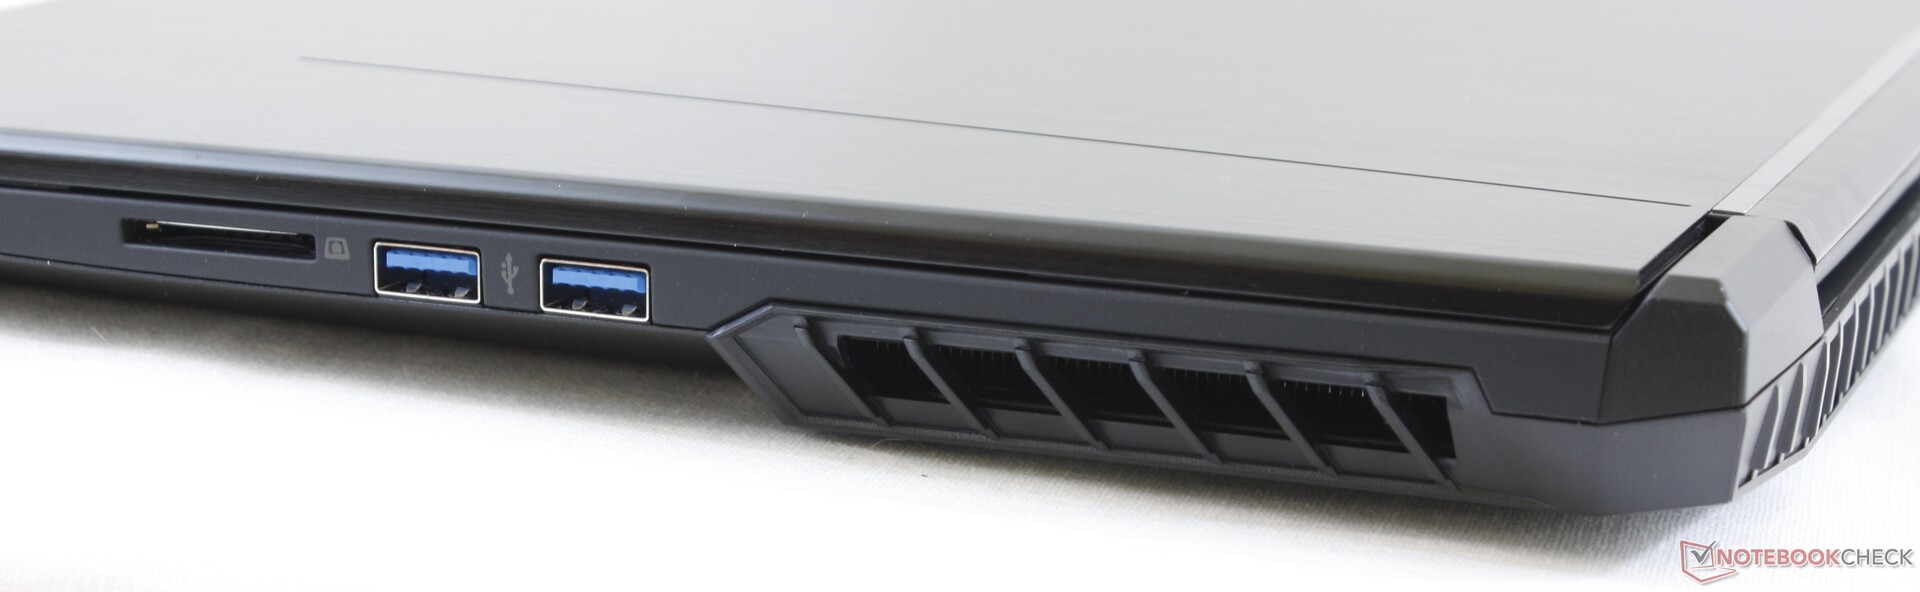
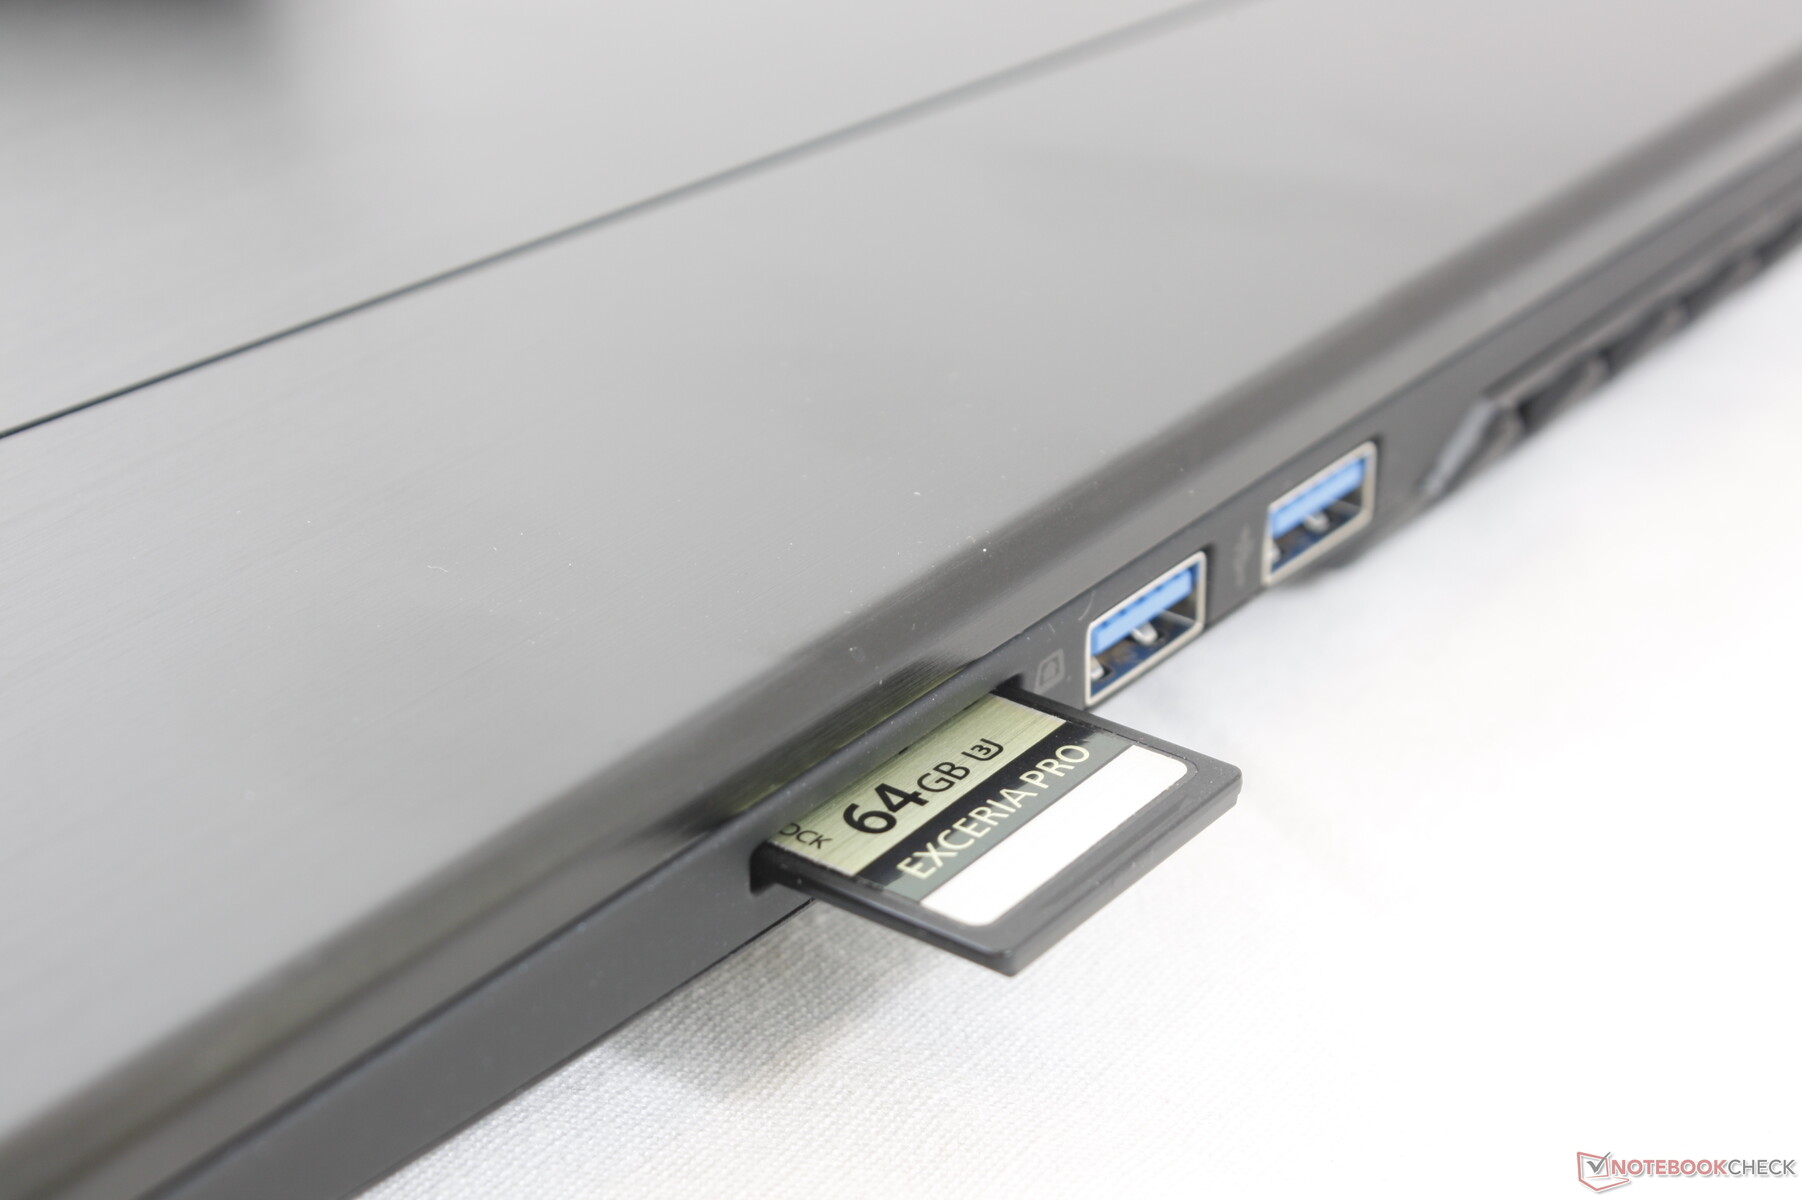
SD Card Reader
| SD Card Reader | |
| average JPG Copy Test (av. of 3 runs) | |
| Dell XPS 15 7590 9980HK GTX 1650 (Toshiba Exceria Pro SDXC 64 GB UHS-II) | |
| Samsung Notebook 9 NP930QAA (Toshiba Exceria Pro M501 microSDXC 64GB) | |
| Schenker XMG Neo 17 (Toshiba Exceria Pro SDXC 64 GB UHS-II) | |
| Walmart EVOO Gaming 17 (Toshiba Exceria Pro SDXC 64 GB UHS-II) | |
| MSI GL62M 7RD-077 (Toshiba Exceria Pro SDXC 64 GB UHS-II) | |
| maximum AS SSD Seq Read Test (1GB) | |
| Dell XPS 15 7590 9980HK GTX 1650 (Toshiba Exceria Pro SDXC 64 GB UHS-II) | |
| Samsung Notebook 9 NP930QAA (Toshiba Exceria Pro M501 microSDXC 64GB) | |
| Schenker XMG Neo 17 (Toshiba Exceria Pro SDXC 64 GB UHS-II) | |
| Walmart EVOO Gaming 17 (Toshiba Exceria Pro SDXC 64 GB UHS-II) | |
| MSI GL62M 7RD-077 (Toshiba Exceria Pro SDXC 64 GB UHS-II) | |
Communication
| Networking | |
| iperf3 transmit AX12 | |
| Lenovo Legion Y740-17IRH | |
| Schenker XMG Neo 17 | |
| Alienware m17 P37E | |
| Razer Blade Pro 17 RTX 2060 | |
| iperf3 receive AX12 | |
| Razer Blade Pro 17 RTX 2060 | |
| Lenovo Legion Y740-17IRH | |
| Alienware m17 P37E | |
| Schenker XMG Neo 17 | |
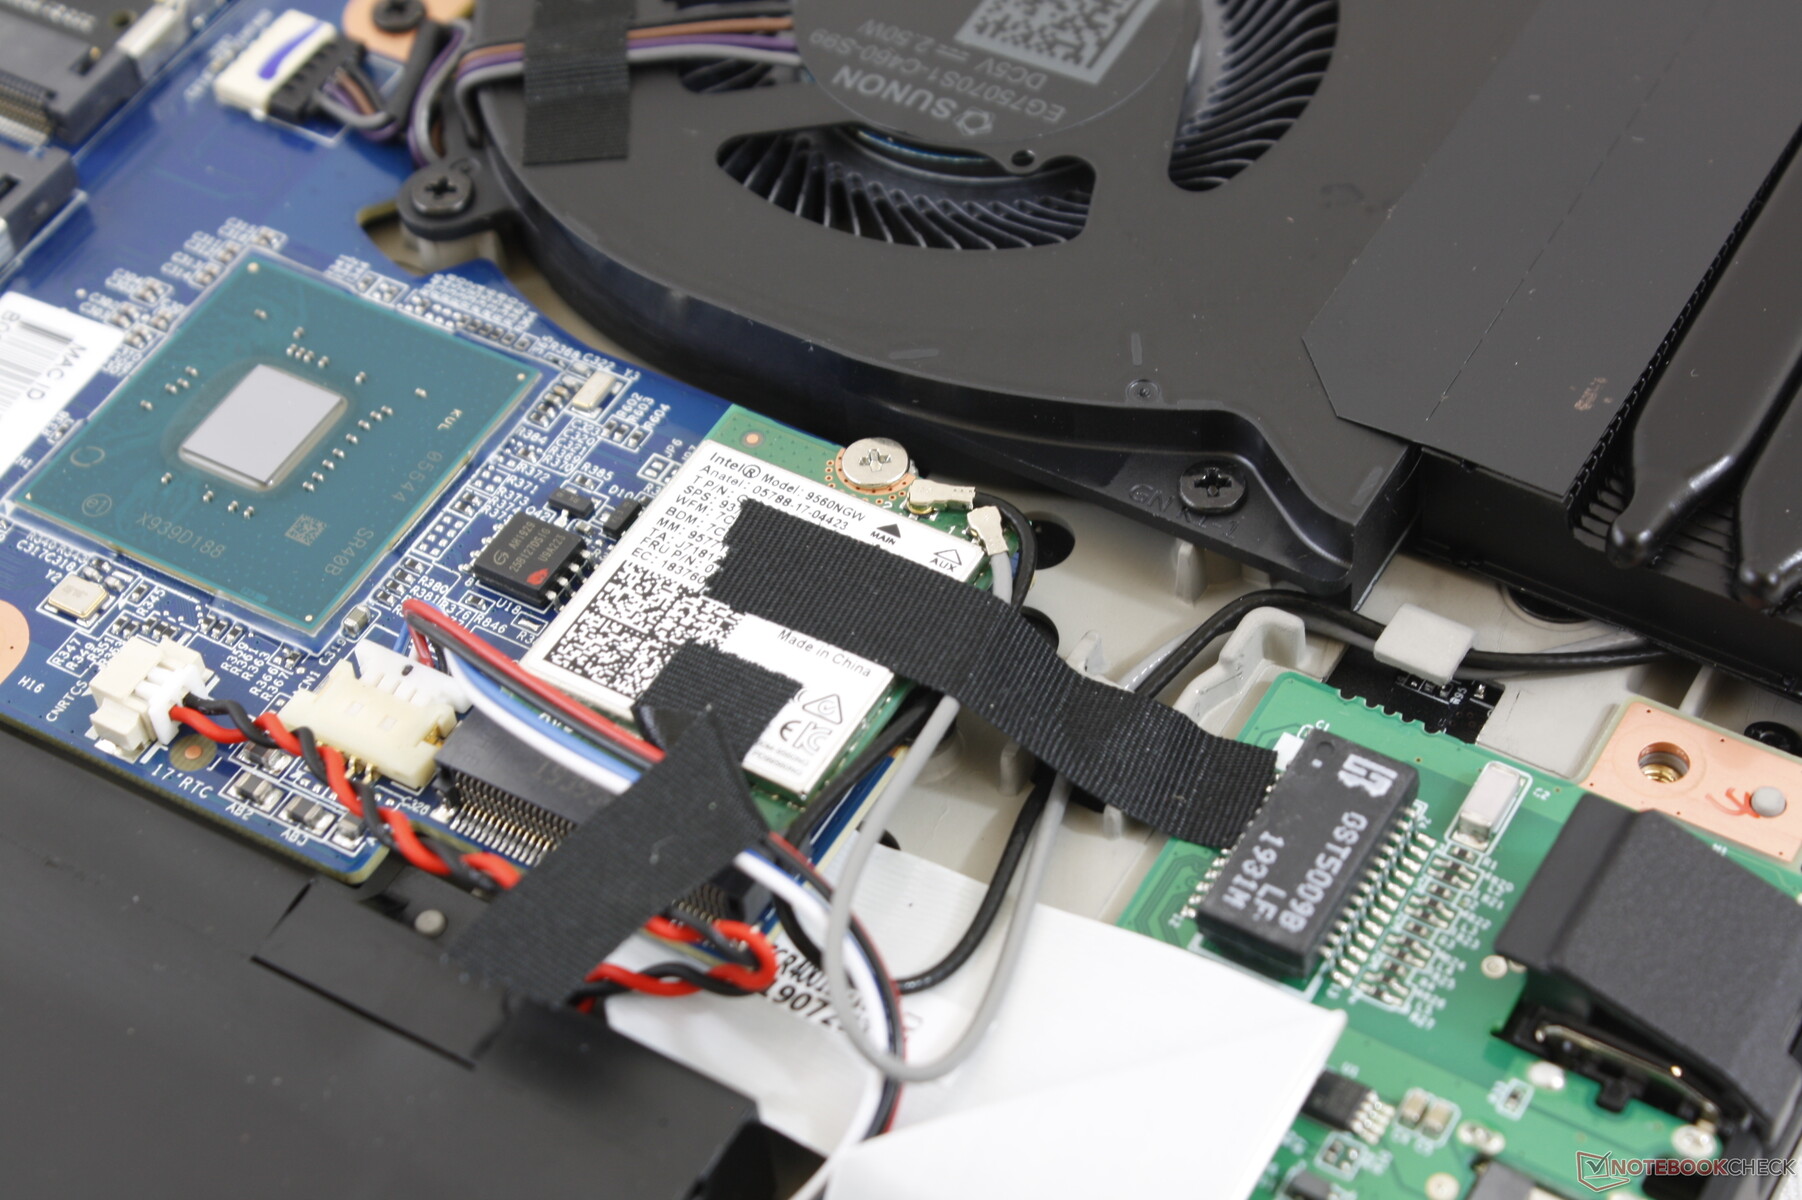
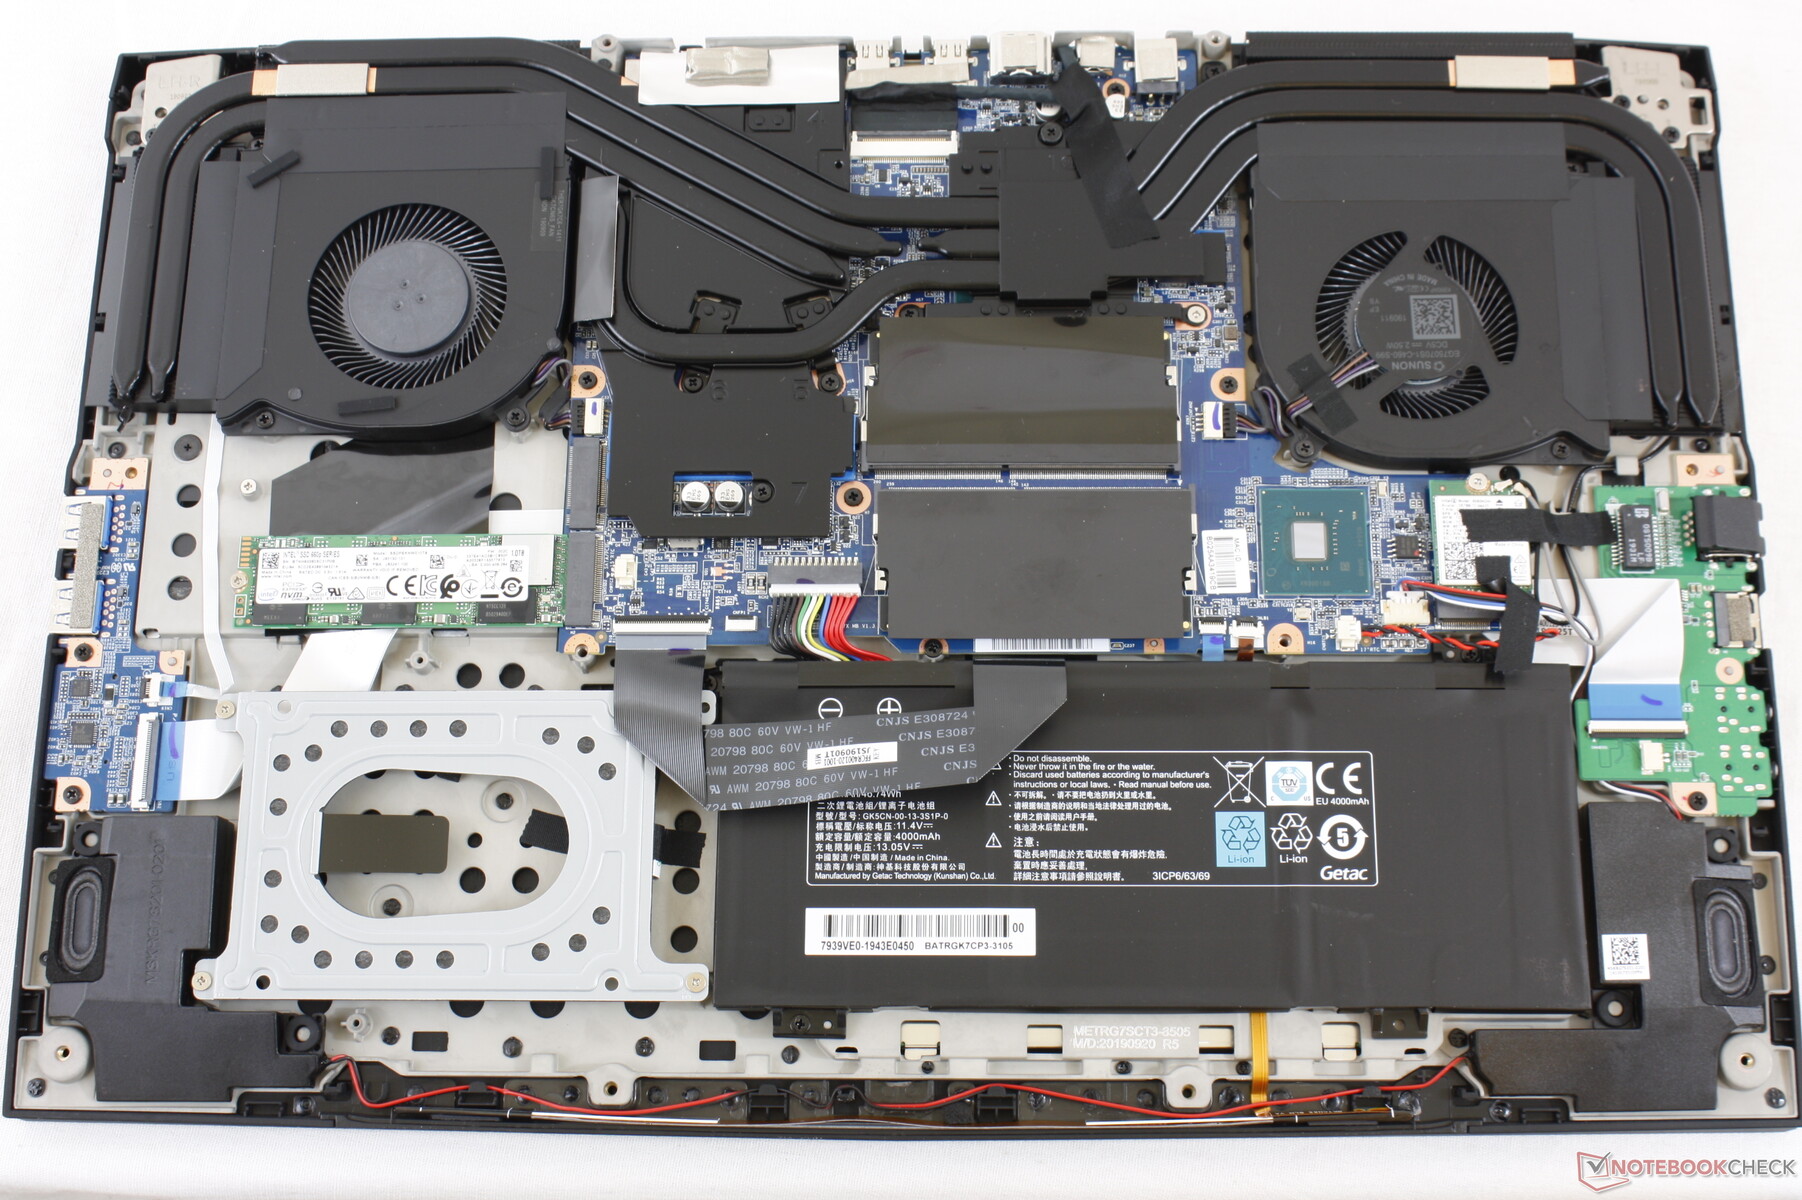
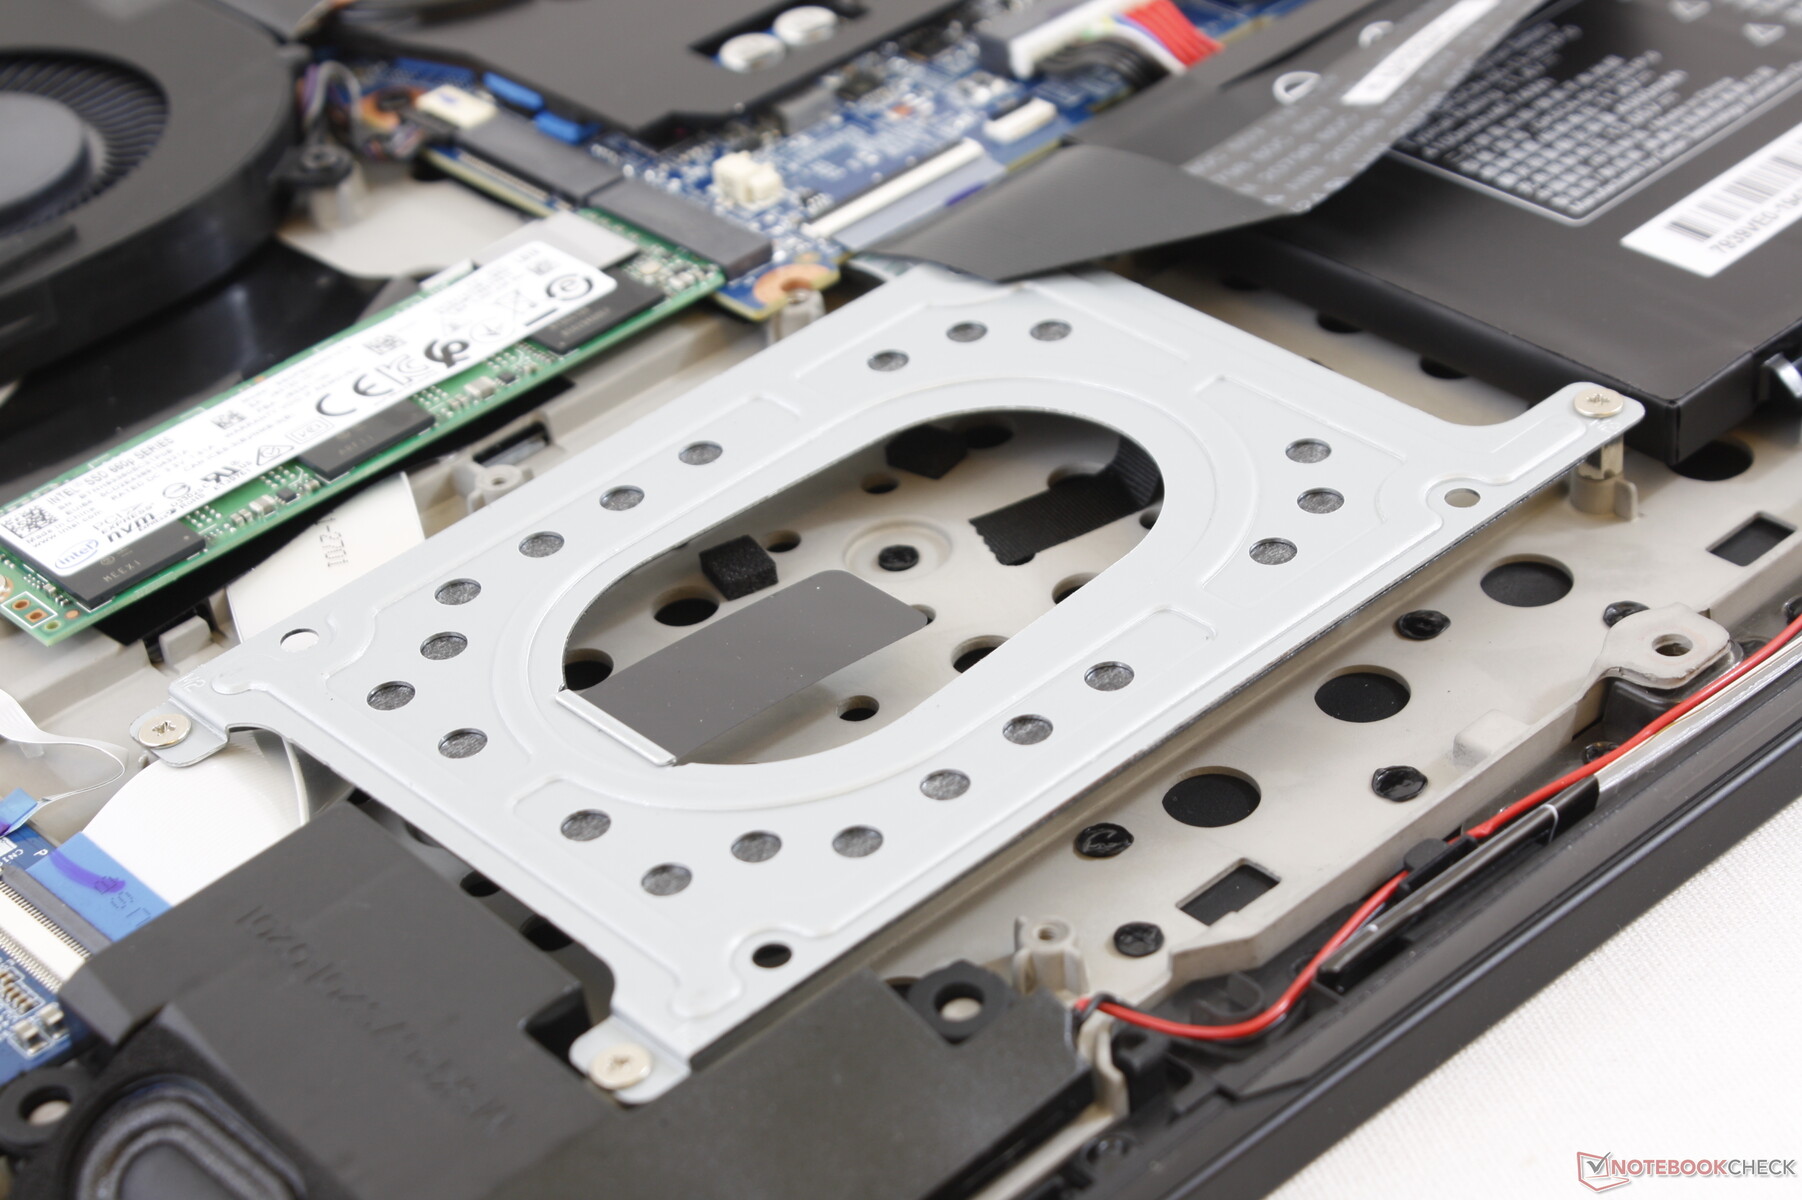
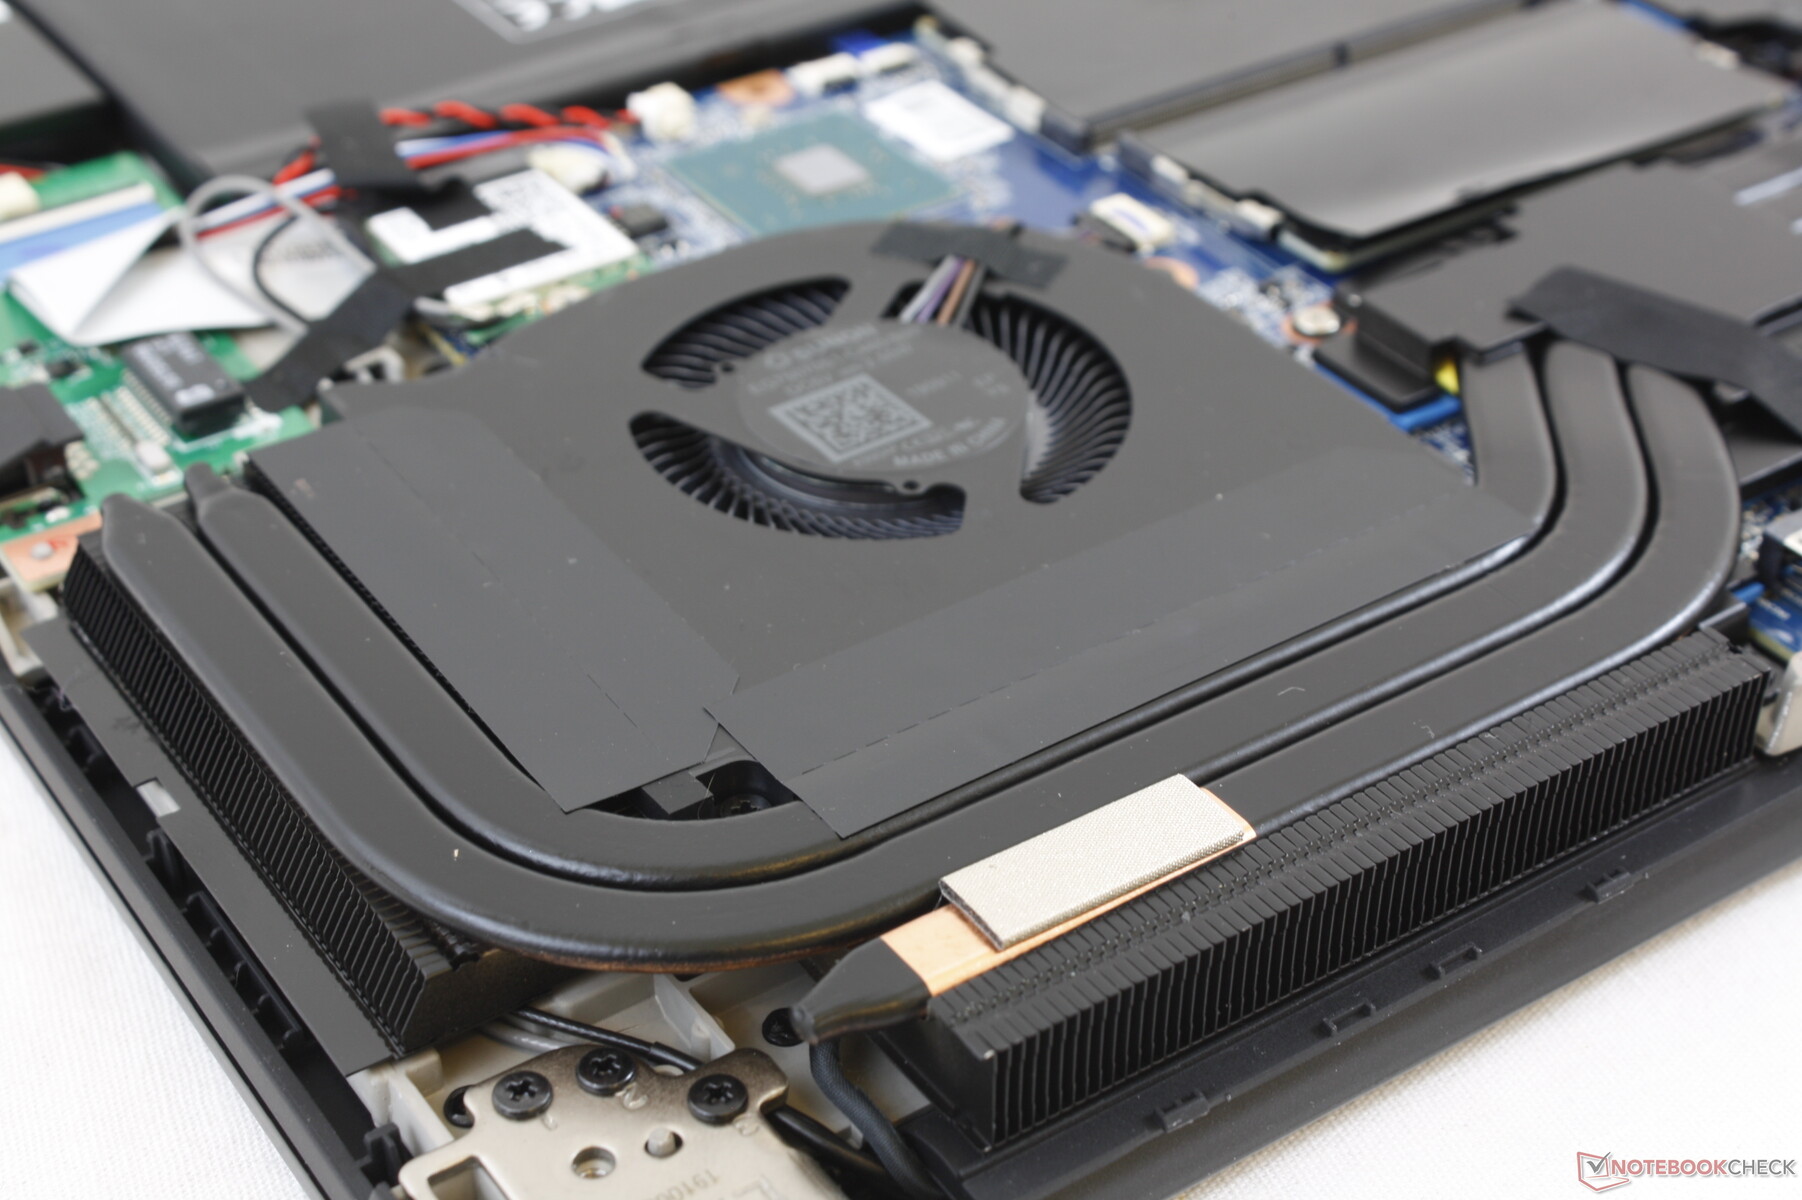
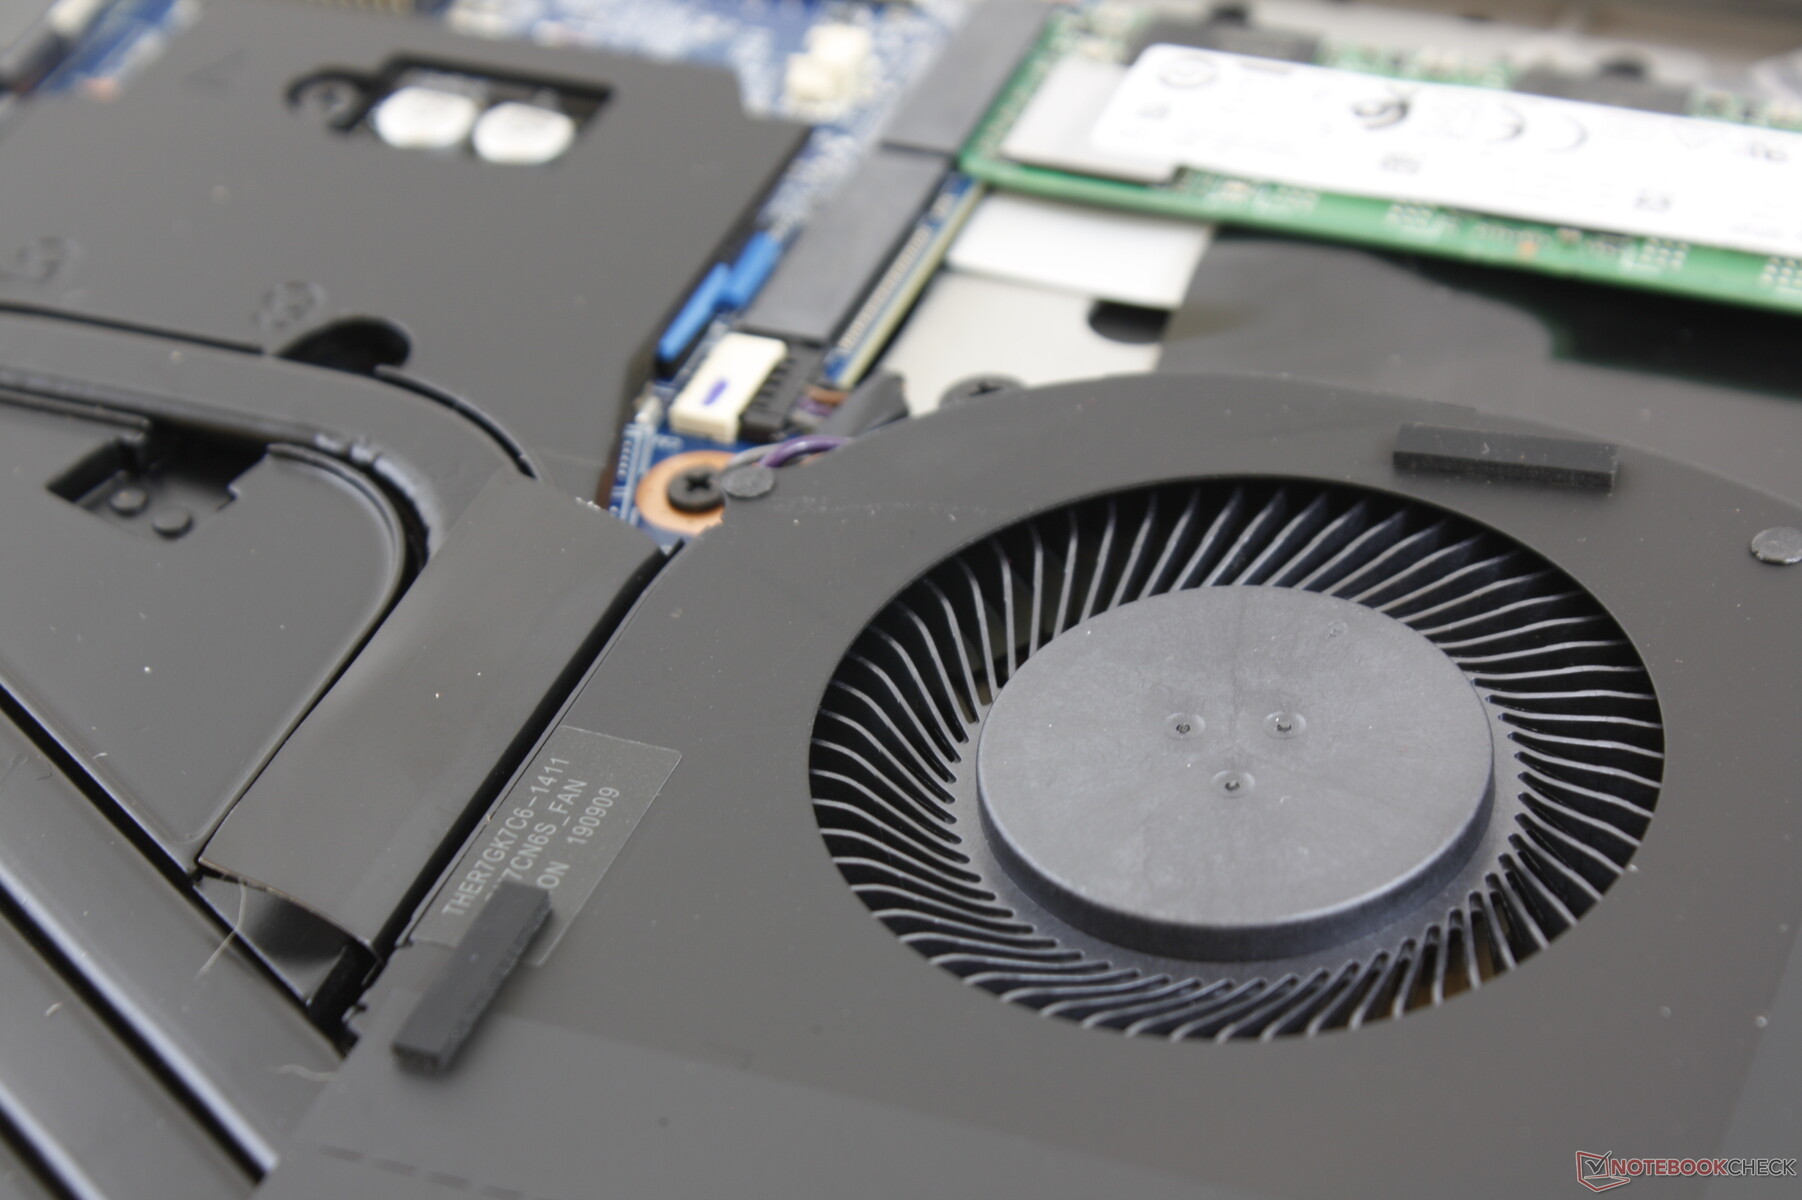
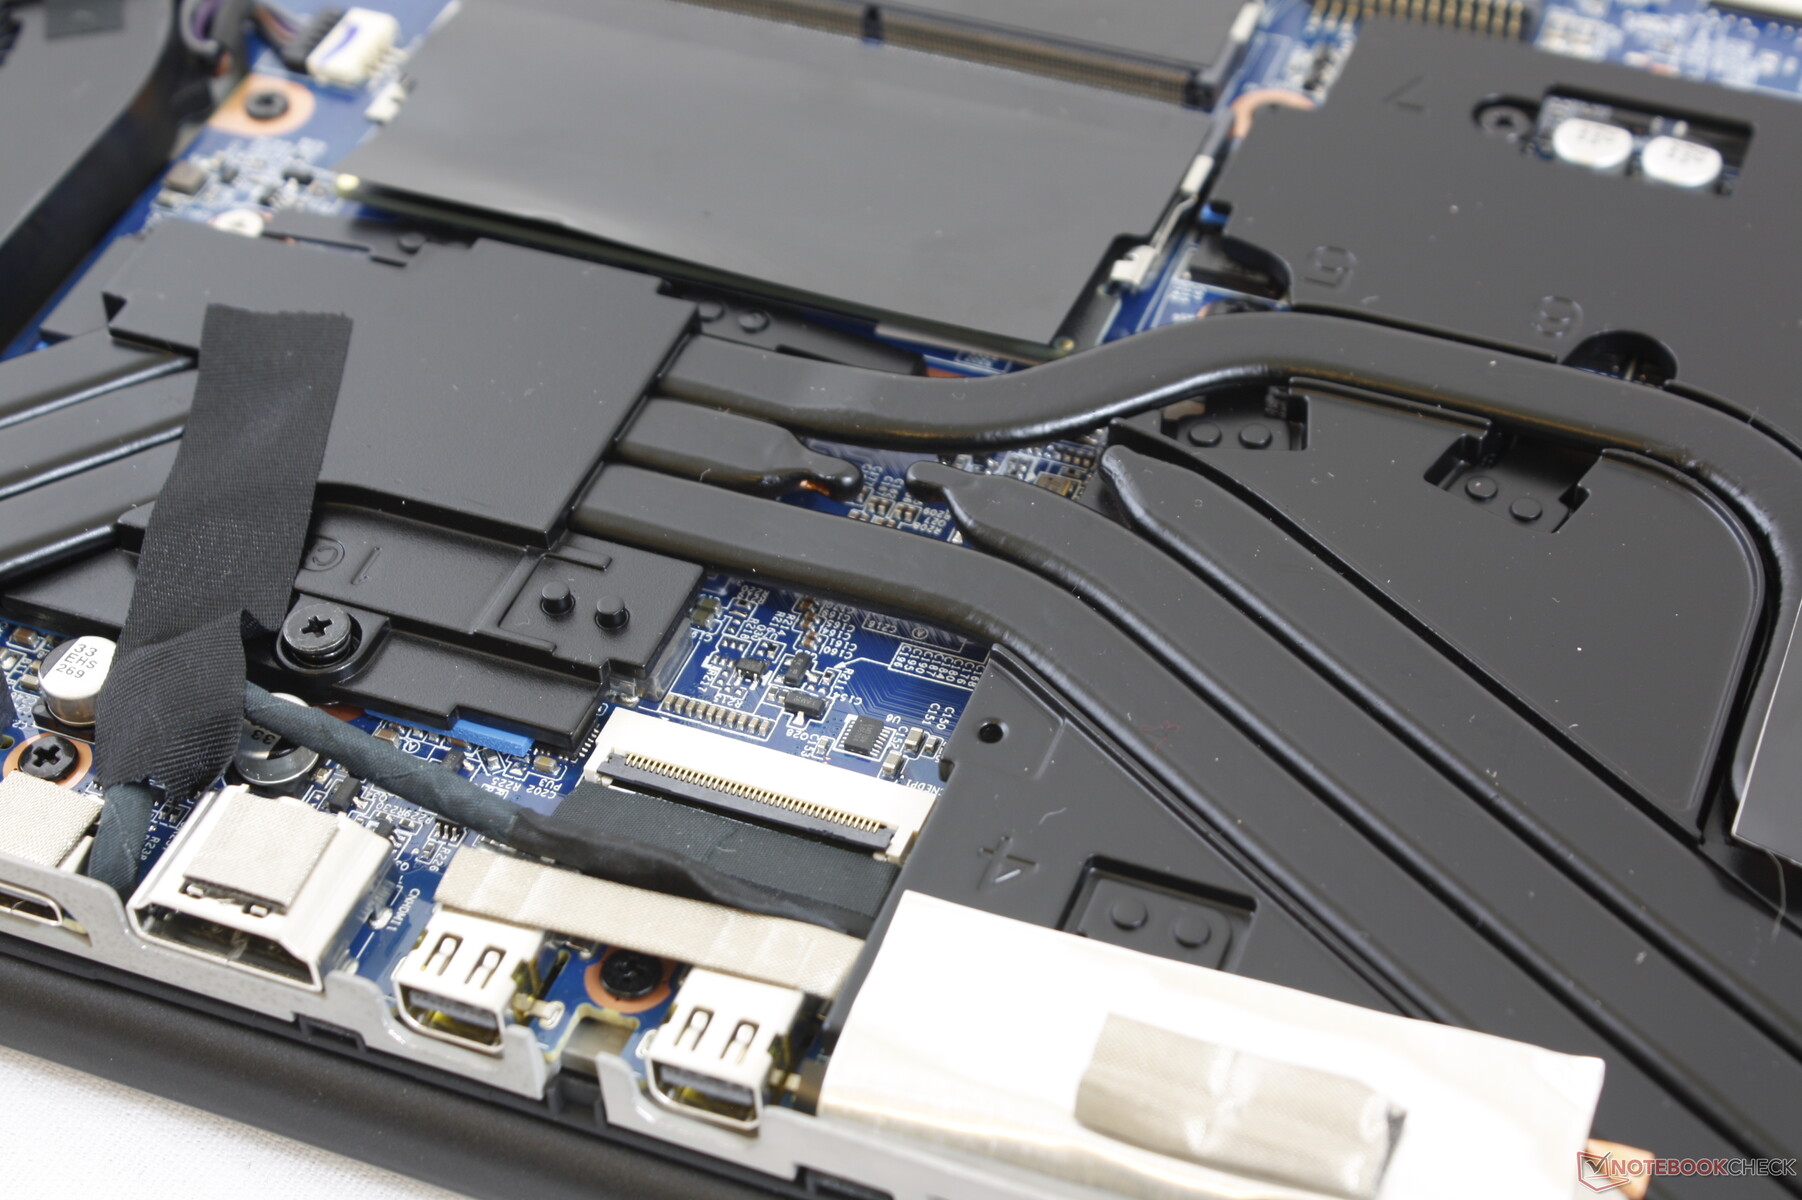
Maintenance
Accessories and Warranty
There are no included extras in the box other than the AC adapter. The standard one-year limited warranty applies.
Input Devices

Display
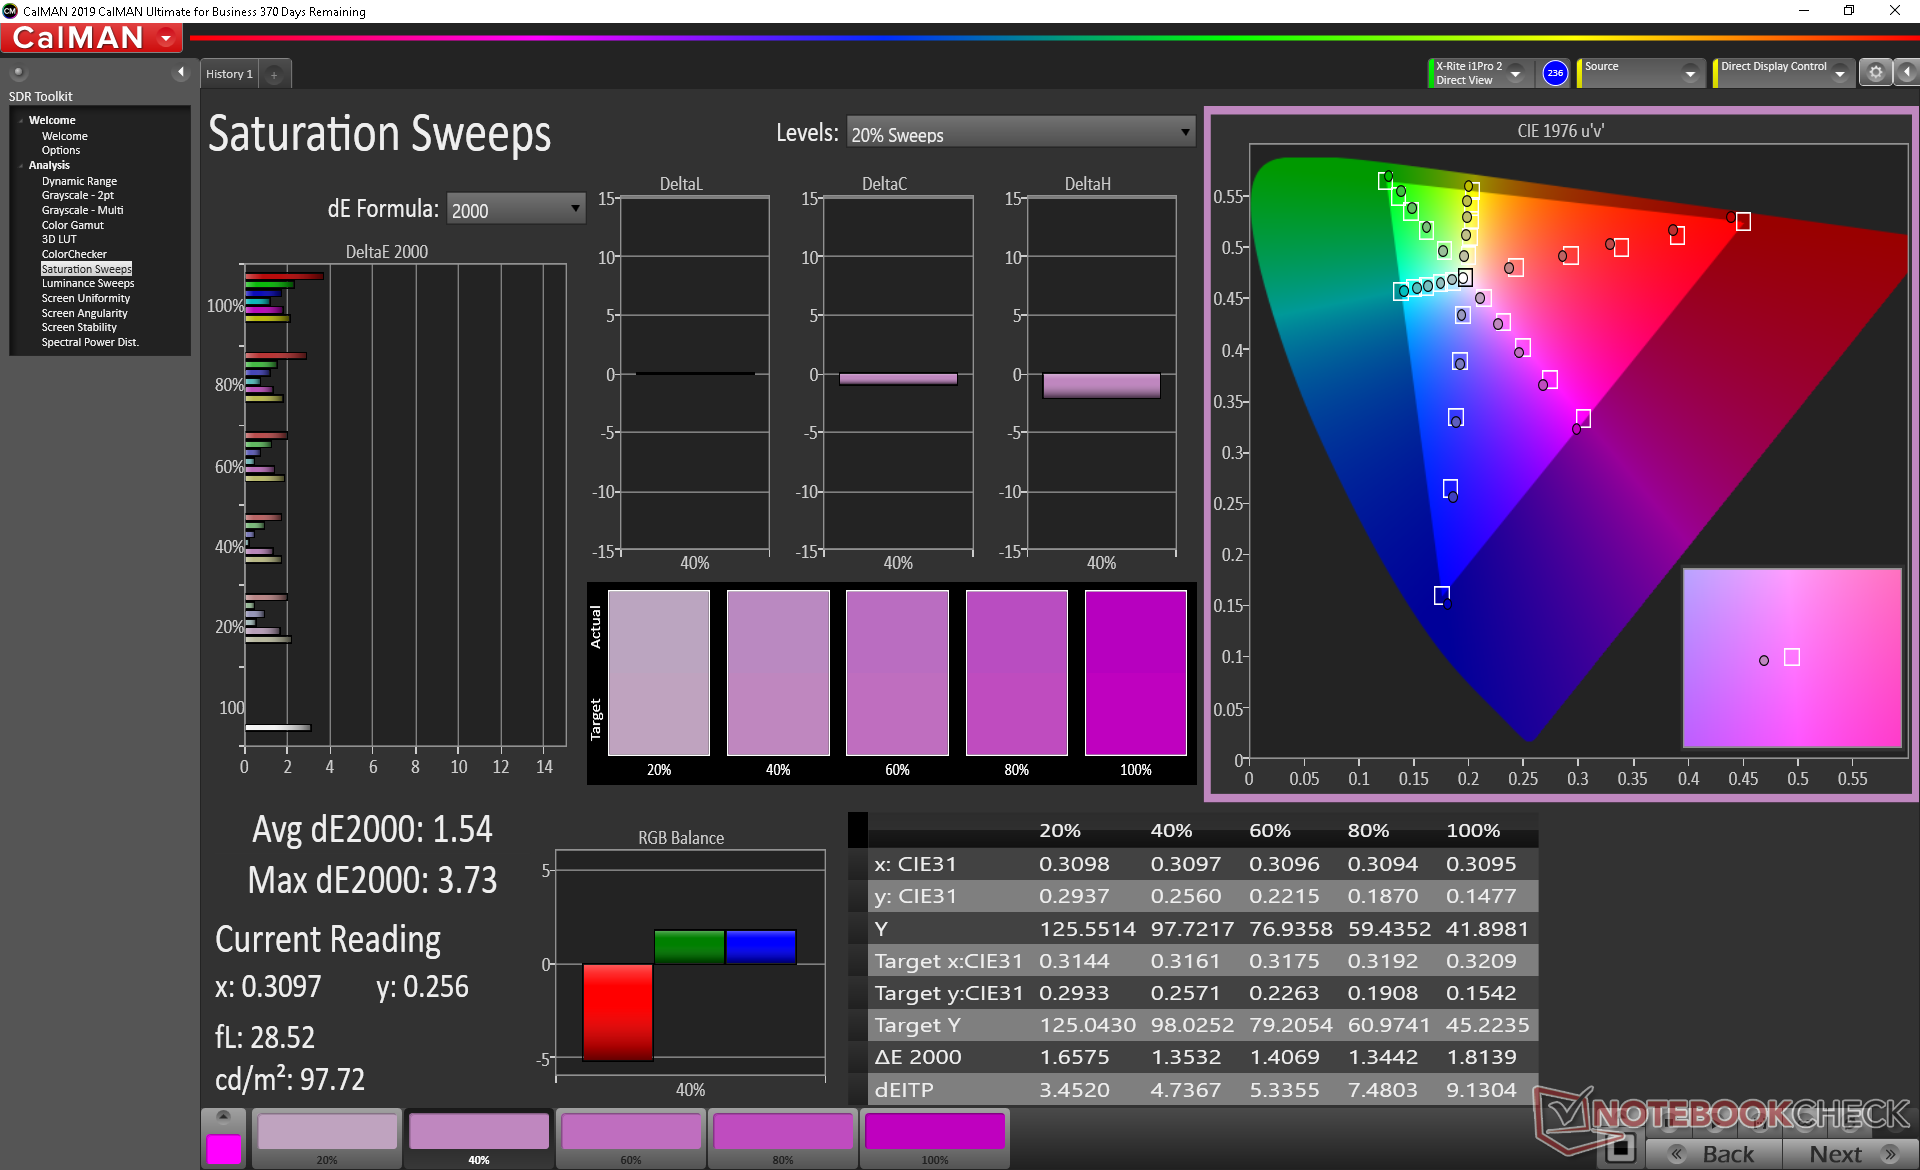
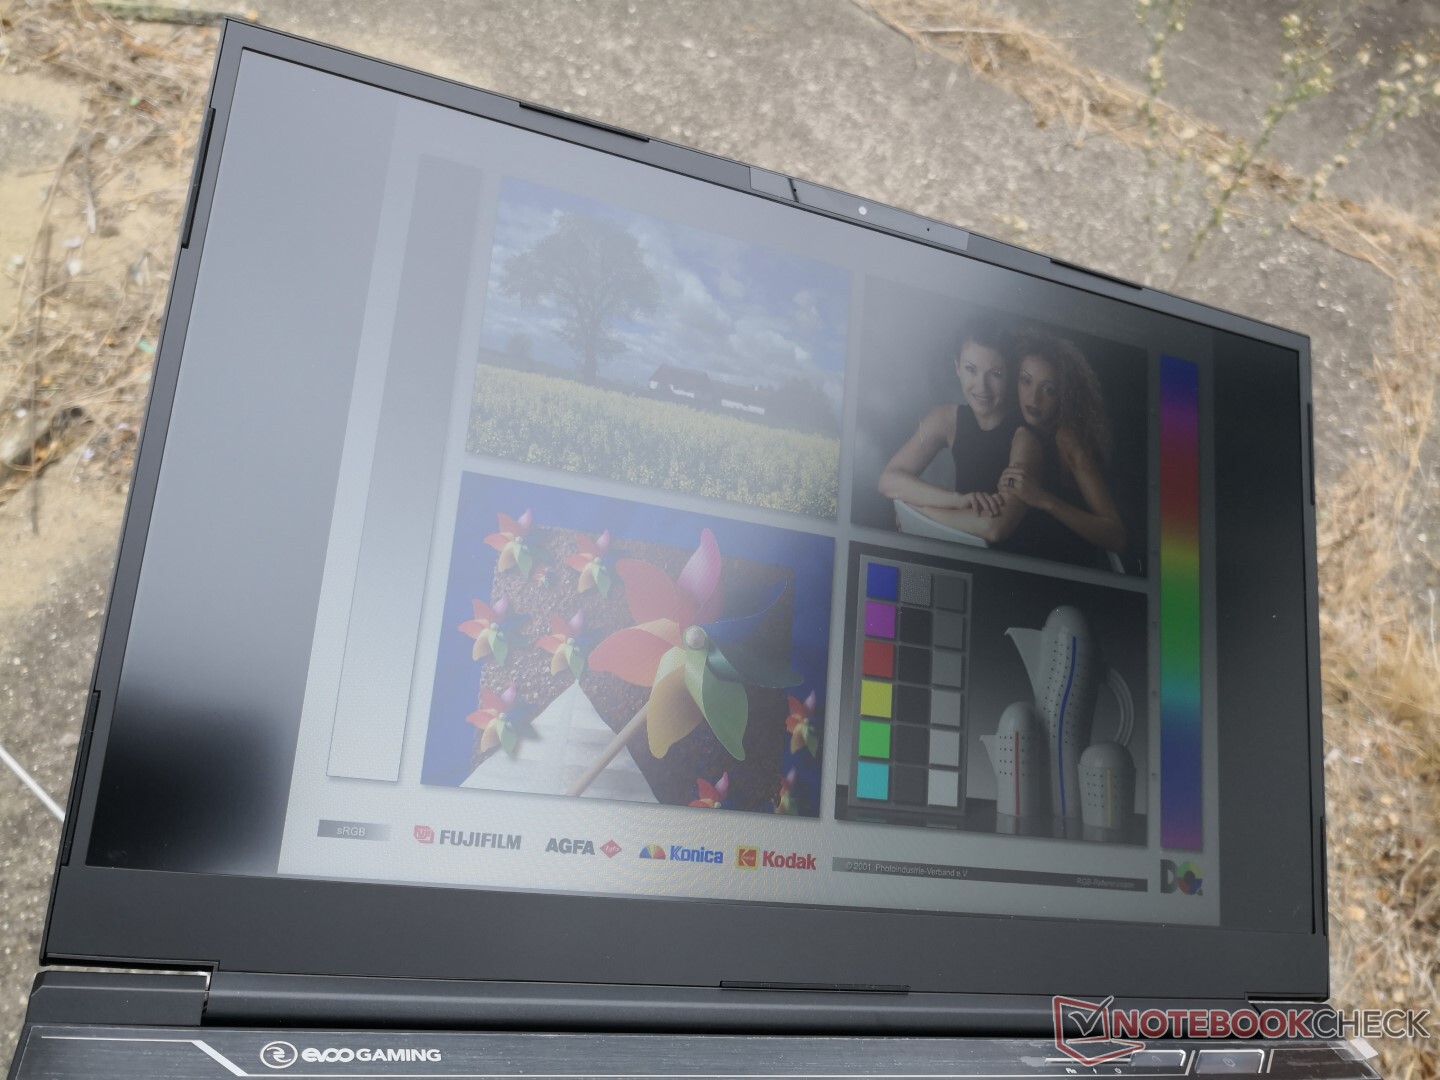
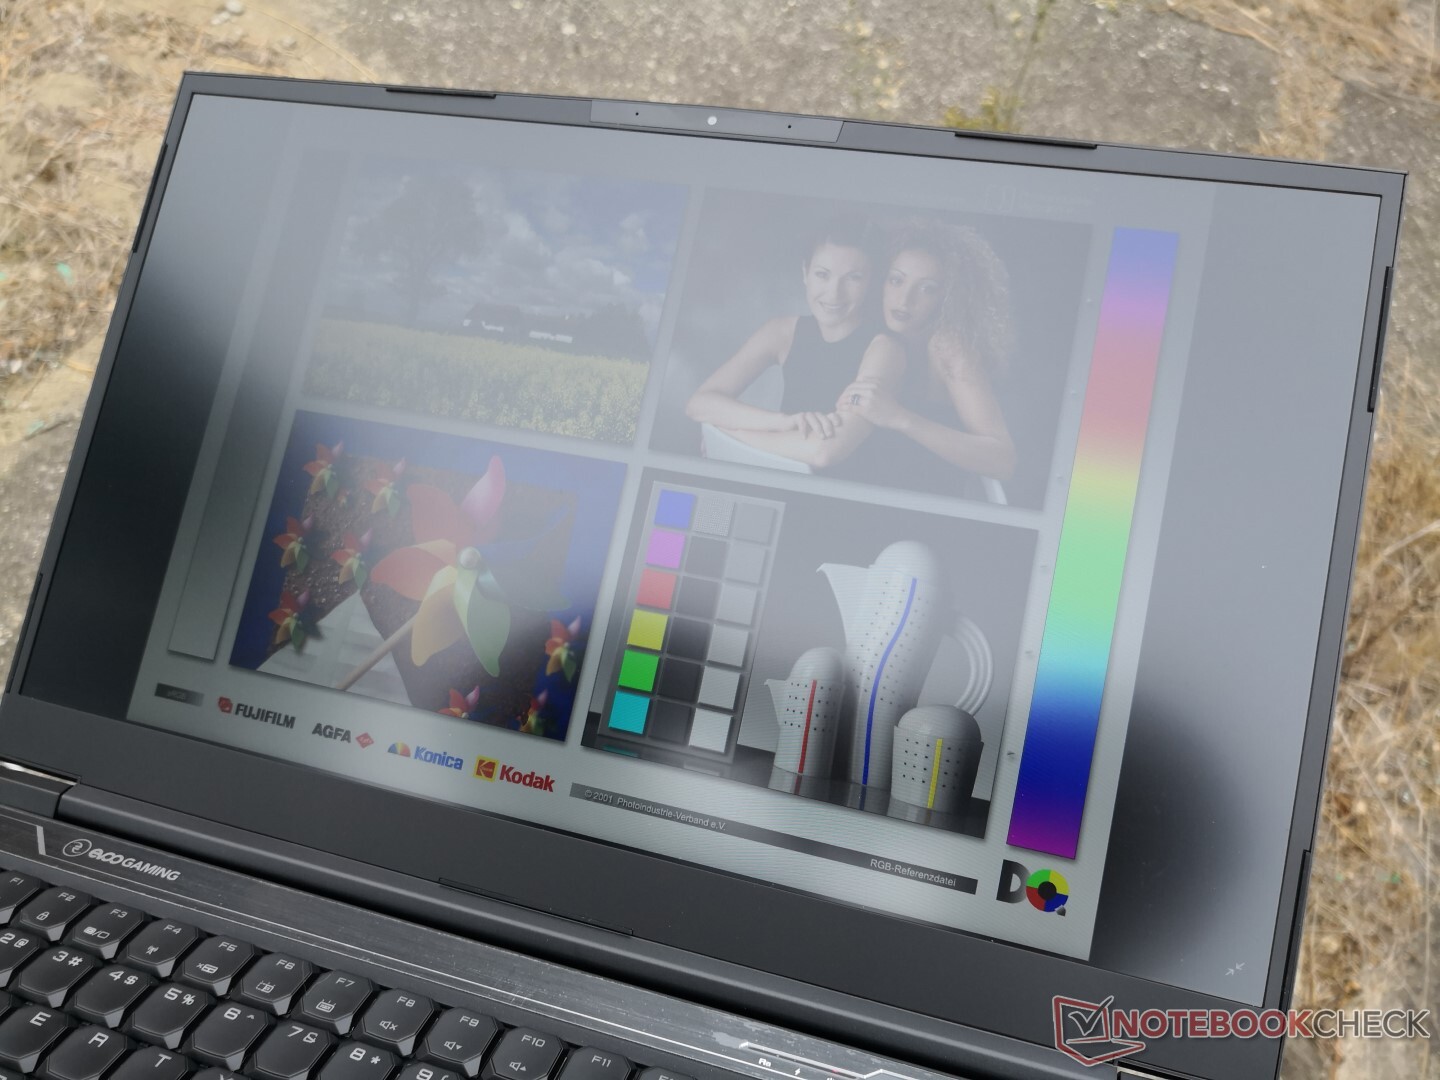
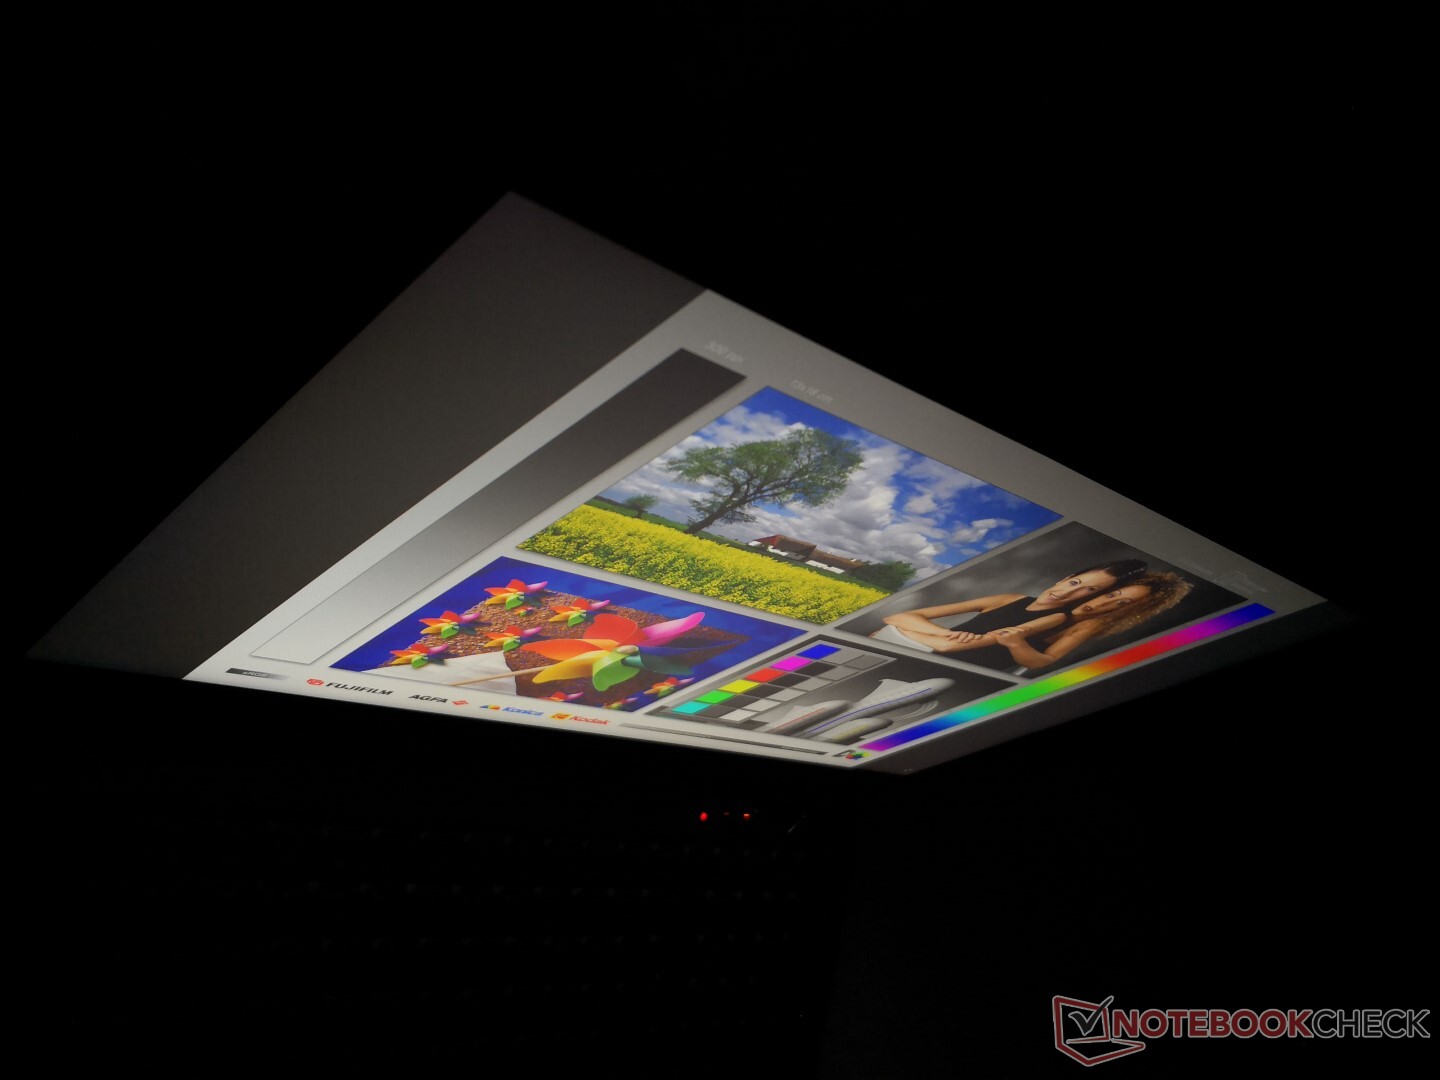
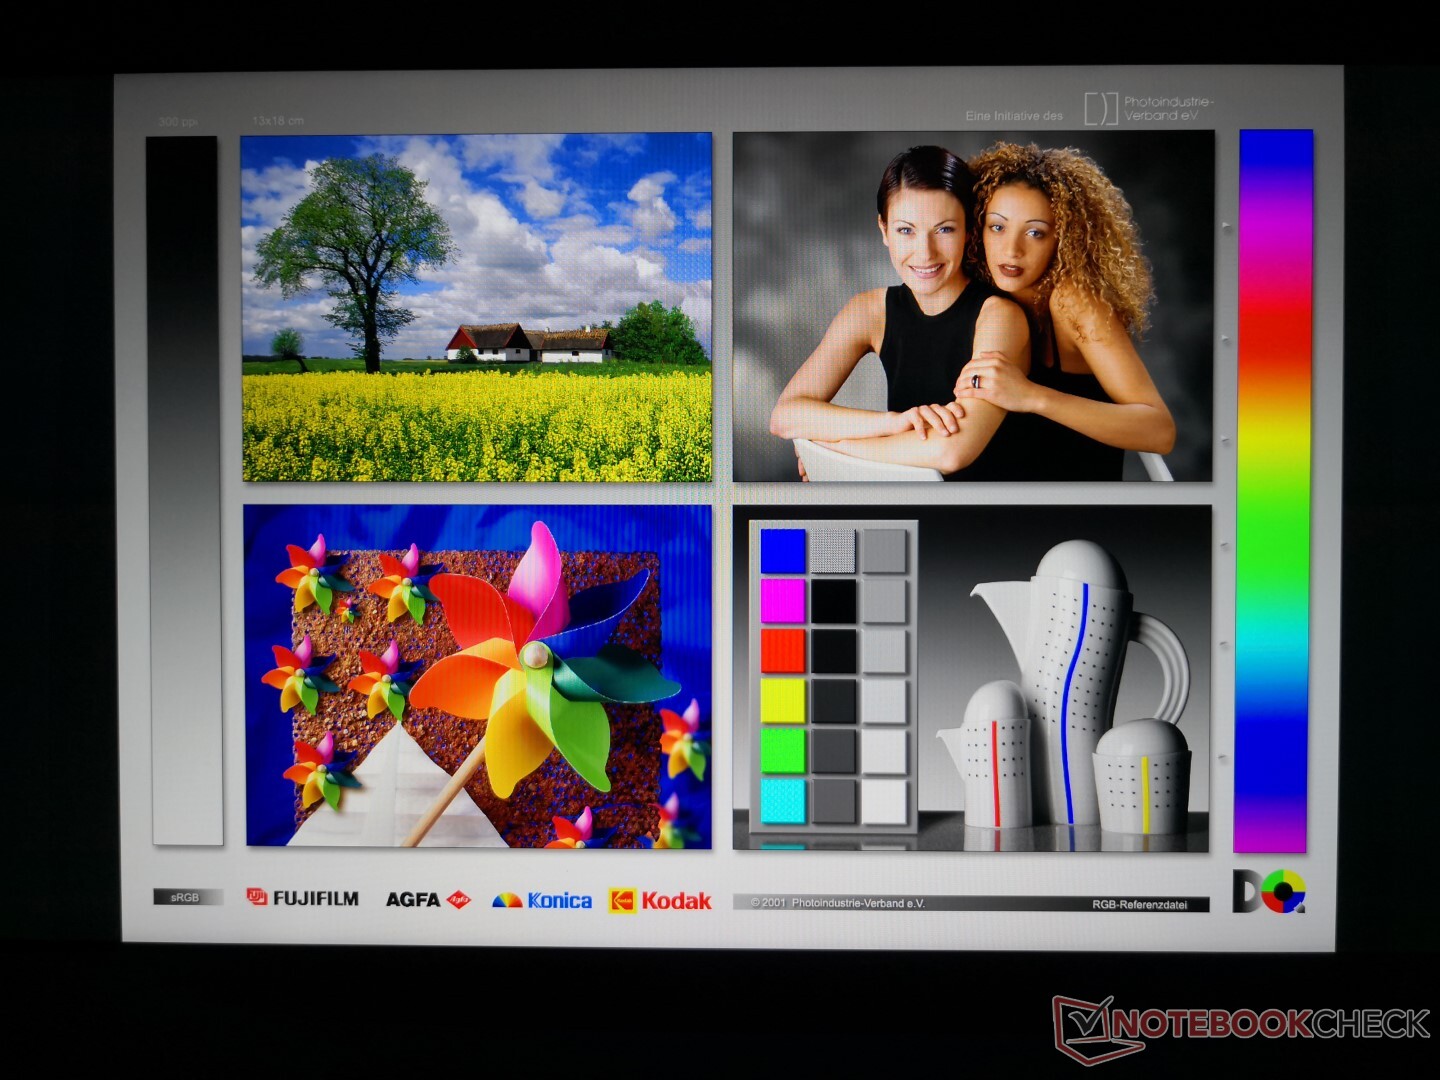
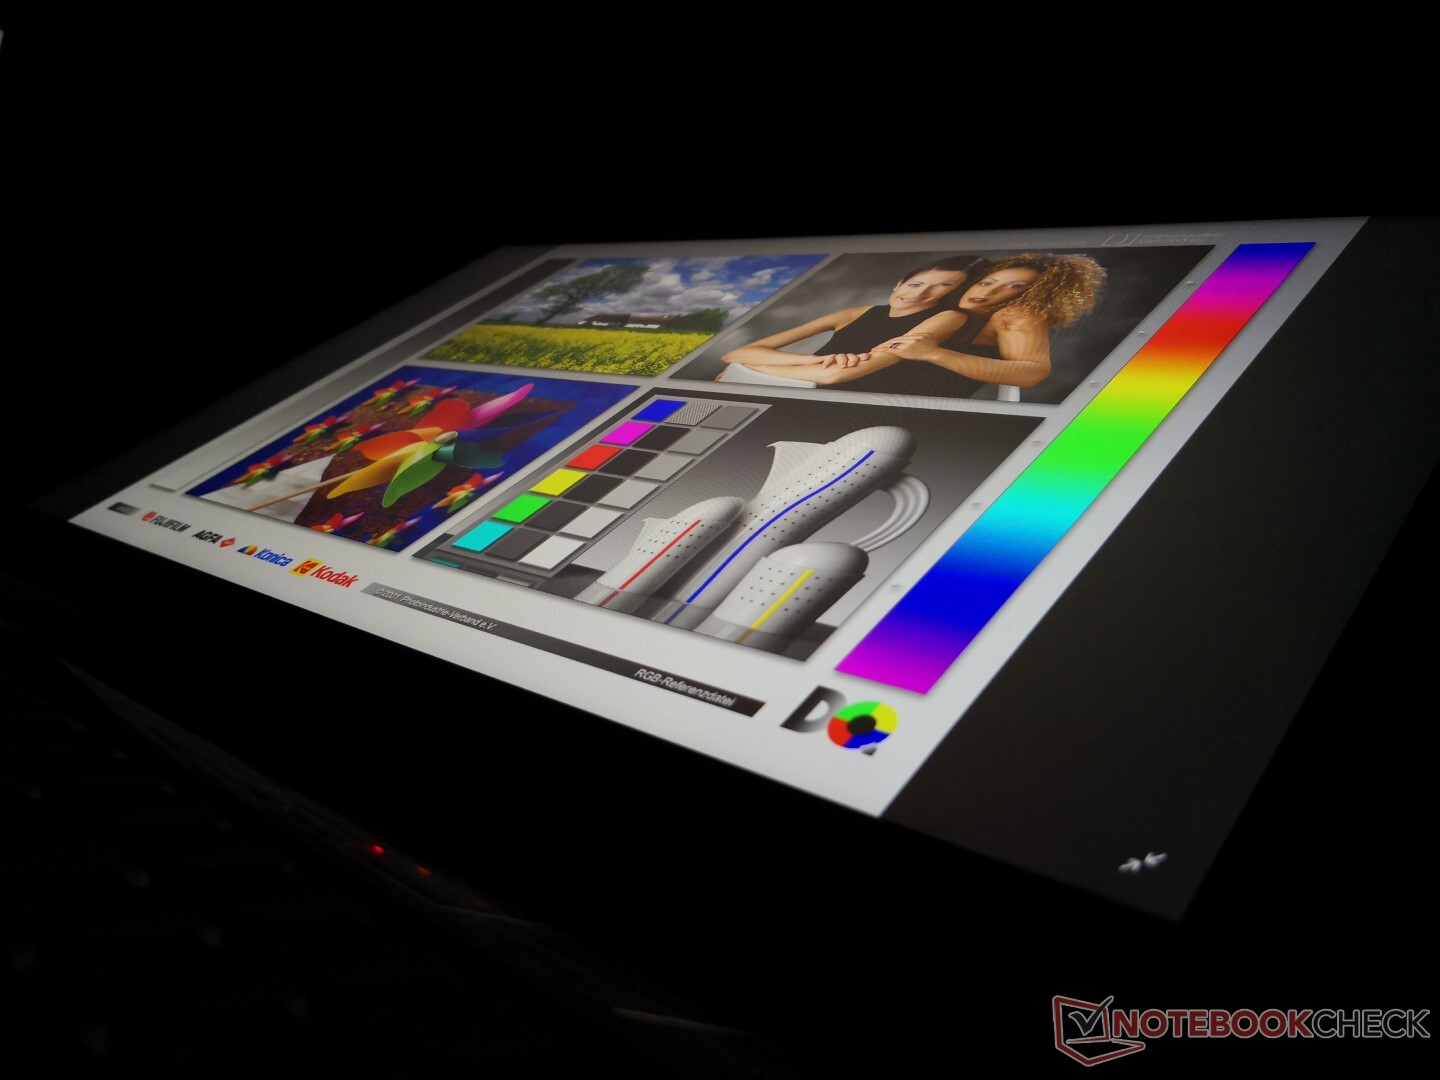
The best characteristics of the display are the fast 144 Hz native refresh rate, fast response times, relatively calibrated colors, minimal graininess, and narrow bezels. It's a high quality panel with the exception of the moderate uneven backlight bleeding on our test unit.


| |||||||||||||||||||||||||
Brightness Distribution: 92 %
Center on Battery: 314.2 cd/m²
Contrast: 1208:1 (Black: 0.26 cd/m²)
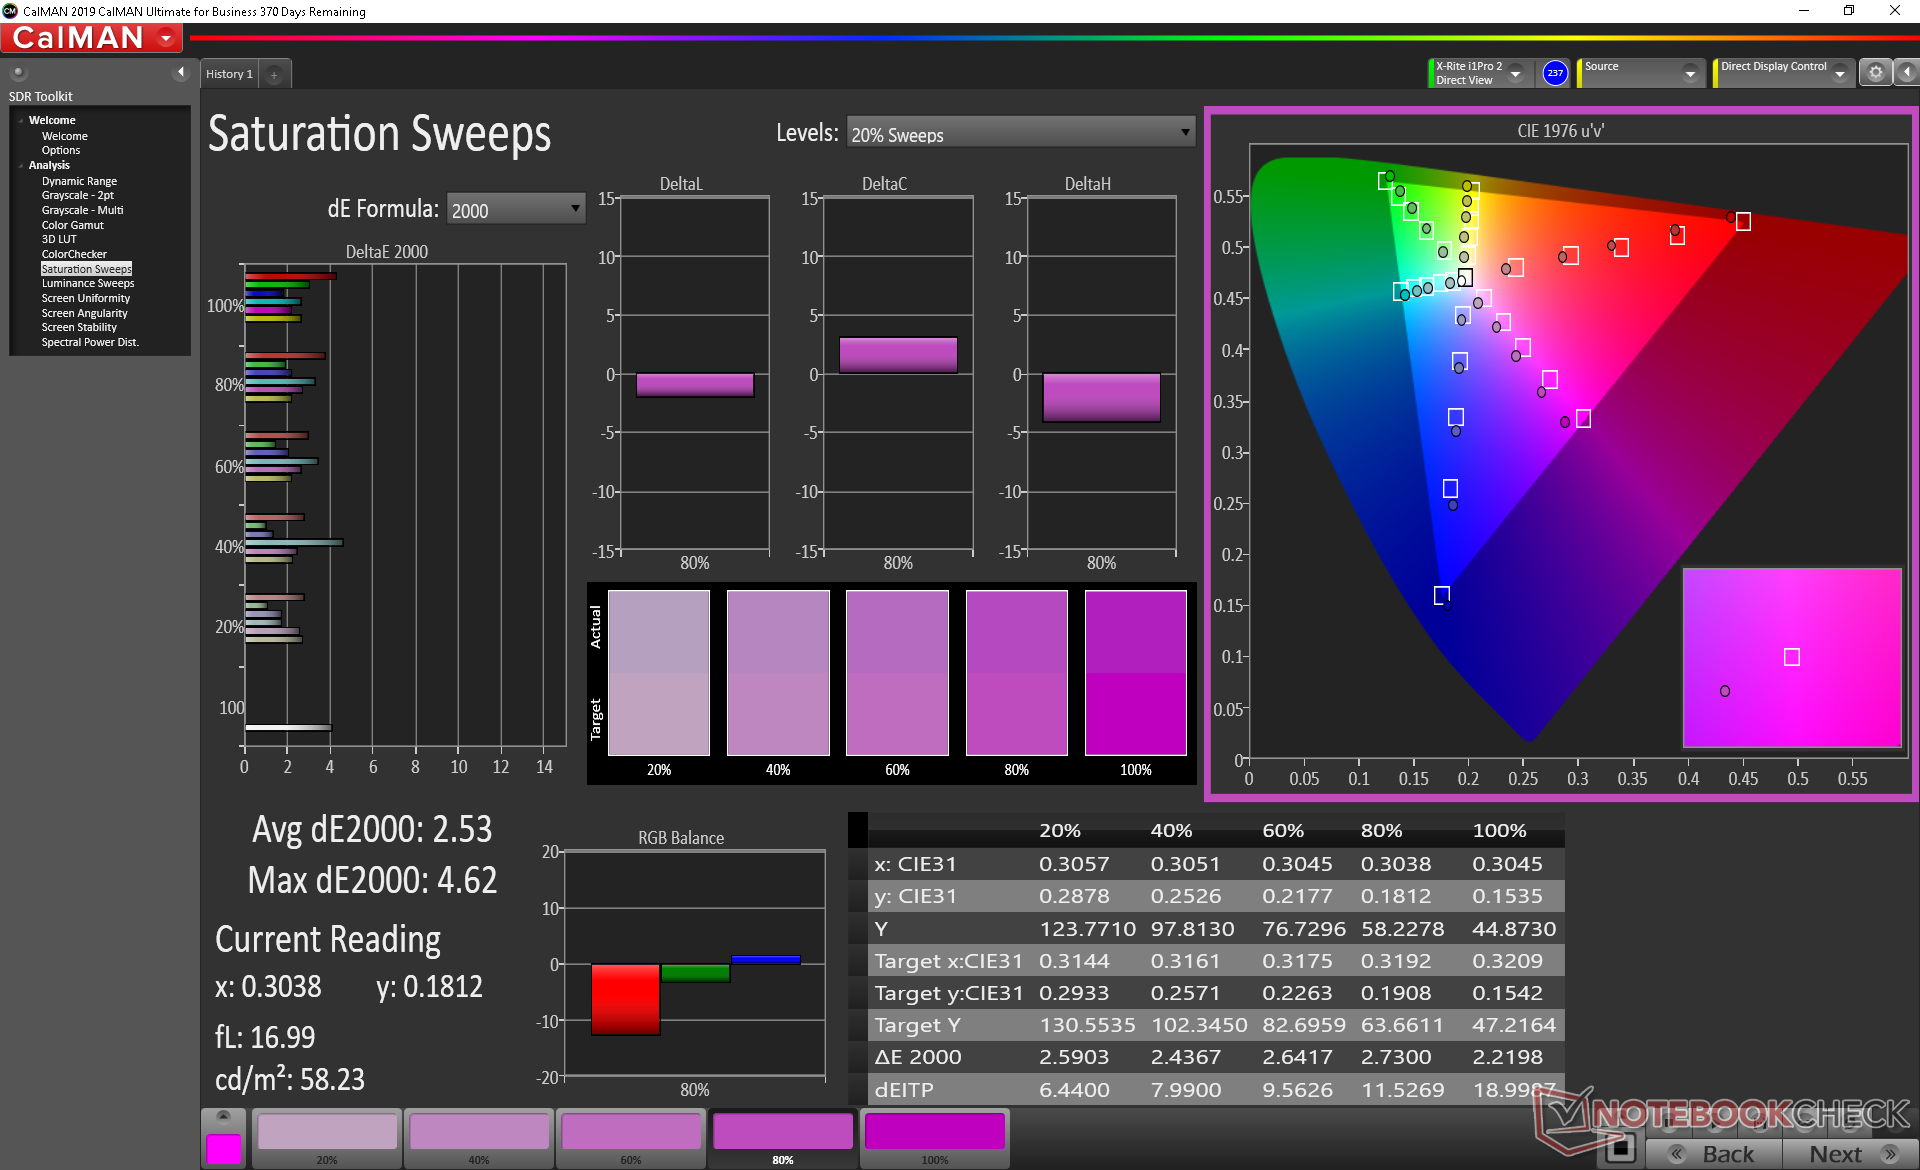
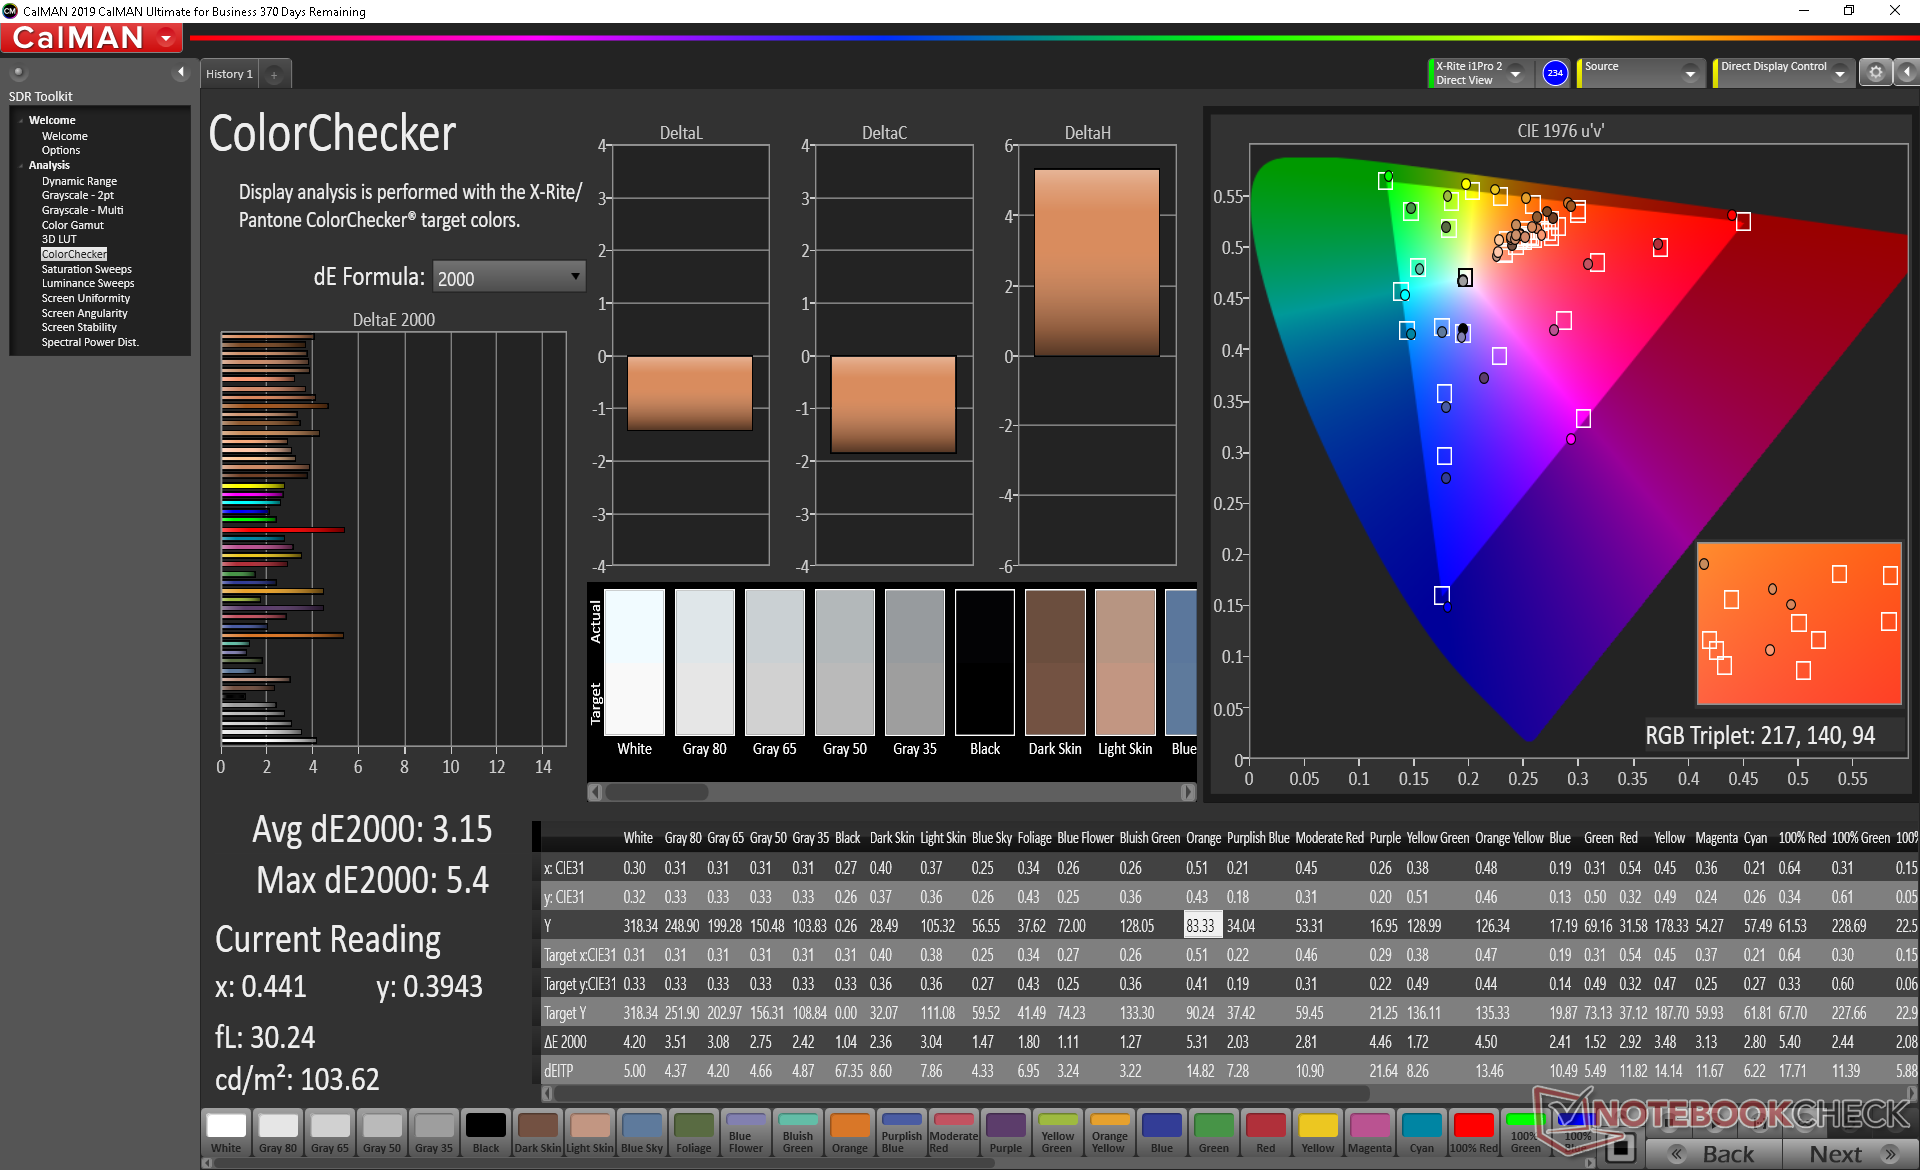
ΔE ColorChecker Calman: 3.15 | ∀{0.5-29.43 Ø4.73}
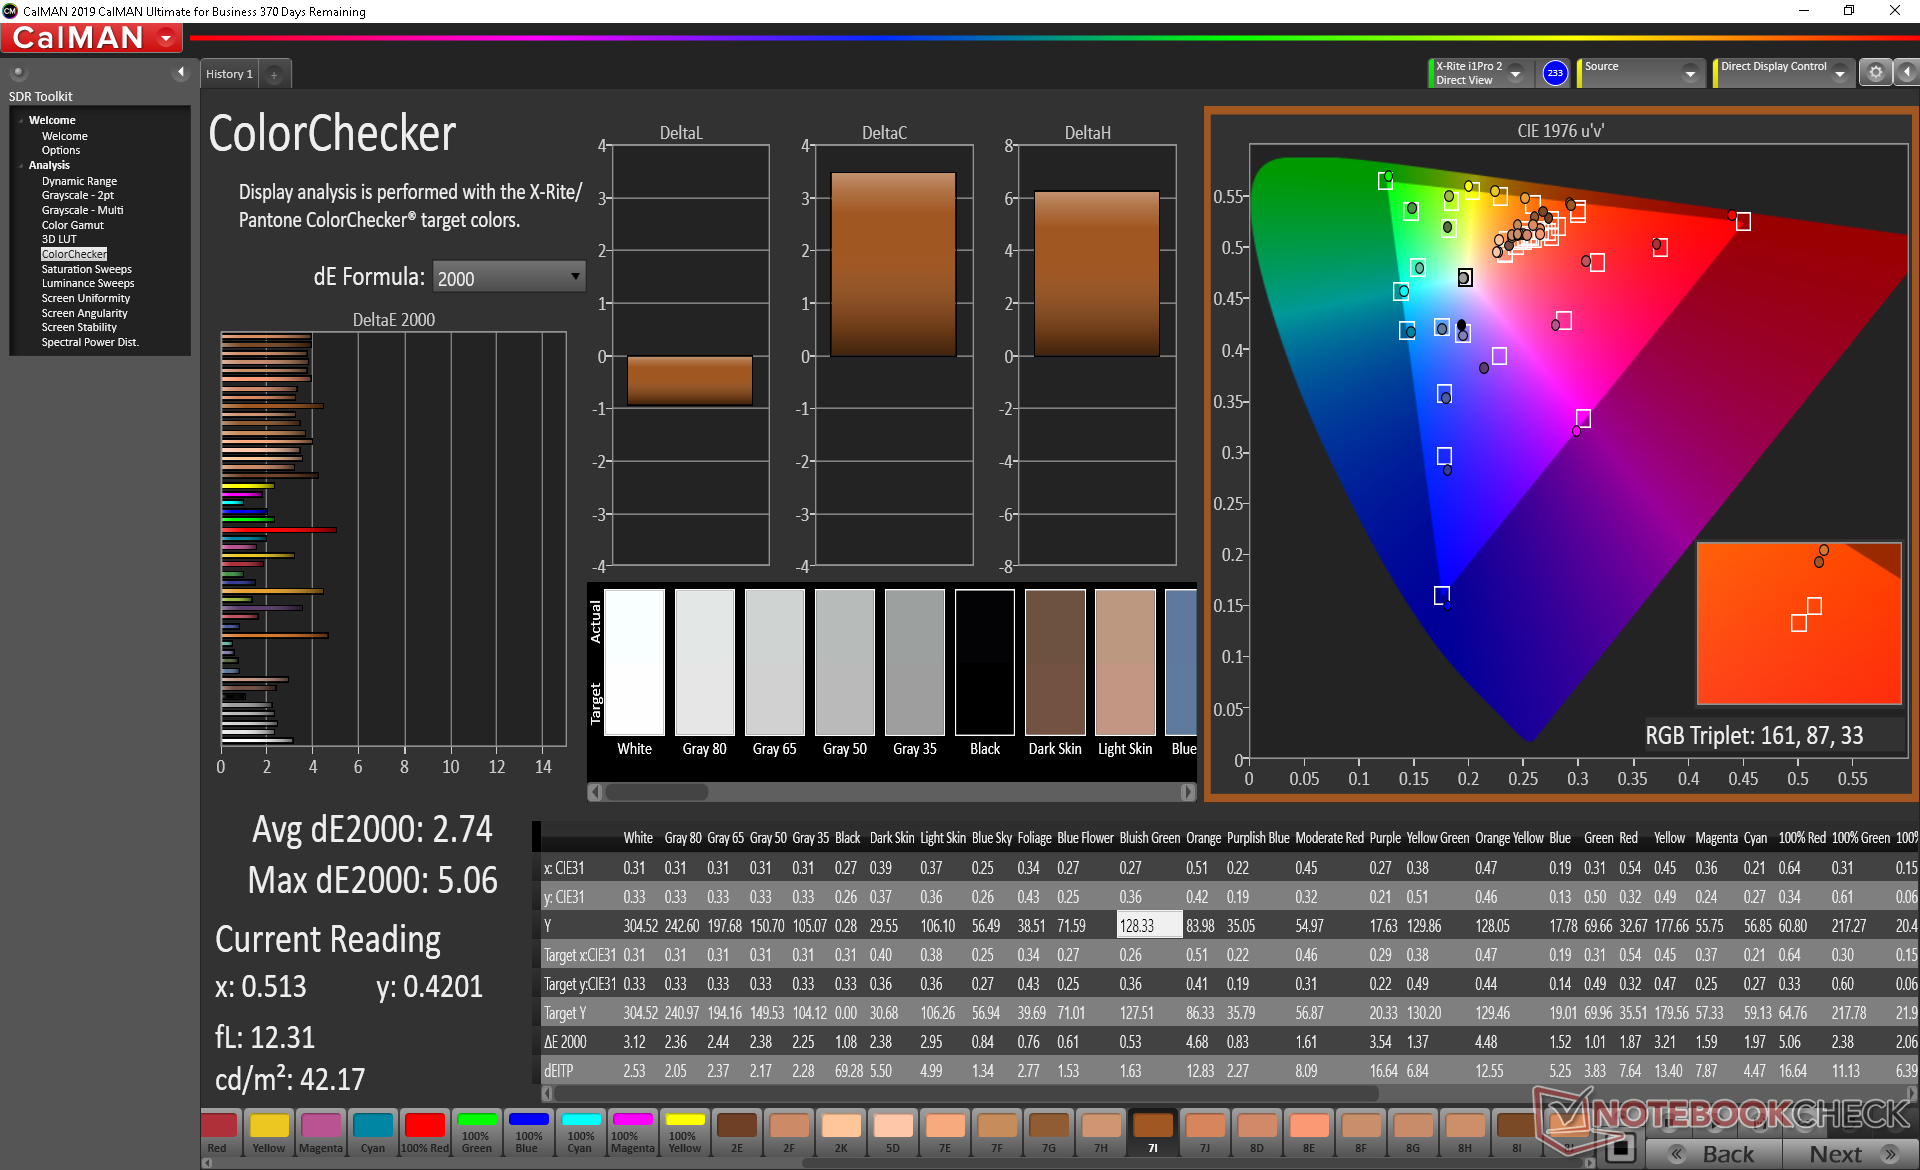
calibrated: 2.74
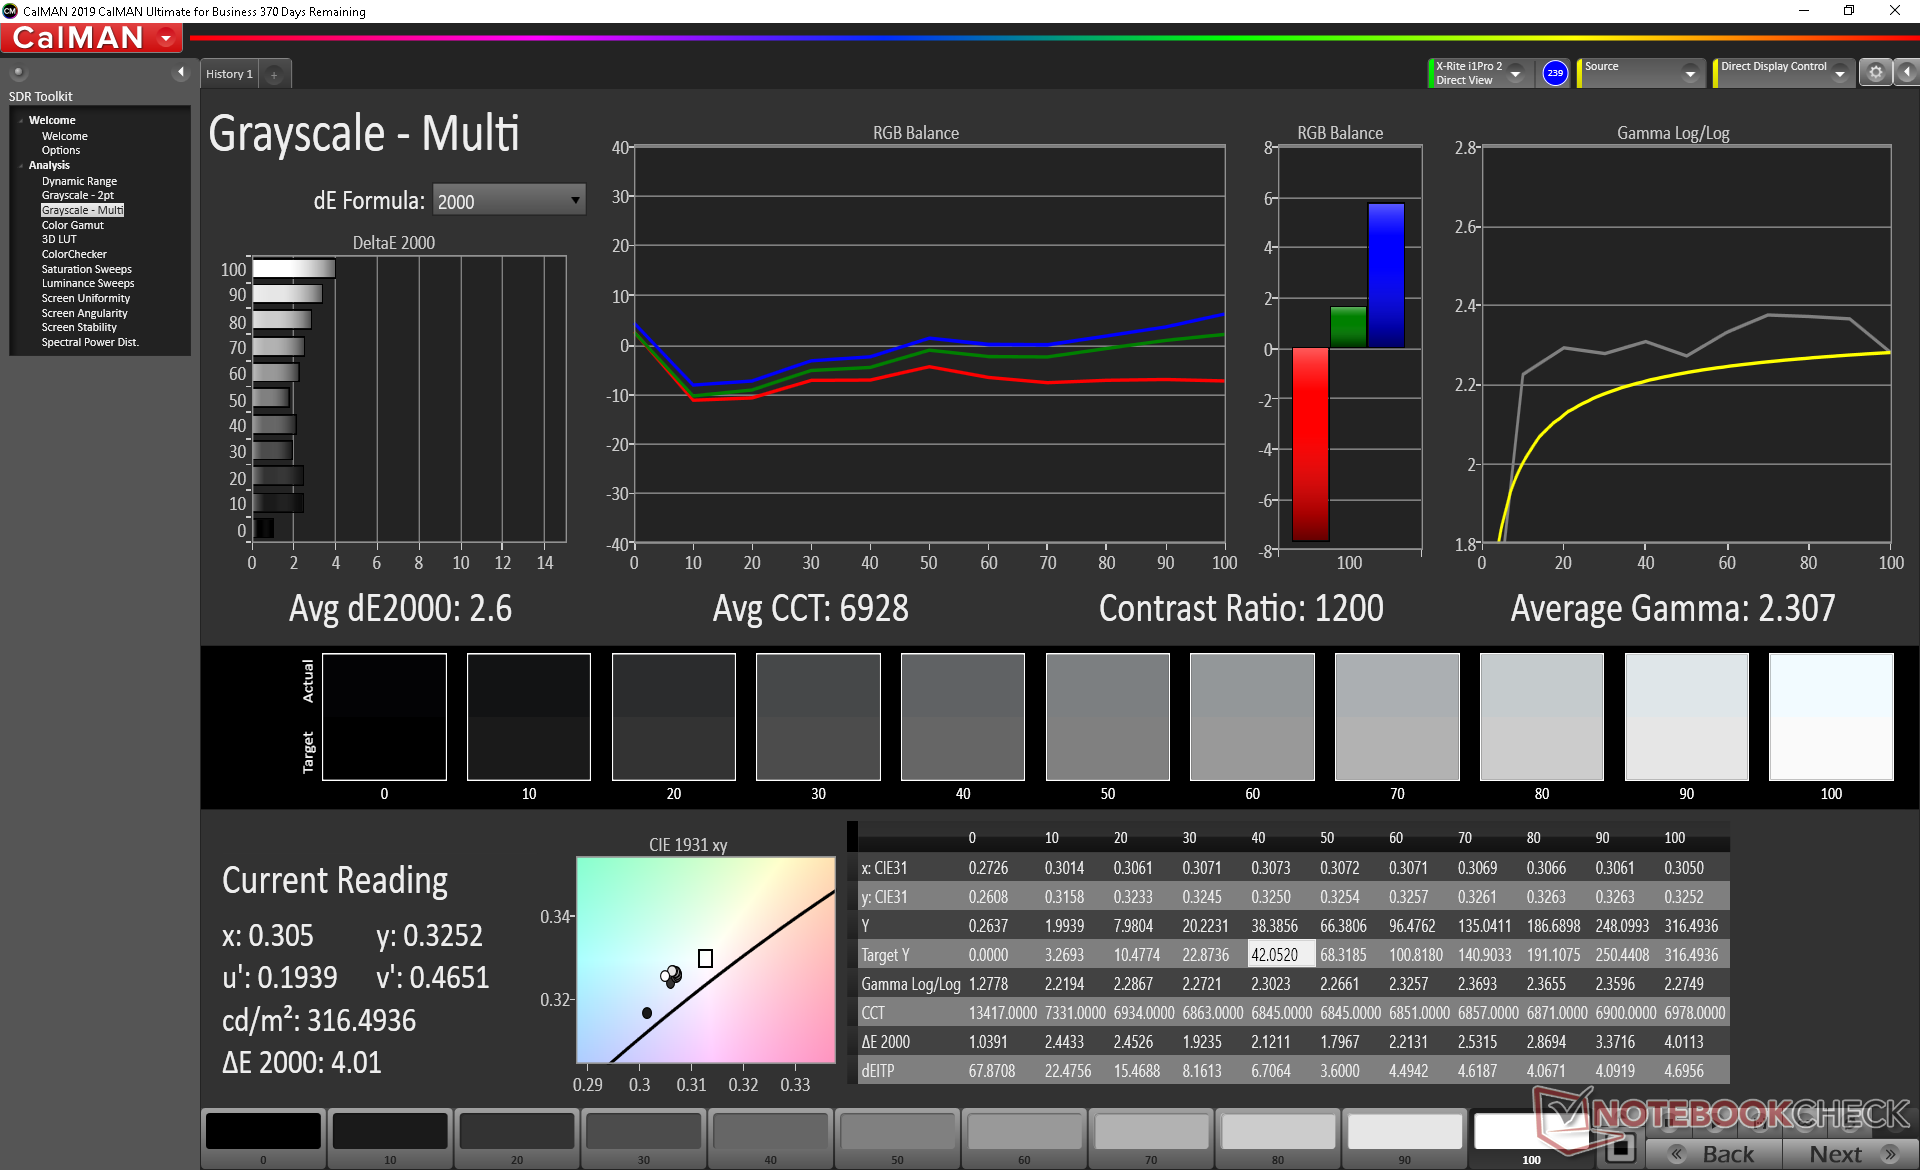
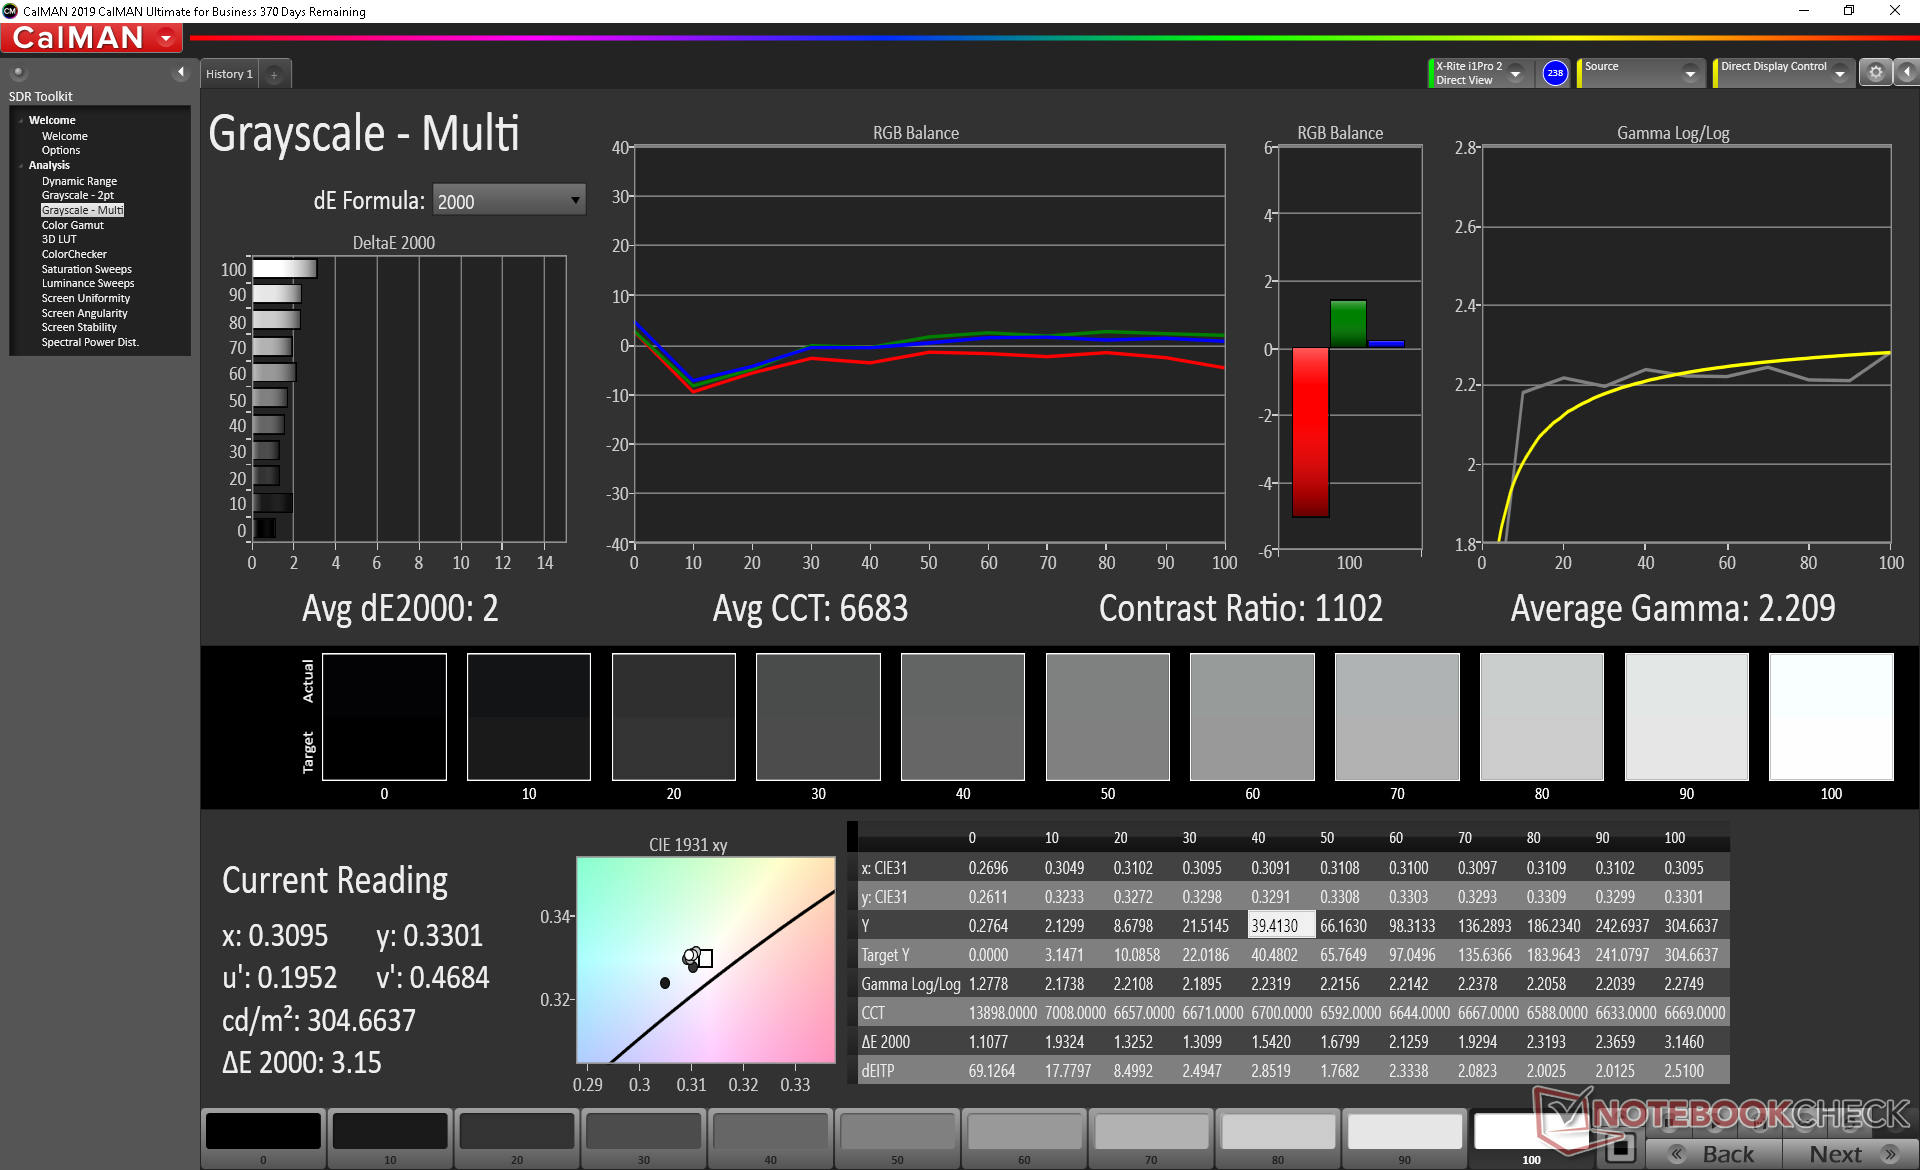
ΔE Greyscale Calman: 2.6 | ∀{0.09-98 Ø4.97}
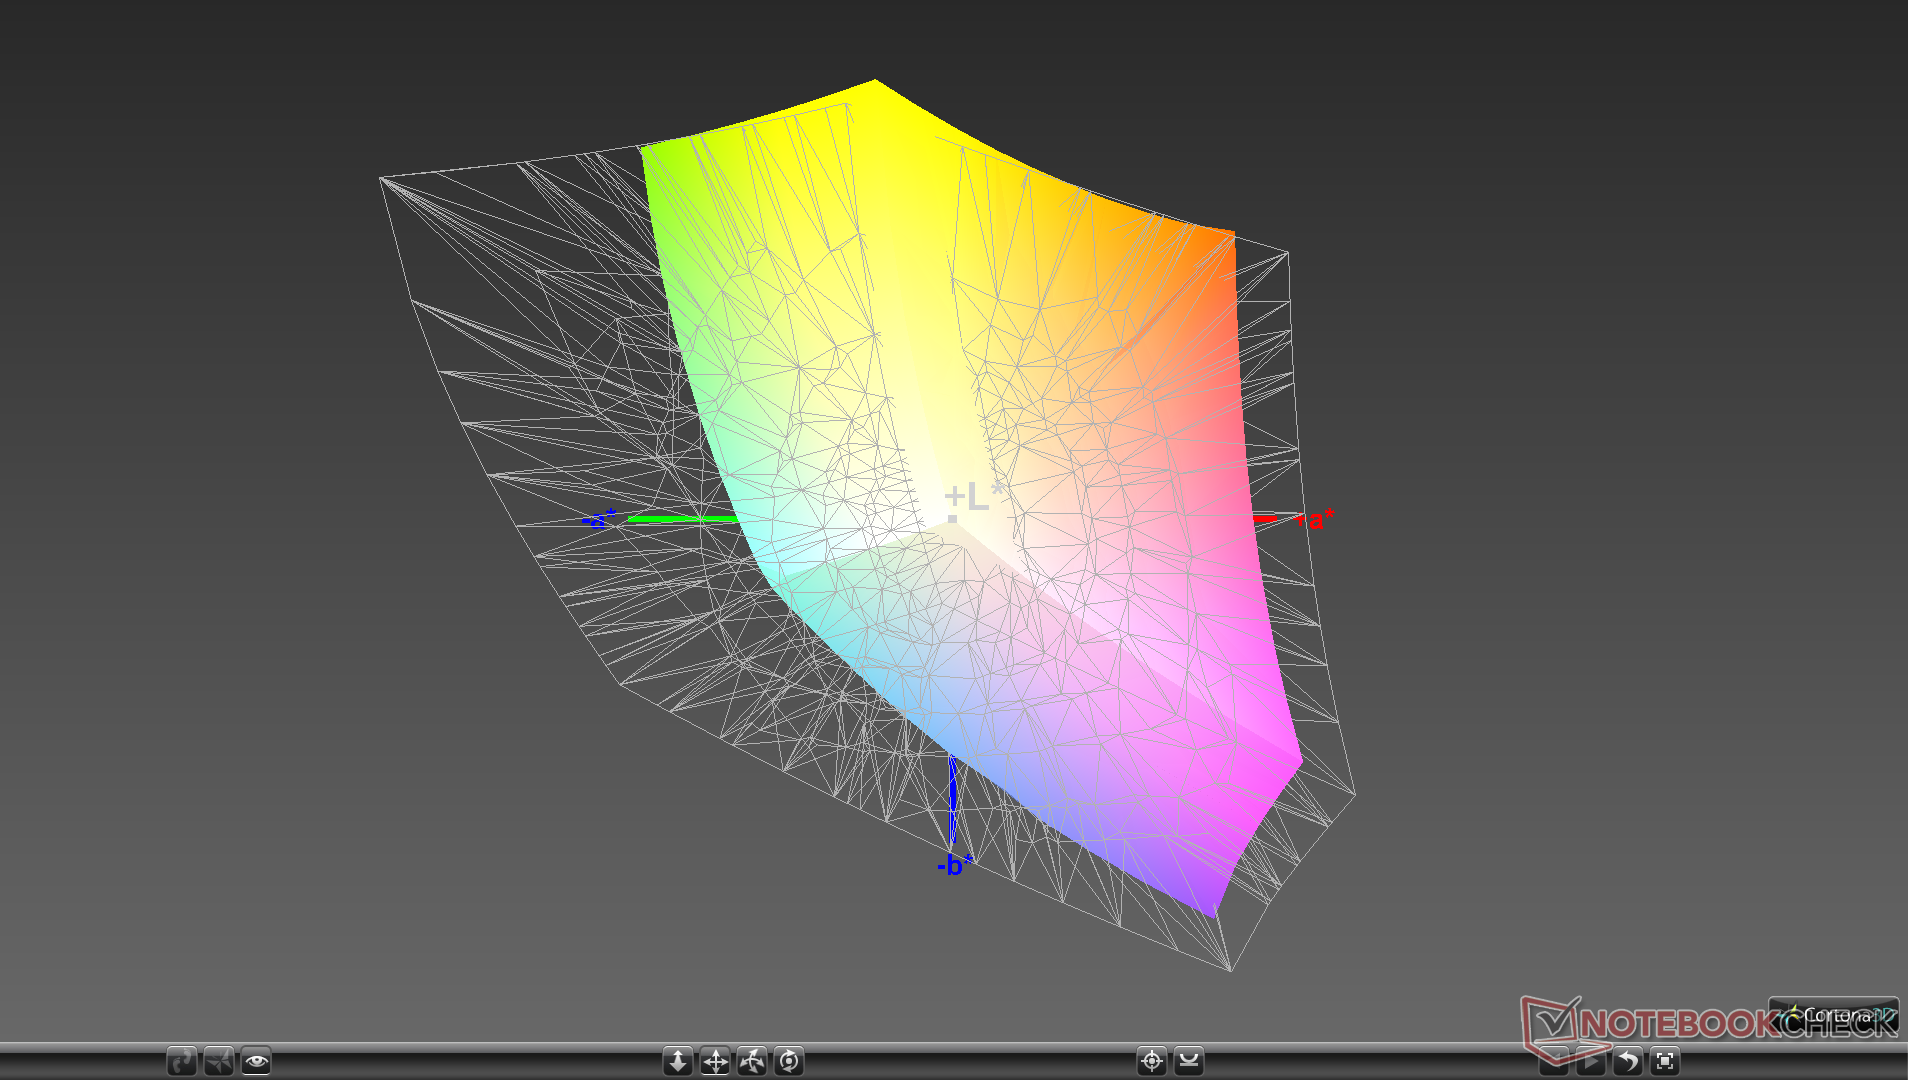
91.8% sRGB (Argyll 1.6.3 3D)
59.6% AdobeRGB 1998 (Argyll 1.6.3 3D)
66.7% AdobeRGB 1998 (Argyll 3D)
92.2% sRGB (Argyll 3D)
65.5% Display P3 (Argyll 3D)
Gamma: 2.31
CCT: 6928 K
| Walmart EVOO Gaming 17 BOE HF N173FHM-N44, IPS, 17.3", 1920x1080 | Schenker XMG Neo 17 BOEhydis NV173FHM-N44 (BOE07B6), IPS, 17.3", 1920x1080 | Alienware m17 P37E AU Optronics B173ZAN01.0, IPS, 17.3", 3840x2160 | Lenovo Legion Y740-17IRH LG Philips LP173WFG-SPD2 (LGD05E0), IPS, 17.3", 1920x1080 | Razer Blade Pro 17 RTX 2060 AU Optronics B173HAN04.0, IPS, 17.3", 1920x1080 | MSI GS75 Stealth 9SG Chi Mei N173HCE-G33 (CMN175C), IPS, 17.3", 1920x1080 | |
|---|---|---|---|---|---|---|
| Display | 0% | 30% | 1% | -5% | -2% | |
| Display P3 Coverage (%) | 65.5 | 65.2 0% | 86.4 32% | 64.8 -1% | 61.1 -7% | 62.6 -4% |
| sRGB Coverage (%) | 92.2 | 92.2 0% | 99.9 8% | 96 4% | 89.4 -3% | 93.5 1% |
| AdobeRGB 1998 Coverage (%) | 66.7 | 66.5 0% | 99.1 49% | 65.8 -1% | 62.5 -6% | 64.7 -3% |
| Response Times | -1% | -111% | 15% | 46% | 41% | |
| Response Time Grey 50% / Grey 80% * (ms) | 17.6 ? | 18.8 ? -7% | 35.6 ? -102% | 14.8 ? 16% | 6.8 ? 61% | 7.2 ? 59% |
| Response Time Black / White * (ms) | 12.8 ? | 12 ? 6% | 28 ? -119% | 11.2 ? 13% | 8.8 ? 31% | 10 ? 22% |
| PWM Frequency (Hz) | 980 ? | 971 ? | 25510 ? | |||
| Screen | 3% | -32% | -8% | 3% | 19% | |
| Brightness middle (cd/m²) | 314.2 | 304 -3% | 357.9 14% | 282 -10% | 300.4 -4% | 366 16% |
| Brightness (cd/m²) | 307 | 289 -6% | 347 13% | 261 -15% | 289 -6% | 343 12% |
| Brightness Distribution (%) | 92 | 90 -2% | 94 2% | 87 -5% | 93 1% | 91 -1% |
| Black Level * (cd/m²) | 0.26 | 0.26 -0% | 0.33 -27% | 0.27 -4% | 0.32 -23% | 0.29 -12% |
| Contrast (:1) | 1208 | 1169 -3% | 1085 -10% | 1044 -14% | 939 -22% | 1262 4% |
| Colorchecker dE 2000 * | 3.15 | 2.65 16% | 6.57 -109% | 3.18 -1% | 2.32 26% | 1.51 52% |
| Colorchecker dE 2000 max. * | 5.4 | 6.11 -13% | 9.86 -83% | 8.39 -55% | 3.81 29% | 3.22 40% |
| Colorchecker dE 2000 calibrated * | 2.74 | 1.5 45% | 6.74 -146% | 0.95 65% | 2.95 -8% | 0.71 74% |
| Greyscale dE 2000 * | 2.6 | 2.75 -6% | 4.3 -65% | 4.1 -58% | 1.5 42% | 1.93 26% |
| Gamma | 2.31 95% | 2.46 89% | 2.6 85% | 2.55 86% | 2.3 96% | 2.38 92% |
| CCT | 6928 94% | 6763 96% | 6403 102% | 7260 90% | 6764 96% | 6881 94% |
| Color Space (Percent of AdobeRGB 1998) (%) | 59.6 | 60 1% | 88.4 48% | 61 2% | 57.4 -4% | 60 1% |
| Color Space (Percent of sRGB) (%) | 91.8 | 92 0% | 100 9% | 96 5% | 89 -3% | 94 2% |
| Total Average (Program / Settings) | 1% /
2% | -38% /
-30% | 3% /
-4% | 15% /
7% | 19% /
18% |
* ... smaller is better
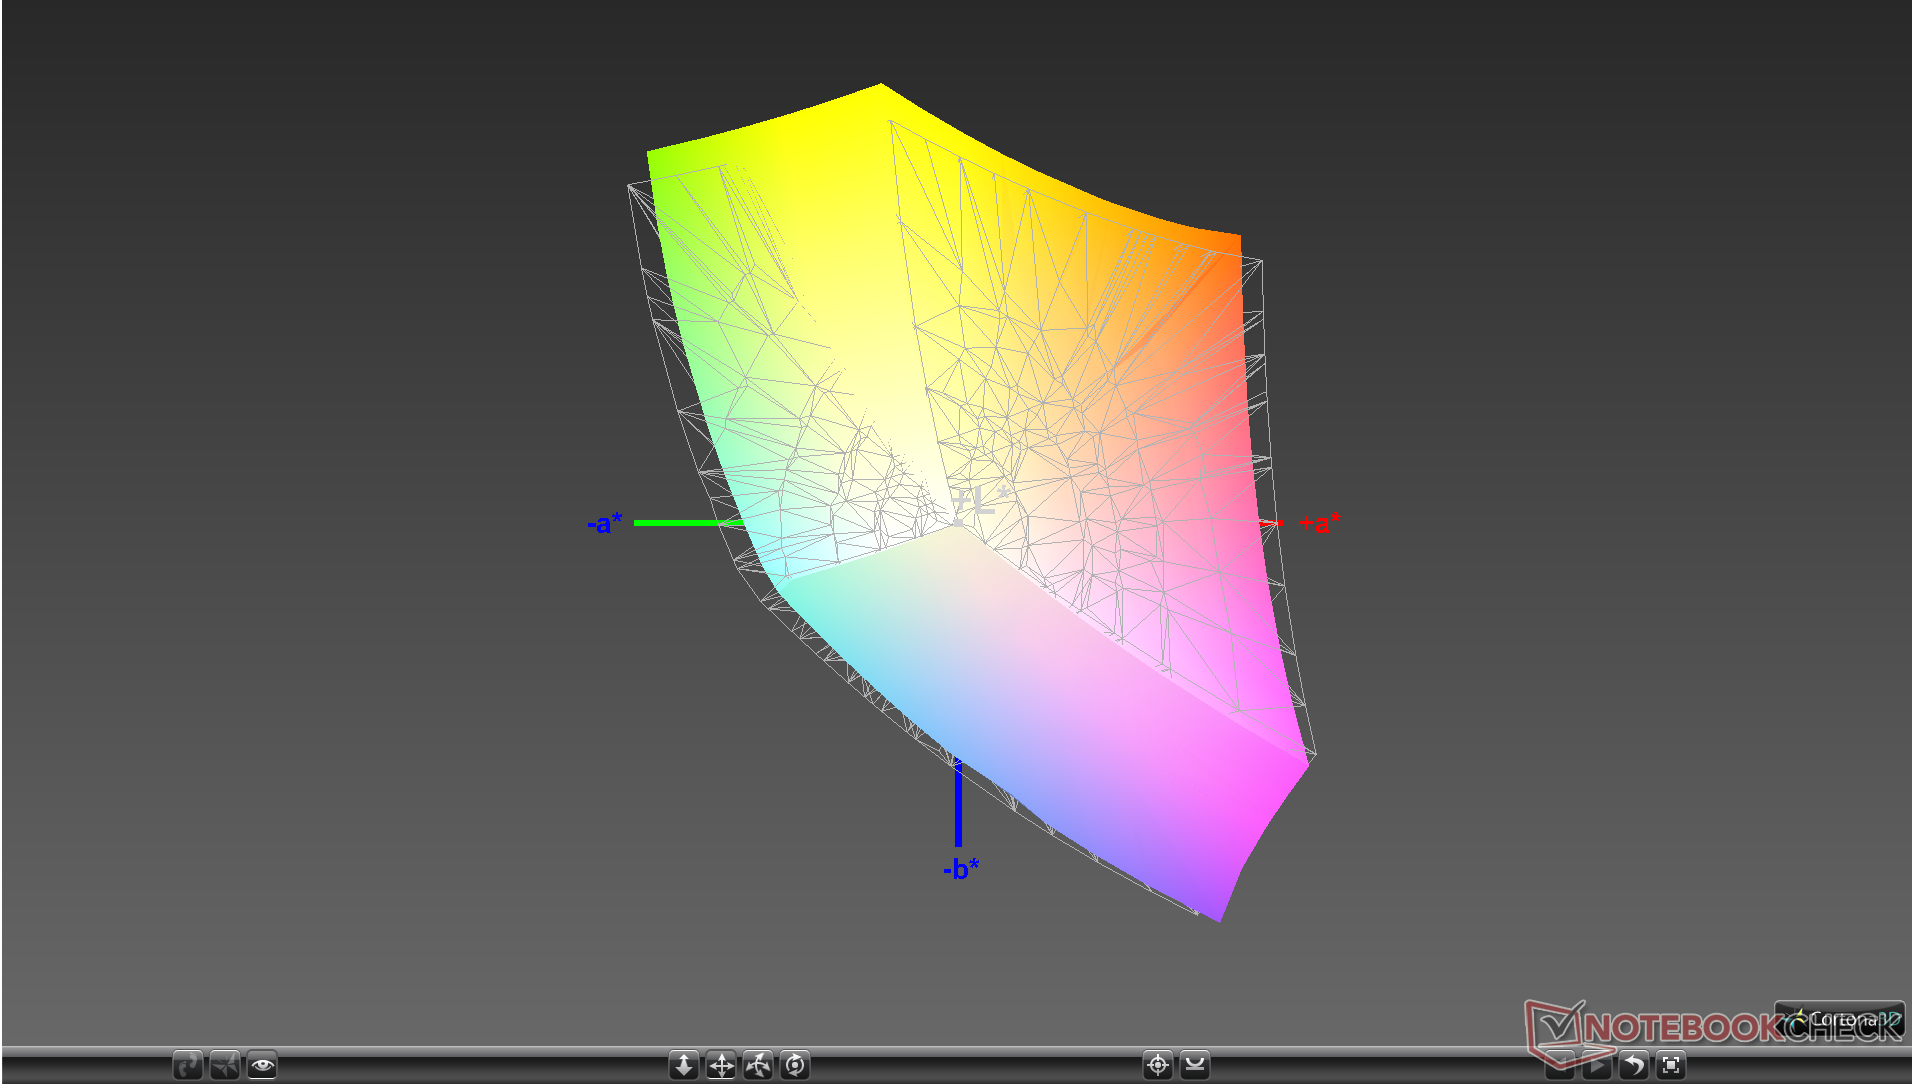
The screen is well-calibrated out of the box due to it being tuned by THX. Most other gaming laptops do not offer this type of service save for Pantone-certified laptops like the more expensive Gigabyte Aero or Razer Blade. Color temperature is slightly too cool, but our calibration fixes this.
Display Response Times
| ↔ Response Time Black to White | ||
|---|---|---|
| 12.8 ms ... rise ↗ and fall ↘ combined | ↗ 7.6 ms rise | 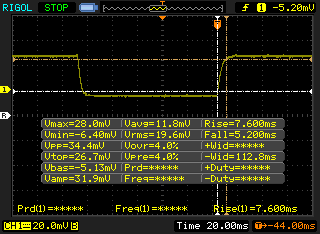 |
| ↘ 5.2 ms fall | ||
| The screen shows good response rates in our tests, but may be too slow for competitive gamers. In comparison, all tested devices range from 0.1 (minimum) to 240 (maximum) ms. » 33 % of all devices are better. This means that the measured response time is better than the average of all tested devices (19.9 ms). | ||
| ↔ Response Time 50% Grey to 80% Grey | ||
| 17.6 ms ... rise ↗ and fall ↘ combined | ↗ 8.4 ms rise | 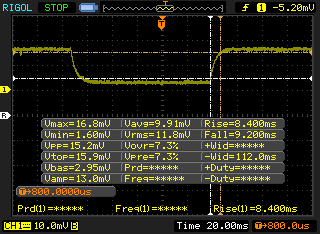 |
| ↘ 9.2 ms fall | ||
| The screen shows good response rates in our tests, but may be too slow for competitive gamers. In comparison, all tested devices range from 0.165 (minimum) to 636 (maximum) ms. » 31 % of all devices are better. This means that the measured response time is better than the average of all tested devices (31.1 ms). | ||
Screen Flickering / PWM (Pulse-Width Modulation)
| Screen flickering / PWM detected | 980 Hz | ≤ 99 % brightness setting | 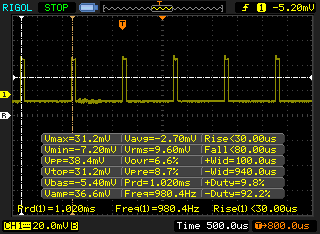 |
The display backlight flickers at 980 Hz (worst case, e.g., utilizing PWM) Flickering detected at a brightness setting of 99 % and below. There should be no flickering or PWM above this brightness setting. The frequency of 980 Hz is quite high, so most users sensitive to PWM should not notice any flickering. In comparison: 52 % of all tested devices do not use PWM to dim the display. If PWM was detected, an average of 7798 (minimum: 5 - maximum: 343500) Hz was measured. | |||

Performance
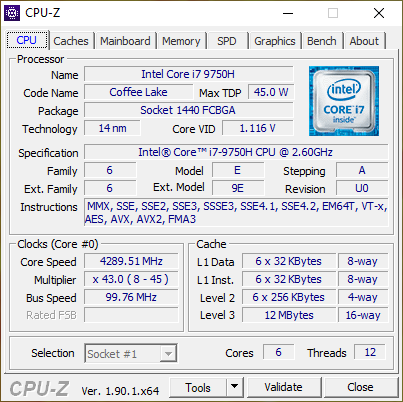
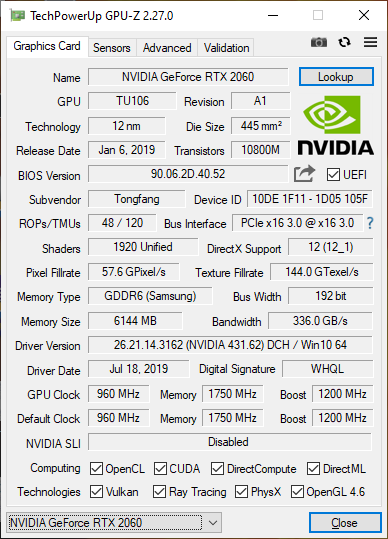
Walmart doesn't offer any other CPU, GPU, or display options outside of what we have here. By focusing on a larger volume of fewer SKUs, Walmart can afford to keep prices lower. The Core i7-9750H and GeForce RTX 2060 are a common pair on mid-range to high-end gaming laptops.
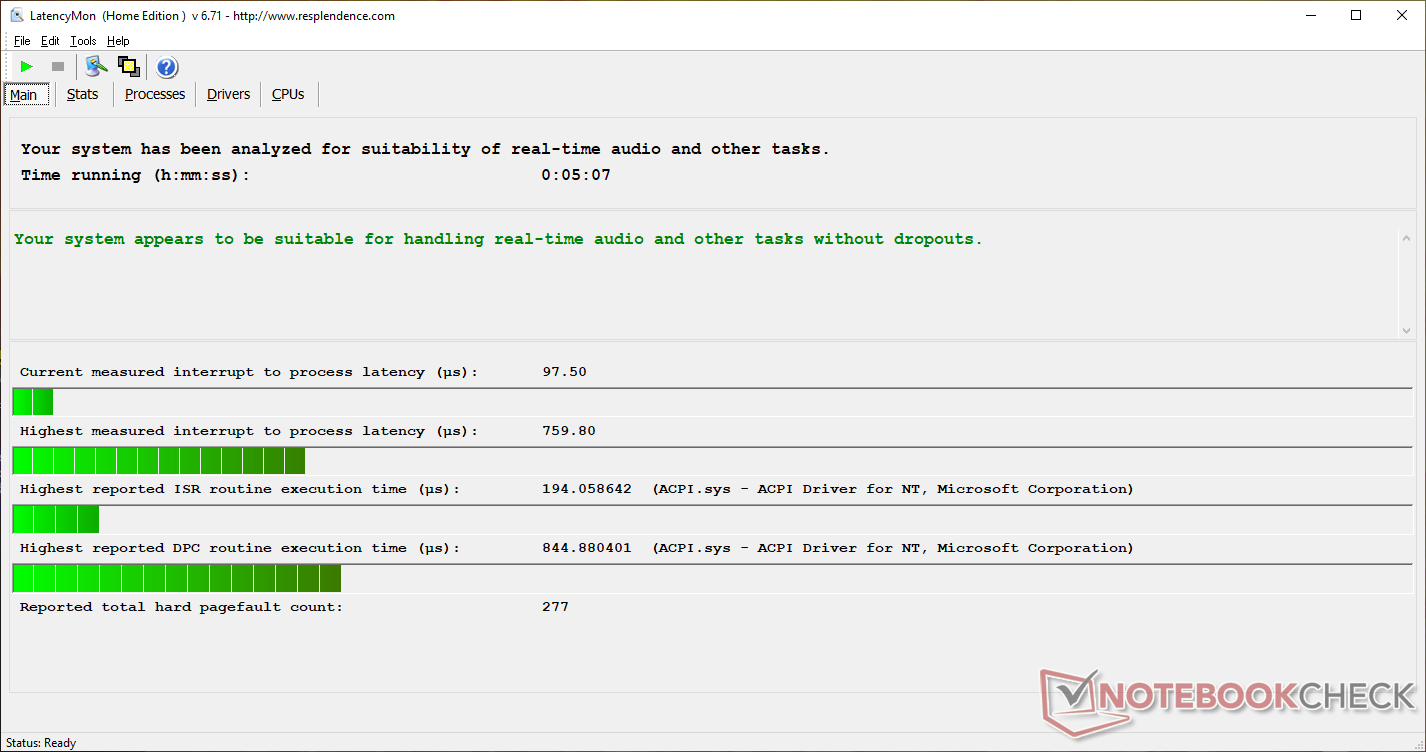
Nvidia Optimus is included for automatic graphics switching at the expense of G-Sync. LatencyMon shows no DPC latency issues.
Processor
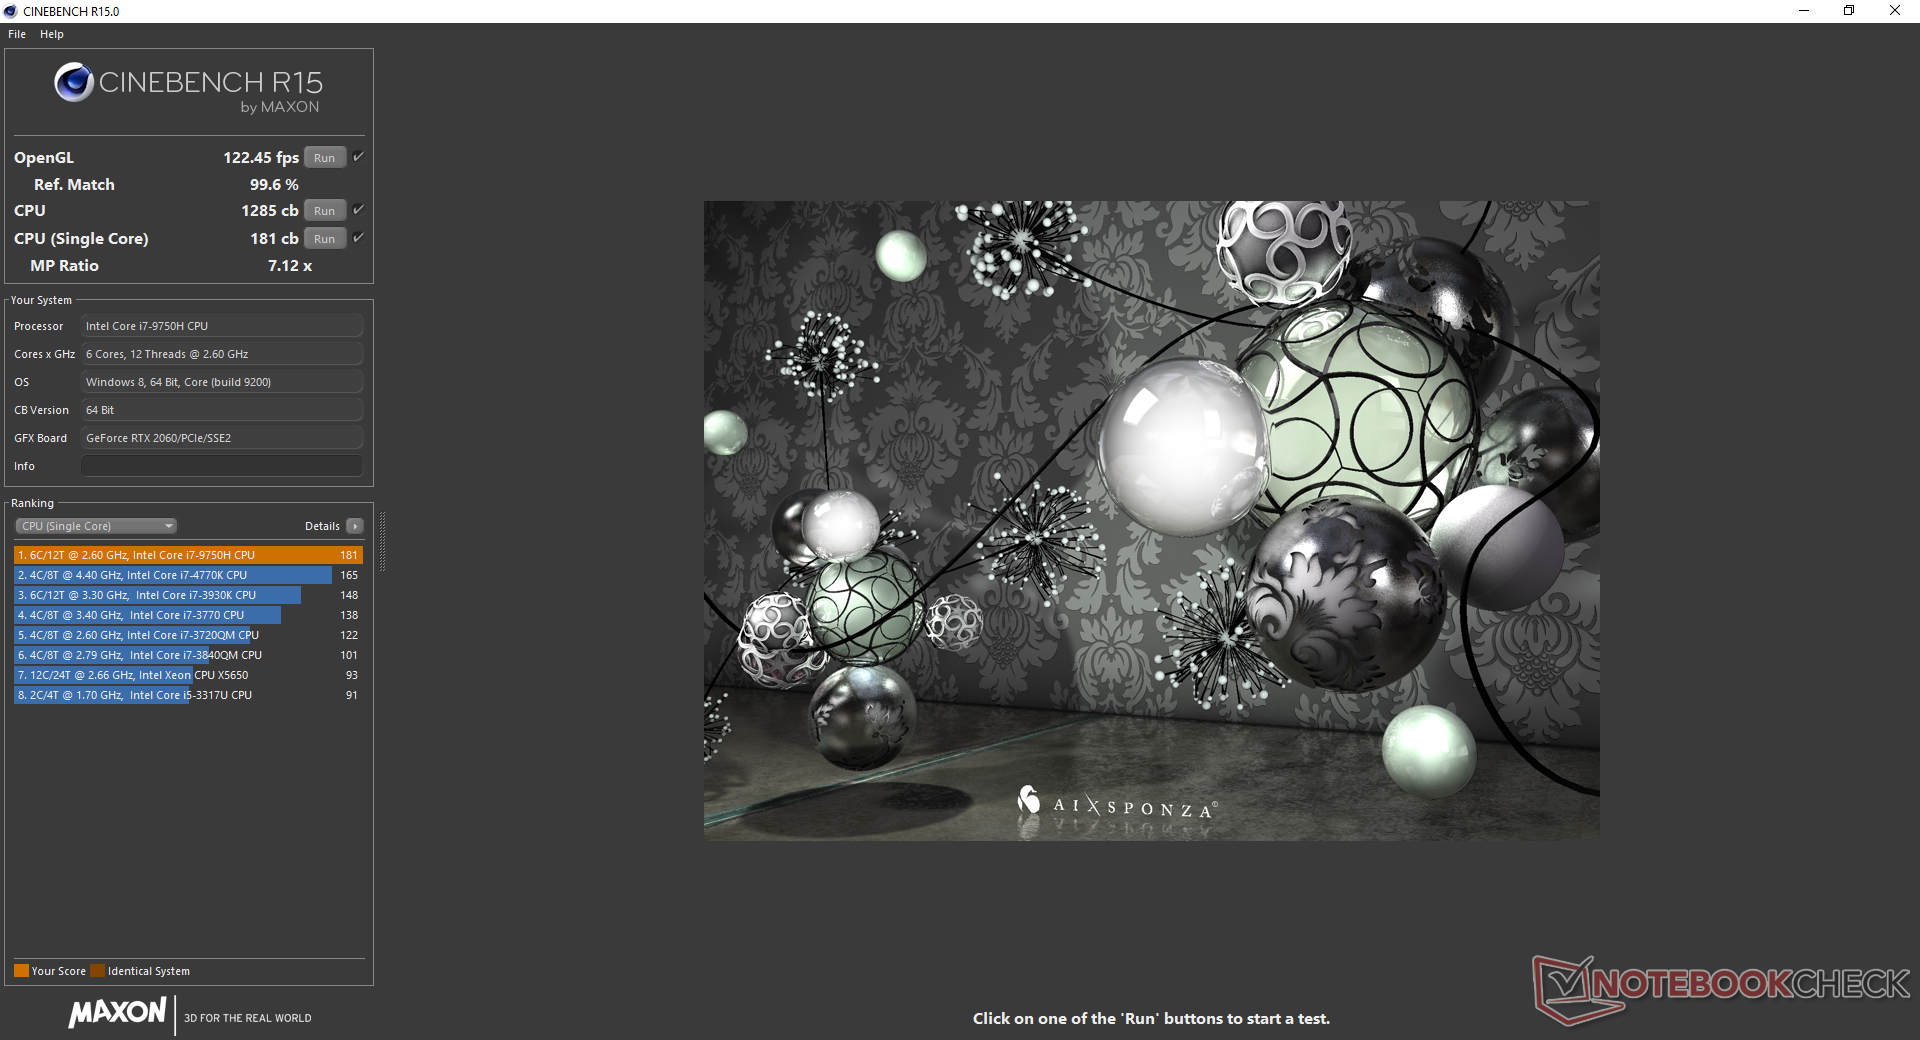
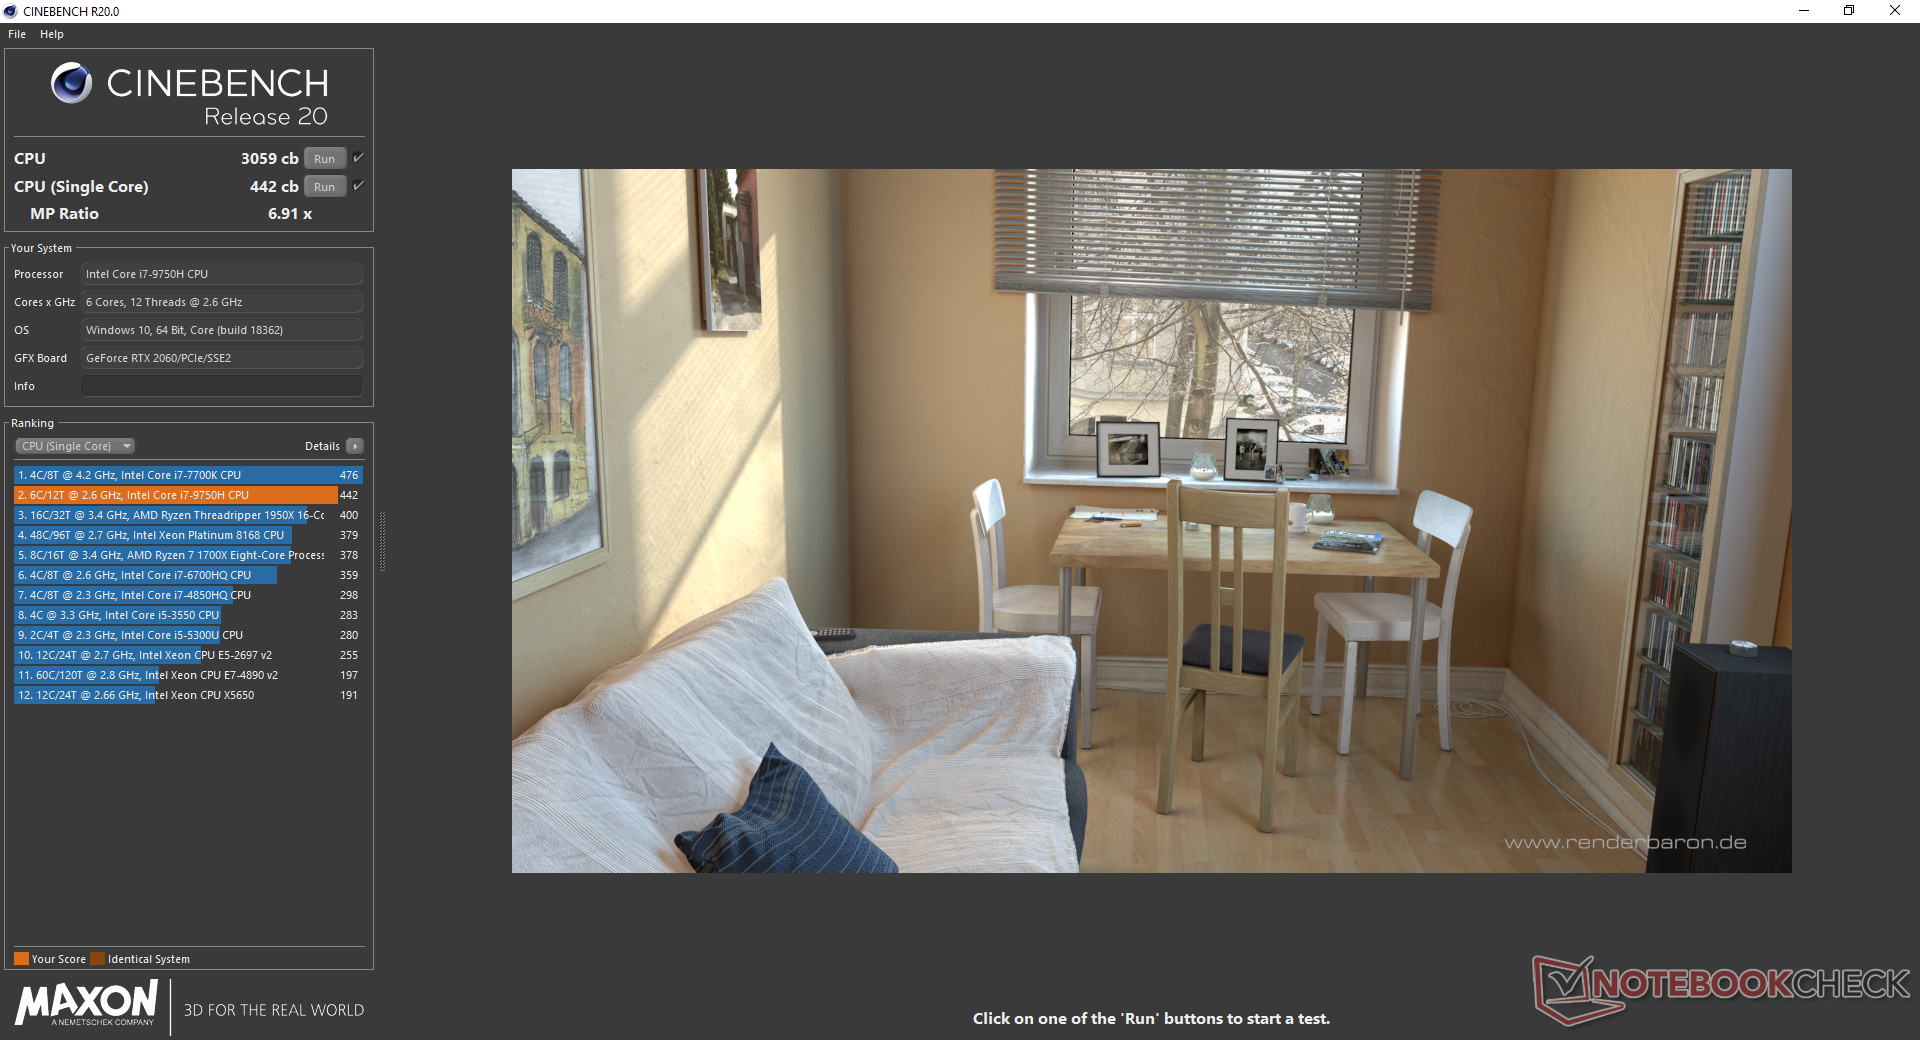
Interestingly, CPU performance is faster than what we recorded on the Schenker Neo 17 despite their similar chassis designs. CineBench R20 Multi-Thread results are 18 percent faster than the average Core i7-9750H in our database to suggest better Turbo Boost sustainability over time. Indeed, we can observe this when running CineBench R15 Multi-Thread in a loop as scores are more stable from beginning to end when compared to the MSI GS75 or Razer Blade Pro 17 with the same CPU as shown below.
See our dedicated page on the Core i7-9750H for more technical information and benchmark comparisons.
System Performance
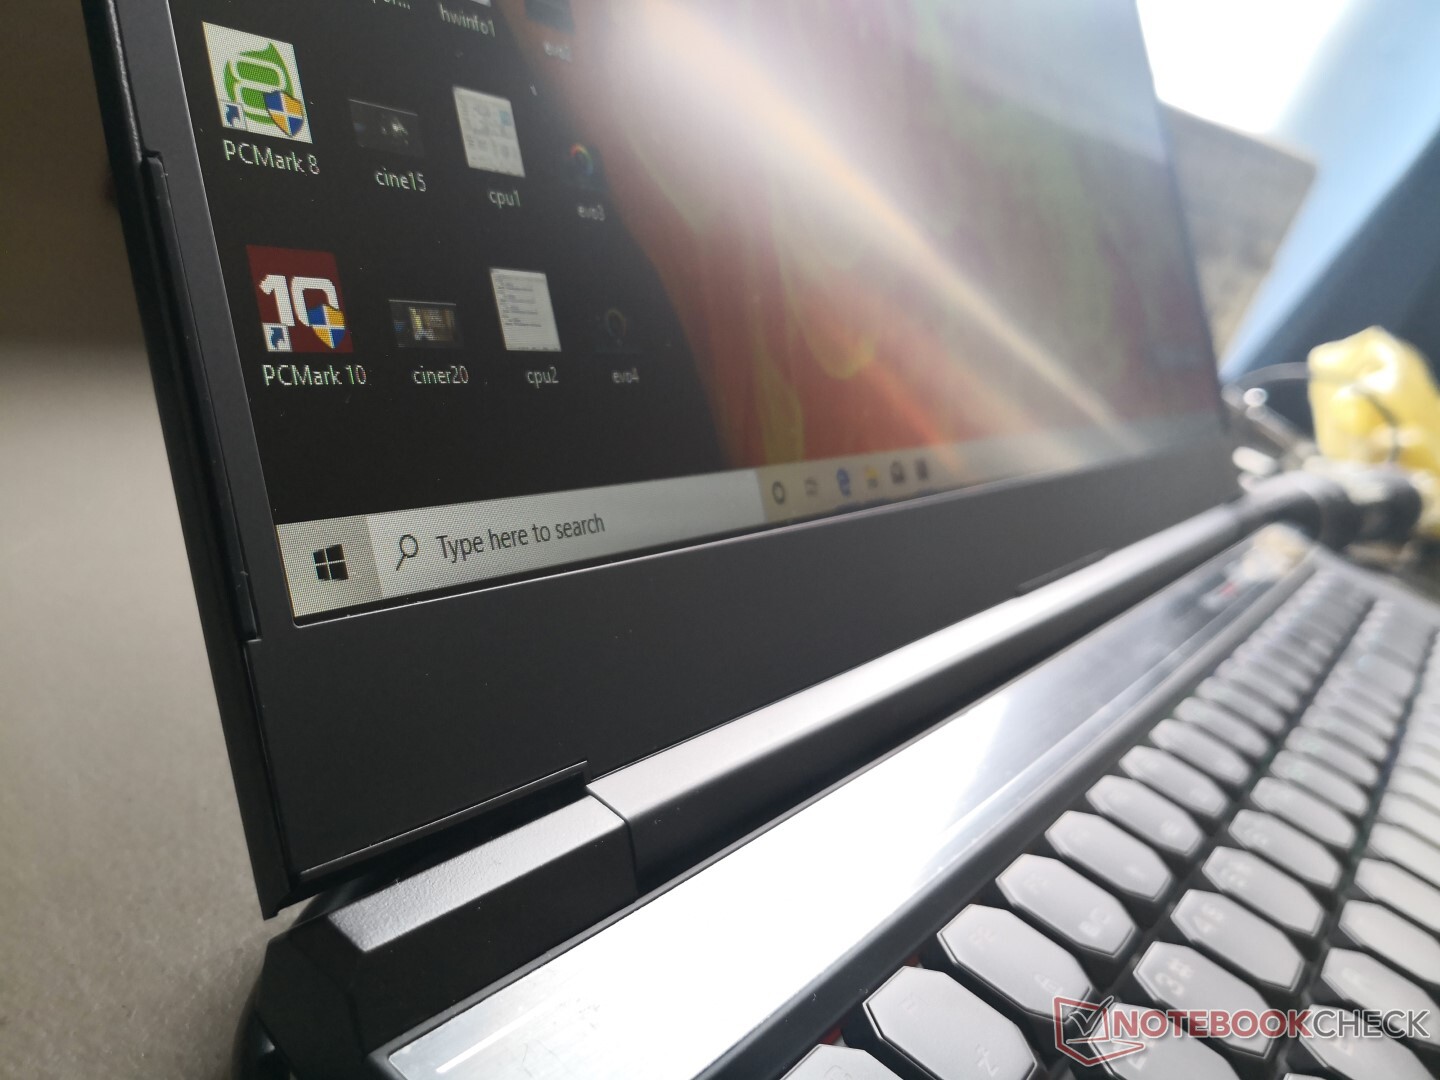
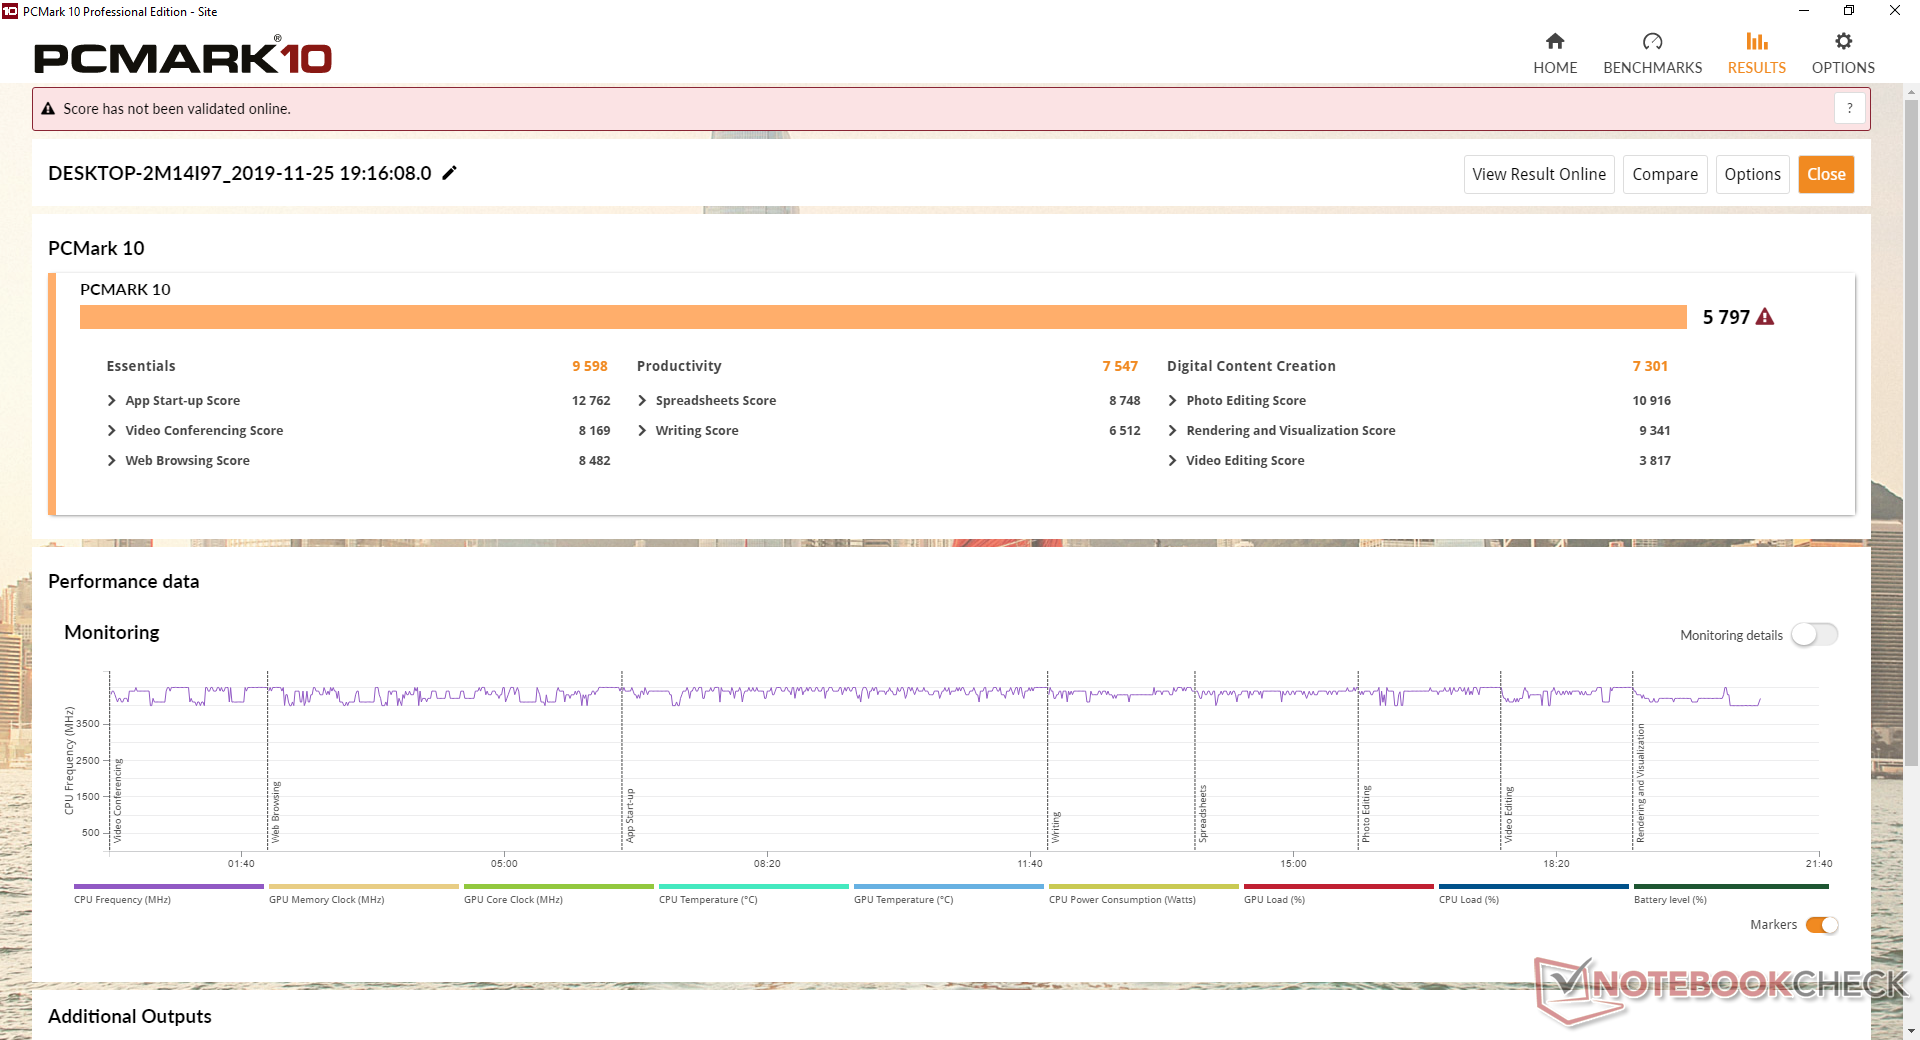
PCMark benchmarks are within single-digit percentages of other high-end ultra-thin gaming laptops like the Razer Blade Pro 17 or MSI GS75. We experienced no software or hardware issues during our time with the test unit. There is almost no bloatware despite it being a Walmart laptop.
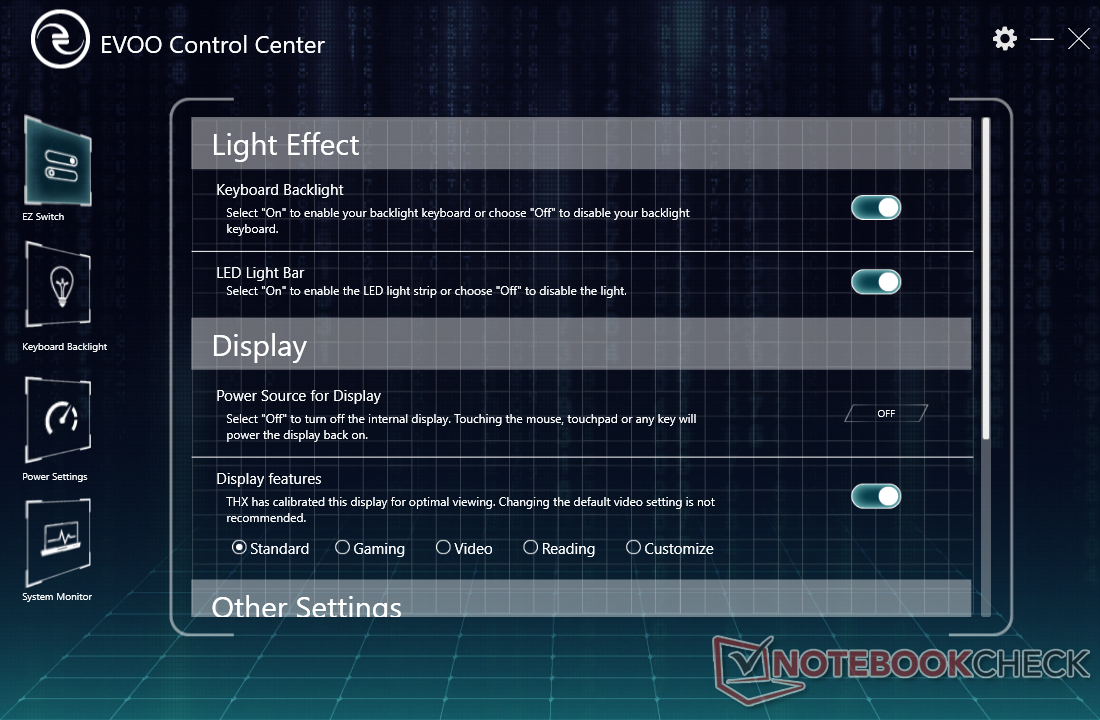
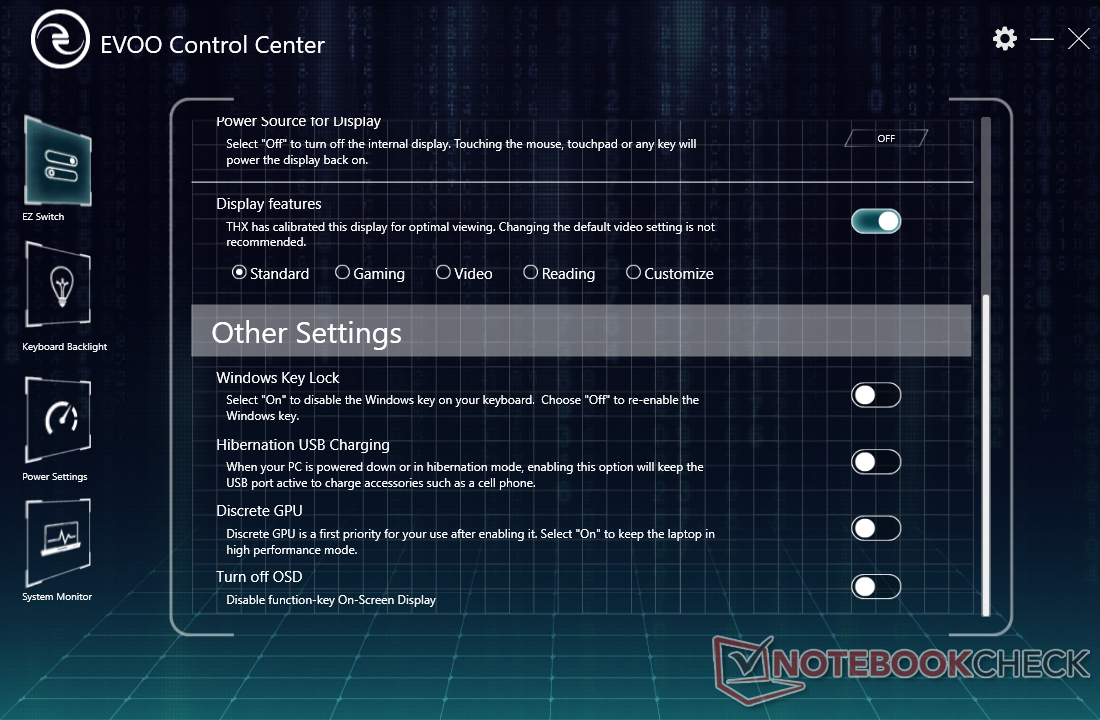
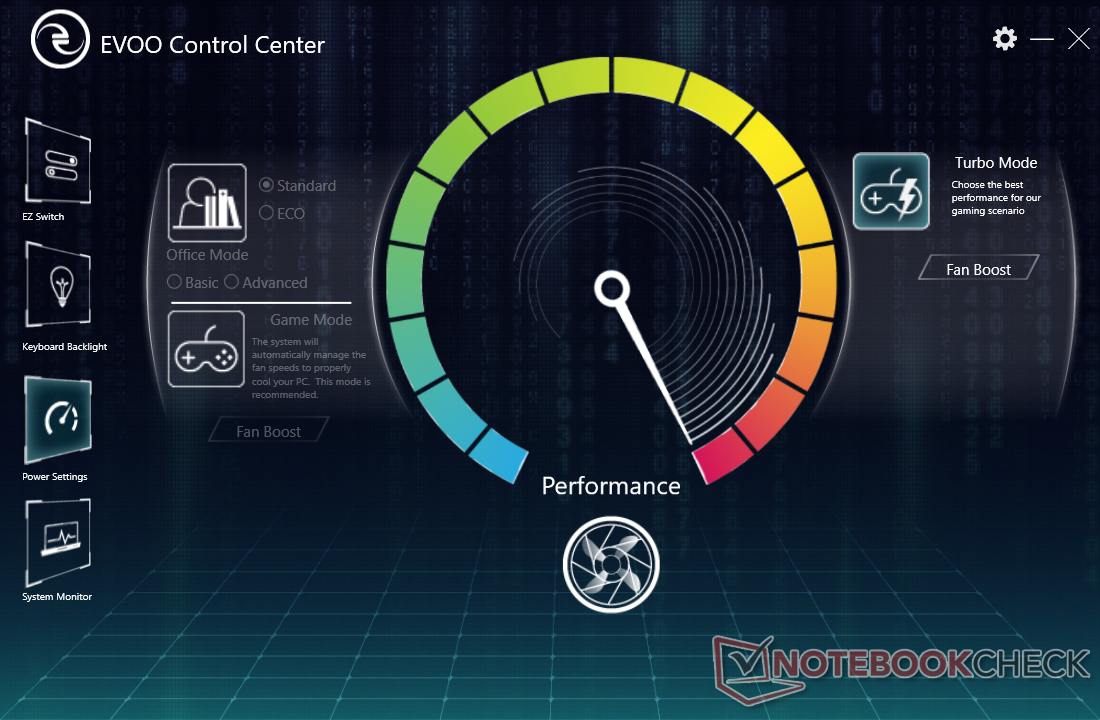
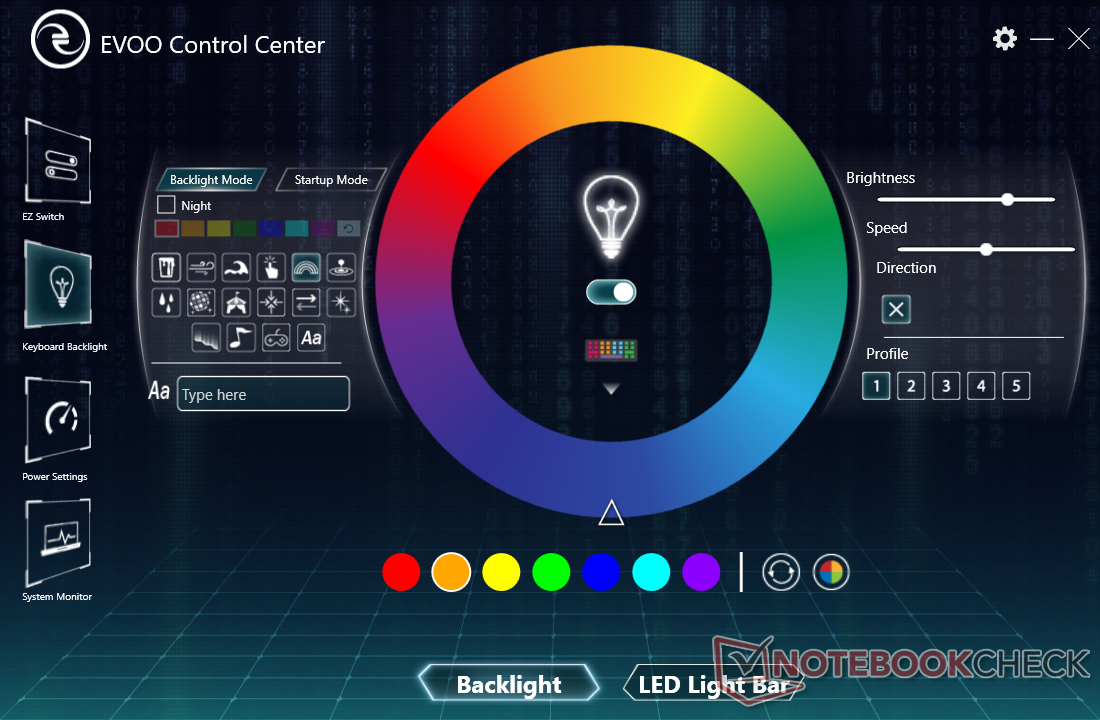
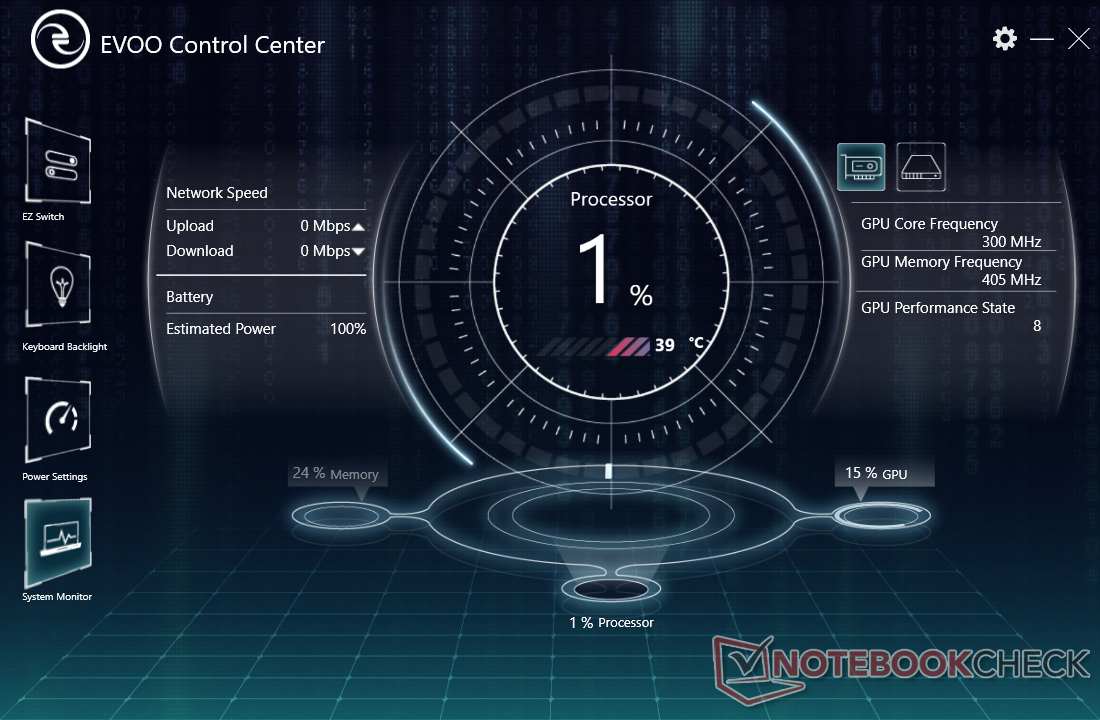
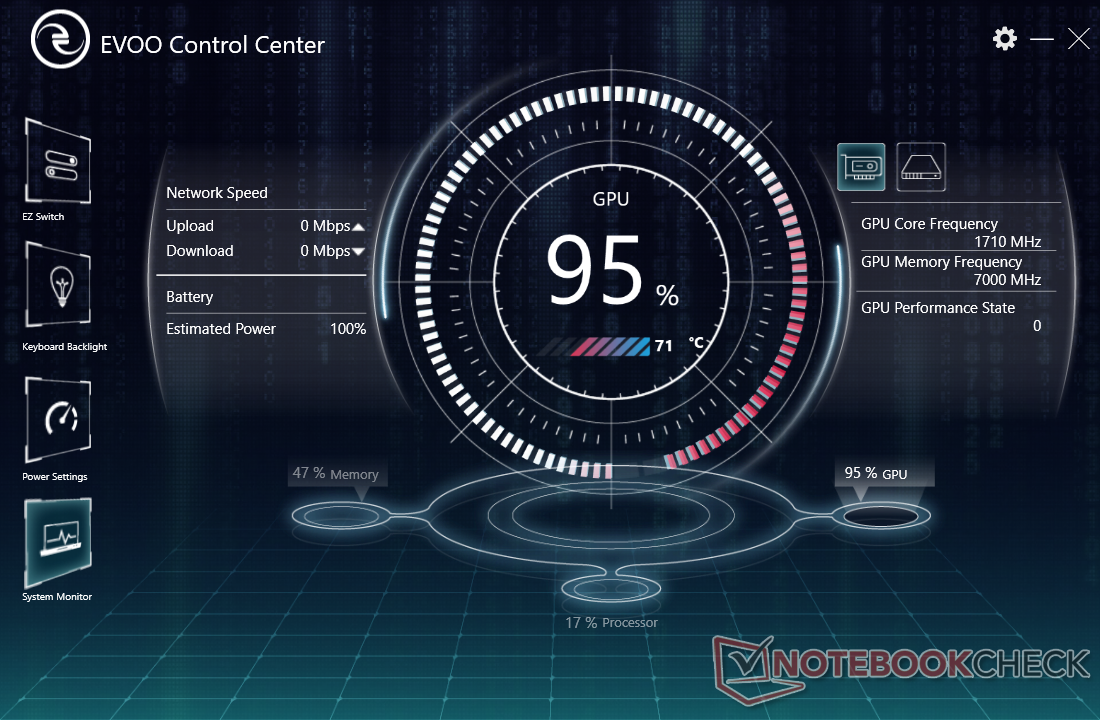
Note that the Control Center software is similar in style to the recently reviewed Maingear Vector 15 since Tongfang designed both of these models.
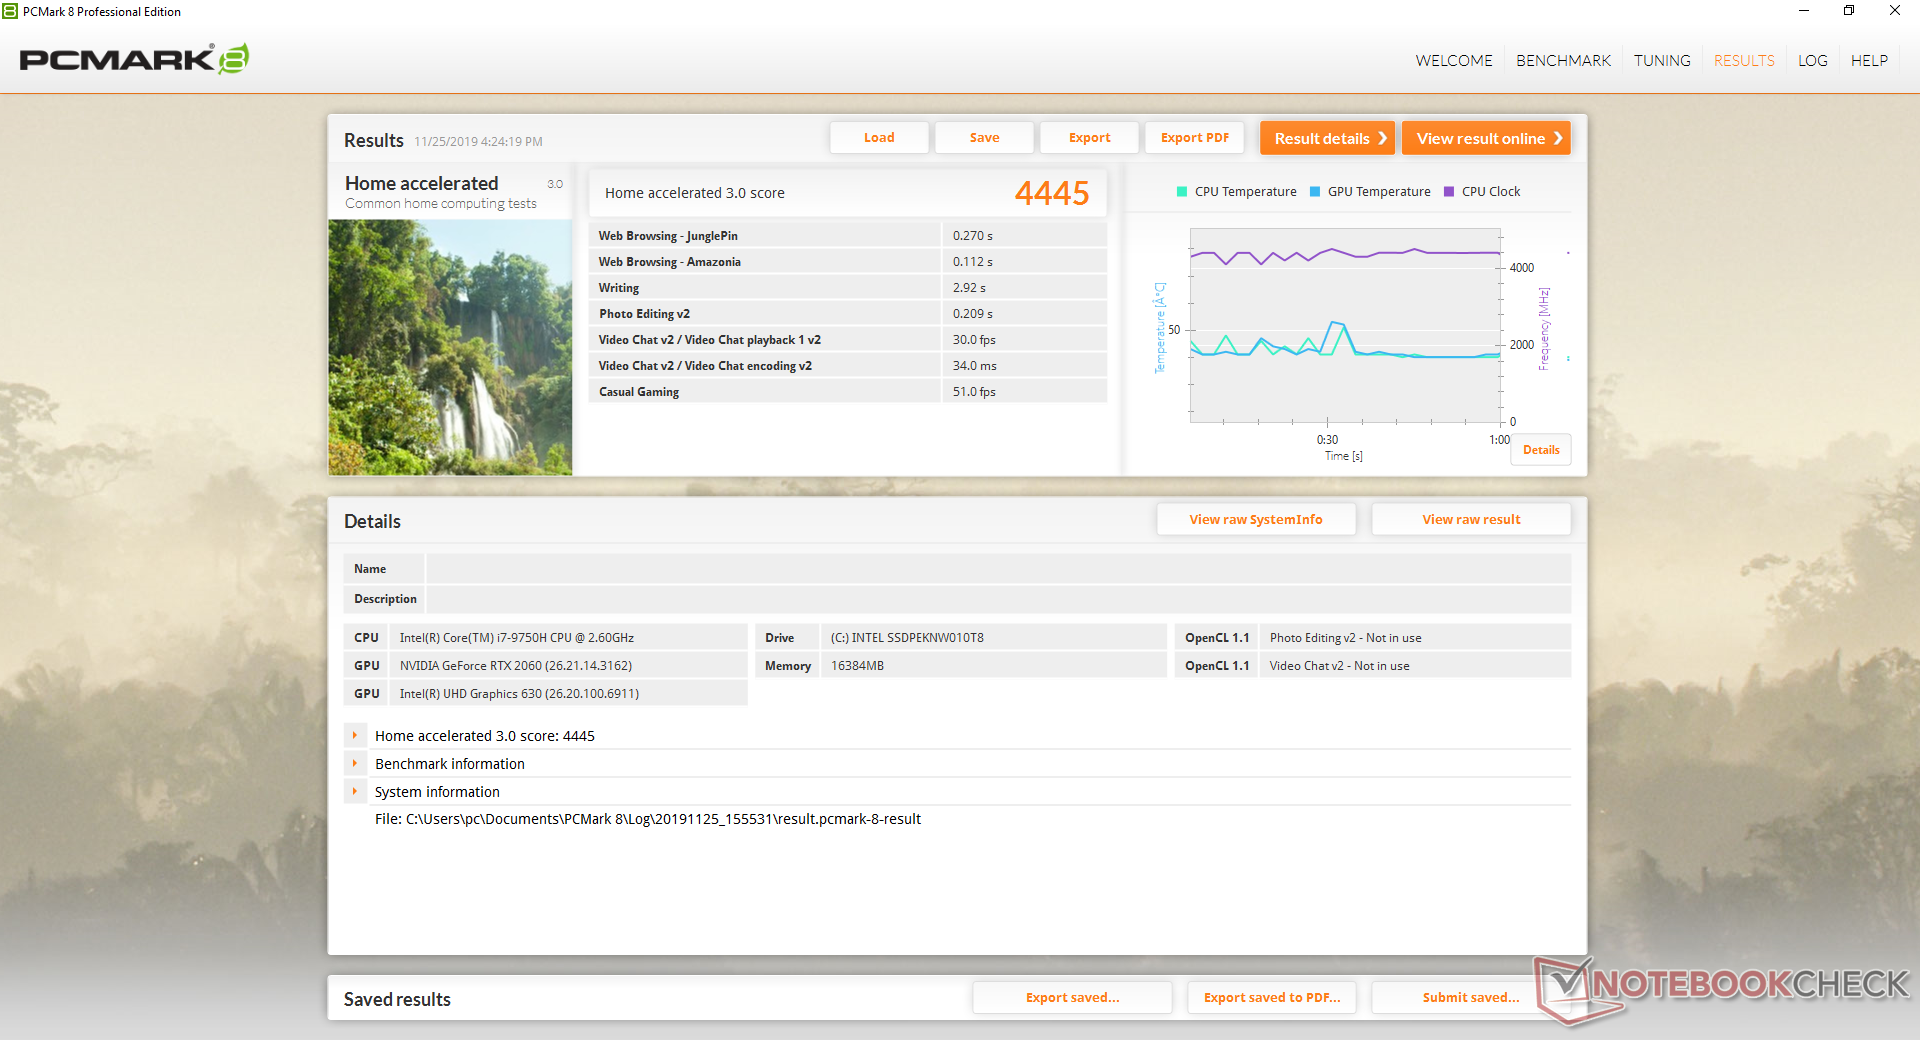
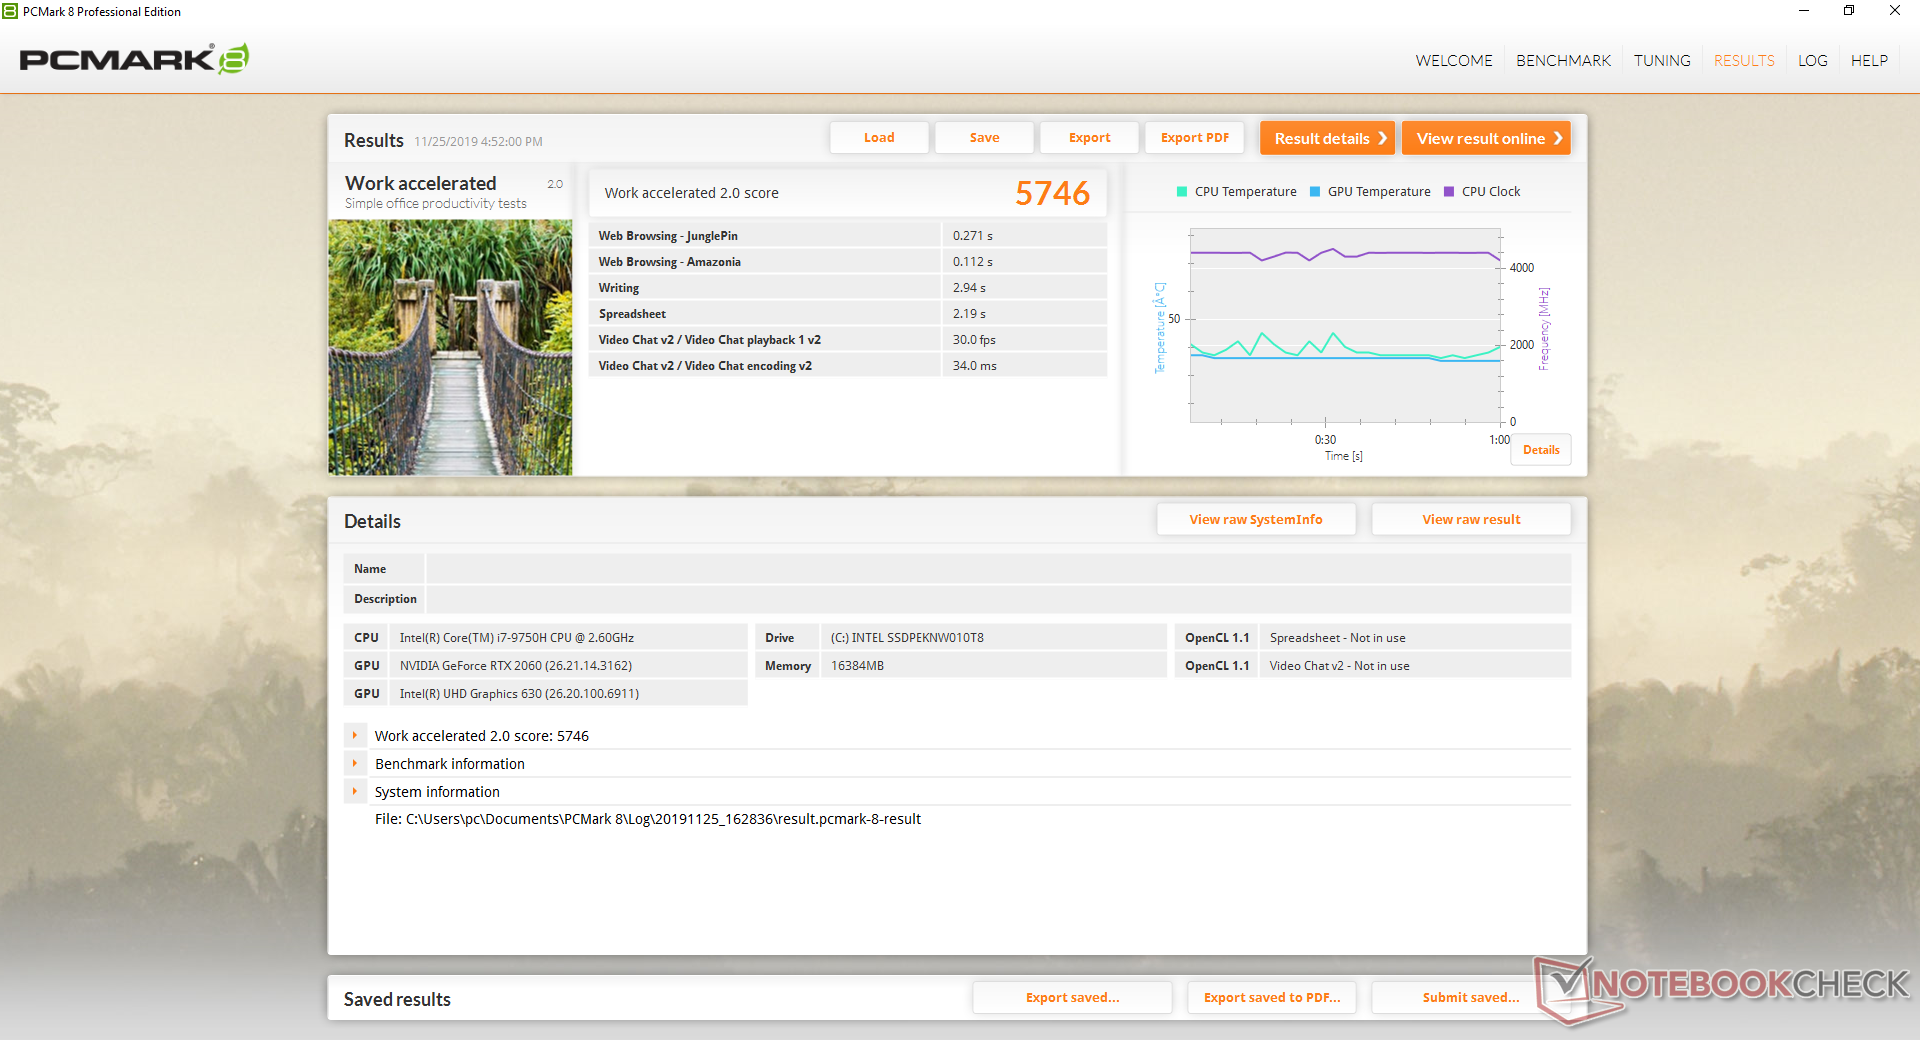
| PCMark 8 Home Score Accelerated v2 | 4445 points | |
| PCMark 8 Work Score Accelerated v2 | 5746 points | |
| PCMark 10 Score | 5797 points | |
Help | ||
Storage Devices
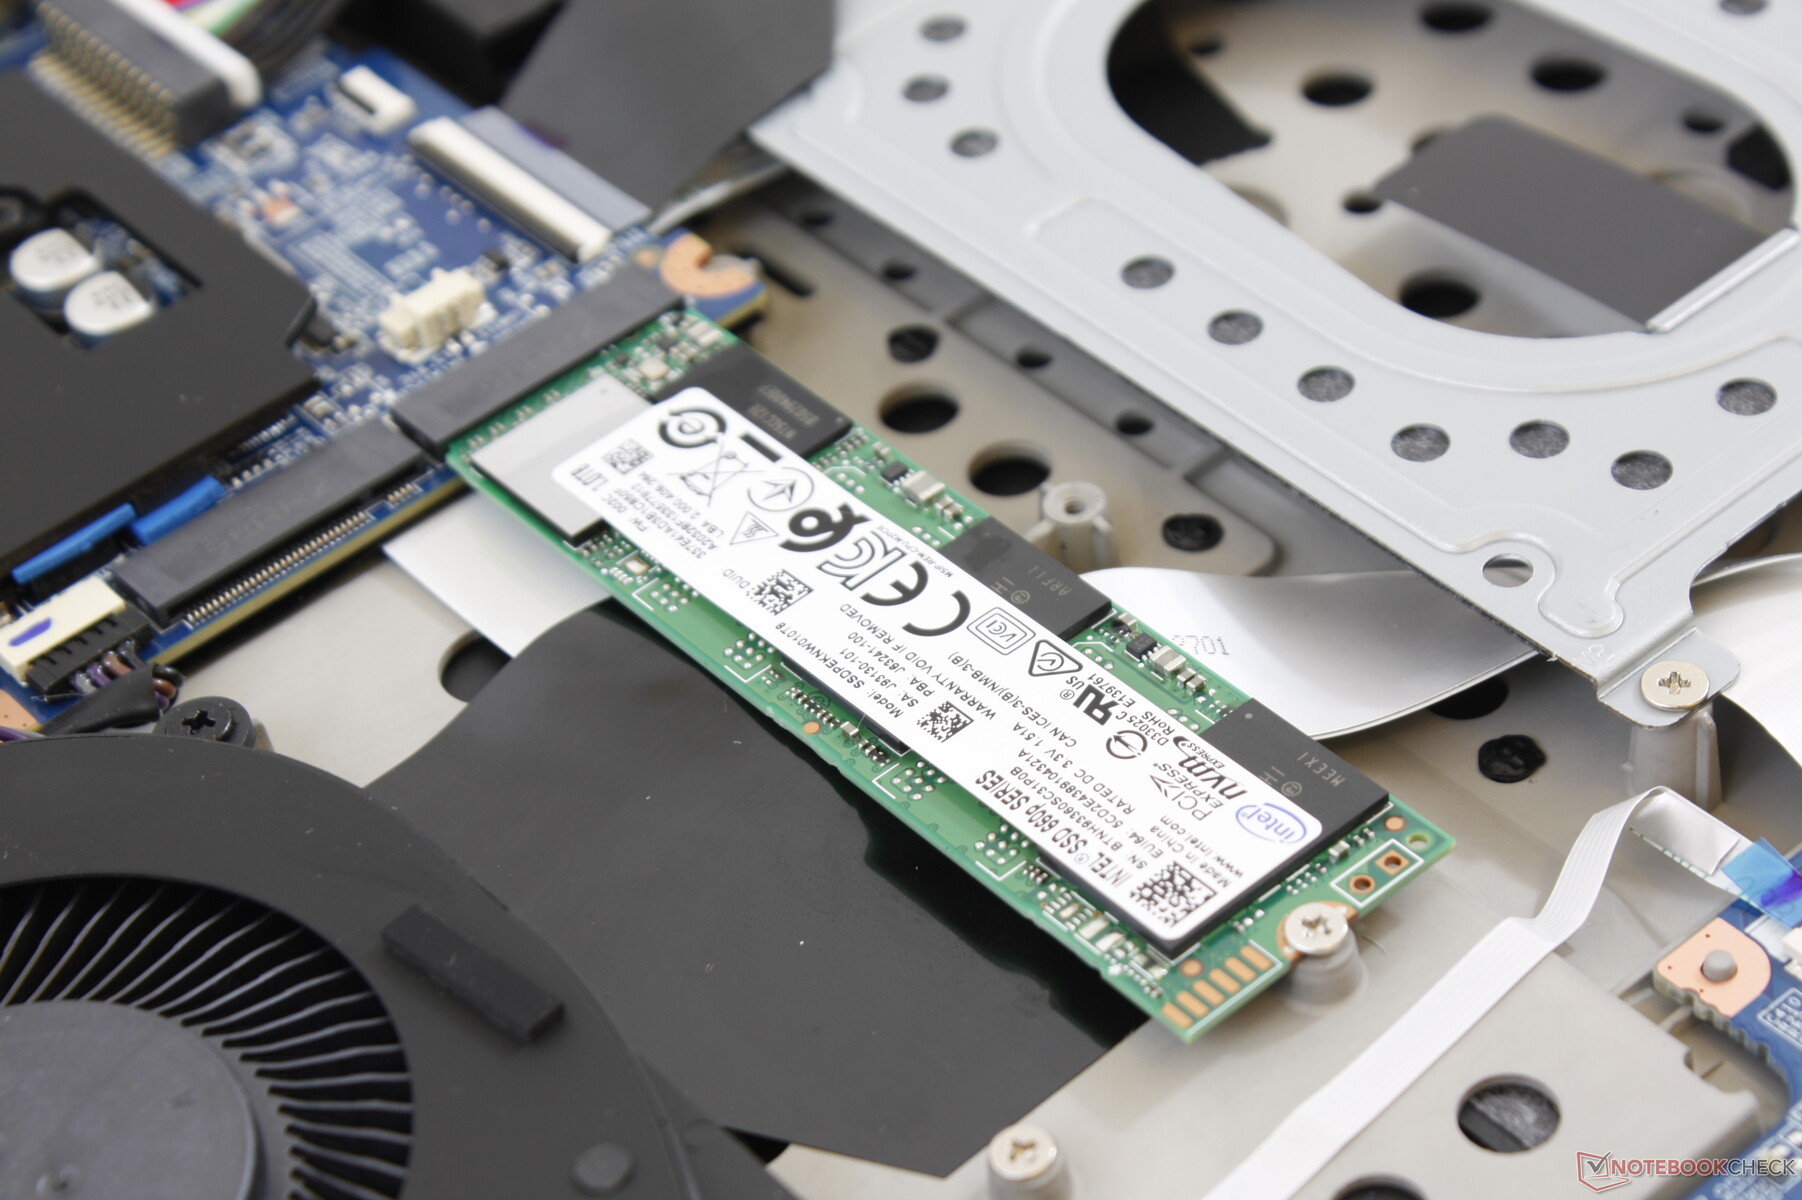
Walmart uses the slower Intel SSD 660p instead of the faster Samsung SSD 970 EVO Plus as found on our Schenker equivalent likely to save on costs. A total of three storage bays are available for expansion.
| Walmart EVOO Gaming 17 Intel SSD 660p 1TB SSDPEKNW010T8 | Schenker XMG Neo 17 Samsung SSD 970 EVO Plus 1TB | Alienware m17 P37E SK Hynix PC401 512GB M.2 (HFS512GD9TNG) | Lenovo Legion Y740-17IRH WDC PC SN520 SDAPMUW-128G | Razer Blade Pro 17 RTX 2060 Samsung SSD PM981 MZVLB512HAJQ | MSI GS75 Stealth 9SG 2x Samsung SSD PM981 MZVLB1T0HALR (RAID 0) | |
|---|---|---|---|---|---|---|
| AS SSD | 98% | -1% | -51% | 47% | 55% | |
| Seq Read (MB/s) | 1038 | 2359 127% | 1835 77% | 1339 29% | 1810 74% | 2855 175% |
| Seq Write (MB/s) | 1604 | 2469 54% | 1121 -30% | 688 -57% | 1797 12% | 2687 68% |
| 4K Read (MB/s) | 42.9 | 53.5 25% | 23.98 -44% | 23.23 -46% | 48.43 13% | 30.31 -29% |
| 4K Write (MB/s) | 107.4 | 117.6 9% | 100 -7% | 98.8 -8% | 106 -1% | 96.3 -10% |
| 4K-64 Read (MB/s) | 583 | 1579 171% | 687 18% | 300.9 -48% | 1156 98% | 1460 150% |
| 4K-64 Write (MB/s) | 725 | 2048 182% | 776 7% | 204.6 -72% | 1748 141% | 1224 69% |
| Access Time Read * (ms) | 0.045 | 0.048 -7% | 0.047 -4% | 0.184 -309% | 0.057 -27% | 0.054 -20% |
| Access Time Write * (ms) | 0.127 | 0.03 76% | 0.053 58% | 0.037 71% | 0.035 72% | 0.038 70% |
| Score Read (Points) | 730 | 1869 156% | 895 23% | 458 -37% | 1385 90% | 1776 143% |
| Score Write (Points) | 992 | 2413 143% | 988 0% | 372 -62% | 2033 105% | 1589 60% |
| Score Total (Points) | 2137 | 5248 146% | 2306 8% | 1038 -51% | 4135 93% | 4259 99% |
| Copy ISO MB/s (MB/s) | 1612 | 773 -52% | 988 -39% | 1984 23% | 2226 38% | |
| Copy Program MB/s (MB/s) | 564 | 493 -13% | 327.2 -42% | 588 4% | 426.4 -24% | |
| Copy Game MB/s (MB/s) | 1328 | 647 -51% | 758 -43% | 835 -37% | 1152 -13% |
* ... smaller is better

GPU Performance
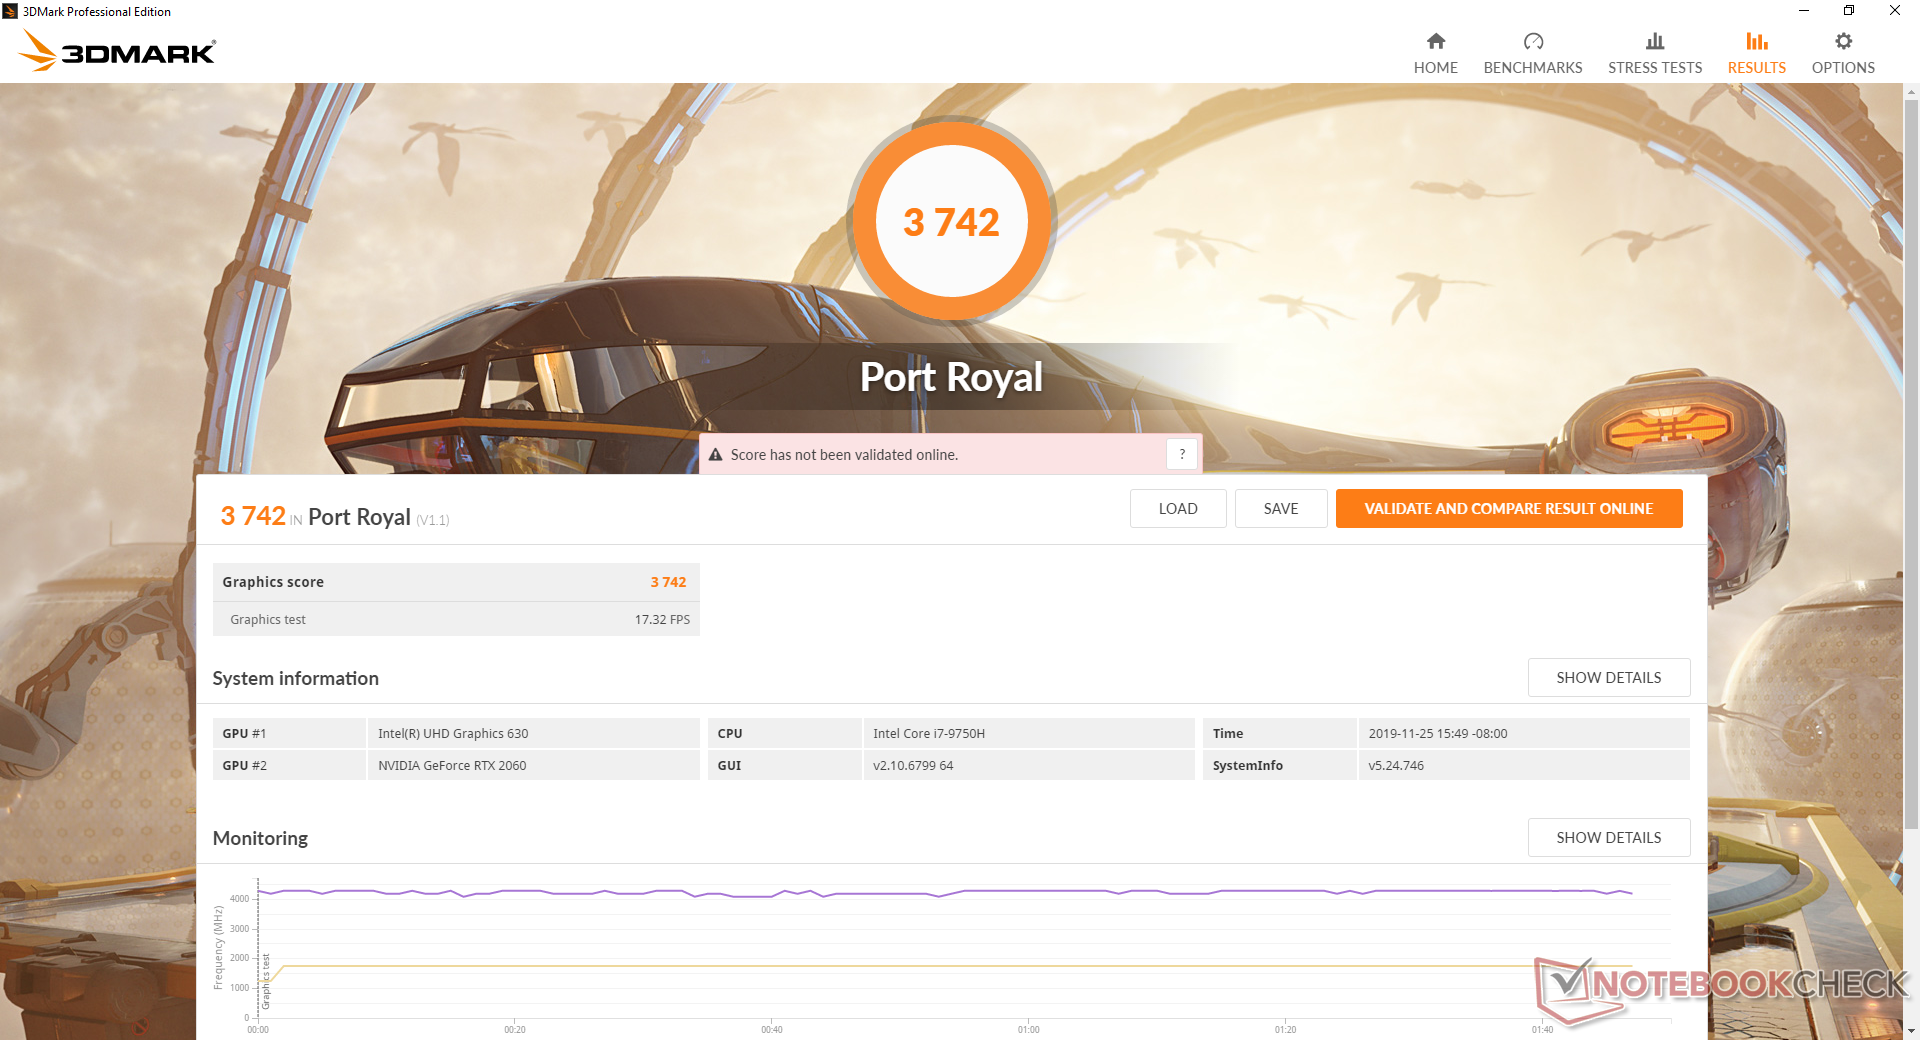
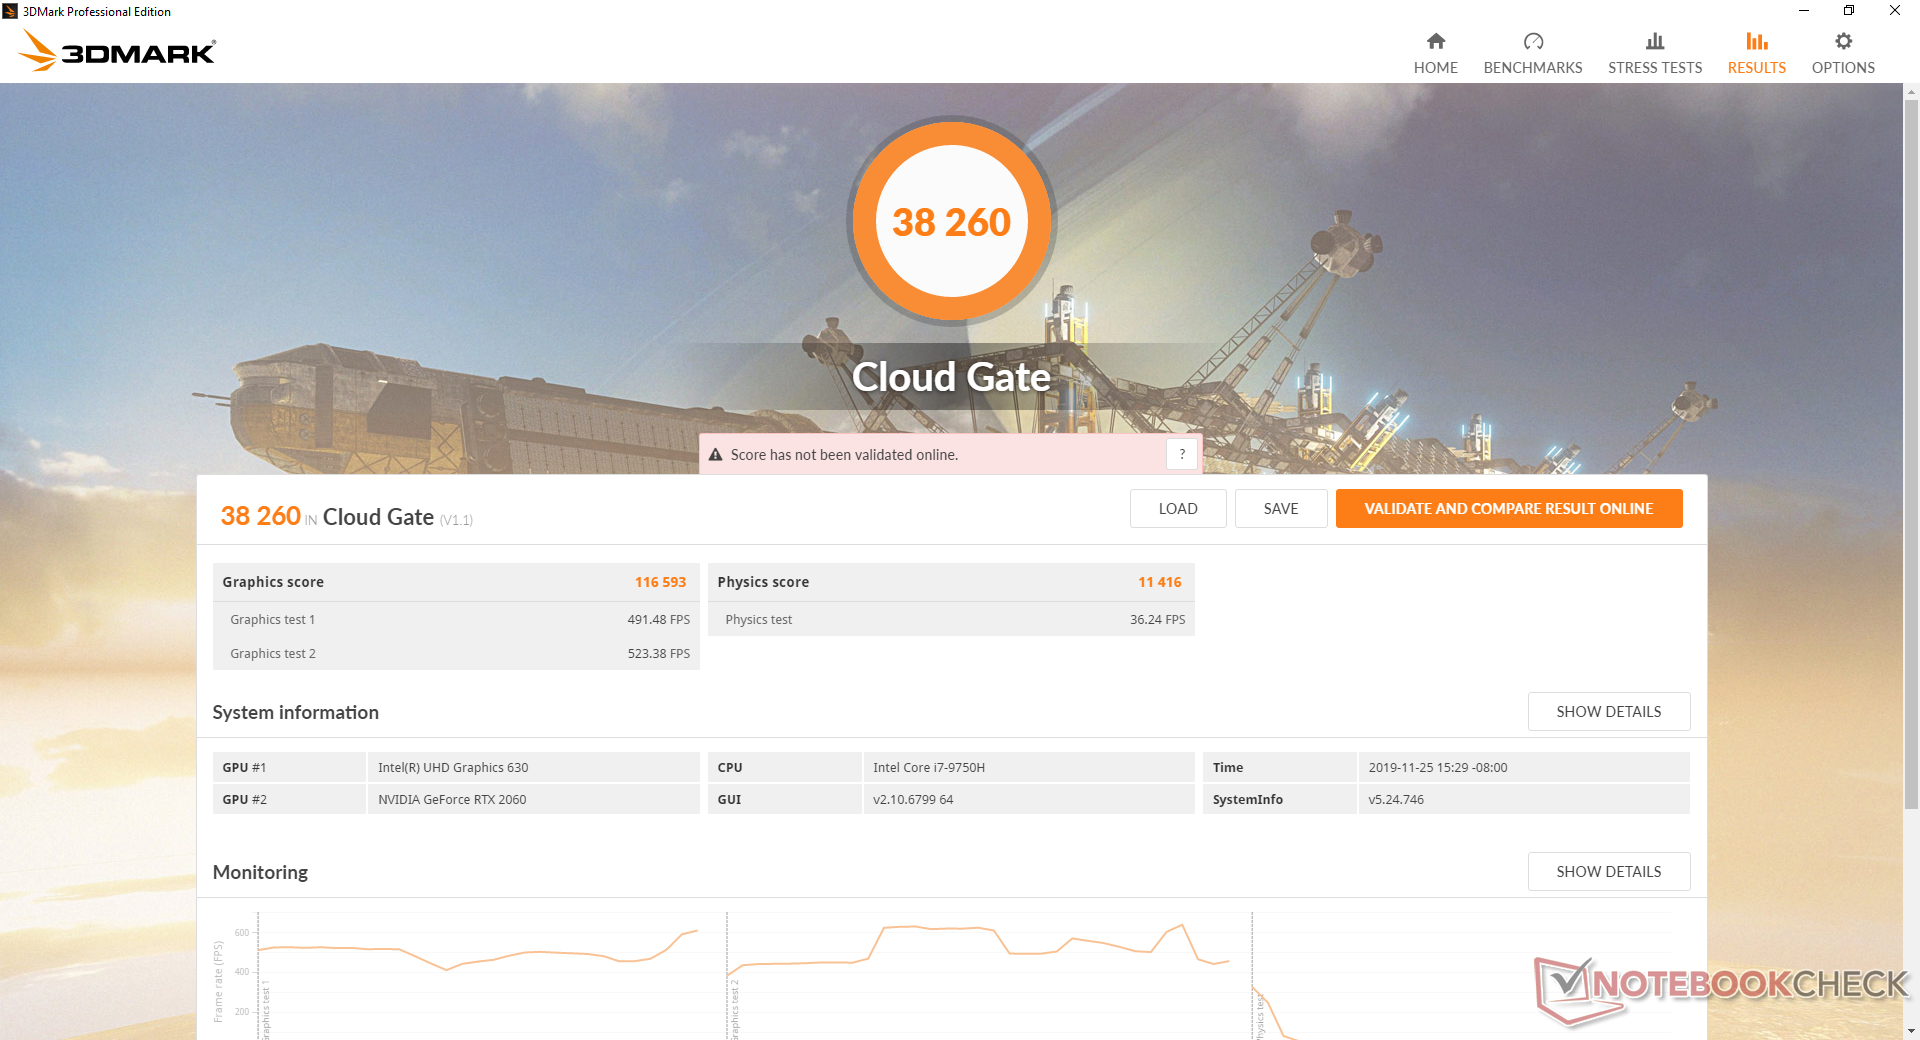
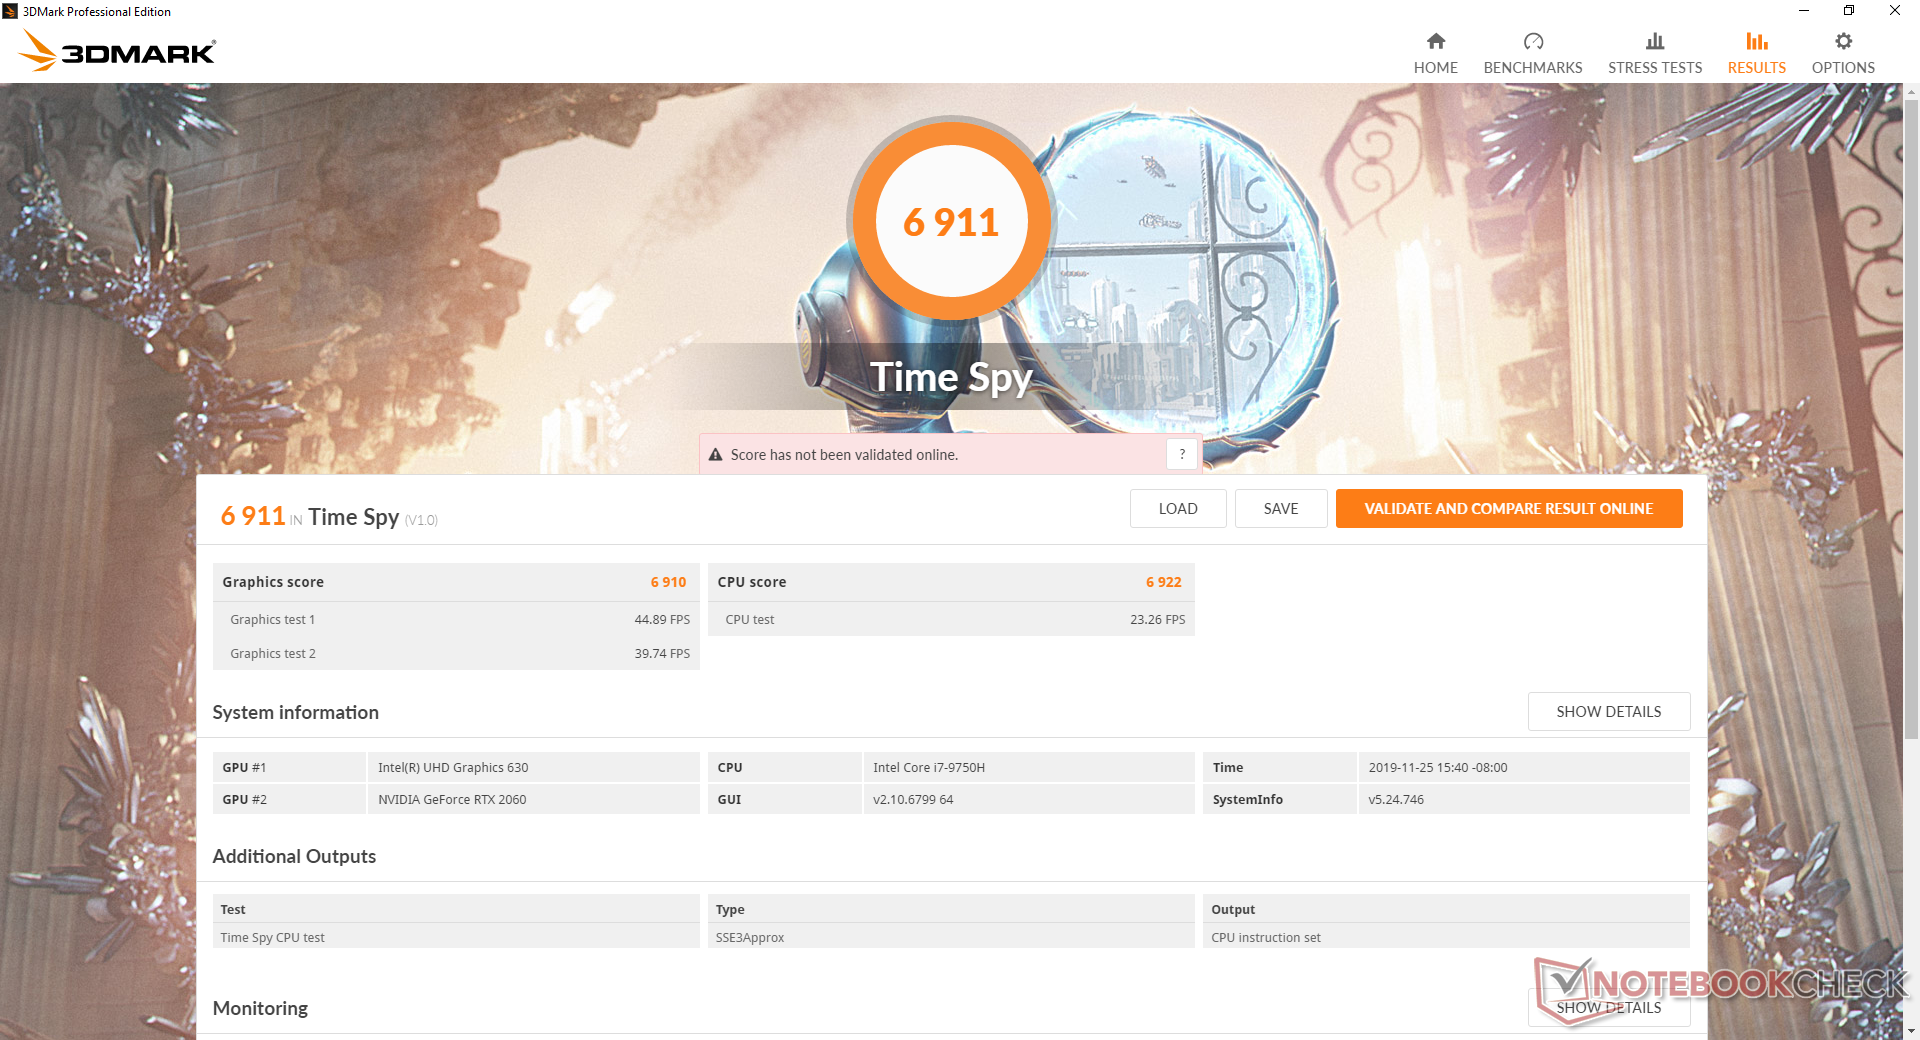
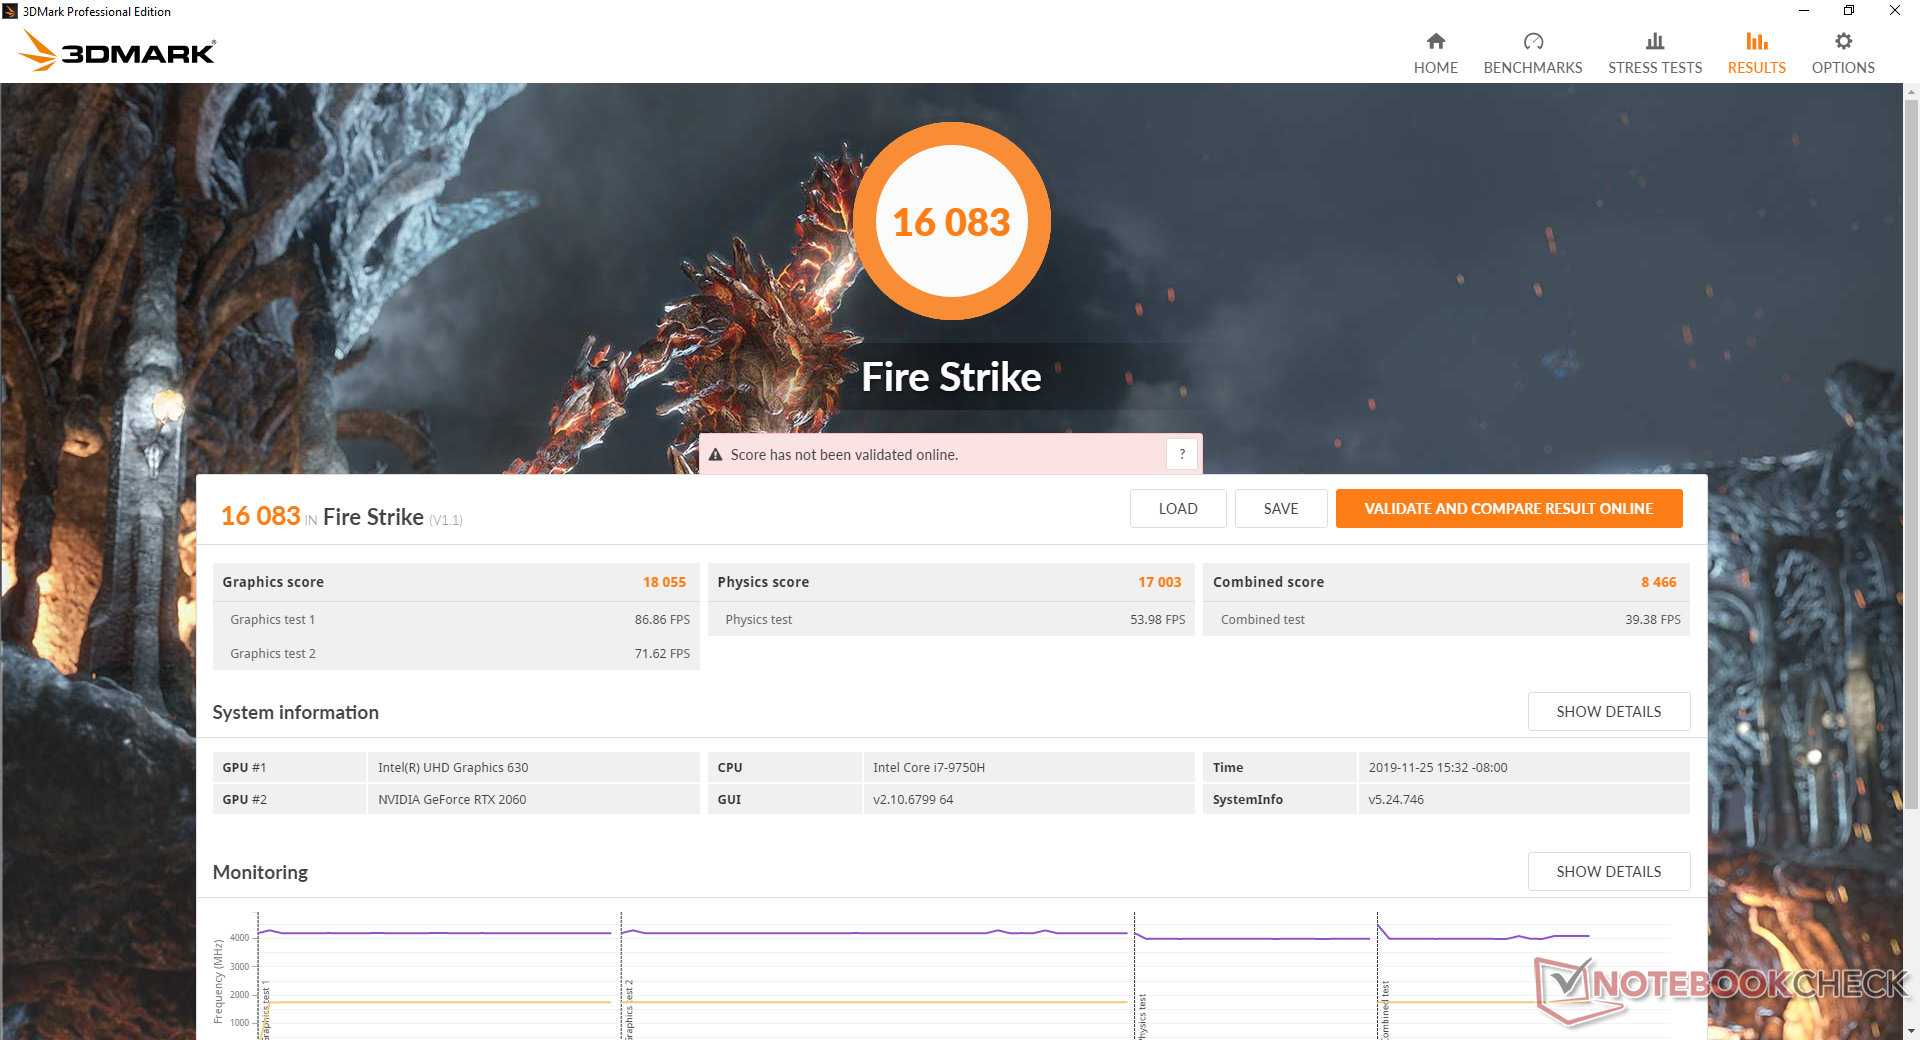
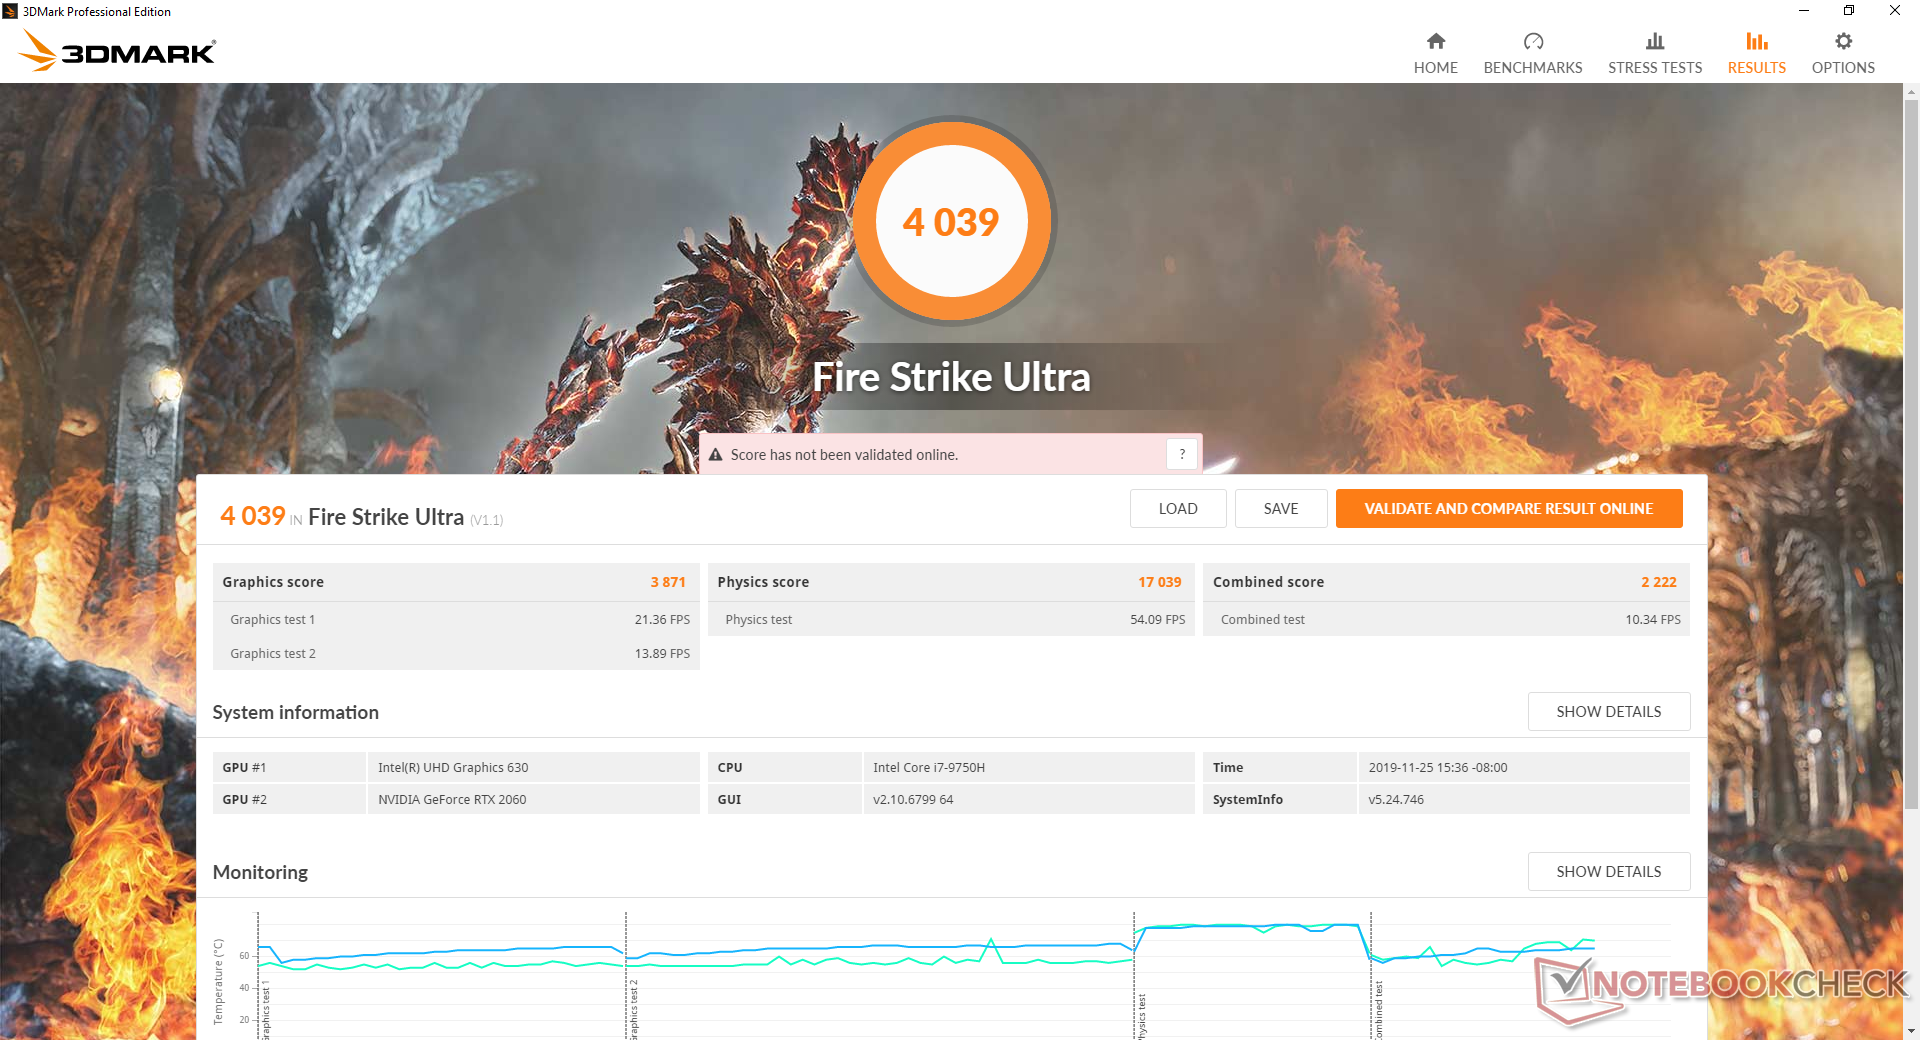
3DMark results are about 13 percent faster than the average mobile RTX 2060 in our database to be nearly the same as the RTX 2070 Max-Q. Moving up to a desktop RTX 2060 will bring roughly 7 to 12 percent more performance.
See our dedicated page on the mobile GeForce RTX 2060 for more technical information and benchmark comparisons.
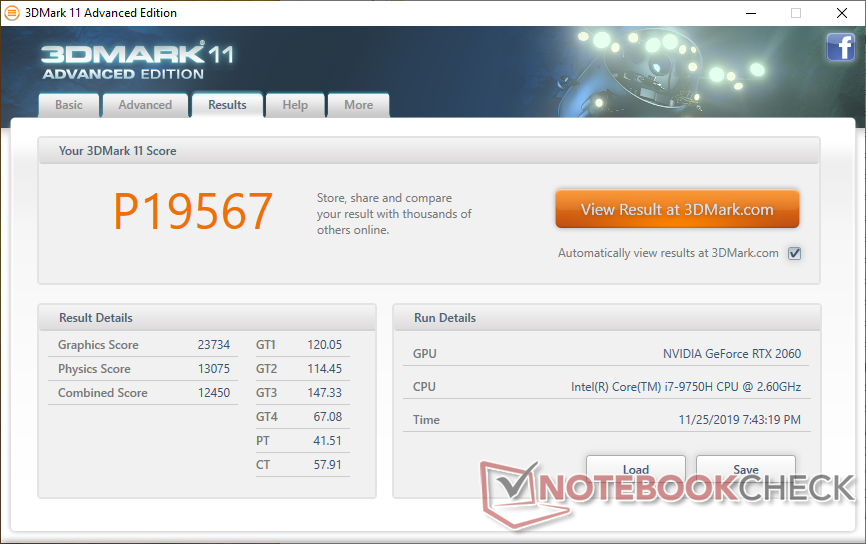
| 3DMark 11 Performance | 19567 points | |
| 3DMark Cloud Gate Standard Score | 38260 points | |
| 3DMark Fire Strike Score | 16083 points | |
| 3DMark Time Spy Score | 6911 points | |
Help | ||
| low | med. | high | ultra | |
|---|---|---|---|---|
| BioShock Infinite (2013) | 322.5 | 285 | 265 | 156 |
| The Witcher 3 (2015) | 295.3 | 215.4 | 131 | 68.9 |
| Shadow of the Tomb Raider (2018) | 133 | 100 | 94 | 83 |
Emissions
System Noise
The fans are relatively lax and so they will not pulse often. When gaming, expect a fan noise of about 45 dB(A) up to 50 dB(A) if the system is at 100 percent utilization. Enabling Fan Boost will raise the ceiling to 54 dB(A).
We can notice slight coil whining or electronic noise from our test unit.
| Walmart EVOO Gaming 17 GeForce RTX 2060 Mobile, i7-9750H, Intel SSD 660p 1TB SSDPEKNW010T8 | Schenker XMG Neo 17 XNE17M19 GeForce RTX 2060 Mobile, i7-9750H, Samsung SSD 970 EVO Plus 500GB | Alienware m17 P37E GeForce RTX 2080 Max-Q, i9-8950HK, SK Hynix PC401 512GB M.2 (HFS512GD9TNG) | Lenovo Legion Y740-17IRH GeForce RTX 2060 Mobile, i7-9750H, WDC PC SN520 SDAPMUW-128G | Razer Blade Pro 17 RTX 2060 GeForce RTX 2060 Mobile, i7-9750H, Samsung SSD PM981 MZVLB512HAJQ | MSI GS75 Stealth 9SG GeForce RTX 2080 Max-Q, i7-9750H, 2x Samsung SSD PM981 MZVLB1T0HALR (RAID 0) | |
|---|---|---|---|---|---|---|
| Noise | -11% | -10% | -15% | -5% | -15% | |
| off / environment * (dB) | 28.7 | 31 -8% | 28.2 2% | 30 -5% | 28.2 2% | 30 -5% |
| Idle Minimum * (dB) | 28.7 | 31 -8% | 28.2 2% | 33 -15% | 28.2 2% | 31 -8% |
| Idle Average * (dB) | 28.7 | 33 -15% | 28.2 2% | 34 -18% | 28.2 2% | 32 -11% |
| Idle Maximum * (dB) | 29.5 | 35 -19% | 31 -5% | 35 -19% | 28.2 4% | 38 -29% |
| Load Average * (dB) | 31.4 | 43 -37% | 50.8 -62% | 48 -53% | 43 -37% | 47 -50% |
| Witcher 3 ultra * (dB) | 44.5 | 45 -1% | 50.8 -14% | 46 -3% | 48.4 -9% | 48 -8% |
| Load Maximum * (dB) | 54 | 47 13% | 50.8 6% | 49 9% | 53.4 1% | 49 9% |
* ... smaller is better
Noise level
| Idle |
| 28.7 / 28.7 / 29.5 dB(A) |
| Load |
| 31.4 / 54 dB(A) |
 | ||
30 dB silent 40 dB(A) audible 50 dB(A) loud |
||
min: | ||
Temperature
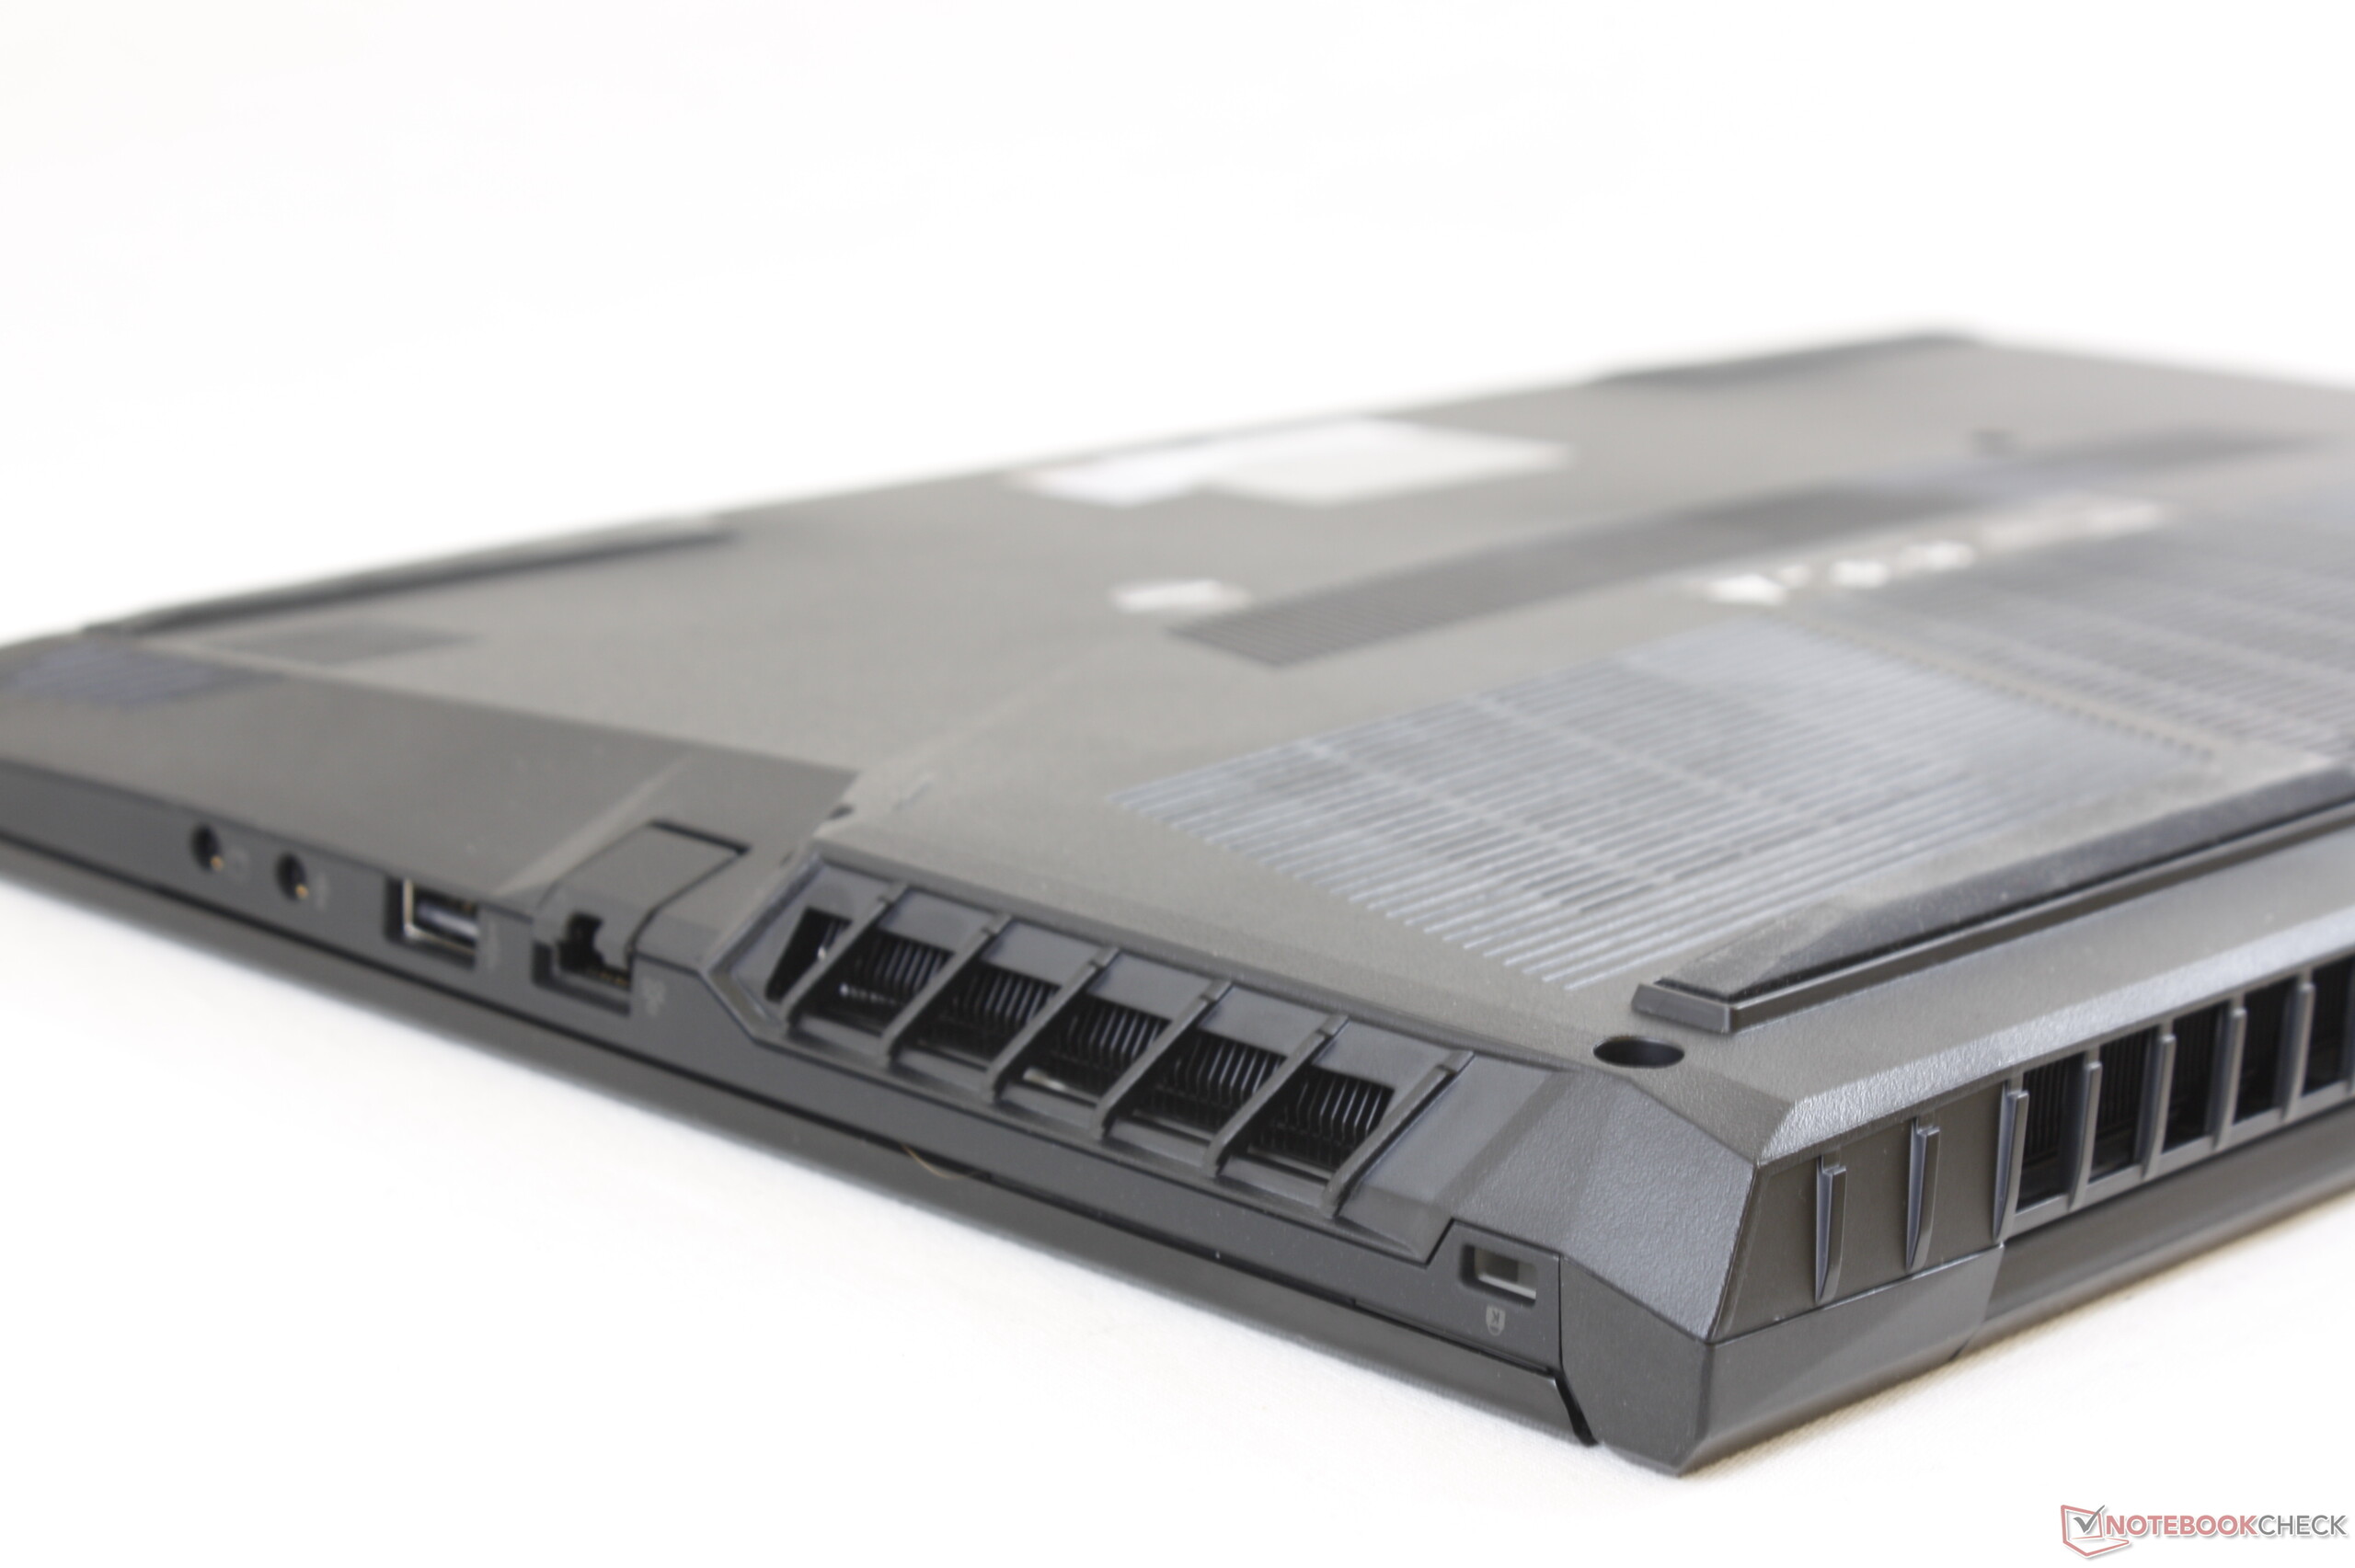
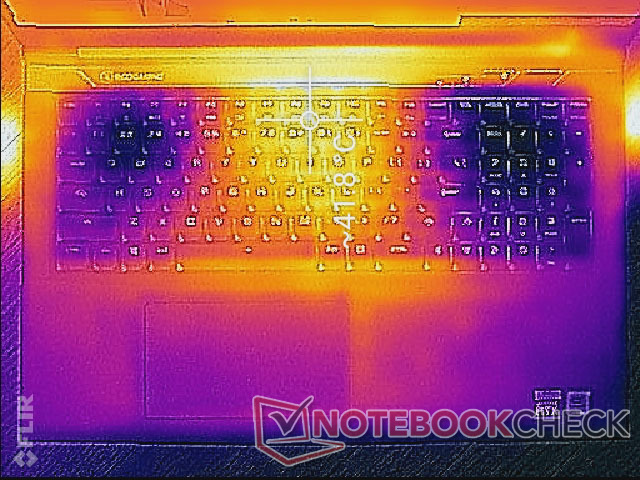
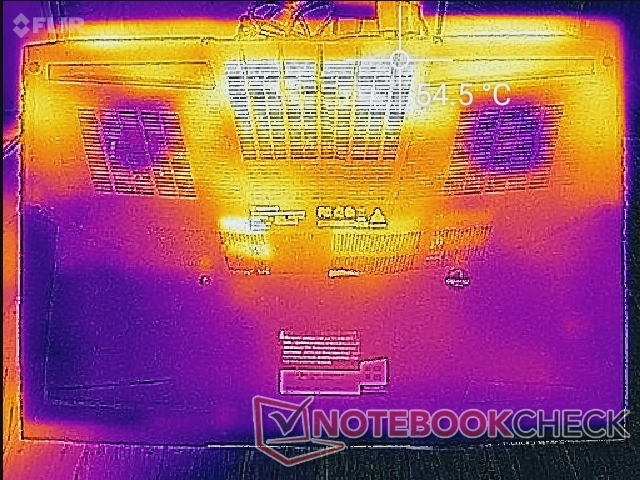
The center keyboard area can become as warm as 42 C to 48 C when under high loads like gaming. Fortunately, most other quadrants remain cool including the palm rests and sides of the keyboard since the internal dual fans pull in fresh air through the keyboard keys. Be sure not to block any of the many ventilation grilles along the bottom or sides.
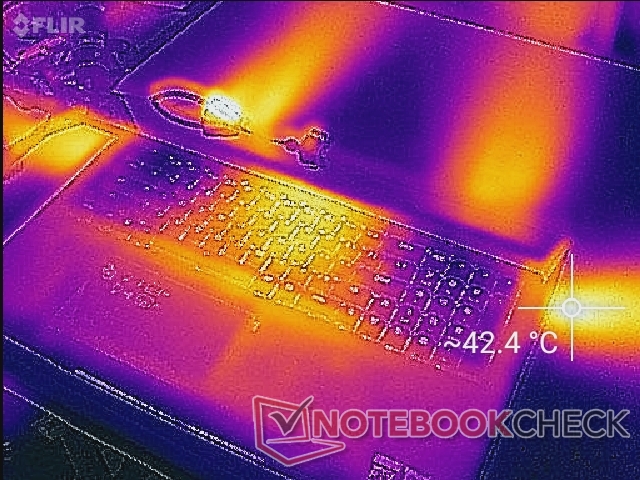
(±) The maximum temperature on the upper side is 45 °C / 113 F, compared to the average of 40.4 °C / 105 F, ranging from 21.2 to 68.8 °C for the class Gaming.
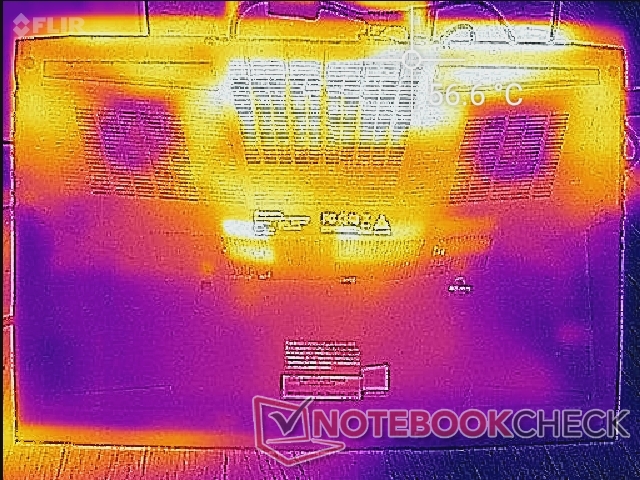
(-) The bottom heats up to a maximum of 56.8 °C / 134 F, compared to the average of 43.2 °C / 110 F
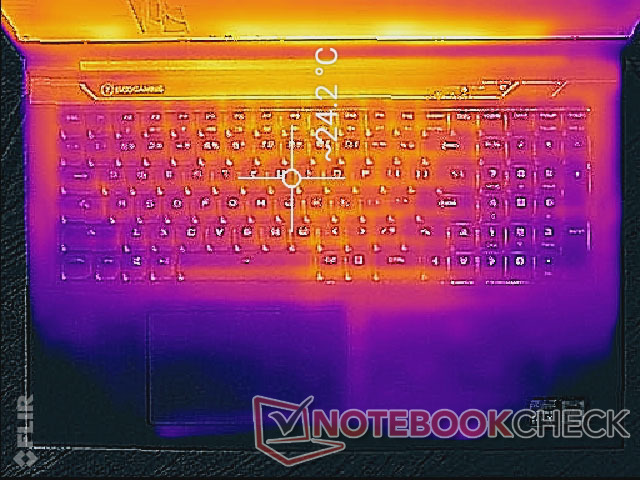
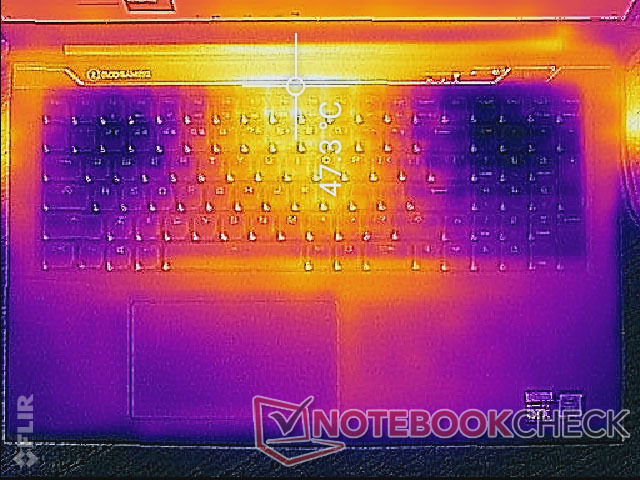
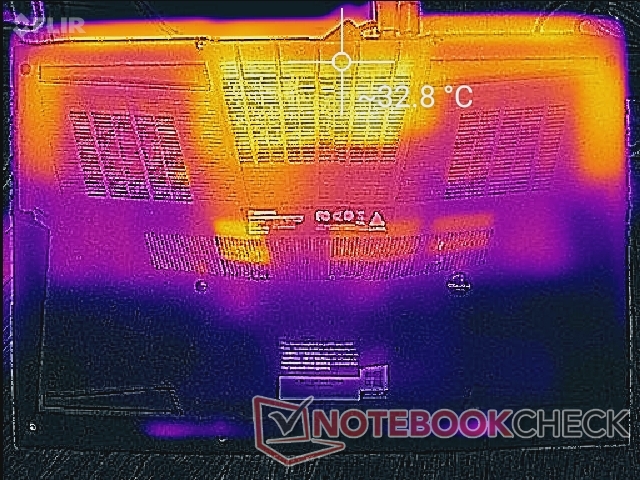
(+) In idle usage, the average temperature for the upper side is 21.1 °C / 70 F, compared to the device average of 33.9 °C / 93 F.
(+) Playing The Witcher 3, the average temperature for the upper side is 30.4 °C / 87 F, compared to the device average of 33.9 °C / 93 F.
(+) The palmrests and touchpad are cooler than skin temperature with a maximum of 26.2 °C / 79.2 F and are therefore cool to the touch.
(+) The average temperature of the palmrest area of similar devices was 28.8 °C / 83.8 F (+2.6 °C / 4.6 F).
Stress Test
Running Witcher 3 results in stable CPU and GPU temperatures of about 72 C each. When running Prime95, core clock rates spike to 4 GHz for the first couple of minutes before falling slightly to 3.8 GHz thereafter. Results are similar to what we observed when running our CineBench R15 Multi-Thread loop test above.
Running on batteries will severely limit performance even when set to High Performance. A Fire Strike test on battery power returns Physics and Graphics scores of 10849 and 1402 points, respectively, compared to 17003 and 18055 points when on mains.
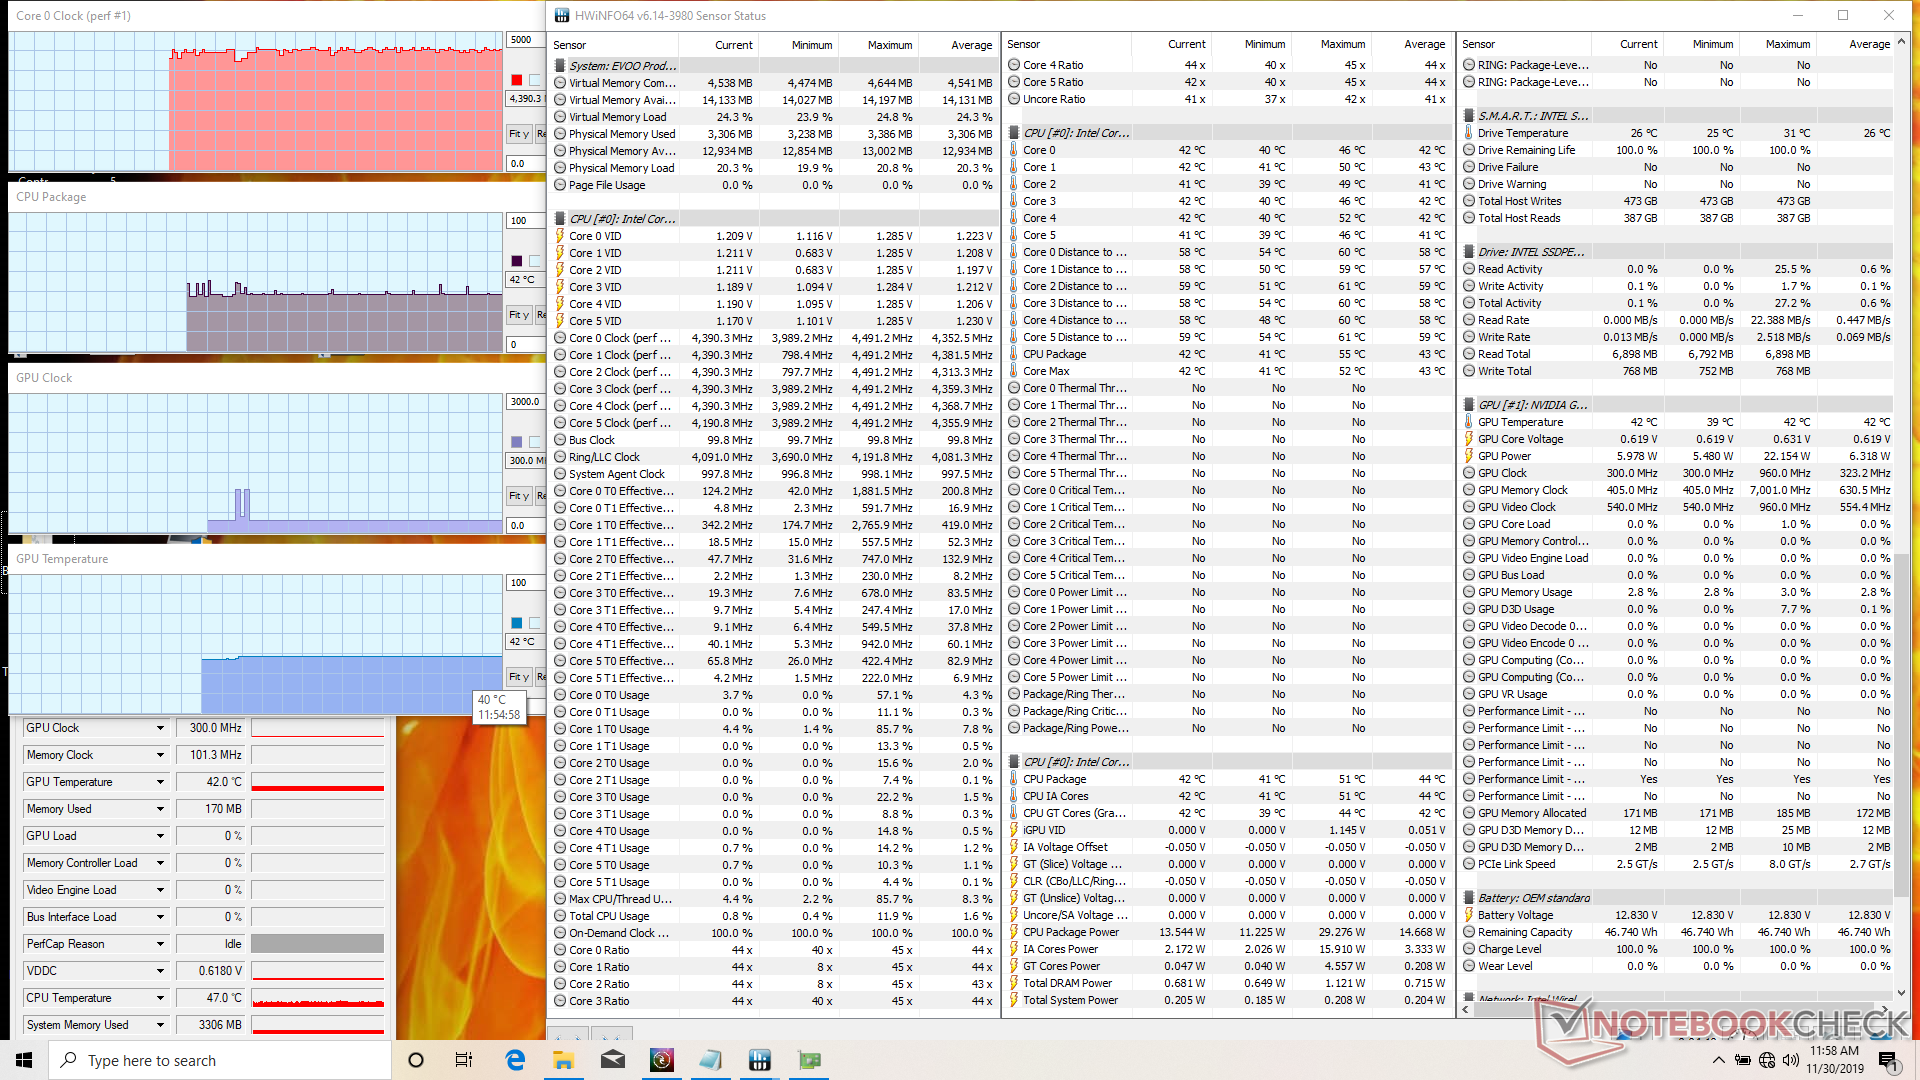
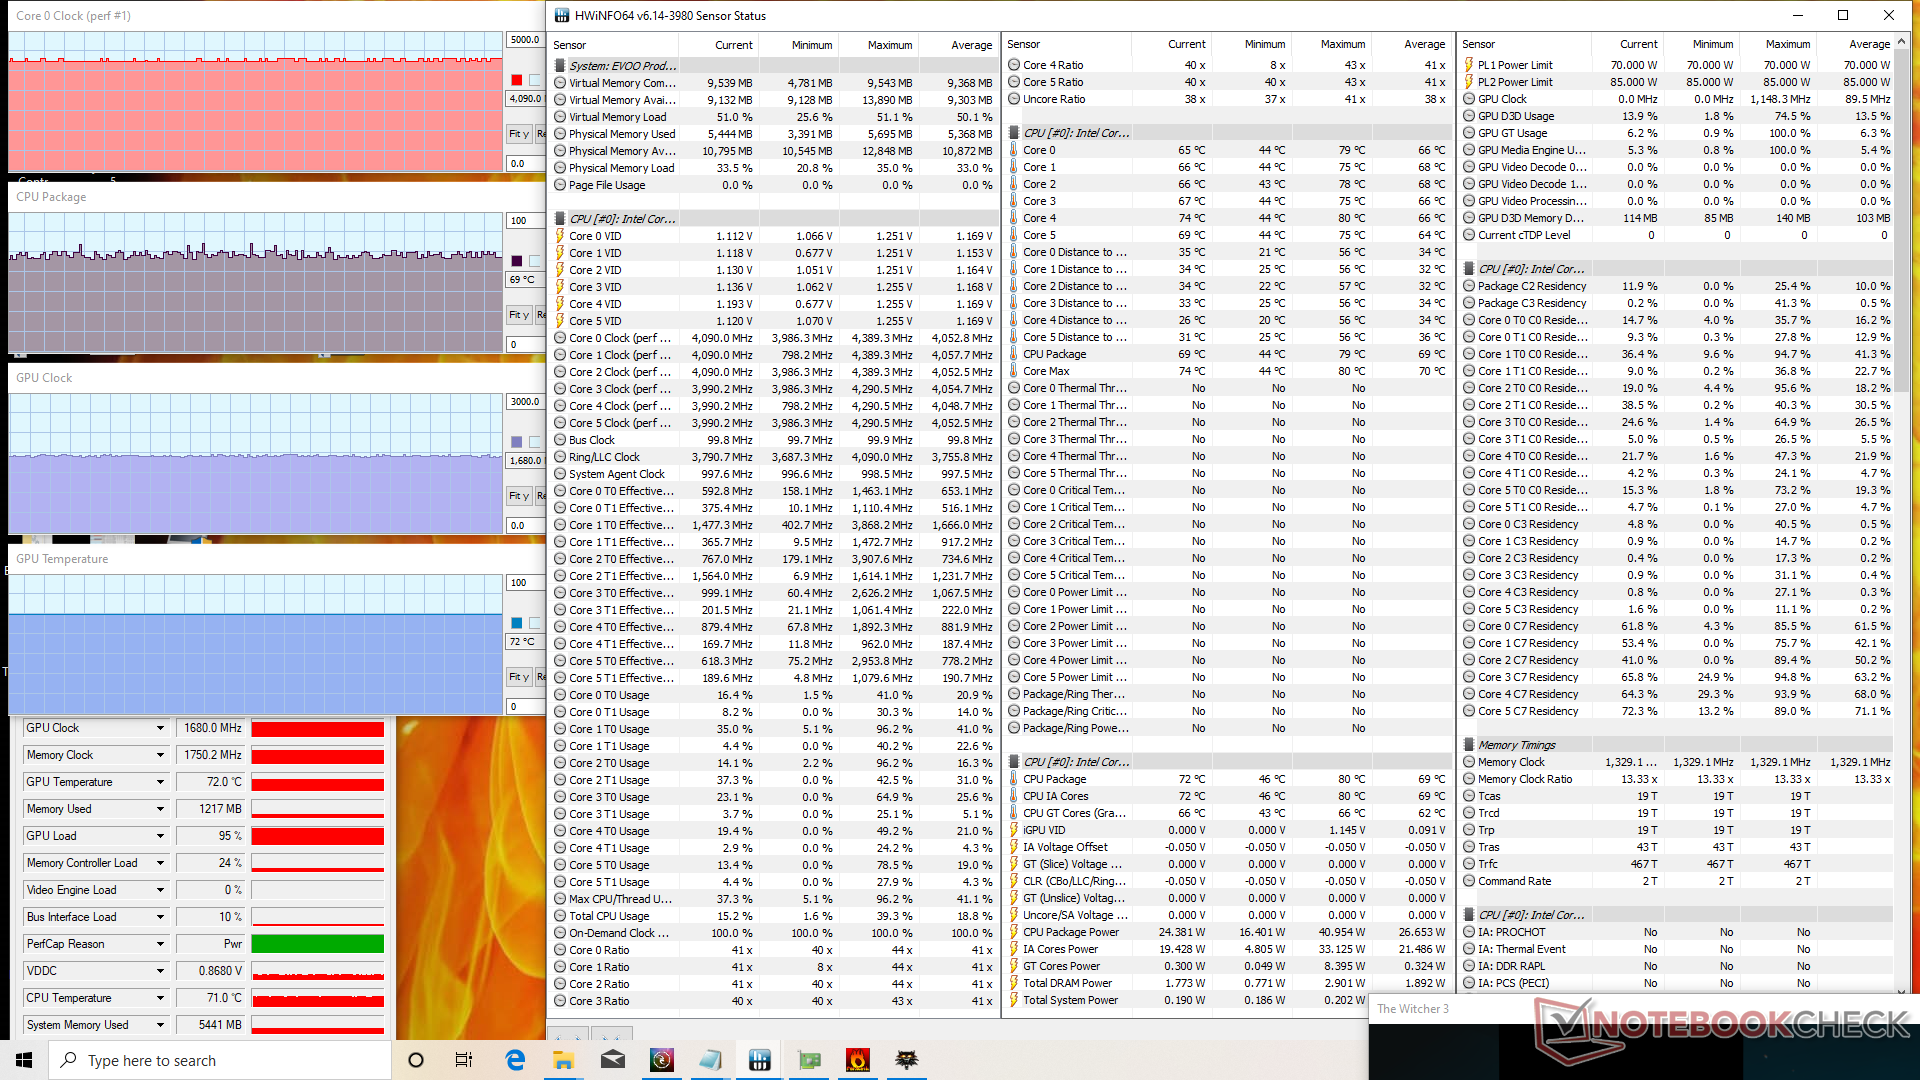
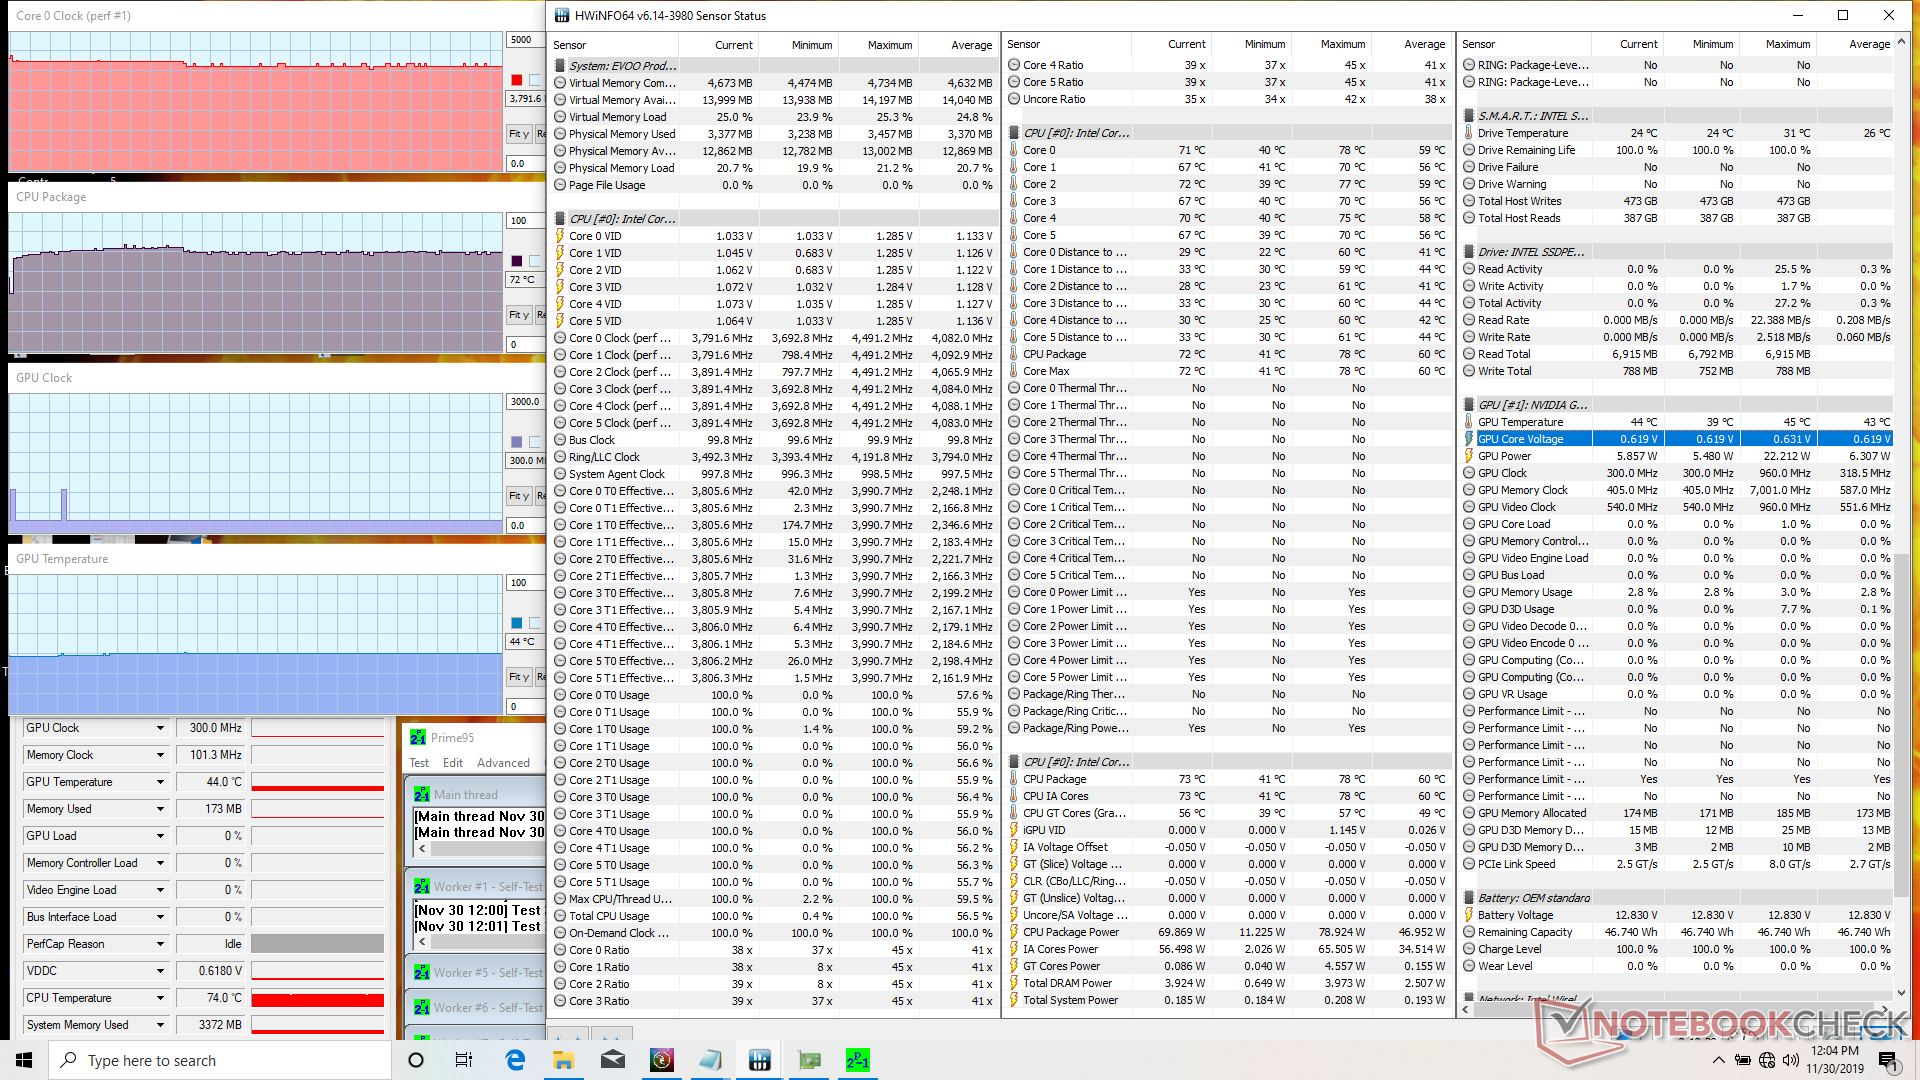
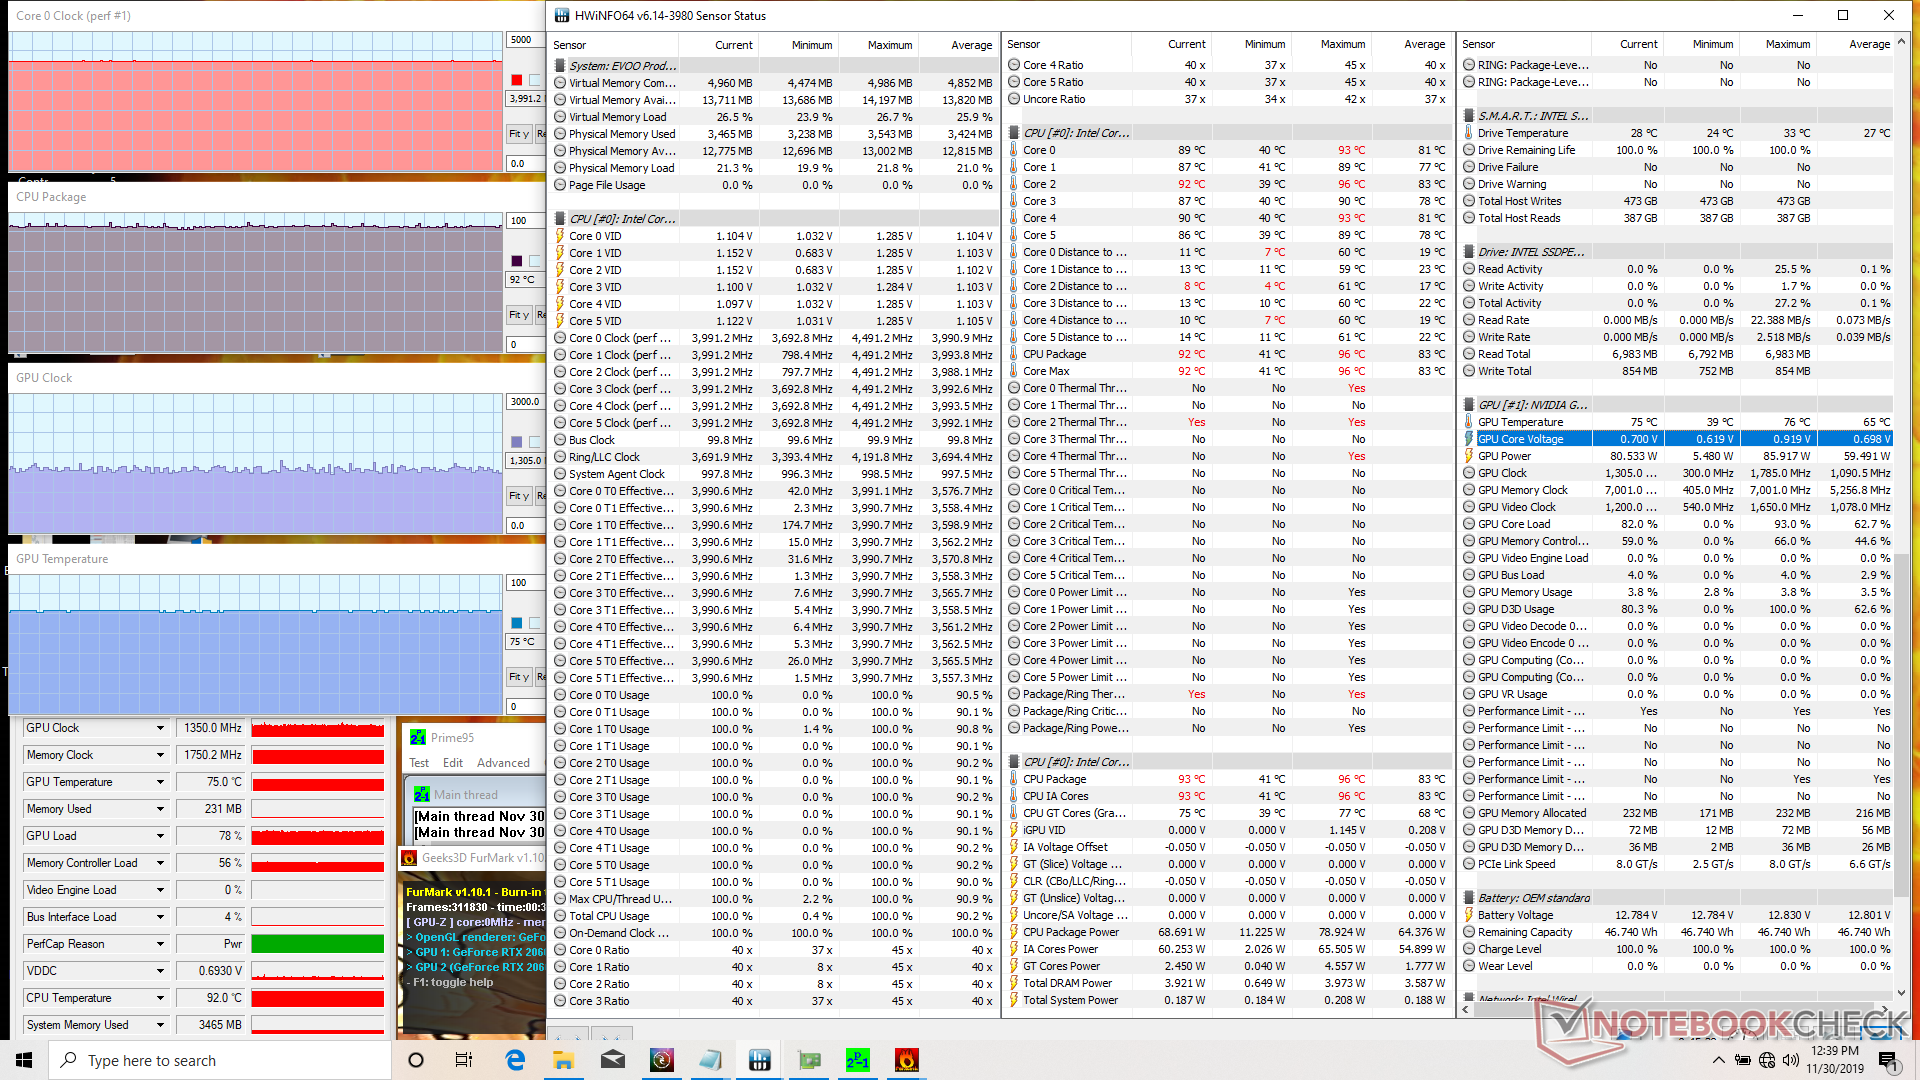
| CPU Clock (GHz) | GPU Clock (MHz) | Average CPU Temperature (°C) | Average GPU Temperature (°C) | |
| System Idle | -- | -- | 42 | 42 |
| Prime95 Stress | 3.8 - 3.9 | -- | 72 | -- |
| Prime95 + FurMark Stress | 4.0 | ~1350 | 92 | 75 |
| Witcher 3 Stress | 4.0 - 4.1 | 1680 | ~70 | 72 |
Speakers

Energy Management
Power Consumption
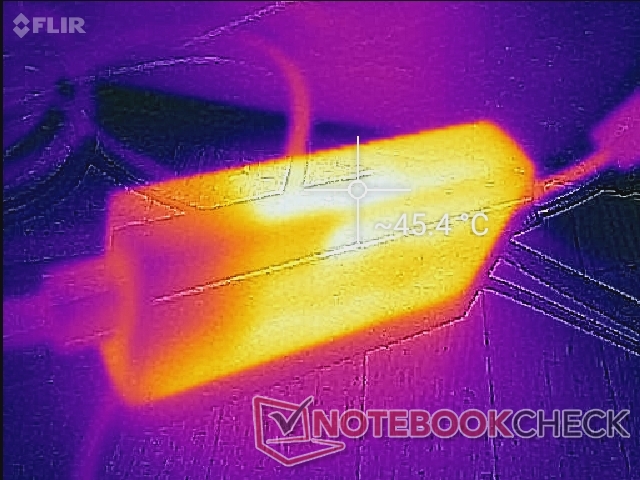
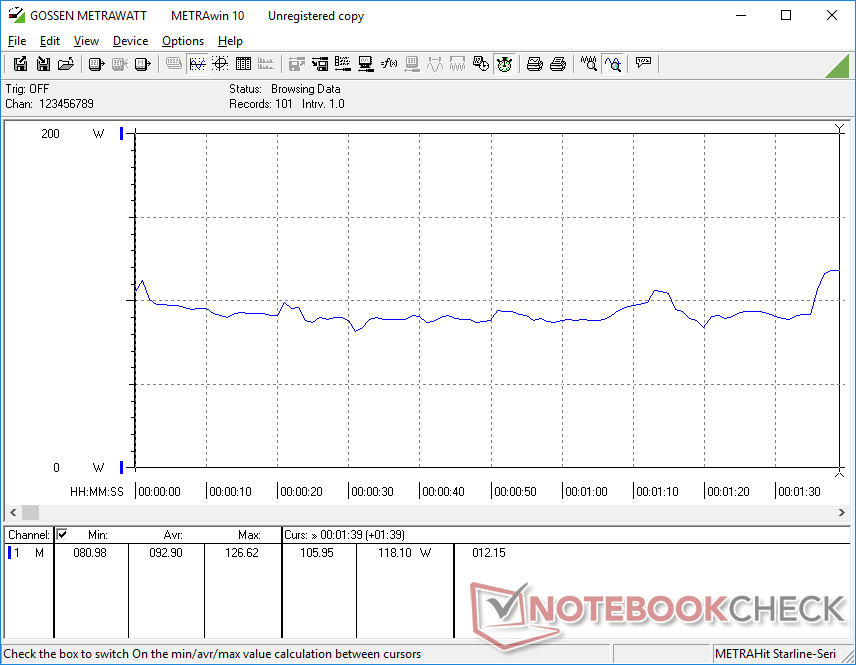
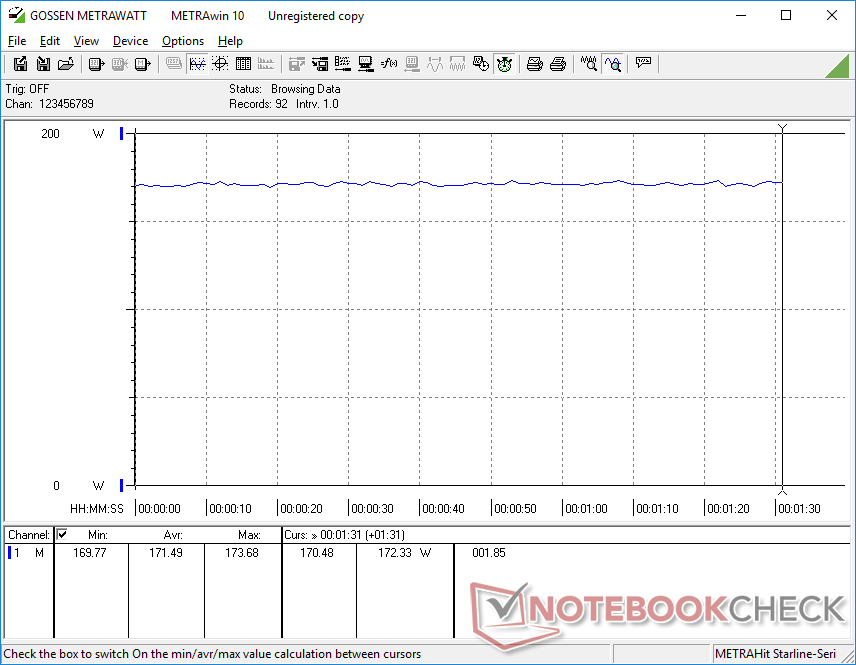
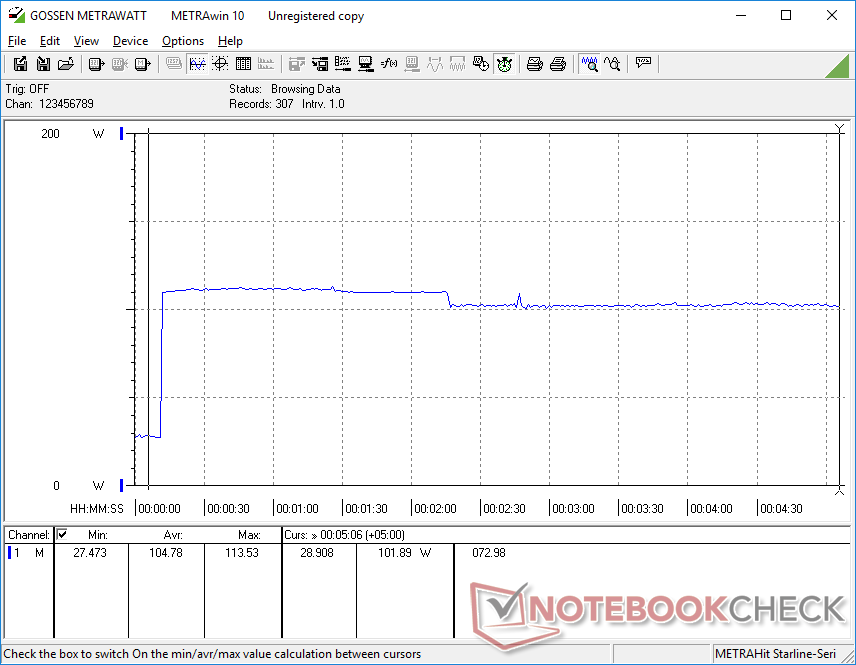
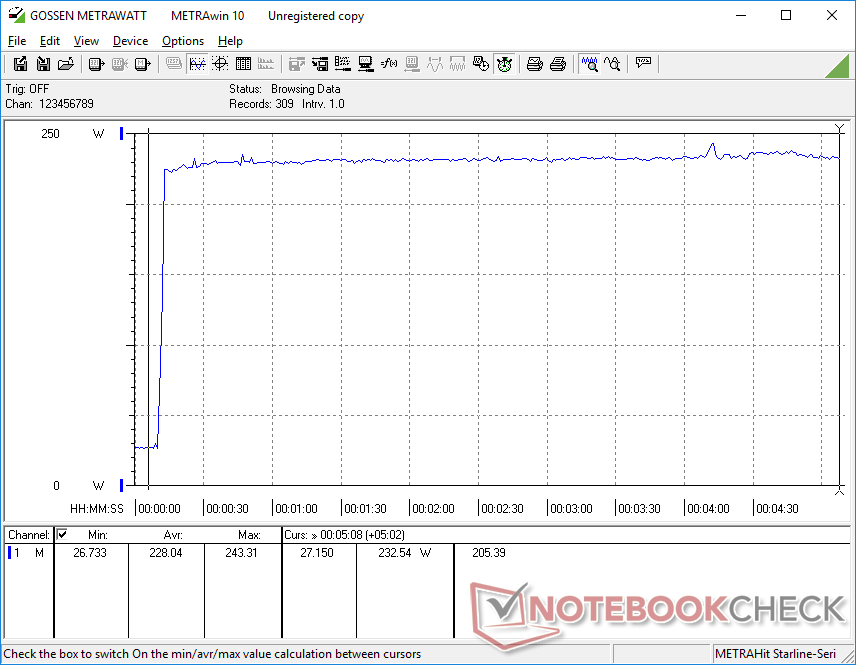
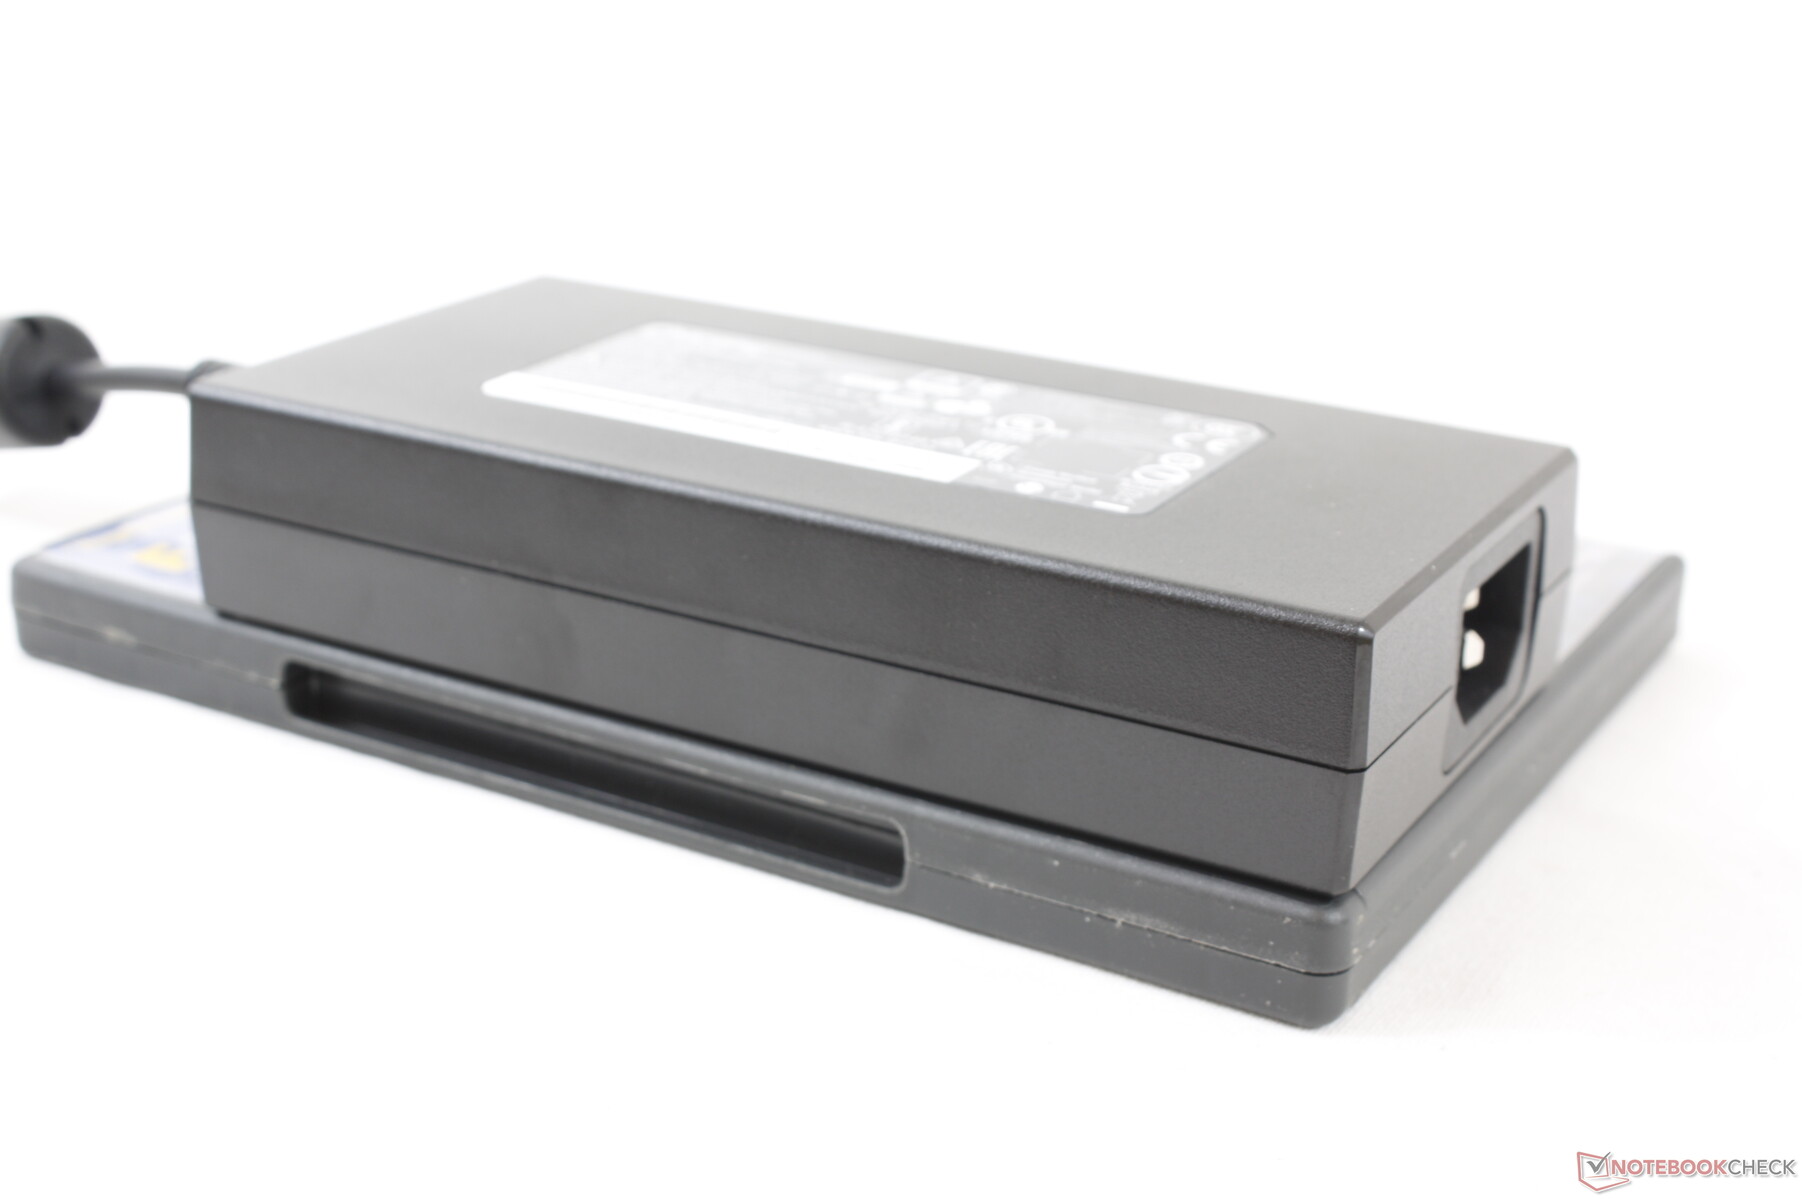
Results are similar to what we recorded on the Schenker XMG Neo 17 with a couple of differences. Idling on desktop with all LEDs enabled and Windows set to High Performance would consume about 32 W. When running Prime95 and FurMark simultaneously, power consumption would also be higher at about 243 W from the medium-sized (~15.5 x 7.5 x 3 cm) 230 W AC adapter. A larger adapter would have been appreciated as the system will not recharge at a decent rate when under extreme processing stress.
| Off / Standby | |
| Idle | |
| Load |
|
Key:
min: | |
| Walmart EVOO Gaming 17 i7-9750H, GeForce RTX 2060 Mobile, Intel SSD 660p 1TB SSDPEKNW010T8, IPS, 1920x1080, 17.3" | Schenker XMG Neo 17 XNE17M19 i7-9750H, GeForce RTX 2060 Mobile, Samsung SSD 970 EVO Plus 500GB, IPS, 1920x1080, 17.3" | Alienware m17 P37E i9-8950HK, GeForce RTX 2080 Max-Q, SK Hynix PC401 512GB M.2 (HFS512GD9TNG), IPS, 3840x2160, 17.3" | Lenovo Legion Y740-17IRH i7-9750H, GeForce RTX 2060 Mobile, WDC PC SN520 SDAPMUW-128G, IPS, 1920x1080, 17.3" | Razer Blade Pro 17 RTX 2060 i7-9750H, GeForce RTX 2060 Mobile, Samsung SSD PM981 MZVLB512HAJQ, IPS, 1920x1080, 17.3" | MSI GS75 Stealth 9SG i7-9750H, GeForce RTX 2080 Max-Q, 2x Samsung SSD PM981 MZVLB1T0HALR (RAID 0), IPS, 1920x1080, 17.3" | |
|---|---|---|---|---|---|---|
| Power Consumption | 15% | -35% | -7% | -9% | 2% | |
| Idle Minimum * (Watt) | 11.4 | 11 4% | 21.2 -86% | 20 -75% | 16 -40% | 13 -14% |
| Idle Average * (Watt) | 16.3 | 14 14% | 29.6 -82% | 21 -29% | 21.7 -33% | 17 -4% |
| Idle Maximum * (Watt) | 31.8 | 20 37% | 34 -7% | 26 18% | 26.1 18% | 25 21% |
| Load Average * (Watt) | 92.9 | 100 -8% | 130.9 -41% | 97 -4% | 105.6 -14% | 96 -3% |
| Witcher 3 ultra * (Watt) | 171.5 | 151 12% | 177.5 -3% | 139 19% | 161.8 6% | 156 9% |
| Load Maximum * (Watt) | 243.3 | 174 28% | 219.7 10% | 168 31% | 225.3 7% | 239 2% |
* ... smaller is better
Battery Life
Users can expect just over 4 hours of real-world WLAN use when set to the Balanced profile with the iGPU active. This is about average when compared to other gaming laptops. Internal battery capacity is small at just 46 W because of the 2.5-inch SATA III bay.
| Walmart EVOO Gaming 17 i7-9750H, GeForce RTX 2060 Mobile, 46 Wh | Schenker XMG Neo 17 i7-8750H, GeForce RTX 2070 Mobile, 46.74 Wh | Alienware m17 P37E i9-8950HK, GeForce RTX 2080 Max-Q, 90 Wh | Lenovo Legion Y740-17IRH i7-9750H, GeForce RTX 2060 Mobile, 76 Wh | Razer Blade Pro 17 RTX 2060 i7-9750H, GeForce RTX 2060 Mobile, 70 Wh | MSI GS75 Stealth 9SG i7-9750H, GeForce RTX 2080 Max-Q, 80.25 Wh | |
|---|---|---|---|---|---|---|
| Battery runtime | -12% | 17% | 2% | 7% | 43% | |
| WiFi v1.3 (h) | 4.2 | 3.7 -12% | 4.9 17% | 4.3 2% | 4.5 7% | 6 43% |
| Reader / Idle (h) | 5.3 | 9.1 | 6.9 | 7.7 | ||
| Load (h) | 0.9 | 0.8 | 1.1 | 1.2 |
Pros
Cons
Verdict

Buying a Walmart EVOO over alternatives like the MSI GS75, Razer Blade Pro 17, Lenovo Legion Y740, or Asus Zephyrus S GX701 doesn't necessarily mean you'll be sacrificing quality for a lower price. Keep in mind that Walmart doesn't design or manufacture their laptops because they are simply rebranded Chinese systems. Resellers of high-end gaming PCs like Maingear, Eluktronics, and others use this very same tactic with this same white label Chinese chassis.
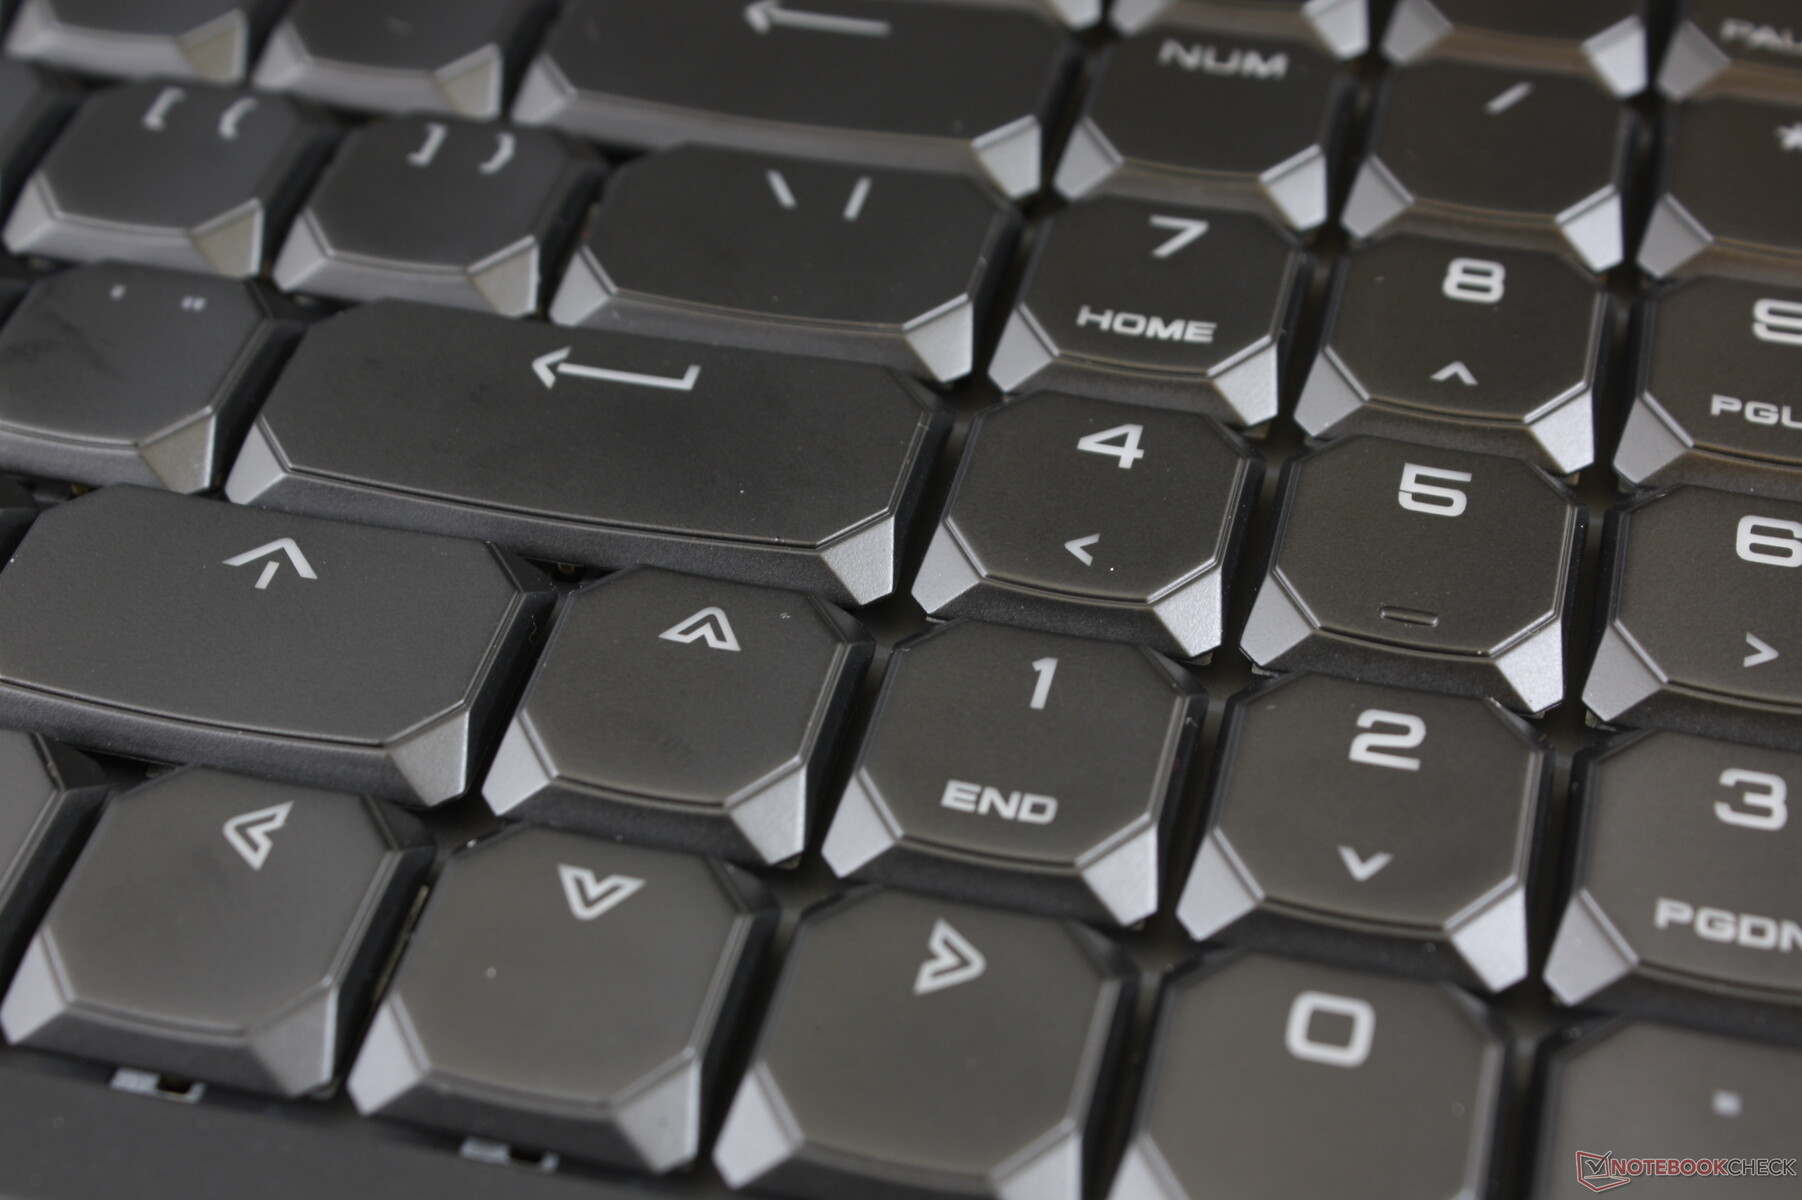
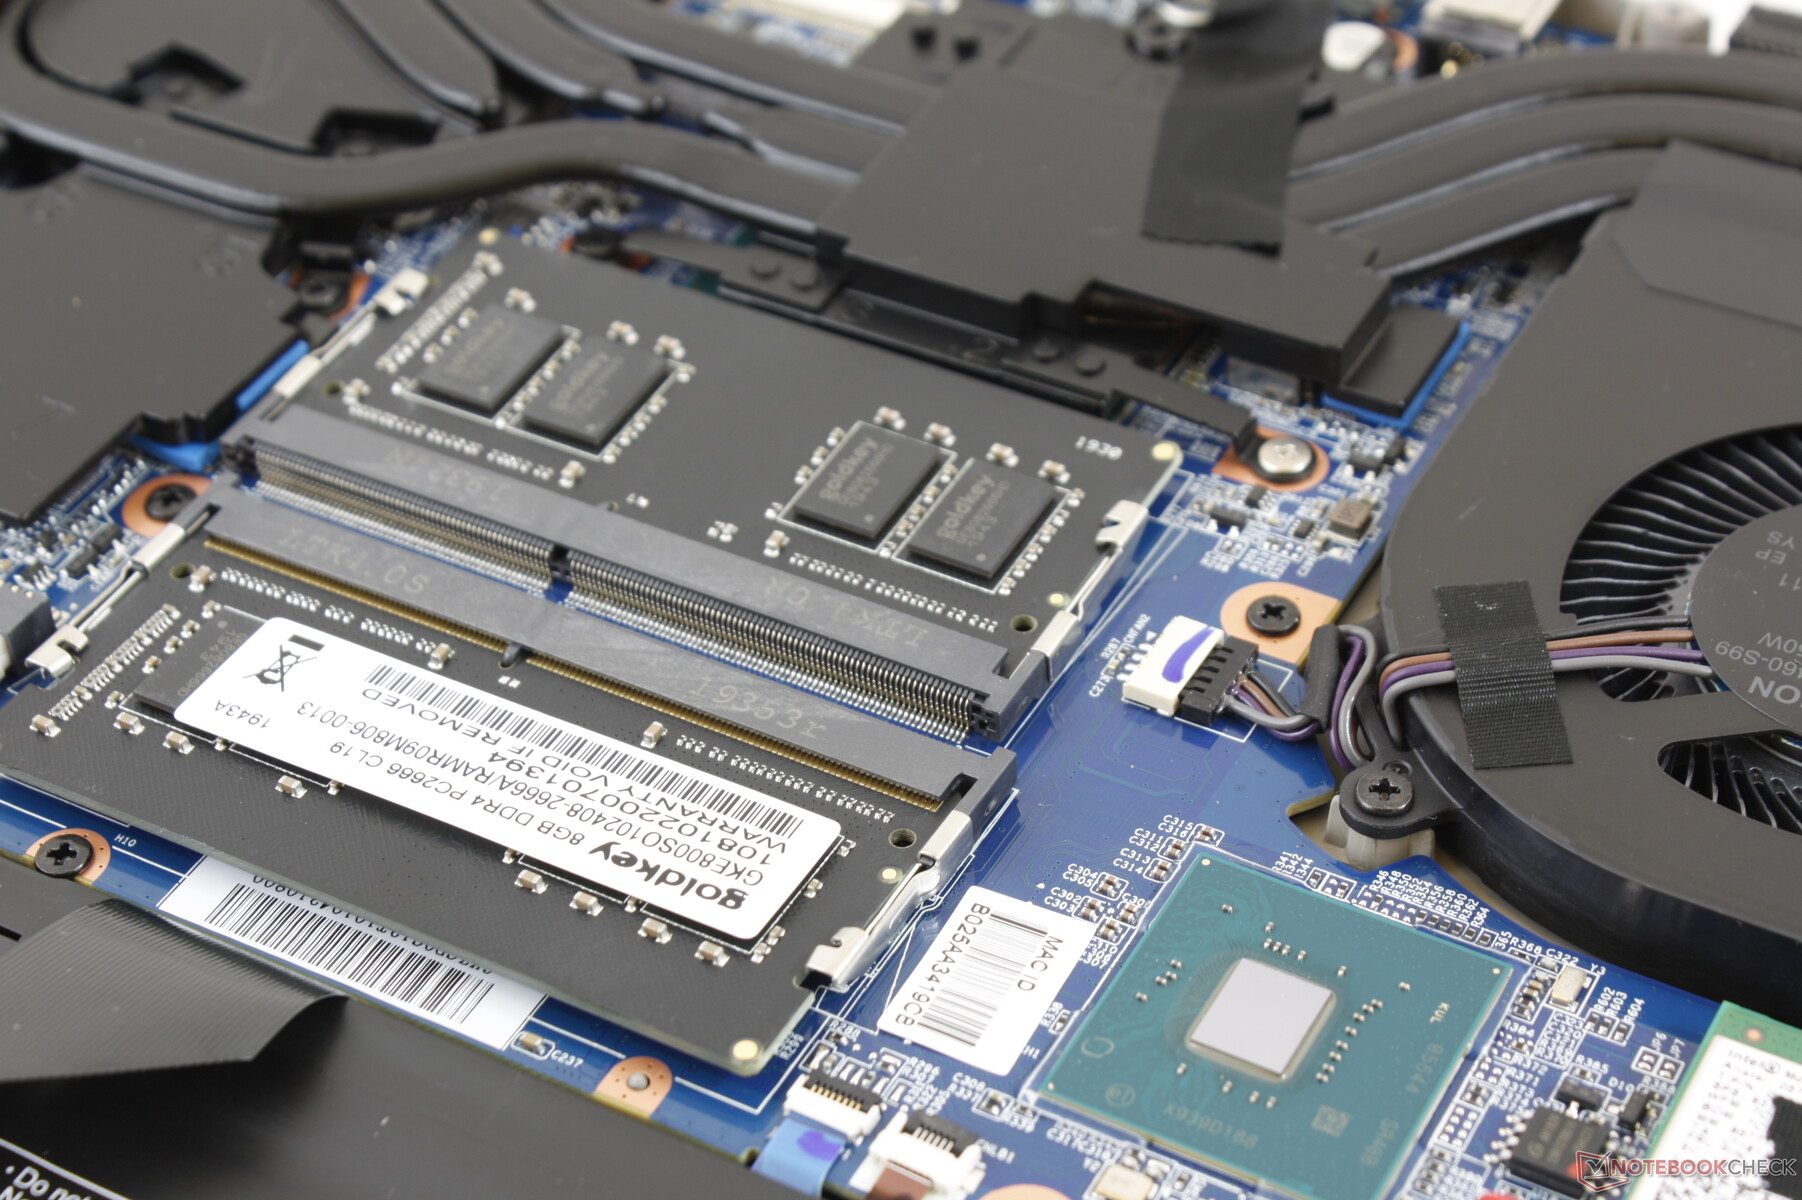
With that said, we're impressed by the above average CPU and GPU performance of the Walmart EVOO. Both the chassis and display are of higher quality than the aforementioned Lenovo as well. The loud mechanical keyboard, however, may not be for everyone especially if you plan on using the laptop in classrooms or libraries. Battery capacity is small for a 17.3-inch laptop and it's a shame that simple RAM or storage upgrades will require breaking a sticker. We also recommend checking for audio issues since the speakers on our test unit wouldn't even work.
The Walmart EVOO Gaming 17 works well if used solely for gaming. Its short battery life and loud keyboard keys make it a poor option for travelers and students who may want a more versatile gaming laptop.
Walmart EVOO Gaming 17
- 05/14/2020 v7 (old)
Allen Ngo
Price comparison
