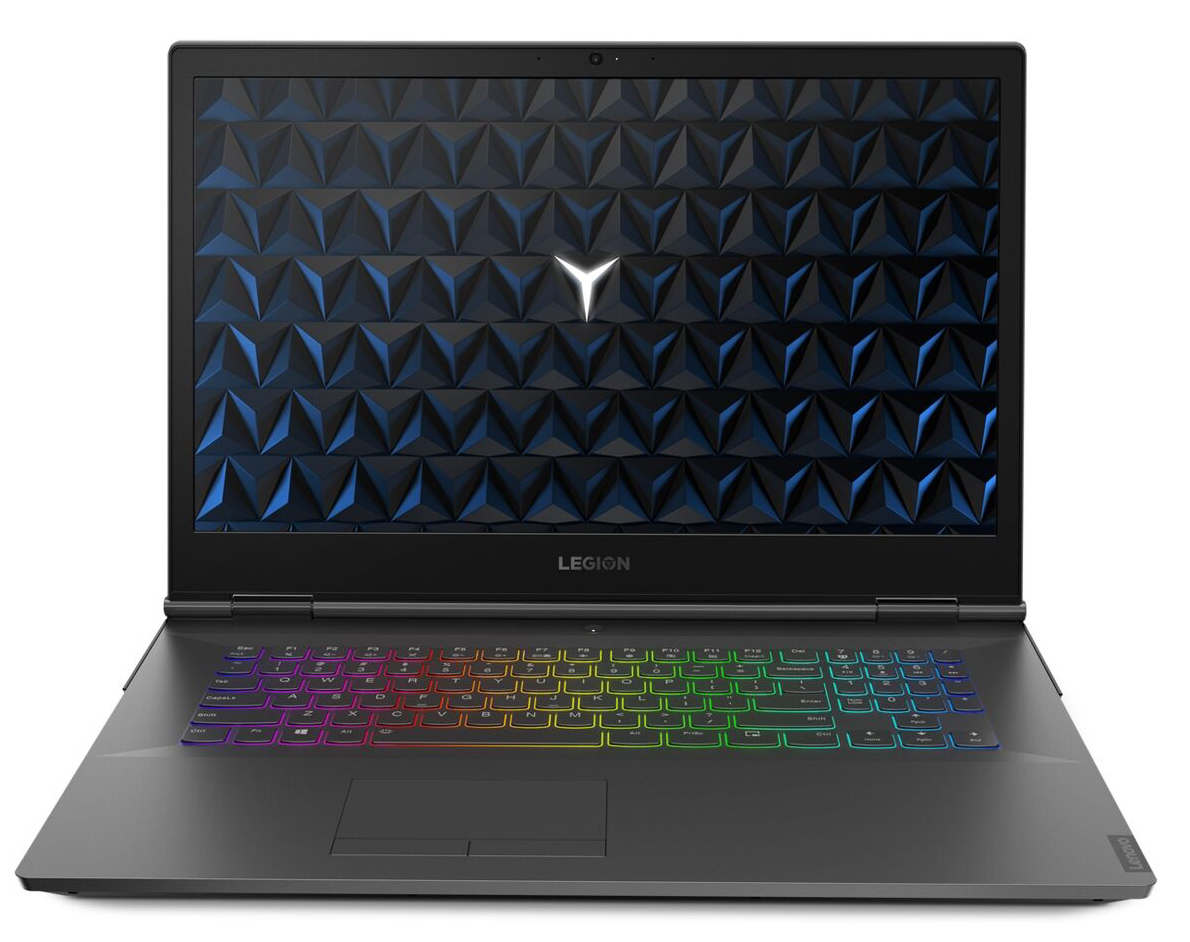
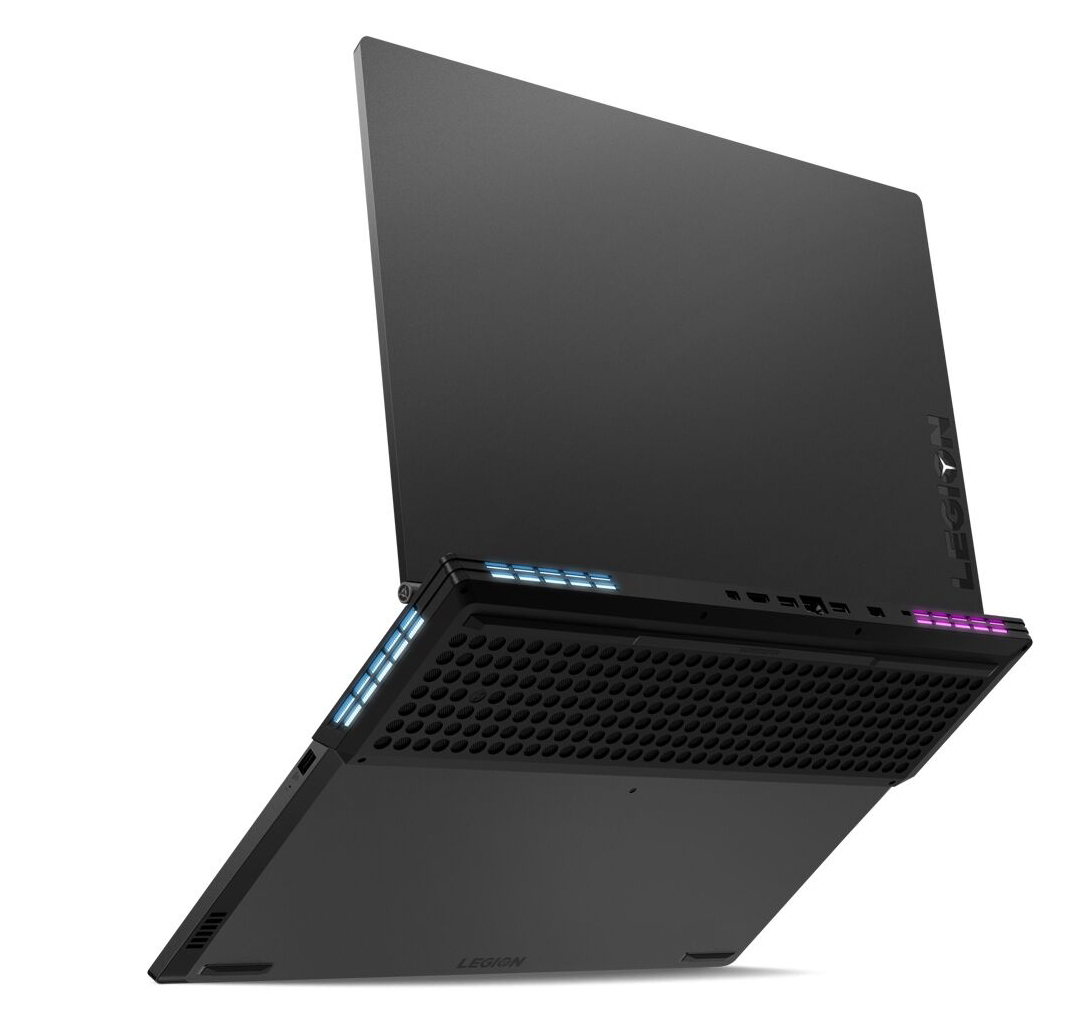
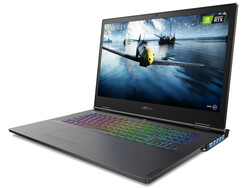
Lenovo Legion Y740-17IRH Review: Gaming bolide gets high marks for its great power delivery and low heat development

Lenovo's 17.3-inch gaming notebook is not unknown to us. We already reviewed its sibling, the Legion Y740-17ICH, which has the same build. Today's test unit is equipped with a Core i7-9750H processor and a GeForce RTX 2060 GPU. Some of its competitors are the Asus Strix Hero III G731GV, the MSI GL75 9SEK, the Schenker XMG Core 17, the Dell G7 17 7790 and the HP Pavilion Gaming 17.
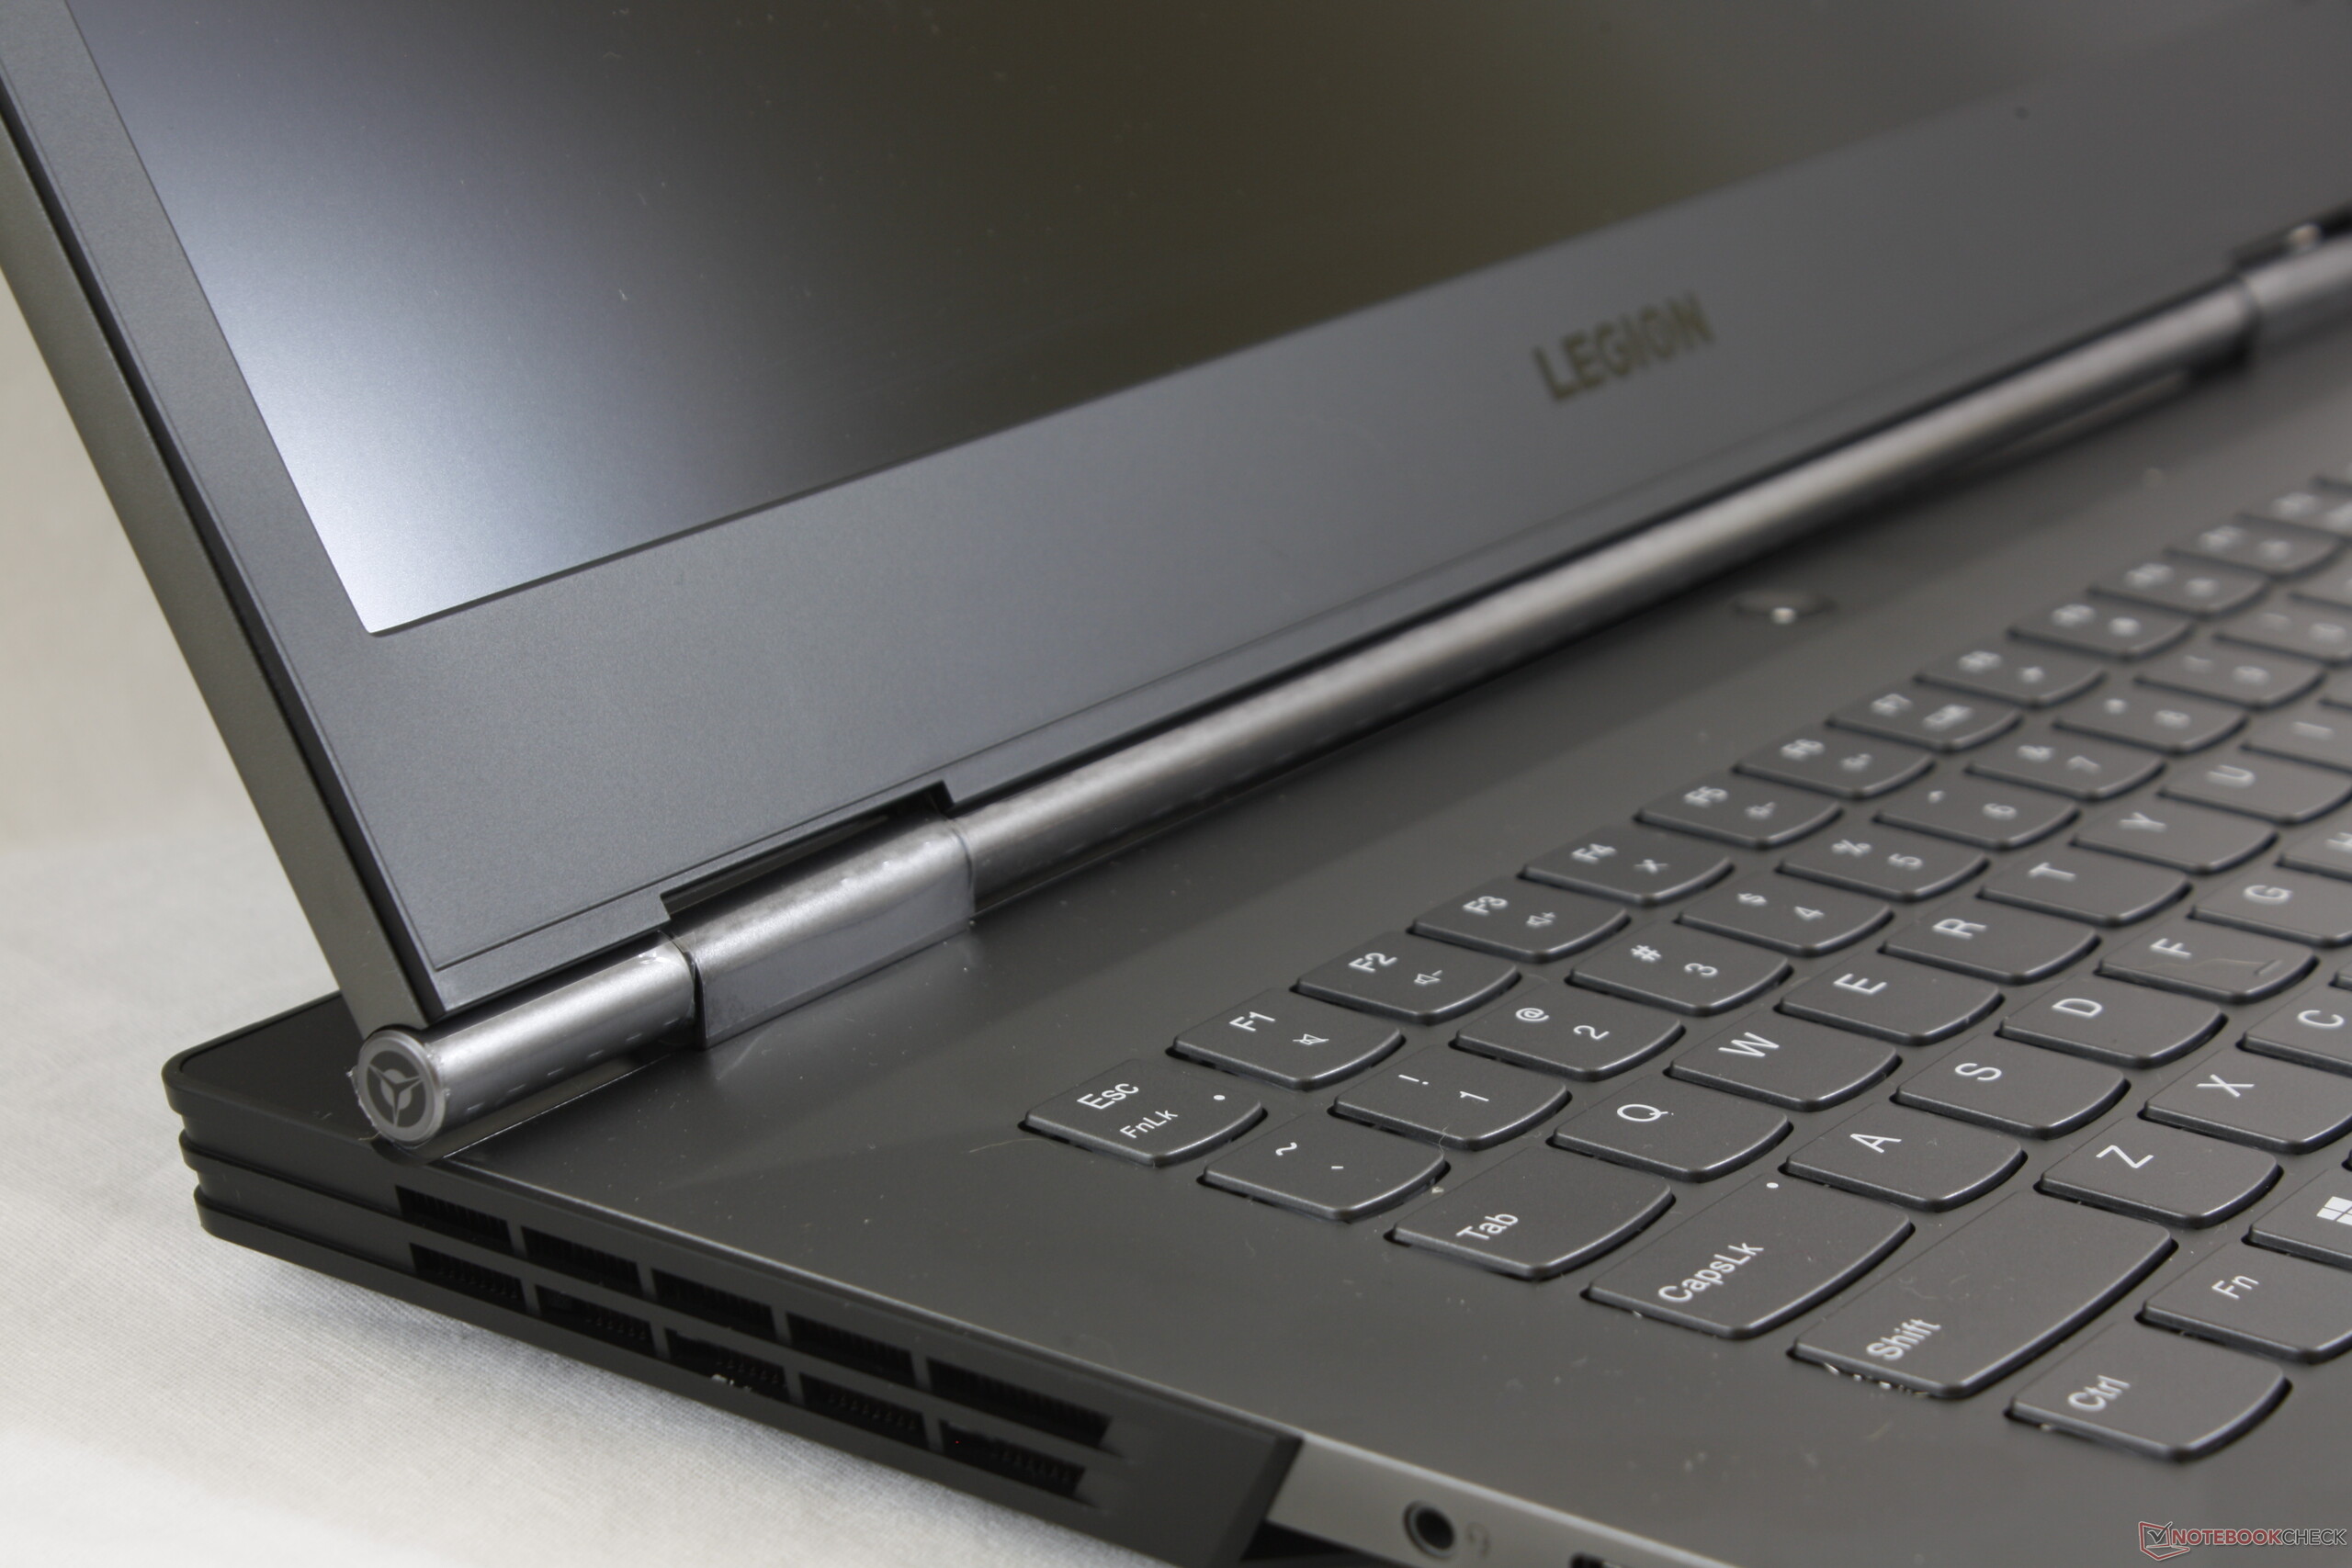
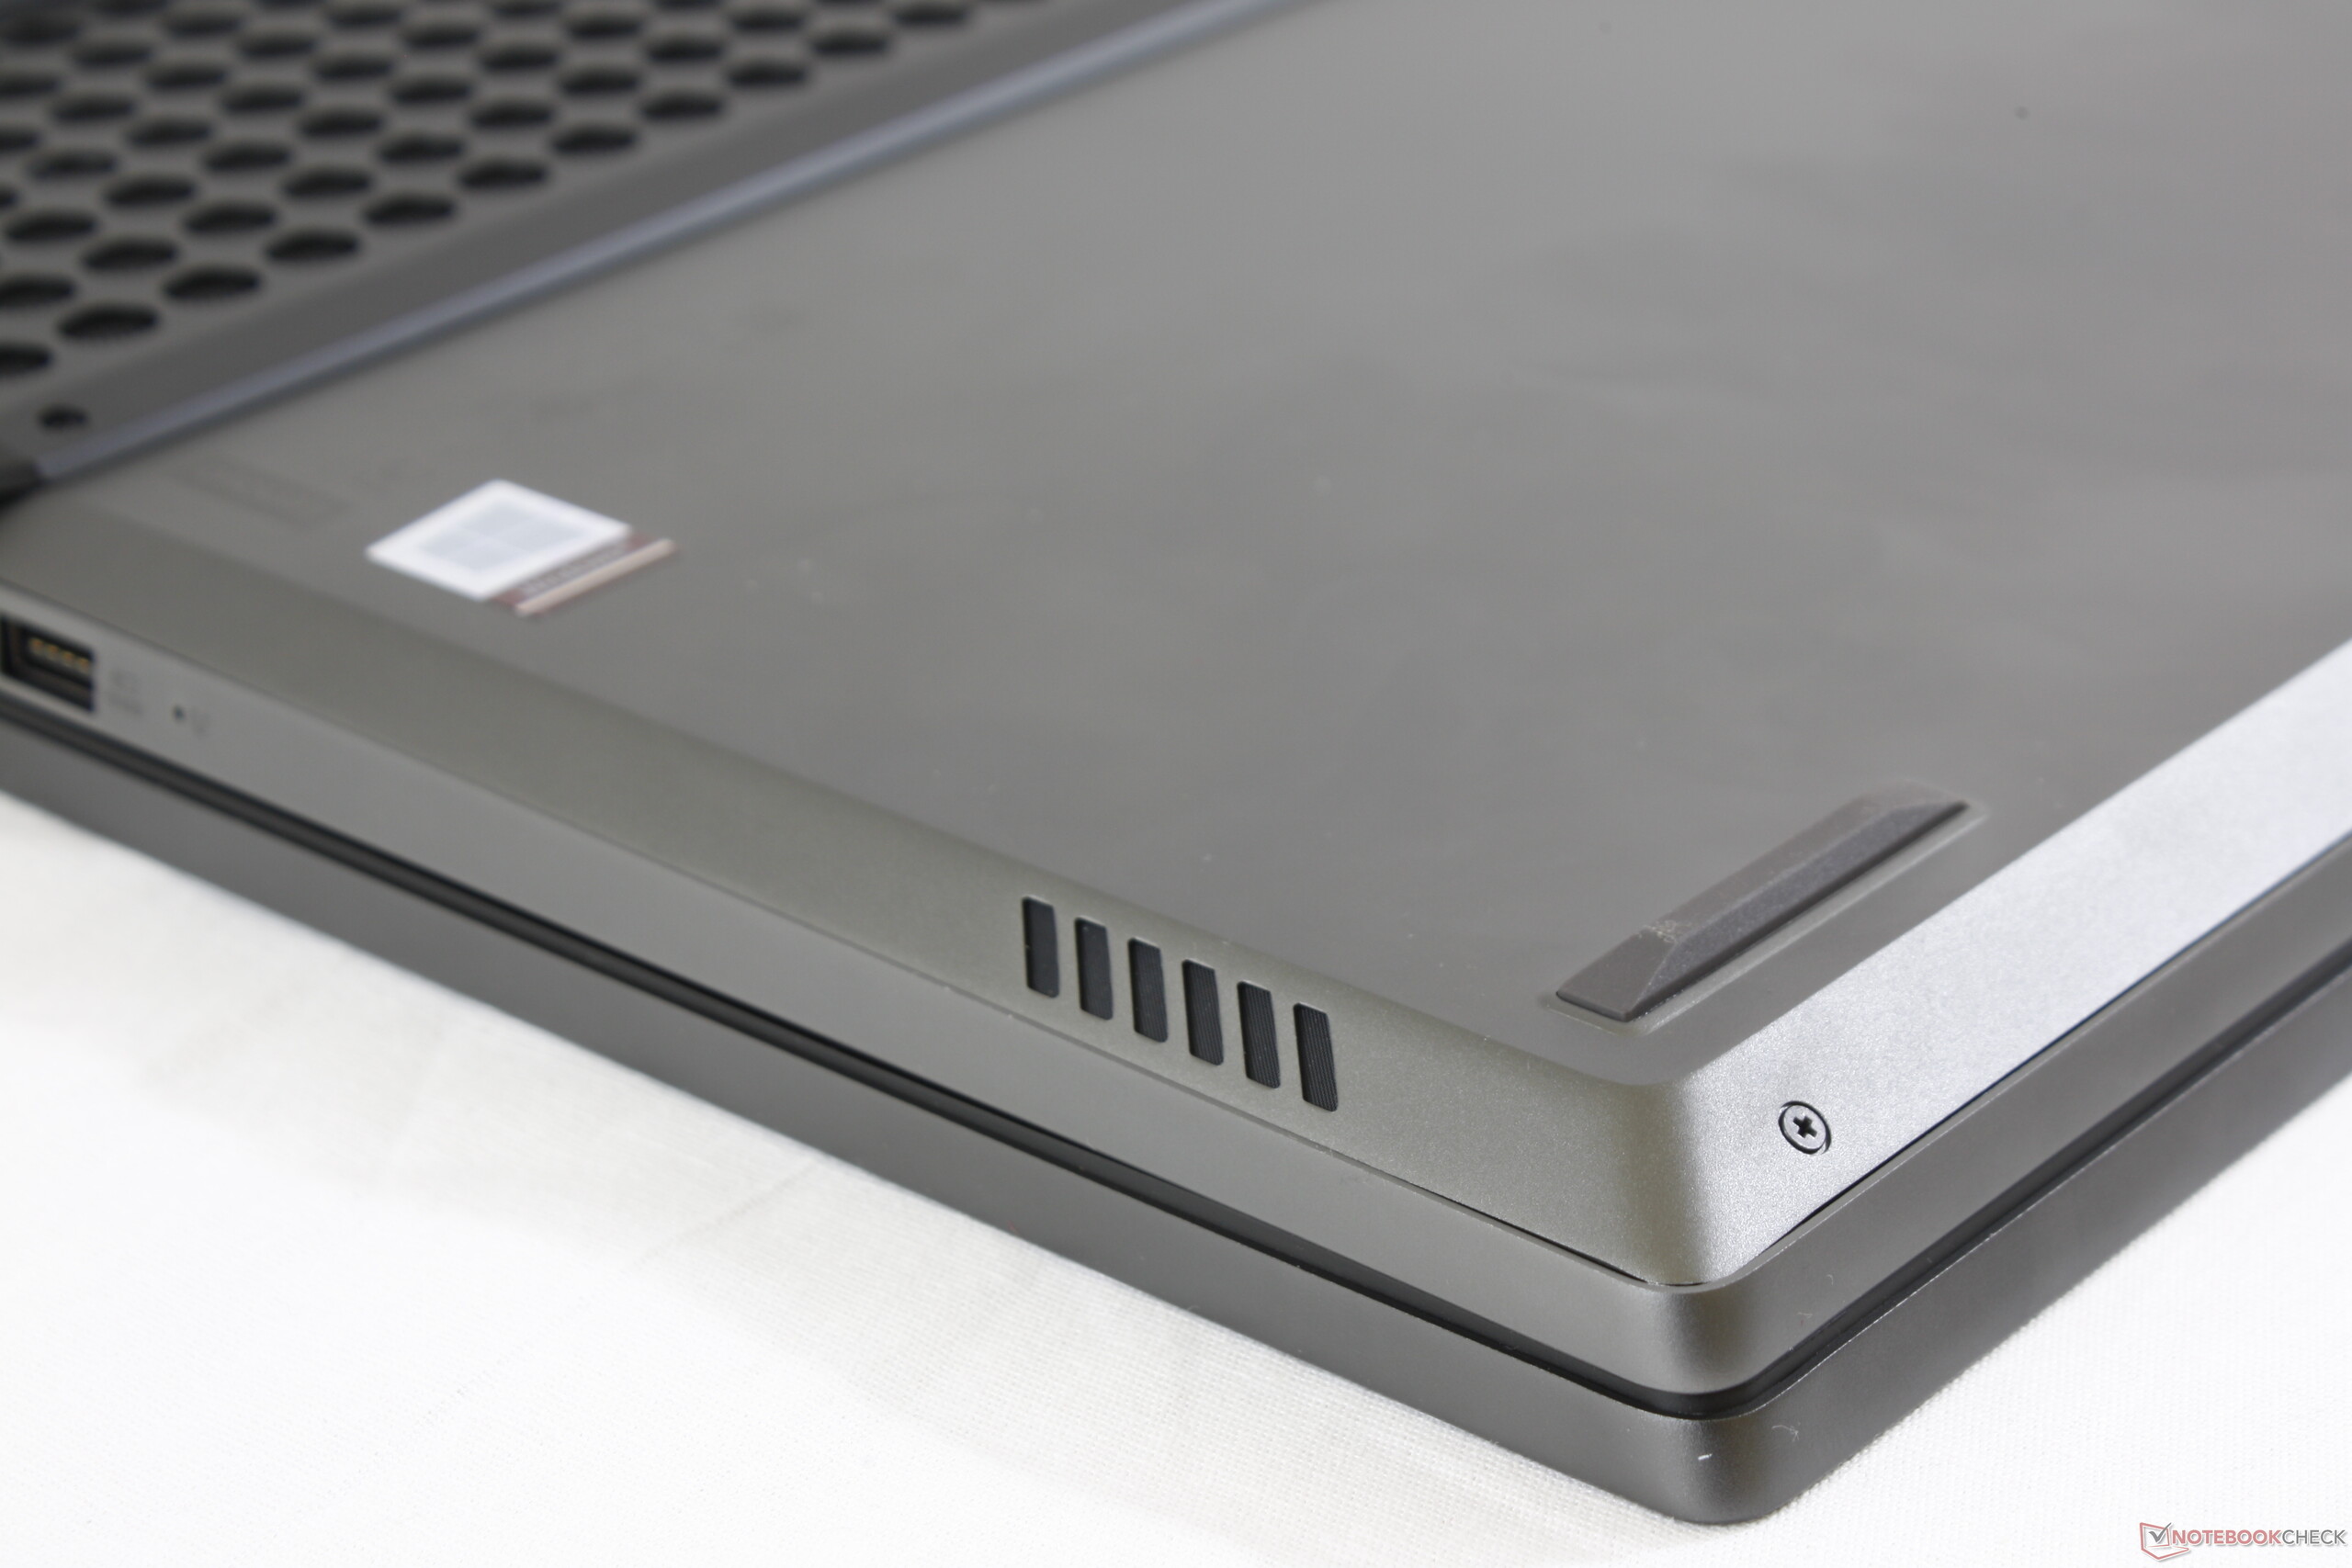
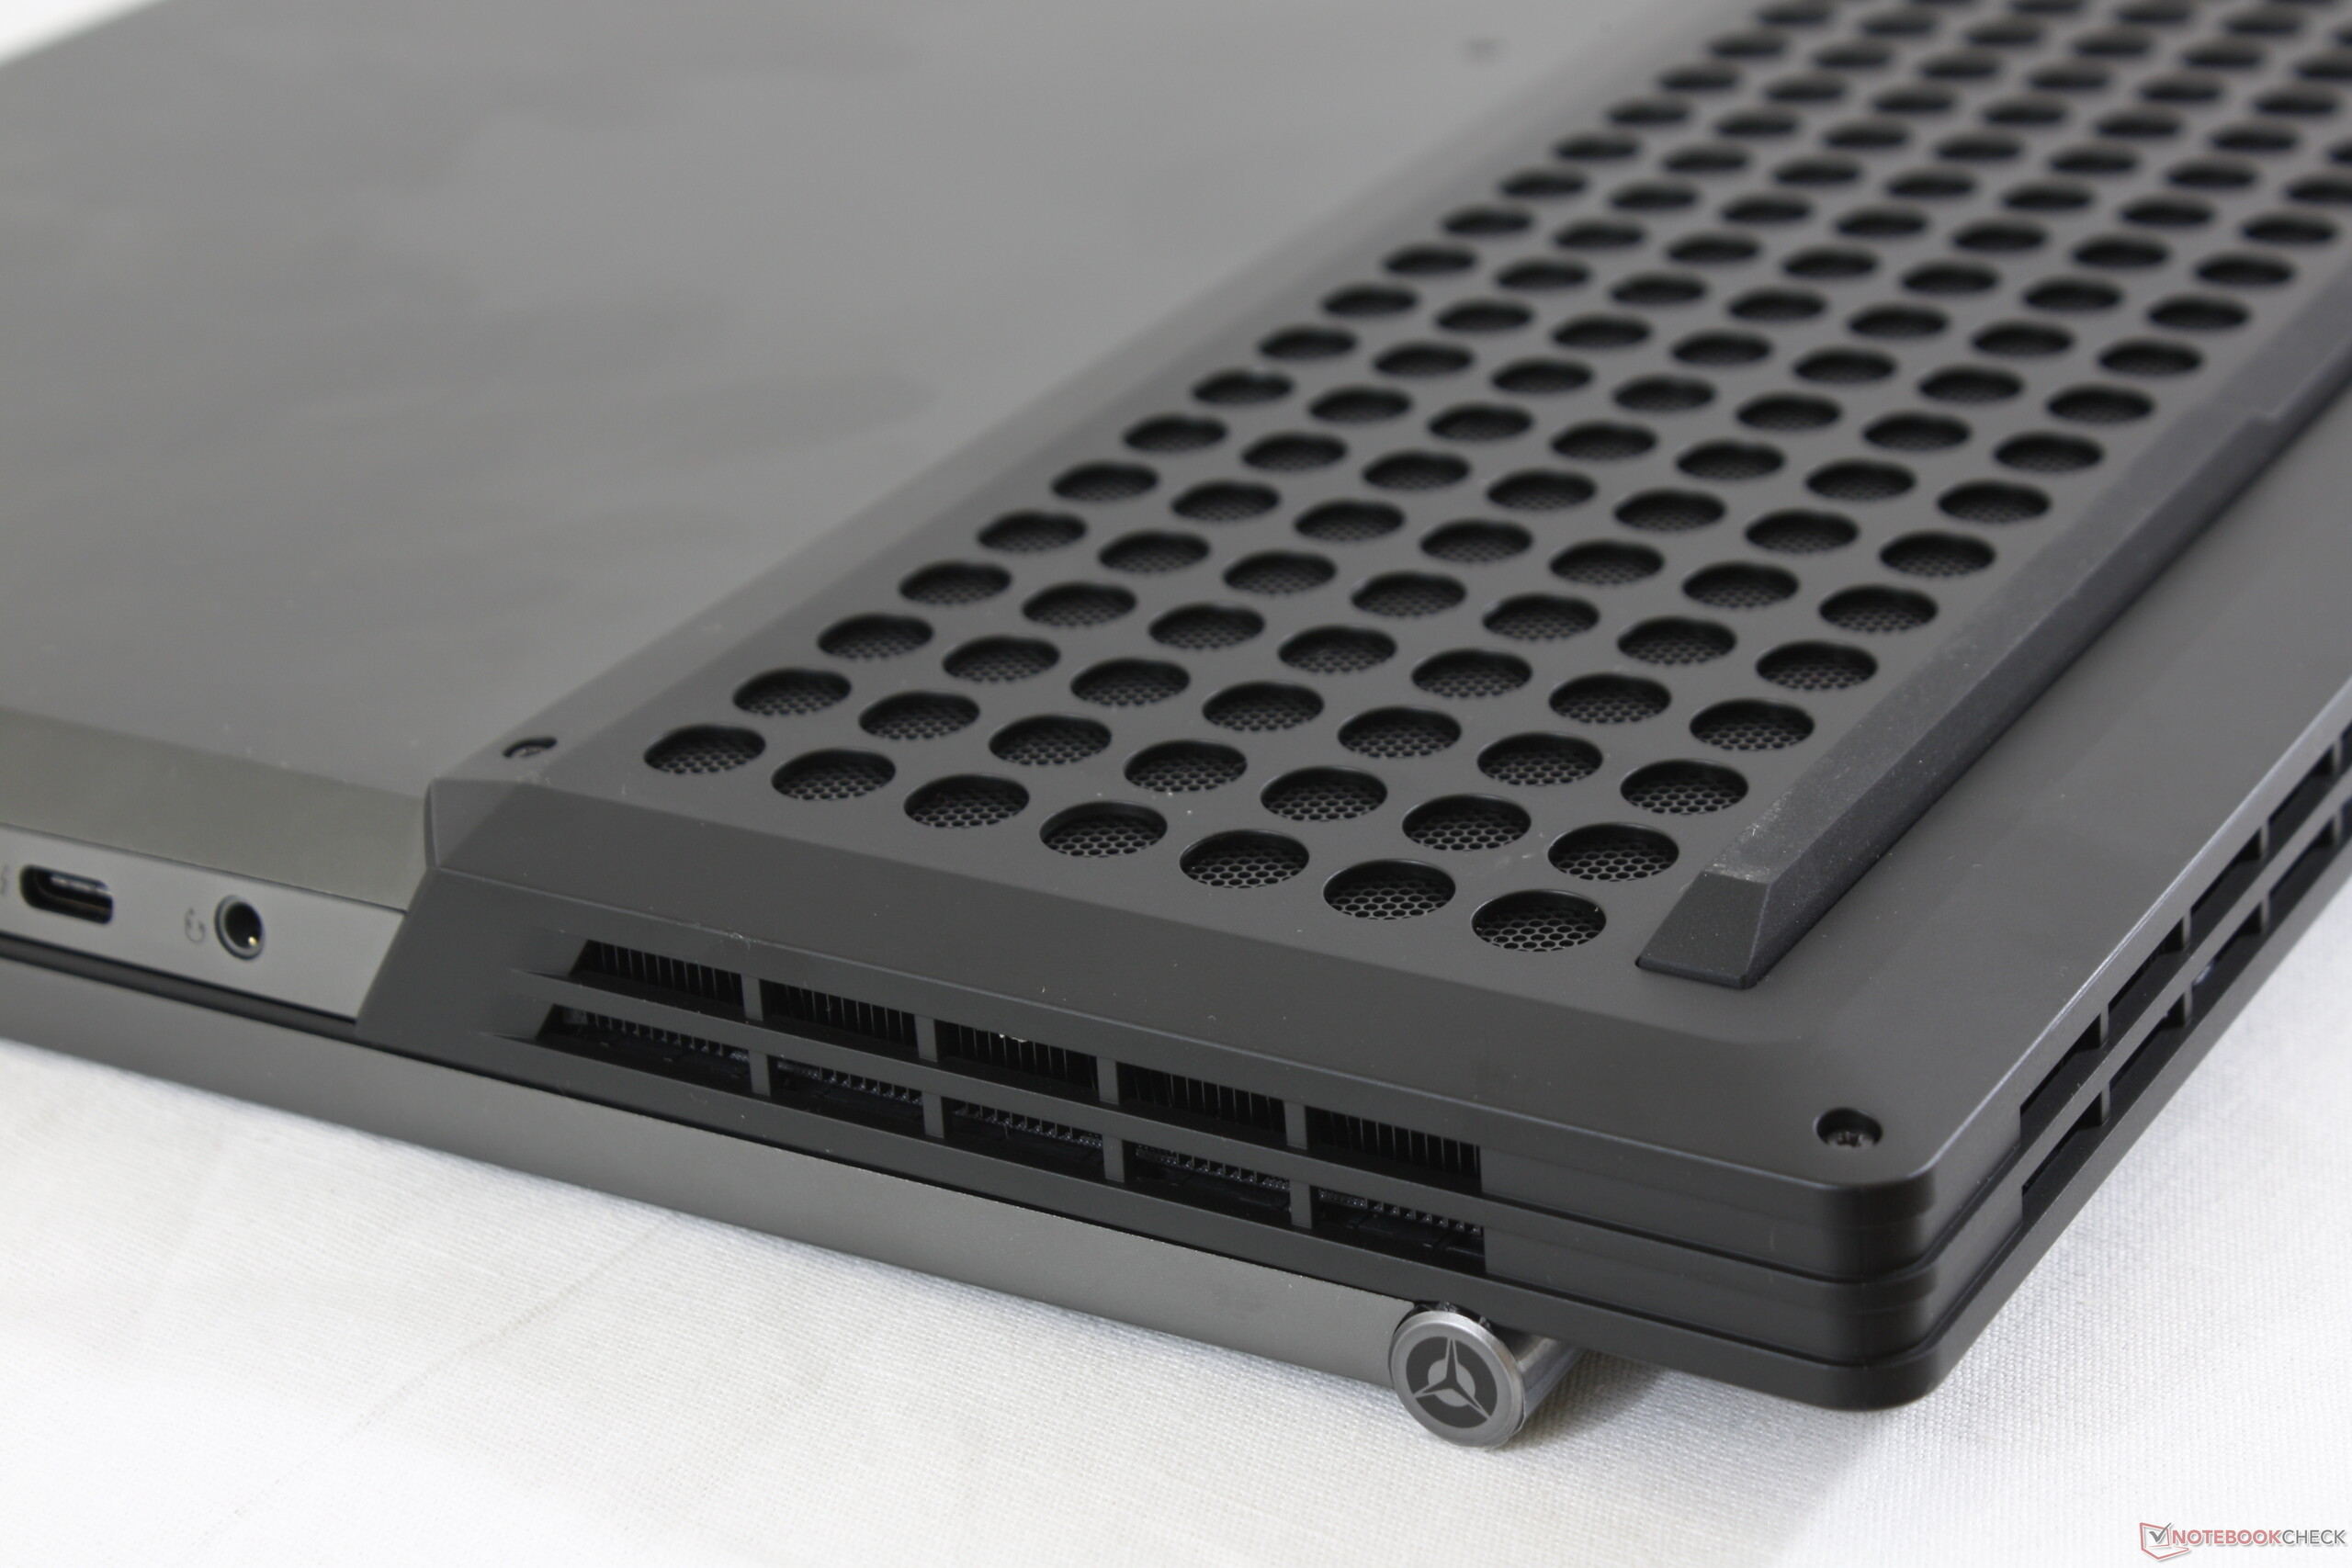
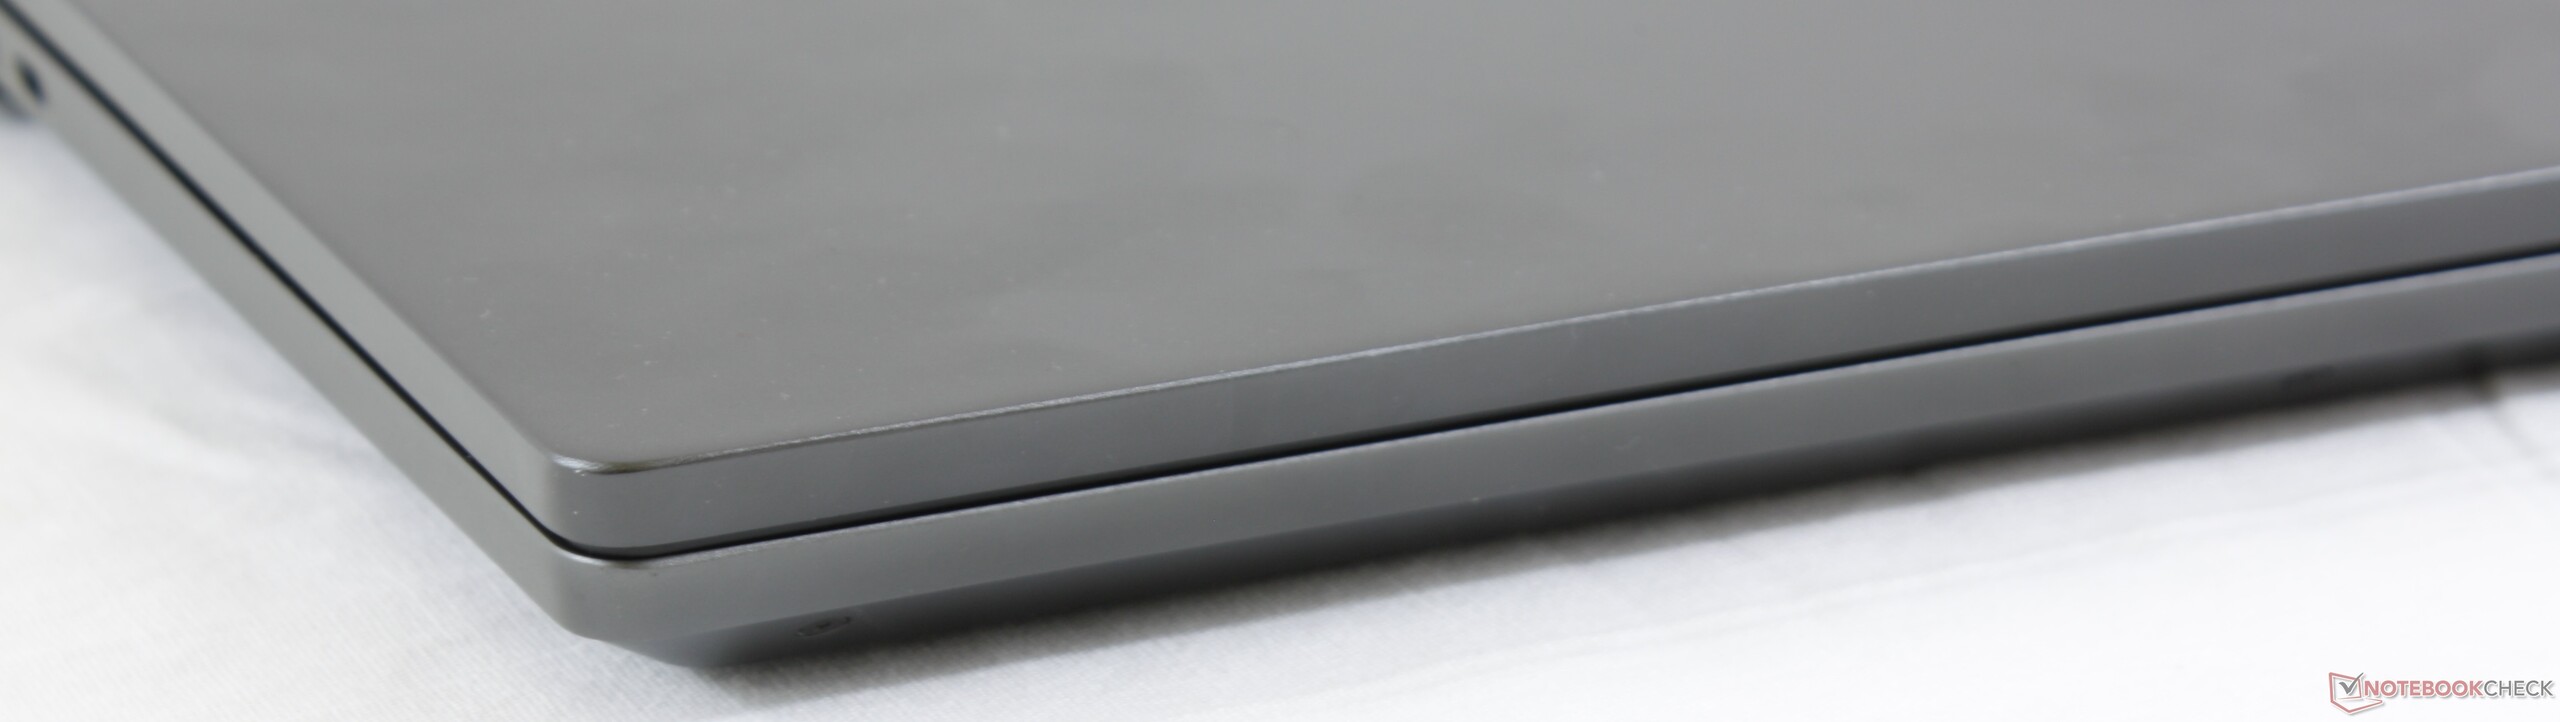
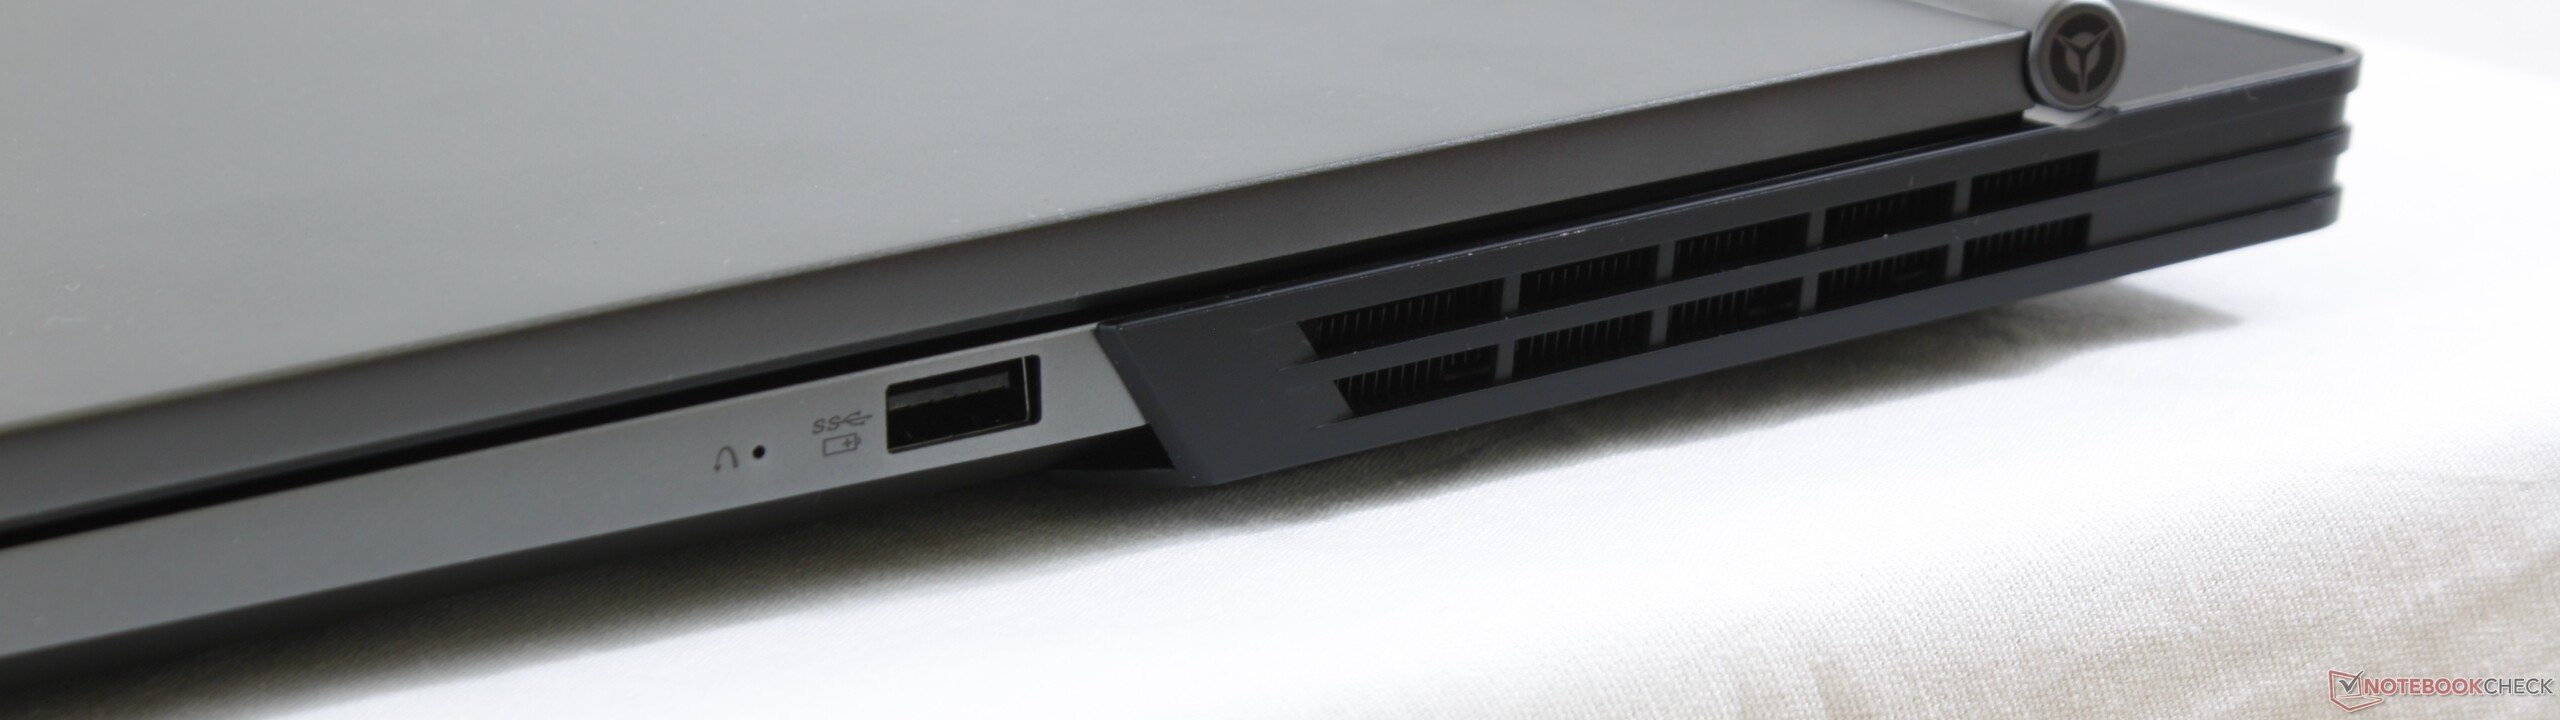
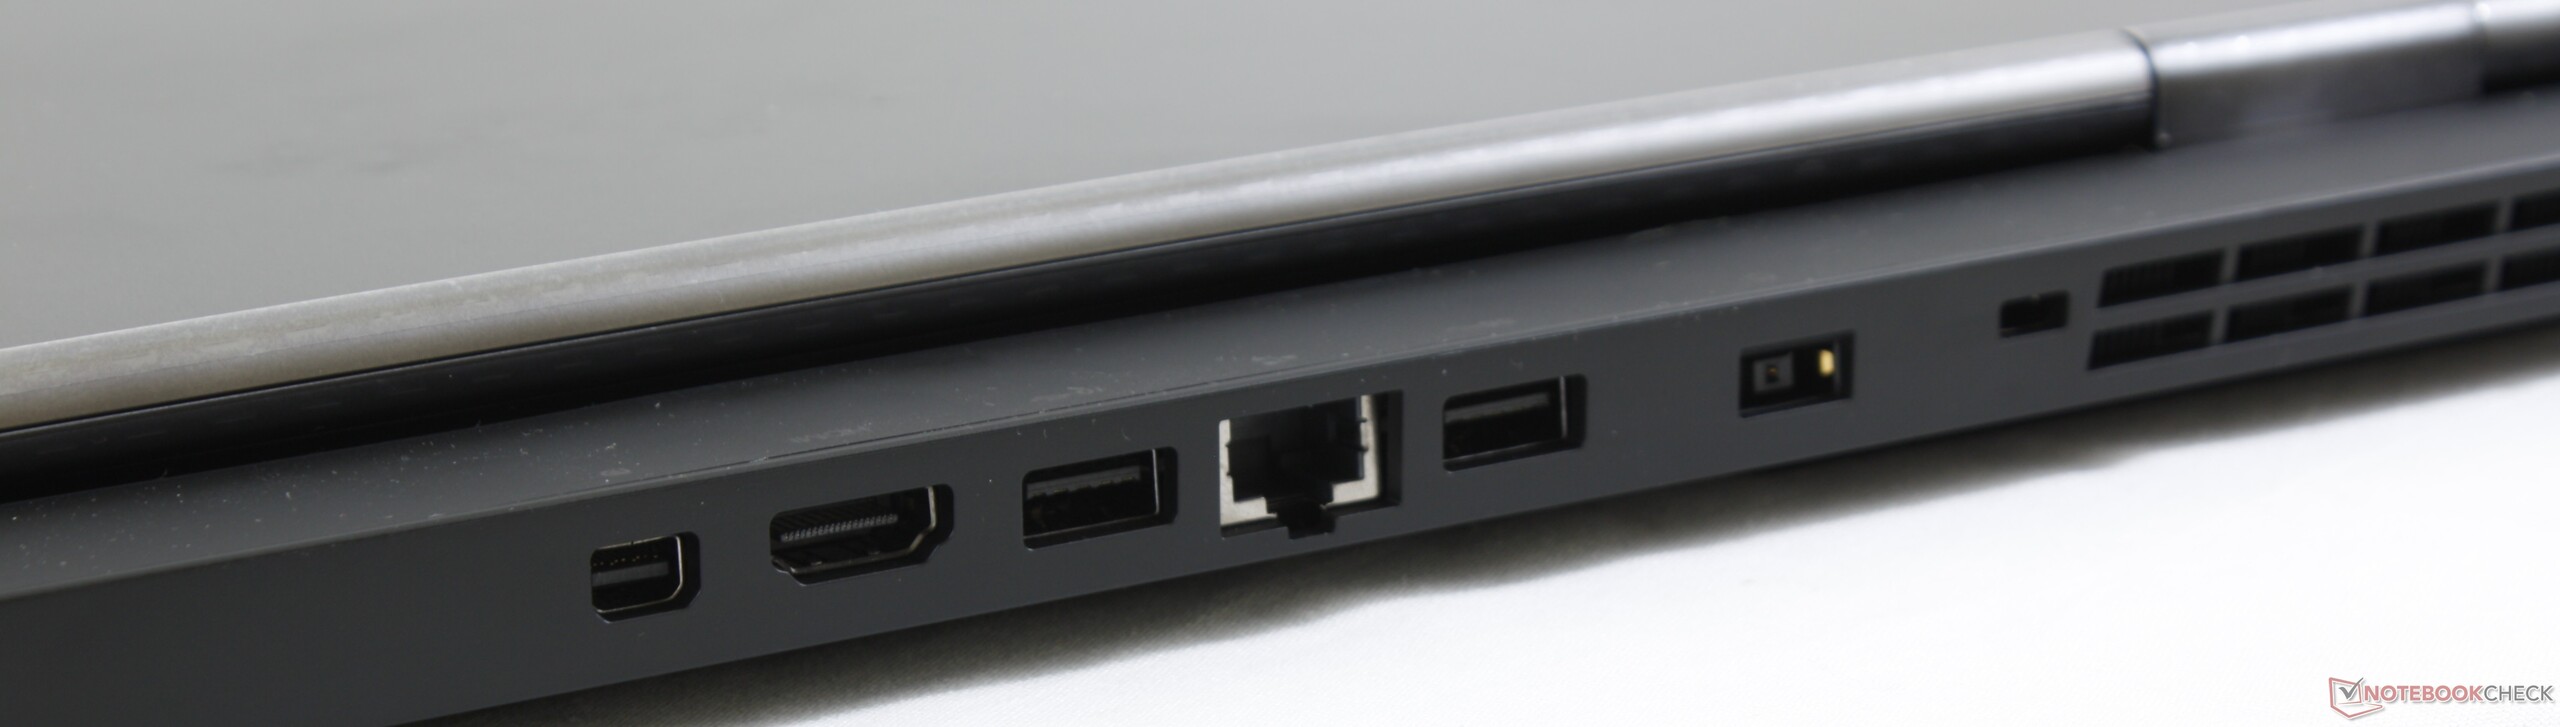
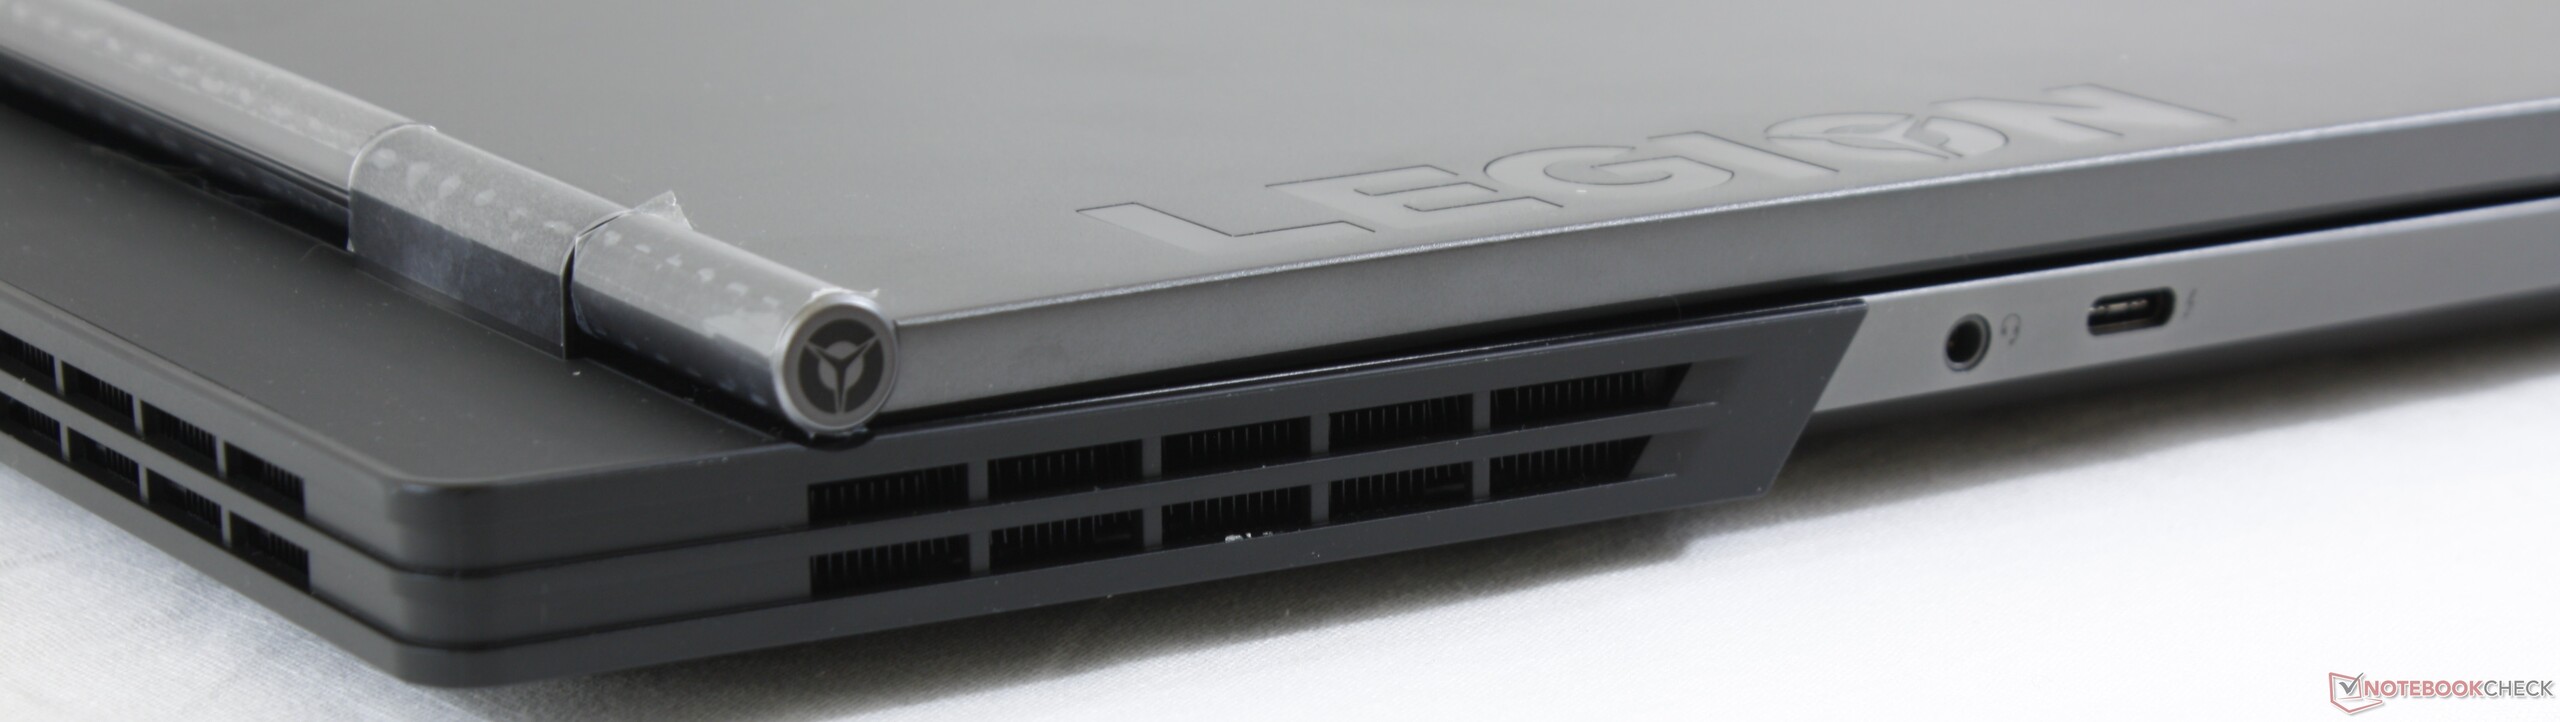
As the two Legion Y740 models have the same build, we will not go into details on the case, connectivity, input devices and speakers in this review. Please refer to our review of the Legion Y740-17ICH for information on these aspects.
Rating | Date | Model | Weight | Height | Size | Resolution | Price |
|---|---|---|---|---|---|---|---|
| 83.2 % v7 (old) | 10 / 2019 | Lenovo Legion Y740-17IRH i7-9750H, GeForce RTX 2060 Mobile | 3 kg | 23 mm | 17.30" | 1920x1080 | |
| 85.6 % v6 (old) | 03 / 2019 | Lenovo Legion Y740-17ICH i7-8750H, GeForce RTX 2080 Max-Q | 2.8 kg | 23 mm | 17.30" | 1920x1080 | |
| 86 % v7 (old) | 08 / 2019 | Asus Strix Hero III G731GV i7-9750H, GeForce RTX 2060 Mobile | 2.9 kg | 26.2 mm | 17.30" | 1920x1080 | |
| 82.9 % v7 (old) | 10 / 2019 | MSI GL75 9SEK-056US i7-9750H, GeForce RTX 2060 Mobile | 2.5 kg | 28 mm | 17.30" | 1920x1080 | |
| 86.7 % v6 (old) | 07 / 2019 | Schenker XMG Core 17 i7-9750H, GeForce GTX 1660 Ti Mobile | 2.5 kg | 30 mm | 17.30" | 1920x1080 | |
| 85.3 % v6 (old) | 06 / 2019 | Dell G7 17 7790 i7-8750H, GeForce RTX 2070 Max-Q | 3.2 kg | 25 mm | 17.30" | 1920x1080 | |
| 81.6 % v7 (old) | 07 / 2019 | HP Pavilion Gaming 17-cd0085cl i7-9750H, GeForce GTX 1660 Ti Max-Q | 2.8 kg | 25 mm | 17.30" | 1920x1080 |


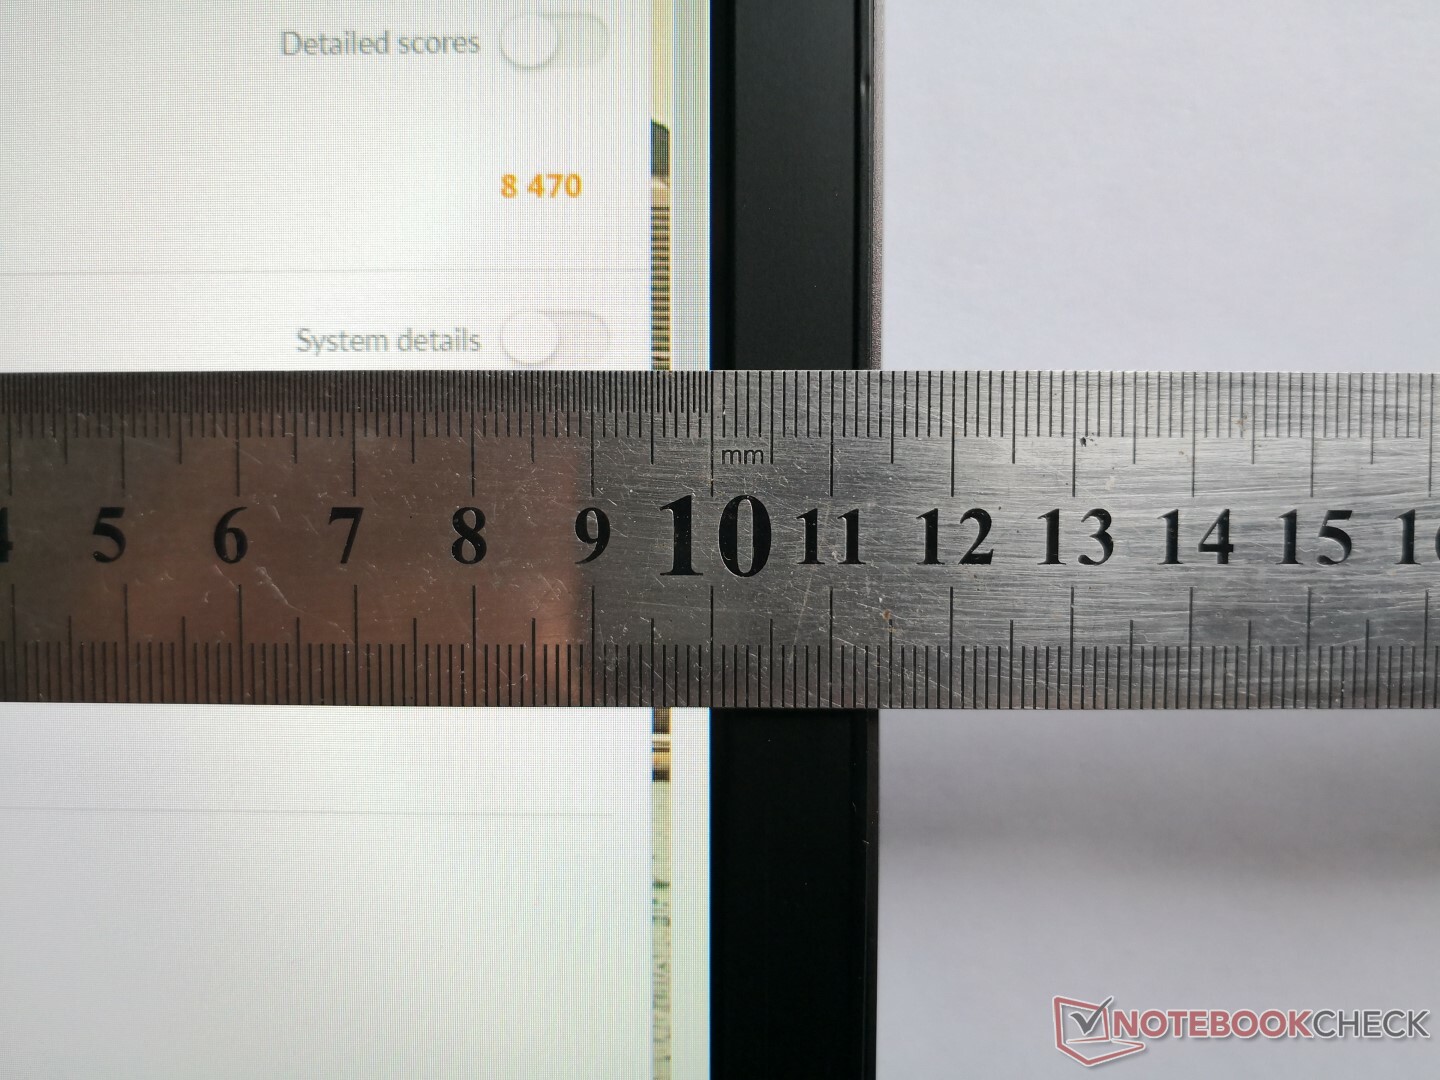
Display - 144-Hz IPS with G-Sync
The Legion's 17.3-inch display has a native resolution of 1920x1080 pixels. While the display offers a good contrast ratio (1044:1), its brightness is a little too low (260.6 cd/m²). Good brightness levels start from around 300 cd/m². Fortunately, the display does not show any PWM flickering.
The 144-Hz panel in our test unit supports Nvidia's G-Sync technology, which dynamically matches the refresh rates of the display and the GPU. This should ensure an even smoother image - particularly while gaming.
| |||||||||||||||||||||||||
Brightness Distribution: 87 %
Center on Battery: 282 cd/m²
Contrast: 1044:1 (Black: 0.27 cd/m²)
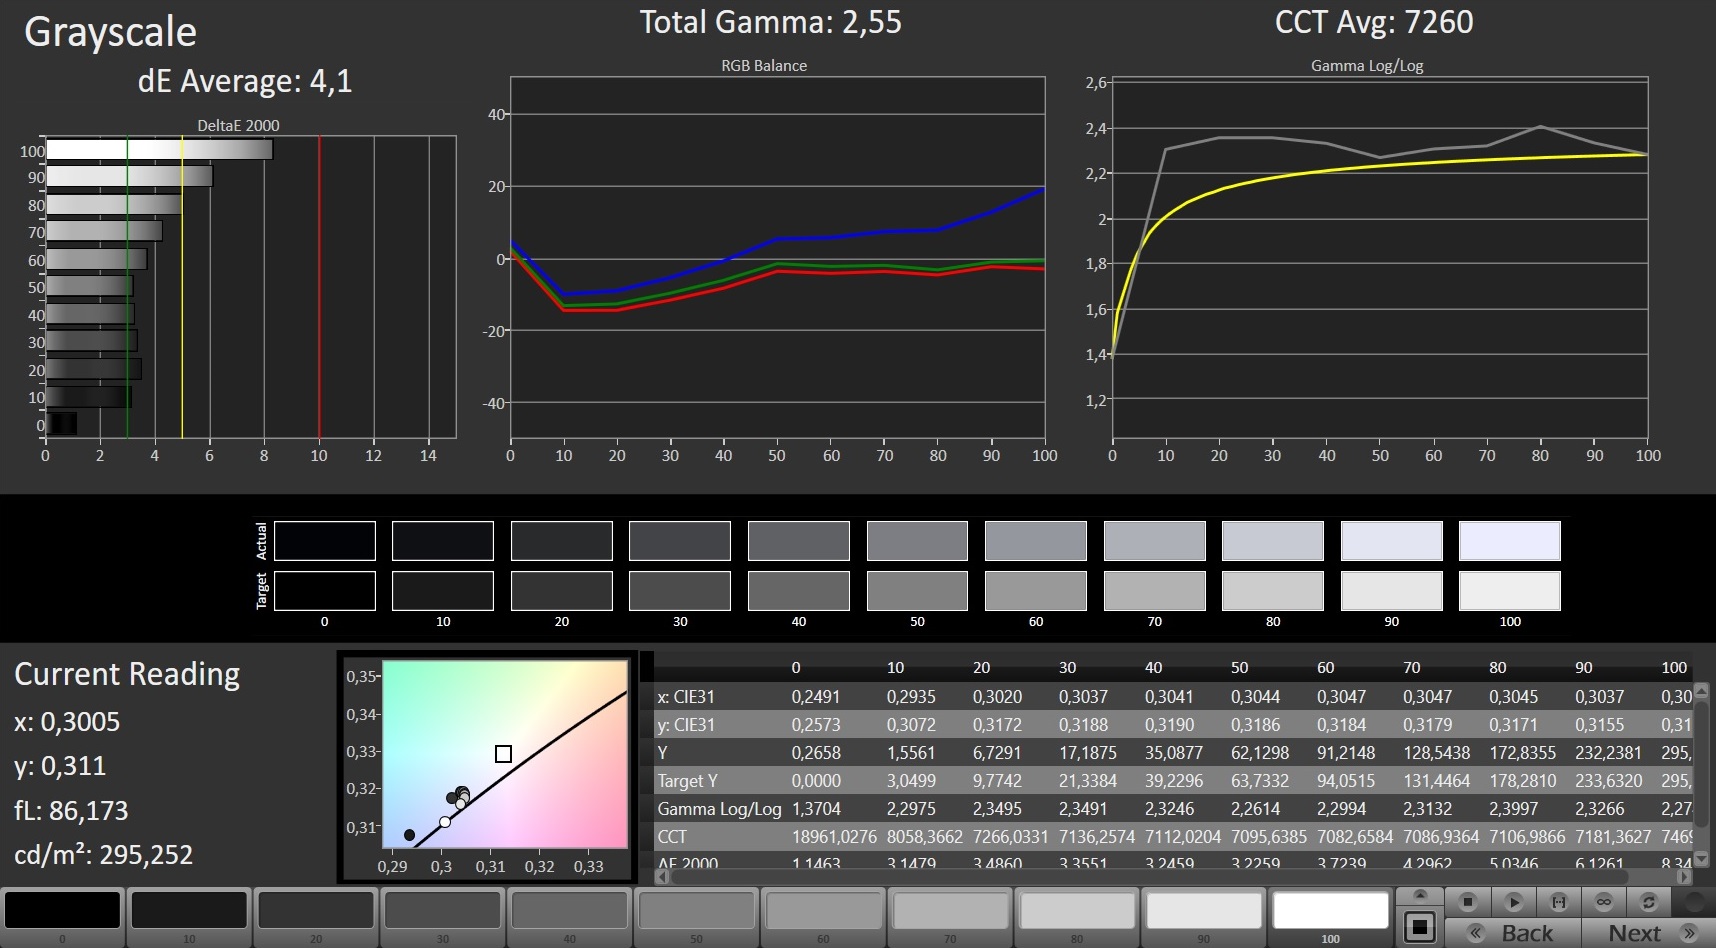
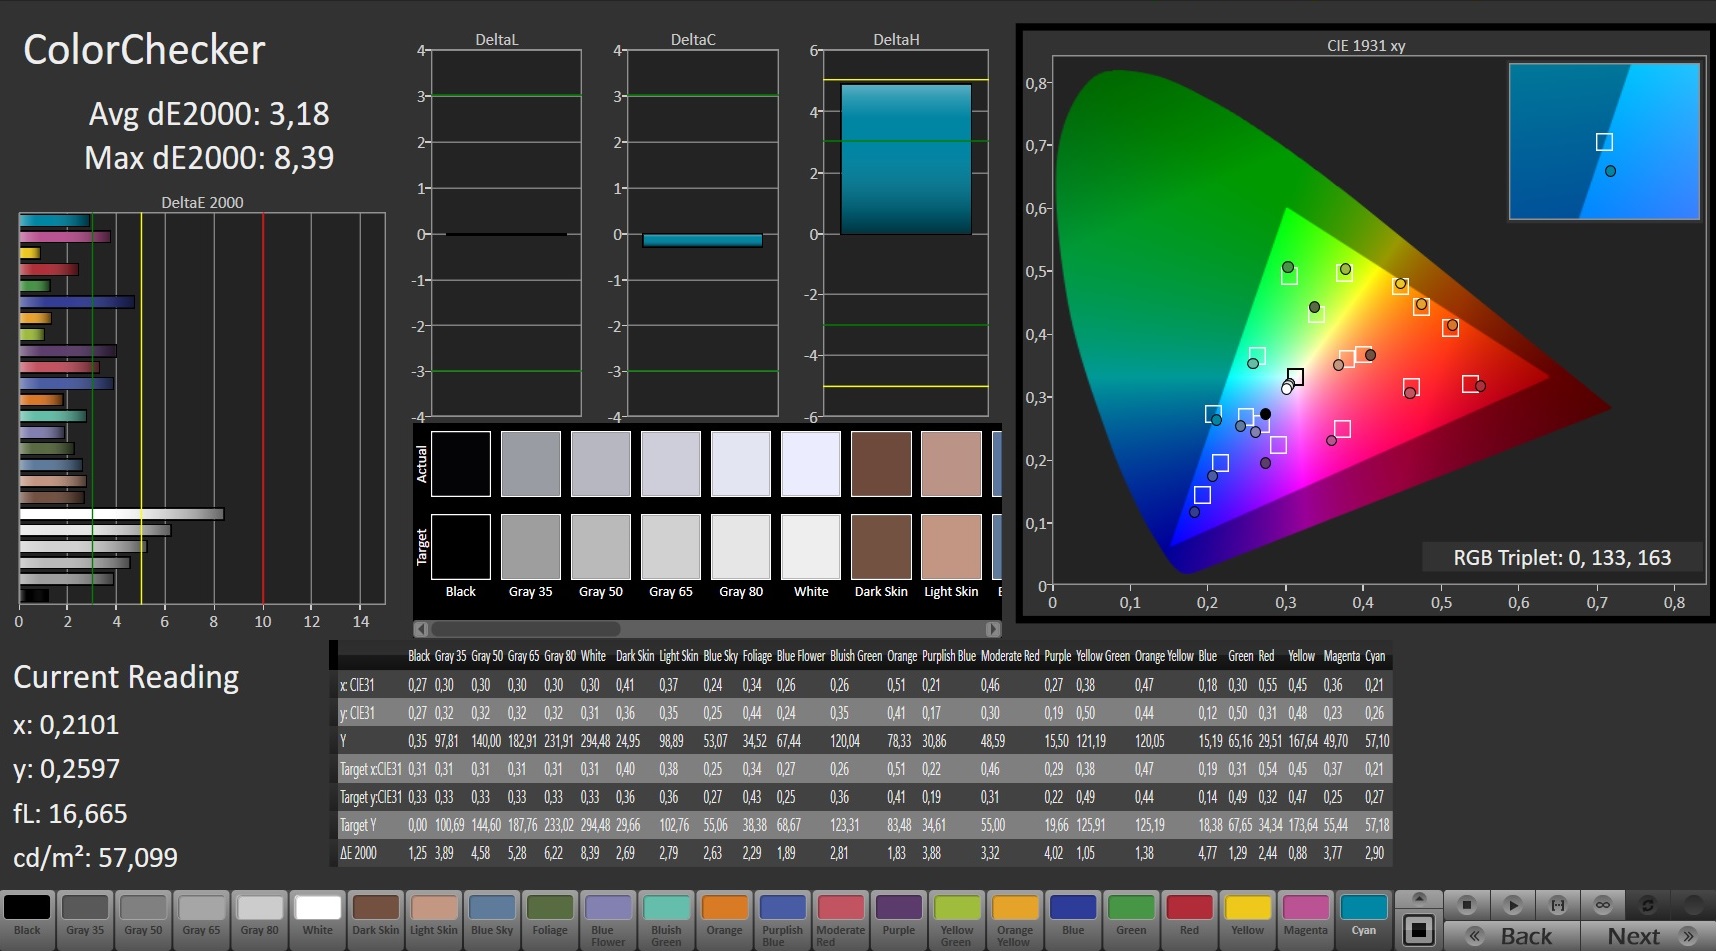
ΔE ColorChecker Calman: 3.18 | ∀{0.5-29.43 Ø4.71}
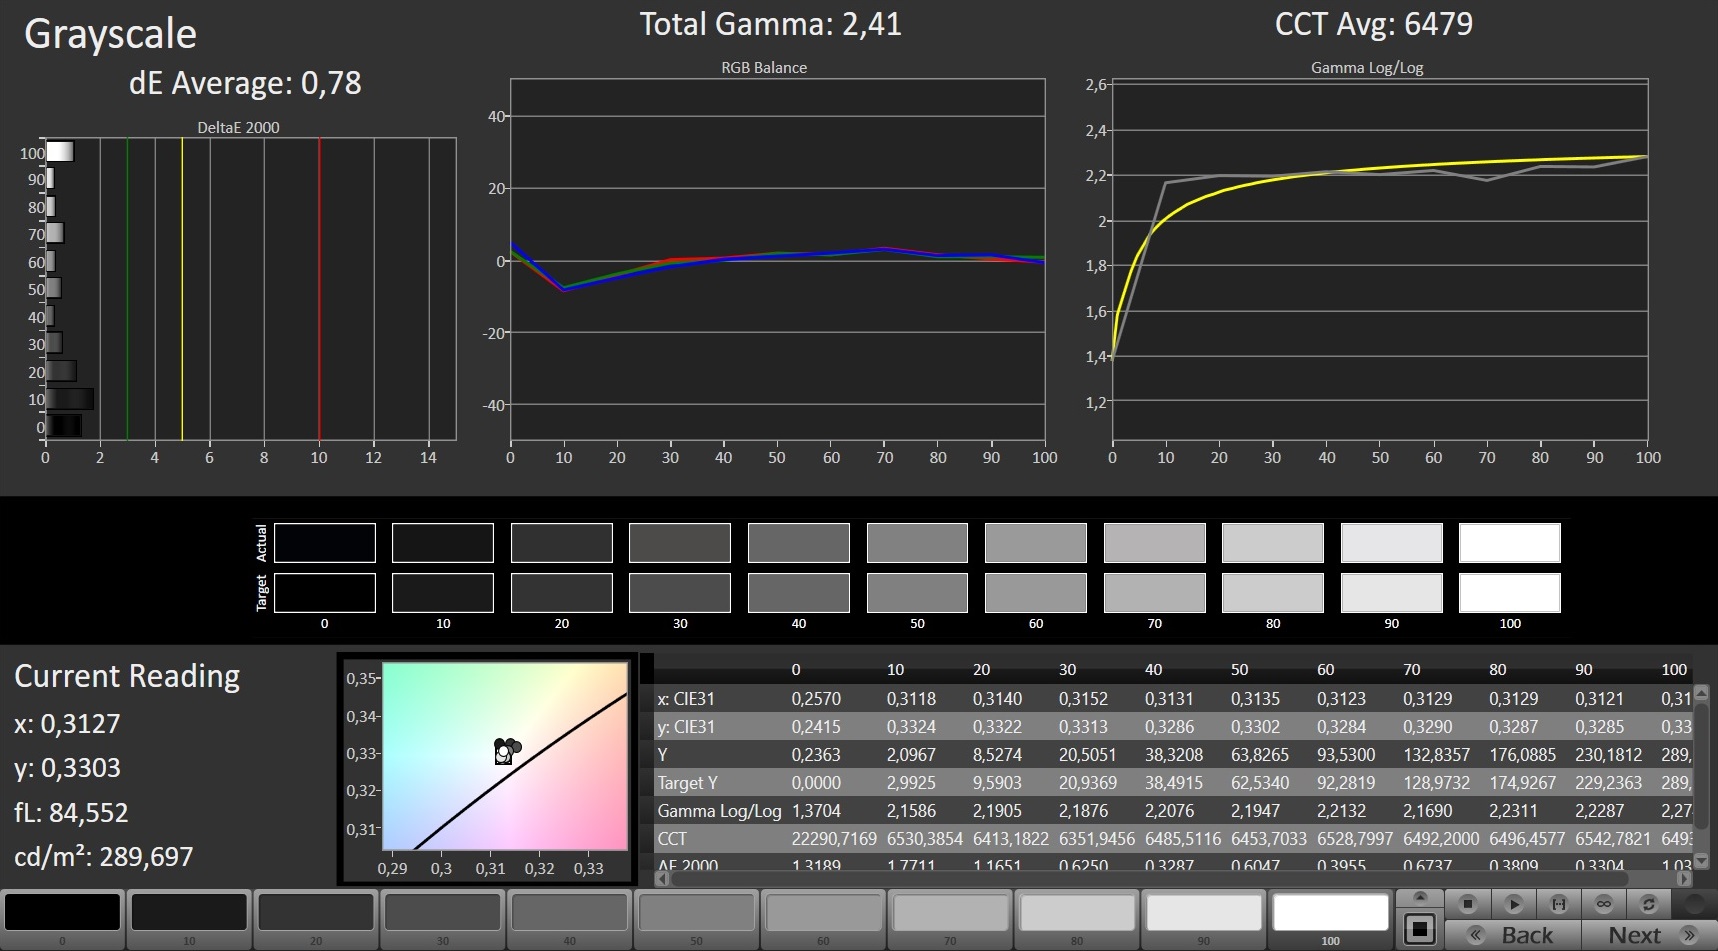
calibrated: 0.95
ΔE Greyscale Calman: 4.1 | ∀{0.09-98 Ø4.96}
96% sRGB (Argyll 1.6.3 3D)
61% AdobeRGB 1998 (Argyll 1.6.3 3D)
65.8% AdobeRGB 1998 (Argyll 3D)
96% sRGB (Argyll 3D)
64.8% Display P3 (Argyll 3D)
Gamma: 2.55
CCT: 7260 K
| Lenovo Legion Y740-17IRH LG Philips LP173WFG-SPD2 (LGD05E0), IPS, 1920x1080 | Lenovo Legion Y740-17ICH AU Optronics B173HAN03.2, IPS, 1920x1080 | Asus Strix Hero III G731GV AU Optronics AUO B173HAN04.0, IPS, 1920x1080 | MSI GL75 9SEK-056US AU Optronics AUO479D (B173HAN04.7), IPS, 1920x1080 | Schenker XMG Core 17 LG Philips LP173WFG-SPB1 (LGD0615), IPS, 1920x1080 | Dell G7 17 7790 AU Optronics AUO409D, B173HAN, IPS, 1920x1080 | HP Pavilion Gaming 17-cd0085cl BOE0825, IPS, 1920x1080 | |
|---|---|---|---|---|---|---|---|
| Display | -3% | -5% | -36% | -0% | -5% | -3% | |
| Display P3 Coverage (%) | 64.8 | 64 -1% | 62.9 -3% | 41.12 -37% | 64.4 -1% | 61.9 -4% | 63.3 -2% |
| sRGB Coverage (%) | 96 | 90.4 -6% | 87.2 -9% | 61.1 -36% | 95.6 0% | 89.6 -7% | 90.2 -6% |
| AdobeRGB 1998 Coverage (%) | 65.8 | 64.8 -2% | 63.8 -3% | 42.49 -35% | 65.6 0% | 63.2 -4% | 64.3 -2% |
| Response Times | -10% | 24% | -97% | 9% | -12% | -95% | |
| Response Time Grey 50% / Grey 80% * (ms) | 14.8 ? | 15.6 ? -5% | 6.8 ? 54% | 26 ? -76% | 14.4 ? 3% | 17.2 ? -16% | 31.6 ? -114% |
| Response Time Black / White * (ms) | 11.2 ? | 12.8 ? -14% | 12 ? -7% | 24.4 ? -118% | 9.6 ? 14% | 12 ? -7% | 19.6 ? -75% |
| PWM Frequency (Hz) | |||||||
| Screen | -36% | -19% | -47% | 3% | -22% | -24% | |
| Brightness middle (cd/m²) | 282 | 299.1 6% | 312.3 11% | 259.1 -8% | 329 17% | 308.6 9% | 299.6 6% |
| Brightness (cd/m²) | 261 | 273 5% | 297 14% | 261 0% | 286 10% | 299 15% | 285 9% |
| Brightness Distribution (%) | 87 | 81 -7% | 91 5% | 93 7% | 79 -9% | 92 6% | 86 -1% |
| Black Level * (cd/m²) | 0.27 | 0.27 -0% | 0.21 22% | 0.25 7% | 0.3 -11% | 0.29 -7% | 0.33 -22% |
| Contrast (:1) | 1044 | 1108 6% | 1487 42% | 1036 -1% | 1097 5% | 1064 2% | 908 -13% |
| Colorchecker dE 2000 * | 3.18 | 5.07 -59% | 3.6 -13% | 4.23 -33% | 2.52 21% | 4.26 -34% | 3.68 -16% |
| Colorchecker dE 2000 max. * | 8.39 | 10.55 -26% | 6.74 20% | 23.39 -179% | 6.9 18% | 7.83 7% | 8.05 4% |
| Colorchecker dE 2000 calibrated * | 0.95 | 3.31 -248% | 3.95 -316% | 3.9 -311% | 1.31 -38% | 2.93 -208% | 3.15 -232% |
| Greyscale dE 2000 * | 4.1 | 6.8 -66% | 3.1 24% | 1.3 68% | 2.98 27% | 5 -22% | 3.8 7% |
| Gamma | 2.55 86% | 2.46 89% | 2.26 97% | 2.076 106% | 2.38 92% | 2.07 106% | 2.12 104% |
| CCT | 7260 90% | 7805 83% | 7002 93% | 6542 99% | 6738 96% | 7488 87% | 7240 90% |
| Color Space (Percent of AdobeRGB 1998) (%) | 61 | 58.5 -4% | 56.6 -7% | 39 -36% | 60 -2% | 57.8 -5% | 58.1 -5% |
| Color Space (Percent of sRGB) (%) | 96 | 89.9 -6% | 86.6 -10% | 61 -36% | 95 -1% | 89.2 -7% | 89.8 -6% |
| Total Average (Program / Settings) | -16% /
-27% | 0% /
-11% | -60% /
-52% | 4% /
3% | -13% /
-18% | -41% /
-29% |
* ... smaller is better
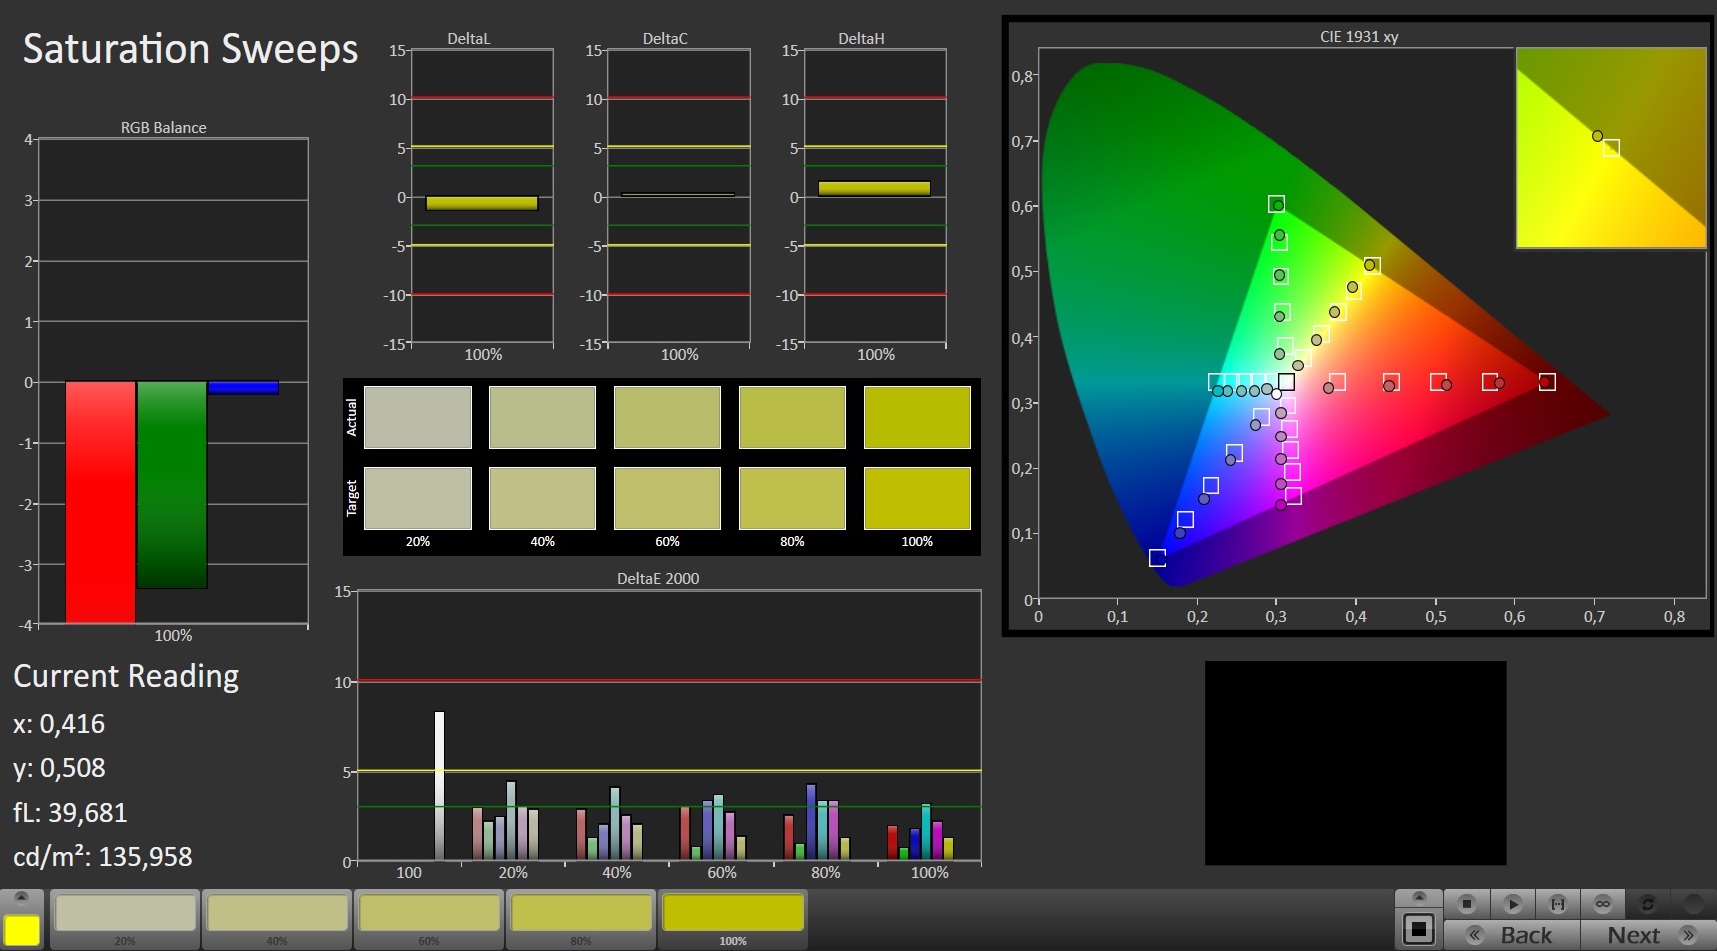
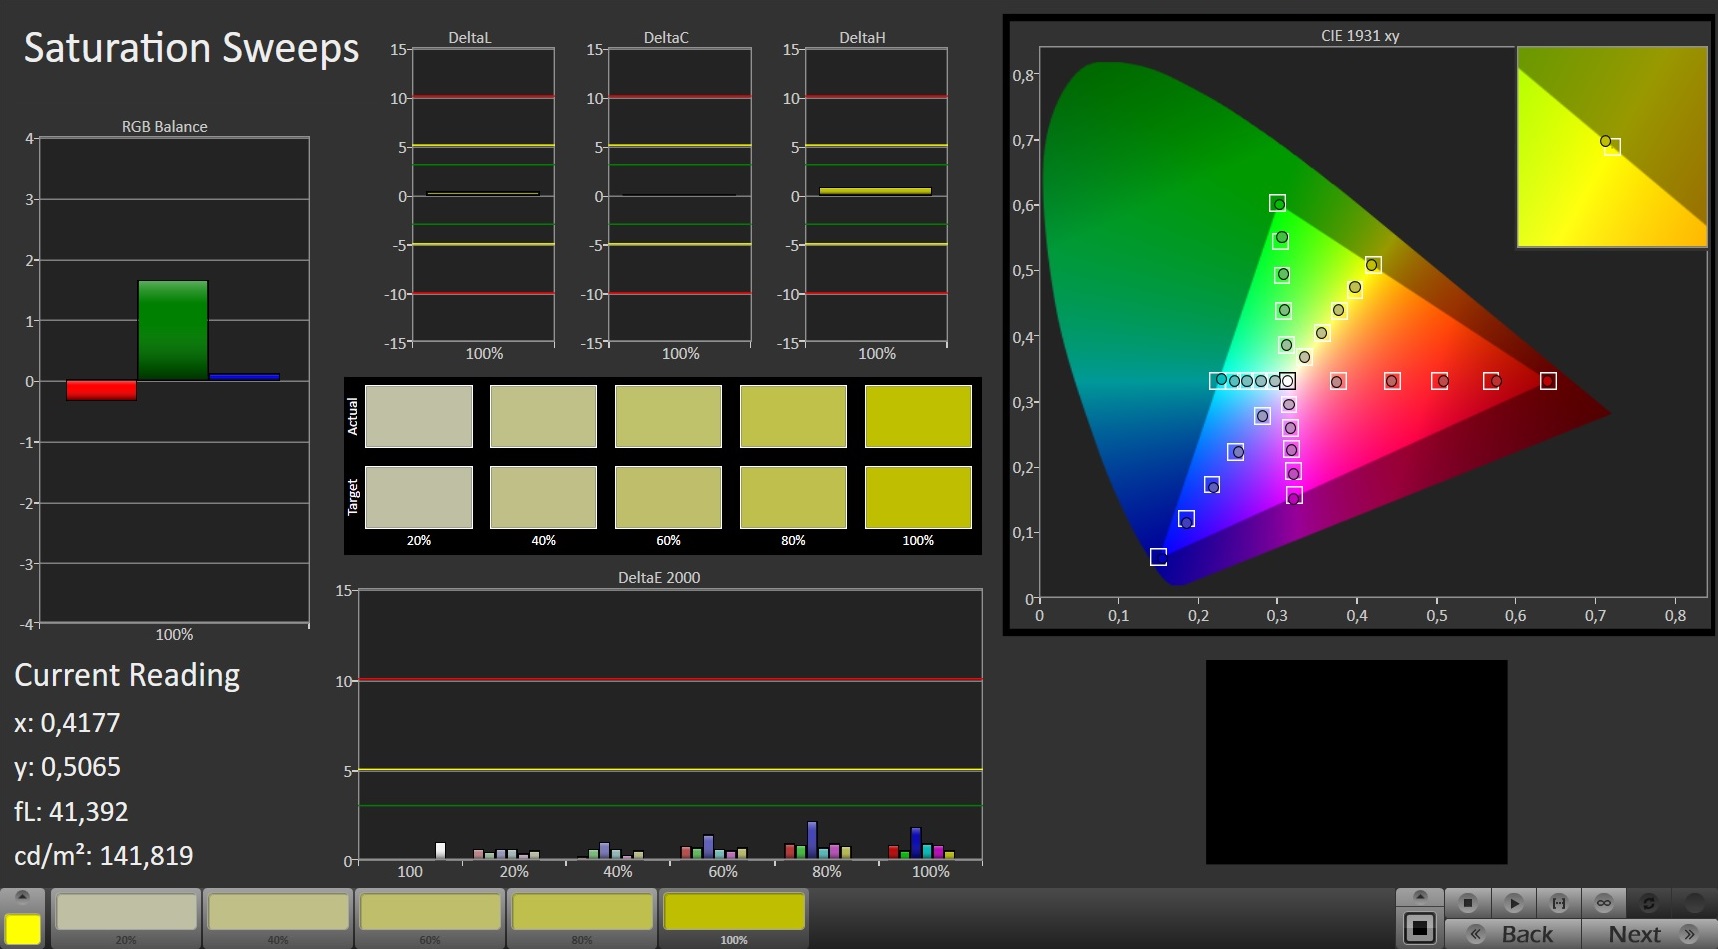
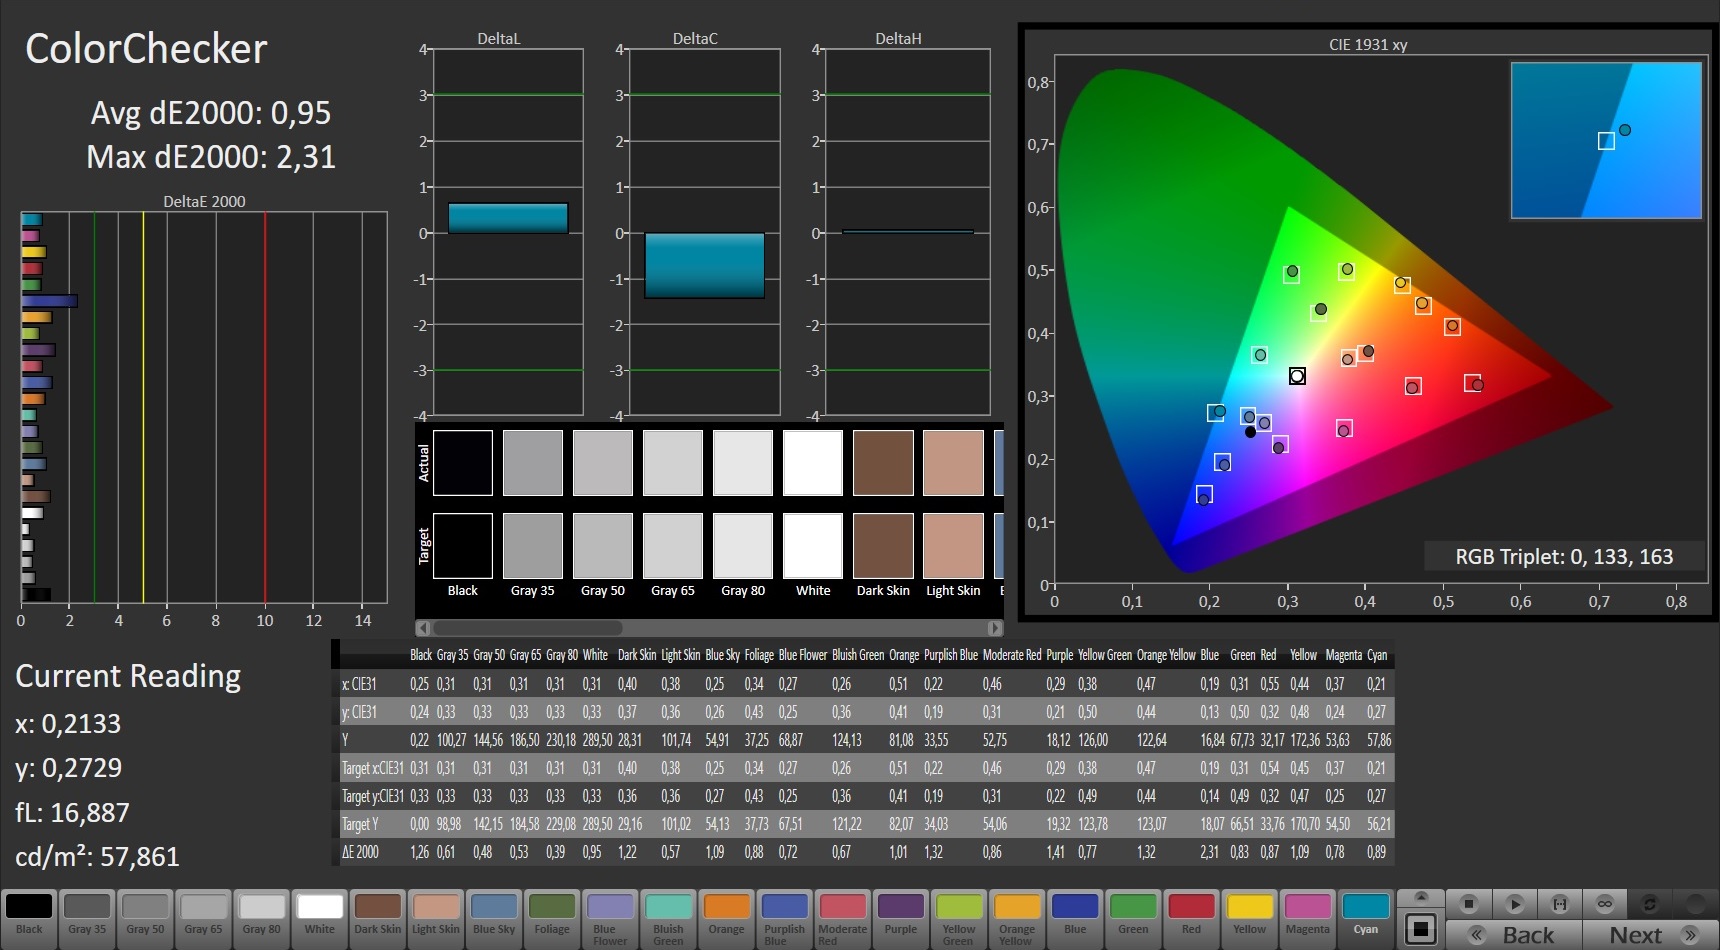
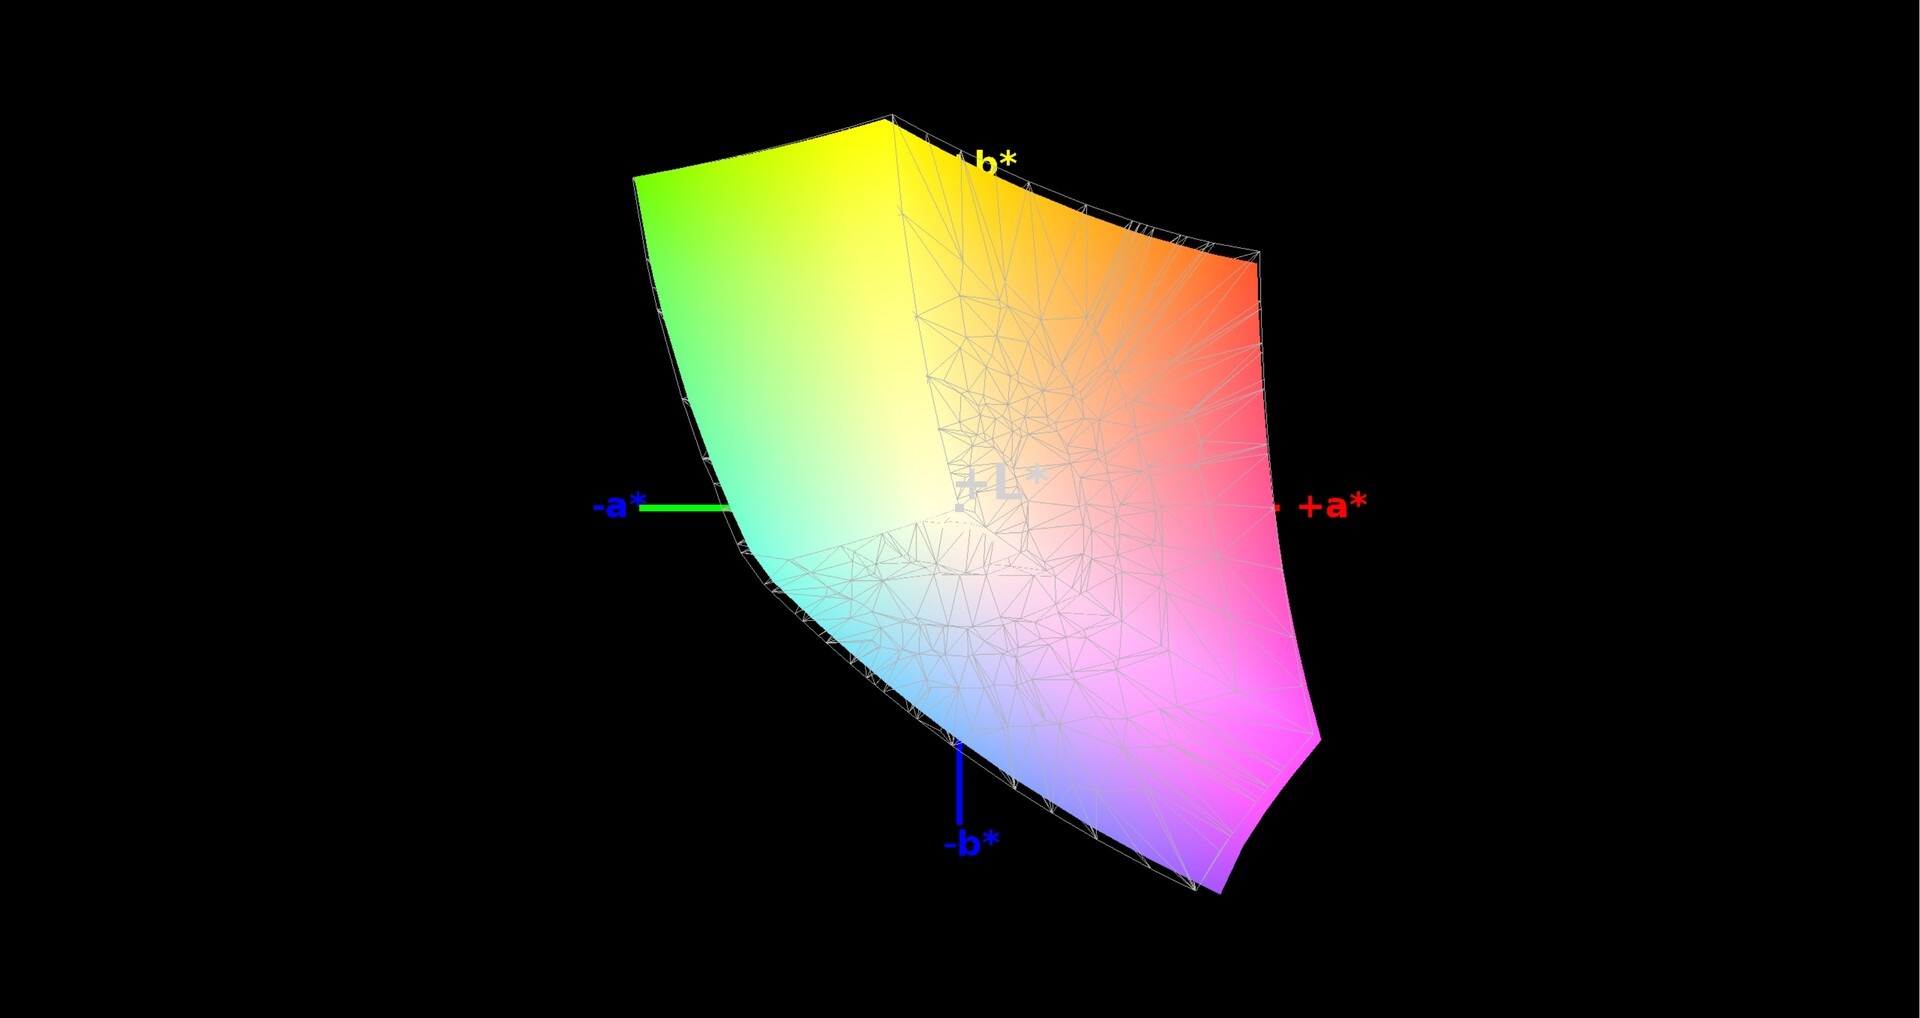
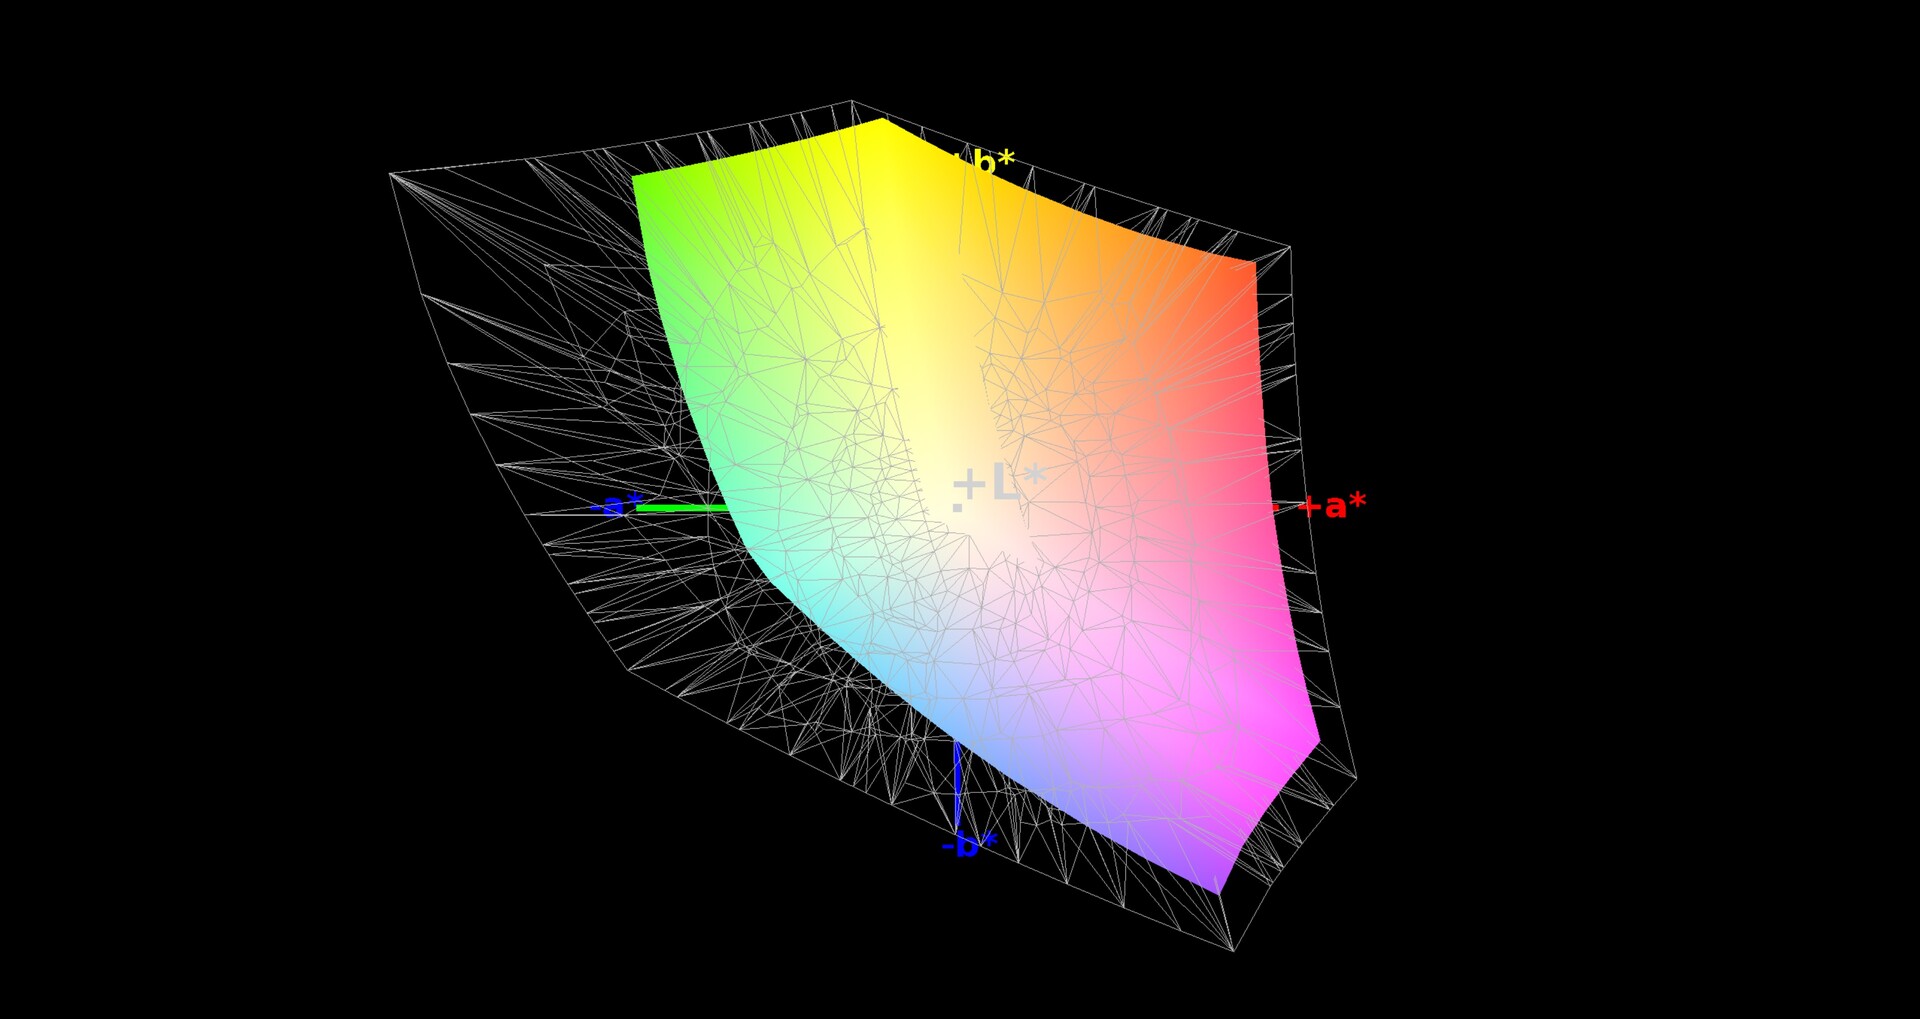
The display of the Legion already has good color reproduction ex-works. Our DeltaE 2000 measurements show a color deviation of 3.18, which is very close to the ideal value of below 3. Calibrating the display further improves color reproduction and results in a color deviation of 0.9 and more balanced grayscales. The color spaces AdobeRGB and sRGB are not covered entirely. We measured coverage of 61% of the AdobeRGB color space and 96% of the sRGB color space.
Display Response Times
| ↔ Response Time Black to White | ||
|---|---|---|
| 11.2 ms ... rise ↗ and fall ↘ combined | ↗ 6 ms rise | 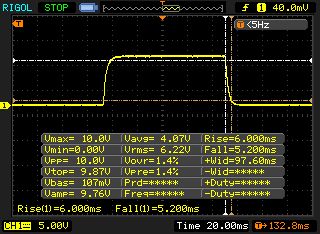 |
| ↘ 5.2 ms fall | ||
| The screen shows good response rates in our tests, but may be too slow for competitive gamers. In comparison, all tested devices range from 0.1 (minimum) to 240 (maximum) ms. » 30 % of all devices are better. This means that the measured response time is better than the average of all tested devices (19.8 ms). | ||
| ↔ Response Time 50% Grey to 80% Grey | ||
| 14.8 ms ... rise ↗ and fall ↘ combined | ↗ 7.6 ms rise | 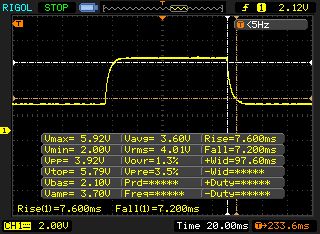 |
| ↘ 7.2 ms fall | ||
| The screen shows good response rates in our tests, but may be too slow for competitive gamers. In comparison, all tested devices range from 0.165 (minimum) to 636 (maximum) ms. » 29 % of all devices are better. This means that the measured response time is better than the average of all tested devices (30.9 ms). | ||
Screen Flickering / PWM (Pulse-Width Modulation)
| Screen flickering / PWM not detected | 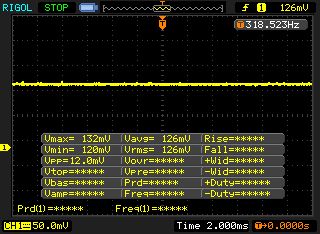 | ||
In comparison: 52 % of all tested devices do not use PWM to dim the display. If PWM was detected, an average of 7744 (minimum: 5 - maximum: 343500) Hz was measured. | |||
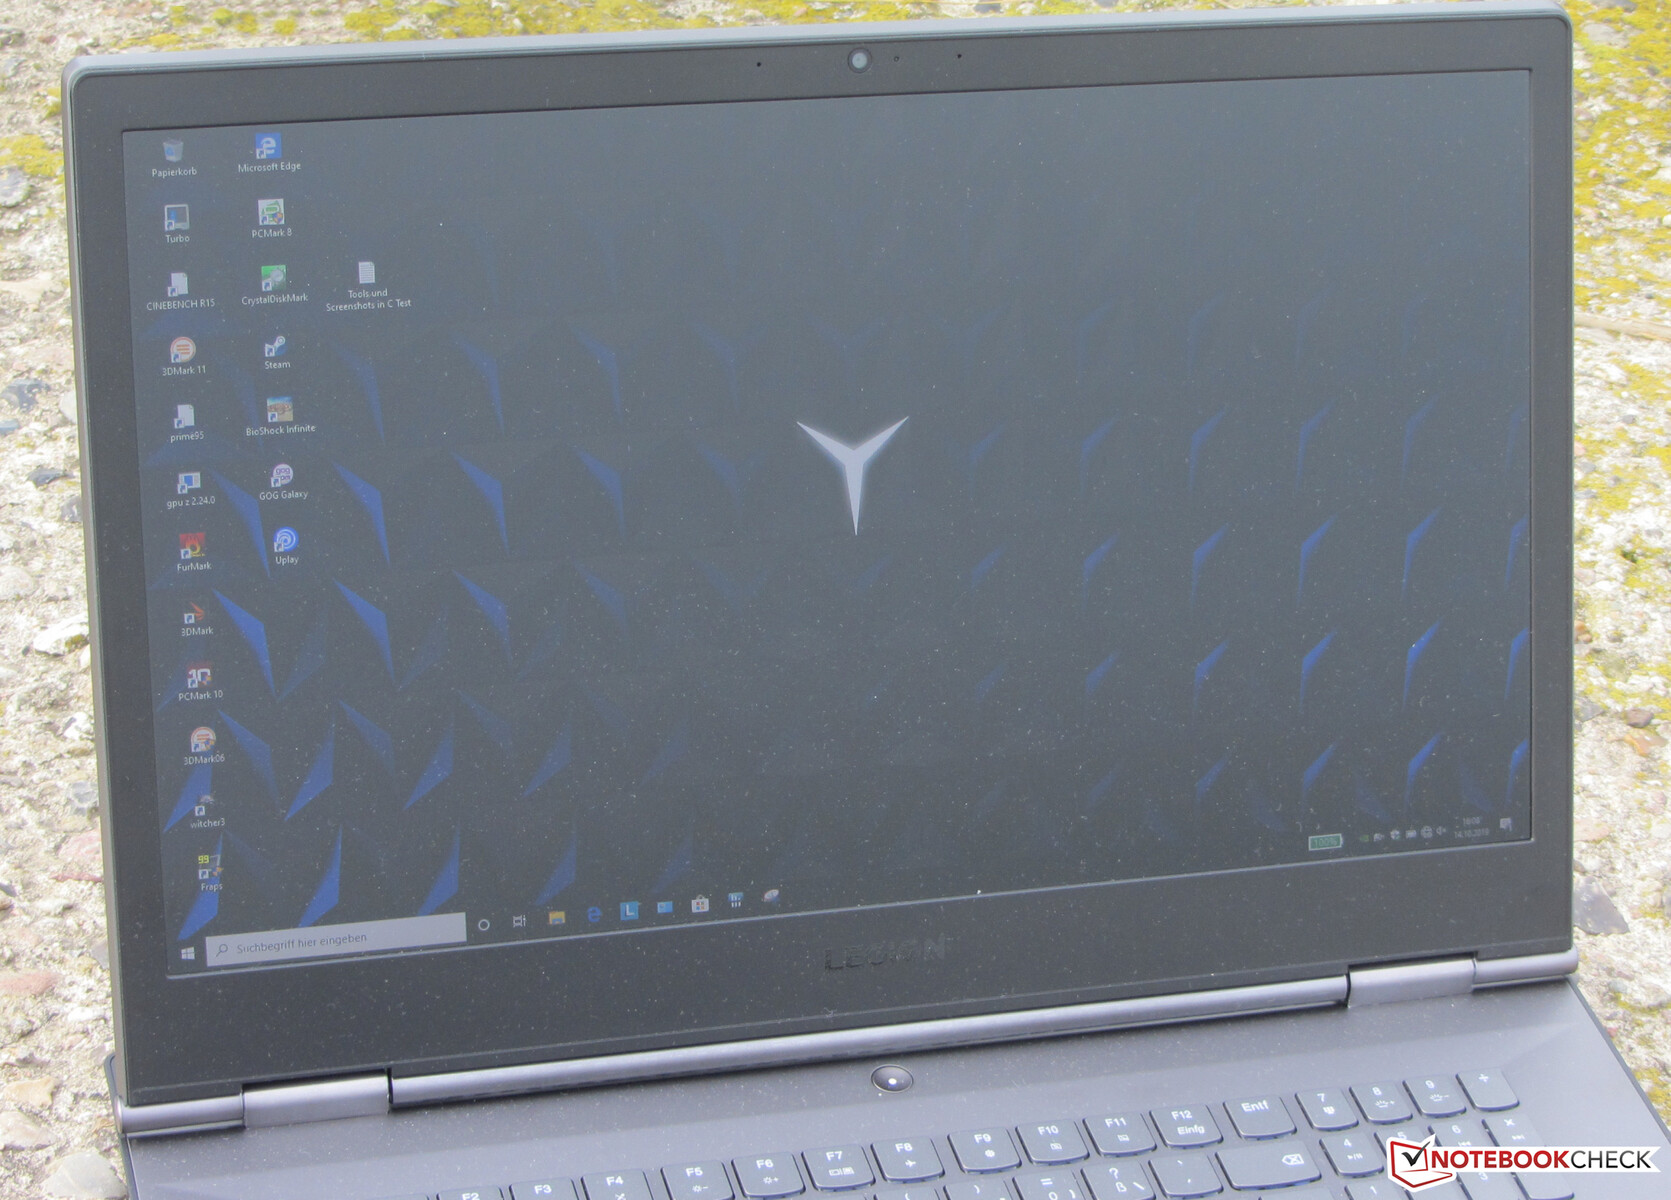
The Lenovo notebook is equipped with an IPS panel with stable viewing angles. This means that the screen can be read from any position. It's also possible to read the screen outdoors, provided the sun is not shining too bright.

Performance - Lenovo laptop offers sufficient performance for the coming years
The Lenovo Y740-17IRHg is a 17.3-inch gaming notebook that displays all current games smoothly and also does a good job in all other areas of use. Our test unit is available for around $1500. Users can choose from a variety of configurations.

Testing Conditions
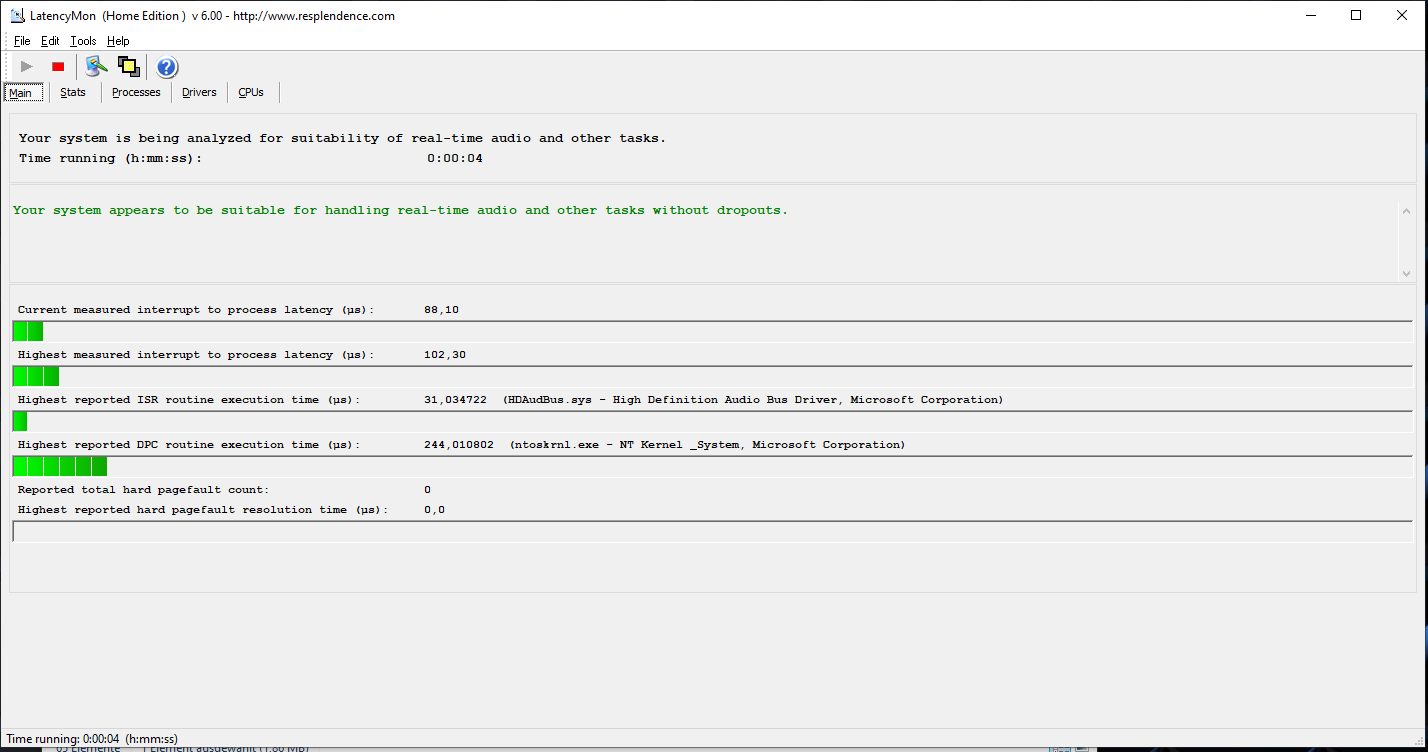
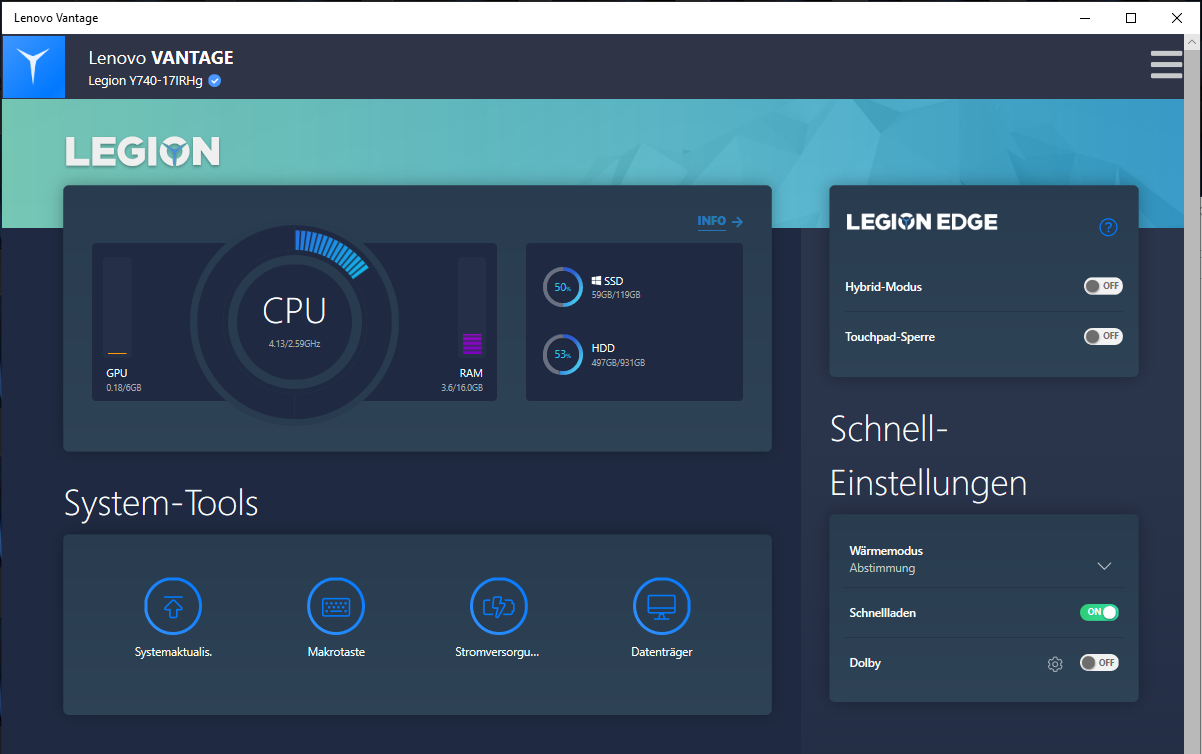
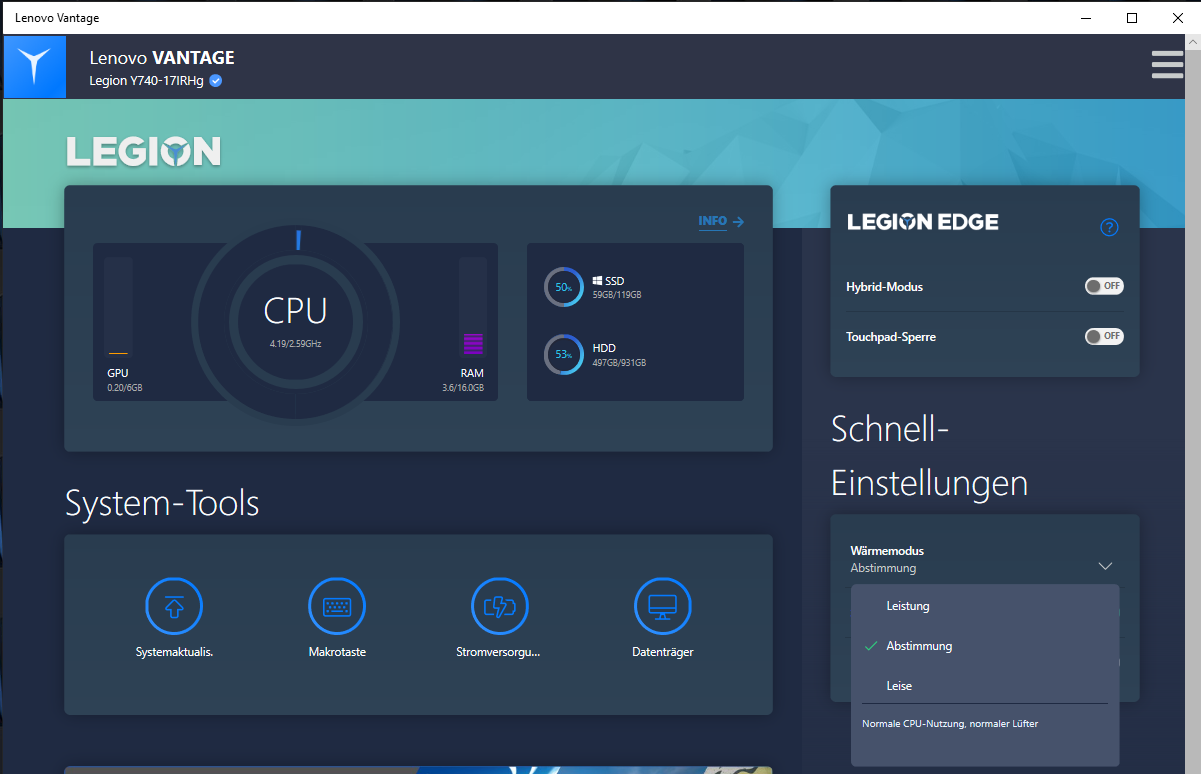
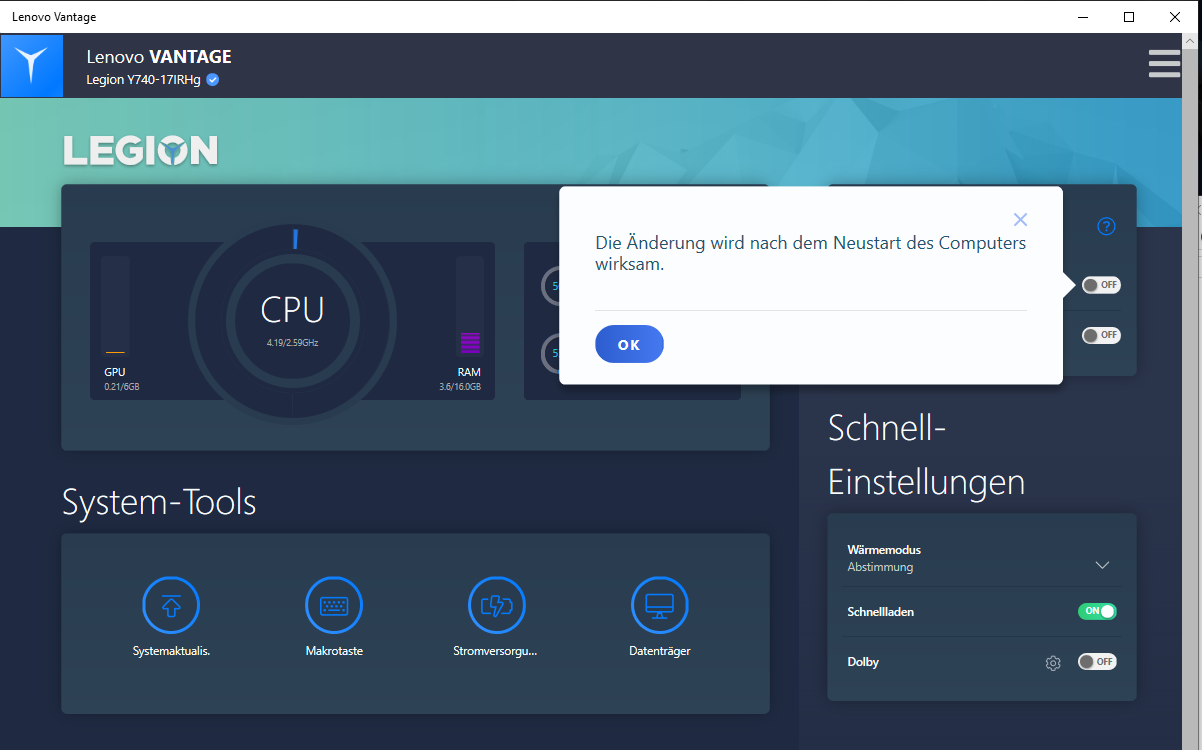
The preinstalled Lenovo Vantage software enables users to switch between various thermal modes, influencing fan use and power delivery. We ran our tests in the "balanced" mode. The other available modes are "quiet" and "performance".
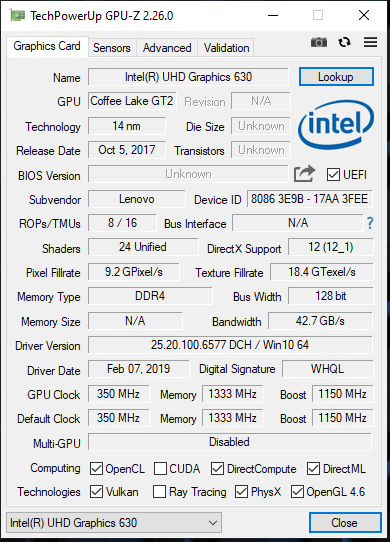
The UHD Graphics 630 GPU, which is integrated in the processor, is disabled at delivery. This means that the notebook does not work with Nvidia's graphics-switching technology Optimus. You can, however, activate the iGPU (and thereby Optimus) via the Lenovo Vantage software. This has a positive impact on the battery life of the notebook.
Processor
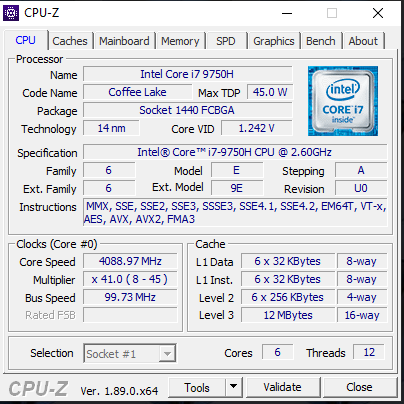
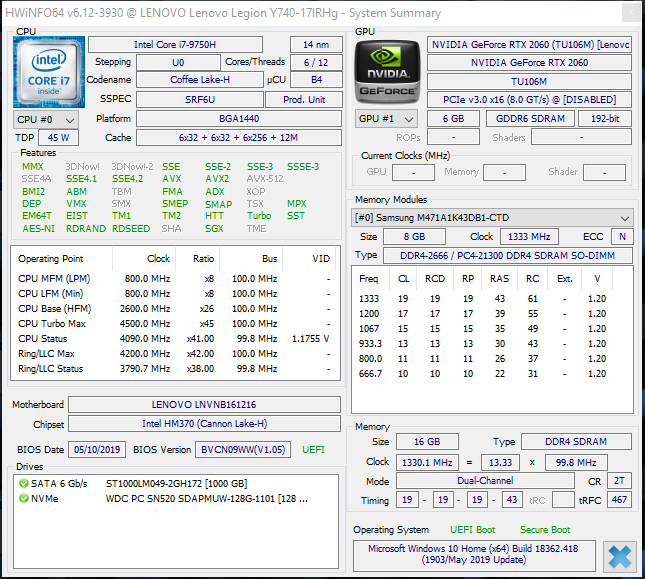
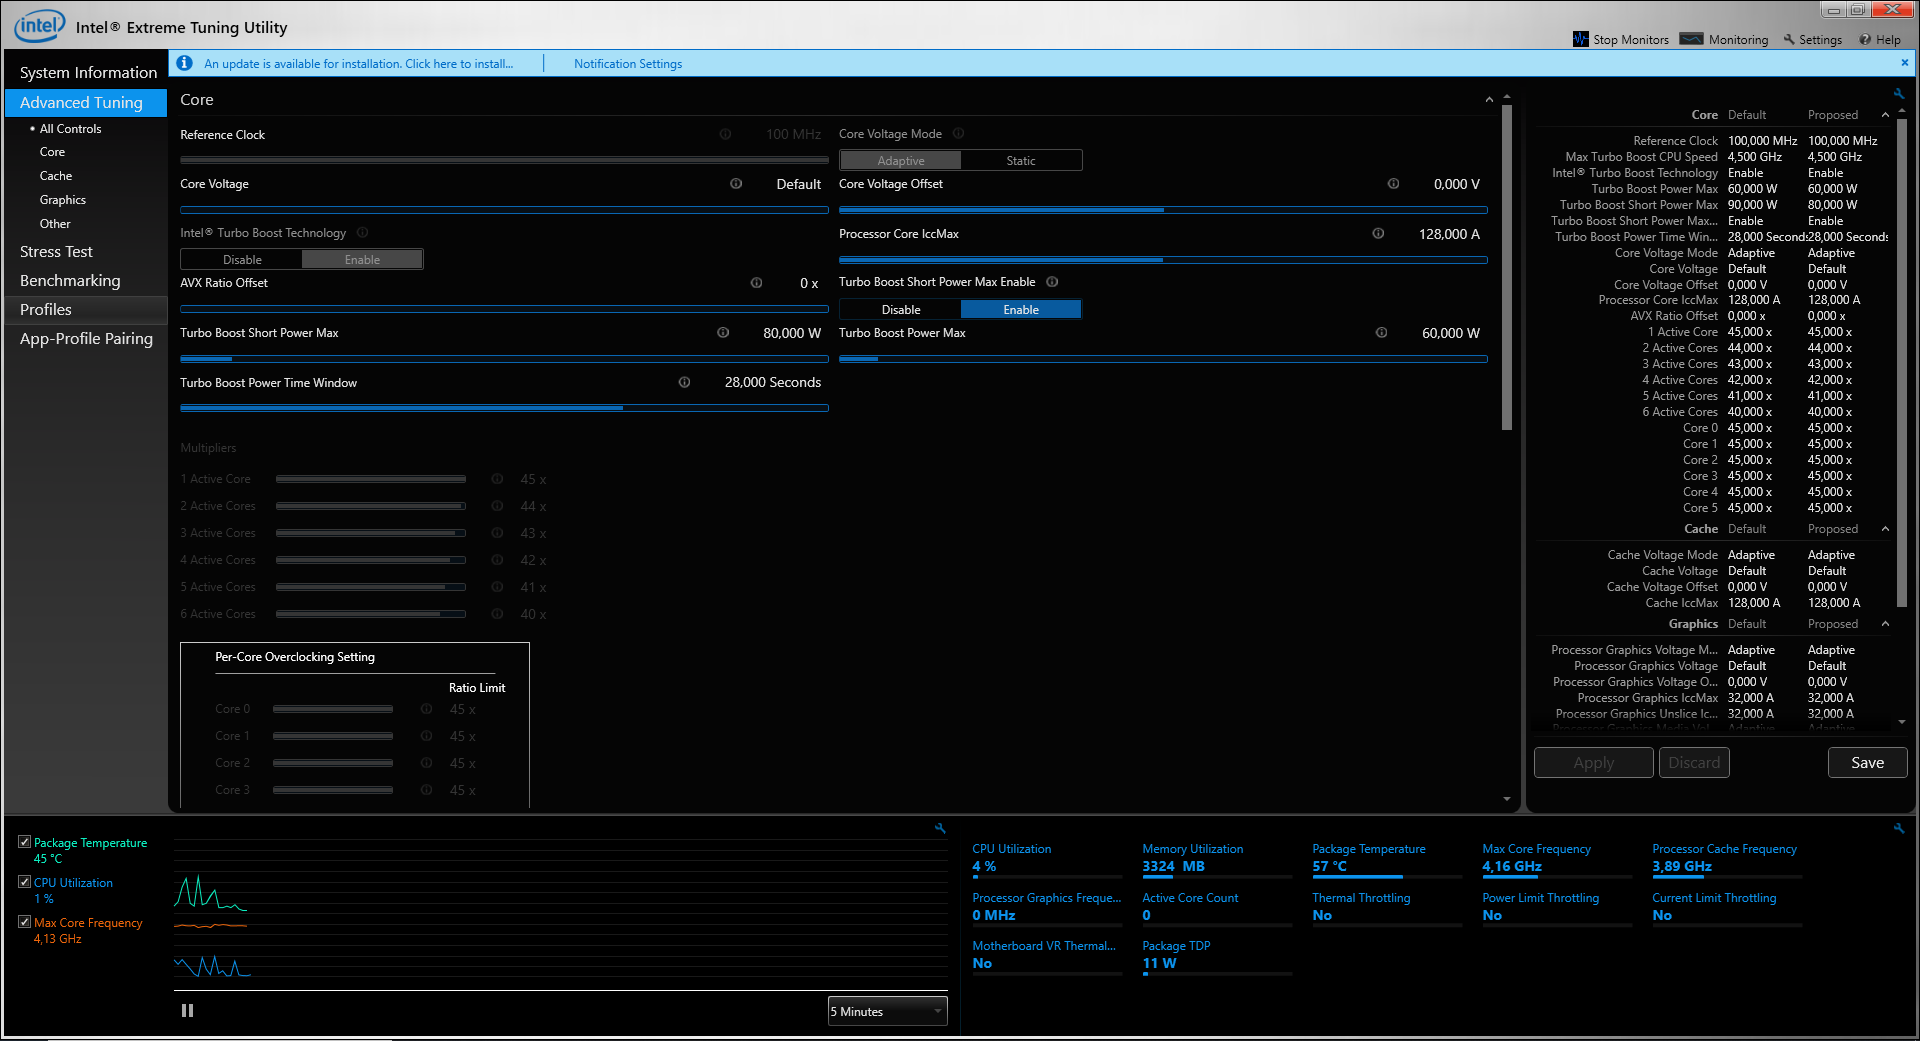
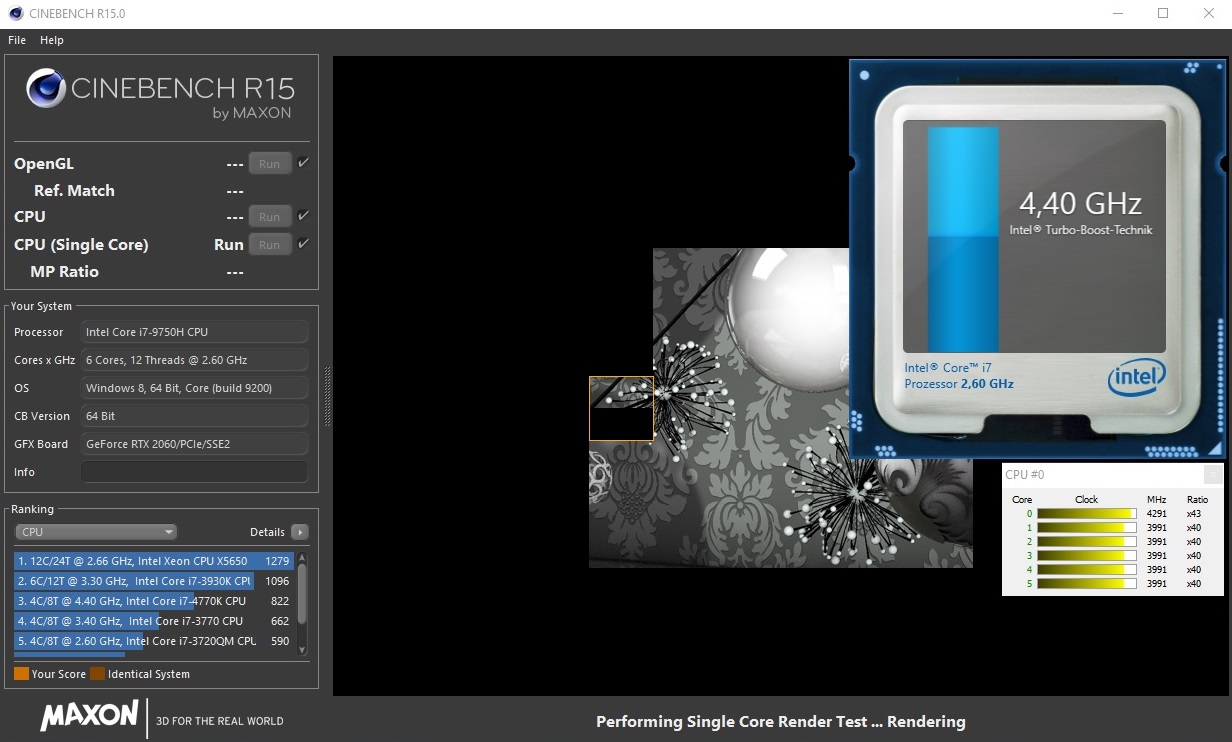
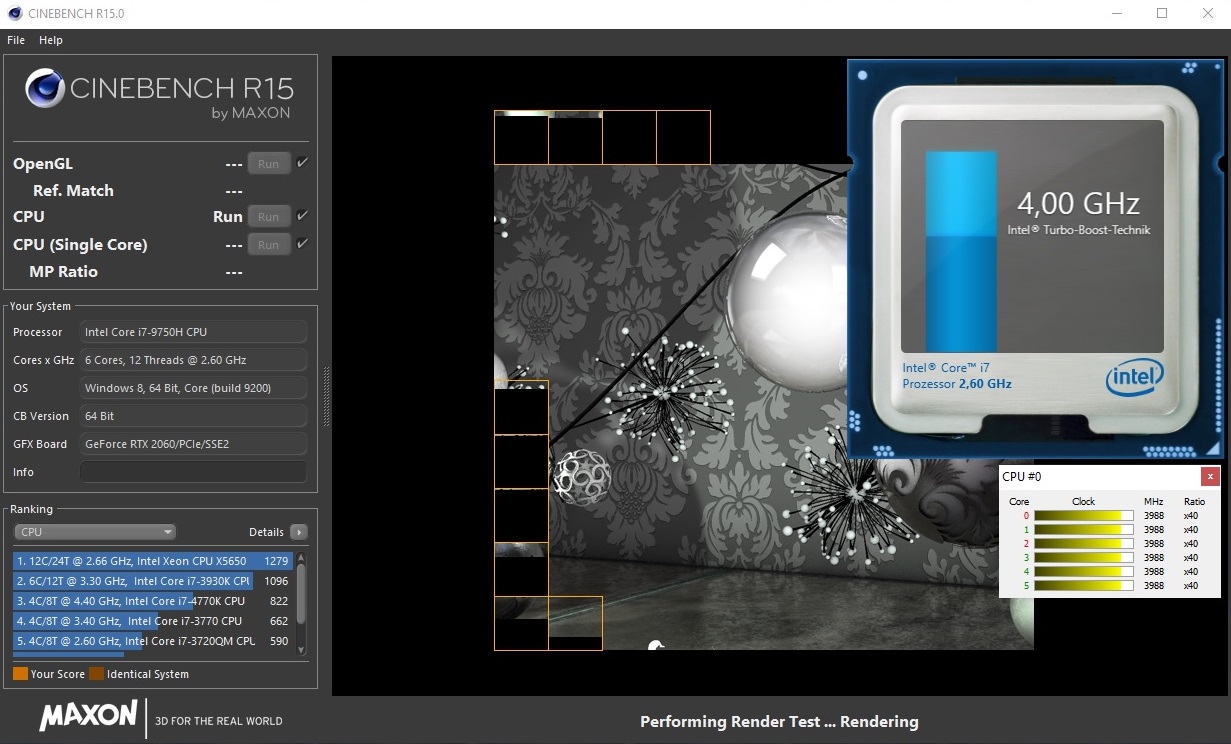
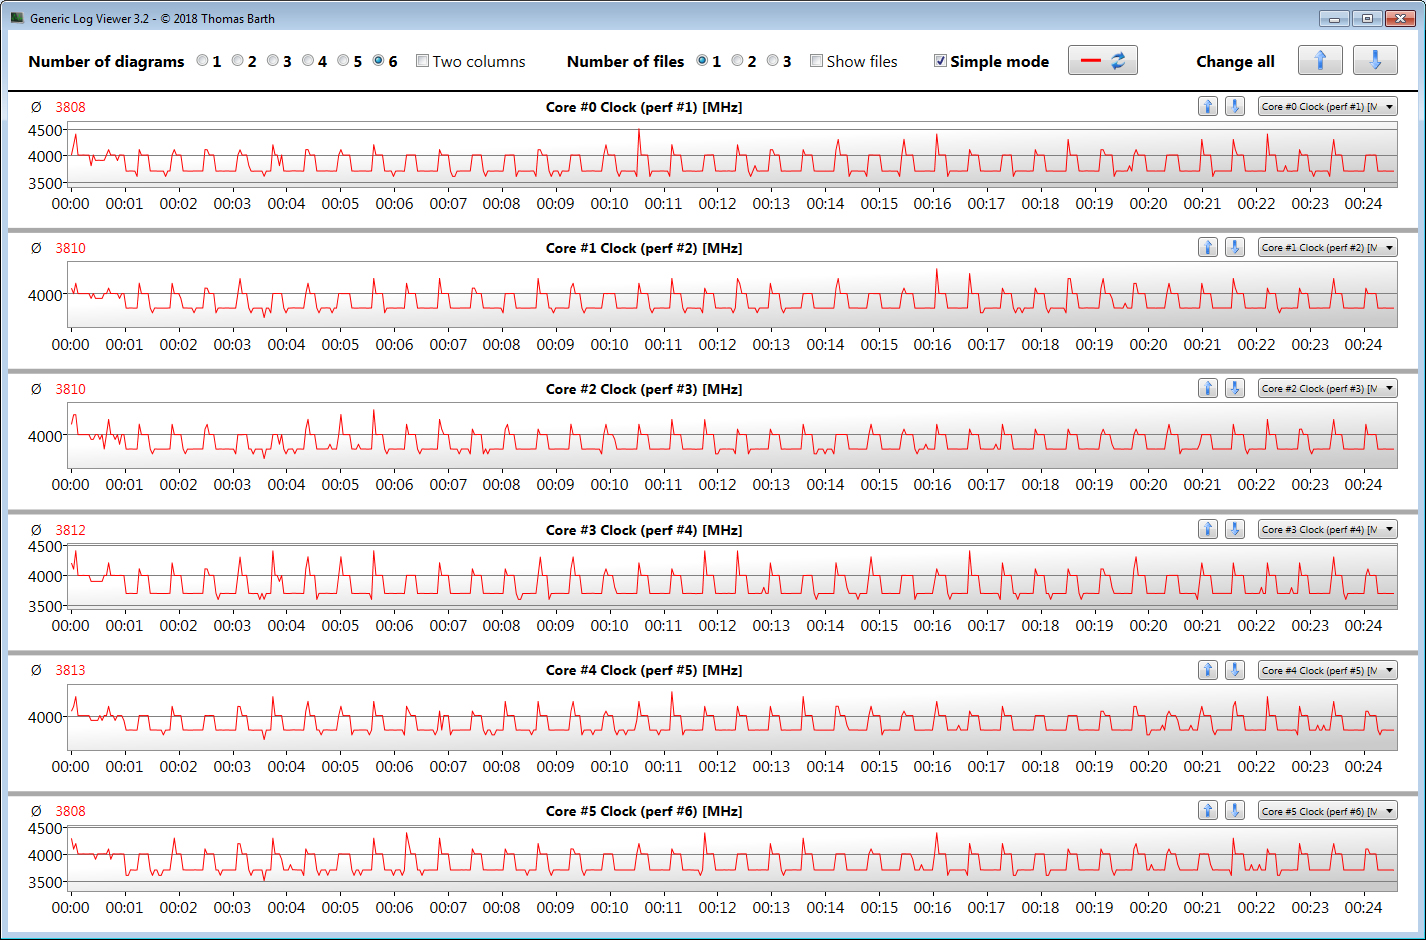
The notebook is powered by the six-core processor Core i7-9750H (Coffee Lake Refresh). The CPU clocks at a base rate of 2.6 GHz. The clock rate can be increased to 4 GHz (six cores), 4.1 GHz (five cores), 4.2 GHz (four cores), 4.3 GHz (three cores), 4.4 GHz (two cores) or 4.5 GHz (one core) via the Turbo Boost.
The processor works at a clock rate of 3.8 - 4 GHz during our Cinebench R15 multithread test and at 4 - 4.5 GHz during the single-thread test. The clock rate drops to 2.6 - 4 GHz (multithread) and 4 - 4.3 GHz (single-thread) when running on battery.
We try to find out whether the CPU can continue using its turbo over a long period of time when connected to the socket by running the Cinebench R15 test in a loop for at least 30 minutes. The results drop slightly from the first to the seventh round but then stabilize and remain fairly stable for the remainder of the test. This means that the CPU continues using the turbo.
Activating the thermal mode "performance" within the Lenovo Vantage software does not improve the results. However, the trajectory of CB15 results is somewhat smoother.
| Cinebench R10 | |
| Rendering Single 32Bit | |
| Average of class Gaming (7457 - 12575, n=9, last 2 years) | |
| Lenovo Legion Y740-17IRH | |
| Schenker XMG Core 17 | |
| Rendering Multiple CPUs 32Bit | |
| Average of class Gaming (42932 - 102066, n=9, last 2 years) | |
| Lenovo Legion Y740-17IRH | |
| Schenker XMG Core 17 | |
| Geekbench 3 | |
| 32 Bit Multi-Core Score | |
| Lenovo Legion Y740-17IRH | |
| Schenker XMG Core 17 | |
| 32 Bit Single-Core Score | |
| Schenker XMG Core 17 | |
| Lenovo Legion Y740-17IRH | |
| Geekbench 4.4 | |
| 64 Bit Multi-Core Score | |
| Average of class Gaming (89200 - 101054, n=3, last 2 years) | |
| Lenovo Legion Y740-17IRH | |
| Schenker XMG Core 17 | |
| 64 Bit Single-Core Score | |
| Average of class Gaming (9335 - 9775, n=3, last 2 years) | |
| Schenker XMG Core 17 | |
| Lenovo Legion Y740-17IRH | |
| Geekbench 5.0 | |
| 5.0 Multi-Core | |
| Average of class Gaming (21768 - 28184, n=3, last 2 years) | |
| Lenovo Legion Y740-17IRH | |
| 5.0 Single-Core | |
| Average of class Gaming (2237 - 2318, n=3, last 2 years) | |
| Lenovo Legion Y740-17IRH | |
| Mozilla Kraken 1.1 - Total | |
| Asus Strix Hero III G731GV (Edge 44.17763.1.0) | |
| Lenovo Legion Y740-17ICH (Edge 44.17763.1.0) | |
| MSI GL75 9SEK-056US (Microsoft Edge 44.17763.1.0) | |
| Lenovo Legion Y740-17IRH (Edge 44) | |
| Schenker XMG Core 17 (Edge 44) | |
| HP Pavilion Gaming 17-cd0085cl (Edge 44.17763.1.0) | |
| Average of class Gaming (391 - 590, n=100, last 2 years) | |
| Octane V2 - Total Score | |
| Average of class Gaming (93292 - 139447, n=26, last 2 years) | |
| HP Pavilion Gaming 17-cd0085cl (Edge 44.17763.1.0) | |
| Schenker XMG Core 17 (Edge 44) | |
| Lenovo Legion Y740-17IRH (Edge 44) | |
| MSI GL75 9SEK-056US (Microsoft Edge 44.17763.1.0) | |
| Lenovo Legion Y740-17ICH (Edge 44.17763.1.0) | |
| Asus Strix Hero III G731GV (Edge 44.17763.1.0) | |
| JetStream 1.1 - 1.1 Total | |
| Average of class Gaming (549 - 647, n=2, last 2 years) | |
| Schenker XMG Core 17 (Edge 44) | |
| HP Pavilion Gaming 17-cd0085cl (Edge 44.17763.1.0) | |
| MSI GL75 9SEK-056US (Microsoft Edge 44.17763.1.0) | |
| Lenovo Legion Y740-17IRH (Edge 44) | |
| Lenovo Legion Y740-17ICH (Edge 44.17763.1.0) | |
| Asus Strix Hero III G731GV (Edge 44.17763.1.0) | |
* ... smaller is better
System Performance
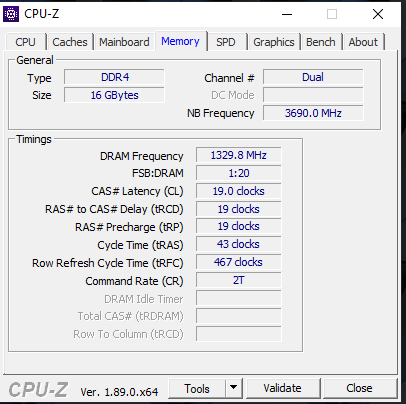
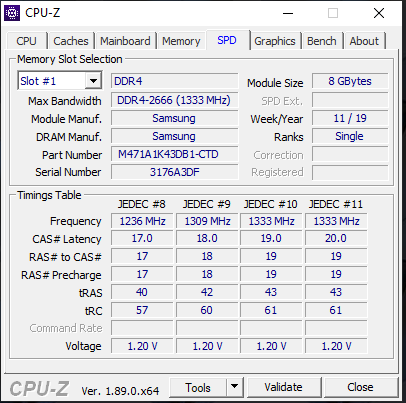
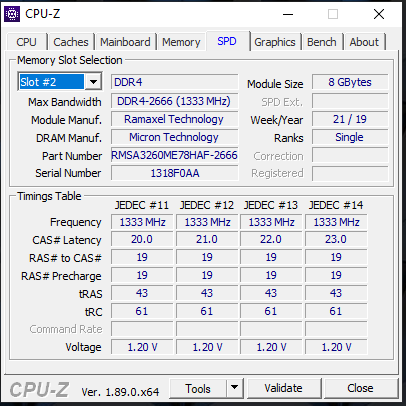
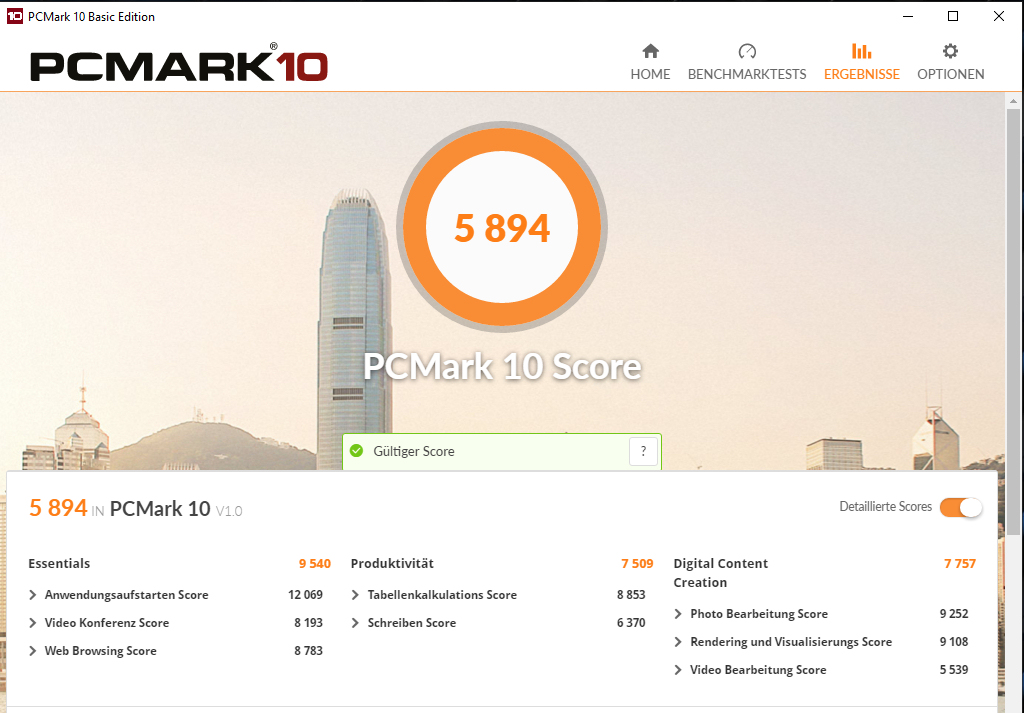
A strong six-core processor, RAM working in dual-channel mode and an NVMe SSD ensure a fast and smooth system. The very good PCMark results confirm that the Y740 offers plenty of computing power for applications beyond the realm of gaming.
| PCMark 8 Home Score Accelerated v2 | 4993 points | |
| PCMark 8 Creative Score Accelerated v2 | 6080 points | |
| PCMark 8 Work Score Accelerated v2 | 5931 points | |
| PCMark 10 Score | 5894 points | |
Help | ||
Storage Devices
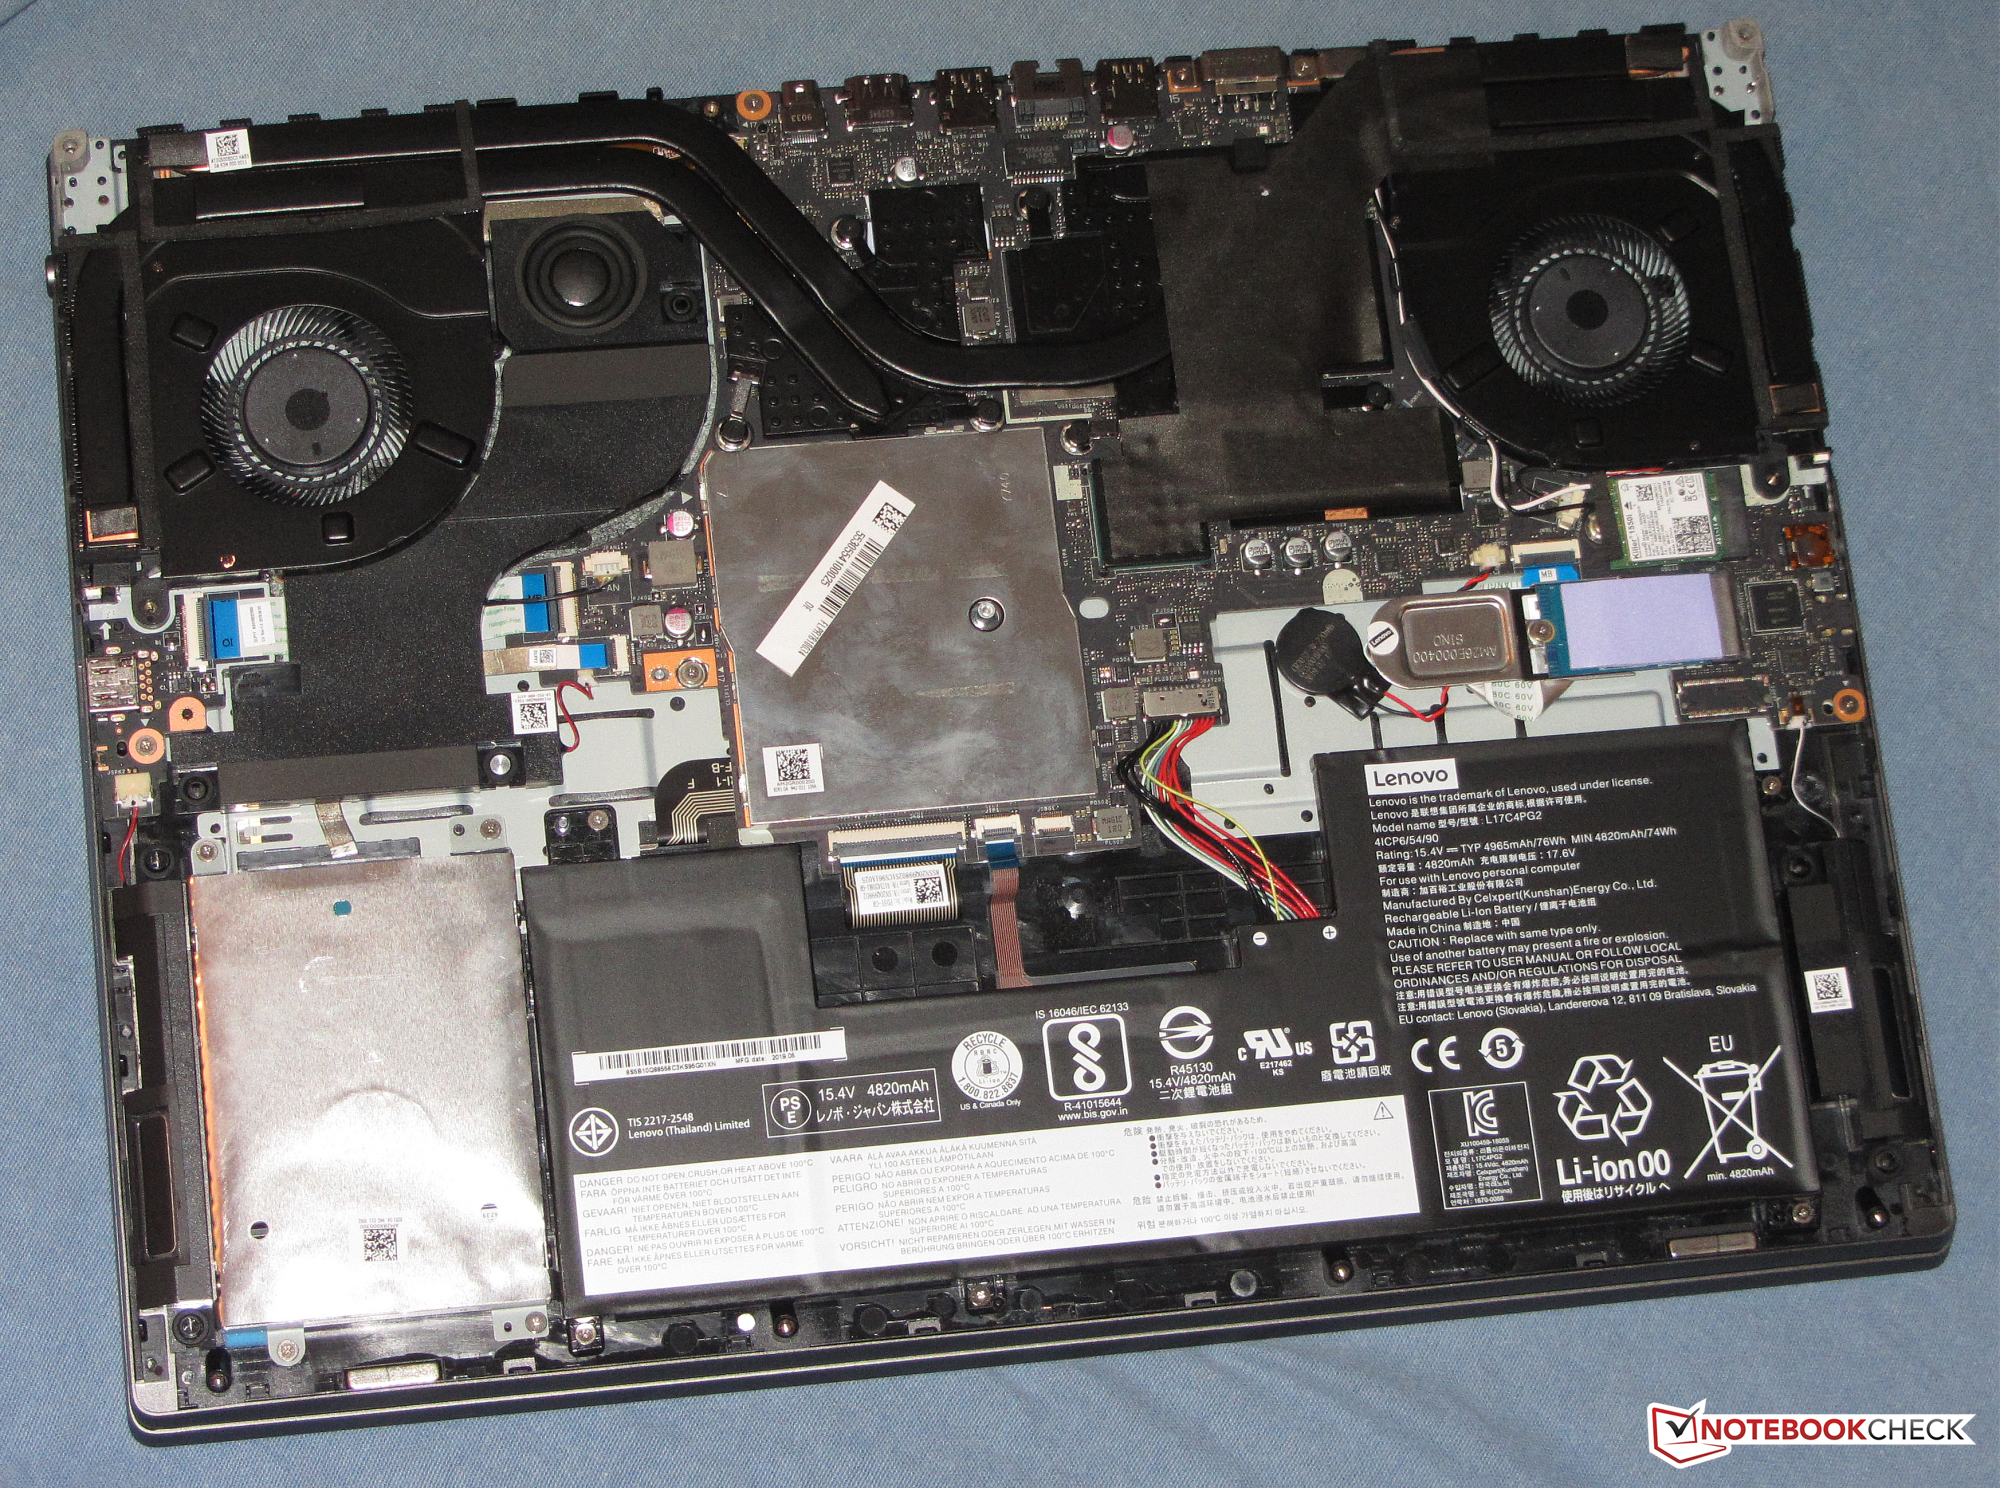
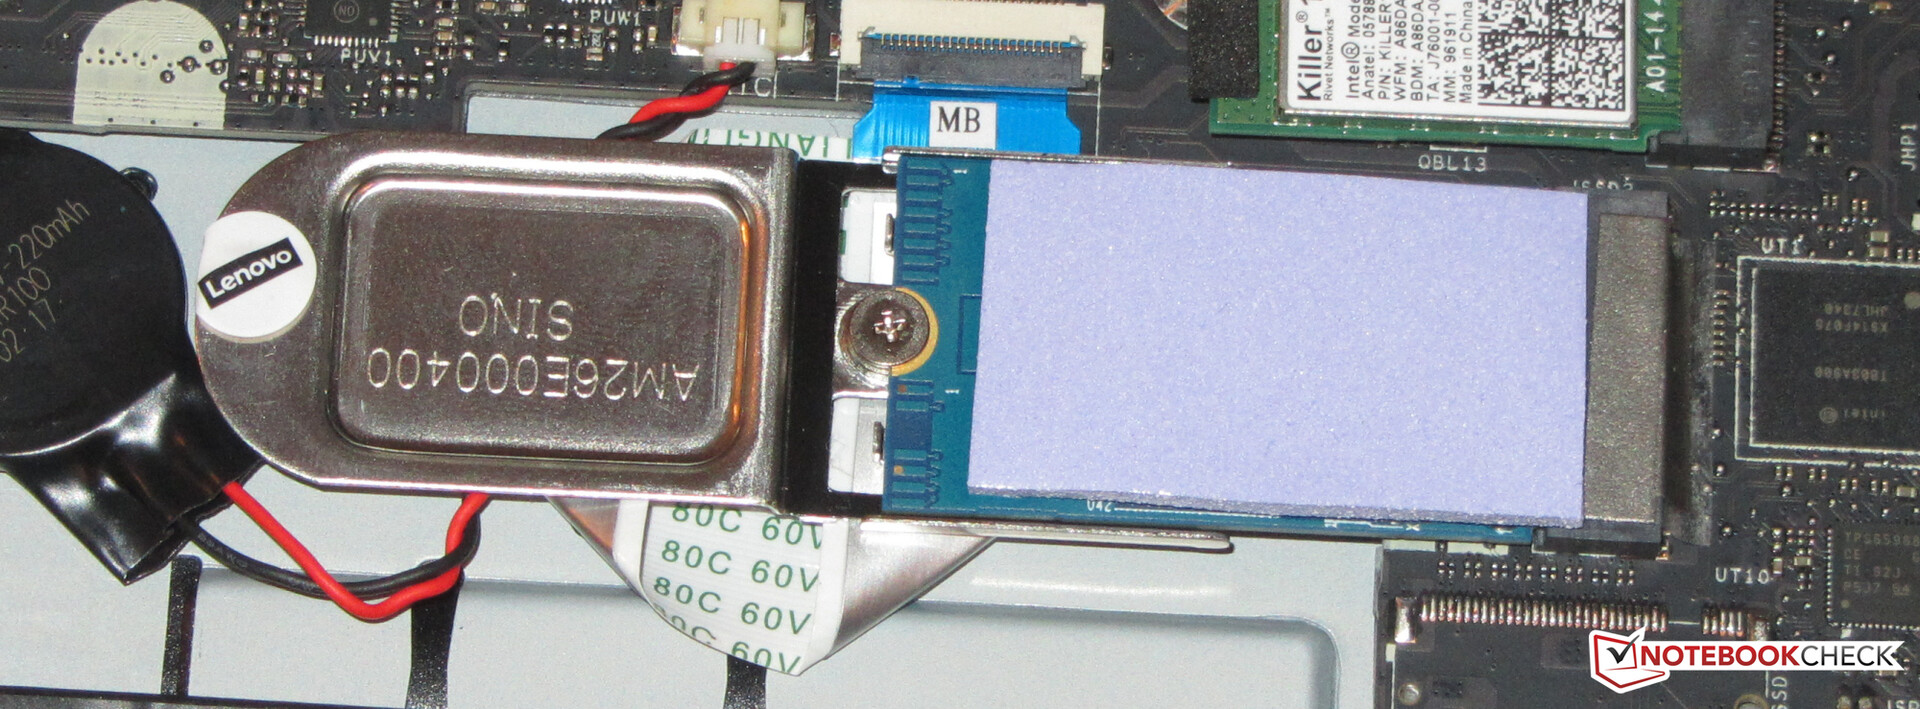
The primary hard drive is an NVMe SSD (M.2 2240) from Western Digital with a capacity of 128 GB. Around 86 GB of this is available at delivery. The device offers good transfer rates, although it cannot keep up with its top-of-the-range competitors. Our test unit is equipped with an additional 2.5-inch hard drive (1 TB 7200 rpm) in order to provide the necessary storage space for a gaming notebook.

| Lenovo Legion Y740-17IRH WDC PC SN520 SDAPMUW-128G | Lenovo Legion Y740-17ICH Samsung SSD PM981 MZVLB256HAHQ | Asus Strix Hero III G731GV Intel SSD 660p SSDPEKNW512G8 | MSI GL75 9SEK-056US WDC PC SN520 SDAPNUW-512G | Schenker XMG Core 17 Samsung SSD 970 EVO Plus 500GB | Dell G7 17 7790 Toshiba BG3 KBG30ZMS256G | HP Pavilion Gaming 17-cd0085cl Samsung SSD PM981 MZVLB256HAHQ | |
|---|---|---|---|---|---|---|---|
| CrystalDiskMark 5.2 / 6 | 86% | 52% | 57% | 104% | -25% | 106% | |
| Write 4K (MB/s) | 102.7 | 99.8 -3% | 129.3 26% | 149.1 45% | 99.3 -3% | 78.6 -23% | 135.3 32% |
| Read 4K (MB/s) | 29.12 | 40.81 40% | 54.4 87% | 48.58 67% | 38.47 32% | 31.89 10% | 63.7 119% |
| Write Seq (MB/s) | 362.2 | 1385 282% | 978 170% | 1449 300% | 230.4 -36% | 1337 269% | |
| Read Seq (MB/s) | 1010 | 2089 107% | 1447 43% | 1237 22% | 925 -8% | 1617 60% | |
| Write 4K Q32T1 (MB/s) | 298.1 | 380 27% | 476.8 60% | 462 55% | 364.4 22% | 159.1 -47% | 568 91% |
| Read 4K Q32T1 (MB/s) | 349.6 | 445.5 27% | 338.1 -3% | 606 73% | 421.9 21% | 315.6 -10% | 645 84% |
| Write Seq Q32T1 (MB/s) | 788 | 1380 75% | 982 25% | 1454 85% | 3276 316% | 230.7 -71% | 1428 81% |
| Read Seq Q32T1 (MB/s) | 1490 | 3471 133% | 1622 9% | 1724 16% | 3338 124% | 1323 -11% | 3184 114% |
Graphics
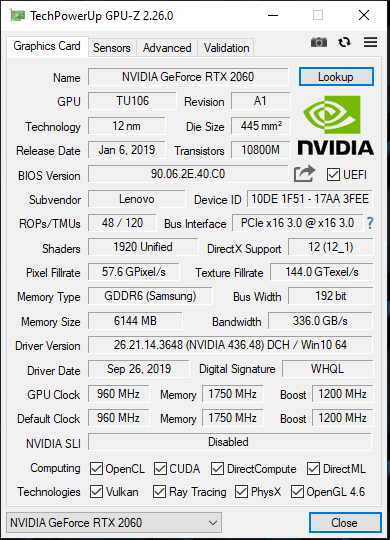
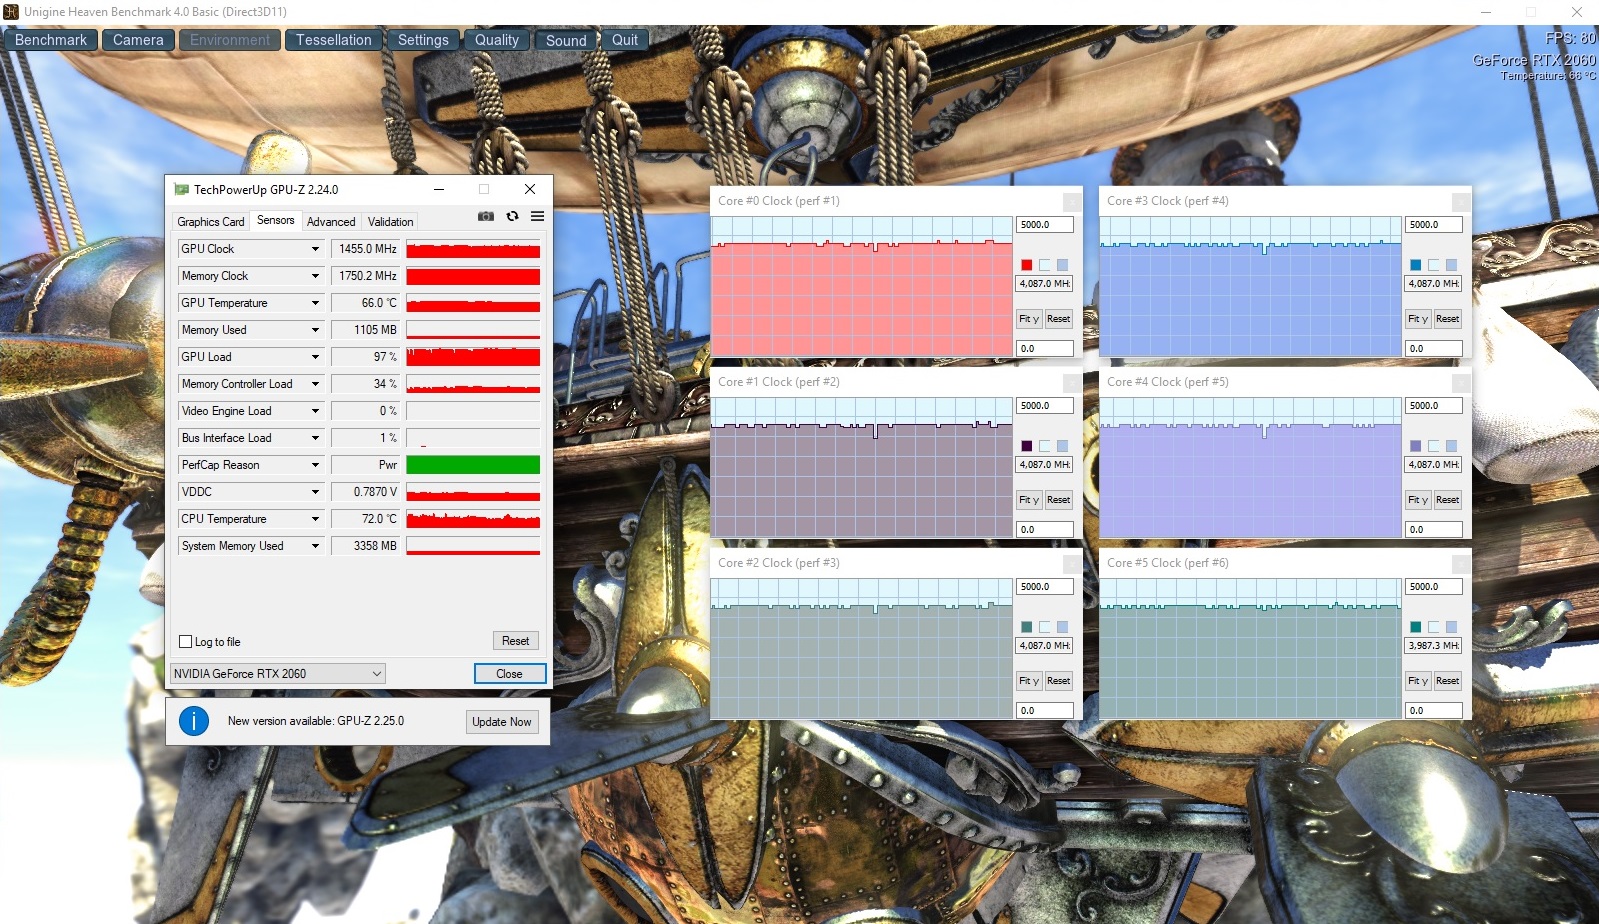
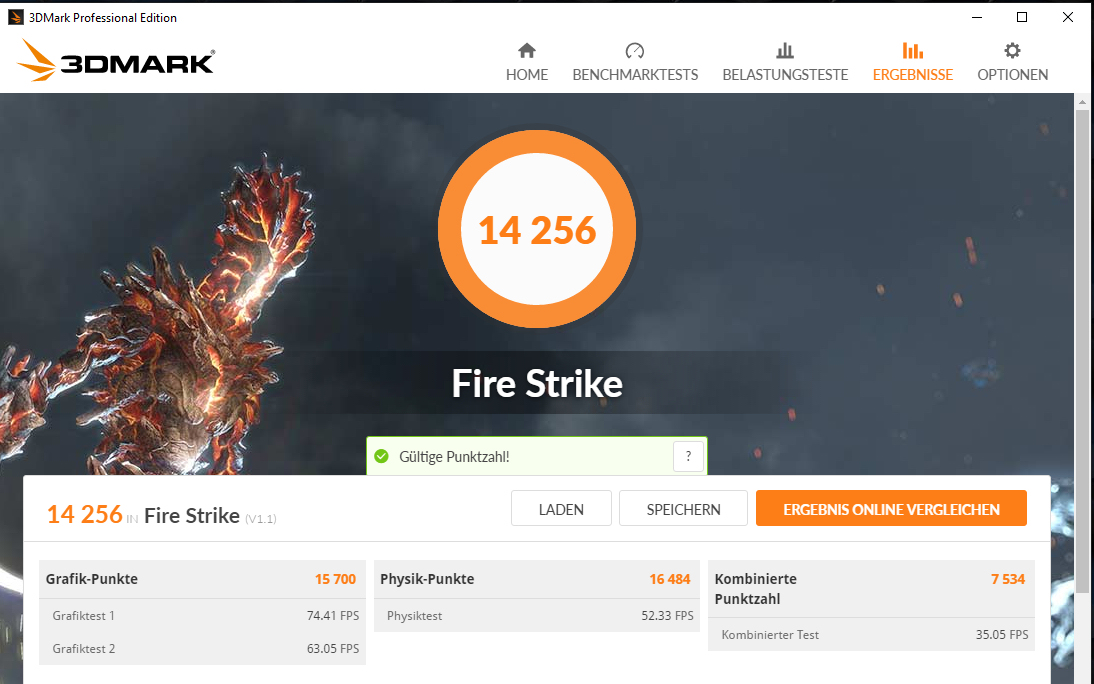
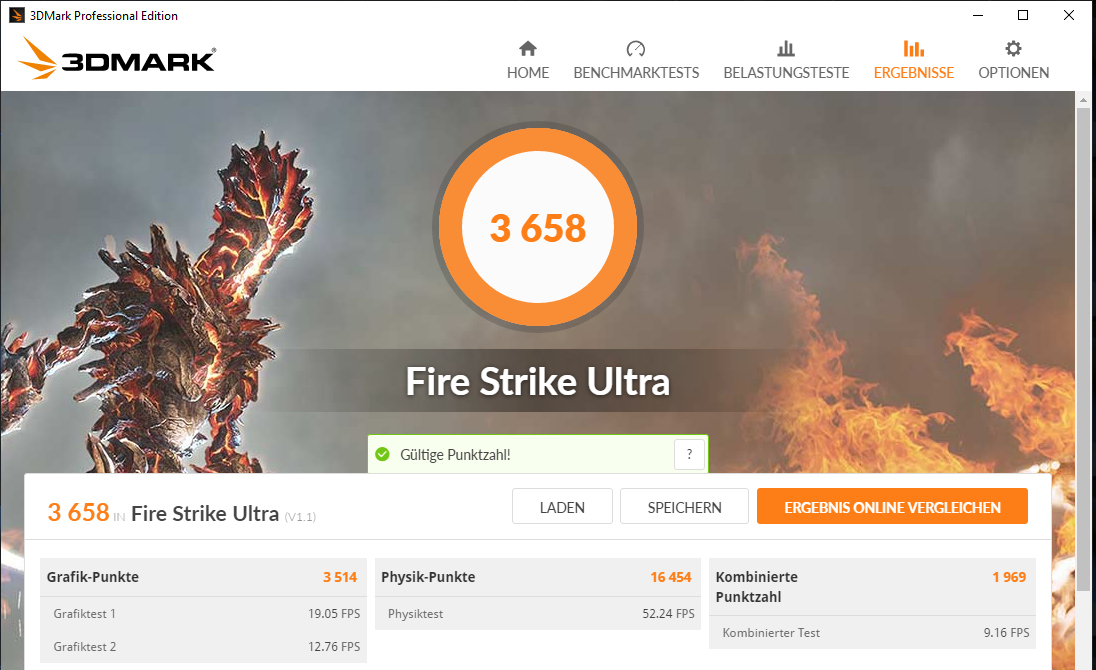
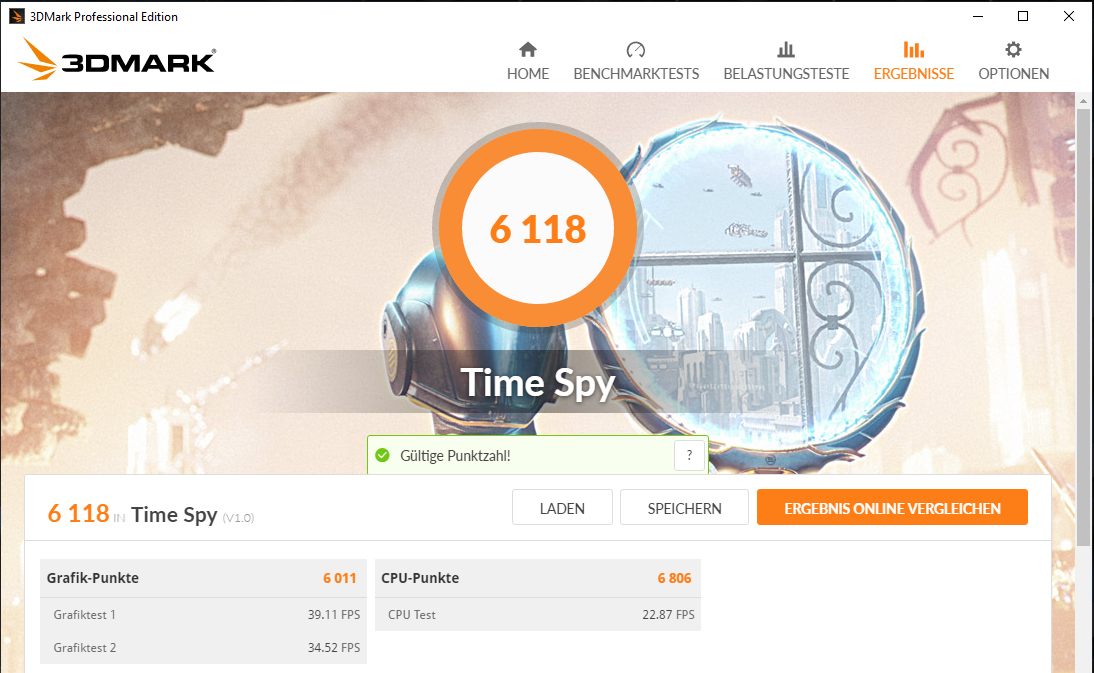
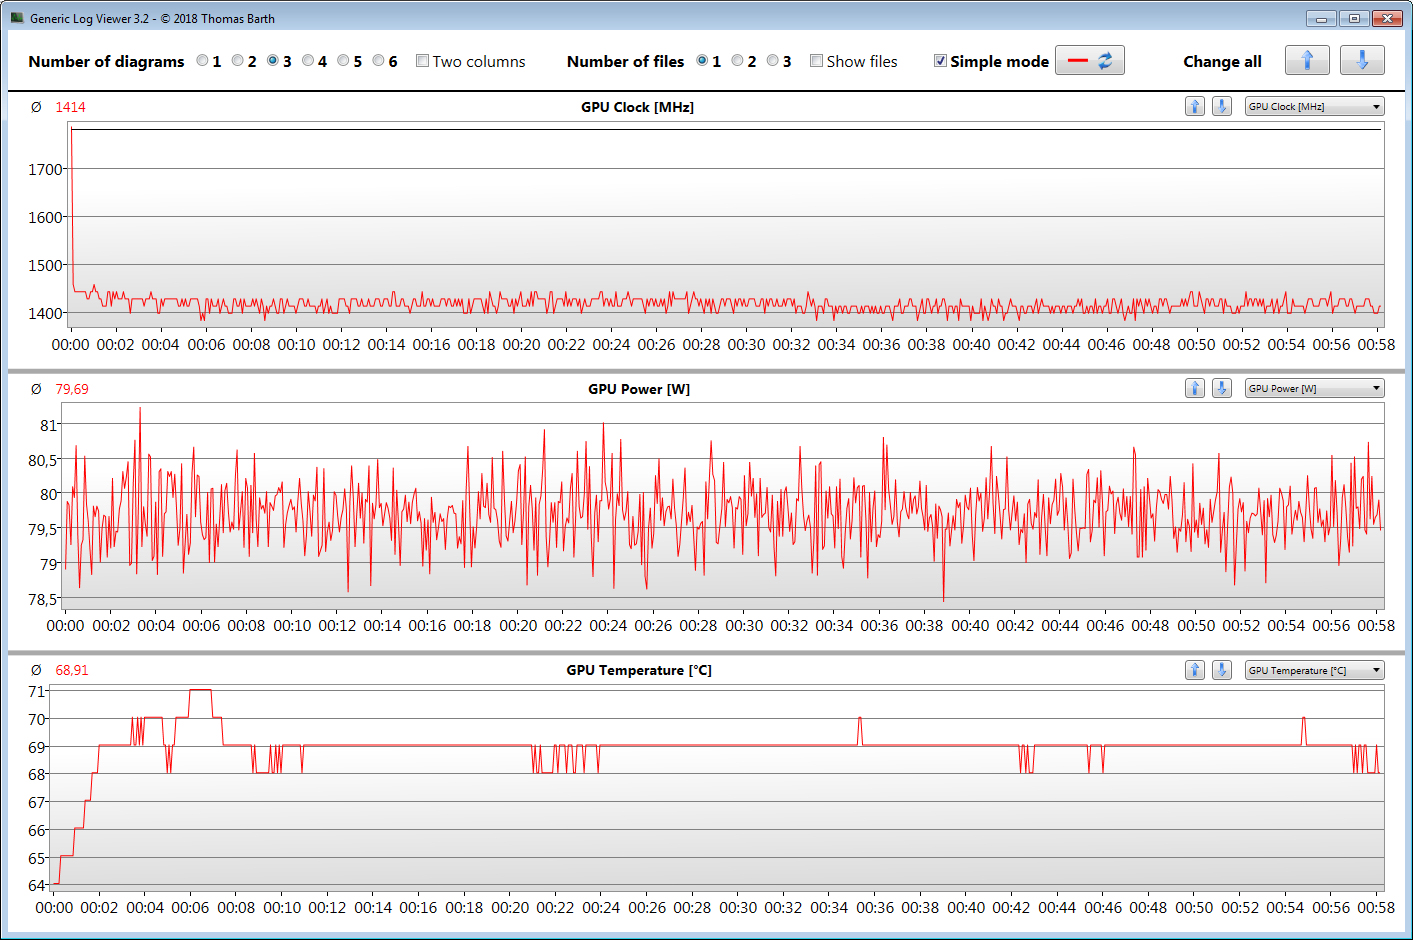
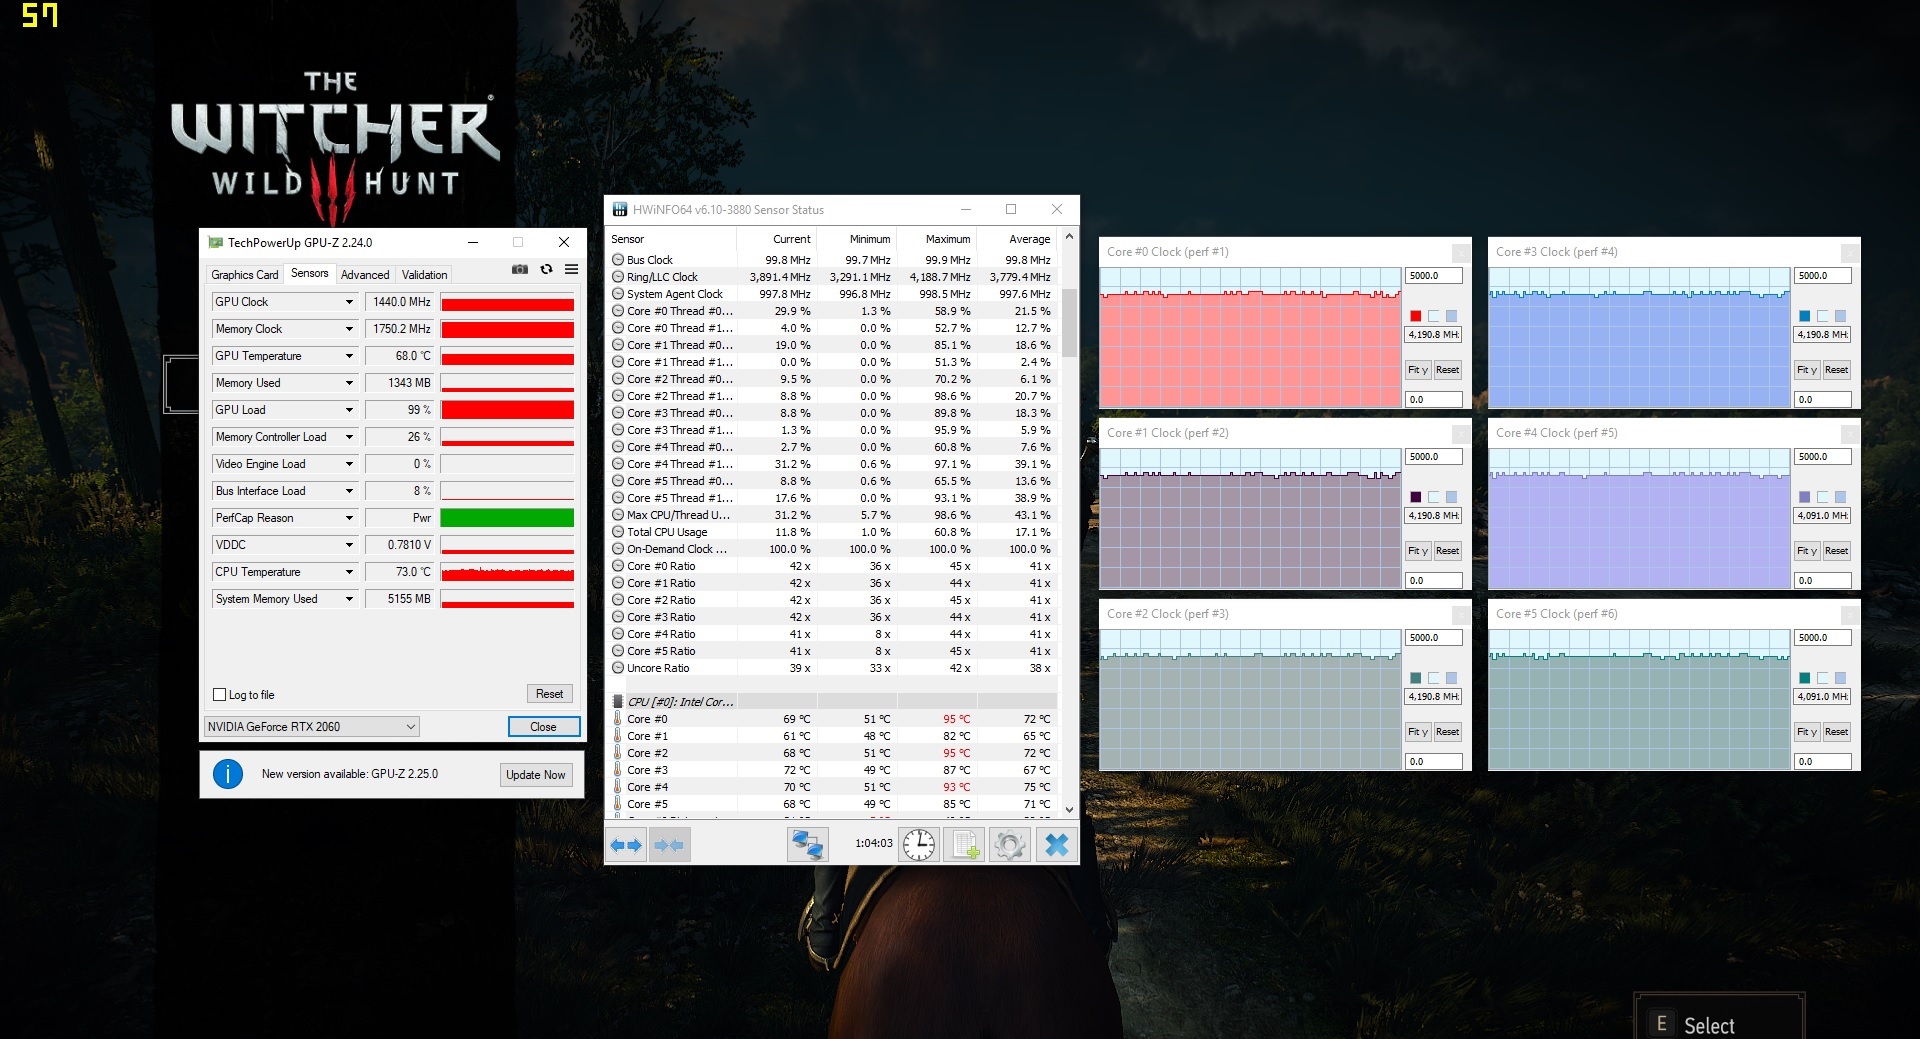
The Legion is equipped with a GeForce RTX 2060 - a current top-range GPU. This Turing model supports DirectX 12 and works with a base clock rate of 960 MHz. This clock rate can be increased to up to 1200 MHz via the turbo. The GPU can clock even faster if the chip remains below a certain temperature and/or energy limit. For example, we registered a maximum clock rate of 1784 MHz, although the device did not manage to keep this up for very long. The Witcher 3 test is completed at an average clock rate of 1414 MHz. The GPU has access to the fast GDDR6 graphics memory (6144 GB). The 3DMark results are average for this GPU.
| 3DMark 06 Standard Score | 40086 points | |
| 3DMark 11 Performance | 17637 points | |
| 3DMark Ice Storm Standard Score | 163805 points | |
| 3DMark Cloud Gate Standard Score | 35897 points | |
| 3DMark Fire Strike Score | 14256 points | |
| 3DMark Time Spy Score | 6118 points | |
Help | ||
Gaming Performance
The included hardware can display all titles in our database smoothly. The games can always be played at Full HD resolution and high to maximum settings. The GPU can also manage resolutions above Full HD, albeit at lower settings (and you would have to connect a suitable monitor for this).
| The Witcher 3 - 1920x1080 Ultra Graphics & Postprocessing (HBAO+) | |
| Average of class Gaming (104.7 - 240, n=7, last 2 years) | |
| Lenovo Legion Y740-17ICH | |
| Dell G7 17 7790 | |
| Lenovo Legion Y740-17IRH | |
| MSI GL75 9SEK-056US | |
| Asus Strix Hero III G731GV | |
| Schenker XMG Core 17 | |
| HP Pavilion Gaming 17-cd0085cl | |
| BioShock Infinite - 1920x1080 Ultra Preset, DX11 (DDOF) | |
| Lenovo Legion Y740-17ICH | |
| Lenovo Legion Y740-17IRH | |
| Asus Strix Hero III G731GV | |
| Schenker XMG Core 17 | |
| Dell G7 17 7790 | |
| HP Pavilion Gaming 17-cd0085cl | |
| Far Cry New Dawn - 1920x1080 Ultra Preset | |
| Lenovo Legion Y740-17IRH | |
| Schenker XMG Core 17 | |
| Far Cry 5 - 1920x1080 Ultra Preset AA:T | |
| Average of class Gaming (70 - 151, n=6, last 2 years) | |
| Lenovo Legion Y740-17IRH | |
| Schenker XMG Core 17 | |
| Metro Exodus - 1920x1080 Ultra Quality AF:16x | |
| Lenovo Legion Y740-17IRH | |
| Total War: Three Kingdoms - 1920x1080 Ultra (incl textures) | |
| Lenovo Legion Y740-17IRH | |
In order to find out whether the refresh rate remains constant over a long period of time, we ran the game The Witcher 3 for around 60 minutes at Full HD resolution and maximum quality settings. The character in the game was not moved during this entire period. The refresh rates remained relatively consistent throughout the test and were always high enough for satisfactory gaming.
| low | med. | high | ultra | |
|---|---|---|---|---|
| BioShock Infinite (2013) | 357 | 293.1 | 294.9 | 148.2 |
| The Witcher 3 (2015) | 282.4 | 198.4 | 114.6 | 58.4 |
| Far Cry 5 (2018) | 125 | 96 | 92 | 87 |
| Shadow of the Tomb Raider (2018) | 120 | 96 | 88 | 78 |
| Far Cry New Dawn (2019) | 124 | 96 | 93 | 83 |
| Metro Exodus (2019) | 136 | 73.8 | 56.3 | 46 |
| Total War: Three Kingdoms (2019) | 249.8 | 113 | 73.4 | 53.7 |
| Control (2019) | 215.9 | 77.6 | 57.4 | |
| Borderlands 3 (2019) | 119.9 | 93.7 | 67.6 | 52 |
| Ghost Recon Breakpoint (2019) | 120 | 84 | 79 | 57 |
Emissions - The Legion Y740 only heats up moderately
System Noise
The Legion hardly makes any noise while idling. The fans run at low speed and occasionally stand completely still, in which case the device is silent (provided the 2.5-inch hard drive isn't being accessed). The fans turn up under load and the Lenovo notebook reached an average of 46 dB(A) during our The Witcher 3 test.
Noise level
| Idle |
| 33 / 34 / 35 dB(A) |
| HDD |
| 34 dB(A) |
| Load |
| 48 / 49 dB(A) |
 | ||
30 dB silent 40 dB(A) audible 50 dB(A) loud |
||
min: | ||
| Lenovo Legion Y740-17IRH i7-9750H, GeForce RTX 2060 Mobile | Lenovo Legion Y740-17ICH i7-8750H, GeForce RTX 2080 Max-Q | Asus Strix Hero III G731GV i7-9750H, GeForce RTX 2060 Mobile | MSI GL75 9SEK-056US i7-9750H, GeForce RTX 2060 Mobile | Schenker XMG Core 17 i7-9750H, GeForce GTX 1660 Ti Mobile | Dell G7 17 7790 i7-8750H, GeForce RTX 2070 Max-Q | HP Pavilion Gaming 17-cd0085cl i7-9750H, GeForce GTX 1660 Ti Max-Q | |
|---|---|---|---|---|---|---|---|
| Noise | 11% | 3% | 4% | 1% | 10% | 15% | |
| off / environment * (dB) | 30 | 28.3 6% | 28.2 6% | 28.1 6% | 30 -0% | 28.2 6% | 28.2 6% |
| Idle Minimum * (dB) | 33 | 31.5 5% | 29.5 11% | 30.9 6% | 30 9% | 28.6 13% | 30.1 9% |
| Idle Average * (dB) | 34 | 31.6 7% | 30.3 11% | 30.9 9% | 32 6% | 28.6 16% | 30.1 11% |
| Idle Maximum * (dB) | 35 | 31.6 10% | 31.9 9% | 31 11% | 35 -0% | 28.6 18% | 30.1 14% |
| Load Average * (dB) | 48 | 32.3 33% | 50.4 -5% | 39 19% | 47 2% | 31.8 34% | 34.2 29% |
| Witcher 3 ultra * (dB) | 46 | 43 7% | 50.1 -9% | 53.5 -16% | 48 -4% | 50.6 -10% | 34.2 26% |
| Load Maximum * (dB) | 49 | 45.5 7% | 50.1 -2% | 53.5 -9% | 51 -4% | 50.8 -4% | 43.8 11% |
* ... smaller is better
Temperature
The Legion reaches different results in our stress test (Prime95 and FurMark running for at least 1 hour) depending on whether it's running on mains or on battery. On mains, the processor clocks at between 2.6 and 2.7 GHz. The GPU, meanwhile, clocks at 1000 MHz. On battery, the clock rates drop to 800 MHz (CPU) and 600 - 1700 MHz (GPU). The stress test represents an extreme scenario that will not occur as such in everyday use. We use this test to find out whether the system remains stable under maximum load.
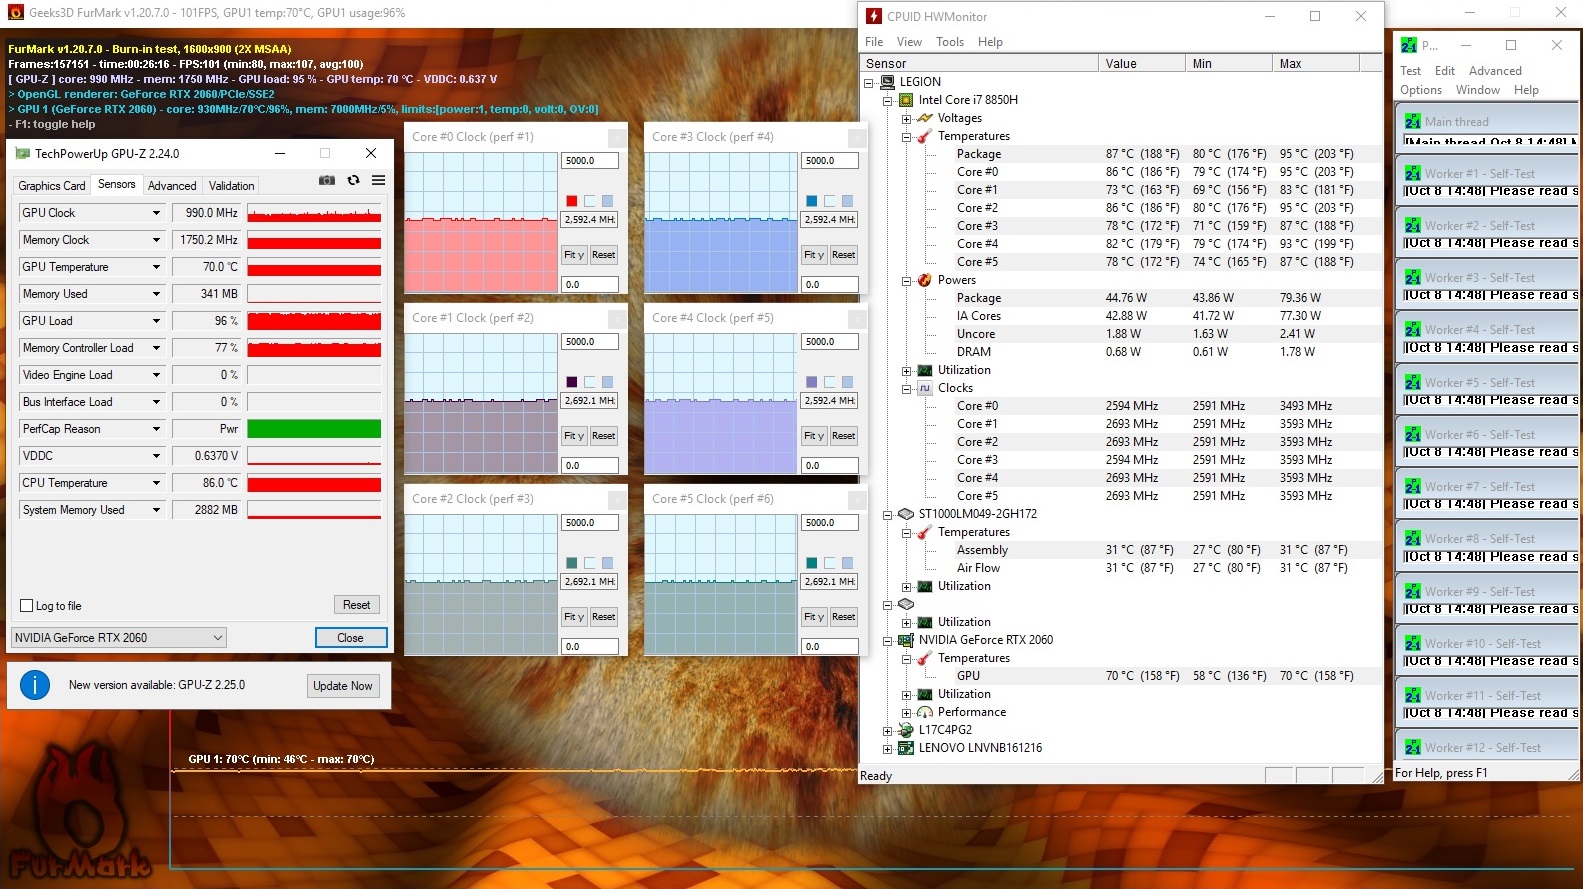
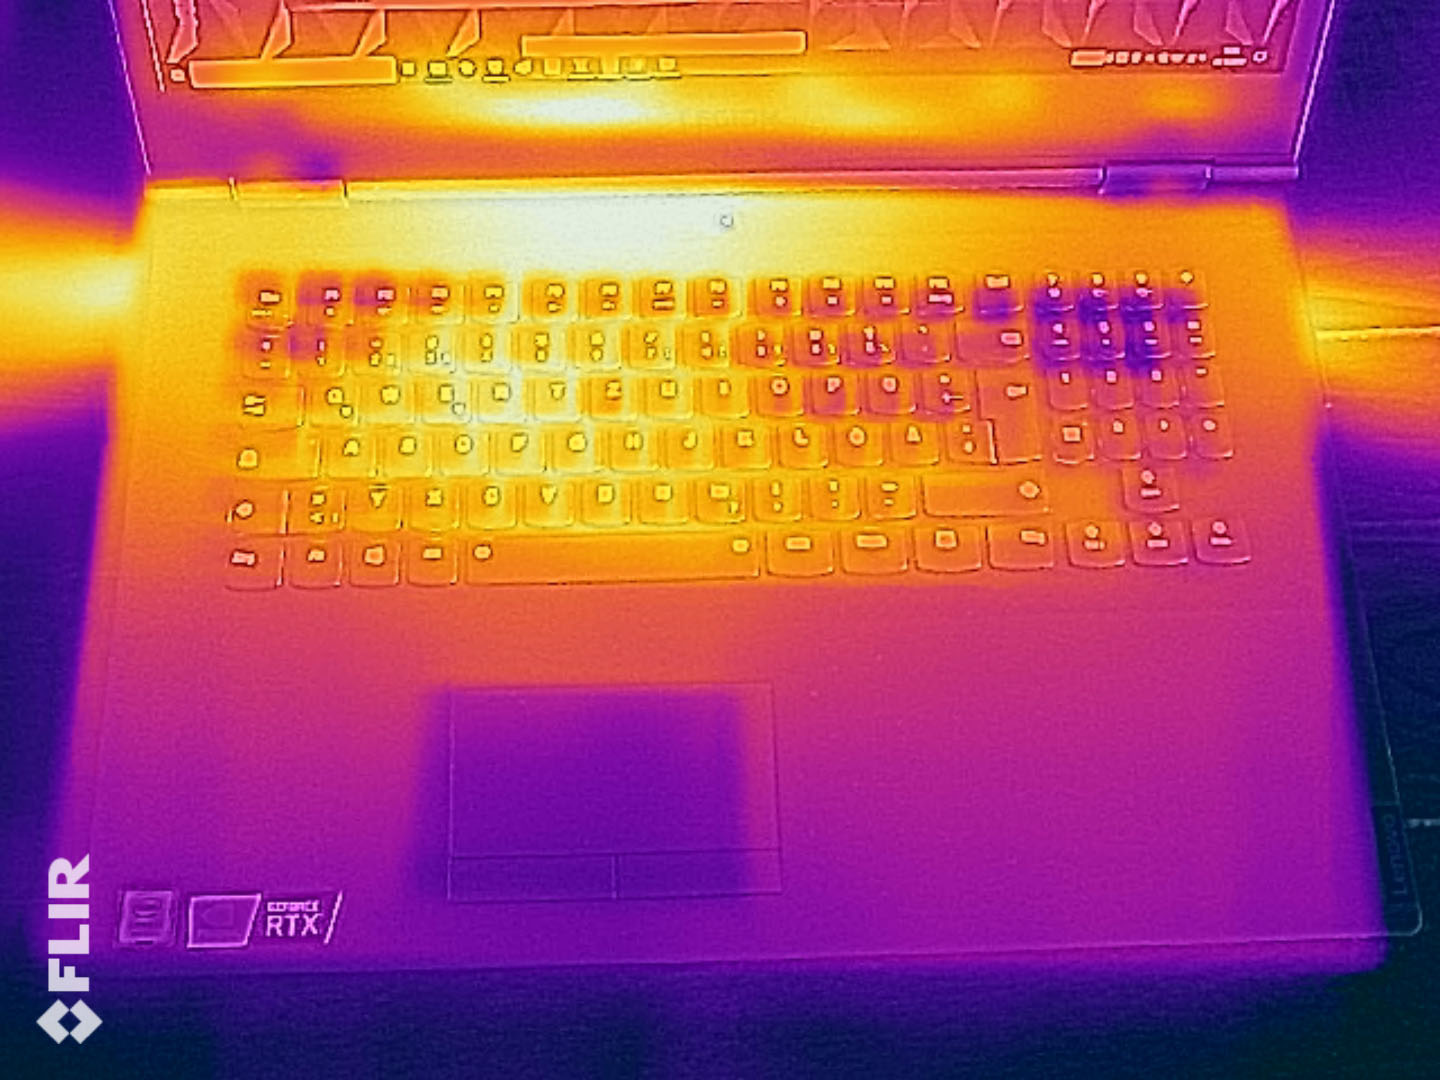
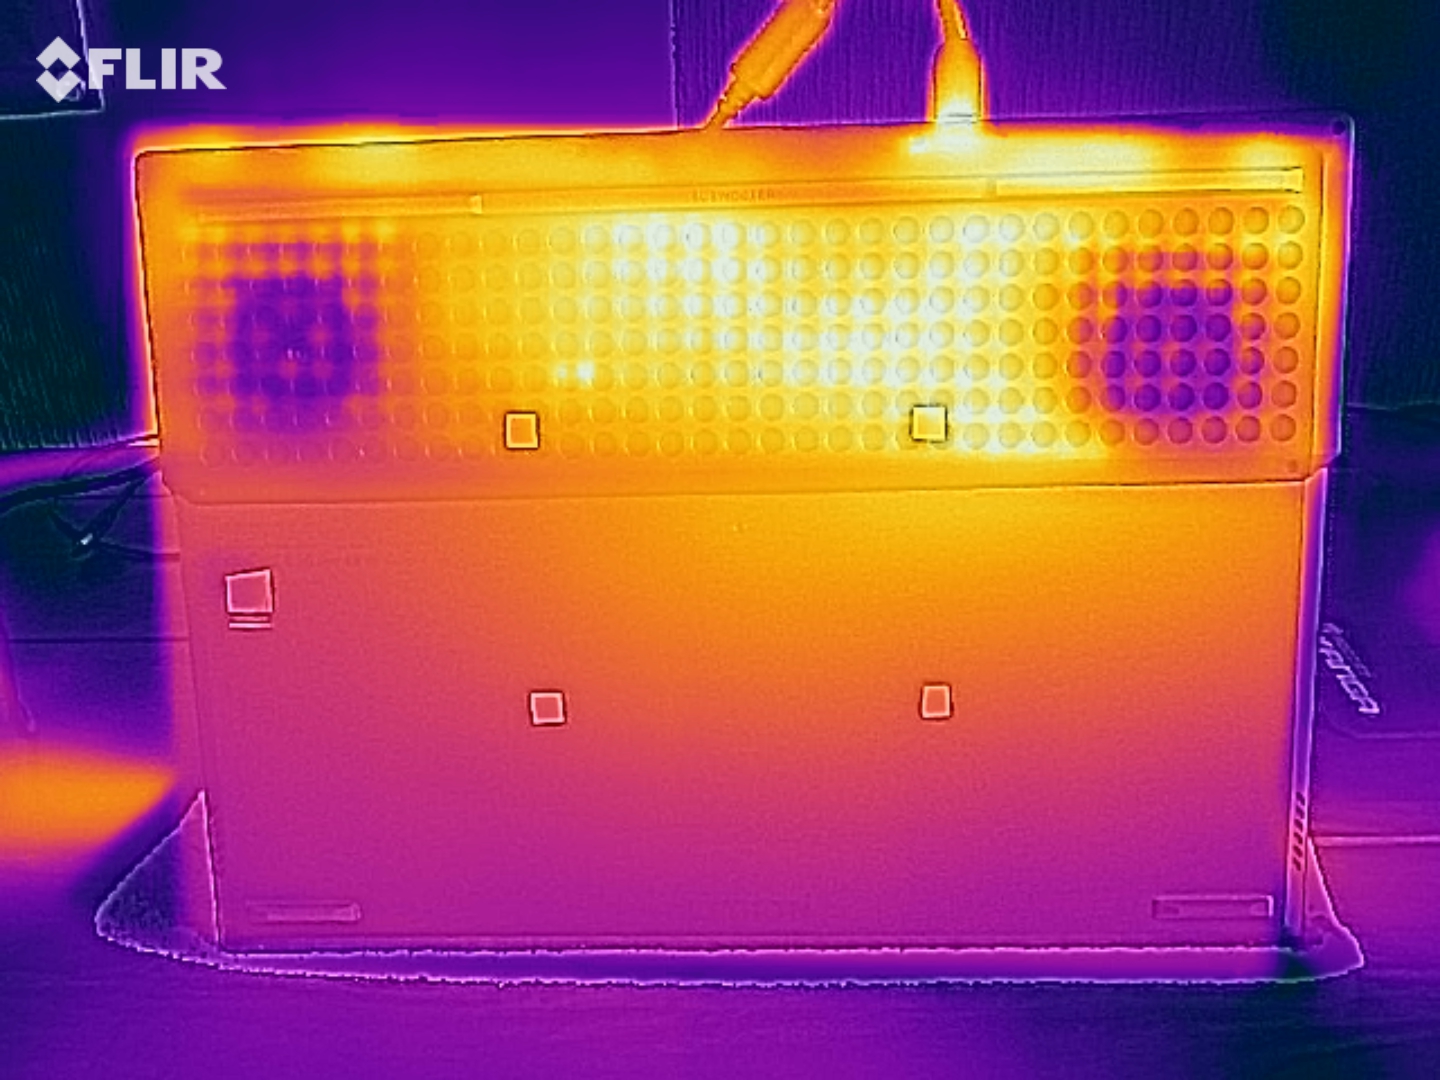
The Lenovo notebook only heats up moderately. We measured maximum temperatures in the mid 40 °Cs during the stress test. Similar temperatures were measured during The Witcher 3 test (with the game running for one hour in Full HD resolution and maximum quality settings). The results are all fine during everyday use.
(±) The maximum temperature on the upper side is 43 °C / 109 F, compared to the average of 40.4 °C / 105 F, ranging from 21.2 to 68.8 °C for the class Gaming.
(-) The bottom heats up to a maximum of 46 °C / 115 F, compared to the average of 43.2 °C / 110 F
(+) In idle usage, the average temperature for the upper side is 28.9 °C / 84 F, compared to the device average of 33.9 °C / 93 F.
(±) Playing The Witcher 3, the average temperature for the upper side is 36.3 °C / 97 F, compared to the device average of 33.9 °C / 93 F.
(+) The palmrests and touchpad are cooler than skin temperature with a maximum of 31 °C / 87.8 F and are therefore cool to the touch.
(-) The average temperature of the palmrest area of similar devices was 28.8 °C / 83.8 F (-2.2 °C / -4 F).
| Lenovo Legion Y740-17IRH i7-9750H, GeForce RTX 2060 Mobile | Lenovo Legion Y740-17ICH i7-8750H, GeForce RTX 2080 Max-Q | Asus Strix Hero III G731GV i7-9750H, GeForce RTX 2060 Mobile | MSI GL75 9SEK-056US i7-9750H, GeForce RTX 2060 Mobile | Schenker XMG Core 17 i7-9750H, GeForce GTX 1660 Ti Mobile | Dell G7 17 7790 i7-8750H, GeForce RTX 2070 Max-Q | HP Pavilion Gaming 17-cd0085cl i7-9750H, GeForce GTX 1660 Ti Max-Q | |
|---|---|---|---|---|---|---|---|
| Heat | 4% | -6% | -19% | -6% | -11% | -8% | |
| Maximum Upper Side * (°C) | 43 | 38.6 10% | 47.2 -10% | 49.4 -15% | 47 -9% | 46.6 -8% | 42.6 1% |
| Maximum Bottom * (°C) | 46 | 43.6 5% | 51 -11% | 50.6 -10% | 50 -9% | 57 -24% | 49 -7% |
| Idle Upper Side * (°C) | 31 | 30.2 3% | 30.2 3% | 39 -26% | 34 -10% | 34.4 -11% | 34 -10% |
| Idle Bottom * (°C) | 34 | 35 -3% | 35.4 -4% | 42 -24% | 32 6% | 34.6 -2% | 39.4 -16% |
* ... smaller is better
Speaker
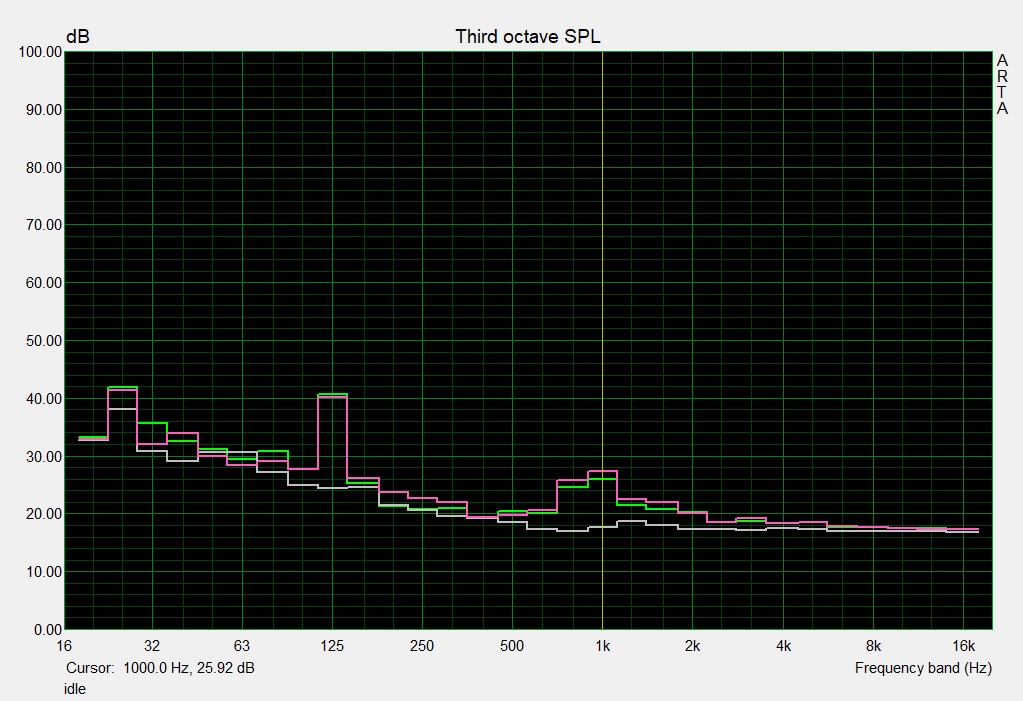
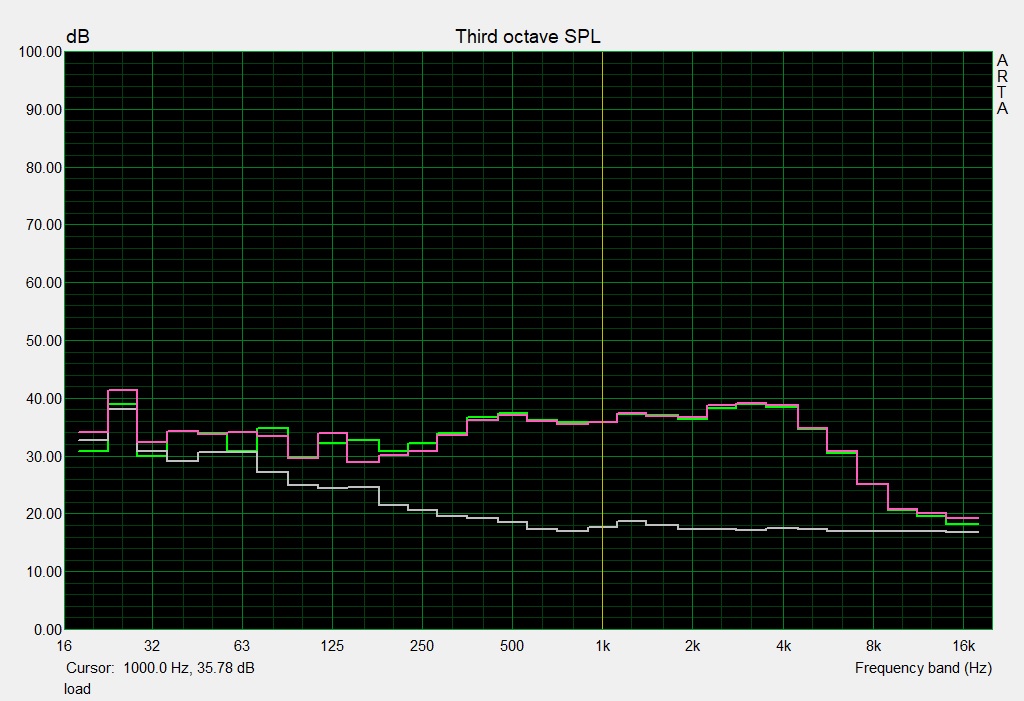
Lenovo Legion Y740-17IRH audio analysis
(±) | speaker loudness is average but good (81 dB)
Bass 100 - 315 Hz
(±) | reduced bass - on average 9.8% lower than median
(±) | linearity of bass is average (13.2% delta to prev. frequency)
Mids 400 - 2000 Hz
(+) | balanced mids - only 2.6% away from median
(+) | mids are linear (4.8% delta to prev. frequency)
Highs 2 - 16 kHz
(+) | balanced highs - only 1.2% away from median
(+) | highs are linear (2.7% delta to prev. frequency)
Overall 100 - 16.000 Hz
(+) | overall sound is linear (10.6% difference to median)
Compared to same class
» 7% of all tested devices in this class were better, 2% similar, 92% worse
» The best had a delta of 6%, average was 18%, worst was 132%
Compared to all devices tested
» 6% of all tested devices were better, 1% similar, 93% worse
» The best had a delta of 4%, average was 23%, worst was 134%
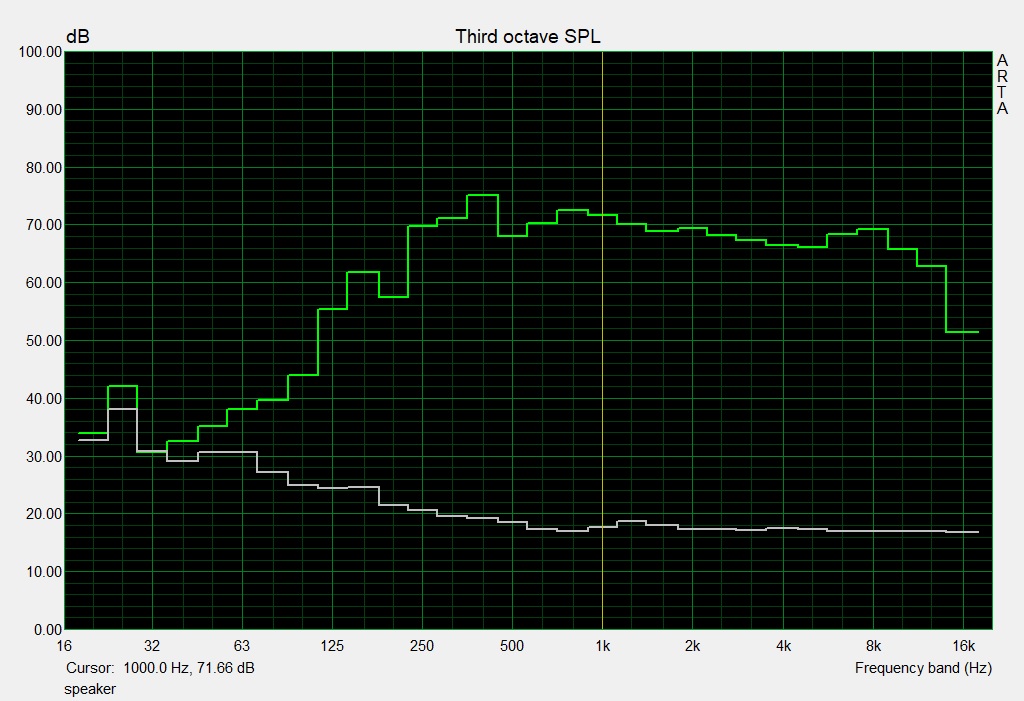
Asus Strix Hero III G731GV audio analysis
(±) | speaker loudness is average but good (81 dB)
Bass 100 - 315 Hz
(±) | reduced bass - on average 6.6% lower than median
(±) | linearity of bass is average (11.8% delta to prev. frequency)
Mids 400 - 2000 Hz
(+) | balanced mids - only 2.8% away from median
(+) | mids are linear (6.7% delta to prev. frequency)
Highs 2 - 16 kHz
(+) | balanced highs - only 1.8% away from median
(+) | highs are linear (5.4% delta to prev. frequency)
Overall 100 - 16.000 Hz
(+) | overall sound is linear (13.4% difference to median)
Compared to same class
» 19% of all tested devices in this class were better, 7% similar, 74% worse
» The best had a delta of 6%, average was 18%, worst was 132%
Compared to all devices tested
» 14% of all tested devices were better, 4% similar, 82% worse
» The best had a delta of 4%, average was 23%, worst was 134%
Energy Management - Activating Optimus improves the battery life
Power Consumption
The Y740-17IRHg does not have any particular anomalies when it comes to power consumption. We measured a maximum consumption of 26 watts while idling. Activating the integrated GPU would reduce the consumption in this scenario. The power consumption increased to up to 168 watts during our stress test but remained lower while gaming. We measured an average consumption of 139 watts during our The Witcher 3 test. The rated output of the AC adaptor is 230 watts.
| Off / Standby | |
| Idle | |
| Load |
|
Key:
min: | |
| Lenovo Legion Y740-17IRH i7-9750H, GeForce RTX 2060 Mobile | Lenovo Legion Y740-17ICH i7-8750H, GeForce RTX 2080 Max-Q | Asus Strix Hero III G731GV i7-9750H, GeForce RTX 2060 Mobile | MSI GL75 9SEK-056US i7-9750H, GeForce RTX 2060 Mobile | Schenker XMG Core 17 i7-9750H, GeForce GTX 1660 Ti Mobile | Dell G7 17 7790 i7-8750H, GeForce RTX 2070 Max-Q | HP Pavilion Gaming 17-cd0085cl i7-9750H, GeForce GTX 1660 Ti Max-Q | |
|---|---|---|---|---|---|---|---|
| Power Consumption | -7% | -12% | 15% | 20% | 11% | 34% | |
| Idle Minimum * (Watt) | 20 | 20.2 -1% | 16.2 19% | 10.7 47% | 10 50% | 9.5 52% | 5.4 73% |
| Idle Average * (Watt) | 21 | 27.2 -30% | 24.8 -18% | 15.2 28% | 13 38% | 16.2 23% | 9.2 56% |
| Idle Maximum * (Watt) | 26 | 28.7 -10% | 28.6 -10% | 17.8 32% | 21 19% | 23.8 8% | 13 50% |
| Load Average * (Watt) | 97 | 90.8 6% | 127.6 -32% | 88.2 9% | 89 8% | 101.7 -5% | 85.9 11% |
| Witcher 3 ultra * (Watt) | 139 | 152.1 -9% | 147.1 -6% | 147.8 -6% | 128 8% | 155 -12% | 107.9 22% |
| Load Maximum * (Watt) | 168 | 165.4 2% | 212.7 -27% | 206.5 -23% | 177 -5% | 172.2 -2% | 182.2 -8% |
* ... smaller is better
Battery Life
The Legion managed a runtime of 4:16 h (iGPU disabled) or 6:11 h (iGPU activated) during our realistic Wi-Fi test. In this test, we simulate browsing the web via a script with the energy profile set to "balanced" and the display brightness set to around 150 cd/m². Our video test lasts 4:20 h on the 17.3-inch gamer. This involves running the short film Big Buck Bunny (H.264, 1920x1080 pixels) in a loop with the energy profile set to "power saving", the radio module deactivated and the display brightness set to around 150 cd/m².
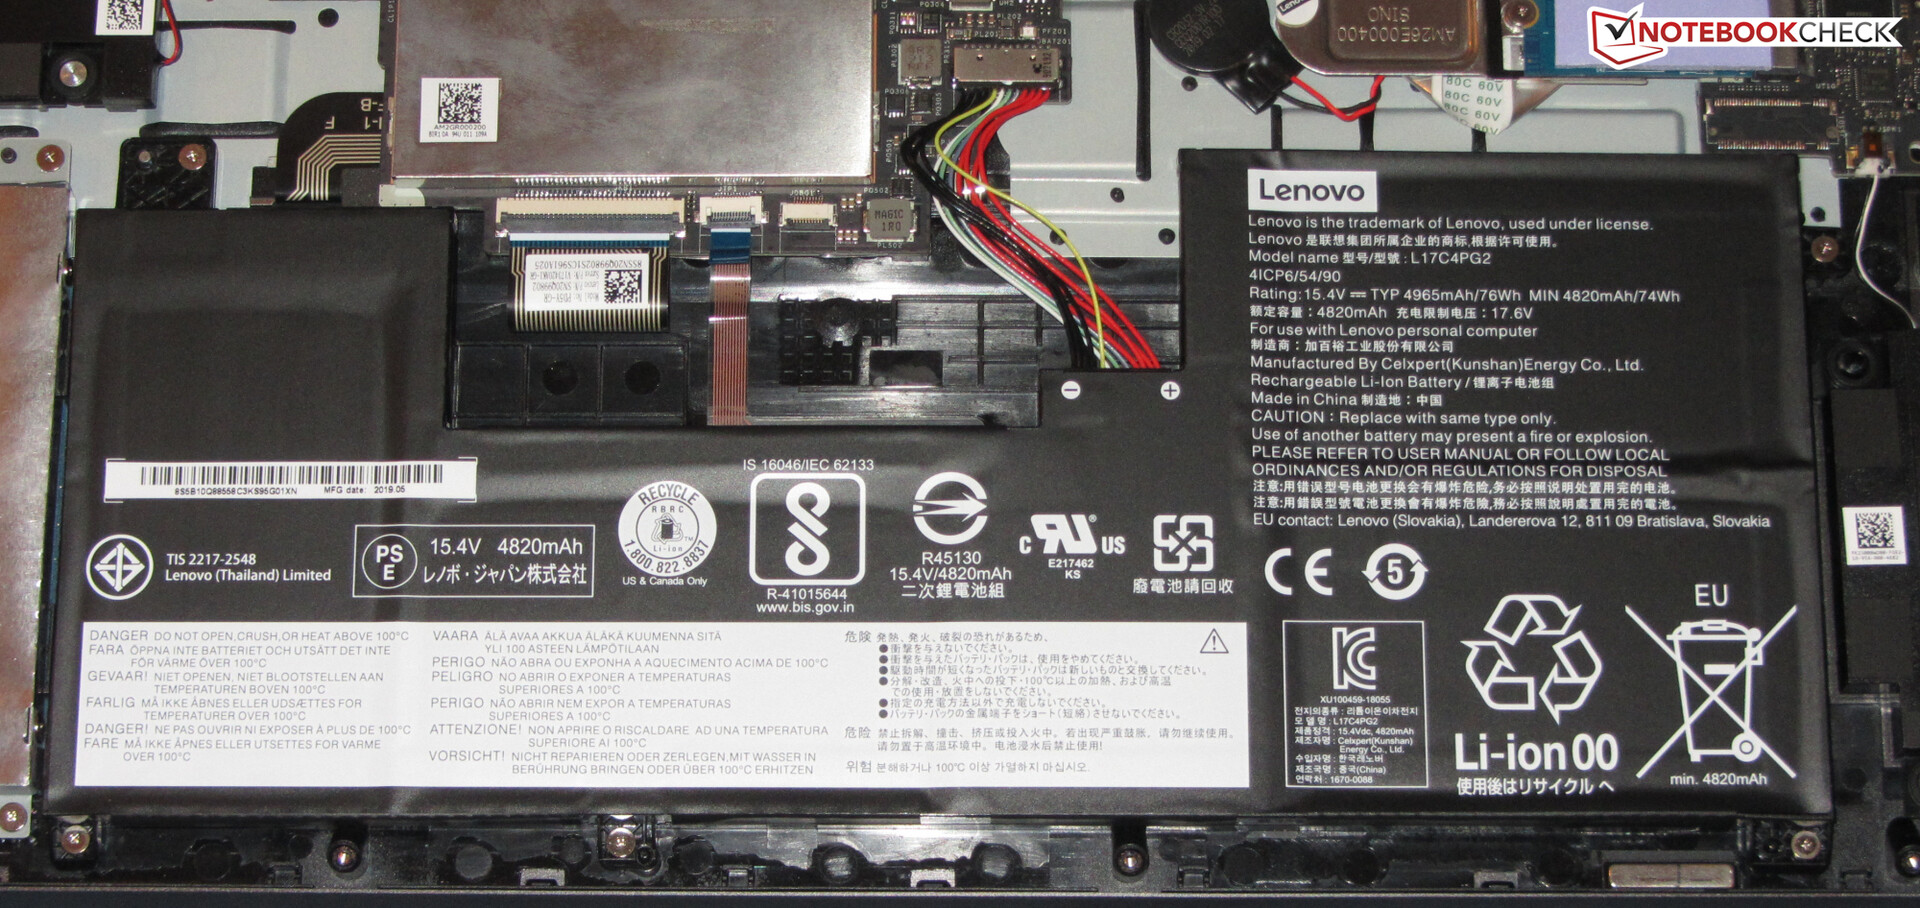
| Lenovo Legion Y740-17IRH i7-9750H, GeForce RTX 2060 Mobile, 76 Wh | Lenovo Legion Y740-17ICH i7-8750H, GeForce RTX 2080 Max-Q, 76 Wh | Asus Strix Hero III G731GV i7-9750H, GeForce RTX 2060 Mobile, 66 Wh | MSI GL75 9SEK-056US i7-9750H, GeForce RTX 2060 Mobile, 51 Wh | Schenker XMG Core 17 i7-9750H, GeForce GTX 1660 Ti Mobile, 46.74 Wh | Dell G7 17 7790 i7-8750H, GeForce RTX 2070 Max-Q, 60 Wh | HP Pavilion Gaming 17-cd0085cl i7-9750H, GeForce GTX 1660 Ti Max-Q, 52.5 Wh | |
|---|---|---|---|---|---|---|---|
| Battery runtime | -26% | 5% | 1% | 17% | 32% | 31% | |
| Reader / Idle (h) | 6.9 | 7.9 14% | 8.1 17% | 8.5 23% | 11.6 68% | ||
| H.264 (h) | 4.3 | 5.3 23% | |||||
| WiFi v1.3 (h) | 4.3 | 3.2 -26% | 4.5 5% | 4.2 -2% | 4.7 9% | 3.9 -9% | 5.7 33% |
| Load (h) | 1.1 | 1 -9% | 1.3 18% | 2 82% | 1 -9% |
Pros
Cons
Verdict
Lenovo has created a 17.3-inch gaming notebook that manages to display all current games smoothly on its matte Full HD display thanks to a Core i7-9750H processor and a GeForce RTX 2060 GPU. Games can be played at high to maximum settings. Another great point: The device only reaches moderate temperatures.
An NVMe SSD ensures a speedy system. On top of the SSD, the device is equipped with a 1-TB hard drive. Both storage devices can be exchanged by the user, although this requires removing the bottom of the base unit.
The Legion Y740-17IRHg gave us a good overall impression and does not seem to have any serious weaknesses.
The 144-Hz IPS display offers short response times, stable viewing angles, a good contrast ratio and great color display. In addition, the device supports G-Sync technology. The maximum brightness of the display is relatively low - we would have expected higher luminosity from a device in this price range.
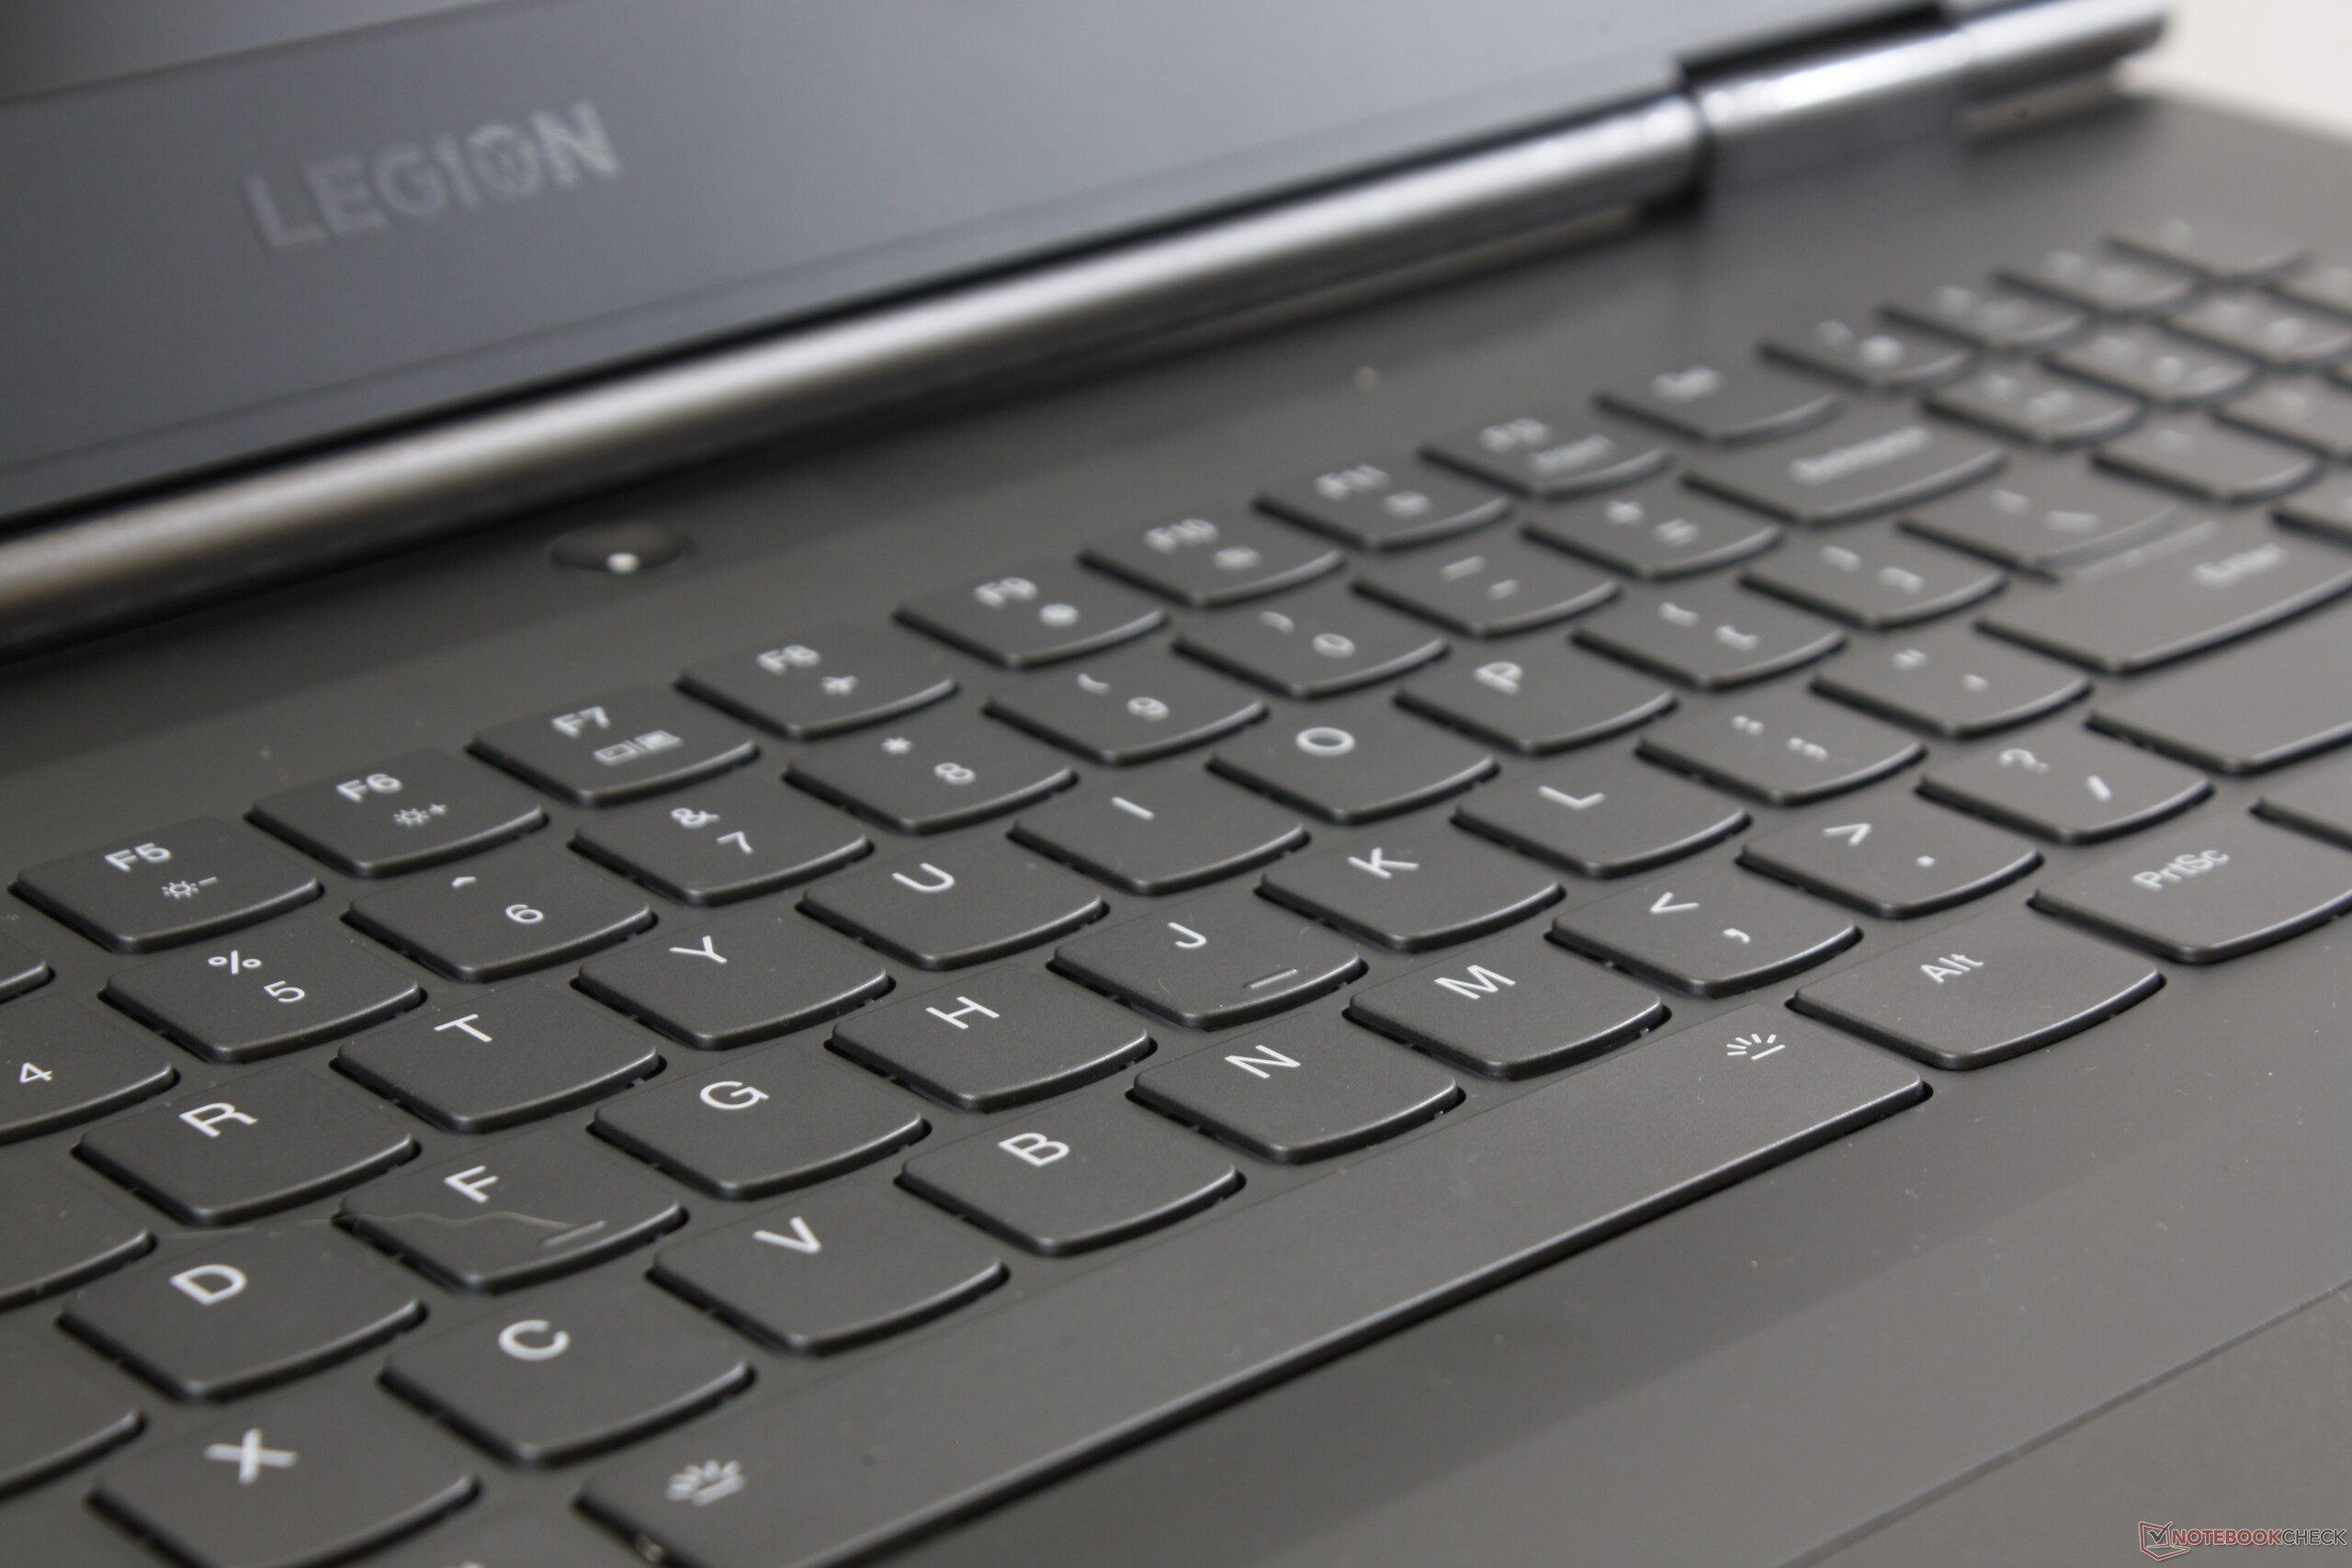
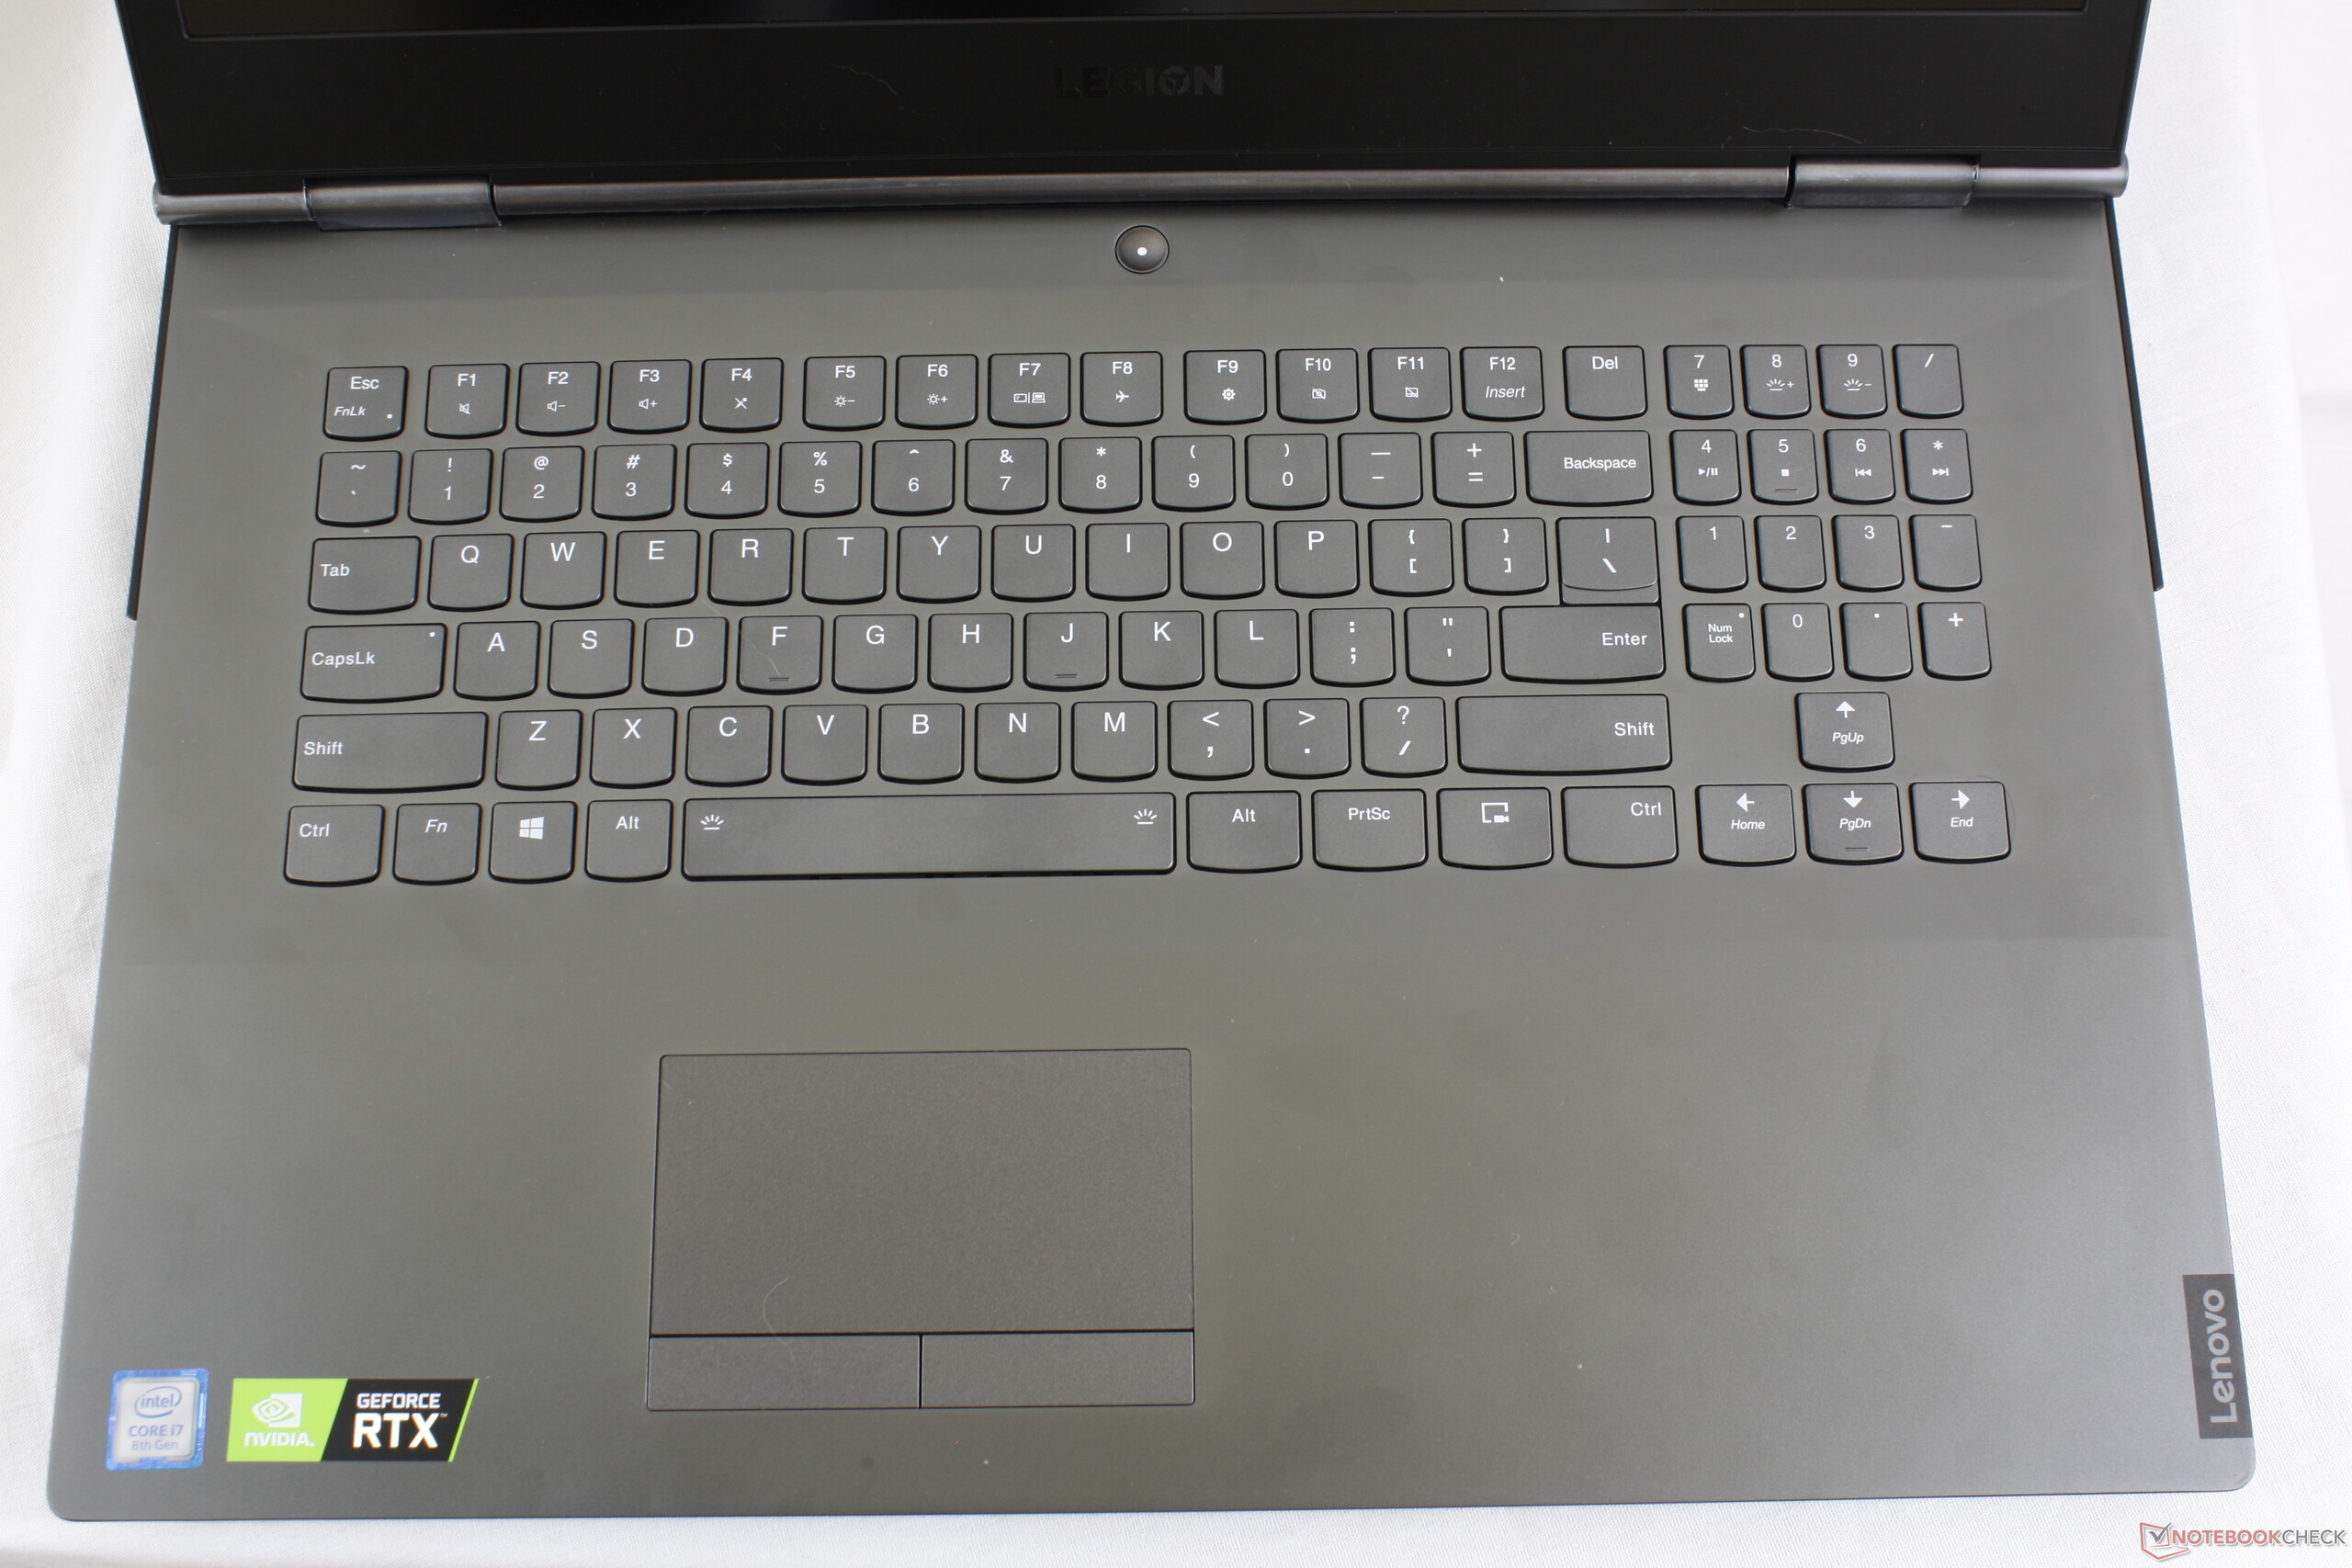
The included keyboard (with RGB backlighting) has proven to be suitable for everyday use. The battery life is not particularly impressive, however - although this can be changed. By activating the integrated GPU, users can improve the battery life, increasing the Wi-Fi runtime from 4:16 h to 6:11 h.
Lenovo Legion Y740-17IRH
- 05/14/2020 v7 (old)
Sascha Mölck
Price comparison

