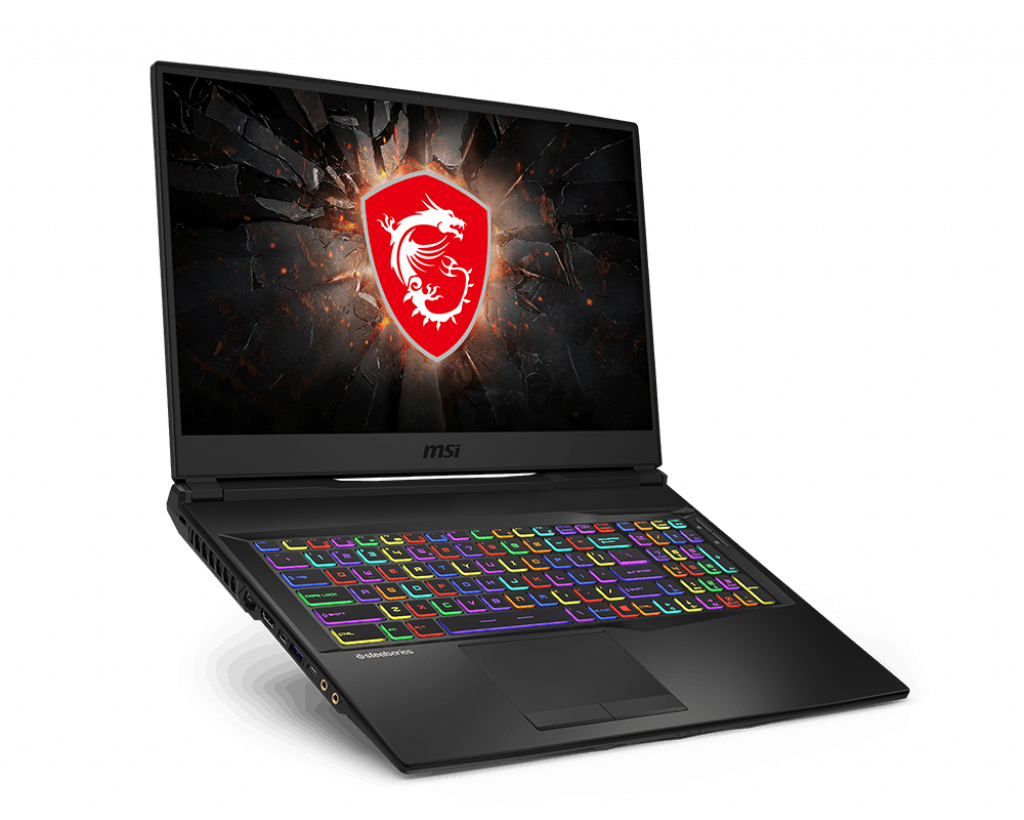
MSI GL75 9SEK Laptop Review - An average mid-range gaming laptop with loud fans
Every year, gaming laptops tend to get a little better. Slimmer display bezels, thinner cases, and improved performance have been the norm for the past few years. However, some things have continued to plague some gaming laptops (particularly cheaper models). The MSI GL75 is an interesting combination of modern design choices and annoying holdouts.
The device is one of MSI's 17.3-inch mid-range models for 2019, and it ticks most of the boxes expected of a US $1500 gaming laptop. Some niceties once reserved for flagship notebooks have made their way into cheaper machines. For example, the GL75 enjoys slim display bezels, per-key RGB backlighting, and a 120 Hz panel. Seeing features like this in a sub-$2000 gaming laptop would have been unthinkable, even among last year's models. However, as we will see, there are a few hangups that spoil an otherwise decent package.
The mid-range gaming laptop market is extremely competitive, especially considering how good machines around the $1500 price point have gotten. Competitors of the MSI GL75 include the Acer Predator Helios 500, the Asus Strix Hero III G731GV, and the HP Pavilion Gaming 17. We will also compare the 2018 MSI GL73, which has dropped in price, to see what MSI changed over the course of a year.
Purchase the MSI GL75 on Amazon here.
Case
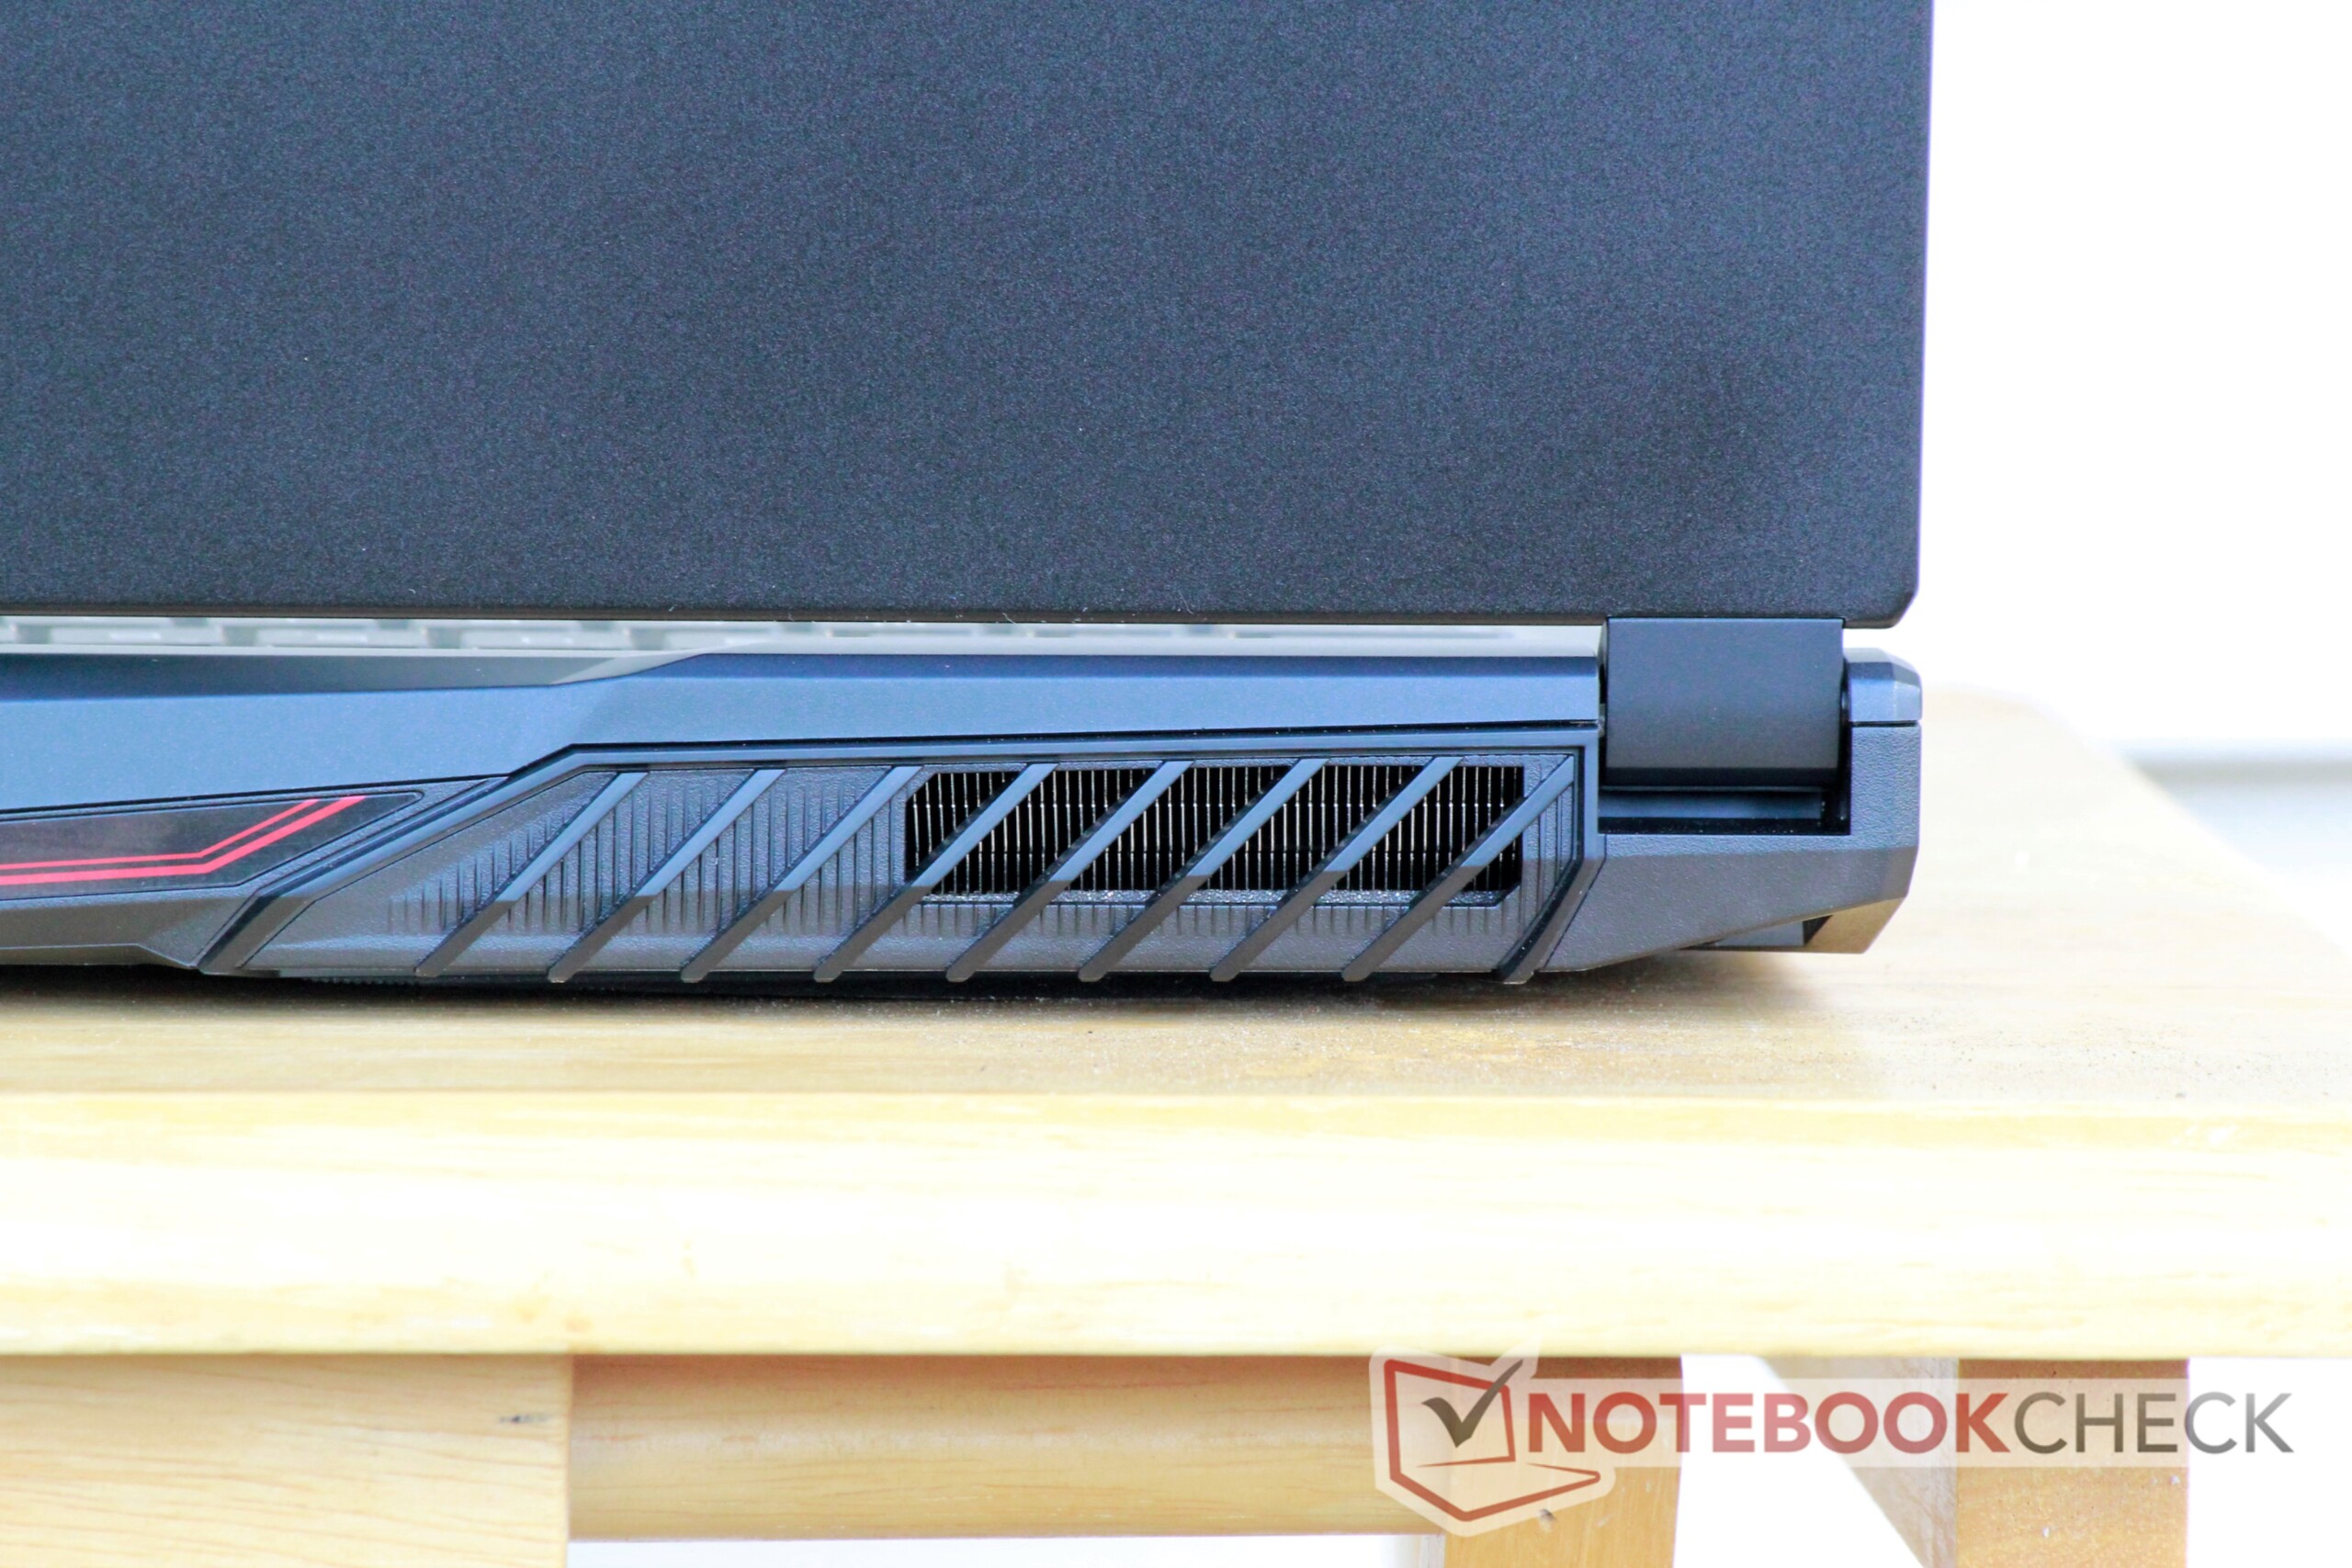
The GL75's case is similar to MSI's other mid-tier gaming laptops. Cool aluminum with a black matte powdered finish covers the back of the display while the rest of the machine is dressed in plastic. The keyboard deck has a black matte finish, echoing the aluminum lid; however, the deck is entirely plastic. Fingerprints readily show on the plastic. While the metal lid is a bit more resistant to smudges, it will show finger oils after a short while. Both surfaces can be easily wiped clean.
The case is fairly stable, though the keyboard deck and palm rests exhibit some minor flex under pressure. The lid is thin and can be warped and twisted, particularly in the middle. The bottom panel is sturdy and holds its shape when pressed. There are no unsightly gaps around the edges of the machine. The hinges hold the screen steady while typing. The display cannot be opened without holding the base of the machine. Pushing the top center of the machine's base creates an audible click, and some creaks can be heard when the palm rests are depressed.
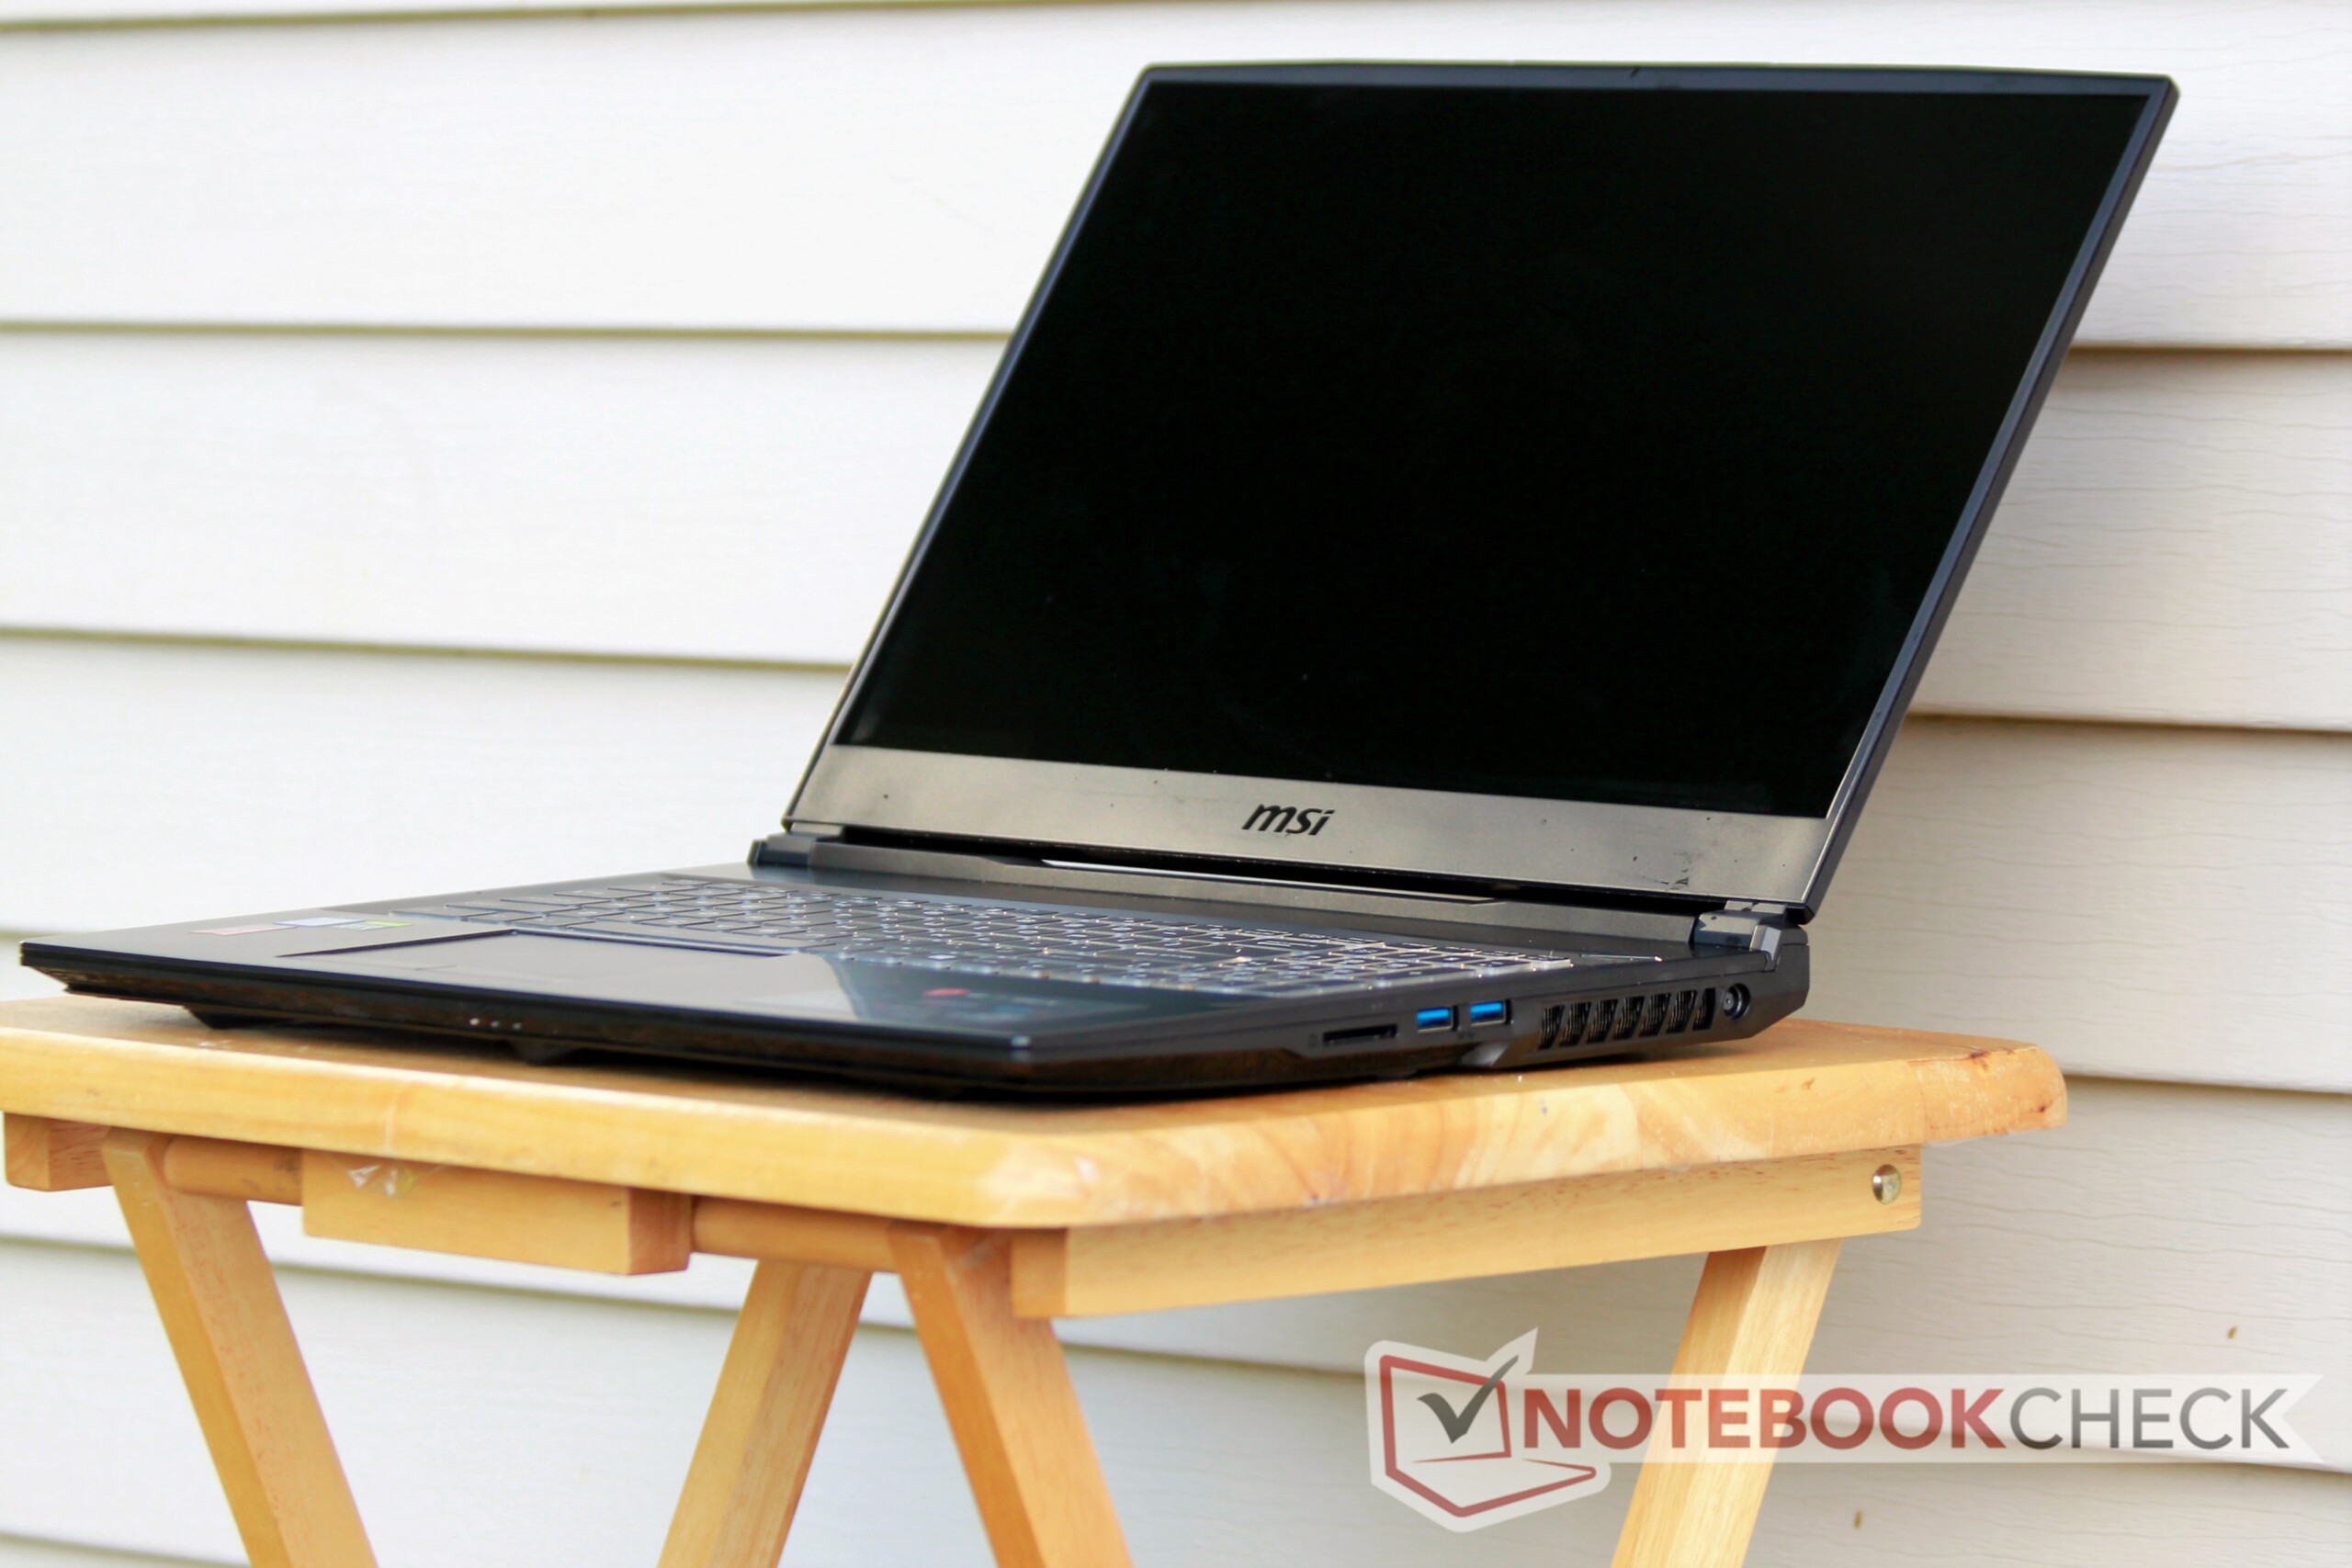
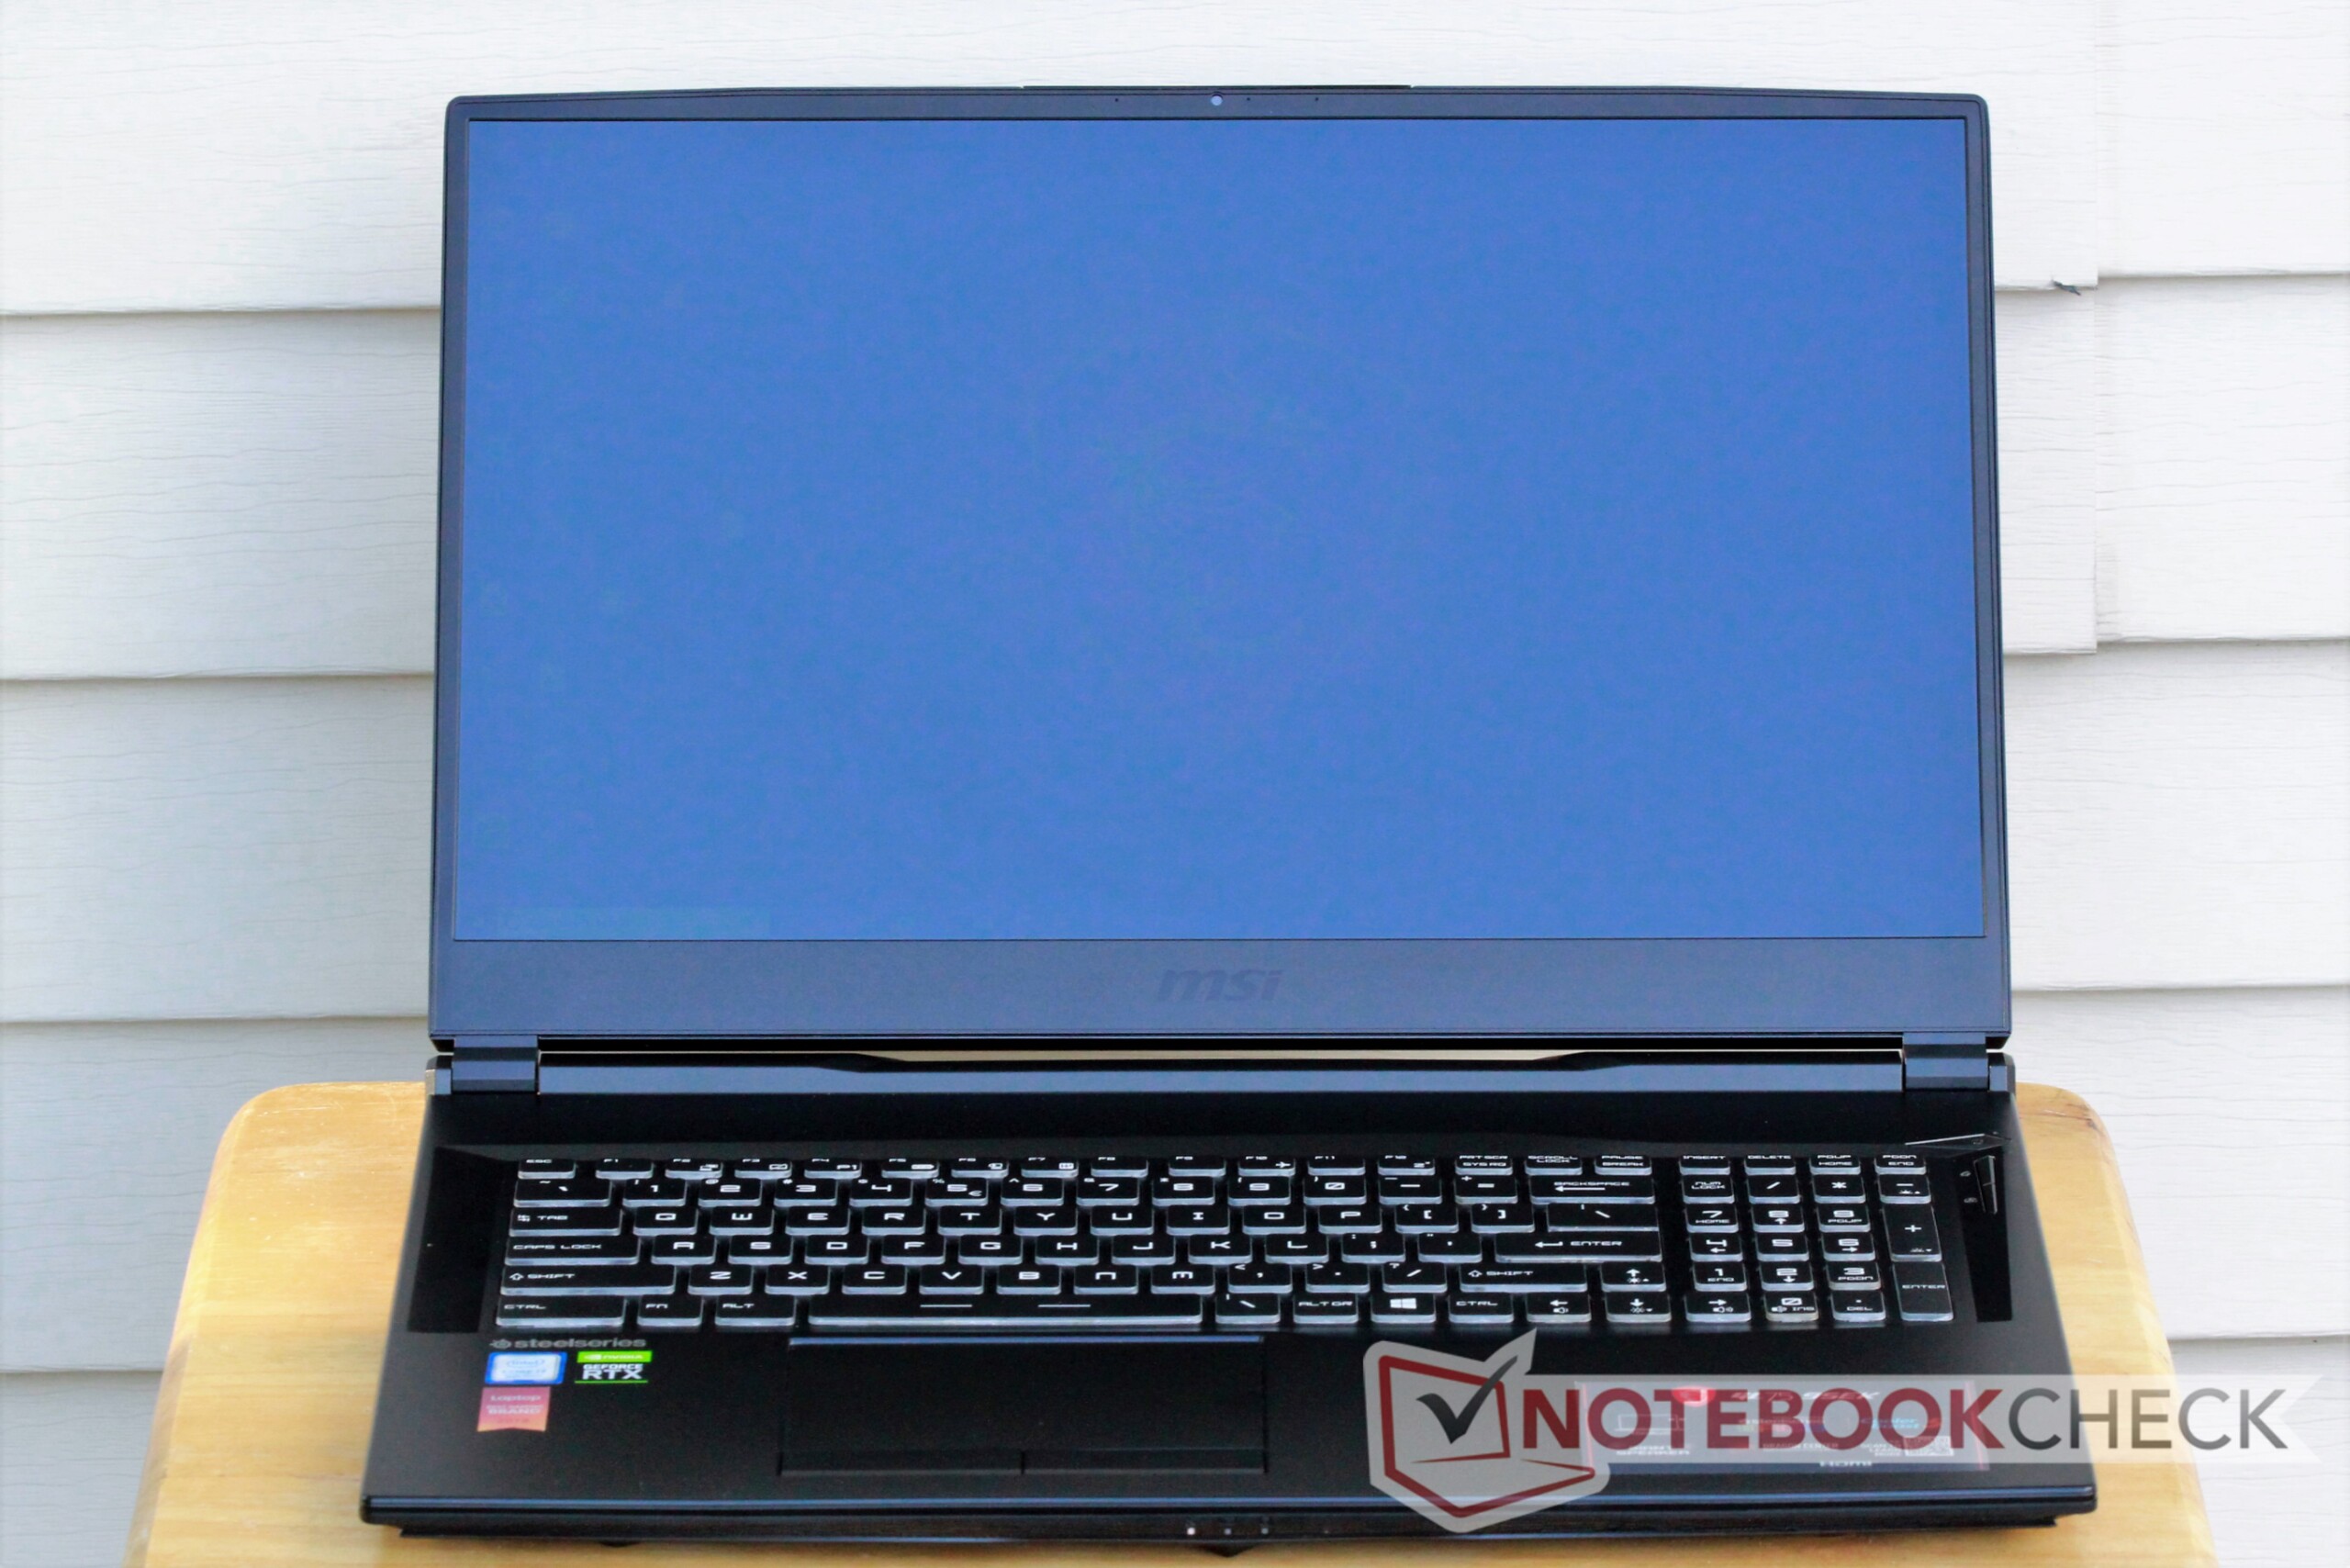
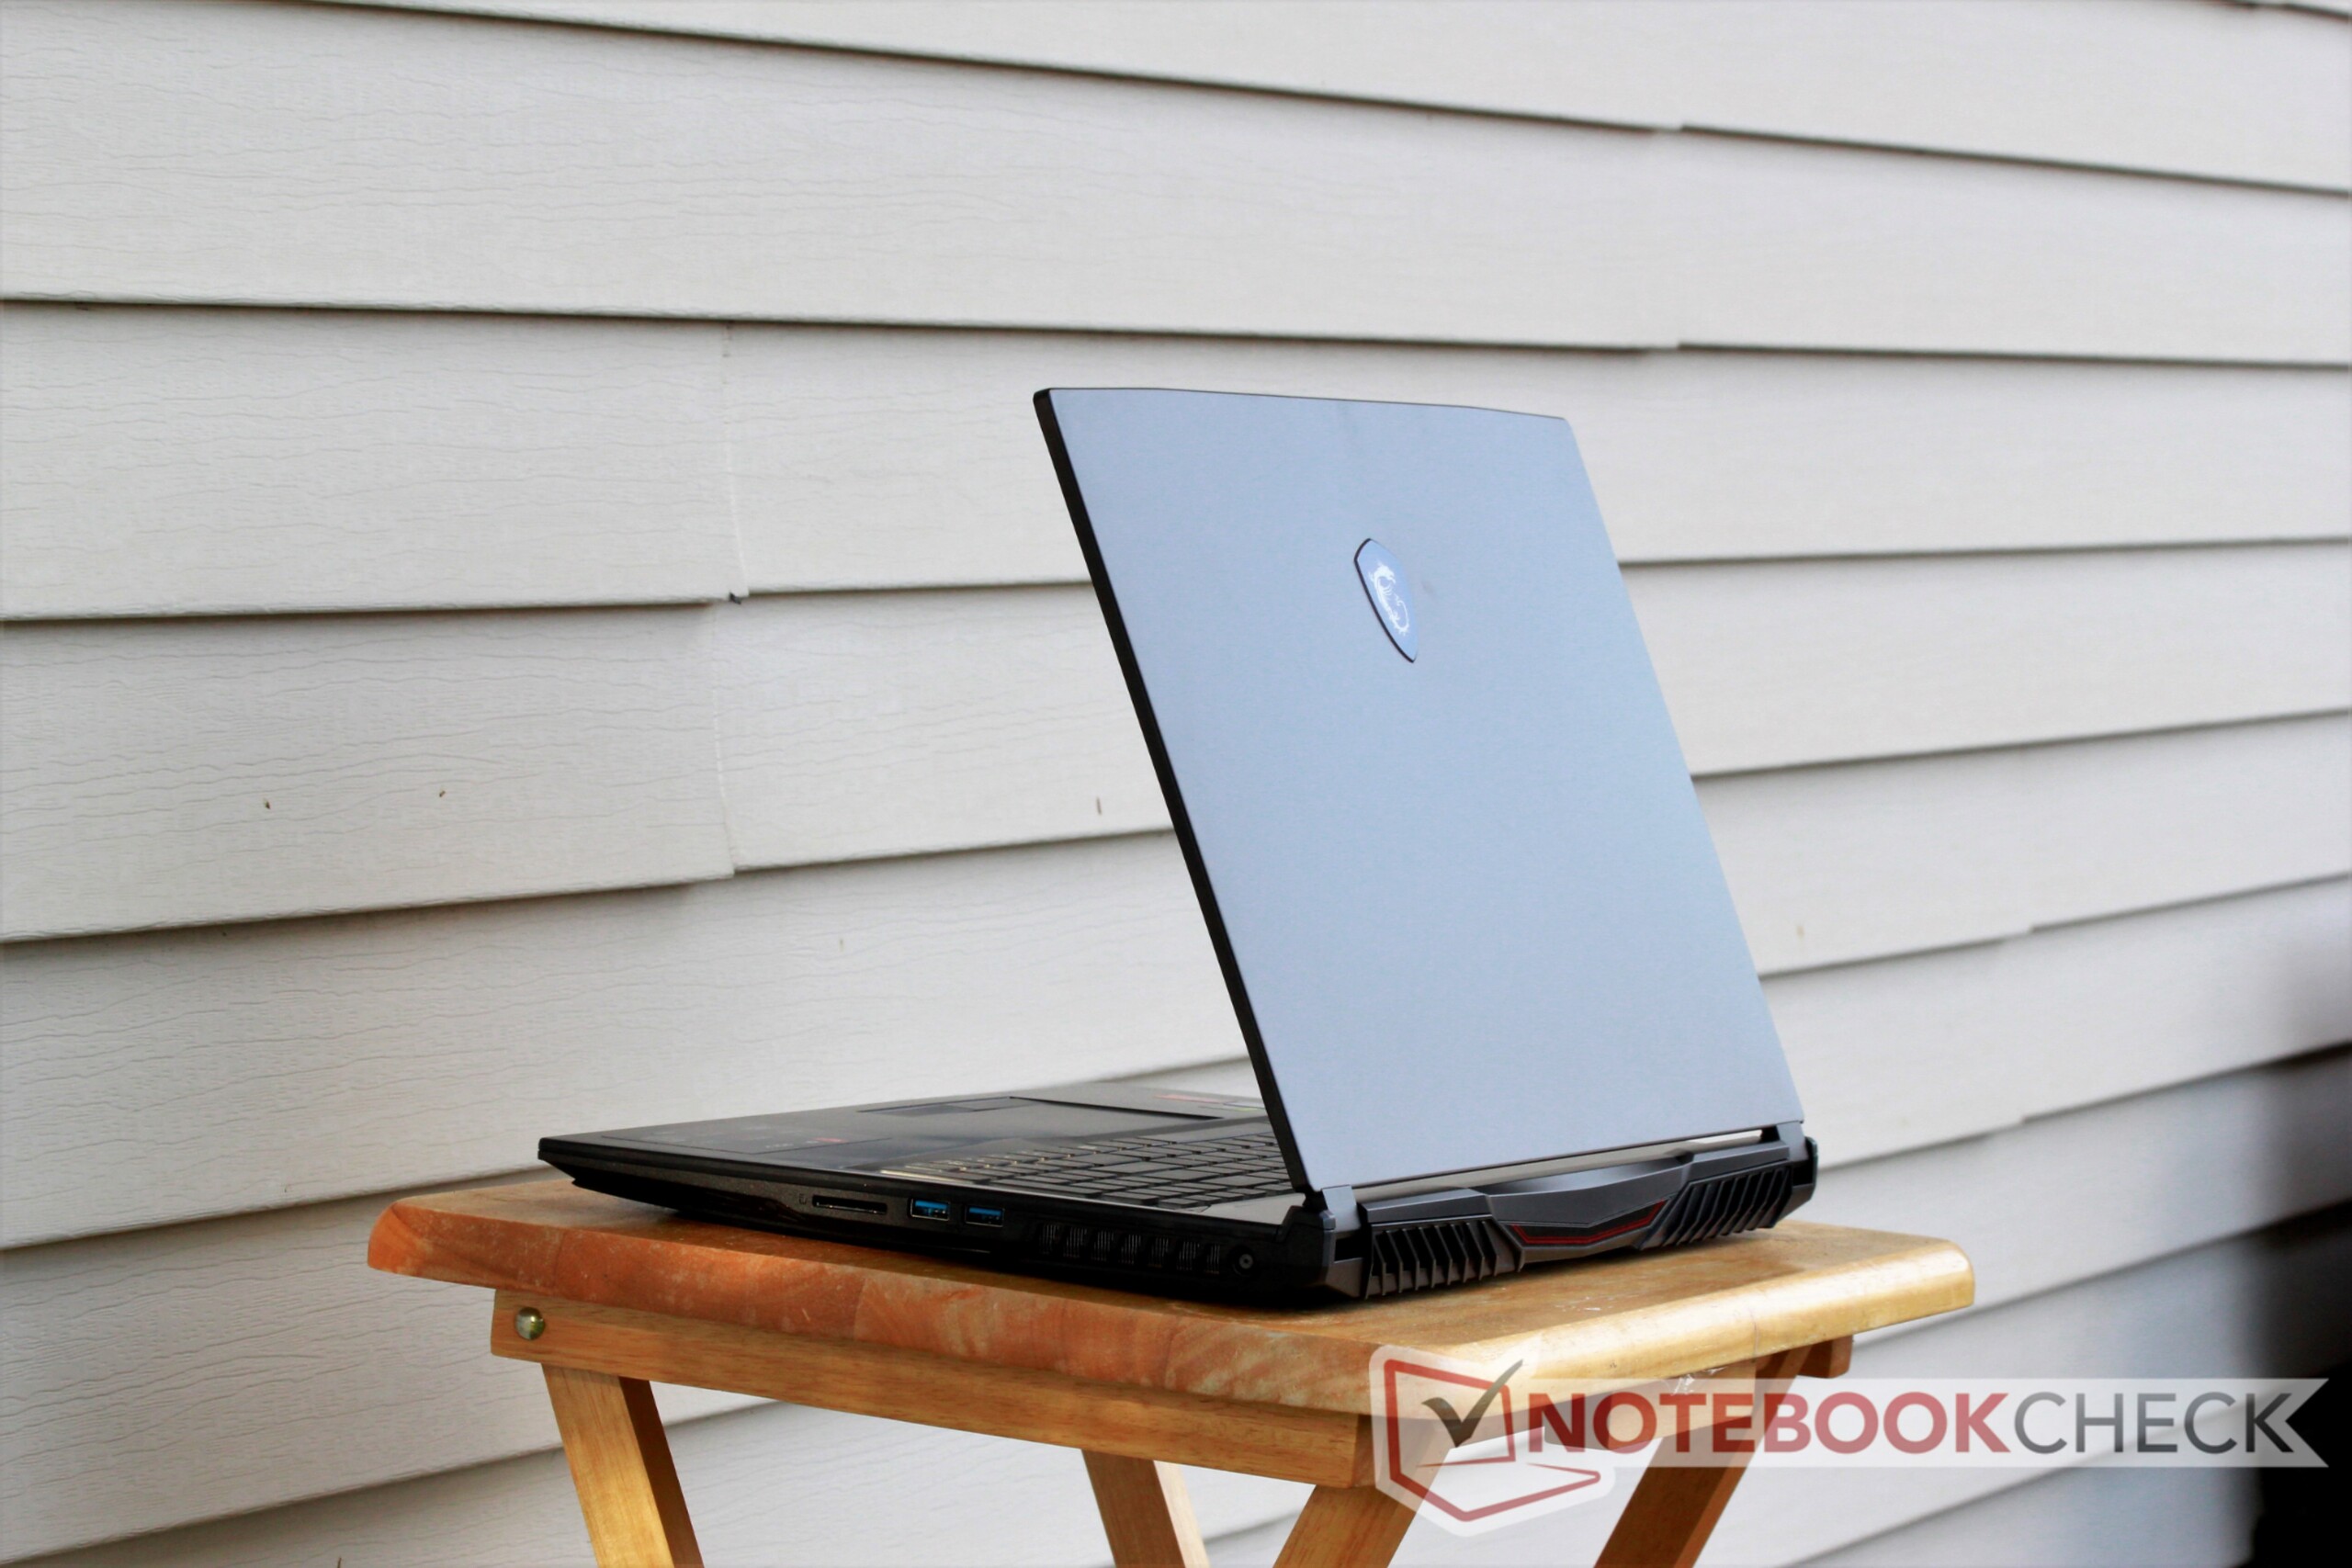
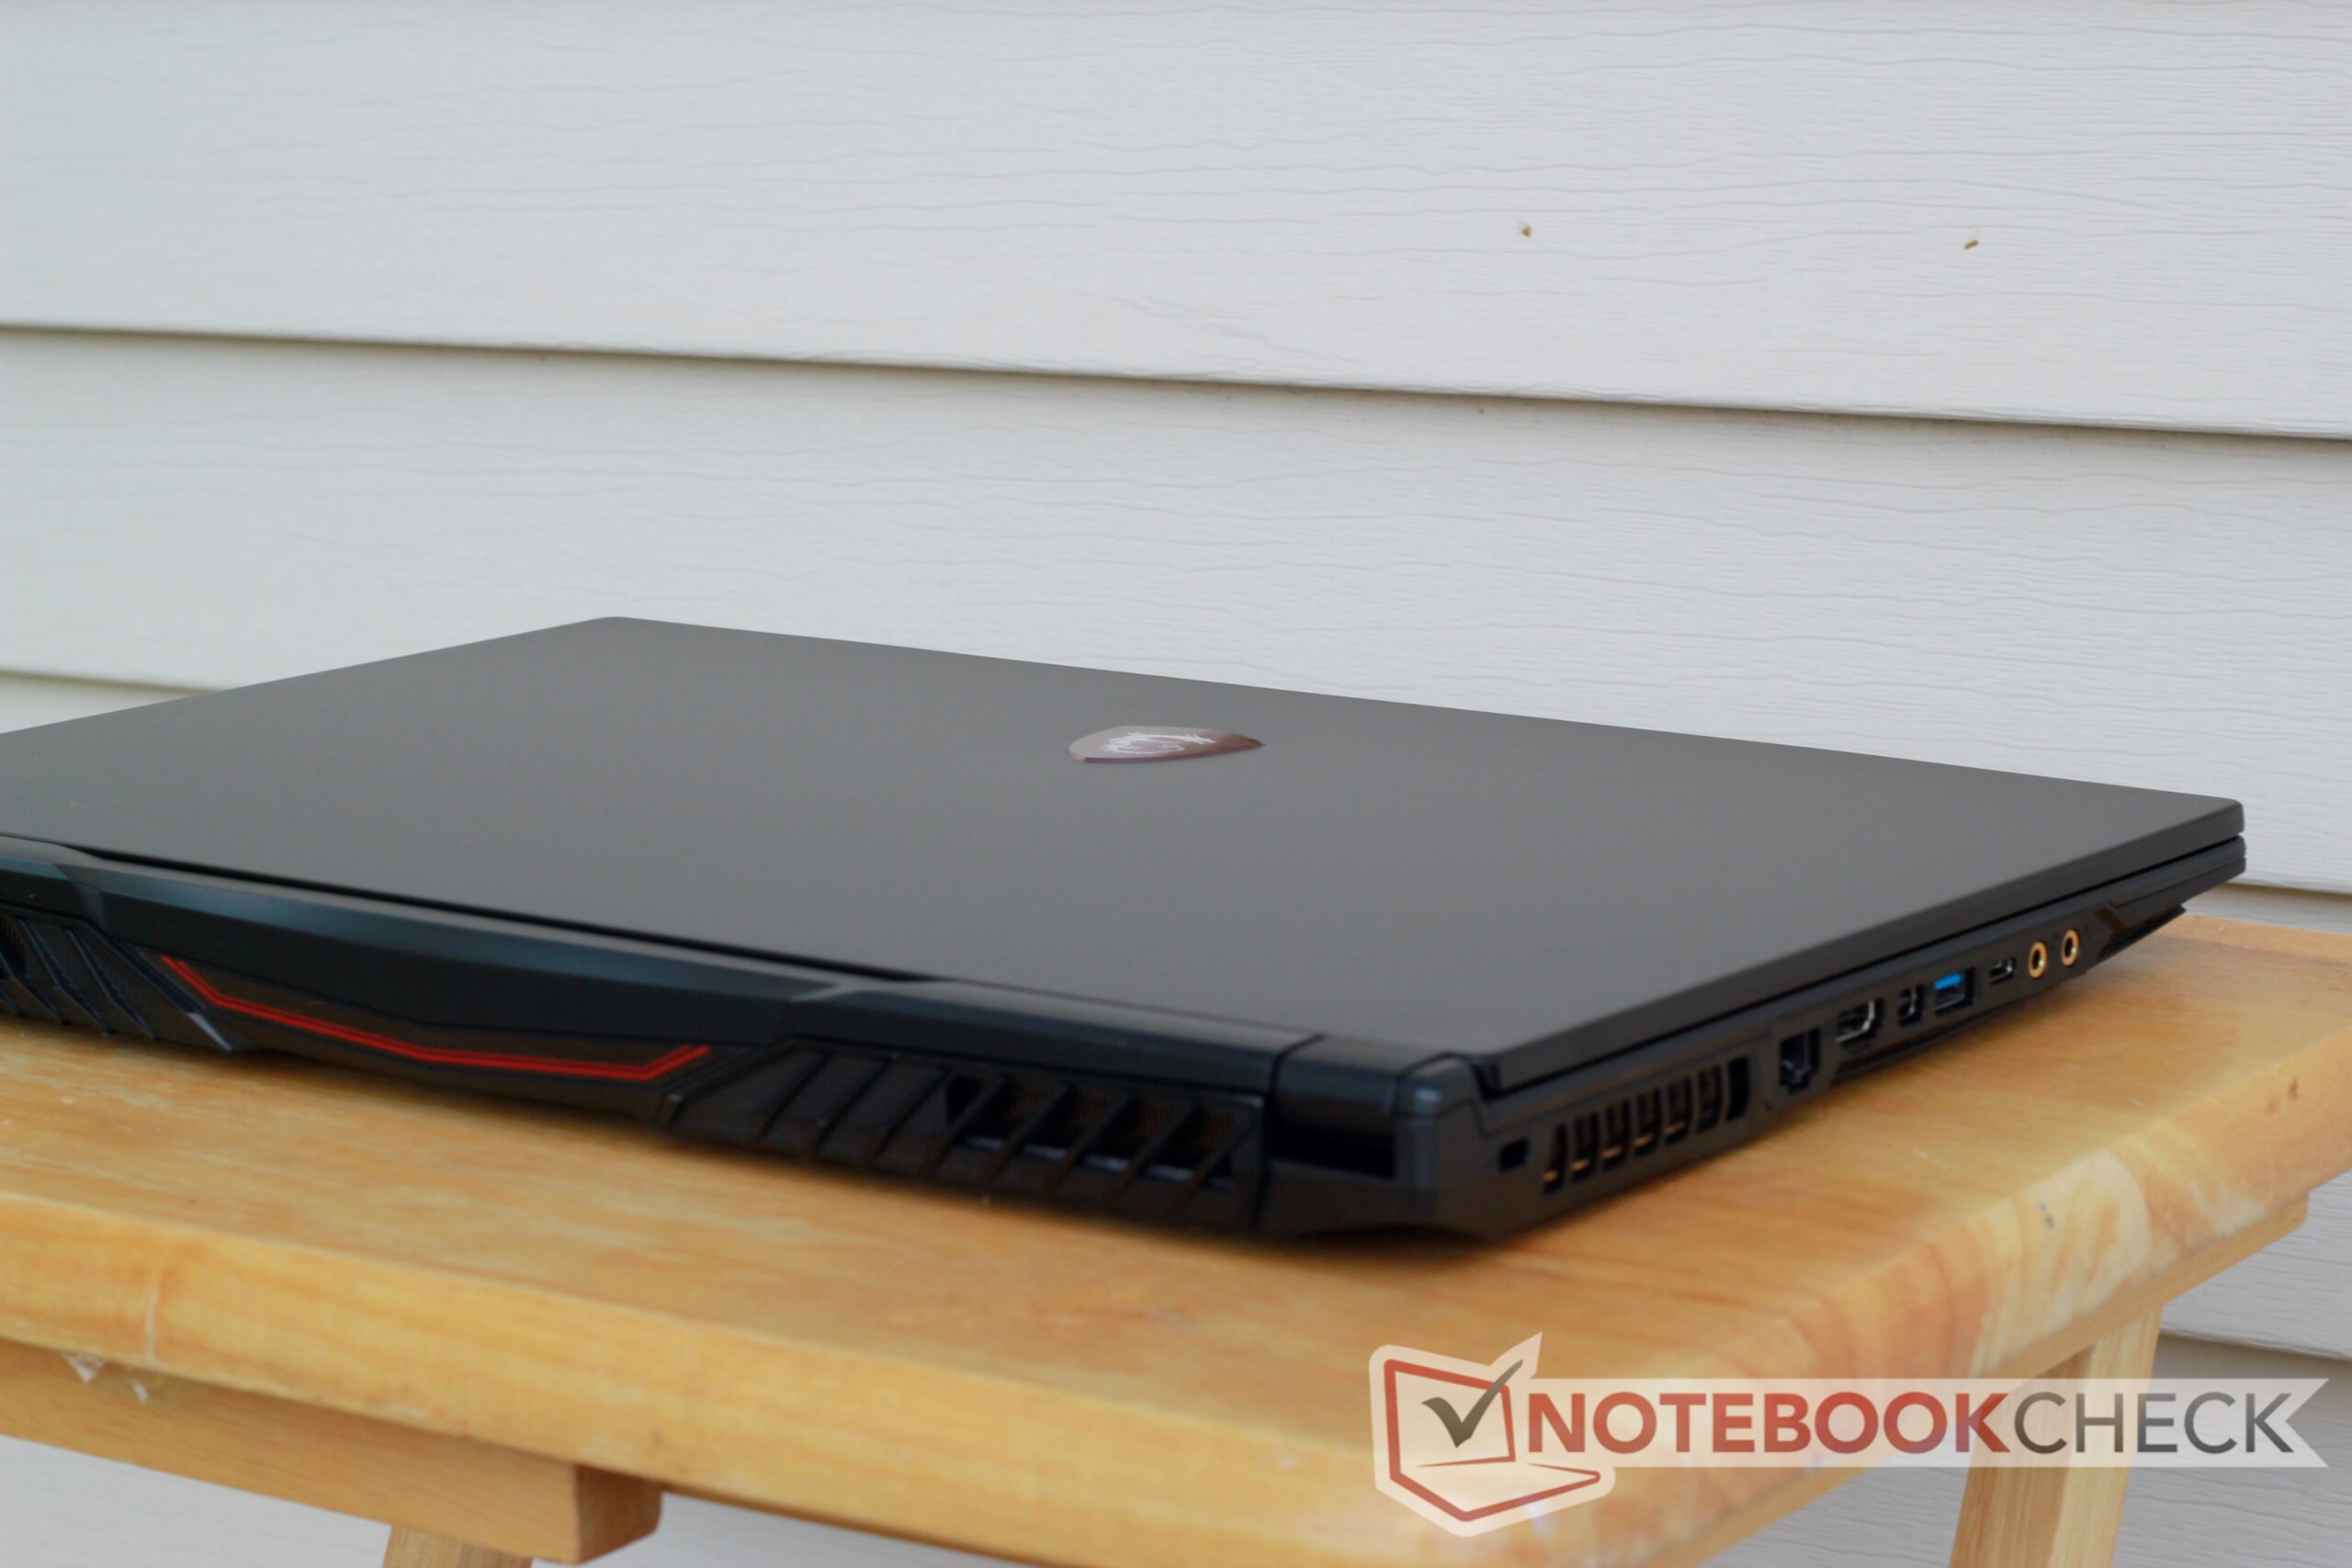
Due to the slim bezels around the display, the GL75 is a fair bit smaller than other 17-inch gaming notebooks. HP's Pavilion Gaming 17 and Asus' Strix Hero III G731GV are close in size but have slightly larger footprints. The GL75 takes up about 11% less desk space than its predecessor, the GL73 8SE. Despite its smaller footprint, the GL75 is still chunky; its 28 mm thick chassis may keep it out of smaller bags. The GL75 weighs in at 2.5 kg, which is on the lighter side for a large gaming laptop. As such, the machine is reasonably portable.
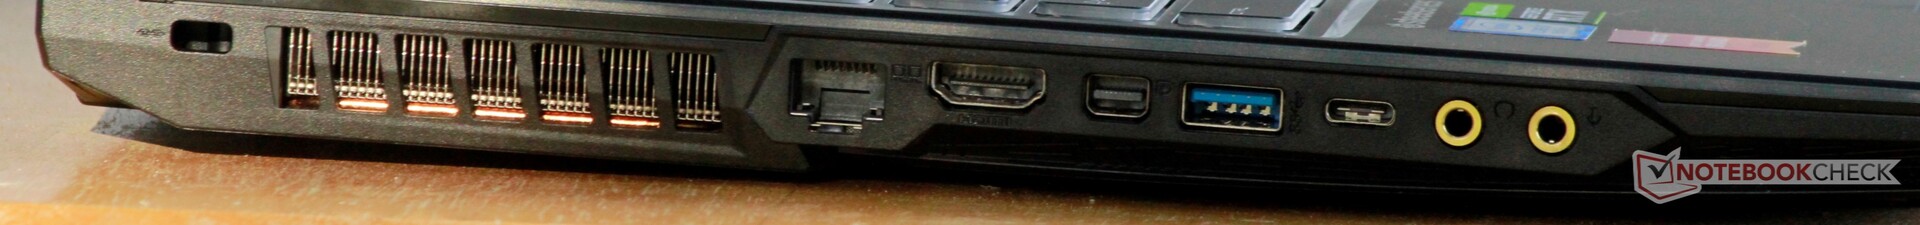
Connectivity
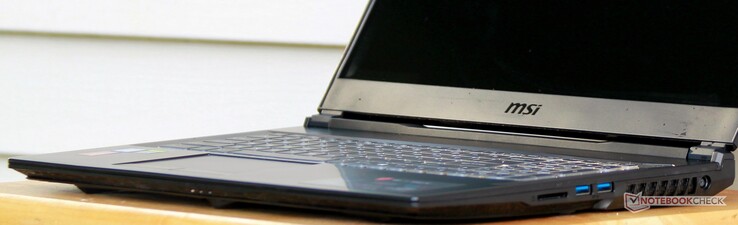
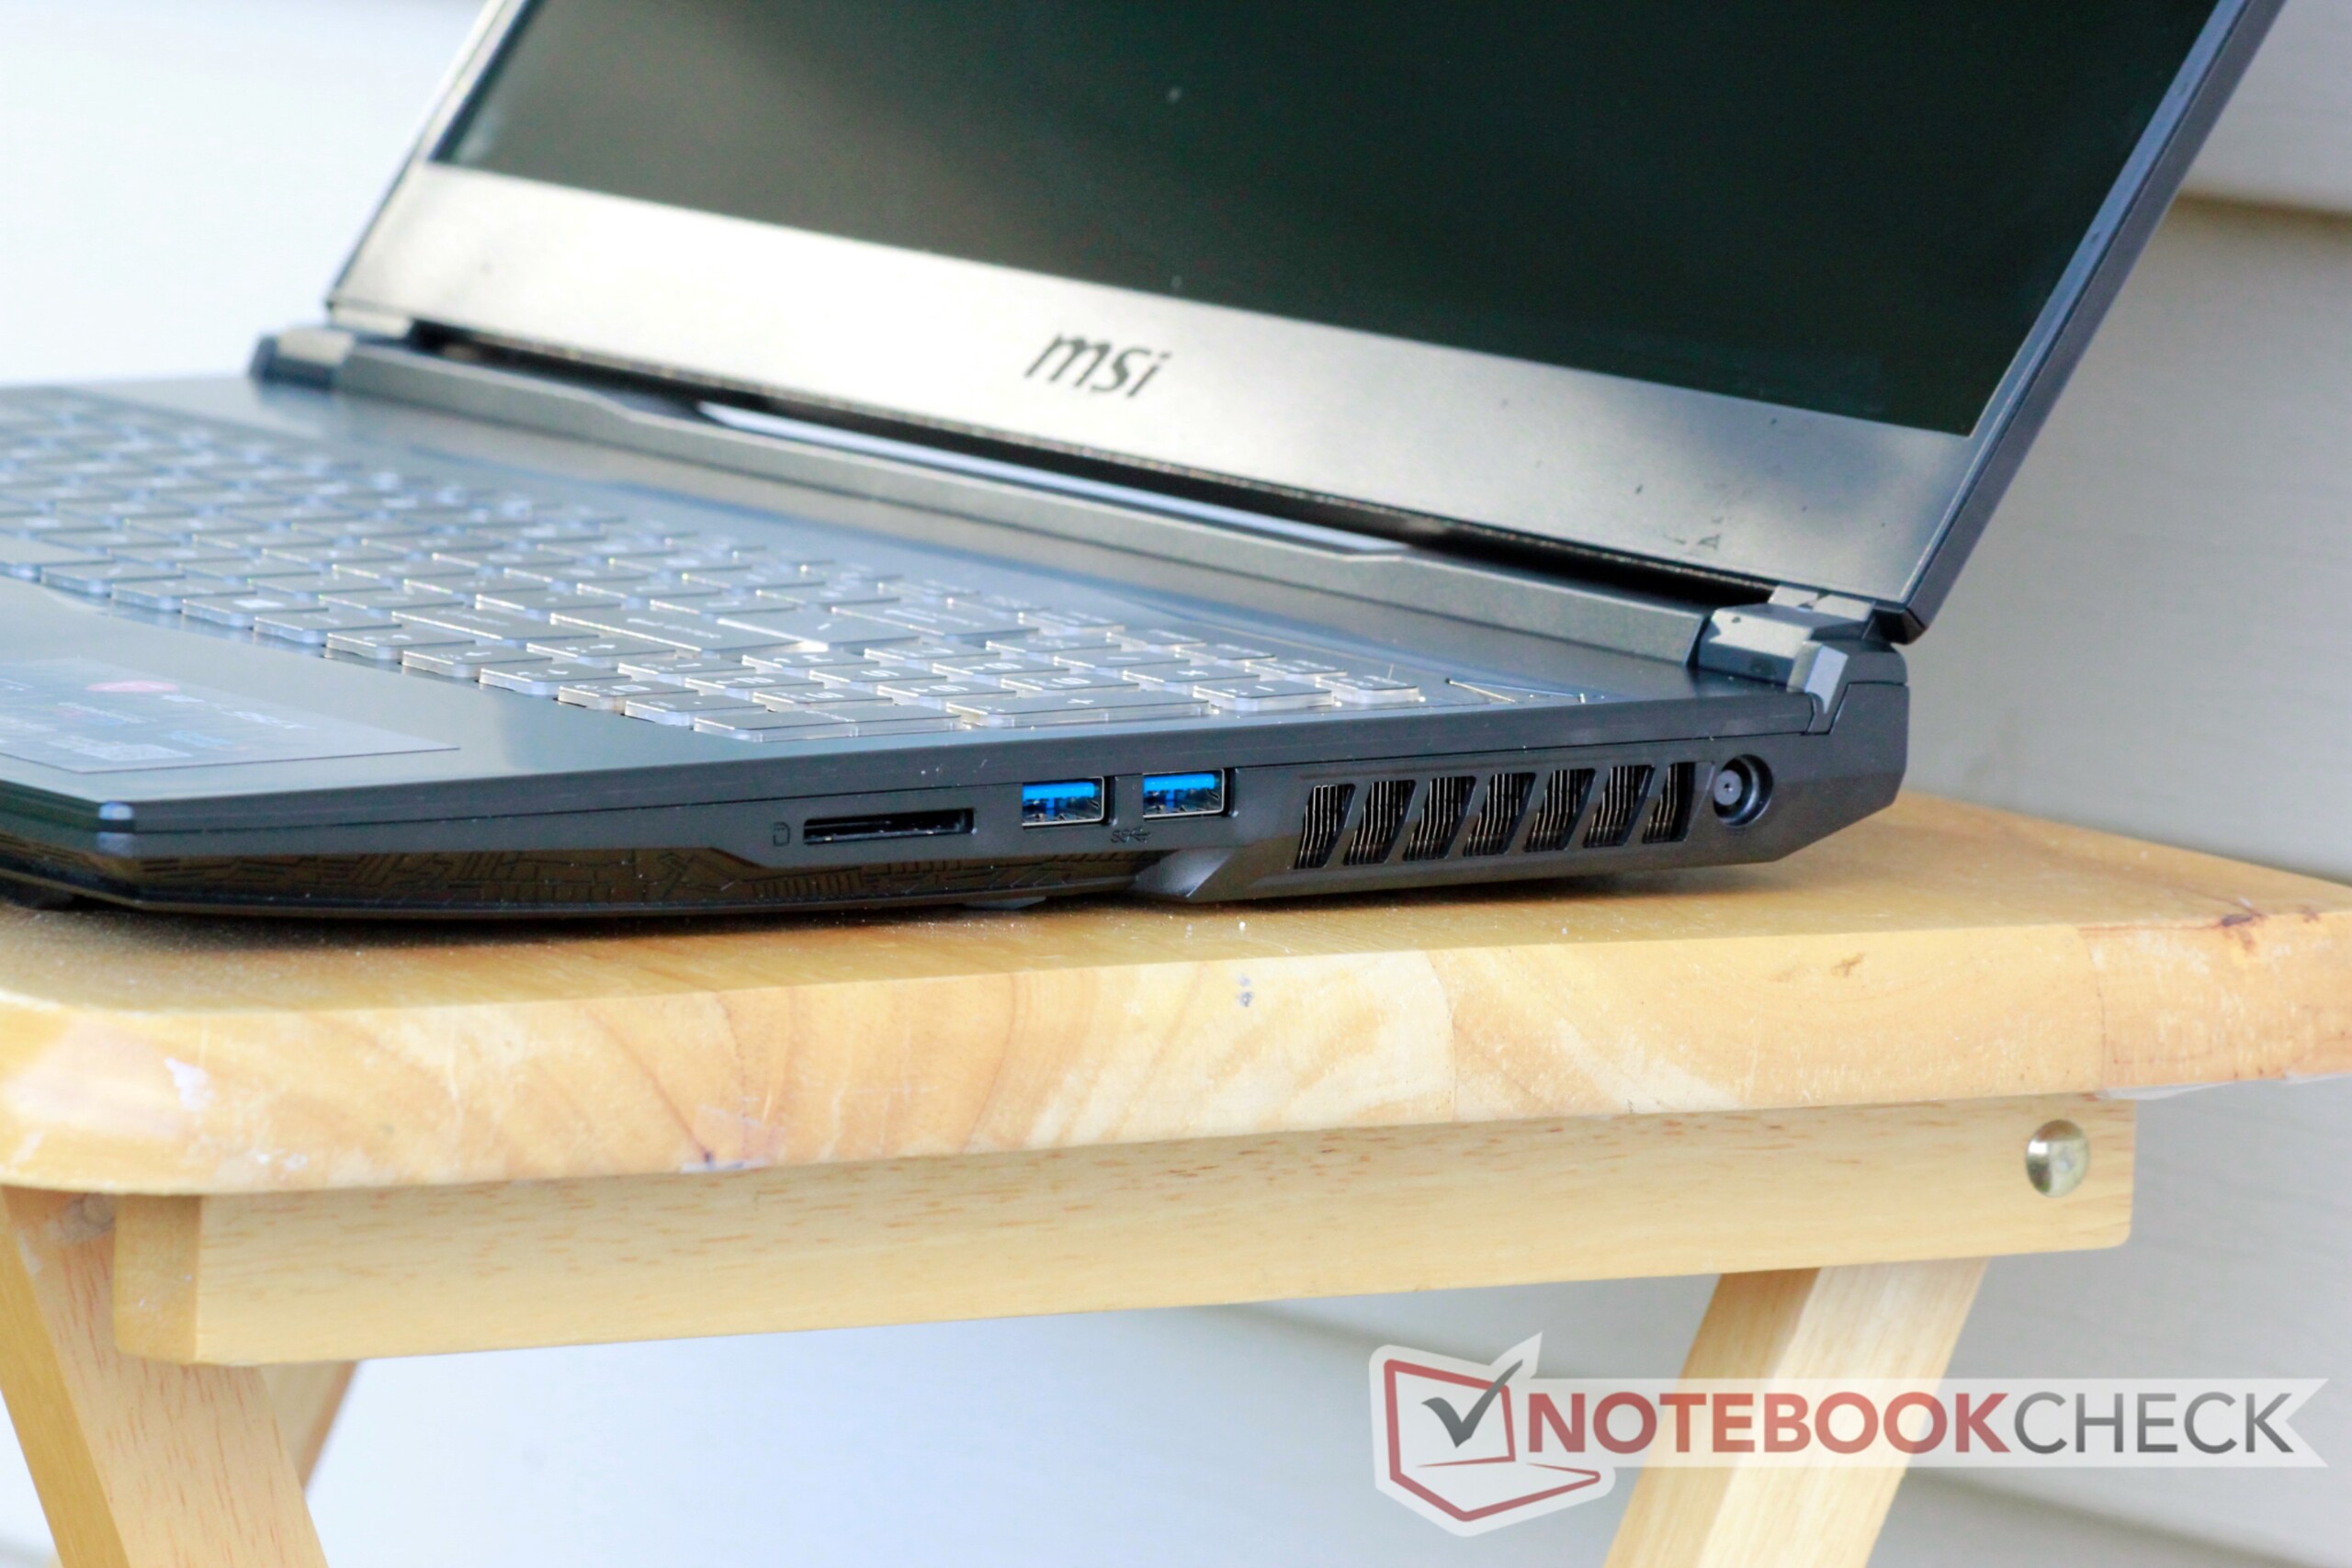
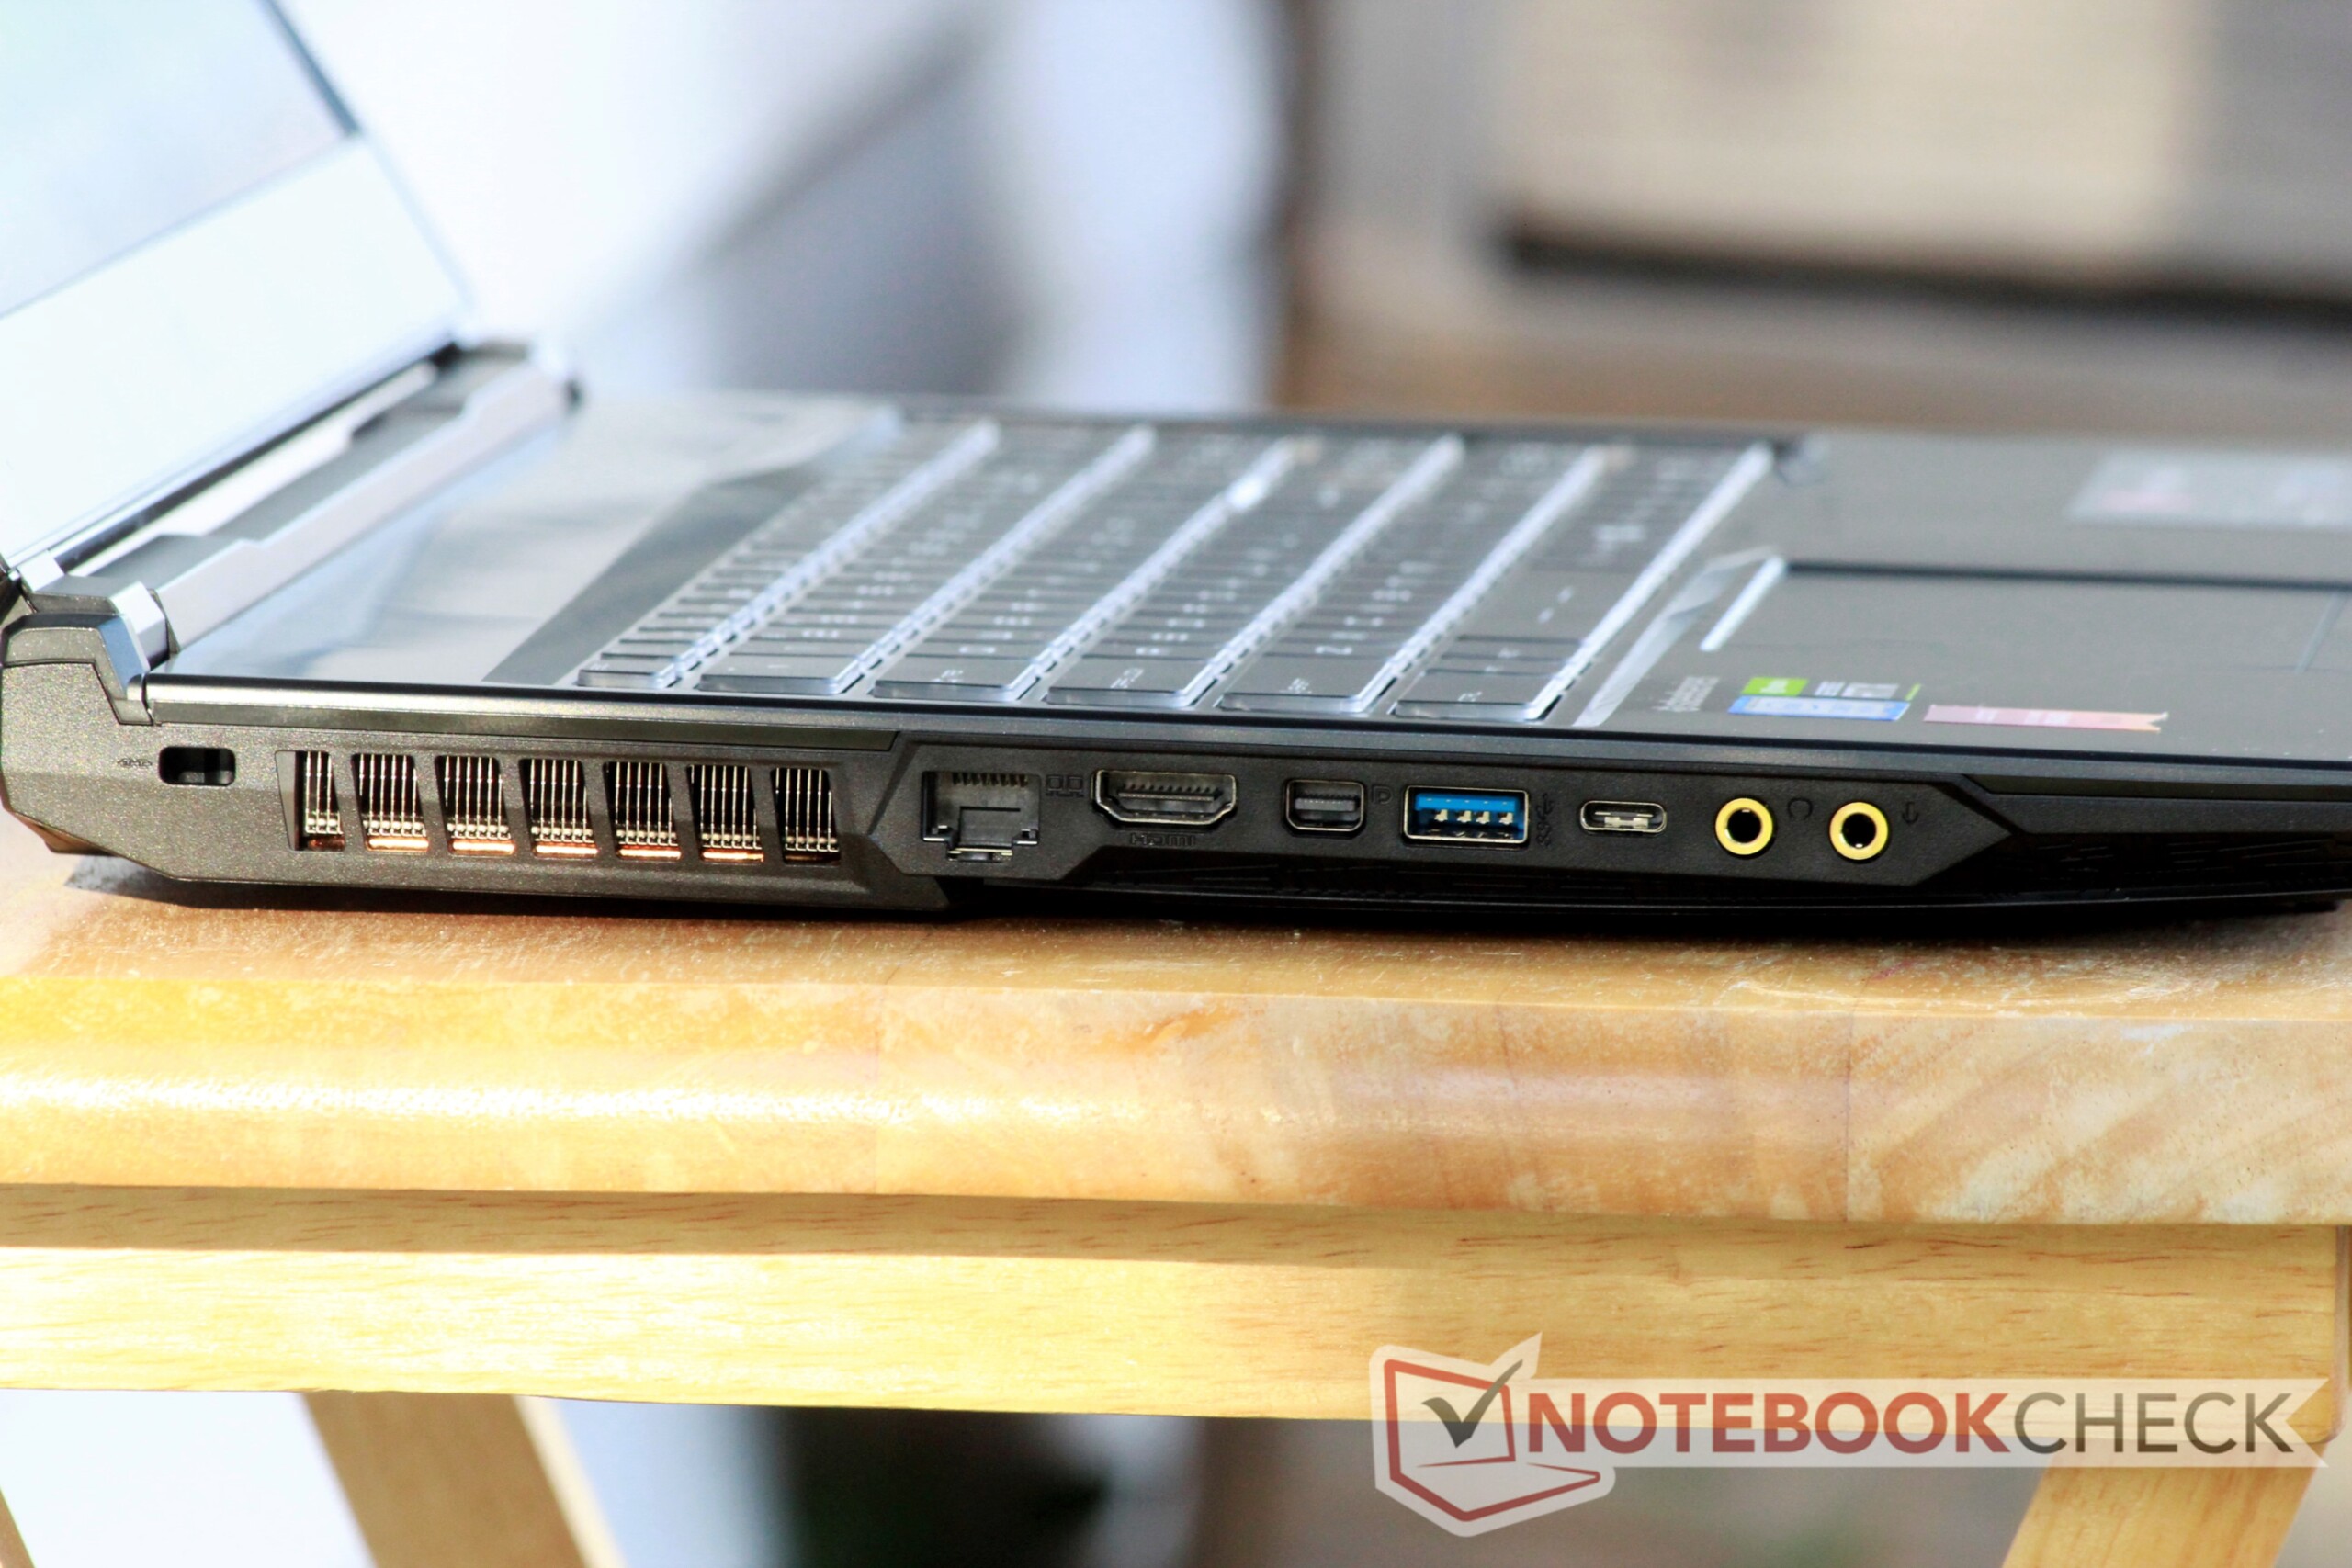
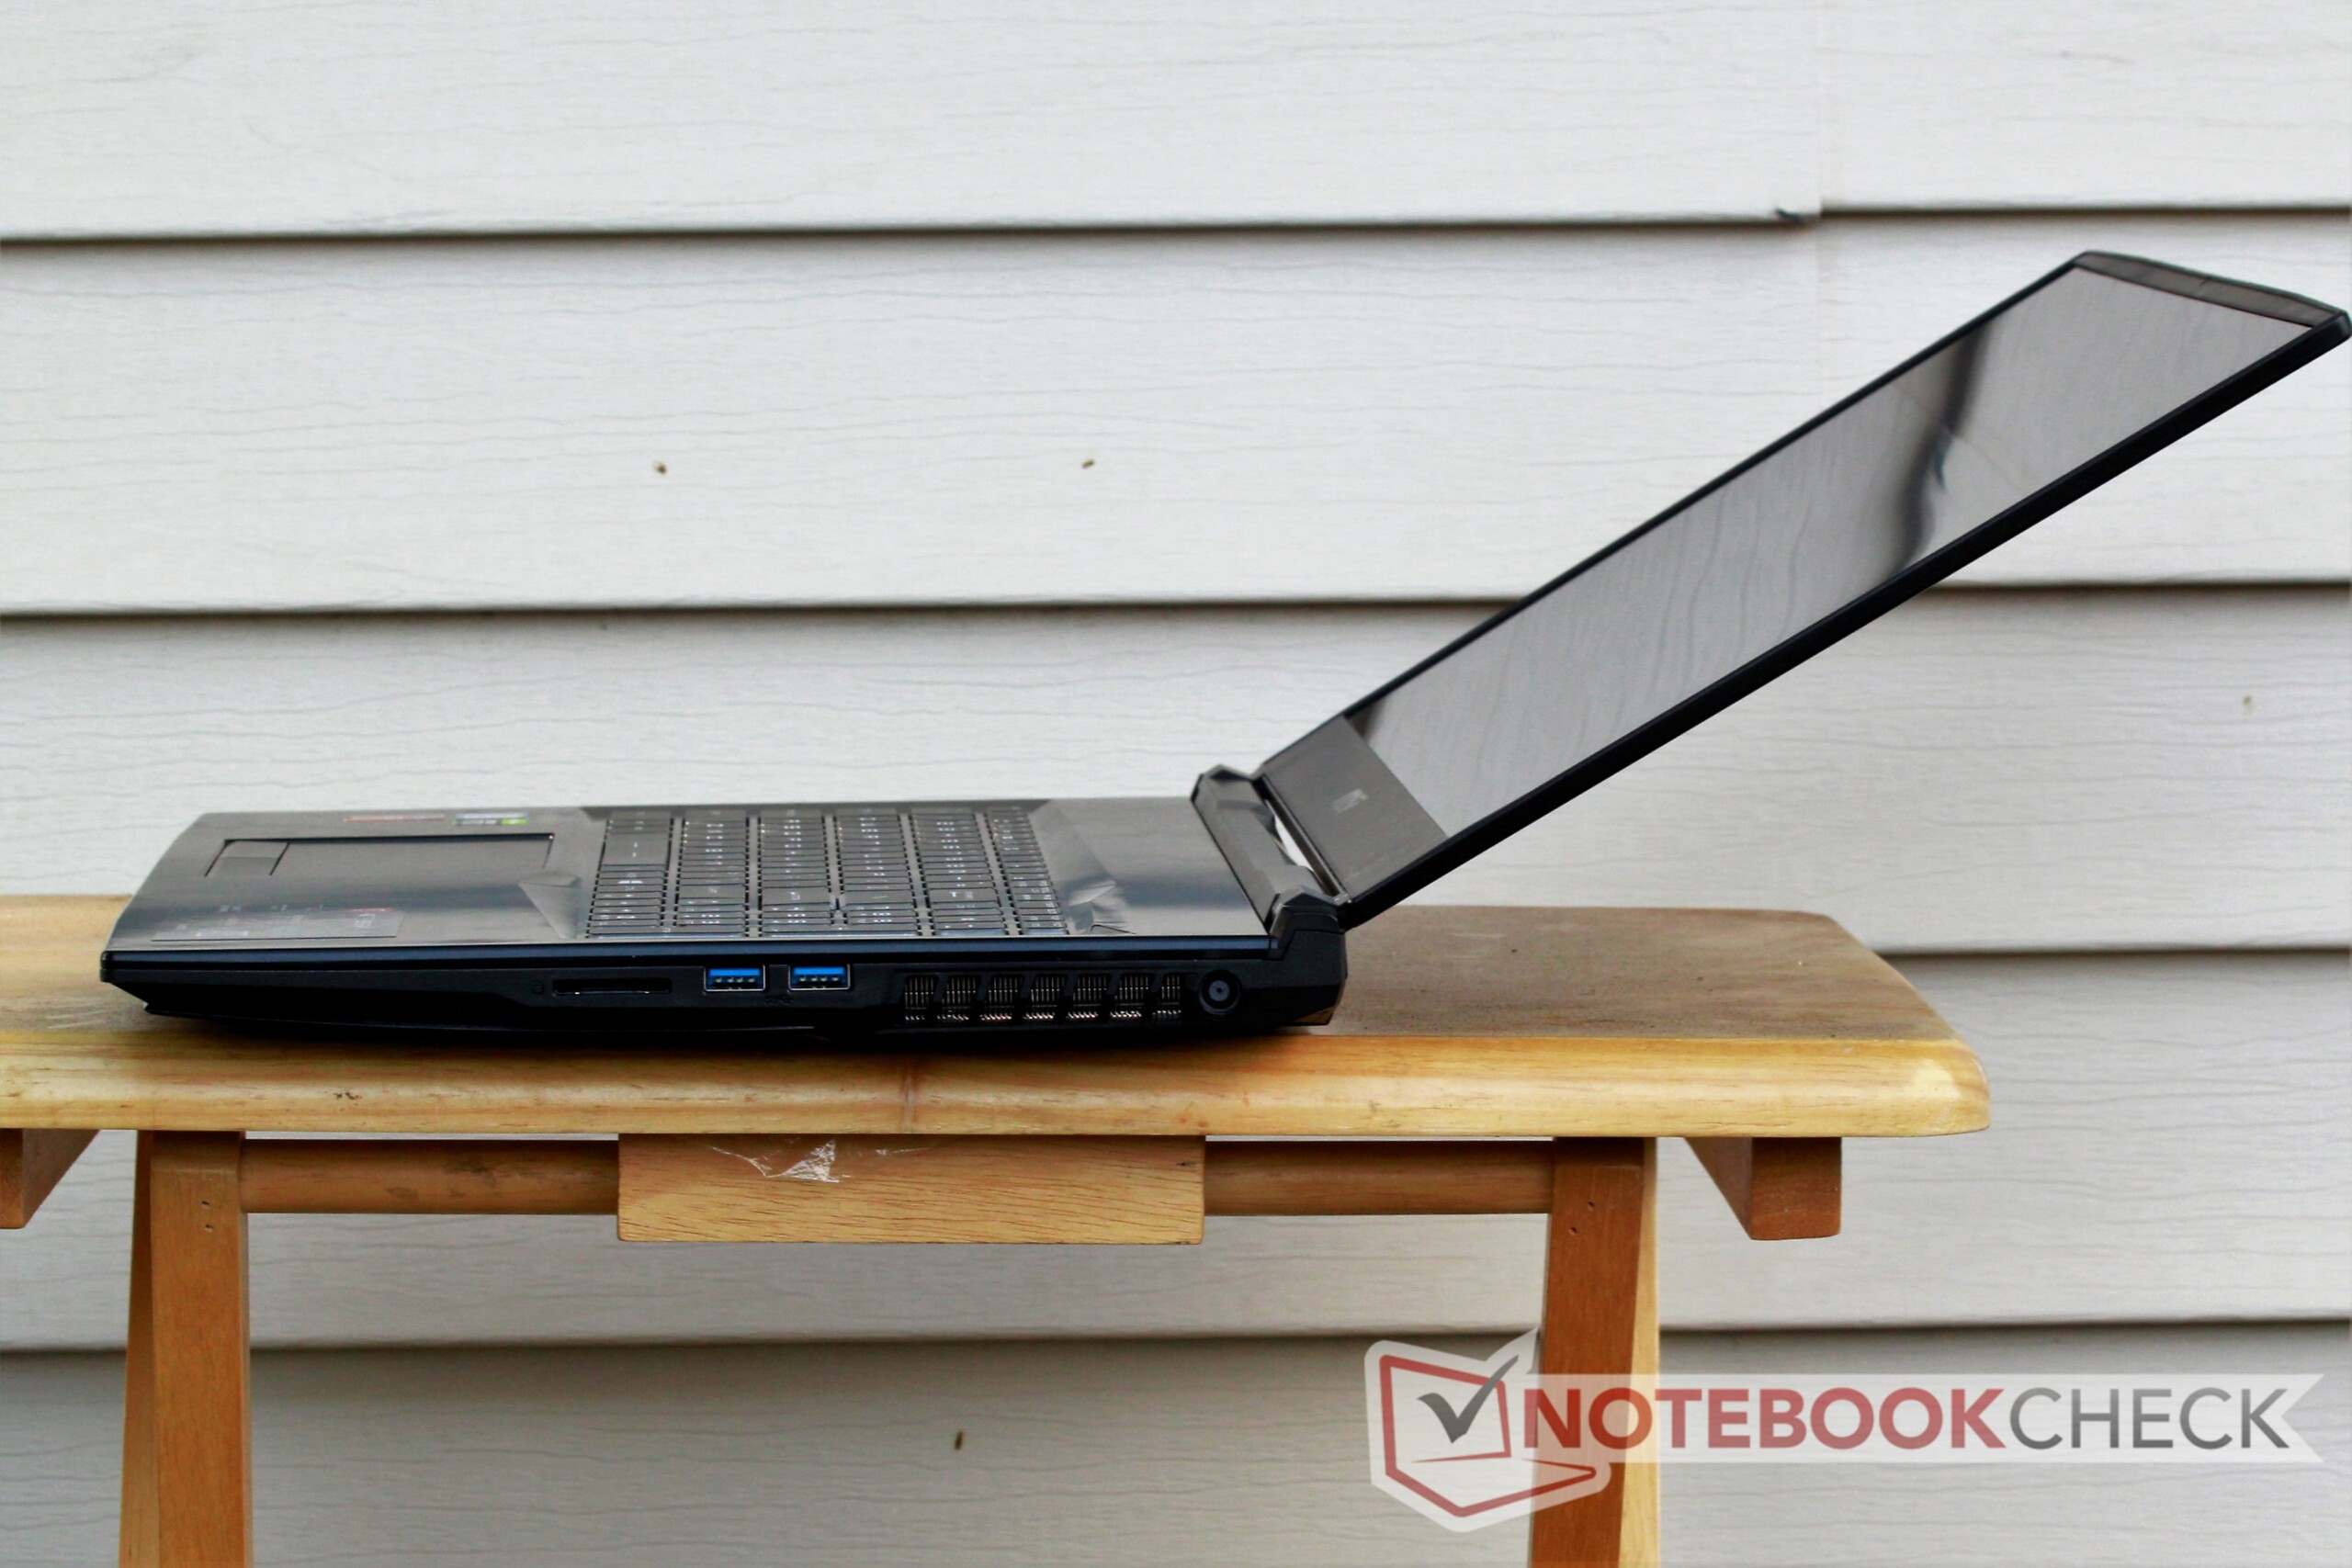
Port selection is varied but feels outdated. The absence of Thunderbolt 3 is understandable given the price, but the use of an older HDMI 1.4 port (which only supports 4K displays at 30 Hz) is a disappointing choice.

SD Card Reader
MSI's budget- and mid-range laptops have long been plagued by slow SD card readers, and (sadly) the GL75 falls victim to this disease. The card reader offers transfer rates below 30 MB/s, which is abysmally slow compared to similarly priced gaming machines. The only other device in our comparison at this end of the speed spectrum is another MSI laptop, the GL73. All other competitors average between 70-80 MB/s.
| SD Card Reader | |
| average JPG Copy Test (av. of 3 runs) | |
| Average of class Gaming (20.9 - 210, n=54, last 2 years) | |
| HP Omen 17t-3AW55AV_1 (Toshiba Exceria Pro SDXC 64 GB UHS-II) | |
| HP Omen 15-dc1020ng (Toshiba Exceria Pro SDXC 64 GB UHS-II) | |
| HP Pavilion Gaming 17-cd0085cl (Toshiba Exceria Pro SDXC 64 GB UHS-II) | |
| MSI GL73 8SE-010US (Toshiba Exceria Pro SDXC 64 GB UHS-II) | |
| MSI GL75 9SEK-056US | |
| maximum AS SSD Seq Read Test (1GB) | |
| Average of class Gaming (25.5 - 261, n=51, last 2 years) | |
| HP Omen 15-dc1020ng (Toshiba Exceria Pro SDXC 64 GB UHS-II) | |
| HP Omen 17t-3AW55AV_1 (Toshiba Exceria Pro SDXC 64 GB UHS-II) | |
| HP Pavilion Gaming 17-cd0085cl (Toshiba Exceria Pro SDXC 64 GB UHS-II) | |
| MSI GL73 8SE-010US (Toshiba Exceria Pro SDXC 64 GB UHS-II) | |
| MSI GL75 9SEK-056US | |
Communication
Excellent wireless cards are somewhat of a given in even modest gaming laptops nowadays, and the GL75's Intel Cannon Lake card furthers this trend. Wireless speeds sit between 650-700 MBit/s, which should be more than enough for most consumer-grade routers. Connections remained stable up to about 30 meters from our home router, even through one interior and one exterior wall.
Accessories
MSI includes a few stickers and some paperwork in the box, but nothing else.
Maintenance & Warranty
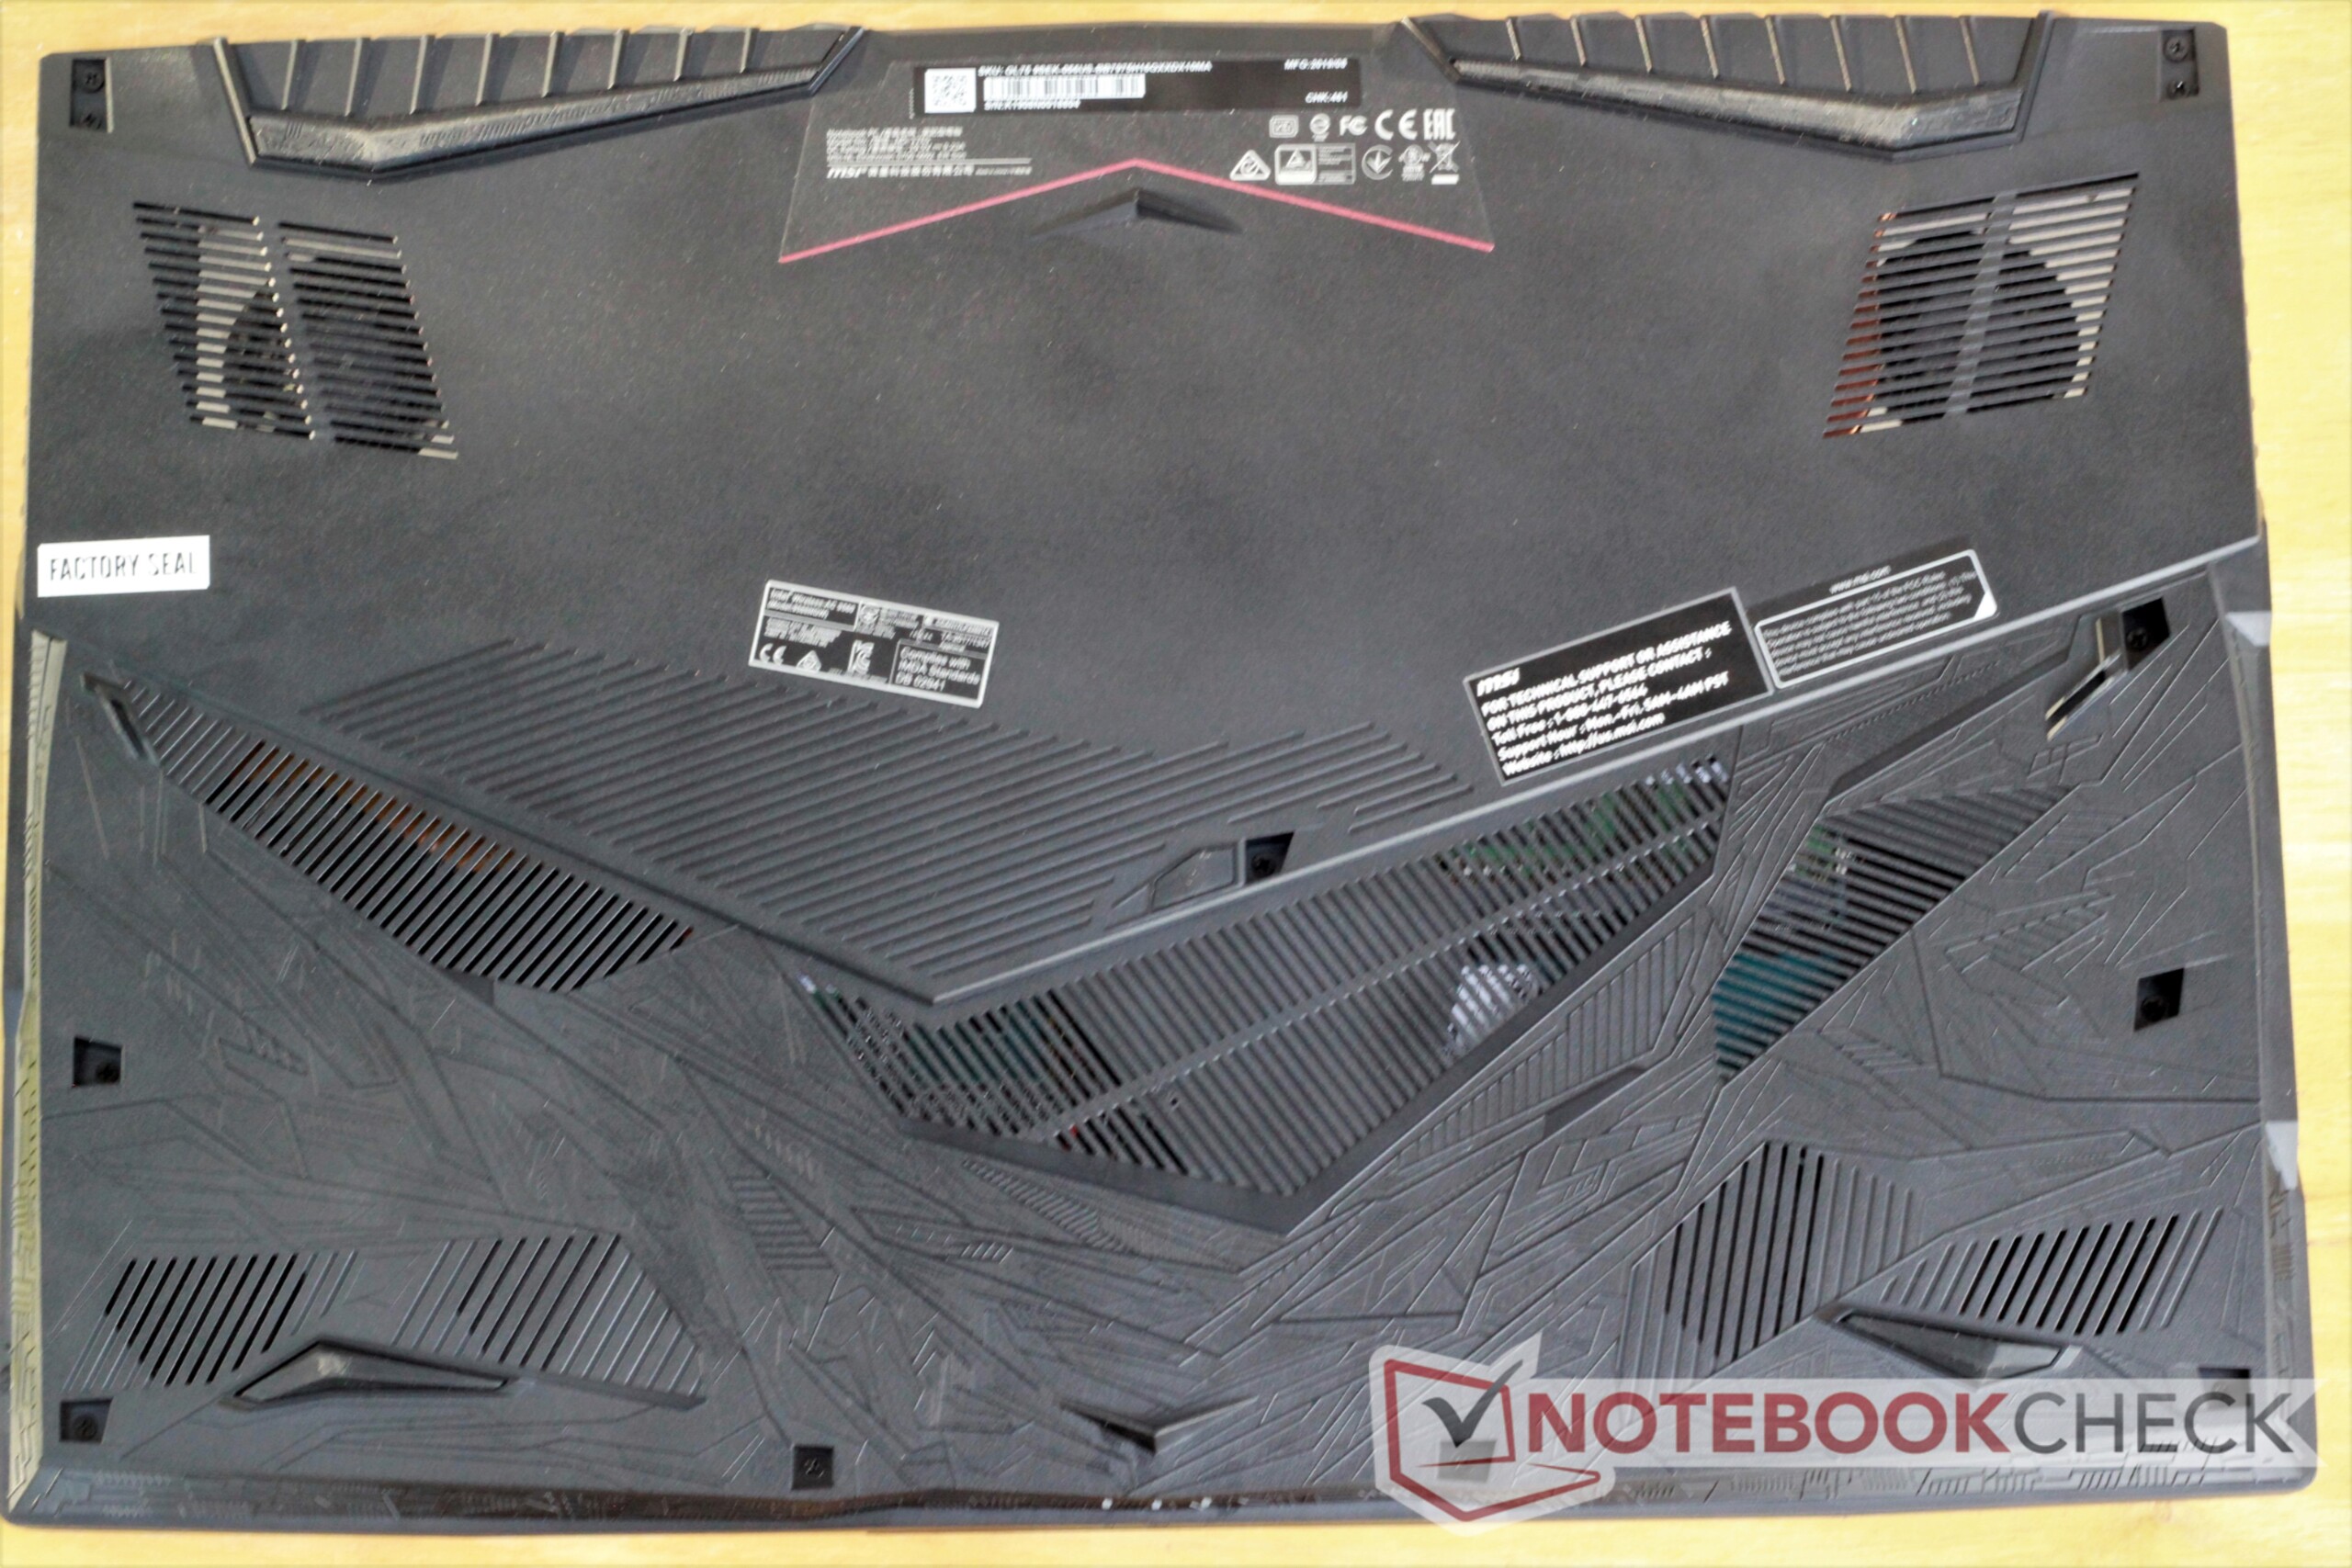
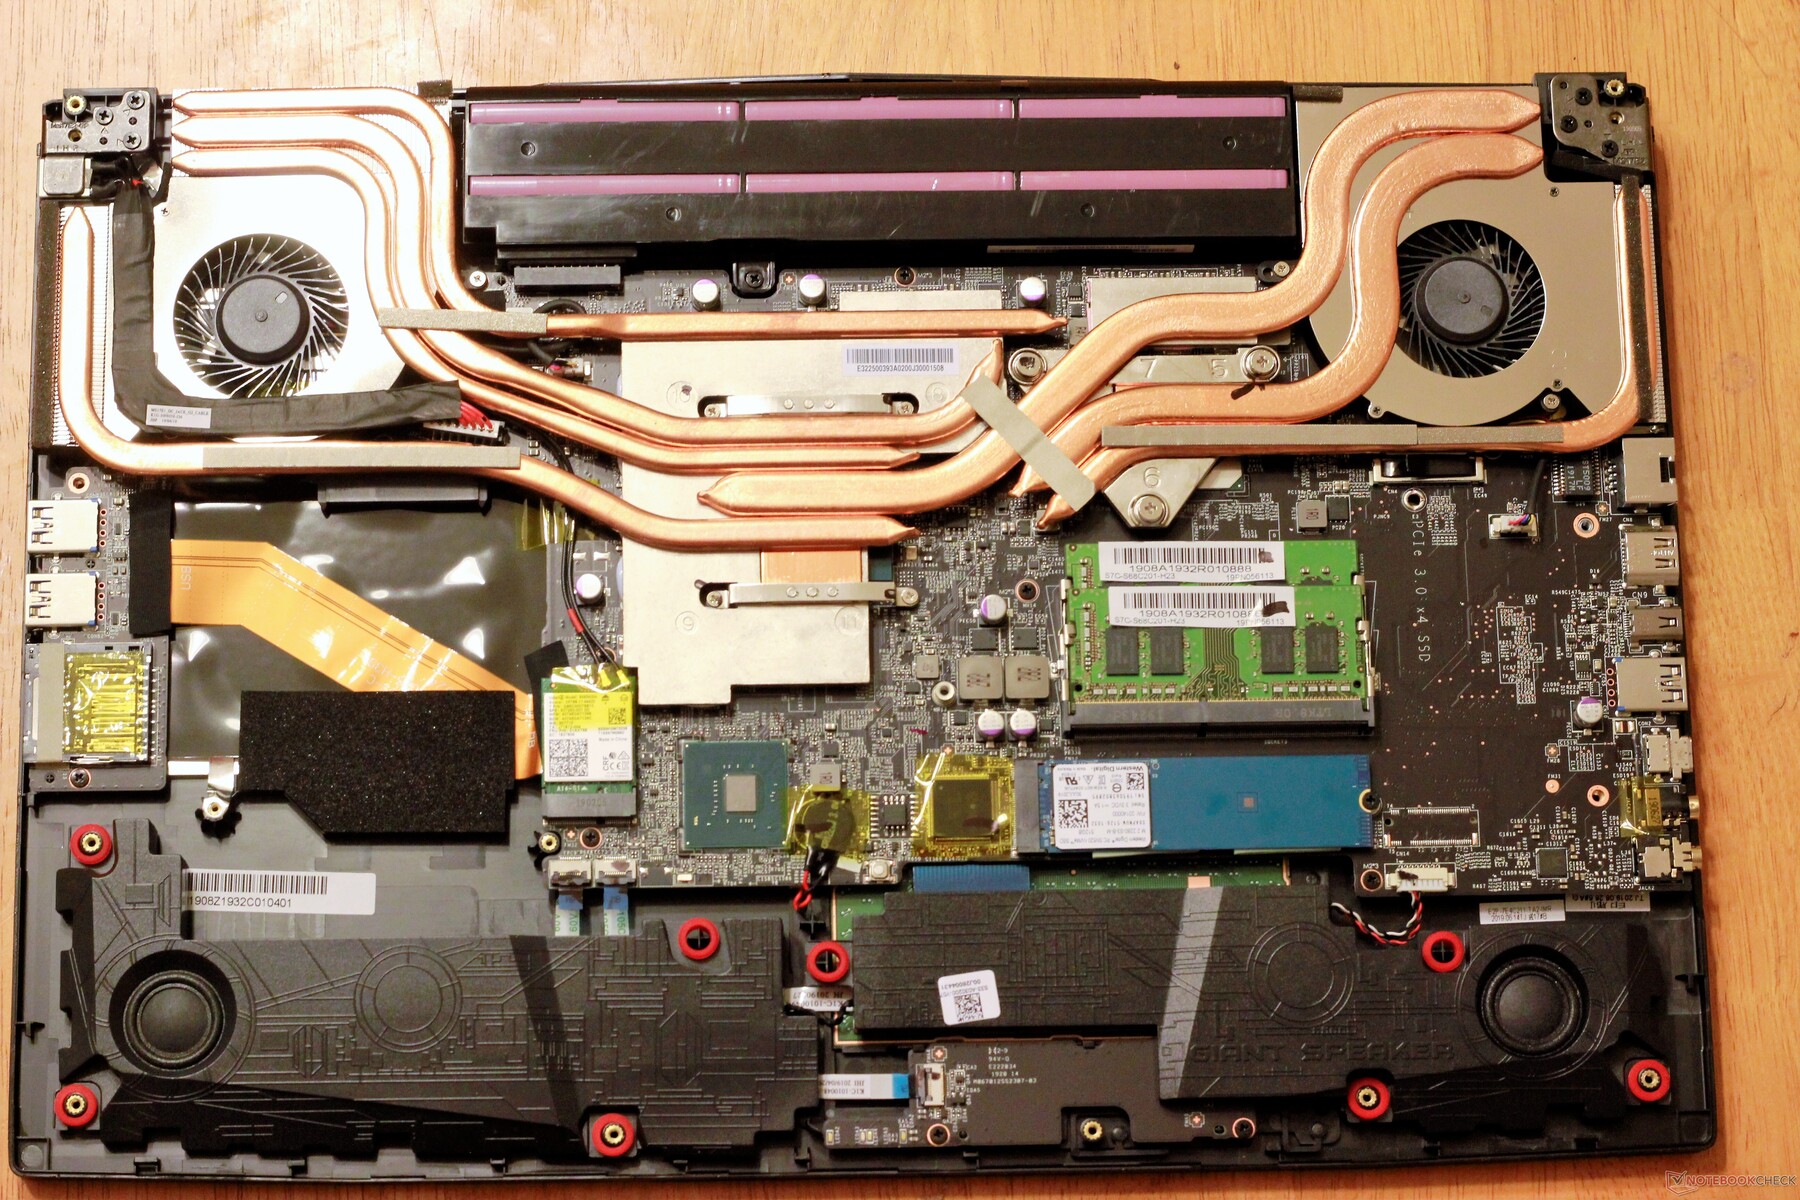
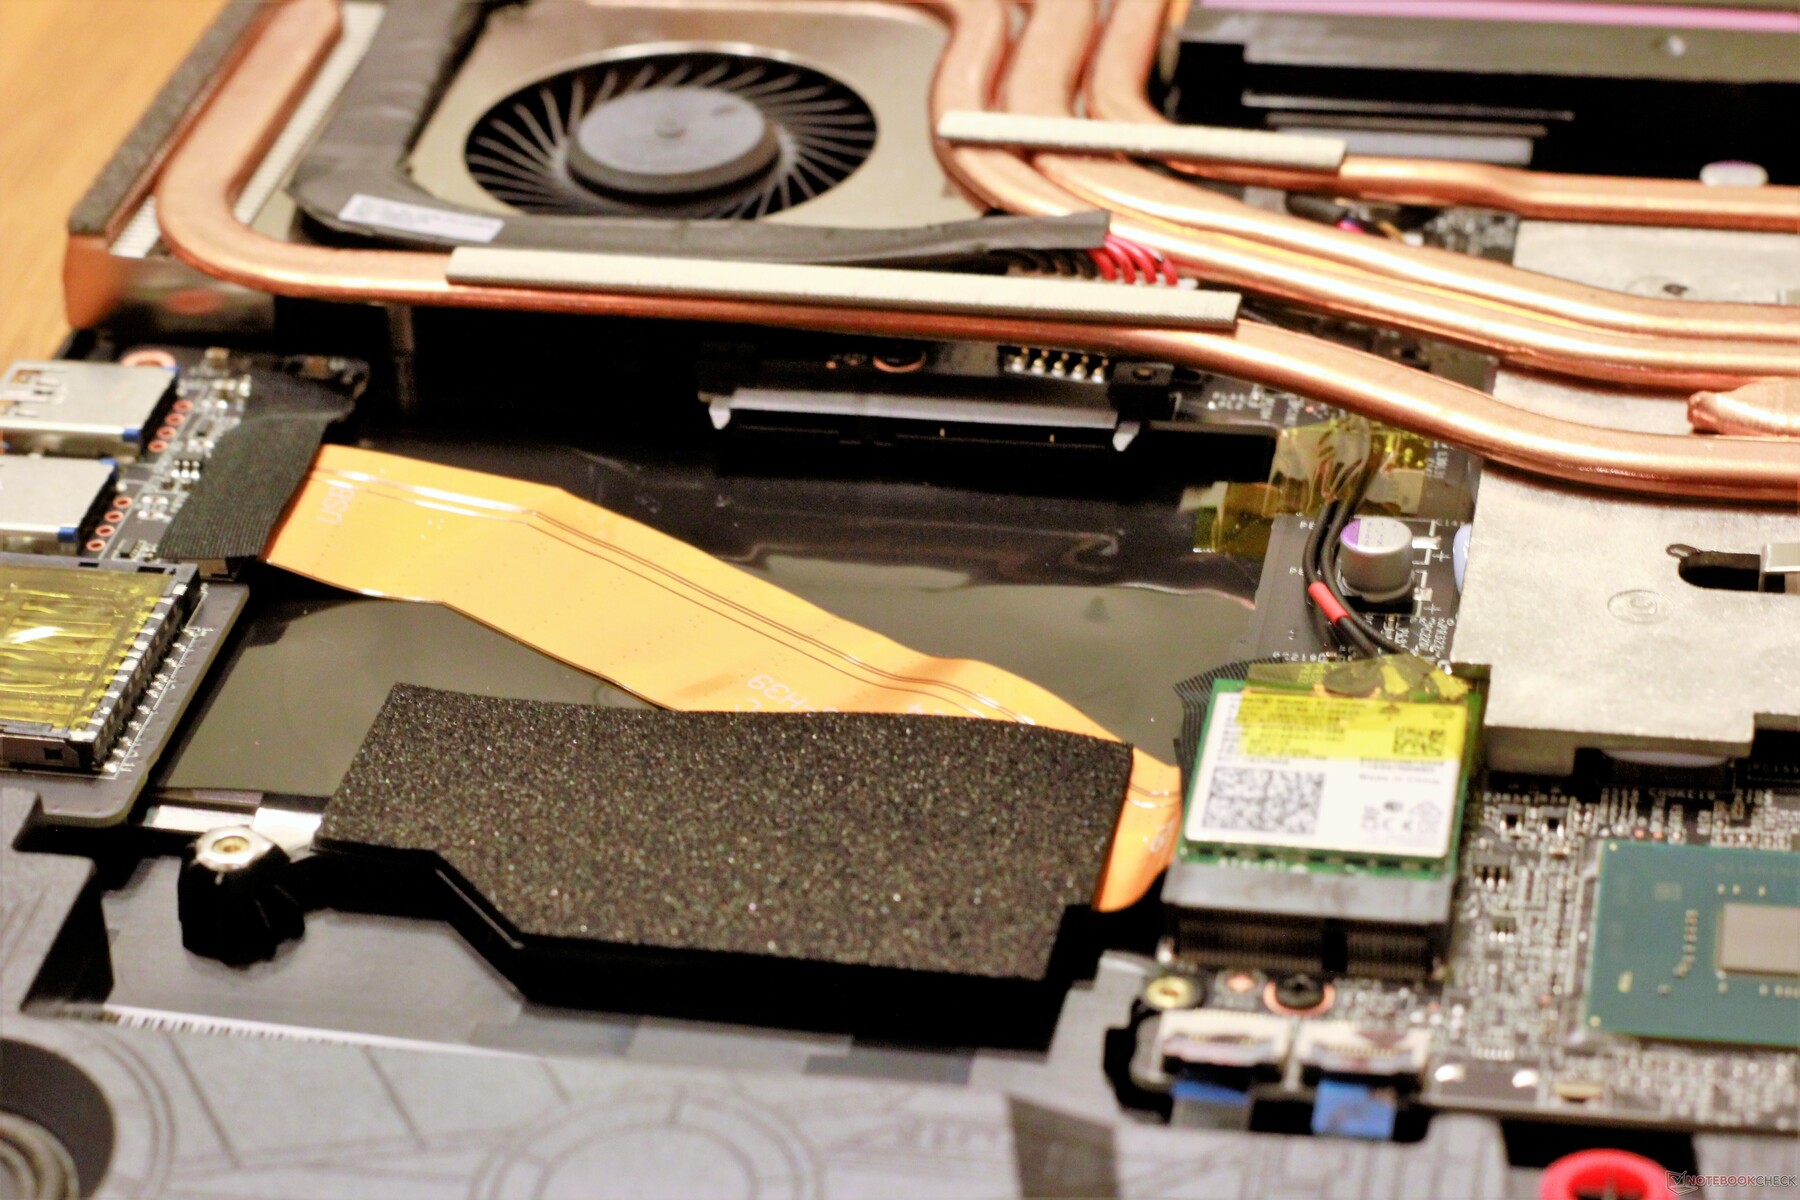
Maintenance and upgrade options are plentiful, but work is required to get inside the laptop. Thirteen #0 Phillips Head screws secure the bottom panel to the chassis. Once these are removed, several stubborn clips hold the panel in place. Care should be used when disengaging these, as they take time and effort to unclip. A plastic spudger should be used on the clips as the soft plastic of the bottom panel could be easily scratched.
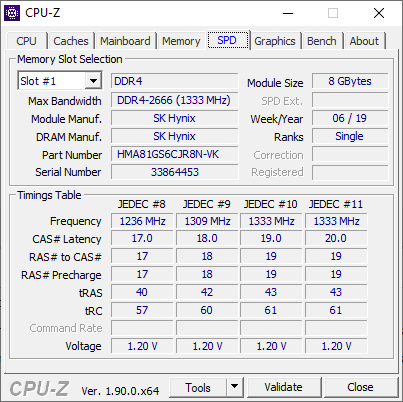
Once the bottom panel is removed, users will have access to both RAM DIMMs, the NVMe drive, the wireless card, and an empty 2.5-inch SATA drive bay. Users can also remove the heat pipe array from the CPU and GPU for repasting. We note the tri-point mount used for the CPU's heat sink, which may dissipate heat less evenly than a standard four-point mount due to uneven pressure.
MSI offers a standard 12-month warranty on the GL75.
Input Devices
Keyboard
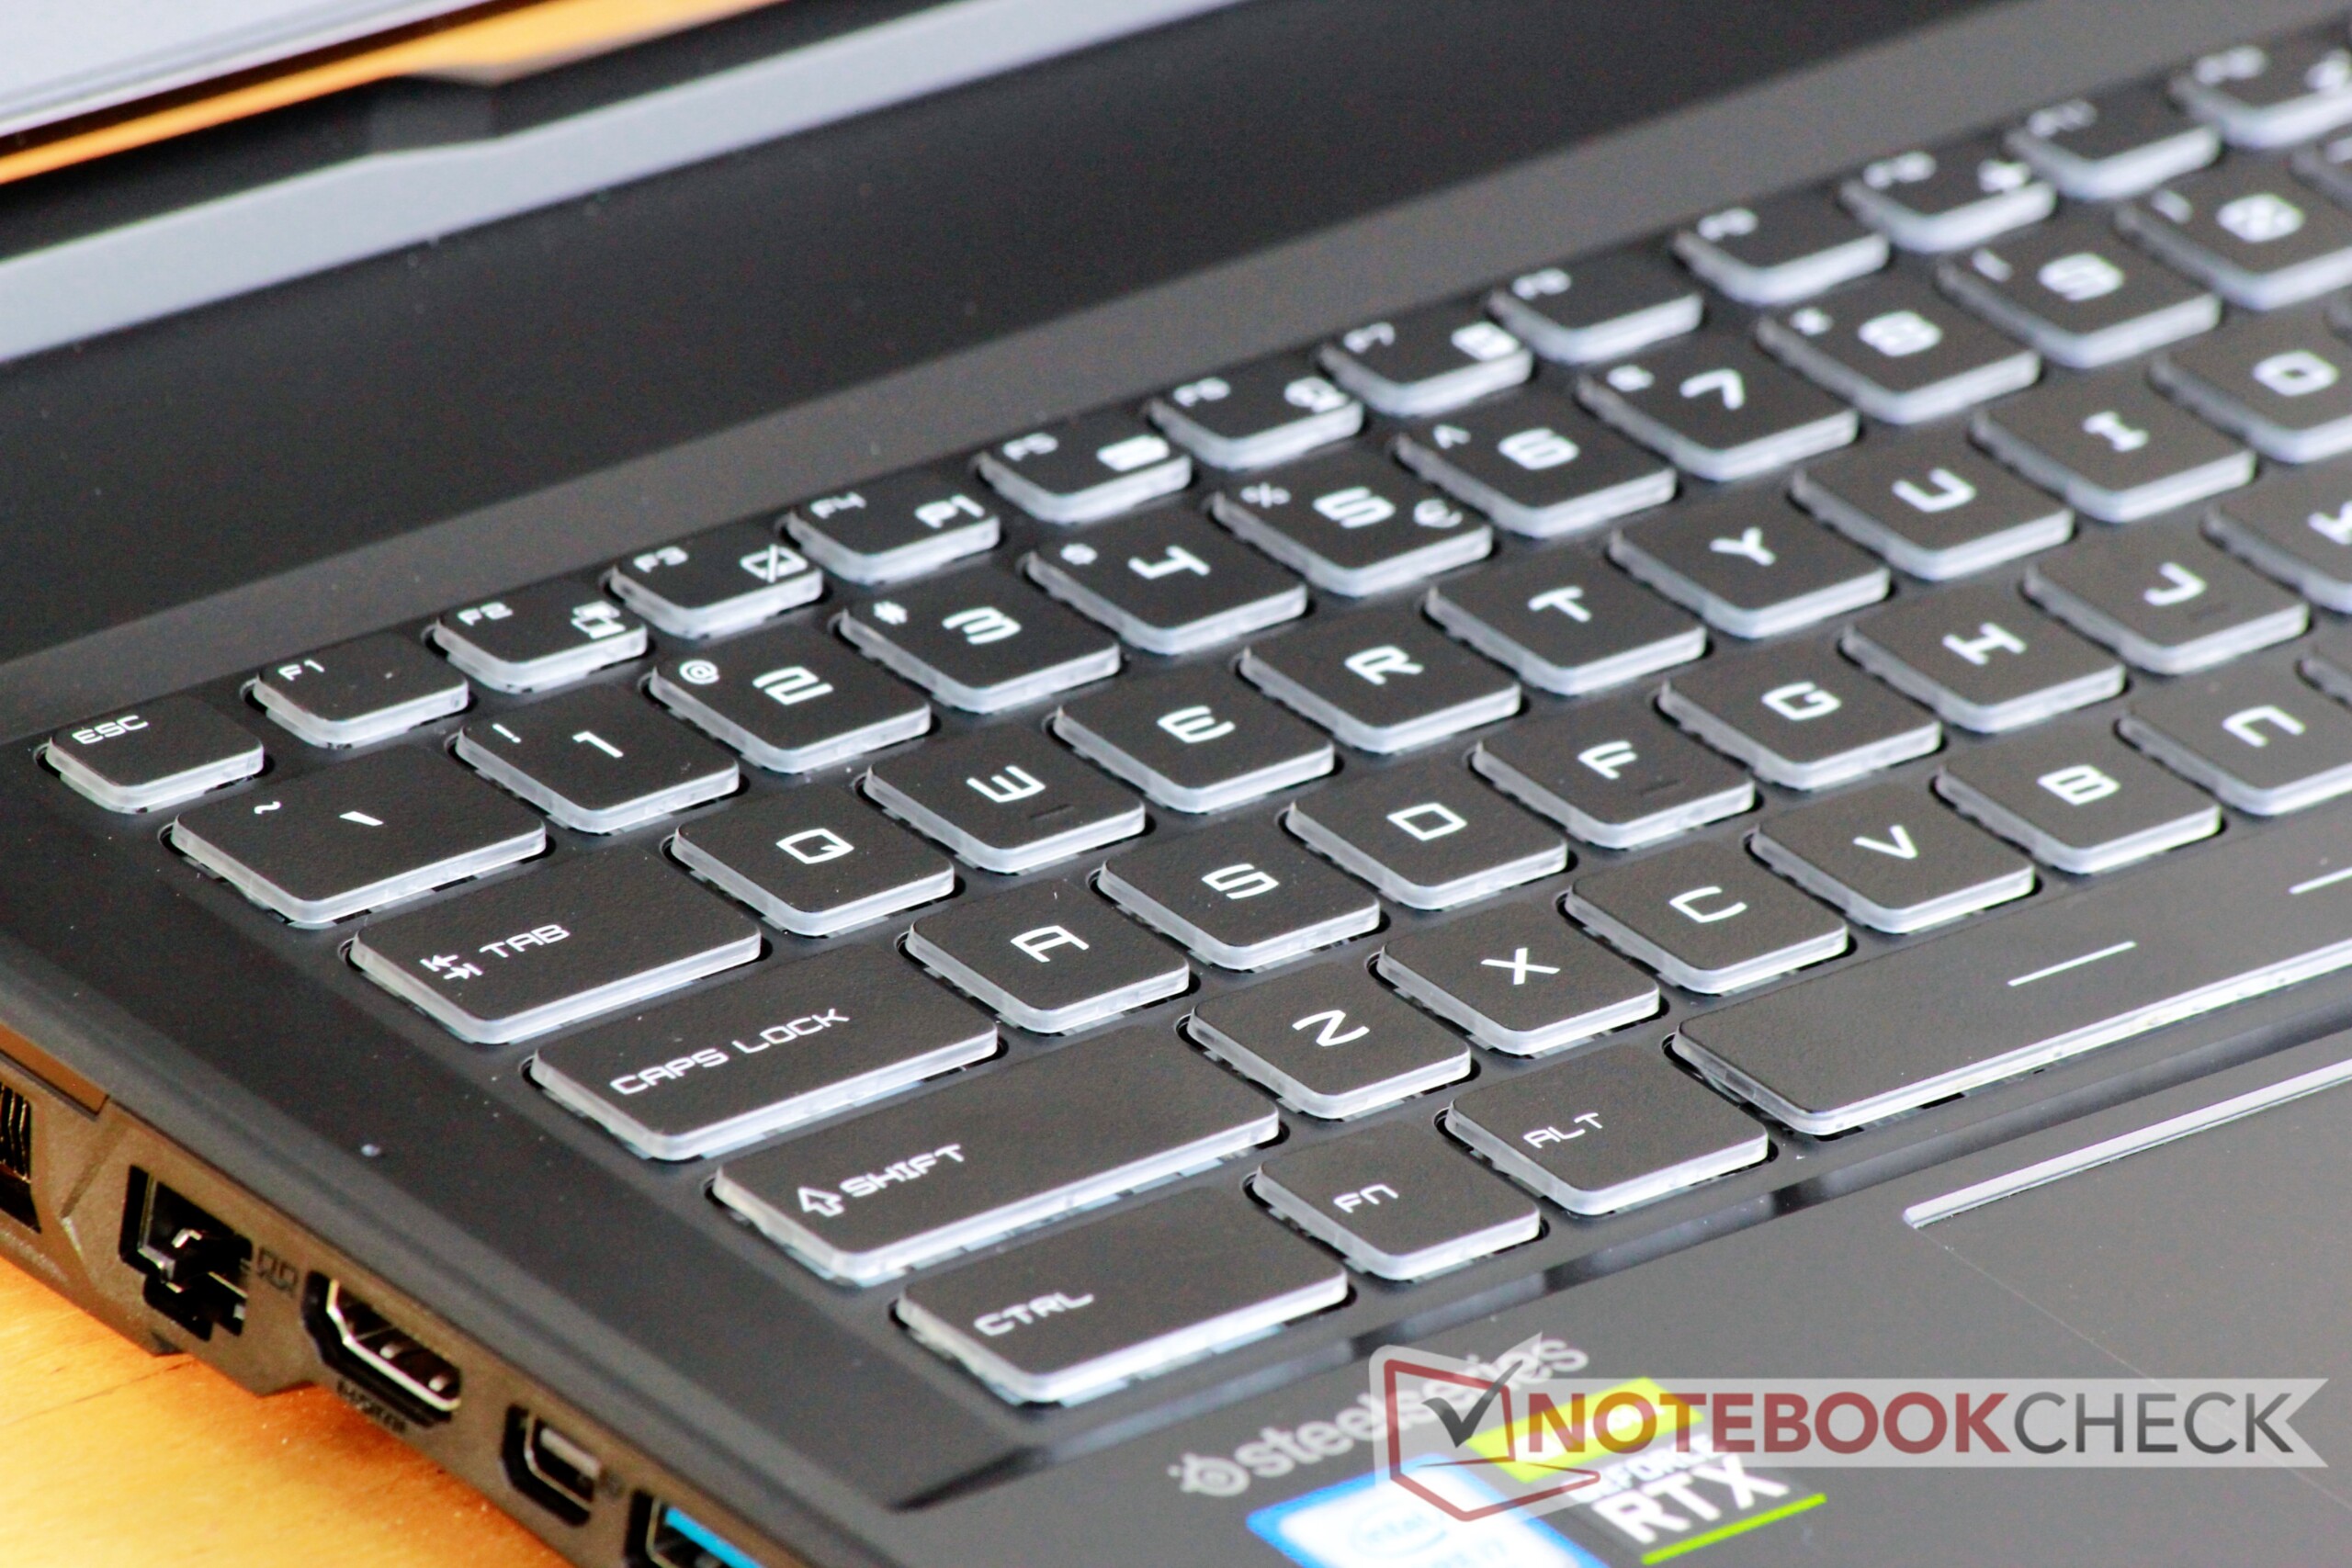
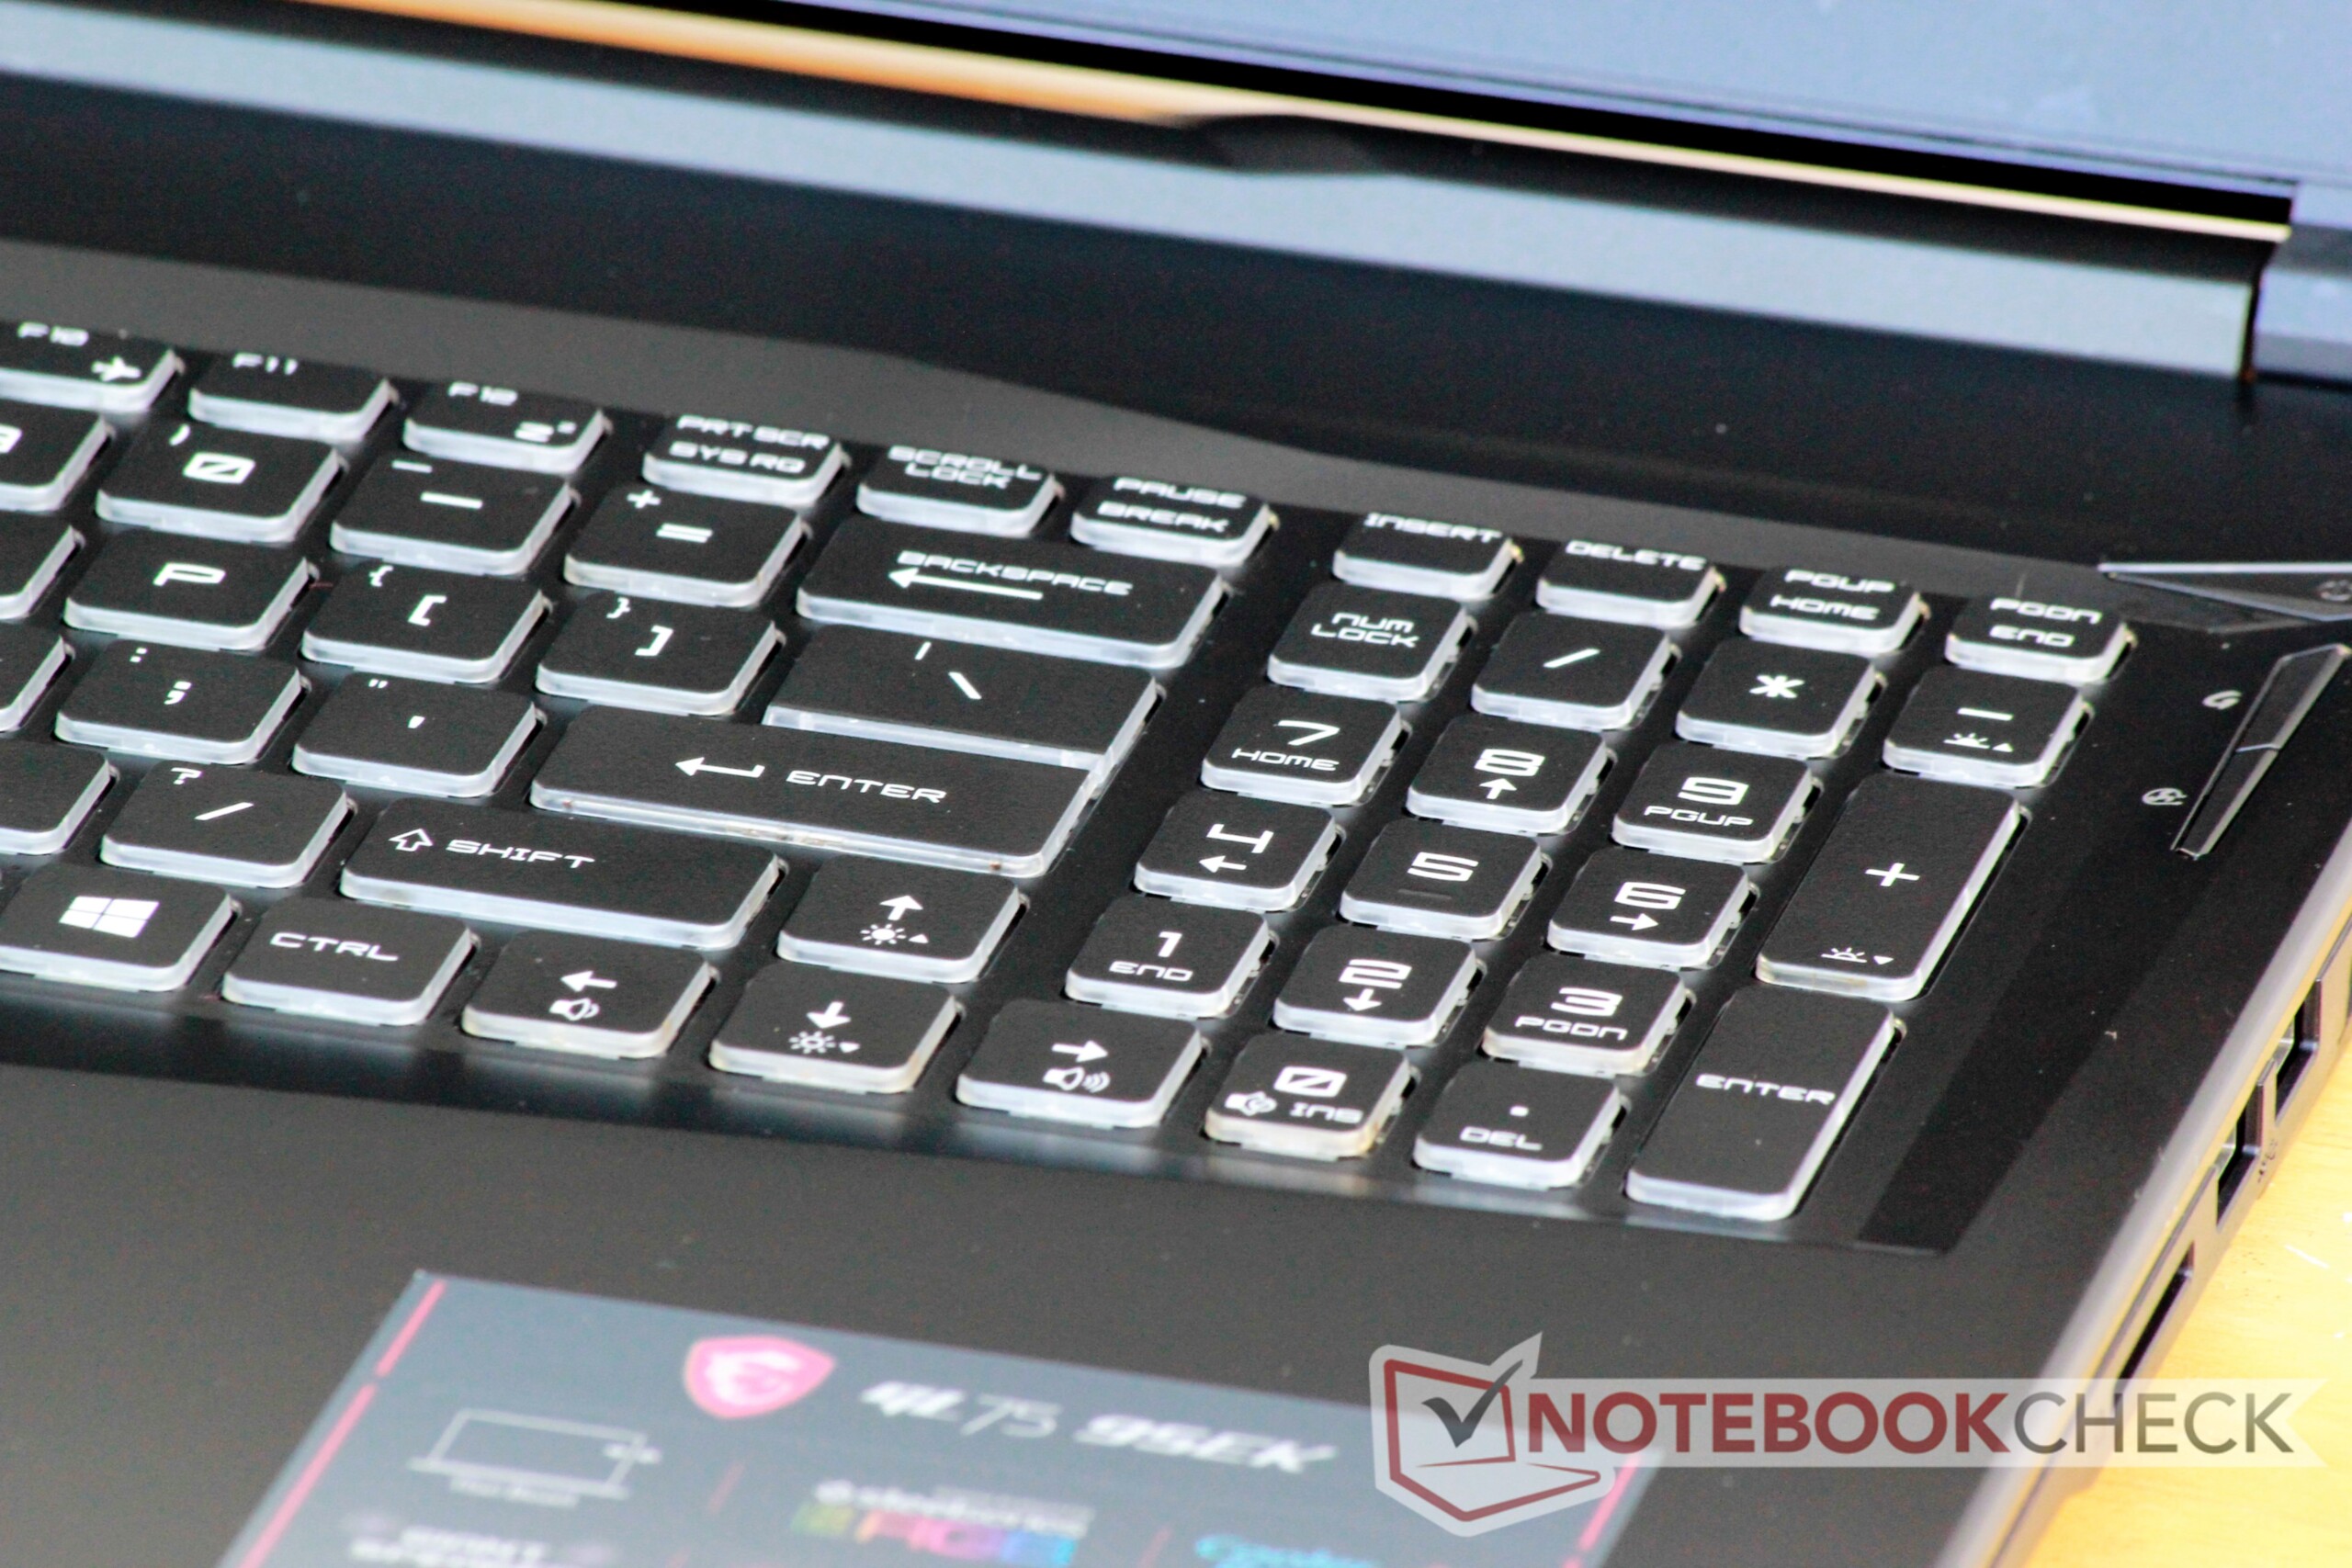
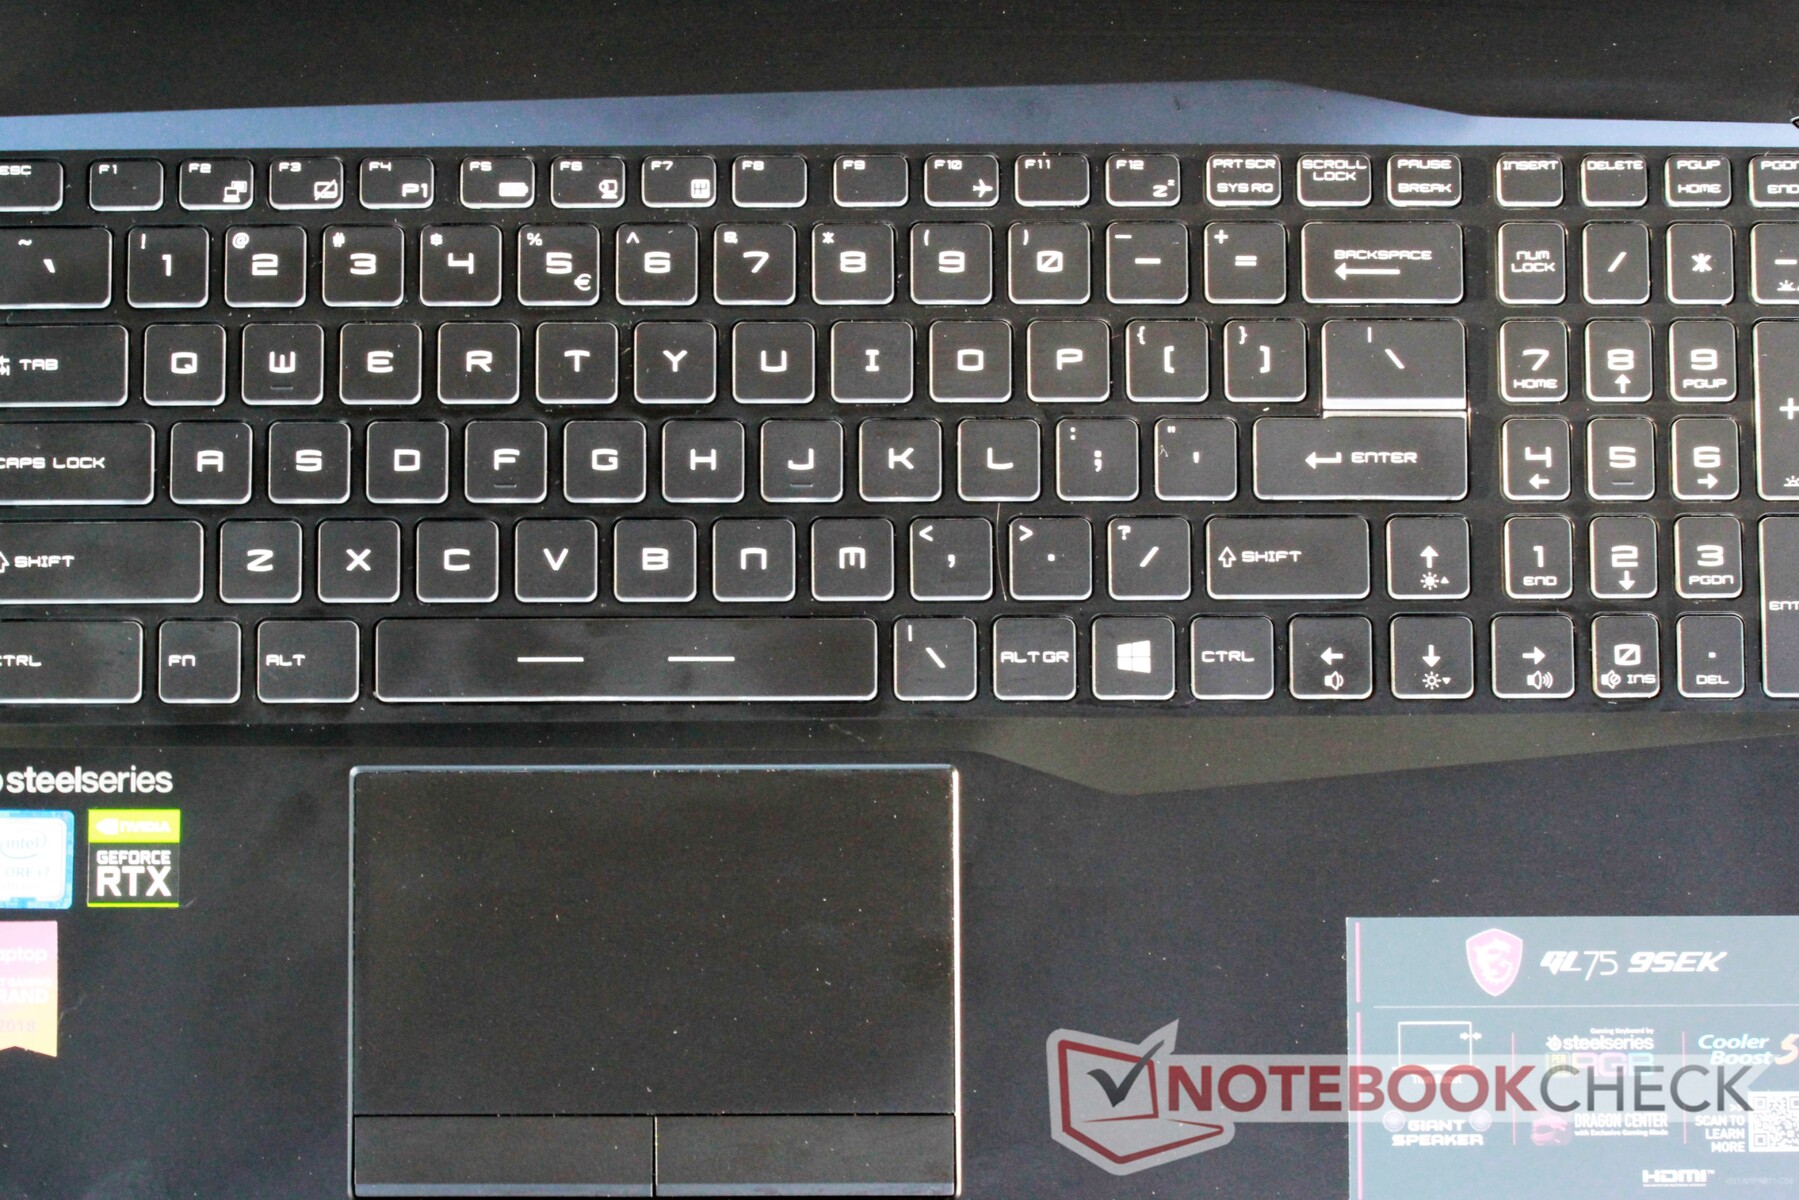
The GL75's keyboard offers the same firm, "pillowy" feedback that MSI laptops are known for. The typing experience is similar to other MSI machines like the GP65 Leopard. In fact, the GL75's keyboard is a near-carbon copy of GP65's. As such, we have similar quibbles here that we did there. The overall layout is good, although some users may find the righthand placement of the Windows key annoying. The QWERTY keys are a bit small for our tastest (19 mm2), and the number pad keys are smaller still. With the minor exceptions, the keyboard is excellent and typists' fingers should be happy.
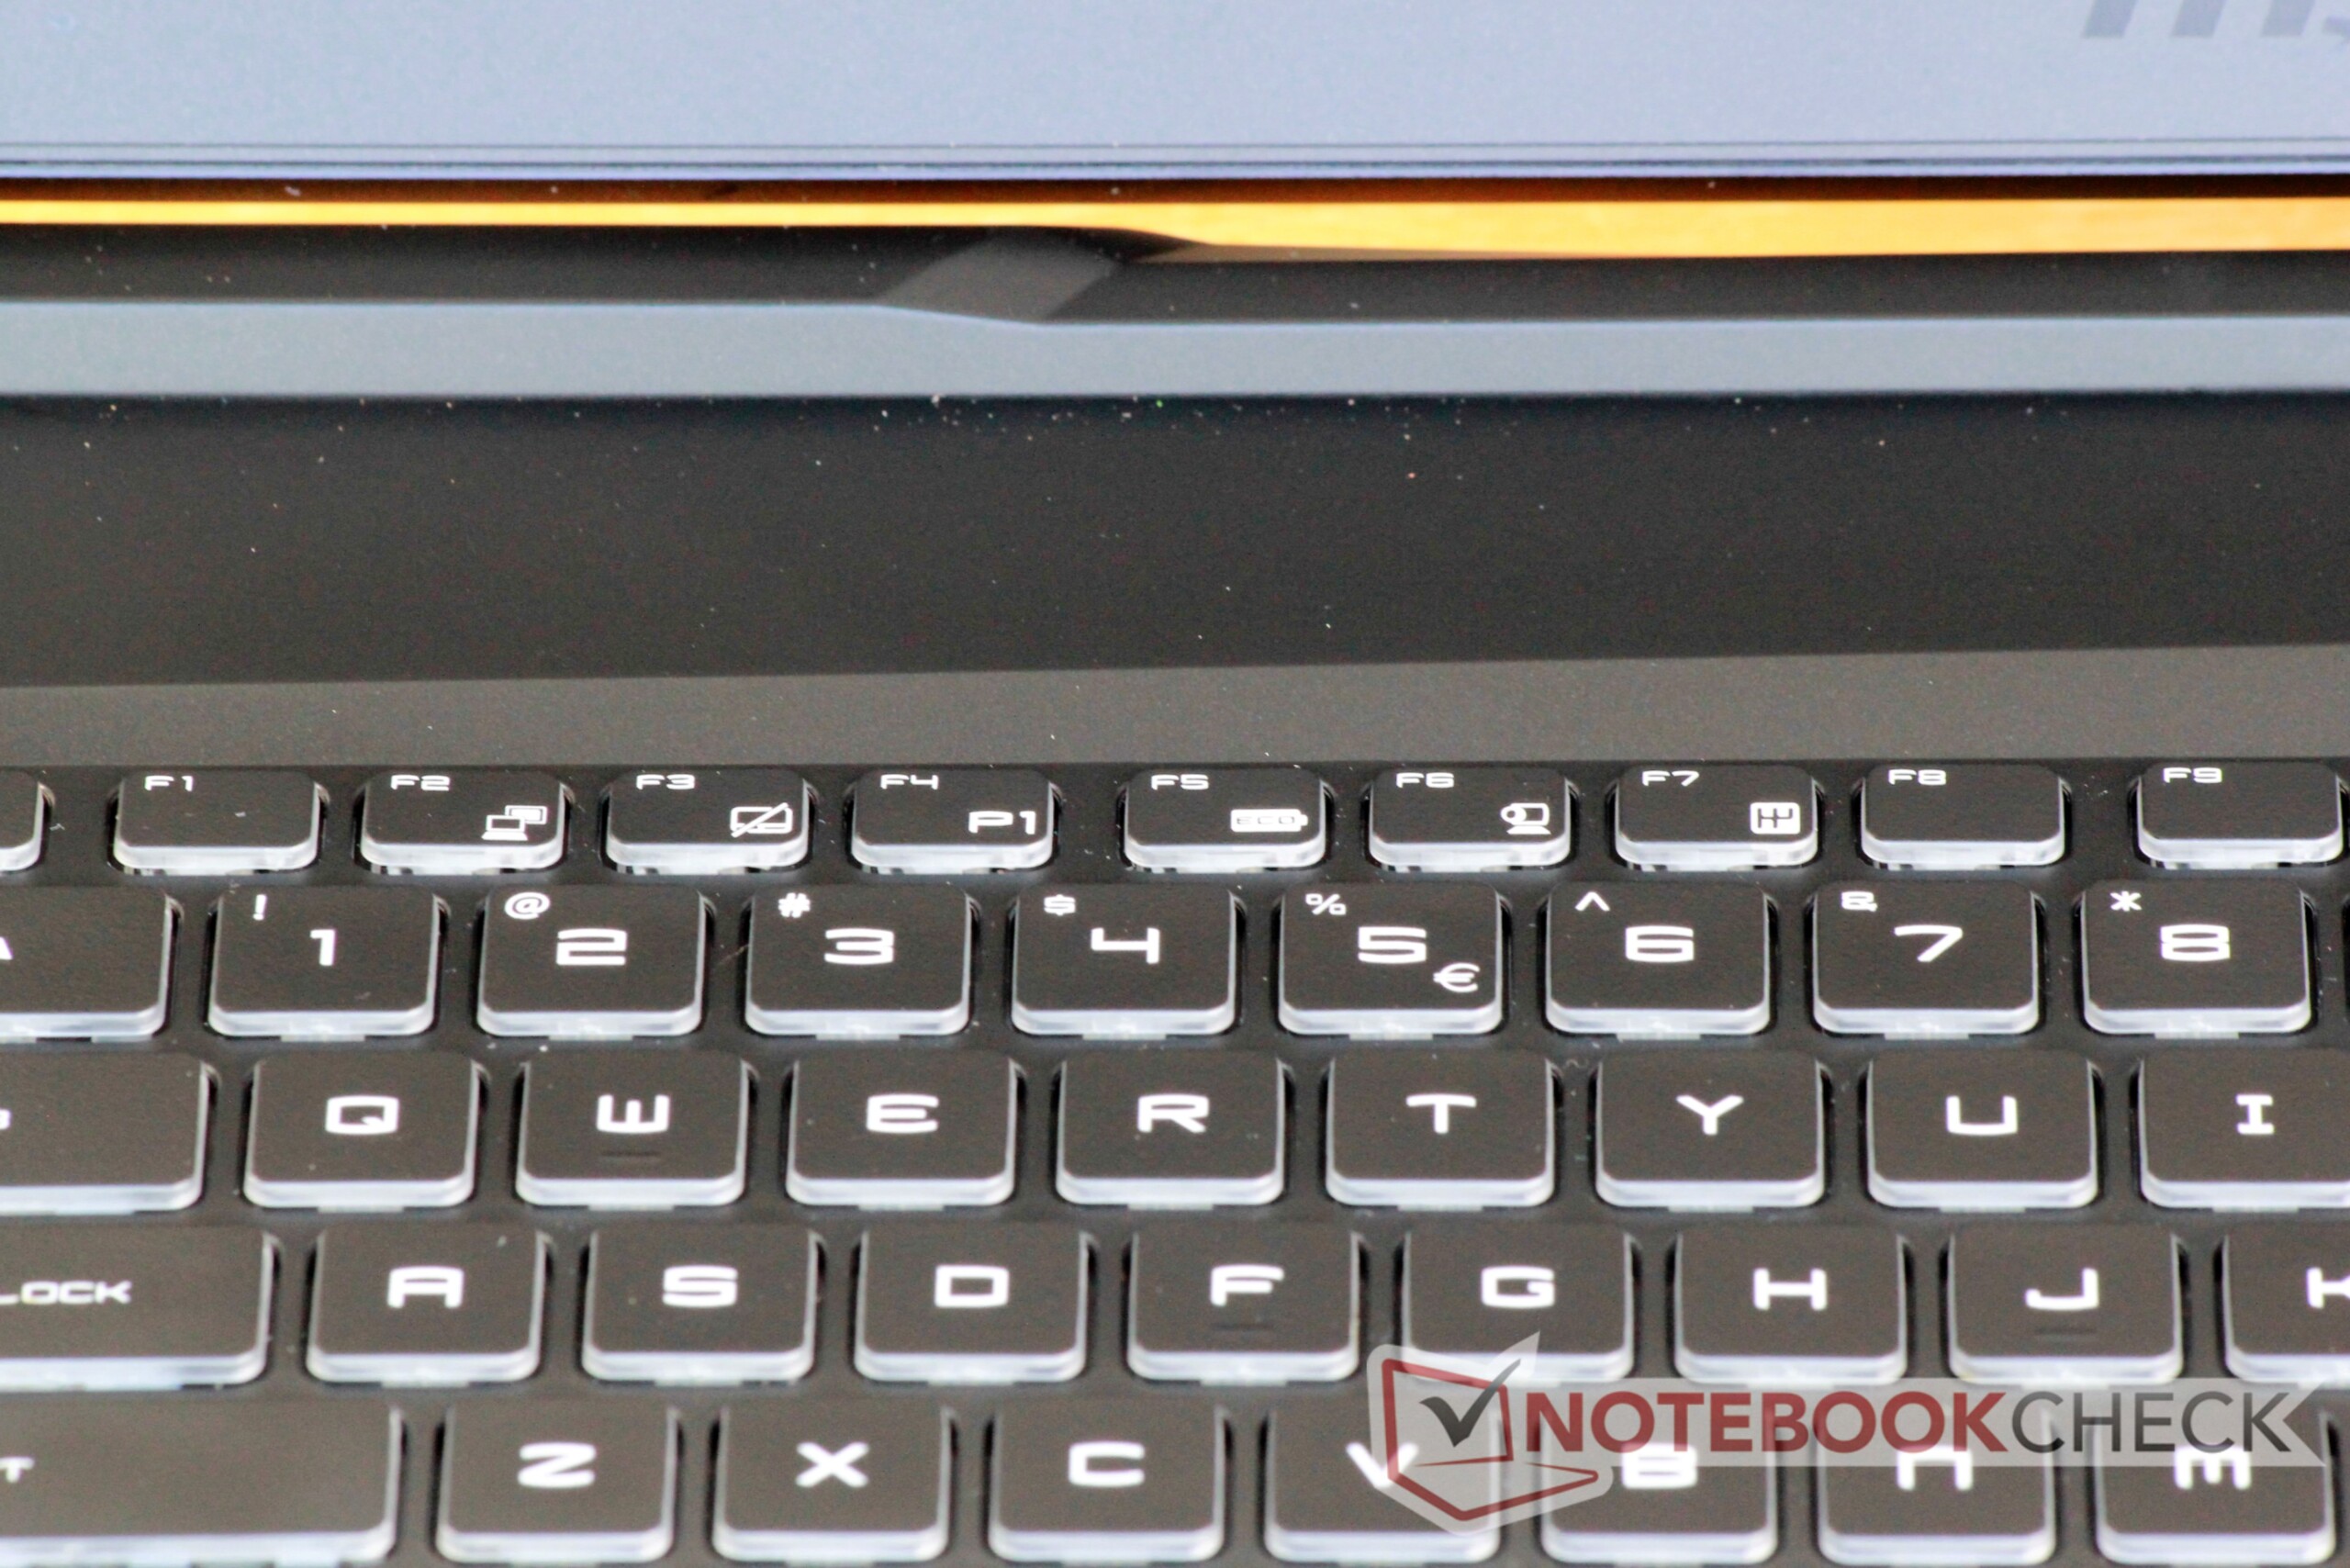
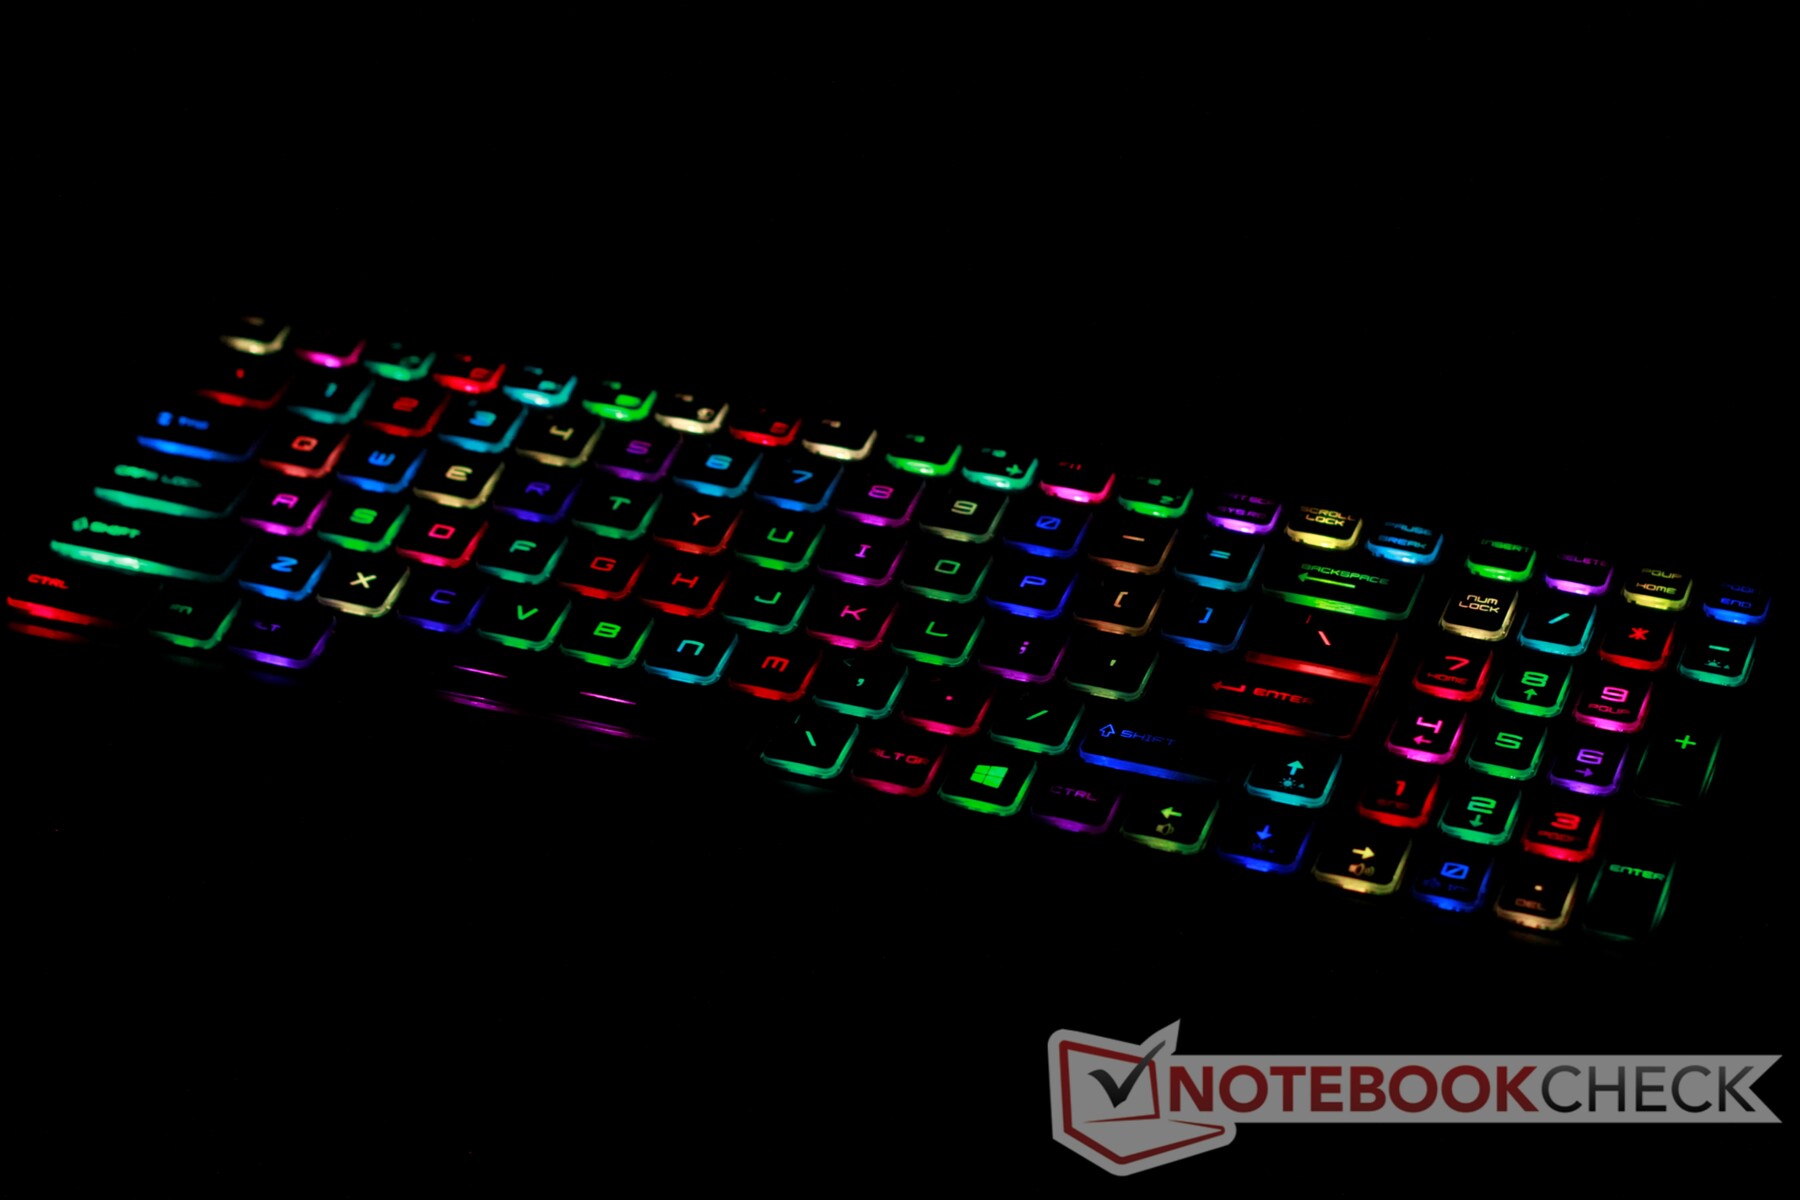
The GL75, like the GP65 Leopard, has a per-key RGB backlight under the keyboard. Colors shine through the translucent sides of the keys, and there are several fun pre-programmed effects. Users can pick these or create their own backlight setup through the SteelSeries Engine 3 tool included with the laptop. One of our favorite features from the GP65 is also here; holding the Fn key kills the backlight and highlights the functions keys on the laptop in red. We hope this feature is picked up by other manufacturers.
Touchpad
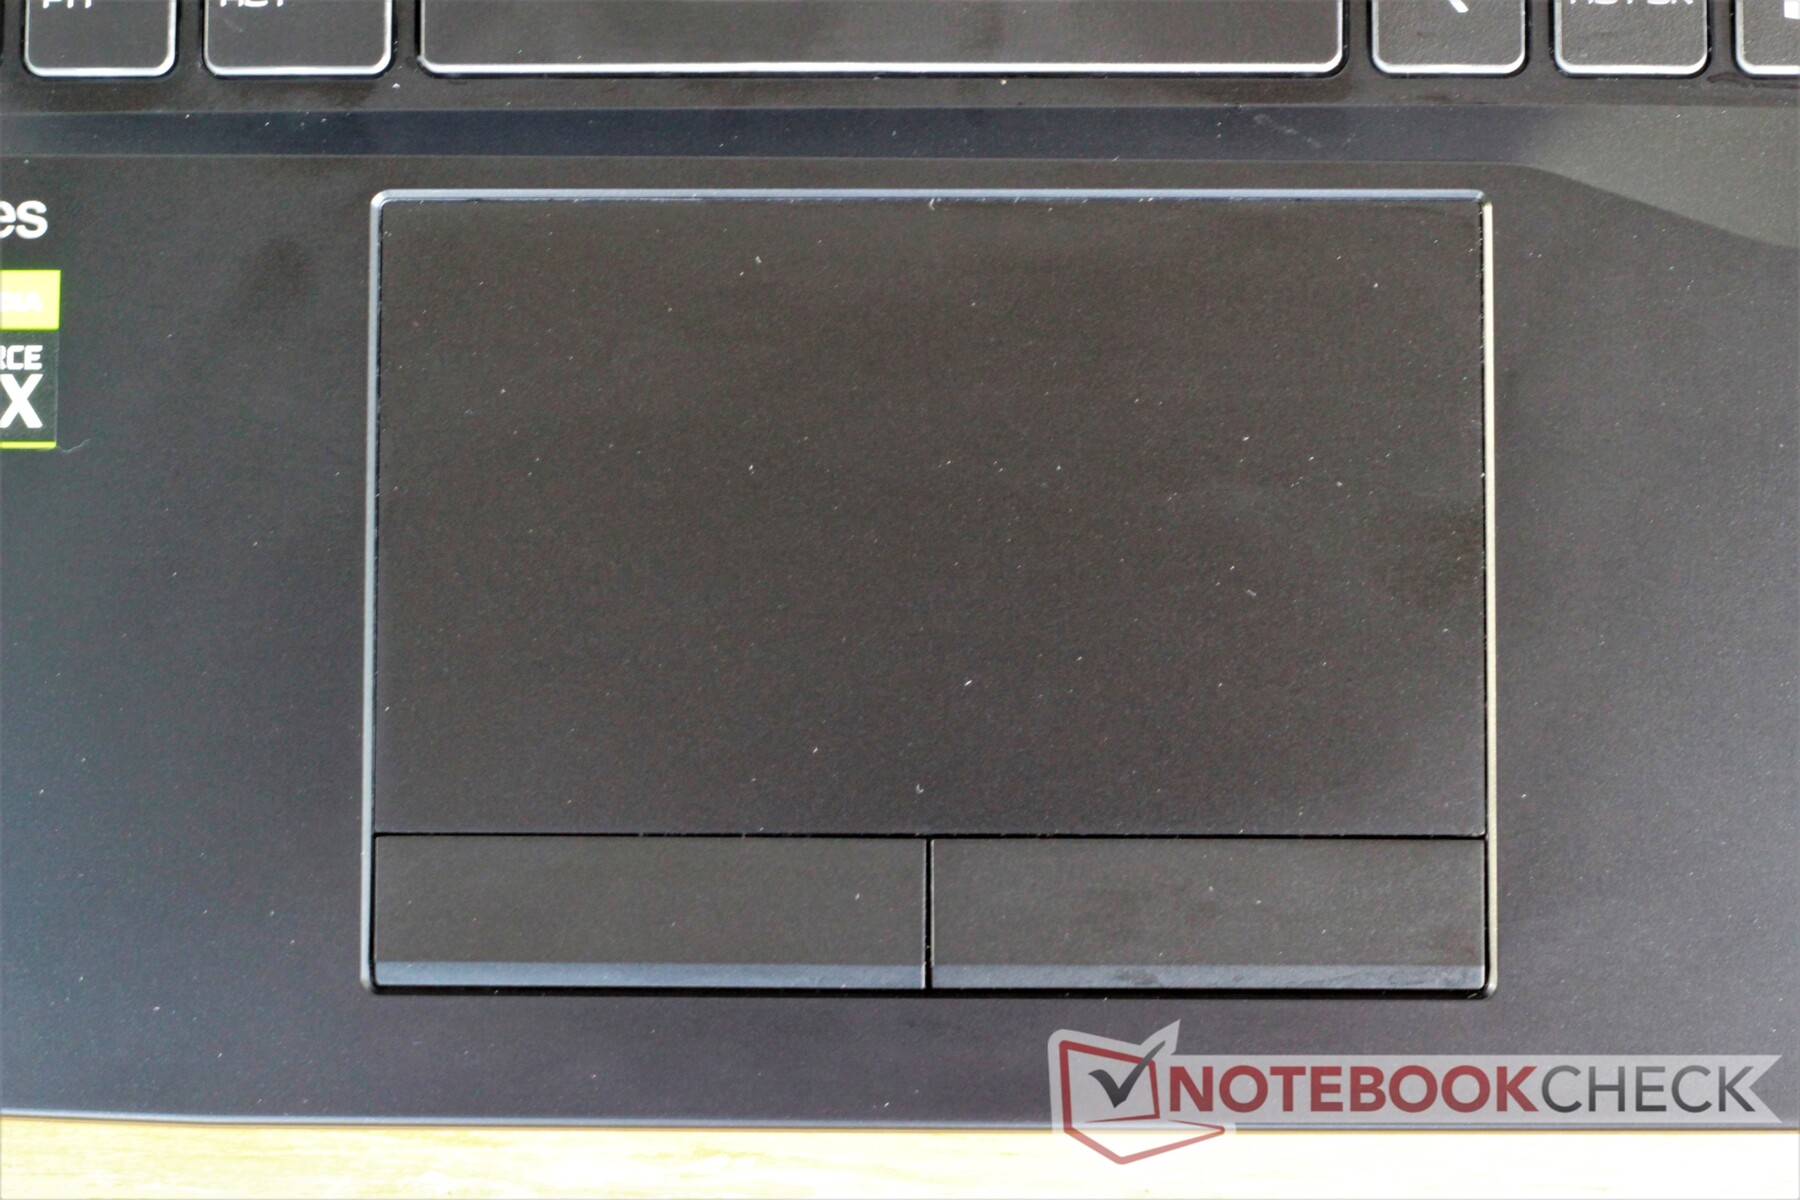
The touchpad is adequate. Glide is smooth across the plastic surface, and tracking is accurate. We appreciate the dedicated buttons below the tracking surface. Clicks are a mixed bag; while feedback is firm, travel is short and the overall feel is hollow. While the touchpad overall isn't suitable for gaming, it's perfectly fine for general navigation.
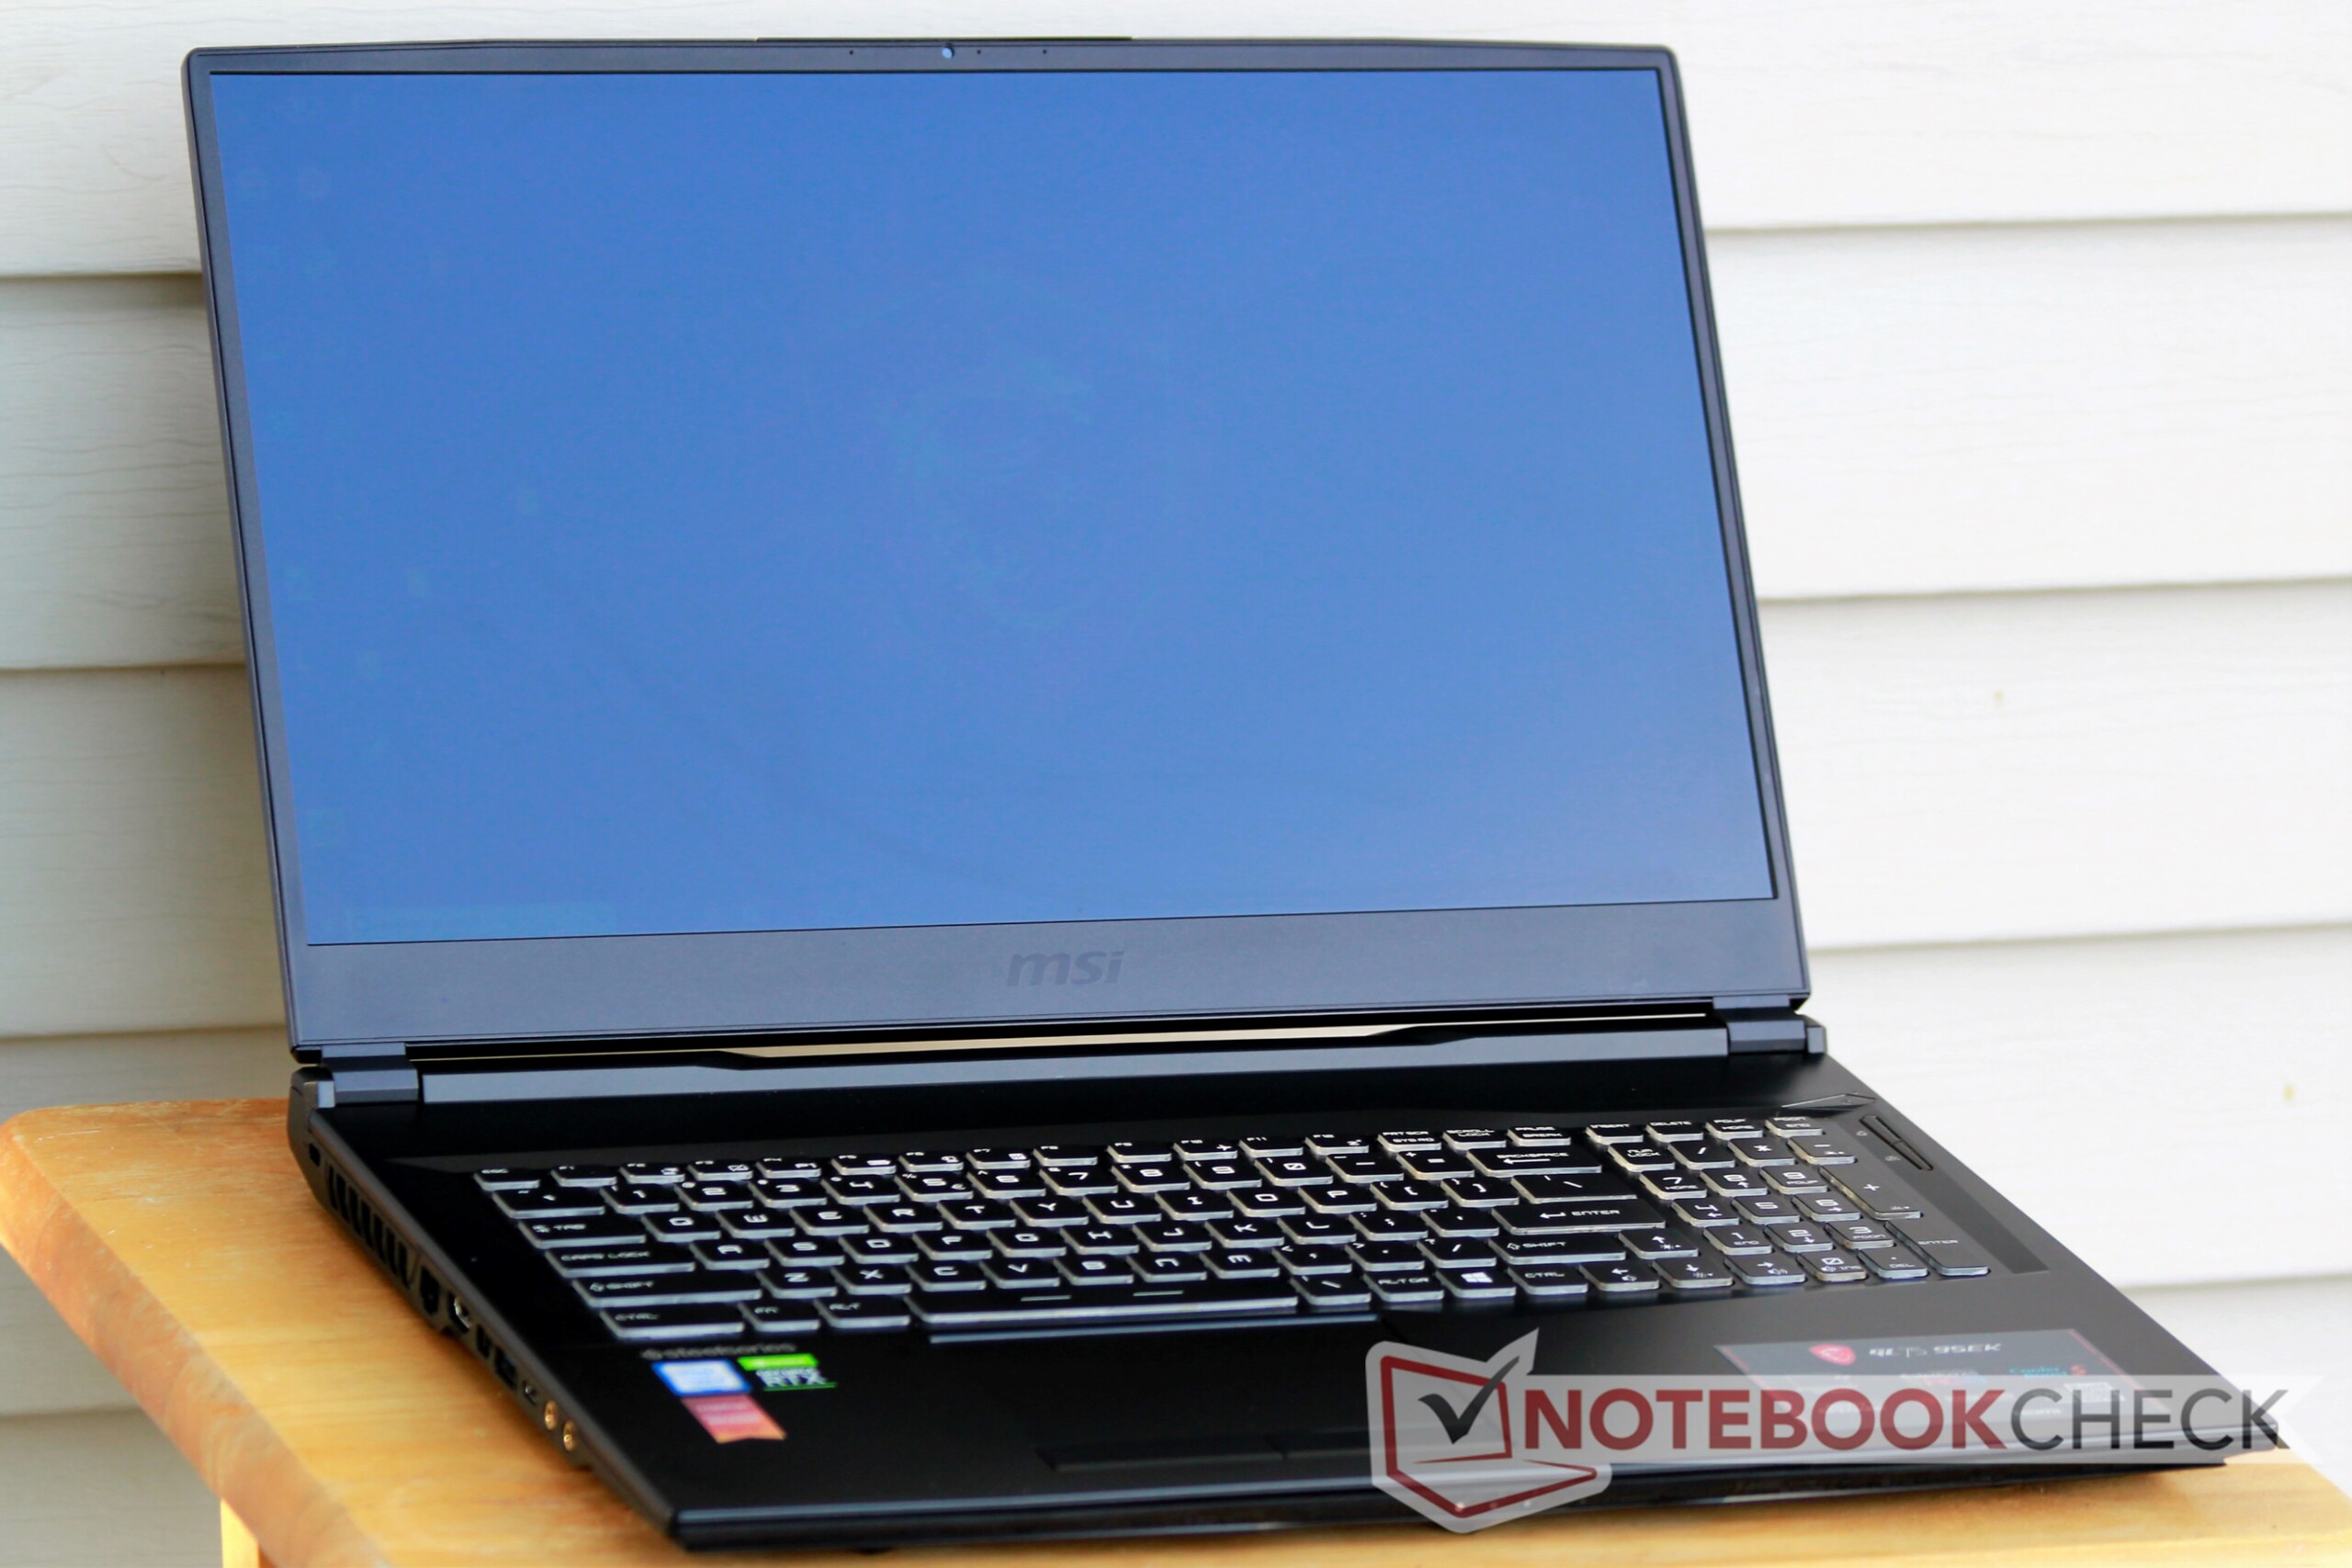
Display

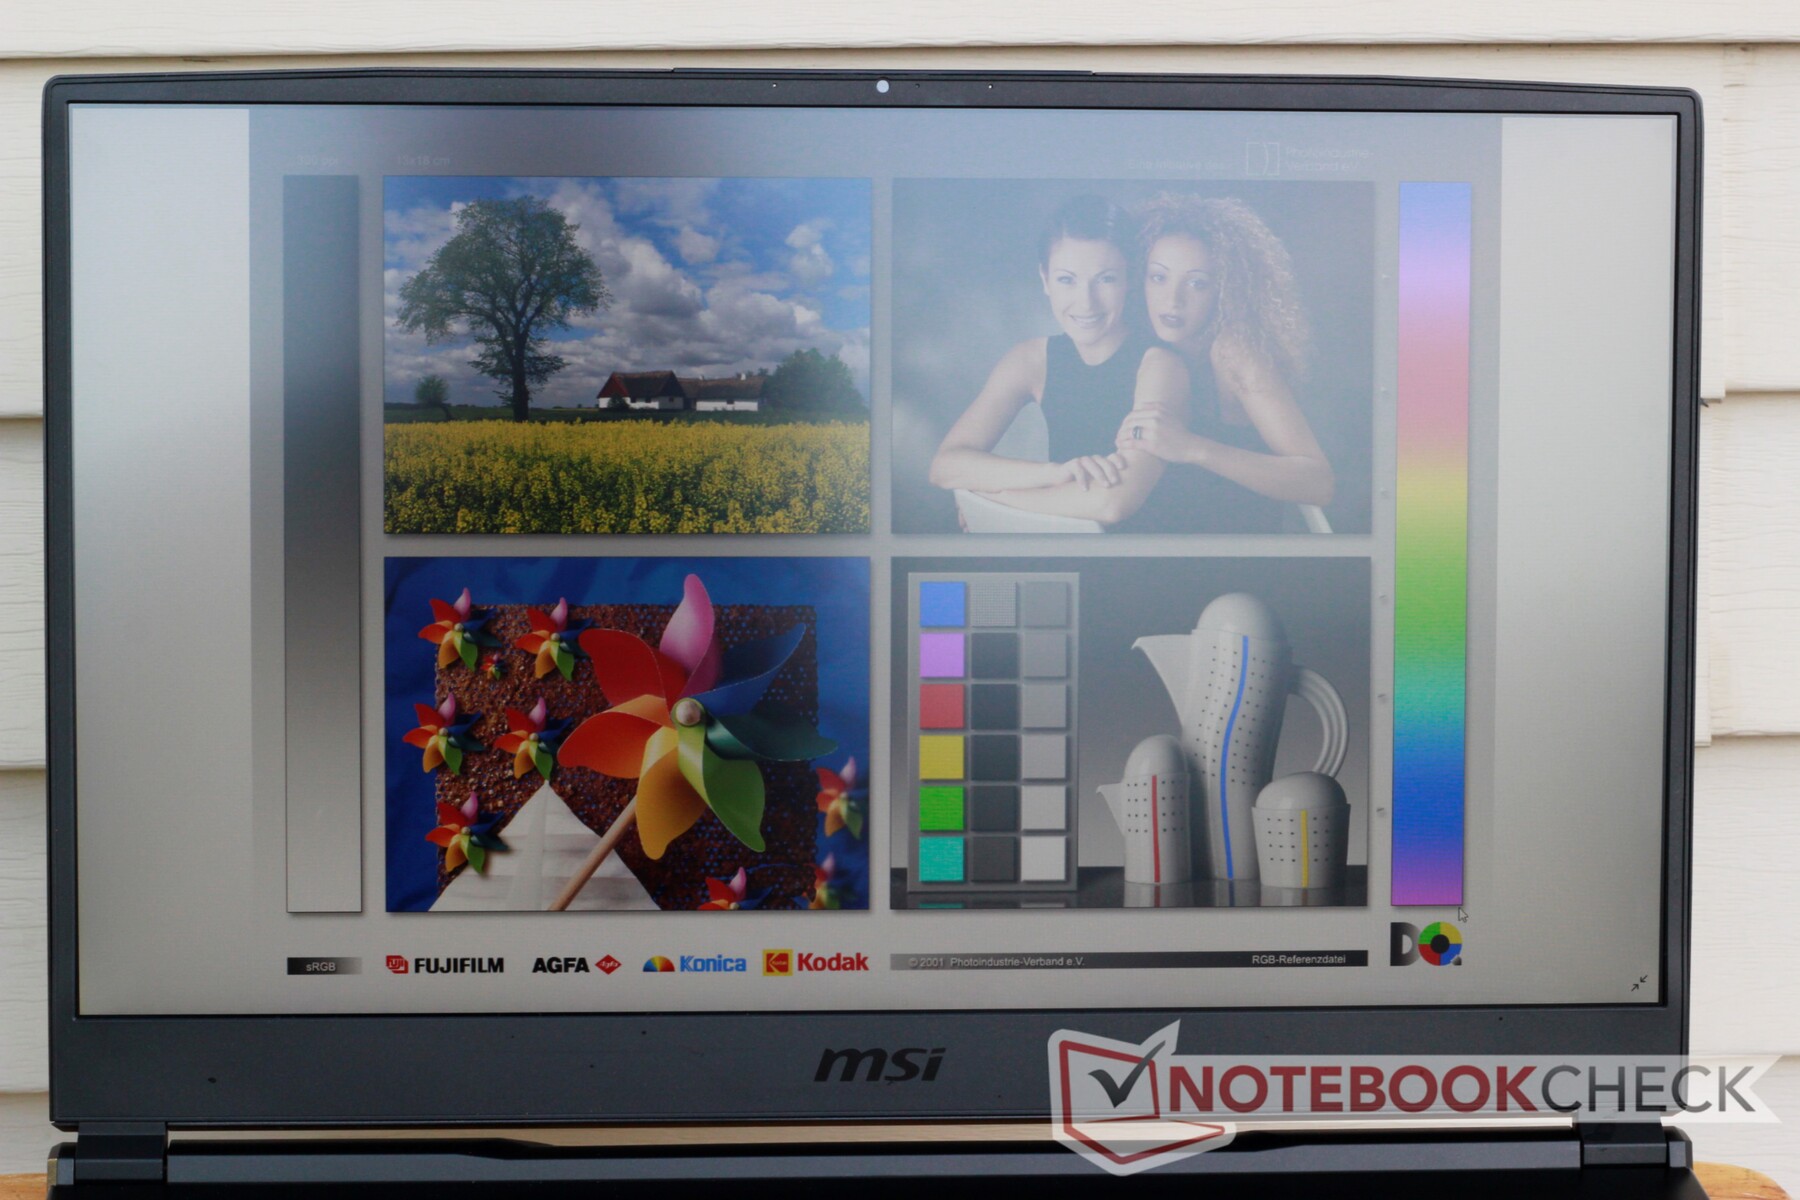
The GL75's screen is decent but falls short in a few regards. The FHD panel offers good contrast (~1050:1) and is fairly sharp, but the backlight is dim at about 260 nits. (The average brightness for most laptops is 300 nits.) The screen is perfectly readable in most indoor environments but suffers under bright lights and outdoors. On the plus side, the 120 Hz refresh rate is a nice feature at this price point, and gameplay glides across the screen when it hits higher framerates. While the IPS panel is an upgrade from the GL73's TN display, the weaker backlight hurts the overall package.
| |||||||||||||||||||||||||
Brightness Distribution: 93 %
Center on Battery: 259.1 cd/m²
Contrast: 1036:1 (Black: 0.25 cd/m²)
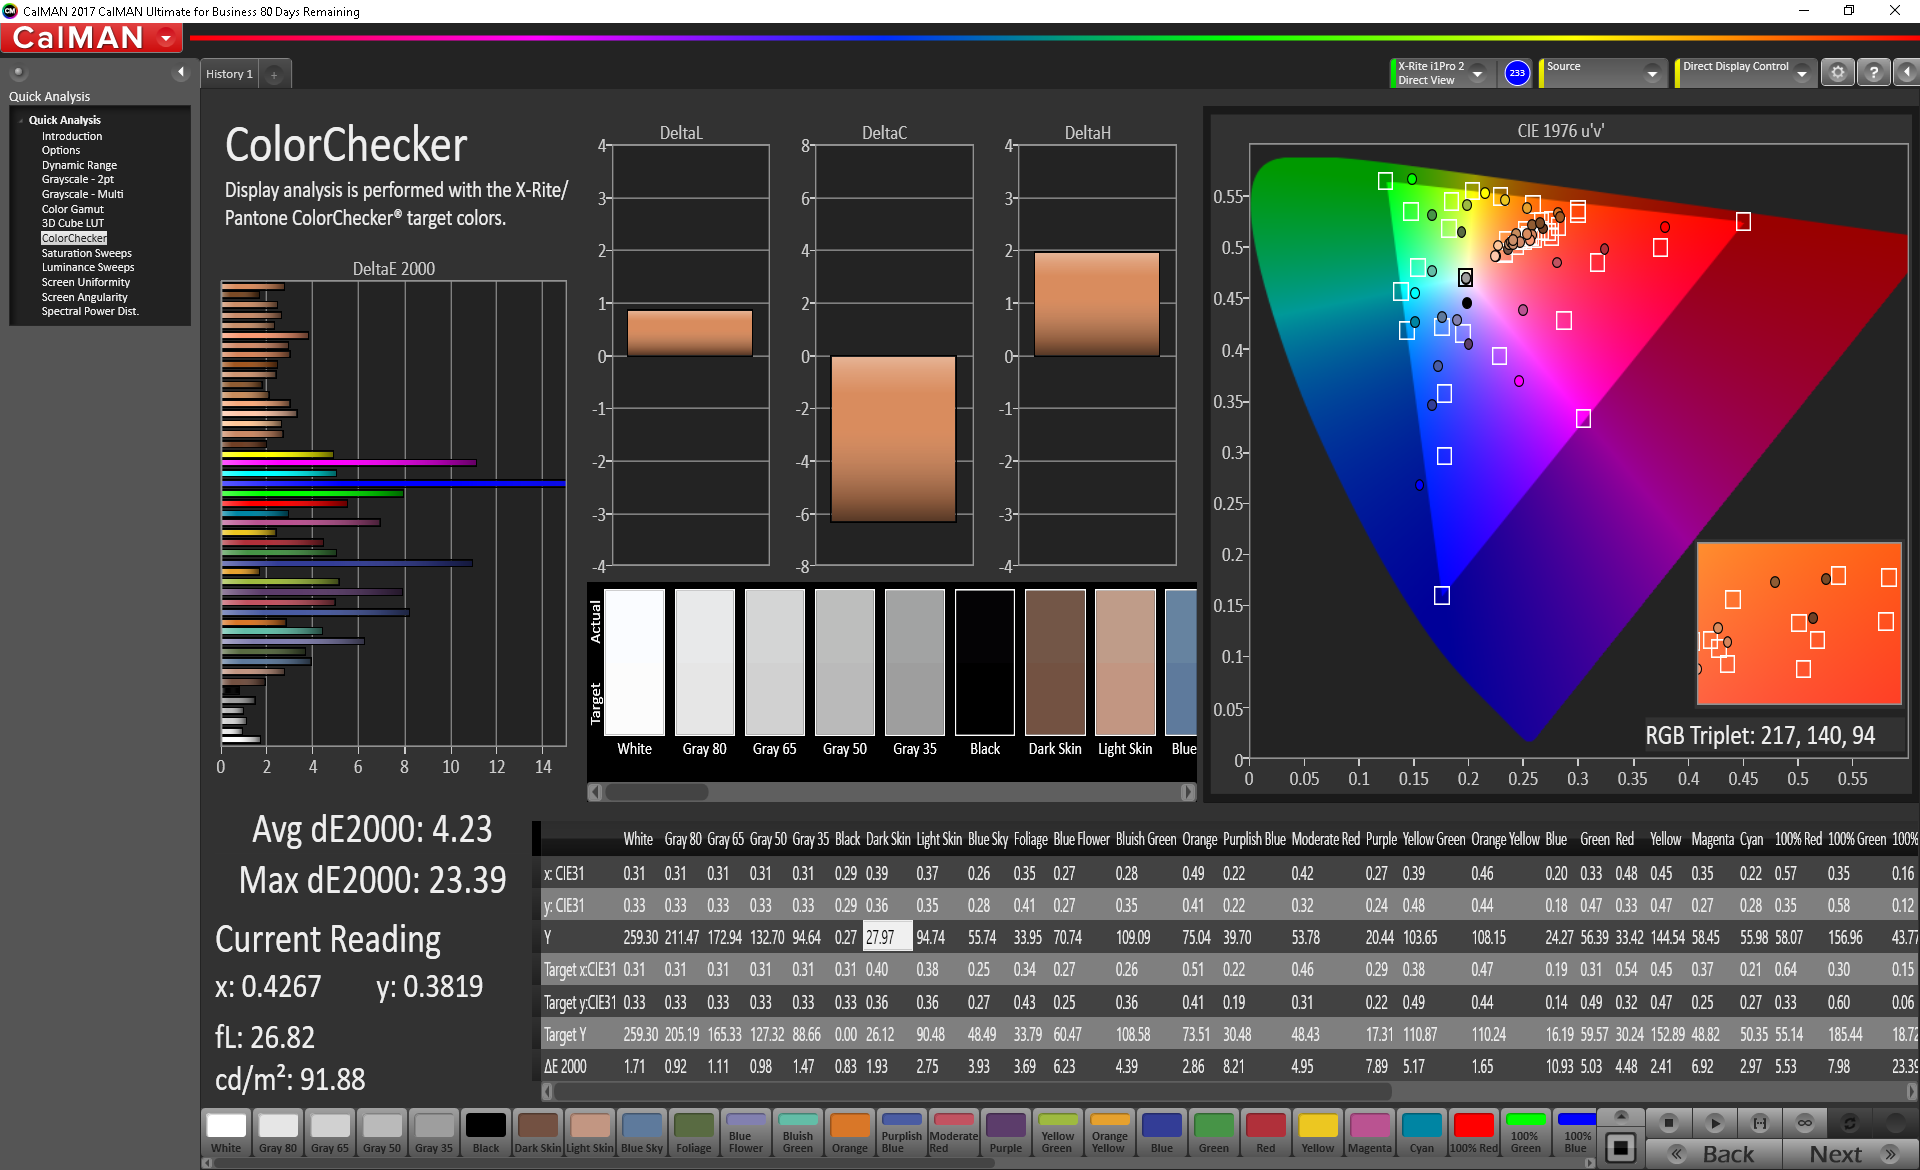
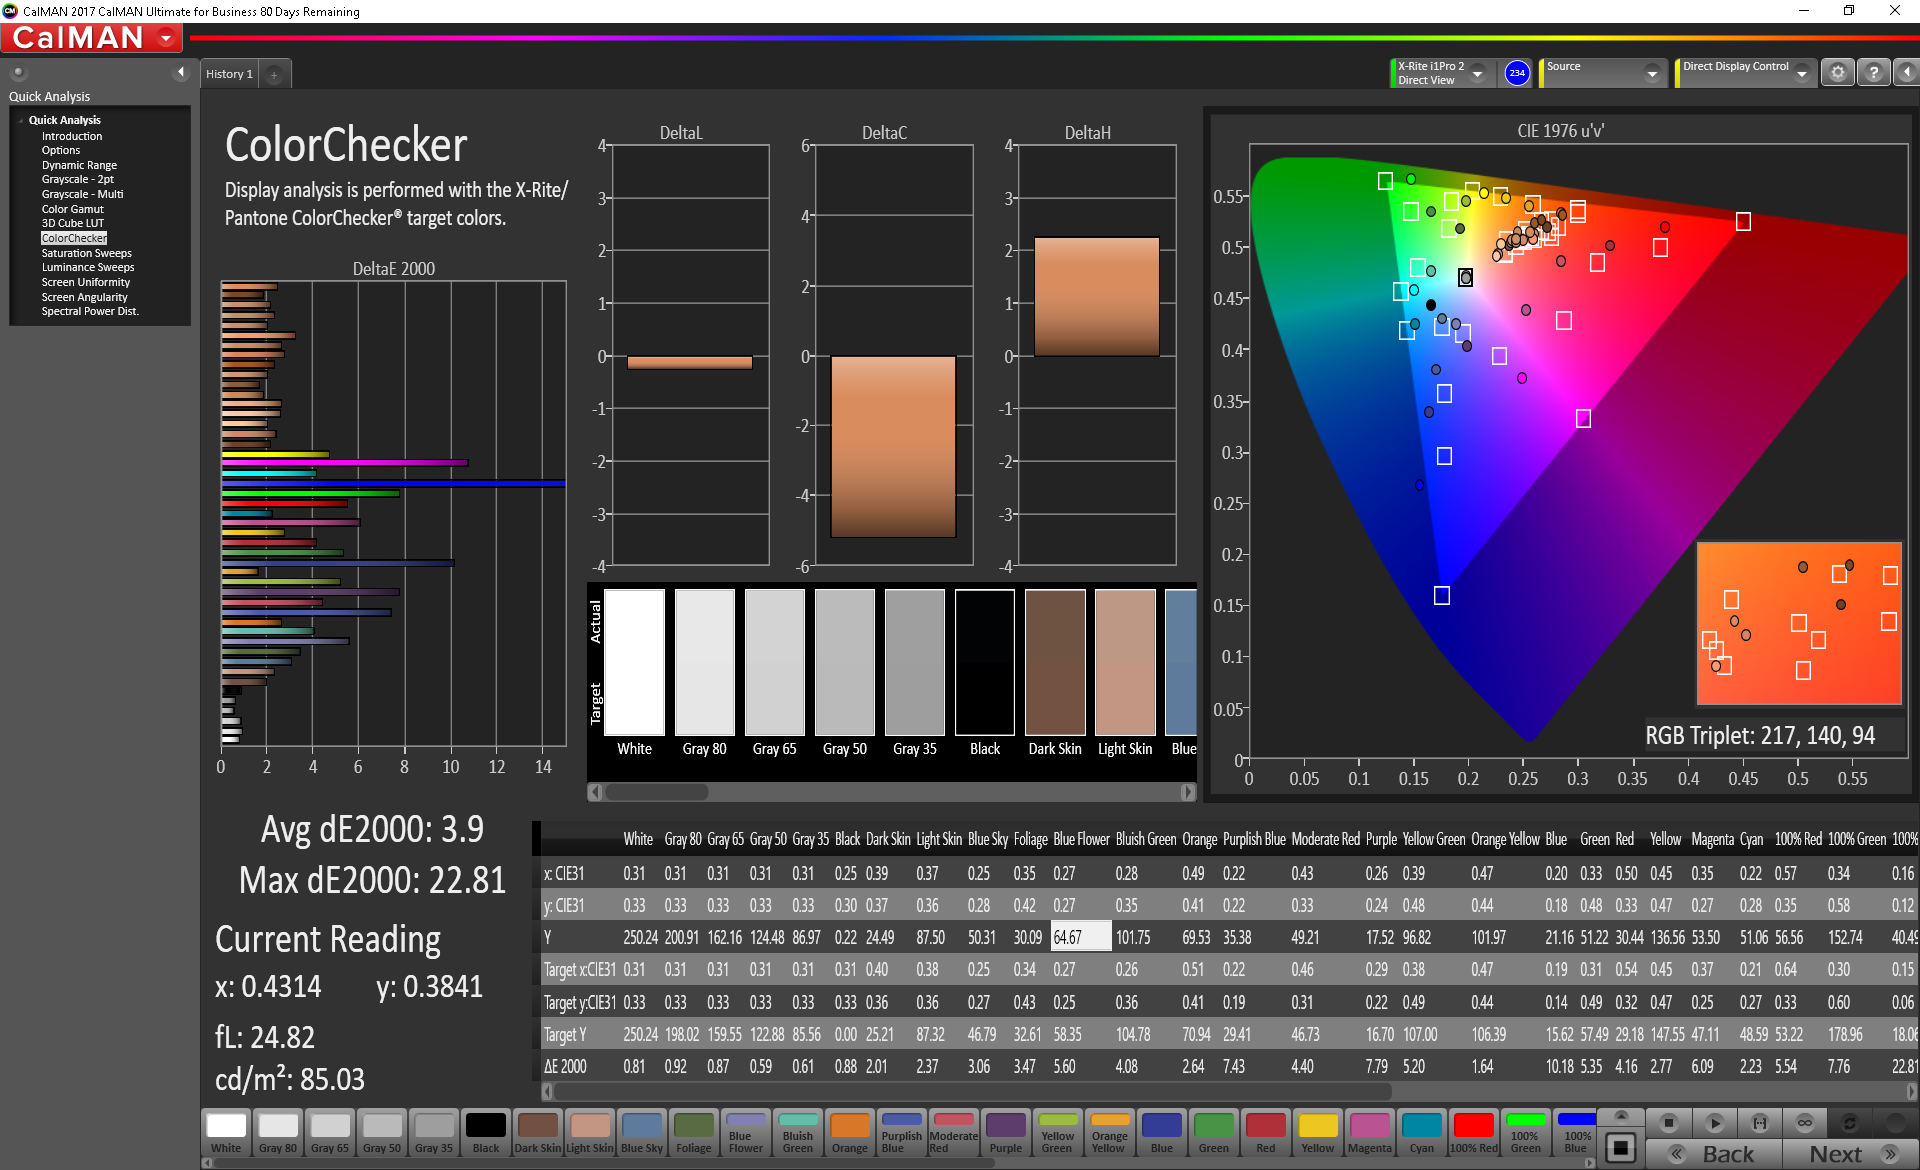
ΔE ColorChecker Calman: 4.23 | ∀{0.5-29.43 Ø4.73}
calibrated: 3.9
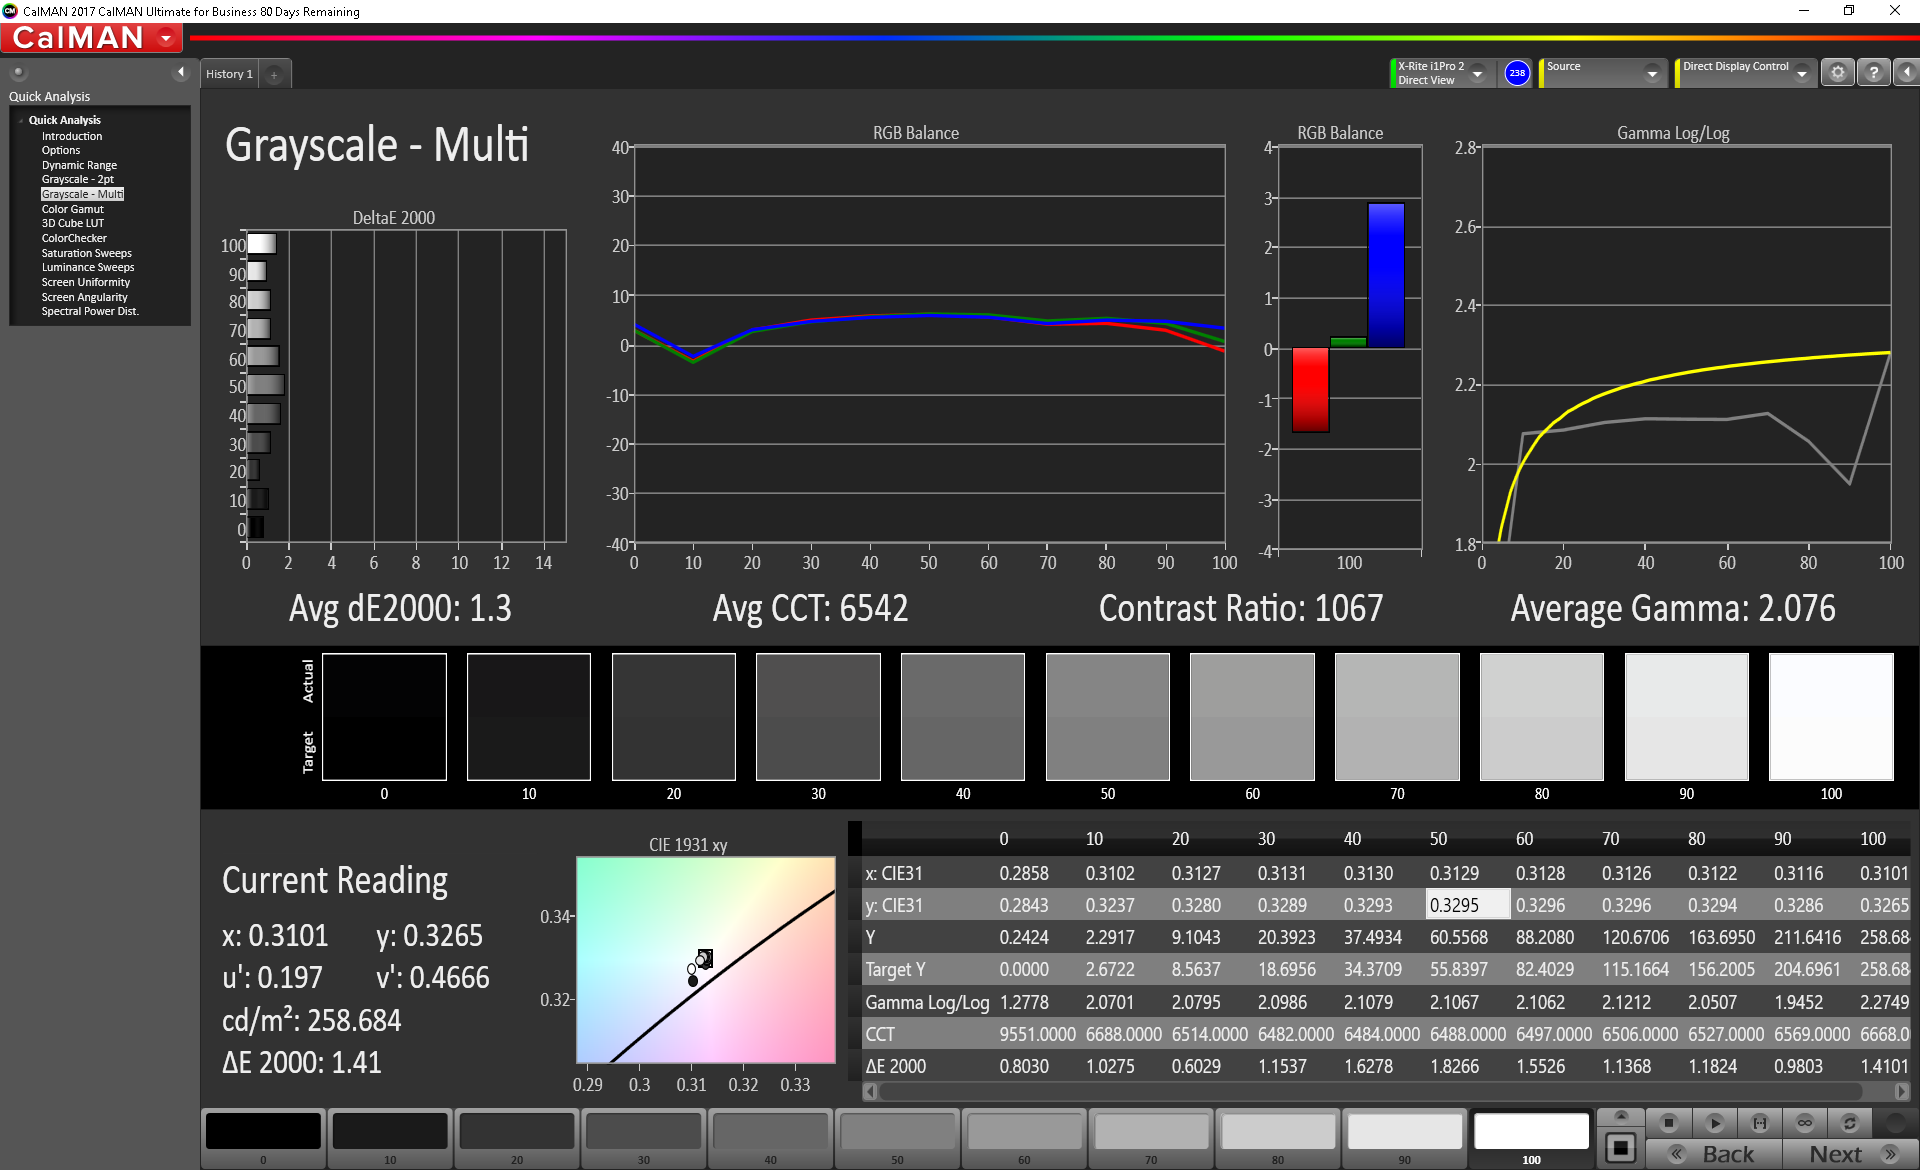
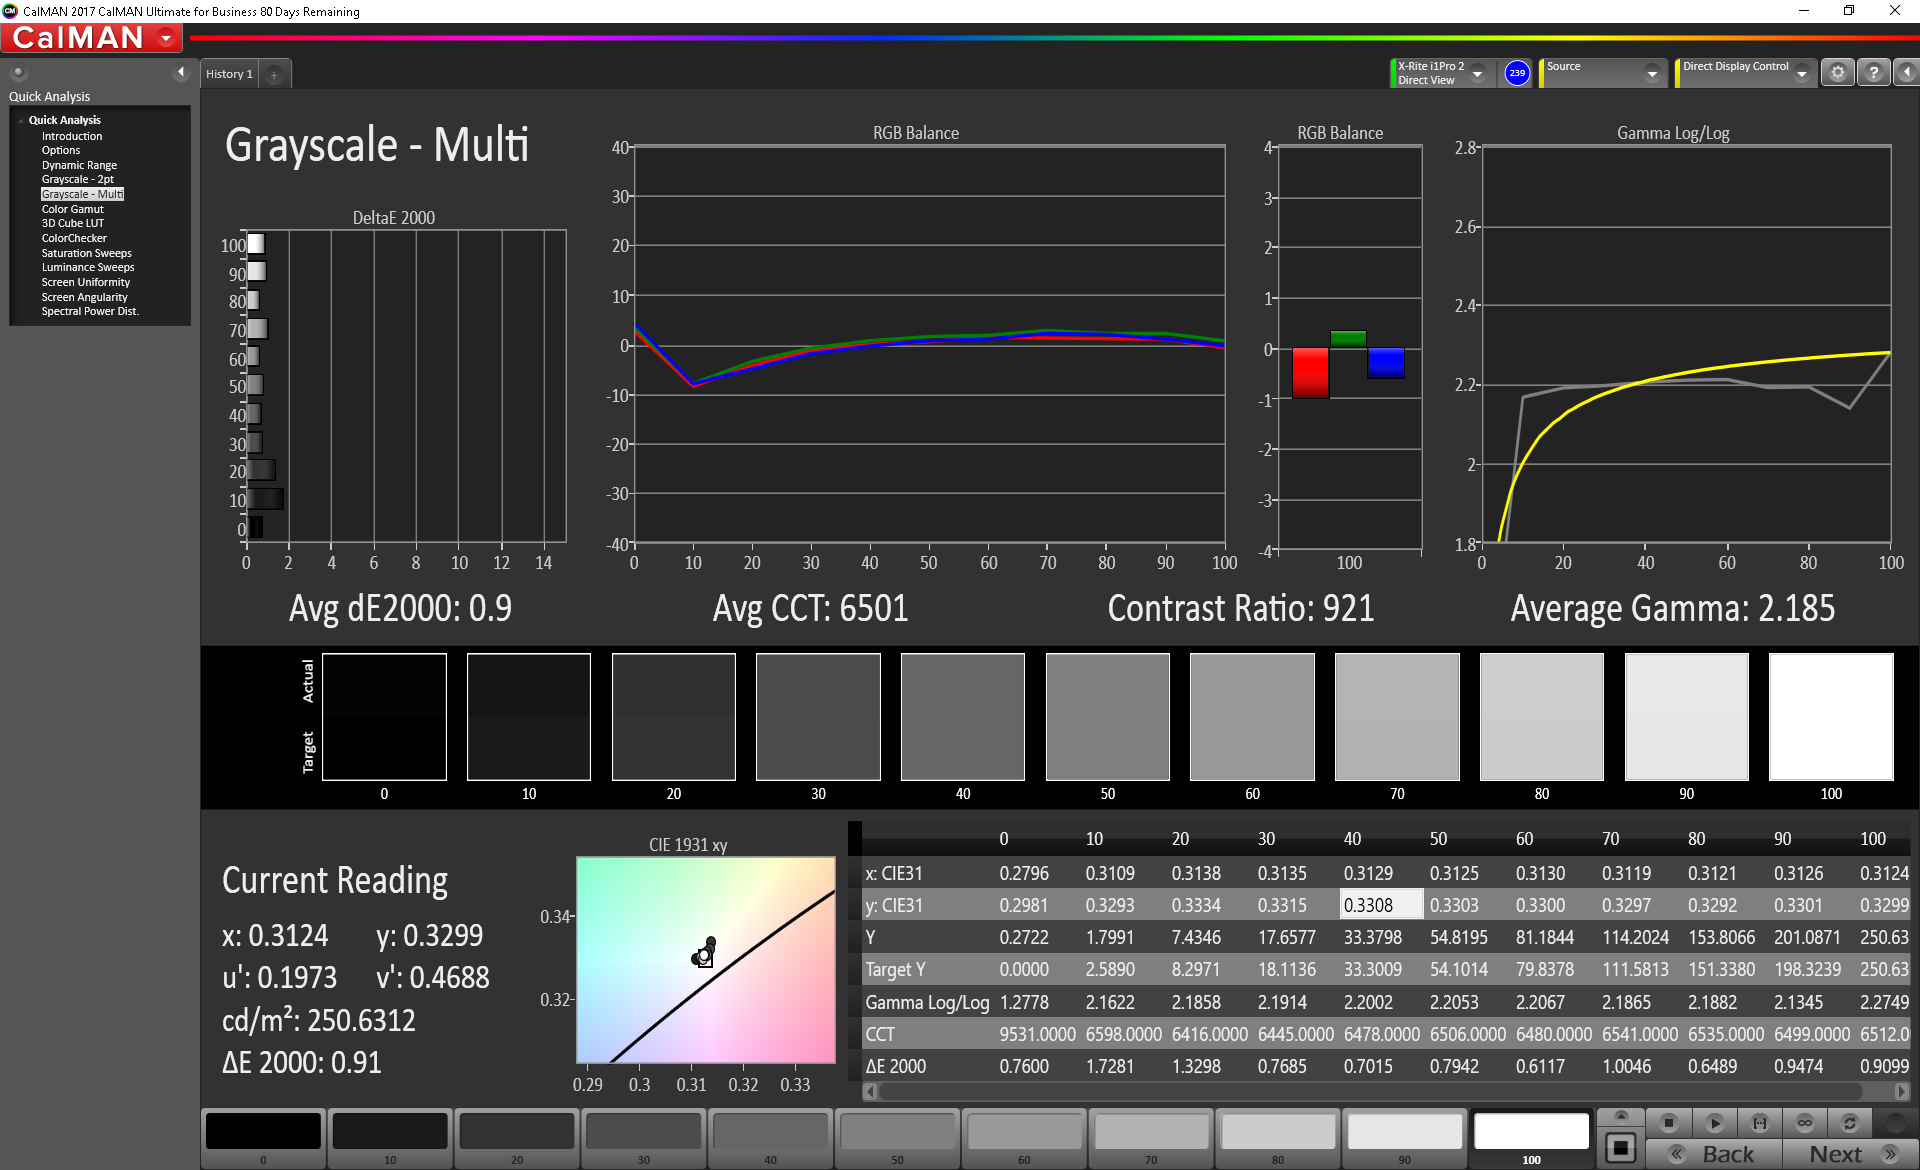
ΔE Greyscale Calman: 1.3 | ∀{0.09-98 Ø4.97}
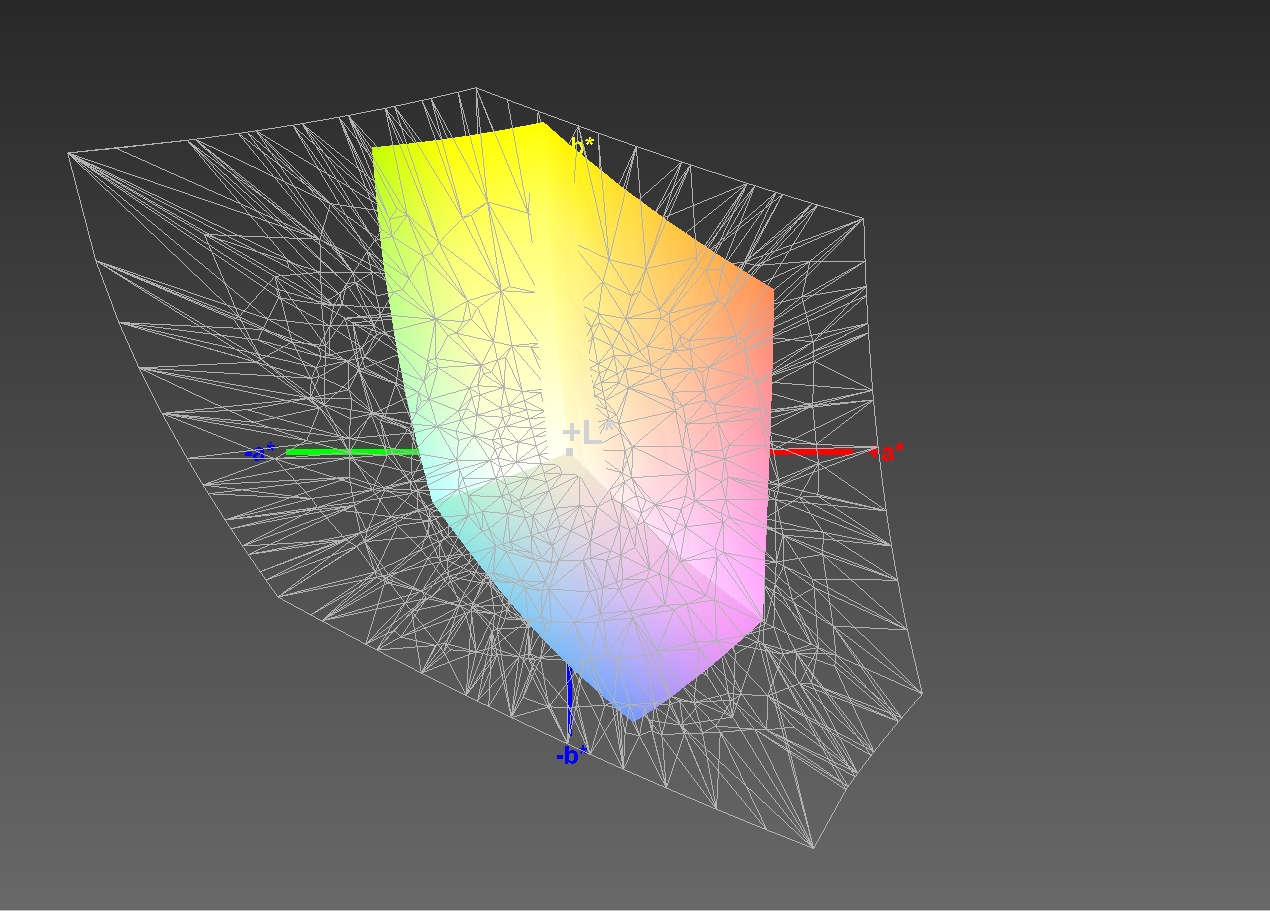
61% sRGB (Argyll 1.6.3 3D)
39% AdobeRGB 1998 (Argyll 1.6.3 3D)
42.49% AdobeRGB 1998 (Argyll 3D)
61.1% sRGB (Argyll 3D)
41.12% Display P3 (Argyll 3D)
Gamma: 2.076
CCT: 6542 K
| MSI GL75 9SEK-056US AU Optronics AUO479D (B173HAN04.7), IPS, 17.3", 1920x1080 | Asus Strix Hero III G731GV AU Optronics AUO B173HAN04.0, IPS, 17.3", 1920x1080 | MSI GL73 8SE-010US CMN1747, TN LED, 17.3", 1920x1080 | Acer Predator Helios 500 PH517-51-79BY AUO_B173HAN03, IPS, 17.3", 1920x1080 | HP Omen 17t-3AW55AV_1 AU Optronics AUO309D, IPS, 17.3", 1920x1080 | HP Omen 15-dc1020ng LGD05CE, IPS, 15.6", 1920x1080 | HP Pavilion Gaming 17-cd0085cl BOE0825, IPS, 17.3", 1920x1080 | |
|---|---|---|---|---|---|---|---|
| Display | 49% | 96% | 53% | 54% | -7% | 51% | |
| Display P3 Coverage (%) | 41.12 | 62.9 53% | 91.1 122% | 64.4 57% | 65.4 59% | 38.37 -7% | 63.3 54% |
| sRGB Coverage (%) | 61.1 | 87.2 43% | 100 64% | 91.3 49% | 90 47% | 57.6 -6% | 90.2 48% |
| AdobeRGB 1998 Coverage (%) | 42.49 | 63.8 50% | 85.4 101% | 65.6 54% | 65.8 55% | 39.69 -7% | 64.3 51% |
| Response Times | 63% | 59% | 55% | 46% | -38% | -1% | |
| Response Time Grey 50% / Grey 80% * (ms) | 26 ? | 6.8 ? 74% | 12.8 ? 51% | 14 ? 46% | 17.6 ? 32% | 40 ? -54% | 31.6 ? -22% |
| Response Time Black / White * (ms) | 24.4 ? | 12 ? 51% | 8.2 ? 66% | 9 ? 63% | 10 ? 59% | 29.6 ? -21% | 19.6 ? 20% |
| PWM Frequency (Hz) | 25770 ? | ||||||
| Screen | 12% | -50% | -28% | 2% | -22% | -2% | |
| Brightness middle (cd/m²) | 259.1 | 312.3 21% | 326.4 26% | 335 29% | 343.6 33% | 251 -3% | 299.6 16% |
| Brightness (cd/m²) | 261 | 297 14% | 317 21% | 300 15% | 320 23% | 232 -11% | 285 9% |
| Brightness Distribution (%) | 93 | 91 -2% | 90 -3% | 82 -12% | 87 -6% | 76 -18% | 86 -8% |
| Black Level * (cd/m²) | 0.25 | 0.21 16% | 0.28 -12% | 0.7 -180% | 0.34 -36% | 0.17 32% | 0.33 -32% |
| Contrast (:1) | 1036 | 1487 44% | 1166 13% | 479 -54% | 1011 -2% | 1476 42% | 908 -12% |
| Colorchecker dE 2000 * | 4.23 | 3.6 15% | 7.83 -85% | 4.99 -18% | 3.74 12% | 6.2 -47% | 3.68 13% |
| Colorchecker dE 2000 max. * | 23.39 | 6.74 71% | 13.36 43% | 9.32 60% | 5.33 77% | 18.6 20% | 8.05 66% |
| Colorchecker dE 2000 calibrated * | 3.9 | 3.95 -1% | 2.83 27% | 1.93 51% | 3.49 11% | 4.8 -23% | 3.15 19% |
| Greyscale dE 2000 * | 1.3 | 3.1 -138% | 10.9 -738% | 5.2 -300% | 3.7 -185% | 4.2 -223% | 3.8 -192% |
| Gamma | 2.076 106% | 2.26 97% | 1.97 112% | 2.49 88% | 2.36 93% | 2.32 95% | 2.12 104% |
| CCT | 6542 99% | 7002 93% | 11056 59% | 7719 84% | 6388 102% | 7454 87% | 7240 90% |
| Color Space (Percent of AdobeRGB 1998) (%) | 39 | 56.6 45% | 75.8 94% | 59 51% | 58 49% | 36.5 -6% | 58.1 49% |
| Color Space (Percent of sRGB) (%) | 61 | 86.6 42% | 100 64% | 91 49% | 90 48% | 57.4 -6% | 89.8 47% |
| Total Average (Program / Settings) | 41% /
25% | 35% /
-9% | 27% /
-3% | 34% /
17% | -22% /
-21% | 16% /
8% |
* ... smaller is better
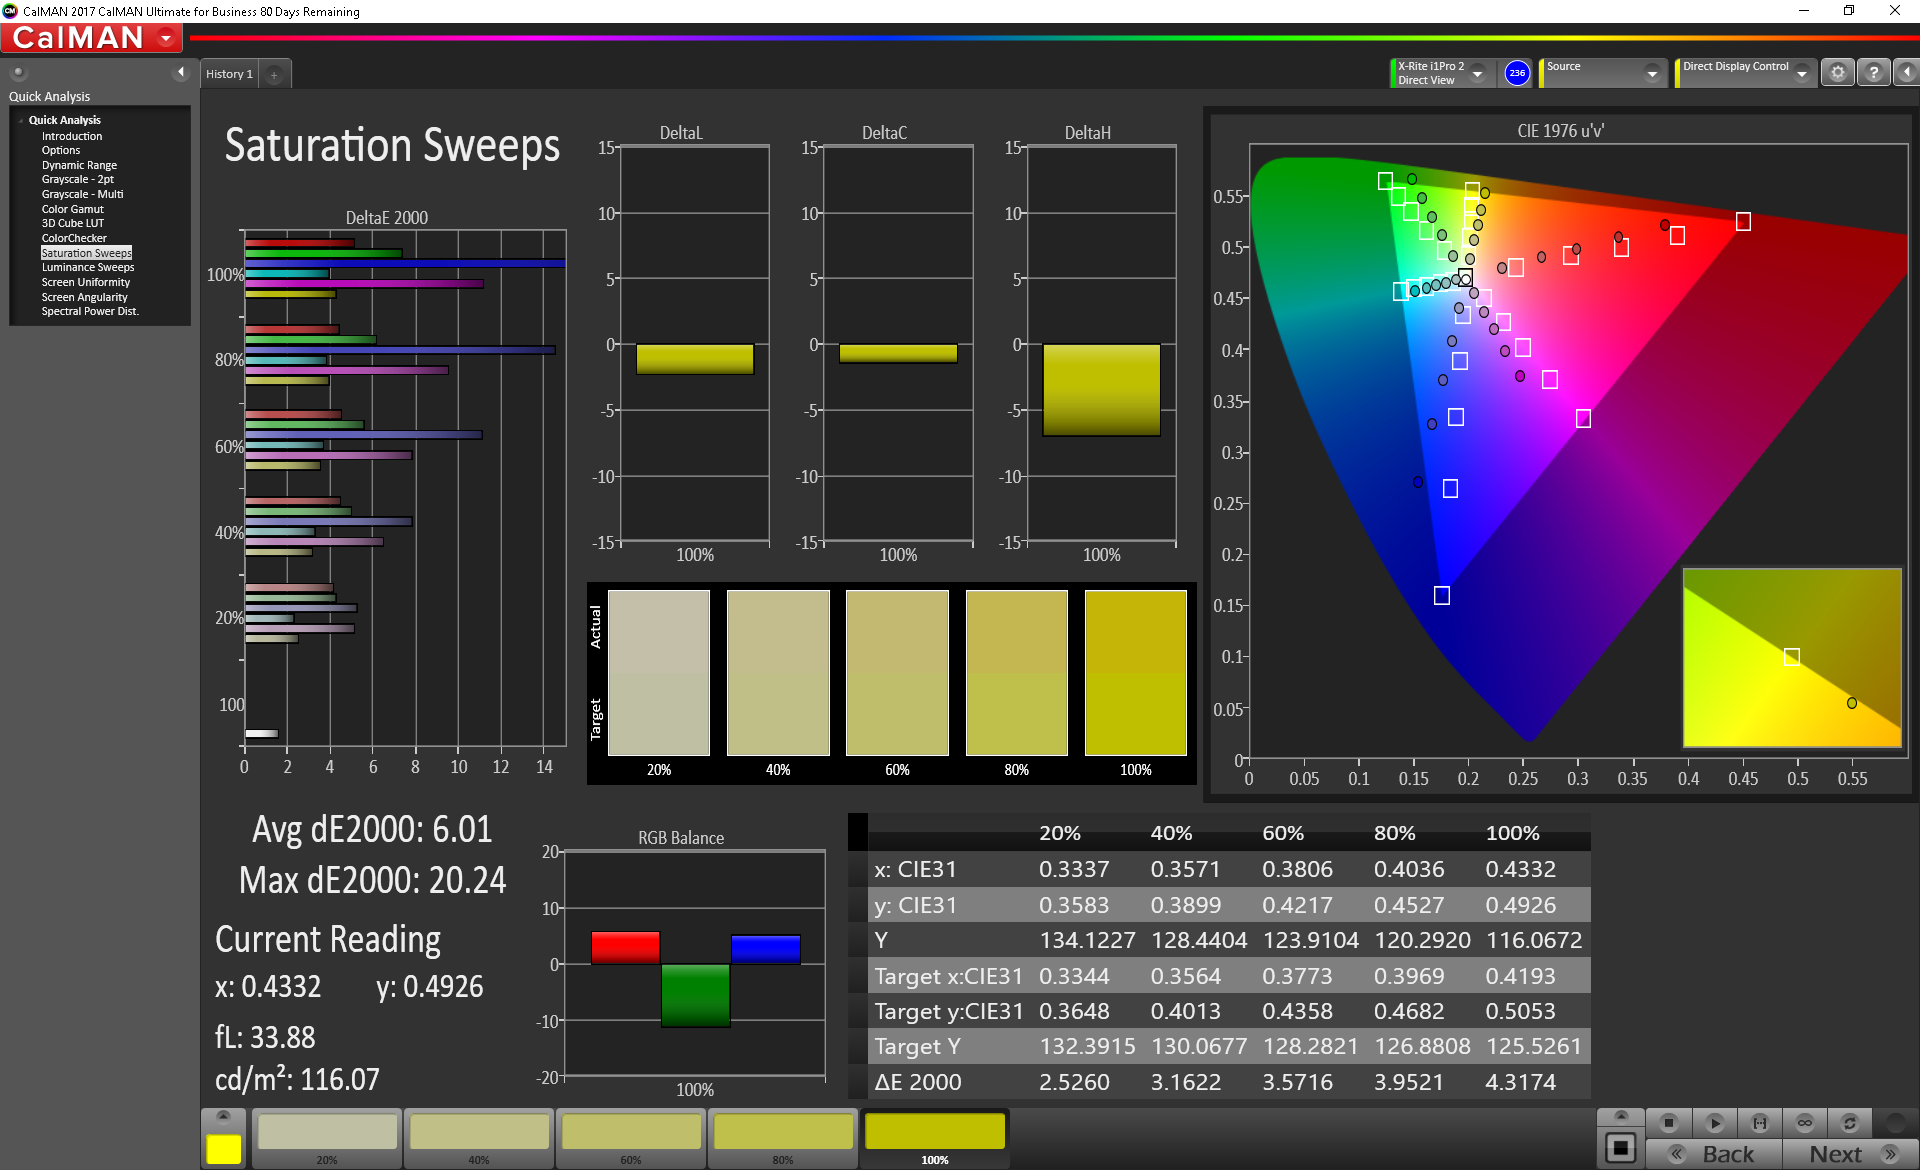
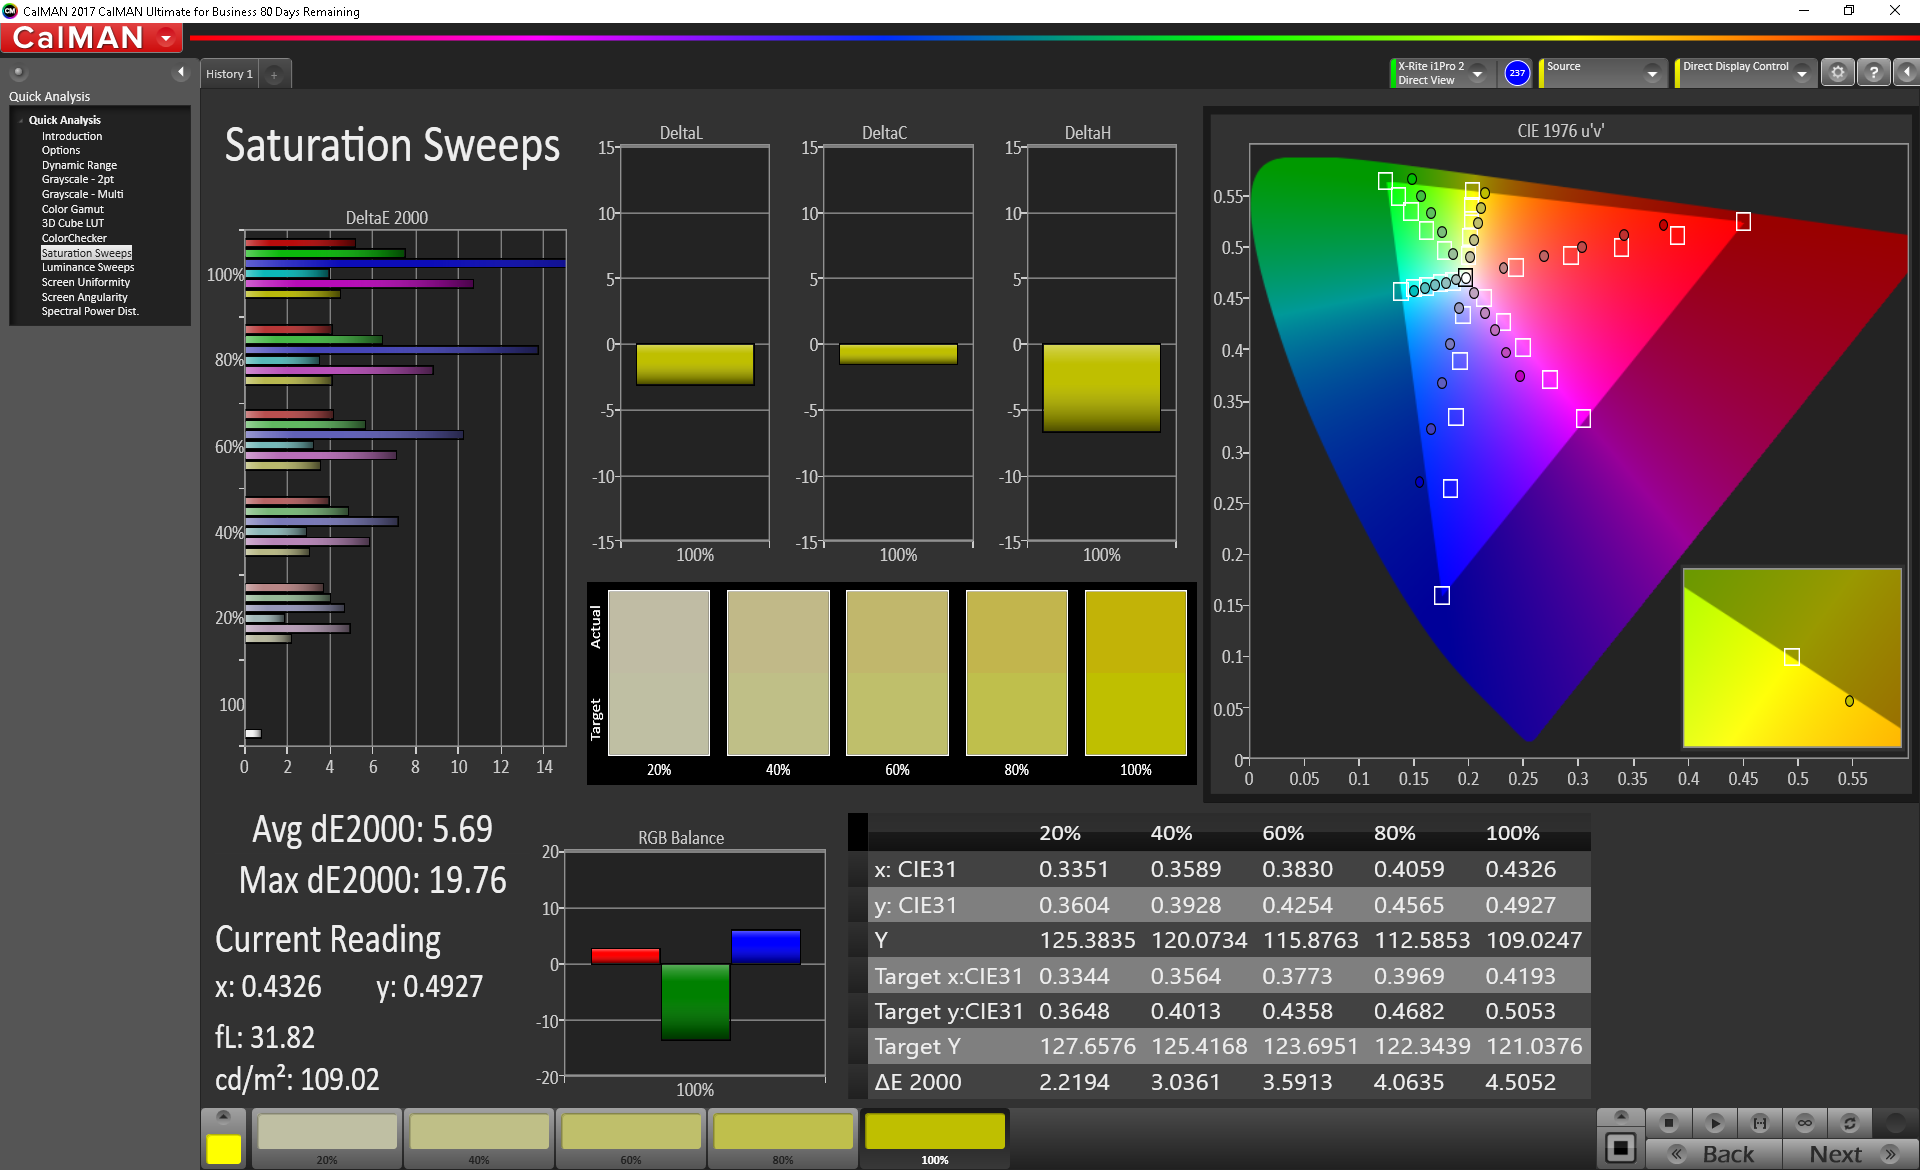
Color reproduction and color space are decent but not great. The DeltaE2000 for colors averages 4.23, which is good for a gaming laptop but not low enough for professional use (DeltaE2000 of 3 or lower). However, some colors bands are far less accurate than others. In particular, hues of blue and green miss their color targets by a fair bit (DeltaE2000 between 8-12). This shouldn't matter much for games. Grays are far more accurate with little variance. Calibration helps these DeltaE2000 scores a bit, but this is not a good display for color-critical work.
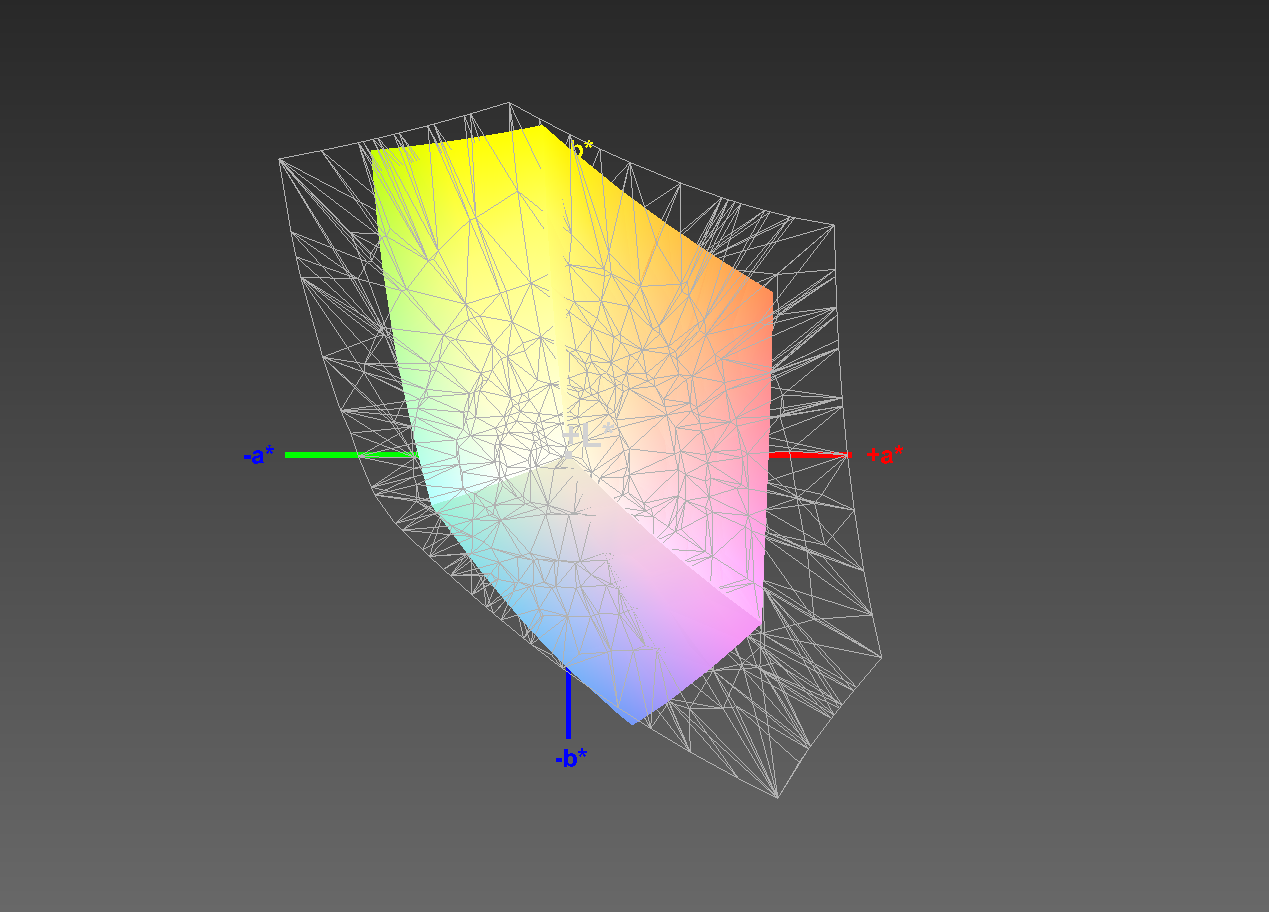
Color space coverage is similarly stunted. The GL75's panel covers only 61% and 39% of the sRGB and AdobeRGB color gamuts, respectively. Again, this is adequate for gaming, but videographers and photographers will find the limited color selection frustrating. Given how far gaming laptop displays have come with regards to color (even mid-range devices), these results are a bit disappointing.
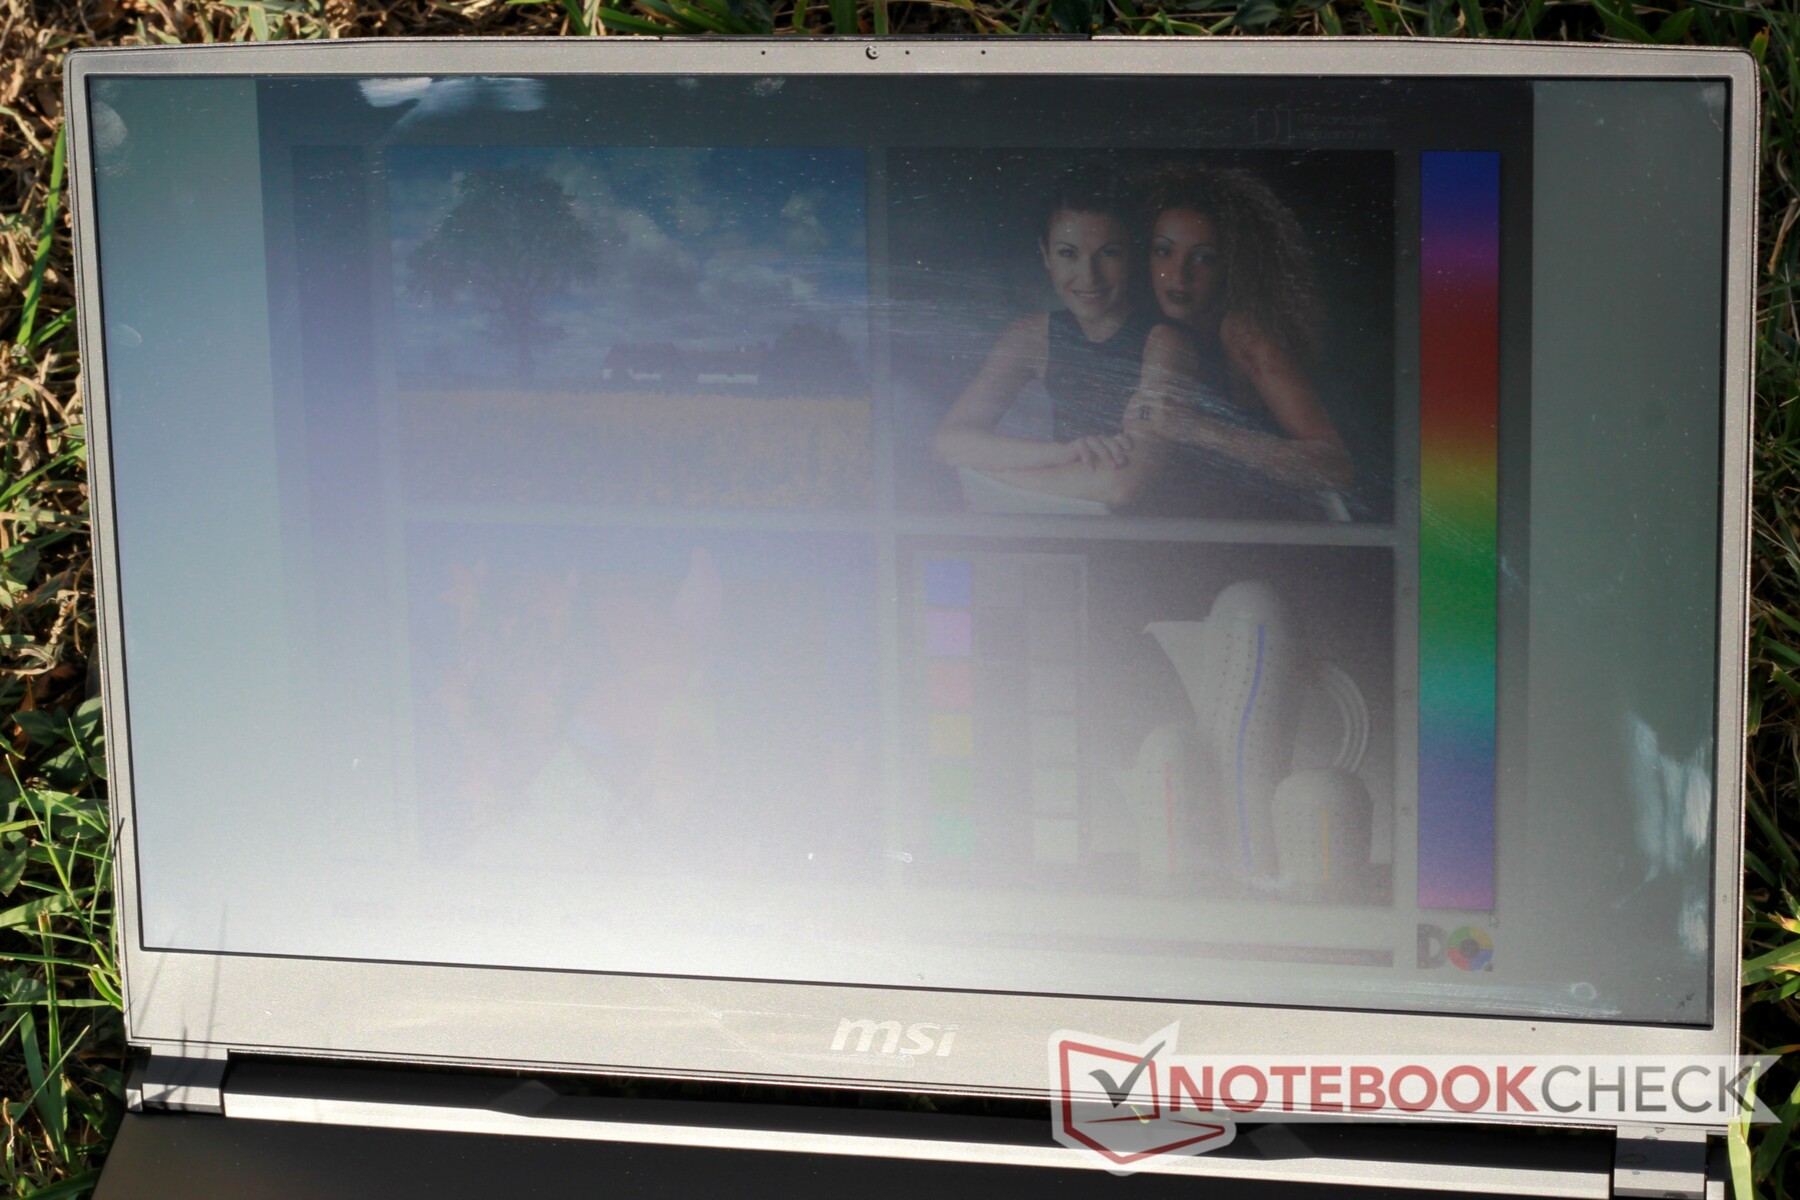
The dim backlight makes outdoor use difficult. While the screen can be seen under shade (thanks in part to its matte finish), direct sunlight completely washes out the display. The matte display exhibits noticeable graininess, especially on white backgrounds. However, this is not uncommon. On a positive note, viewing angles are good (typical for an IPS display), and backlight bleed is minimal.


Display Response Times
| ↔ Response Time Black to White | ||
|---|---|---|
| 24.4 ms ... rise ↗ and fall ↘ combined | ↗ 12.8 ms rise | 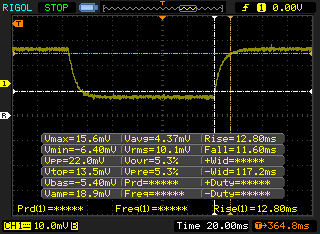 |
| ↘ 11.6 ms fall | ||
| The screen shows good response rates in our tests, but may be too slow for competitive gamers. In comparison, all tested devices range from 0.1 (minimum) to 240 (maximum) ms. » 57 % of all devices are better. This means that the measured response time is worse than the average of all tested devices (19.9 ms). | ||
| ↔ Response Time 50% Grey to 80% Grey | ||
| 26 ms ... rise ↗ and fall ↘ combined | ↗ 11.6 ms rise | 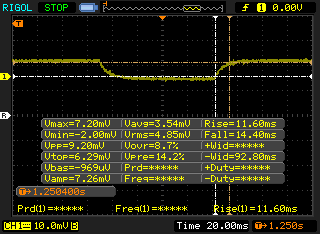 |
| ↘ 14.4 ms fall | ||
| The screen shows relatively slow response rates in our tests and may be too slow for gamers. In comparison, all tested devices range from 0.165 (minimum) to 636 (maximum) ms. » 36 % of all devices are better. This means that the measured response time is better than the average of all tested devices (31.1 ms). | ||
Screen Flickering / PWM (Pulse-Width Modulation)
| Screen flickering / PWM not detected | 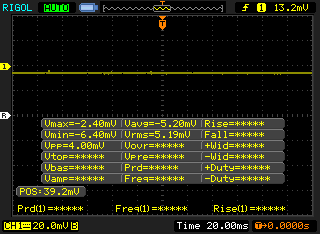 | ||
In comparison: 52 % of all tested devices do not use PWM to dim the display. If PWM was detected, an average of 7794 (minimum: 5 - maximum: 343500) Hz was measured. | |||
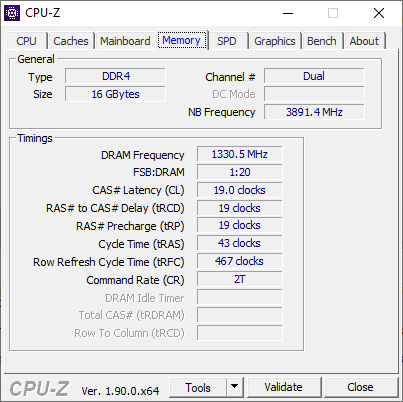
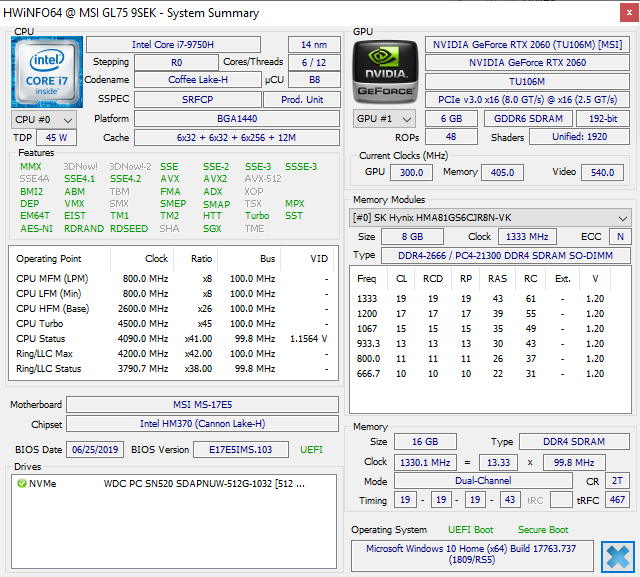
Performance
While the GL75's exterior features range from mediocre to average, its internals are surprisingly good. The GL75 ticks all the boxes expected of a 2019 mid-range gaming laptop (Core i7-9750H, RTX 2060) but regularly outperforms similarly specced competitors in almost every regard.

Processor
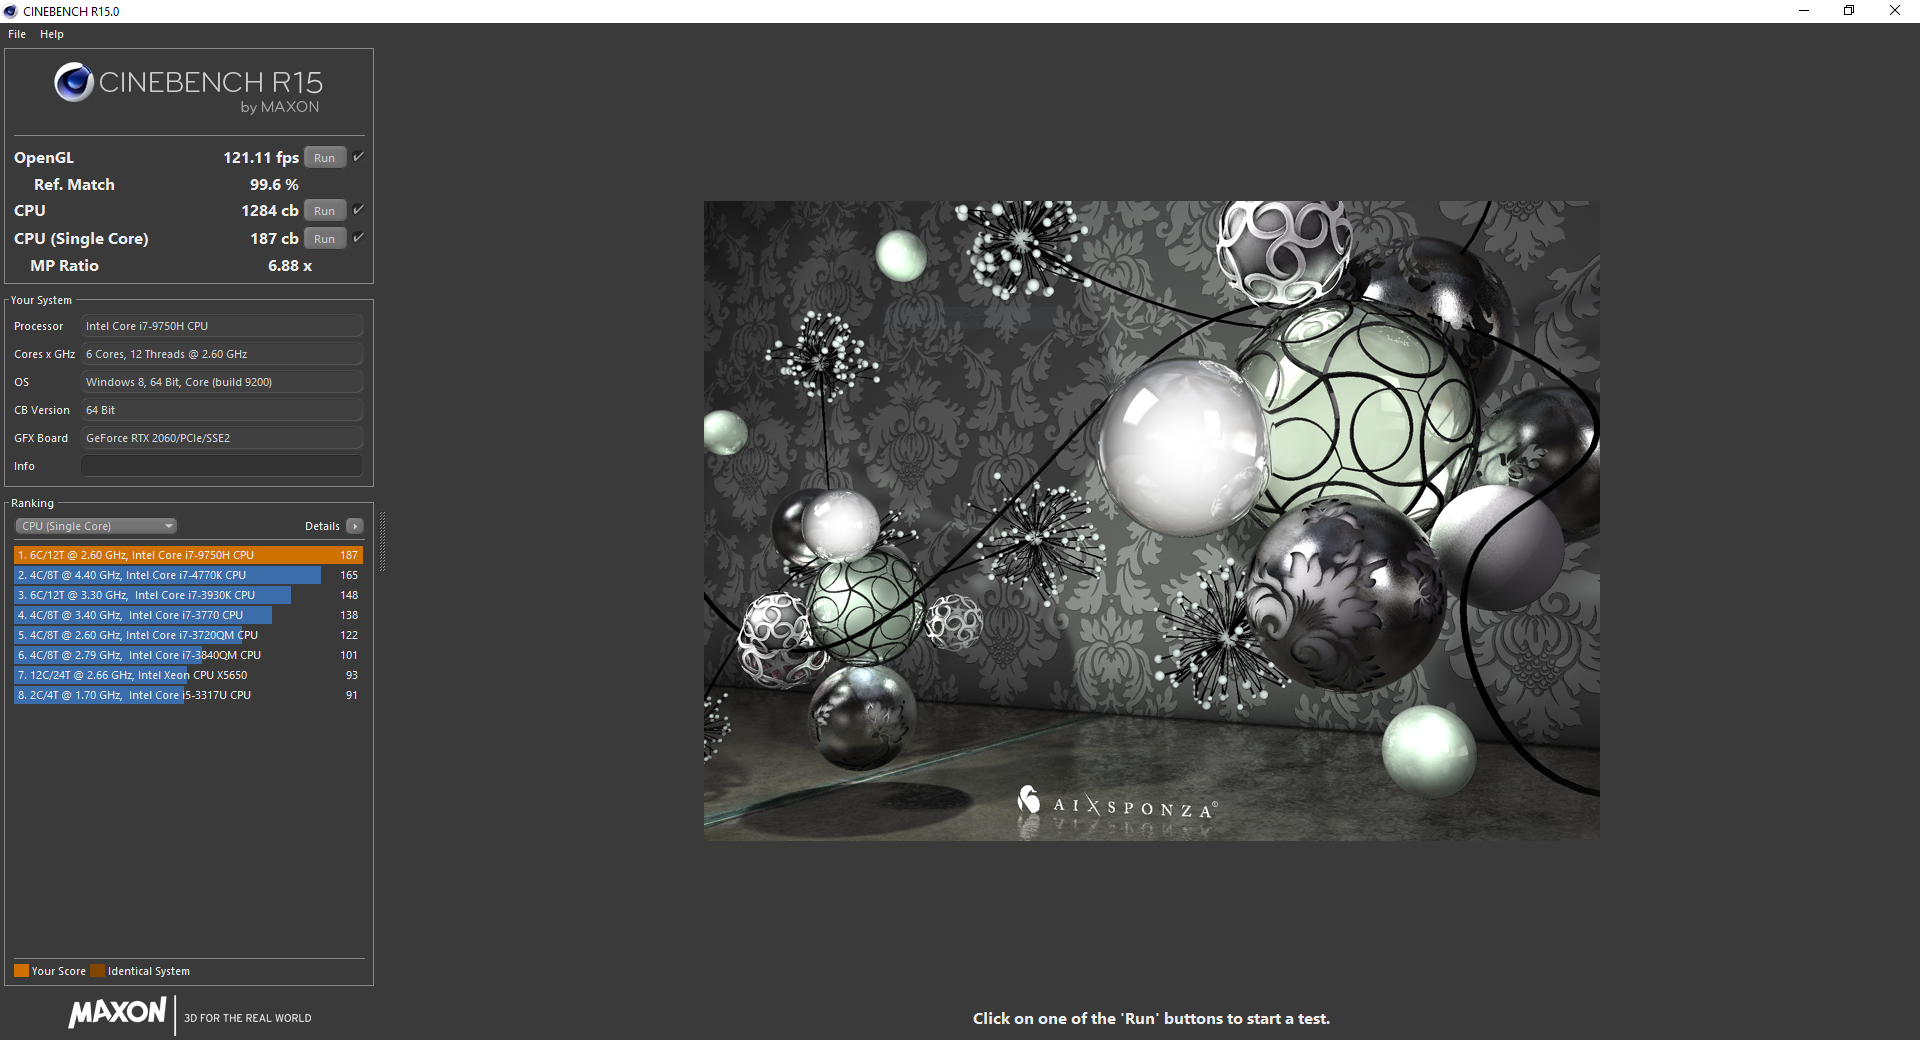
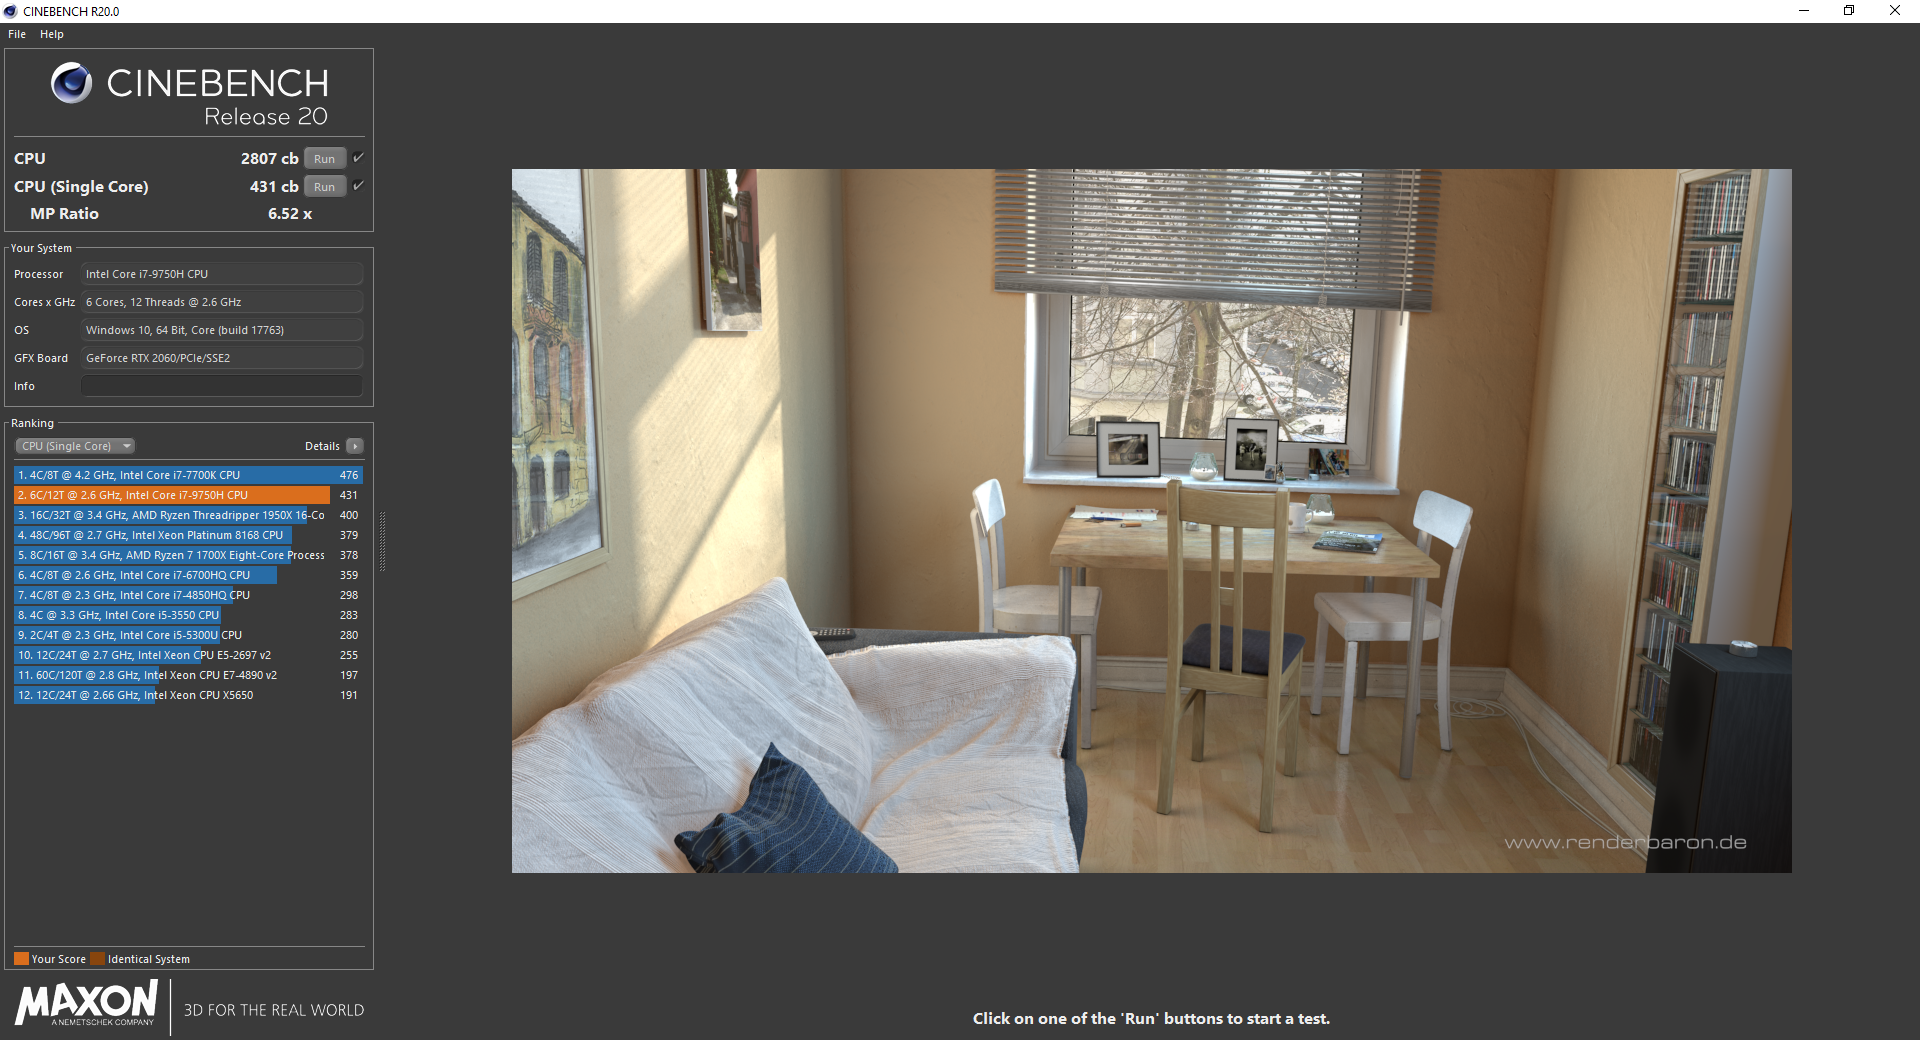
Intel's Core i7-9750H is the go-to CPU for gaming laptops this year, and with good reason. The hexacore, hyperthreaded CPU is a great performer and a small bump up from last year's Core i7-8750H. We've seen this processor several times at this point, and we know what to expect. However, the MSI GL75 manages to rise above the sea of 9750H-equipped laptops with impressive performance.
In Cinebench R15's multicore test, the GL75 bests the average score for the Core i7-9750H by 9%. Similarly, the GL75 smokes the competition in our Cinebench R15 loop test, which runs the multi-core benchmark 50 times in a row. After the typical drop in performance from the first pass, the GL75 holds fairly steady over the test, save for a single dip about halfway through. Notably, the GL75 beats out the Asus Strix Hero III G731GV and the HP Pavilion Gaming 17 by an average of 7-10% in this test.
| Cinebench R10 | |
| Rendering Multiple CPUs 32Bit | |
| Average of class Gaming (42932 - 81339, n=8, last 2 years) | |
| Average Intel Core i7-9750H (28251 - 36304, n=13) | |
| Lenovo Legion Y540-17IRH | |
| Rendering Single 32Bit | |
| Average of class Gaming (7457 - 11779, n=8, last 2 years) | |
| Average Intel Core i7-9750H (6659 - 7214, n=13) | |
| Lenovo Legion Y540-17IRH | |
System Performance
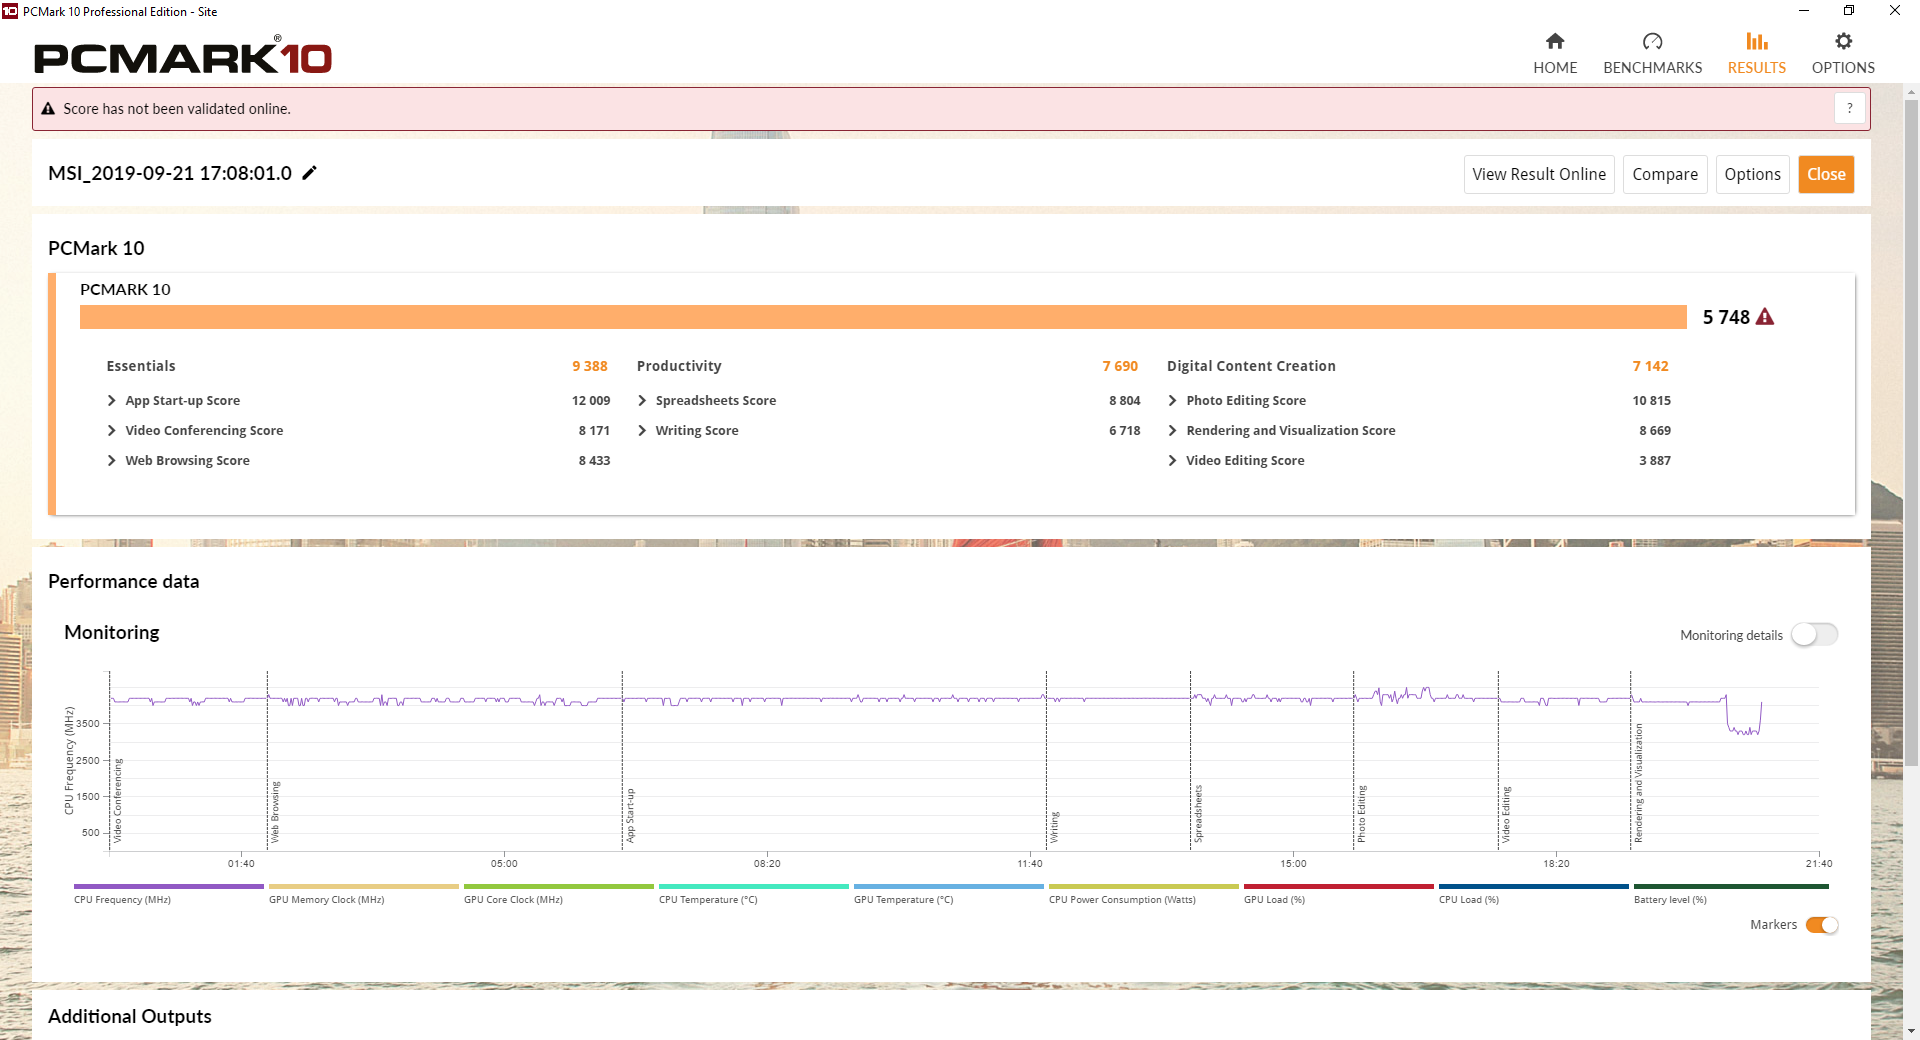
Overall system performance is excellent. The fast CPU, beefy GPU, and snappy NVMe SSD work in concert to plow through most workloads. In general, performance (as measured by PCMark 10) is in line with similarly priced laptops, and the GL75 should be able to easily handle most workloads thrown its way.
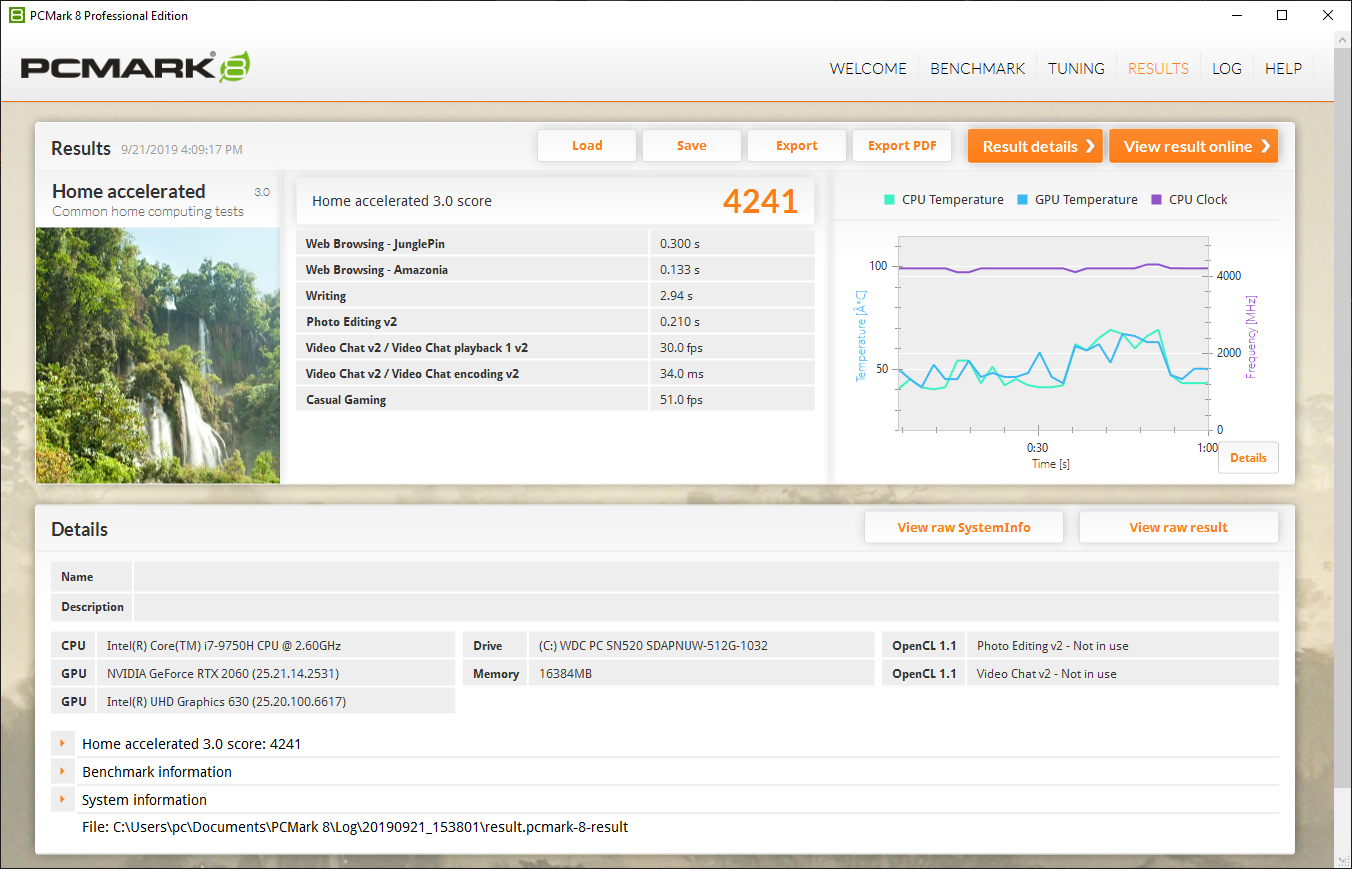
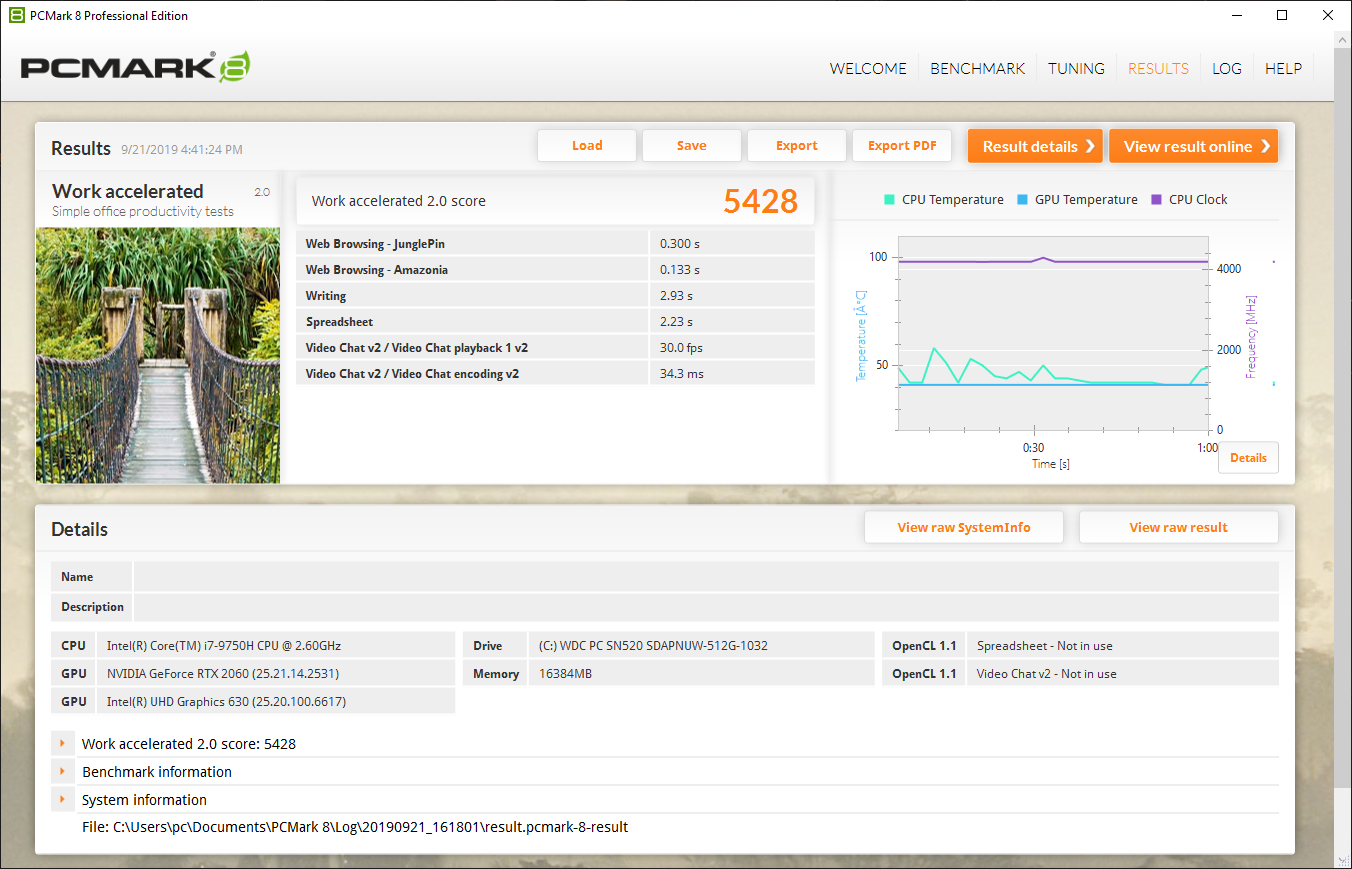
| PCMark 8 Home Score Accelerated v2 | 4241 points | |
| PCMark 8 Work Score Accelerated v2 | 5428 points | |
| PCMark 10 Score | 5748 points | |
Help | ||
Storage Devices
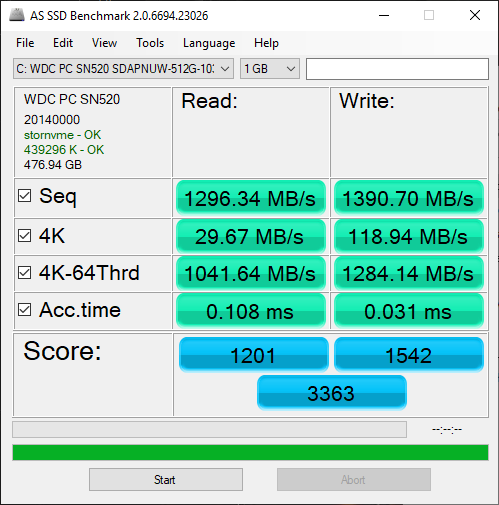
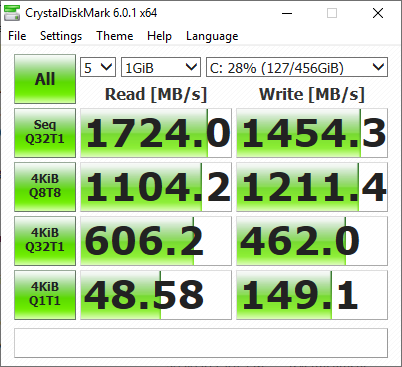
The Western Digital PC SN520 NVMe SSD is a very nice touch for a $1500 laptop. General read and write speeds are fairly good (~1300-1700 MB/s, depending on the test). Most competitors, except for HP's Omen 17t and Pavilion Gaming 17, cannot keep up. Both of these machines rely on Samsung's PM981, which usually bests other NVMe SSDs by a small margin.
| MSI GL75 9SEK-056US WDC PC SN520 SDAPNUW-512G | Asus Strix Hero III G731GV Intel SSD 660p SSDPEKNW512G8 | MSI GL73 8SE-010US Kingston RBUSNS8154P3128GJ | Acer Predator Helios 500 PH517-51-79BY SK hynix SSD Canvas SC300 HFS256GD9MNE-6200A | HP Omen 17t-3AW55AV_1 Samsung SSD PM981 MZVLB512HAJQ | HP Pavilion Gaming 17-cd0085cl Samsung SSD PM981 MZVLB256HAHQ | |
|---|---|---|---|---|---|---|
| AS SSD | -29% | -79% | -33% | 17% | 5% | |
| Seq Read (MB/s) | 1296 | 940 -27% | 794 -39% | 972 -25% | 1473 14% | 1709 32% |
| Seq Write (MB/s) | 1391 | 921 -34% | 427.6 -69% | 838 -40% | 1962 41% | 1345 -3% |
| 4K Read (MB/s) | 29.67 | 48.05 62% | 21.91 -26% | 38.57 30% | 31.66 7% | 49.73 68% |
| 4K Write (MB/s) | 104.3 | 56.6 | 80.7 | 84.4 | 108.2 | |
| 4K-64 Read (MB/s) | 1042 | 320.1 -69% | 354.3 -66% | 723 -31% | 1125 8% | 731 -30% |
| 4K-64 Write (MB/s) | 1284 | 703 -45% | 285.7 -78% | 647 -50% | 1866 45% | 1233 -4% |
| Access Time Read * (ms) | 0.108 | 0.079 27% | 0.237 -119% | 0.071 34% | 0.073 32% | |
| Access Time Write * (ms) | 0.031 | 0.046 -48% | 0.09 -190% | 0.054 -74% | 0.047 -52% | 0.034 -10% |
| Score Read (Points) | 1201 | 462 -62% | 456 -62% | 859 -28% | 1304 9% | 951 -21% |
| Score Write (Points) | 1542 | 900 -42% | 385 -75% | 812 -47% | 2147 39% | 1476 -4% |
| Score Total (Points) | 3363 | 1616 -52% | 1061 -68% | 4142 23% | 2909 -13% | |
| Copy ISO MB/s (MB/s) | 1416 | 811 | 868 | 1080 | 1284 | |
| Copy Program MB/s (MB/s) | 569 | 278 | 337 | 481.1 | 589 | |
| Copy Game MB/s (MB/s) | 971 | 556 | 590 | 875 | 1107 | |
| CrystalDiskMark 5.2 / 6 | -13% | -49% | -37% | -6% | 22% | |
| Write 4K (MB/s) | 149.1 | 129.3 -13% | 71.2 -52% | 79.2 -47% | 110.7 -26% | 135.3 -9% |
| Read 4K (MB/s) | 48.58 | 54.4 12% | 32.7 -33% | 39.69 -18% | 35.49 -27% | 63.7 31% |
| Write Seq (MB/s) | 978 | 404.5 | 950 | 1665 | 1337 | |
| Read Seq (MB/s) | 1447 | 8.3 | 1087 | 1284 | 1617 | |
| Write 4K Q32T1 (MB/s) | 462 | 476.8 3% | 204 -56% | 189.6 -59% | 340.2 -26% | 568 23% |
| Read 4K Q32T1 (MB/s) | 606 | 338.1 -44% | 303.2 -50% | 304 -50% | 407.5 -33% | 645 6% |
| Write Seq Q32T1 (MB/s) | 1454 | 982 -32% | 386.5 -73% | 948 -35% | 2038 40% | 1428 -2% |
| Read Seq Q32T1 (MB/s) | 1724 | 1622 -6% | 1214 -30% | 1488 -14% | 2367 37% | 3184 85% |
| Write 4K Q8T8 (MB/s) | 1211 | |||||
| Read 4K Q8T8 (MB/s) | 1104 | |||||
| Total Average (Program / Settings) | -21% /
-23% | -64% /
-68% | -35% /
-35% | 6% /
8% | 14% /
11% |
* ... smaller is better

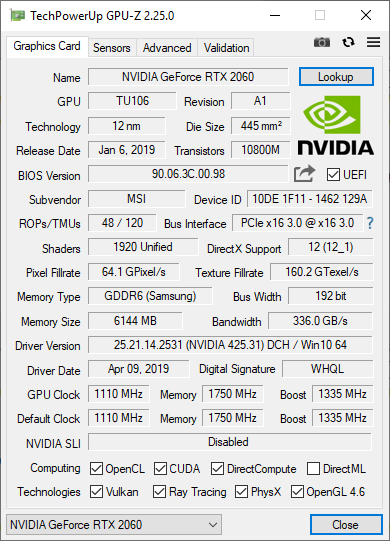
GPU Performance
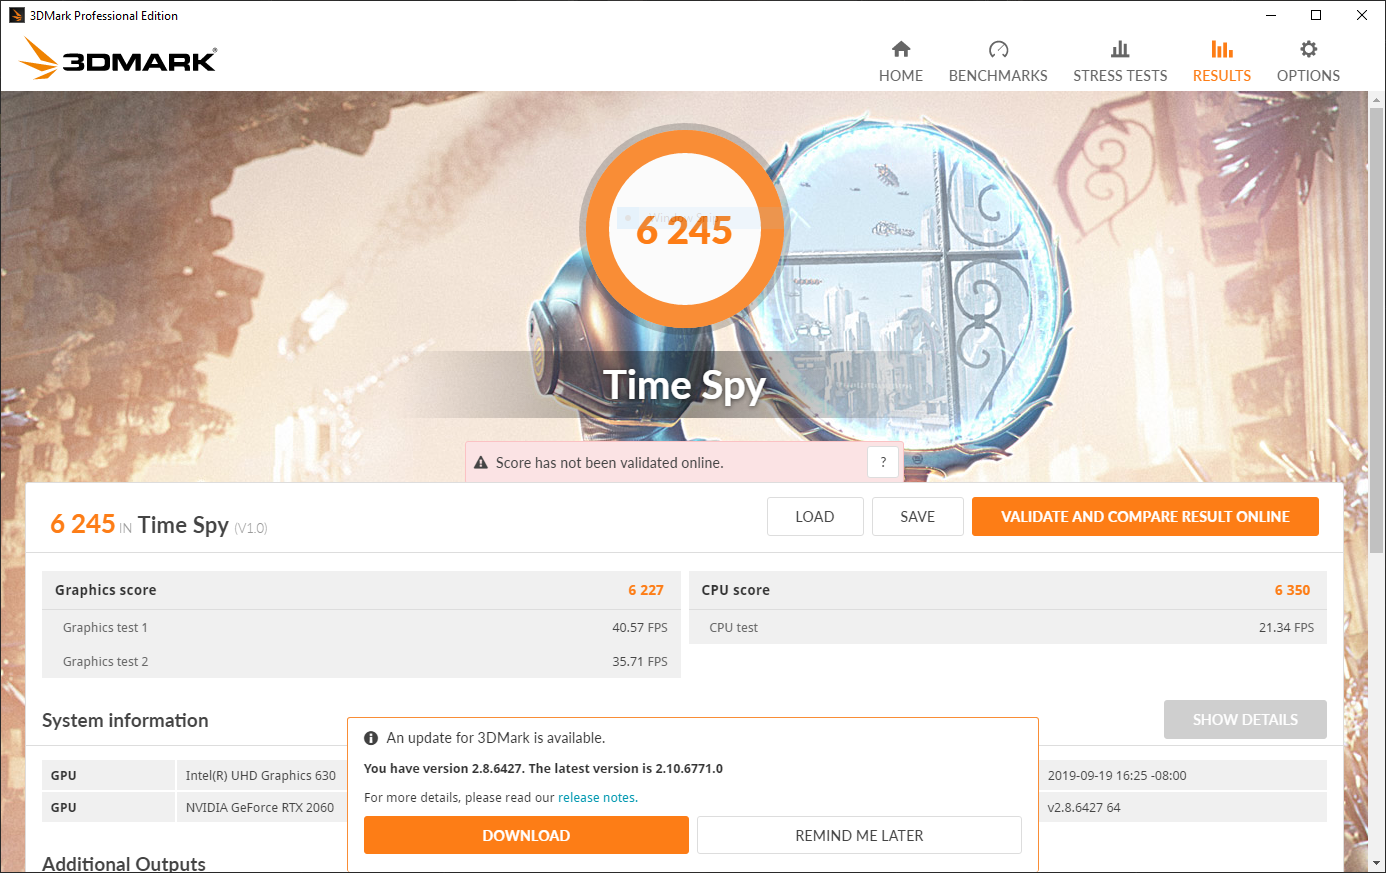
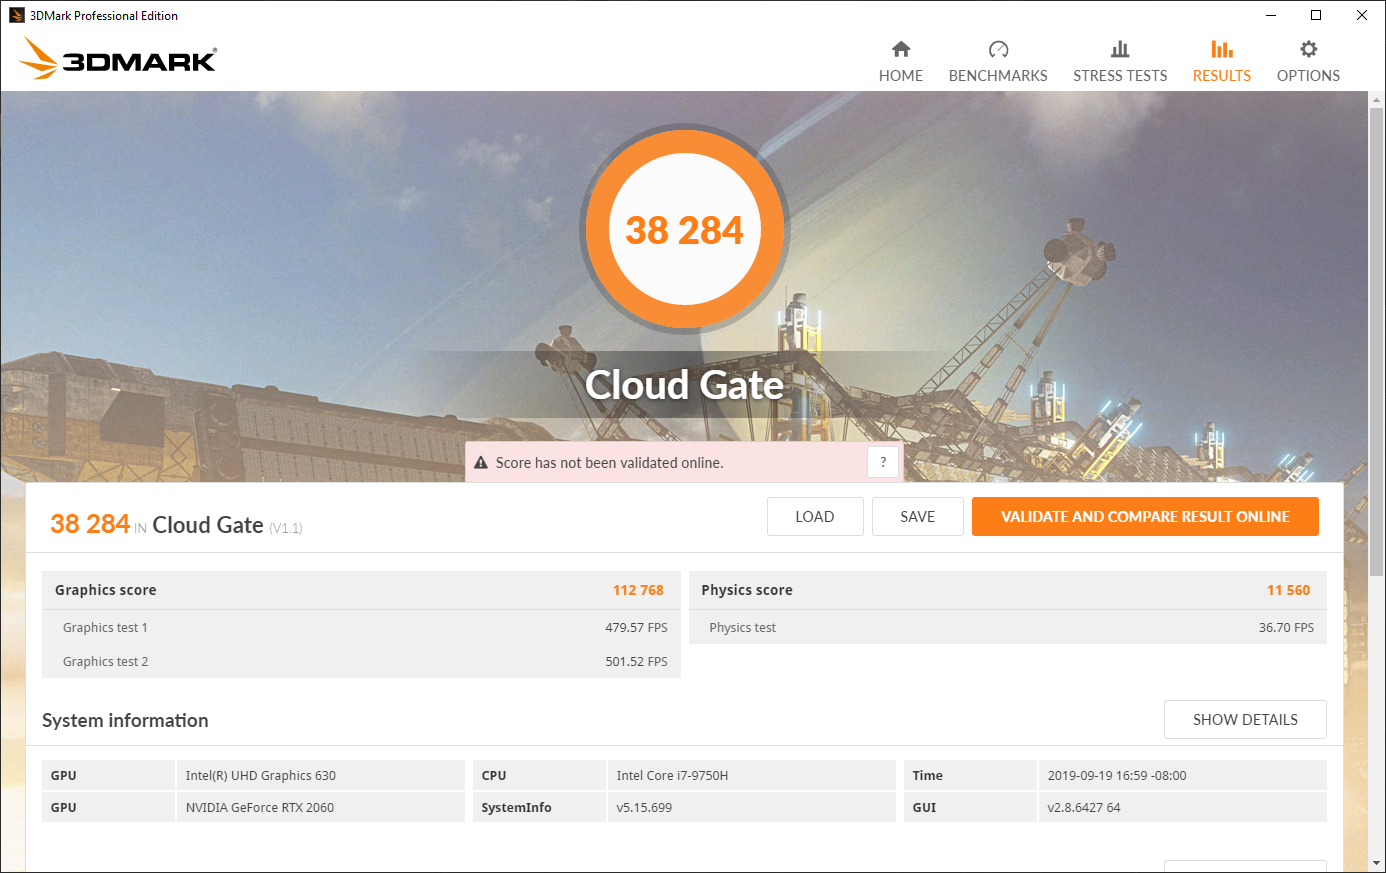
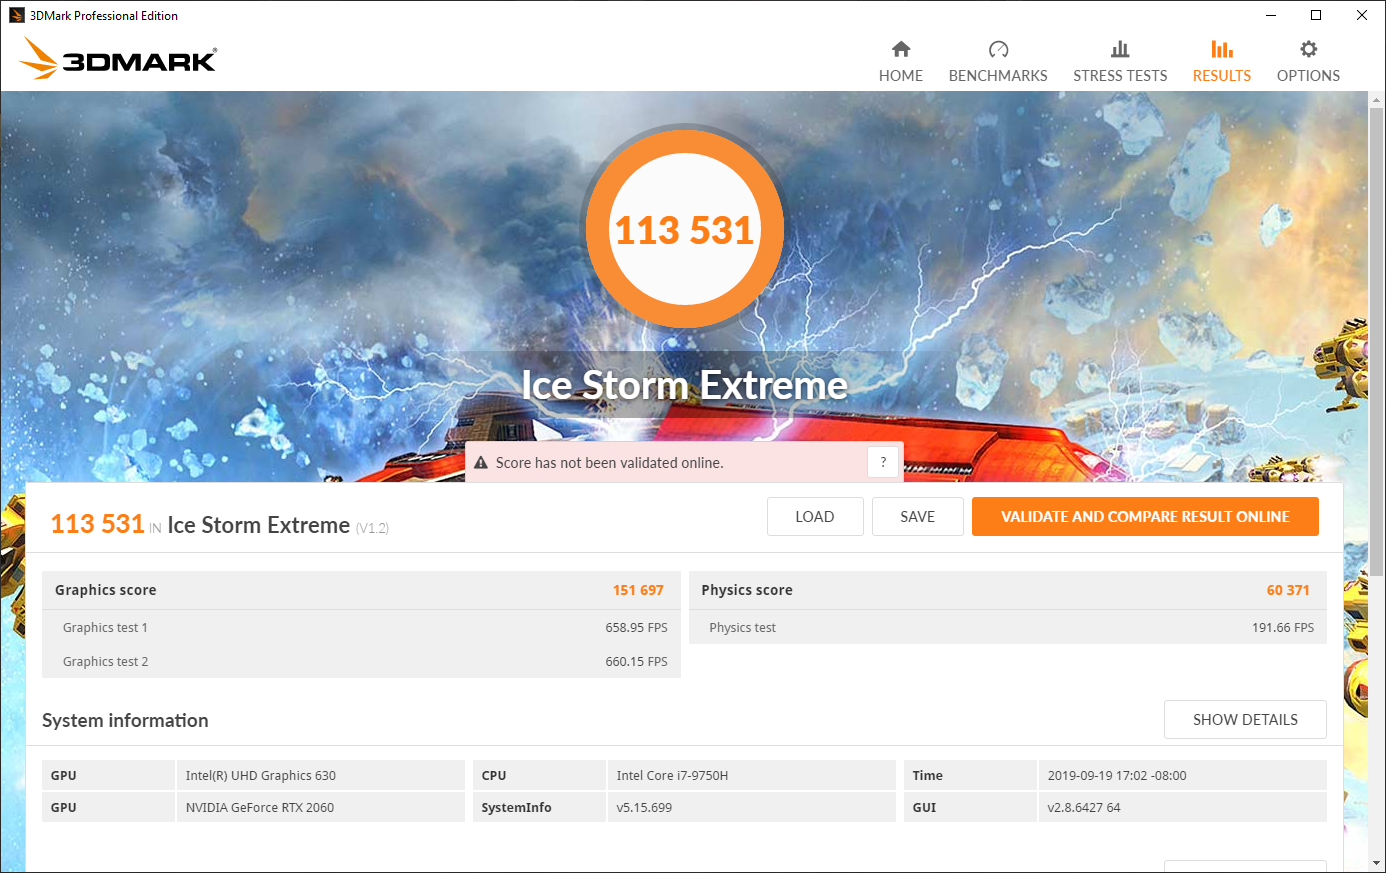
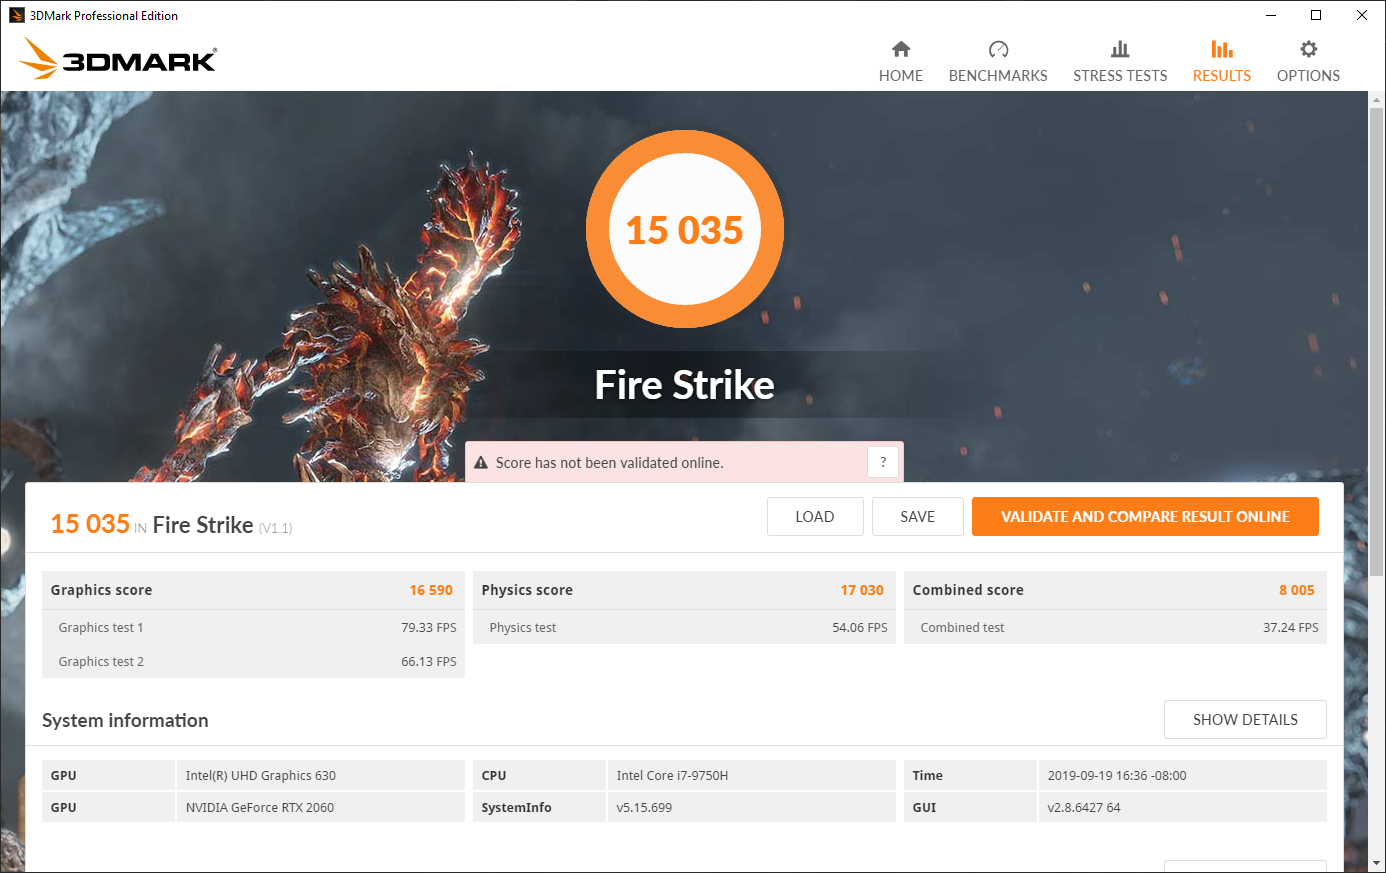
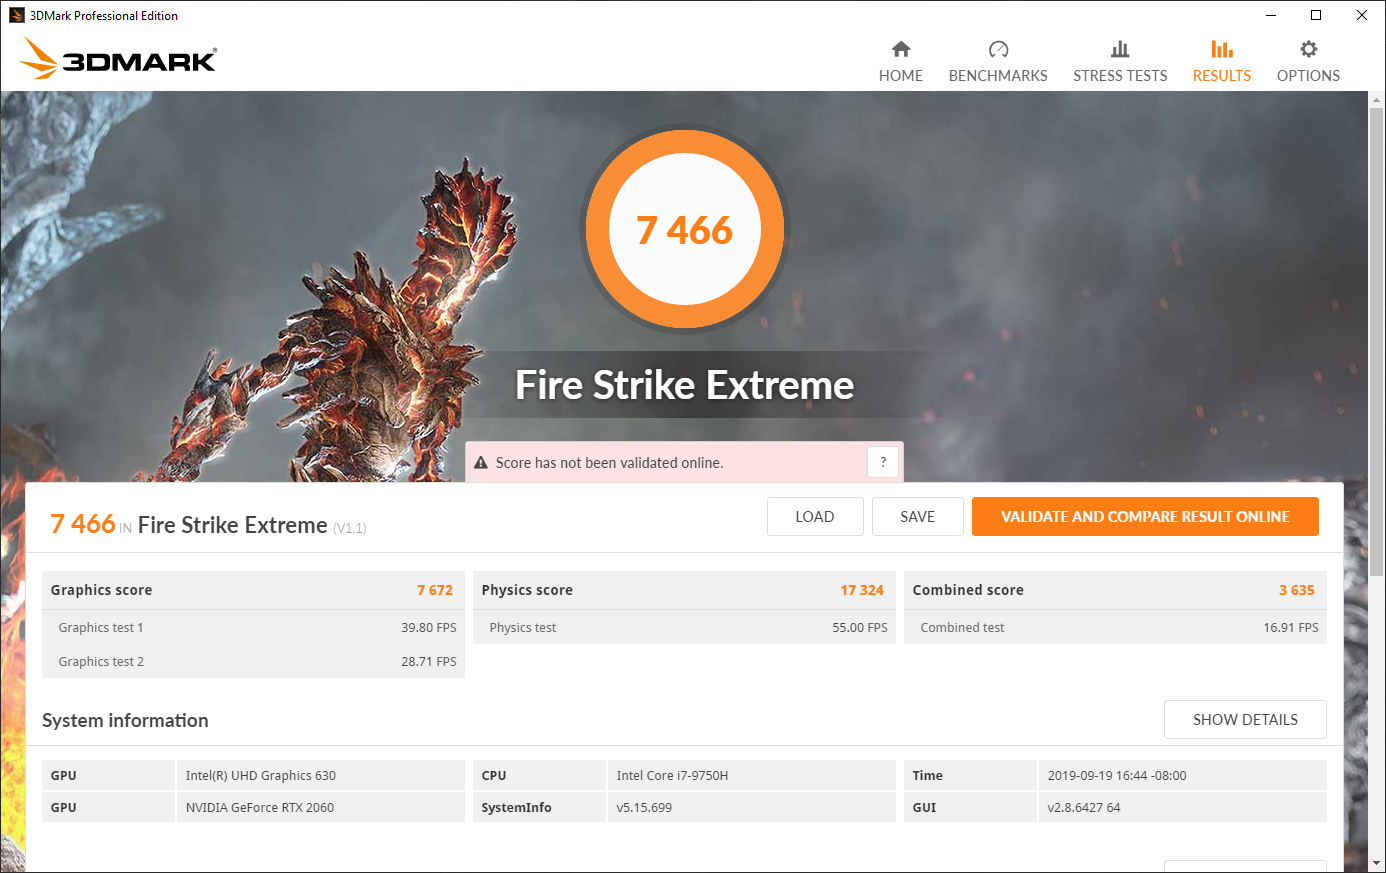
In similar fashion to the CPU, the Nvidia GeForce RTX 2060 in the GL75 performs a bit above average. Compared to other laptops using the RTX 2060, the GL75 scores about 3-5% better 3DMark 11 and 3DMark's various benchmarks. The GL75 is even able to keep up with the RTX 2070 Max-Q-equipped Omen X 2S. As we will see below, this translates into competent gaming performance. As such, the GL75 can take advantage of its 120 Hz display.
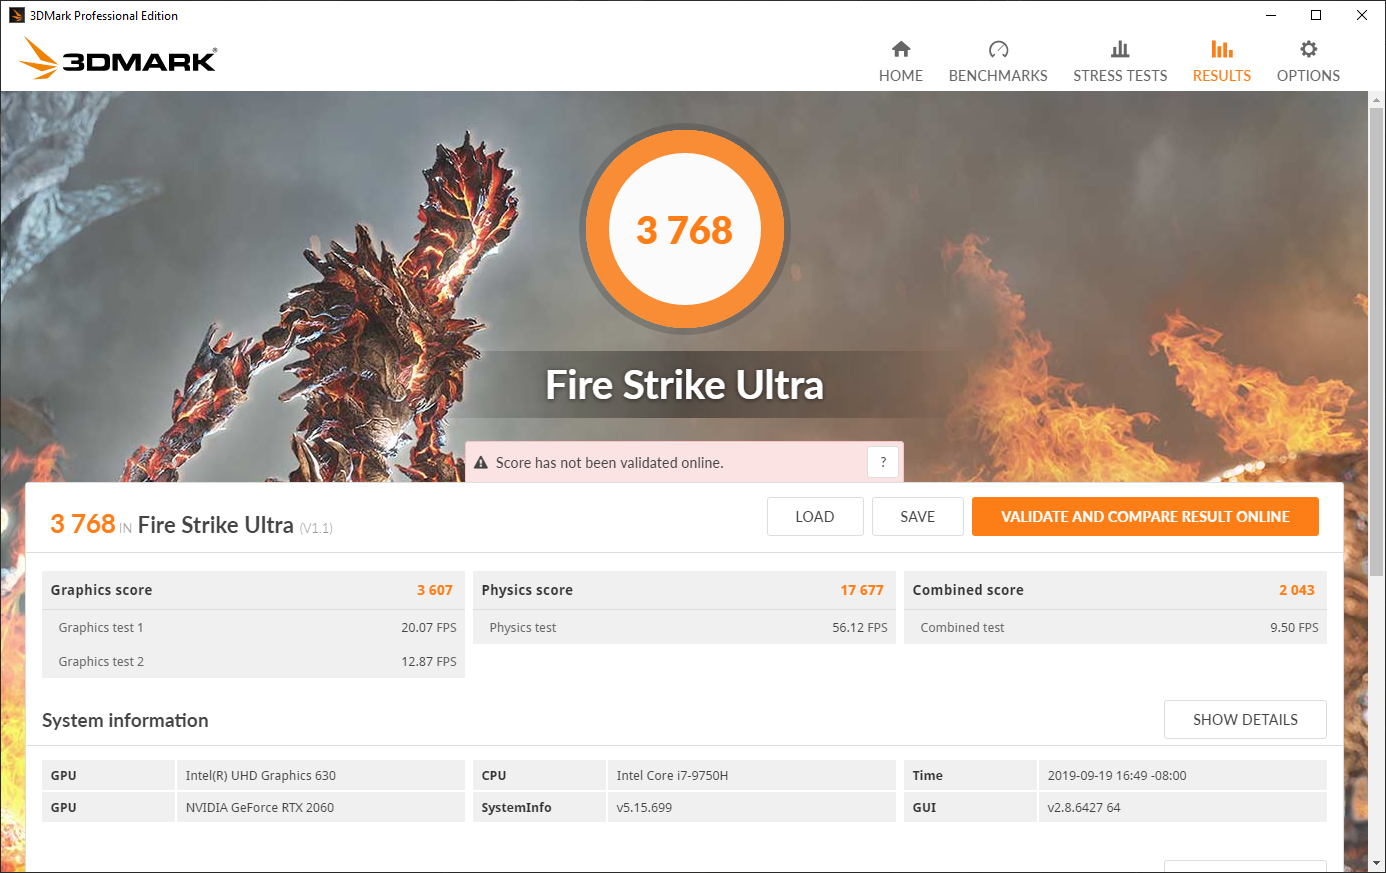
| 3DMark 11 Performance | 18769 points | |
| 3DMark Cloud Gate Standard Score | 38284 points | |
| 3DMark Fire Strike Score | 15035 points | |
| 3DMark Time Spy Score | 6245 points | |
Help | ||
Gaming Performance
The GL75 is perfectly suited for gaming at FHD/High settings. Thanks to the excellent performance of the machine's RTX 2060, games can push past 60 fps. In particular, competitive titles like Rocket League, DOTA 2, and the like will greatly benefit from the fast 120 Hz display. Heavier titles like Shadow of the Tomb Raider aren't much of a problem at Full HD, but higher resolutions will require lower settings.
Long-term gaming performance is stable. Over an hour-long playthrough of The Witcher 3, we see neither unexpected frame drops nor spikes.
| low | med. | high | ultra | |
|---|---|---|---|---|
| The Witcher 3 (2015) | 262 | 182 | 115 | 58 |
| Rocket League (2017) | 252 | 249 | 246 | |
| Shadow of the Tomb Raider (2018) | 120 | 96 | 90 | 80 |
| F1 2019 (2019) | 209 | 166 | 138 | 99 |
Emissions
System Noise
While the internals of the MSI GL75 offer above-average performance, they generate a lot of heat. Because of this, fan noise and heat management are the machine's Achilles Heels. The fans get extremely loud when the machine is under full load, peaking at 53-54 dB(A). Additionally, their high pitch cuts through all ambient noises and shrilly pierces the user's ears. There is a manual "turbo" mode for the fans that forces them to run full-tilt all the time; while this mode helps cool the internals, it is (obviously) extremely noisy.
To further poison the well, there is noticeable coil whine. As such, the GL75 emits a subtle hum that can be heard in quiet environments like a library or office. The fans also spin up a slight bit under lighter loads (e.g., web browsing). The GL75 is constantly making some kind of noise, which can grow annoying in quiet rooms.
| MSI GL75 9SEK-056US GeForce RTX 2060 Mobile, i7-9750H, WDC PC SN520 SDAPNUW-512G | Asus Strix Hero III G731GV GeForce RTX 2060 Mobile, i7-9750H, Intel SSD 660p SSDPEKNW512G8 | MSI GL73 8SE-010US GeForce RTX 2060 Mobile, i7-8750H, Kingston RBUSNS8154P3128GJ | Acer Predator Helios 500 PH517-51-79BY GeForce GTX 1070 Mobile, i7-8750H, SK hynix SSD Canvas SC300 HFS256GD9MNE-6200A | HP Omen 17t-3AW55AV_1 GeForce GTX 1070 Mobile, i7-8750H, Samsung SSD PM981 MZVLB512HAJQ | HP Omen 15-dc1020ng GeForce GTX 1650 Mobile, i5-9300H, WDC PC SN720 SDAQNTW-512G | HP Pavilion Gaming 17-cd0085cl GeForce GTX 1660 Ti Max-Q, i7-9750H, Samsung SSD PM981 MZVLB256HAHQ | |
|---|---|---|---|---|---|---|---|
| Noise | -2% | -2% | -2% | 1% | 11% | 11% | |
| off / environment * (dB) | 28.1 | 28.2 -0% | 28.6 -2% | 30.4 -8% | 27.8 1% | 28.8 -2% | 28.2 -0% |
| Idle Minimum * (dB) | 30.9 | 29.5 5% | 33.8 -9% | 31.2 -1% | 31.1 -1% | 28.8 7% | 30.1 3% |
| Idle Average * (dB) | 30.9 | 30.3 2% | 34 -10% | 35.3 -14% | 31.1 -1% | 29.5 5% | 30.1 3% |
| Idle Maximum * (dB) | 31 | 31.9 -3% | 34.1 -10% | 35.3 -14% | 35 -13% | 31.1 -0% | 30.1 3% |
| Load Average * (dB) | 39 | 50.4 -29% | 36.5 6% | 44.4 -14% | 42 -8% | 35.2 10% | 34.2 12% |
| Witcher 3 ultra * (dB) | 53.5 | 50.1 6% | 47.8 11% | 41 23% | 44.5 17% | 35.2 34% | 34.2 36% |
| Load Maximum * (dB) | 53.5 | 50.1 6% | 52.2 2% | 45.2 16% | 46.5 13% | 41 23% | 43.8 18% |
* ... smaller is better
Noise level
| Idle |
| 30.9 / 30.9 / 31 dB(A) |
| Load |
| 39 / 53.5 dB(A) |
 | ||
30 dB silent 40 dB(A) audible 50 dB(A) loud |
||
min: | ||
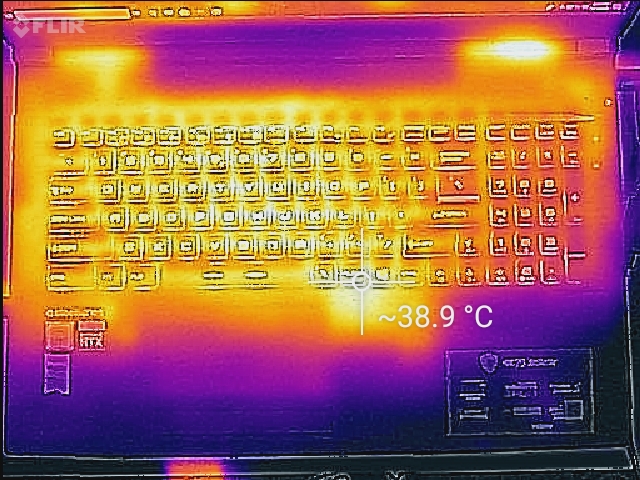
Temperature
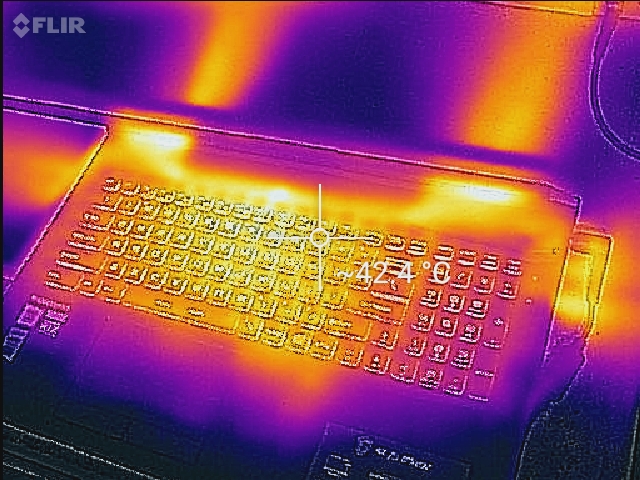
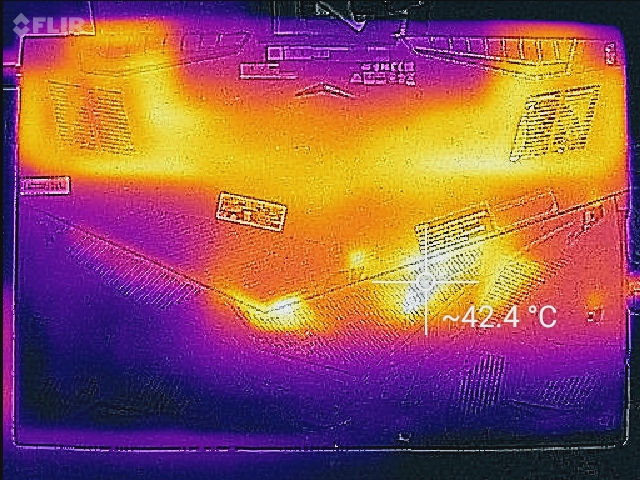
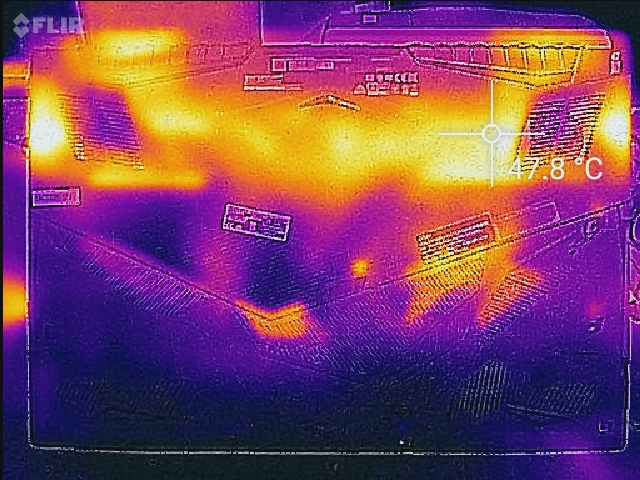
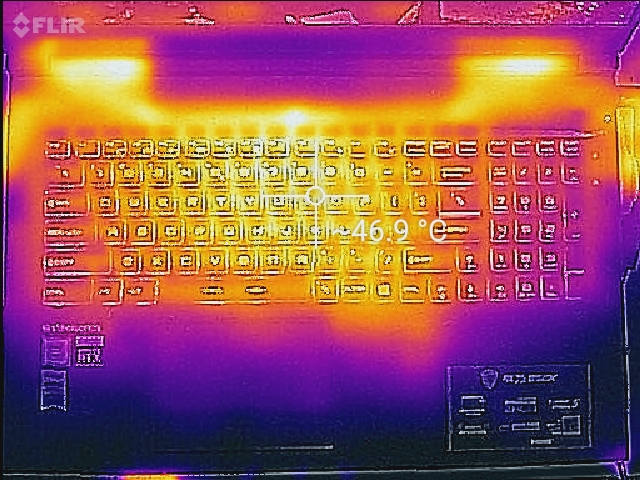
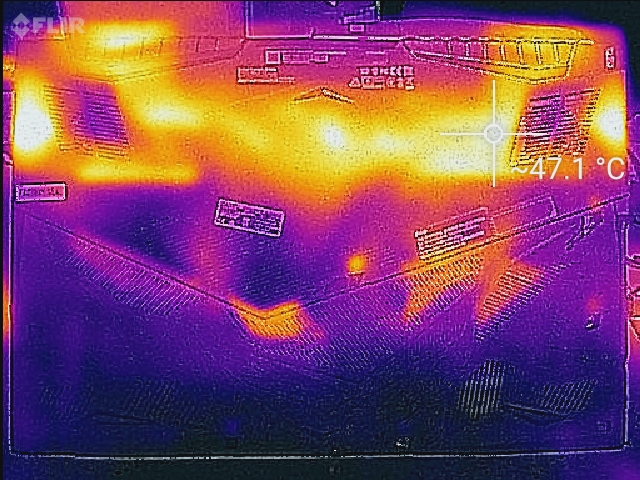
The MSI GL75 grows hot under load, despite the aggressive fans. In particular, the chassis directly above and below the rear vents becomes hot to the touch when pushing the machine. After about 10 minutes of heavy gaming, these points can grow uncomfortable. Thankfully, the cooling system draws heat away from the WASD keys and number pad, which is where hands are likely to rest during gameplay; these areas only get a slight bit warmer than room temperature. The bottom gets too hot for lap gaming; a table or other hard, flat surface is recommended.
(-) The maximum temperature on the upper side is 49.4 °C / 121 F, compared to the average of 40.4 °C / 105 F, ranging from 21.2 to 68.8 °C for the class Gaming.
(-) The bottom heats up to a maximum of 50.6 °C / 123 F, compared to the average of 43.2 °C / 110 F
(±) In idle usage, the average temperature for the upper side is 35 °C / 95 F, compared to the device average of 33.9 °C / 93 F.
(-) Playing The Witcher 3, the average temperature for the upper side is 39.2 °C / 103 F, compared to the device average of 33.9 °C / 93 F.
(+) The palmrests and touchpad are cooler than skin temperature with a maximum of 31.6 °C / 88.9 F and are therefore cool to the touch.
(-) The average temperature of the palmrest area of similar devices was 28.8 °C / 83.8 F (-2.8 °C / -5.1 F).

Stress Test
Under stress, the GL75 performs fairly well. Running Prime95 for an hour to full strain the CPU, the 9750H averages 3.6 GHz, though it gets fairly hot (87° C) to maintain this speed. The GPU, however, keeps its cool under stress (one hour of FurMark), keeping an average clock of 1300 MHz while temperatures hover around 58° C. These numbers hold when running Prime95 and FurMark concurrently, though the CPU throttles back a slight bit to 2.8 GHz. Even under the heavy load, the CPU is able to intermittently boost to 4.0 GHz, though it cannot hold this clock for long.
Gaming stress presents no problems. After an hour-long session of The Witcher 3, the CPU and GPU were able to boost near their rated maximums. Temperatures were well-controlled (66° C and 59° C respectively), likely due to the aggressive fan profile.


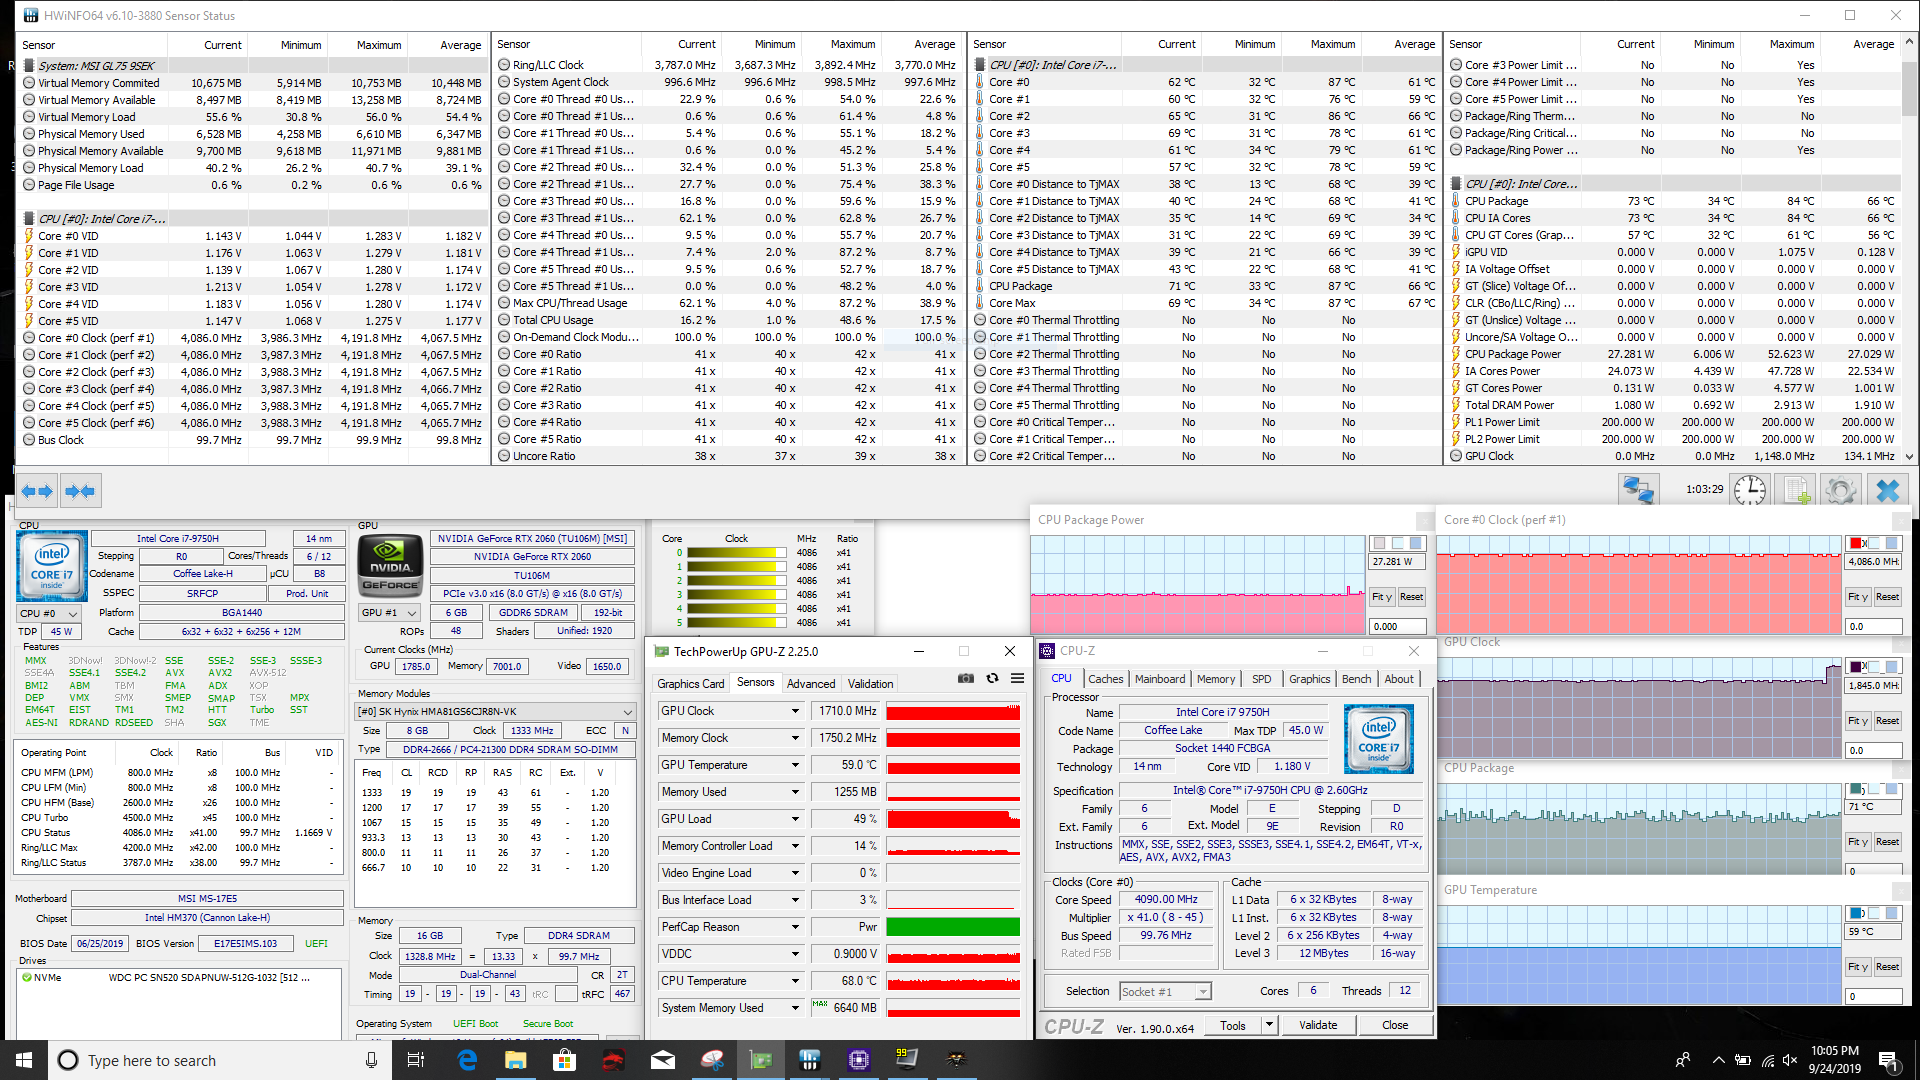
| CPU Clock (GHz) | GPU Clock (MHz) | Average CPU Temperature (°C) | Average GPU Temperature (°C) | |
| Prime95 Stress | 3.6 | - | 87 | - |
| FurMark Stress | 4.2 | 1300 | 55 | 58 |
| Prime95 + FurMark Stress | 2.8 | 1335 | 74 | 58 |
| Witcher 3 Stress | 4.1 | 1550 | 66 | 59 |
Speakers

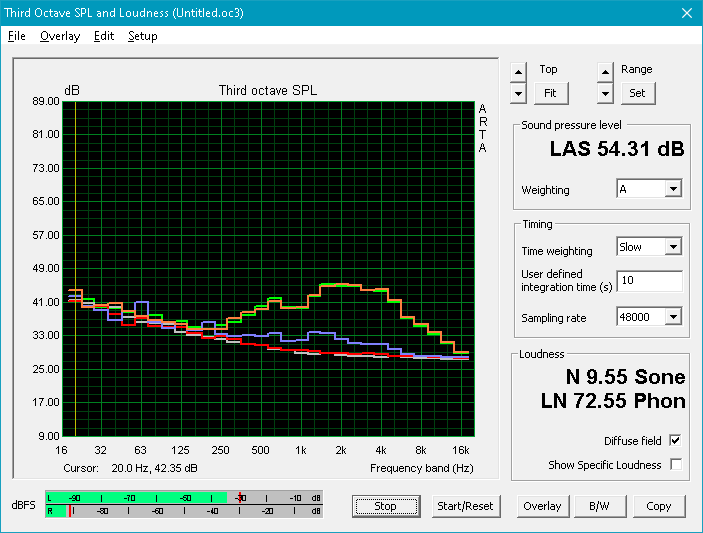
One area MSI has seemingly invested in is speaker quality. We have seen great results from MSI mid-rangers, and the GL75 further solidifies that trend. The dual 3 Watt speakers get loud (82 dB) and remain clear at all volumes. While bass is thin, it is at least present. Mids and highs are well-balanced. The overall sound profile tends high but is fuller than the tinny speakers typical of laptops at or below this price point. Sadly, the dedicated headphone jack does not support S/PDIF or HiFi audio output, although MSI advertises an onboard amp that can boost volume up to an additional 30%. The GL75 also include the Nahimic sound software common to MSI laptops.
MSI GL75 9SEK-056US audio analysis
(±) | speaker loudness is average but good (81.7 dB)
Bass 100 - 315 Hz
(-) | nearly no bass - on average 19% lower than median
(±) | linearity of bass is average (10.3% delta to prev. frequency)
Mids 400 - 2000 Hz
(+) | balanced mids - only 2.9% away from median
(+) | mids are linear (6.7% delta to prev. frequency)
Highs 2 - 16 kHz
(+) | balanced highs - only 1.5% away from median
(+) | highs are linear (3.4% delta to prev. frequency)
Overall 100 - 16.000 Hz
(+) | overall sound is linear (14.5% difference to median)
Compared to same class
» 27% of all tested devices in this class were better, 7% similar, 66% worse
» The best had a delta of 6%, average was 18%, worst was 132%
Compared to all devices tested
» 18% of all tested devices were better, 4% similar, 78% worse
» The best had a delta of 4%, average was 24%, worst was 134%
Asus Strix Hero III G731GV audio analysis
(±) | speaker loudness is average but good (81 dB)
Bass 100 - 315 Hz
(±) | reduced bass - on average 6.6% lower than median
(±) | linearity of bass is average (11.8% delta to prev. frequency)
Mids 400 - 2000 Hz
(+) | balanced mids - only 2.8% away from median
(+) | mids are linear (6.7% delta to prev. frequency)
Highs 2 - 16 kHz
(+) | balanced highs - only 1.8% away from median
(+) | highs are linear (5.4% delta to prev. frequency)
Overall 100 - 16.000 Hz
(+) | overall sound is linear (13.4% difference to median)
Compared to same class
» 19% of all tested devices in this class were better, 7% similar, 74% worse
» The best had a delta of 6%, average was 18%, worst was 132%
Compared to all devices tested
» 14% of all tested devices were better, 4% similar, 83% worse
» The best had a delta of 4%, average was 24%, worst was 134%
HP Omen 17t-3AW55AV_1 audio analysis
(±) | speaker loudness is average but good (72.8 dB)
Bass 100 - 315 Hz
(-) | nearly no bass - on average 17.6% lower than median
(±) | linearity of bass is average (14.3% delta to prev. frequency)
Mids 400 - 2000 Hz
(+) | balanced mids - only 2% away from median
(+) | mids are linear (5.2% delta to prev. frequency)
Highs 2 - 16 kHz
(+) | balanced highs - only 2.4% away from median
(+) | highs are linear (6.5% delta to prev. frequency)
Overall 100 - 16.000 Hz
(±) | linearity of overall sound is average (16% difference to median)
Compared to same class
» 38% of all tested devices in this class were better, 6% similar, 55% worse
» The best had a delta of 6%, average was 18%, worst was 132%
Compared to all devices tested
» 25% of all tested devices were better, 5% similar, 70% worse
» The best had a delta of 4%, average was 24%, worst was 134%
Energy Management
Power Consumption
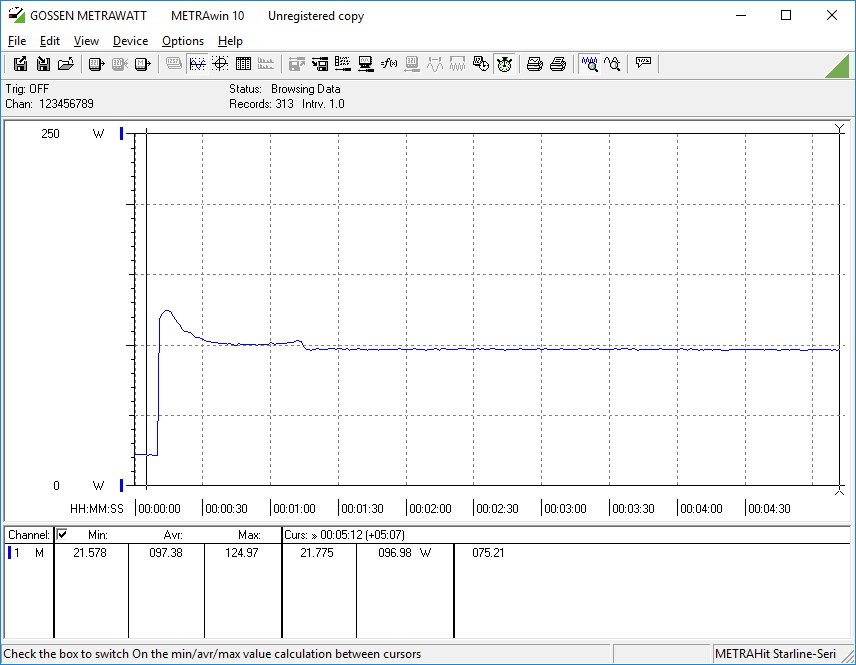
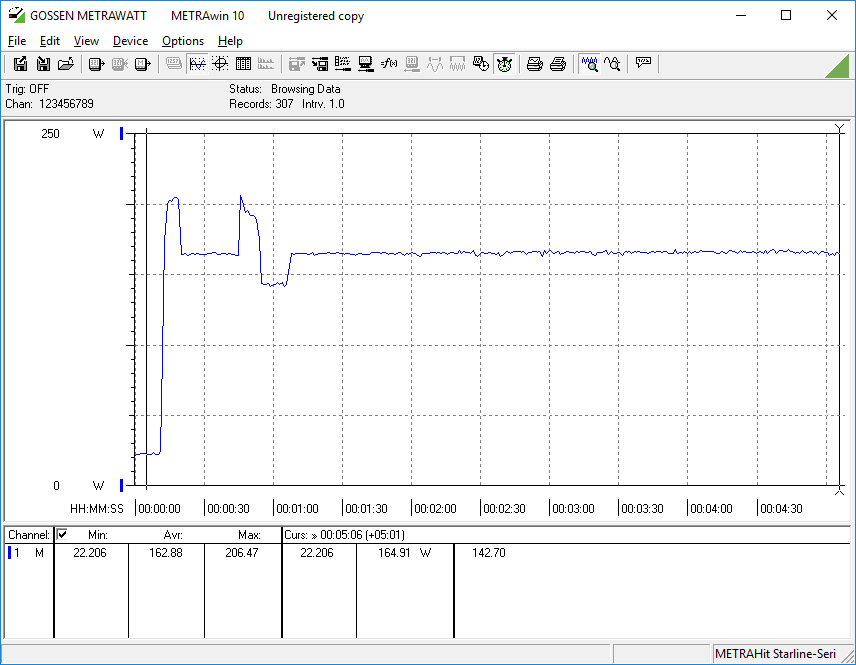
Power draw is on the higher side for an RTX 2060 but is largely within expectation. We observe brief spikes past 200 Watts at the beginning of our load test, which is higher than the 180 Watt rating of the included power supply. However, these are brief and should not present problems. Under more normal loads (e.g., gaming), the laptop draws about 150 Watts (83% of the power adapter's rating).


| Off / Standby | |
| Idle | |
| Load |
|
Key:
min: | |
| MSI GL75 9SEK-056US i7-9750H, GeForce RTX 2060 Mobile, WDC PC SN520 SDAPNUW-512G, IPS, 1920x1080, 17.3" | Asus Strix Hero III G731GV i7-9750H, GeForce RTX 2060 Mobile, Intel SSD 660p SSDPEKNW512G8, IPS, 1920x1080, 17.3" | MSI GL73 8SE-010US i7-8750H, GeForce RTX 2060 Mobile, Kingston RBUSNS8154P3128GJ, TN LED, 1920x1080, 17.3" | Acer Predator Helios 500 PH517-51-79BY i7-8750H, GeForce GTX 1070 Mobile, SK hynix SSD Canvas SC300 HFS256GD9MNE-6200A, IPS, 1920x1080, 17.3" | HP Omen 17t-3AW55AV_1 i7-8750H, GeForce GTX 1070 Mobile, Samsung SSD PM981 MZVLB512HAJQ, IPS, 1920x1080, 17.3" | HP Omen 15-dc1020ng i5-9300H, GeForce GTX 1650 Mobile, WDC PC SN720 SDAQNTW-512G, IPS, 1920x1080, 15.6" | HP Pavilion Gaming 17-cd0085cl i7-9750H, GeForce GTX 1660 Ti Max-Q, Samsung SSD PM981 MZVLB256HAHQ, IPS, 1920x1080, 17.3" | |
|---|---|---|---|---|---|---|---|
| Power Consumption | -37% | 4% | -58% | -37% | 38% | 26% | |
| Idle Minimum * (Watt) | 10.7 | 16.2 -51% | 8.8 18% | 20.4 -91% | 17.8 -66% | 4.04 62% | 5.4 50% |
| Idle Average * (Watt) | 15.2 | 24.8 -63% | 16.2 -7% | 26.5 -74% | 24.7 -63% | 7.2 53% | 9.2 39% |
| Idle Maximum * (Watt) | 17.8 | 28.6 -61% | 18.3 -3% | 37 -108% | 29.6 -66% | 11.4 36% | 13 27% |
| Load Average * (Watt) | 88.2 | 127.6 -45% | 86.1 2% | 129 -46% | 110 -25% | 80.8 8% | 85.9 3% |
| Witcher 3 ultra * (Watt) | 147.8 | 147.1 -0% | 146.7 1% | 186 -26% | 167.8 -14% | 93.6 37% | 107.9 27% |
| Load Maximum * (Watt) | 206.5 | 212.7 -3% | 186.4 10% | 216 -5% | 178.6 14% | 144.5 30% | 182.2 12% |
* ... smaller is better
Battery Life
Unsurprisingly, the 51 Wh battery doesn't last very long when gaming unplugged; users can expect about an hour of heavy use before the GL75 dies. Battery life with more general use is decent; the machine lasted just over four hours in our WiFi v1.3 battery test (screen set to 150 nits, Balanced power profile, opening a new web page every 30-40 seconds). With the keyboard backlight turned off and the screen fully dimmed, the GL75 can manage almost eight hours of use. While users can do some work on the go, the power adapter will need to be close at hand for longer workdays or heavier loads.
| MSI GL75 9SEK-056US i7-9750H, GeForce RTX 2060 Mobile, 51 Wh | MSI GL73 8SE-010US i7-8750H, GeForce RTX 2060 Mobile, 41 Wh | Acer Predator Helios 500 PH517-51-79BY i7-8750H, GeForce GTX 1070 Mobile, 72 Wh | HP Omen 17t-3AW55AV_1 i7-8750H, GeForce GTX 1070 Mobile, 86 Wh | HP Pavilion Gaming 17-cd0085cl i7-9750H, GeForce GTX 1660 Ti Max-Q, 52.5 Wh | Asus Strix Hero III G731GV i7-9750H, GeForce RTX 2060 Mobile, 66 Wh | |
|---|---|---|---|---|---|---|
| Battery runtime | -30% | -9% | 6% | 28% | 7% | |
| Reader / Idle (h) | 7.9 | 6.5 -18% | 4.2 -47% | 4.5 -43% | 11.6 47% | |
| WiFi v1.3 (h) | 4.2 | 2.8 -33% | 2.9 -31% | 4.2 0% | 5.7 36% | 4.5 7% |
| Load (h) | 1 | 0.6 -40% | 1.5 50% | 1.6 60% | 1 0% | |
| Witcher 3 ultra (h) | 1.1 |
Pros
Cons
Verdict

The MSI GL75 is perhaps the definition of a mixed bag. For US $1500, there are quite a few things to like about the machine. The 120 Hz refresh rate of the display pairs well with the powerful hardware to make a great FHD gaming machine. The excellent keyboard and its per-key RGB backlight are excellent touches at this price point, and the speakers make media consumption enjoyable.
However, a few hangups and annoyances hurt the laptop and keep it from excellence. The fans are noisy, and hot spots along the base of the chassis make lap use uncomfortable. Further, the display's backlight is dim and dull.
Because of these sticking points, potential buyers will want to check out competitors. The Asus ROG Strix G GL731GU offers much better build quality, better heat management, and more even-pitched fans at the cost of a bit less graphical performance. MSI's own GP65 Leopard packs similar performance, the same keyboard, and a far superior display into a smaller package, though it also suffers from hot spots and shrill fans. These two devices prove that gamers aren't left wanting for options at this price point, making their decision all the more difficult.
Overall, the GL75 fails to "wow." The laptop is a fine machine, but unless you need a 17.3-inch gaming laptop with a good RGB keyboard and loud speakers, there are better options available.
MSI GL75 9SEK-056US
- 09/30/2019 v7 (old)
Sam Medley
Price comparison
