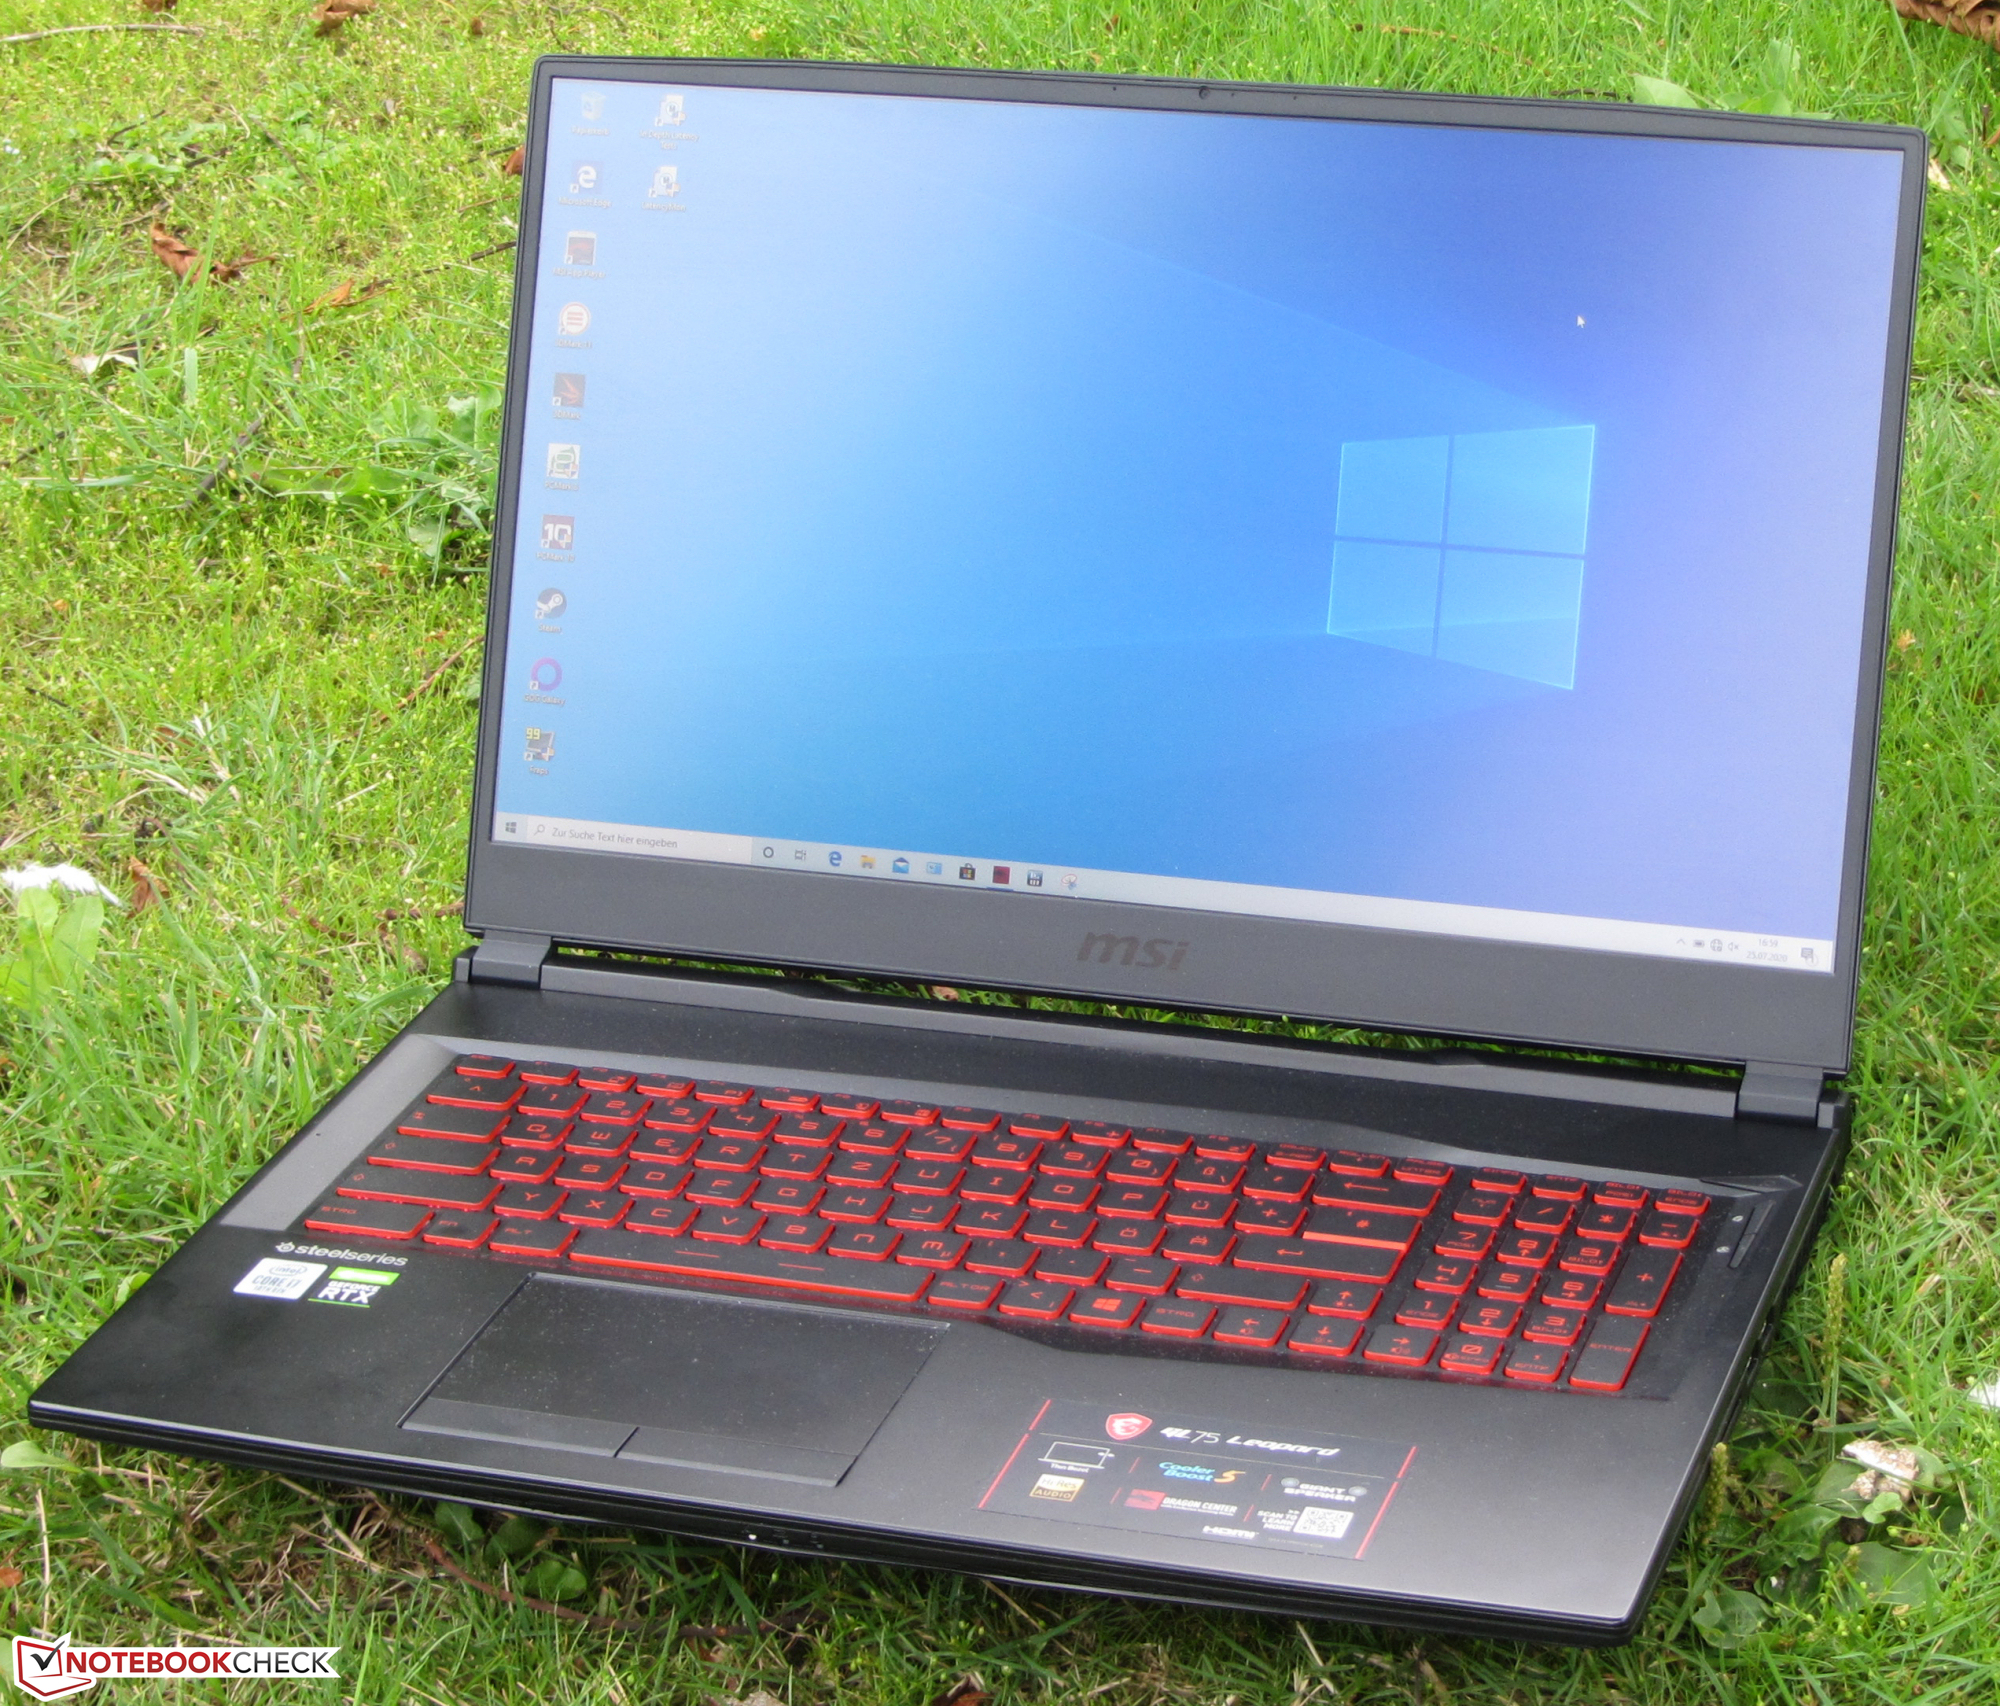
MSI GL75 Leopard in review: Successful gaming laptop with a 144 Hz display

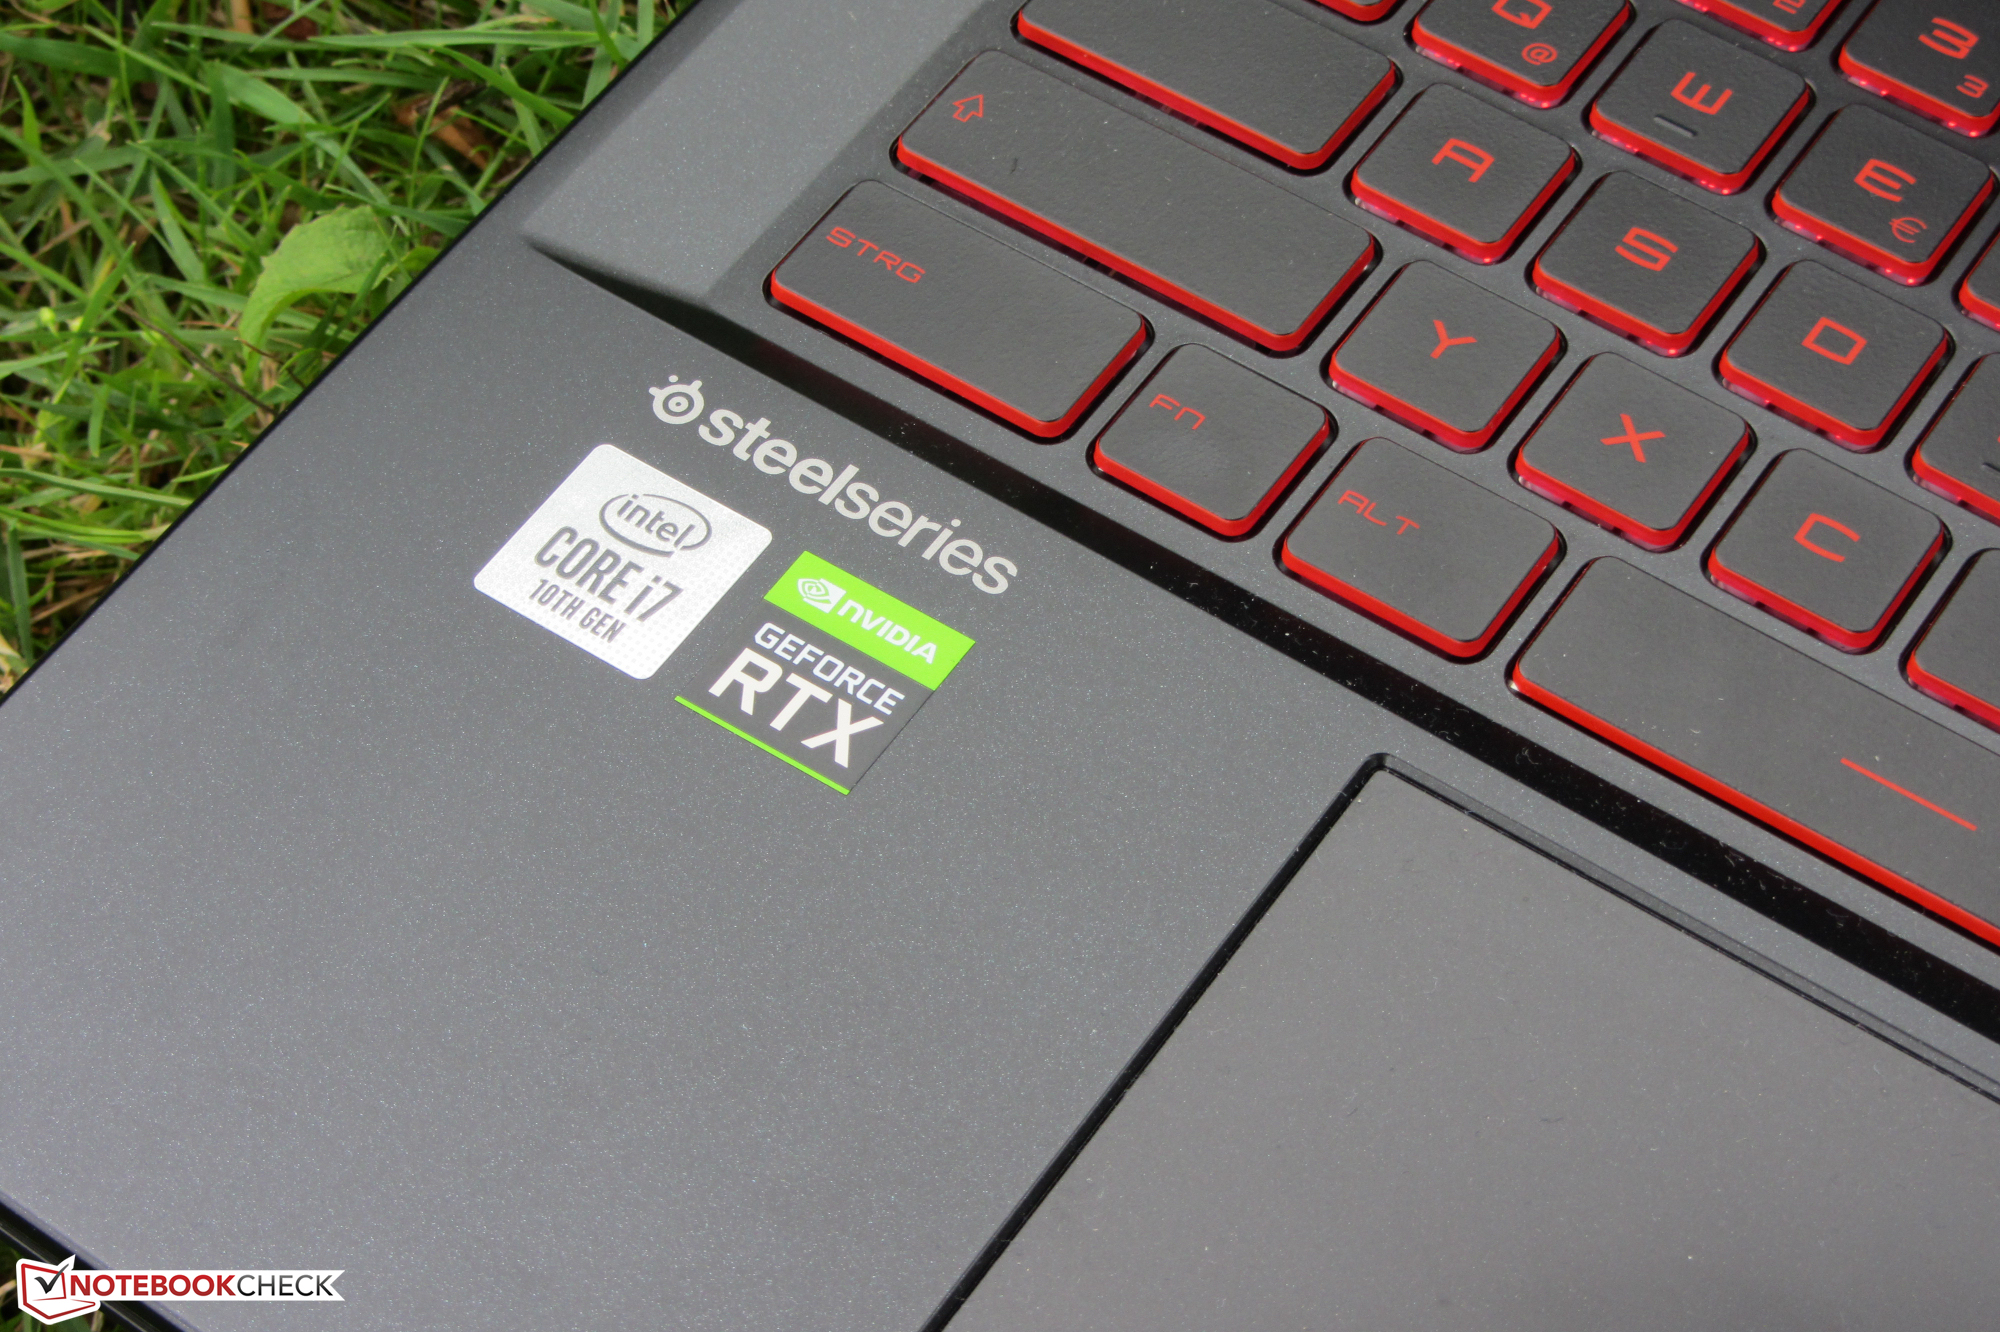
The MSI GL75 Leopard belongs to the gaming laptops in the 17.3-inch format. It's powered by a Core i7-10750H hexa-core processor and a GeForce RTX 2070 graphics core. The device is not unknown to us since it's the (largely) identical successor to the GL75 9SEK and the identical sibling model of the GP75 Leopard 9SD, respectively. Competitors include devices like the Acer Nitro 5 AN517-52, the Schenker XMG Neo 17, and the Lenovo Legion Y740-17IRHg.
Rating | Date | Model | Weight | Height | Size | Resolution | Price |
|---|---|---|---|---|---|---|---|
| 83.5 % v7 (old) | 08 / 2020 | MSI GL75 10SFR i7-10750H, GeForce RTX 2070 Mobile | 2.6 kg | 28 mm | 17.30" | 1920x1080 | |
| 80.6 % v7 (old) | 06 / 2020 | Acer Nitro 5 AN517-52-77DS i7-10750H, GeForce RTX 2060 Mobile | 2.2 kg | 24.9 mm | 17.30" | 1920x1080 | |
| 83.2 % v7 (old) | 11 / 2019 | Schenker XMG Neo 17 XNE17M19 i7-9750H, GeForce RTX 2060 Mobile | 2.5 kg | 27 mm | 17.30" | 1920x1080 | |
| 84 % v7 (old) | 03 / 2020 | Lenovo Legion Y740-17IRHg-81UJ001VGE i7-9750H, GeForce RTX 2080 Max-Q | 3 kg | 25.5 mm | 17.30" | 1920x1080 |
| SD Card Reader | |
| average JPG Copy Test (av. of 3 runs) | |
| Average of class Gaming (20.9 - 210, n=54, last 2 years) | |
| Schenker XMG Neo 17 (Toshiba Exceria Pro SDXC 64 GB UHS-II) | |
| Schenker XMG Neo 17 XNE17M19 (Toshiba Exceria Pro SDXC 64 GB UHS-II) | |
| MSI GP75 Leopard 9SD (Toshiba Exceria Pro SDXC 64 GB UHS-II) | |
| MSI GL75 9SEK-056US | |
| MSI GL75 10SFR (Toshiba Exceria Pro SDXC 64 GB UHS-II) | |
| maximum AS SSD Seq Read Test (1GB) | |
| Average of class Gaming (25.5 - 261, n=51, last 2 years) | |
| Schenker XMG Neo 17 (Toshiba Exceria Pro SDXC 64 GB UHS-II) | |
| Schenker XMG Neo 17 XNE17M19 (Toshiba Exceria Pro SDXC 64 GB UHS-II) | |
| MSI GL75 9SEK-056US | |
| MSI GP75 Leopard 9SD (Toshiba Exceria Pro SDXC 64 GB UHS-II) | |
| MSI GL75 10SFR (Toshiba Exceria Pro SDXC 64 GB UHS-II) | |


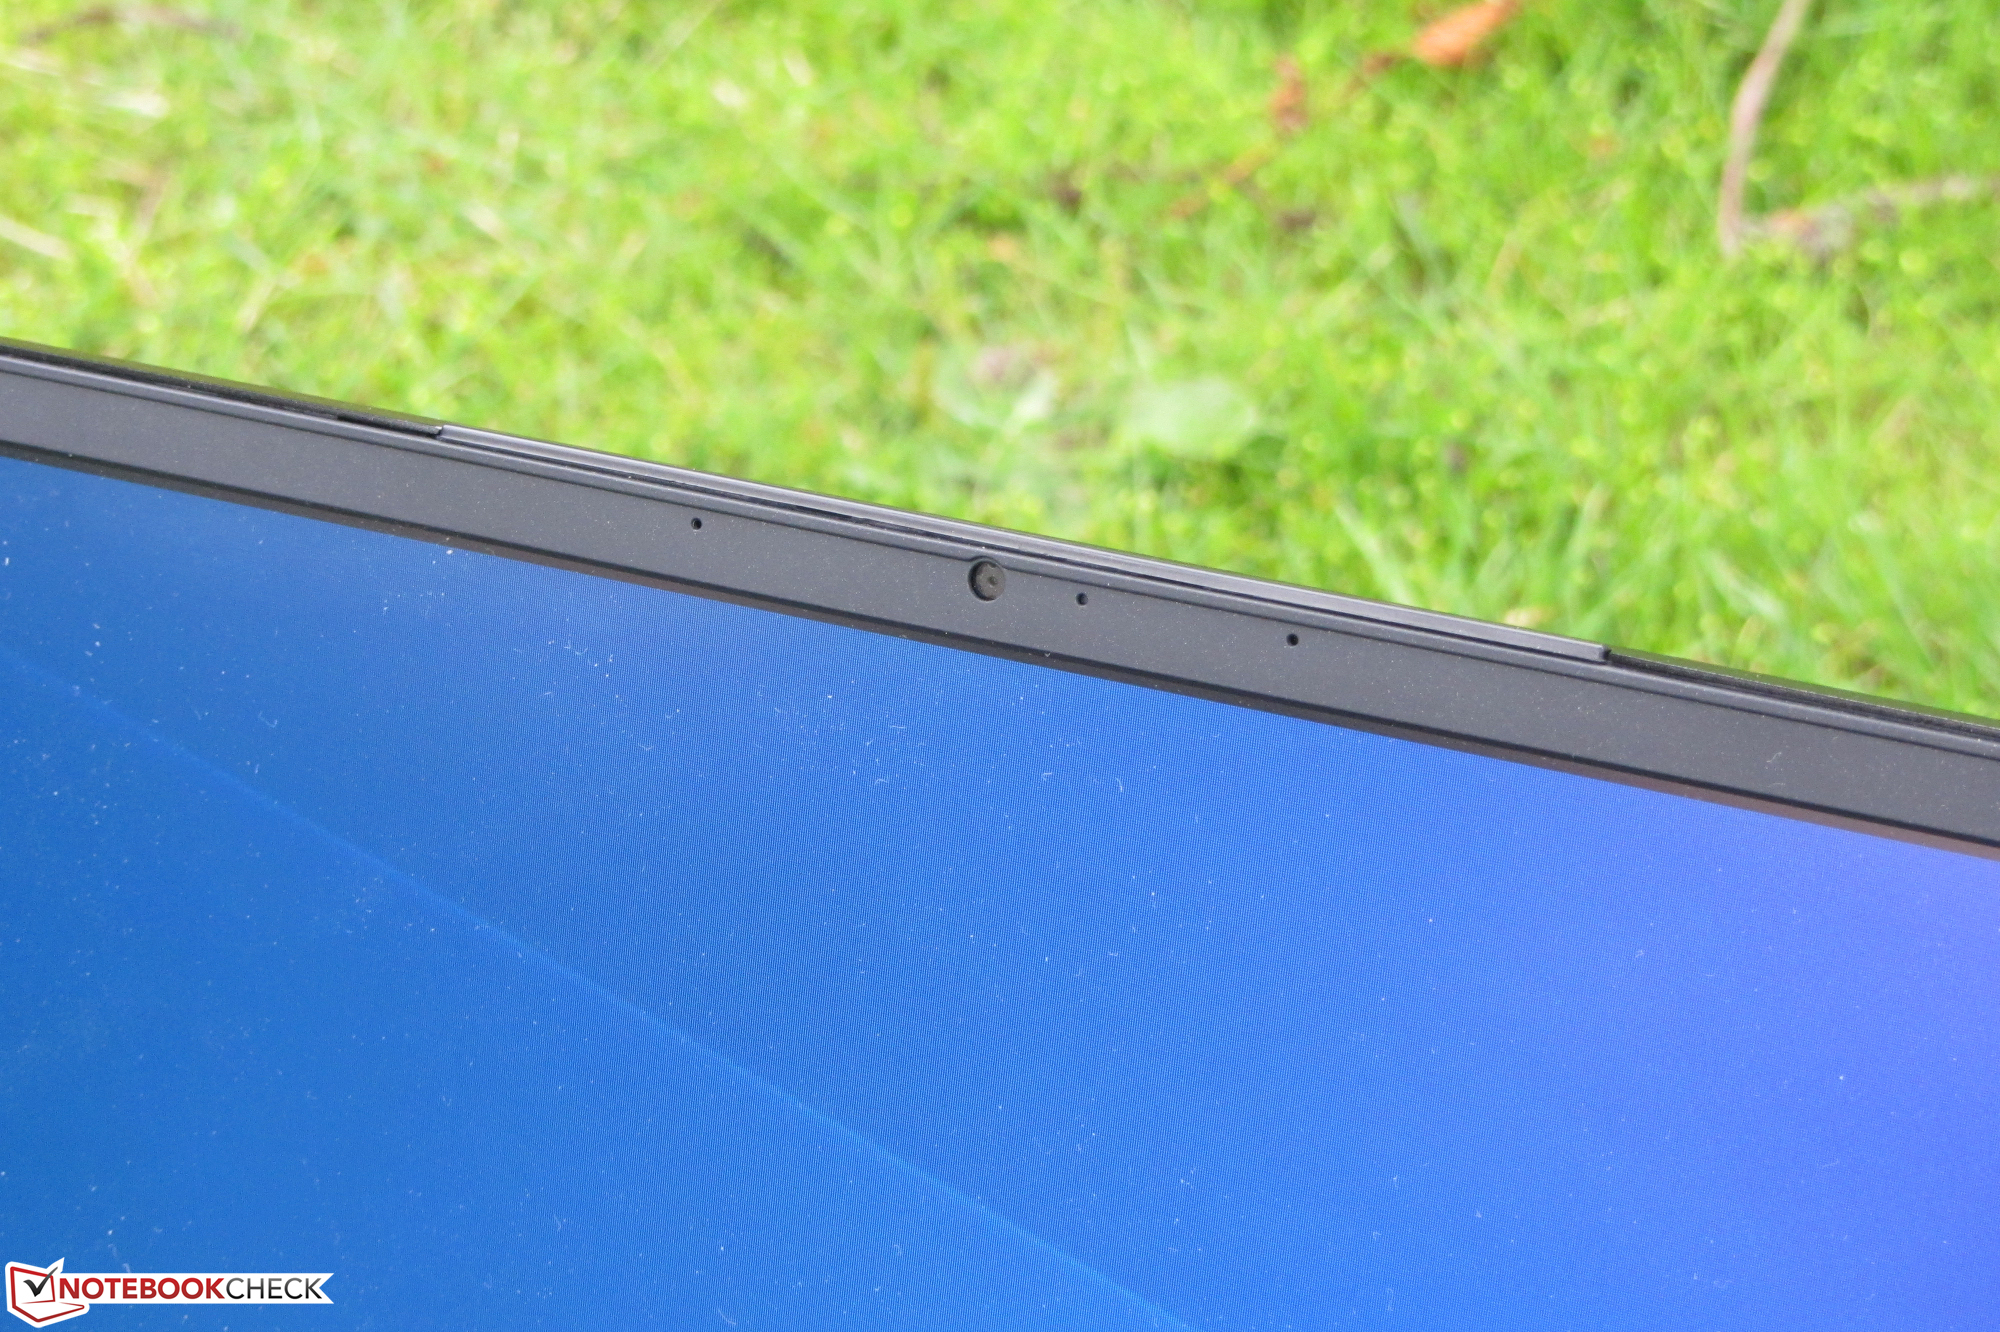
Display - Responsive, bright, high-contrast
The 17.3-inch display of the GL75 has a native resolution of 1920x1080 pixels. The brightness (308.7 cd/m²) and contrast (1,549:1) are within the target. In addition, the 144 Hz panel delivers good response times. Unfortunately, the display flickers at a frequency of 208 Hz at brightness levels of 30% and below. Due to the low frequency, sensitive users could experience headaches and/or eye problems.


| |||||||||||||||||||||||||
Brightness Distribution: 86 %
Center on Battery: 337 cd/m²
Contrast: 1549:1 (Black: 0.215 cd/m²)
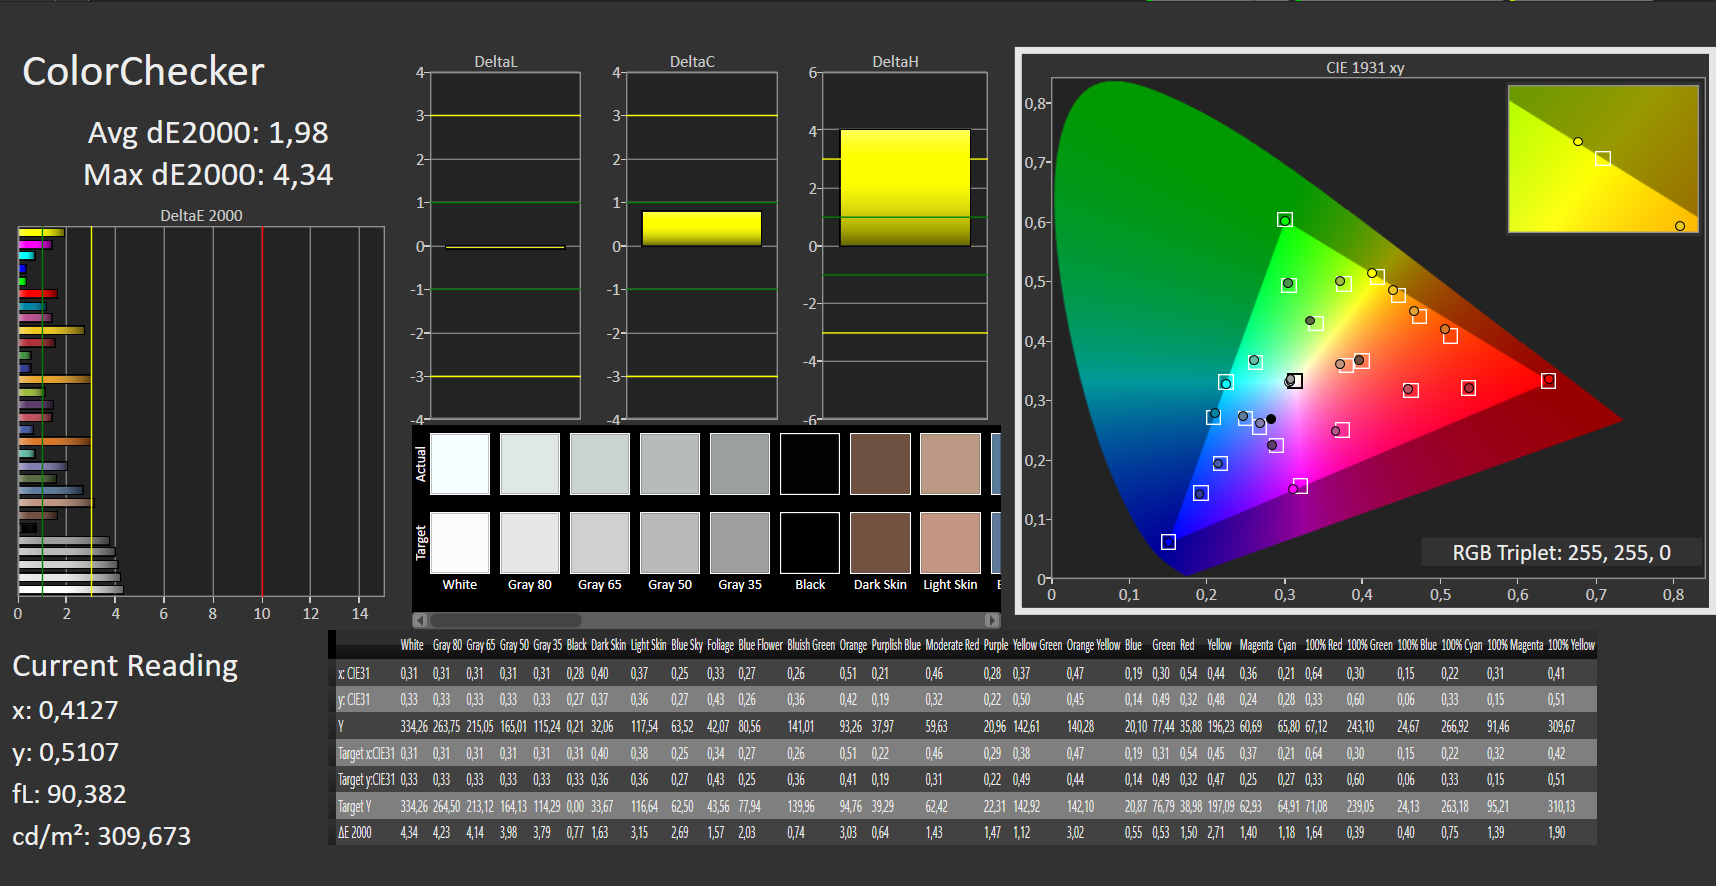
ΔE ColorChecker Calman: 1.98 | ∀{0.5-29.43 Ø4.72}
calibrated: 2.01
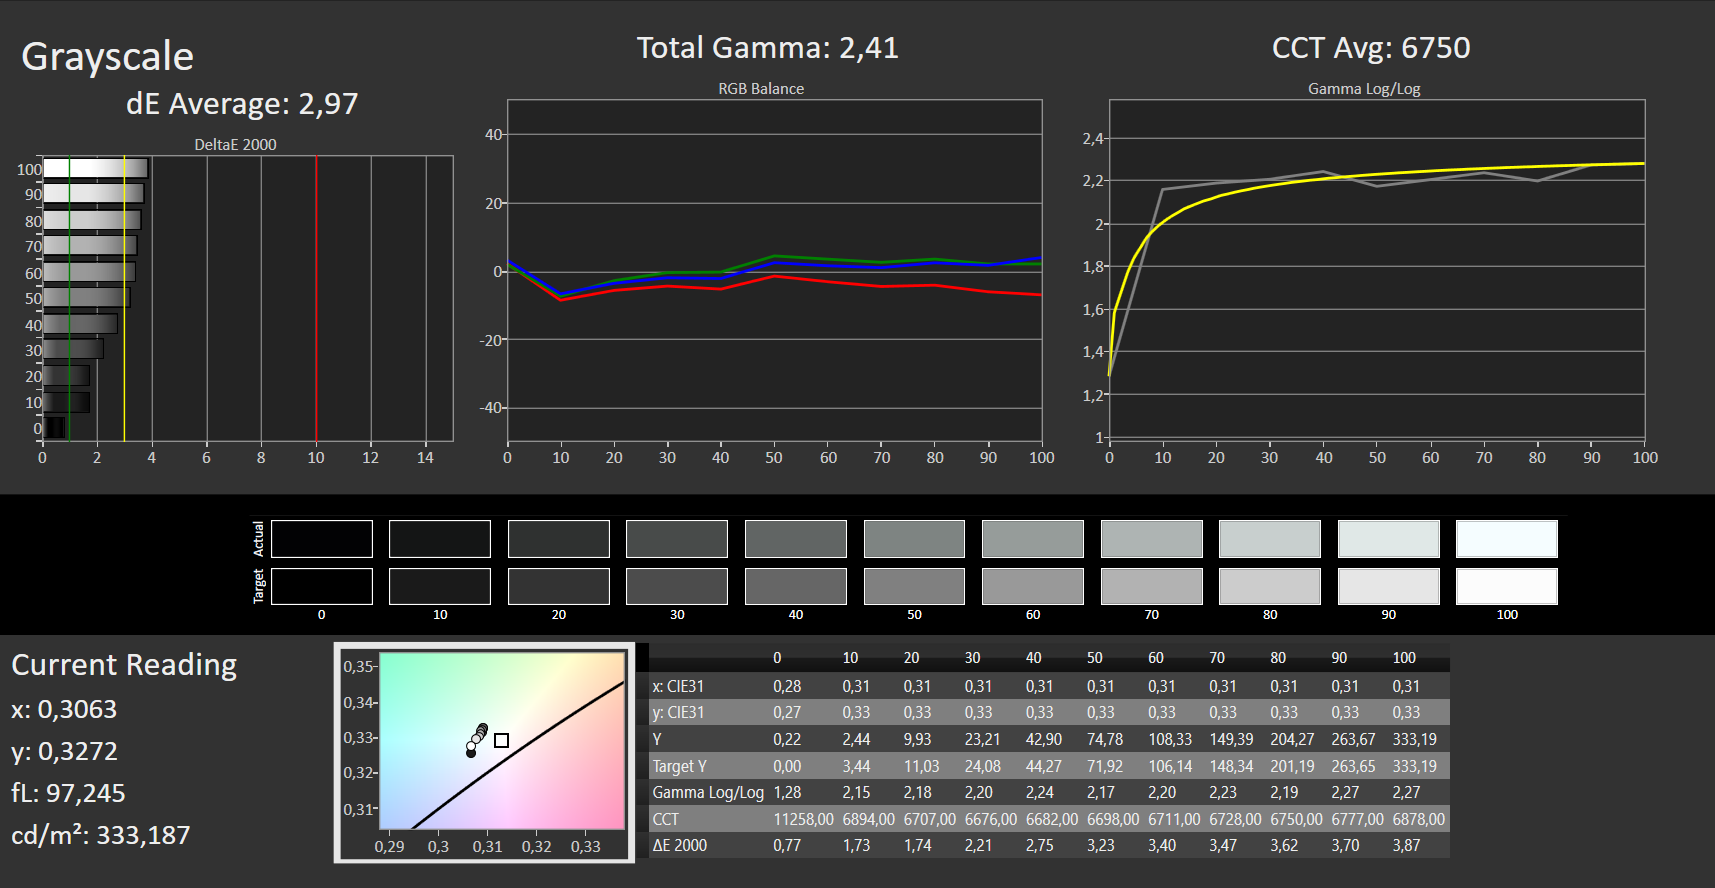
ΔE Greyscale Calman: 2.97 | ∀{0.09-98 Ø4.97}
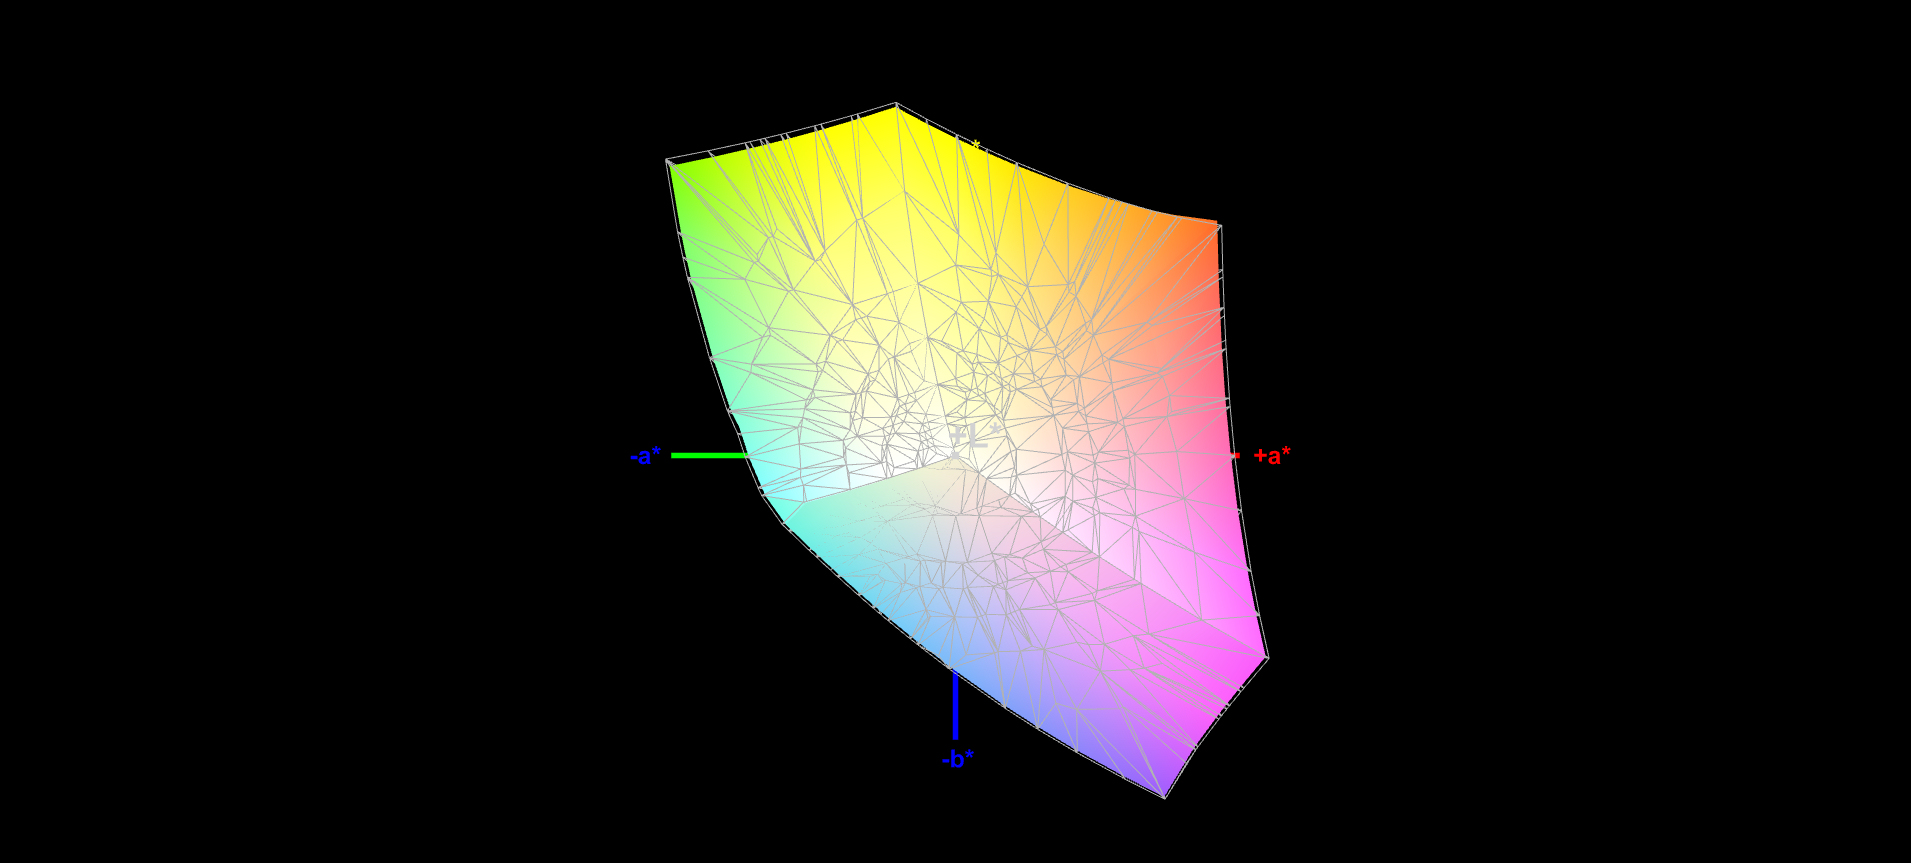
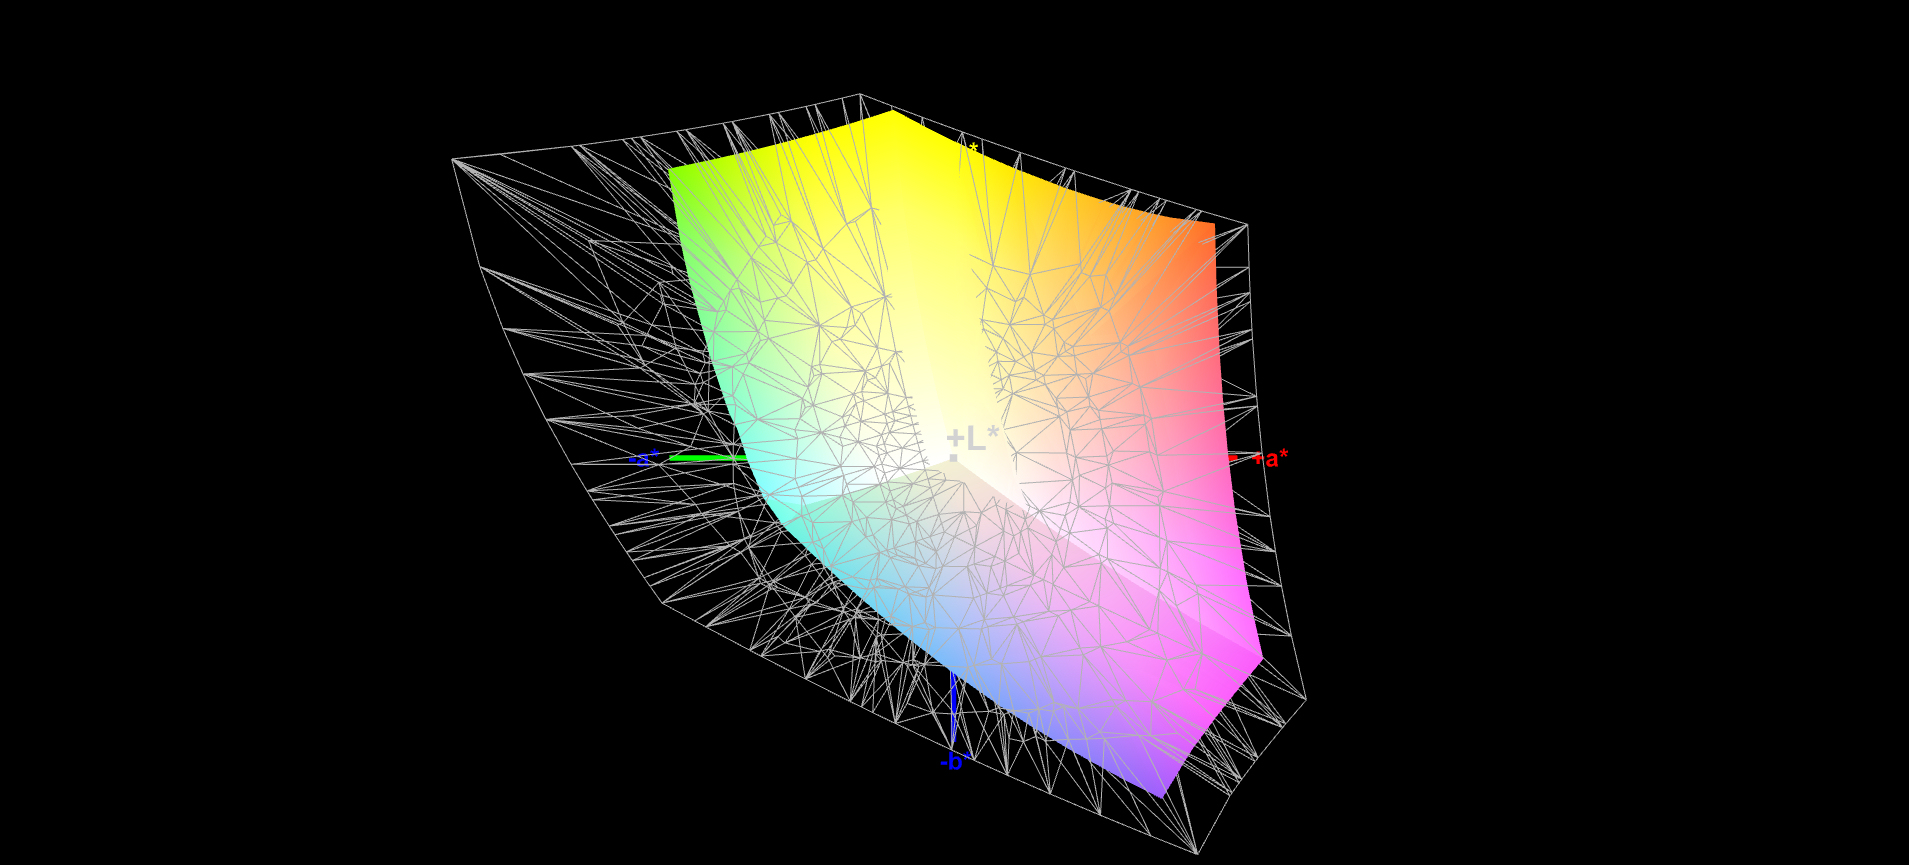
96% sRGB (Argyll 1.6.3 3D)
61% AdobeRGB 1998 (Argyll 1.6.3 3D)
66% AdobeRGB 1998 (Argyll 3D)
96.2% sRGB (Argyll 3D)
63.9% Display P3 (Argyll 3D)
Gamma: 2.41
CCT: 6750 K
| MSI GL75 10SFR Chi Mei N173HCE-G33, IPS, 1920x1080, 17.3" | Acer Nitro 5 AN517-52-77DS AU Optronics B173HAN04.7, IPS, 1920x1080, 17.3" | Schenker XMG Neo 17 XNE17M19 LG LP173WFG-SPB1 (LGD0615), IPS, 1920x1080, 17.3" | Lenovo Legion Y740-17IRHg-81UJ001VGE AUO_B173HAN03, IPS, 1920x1080, 17.3" | MSI GL75 9SEK-056US AU Optronics AUO479D (B173HAN04.7), IPS, 1920x1080, 17.3" | MSI GP75 Leopard 9SD Chi Mei N173HCE-G33 (CMN175C), IPS, 1920x1080, 17.3" | |
|---|---|---|---|---|---|---|
| Display | -38% | -0% | -2% | -36% | -1% | |
| Display P3 Coverage (%) | 63.9 | 39.47 -38% | 64.6 1% | 63.8 0% | 41.12 -36% | 63.4 -1% |
| sRGB Coverage (%) | 96.2 | 58.9 -39% | 95.6 -1% | 92.7 -4% | 61.1 -36% | 94.9 -1% |
| AdobeRGB 1998 Coverage (%) | 66 | 40.77 -38% | 65.6 -1% | 65.3 -1% | 42.49 -36% | 65.1 -1% |
| Response Times | -191% | -30% | -28% | -144% | 18% | |
| Response Time Grey 50% / Grey 80% * (ms) | 12 ? | 35 ? -192% | 15.6 ? -30% | 16 ? -33% | 26 ? -117% | 8 ? 33% |
| Response Time Black / White * (ms) | 9 ? | 26 ? -189% | 11.6 ? -29% | 11 ? -22% | 24.4 ? -171% | 8.8 ? 2% |
| PWM Frequency (Hz) | 208 ? | 25510 ? | ||||
| Screen | -87% | -27% | -33% | -67% | -9% | |
| Brightness middle (cd/m²) | 333 | 263 -21% | 318 -5% | 310 -7% | 259.1 -22% | 420 26% |
| Brightness (cd/m²) | 309 | 246 -20% | 286 -7% | 281 -9% | 261 -16% | 393 27% |
| Brightness Distribution (%) | 86 | 85 -1% | 86 0% | 85 -1% | 93 8% | 91 6% |
| Black Level * (cd/m²) | 0.215 | 0.47 -119% | 0.23 -7% | 0.31 -44% | 0.25 -16% | 0.32 -49% |
| Contrast (:1) | 1549 | 560 -64% | 1383 -11% | 1000 -35% | 1036 -33% | 1313 -15% |
| Colorchecker dE 2000 * | 1.98 | 5.07 -156% | 3.89 -96% | 3.86 -95% | 4.23 -114% | 3.04 -54% |
| Colorchecker dE 2000 max. * | 4.34 | 20.5 -372% | 10.56 -143% | 7.8 -80% | 23.39 -439% | 7.22 -66% |
| Colorchecker dE 2000 calibrated * | 2.01 | 4.9 -144% | 1.03 49% | 3.9 -94% | 0.89 56% | |
| Greyscale dE 2000 * | 2.97 | 2.55 14% | 5.3 -78% | 4.48 -51% | 1.3 56% | 3.91 -32% |
| Gamma | 2.41 91% | 2.37 93% | 2.46 89% | 2.5 88% | 2.076 106% | 2.26 97% |
| CCT | 6750 96% | 6446 101% | 7462 87% | 7542 86% | 6542 99% | 7138 91% |
| Color Space (Percent of AdobeRGB 1998) (%) | 61 | 37 -39% | 60 -2% | 60 -2% | 39 -36% | 60 -2% |
| Color Space (Percent of sRGB) (%) | 96 | 59 -39% | 96 0% | 93 -3% | 61 -36% | 95 -1% |
| Total Average (Program / Settings) | -105% /
-91% | -19% /
-23% | -21% /
-26% | -82% /
-71% | 3% /
-5% |
* ... smaller is better
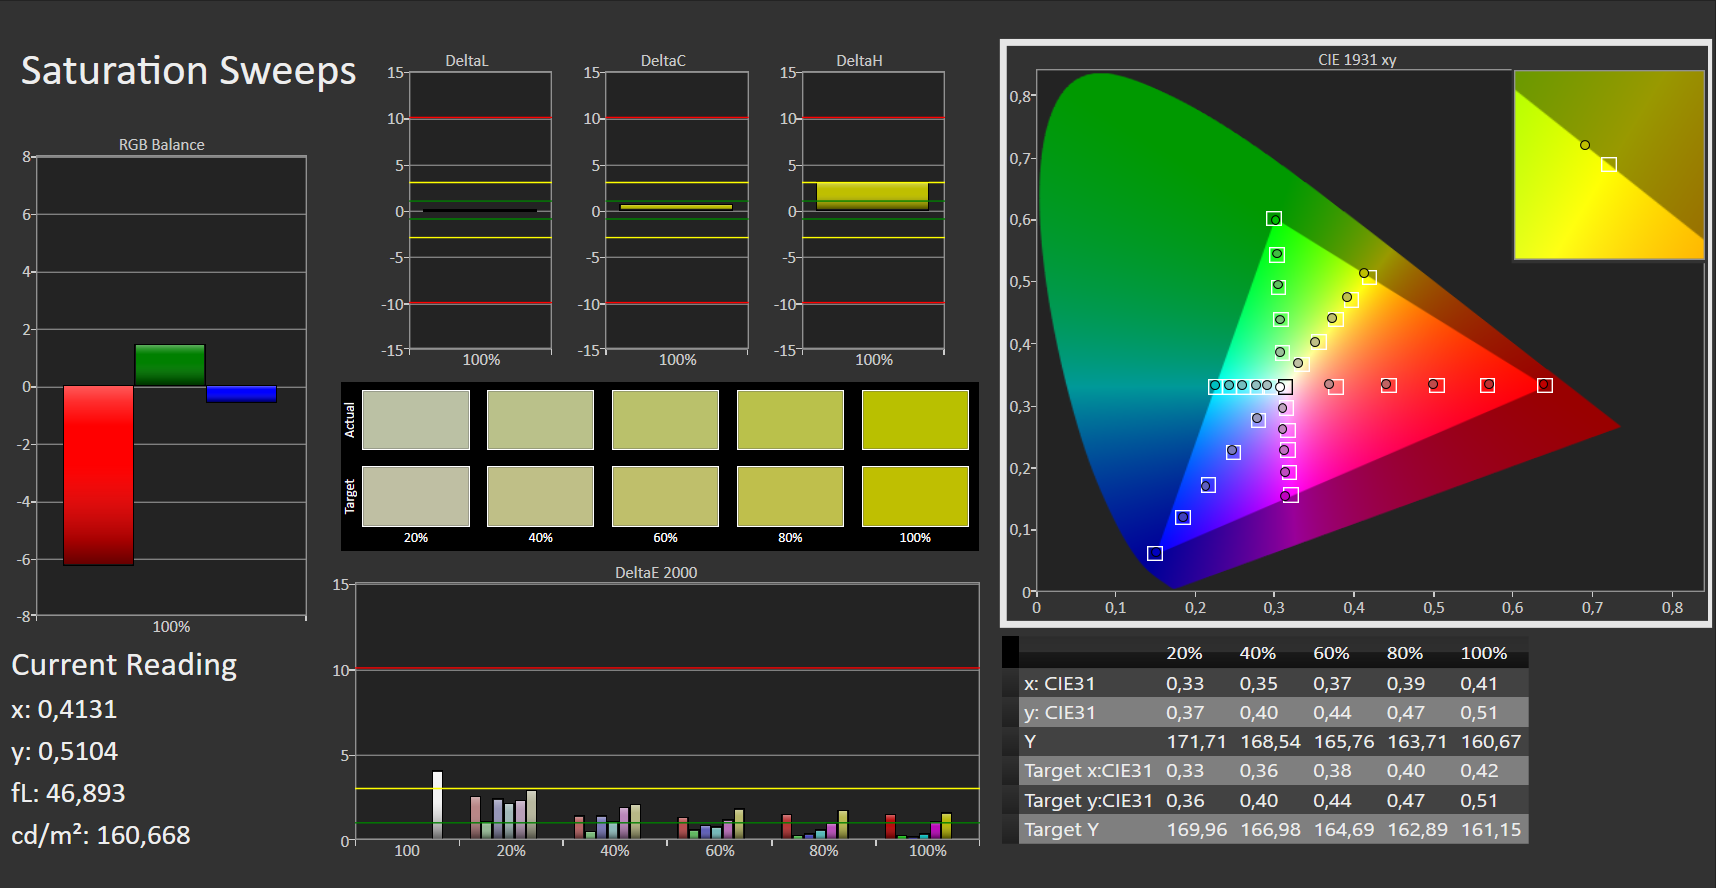
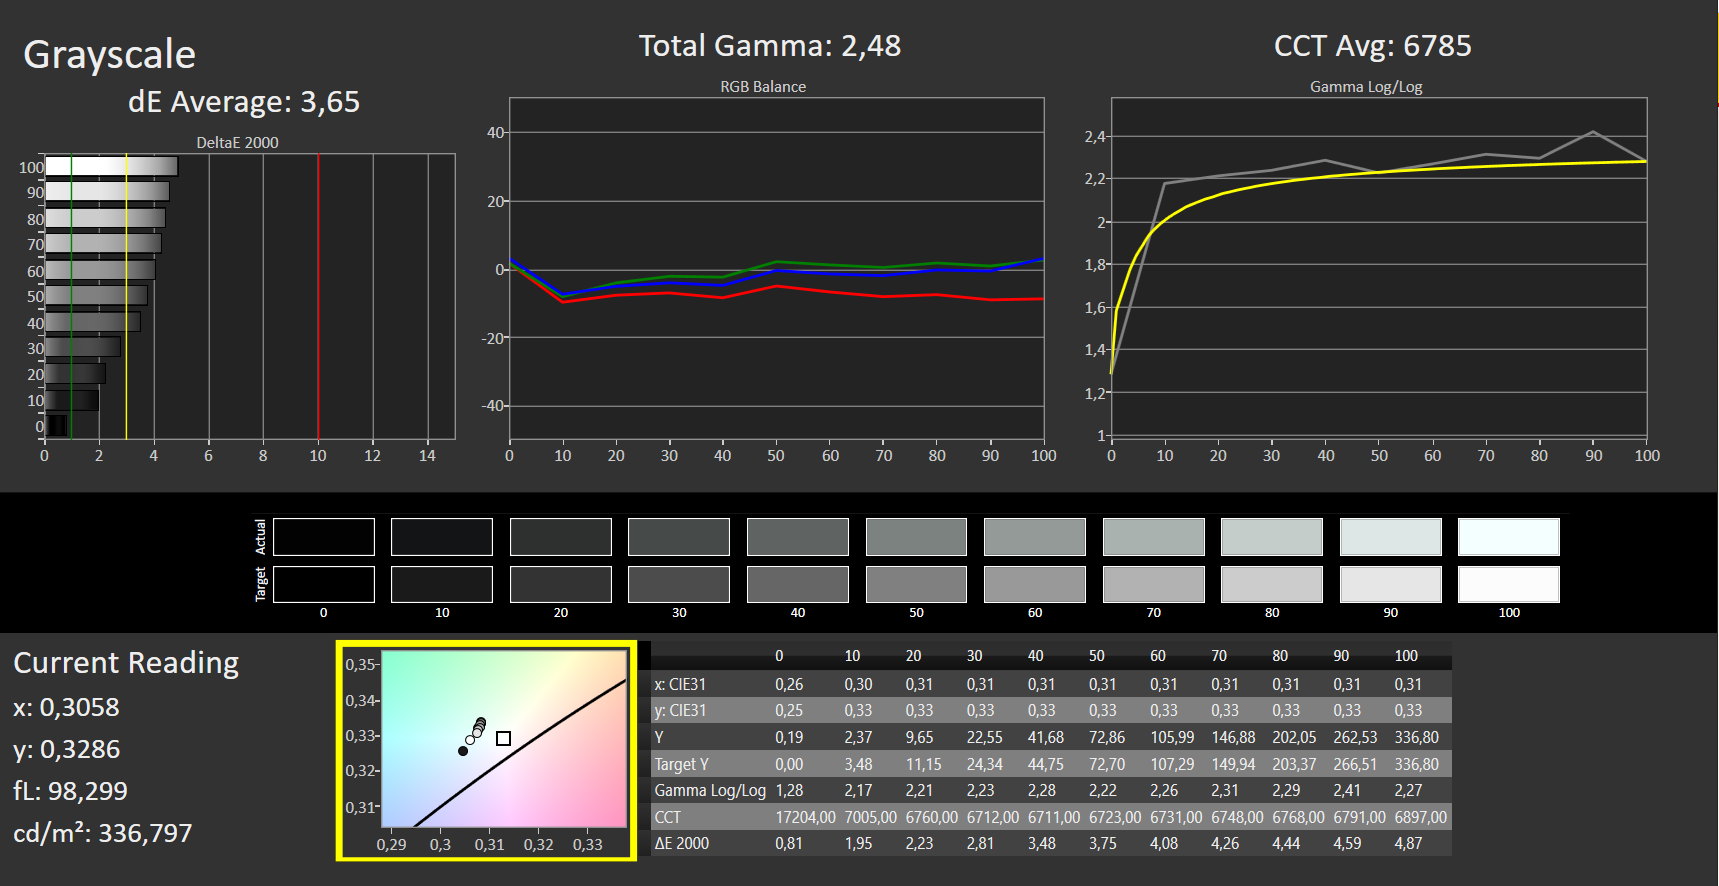
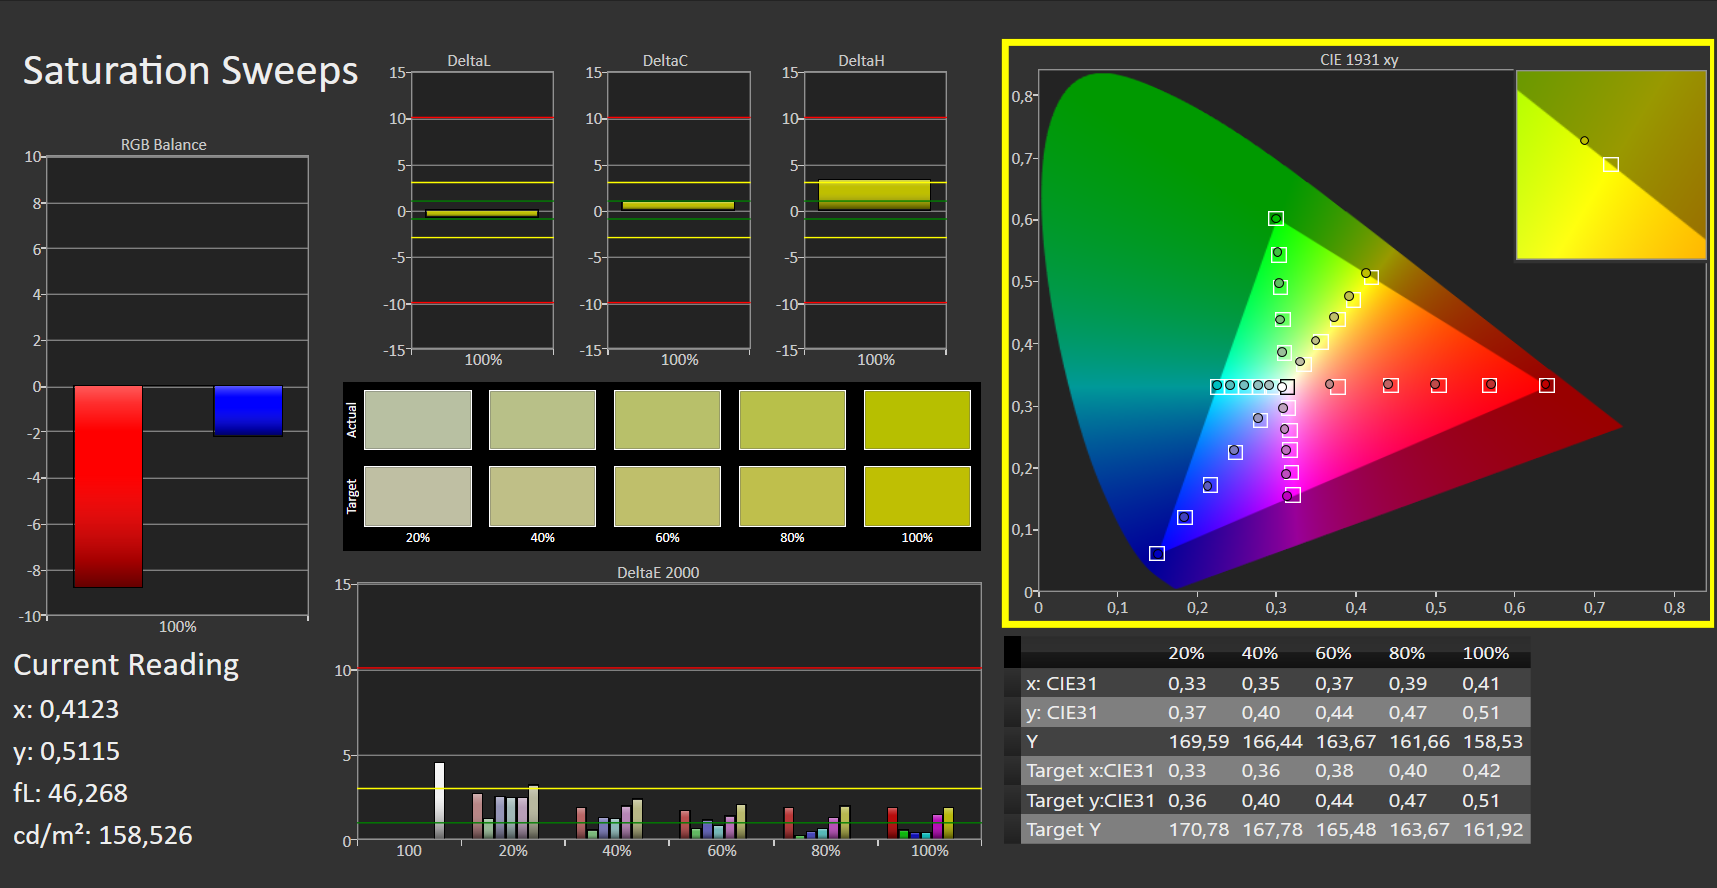
Out of the box, the screen already shows a good color reproduction. With a DeltaE 2000 color deviation of just under 2, the target (DeltaE less than 3) is met. The display doesn't suffer from a blue tint. Calibration doesn't lead to improvements in terms of color reproduction. Furthermore, the AdobeRGB color space (61%) is not fully mapped. The situation looks better with the sRGB color space (96%).

Display Response Times
| ↔ Response Time Black to White | ||
|---|---|---|
| 9 ms ... rise ↗ and fall ↘ combined | ↗ 5 ms rise | 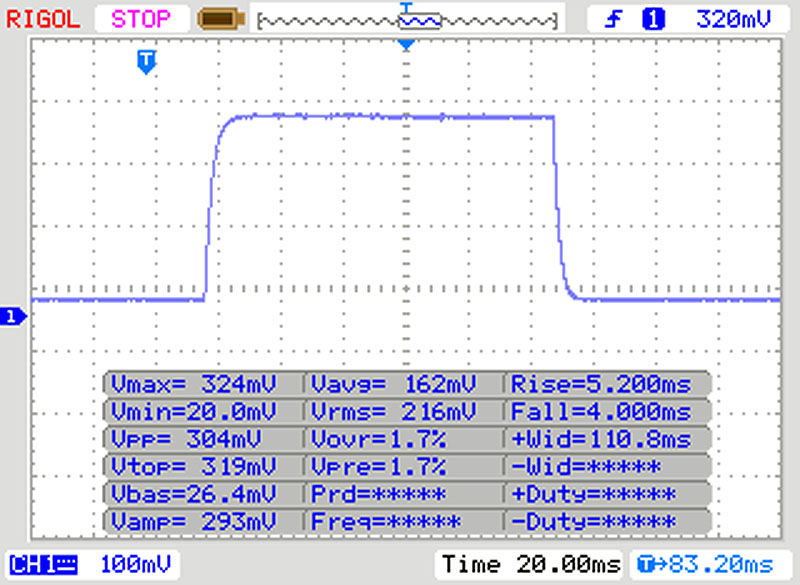 |
| ↘ 4 ms fall | ||
| The screen shows fast response rates in our tests and should be suited for gaming. In comparison, all tested devices range from 0.1 (minimum) to 240 (maximum) ms. » 25 % of all devices are better. This means that the measured response time is better than the average of all tested devices (19.8 ms). | ||
| ↔ Response Time 50% Grey to 80% Grey | ||
| 12 ms ... rise ↗ and fall ↘ combined | ↗ 6 ms rise | 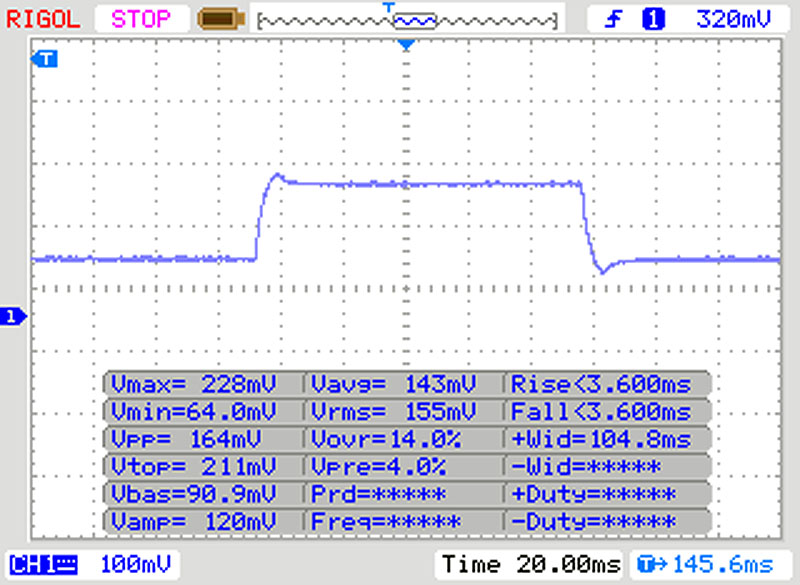 |
| ↘ 6 ms fall | ||
| The screen shows good response rates in our tests, but may be too slow for competitive gamers. In comparison, all tested devices range from 0.165 (minimum) to 636 (maximum) ms. » 25 % of all devices are better. This means that the measured response time is better than the average of all tested devices (31 ms). | ||
Screen Flickering / PWM (Pulse-Width Modulation)
| Screen flickering / PWM detected | 208 Hz | ≤ 30 % brightness setting | 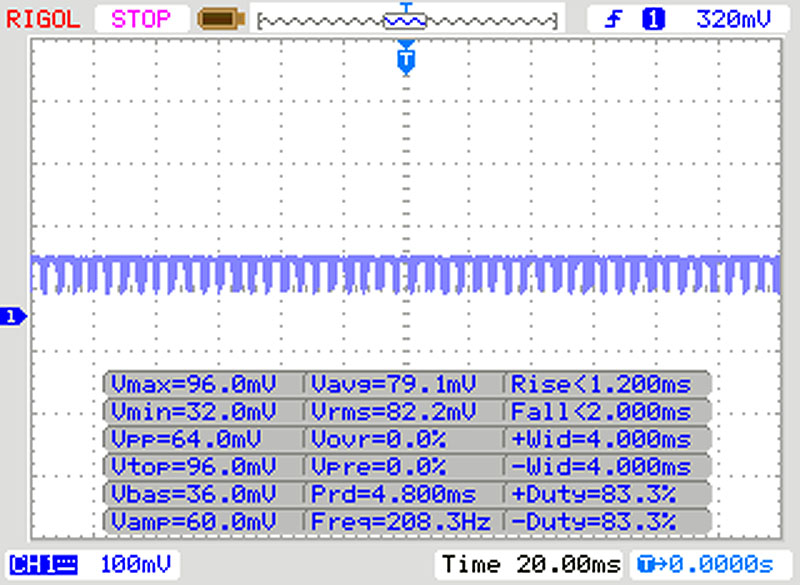 |
The display backlight flickers at 208 Hz (worst case, e.g., utilizing PWM) Flickering detected at a brightness setting of 30 % and below. There should be no flickering or PWM above this brightness setting. The frequency of 208 Hz is relatively low, so sensitive users will likely notice flickering and experience eyestrain at the stated brightness setting and below. In comparison: 52 % of all tested devices do not use PWM to dim the display. If PWM was detected, an average of 7747 (minimum: 5 - maximum: 343500) Hz was measured. | |||
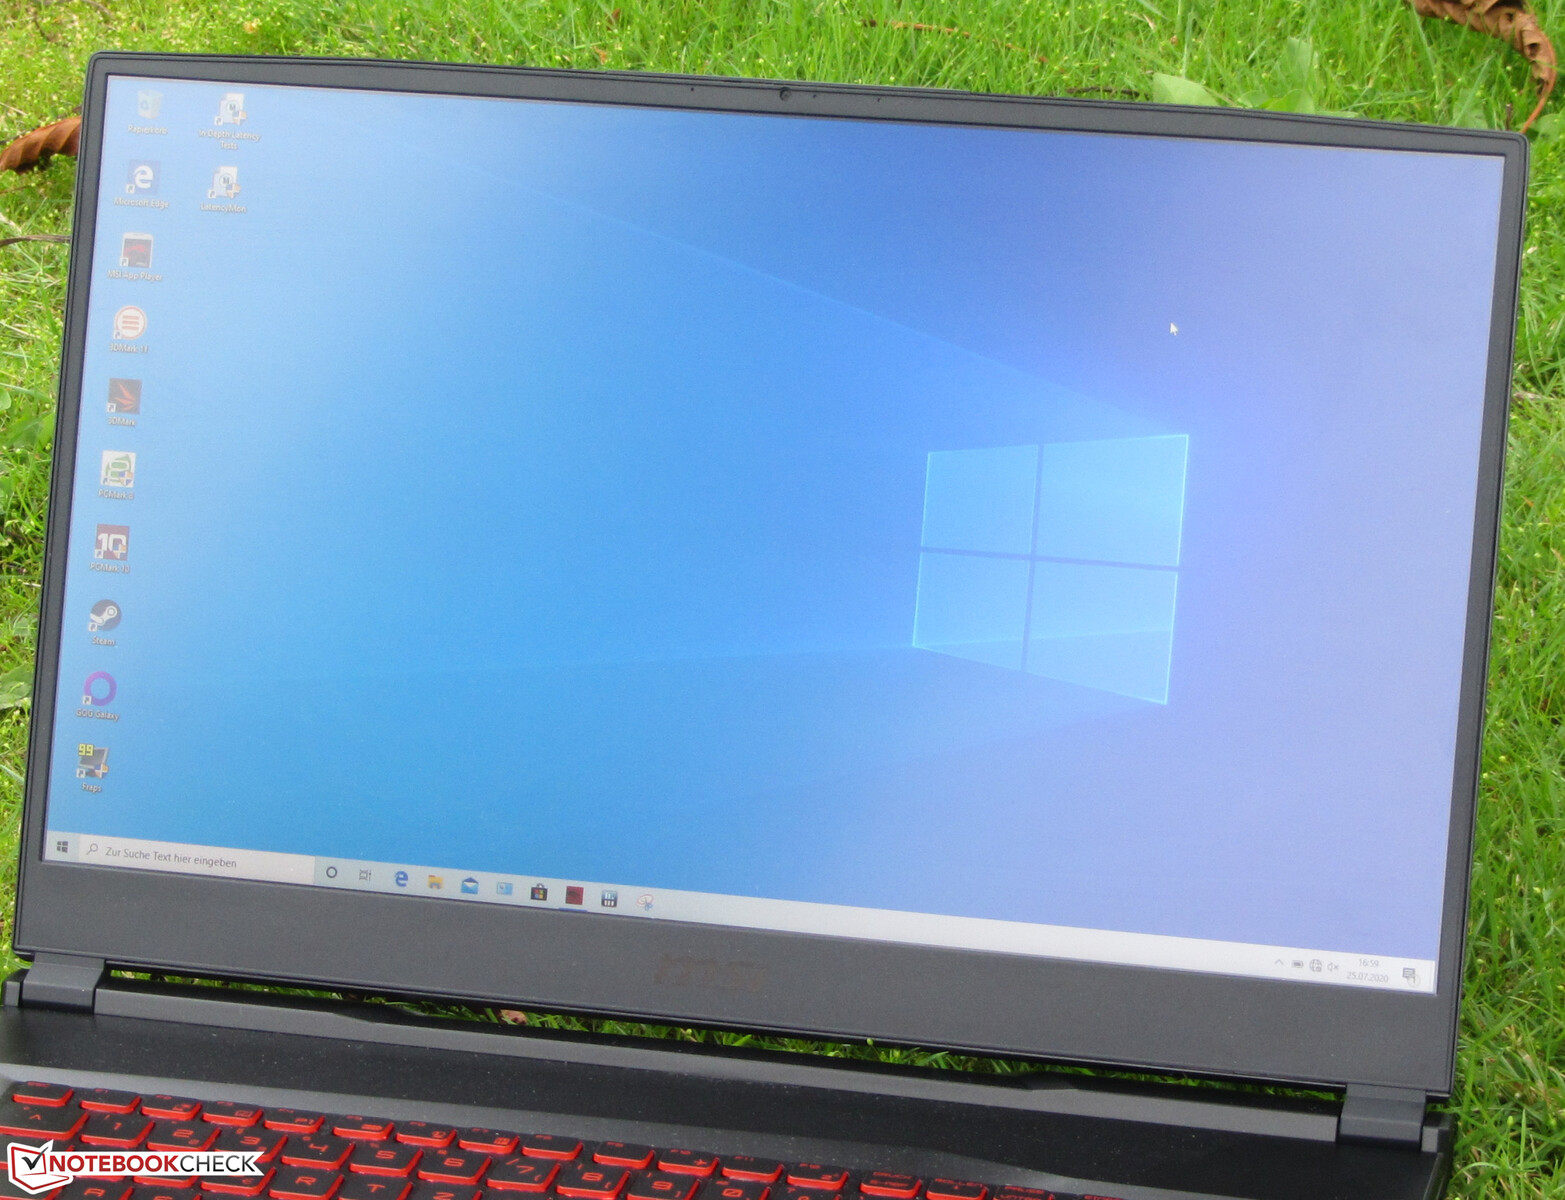
The laptop is equipped with a viewing-angle stable IPS panel. Consequently, the screen can be read from any position. Outdoors, reading the display is possible when the sun is not too bright.

Performance - The GL75 offers enough power for all application areas
MSI has a 17.3-inch gaming laptop in its range with the GL75 Leopard 10SFR-221. It brings every modern game smoothly onto the screen and also cuts a fine figure in all other application areas. Our test device costs just under 1,800 Euros (~$2,120). Other configuration variants are available.
Test conditions
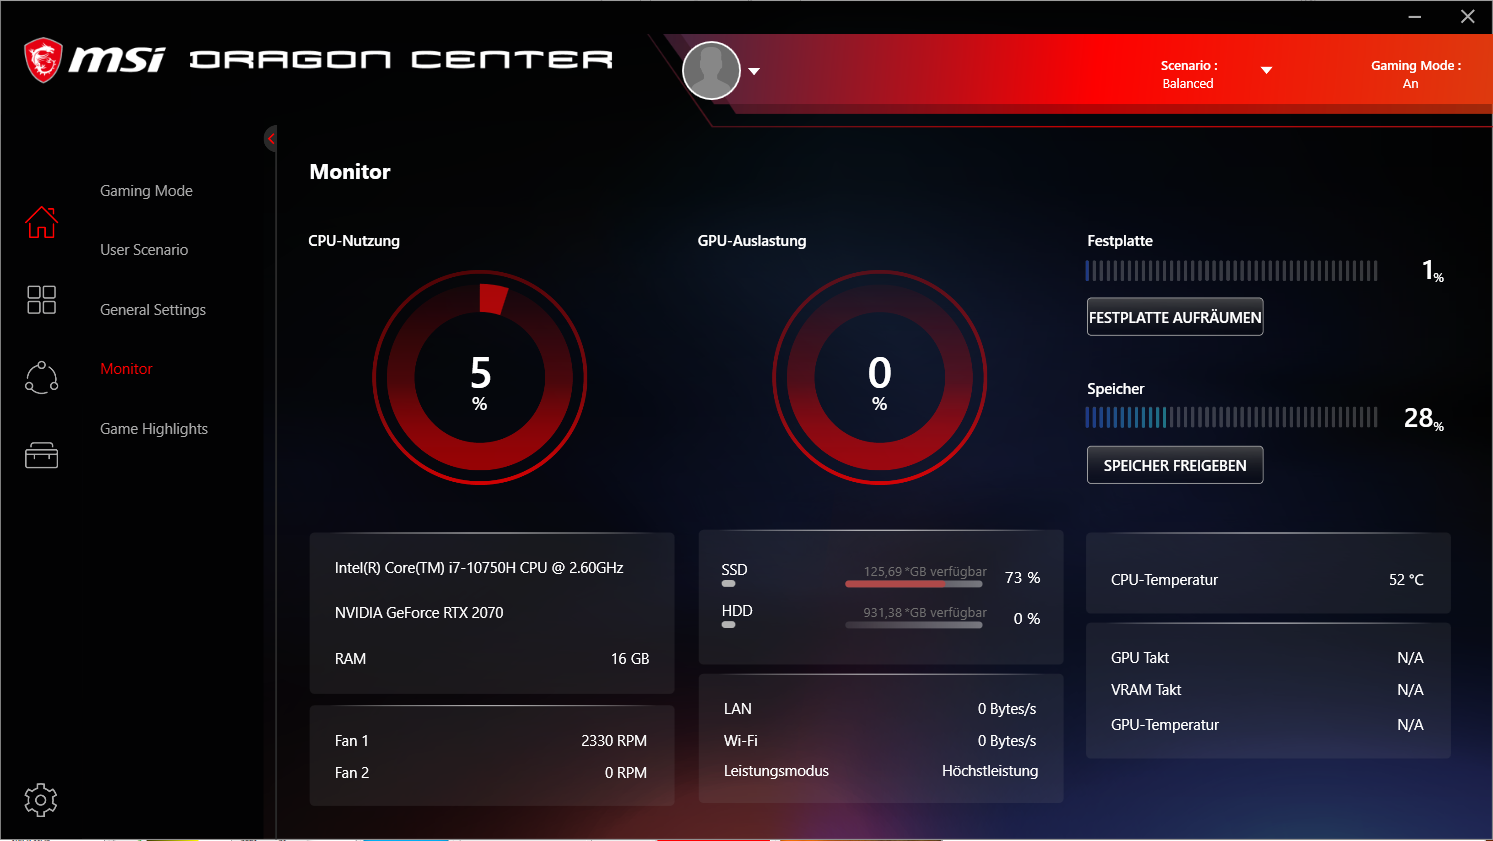
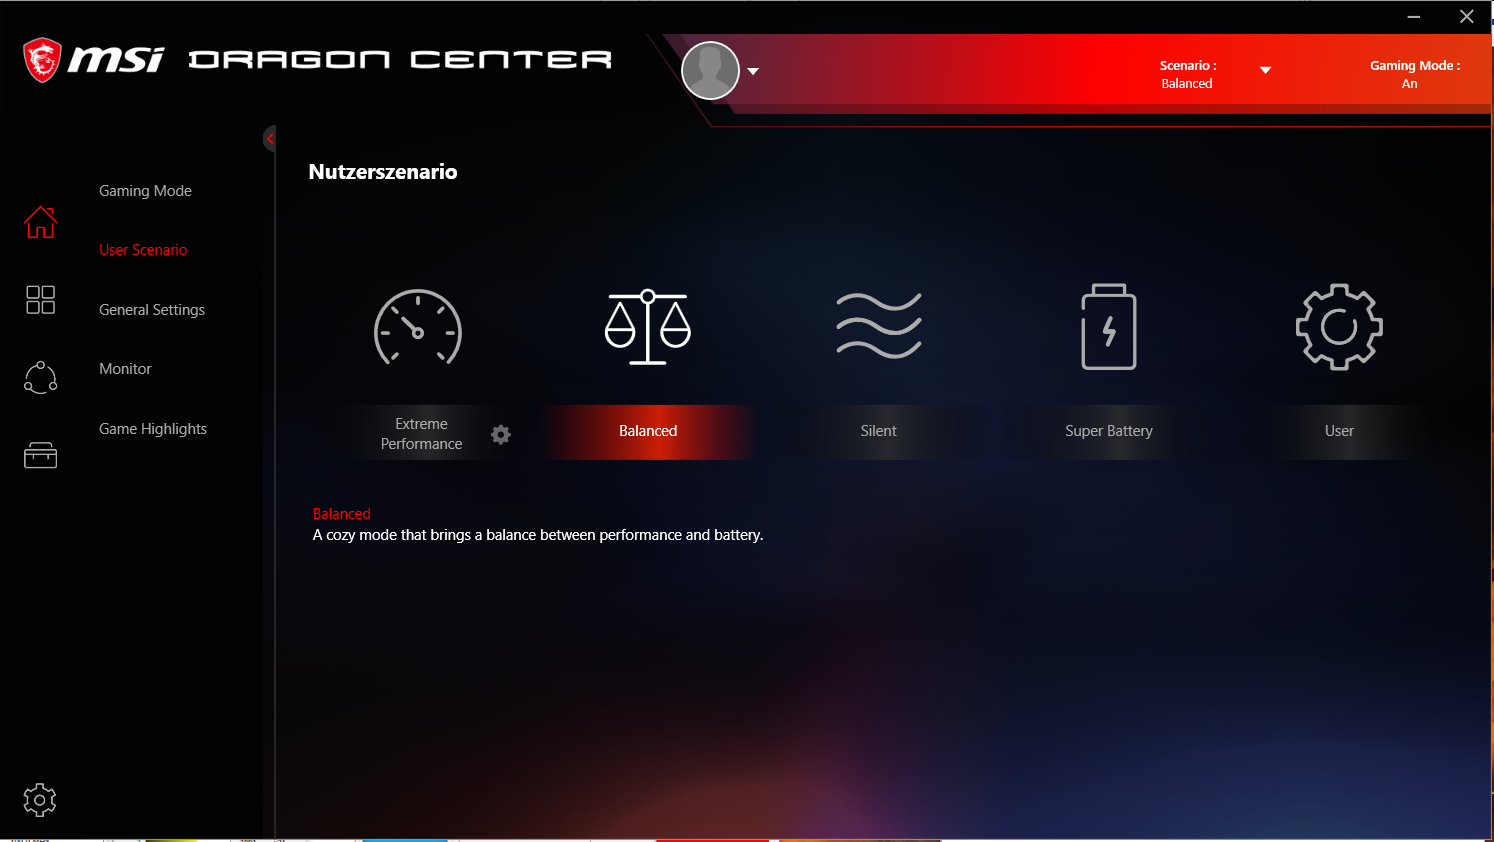
The preinstalled Dragon Center offers a variety of performance profiles to choose from that have an impact on noise development and performance. We performed all tests with the "Balanced" performance profile. Some benchmarks were also carried out under the "Extreme Performance" profile, and we point this out at the appropriate places.
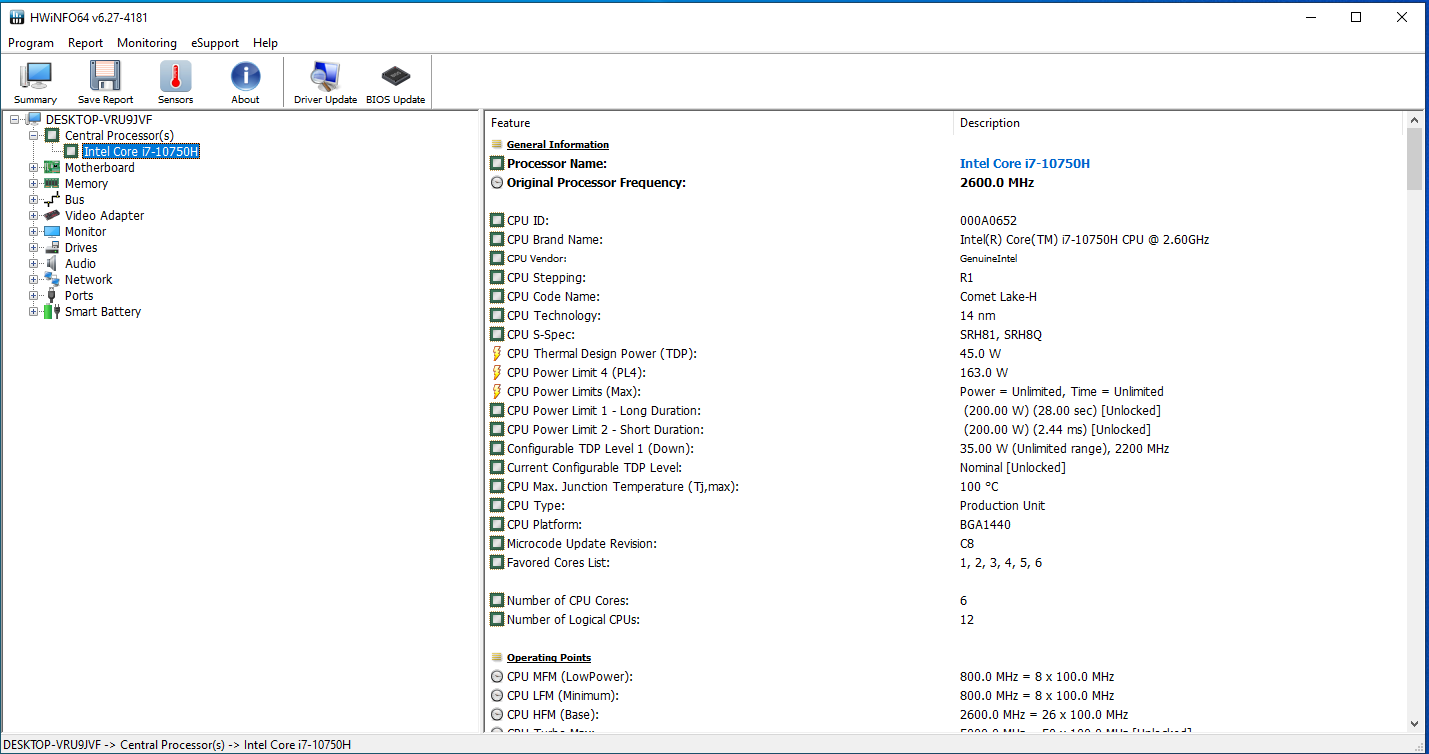
Processor
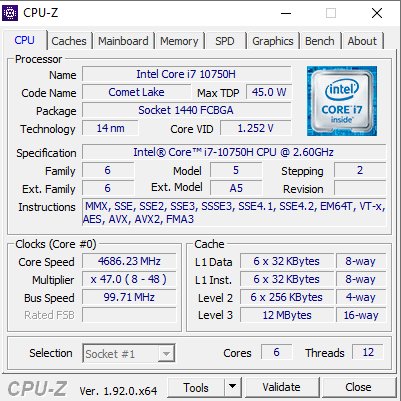
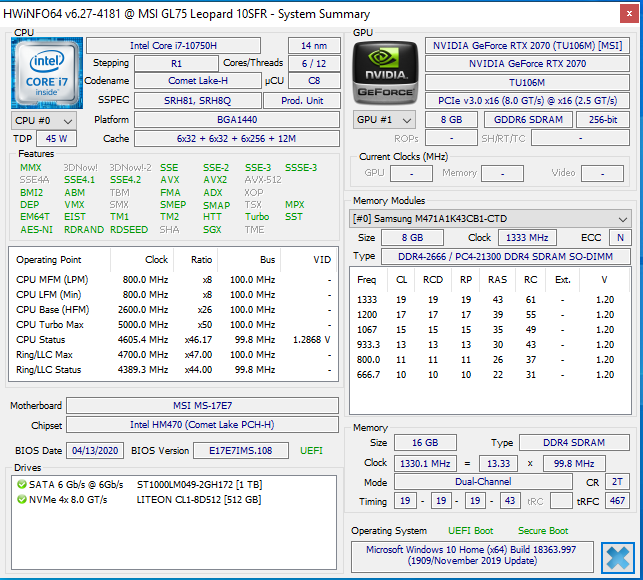
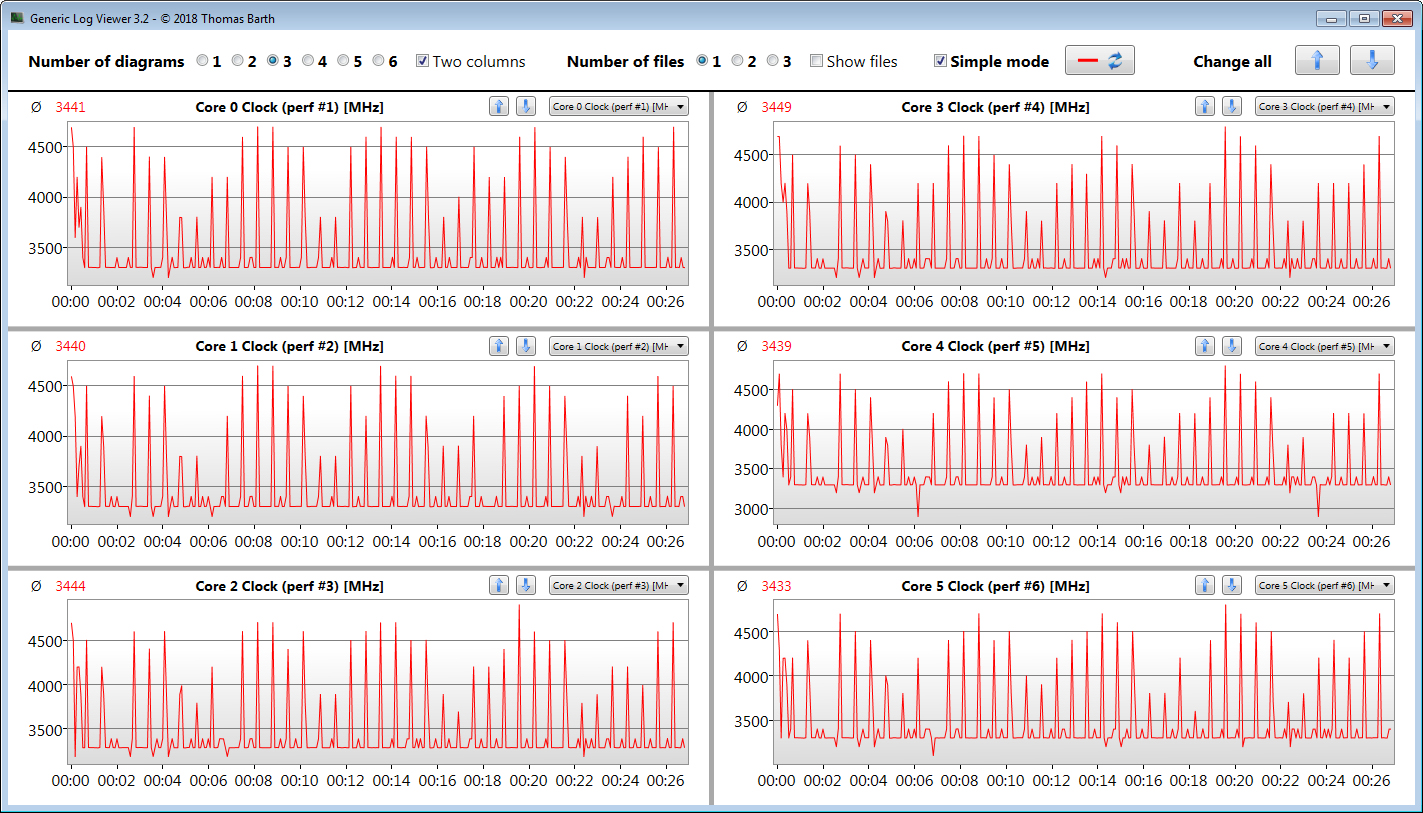
MSI equips the GL75 with a Core i7-10750H hexa-core processor (Comet Lake). The CPU operates at a base speed of 2.6 GHz. The clock rate can be increased to range between 4.3 GHz (six cores) and 5 GHz (one core) via Turbo. Moreover, Hyper-Threading (two threads per core) is supported.
The processor briefly works through the Cinebench R15 benchmark's multithread test at 3.4 to 4.2 GHz. The clock speed then drops to 3.3 to 3.9 GHz. The single-thread test is run at 4.2 to 4.6 GHz. On battery power, the speeds are 1.6 to 1.9 GHz (multithread) and 3.2 to 4.6 GHz (single-thread), respectively.
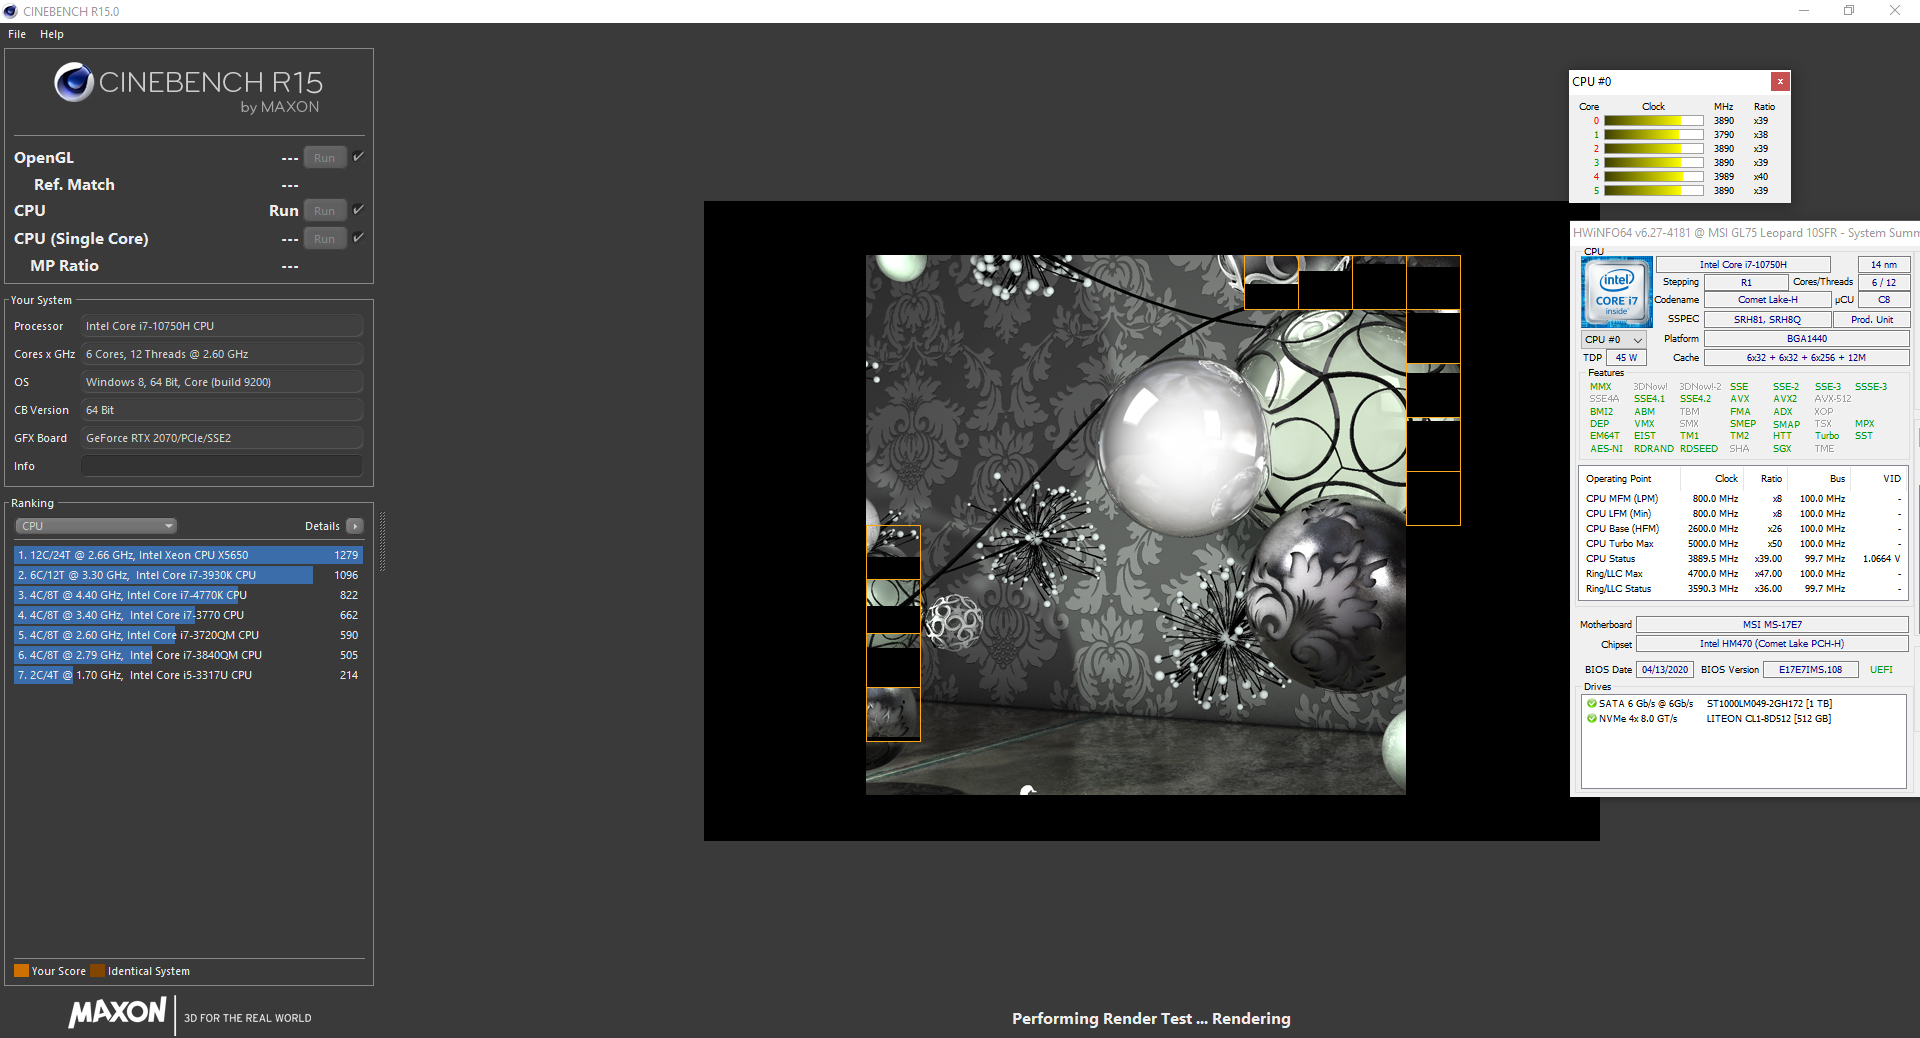
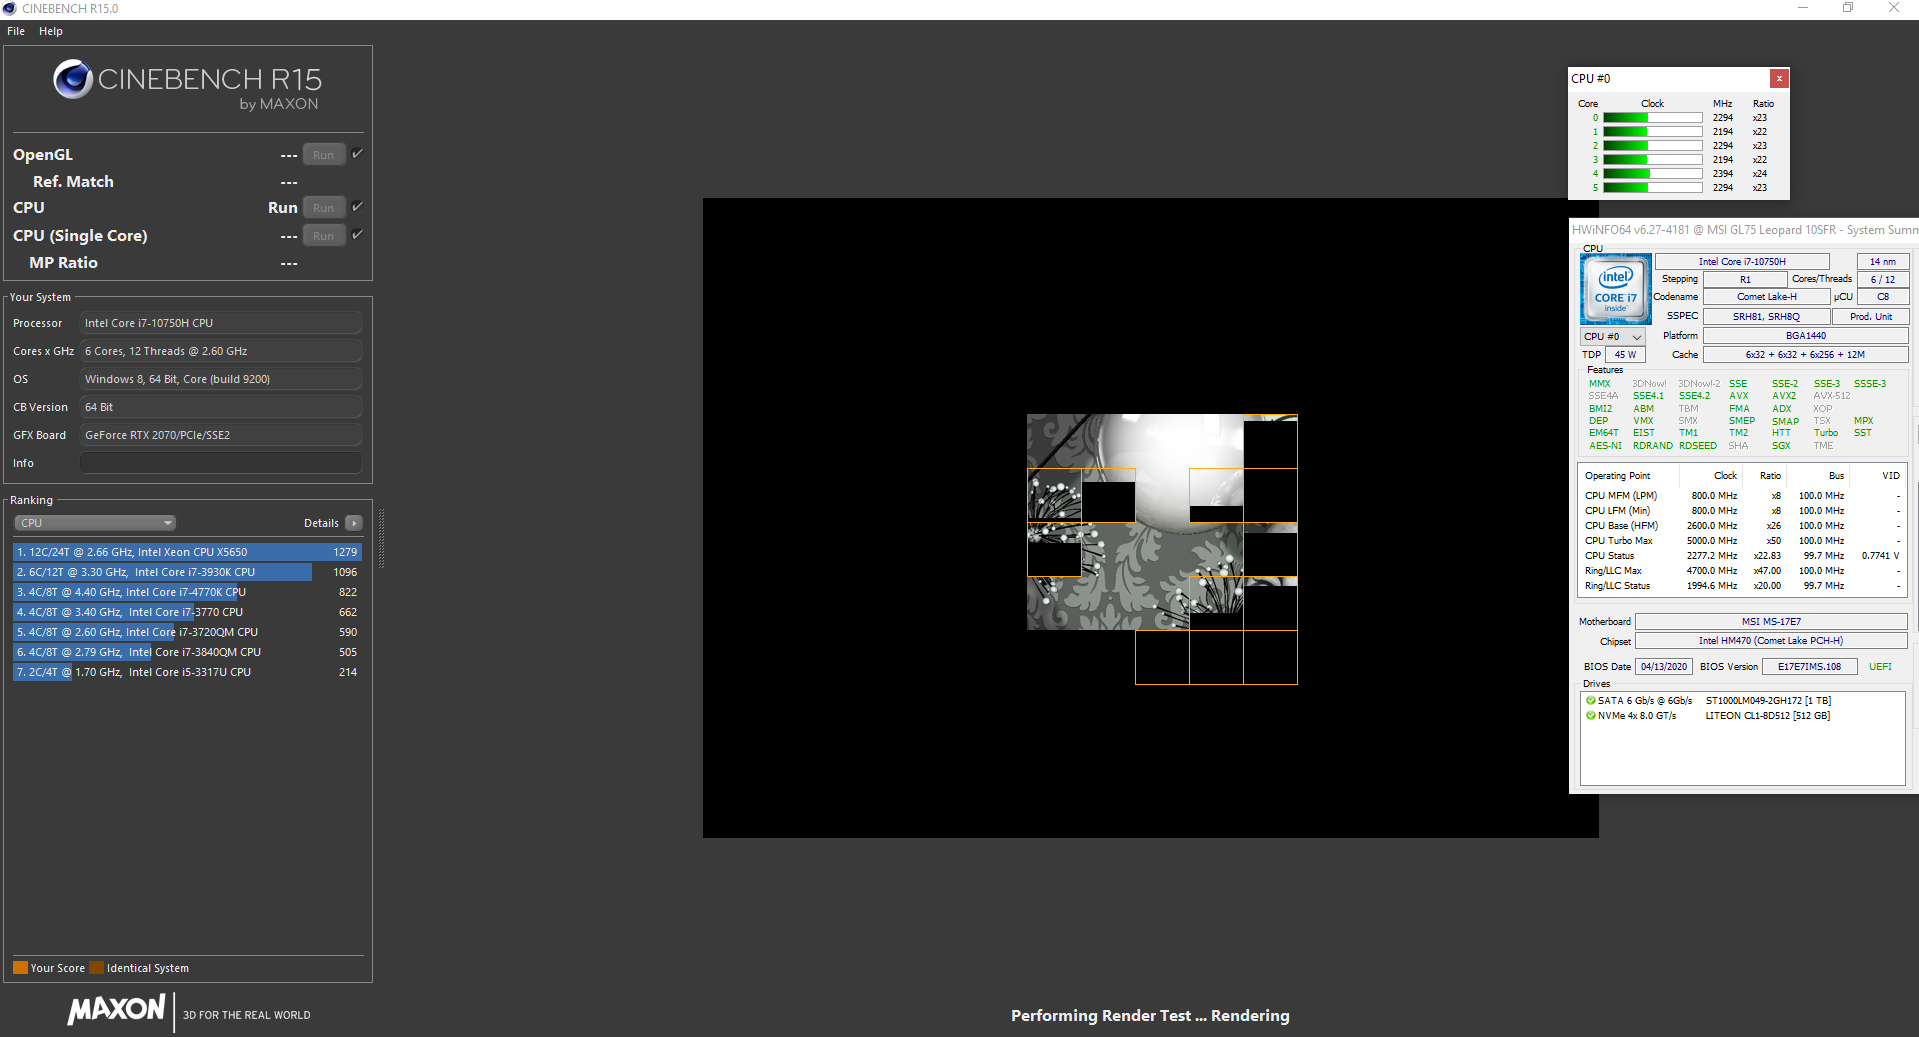

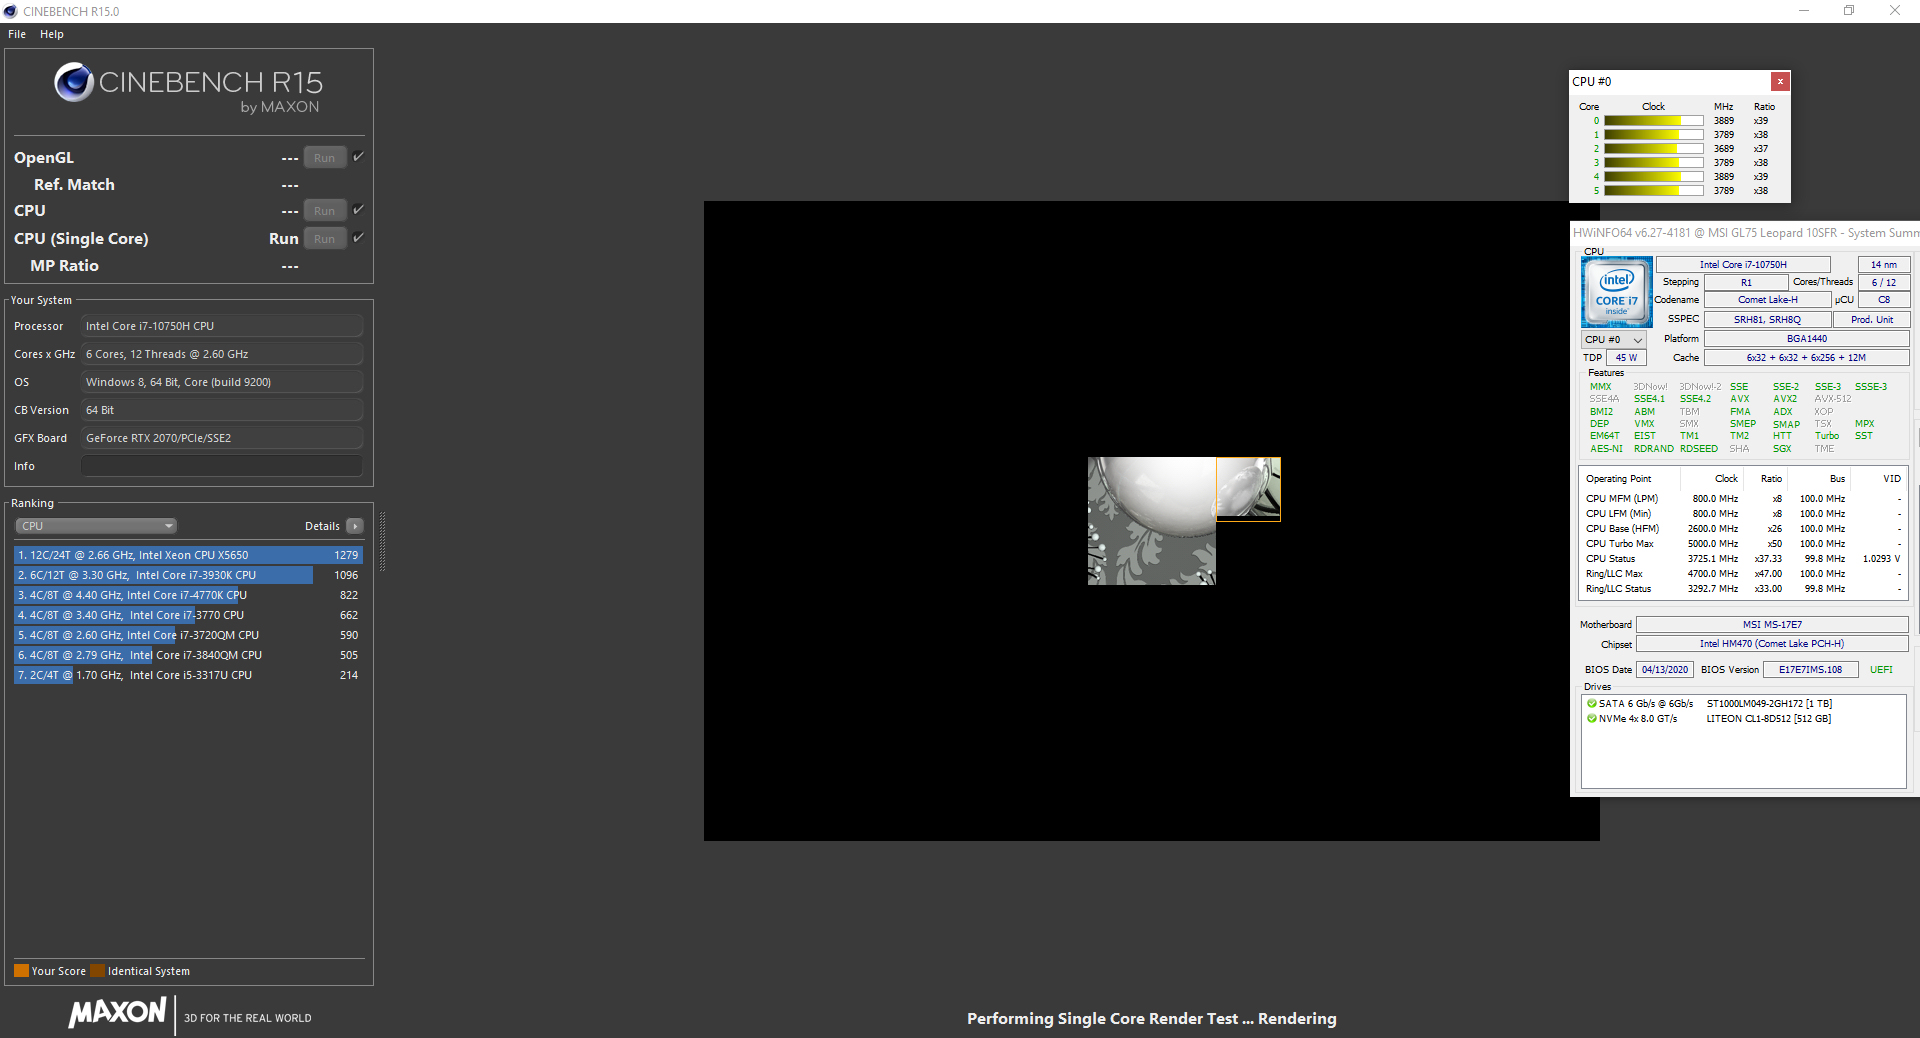
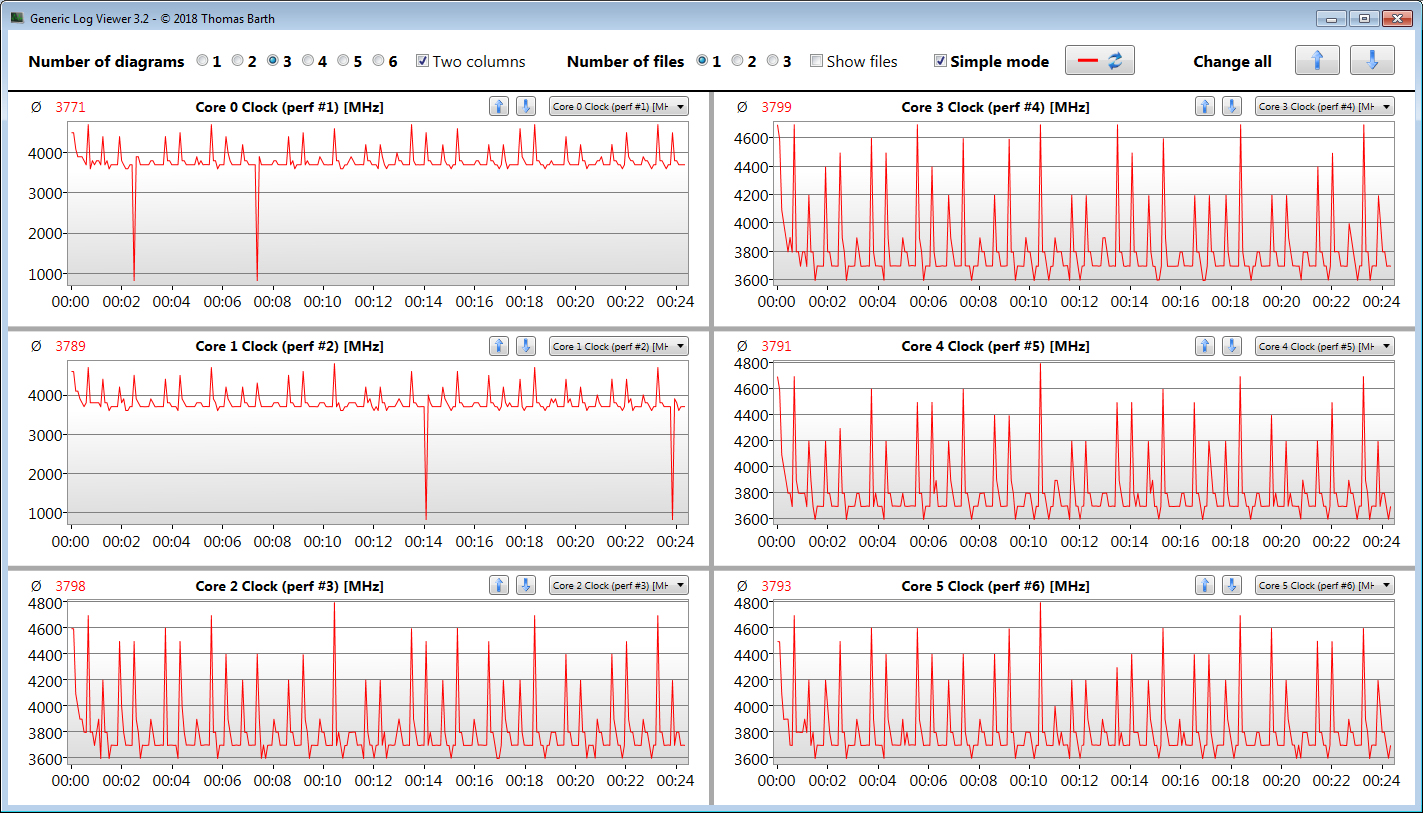
We verify if the CPU Turbo is also consistently used when plugged in by running the Cinebench R15 benchmark's multithread test in a continuous loop for at least 30 minutes. The results drop slightly from the first to the second run and then remain at a constant level. Turbo is used.
Slightly higher results are achieved if the "Extreme Performance" profile is selected within the Dragon Center software.
* ... smaller is better
System performance
A glance at the GL75's component list reveals that the laptop has enough computing power for applications beyond gaming. This is confirmed by the good results in the PCMark benchmarks.
| PCMark 8 Home Score Accelerated v2 | 3372 points | |
| PCMark 8 Creative Score Accelerated v2 | 3874 points | |
| PCMark 8 Work Score Accelerated v2 | 5678 points | |
| PCMark 10 Score | 5179 points | |
Help | ||
DPC latencies
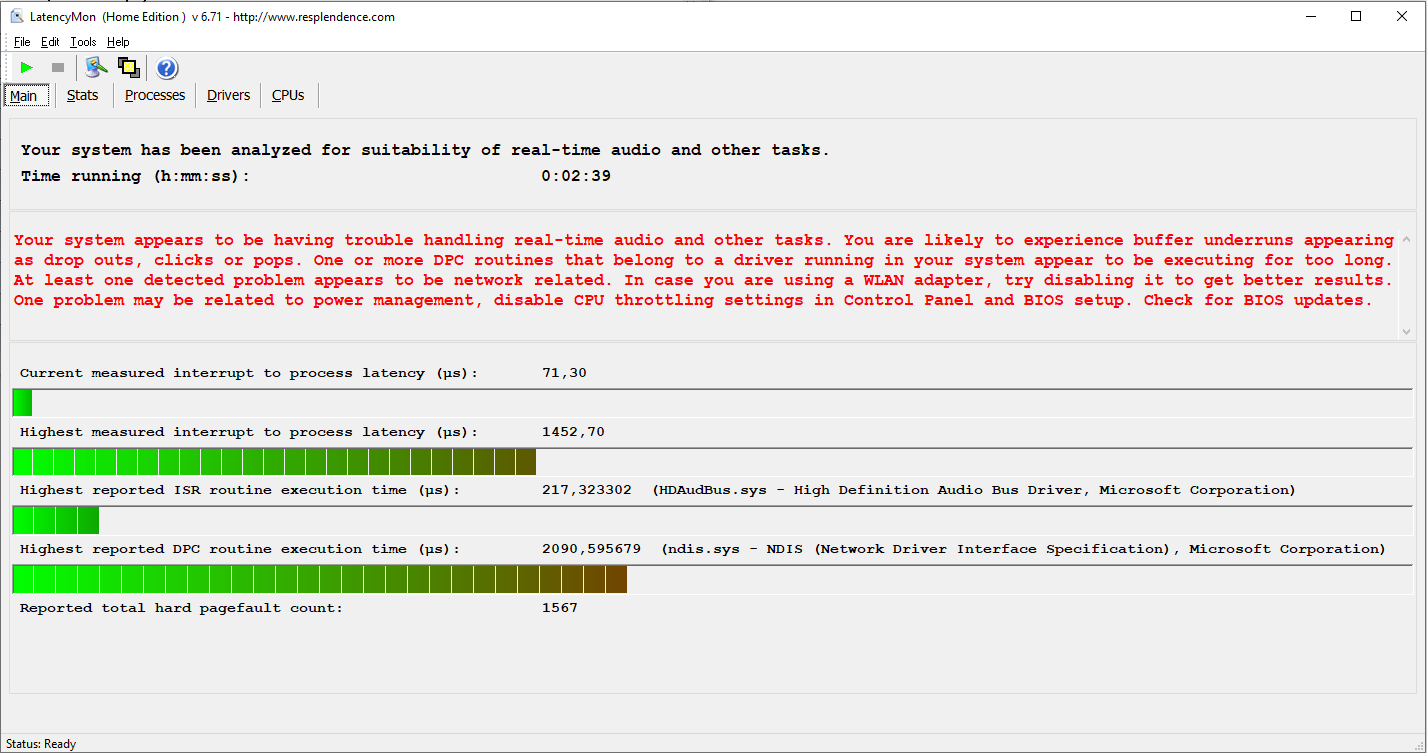
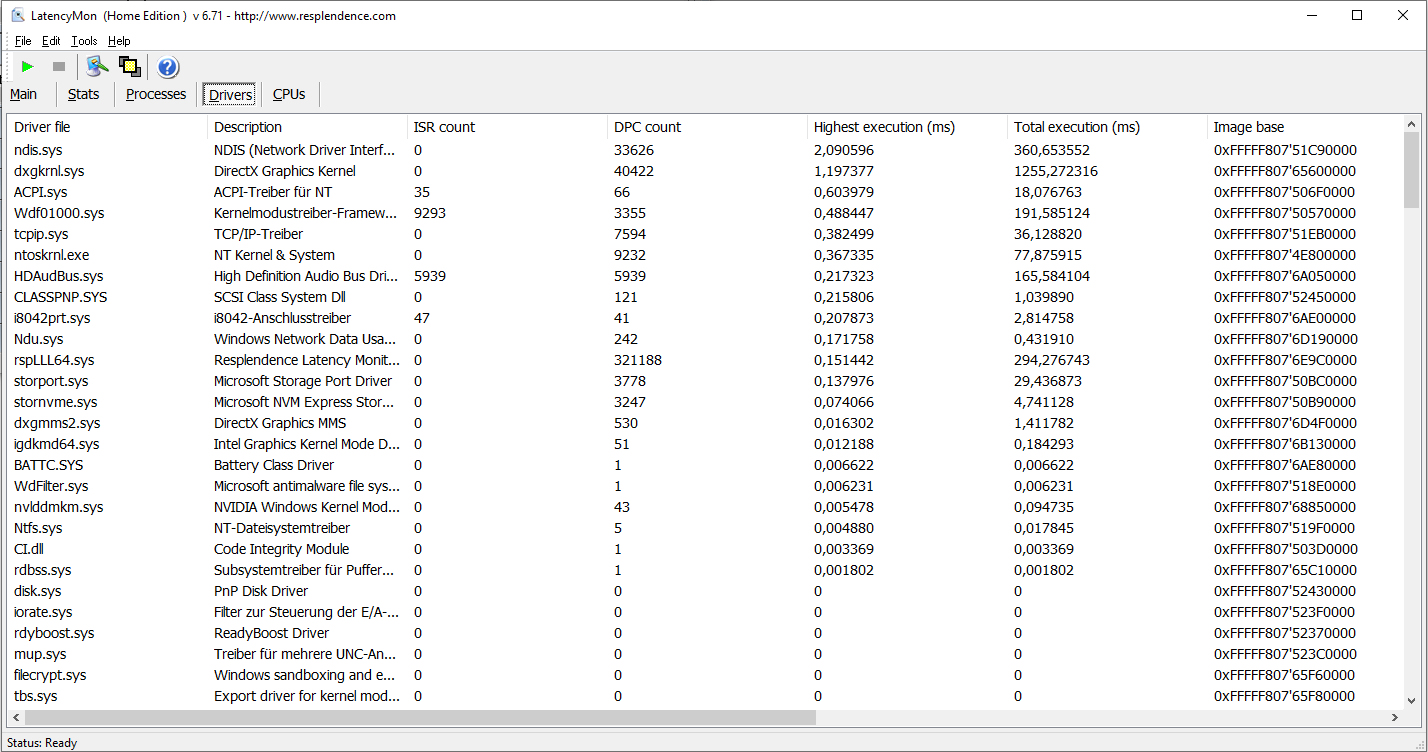
In our standardized latency monitor test (web surfing, 4K video playback, high-load Prime95), we could observe high DPC latencies. The system is not suitable for real-time video and audio-editing.
| DPC Latencies / LatencyMon - interrupt to process latency (max), Web, Youtube, Prime95 | |
| Asus TUF A17 FA706IU-AS76 | |
| MSI GL75 10SFR | |
| MSI Bravo 17 A4DDR | |
| Acer Nitro 5 AN517-52-77DS | |
* ... smaller is better
Storage
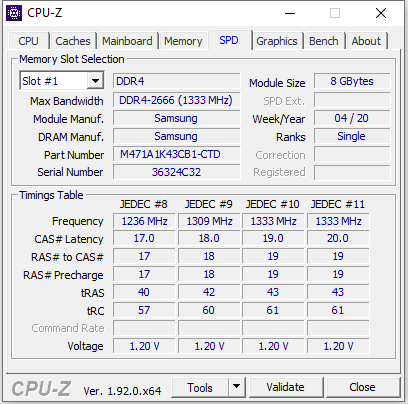
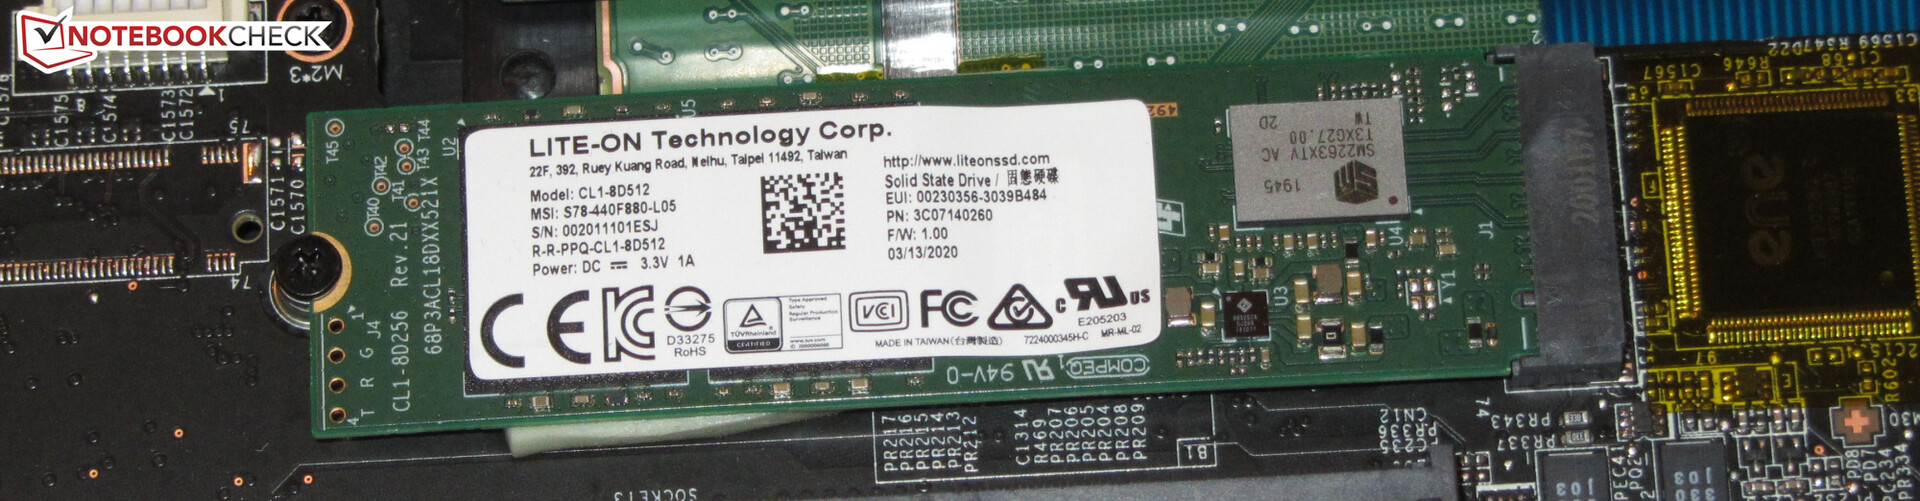
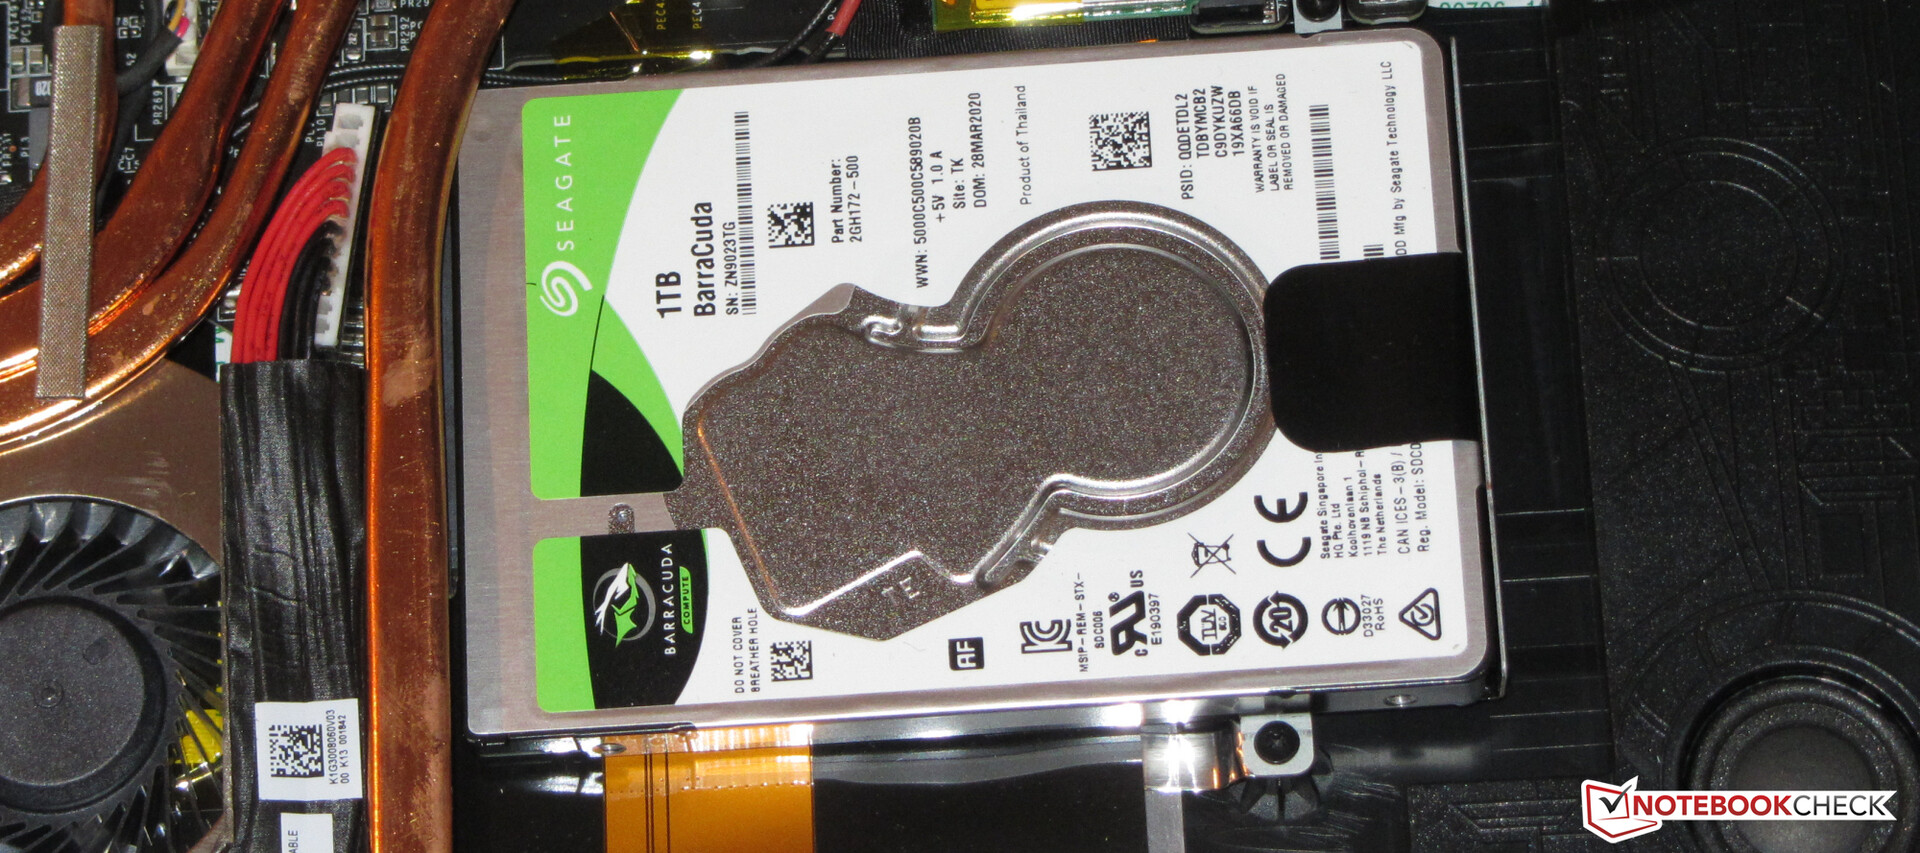
The system drive is an NVMe SSD (M.2 2280) from Lite-On that provides 512 GB of storage space. The SSD delivers good transfer rates overall. The laptop also comes with a 2.5-inch hard drive that provides 1 TB of storage space and runs at 7,200 revolutions per minute.

| MSI GL75 10SFR Lite-On CL1-8D512 | Acer Nitro 5 AN517-52-77DS WDC PC SN530 SDBPNPZ-1T00 | Schenker XMG Neo 17 XNE17M19 Samsung SSD 970 EVO Plus 500GB | Lenovo Legion Y740-17IRHg-81UJ001VGE Samsung SSD PM981 MZVLB1T0HALR | Schenker XMG Neo 17 Samsung SSD 970 EVO Plus 1TB | MSI GL75 9SEK-056US WDC PC SN520 SDAPNUW-512G | MSI GP75 Leopard 9SD Kingston RBUSNS8154P3256GJ1 | MSI Bravo 17 A4DDR Toshiba KBG30ZMV512G | Asus TUF A17 FA706IU-AS76 Intel SSD 660p 1TB SSDPEKNW010T8 | Average Lite-On CL1-8D512 | |
|---|---|---|---|---|---|---|---|---|---|---|
| CrystalDiskMark 5.2 / 6 | 5% | 11% | 21% | 7% | 7% | -45% | -24% | 15% | -16% | |
| Write 4K (MB/s) | 132.2 | 140 6% | 103.2 -22% | 101.2 -23% | 92.7 -30% | 149.1 13% | 105.8 -20% | 94.6 -28% | 189.7 43% | 119 ? -10% |
| Read 4K (MB/s) | 45.62 | 49.04 7% | 42.11 -8% | 44.61 -2% | 41.4 -9% | 48.58 6% | 27.89 -39% | 47.12 3% | 62.3 37% | 35.6 ? -22% |
| Write Seq (MB/s) | 1511 | 1963 30% | 1087 -28% | 2295 52% | 1363 -10% | 270.8 -82% | 850 -44% | 1681 11% | 1099 ? -27% | |
| Read Seq (MB/s) | 1890 | 1455 -23% | 974 -48% | 2174 15% | 1259 -33% | 879 -53% | 1157 -39% | 1608 -15% | 1806 ? -4% | |
| Write 4K Q32T1 (MB/s) | 375.9 | 398.2 6% | 404.7 8% | 401.2 7% | 289.7 -23% | 462 23% | 273.3 -27% | 277.7 -26% | 468.6 25% | 390 ? 4% |
| Read 4K Q32T1 (MB/s) | 525 | 461.9 -12% | 469.8 -11% | 475.5 -9% | 337.5 -36% | 606 15% | 361.2 -31% | 546 4% | 541 3% | 371 ? -29% |
| Write Seq Q32T1 (MB/s) | 1505 | 1969 31% | 3279 118% | 2397 59% | 3332 121% | 1454 -3% | 253 -83% | 908 -40% | 1770 18% | 965 ? -36% |
| Read Seq Q32T1 (MB/s) | 2008 | 1927 -4% | 3513 75% | 3337 66% | 3477 73% | 1724 -14% | 1505 -25% | 1632 -19% | 1898 -5% | 1998 ? 0% |
| Write 4K Q8T8 (MB/s) | 1562 | 1211 | ||||||||
| Read 4K Q8T8 (MB/s) | 1373 | 1104 | ||||||||
| AS SSD | 51% | 119% | 89% | 130% | 49% | -53% | 6% | 30% | -13% | |
| Seq Read (MB/s) | 1923 | 1804 -6% | 2274 18% | 2800 46% | 2359 23% | 1296 -33% | 748 -61% | 1420 -26% | 1320 -31% | 1795 ? -7% |
| Seq Write (MB/s) | 1065 | 1922 80% | 2522 137% | 2424 128% | 2469 132% | 1391 31% | 219 -79% | 922 -13% | 1539 45% | 706 ? -34% |
| 4K Read (MB/s) | 25.43 | 38.21 50% | 49.72 96% | 42.77 68% | 53.5 110% | 29.67 17% | 25.7 1% | 48.51 91% | 56.3 121% | 24.8 ? -2% |
| 4K Write (MB/s) | 101.9 | 105 3% | 118.2 16% | 94.8 -7% | 117.6 15% | 82.4 -19% | 116.8 15% | 158.5 56% | 92.6 ? -9% | |
| 4K-64 Read (MB/s) | 477.9 | 976 104% | 1209 153% | 1406 194% | 1579 230% | 1042 118% | 259.3 -46% | 928 94% | 586 23% | 379 ? -21% |
| 4K-64 Write (MB/s) | 563 | 1150 104% | 2218 294% | 1697 201% | 2048 264% | 1284 128% | 190.2 -66% | 345.4 -39% | 820 46% | 472 ? -16% |
| Access Time Read * (ms) | 0.053 | 0.055 -4% | 0.05 6% | 0.048 9% | 0.108 -104% | 0.159 -200% | 0.089 -68% | 0.043 19% | 0.069 ? -30% | |
| Access Time Write * (ms) | 0.126 | 0.045 64% | 0.031 75% | 0.039 69% | 0.03 76% | 0.031 75% | 0.058 54% | 0.189 -50% | 0.113 10% | 0.134 ? -6% |
| Score Read (Points) | 696 | 1194 72% | 1486 114% | 1729 148% | 1869 169% | 1201 73% | 360 -48% | 1119 61% | 775 11% | 584 ? -16% |
| Score Write (Points) | 771 | 1747 127% | 2588 236% | 2034 164% | 2413 213% | 1542 100% | 294 -62% | 554 -28% | 1132 47% | 635 ? -18% |
| Score Total (Points) | 1785 | 3563 100% | 4855 172% | 4630 159% | 5248 194% | 3363 88% | 821 -54% | 2232 25% | 2333 31% | 1469 ? -18% |
| Copy ISO MB/s (MB/s) | 1710 | 1305 -24% | 2148 26% | 1736 2% | 1710 ? 0% | |||||
| Copy Program MB/s (MB/s) | 465.3 | 467.5 0% | 582 25% | 553 19% | 465 ? 0% | |||||
| Copy Game MB/s (MB/s) | 1042 | 872 -16% | 1278 23% | 1264 21% | 1042 ? 0% | |||||
| Total Average (Program / Settings) | 28% /
33% | 65% /
73% | 55% /
64% | 69% /
78% | 28% /
33% | -49% /
-49% | -9% /
-7% | 23% /
24% | -15% /
-14% |
* ... smaller is better
Continuous load read: DiskSpd Read Loop, Queue Depth 8
Graphics card
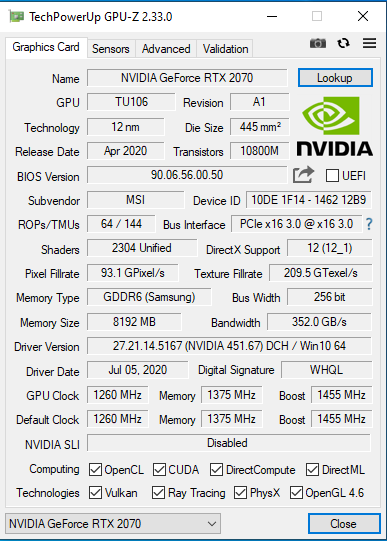
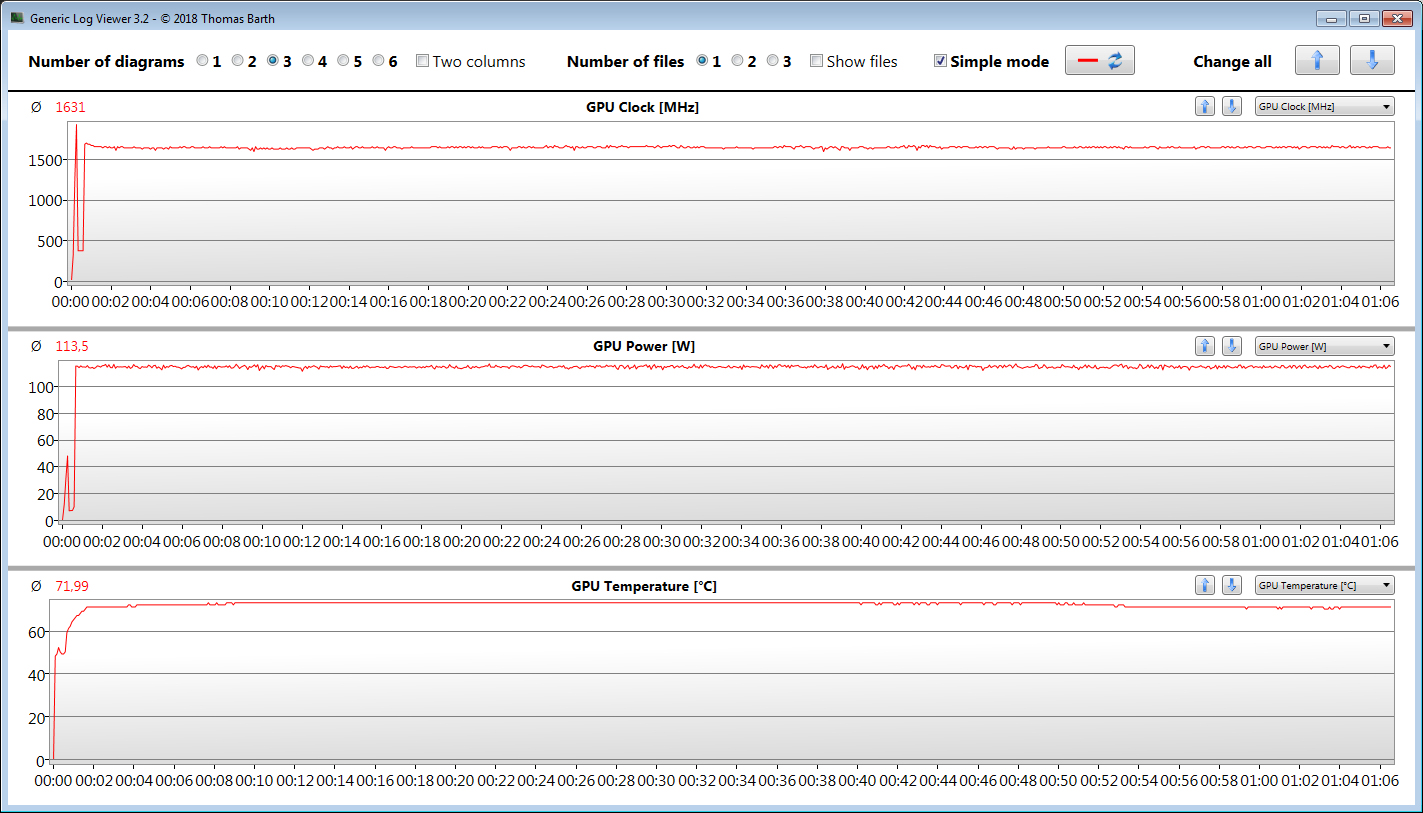
The GeForce RTX 2070 graphics core supports DirectX 12 and operates at a base speed of 1,260 MHz. When boosted, an increase up to 1,455 MHz is possible. However, higher speeds can also be achieved if the GPU doesn't reach a specified temperature and/or energy threshold. As a result, we register a maximum of 1,900 MHz, which can only be maintained for a short time, though. The GPU processes our The Witcher 3 test at an average speed of 1,631 MHz. Furthermore, the GPU can access fast GDDR6 graphics memory (8,192 MB).
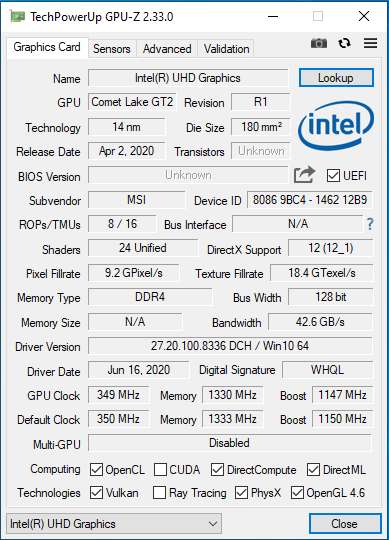
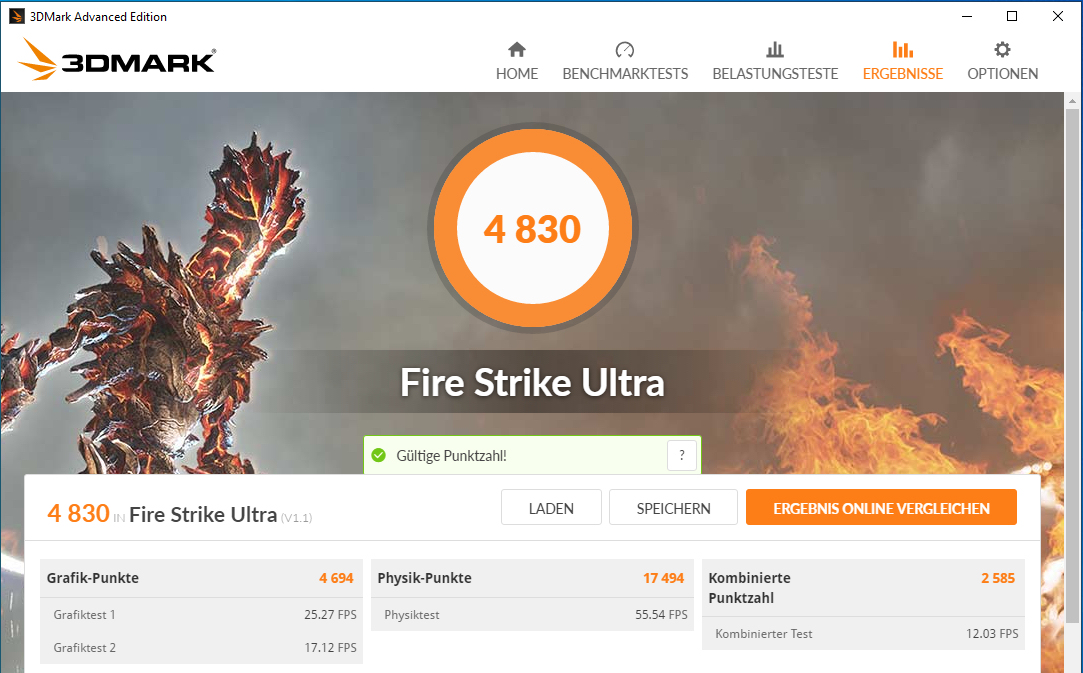
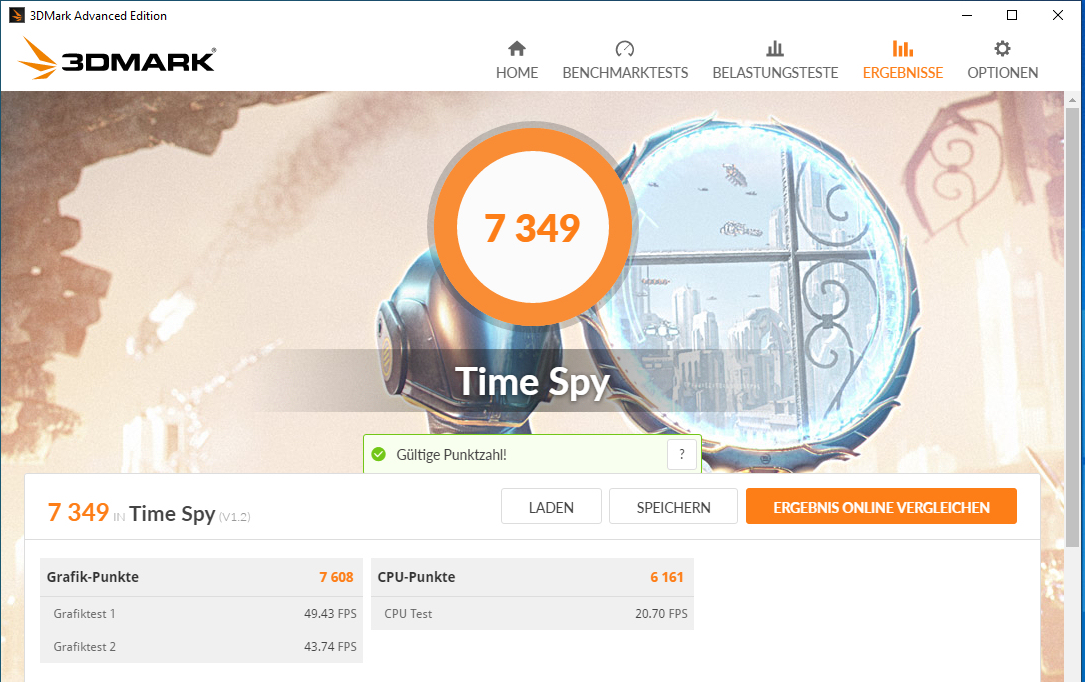
The results in the 3DMark benchmarks are at a normal level for the graphics core installed here. The UHD Graphics 630 GPU that's integrated into the processor is active, and the laptop works with Nvidia's Optimus graphics-switching solution.
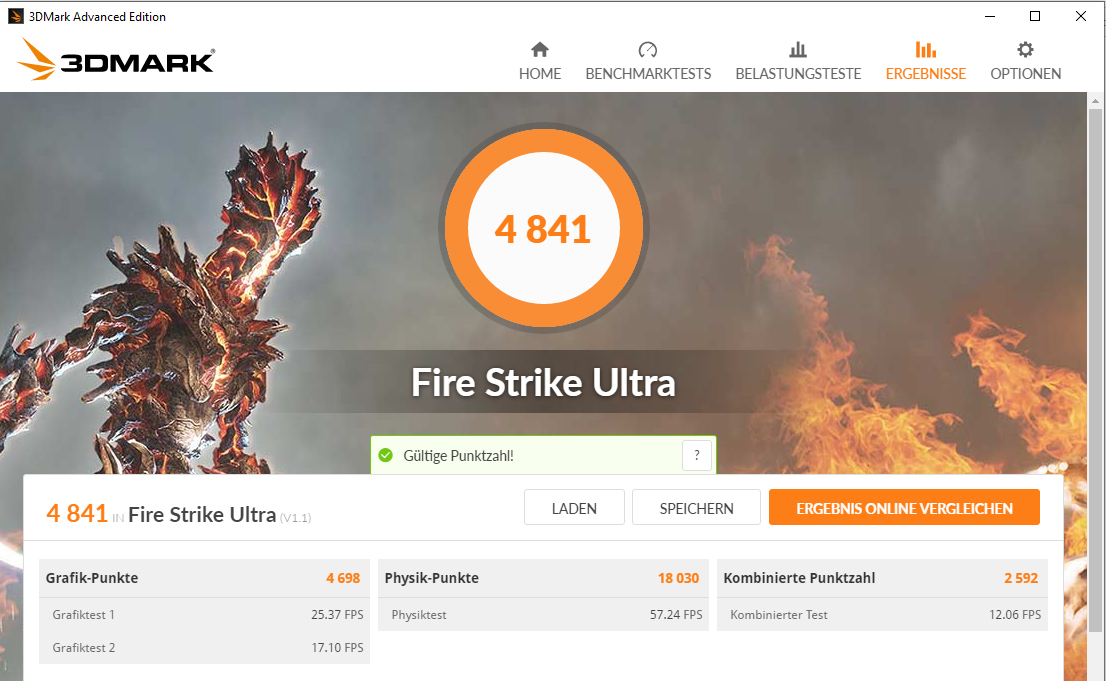
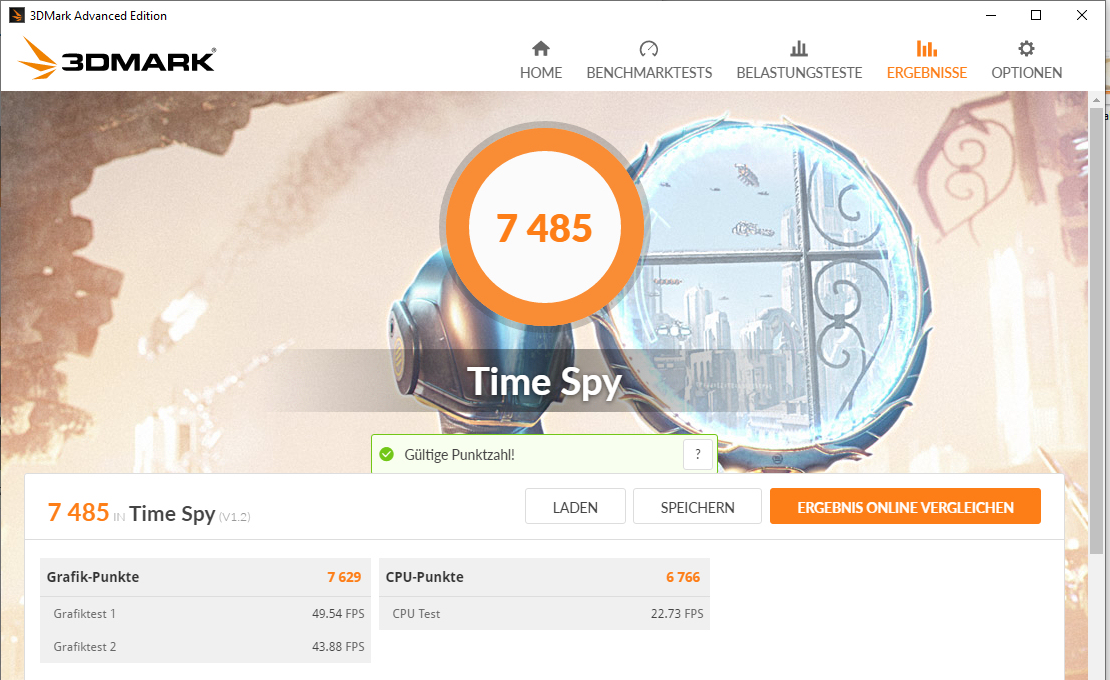
The "Extreme Performance" profile, which can be selected within the Dragon Center software, has no influence on the graphics performance. The 3DMark results are similar.
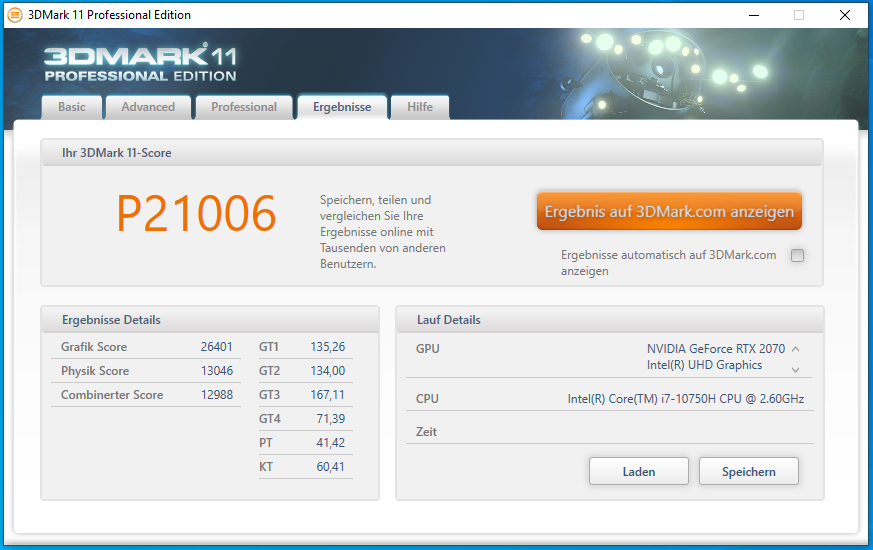
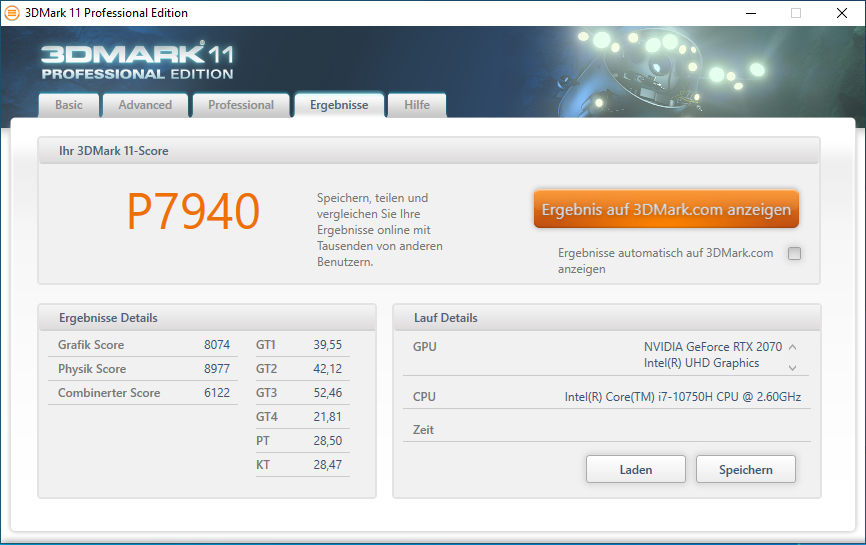
| 3DMark 11 Performance | 21006 points | |
| 3DMark Cloud Gate Standard Score | 36210 points | |
| 3DMark Fire Strike Score | 17529 points | |
| 3DMark Time Spy Score | 7349 points | |
Help | ||
Gaming performance
The built-in CPU-GPU combination brings all modern games in Full HD resolution and with maximum quality settings smoothly onto the matte screen. Resolutions beyond Full HD are also possible when an appropriate monitor is connected. However, the quality controls shouldn't be adjusted too high in that case.
| BioShock Infinite - 1920x1080 Ultra Preset, DX11 (DDOF) | |
| Average NVIDIA GeForce RTX 2070 Mobile (136.9 - 187.8, n=9) | |
| Lenovo Legion Y740-17IRHg-81UJ001VGE | |
| MSI GL75 10SFR | |
| MSI GP75 Leopard 9SD | |
| Acer Nitro 5 AN517-52-77DS | |
| Shadow of the Tomb Raider - 1920x1080 Highest Preset AA:T | |
| Average of class Gaming (96 - 116, n=2, last 2 years) | |
| MSI GL75 10SFR | |
| Average NVIDIA GeForce RTX 2070 Mobile (74.2 - 97, n=11) | |
| MSI GL75 9SEK-056US | |
| Asus TUF A17 FA706IU-AS76 | |
| Acer Nitro 5 AN517-52-77DS | |
| MSI Bravo 17 A4DDR | |
| Total War: Three Kingdoms - 1920x1080 Ultra (incl textures) | |
| MSI GL75 10SFR | |
| Average NVIDIA GeForce RTX 2070 Mobile (n=1) | |
| Acer Nitro 5 AN517-52-77DS | |
| Red Dead Redemption 2 - 1920x1080 Maximum Settings | |
| MSI GL75 10SFR | |
| Average NVIDIA GeForce RTX 2070 Mobile (42.4 - 43, n=3) | |
| Acer Nitro 5 AN517-52-77DS | |
| Doom Eternal - 1920x1080 Ultra Preset | |
| Average NVIDIA GeForce RTX 2070 Mobile (145.1 - 157, n=3) | |
| MSI GL75 10SFR | |
| Acer Nitro 5 AN517-52-77DS | |
| MSI Bravo 17 A4DDR | |
In order to verify whether the frame rates remain largely constant even over a prolonged period of time, we let the game The Witcher 3 run for about 60 minutes at Full HD resolution and maximum quality settings. The character embodied by the player is not moved during this whole period. A drop in frame rates wasn't found.
| low | med. | high | ultra | |
|---|---|---|---|---|
| BioShock Infinite (2013) | 332.8 | 294.5 | 276.3 | 163.7 |
| The Witcher 3 (2015) | 286.3 | 226.7 | 147.1 | 79.9 |
| Dota 2 Reborn (2015) | 147.2 | 129.4 | 121.8 | 115 |
| X-Plane 11.11 (2018) | 107 | 92.3 | 79.6 | |
| Shadow of the Tomb Raider (2018) | 118 | 104 | 100 | 93 |
| Total War: Three Kingdoms (2019) | 232.7 | 129.9 | 88.5 | 63.1 |
| Red Dead Redemption 2 (2019) | 127.9 | 97.5 | 66.4 | 43 |
| Hunt Showdown (2020) | 184.2 | 124 | 101.7 | |
| Doom Eternal (2020) | 217.6 | 162 | 148.9 | 145.1 |
| Gears Tactics (2020) | 226.5 | 169.9 | 115.2 | 90.9 |
| F1 2020 (2020) | 230 | 177 | 148 | 115 |
| Death Stranding (2020) | 149.3 | 126 | 114.6 | 112 |
Emissions - The fans of the MSI laptop produce a lot of noise
Noise emissions
In idle usage, the fans usually run at low speeds. They aren't really noticeable then. Occasionally, they are quiet, and silence prevails. However, the fans turn up under load. Consequently, we register a sound pressure level of 53.2 dB(A) during the stress test. If you switch to the "Extreme Performance" profile within the Dragon Center software, the sound level rises to 54.9 dB(A). The "Silent" mode results in an overall lower noise level - at the expense of computing power.
Noise level
| Idle |
| 32.2 / 32.2 / 32.2 dB(A) |
| Load |
| 52.8 / 53.2 dB(A) |
 | ||
30 dB silent 40 dB(A) audible 50 dB(A) loud |
||
min: | ||
| MSI GL75 10SFR i7-10750H, GeForce RTX 2070 Mobile | Acer Nitro 5 AN517-52-77DS i7-10750H, GeForce RTX 2060 Mobile | Schenker XMG Neo 17 XNE17M19 i7-9750H, GeForce RTX 2060 Mobile | Lenovo Legion Y740-17IRHg-81UJ001VGE i7-9750H, GeForce RTX 2080 Max-Q | MSI GL75 9SEK-056US i7-9750H, GeForce RTX 2060 Mobile | MSI GP75 Leopard 9SD i7-9750H, GeForce GTX 1660 Ti Mobile | Average NVIDIA GeForce RTX 2070 Mobile | Average of class Gaming | |
|---|---|---|---|---|---|---|---|---|
| Noise | 10% | 5% | 12% | 6% | -1% | 2% | 13% | |
| off / environment * (dB) | 30.1 | 30.2 -0% | 31 -3% | 30.3 -1% | 28.1 7% | 29 4% | 28.8 ? 4% | 24.1 ? 20% |
| Idle Minimum * (dB) | 32.2 | 30.2 6% | 31 4% | 30.3 6% | 30.9 4% | 29 10% | 30.4 ? 6% | 25.9 ? 20% |
| Idle Average * (dB) | 32.2 | 30.2 6% | 33 -2% | 30.3 6% | 30.9 4% | 34 -6% | 31.7 ? 2% | 27.4 ? 15% |
| Idle Maximum * (dB) | 32.2 | 30.2 6% | 35 -9% | 30.5 5% | 31 4% | 37 -15% | 34.9 ? -8% | 30.1 ? 7% |
| Load Average * (dB) | 52.8 | 41.5 21% | 43 19% | 40.8 23% | 39 26% | 53 -0% | 46.8 ? 11% | 43.6 ? 17% |
| Witcher 3 ultra * (dB) | 53.8 | 44.5 17% | 45 16% | 40.5 25% | 53.5 1% | 51 5% | ||
| Load Maximum * (dB) | 53.2 | 44.6 16% | 47 12% | 40.8 23% | 53.5 -1% | 55 -3% | 55.8 ? -5% | 54.2 ? -2% |
* ... smaller is better
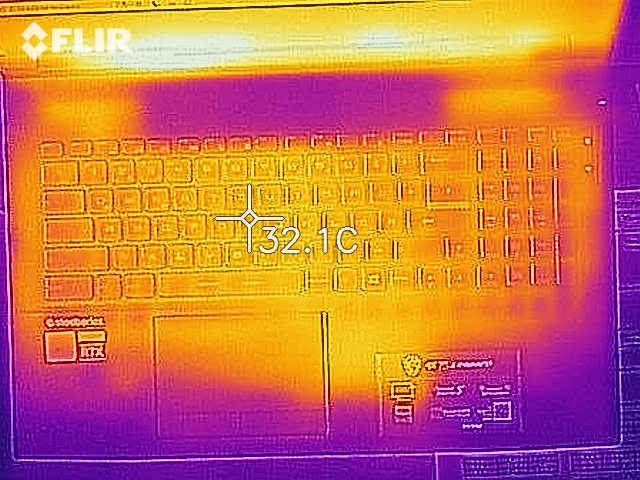
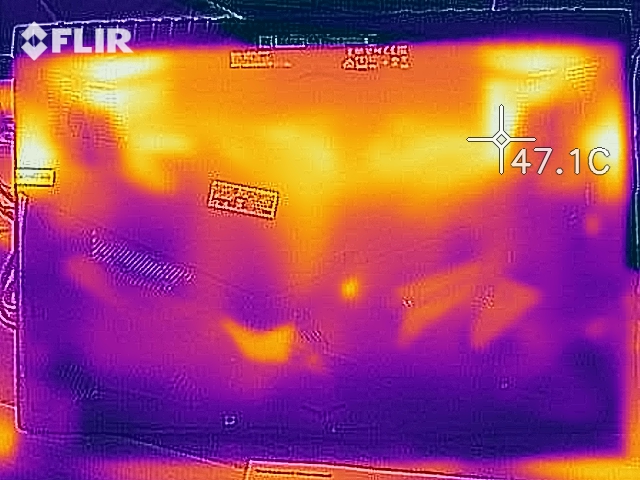
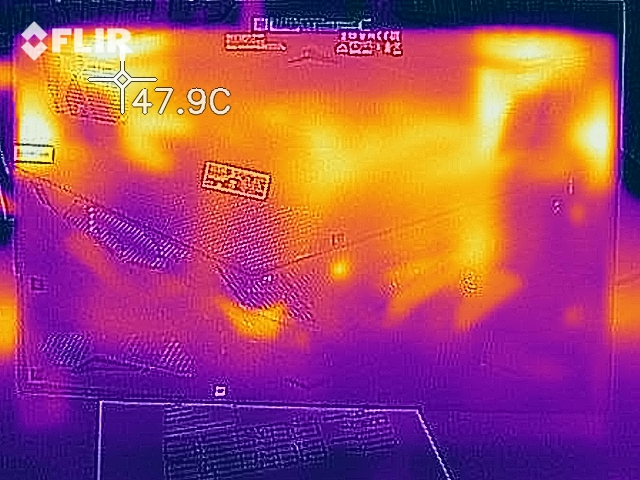
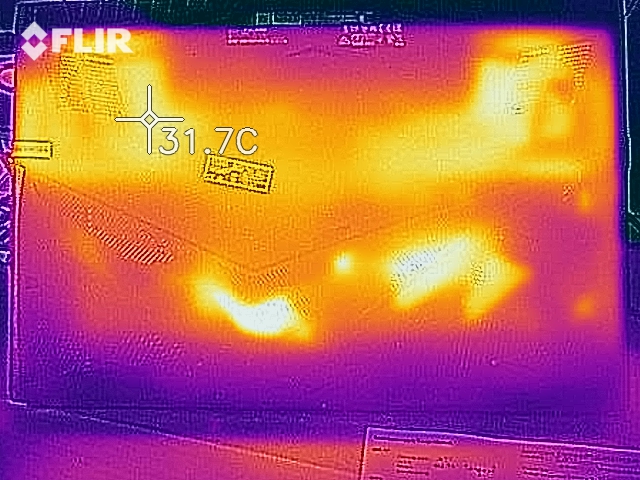
Temperature
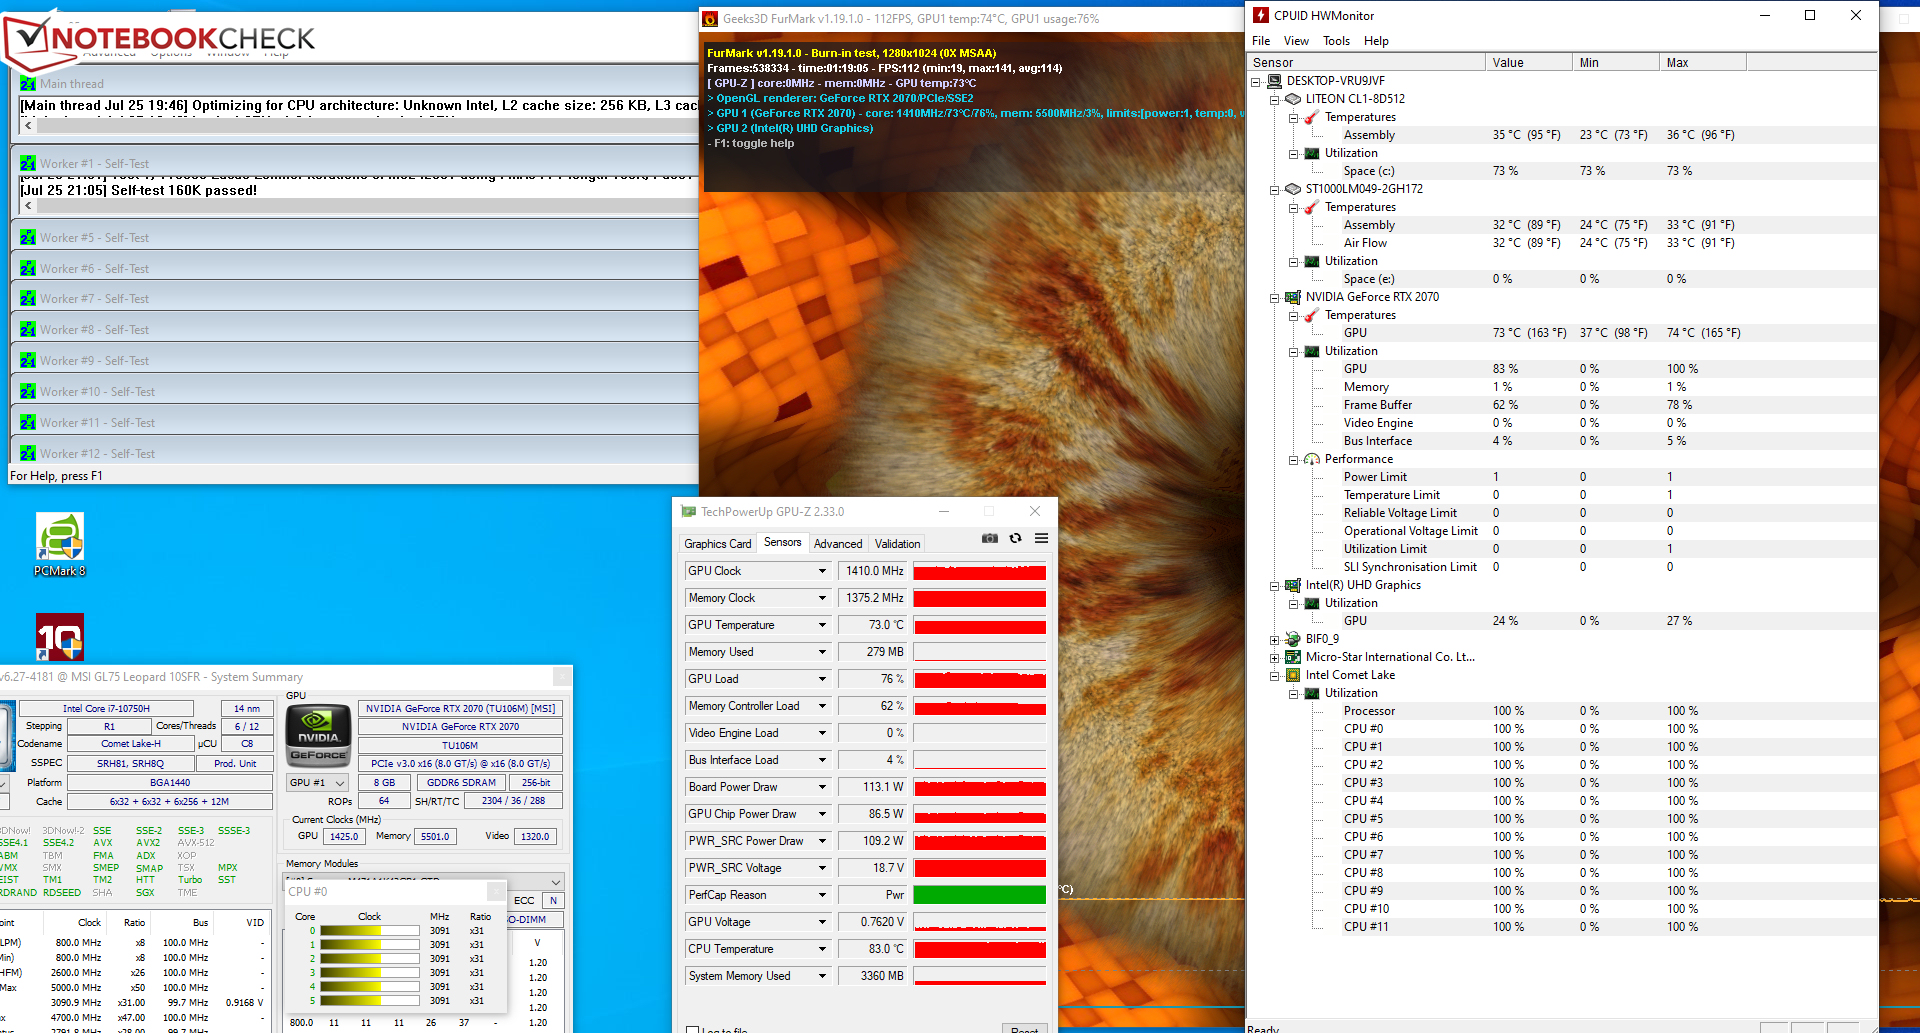
The CPU and GPU process our stress test (Prime95 and FurMark run for at least an hour) at 3.1 GHz and 1,400 to 1,450 MHz, respectively. On battery power, the clock rates are 1.6 to 1.9 GHz (CPU) and 300 MHz (GPU), respectively. The stress test represents an extreme scenario that doesn't occur in everyday life. We use this test to check if the system remains stable even under full load.
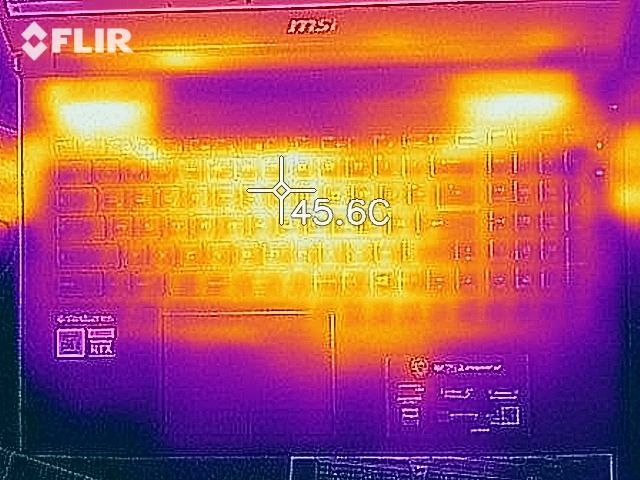
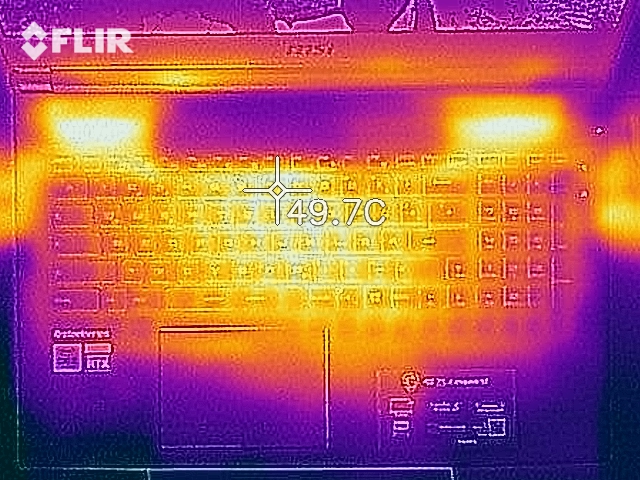
The GL75 doesn't heat up in a particularly strong way. We register temperatures slightly above 40 °C (~104 °F) at some measuring points during the stress test. Heat development is at the same level when performing our The Witcher 3 test. In everyday use, the values are in the green range.
(±) The maximum temperature on the upper side is 44 °C / 111 F, compared to the average of 40.4 °C / 105 F, ranging from 21.2 to 68.8 °C for the class Gaming.
(±) The bottom heats up to a maximum of 42.5 °C / 109 F, compared to the average of 43.2 °C / 110 F
(+) In idle usage, the average temperature for the upper side is 27.4 °C / 81 F, compared to the device average of 33.9 °C / 93 F.
(±) Playing The Witcher 3, the average temperature for the upper side is 36.4 °C / 98 F, compared to the device average of 33.9 °C / 93 F.
(+) The palmrests and touchpad are reaching skin temperature as a maximum (33.3 °C / 91.9 F) and are therefore not hot.
(-) The average temperature of the palmrest area of similar devices was 28.8 °C / 83.8 F (-4.5 °C / -8.1 F).
| MSI GL75 10SFR i7-10750H, GeForce RTX 2070 Mobile | Acer Nitro 5 AN517-52-77DS i7-10750H, GeForce RTX 2060 Mobile | Schenker XMG Neo 17 XNE17M19 i7-9750H, GeForce RTX 2060 Mobile | Lenovo Legion Y740-17IRHg-81UJ001VGE i7-9750H, GeForce RTX 2080 Max-Q | MSI GL75 9SEK-056US i7-9750H, GeForce RTX 2060 Mobile | MSI GP75 Leopard 9SD i7-9750H, GeForce GTX 1660 Ti Mobile | Average NVIDIA GeForce RTX 2070 Mobile | Average of class Gaming | |
|---|---|---|---|---|---|---|---|---|
| Heat | -7% | -4% | -4% | -27% | -3% | -14% | -10% | |
| Maximum Upper Side * (°C) | 44 | 50.6 -15% | 48 -9% | 40.7 7% | 49.4 -12% | 45 -2% | 47.1 ? -7% | 45.2 ? -3% |
| Maximum Bottom * (°C) | 42.5 | 53.8 -27% | 54 -27% | 42.2 1% | 50.6 -19% | 42 1% | 51 ? -20% | 48.2 ? -13% |
| Idle Upper Side * (°C) | 29.1 | 26.6 9% | 26 11% | 31.9 -10% | 39 -34% | 30 -3% | 31.8 ? -9% | 31 ? -7% |
| Idle Bottom * (°C) | 29.5 | 27.8 6% | 27 8% | 33.9 -15% | 42 -42% | 32 -8% | 34.8 ? -18% | 34.3 ? -16% |
* ... smaller is better
Speakers
MSI GL75 10SFR audio analysis
(±) | speaker loudness is average but good (75.6 dB)
Bass 100 - 315 Hz
(-) | nearly no bass - on average 20.3% lower than median
(±) | linearity of bass is average (13.1% delta to prev. frequency)
Mids 400 - 2000 Hz
(+) | balanced mids - only 1.9% away from median
(±) | linearity of mids is average (7% delta to prev. frequency)
Highs 2 - 16 kHz
(+) | balanced highs - only 2.3% away from median
(+) | highs are linear (3.7% delta to prev. frequency)
Overall 100 - 16.000 Hz
(+) | overall sound is linear (13.9% difference to median)
Compared to same class
» 22% of all tested devices in this class were better, 7% similar, 70% worse
» The best had a delta of 6%, average was 18%, worst was 132%
Compared to all devices tested
» 16% of all tested devices were better, 4% similar, 80% worse
» The best had a delta of 4%, average was 23%, worst was 134%
Energy management - The MSI Leopard doesn't offer long battery life
Energy consumption
In idle usage, we register a maximum power consumption of 18 watts - a high value, but it's quite normal for a device in this performance class. The stress test lets the demand increase up to 224 watts. Moreover, we measure an average power consumption of 203 watts (196 to 212 watts) during the execution of our The Witcher 3 test. The rated output of the power adapter is 230 watts.
| Off / Standby | |
| Idle | |
| Load |
|
Key:
min: | |
| MSI GL75 10SFR i7-10750H, GeForce RTX 2070 Mobile | Acer Nitro 5 AN517-52-77DS i7-10750H, GeForce RTX 2060 Mobile | Schenker XMG Neo 17 XNE17M19 i7-9750H, GeForce RTX 2060 Mobile | Lenovo Legion Y740-17IRHg-81UJ001VGE i7-9750H, GeForce RTX 2080 Max-Q | MSI GL75 9SEK-056US i7-9750H, GeForce RTX 2060 Mobile | MSI GP75 Leopard 9SD i7-9750H, GeForce GTX 1660 Ti Mobile | Average NVIDIA GeForce RTX 2070 Mobile | Average of class Gaming | |
|---|---|---|---|---|---|---|---|---|
| Power Consumption | 34% | 14% | -18% | 15% | 11% | -42% | -11% | |
| Idle Minimum * (Watt) | 12 | 5.4 55% | 11 8% | 15.7 -31% | 10.7 11% | 10 17% | 21.4 ? -78% | 13 ? -8% |
| Idle Average * (Watt) | 16.6 | 9.8 41% | 14 16% | 26.3 -58% | 15.2 8% | 15 10% | 26.3 ? -58% | 18.7 ? -13% |
| Idle Maximum * (Watt) | 18 | 10.9 39% | 20 -11% | 28 -56% | 17.8 1% | 22 -22% | 32.2 ? -79% | 24.3 ? -35% |
| Load Average * (Watt) | 130 | 104 20% | 100 23% | 136 -5% | 88.2 32% | 92 29% | 114.8 ? 12% | 110.2 ? 15% |
| Witcher 3 ultra * (Watt) | 203 | 134.3 34% | 151 26% | 160 21% | 147.8 27% | 153 25% | ||
| Load Maximum * (Watt) | 224 | 193 14% | 174 22% | 177 21% | 206.5 8% | 216 4% | 238 ? -6% | 258 ? -15% |
* ... smaller is better
Battery life
The gaming laptop achieves a runtime of 3:54 h in our practical WLAN test (accessing websites using a script). In addition, the 17.3-incher ends our video test after 5:11 h. We let the short film Big Buck Bunny (H.264 encoding, 1920x1080 pixels) run in a continuous loop here. Test conditions: The energy-saving functions and the wireless modules (only during the video test) are deactivated; the display brightness is adjusted to about 150 cd/m².
| MSI GL75 10SFR i7-10750H, GeForce RTX 2070 Mobile, 51 Wh | Acer Nitro 5 AN517-52-77DS i7-10750H, GeForce RTX 2060 Mobile, 57.48 Wh | Schenker XMG Neo 17 XNE17M19 i7-9750H, GeForce RTX 2060 Mobile, 46 Wh | Lenovo Legion Y740-17IRHg-81UJ001VGE i7-9750H, GeForce RTX 2080 Max-Q, 76 Wh | MSI GL75 9SEK-056US i7-9750H, GeForce RTX 2060 Mobile, 51 Wh | MSI GP75 Leopard 9SD i7-9750H, GeForce GTX 1660 Ti Mobile, 51 Wh | Average of class Gaming | |
|---|---|---|---|---|---|---|---|
| Battery runtime | 83% | 17% | -15% | 19% | -23% | 68% | |
| Reader / Idle (h) | 6.4 | 11 72% | 6.7 5% | 3.8 -41% | 7.9 23% | 4.8 -25% | 8.71 ? 36% |
| H.264 (h) | 5.2 | 7.3 40% | 2.8 -46% | 8.64 ? 66% | |||
| WiFi v1.3 (h) | 3.9 | 6.6 69% | 4.7 21% | 3 -23% | 4.2 8% | 3.2 -18% | 7.15 ? 83% |
| Load (h) | 0.8 | 2 150% | 1 25% | 1.2 50% | 1 25% | 0.6 -25% | 1.502 ? 88% |
Pros
Cons
Verdict
The MSI GL75 does what is expected of it. It brings all modern games smoothly onto the screen. No compromises in terms of resolution and quality level have to be made for this. The combination of a Core i7-10750H hexa-core processor and a GeForce RTX 2070 GPU makes this possible.
The powerful hardware needs to be cooled. That's why the laptop's two fans turn up heavily under load and produce a lot of noise. Positive consequence: The case only heats up moderately.
MSI delivers a well-rounded gaming laptop at a reasonable price with the GL75 Leopard 10SFR-221.
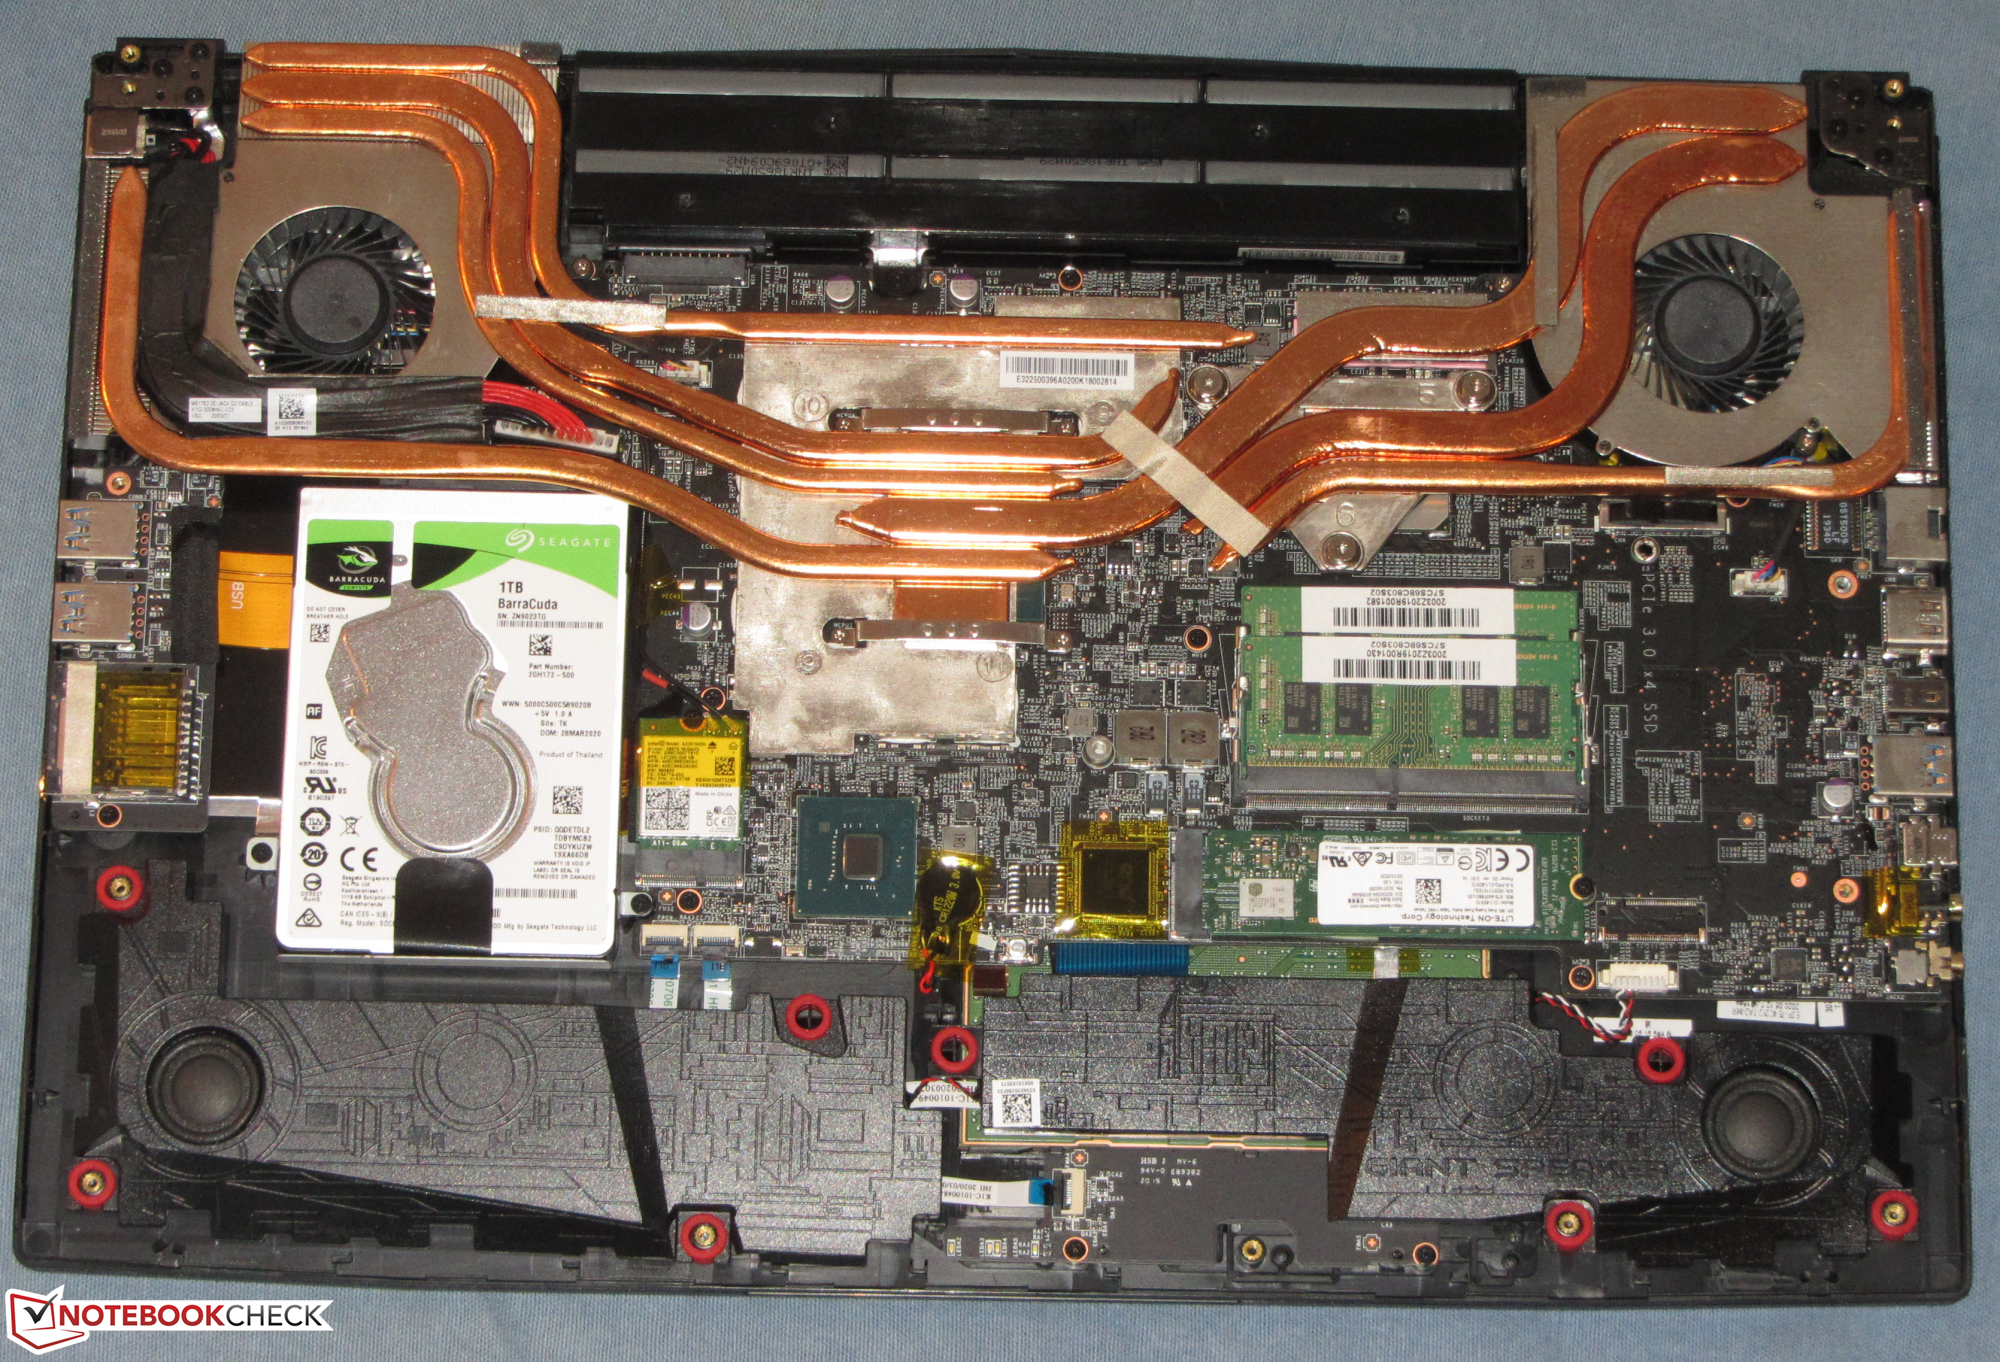
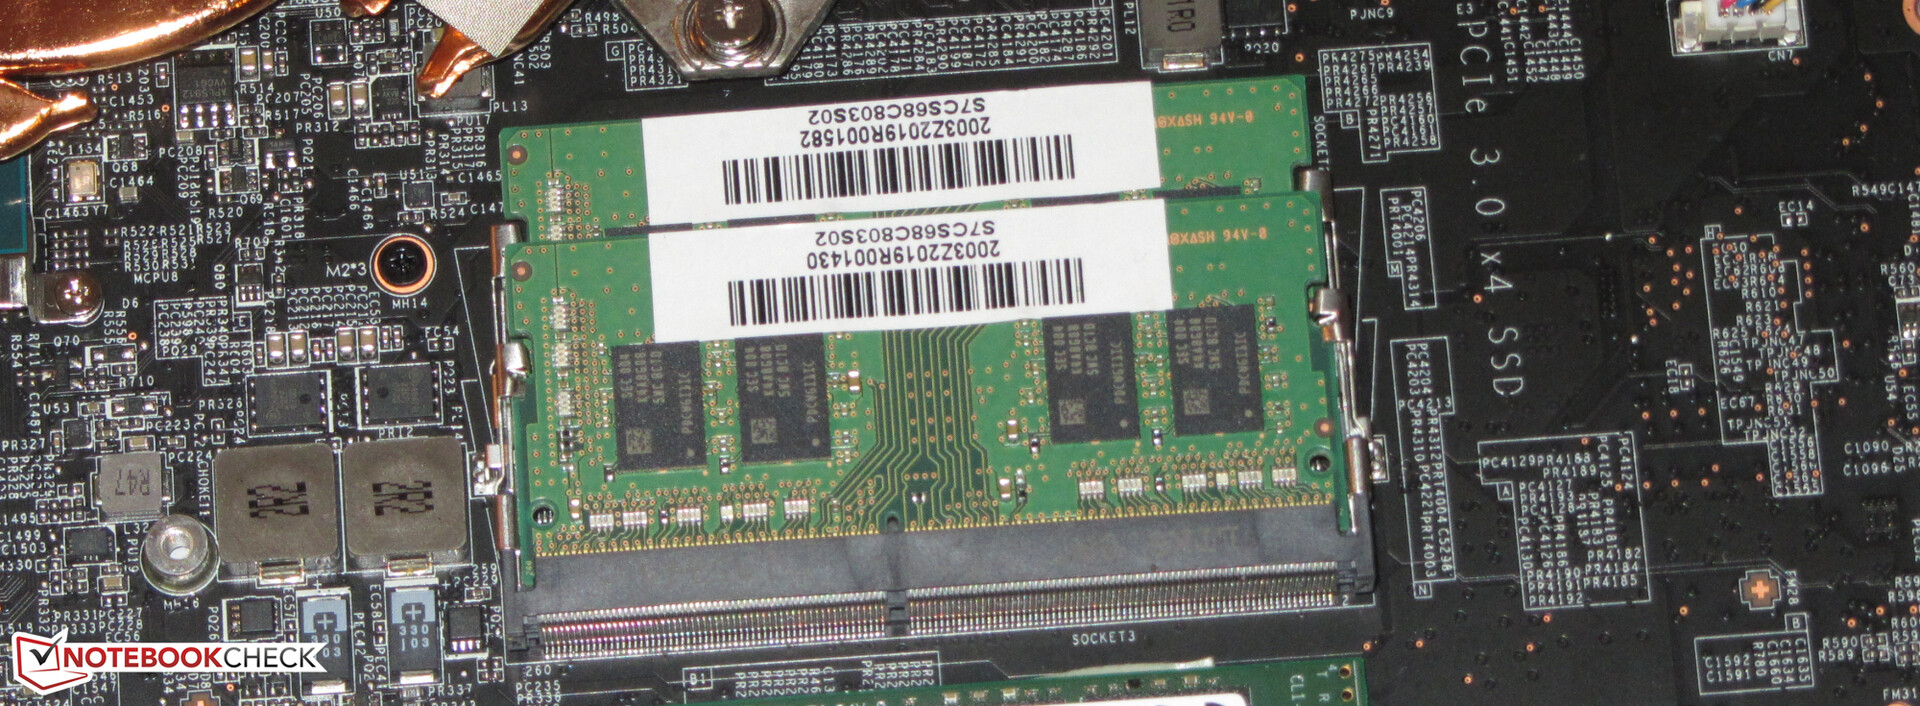
The laptop comes with a fast NVMe SSD that offers a total of 512 GB of storage space. Since a gaming laptop can never have too much storage, MSI also includes a 1 TB hard drive (7,200 rpm). Both storage devices can be replaced. To do so, the bottom cover of the case would have to be removed.
The matte 144 Hz Full HD IPS display scores points with stable viewing angles, sufficient brightness, good contrast, short response times, and great color reproduction. The color-space coverage is also pleasing.
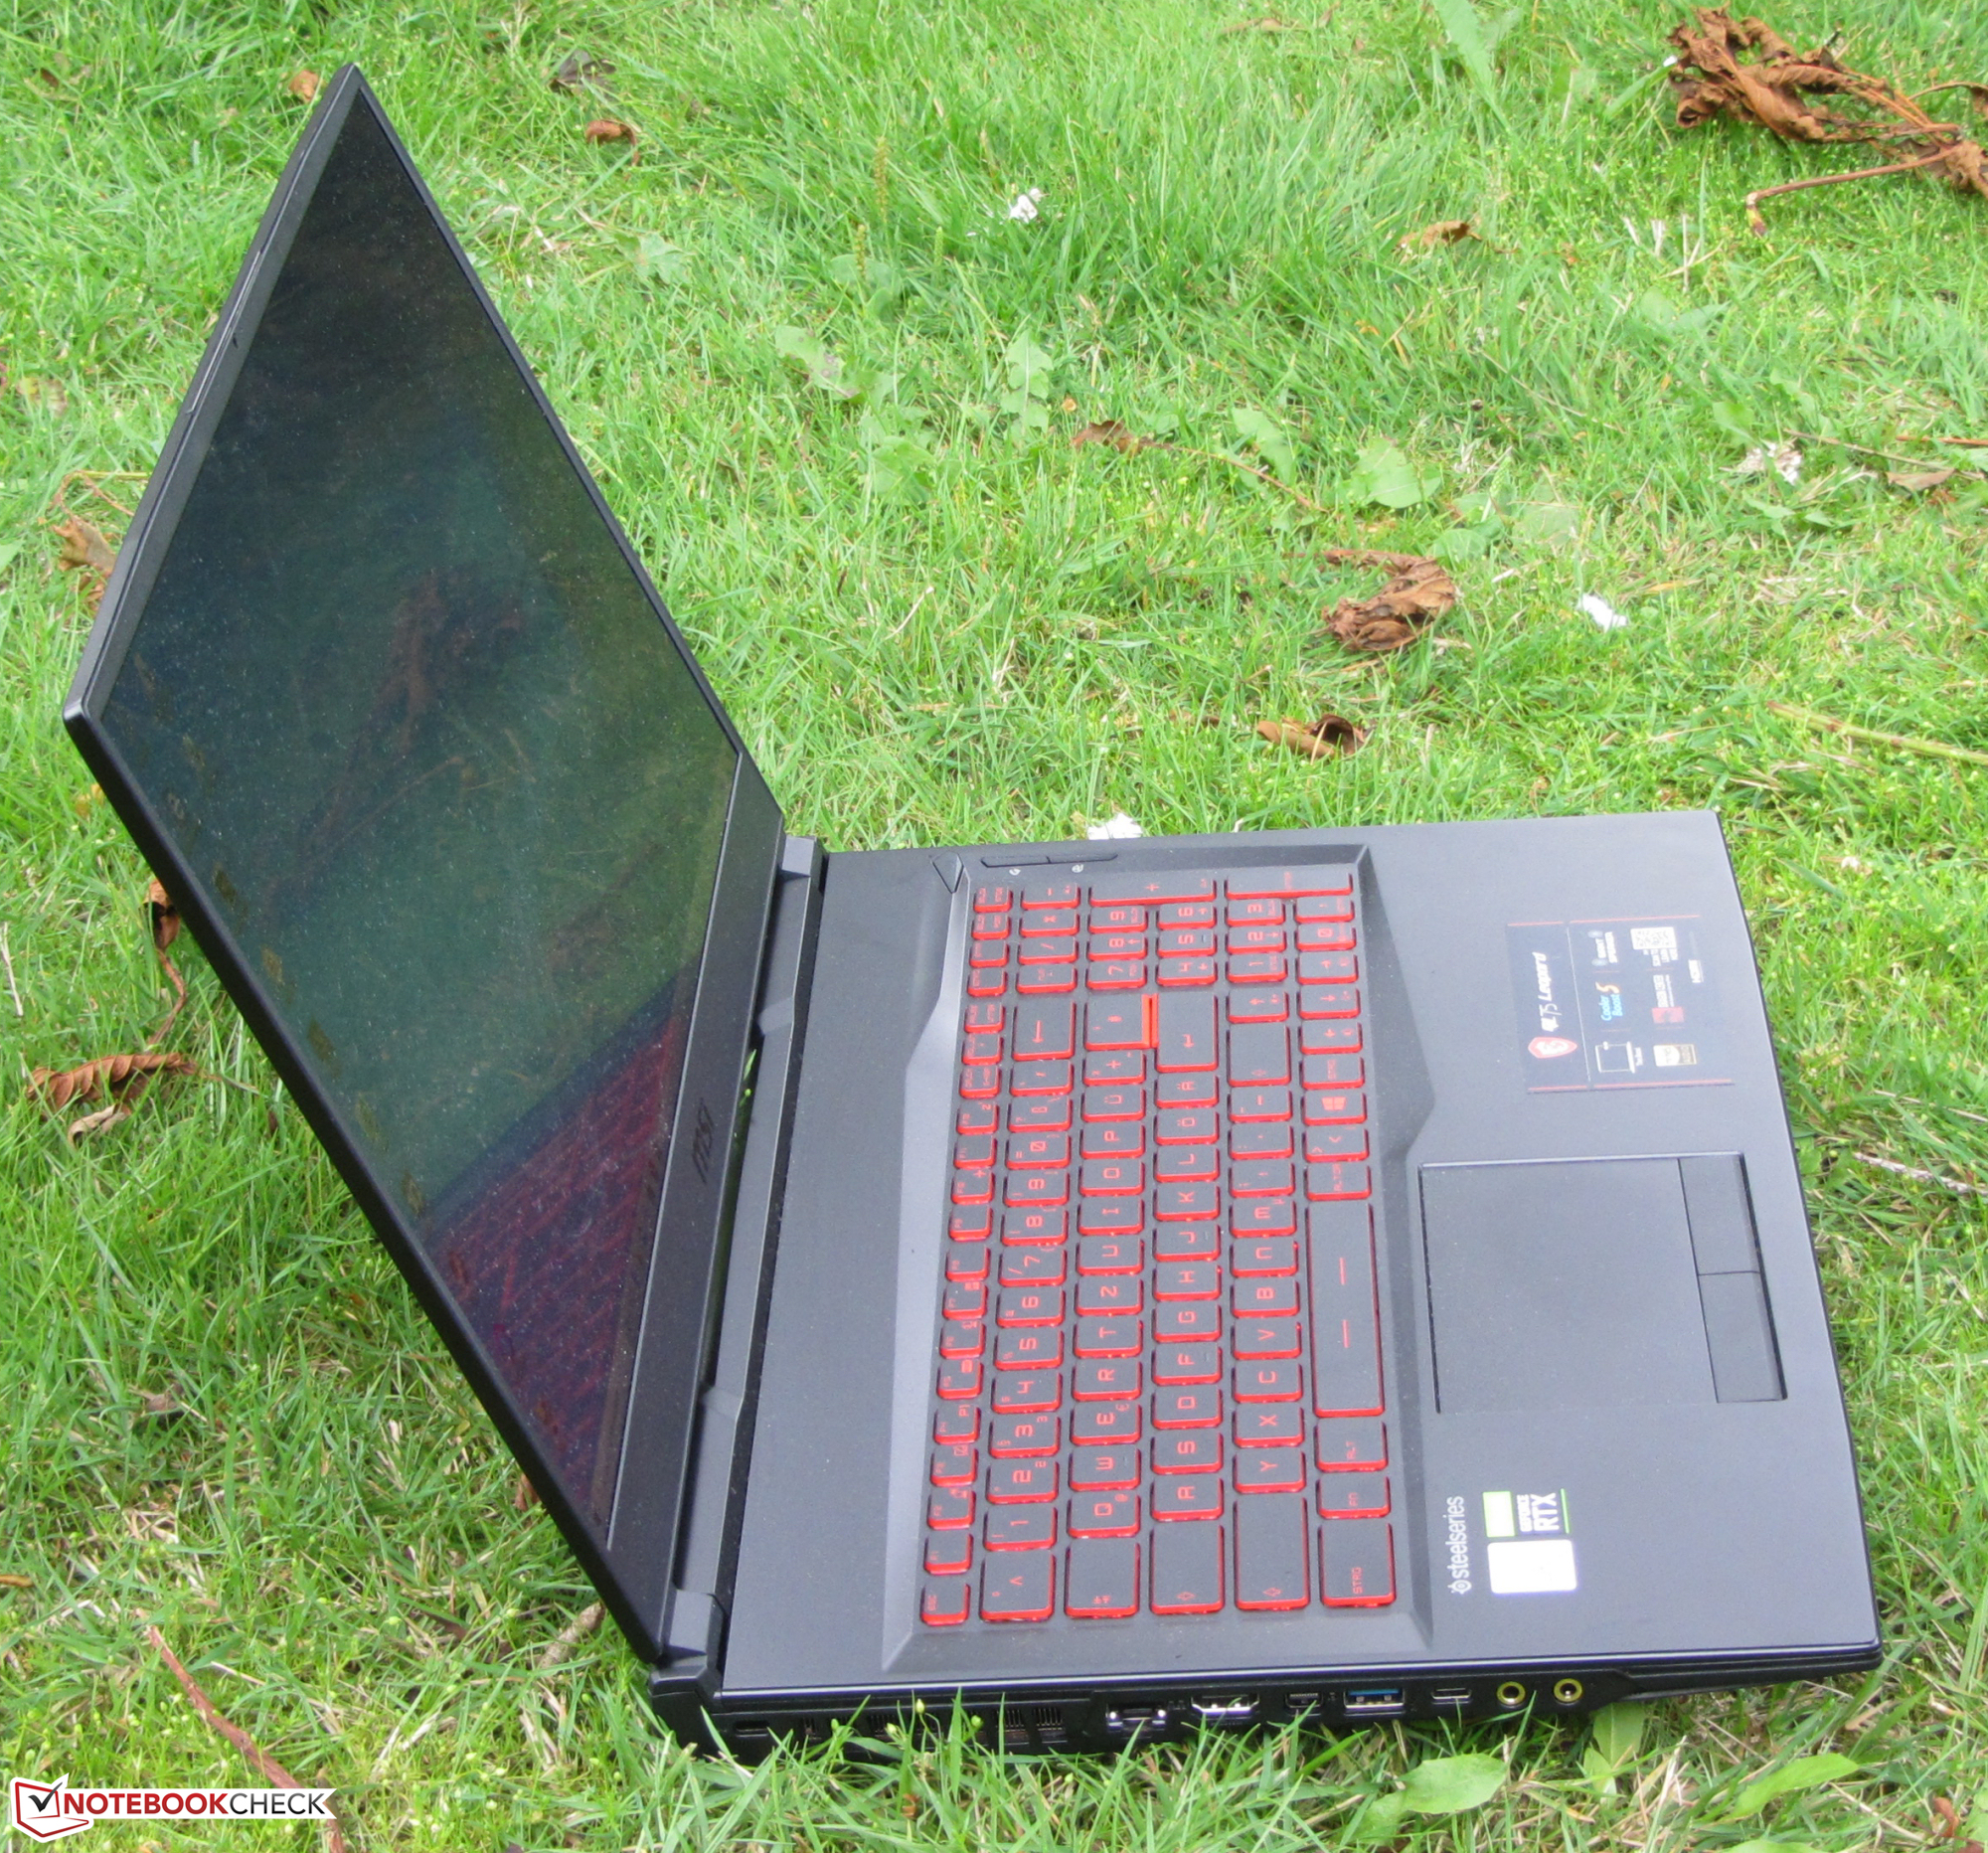
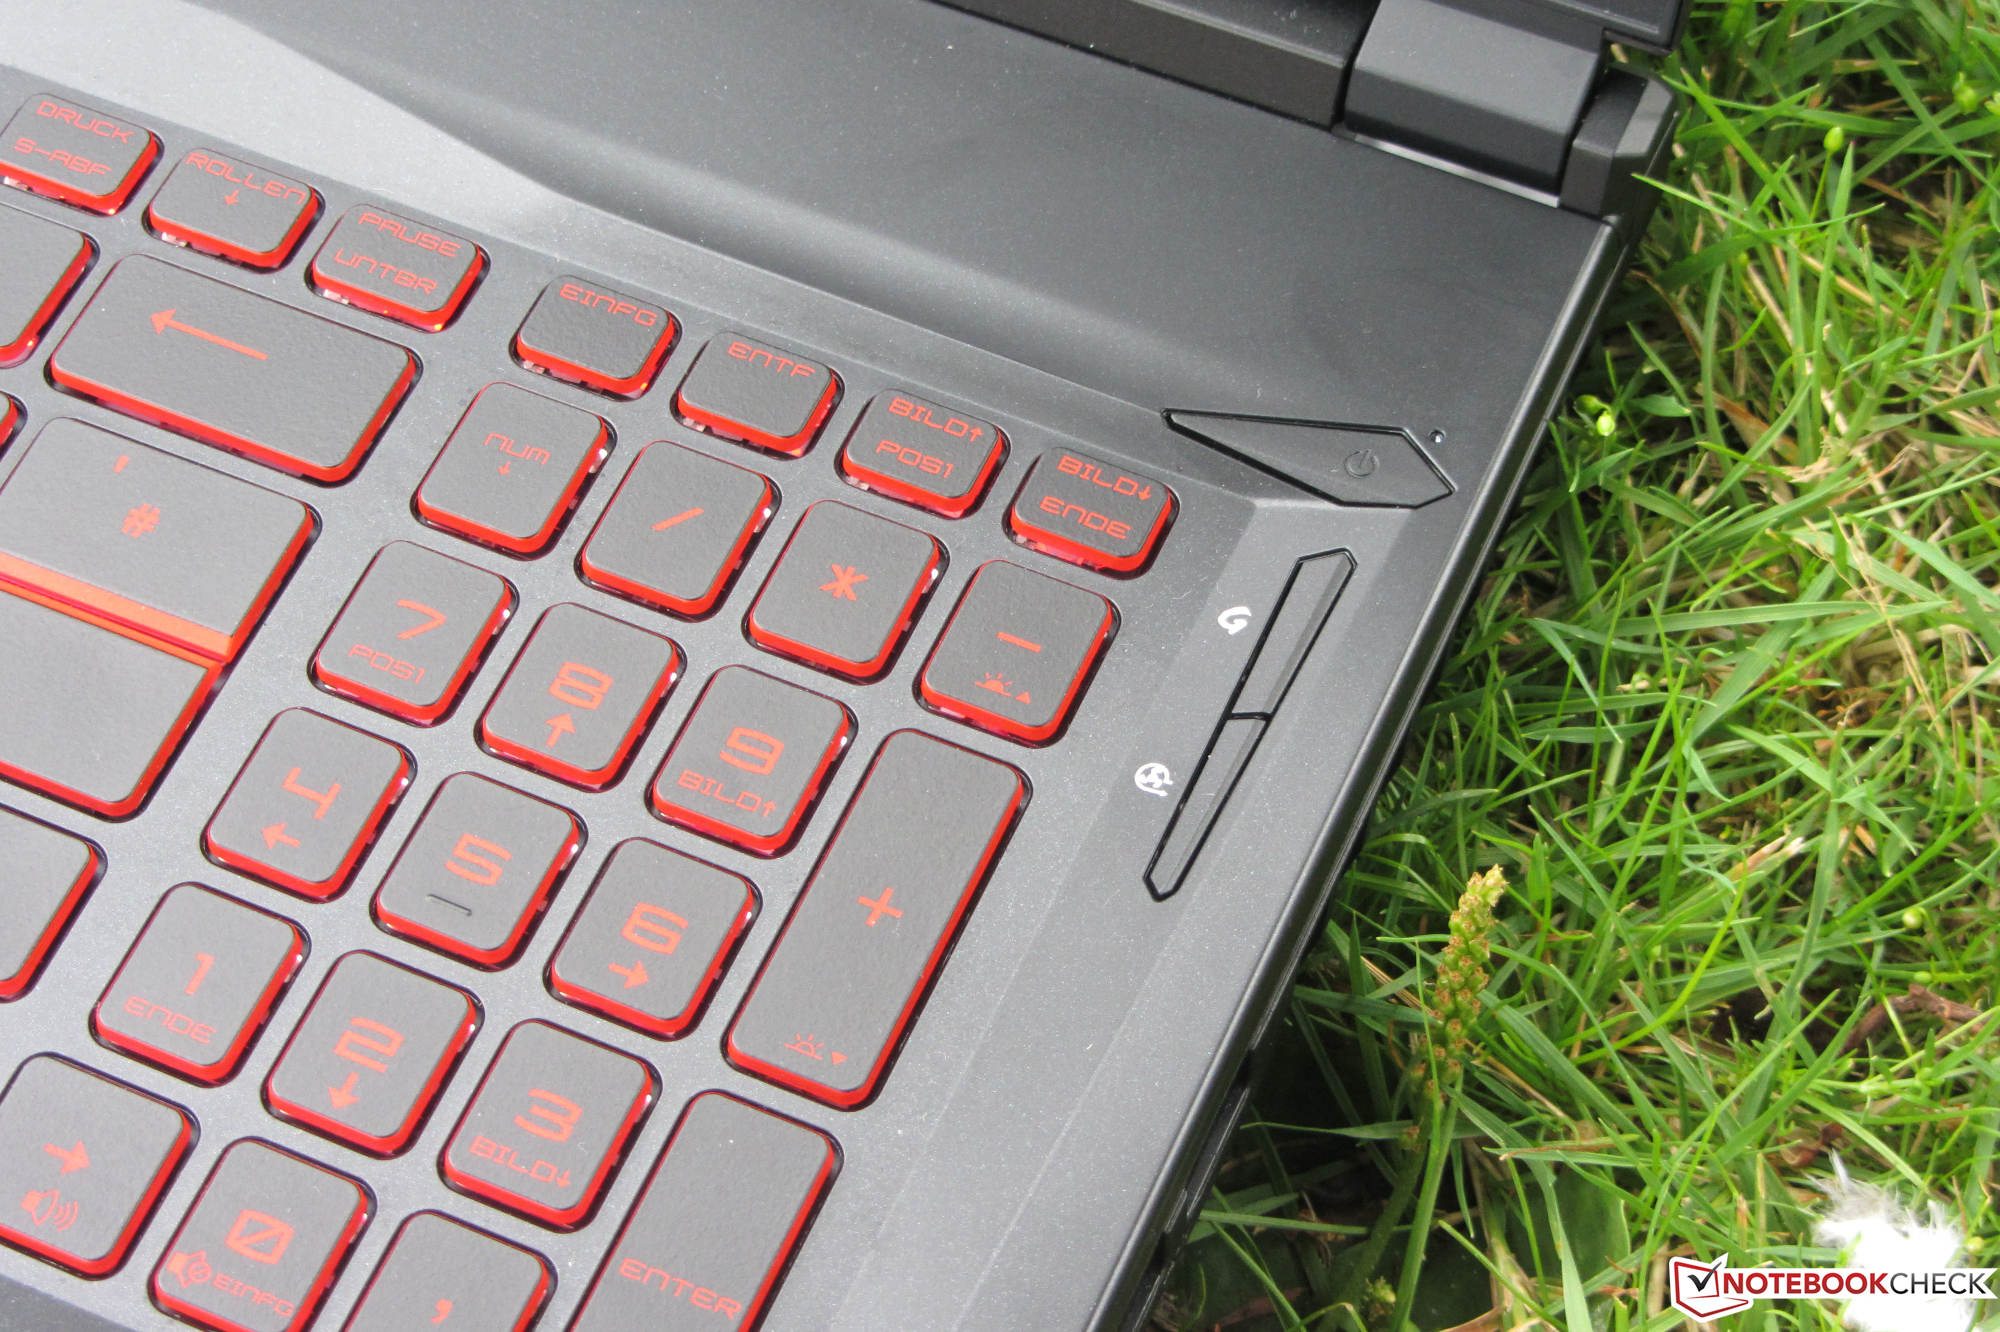
The battery runtimes won't knock anyone's socks off, but they're alright for a gaming laptop. The backlit keyboard has proven its everyday suitability. However, it doesn't offer RGB lighting like the predecessor and the sibling model did but only has a monochrome lighting in red. Moreover, the laptop doesn't offer a Thunderbolt 3 port. MSI has only installed a USB Type-C 3.2 Gen 2 port that doesn't support DisplayPort via USB-C or Power Delivery.
MSI GL75 10SFR
- 07/31/2020 v7 (old)
Sascha Mölck
Price comparison

