Acer Nitro 5 AN517-52 in review: Largely well-rounded gaming laptop offers decent battery life

The Acer Nitro 5 series is made of inexpensive, entry-level and mid-range gaming laptops. The devices are positioned below Acer's Predator series. With the Nitro 5 AN517-52-77DS, we have the current 17.3-inch top-of-the-line model of the Nitro 5 series at hand. Competitors include devices like the Asus TUF A17 FA706IU, the Schenker XMG Pro 17 PB71RD-G, the Lenovo Legion Y540-17IRH and the HP Pavilion Gaming 17.
Rating | Date | Model | Weight | Height | Size | Resolution | Price |
|---|---|---|---|---|---|---|---|
| 80.6 % v7 (old) | 06 / 2020 | Acer Nitro 5 AN517-52-77DS i7-10750H, GeForce RTX 2060 Mobile | 2.2 kg | 24.9 mm | 17.30" | 1920x1080 | |
| 82.9 % v7 (old) | 05 / 2020 | Asus TUF A17 FA706IU-AS76 R7 4800H, GeForce GTX 1660 Ti Mobile | 2.6 kg | 26 mm | 17.30" | 1920x1080 | |
| 83.2 % v7 (old) | 02 / 2020 | Schenker XMG Pro 17 PB71RD-G i7-9750H, GeForce RTX 2060 Mobile | 2.8 kg | 30 mm | 17.30" | 1920x1080 | |
| 81.6 % v7 (old) | 07 / 2019 | HP Pavilion Gaming 17-cd0085cl i7-9750H, GeForce GTX 1660 Ti Max-Q | 2.8 kg | 25 mm | 17.30" | 1920x1080 | |
| 82.3 % v7 (old) | 07 / 2019 | Lenovo Legion Y540-17IRH i5-9300H, GeForce GTX 1660 Ti Mobile | 2.8 kg | 26.3 mm | 17.30" | 1920x1080 |
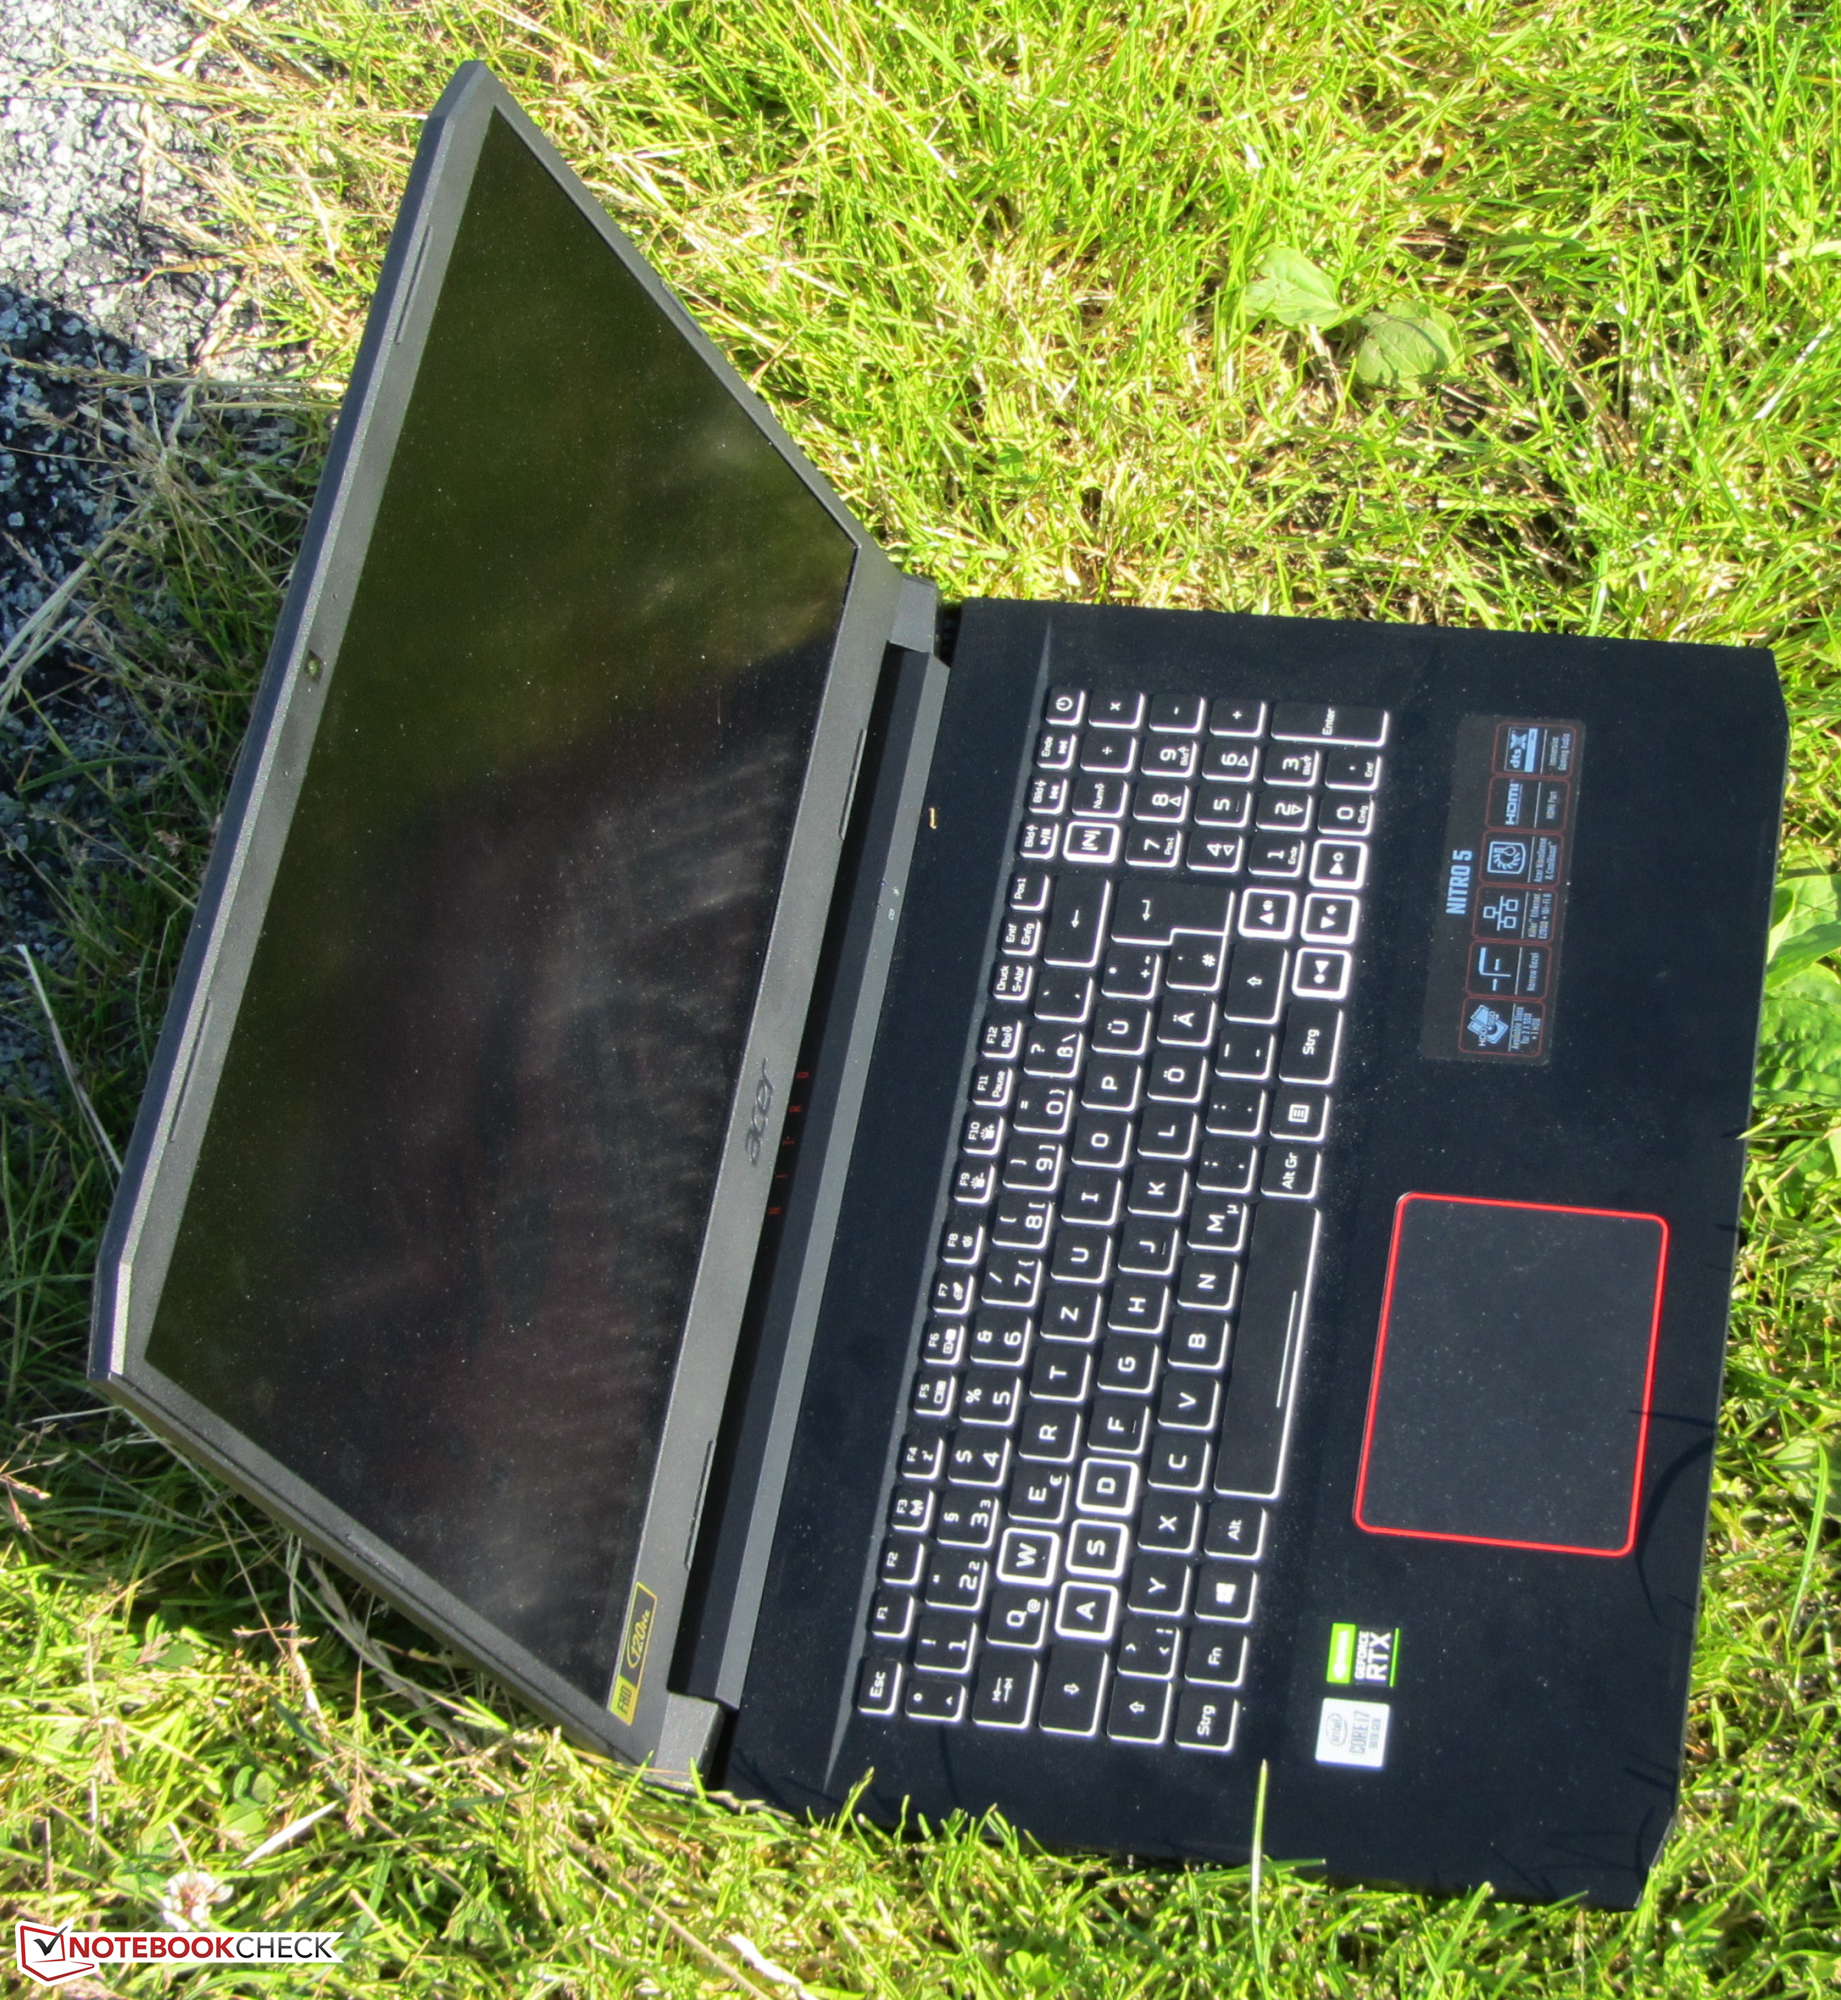
Case - Acer has chosen plastic for the Nitro
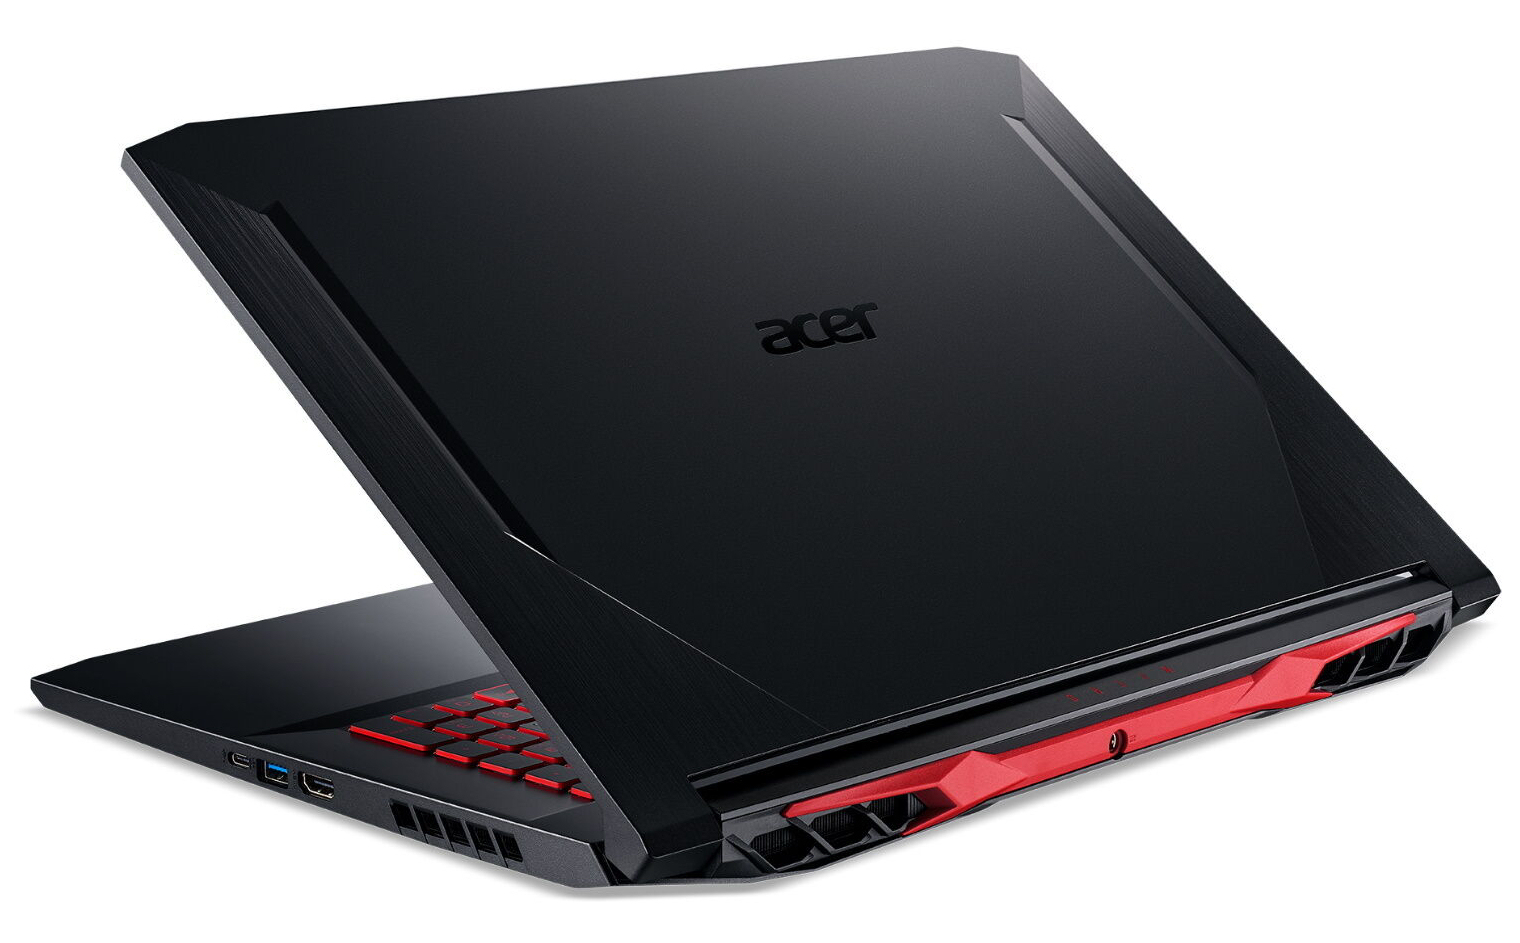
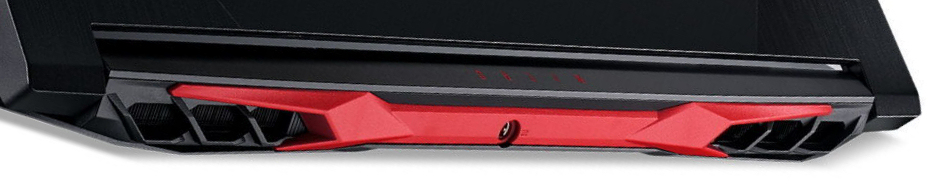
The case of the Nitro 5 is made completely of black plastic. Two red elements (area between the rear air vents, ring around the touchpad) provide color accents. Acer has relied almost entirely on smooth surfaces. Only the left and right sides of the lid's back contain a brushed metal imitation. The laptop doesn't offer a maintenance hatch. The battery is firmly built into the device.
The Nitro 5 shows a good workmanship. Material protrusions aren't noticeable, and the gap dimensions are correct too. On the other hand, there is room for improvement in terms of stability. In this way, the base unit and the lid in particular should have a greater rigidity. Exerting pressure on the back of the lid doesn't lead to changes on the display's content. The hinges hold the lid firmly in position. Furthermore, opening the lid with one hand is possible.
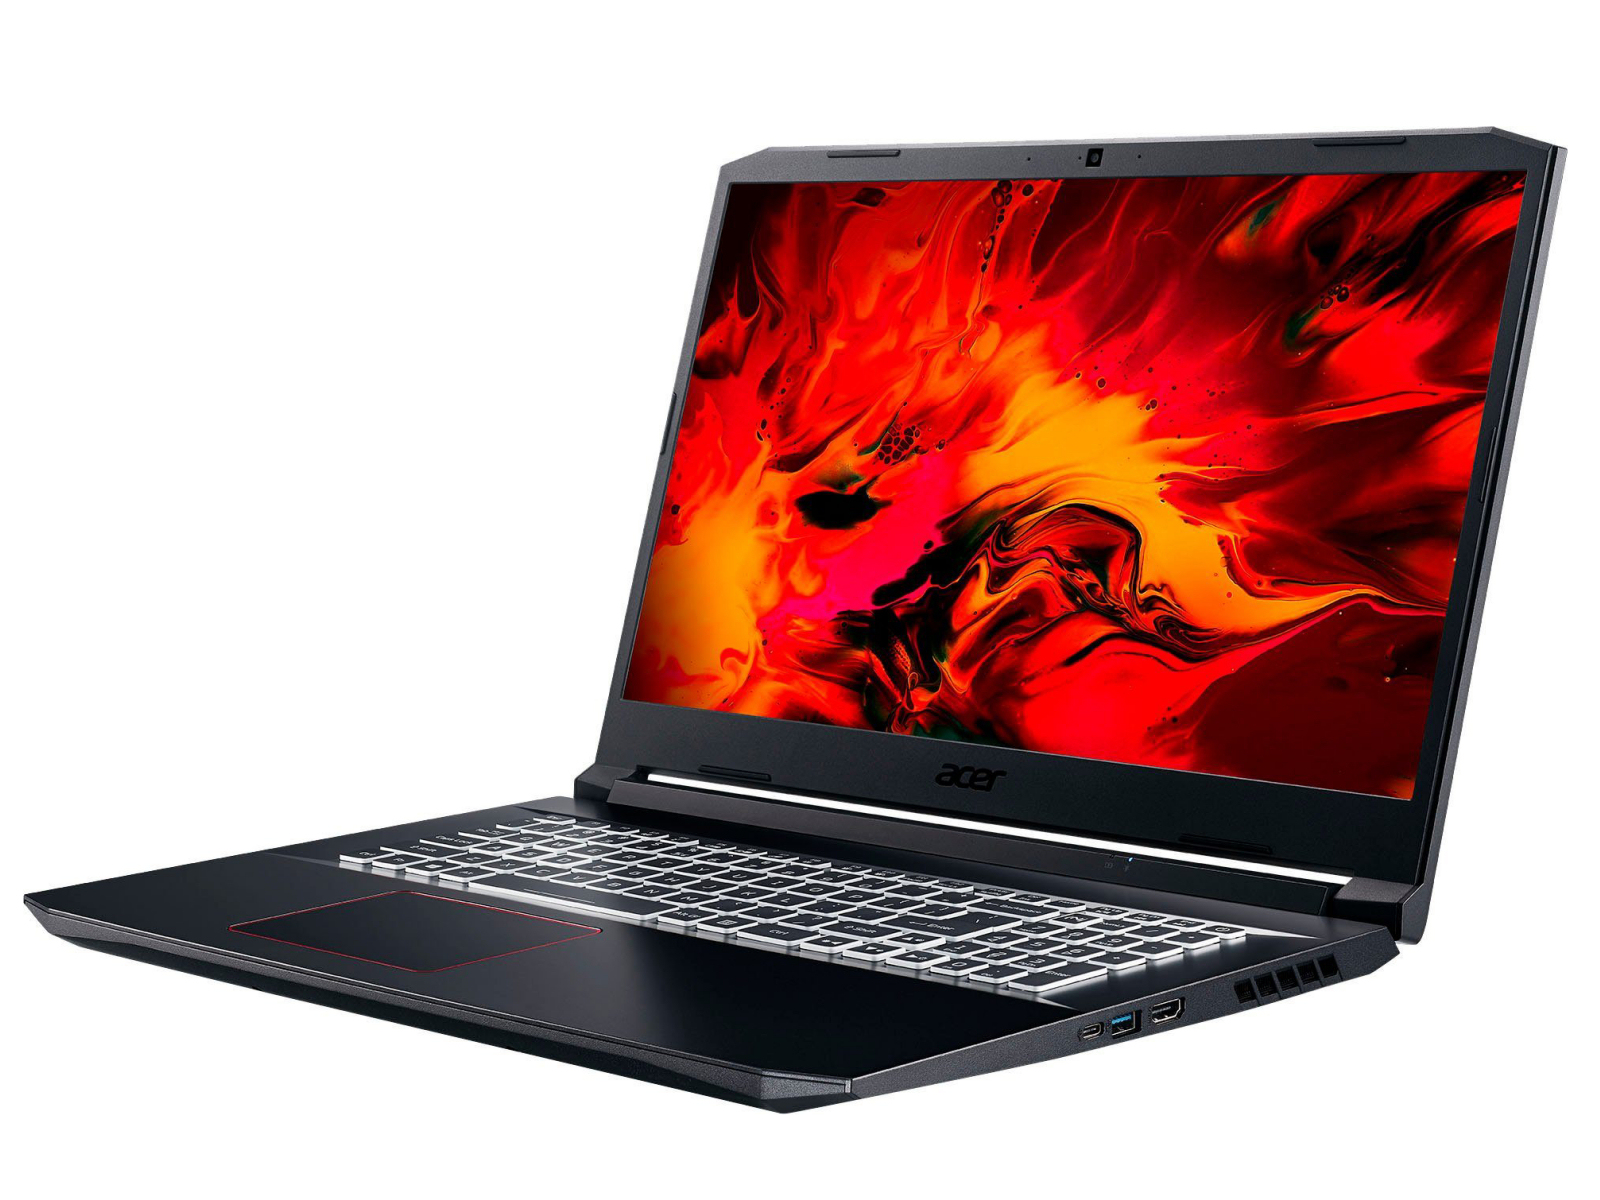
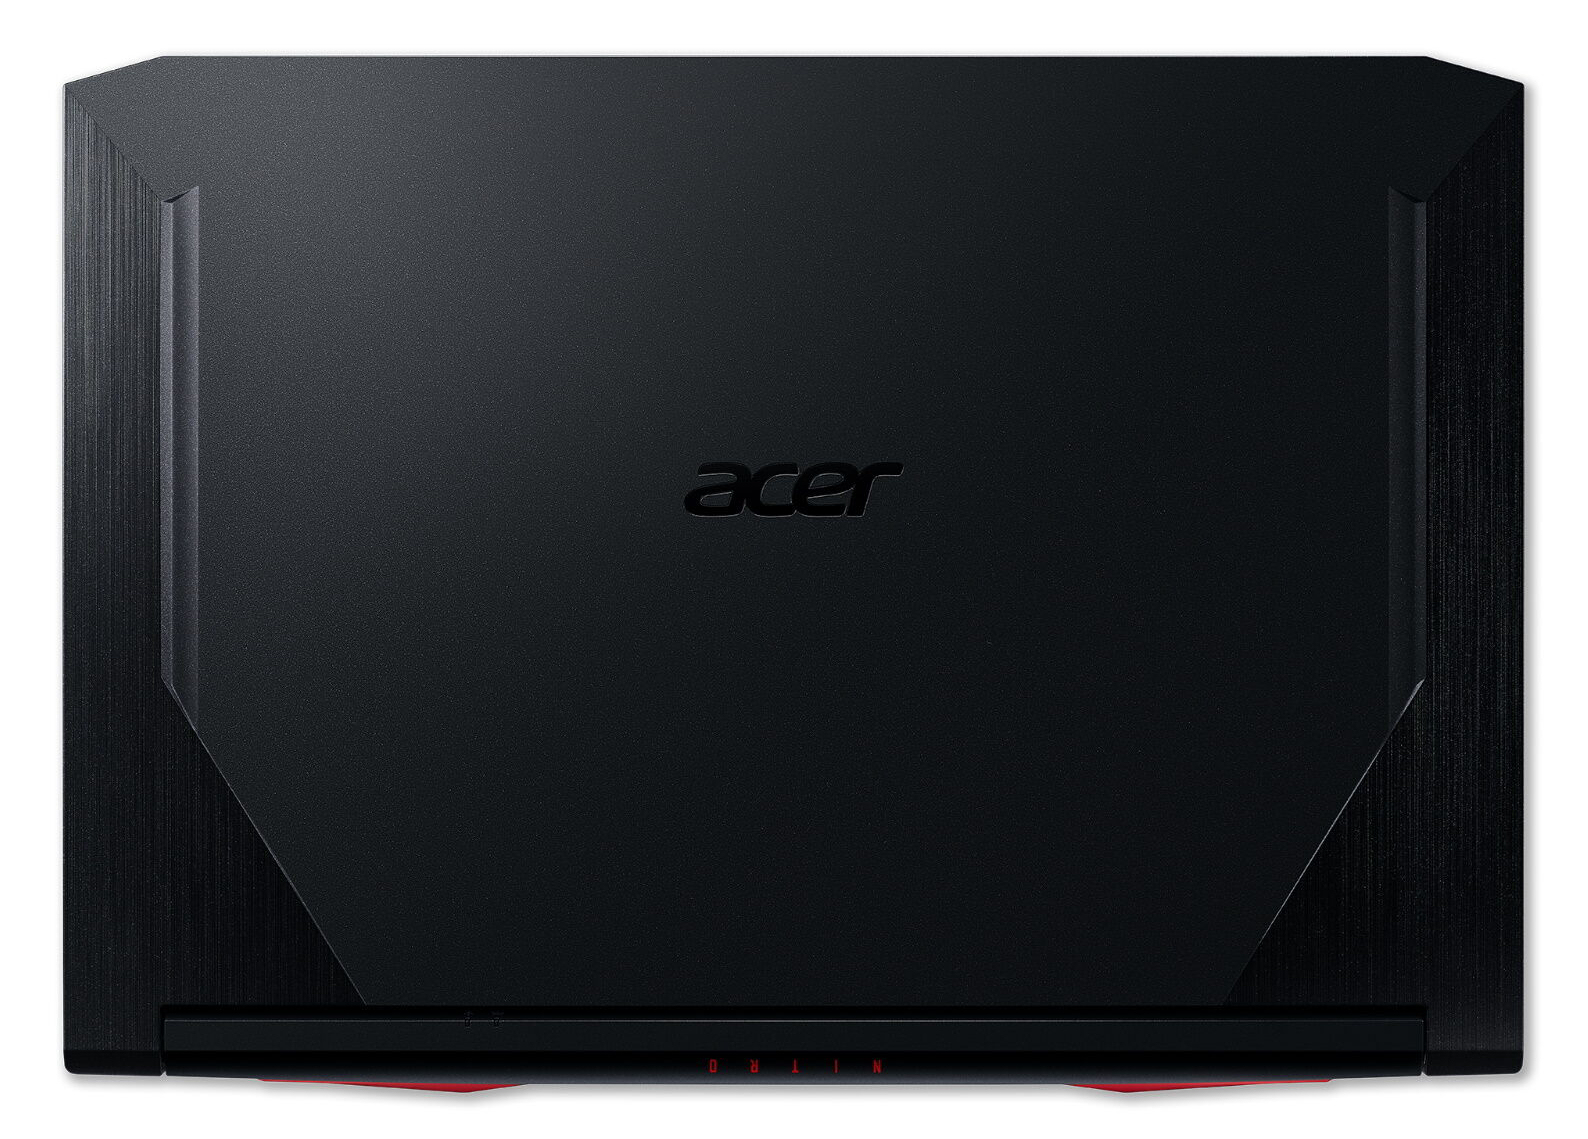
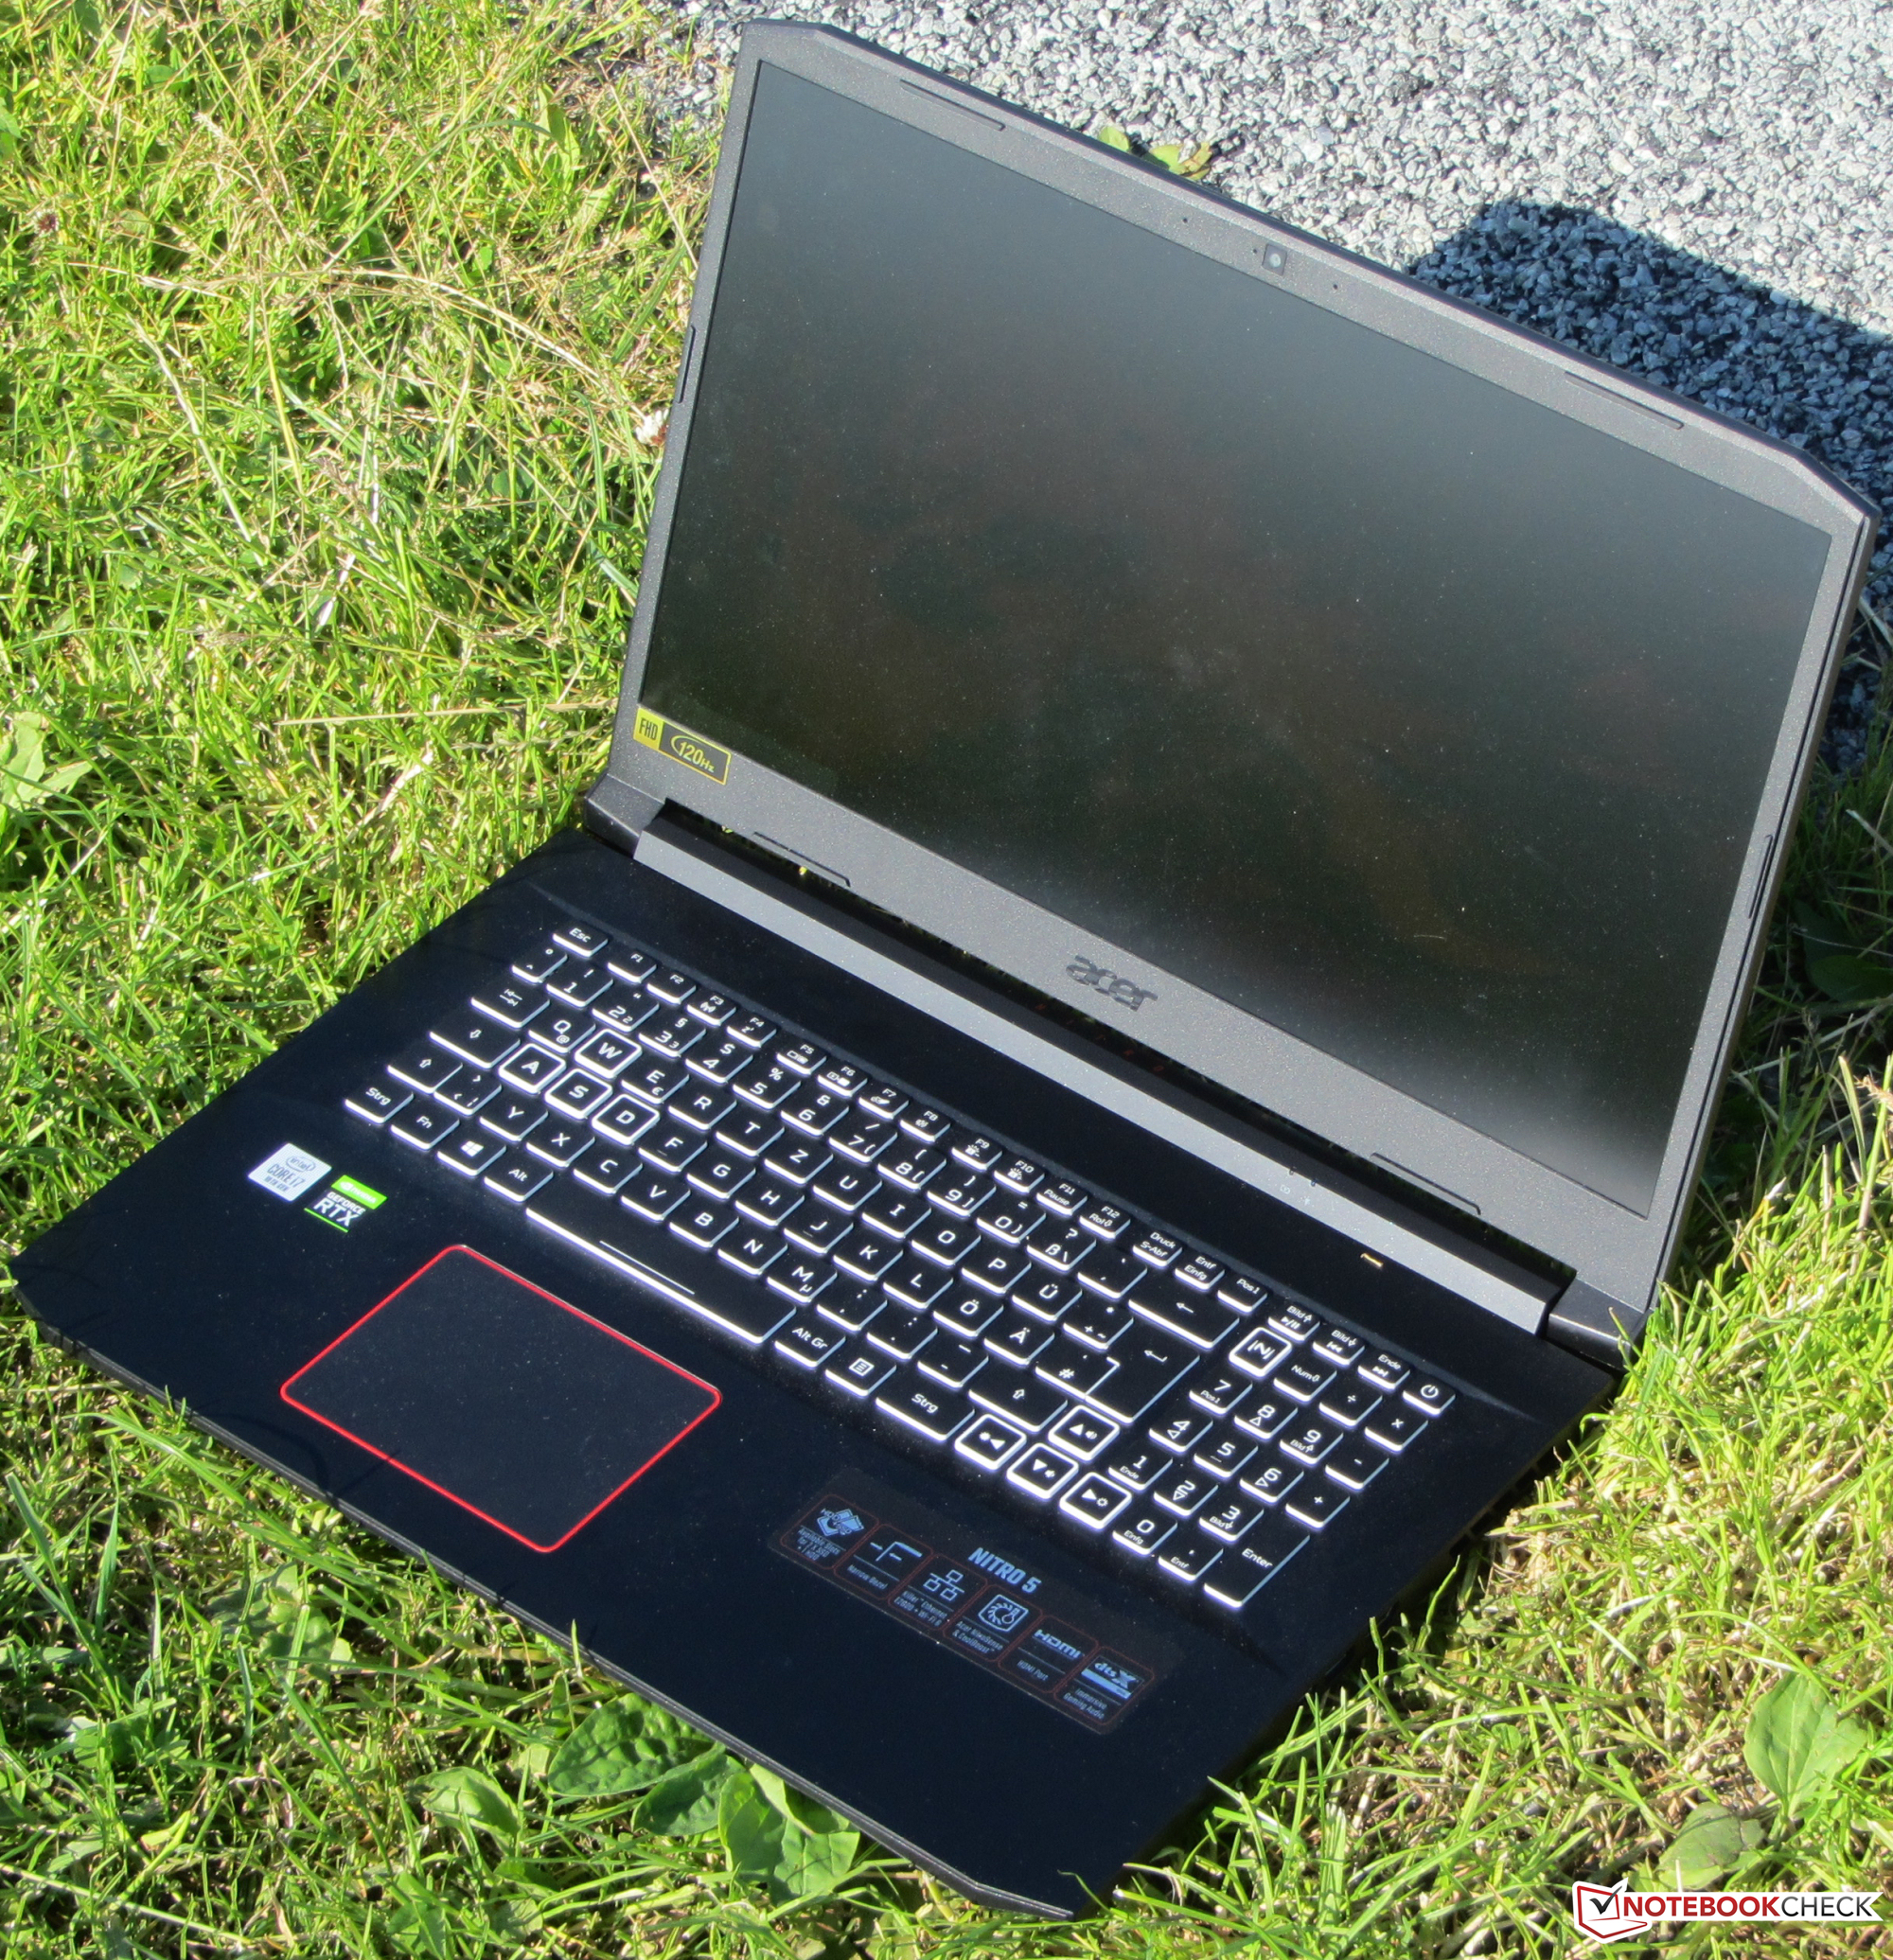
The Acer laptop can't deny its relation to the predecessor model. The basic shape as well as the width and depth have remained largely the same. However, the new model is a bit thinner and weighs approximately 600 grams less. At a weight of about 2.2 kg, it also undercuts its competitors.
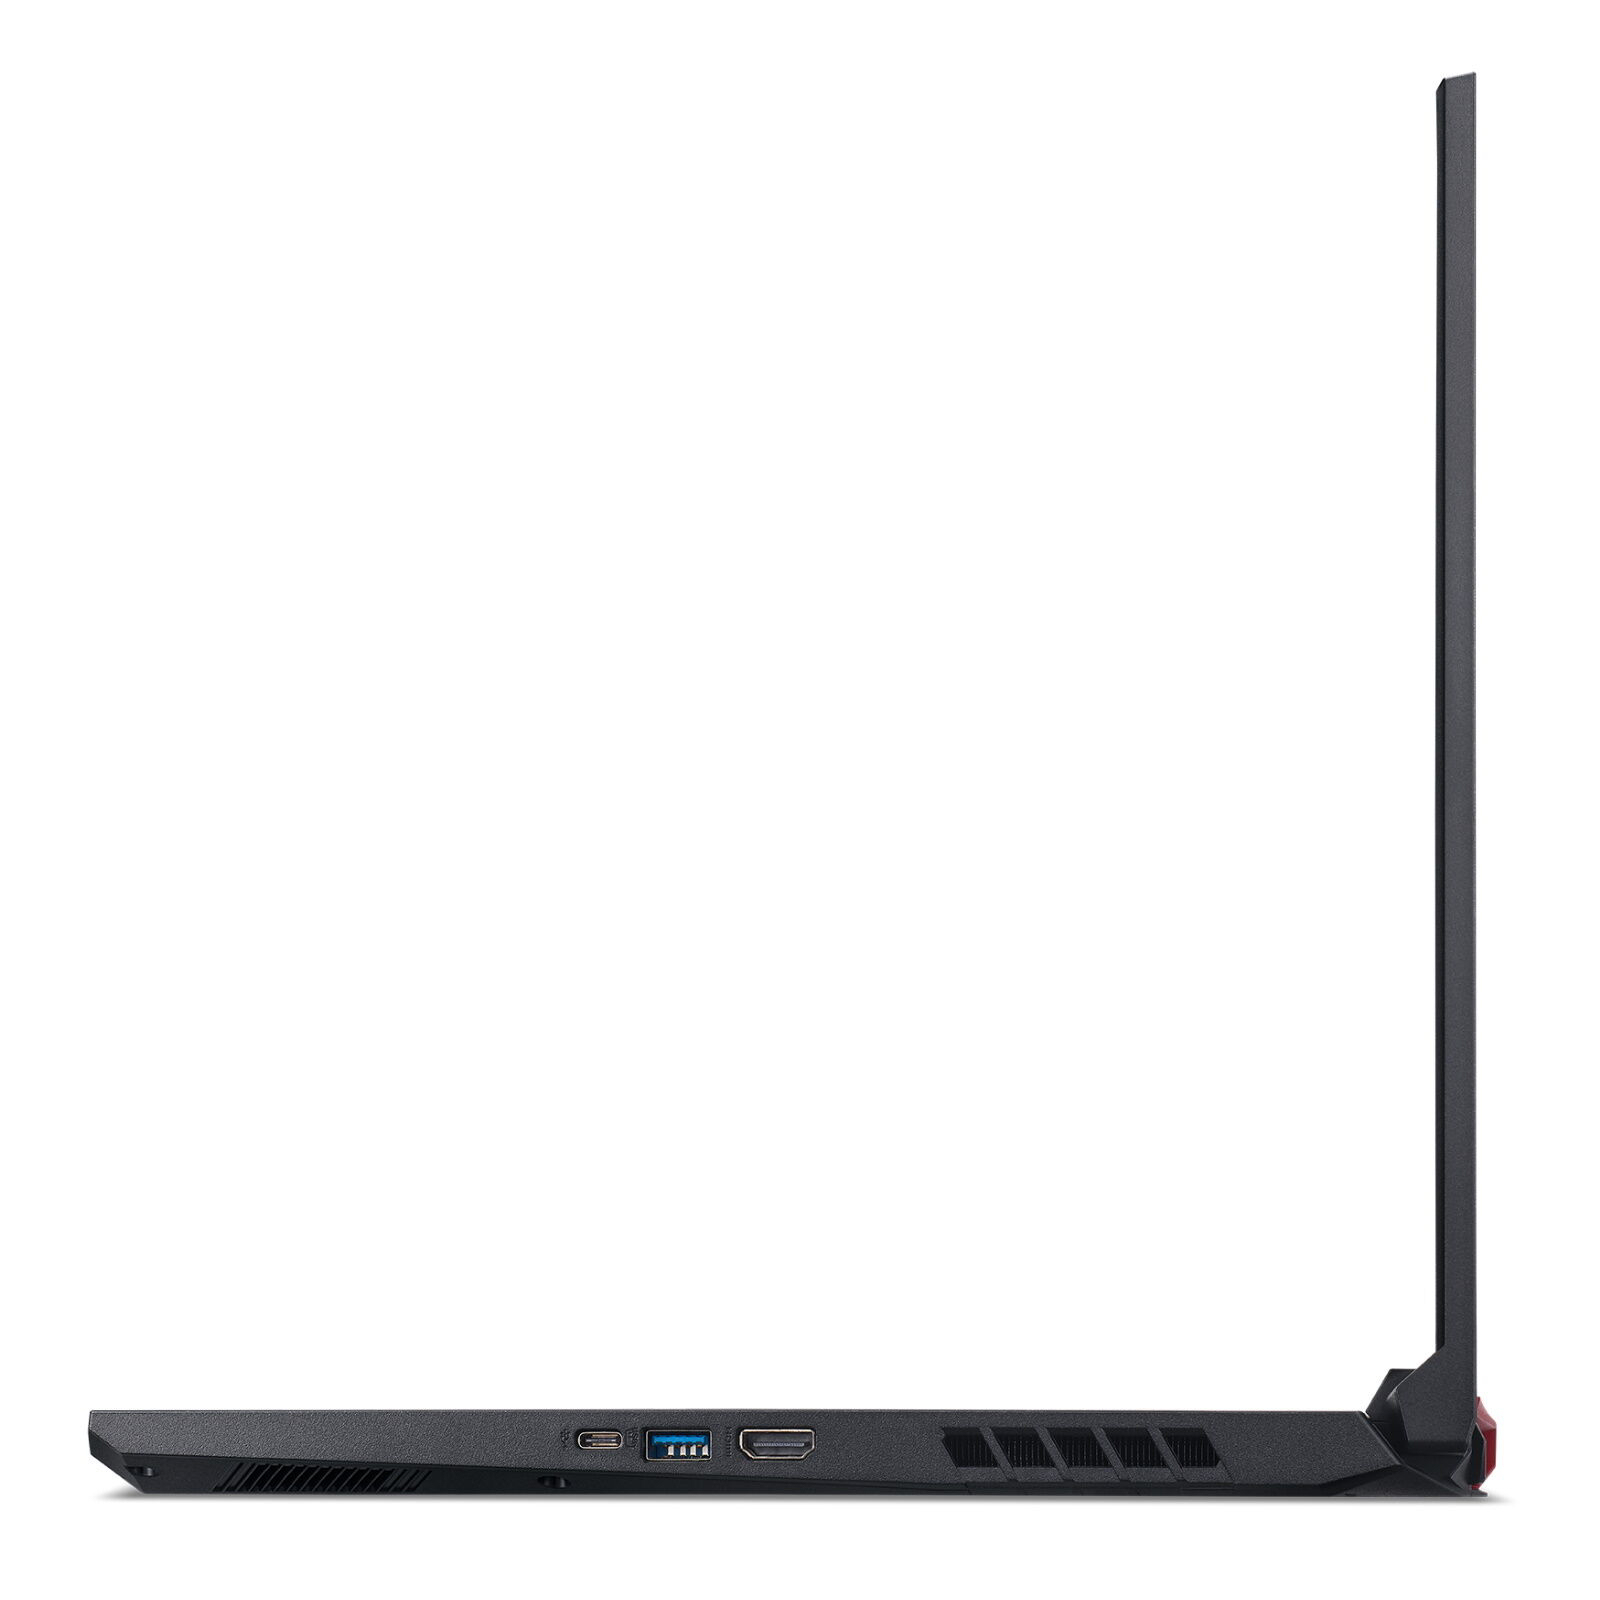
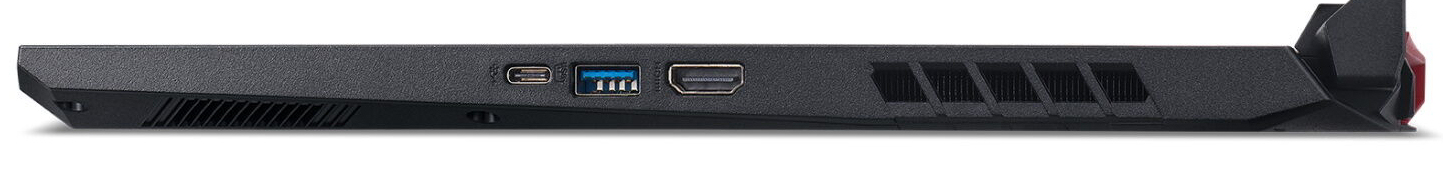
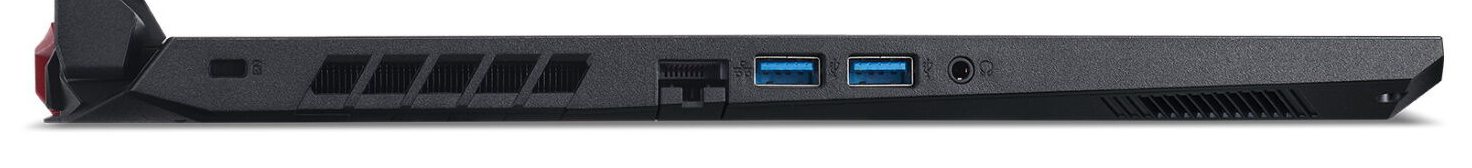
Connectivity - No Thunderbolt 3 on board
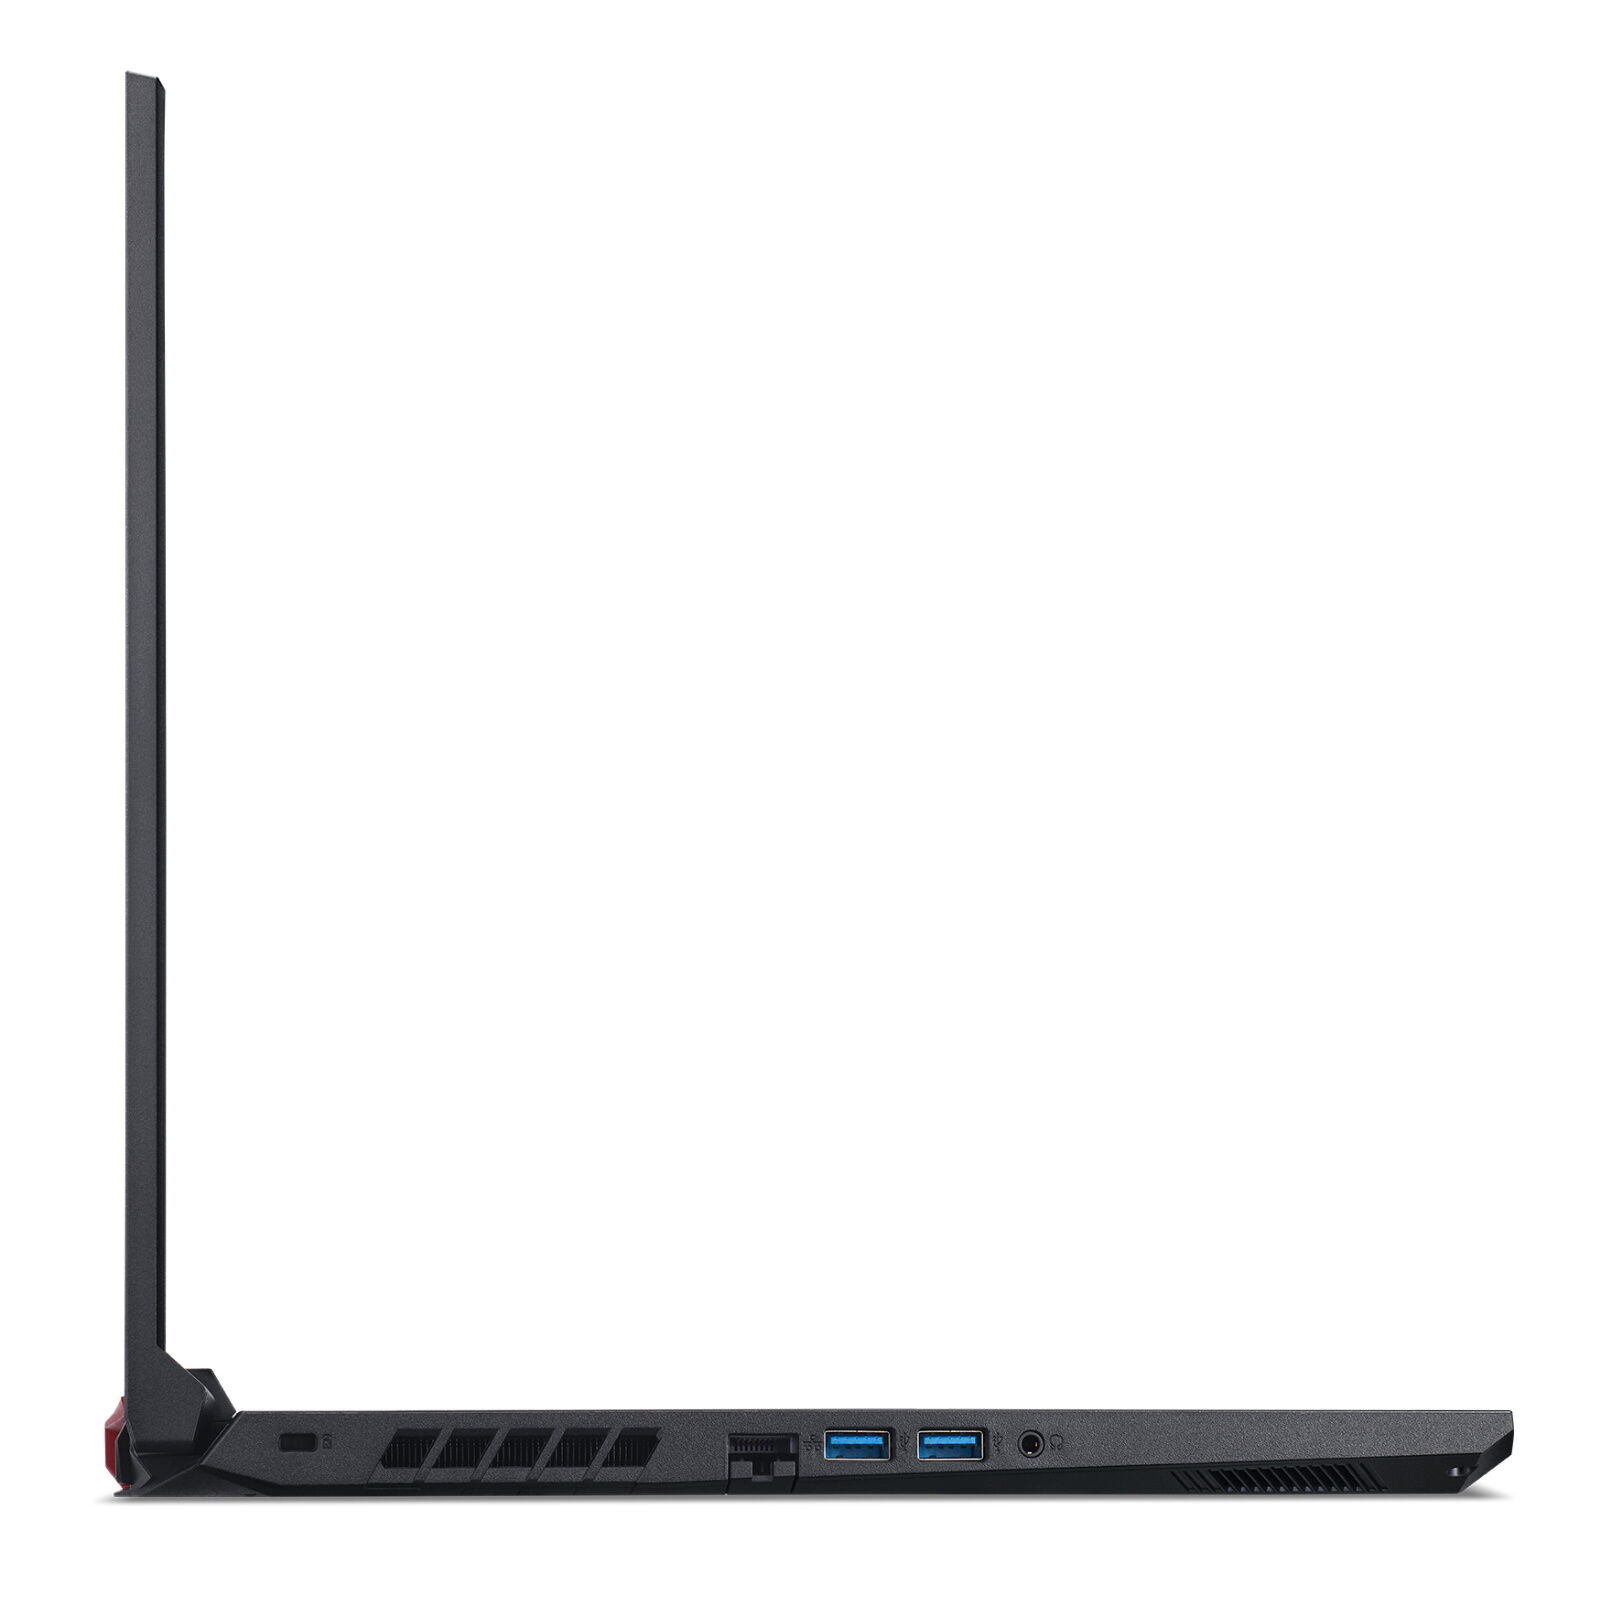
The Acer computer provides a limited amount of connections. The laptop has three USB Type-A ports (USB 3.2 Gen 1) to offer. The USB Type-C port supports the USB 3.2 Gen 2 standard. Moreover, DisplayPort via USB-C is not supported. As a result, there's only one video output with the HDMI connection. There is no memory card reader. The ports are located in the middle section of the right and left sides. Therefore, the areas next to the palm rest will remain free of cables.
Communication
The built-in WLAN chip (Intel Wi-Fi 6 AX201) supports the fast ax standard. The transfer speeds obtained under optimal conditions (no other WLAN devices nearby, short distance between laptop and server PC) are very good. A Killer E2600 Gigabit Ethernet controller handles wired network connections and does its job smoothly.
Webcam
The built-in webcam generates images at a maximum resolution of 1280x720 pixels. The results look a bit washed-out. In addition, the color accuracy is lacking. At a deviation of about 14, the target (Delta E less than 3) is clearly missed.


Accessories
The laptop comes with the usual documents: A quick-start guide and warranty information. In addition, the box also contains a short ribbon cable including a SATA connector, which would be needed for the installation of a 2.5-inch storage device.
Maintenance
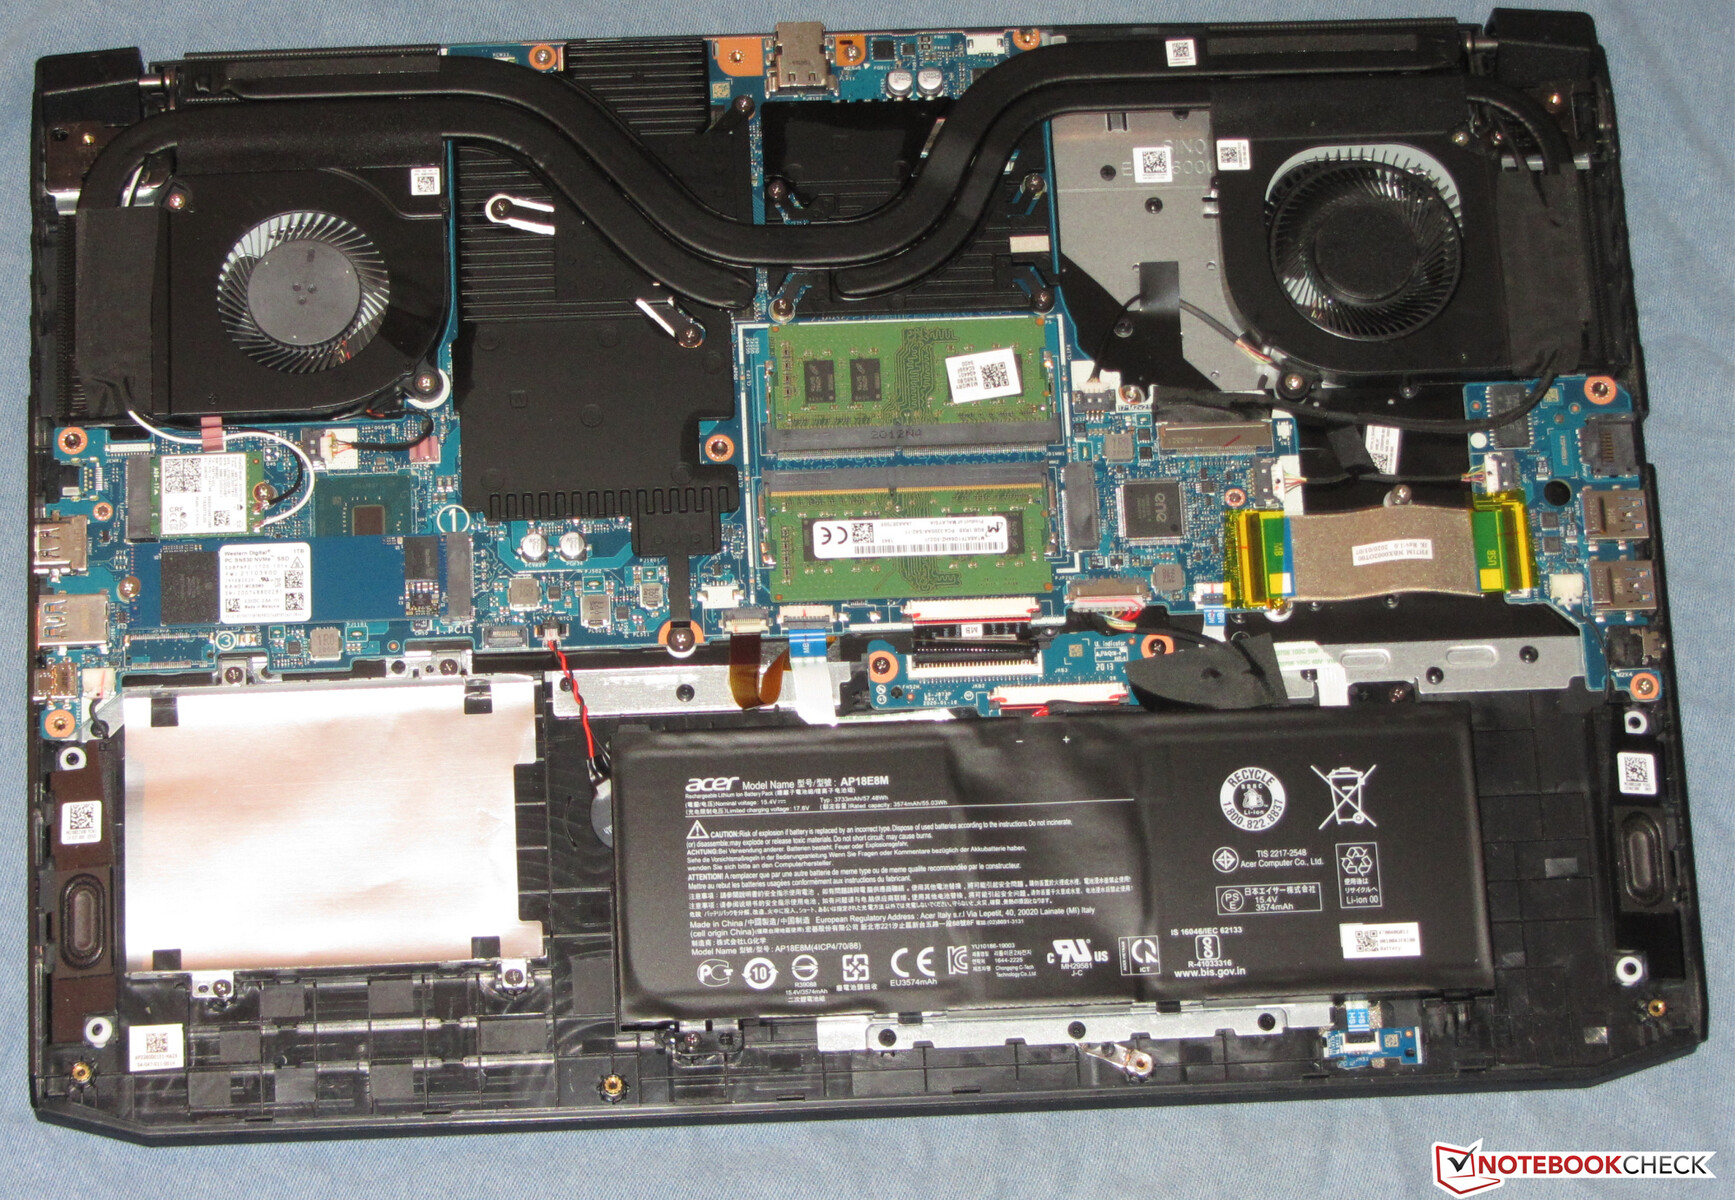
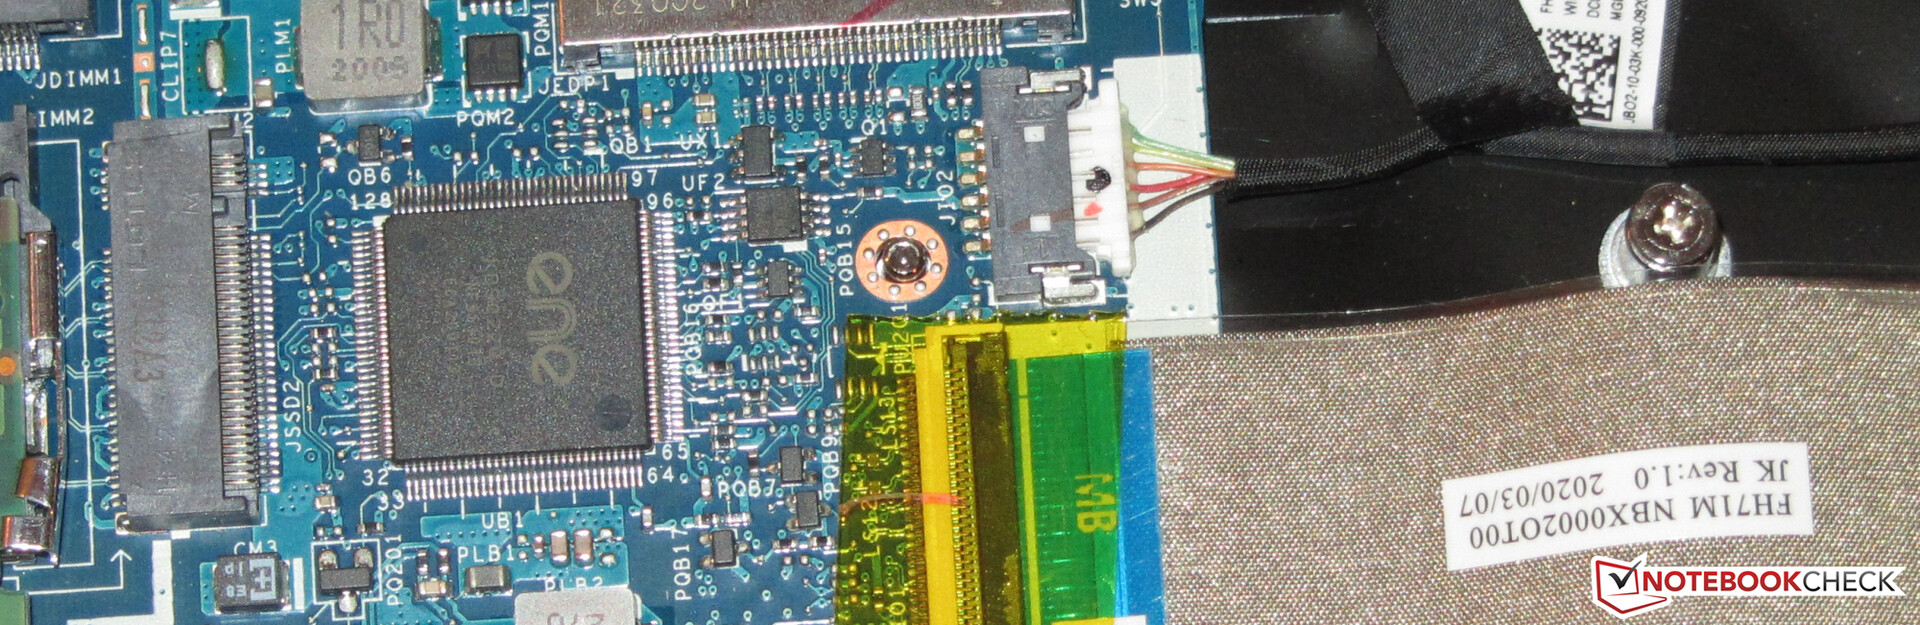
The Acer Nitro doesn't offer a maintenance hatch. To access the inside, the bottom cover needs to be removed. All the screws on the bottom of the unit have to be removed for this. The bottom cover can then be lifted using a flat spatula or a grout finishing tool. The clamps holding the bottom cover have quite a firm grip.
Warranty
Acer honors the 17.3-inch model with a two-year warranty - including pick-up service. A three-year warranty costs almost 100 Euros (~$113).
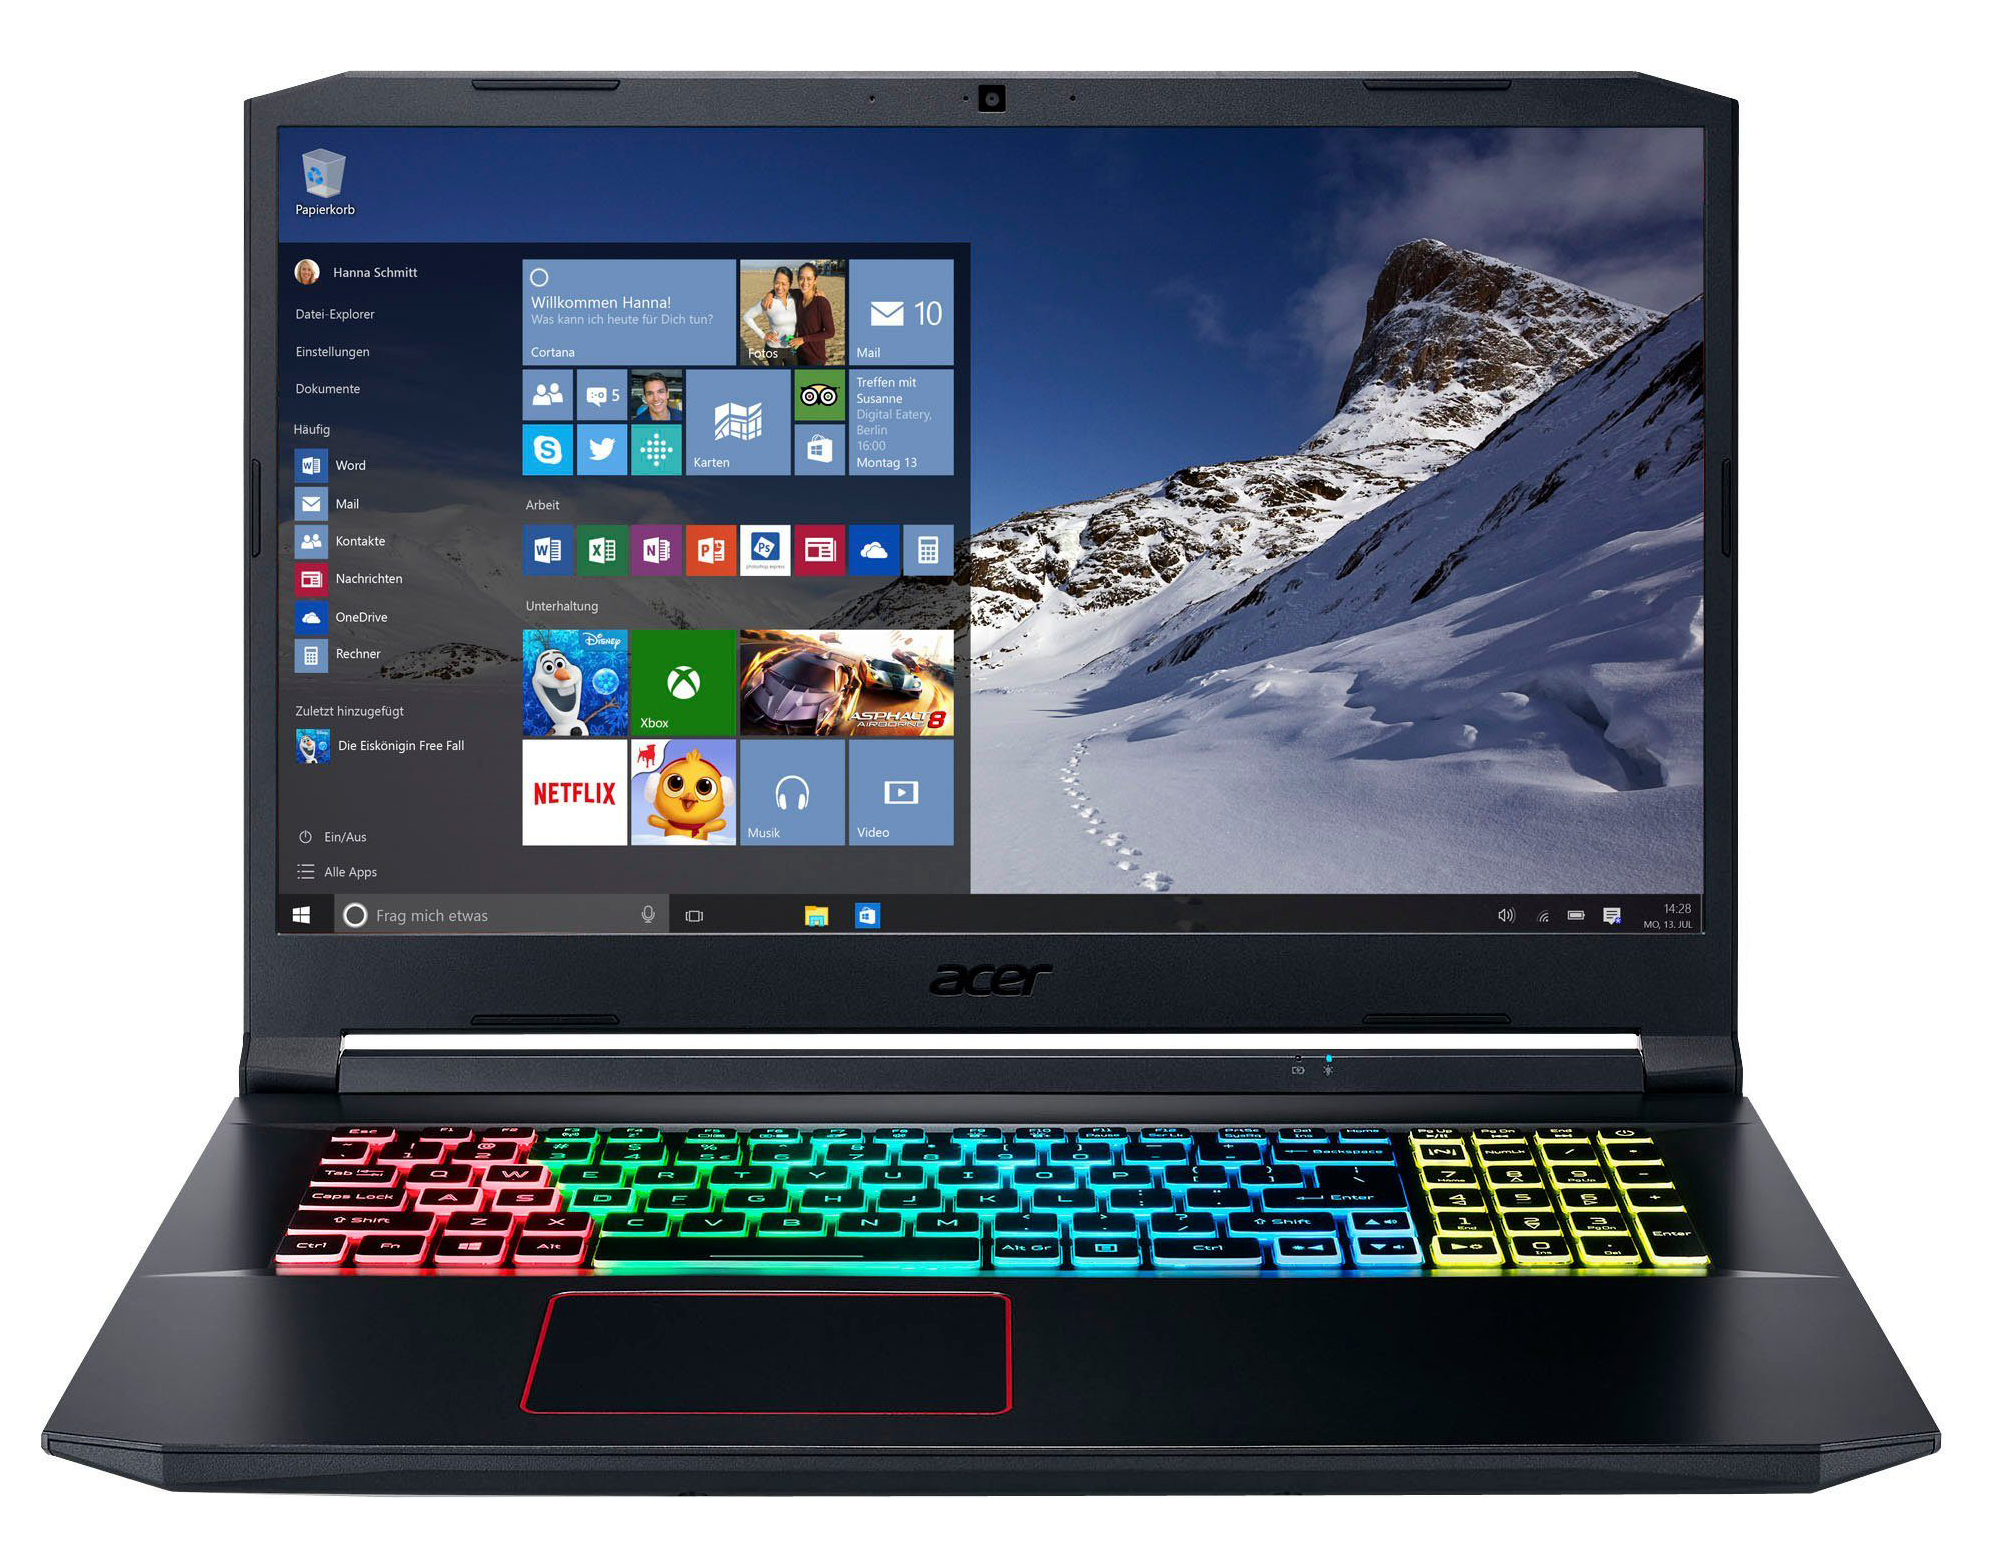
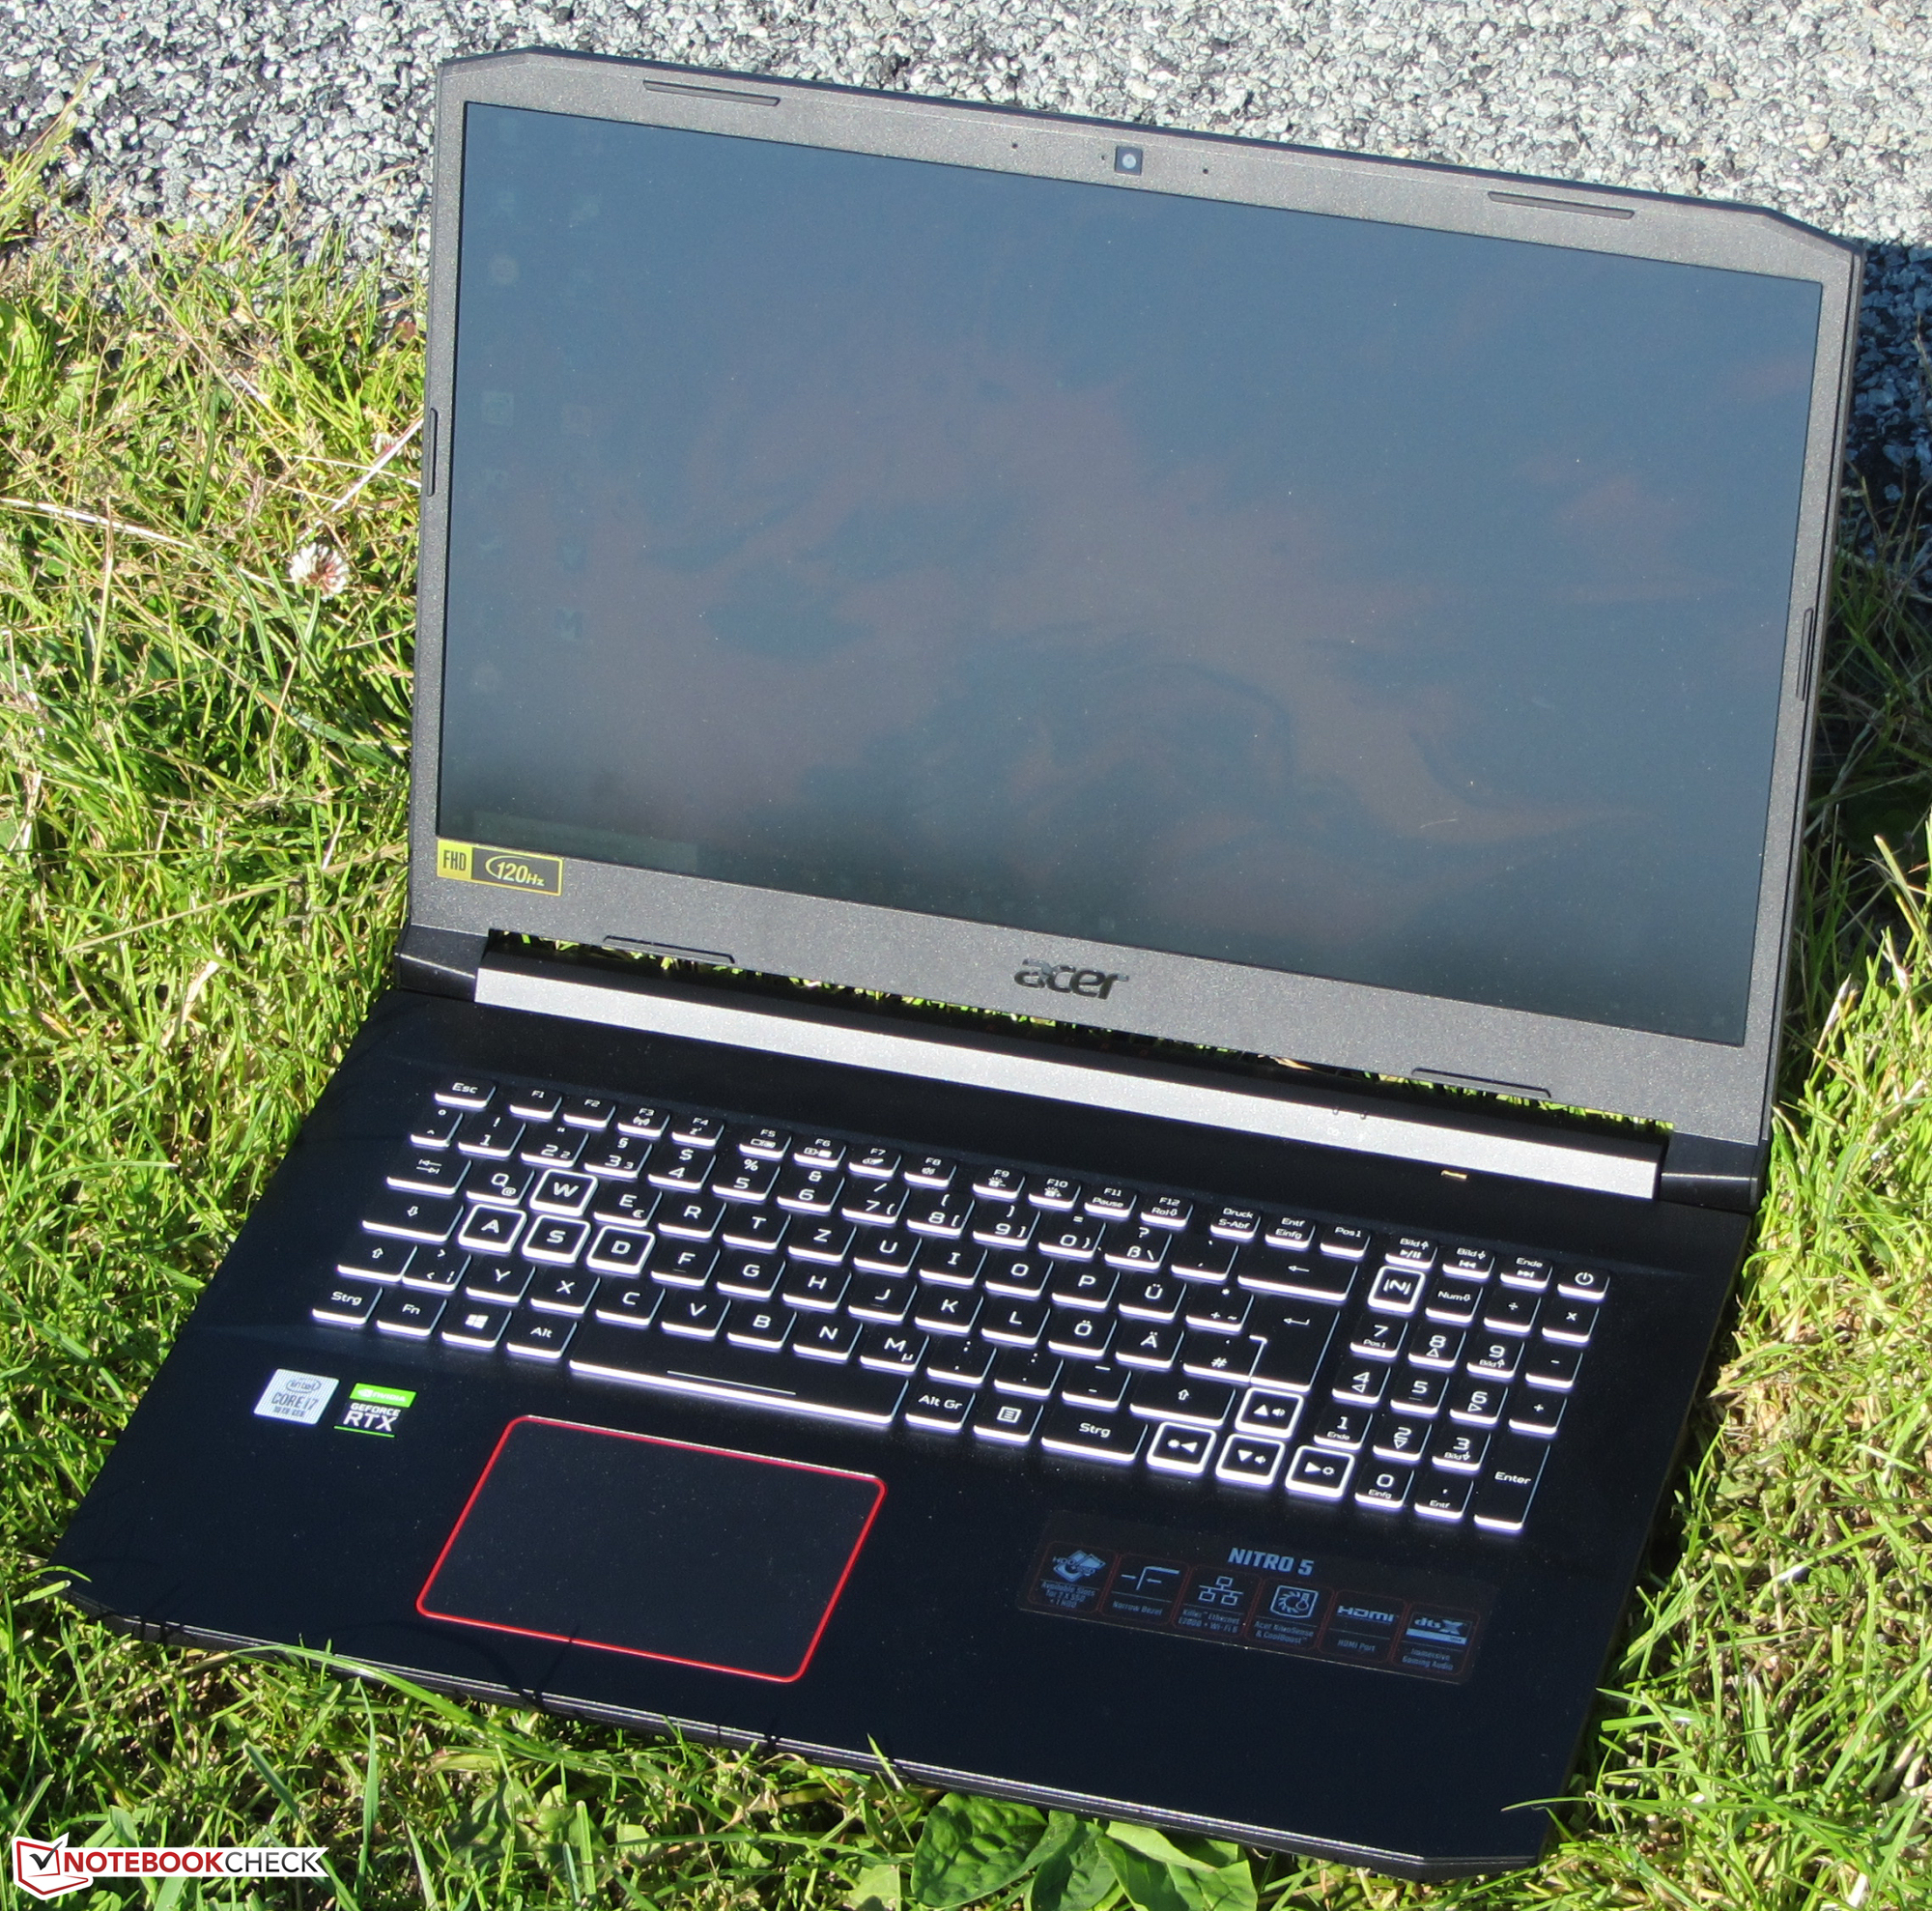
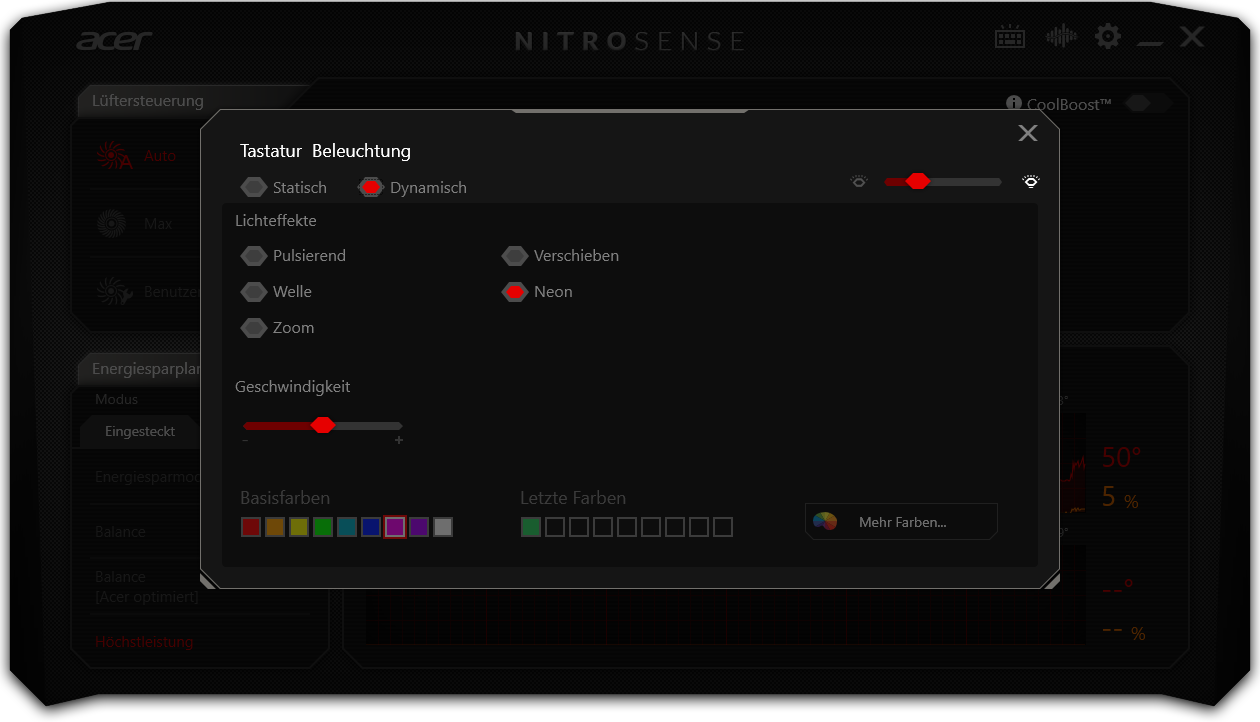
Input devices - AN517 with RGB keyboard
Keyboard
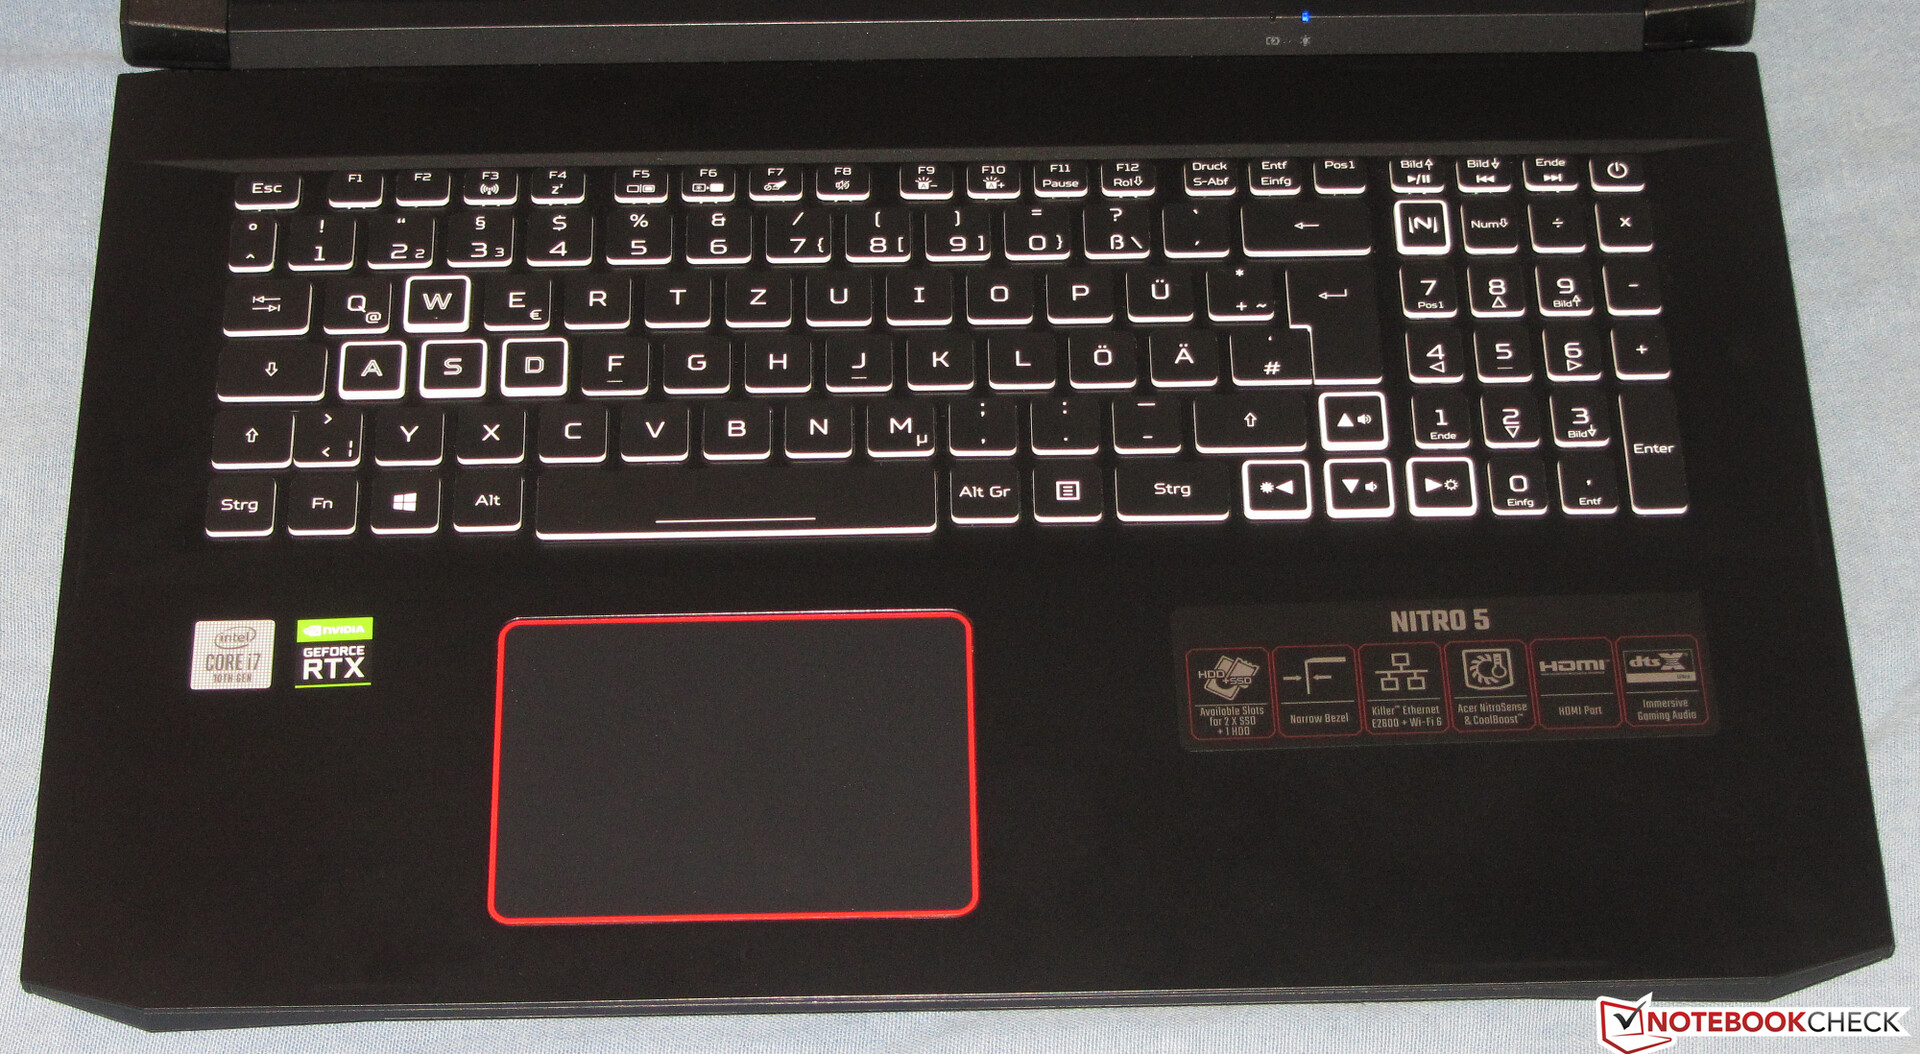
Acer's gaming laptop comes with a backlit (RGB) chiclet keyboard, which has main keys (letters and number row) that feature a slightly concave curvature. The remaining keys (function keys, number pad) are evenly designed. All keys offer a medium travel and a clear pressure point. The resistance provided by the keys is okay. The keyboard yields a bit during typing, but this didn't prove to be disturbing. Overall, Acer delivers a keyboard suitable for everyday use here.
Touchpad
The multi-touch capable ClickPad takes up an area of approximately 10.6 x 7.8 cm. Therefore, a lot of space is available for using gesture controls. The smooth surface of the pad makes it easy for the fingers to glide on it. It also reacts to input in the corners. The pad has a short travel and a clear pressure point.
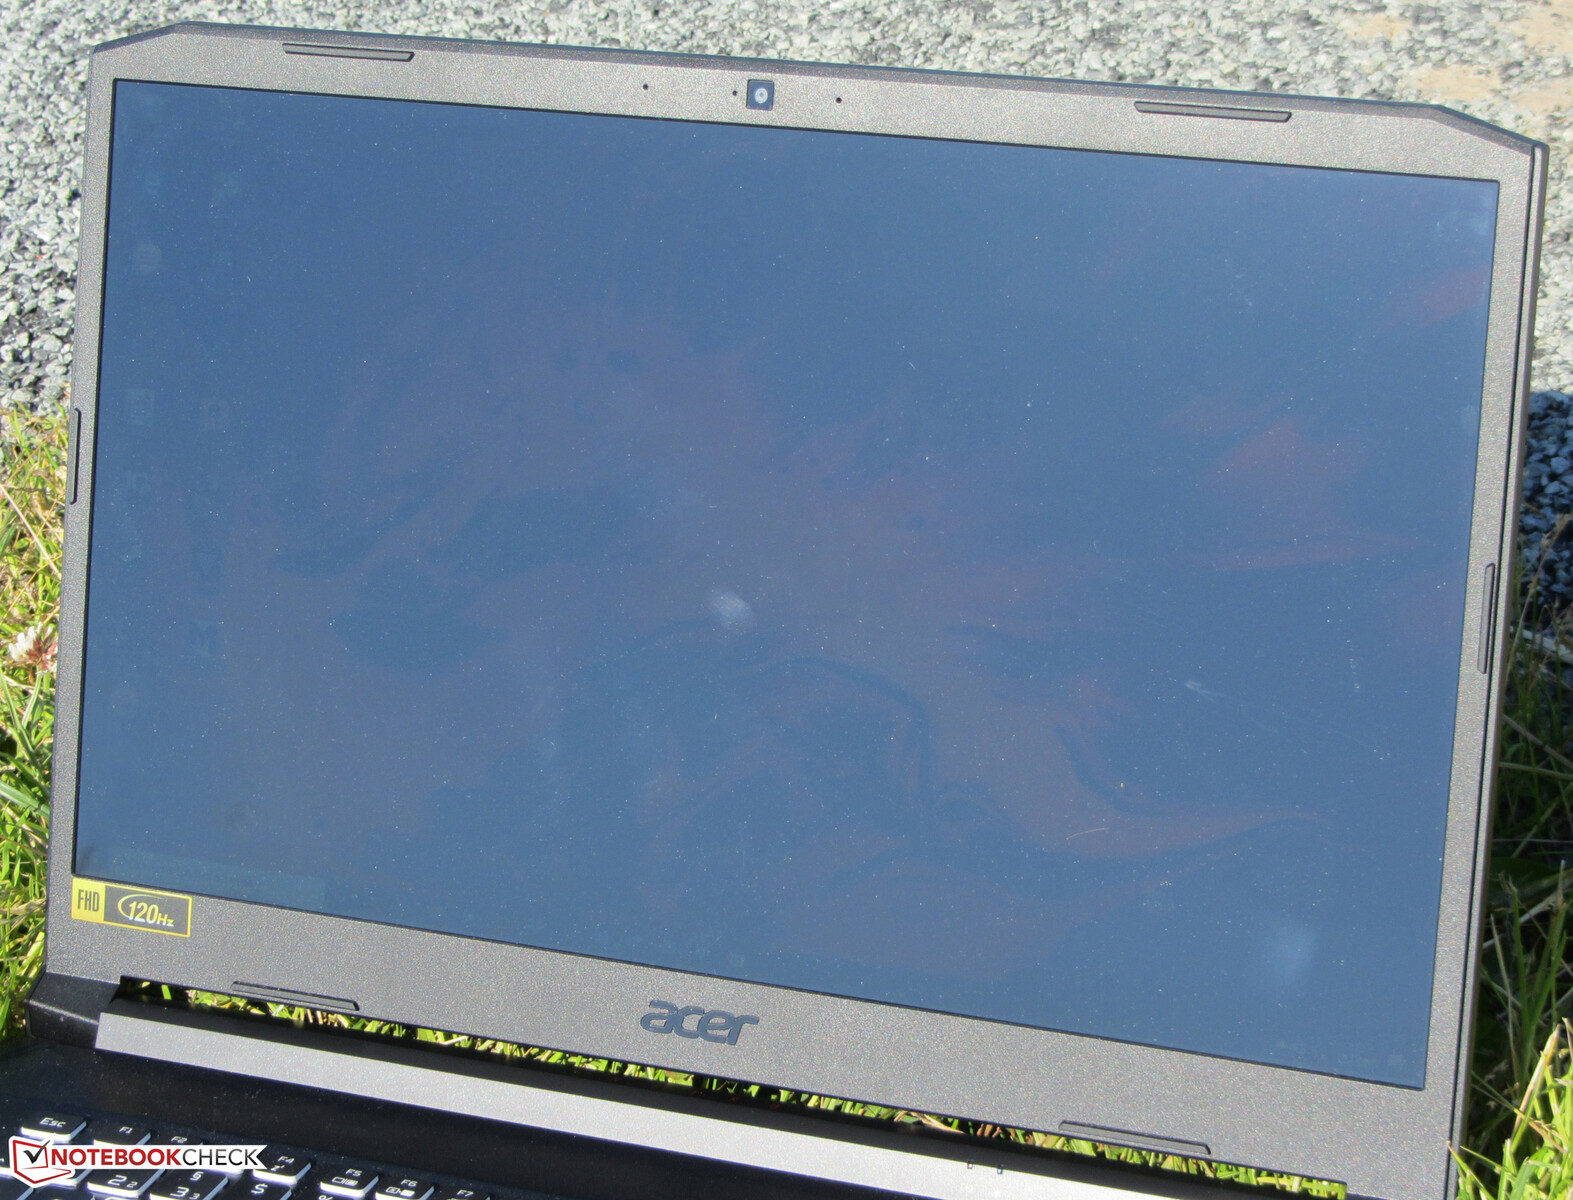
Display - Acer laptop comes with a dim, low-contrast panel
The Nitro AN517's 17.3-inch display operates at a native resolution of 1920x1080 pixels. The brightness (246.4 cd/m²) and contrast (560:1) are not convincing. The display of a 1,500-Euro (~$1,697) laptop should offer more in this regard. We consider values beyond 300 cd/m² and 1000:1, respectively, to be good. Positive: The display shows no PWM flickering.
Although this is a 120 Hz panel, the response times only turned out to be mediocre. The 120 Hz display in the Asus TUF A17 delivers somewhat better response times.

| |||||||||||||||||||||||||
Brightness Distribution: 85 %
Center on Battery: 263 cd/m²
Contrast: 560:1 (Black: 0.47 cd/m²)
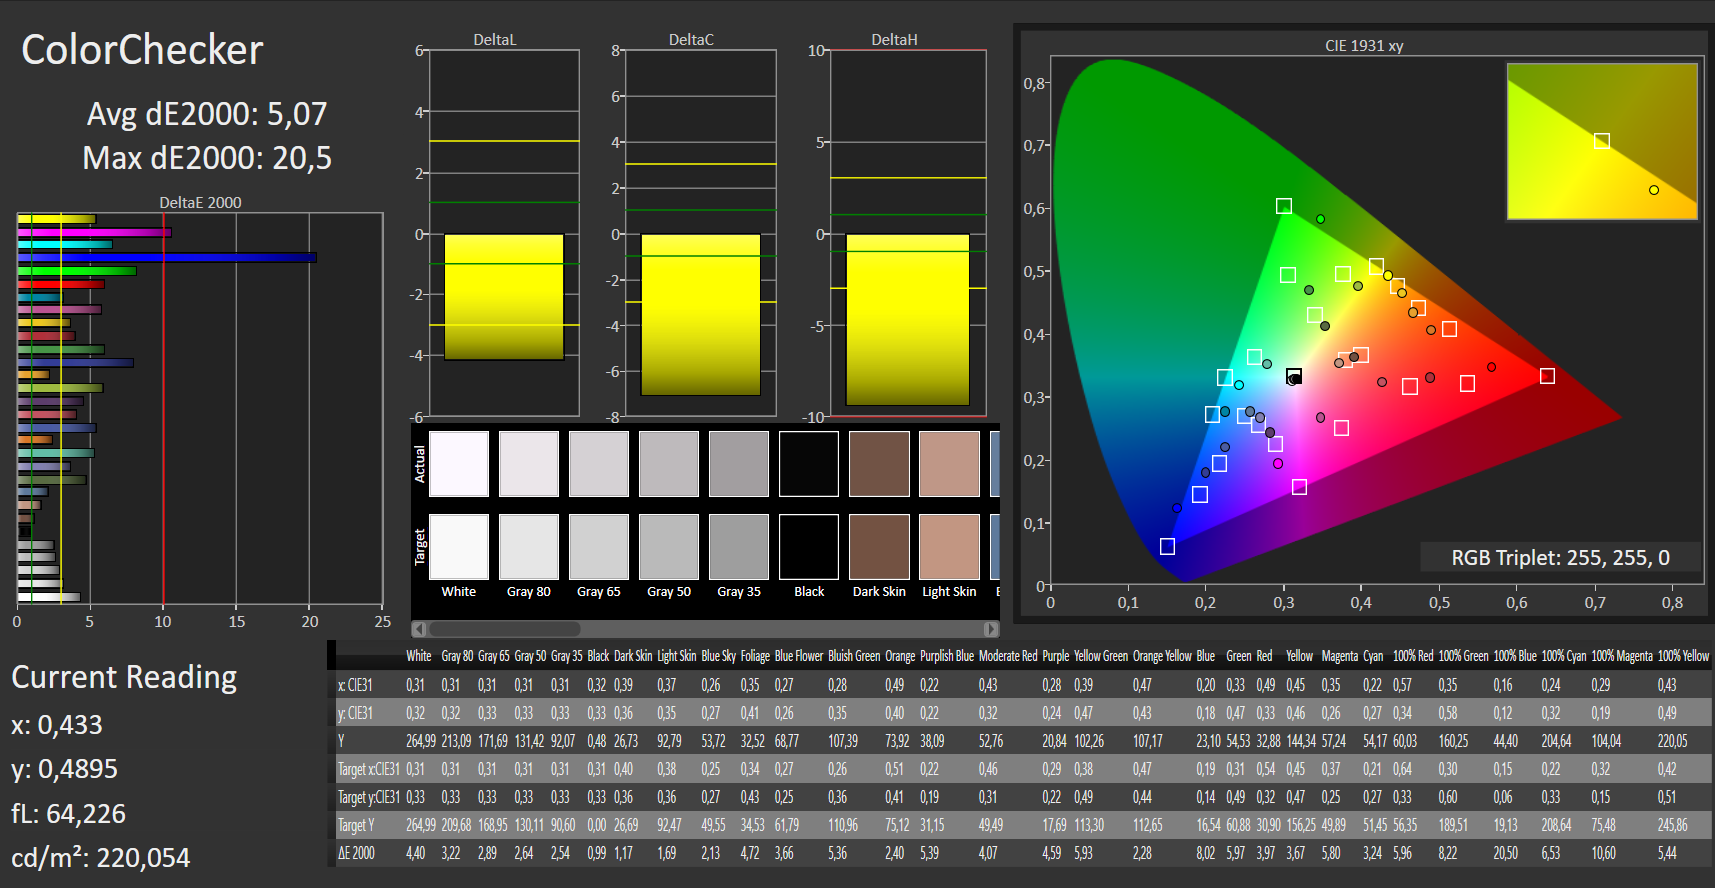
ΔE ColorChecker Calman: 5.07 | ∀{0.5-29.43 Ø4.73}
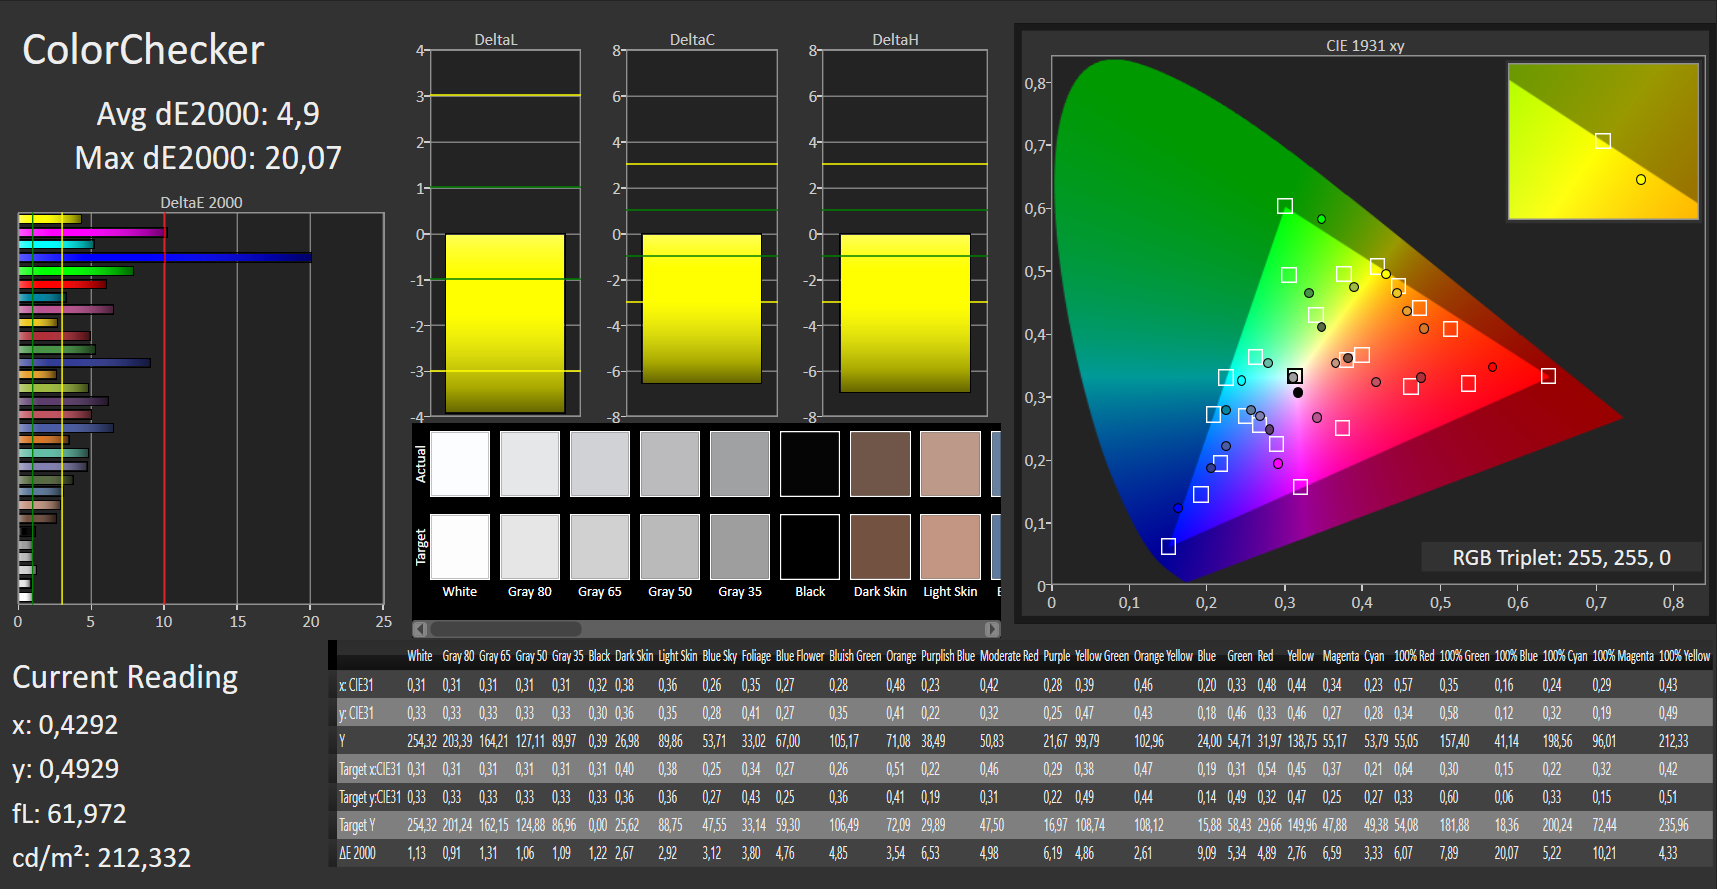
calibrated: 4.9
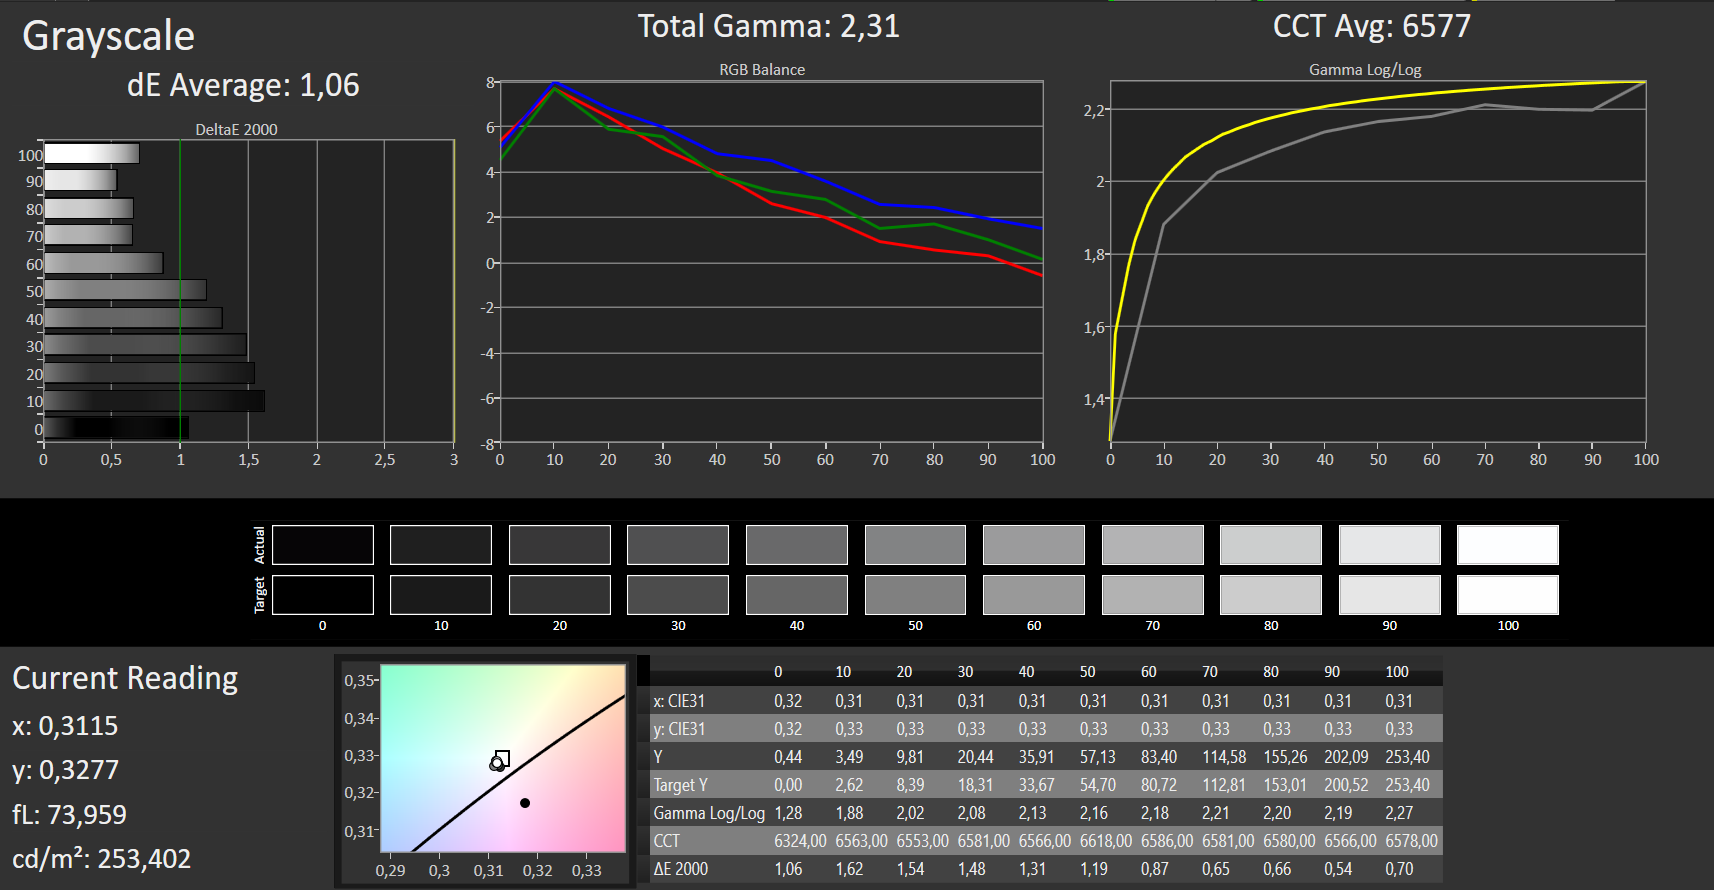
ΔE Greyscale Calman: 2.55 | ∀{0.09-98 Ø4.97}
59% sRGB (Argyll 1.6.3 3D)
37% AdobeRGB 1998 (Argyll 1.6.3 3D)
40.77% AdobeRGB 1998 (Argyll 3D)
58.9% sRGB (Argyll 3D)
39.47% Display P3 (Argyll 3D)
Gamma: 2.37
CCT: 6446 K
| Acer Nitro 5 AN517-52-77DS IPS, 1920x1080, 17.3" | Asus TUF A17 FA706IU-AS76 IPS, 1920x1080, 17.3" | Lenovo Legion Y540-17IRH IPS, 1920x1080, 17.3" | Schenker XMG Pro 17 PB71RD-G IPS, 1920x1080, 17.3" | HP Pavilion Gaming 17-cd0085cl IPS, 1920x1080, 17.3" | Acer Aspire Nitro 5 AN517-51-7887 IPS, 1920x1080, 17.3" | |
|---|---|---|---|---|---|---|
| Display | 2% | 72% | 56% | 57% | 57% | |
| Display P3 Coverage (%) | 39.47 | 40.55 3% | 69 75% | 62.8 59% | 63.3 60% | 62.7 59% |
| sRGB Coverage (%) | 58.9 | 59.7 1% | 98.3 67% | 89.8 52% | 90.2 53% | 92.5 57% |
| AdobeRGB 1998 Coverage (%) | 40.77 | 41.89 3% | 70.7 73% | 64.2 57% | 64.3 58% | 63.5 56% |
| Response Times | 31% | 50% | 53% | 18% | -3% | |
| Response Time Grey 50% / Grey 80% * (ms) | 35 ? | 22.4 ? 36% | 18 ? 49% | 16.8 ? 52% | 31.6 ? 10% | 37 ? -6% |
| Response Time Black / White * (ms) | 26 ? | 19.2 ? 26% | 12.8 ? 51% | 12 ? 54% | 19.6 ? 25% | 26 ? -0% |
| PWM Frequency (Hz) | ||||||
| Screen | 15% | 44% | 27% | 28% | 25% | |
| Brightness middle (cd/m²) | 263 | 264.8 1% | 286 9% | 274 4% | 299.6 14% | 407 55% |
| Brightness (cd/m²) | 246 | 253 3% | 282 15% | 273 11% | 285 16% | 364 48% |
| Brightness Distribution (%) | 85 | 90 6% | 87 2% | 95 12% | 86 1% | 84 -1% |
| Black Level * (cd/m²) | 0.47 | 0.31 34% | 0.19 60% | 0.26 45% | 0.33 30% | 0.3 36% |
| Contrast (:1) | 560 | 854 53% | 1505 169% | 1054 88% | 908 62% | 1357 142% |
| Colorchecker dE 2000 * | 5.07 | 4.73 7% | 3.57 30% | 4.62 9% | 3.68 27% | 4.55 10% |
| Colorchecker dE 2000 max. * | 20.5 | 18.89 8% | 7.5 63% | 7.66 63% | 8.05 61% | 12.44 39% |
| Colorchecker dE 2000 calibrated * | 4.9 | 4.64 5% | 1.31 73% | 1.93 61% | 3.15 36% | |
| Greyscale dE 2000 * | 2.55 | 1.4 45% | 4.51 -77% | 5.3 -108% | 3.8 -49% | 7.61 -198% |
| Gamma | 2.37 93% | 2.16 102% | 2.36 93% | 2.34 94% | 2.12 104% | 2.51 88% |
| CCT | 6446 101% | 6641 98% | 7411 88% | 7619 85% | 7240 90% | 7212 90% |
| Color Space (Percent of AdobeRGB 1998) (%) | 37 | 38.4 4% | 64 73% | 58 57% | 58.1 57% | 59 59% |
| Color Space (Percent of sRGB) (%) | 59 | 59.3 1% | 98 66% | 90 53% | 89.8 52% | 92 56% |
| Total Average (Program / Settings) | 16% /
15% | 55% /
50% | 45% /
36% | 34% /
32% | 26% /
27% |
* ... smaller is better
Out of the box, the display shows a quite decent color reproduction. But with a Delta E 2000 color deviation of just under 5, the target (Delta E less than 3) is missed. The display doesn't suffer from a blue tint. Moreover, calibration only provides for slight improvements. The AdobeRGB (37%) and sRGB (59%) color spaces aren't completely covered.


Display Response Times
| ↔ Response Time Black to White | ||
|---|---|---|
| 26 ms ... rise ↗ and fall ↘ combined | ↗ 14 ms rise | 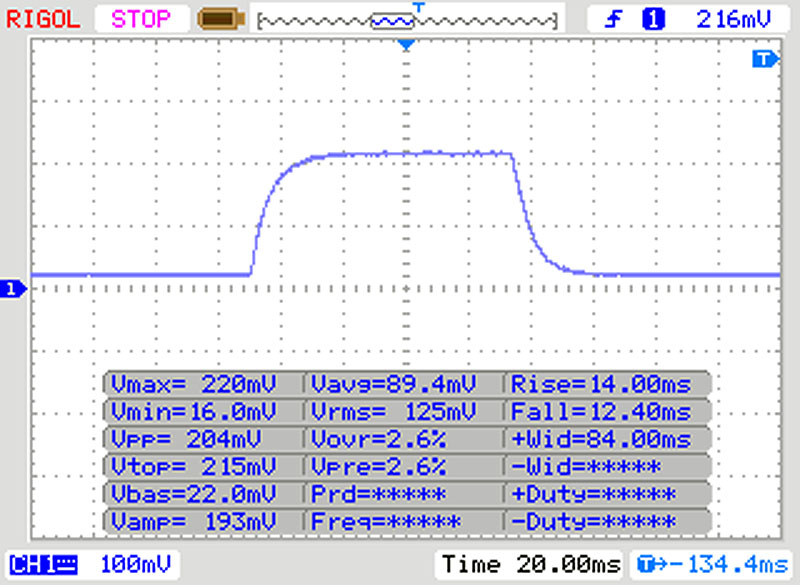 |
| ↘ 12 ms fall | ||
| The screen shows relatively slow response rates in our tests and may be too slow for gamers. In comparison, all tested devices range from 0.1 (minimum) to 240 (maximum) ms. » 62 % of all devices are better. This means that the measured response time is worse than the average of all tested devices (19.9 ms). | ||
| ↔ Response Time 50% Grey to 80% Grey | ||
| 35 ms ... rise ↗ and fall ↘ combined | ↗ 17 ms rise | 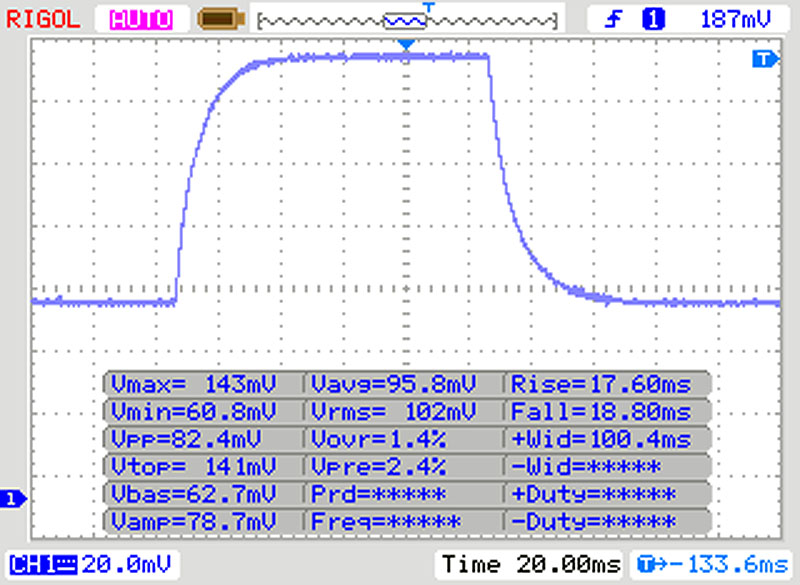 |
| ↘ 18 ms fall | ||
| The screen shows slow response rates in our tests and will be unsatisfactory for gamers. In comparison, all tested devices range from 0.165 (minimum) to 636 (maximum) ms. » 49 % of all devices are better. This means that the measured response time is worse than the average of all tested devices (31.1 ms). | ||
Screen Flickering / PWM (Pulse-Width Modulation)
| Screen flickering / PWM not detected | 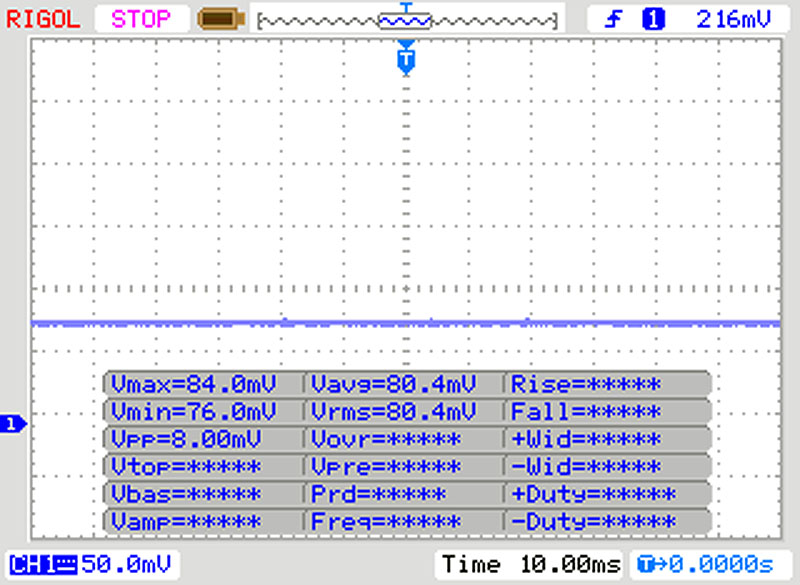 | ||
In comparison: 52 % of all tested devices do not use PWM to dim the display. If PWM was detected, an average of 7794 (minimum: 5 - maximum: 343500) Hz was measured. | |||
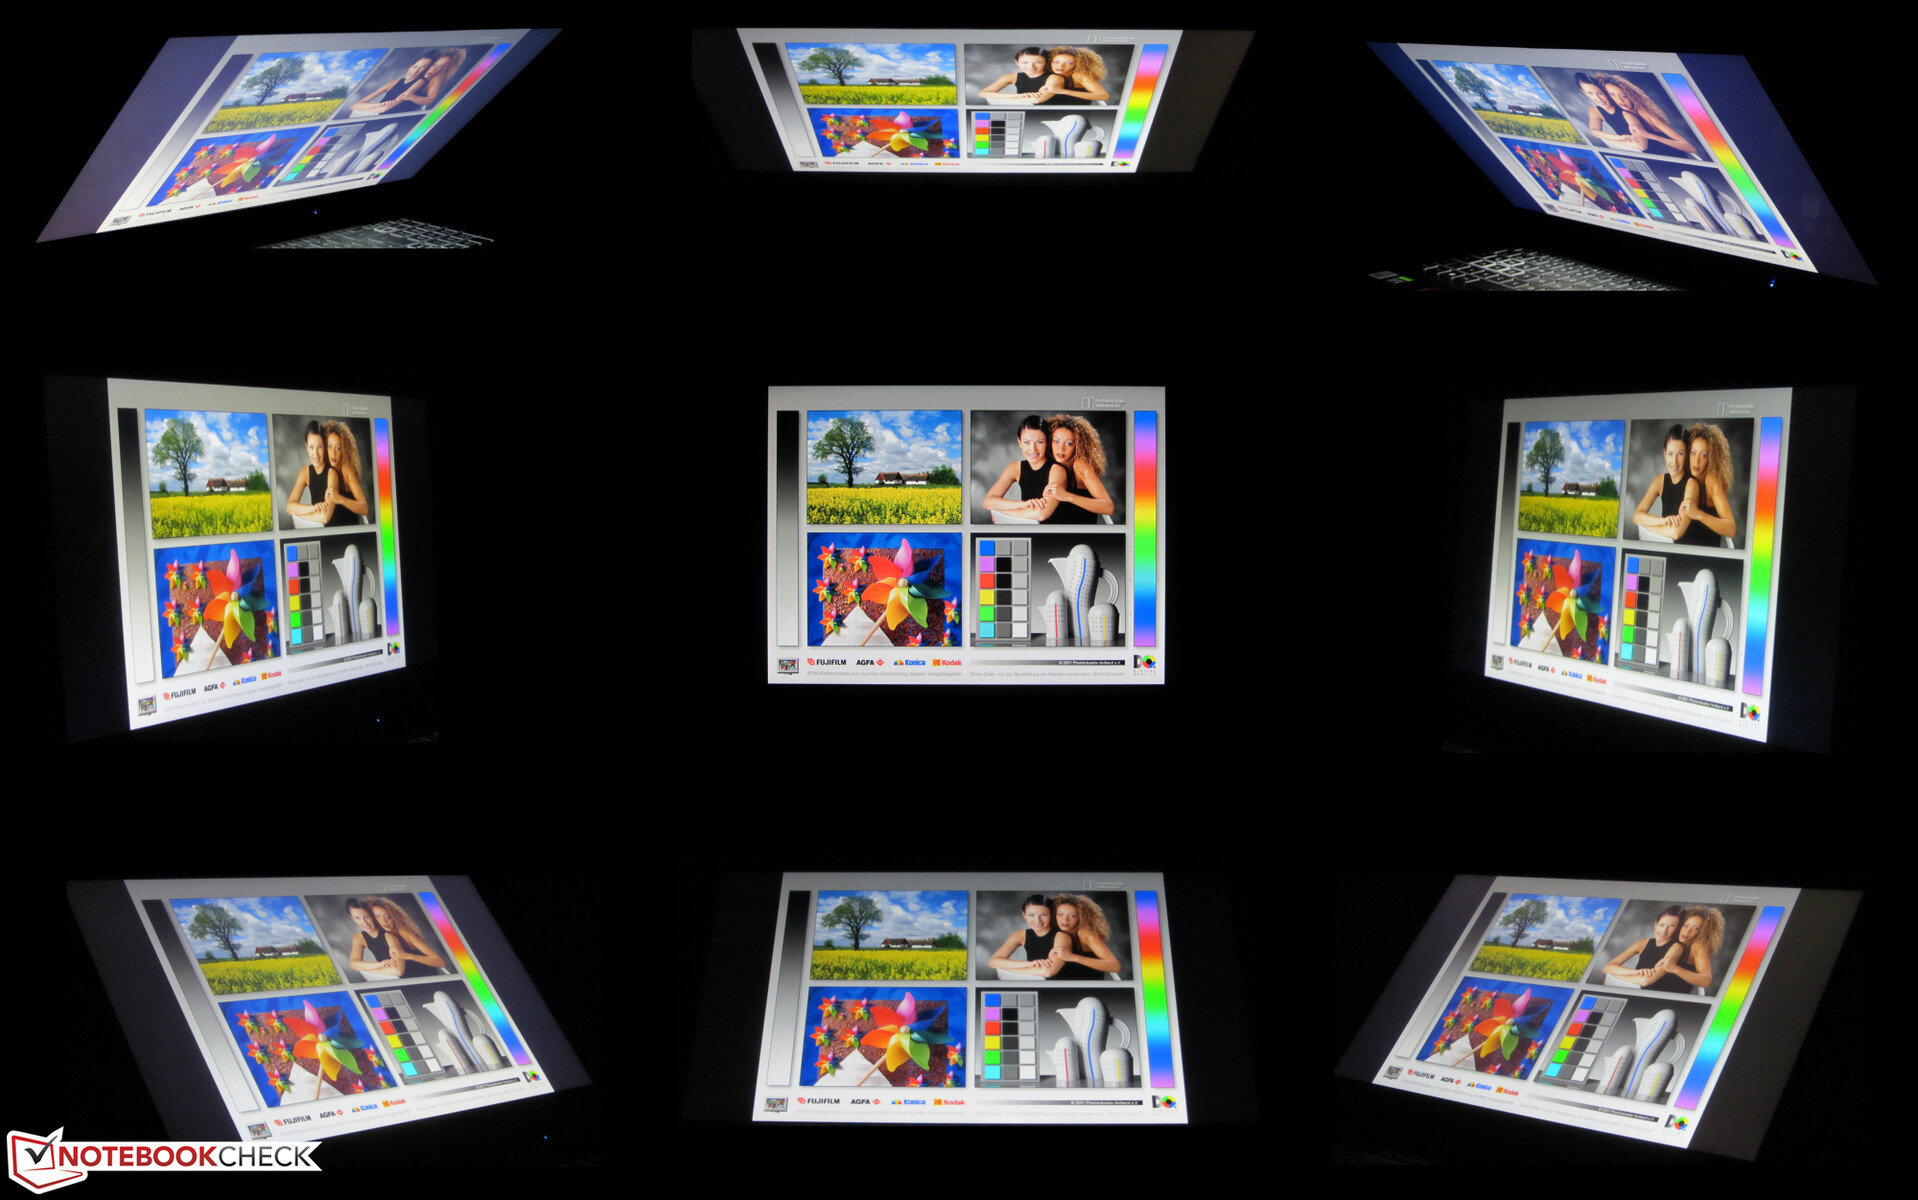
The Acer laptop is equipped with a viewing-angle stable IPS panel. Therefore, the screen can be read from any position. Reading the display outdoors is only possible when the sun is not too bright.
Performance - Enough for all areas
Acer has a 17.3-inch gaming laptop in its product range with the Nitro AN517-52. It runs every modern game smoothly on its display and also cuts a fine figure in all other application areas. About 1,500 Euros (~$1,697) has to be paid for our test device. Furthermore, other configuration variants are available. Prices start at 900 Euros (~$1,018).
Test conditions
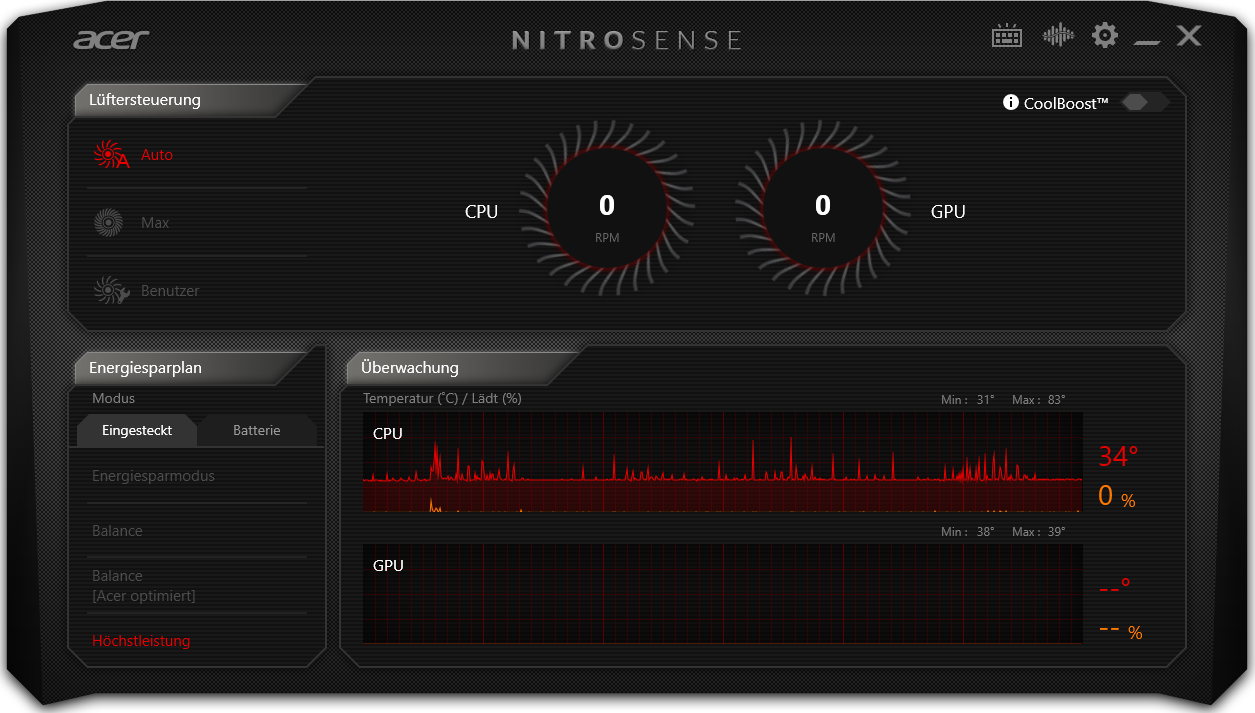
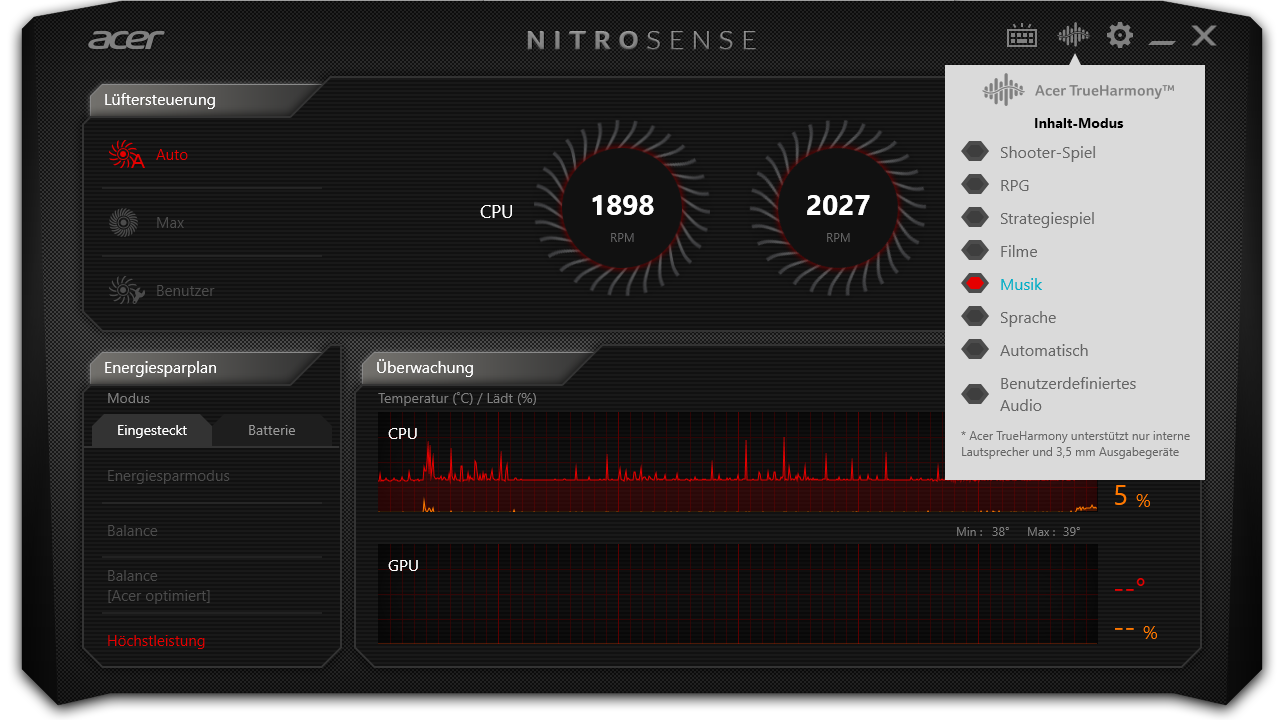
The preinstalled NitroSense software offers various performance profiles to choose from and allows you to influence the two fans. We conducted all benchmarks with the "maximum performance" profile and used the automatic fan control.
Processor
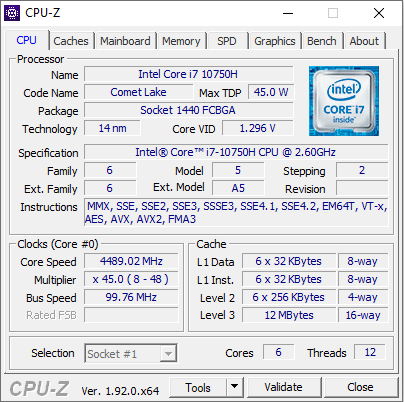
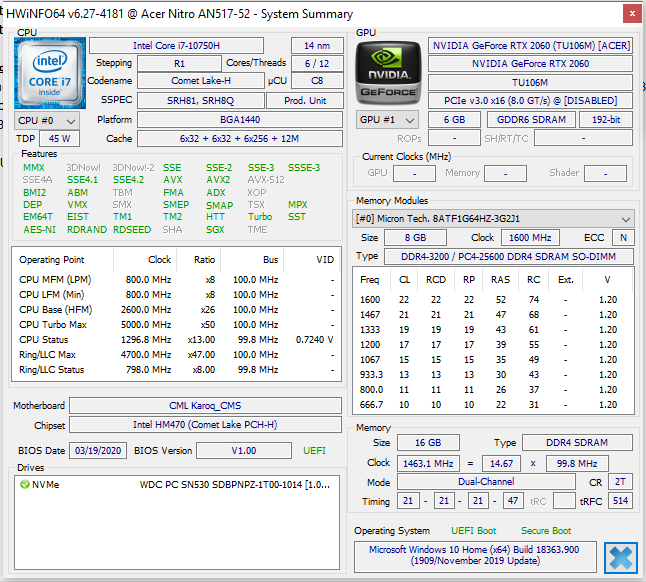
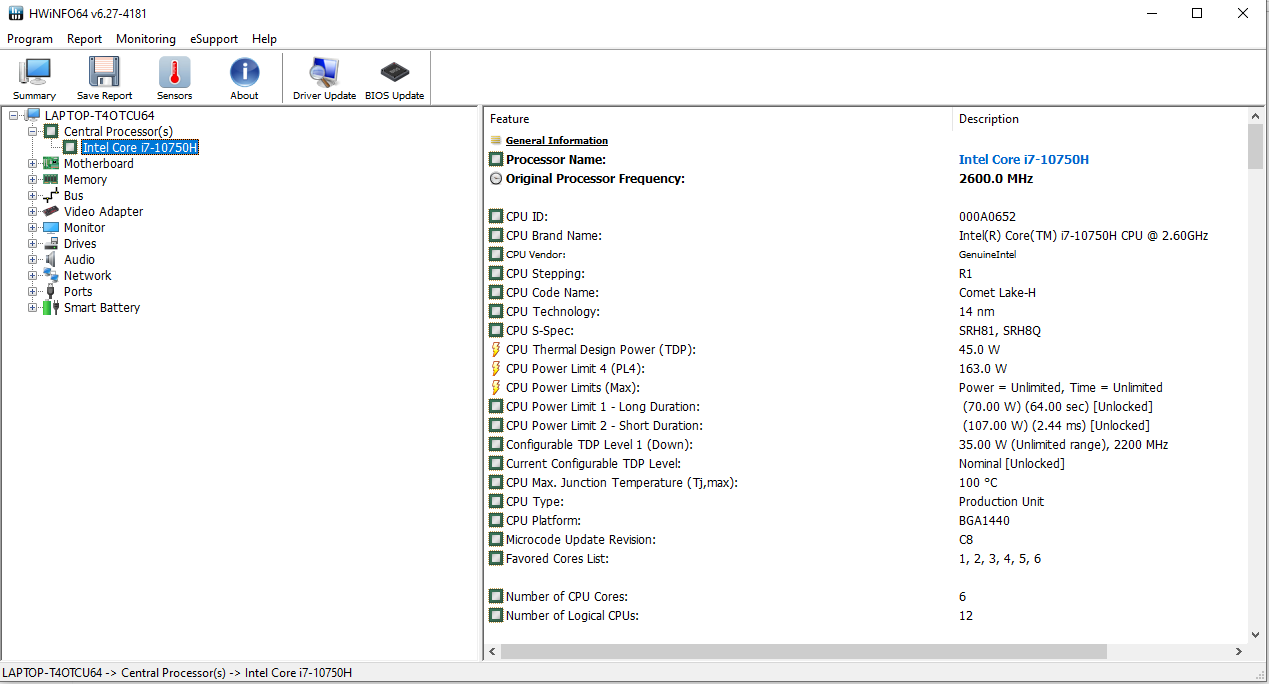
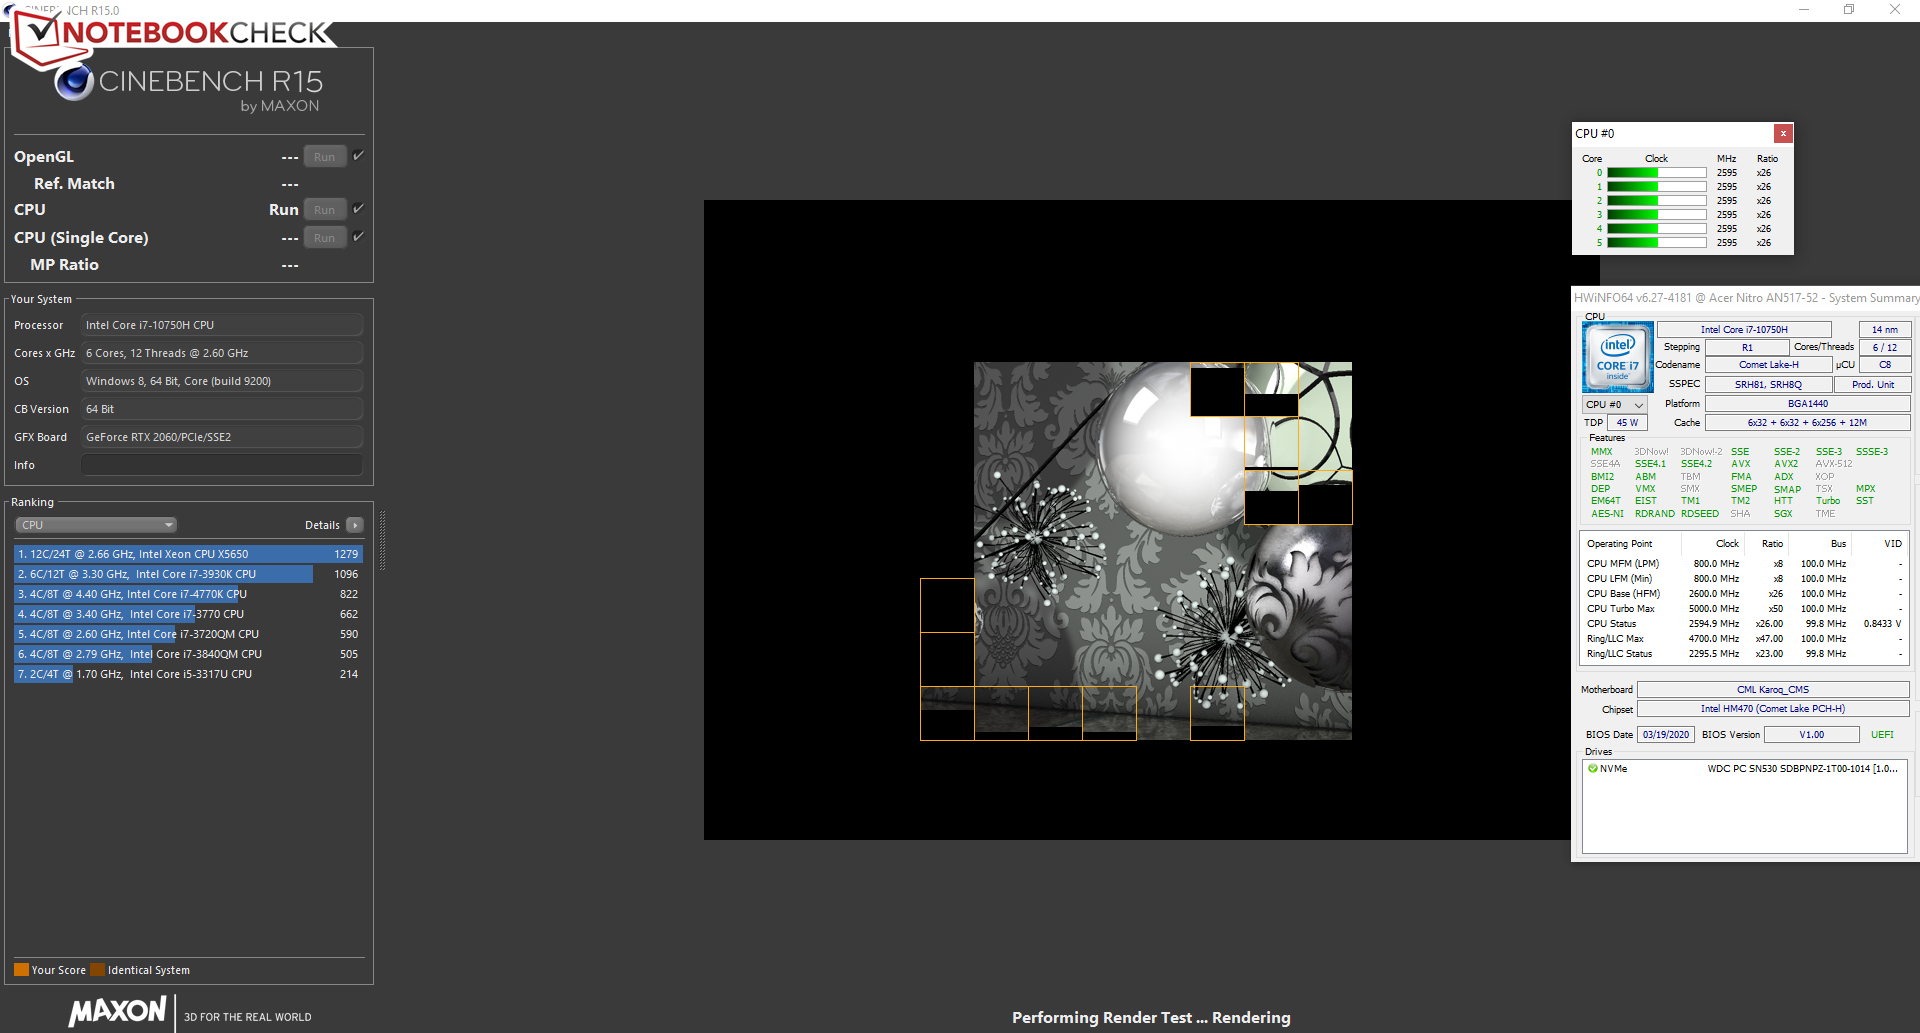
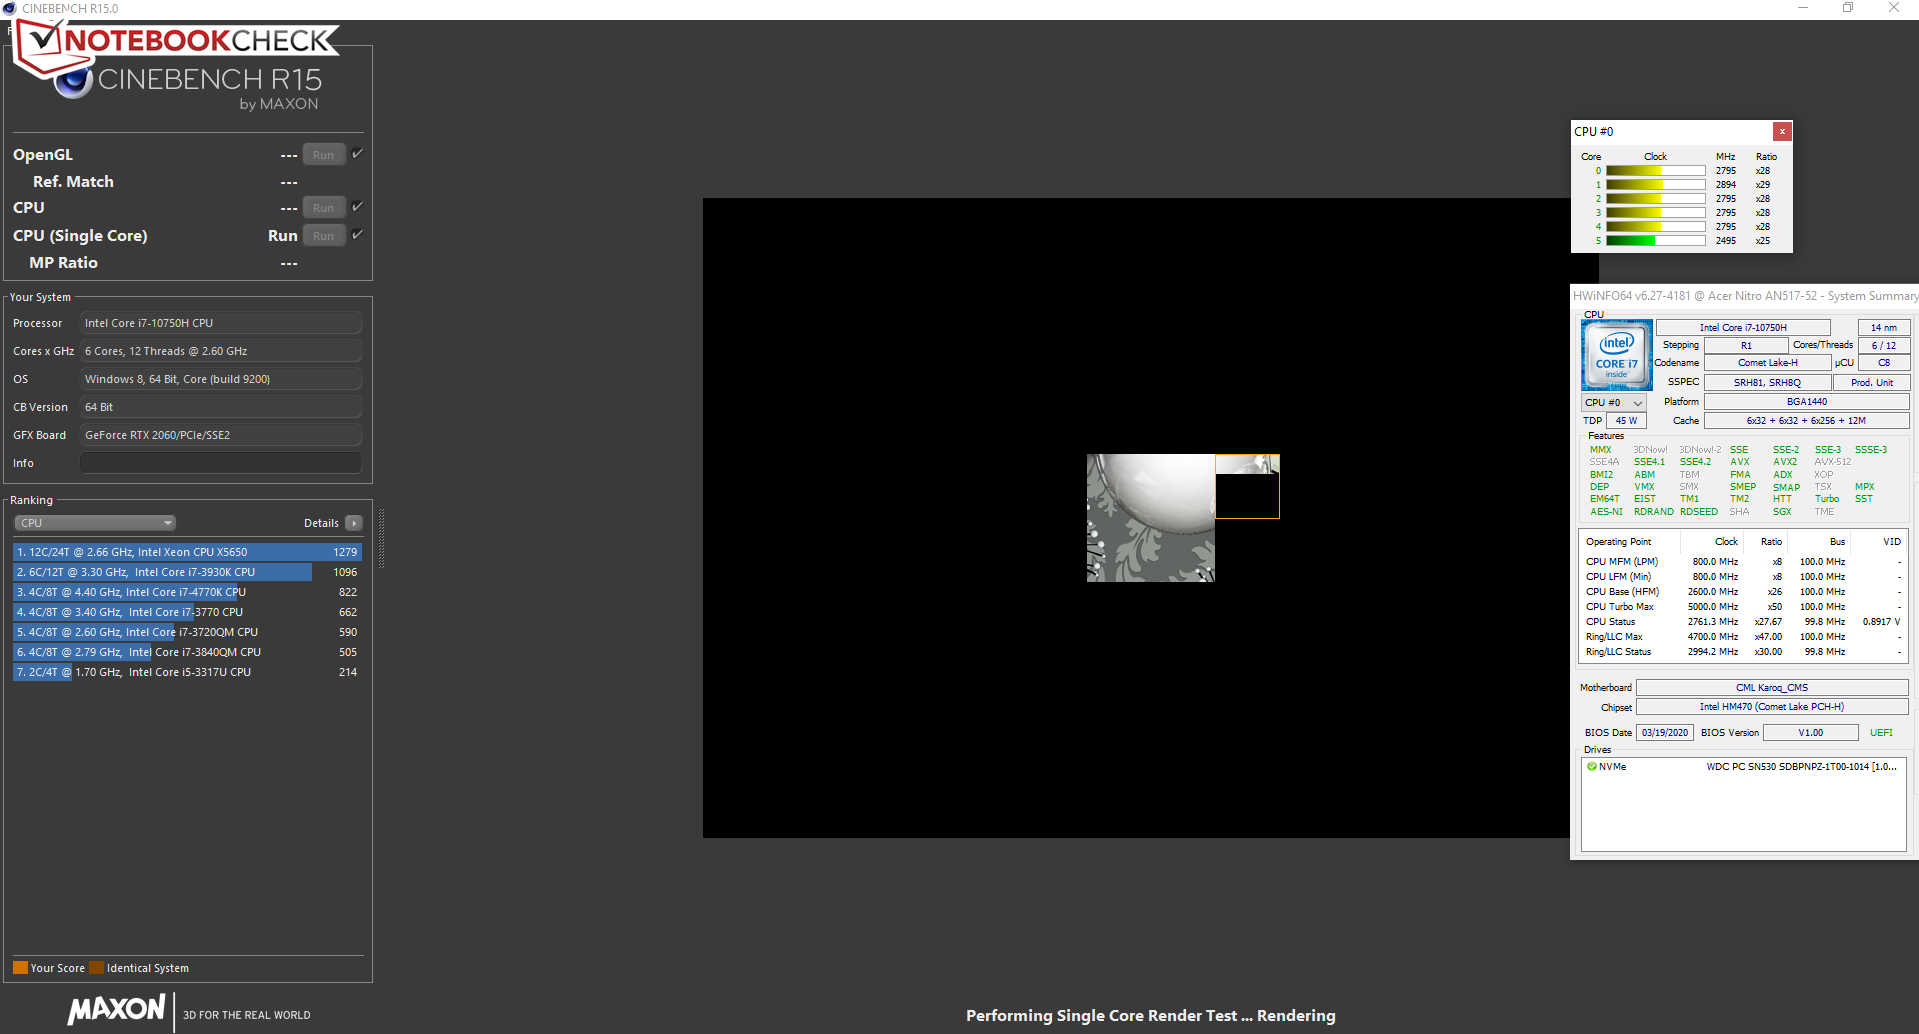
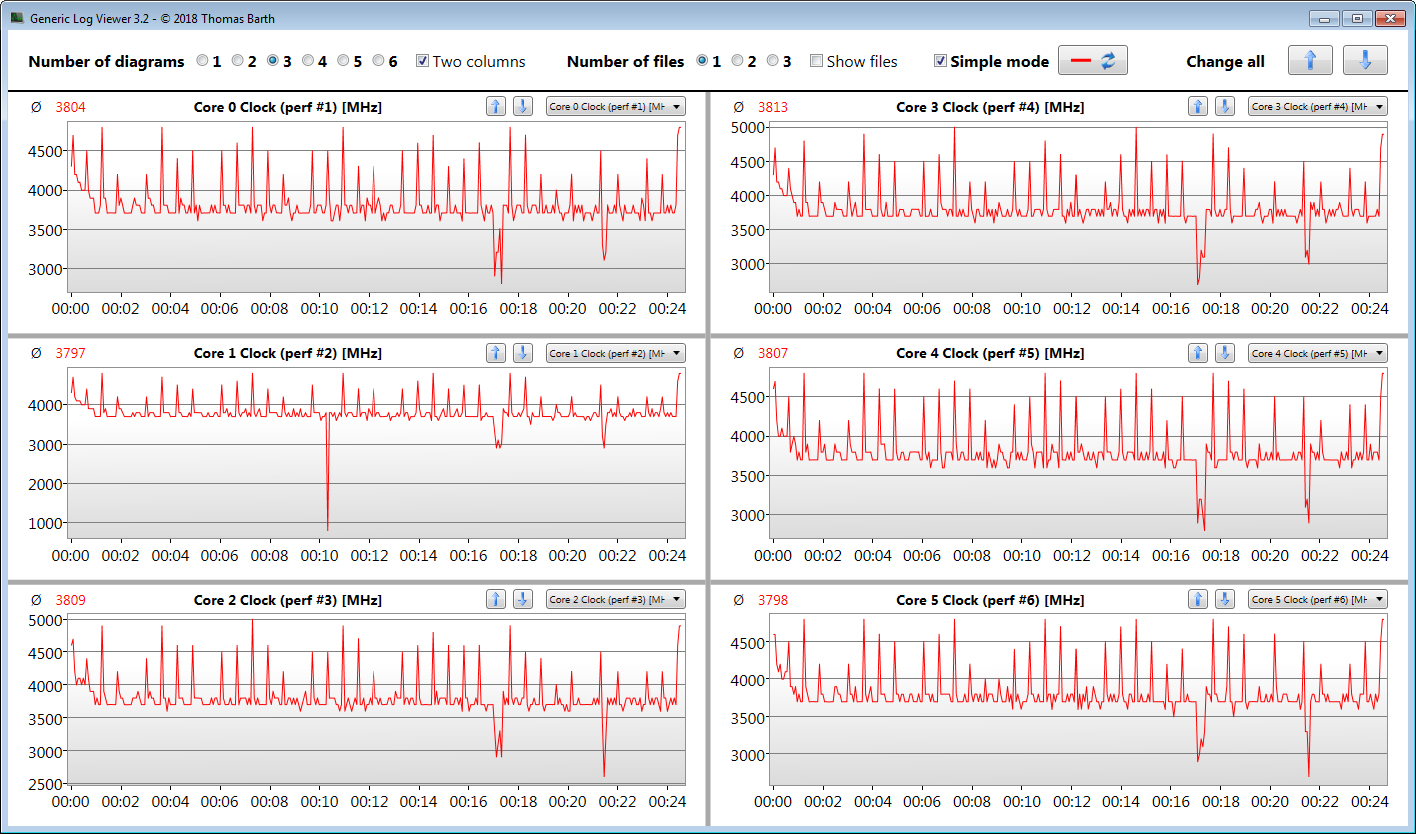
The laptop has a Core i7-10750H hexa-core processor (Comet Lake) on board, which runs at a base speed of 2.6 GHz. The clock rate can be increased to up to 5 GHz (one core) via Turbo Boost. If all six cores are fully loaded, the maximum is 4.3 GHz.
The CPU briefly processes the Cinebench R15 benchmark's multithread test at 4.2 GHz. The clock rate then drops to 3.7 to 3.9 GHz. The single-thread test is completed at 4.2 to 4.7 GHz. On battery power, the operating speeds are 2.6 GHz (multithread) and 2.2 to 2.9 GHz (single-thread), respectively.
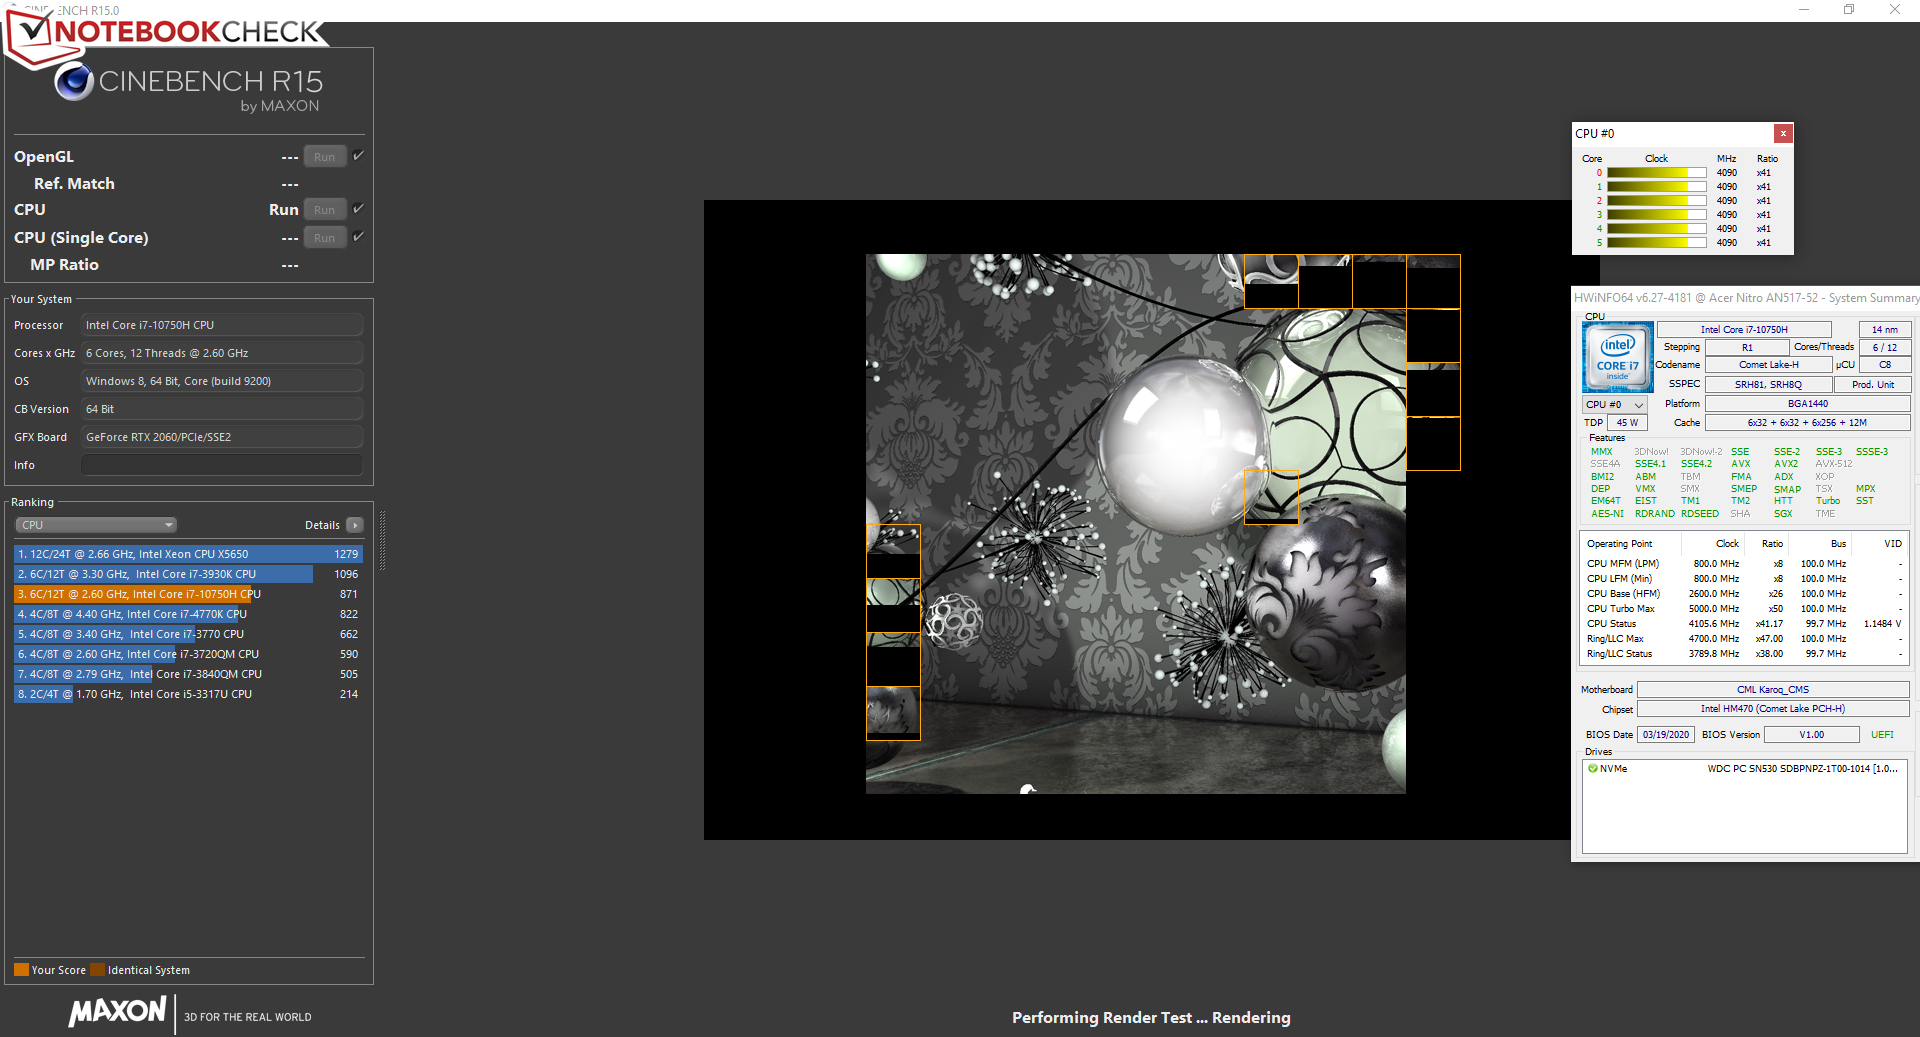

We verify if the CPU Turbo is also consistently used when plugged in by running the Cinebench R15 benchmark's multithread test in a continuous loop for at least 30 minutes. The results slightly drop from the first to the third run and then stabilize at a quite constant level. Turbo is used.
| LibreOffice - 20 Documents To PDF | |
| Asus TUF A17 FA706IU-AS76 | |
| Average Intel Core i7-10750H (43.1 - 99.2, n=43) | |
| Acer Nitro 5 AN517-52-77DS | |
| Average of class Gaming (19 - 88.8, n=110, last 2 years) | |
* ... smaller is better
System performance
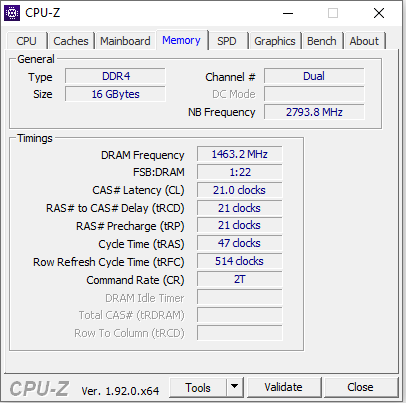
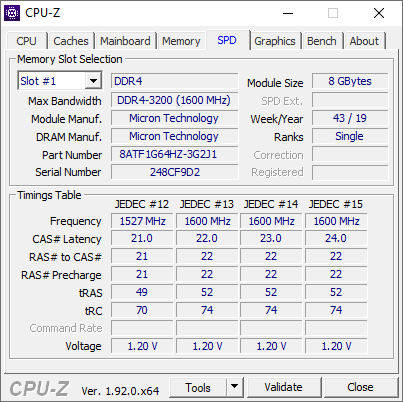
Acer's 17.3-incher does not lack computing power. A strong hexa-core processor, RAM running in dual-channel mode and a fast NVMe SSD ensure a fast and smooth system. An upper-class GPU is added to this. The results in the PCMark benchmarks are very good.
| PCMark 8 Home Score Accelerated v2 | 3836 points | |
| PCMark 8 Creative Score Accelerated v2 | 4075 points | |
| PCMark 8 Work Score Accelerated v2 | 5552 points | |
| PCMark 10 Score | 5201 points | |
Help | ||
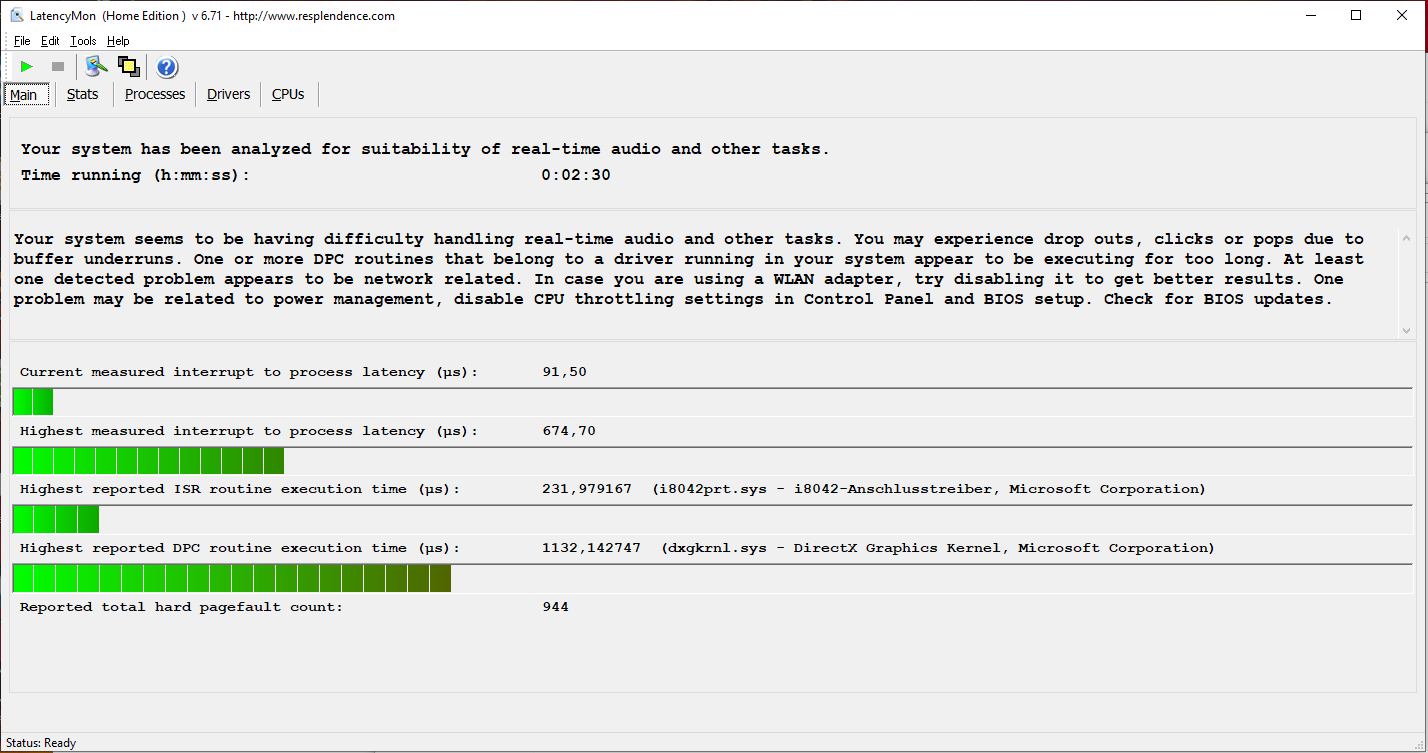
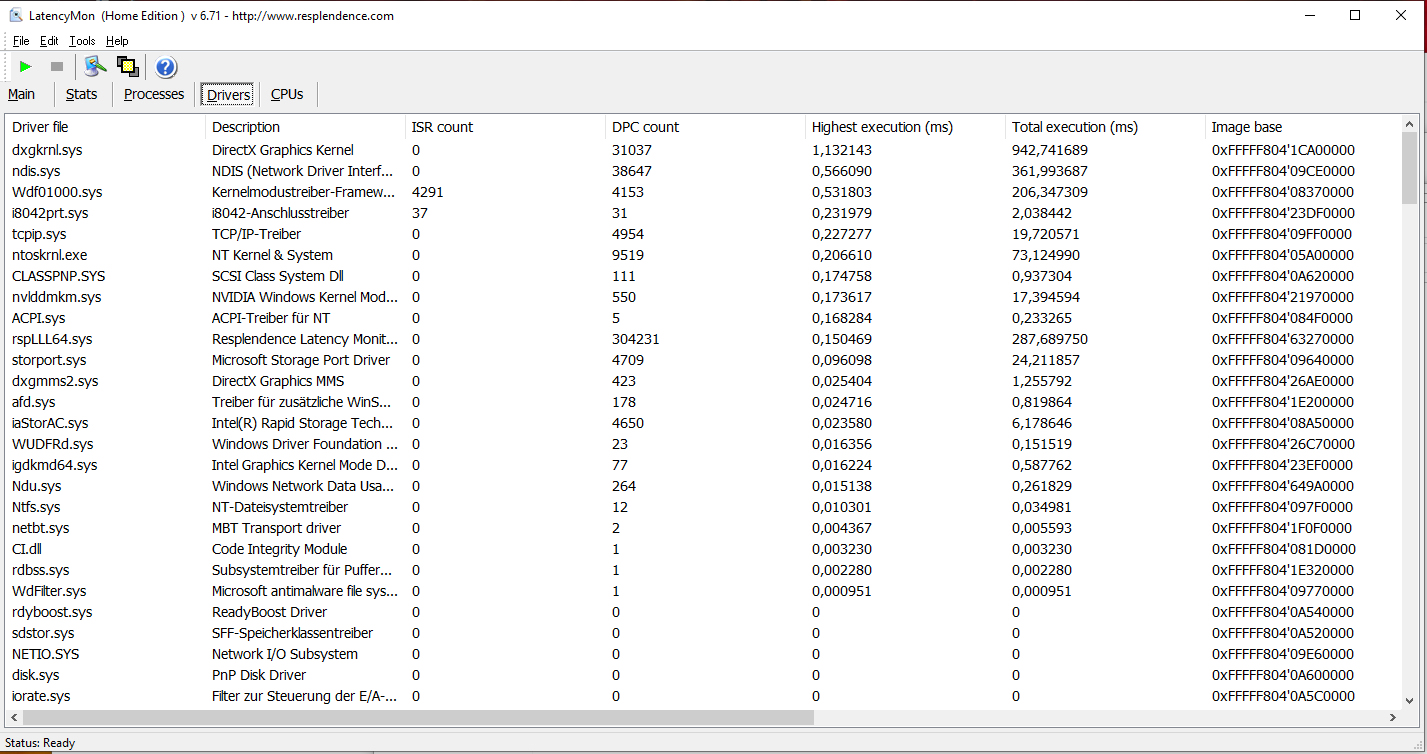
DPC latency
In our standardized latency monitor test (web-surfing, 4K video playback, high-load Prime95) we could observe high DPC latencies. The system is, therefore, not suitable for real-time video and audio-editing.
| DPC Latencies / LatencyMon - interrupt to process latency (max), Web, Youtube, Prime95 | |
| Asus TUF A17 FA706IU-AS76 | |
| Acer Nitro 5 AN517-52-77DS | |
* ... smaller is better
Storage
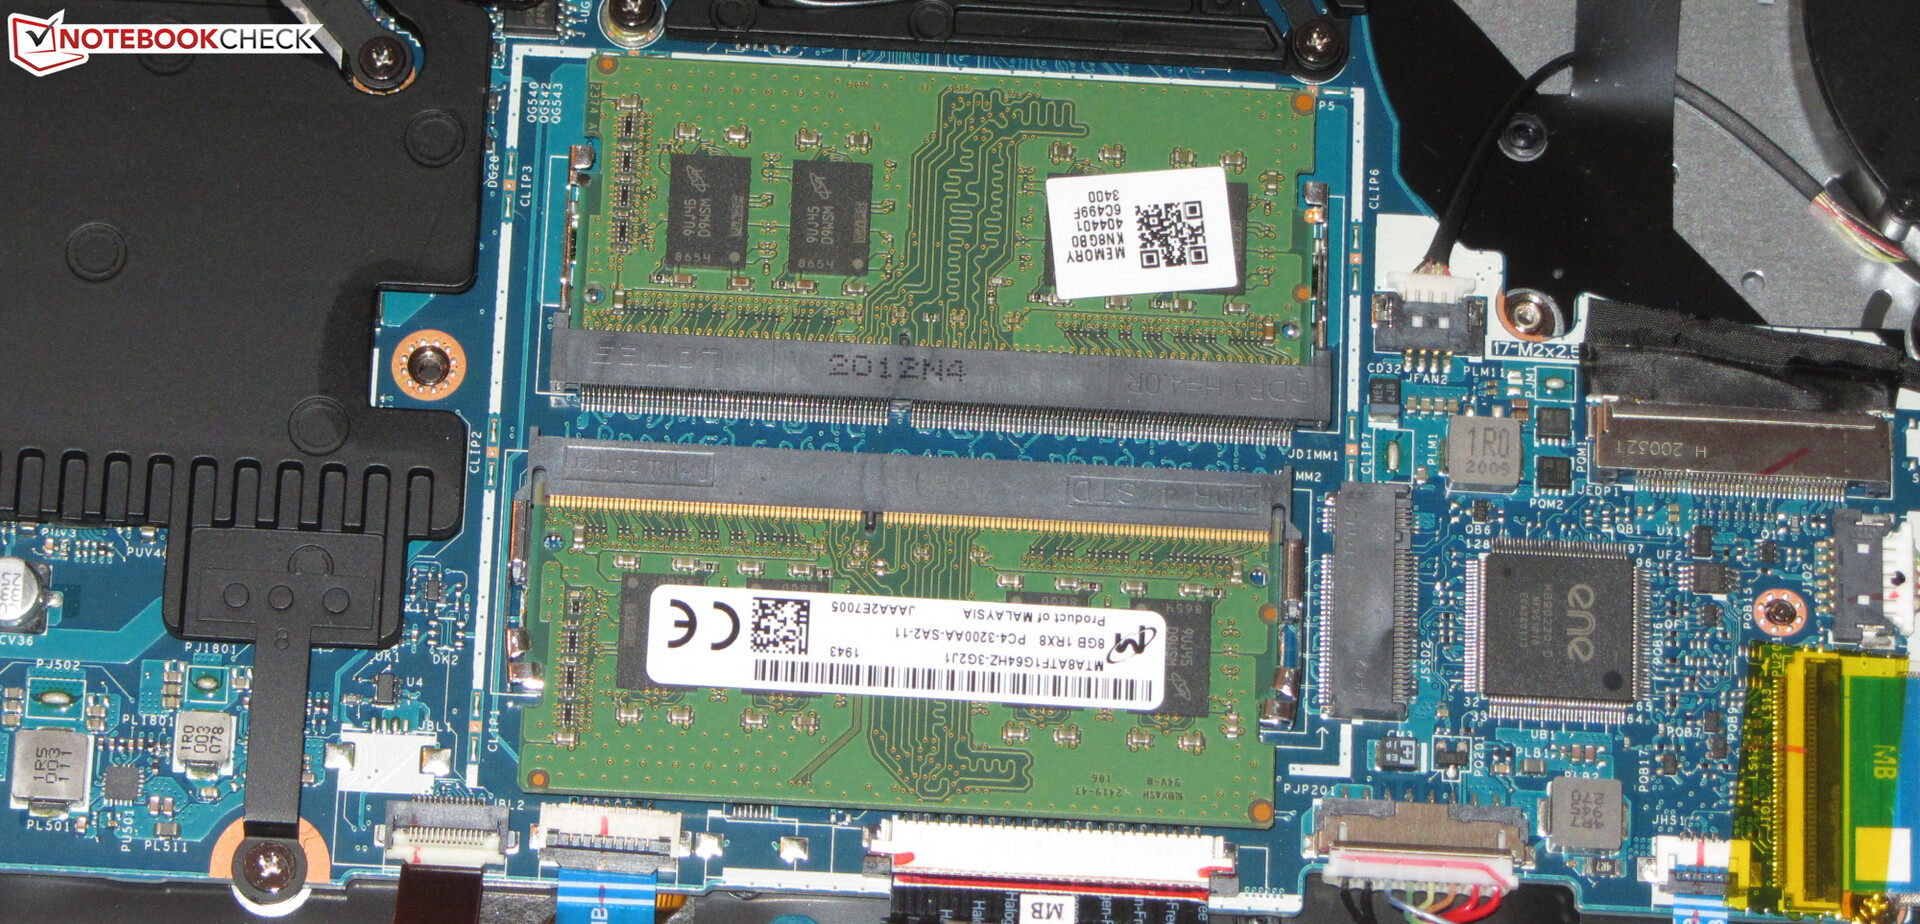
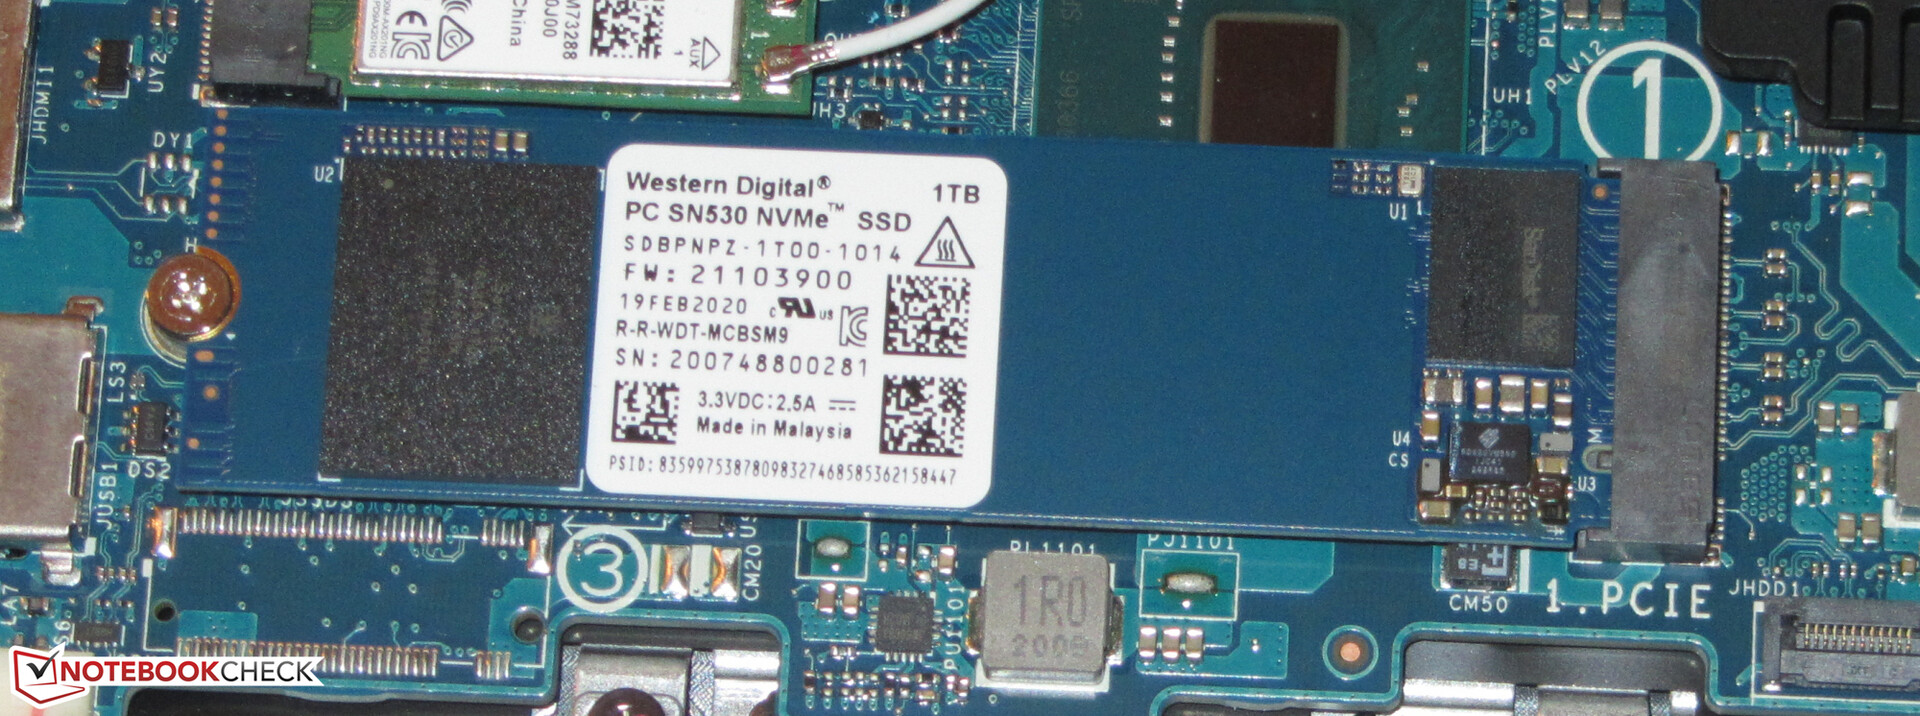
An NVMe SSD (M.2 2280) from Western Digital is used as system drive. It provides 1 TB of storage space and delivers good transfer speeds.
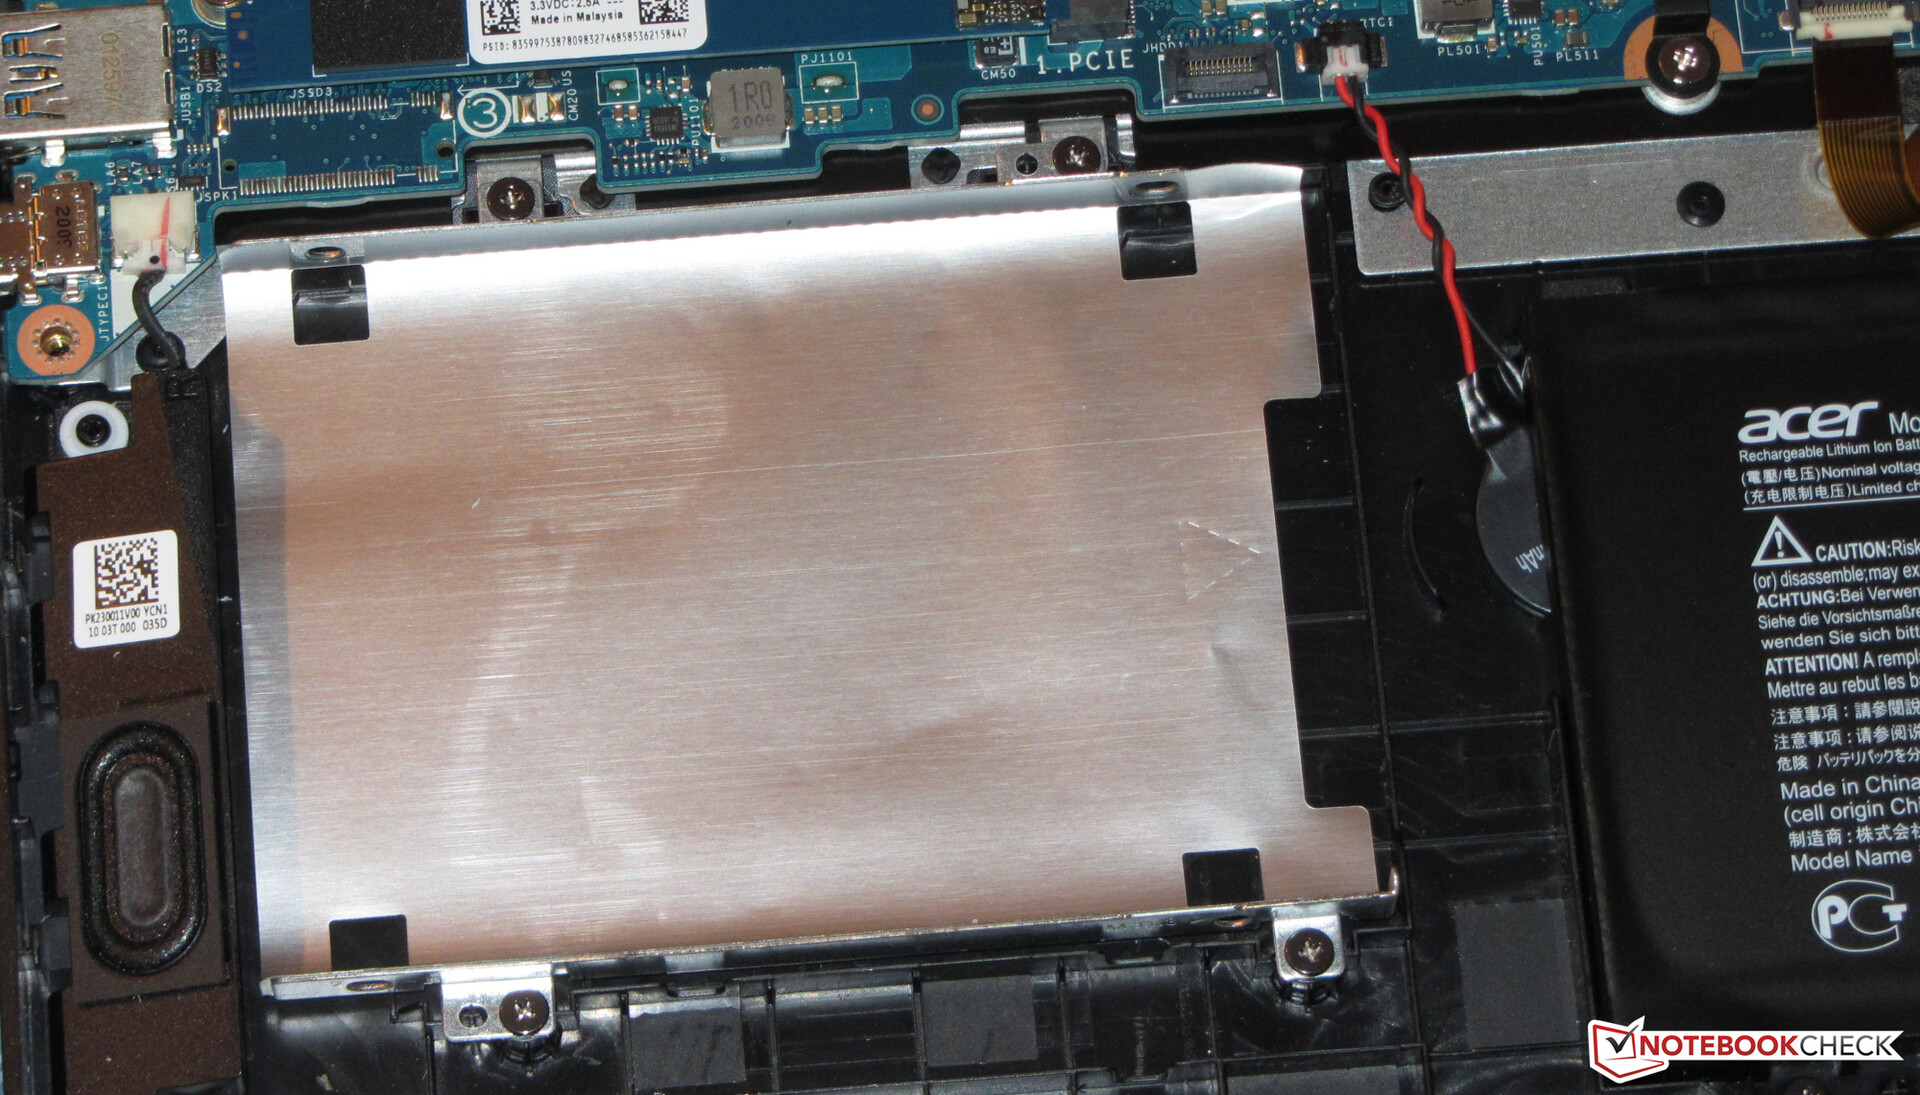
The laptop offers additional space for a second M.2 2280 SSD (NVMe) as well as a 2.5-inch storage device (the SATA slot and screws are in the box; the installation frame is found inside the laptop).

| Acer Nitro 5 AN517-52-77DS WDC PC SN530 SDBPNPZ-1T00 | Asus TUF A17 FA706IU-AS76 Intel SSD 660p 1TB SSDPEKNW010T8 | Lenovo Legion Y540-17IRH WDC PC SN520 SDAPNUW-512G | Schenker XMG Pro 17 PB71RD-G Samsung SSD 970 EVO Plus 500GB | HP Pavilion Gaming 17-cd0085cl Samsung SSD PM981 MZVLB256HAHQ | Acer Aspire Nitro 5 AN517-51-7887 WDC PC SN520 SDAPNUW-512G | Average WDC PC SN530 SDBPNPZ-1T00 | |
|---|---|---|---|---|---|---|---|
| CrystalDiskMark 5.2 / 6 | 10% | -27% | 22% | 16% | -21% | 16% | |
| Write 4K (MB/s) | 140 | 189.7 36% | 105.1 -25% | 117.5 -16% | 135.3 -3% | 104.6 -25% | 182.7 ? 31% |
| Read 4K (MB/s) | 49.04 | 62.3 27% | 34.41 -30% | 46.47 -5% | 63.7 30% | 39.76 -19% | 48.6 ? -1% |
| Write Seq (MB/s) | 1963 | 1681 -14% | 1298 -34% | 1345 -31% | 1337 -32% | 1268 -35% | 1979 ? 1% |
| Read Seq (MB/s) | 1455 | 1608 11% | 1099 -24% | 2804 93% | 1617 11% | 1414 -3% | 1828 ? 26% |
| Write 4K Q32T1 (MB/s) | 398.2 | 468.6 18% | 335.7 -16% | 368.2 -8% | 568 43% | 287.9 -28% | 498 ? 25% |
| Read 4K Q32T1 (MB/s) | 461.9 | 541 17% | 231.4 -50% | 412.9 -11% | 645 40% | 381.1 -17% | 573 ? 24% |
| Write Seq Q32T1 (MB/s) | 1969 | 1770 -10% | 1454 -26% | 3248 65% | 1428 -27% | 1319 -33% | 1980 ? 1% |
| Read Seq Q32T1 (MB/s) | 1927 | 1898 -2% | 1740 -10% | 3559 85% | 3184 65% | 1735 -10% | 2336 ? 21% |
Continuous load read: DiskSpd Read Loop, Queue Depth 8
Graphics card
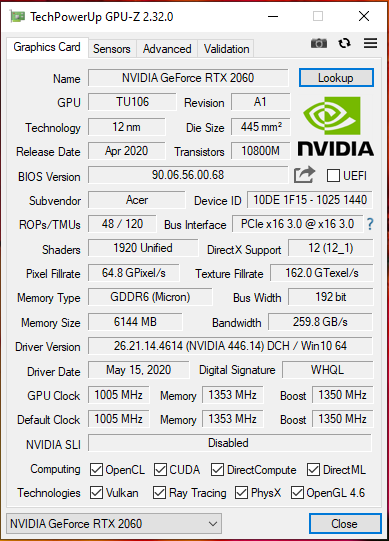
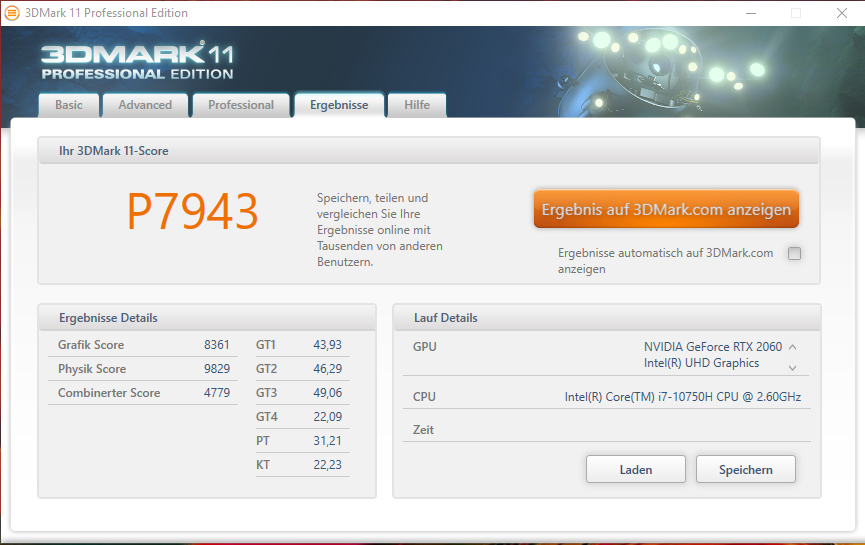
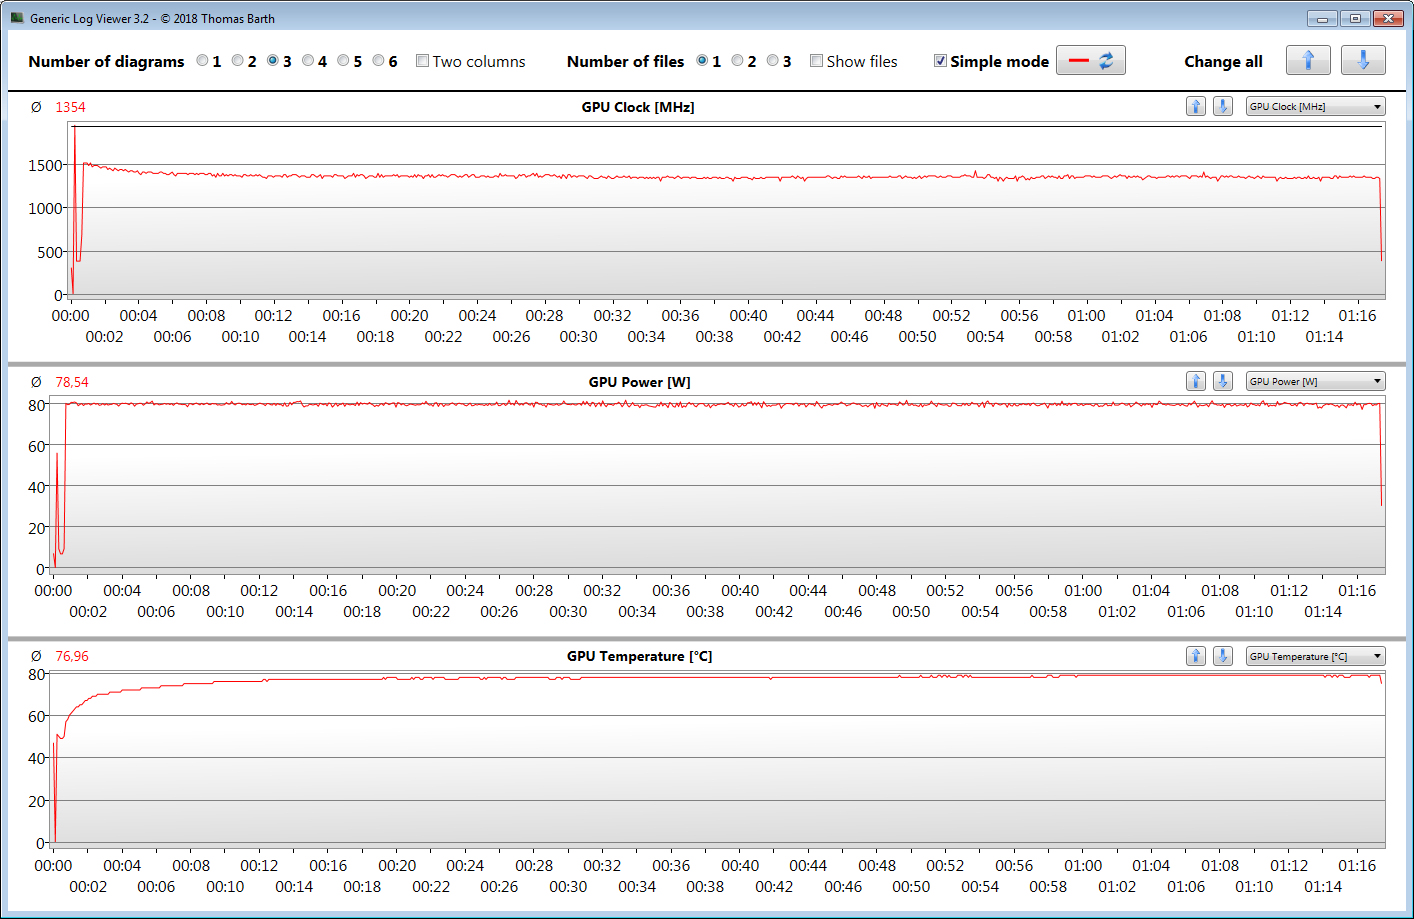
The GeForce RTX 2060 graphics core (Turing) belongs to the GPU upper class. It supports DirectX 12 and runs at a base speed of 1,005 MHz. An increase to up to 1,350 MHz is possible when boosted. Higher speeds are feasible if the GPU doesn't reach a defined temperature and/or energy threshold. In this way, we register a maximum of 1,960 MHz. Our The Witcher 3 test is run at an average speed of 1,354 MHz. The GPU has access to fast GDDR6 video memory (6,144 MB).
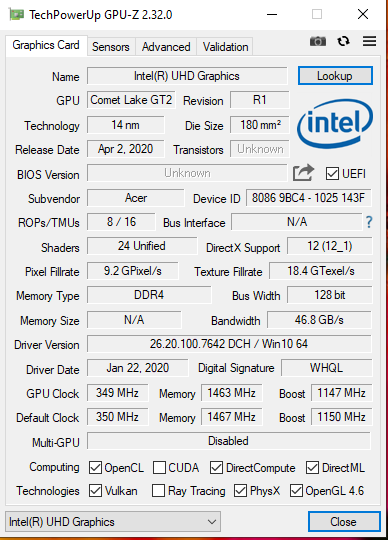
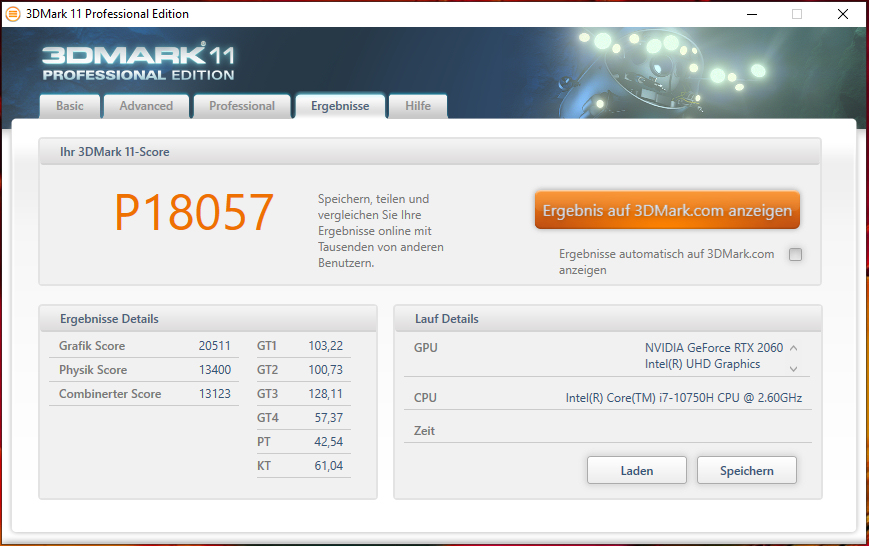
The results in the various 3DMark benchmarks are at a normal level for the GPU installed here. The Intel UHD Graphics 630 GPU that's integrated into the processor is active, and the laptop works with Nvidia's Optimus graphics-switching solution.
| 3DMark 06 Standard Score | 38509 points | |
| 3DMark 11 Performance | 18057 points | |
| 3DMark Ice Storm Standard Score | 117009 points | |
| 3DMark Cloud Gate Standard Score | 31601 points | |
| 3DMark Fire Strike Score | 14191 points | |
| 3DMark Time Spy Score | 5759 points | |
Help | ||
Gaming performance
The hardware in the Nitro 5 is able to run all the games in our database smoothly. Full HD resolution and high to maximum quality settings can always be selected. The GPU can also handle resolutions beyond Full HD (for which a corresponding monitor would have to be connected). However, the quality settings should be chosen more conservatively then.
| BioShock Infinite - 1920x1080 Ultra Preset, DX11 (DDOF) | |
| Lenovo Legion Y740-17IRH | |
| Average NVIDIA GeForce RTX 2060 Mobile (119 - 156, n=17) | |
| Acer Nitro 5 AN517-52-77DS | |
| Lenovo Legion Y540-17IRH | |
| Acer Aspire Nitro 5 AN517-51-7887 | |
| HP Pavilion Gaming 17-cd0085cl | |
| Shadow of the Tomb Raider - 1920x1080 Highest Preset AA:T | |
| Average of class Gaming (96 - 116, n=2, last 2 years) | |
| Lenovo Legion Y740-17IRH | |
| Average NVIDIA GeForce RTX 2060 Mobile (54 - 86, n=22) | |
| Asus TUF A17 FA706IU-AS76 | |
| Acer Nitro 5 AN517-52-77DS | |
| HP Pavilion Gaming 17-cd0085cl | |
In order to verify whether the frame rates remain largely constant even over a prolonged period of time, we let the game The Witcher 3 run for about 60 minutes at Full HD resolution and maximum quality settings. The character embodied by the player is not moved during this whole period. A drop in frame rates wasn't found.
| low | med. | high | ultra | |
|---|---|---|---|---|
| BioShock Infinite (2013) | 327.4 | 285.5 | 263.5 | 138.4 |
| The Witcher 3 (2015) | 277 | 188.3 | 108.9 | 63 |
| Dota 2 Reborn (2015) | 146.1 | 133.9 | 123.8 | 116.8 |
| X-Plane 11.11 (2018) | 98.3 | 84.1 | 75.8 | |
| Shadow of the Tomb Raider (2018) | 114 | 89 | 82 | 73 |
| Metro Exodus (2019) | 142.4 | 75.9 | 56.6 | 44.5 |
| Total War: Three Kingdoms (2019) | 229.6 | 107.4 | 66.9 | 46.3 |
| Control (2019) | 201.9 | 74.9 | 54.6 | |
| Borderlands 3 (2019) | 133 | 86.9 | 62.2 | 47.7 |
| Call of Duty Modern Warfare 2019 (2019) | 133.5 | 90.2 | 74.3 | 65.5 |
| Red Dead Redemption 2 (2019) | 116.9 | 76.1 | 50.7 | 32.5 |
| Escape from Tarkov (2020) | 121 | 121 | 117.5 | 103.3 |
| Hunt Showdown (2020) | 170.6 | 94.2 | 75 | |
| Doom Eternal (2020) | 195.6 | 125.4 | 112.4 | 108.9 |
| Gears Tactics (2020) | 236.1 | 145.6 | 93.3 | 60.7 |
Emissions - The Acer gaming laptop behaves normally
Noise emissions
Both fans in the AN571-52 operate at low speeds in idle usage and are barely audible. They are occasionally silent, but they turn up under load. In this way, we register sound pressure levels of 44.6 dB(A) (stress test) and 44.5 dB(A) (The Witcher 3 test), respectively. Playing without a headset is not enjoyable.
Noise level
| Idle |
| 30.2 / 30.2 / 30.2 dB(A) |
| Load |
| 41.5 / 44.6 dB(A) |
 | ||
30 dB silent 40 dB(A) audible 50 dB(A) loud |
||
min: | ||
| Acer Nitro 5 AN517-52-77DS i7-10750H, GeForce RTX 2060 Mobile | Asus TUF A17 FA706IU-AS76 R7 4800H, GeForce GTX 1660 Ti Mobile | Schenker XMG Pro 17 PB71RD-G i7-9750H, GeForce RTX 2060 Mobile | Lenovo Legion Y540-17IRH i5-9300H, GeForce GTX 1660 Ti Mobile | HP Pavilion Gaming 17-cd0085cl i7-9750H, GeForce GTX 1660 Ti Max-Q | Acer Aspire Nitro 5 AN517-51-7887 i7-9750H, GeForce GTX 1660 Ti Mobile | Average NVIDIA GeForce RTX 2060 Mobile | Average of class Gaming | |
|---|---|---|---|---|---|---|---|---|
| Noise | -5% | -14% | -7% | 7% | -3% | -3% | 3% | |
| off / environment * (dB) | 30.2 | 28.7 5% | 30 1% | 30 1% | 28.2 7% | 30 1% | 27.9 ? 8% | 24.1 ? 20% |
| Idle Minimum * (dB) | 30.2 | 28.7 5% | 30 1% | 30 1% | 30.1 -0% | 30.2 -0% | 29 ? 4% | 25.8 ? 15% |
| Idle Average * (dB) | 30.2 | 30.5 -1% | 32 -6% | 32 -6% | 30.1 -0% | 30.2 -0% | 30 ? 1% | 27.4 ? 9% |
| Idle Maximum * (dB) | 30.2 | 32.5 -8% | 39 -29% | 34 -13% | 30.1 -0% | 31 -3% | 33 ? -9% | 30 ? 1% |
| Load Average * (dB) | 41.5 | 42.5 -2% | 51 -23% | 44 -6% | 34.2 18% | 43.4 -5% | 44 ? -6% | 43 ? -4% |
| Witcher 3 ultra * (dB) | 44.5 | 50.1 -13% | 54 -21% | 50 -12% | 34.2 23% | 48.5 -9% | ||
| Load Maximum * (dB) | 44.6 | 53.4 -20% | 54 -21% | 52 -17% | 43.8 2% | 45.5 -2% | 51.6 ? -16% | 54 ? -21% |
* ... smaller is better
Temperature
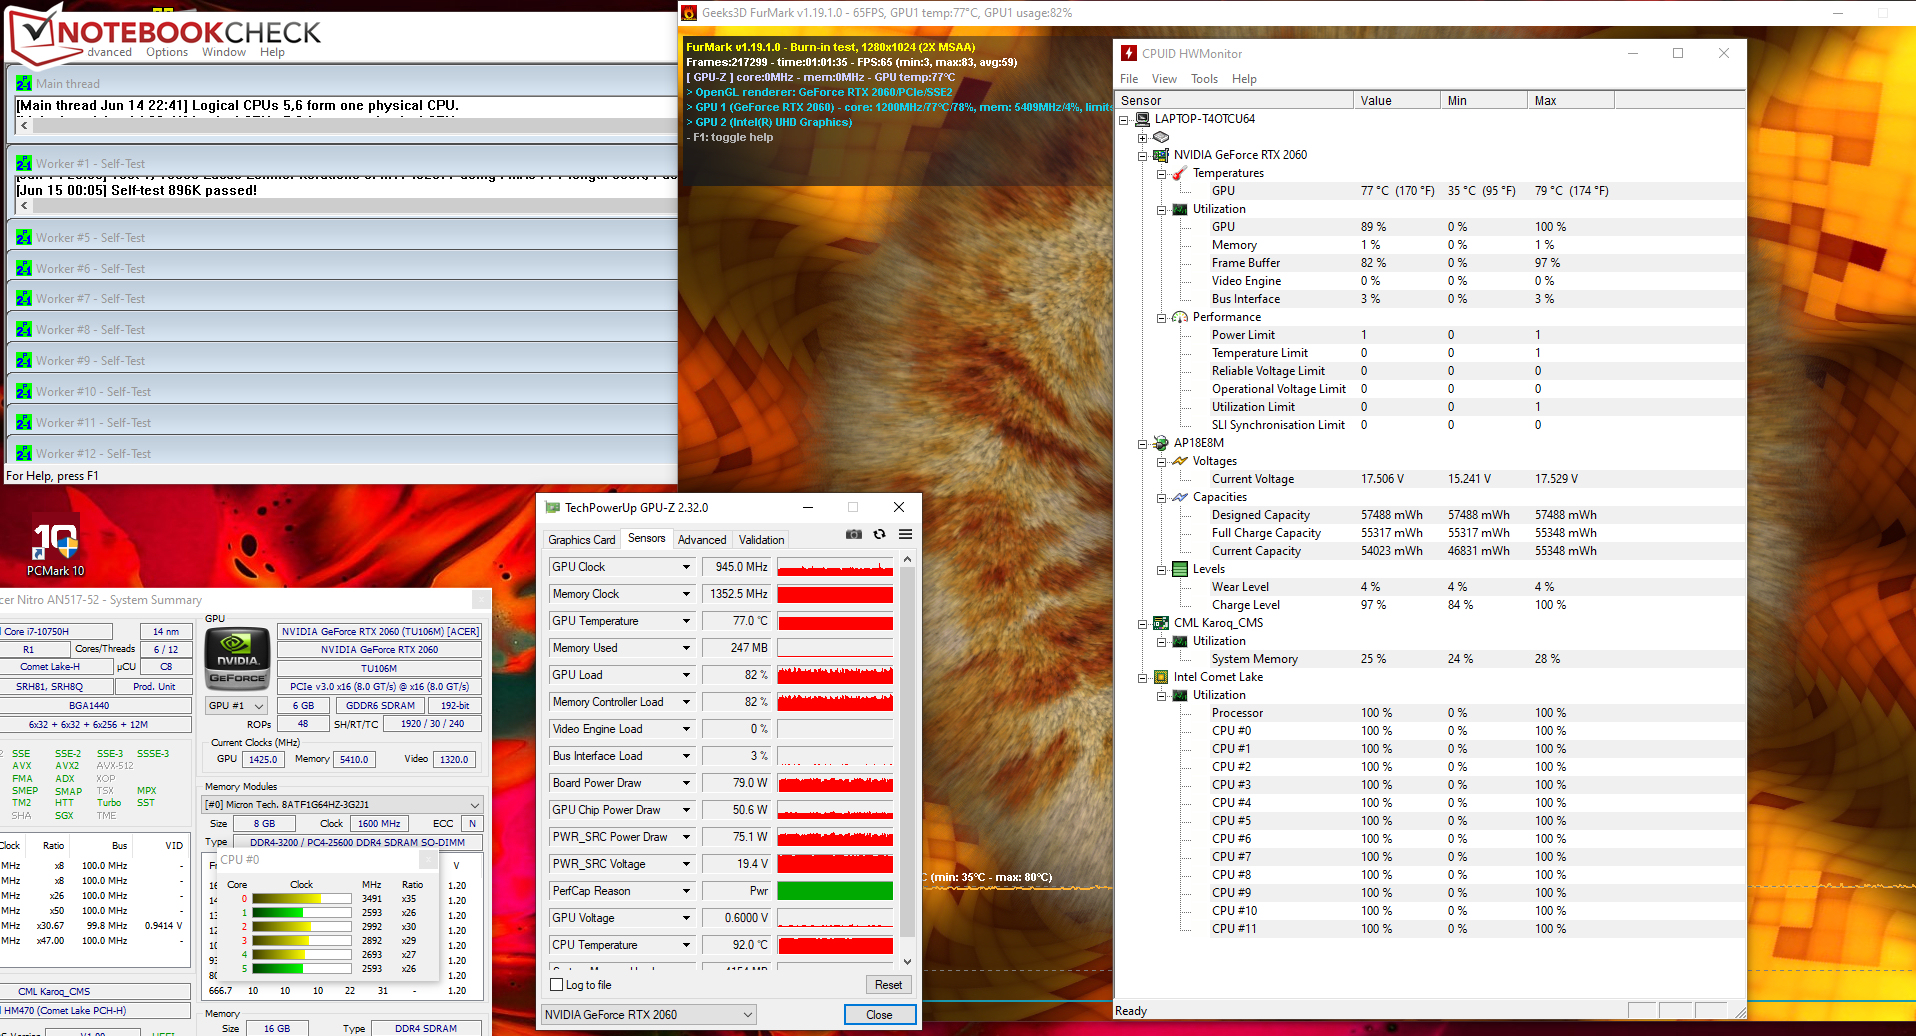
The Acer laptop works through our stress test (Prime95 and FurMark run for at least an hour) in different ways when plugged in and on battery power. The processor and graphics core run at 3.5 GHz and 1,140 MHz, respectively, for a short time. Subsequently, the clock speeds oscillate between 2.5 and 3.5 GHZ for the CPU, while they vary in the range of 800 to 1,200 MHz for the GPU. On battery power, the speeds are 800 to 900 MHz (CPU) and 1,440 MHz (GPU), respectively. The stress test represents an extreme scenario that doesn't occur in everyday life. We use this test to verify that the system remains stable even under full load.
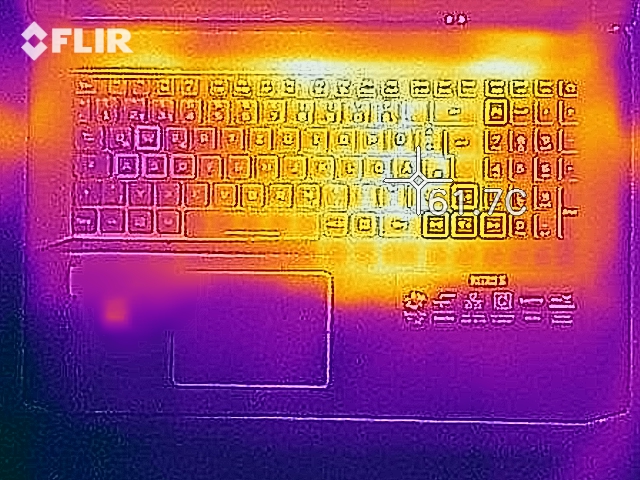
Overall, the heat development is alright for a laptop in this performance class. During the stress test we registered temperatures of just over 50 °C (~122 °F) at several measuring points. The device warmed up a bit less when performing our The Witcher 3 test. In everyday use, the temperatures remain in the green range.
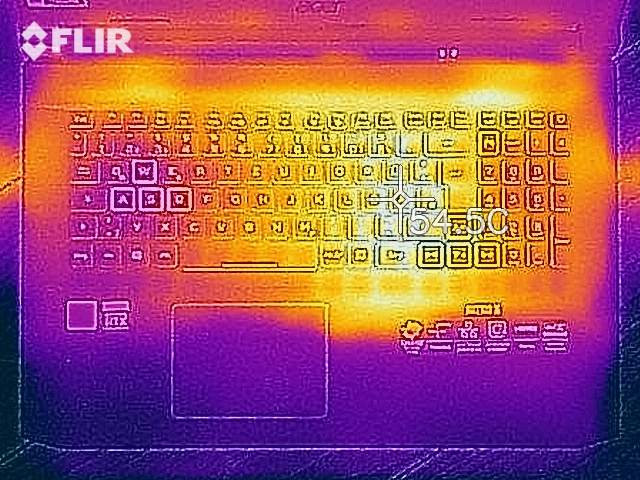
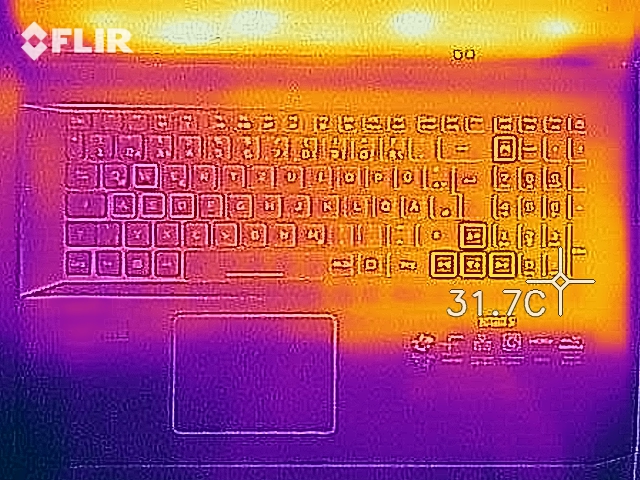
(-) The maximum temperature on the upper side is 50.6 °C / 123 F, compared to the average of 40.4 °C / 105 F, ranging from 21.2 to 68.8 °C for the class Gaming.
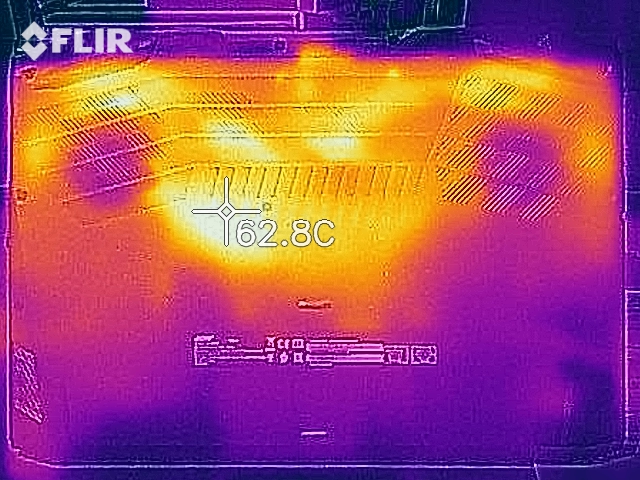
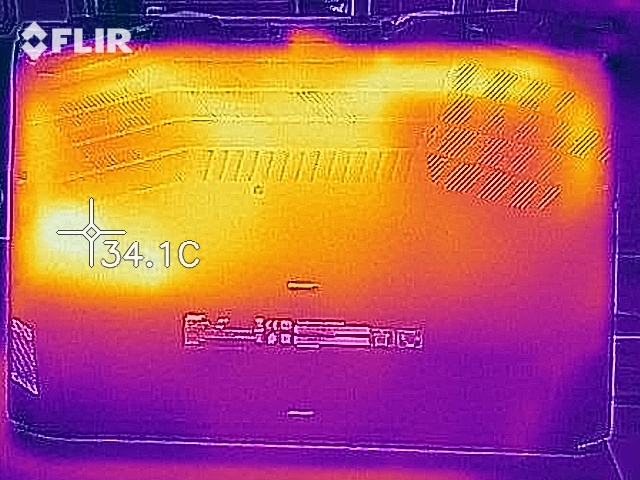
(-) The bottom heats up to a maximum of 53.8 °C / 129 F, compared to the average of 43.2 °C / 110 F
(+) In idle usage, the average temperature for the upper side is 25 °C / 77 F, compared to the device average of 33.9 °C / 93 F.
(±) Playing The Witcher 3, the average temperature for the upper side is 37.3 °C / 99 F, compared to the device average of 33.9 °C / 93 F.
(+) The palmrests and touchpad are cooler than skin temperature with a maximum of 26.1 °C / 79 F and are therefore cool to the touch.
(+) The average temperature of the palmrest area of similar devices was 28.8 °C / 83.8 F (+2.7 °C / 4.8 F).

| Acer Nitro 5 AN517-52-77DS i7-10750H, GeForce RTX 2060 Mobile | Asus TUF A17 FA706IU-AS76 R7 4800H, GeForce GTX 1660 Ti Mobile | Schenker XMG Pro 17 PB71RD-G i7-9750H, GeForce RTX 2060 Mobile | Lenovo Legion Y740-17IRH i7-9750H, GeForce RTX 2060 Mobile | HP Pavilion Gaming 17-cd0085cl i7-9750H, GeForce GTX 1660 Ti Max-Q | Acer Aspire Nitro 5 AN517-51-7887 i7-9750H, GeForce GTX 1660 Ti Mobile | Average NVIDIA GeForce RTX 2060 Mobile | Average of class Gaming | |
|---|---|---|---|---|---|---|---|---|
| Heat | -4% | -4% | -3% | -11% | -5% | -7% | -5% | |
| Maximum Upper Side * (°C) | 50.6 | 47.6 6% | 47 7% | 43 15% | 42.6 16% | 51.7 -2% | 47.2 ? 7% | 45.2 ? 11% |
| Maximum Bottom * (°C) | 53.8 | 50.8 6% | 48 11% | 46 14% | 49 9% | 55.4 -3% | 52.7 ? 2% | 48 ? 11% |
| Idle Upper Side * (°C) | 26.6 | 33 -24% | 30 -13% | 31 -17% | 34 -28% | 29.1 -9% | 31 ? -17% | 31.1 ? -17% |
| Idle Bottom * (°C) | 27.8 | 29 -4% | 34 -22% | 34 -22% | 39.4 -42% | 29 -4% | 32.9 ? -18% | 34.2 ? -23% |
* ... smaller is better
Speakers
The stereo speakers are placed in the front area of the bottom of the device. They produce a decent sound, which is largely lacking in bass. In addition, the speakers only have a low maximum volume.
Acer Nitro 5 AN517-52-77DS audio analysis
(-) | not very loud speakers (67.8 dB)
Bass 100 - 315 Hz
(-) | nearly no bass - on average 22.3% lower than median
(±) | linearity of bass is average (12% delta to prev. frequency)
Mids 400 - 2000 Hz
(+) | balanced mids - only 4.1% away from median
(±) | linearity of mids is average (9.2% delta to prev. frequency)
Highs 2 - 16 kHz
(+) | balanced highs - only 2.6% away from median
(+) | highs are linear (6.3% delta to prev. frequency)
Overall 100 - 16.000 Hz
(±) | linearity of overall sound is average (22.4% difference to median)
Compared to same class
» 80% of all tested devices in this class were better, 6% similar, 14% worse
» The best had a delta of 6%, average was 18%, worst was 132%
Compared to all devices tested
» 65% of all tested devices were better, 6% similar, 29% worse
» The best had a delta of 4%, average was 24%, worst was 134%
Asus TUF A17 FA706IU-AS76 audio analysis
(±) | speaker loudness is average but good (74 dB)
Bass 100 - 315 Hz
(±) | reduced bass - on average 12.7% lower than median
(±) | linearity of bass is average (11.5% delta to prev. frequency)
Mids 400 - 2000 Hz
(+) | balanced mids - only 4.8% away from median
(±) | linearity of mids is average (9.1% delta to prev. frequency)
Highs 2 - 16 kHz
(+) | balanced highs - only 3.1% away from median
(±) | linearity of highs is average (8.7% delta to prev. frequency)
Overall 100 - 16.000 Hz
(±) | linearity of overall sound is average (23.5% difference to median)
Compared to same class
» 85% of all tested devices in this class were better, 5% similar, 10% worse
» The best had a delta of 6%, average was 18%, worst was 132%
Compared to all devices tested
» 70% of all tested devices were better, 6% similar, 24% worse
» The best had a delta of 4%, average was 24%, worst was 134%
Energy management - The Nitro AN517-52 provides good battery life
Energy consumption
In idle usage we register a maximum power consumption of 10.9 watts - a good value. The stress test lets the power consumption rise up to 193 watts - for a few seconds. During the execution of our The Witcher 3 test, we measured an average power consumption of 134.3 watts (127.7 to 152.9 watts). Moreover, the power adapter's output is 180 watts.
| Off / Standby | |
| Idle | |
| Load |
|
Key:
min: | |
| Acer Nitro 5 AN517-52-77DS i7-10750H, GeForce RTX 2060 Mobile | Asus TUF A17 FA706IU-AS76 R7 4800H, GeForce GTX 1660 Ti Mobile | Schenker XMG Pro 17 PB71RD-G i7-9750H, GeForce RTX 2060 Mobile | Lenovo Legion Y540-17IRH i5-9300H, GeForce GTX 1660 Ti Mobile | HP Pavilion Gaming 17-cd0085cl i7-9750H, GeForce GTX 1660 Ti Max-Q | Acer Aspire Nitro 5 AN517-51-7887 i7-9750H, GeForce GTX 1660 Ti Mobile | Average NVIDIA GeForce RTX 2060 Mobile | Average of class Gaming | |
|---|---|---|---|---|---|---|---|---|
| Power Consumption | -15% | -60% | -89% | 5% | 10% | -61% | -79% | |
| Idle Minimum * (Watt) | 5.4 | 7.4 -37% | 11 -104% | 19 -252% | 5.4 -0% | 3.9 28% | 11.5 ? -113% | 13.2 ? -144% |
| Idle Average * (Watt) | 9.8 | 10.5 -7% | 18 -84% | 22 -124% | 9.2 6% | 8.9 9% | 16.5 ? -68% | 18.9 ? -93% |
| Idle Maximum * (Watt) | 10.9 | 17 -56% | 28 -157% | 30 -175% | 13 -19% | 12.2 -12% | 23.7 ? -117% | 24.3 ? -123% |
| Load Average * (Watt) | 104 | 103.7 -0% | 99 5% | 79 24% | 85.9 17% | 83 20% | 107.5 ? -3% | 108 ? -4% |
| Witcher 3 ultra * (Watt) | 134.3 | 128.1 5% | 146 -9% | 134 -0% | 107.9 20% | 130 3% | ||
| Load Maximum * (Watt) | 193 | 183.2 5% | 210 -9% | 201 -4% | 182.2 6% | 168 13% | 199.7 ? -3% | 254 ? -32% |
* ... smaller is better
Battery life
Acer's gaming powerhouse achieves a runtime of 6:36 h in our practical WLAN test (accessing websites using a script; energy profile: Balanced). The 17.3-incher completes our video test (energy profile: Energy-saving mode) after 7:19 h. We let the Big Buck Bunny short film (H.264 encoding, 1920x1080 pixels) run in a continuous loop. The energy-saving functions are disabled during both tests, and the display brightness is regulated to about 150 cd/m². To perform the video test, the radio modules are also turned off.
| Acer Nitro 5 AN517-52-77DS i7-10750H, GeForce RTX 2060 Mobile, 57.48 Wh | Asus TUF A17 FA706IU-AS76 R7 4800H, GeForce GTX 1660 Ti Mobile, 90 Wh | Lenovo Legion Y540-17IRH i5-9300H, GeForce GTX 1660 Ti Mobile, 57 Wh | Schenker XMG Pro 17 PB71RD-G i7-9750H, GeForce RTX 2060 Mobile, 62 Wh | HP Pavilion Gaming 17-cd0085cl i7-9750H, GeForce GTX 1660 Ti Max-Q, 52.5 Wh | Acer Aspire Nitro 5 AN517-51-7887 i7-9750H, GeForce GTX 1660 Ti Mobile, 57 Wh | Average of class Gaming | |
|---|---|---|---|---|---|---|---|
| Battery runtime | 26% | -49% | -42% | -20% | -3% | -7% | |
| Reader / Idle (h) | 11 | 9.1 -17% | 5.2 -53% | 5.2 -53% | 11.6 5% | 13.4 22% | 8.71 ? -21% |
| H.264 (h) | 7.3 | 3.4 -53% | 6.3 -14% | 8.26 ? 13% | |||
| WiFi v1.3 (h) | 6.6 | 8.5 29% | 3.7 -44% | 4.1 -38% | 5.7 -14% | 6.2 -6% | 7.02 ? 6% |
| Load (h) | 2 | 3.3 65% | 1.1 -45% | 1.3 -35% | 1 -50% | 1.7 -15% | 1.47 ? -26% |
Pros
Cons
Verdict
Acer's 17.3-inch gaming laptop is able to run all the latest games smoothly on the matte Full HD display thanks to the Core i7-10750H processor and the GeForce RTX 2060 GPU. You can usually play at Full HD resolution and high to maximum quality settings here.
The Acer Nitro 5 AN517-52 is a largely well-rounded gaming laptop that deserves a better display.
Enough room for games and other applications is provided by the 1 TB NVMe SSD. Should the storage space ever run out, it could be expanded. The laptop can also accommodate a second M.2 2280 NVMe SSD and a 2.5-inch storage device. Since the computer doesn't have a maintenance hatch, the case would have to be opened for this.
All in all, the 120 Hz IPS display isn't able to convince. Brightness, contrast and color-space coverage are all too low. The response times can only be described as average. A 1,500-Euro (~$1,697) laptop needs to offer more here. Stable viewing angles, a matte surface, and decent color reproduction speak for the display.
The laptop comes with the most necessary ports. You'll look in vain for a Thunderbolt 3 port, though. There's only one USB Type-C 3.2 Gen 2 port, which doesn't support the DisplayPort via USB-C function. The built-in keyboard (with RGB lighting) has proven to be suitable for everyday use. Furthermore, battery life is more than okay for a 17.3-inch gaming laptop.
Currently, the laptop costs just under 1,500 Euros (~$1,697). As a result, it really doesn't represent itself as a bargain. Nevertheless, it does offer a good price-performance ratio.
Acer Nitro 5 AN517-52-77DS
- 06/18/2020 v7 (old)
Sascha Mölck
Price comparison

