Acer Nitro 5 AN517-53 review: Affordable gaming laptop with RTX 3050 ↺

The Acer Nitro 5, which is very popular due to its usually good price-performance ratio, exists in various CPU and GPU configurations. We took one of the cheapest models, the AN517-53-54DQ, and put it through its paces. The 17-incher, which wanders over the (virtual) counter for just under 1,000 Euro (~$1180), can fall back on a quad-core processor from Intel's current Tiger-Lake generation, more precisely the Core i5-11300H.
Demanding graphics calculations (the notebook supports Nvidia's Optimus technology) are taken care of by the GeForce RTX 3050 laptop GPU, a brand new mid-range chip based on Nvidia's Ampere architecture. The operating system (Windows 10 Home 64 bit) is installed on a 512 GB NVMe SSD in M.2 format. The display is a matte IPS panel with 1,920 x 1,080 pixels and 144 Hz.
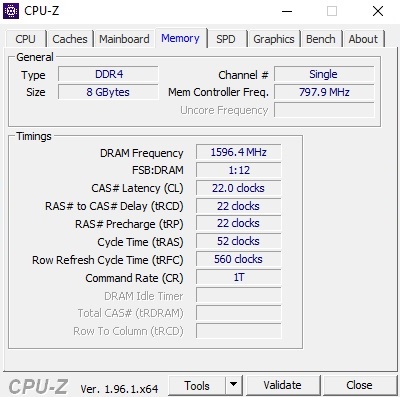
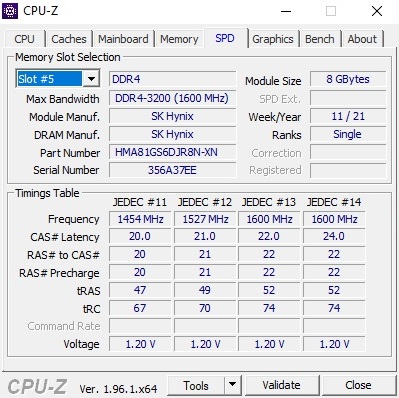
Buyers will have to make some concessions when it comes to the working memory. The installed 8 GB DDR4 RAM is only single-rank and only runs in single-channel mode, which sometimes costs more and sometimes results in less performance depending on the (3D) application.
The Nitro 5 AN517-53-54DQ's competitors include other affordable 17-inch gamers with quad-core CPUs and mid-range GPUs like the Lenovo Legion 5 17IMH05, the MSI GF75 Thin 10SCXR and the Asus TUF FX705DT-AU068T, which are all still equipped with the old GeForce GTX 1650, the predecessor of the RTX 3050. We also compared the HP Omen 15-ek0456ng with a GeForce GTX 1660 Ti for the test.
Possible competitors in comparison
Rating | Date | Model | Weight | Height | Size | Resolution | Price |
|---|---|---|---|---|---|---|---|
| 81.1 % v7 (old) | 08 / 2021 | Acer Nitro 5 AN517-53-54DQ i5-11300H, GeForce RTX 3050 4GB Laptop GPU | 2.6 kg | 25 mm | 17.30" | 1920x1080 | |
| 82.1 % v7 (old) | 09 / 2020 | HP Omen 15-ek0456ng i5-10300H, GeForce GTX 1660 Ti Mobile | 2.1 kg | 32 mm | 15.60" | 1920x1080 | |
| 81.9 % v7 (old) | 10 / 2020 | Lenovo Legion 5 17IMH05 i5-10300H, GeForce GTX 1650 Mobile | 2.9 kg | 26.2 mm | 17.30" | 1920x1080 | |
| 78.5 % v7 (old) | 04 / 2020 | MSI GF75 Thin 10SCXR i5-10300H, GeForce GTX 1650 Mobile | 2.2 kg | 23.1 mm | 17.30" | 1920x1080 | |
| 77.8 % v7 (old) | 06 / 2019 | Asus TUF FX705DT-AU068T R5 3550H, GeForce GTX 1650 Mobile | 2.7 kg | 26.6 mm | 17.30" | 1920x1080 |
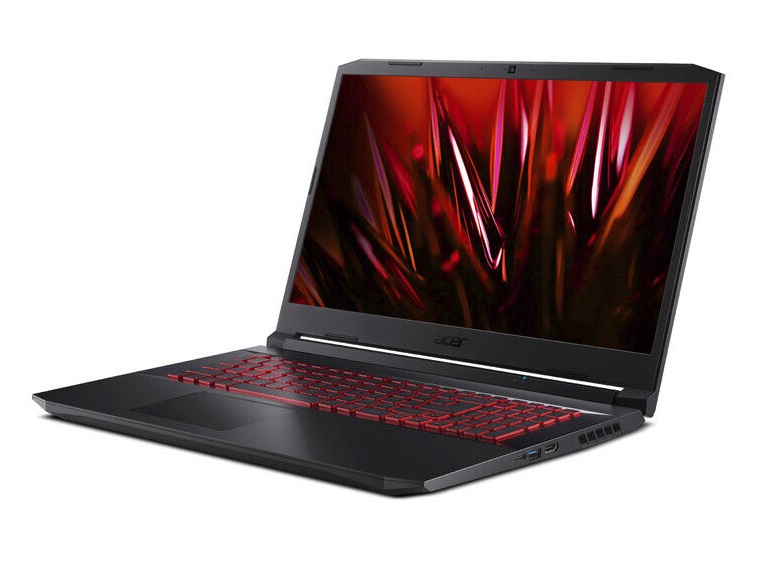
Since the chassis is mostly identical to the recently reviewed Acer Nitro 5 AN517-41-R5Z7, we will not go into more detail about the chassis, the equipment (interfaces, etc.) and the input devices in this article. You can find the corresponding information in the linked review. The only striking change concerns the keyboard. Instead of a white lettered and RGB illuminated keyboard, the Nitro 5 AN517-53-54DQ offers a red model (both lettering and illumination).
Communication
Webcam


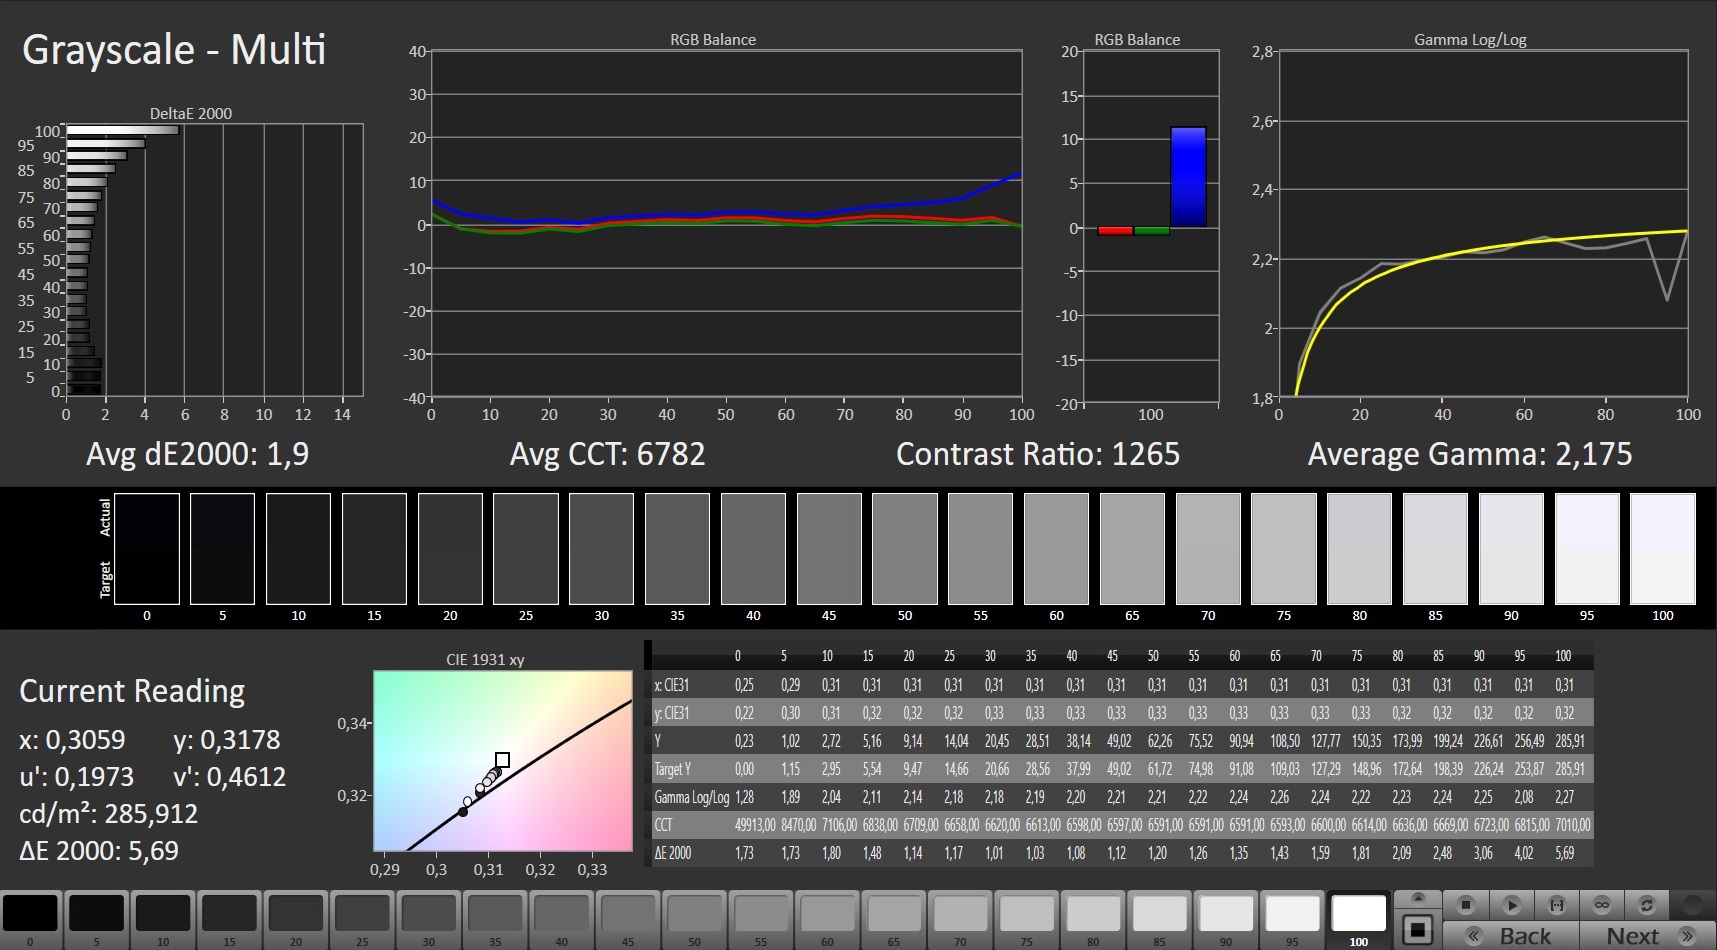
Display - 144 Hz, but dark and colorless
Although the 144 Hz panel matches the Nitro 5 AN517-41-R5Z7, the determined values deviate slightly in places. This is a typical phenomenon since there are always certain fluctuations in series production.
| |||||||||||||||||||||||||
Brightness Distribution: 83 %
Center on Battery: 286 cd/m²
Contrast: 1243:1 (Black: 0.23 cd/m²)
ΔE ColorChecker Calman: 4.92 | ∀{0.5-29.43 Ø4.72}
calibrated: 4.73
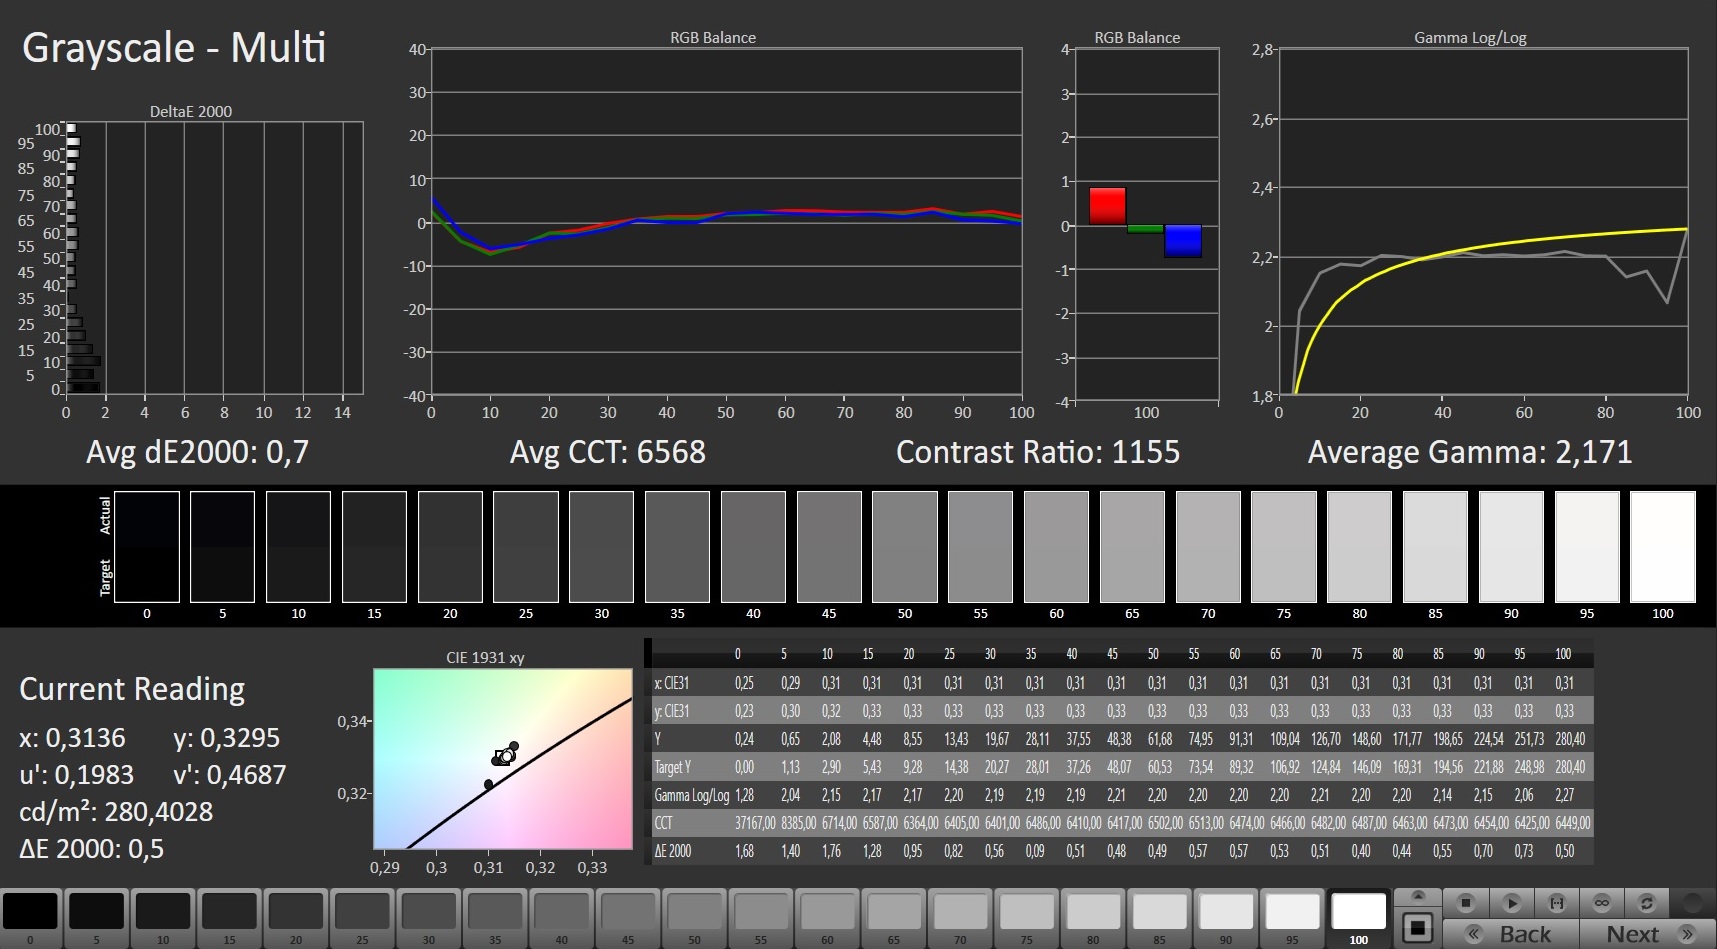
ΔE Greyscale Calman: 1.9 | ∀{0.09-98 Ø4.97}
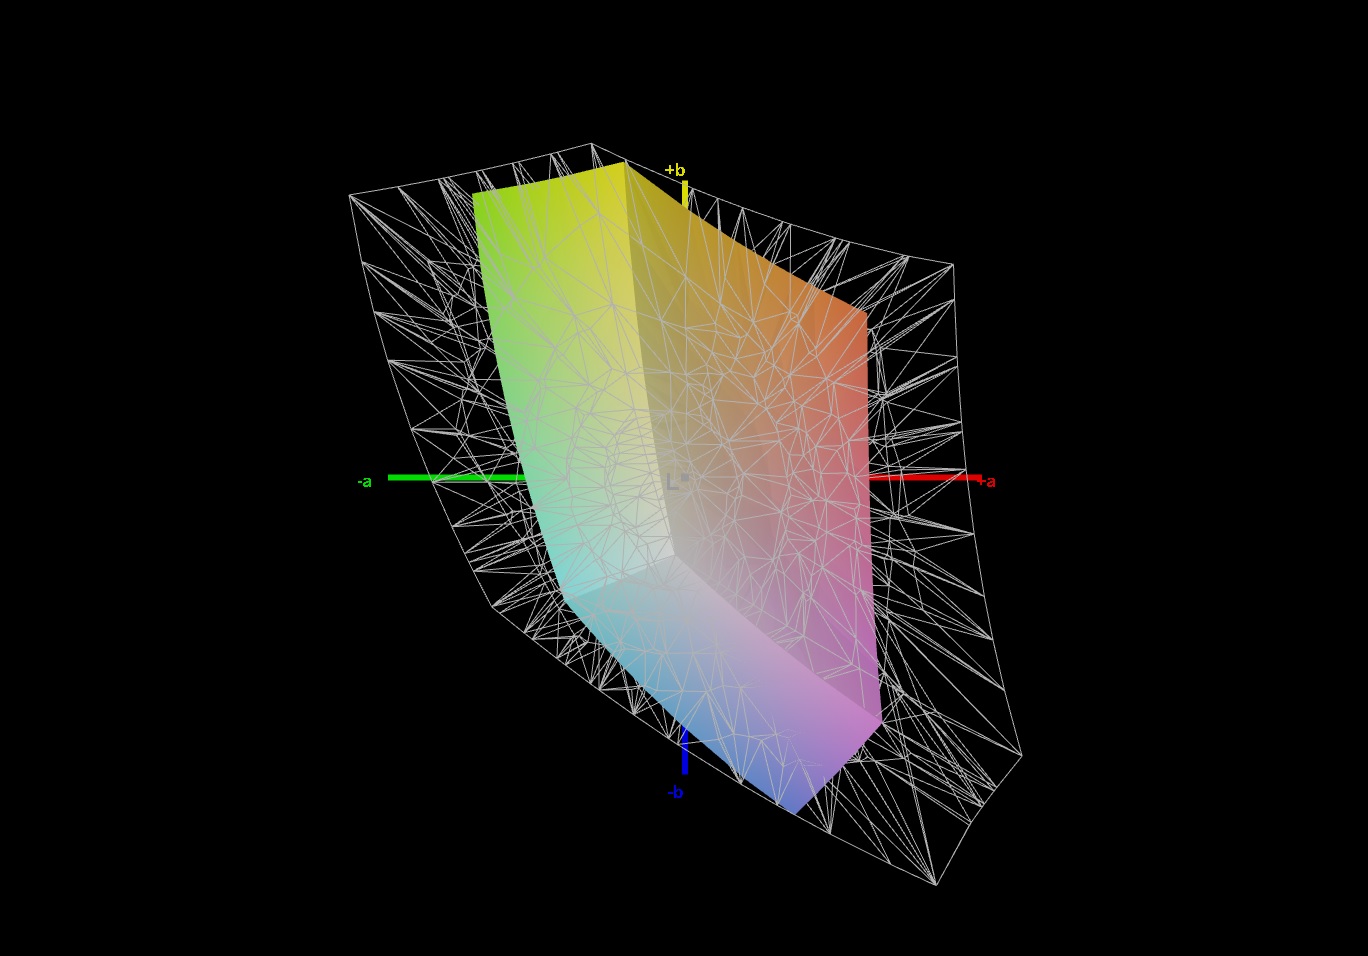
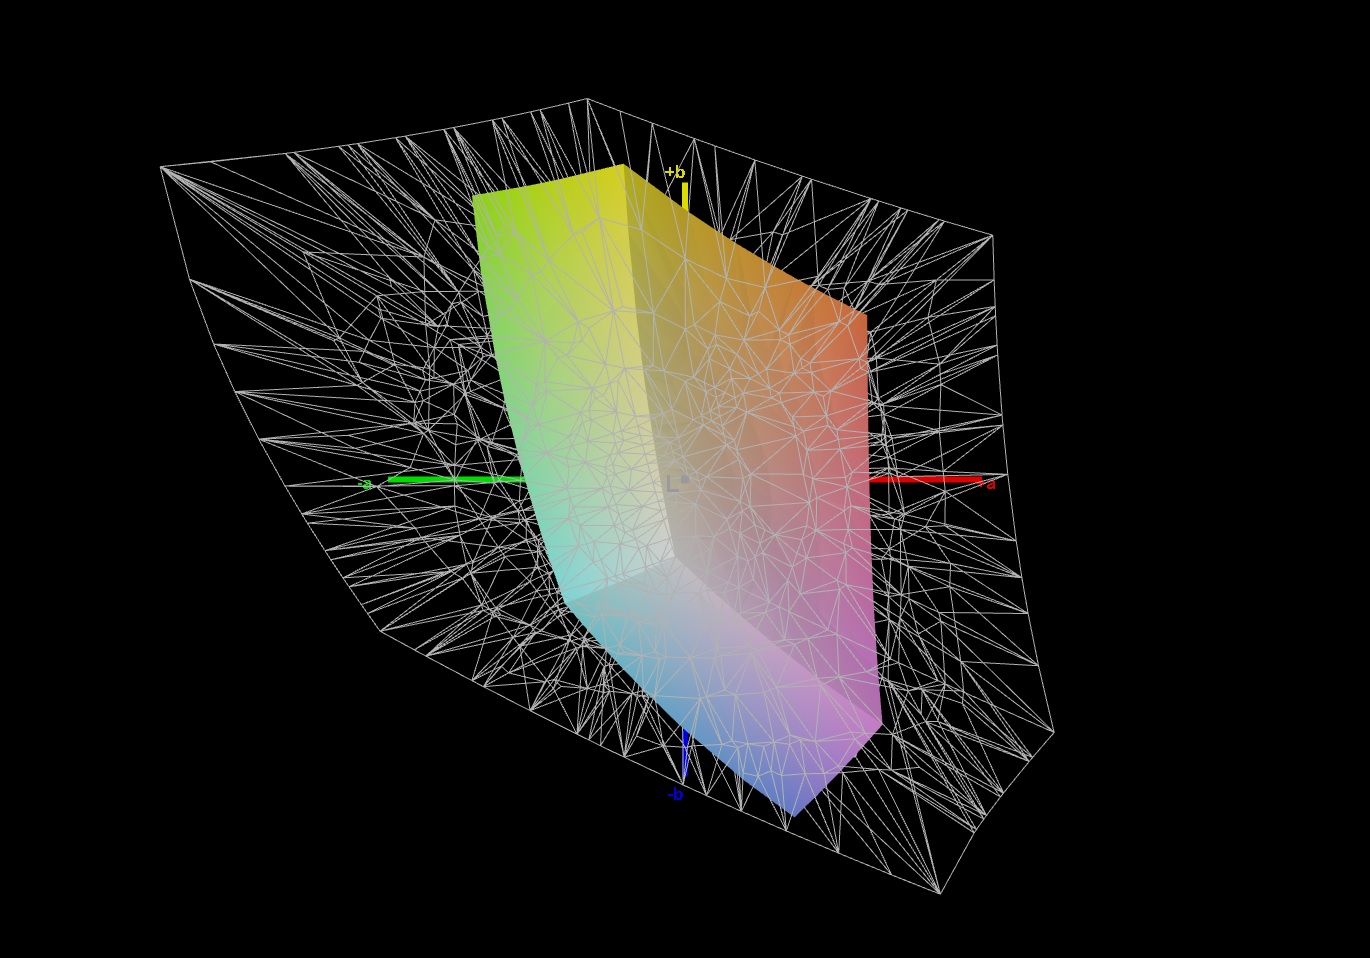
37.9% AdobeRGB 1998 (Argyll 3D)
55% sRGB (Argyll 3D)
36.7% Display P3 (Argyll 3D)
Gamma: 2.175
CCT: 6782 K
| Acer Nitro 5 AN517-53-54DQ BOE NV173FHM-NX4 (BOE09B4), IPS, 1920x1080, 17.3" | HP Omen 15-ek0456ng LGD05FE, IPS, 1920x1080, 15.6" | Lenovo Legion 5 17IMH05 AU Optronics B173HAN04.3, IPS, 1920x1080, 17.3" | MSI GF75 Thin 10SCXR AU Optronics B173HAN04.7, IPS, 1920x1080, 17.3" | Asus TUF FX705DT-AU068T AU Optronics B173HAN04.2, IPS, 1920x1080, 17.3" | |
|---|---|---|---|---|---|
| Display | 85% | 7% | 67% | ||
| Display P3 Coverage (%) | 36.7 | 69.4 89% | 39.46 8% | 62.3 70% | |
| sRGB Coverage (%) | 55 | 97.1 77% | 58.4 6% | 89.1 62% | |
| AdobeRGB 1998 Coverage (%) | 37.9 | 71.2 88% | 40.77 8% | 63.7 68% | |
| Response Times | 36% | -52% | -39% | -63% | |
| Response Time Grey 50% / Grey 80% * (ms) | 24.8 ? | 17 ? 31% | 38.4 ? -55% | 34 ? -37% | 41 ? -65% |
| Response Time Black / White * (ms) | 18.8 ? | 11 ? 41% | 28 ? -49% | 26.4 ? -40% | 30 ? -60% |
| PWM Frequency (Hz) | |||||
| Screen | 18% | -5% | -21% | 6% | |
| Brightness middle (cd/m²) | 286 | 314 10% | 326 14% | 251.2 -12% | 316 10% |
| Brightness (cd/m²) | 261 | 293 12% | 304 16% | 242 -7% | 294 13% |
| Brightness Distribution (%) | 83 | 87 5% | 89 7% | 92 11% | 84 1% |
| Black Level * (cd/m²) | 0.23 | 0.22 4% | 0.25 -9% | 0.34 -48% | 0.32 -39% |
| Contrast (:1) | 1243 | 1427 15% | 1304 5% | 739 -41% | 988 -21% |
| Colorchecker dE 2000 * | 4.92 | 2.51 49% | 4.42 10% | 4.5 9% | 3.39 31% |
| Colorchecker dE 2000 max. * | 19.29 | 4.42 77% | 9.44 51% | 20 -4% | 5.56 71% |
| Colorchecker dE 2000 calibrated * | 4.73 | 1.71 64% | 1.53 68% | 3.91 17% | 2.14 55% |
| Greyscale dE 2000 * | 1.9 | 3.26 -72% | 5.8 -205% | 4 -111% | 3.17 -67% |
| Gamma | 2.175 101% | 2.42 91% | 2.261 97% | 2.25 98% | 2.39 92% |
| CCT | 6782 96% | 6150 106% | 6822 95% | 5882 111% | 7098 92% |
| Color Space (Percent of AdobeRGB 1998) (%) | 71 | 37.3 | 51 | ||
| Color Space (Percent of sRGB) (%) | 93 | 58.1 | 89 | ||
| Total Average (Program / Settings) | 27% /
21% | 9% /
8% | -18% /
-17% | 3% /
9% |
* ... smaller is better
While the black value (0.23 cd/m²) and the contrast (1,243:1) of our test device are convincing, the brightness is not impressive. An average of 261 cd/m² is sufficient for most indoor areas, but the 17-inch device clearly lacks brightness in brighter places (conservatory, terrace, etc.). We would expect an average of at least 300 cd/m² even for a budget gamer.
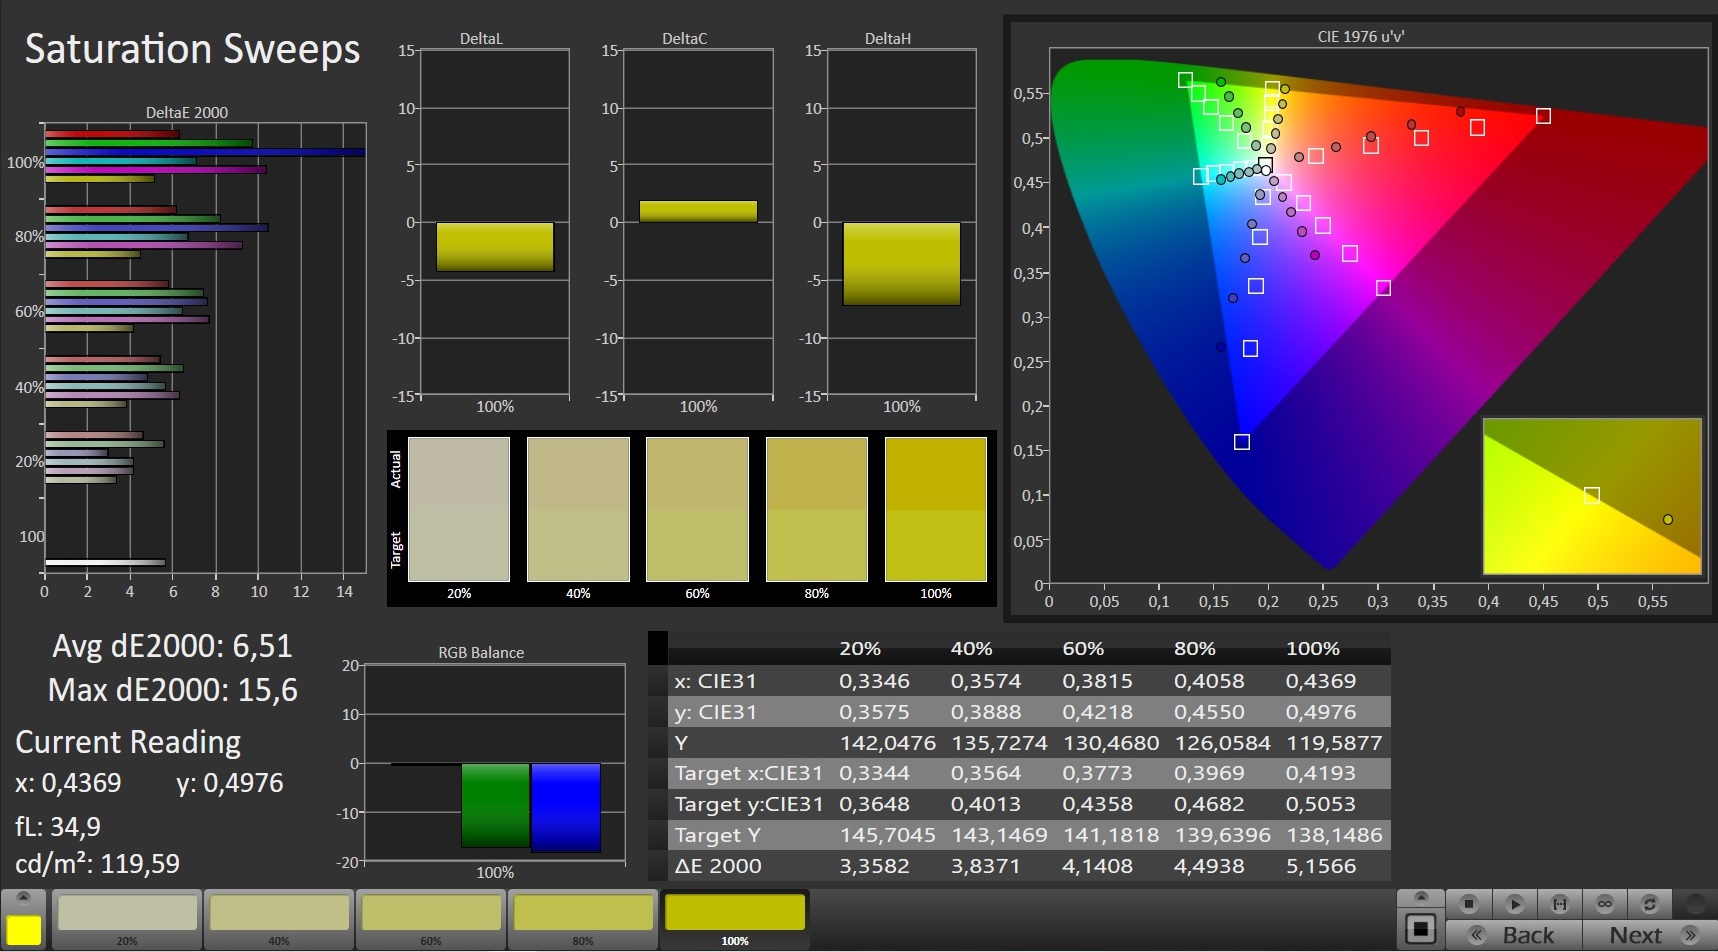
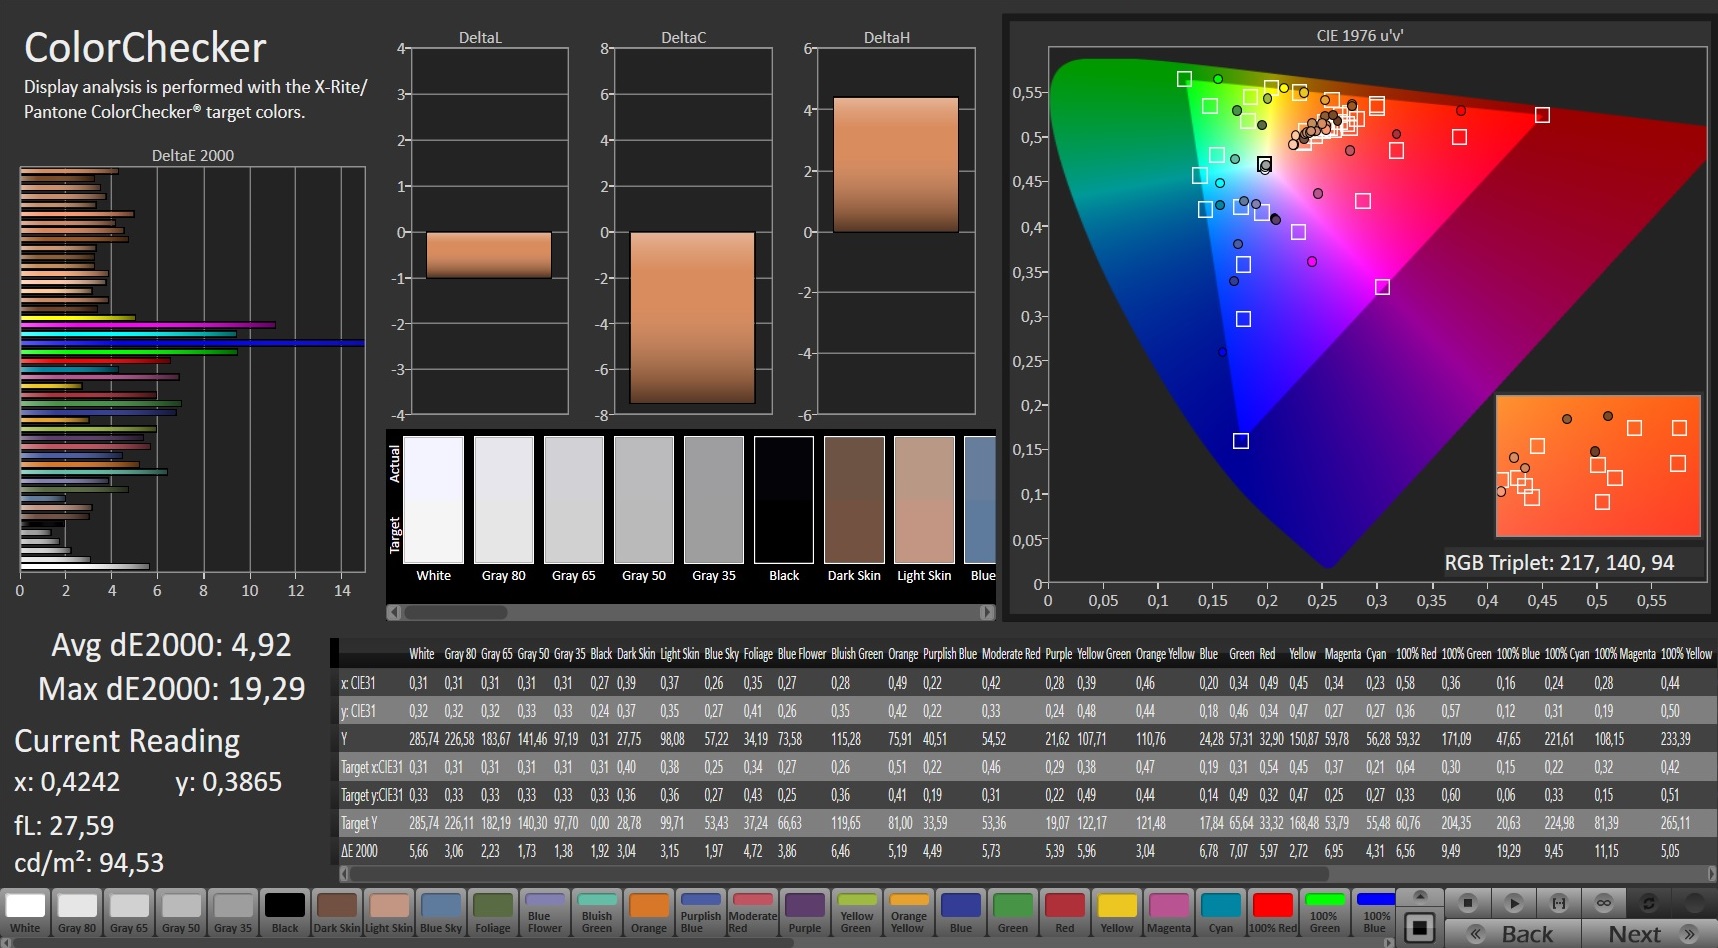

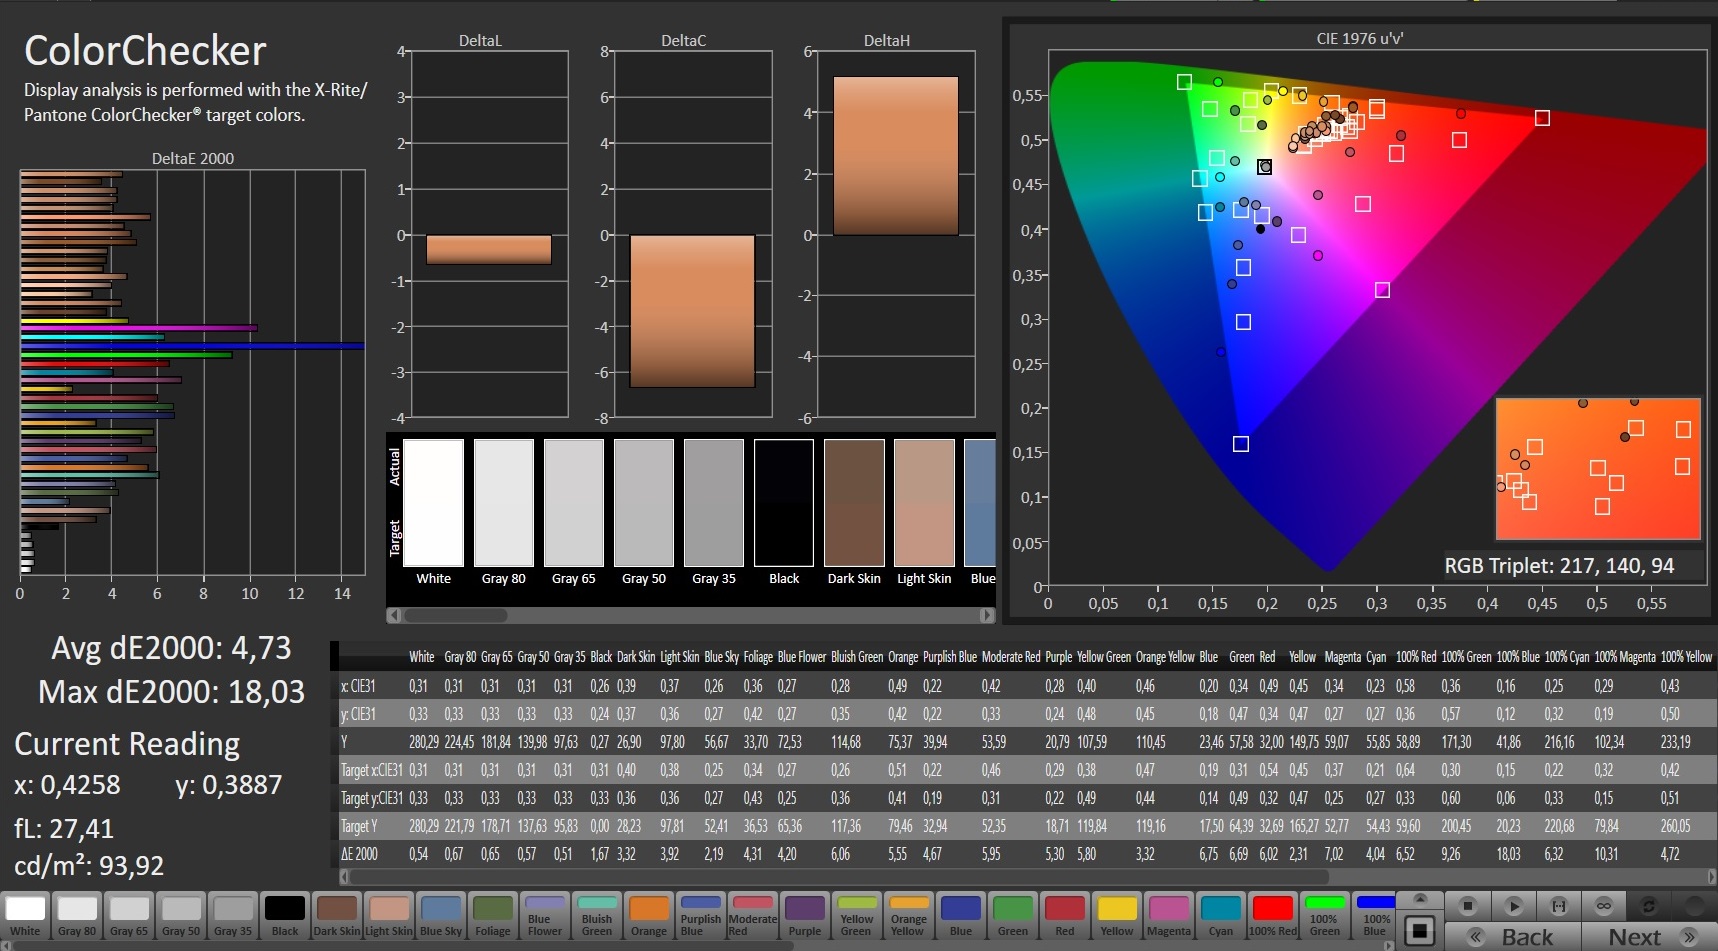
However, the color space turns out to be the biggest weakness. 55% sRGB coverage and around 38% Adobe RGB coverage are very disappointing and make for a rather pale picture. Among the comparison devices, only the MSI GF75 performs similarly poorly. The same applies to the color accuracy, although the Lenovo Legion 5 also leaves something to be desired here.
The other rates are rather unspectacular. For example, the response time of just under 19 ms black-to-white and 25 ms gray-to-grey is neither bad nor particularly good. We could not determine flickering at reduced brightness. The viewing angles are on the usual IPS level.
Display Response Times
| ↔ Response Time Black to White | ||
|---|---|---|
| 18.8 ms ... rise ↗ and fall ↘ combined | ↗ 10.8 ms rise | 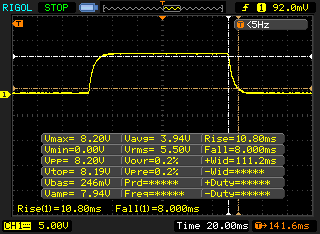 |
| ↘ 8 ms fall | ||
| The screen shows good response rates in our tests, but may be too slow for competitive gamers. In comparison, all tested devices range from 0.1 (minimum) to 240 (maximum) ms. » 42 % of all devices are better. This means that the measured response time is similar to the average of all tested devices (19.8 ms). | ||
| ↔ Response Time 50% Grey to 80% Grey | ||
| 24.8 ms ... rise ↗ and fall ↘ combined | ↗ 12.4 ms rise | 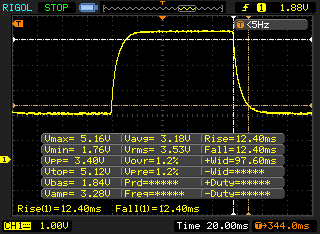 |
| ↘ 12.4 ms fall | ||
| The screen shows good response rates in our tests, but may be too slow for competitive gamers. In comparison, all tested devices range from 0.165 (minimum) to 636 (maximum) ms. » 35 % of all devices are better. This means that the measured response time is better than the average of all tested devices (31 ms). | ||
Screen Flickering / PWM (Pulse-Width Modulation)
| Screen flickering / PWM not detected | 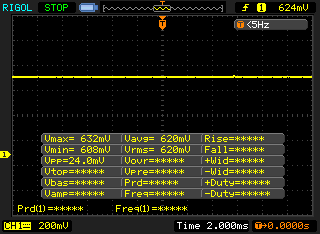 | ||
In comparison: 52 % of all tested devices do not use PWM to dim the display. If PWM was detected, an average of 7747 (minimum: 5 - maximum: 343500) Hz was measured. | |||
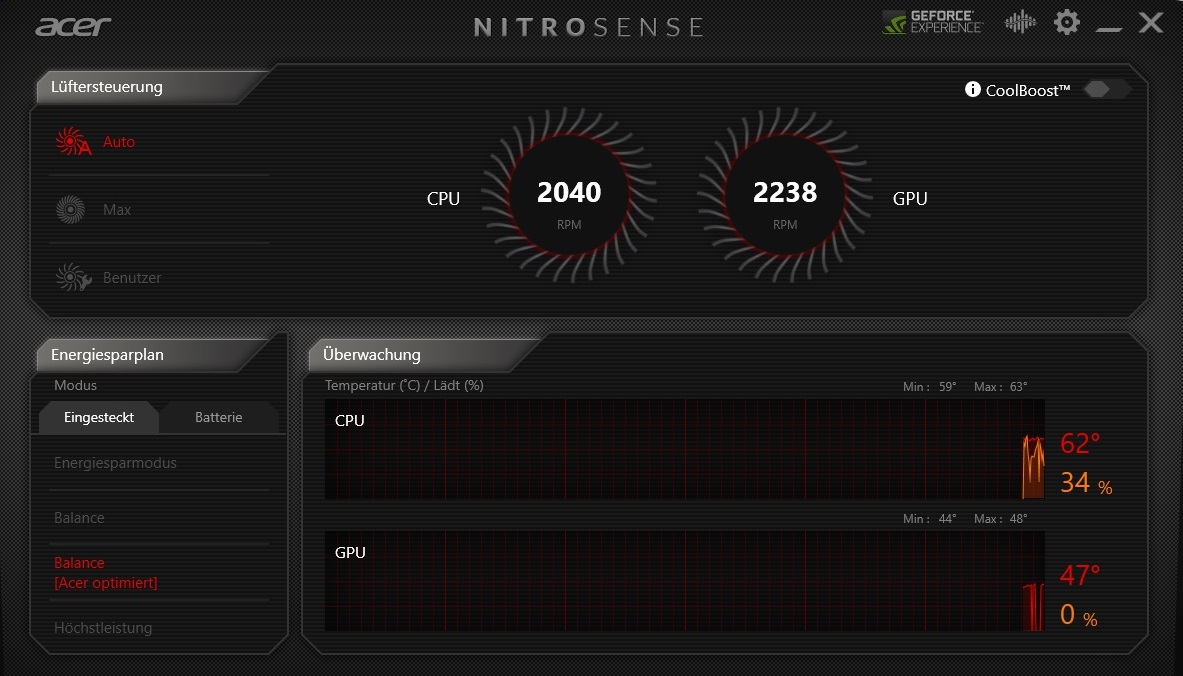
Test conditions - Nitro Sense hardly offers any options
In contrast to other gaming notebooks from Acer, the preinstalled Nitro Sense tool has very few functions and options. Besides the fan control, you can only change the energy-saving plan. Our measurements were performed in the delivery state (see screenshot).
Performance - Modern mid-range components
A quad-core CPU indicates mid-range hardware as well as 8 GB of RAM and a GPU with 4 GB of VRAM. If you invest a bit more money, you can also get the Nitro 5 with high-end features (8-core CPU, 16 GB RAM, 6-8 GB GPU).
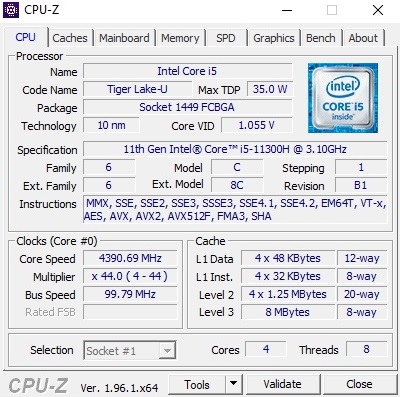
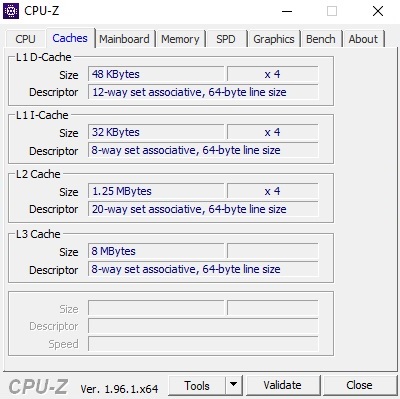

Processor
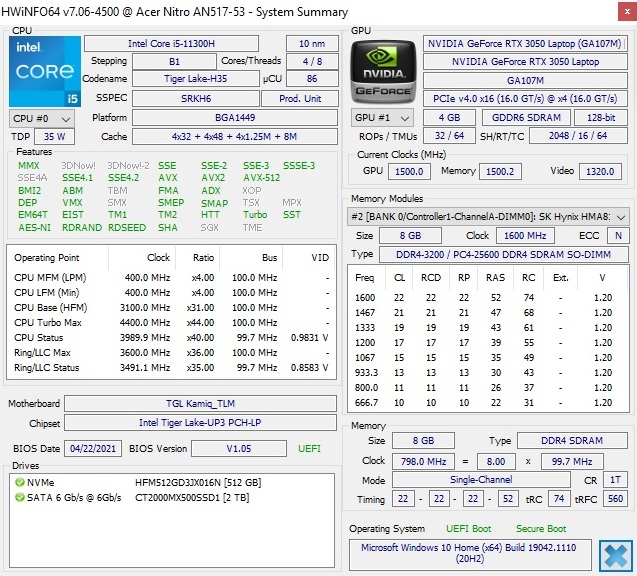
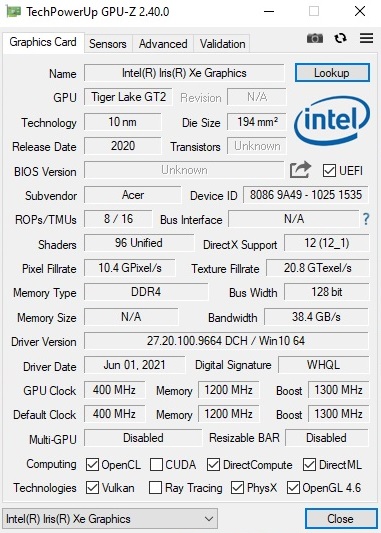
As mentioned before, the Core i5-11300H is a quad-core model from the Tiger Lake series, which is finally no longer manufactured in the outdated 14 nm process that Intel used for years. The 10 nm CPU offers 8 MB L3 cache and can process up to 8 threads in parallel via Hyper-Threading. Compared to the classic 6- and 8-core chips, the TDP is only 35 instead of 45 watts. According to the HWiNFO tool, the processor in the Nitro 5 is set to 40 watts PL1 and 64 watts PL2. The clock - depending on the application and load - is between 3.1 and 4.4 GHz under load.
We checked how the CPU behaves over a long period of time using Cinebench R15. The Core i5-11300H's performance remained fairly constant in the loop and, as expected, placed itself above the old Core i5-10300H in the loop.
Cinebench R15 Multi long-term test
* ... smaller is better
System performance
Despite the modest memory configuration, it is enough for the first place in the test field in the system benchmarks. PCMark 10 sees the Nitro 5 between 8% and 40% ahead of the competition, whereby the everyday Windows experience should feel very similar on all devices in terms of boot time and loading times, etc.
| PCMark 10 / Score | |
| Average of class Gaming (5828 - 11730, n=92, last 2 years) | |
| Acer Nitro 5 AN517-53-54DQ | |
| Average Intel Core i5-11300H, NVIDIA GeForce RTX 3050 4GB Laptop GPU (n=1) | |
| MSI GF75 Thin 10SCXR | |
| HP Omen 15-ek0456ng | |
| Asus TUF FX705DT-AU068T | |
| Lenovo Legion 5 17IMH05 | |
| PCMark 10 Score | 5705 points | |
Help | ||
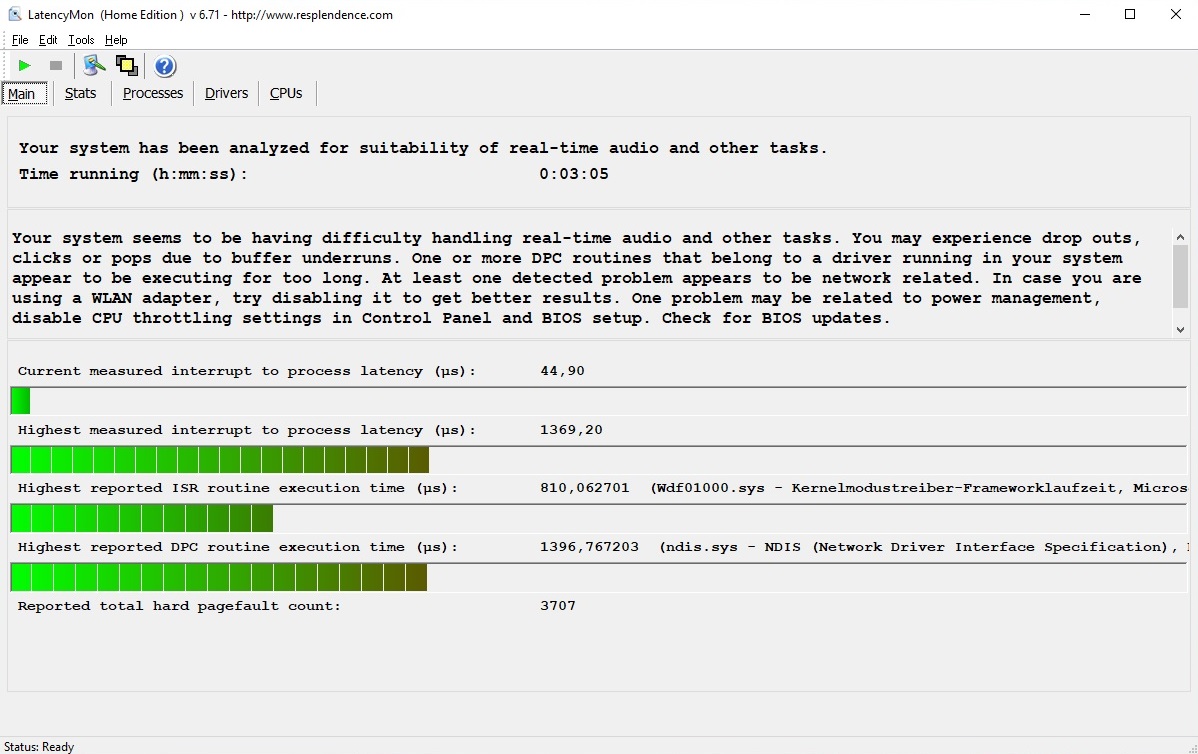
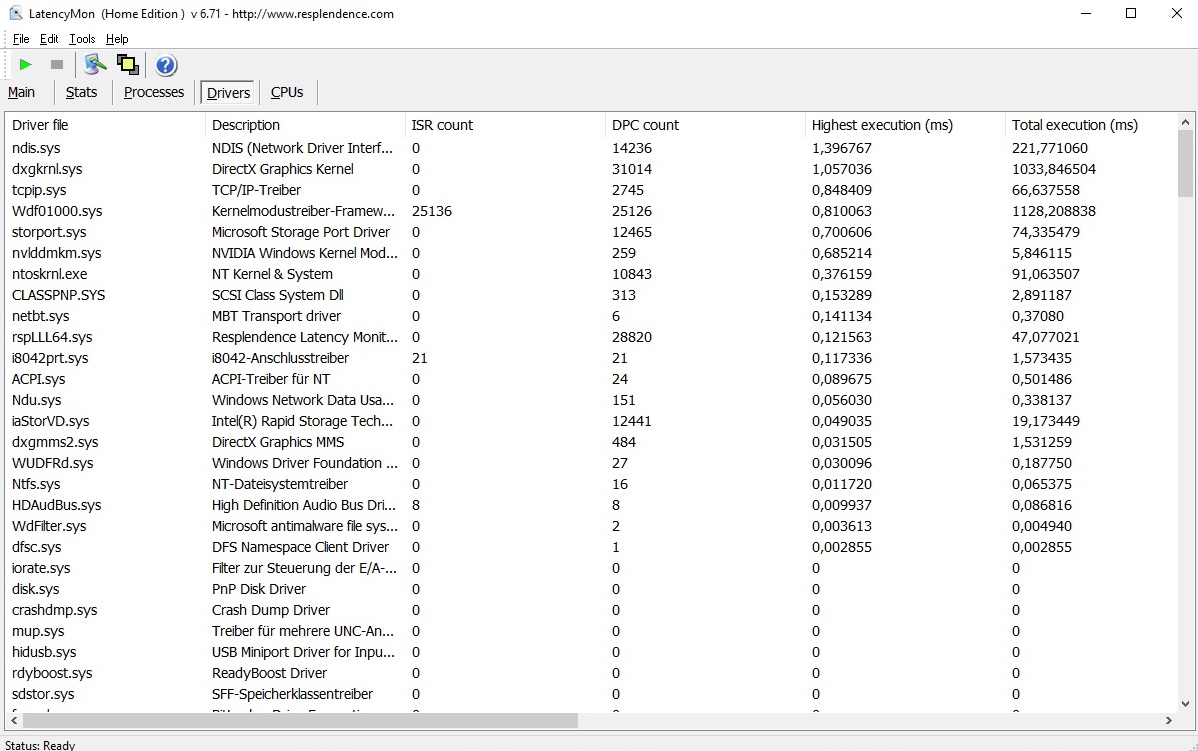
DPC latencies
Although the 17-incher shines with the lowest latency rates compared to the competition, the LatencyMon tool indicates possible problems with real-time processing of audio and video content.
| DPC Latencies / LatencyMon - interrupt to process latency (max), Web, Youtube, Prime95 | |
| HP Omen 15-ek0456ng | |
| MSI GF75 Thin 10SCXR | |
| Lenovo Legion 5 17IMH05 | |
| Acer Nitro 5 AN517-53-54DQ | |
* ... smaller is better
Mass storage
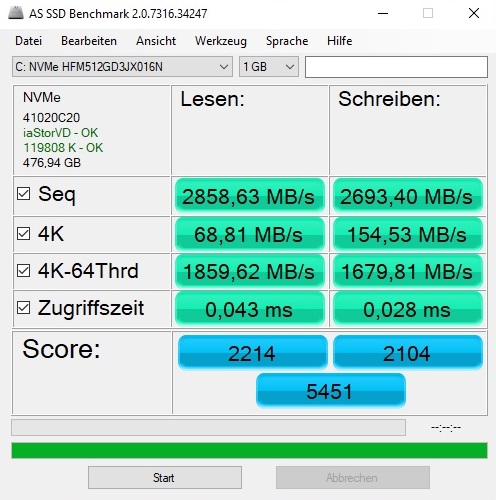
There is praise for the fast mass storage. While SATA III SSDs with a maximum of 500 - 600 MB/s were common in the budget sector in the past, fast PCIe/NVMe SSDs are slowly but surely part of the standard repertoire. The Nitro 5 offers a particularly powerful representative of this guild with the 512 GB version of the SK Hynix BC711, which leaves the NVMe models of the competitors behind, sometimes significantly.
Nice: If you want to expand the storage space, you will find a free M.2 slot and a 2.5-inch bay inside the case (suitable cable included).
| Acer Nitro 5 AN517-53-54DQ SK Hynix BC711 HFM512GD3HX015N | HP Omen 15-ek0456ng Toshiba XG6 KXG60ZNV512G | Lenovo Legion 5 17IMH05 SK hynix BC511 HFM512GDHTNI-87A0B | MSI GF75 Thin 10SCXR WDC PC SN530 SDBPNPZ-512G | Asus TUF FX705DT-AU068T WDC PC SN520 SDAPNUW-256G | |
|---|---|---|---|---|---|
| CrystalDiskMark 5.2 / 6 | -31% | -41% | -38% | -48% | |
| Write 4K (MB/s) | 206.1 | 120 -42% | 134.7 -35% | 140.7 -32% | 145 -30% |
| Read 4K (MB/s) | 77.8 | 36.09 -54% | 44.84 -42% | 43.18 -44% | 45.28 -42% |
| Write Seq (MB/s) | 2842 | 1778 -37% | 1053 -63% | 1829 -36% | 1301 -54% |
| Read Seq (MB/s) | 2552 | 1362 -47% | 1241 -51% | 1095 -57% | 1362 -47% |
| Write 4K Q32T1 (MB/s) | 583 | 429.1 -26% | 499.8 -14% | 431.7 -26% | 249.1 -57% |
| Read 4K Q32T1 (MB/s) | 663 | 493.2 -26% | 518 -22% | 527 -21% | 342.1 -48% |
| Write Seq Q32T1 (MB/s) | 3014 | 2936 -3% | 1022 -66% | 1831 -39% | 1301 -57% |
| Read Seq Q32T1 (MB/s) | 3556 | 3227 -9% | 2263 -36% | 1708 -52% | 1732 -51% |
| AS SSD | -30% | -46% | -94% | -64% | |
| Seq Read (MB/s) | 2859 | 2053 -28% | 1635 -43% | 1007 -65% | 1546 -46% |
| Seq Write (MB/s) | 2693 | 2562 -5% | 913 -66% | 1755 -35% | 1182 -56% |
| 4K Read (MB/s) | 68.8 | 42.46 -38% | 46.18 -33% | 39.88 -42% | 36.54 -47% |
| 4K Write (MB/s) | 154.5 | 97.2 -37% | 101.7 -34% | 111.6 -28% | 109.2 -29% |
| 4K-64 Read (MB/s) | 1860 | 1414 -24% | 773 -58% | 751 -60% | 612 -67% |
| 4K-64 Write (MB/s) | 1680 | 1471 -12% | 745 -56% | 402.6 -76% | 436.6 -74% |
| Access Time Read * (ms) | 0.043 | 0.079 -84% | 0.05 -16% | 0.084 -95% | 0.113 -163% |
| Access Time Write * (ms) | 0.028 | 0.039 -39% | 0.037 -32% | 0.151 -439% | 0.034 -21% |
| Score Read (Points) | 2214 | 1662 -25% | 983 -56% | 892 -60% | 803 -64% |
| Score Write (Points) | 2104 | 1825 -13% | 938 -55% | 690 -67% | 664 -68% |
| Score Total (Points) | 5451 | 4364 -20% | 2399 -56% | 2085 -62% | 1869 -66% |
| Total Average (Program / Settings) | -31% /
-30% | -44% /
-44% | -66% /
-70% | -56% /
-57% |
* ... smaller is better

Continuous load read: DiskSpd Read Loop, Queue Depth 8
Graphics card
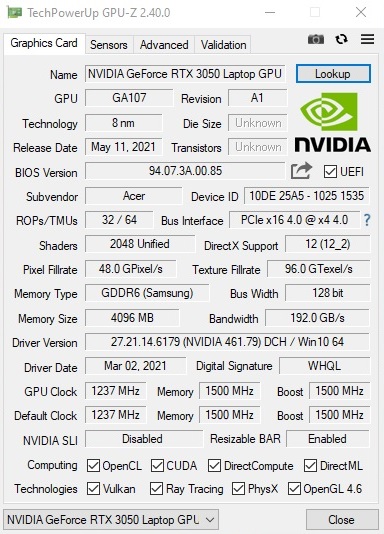
The most interesting aspect for many users might be the GPU. While we were able to examine the mobile GeForce RTX 3050 Ti once or twice in the past, there have hardly been any benchmark results for the RTX 3050 so far. Compared to the RTX 3050 Ti, the DirectX 12 model has to make do with 2,048 instead of 2,560 shaders.
However, the performance primarily depends on the cooling system (keyword clock margin) and the set TGP. The latter varies between 35 and 80 watts for the RTX 3050 (without Dynamic Boost). In the case of the Nitro 5, it is 75 watts including Dynamic Boost, so it is a pretty good value that is in the upper third.
We see the limited video memory as the weak point. Both the RTX 3050 and the RTX 3050 Ti only have 4 GB of GDDR6 VRAM (128-bit interface), which is no longer up-to-date in 2021 and especially in view of the VRAM requirements of many current games and has a negative impact on the future-proofing of the laptop. Even in the mid-range segment, at least 6 GB would be appropriate by now.
However, the Ampere GPU has an easy game against the old GTX 1650, which still had to do without ray tracing support. In the 3DMark tests, the lead is usually 30 to 40%. However, it does not quite reach the GTX 1660 Ti's level - that was to be expected beforehand.
| 3DMark 06 Standard Score | 36425 points | |
| 3DMark Vantage P Result | 43216 points | |
| 3DMark 11 Performance | 14587 points | |
| 3DMark Ice Storm Standard Score | 61606 points | |
| 3DMark Cloud Gate Standard Score | 24215 points | |
| 3DMark Fire Strike Score | 11041 points | |
| 3DMark Time Spy Score | 4877 points | |
Help | ||
Gaming performance
Analogous to the synthetic benchmarks, the mobile GeForce RTX 3050 also ranks between the GTX 1650 (Ti) and the GeForce GTX 1660 Ti in the gaming course, whereby the frame rate sometimes tends more in one and sometimes more in the other direction depending on the game and VRAM consumption.
Overall, the GeForce RTX 3050 Laptop GPU is fast enough to run most titles in the native resolution of 1,920 x 1,080 with high to maximum details. It only gets tight when ray tracing is enabled or very computationally intensive and/or moderately optimized games like Assassin's Creed Valhalla and Cyberpunk 2077, where even medium settings become a challenge. The RTX 3050 is hardly suitable for QHD and 4K games. For this, we recommend a high-end device with an GeForce RTX 3060 upwards.
| Performance rating - Percent | |
| Average of class Gaming -384! | |
| MSI GP65 Leopard 9SD -84! | |
| Acer Nitro 5 AN517-53-54DQ -247! | |
| MSI GP75 -257! | |
| MSI GL75 -267! | |
| Vampire Bloodhunt | |
| 3840x2160 Ultra Preset | |
| MSI GP65 Leopard 9SD | |
| 2560x1440 Ultra Preset | |
| MSI GP65 Leopard 9SD | |
| 1920x1080 Ultra Preset | |
| MSI GP65 Leopard 9SD | |
| MSI GP75 | |
| 1920x1080 High Preset | |
| MSI GP65 Leopard 9SD | |
| MSI GP75 | |
| 1920x1080 Medium Preset | |
| MSI GP65 Leopard 9SD | |
| MSI GP75 | |
| 1920x1080 Low Preset | |
| MSI GP75 | |
| 1280x720 Low Preset | |
| MSI GP75 | |
| Tiny Tina's Wonderlands | |
| 2560x1440 Badass Preset (DX12) | |
| Average of class Gaming (58.9 - 111.2, n=3, last 2 years) | |
| MSI GP65 Leopard 9SD | |
| 1920x1080 Badass Preset (DX12) | |
| Average of class Gaming (55 - 159.4, n=4, last 2 years) | |
| MSI GP65 Leopard 9SD | |
| MSI GP75 | |
| 1920x1080 High Preset (DX12) | |
| Average of class Gaming (72.1 - 203, n=4, last 2 years) | |
| MSI GP65 Leopard 9SD | |
| MSI GP75 | |
| 1920x1080 Medium Preset (DX12) | |
| Average of class Gaming (95.6 - 293, n=4, last 2 years) | |
| MSI GP65 Leopard 9SD | |
| MSI GP75 | |
| 1920x1080 Low Preset (DX12) | |
| Average of class Gaming (113 - 353, n=4, last 2 years) | |
| MSI GP65 Leopard 9SD | |
| MSI GP75 | |
| 1280x720 Lowest Preset (DX12) | |
| Average of class Gaming (154 - 282, n=2, last 2 years) | |
| MSI GP75 | |
| Ghostwire Tokyo | |
| 3840x2160 Highest Settings | |
| MSI GP65 Leopard 9SD | |
| 2560x1440 Highest Settings | |
| MSI GP65 Leopard 9SD | |
| MSI GP75 | |
| 1920x1080 Highest Settings | |
| MSI GP65 Leopard 9SD | |
| MSI GP75 | |
| 1920x1080 High Settings | |
| MSI GP65 Leopard 9SD | |
| MSI GP75 | |
| 1920x1080 Medium Settings | |
| MSI GP65 Leopard 9SD | |
| MSI GP75 | |
| 1920x1080 Low Settings | |
| MSI GP65 Leopard 9SD | |
| MSI GP75 | |
| 1280x720 Lowest Settings | |
| MSI GP75 | |
| Elden Ring | |
| 3840x2160 Maximum Preset | |
| MSI GP65 Leopard 9SD | |
| MSI GP75 | |
| MSI GL75 | |
| 2560x1440 Maximum Preset | |
| MSI GP65 Leopard 9SD | |
| MSI GP75 | |
| MSI GL75 | |
| 1920x1080 Maximum Preset | |
| MSI GP65 Leopard 9SD | |
| MSI GP75 | |
| MSI GL75 | |
| 1920x1080 High Preset | |
| MSI GP65 Leopard 9SD | |
| MSI GP75 | |
| MSI GL75 | |
| 1920x1080 Medium Preset | |
| MSI GP75 | |
| MSI GP65 Leopard 9SD | |
| MSI GL75 | |
| 1920x1080 Low Preset | |
| MSI GP75 | |
| MSI GL75 | |
| Elex 2 | |
| 3840x2160 Ultra / On AA:SM AF:16x | |
| MSI GP65 Leopard 9SD | |
| 2560x1440 Ultra / On AA:SM AF:16x | |
| MSI GP65 Leopard 9SD | |
| 1920x1080 Ultra / On AA:SM AF:16x | |
| MSI GP65 Leopard 9SD | |
| MSI GP75 | |
| MSI GL75 | |
| 1920x1080 High / On AA:FX AF:16x | |
| MSI GP65 Leopard 9SD | |
| MSI GP75 | |
| MSI GL75 | |
| 1920x1080 Medium / On AA:FX AF:16x | |
| MSI GP65 Leopard 9SD | |
| MSI GP75 | |
| MSI GL75 | |
| 1920x1080 Low / Off | |
| MSI GP75 | |
| MSI GL75 | |
| 1280x720 Low / Off | |
| MSI GP75 | |
| MSI GL75 | |
| Cyberpunk 2077 1.6 | |
| 3840x2160 Ultra Preset | |
| MSI GP65 Leopard 9SD | |
| MSI GP75 | |
| MSI GL75 | |
| 2560x1440 Ultra Preset | |
| MSI GP65 Leopard 9SD | |
| MSI GP75 | |
| MSI GL75 | |
| 1920x1080 Ultra Preset | |
| MSI GP65 Leopard 9SD | |
| MSI GP75 | |
| MSI GL75 | |
| 1920x1080 High Preset | |
| MSI GP65 Leopard 9SD | |
| MSI GP75 | |
| MSI GL75 | |
| 1920x1080 Medium Preset | |
| MSI GP65 Leopard 9SD | |
| MSI GP75 | |
| MSI GL75 | |
| 1920x1080 Low Preset | |
| MSI GP65 Leopard 9SD | |
| MSI GP75 | |
| MSI GL75 | |
| 1280x720 Low Preset | |
| MSI GP65 Leopard 9SD | |
| MSI GP75 | |
| MSI GL75 | |
| GRID Legends | |
| 3840x2160 Ultra Preset | |
| MSI GP65 Leopard 9SD | |
| 2560x1440 Ultra Preset | |
| MSI GP65 Leopard 9SD | |
| 1920x1080 Ultra Preset | |
| MSI GP65 Leopard 9SD | |
| MSI GP75 | |
| MSI GL75 | |
| 1920x1080 High Preset | |
| MSI GP65 Leopard 9SD | |
| MSI GP75 | |
| MSI GL75 | |
| 1920x1080 Medium Preset | |
| MSI GP65 Leopard 9SD | |
| MSI GP75 | |
| MSI GL75 | |
| 1920x1080 Low Preset | |
| MSI GP75 | |
| MSI GL75 | |
| 1280x720 Low Preset | |
| MSI GP75 | |
| MSI GL75 | |
| Dying Light 2 | |
| 3840x2160 High Quality | |
| MSI GP65 Leopard 9SD | |
| 2560x1440 High Quality | |
| MSI GP65 Leopard 9SD | |
| 1920x1080 High Quality | |
| MSI GP65 Leopard 9SD | |
| MSI GP75 | |
| MSI GL75 | |
| 1920x1080 Medium Quality | |
| MSI GP65 Leopard 9SD | |
| MSI GP75 | |
| MSI GL75 | |
| 1920x1080 Low Quality | |
| MSI GP65 Leopard 9SD | |
| MSI GP75 | |
| MSI GL75 | |
| 1280x720 Low Quality | |
| MSI GP75 | |
| MSI GL75 | |
| Rainbow Six Extraction | |
| 3840x2160 Ultra Preset (with Fixed Resolution Quality) | |
| MSI GP65 Leopard 9SD | |
| 2560x1440 Ultra Preset (with Fixed Resolution Quality) | |
| MSI GP65 Leopard 9SD | |
| 1920x1080 Ultra Preset (with Fixed Resolution Quality) | |
| MSI GP65 Leopard 9SD | |
| MSI GP75 | |
| MSI GL75 | |
| 1920x1080 High Preset (with Fixed Resolution Quality) | |
| MSI GP65 Leopard 9SD | |
| MSI GP75 | |
| MSI GL75 | |
| 1920x1080 Medium Preset (with Fixed Resolution Quality) | |
| MSI GP65 Leopard 9SD | |
| MSI GP75 | |
| MSI GL75 | |
| 1920x1080 Very Low Preset (with Fixed Resolution Quality) | |
| MSI GP75 | |
| MSI GL75 | |
| 1280x720 Ultra Low Preset (with Fixed Resolution Quality) | |
| MSI GP75 | |
| MSI GL75 | |
| God of War | |
| 3840x2160 Ultra Preset | |
| MSI GP65 Leopard 9SD | |
| 2560x1440 Ultra Preset | |
| MSI GP65 Leopard 9SD | |
| 1920x1080 Ultra Preset | |
| MSI GP65 Leopard 9SD | |
| MSI GP75 | |
| MSI GL75 | |
| 1920x1080 High Preset | |
| MSI GP65 Leopard 9SD | |
| MSI GP75 | |
| MSI GL75 | |
| 1920x1080 Original Preset | |
| MSI GP65 Leopard 9SD | |
| MSI GP75 | |
| MSI GL75 | |
| 1920x1080 Low Preset | |
| MSI GP75 | |
| MSI GL75 | |
| 1280x720 Low Preset | |
| MSI GP75 | |
| MSI GL75 | |
| Halo Infinite | |
| 3840x2160 Ultra Preset | |
| MSI GP65 Leopard 9SD | |
| 2560x1440 Ultra Preset | |
| MSI GP65 Leopard 9SD | |
| 1920x1080 Ultra Preset | |
| MSI GP65 Leopard 9SD | |
| MSI GP75 | |
| MSI GL75 | |
| 1920x1080 High Preset | |
| MSI GP65 Leopard 9SD | |
| MSI GP75 | |
| MSI GL75 | |
| 1920x1080 Medium Preset | |
| MSI GP65 Leopard 9SD | |
| MSI GP75 | |
| MSI GL75 | |
| 1920x1080 Low Preset | |
| MSI GP75 | |
| MSI GL75 | |
| 1280x720 Low Preset | |
| MSI GP75 | |
| MSI GL75 | |
| Farming Simulator 22 | |
| 3840x2160 Very High Preset | |
| MSI GP65 Leopard 9SD | |
| MSI GP75 | |
| MSI GL75 | |
| 2560x1440 Very High Preset | |
| MSI GP65 Leopard 9SD | |
| MSI GP75 | |
| MSI GL75 | |
| 1920x1080 Very High Preset | |
| MSI GP65 Leopard 9SD | |
| MSI GP75 | |
| MSI GL75 | |
| 1920x1080 High Preset | |
| MSI GP65 Leopard 9SD | |
| MSI GP75 | |
| MSI GL75 | |
| 1920x1080 Medium Preset | |
| MSI GP65 Leopard 9SD | |
| MSI GP75 | |
| MSI GL75 | |
| 1280x720 Low Preset | |
| MSI GP75 | |
| MSI GL75 | |
| Battlefield 2042 | |
| 3840x2160 Ultra Preset | |
| MSI GP65 Leopard 9SD | |
| 2560x1440 Ultra Preset | |
| MSI GP65 Leopard 9SD | |
| MSI GL75 | |
| 1920x1080 Ultra Preset | |
| MSI GP65 Leopard 9SD | |
| MSI GL75 | |
| 1920x1080 High Preset | |
| MSI GP65 Leopard 9SD | |
| MSI GL75 | |
| 1920x1080 Medium Preset | |
| MSI GP65 Leopard 9SD | |
| MSI GL75 | |
| 1920x1080 Low Preset | |
| MSI GP65 Leopard 9SD | |
| MSI GL75 | |
| 1280x720 Low Preset | |
| MSI GL75 | |
| Forza Horizon 5 | |
| 3840x2160 Extreme Preset | |
| MSI GP65 Leopard 9SD | |
| MSI GP75 | |
| MSI GL75 | |
| 2560x1440 Extreme Preset | |
| MSI GP65 Leopard 9SD | |
| MSI GP75 | |
| MSI GL75 | |
| 1920x1080 Extreme Preset | |
| MSI GP65 Leopard 9SD | |
| MSI GP75 | |
| MSI GL75 | |
| 1920x1080 High Preset | |
| MSI GP65 Leopard 9SD | |
| MSI GP75 | |
| MSI GL75 | |
| 1920x1080 Medium Preset | |
| MSI GP65 Leopard 9SD | |
| MSI GP75 | |
| MSI GL75 | |
| 1920x1080 Low Preset | |
| MSI GP65 Leopard 9SD | |
| MSI GP75 | |
| MSI GL75 | |
| Call of Duty Vanguard | |
| 3840x2160 Ultra Preset | |
| MSI GP65 Leopard 9SD | |
| MSI GP75 | |
| MSI GL75 | |
| 2560x1440 Ultra Preset | |
| MSI GP65 Leopard 9SD | |
| MSI GP75 | |
| MSI GL75 | |
| 1920x1080 Ultra Preset | |
| MSI GP65 Leopard 9SD | |
| MSI GP75 | |
| MSI GL75 | |
| 1920x1080 High Preset | |
| MSI GP65 Leopard 9SD | |
| MSI GP75 | |
| MSI GL75 | |
| 1920x1080 Medium Preset | |
| MSI GP65 Leopard 9SD | |
| MSI GP75 | |
| MSI GL75 | |
| 1920x1080 Low Preset | |
| MSI GP65 Leopard 9SD | |
| MSI GP75 | |
| MSI GL75 | |
| Riders Republic | |
| 3840x2160 Ultra Preset | |
| MSI GP65 Leopard 9SD | |
| MSI GP75 | |
| MSI GL75 | |
| 2560x1440 Ultra Preset | |
| MSI GP65 Leopard 9SD | |
| MSI GP75 | |
| MSI GL75 | |
| 1920x1080 Ultra Preset | |
| MSI GP65 Leopard 9SD | |
| MSI GP75 | |
| MSI GL75 | |
| 1920x1080 High Preset | |
| MSI GP65 Leopard 9SD | |
| MSI GP75 | |
| MSI GL75 | |
| 1920x1080 Medium Preset | |
| MSI GP65 Leopard 9SD | |
| MSI GP75 | |
| MSI GL75 | |
| 1920x1080 Low Preset | |
| MSI GP65 Leopard 9SD | |
| MSI GP75 | |
| MSI GL75 | |
| Guardians of the Galaxy | |
| 3840x2160 Ultra Preset | |
| MSI GP65 Leopard 9SD | |
| MSI GP75 | |
| MSI GL75 | |
| 2560x1440 Ultra Preset | |
| MSI GP65 Leopard 9SD | |
| MSI GP75 | |
| MSI GL75 | |
| 1920x1080 Ultra Preset | |
| MSI GP65 Leopard 9SD | |
| MSI GP75 | |
| MSI GL75 | |
| 1920x1080 High Preset | |
| MSI GP65 Leopard 9SD | |
| MSI GP75 | |
| MSI GL75 | |
| 1920x1080 Medium Preset | |
| MSI GP65 Leopard 9SD | |
| MSI GP75 | |
| MSI GL75 | |
| 1920x1080 Low Preset | |
| MSI GP65 Leopard 9SD | |
| MSI GP75 | |
| MSI GL75 | |
| Alan Wake Remastered | |
| 3840x2160 High Preset | |
| MSI GP65 Leopard 9SD | |
| 2560x1440 High Preset | |
| MSI GP65 Leopard 9SD | |
| MSI GP75 | |
| MSI GL75 | |
| 1920x1080 High Preset | |
| MSI GP65 Leopard 9SD | |
| MSI GP75 | |
| MSI GL75 | |
| 1920x1080 Medium Preset | |
| MSI GP65 Leopard 9SD | |
| MSI GP75 | |
| MSI GL75 | |
| 1920x1080 Low Preset | |
| MSI GP75 | |
| MSI GP65 Leopard 9SD | |
| MSI GL75 | |
| Back 4 Blood | |
| 3840x2160 Epic Preset (DX12) AA:T | |
| MSI GP65 Leopard 9SD | |
| MSI GP75 | |
| MSI GL75 | |
| 2560x1440 Epic Preset (DX12) AA:T | |
| MSI GP65 Leopard 9SD | |
| MSI GP75 | |
| MSI GL75 | |
| 1920x1080 Epic Preset (DX12) AA:T | |
| MSI GP65 Leopard 9SD | |
| MSI GP75 | |
| MSI GL75 | |
| 1920x1080 High Preset (DX12) AA:T | |
| MSI GP65 Leopard 9SD | |
| MSI GP75 | |
| MSI GL75 | |
| 1920x1080 Medium Preset (DX12) AA:FX | |
| MSI GP65 Leopard 9SD | |
| MSI GP75 | |
| MSI GL75 | |
| 1920x1080 Low Preset (DX12) | |
| MSI GP65 Leopard 9SD | |
| MSI GP75 | |
| MSI GL75 | |
| Far Cry 6 | |
| 2560x1440 Ultra Graphics Quality + HD Textures AA:T | |
| Average of class Gaming (n=1last 2 years) | |
| MSI GP65 Leopard 9SD | |
| MSI GP75 | |
| MSI GL75 | |
| 1920x1080 Ultra Graphics Quality + HD Textures AA:T | |
| Average of class Gaming (n=1last 2 years) | |
| MSI GP65 Leopard 9SD | |
| MSI GP75 | |
| MSI GL75 | |
| 1920x1080 High Graphics Quality AA:T | |
| Average of class Gaming (n=1last 2 years) | |
| MSI GP65 Leopard 9SD | |
| MSI GP75 | |
| MSI GL75 | |
| 1920x1080 Medium Graphics Quality AA:SM | |
| Average of class Gaming (n=1last 2 years) | |
| MSI GP65 Leopard 9SD | |
| MSI GP75 | |
| MSI GL75 | |
| 1920x1080 Low Graphics Quality | |
| Average of class Gaming (n=1last 2 years) | |
| MSI GP65 Leopard 9SD | |
| MSI GP75 | |
| MSI GL75 | |
| FIFA 22 | |
| 3840x2160 Ultra Rendering Quality AA:4x MS | |
| MSI GP65 Leopard 9SD | |
| MSI GP75 | |
| MSI GL75 | |
| 2560x1440 Ultra Rendering Quality AA:4x MS | |
| MSI GP65 Leopard 9SD | |
| MSI GP75 | |
| MSI GL75 | |
| 1920x1080 Ultra Rendering Quality AA:4x MS | |
| MSI GP65 Leopard 9SD | |
| MSI GP75 | |
| MSI GL75 | |
| 1920x1080 High Rendering Quality AA:2x MS | |
| MSI GP65 Leopard 9SD | |
| MSI GP75 | |
| MSI GL75 | |
| 1920x1080 Medium Rendering Quality | |
| MSI GP65 Leopard 9SD | |
| MSI GP75 | |
| MSI GL75 | |
| 1920x1080 Low Rendering Quality | |
| MSI GP65 Leopard 9SD | |
| MSI GP75 | |
| MSI GL75 | |
| New World | |
| 3840x2160 Very High Video Quality | |
| MSI GP65 Leopard 9SD | |
| MSI GP75 | |
| MSI GL75 | |
| 2560x1440 Very High Video Quality | |
| MSI GP65 Leopard 9SD | |
| MSI GP75 | |
| MSI GL75 | |
| 1920x1080 Very High Video Quality | |
| MSI GP65 Leopard 9SD | |
| MSI GP75 | |
| MSI GL75 | |
| 1920x1080 High Video Quality | |
| MSI GP65 Leopard 9SD | |
| MSI GP75 | |
| MSI GL75 | |
| 1920x1080 Medium Video Quality | |
| MSI GP65 Leopard 9SD | |
| MSI GP75 | |
| MSI GL75 | |
| 1920x1080 Low Video Quality | |
| MSI GP65 Leopard 9SD | |
| MSI GP75 | |
| MSI GL75 | |
| Deathloop | |
| 3840x2160 Ultra Preset | |
| MSI GP65 Leopard 9SD | |
| MSI GP75 | |
| MSI GL75 | |
| 2560x1440 Ultra Preset | |
| MSI GP65 Leopard 9SD | |
| MSI GP75 | |
| MSI GL75 | |
| 1920x1080 Ultra Preset | |
| MSI GP65 Leopard 9SD | |
| MSI GP75 | |
| MSI GL75 | |
| 1920x1080 High Preset | |
| MSI GP65 Leopard 9SD | |
| MSI GP75 | |
| MSI GL75 | |
| 1920x1080 Medium Preset | |
| MSI GP65 Leopard 9SD | |
| MSI GP75 | |
| MSI GL75 | |
| 1920x1080 Low Preset | |
| MSI GP65 Leopard 9SD | |
| MSI GP75 | |
| MSI GL75 | |
| Monster Hunter Stories 2 | |
| 3840x2160 High Preset | |
| MSI GP65 Leopard 9SD | |
| Acer Nitro 5 AN517-53-54DQ | |
| MSI GP75 | |
| MSI GL75 | |
| 2560x1440 High Preset | |
| MSI GP65 Leopard 9SD | |
| MSI GP75 | |
| MSI GL75 | |
| Acer Nitro 5 AN517-53-54DQ | |
| 1920x1080 High Preset | |
| MSI GP65 Leopard 9SD | |
| MSI GP75 | |
| MSI GL75 | |
| Acer Nitro 5 AN517-53-54DQ | |
| 1920x1080 Medium Preset | |
| MSI GP65 Leopard 9SD | |
| MSI GP75 | |
| MSI GL75 | |
| Acer Nitro 5 AN517-53-54DQ | |
| 1920x1080 Low Preset | |
| MSI GP75 | |
| MSI GP65 Leopard 9SD | |
| MSI GL75 | |
| F1 2021 | |
| 3840x2160 Ultra High Preset + Raytracing AA:T AF:16x | |
| Acer Nitro 5 AN517-53-54DQ | |
| 2560x1440 Ultra High Preset + Raytracing AA:T AF:16x | |
| Acer Nitro 5 AN517-53-54DQ | |
| 1920x1080 Ultra High Preset + Raytracing AA:T AF:16x | |
| Acer Nitro 5 AN517-53-54DQ | |
| 1920x1080 High Preset AA:T AF:16x | |
| MSI GP65 Leopard 9SD | |
| Acer Nitro 5 AN517-53-54DQ | |
| MSI GP75 | |
| MSI GL75 | |
| 1920x1080 Medium Preset AA:T AF:16x | |
| MSI GP65 Leopard 9SD | |
| Acer Nitro 5 AN517-53-54DQ | |
| MSI GP75 | |
| MSI GL75 | |
| 1920x1080 Ultra Low Preset | |
| MSI GP65 Leopard 9SD | |
| MSI GP75 | |
| MSI GL75 | |
| Days Gone | |
| 3840x2160 Very High Preset | |
| MSI GP65 Leopard 9SD | |
| Acer Nitro 5 AN517-53-54DQ | |
| MSI GP75 | |
| MSI GL75 | |
| 2560x1440 Very High Preset | |
| MSI GP65 Leopard 9SD | |
| Acer Nitro 5 AN517-53-54DQ | |
| MSI GP75 | |
| MSI GL75 | |
| 1920x1080 Very High Preset | |
| MSI GP65 Leopard 9SD | |
| Acer Nitro 5 AN517-53-54DQ | |
| MSI GP75 | |
| MSI GL75 | |
| 1920x1080 High Preset | |
| MSI GP65 Leopard 9SD | |
| Acer Nitro 5 AN517-53-54DQ | |
| MSI GP75 | |
| MSI GL75 | |
| 1920x1080 Medium Preset | |
| MSI GP65 Leopard 9SD | |
| Acer Nitro 5 AN517-53-54DQ | |
| MSI GP75 | |
| MSI GL75 | |
| 1920x1080 Low Preset | |
| MSI GP65 Leopard 9SD | |
| MSI GP75 | |
| MSI GL75 | |
| Mass Effect Legendary Edition | |
| 3840x2160 On | |
| MSI GP65 Leopard 9SD | |
| Acer Nitro 5 AN517-53-54DQ | |
| MSI GP75 | |
| MSI GL75 | |
| 2560x1440 On | |
| MSI GP65 Leopard 9SD | |
| Acer Nitro 5 AN517-53-54DQ | |
| MSI GP75 | |
| MSI GL75 | |
| 1920x1080 On | |
| MSI GP65 Leopard 9SD | |
| MSI GP75 | |
| Acer Nitro 5 AN517-53-54DQ | |
| MSI GL75 | |
| 1280x720 Off | |
| MSI GP75 | |
| MSI GP65 Leopard 9SD | |
| MSI GL75 | |
| Resident Evil Village | |
| 3840x2160 Max Preset | |
| MSI GP65 Leopard 9SD | |
| Acer Nitro 5 AN517-53-54DQ | |
| MSI GP75 | |
| MSI GL75 | |
| 2560x1440 Max Preset | |
| MSI GP65 Leopard 9SD | |
| Acer Nitro 5 AN517-53-54DQ | |
| MSI GP75 | |
| MSI GL75 | |
| 1920x1080 Max Preset | |
| MSI GP65 Leopard 9SD | |
| MSI GP75 | |
| Acer Nitro 5 AN517-53-54DQ | |
| MSI GL75 | |
| 1920x1080 Prioritize Graphics Preset | |
| MSI GP65 Leopard 9SD | |
| MSI GP75 | |
| Acer Nitro 5 AN517-53-54DQ | |
| MSI GL75 | |
| 1920x1080 Balanced Preset | |
| MSI GP65 Leopard 9SD | |
| MSI GP75 | |
| Acer Nitro 5 AN517-53-54DQ | |
| MSI GL75 | |
| 1920x1080 Prioritize Performance Preset | |
| MSI GP65 Leopard 9SD | |
| MSI GP75 | |
| MSI GL75 | |
| Outriders | |
| 3840x2160 Ultra Preset | |
| MSI GP65 Leopard 9SD | |
| MSI GP75 | |
| MSI GL75 | |
| Acer Nitro 5 AN517-53-54DQ | |
| 2560x1440 Ultra Preset | |
| MSI GP65 Leopard 9SD | |
| MSI GP75 | |
| MSI GL75 | |
| Acer Nitro 5 AN517-53-54DQ | |
| 1920x1080 Ultra Preset | |
| MSI GP65 Leopard 9SD | |
| MSI GP75 | |
| Acer Nitro 5 AN517-53-54DQ | |
| MSI GL75 | |
| 1920x1080 High Preset | |
| MSI GP65 Leopard 9SD | |
| MSI GP75 | |
| MSI GL75 | |
| Acer Nitro 5 AN517-53-54DQ | |
| 1920x1080 Medium Preset | |
| MSI GP65 Leopard 9SD | |
| MSI GP75 | |
| MSI GL75 | |
| Acer Nitro 5 AN517-53-54DQ | |
| 1920x1080 Low Preset | |
| MSI GP65 Leopard 9SD | |
| MSI GP75 | |
| MSI GL75 | |
| Hitman 3 | |
| 3840x2160 Maximum Settings AF:16x | |
| MSI GP65 Leopard 9SD | |
| Acer Nitro 5 AN517-53-54DQ | |
| MSI GP75 | |
| MSI GL75 | |
| 2560x1440 Maximum Settings AF:16x | |
| MSI GP65 Leopard 9SD | |
| Acer Nitro 5 AN517-53-54DQ | |
| MSI GP75 | |
| MSI GL75 | |
| 1920x1080 Maximum Settings AF:16x | |
| MSI GP65 Leopard 9SD | |
| MSI GP75 | |
| MSI GL75 | |
| Acer Nitro 5 AN517-53-54DQ | |
| 1920x1080 High Settings AF:16x | |
| MSI GP65 Leopard 9SD | |
| MSI GP75 | |
| MSI GL75 | |
| Acer Nitro 5 AN517-53-54DQ | |
| 1920x1080 Medium Settings AF:16x | |
| MSI GP65 Leopard 9SD | |
| Acer Nitro 5 AN517-53-54DQ | |
| MSI GP75 | |
| MSI GL75 | |
| 1920x1080 Minimum Settings | |
| MSI GP65 Leopard 9SD | |
| MSI GP75 | |
| MSI GL75 | |
| Cyberpunk 2077 1.0 | |
| 1920x1080 Ray Tracing Ultra Preset (DLSS off) | |
| MSI GP65 Leopard 9SD | |
| 3840x2160 Ultra Preset | |
| MSI GP65 Leopard 9SD | |
| MSI GP75 | |
| MSI GL75 | |
| Acer Nitro 5 AN517-53-54DQ | |
| 2560x1440 Ultra Preset | |
| MSI GP65 Leopard 9SD | |
| Acer Nitro 5 AN517-53-54DQ | |
| MSI GP75 | |
| MSI GL75 | |
| 1920x1080 Ultra Preset | |
| MSI GP65 Leopard 9SD | |
| Acer Nitro 5 AN517-53-54DQ | |
| MSI GP75 | |
| MSI GL75 | |
| 1920x1080 High Preset | |
| MSI GP65 Leopard 9SD | |
| Acer Nitro 5 AN517-53-54DQ | |
| MSI GP75 | |
| MSI GL75 | |
| 1920x1080 Medium Preset | |
| MSI GP65 Leopard 9SD | |
| Acer Nitro 5 AN517-53-54DQ | |
| MSI GP75 | |
| MSI GL75 | |
| 1920x1080 Low Preset | |
| MSI GP65 Leopard 9SD | |
| MSI GP75 | |
| MSI GL75 | |
| Immortals Fenyx Rising | |
| 3840x2160 Very High Preset | |
| MSI GP65 Leopard 9SD | |
| MSI GP75 | |
| Acer Nitro 5 AN517-53-54DQ | |
| MSI GL75 | |
| 2560x1440 Very High Preset | |
| MSI GP65 Leopard 9SD | |
| Acer Nitro 5 AN517-53-54DQ | |
| MSI GP75 | |
| MSI GL75 | |
| 1920x1080 Very High Preset | |
| MSI GP65 Leopard 9SD | |
| MSI GP75 | |
| Acer Nitro 5 AN517-53-54DQ | |
| MSI GL75 | |
| 1920x1080 High Preset | |
| MSI GP65 Leopard 9SD | |
| Acer Nitro 5 AN517-53-54DQ | |
| MSI GP75 | |
| MSI GL75 | |
| 1920x1080 Medium Preset | |
| MSI GP65 Leopard 9SD | |
| Acer Nitro 5 AN517-53-54DQ | |
| MSI GP75 | |
| MSI GL75 | |
| Crysis Remastered | |
| 3840x2160 Very High Preset AA:SM | |
| Acer Nitro 5 AN517-53-54DQ | |
| MSI GP65 Leopard 9SD | |
| MSI GL75 | |
| MSI GP75 | |
| 2560x1440 Very High Preset AA:SM | |
| Acer Nitro 5 AN517-53-54DQ | |
| MSI GP65 Leopard 9SD | |
| MSI GL75 | |
| MSI GP75 | |
| 1920x1080 Very High Preset AA:SM | |
| MSI GP65 Leopard 9SD | |
| Acer Nitro 5 AN517-53-54DQ | |
| MSI GL75 | |
| MSI GP75 | |
| 1920x1080 High Preset AA:SM | |
| MSI GP65 Leopard 9SD | |
| Acer Nitro 5 AN517-53-54DQ | |
| MSI GP75 | |
| MSI GL75 | |
| 1920x1080 Medium Preset | |
| MSI GP65 Leopard 9SD | |
| Acer Nitro 5 AN517-53-54DQ | |
| MSI GP75 | |
| MSI GL75 | |
| Yakuza Like a Dragon | |
| 3840x2160 Ultra Preset | |
| MSI GP65 Leopard 9SD | |
| Acer Nitro 5 AN517-53-54DQ | |
| MSI GP75 | |
| MSI GL75 | |
| 2560x1440 Ultra Preset | |
| MSI GP65 Leopard 9SD | |
| Acer Nitro 5 AN517-53-54DQ | |
| MSI GP75 | |
| MSI GL75 | |
| 1920x1080 Ultra Preset | |
| MSI GP65 Leopard 9SD | |
| Acer Nitro 5 AN517-53-54DQ | |
| MSI GP75 | |
| MSI GL75 | |
| 1920x1080 High Preset | |
| MSI GP65 Leopard 9SD | |
| Acer Nitro 5 AN517-53-54DQ | |
| MSI GP75 | |
| MSI GL75 | |
| 1920x1080 Medium Preset | |
| MSI GP65 Leopard 9SD | |
| Acer Nitro 5 AN517-53-54DQ | |
| MSI GP75 | |
| MSI GL75 | |
| Call of Duty Black Ops Cold War | |
| 1920x1080 Highest Settings + Ultra Ray Tracing | |
| MSI GP65 Leopard 9SD | |
| 3840x2160 Highest Settings | |
| MSI GP65 Leopard 9SD | |
| 2560x1440 Highest Settings | |
| MSI GP65 Leopard 9SD | |
| 1920x1080 Highest Settings | |
| MSI GP65 Leopard 9SD | |
| 1920x1080 High Settings | |
| MSI GP65 Leopard 9SD | |
| 1920x1080 Medium Settings | |
| MSI GP65 Leopard 9SD | |
| Assassin´s Creed Valhalla | |
| 3840x2160 Ultra High Preset | |
| MSI GP65 Leopard 9SD | |
| 2560x1440 Ultra High Preset | |
| MSI GP65 Leopard 9SD | |
| Acer Nitro 5 AN517-53-54DQ | |
| 1920x1080 Ultra High Preset | |
| MSI GP65 Leopard 9SD | |
| Acer Nitro 5 AN517-53-54DQ | |
| 1920x1080 High Preset | |
| MSI GP65 Leopard 9SD | |
| Acer Nitro 5 AN517-53-54DQ | |
| 1920x1080 Medium Preset | |
| MSI GP65 Leopard 9SD | |
| Acer Nitro 5 AN517-53-54DQ | |
| Dirt 5 | |
| 3840x2160 Ultra High Preset | |
| MSI GP65 Leopard 9SD | |
| Acer Nitro 5 AN517-53-54DQ | |
| 2560x1440 Ultra High Preset | |
| Acer Nitro 5 AN517-53-54DQ | |
| MSI GP65 Leopard 9SD | |
| 1920x1080 Ultra High Preset | |
| Acer Nitro 5 AN517-53-54DQ | |
| MSI GP65 Leopard 9SD | |
| 1920x1080 High Preset | |
| MSI GP65 Leopard 9SD | |
| Acer Nitro 5 AN517-53-54DQ | |
| 1920x1080 Medium Preset | |
| MSI GP65 Leopard 9SD | |
| Acer Nitro 5 AN517-53-54DQ | |
| Watch Dogs Legion | |
| 1920x1080 Ultra Preset + Ultra Ray Tracing (DX12) | |
| MSI GP65 Leopard 9SD | |
| 3840x2160 Ultra Preset (DX12) | |
| MSI GP65 Leopard 9SD | |
| 2560x1440 Ultra Preset (DX12) | |
| MSI GP65 Leopard 9SD | |
| 1920x1080 Ultra Preset (DX12) | |
| MSI GP65 Leopard 9SD | |
| 1920x1080 High Preset (DX12) | |
| MSI GP65 Leopard 9SD | |
| Acer Nitro 5 AN517-53-54DQ | |
| 1920x1080 Medium Preset (DX12) | |
| MSI GP65 Leopard 9SD | |
| Acer Nitro 5 AN517-53-54DQ | |
| FIFA 21 | |
| 3840x2160 Ultra Preset AA:4xMS | |
| MSI GP65 Leopard 9SD | |
| Acer Nitro 5 AN517-53-54DQ | |
| 2560x1440 Ultra Preset AA:4xMS | |
| MSI GP65 Leopard 9SD | |
| Acer Nitro 5 AN517-53-54DQ | |
| 1920x1080 Ultra Preset AA:4xMS | |
| MSI GP65 Leopard 9SD | |
| Acer Nitro 5 AN517-53-54DQ | |
| 1920x1080 High Preset AA:2xMS | |
| MSI GP65 Leopard 9SD | |
| Acer Nitro 5 AN517-53-54DQ | |
| 1920x1080 Medium Preset | |
| MSI GP65 Leopard 9SD | |
| Acer Nitro 5 AN517-53-54DQ | |
| 1280x720 Low Preset | |
| MSI GP65 Leopard 9SD | |
| Star Wars Squadrons | |
| 3840x2160 Ultra Preset | |
| MSI GP65 Leopard 9SD | |
| Acer Nitro 5 AN517-53-54DQ | |
| 2560x1440 Ultra Preset | |
| MSI GP65 Leopard 9SD | |
| Acer Nitro 5 AN517-53-54DQ | |
| 1920x1080 Ultra Preset | |
| MSI GP65 Leopard 9SD | |
| Acer Nitro 5 AN517-53-54DQ | |
| 1920x1080 High Preset | |
| MSI GP65 Leopard 9SD | |
| Acer Nitro 5 AN517-53-54DQ | |
| 1920x1080 Medium Preset | |
| MSI GP65 Leopard 9SD | |
| Acer Nitro 5 AN517-53-54DQ | |
| 1280x720 Low Preset | |
| MSI GP65 Leopard 9SD | |
| Mafia Definitive Edition | |
| 3840x2160 High Preset | |
| MSI GP65 Leopard 9SD | |
| Acer Nitro 5 AN517-53-54DQ | |
| 2560x1440 High Preset | |
| MSI GP65 Leopard 9SD | |
| Acer Nitro 5 AN517-53-54DQ | |
| 1920x1080 High Preset | |
| MSI GP65 Leopard 9SD | |
| Acer Nitro 5 AN517-53-54DQ | |
| 1920x1080 Medium Preset | |
| MSI GP65 Leopard 9SD | |
| Acer Nitro 5 AN517-53-54DQ | |
| 1280x720 Low Preset | |
| MSI GP65 Leopard 9SD | |
| Serious Sam 4 | |
| 2560x1440 Ultra (DX12) AA:2xMS | |
| MSI GP65 Leopard 9SD | |
| Acer Nitro 5 AN517-53-54DQ | |
| 1920x1080 Ultra (DX12) AA:2xMS | |
| MSI GP65 Leopard 9SD | |
| Acer Nitro 5 AN517-53-54DQ | |
| 1920x1080 High (DX12) | |
| MSI GP65 Leopard 9SD | |
| Acer Nitro 5 AN517-53-54DQ | |
| 1920x1080 Medium (DX12) | |
| MSI GP65 Leopard 9SD | |
| Acer Nitro 5 AN517-53-54DQ | |
| 1280x720 Lowest (DX12) | |
| MSI GP65 Leopard 9SD | |
| Flight Simulator 2020 | |
| 3840x2160 Ultra AA:TAA AF:16x | |
| MSI GP65 Leopard 9SD | |
| 2560x1440 Ultra AA:TAA AF:16x | |
| MSI GP65 Leopard 9SD | |
| 1920x1080 Ultra AA:TAA AF:16x | |
| MSI GP65 Leopard 9SD | |
| 1920x1080 High-End AA:TAA AF:8x | |
| MSI GP65 Leopard 9SD | |
| 1920x1080 Medium AA:TAA AF:4x | |
| MSI GP65 Leopard 9SD | |
| 1280x720 Low-End AA:TAA | |
| MSI GP65 Leopard 9SD | |
| Valorant | |
| 3840x2160 High / On AA:FX AF:16x | |
| MSI GP65 Leopard 9SD | |
| 2560x1440 High / On AA:FX AF:16x | |
| MSI GP65 Leopard 9SD | |
| 1920x1080 High / On AA:FX AF:16x | |
| MSI GP65 Leopard 9SD | |
| 1920x1080 Medium / On AF:8x | |
| MSI GP65 Leopard 9SD | |
| 1280x720 Low / Off AF:1x | |
| MSI GP65 Leopard 9SD | |
| Horizon Zero Dawn | |
| 3840x2160 Ultimate Quality | |
| MSI GP65 Leopard 9SD | |
| 2560x1440 Ultimate Quality | |
| MSI GP65 Leopard 9SD | |
| 1920x1080 Ultimate Quality | |
| MSI GP65 Leopard 9SD | |
| 1920x1080 Favor Quality | |
| MSI GP65 Leopard 9SD | |
| 1920x1080 Original | |
| MSI GP65 Leopard 9SD | |
| 1280x720 Favor Performance | |
| MSI GP65 Leopard 9SD | |
| Strange Brigade | |
| 3840x2160 ultra AA:ultra AF:16 | |
| Average of class Gaming (83 - 187.2, n=33, last 2 years) | |
| Acer Nitro 5 AN517-53-54DQ | |
| 2560x1440 ultra AA:ultra AF:16 | |
| Average of class Gaming (52.8 - 350, n=75, last 2 years) | |
| Acer Nitro 5 AN517-53-54DQ | |
| 1920x1080 ultra AA:ultra AF:16 | |
| Average of class Gaming (76.3 - 456, n=86, last 2 years) | |
| Acer Nitro 5 AN517-53-54DQ | |
| 1920x1080 high AA:high AF:8 | |
| Average of class Gaming (129.5 - 485, n=74, last 2 years) | |
| Acer Nitro 5 AN517-53-54DQ | |
| 1920x1080 medium AA:medium AF:4 | |
| Average of class Gaming (160.9 - 509, n=71, last 2 years) | |
| Acer Nitro 5 AN517-53-54DQ | |
| Death Stranding | |
| 3840x2160 Very High Preset | |
| MSI GP65 Leopard 9SD | |
| Acer Nitro 5 AN517-53-54DQ | |
| 2560x1440 Very High Preset | |
| MSI GP65 Leopard 9SD | |
| Acer Nitro 5 AN517-53-54DQ | |
| 1920x1080 Very High Preset | |
| MSI GP65 Leopard 9SD | |
| Acer Nitro 5 AN517-53-54DQ | |
| 1920x1080 Default Preset | |
| MSI GP65 Leopard 9SD | |
| Acer Nitro 5 AN517-53-54DQ | |
| 1920x1080 Medium Preset | |
| MSI GP65 Leopard 9SD | |
| Acer Nitro 5 AN517-53-54DQ | |
| 1280x720 Low Preset | |
| MSI GP65 Leopard 9SD | |
| F1 2020 | |
| 3840x2160 Ultra High Preset AA:T AF:16x | |
| MSI GP65 Leopard 9SD | |
| 2560x1440 Ultra High Preset AA:T AF:16x | |
| MSI GP65 Leopard 9SD | |
| 1920x1080 Ultra High Preset AA:T AF:16x | |
| MSI GP65 Leopard 9SD | |
| 1920x1080 High Preset AA:T AF:16x | |
| MSI GP65 Leopard 9SD | |
| 1920x1080 Medium Preset AF:16x | |
| MSI GP65 Leopard 9SD | |
| 1280x720 Ultra Low Preset | |
| MSI GP65 Leopard 9SD | |
| Gears Tactics | |
| 3840x2160 Ultra Preset | |
| MSI GP65 Leopard 9SD | |
| Acer Nitro 5 AN517-53-54DQ | |
| 2560x1440 Ultra Preset | |
| MSI GP65 Leopard 9SD | |
| Acer Nitro 5 AN517-53-54DQ | |
| 1920x1080 Ultra Preset | |
| MSI GP65 Leopard 9SD | |
| Acer Nitro 5 AN517-53-54DQ | |
| 1920x1080 High Preset | |
| MSI GP65 Leopard 9SD | |
| Acer Nitro 5 AN517-53-54DQ | |
| 1920x1080 Medium Preset | |
| MSI GP65 Leopard 9SD | |
| Acer Nitro 5 AN517-53-54DQ | |
| 1280x720 Low Preset | |
| MSI GP65 Leopard 9SD | |
| Doom Eternal | |
| 3840x2160 Ultra Preset | |
| MSI GP65 Leopard 9SD | |
| 2560x1440 Ultra Preset | |
| MSI GP65 Leopard 9SD | |
| 1920x1080 Ultra Preset | |
| MSI GP65 Leopard 9SD | |
| 1920x1080 High Preset | |
| MSI GP65 Leopard 9SD | |
| Acer Nitro 5 AN517-53-54DQ | |
| 1920x1080 Medium Preset | |
| MSI GP65 Leopard 9SD | |
| Acer Nitro 5 AN517-53-54DQ | |
| 1280x720 Low Preset | |
| MSI GP65 Leopard 9SD | |
| Hunt Showdown | |
| 3840x2160 High Preset | |
| MSI GP65 Leopard 9SD | |
| Acer Nitro 5 AN517-53-54DQ | |
| 2560x1440 High Preset | |
| MSI GP65 Leopard 9SD | |
| Acer Nitro 5 AN517-53-54DQ | |
| 1920x1080 High Preset | |
| MSI GP65 Leopard 9SD | |
| Acer Nitro 5 AN517-53-54DQ | |
| 1920x1080 Medium Preset | |
| MSI GP65 Leopard 9SD | |
| Acer Nitro 5 AN517-53-54DQ | |
| 1280x720 Low Preset | |
| MSI GP65 Leopard 9SD | |
| Escape from Tarkov | |
| 3840x2160 Ultra Preset | |
| MSI GP65 Leopard 9SD | |
| 2560x1440 Ultra Preset | |
| MSI GP65 Leopard 9SD | |
| 1920x1080 Ultra Preset | |
| MSI GP65 Leopard 9SD | |
| 1920x1080 High Preset | |
| MSI GP65 Leopard 9SD | |
| 1920x1080 Medium Preset | |
| MSI GP65 Leopard 9SD | |
| 1280x720 Low Preset | |
| MSI GP65 Leopard 9SD | |
| Red Dead Redemption 2 | |
| 3840x2160 Maximum Settings | |
| MSI GP65 Leopard 9SD | |
| 2560x1440 Maximum Settings | |
| MSI GP65 Leopard 9SD | |
| 1920x1080 Maximum Settings | |
| MSI GP65 Leopard 9SD | |
| 1920x1080 High Settings | |
| MSI GP65 Leopard 9SD | |
| 1920x1080 Medium Settings | |
| MSI GP65 Leopard 9SD | |
| 1280x720 Minimum Settings | |
| MSI GP65 Leopard 9SD | |
| Star Wars Jedi Fallen Order | |
| 3840x2160 Epic Preset | |
| MSI GP65 Leopard 9SD | |
| Acer Nitro 5 AN517-53-54DQ | |
| 2560x1440 Epic Preset | |
| MSI GP65 Leopard 9SD | |
| Acer Nitro 5 AN517-53-54DQ | |
| 1920x1080 Epic Preset | |
| MSI GP65 Leopard 9SD | |
| Acer Nitro 5 AN517-53-54DQ | |
| 1920x1080 High Preset | |
| MSI GP65 Leopard 9SD | |
| Acer Nitro 5 AN517-53-54DQ | |
| 1920x1080 Medium Preset | |
| MSI GP65 Leopard 9SD | |
| Acer Nitro 5 AN517-53-54DQ | |
| Need for Speed Heat | |
| 3840x2160 Ultra Preset | |
| MSI GP65 Leopard 9SD | |
| Acer Nitro 5 AN517-53-54DQ | |
| 2560x1440 Ultra Preset | |
| MSI GP65 Leopard 9SD | |
| Acer Nitro 5 AN517-53-54DQ | |
| 1920x1080 Ultra Preset | |
| MSI GP65 Leopard 9SD | |
| Acer Nitro 5 AN517-53-54DQ | |
| 1920x1080 High Preset | |
| MSI GP65 Leopard 9SD | |
| Acer Nitro 5 AN517-53-54DQ | |
| 1920x1080 Medium Preset | |
| MSI GP65 Leopard 9SD | |
| Acer Nitro 5 AN517-53-54DQ | |
| 1280x720 Low Preset | |
| MSI GP65 Leopard 9SD | |
| Call of Duty Modern Warfare 2019 | |
| 1920x1080 Maximum Settings with Raytracing AA:T2X Filmic SM | |
| MSI GP65 Leopard 9SD | |
| 3840x2160 Maximum Settings AA:T2X Filmic SM | |
| MSI GP65 Leopard 9SD | |
| 2560x1440 Maximum Settings AA:T2X Filmic SM | |
| MSI GP65 Leopard 9SD | |
| 1920x1080 Maximum Settings AA:T2X Filmic SM | |
| MSI GP65 Leopard 9SD | |
| 1920x1080 High Settings AA:1X SM | |
| MSI GP65 Leopard 9SD | |
| 1920x1080 Medium Settings | |
| MSI GP65 Leopard 9SD | |
| 1280x720 Minimum Settings | |
| MSI GP65 Leopard 9SD | |
| GRID 2019 | |
| 3840x2160 Ultra High Preset | |
| MSI GP65 Leopard 9SD | |
| Acer Nitro 5 AN517-53-54DQ | |
| 2560x1440 Ultra High Preset | |
| MSI GP65 Leopard 9SD | |
| Acer Nitro 5 AN517-53-54DQ | |
| 1920x1080 Ultra High Preset | |
| MSI GP65 Leopard 9SD | |
| Acer Nitro 5 AN517-53-54DQ | |
| 1920x1080 High Preset | |
| MSI GP65 Leopard 9SD | |
| Acer Nitro 5 AN517-53-54DQ | |
| 1920x1080 Medium Preset | |
| MSI GP65 Leopard 9SD | |
| Acer Nitro 5 AN517-53-54DQ | |
| 1280x720 Ultra Low Preset | |
| MSI GP65 Leopard 9SD | |
| Ghost Recon Breakpoint | |
| 3840x2160 Ultra Preset AA:T | |
| MSI GP65 Leopard 9SD | |
| 2560x1440 Ultra Preset AA:T | |
| MSI GP65 Leopard 9SD | |
| 1920x1080 Ultra Preset AA:T | |
| MSI GP65 Leopard 9SD | |
| 1920x1080 High Preset AA:T | |
| MSI GP65 Leopard 9SD | |
| 1920x1080 Medium Preset | |
| MSI GP65 Leopard 9SD | |
| 1280x720 Low Preset | |
| MSI GP65 Leopard 9SD | |
| FIFA 20 | |
| 3840x2160 Ultra Preset AA:4xMS | |
| MSI GP65 Leopard 9SD | |
| 2560x1440 Ultra Preset AA:4xMS | |
| MSI GP65 Leopard 9SD | |
| 1920x1080 Ultra Preset AA:4xMS | |
| MSI GP65 Leopard 9SD | |
| 1920x1080 High Preset AA:2xMS | |
| MSI GP65 Leopard 9SD | |
| 1920x1080 Medium Preset | |
| MSI GP65 Leopard 9SD | |
| 1280x720 Low Preset | |
| MSI GP65 Leopard 9SD | |
| Borderlands 3 | |
| 3840x2160 Badass Overall Quality (DX11) | |
| Acer Nitro 5 AN517-53-54DQ | |
| MSI GP65 Leopard 9SD | |
| 2560x1440 Badass Overall Quality (DX11) | |
| MSI GP65 Leopard 9SD | |
| Acer Nitro 5 AN517-53-54DQ | |
| 1920x1080 Badass Overall Quality (DX11) | |
| MSI GP65 Leopard 9SD | |
| Acer Nitro 5 AN517-53-54DQ | |
| 1920x1080 High Overall Quality (DX11) | |
| MSI GP65 Leopard 9SD | |
| Acer Nitro 5 AN517-53-54DQ | |
| 1920x1080 Medium Overall Quality (DX11) | |
| MSI GP65 Leopard 9SD | |
| Acer Nitro 5 AN517-53-54DQ | |
| 1280x720 Very Low Overall Quality (DX11) | |
| MSI GP65 Leopard 9SD | |
| Control | |
| 1920x1080 High Quality Preset & High Ray Tracing Preset (DX12) | |
| MSI GP65 Leopard 9SD | |
| 3840x2160 High Quality Preset | |
| MSI GP65 Leopard 9SD | |
| Acer Nitro 5 AN517-53-54DQ | |
| 2560x1440 High Quality Preset | |
| MSI GP65 Leopard 9SD | |
| Acer Nitro 5 AN517-53-54DQ | |
| 1920x1080 High Quality Preset | |
| MSI GP65 Leopard 9SD | |
| Acer Nitro 5 AN517-53-54DQ | |
| 1920x1080 Medium Quality Preset | |
| MSI GP65 Leopard 9SD | |
| Acer Nitro 5 AN517-53-54DQ | |
| 1280x720 Low Quality Preset | |
| MSI GP65 Leopard 9SD | |
| F1 2019 | |
| 3840x2160 Ultra High Preset AA:T AF:16x | |
| MSI GP65 Leopard 9SD | |
| 2560x1440 Ultra High Preset AA:T AF:16x | |
| MSI GP65 Leopard 9SD | |
| 1920x1080 Ultra High Preset AA:T AF:16x | |
| MSI GP65 Leopard 9SD | |
| 1920x1080 High Preset AA:T AF:16x | |
| MSI GP65 Leopard 9SD | |
| 1920x1080 Medium Preset AA:T AF:16x | |
| MSI GP65 Leopard 9SD | |
| 1280x720 Ultra Low Preset | |
| MSI GP65 Leopard 9SD | |
| Rage 2 | |
| 3840x2160 Ultra Preset (Resolution Scale Off) | |
| Acer Nitro 5 AN517-53-54DQ | |
| 2560x1440 Ultra Preset (Resolution Scale Off) | |
| Acer Nitro 5 AN517-53-54DQ | |
| 1920x1080 Ultra Preset (Resolution Scale Off) | |
| Acer Nitro 5 AN517-53-54DQ | |
| 1920x1080 High Preset (Resolution Scale Off) | |
| Acer Nitro 5 AN517-53-54DQ | |
| 1920x1080 Medium Preset (Resolution Scale Off) | |
| Acer Nitro 5 AN517-53-54DQ | |
| Anno 1800 | |
| 3840x2160 Ultra Graphics Quality (DX11) | |
| Acer Nitro 5 AN517-53-54DQ | |
| 2560x1440 Ultra Graphics Quality (DX11) | |
| Average of class Gaming (n=1last 2 years) | |
| Acer Nitro 5 AN517-53-54DQ | |
| 1920x1080 Ultra Graphics Quality (DX11) | |
| Average of class Gaming (n=1last 2 years) | |
| Acer Nitro 5 AN517-53-54DQ | |
| 1920x1080 High Graphics Quality (DX11) | |
| Average of class Gaming (n=1last 2 years) | |
| Acer Nitro 5 AN517-53-54DQ | |
| 1920x1080 Medium Graphics Quality (DX11) | |
| Average of class Gaming (n=1last 2 years) | |
| Acer Nitro 5 AN517-53-54DQ | |
| The Division 2 | |
| 3840x2160 Ultra Preset | |
| Acer Nitro 5 AN517-53-54DQ | |
| 2560x1440 Ultra Preset | |
| Acer Nitro 5 AN517-53-54DQ | |
| 1920x1080 Ultra Preset | |
| Acer Nitro 5 AN517-53-54DQ | |
| 1920x1080 High Preset | |
| Acer Nitro 5 AN517-53-54DQ | |
| 1920x1080 Medium Preset | |
| Acer Nitro 5 AN517-53-54DQ | |
| Apex Legends | |
| 3840x2160 Maximum Settings AA:TS AF:16x | |
| Acer Nitro 5 AN517-53-54DQ | |
| 2560x1440 Maximum Settings AA:TS AF:16x | |
| Acer Nitro 5 AN517-53-54DQ | |
| 1920x1080 Maximum Settings AA:TS AF:16x | |
| Acer Nitro 5 AN517-53-54DQ | |
| 1920x1080 High Settings AA:TS AF:8x | |
| Acer Nitro 5 AN517-53-54DQ | |
| 1920x1080 Medium Settings AA:TS AF:4x | |
| Acer Nitro 5 AN517-53-54DQ | |
| Metro Exodus | |
| 3840x2160 Ultra Quality AF:16x | |
| Acer Nitro 5 AN517-53-54DQ | |
| 2560x1440 Ultra Quality AF:16x | |
| Acer Nitro 5 AN517-53-54DQ | |
| 1920x1080 Ultra Quality AF:16x | |
| Acer Nitro 5 AN517-53-54DQ | |
| 1920x1080 High Quality AF:16x | |
| Acer Nitro 5 AN517-53-54DQ | |
| 1920x1080 Medium Quality AF:4x | |
| Acer Nitro 5 AN517-53-54DQ | |
| Battlefield V | |
| 3840x2160 Ultra Preset | |
| Acer Nitro 5 AN517-53-54DQ | |
| 2560x1440 Ultra Preset | |
| Acer Nitro 5 AN517-53-54DQ | |
| 1920x1080 Ultra Preset | |
| Acer Nitro 5 AN517-53-54DQ | |
| 1920x1080 High Preset | |
| Acer Nitro 5 AN517-53-54DQ | |
| 1920x1080 Medium Preset | |
| Acer Nitro 5 AN517-53-54DQ | |
| Shadow of the Tomb Raider | |
| 3840x2160 Highest Preset AA:T | |
| Acer Nitro 5 AN517-53-54DQ | |
| 2560x1440 Highest Preset AA:T | |
| Acer Nitro 5 AN517-53-54DQ | |
| 1920x1080 Highest Preset AA:T | |
| Average of class Gaming (96 - 116, n=2, last 2 years) | |
| Acer Nitro 5 AN517-53-54DQ | |
| 1920x1080 High Preset AA:SM | |
| Average of class Gaming (107 - 127, n=2, last 2 years) | |
| Acer Nitro 5 AN517-53-54DQ | |
| 1920x1080 Medium Preset | |
| Acer Nitro 5 AN517-53-54DQ | |
| Far Cry 5 | |
| 3840x2160 Ultra Preset AA:T | |
| Average of class Gaming (n=1last 2 years) | |
| Acer Nitro 5 AN517-53-54DQ | |
| 2560x1440 Ultra Preset AA:T | |
| Average of class Gaming (93 - 149, n=5, last 2 years) | |
| Acer Nitro 5 AN517-53-54DQ | |
| 1920x1080 Ultra Preset AA:T | |
| Average of class Gaming (70 - 151, n=6, last 2 years) | |
| Acer Nitro 5 AN517-53-54DQ | |
| 1920x1080 High Preset AA:T | |
| Average of class Gaming (82 - 163, n=6, last 2 years) | |
| Acer Nitro 5 AN517-53-54DQ | |
| 1920x1080 Medium Preset AA:T | |
| Average of class Gaming (84 - 173, n=6, last 2 years) | |
| Acer Nitro 5 AN517-53-54DQ | |
| X-Plane 11.11 | |
| 1920x1080 high (fps_test=3) | |
| Average of class Gaming (55.5 - 143.5, n=108, last 2 years) | |
| Acer Nitro 5 AN517-53-54DQ | |
| 1920x1080 med (fps_test=2) | |
| Average of class Gaming (63.8 - 181.2, n=102, last 2 years) | |
| Acer Nitro 5 AN517-53-54DQ | |
| 1280x720 low (fps_test=1) | |
| Average of class Gaming (70.1 - 209, n=91, last 2 years) | |
| Acer Nitro 5 AN517-53-54DQ | |
| Final Fantasy XV Benchmark | |
| 3840x2160 High Quality | |
| Average of class Gaming (49.1 - 111.8, n=32, last 2 years) | |
| Acer Nitro 5 AN517-53-54DQ | |
| 2560x1440 High Quality | |
| Average of class Gaming (32.5 - 184.3, n=86, last 2 years) | |
| Acer Nitro 5 AN517-53-54DQ | |
| 1920x1080 High Quality | |
| Average of class Gaming (41 - 215, n=94, last 2 years) | |
| Acer Nitro 5 AN517-53-54DQ | |
| 1920x1080 Standard Quality | |
| Average of class Gaming (85.7 - 236, n=81, last 2 years) | |
| Acer Nitro 5 AN517-53-54DQ | |
| Fortnite | |
| 2560x1440 Epic Preset | |
| MSI GP65 Leopard 9SD | |
| 1920x1080 Epic Preset | |
| MSI GP65 Leopard 9SD | |
| Playerunknown's Battlegrounds (PUBG) - 1920x1080 Ultra Preset | |
| MSI GP65 Leopard 9SD | |
| Dota 2 Reborn | |
| 1920x1080 ultra (3/3) best looking | |
| Average of class Gaming (84.8 - 248, n=106, last 2 years) | |
| Acer Nitro 5 AN517-53-54DQ | |
| 1920x1080 high (2/3) | |
| Average of class Gaming (82.8 - 275, n=105, last 2 years) | |
| Acer Nitro 5 AN517-53-54DQ | |
| 1366x768 med (1/3) | |
| Average of class Gaming (86.3 - 304, n=102, last 2 years) | |
| Acer Nitro 5 AN517-53-54DQ | |
| 1280x720 min (0/3) fastest | |
| Average of class Gaming (102.1 - 327, n=90, last 2 years) | |
| Acer Nitro 5 AN517-53-54DQ | |
| Overwatch - 2560x1440 Epic (Render Scale 100 %) AA:SM AF:16x | |
| MSI GP65 Leopard 9SD | |
| The Witcher 3 | |
| 3840x2160 High Graphics & Postprocessing (Nvidia HairWorks Off) | |
| Average of class Gaming (114 - 169.8, n=3, last 2 years) | |
| Acer Nitro 5 AN517-53-54DQ | |
| 1920x1080 Ultra Graphics & Postprocessing (HBAO+) | |
| Average of class Gaming (104.7 - 240, n=6, last 2 years) | |
| Acer Nitro 5 AN517-53-54DQ | |
| 1920x1080 High Graphics & Postprocessing (Nvidia HairWorks Off) | |
| Average of class Gaming (n=1last 2 years) | |
| Acer Nitro 5 AN517-53-54DQ | |
| 1366x768 Medium Graphics & Postprocessing | |
| Average of class Gaming (n=1last 2 years) | |
| Acer Nitro 5 AN517-53-54DQ | |
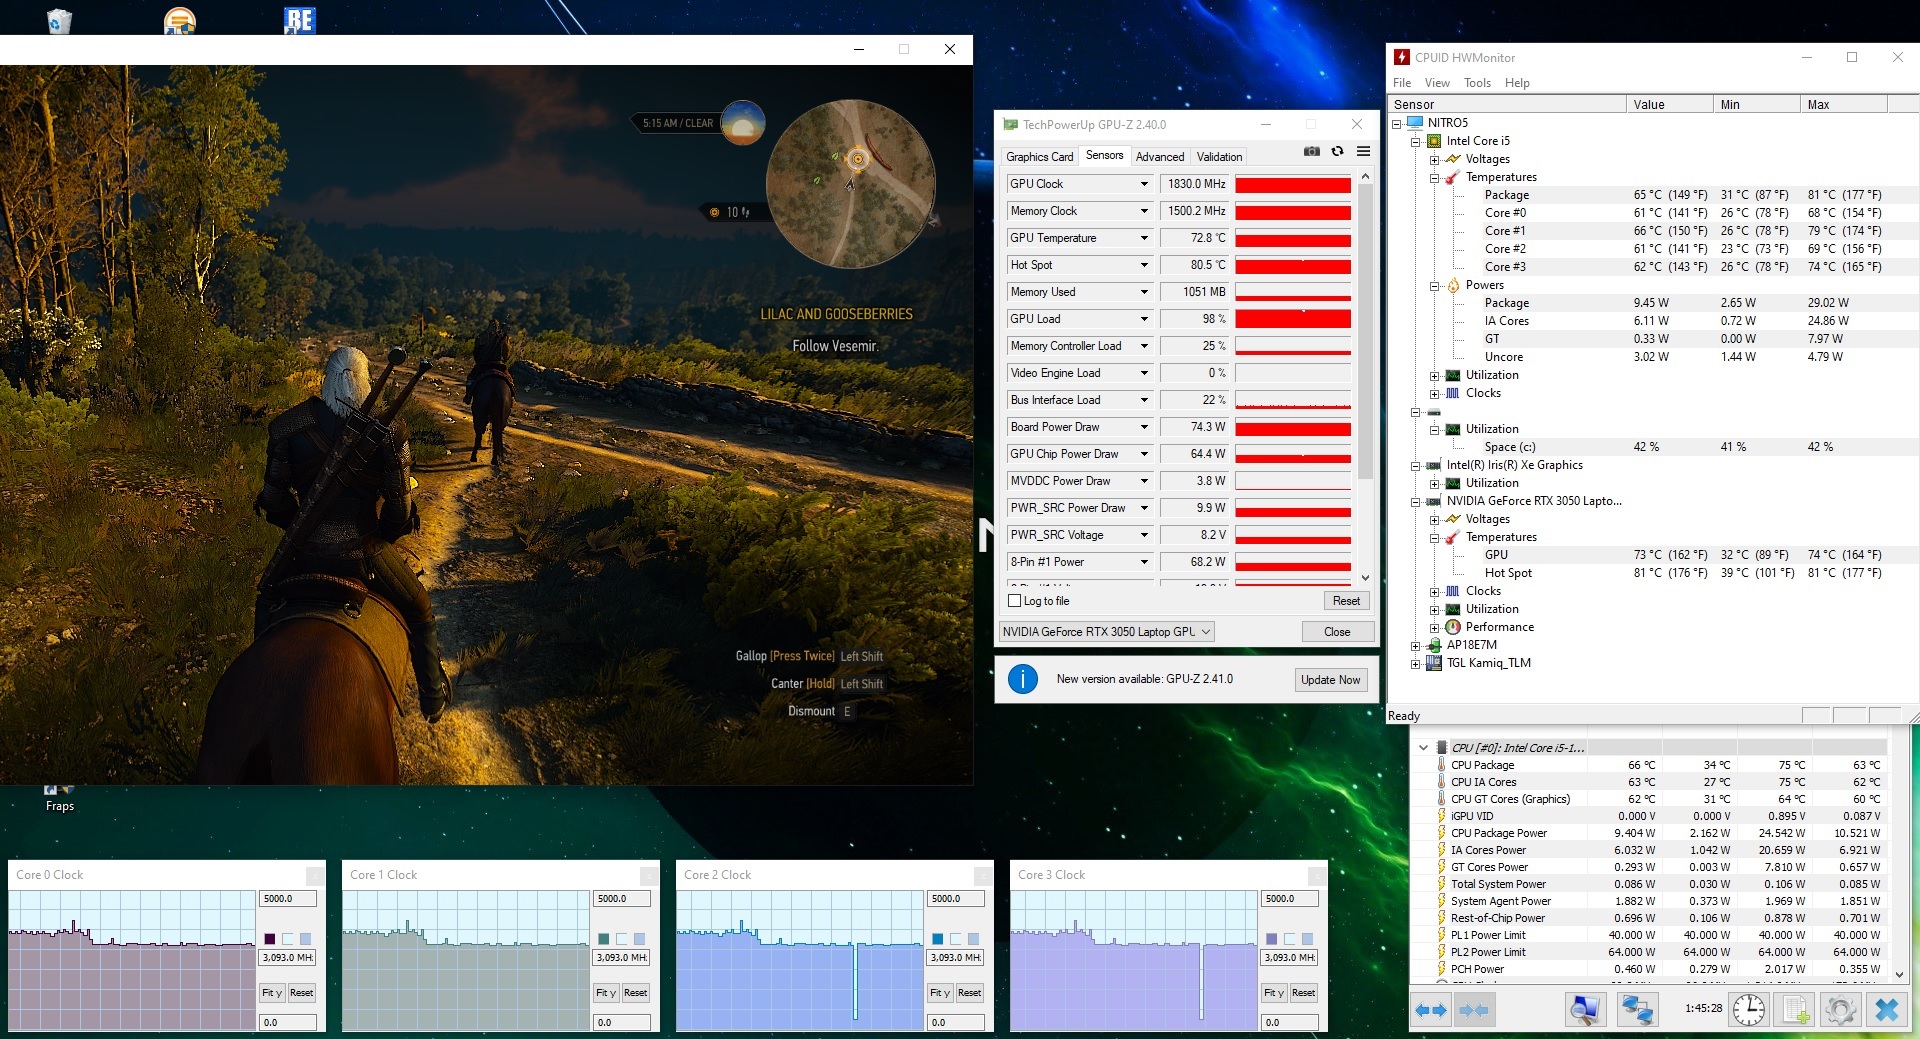
Top: In the 60-minute test of The Witcher 3 (FHD/Ultra) there were no abnormalities. The clock rates and performance were quite stable.
Witcher 3 FPS-Diagram
| low | med. | high | ultra | QHD | 4K | |
|---|---|---|---|---|---|---|
| GTA V (2015) | 157 | 120 | 63.9 | 48 | 46.3 | |
| The Witcher 3 (2015) | 142 | 84.5 | 48.7 | 33.2 | ||
| Dota 2 Reborn (2015) | 115 | 104 | 92.1 | 88.1 | ||
| Final Fantasy XV Benchmark (2018) | 71.8 | 48.6 | 33 | 17.4 | ||
| X-Plane 11.11 (2018) | 85.2 | 65.9 | 57.7 | |||
| Far Cry 5 (2018) | 86 | 80 | 74 | 52 | 19 | |
| Strange Brigade (2018) | 93.4 | 75.7 | 67.9 | 48.7 | 34 | |
| Shadow of the Tomb Raider (2018) | 66 | 63 | 57 | 44 | 23 | |
| Battlefield V (2018) | 92.8 | 89.4 | 83.2 | 65.7 | 35 | |
| Apex Legends (2019) | 126 | 100 | 89.8 | 68.4 | 37.1 | |
| Metro Exodus (2019) | 63.4 | 46.9 | 37.1 | 29 | 17.2 | |
| The Division 2 (2019) | 87 | 69 | 52 | 35 | 16 | |
| Anno 1800 (2019) | 88 | 60.3 | 31.2 | 22.9 | 12.4 | |
| Rage 2 (2019) | 81.3 | 69.8 | 68.8 | 43 | 14.2 | |
| Control (2019) | 62.1 | 45.1 | 29.1 | 13.3 | ||
| Borderlands 3 (2019) | 81.3 | 57.1 | 43.4 | 30.3 | 15.6 | |
| GRID 2019 (2019) | 93.3 | 71.1 | 36.4 | 22.8 | 11.4 | |
| Need for Speed Heat (2019) | 64.7 | 62.5 | 61.1 | 47.1 | 23.3 | |
| Star Wars Jedi Fallen Order (2019) | 86.6 | 80 | 71.6 | 52.6 | 25.3 | |
| Hunt Showdown (2020) | 73.5 | 67.7 | 42 | 19.5 | ||
| Doom Eternal (2020) | 133 | 107 | ||||
| Gears Tactics (2020) | 129 | 84.6 | 62.4 | 42.1 | 21.6 | |
| Death Stranding (2020) | 79.2 | 73.6 | 71 | 38.8 | 19 | |
| Crysis Remastered (2020) | 99.3 | 52.2 | 35.9 | 24.4 | 13.8 | |
| Serious Sam 4 (2020) | 63.5 | 48.9 | 39.1 | 29.9 | ||
| Mafia Definitive Edition (2020) | 64 | 58.9 | 40.1 | 20.4 | ||
| Star Wars Squadrons (2020) | 164 | 145 | 143 | 93.8 | 50.6 | |
| FIFA 21 (2020) | 186 | 180 | 175 | 166 | 112 | |
| Watch Dogs Legion (2020) | 61 | 54 | ||||
| Dirt 5 (2020) | 73.4 | 54.6 | 44.2 | 33 | 16.9 | |
| Assassin´s Creed Valhalla (2020) | 60 | 27 | 20 | 19 | ||
| Yakuza Like a Dragon (2020) | 57.1 | 55.3 | 50.7 | 37.1 | 19.1 | |
| Immortals Fenyx Rising (2020) | 69 | 50 | 45 | 29 | 15 | |
| Cyberpunk 2077 1.0 (2020) | 41.2 | 36 | 29.5 | 16.4 | 4.68 | |
| Hitman 3 (2021) | 103 | 60.5 | 55.7 | 39.7 | 21.4 | |
| Outriders (2021) | 53.2 | 51 | 47.2 | 30.6 | 22.9 | |
| Resident Evil Village (2021) | 73.5 | 66.6 | 57.2 | 41.6 | 17.4 | |
| Mass Effect Legendary Edition (2021) | 96.8 | 78.2 | 43.5 | |||
| Days Gone (2021) | 78.4 | 69.9 | 51.6 | 37.3 | 20.8 | |
| Monster Hunter Stories 2 (2021) | 95.6 | 91.4 | 78.4 | 60.5 | ||
| F1 2021 (2021) | 144 | 115 | 55 | 30 | 12 |
Emissions - Rather unspectacular
Noise emissions
The noise level is in line with the competition. While we could elicit 25 to 33 dB(A) from the 17-incher in idle mode (the device is silent under ideal conditions), it was 43 to 47 dB(A) under load (average 44 dB(A) after one hour of The Witcher 3). In short: The Nitro 5 is neither quiet nor unpleasantly loud in 3D mode.
Noise level
| Idle |
| 25 / 31 / 33 dB(A) |
| Load |
| 43 / 47 dB(A) |
 | ||
30 dB silent 40 dB(A) audible 50 dB(A) loud |
||
min: | ||
| Acer Nitro 5 AN517-53-54DQ i5-11300H, GeForce RTX 3050 4GB Laptop GPU | HP Omen 15-ek0456ng i5-10300H, GeForce GTX 1660 Ti Mobile | Lenovo Legion 5 17IMH05 i5-10300H, GeForce GTX 1650 Mobile | MSI GF75 Thin 10SCXR i5-10300H, GeForce GTX 1650 Mobile | Asus TUF FX705DT-AU068T R5 3550H, GeForce GTX 1650 Mobile | Average of class Gaming | |
|---|---|---|---|---|---|---|
| Noise | -5% | 4% | -4% | -5% | 1% | |
| off / environment * (dB) | 25 | 27 -8% | 24 4% | 28.4 -14% | 30.8 -23% | 24.1 ? 4% |
| Idle Minimum * (dB) | 25 | 32.4 -30% | 24 4% | 33 -32% | 30.8 -23% | 25.9 ? -4% |
| Idle Average * (dB) | 31 | 32.4 -5% | 25 19% | 33 -6% | 30.8 1% | 27.4 ? 12% |
| Idle Maximum * (dB) | 33 | 32.4 2% | 29 12% | 33.1 -0% | 32.2 2% | 30.1 ? 9% |
| Load Average * (dB) | 43 | 32.5 24% | 43 -0% | 37.7 12% | 38.6 10% | 43.6 ? -1% |
| Witcher 3 ultra * (dB) | 44 | 47.2 -7% | 46 -5% | 39.2 11% | ||
| Load Maximum * (dB) | 47 | 51.9 -10% | 51 -9% | 46 2% | 44.8 5% | 54.2 ? -15% |
* ... smaller is better
Temperature
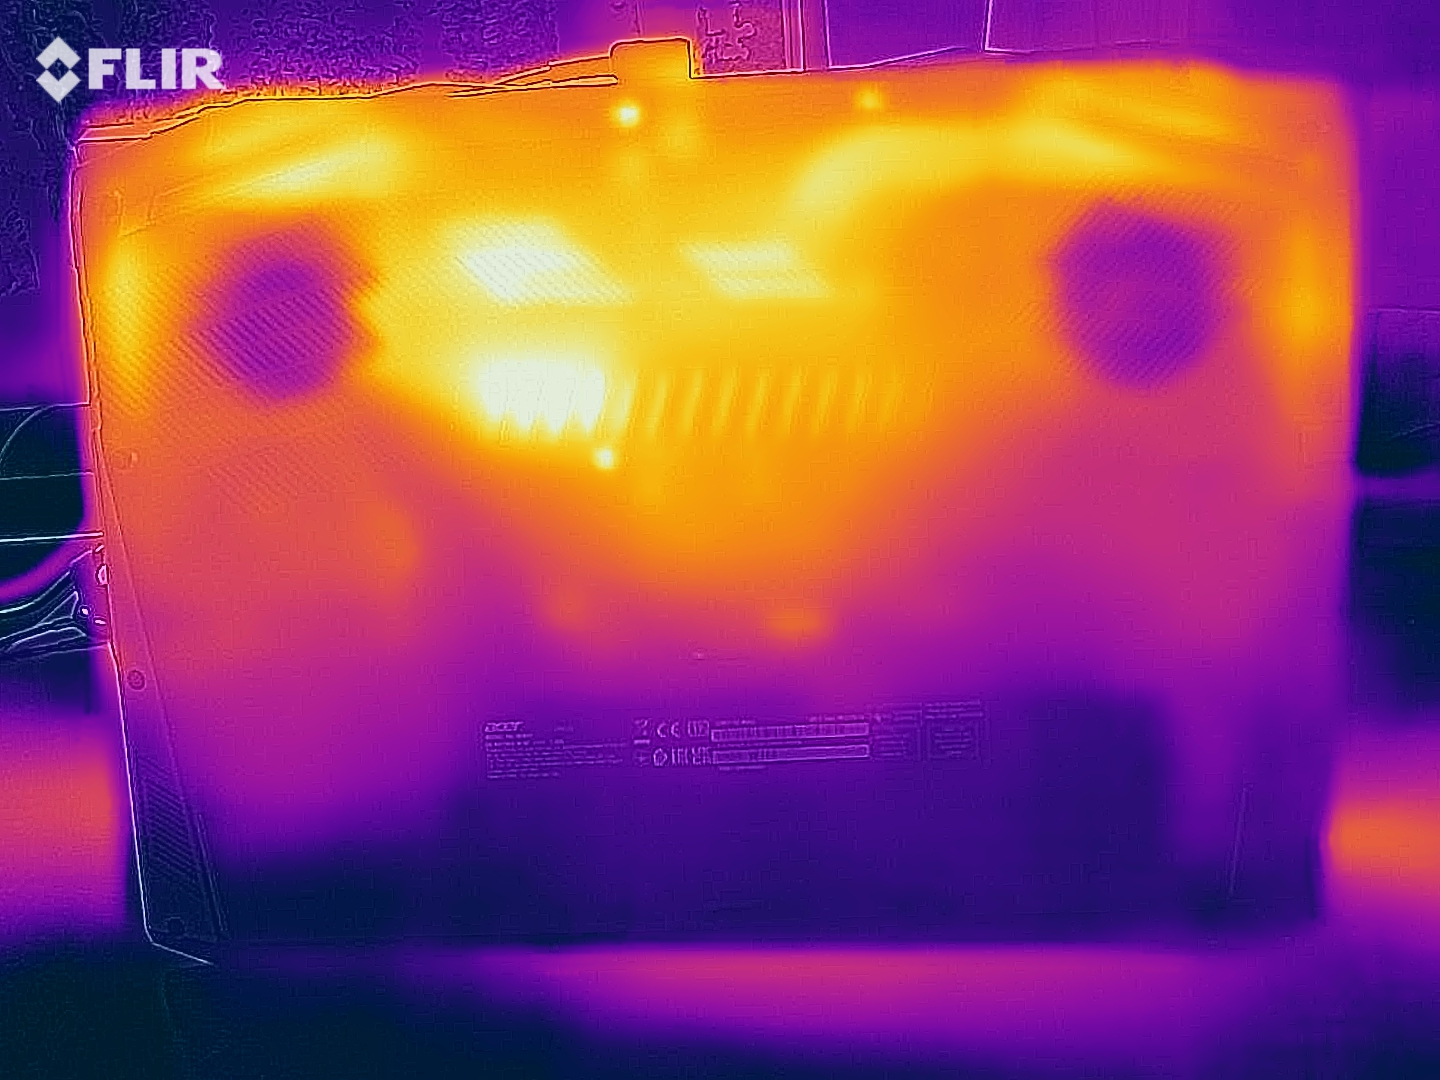
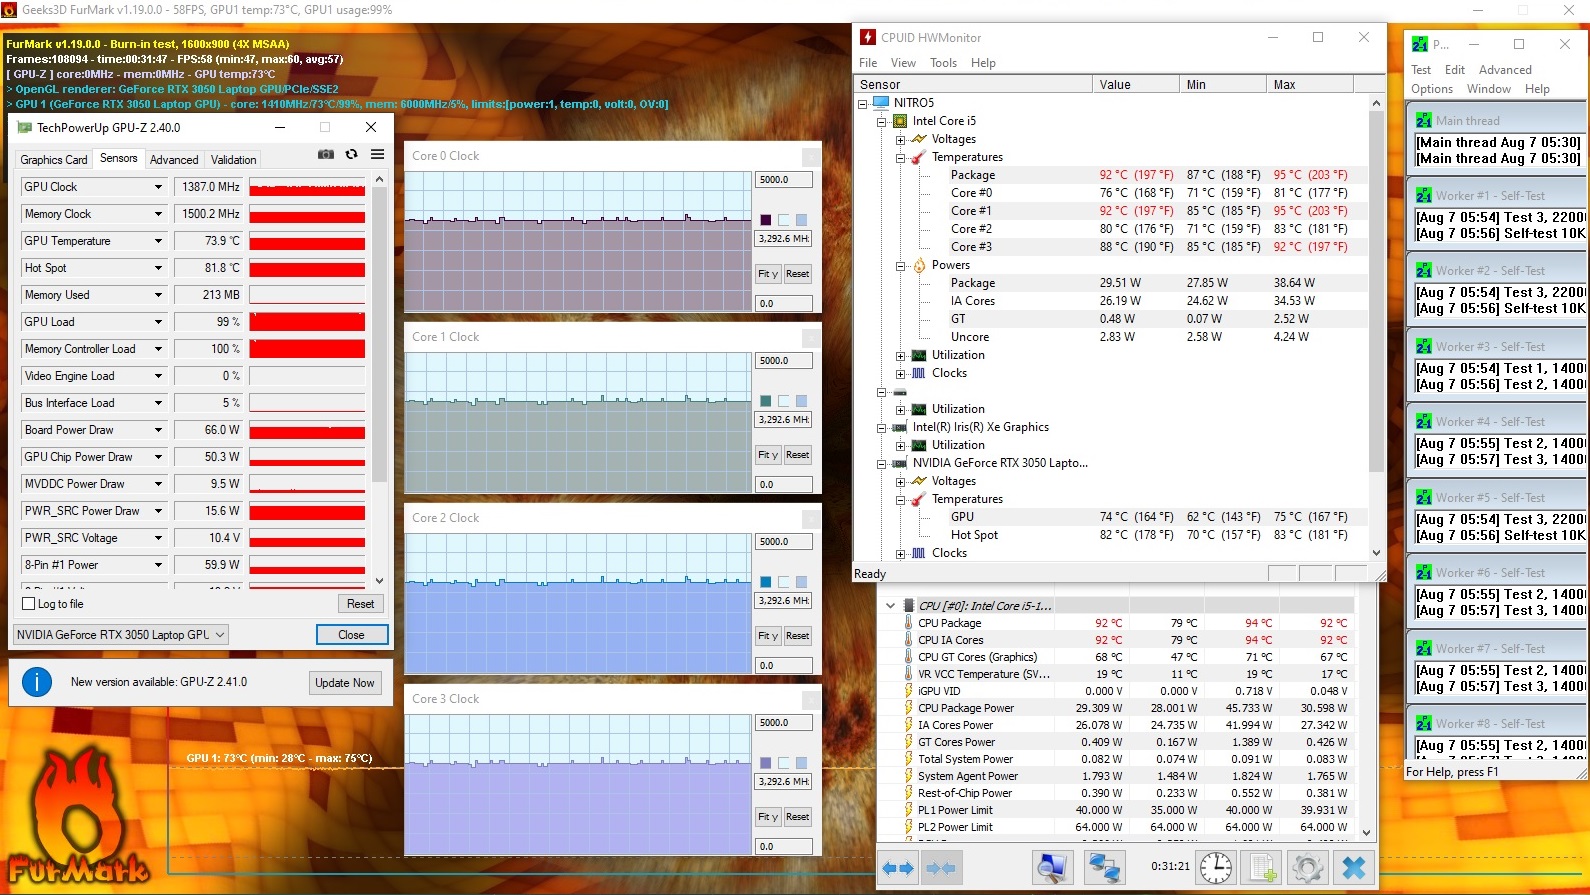
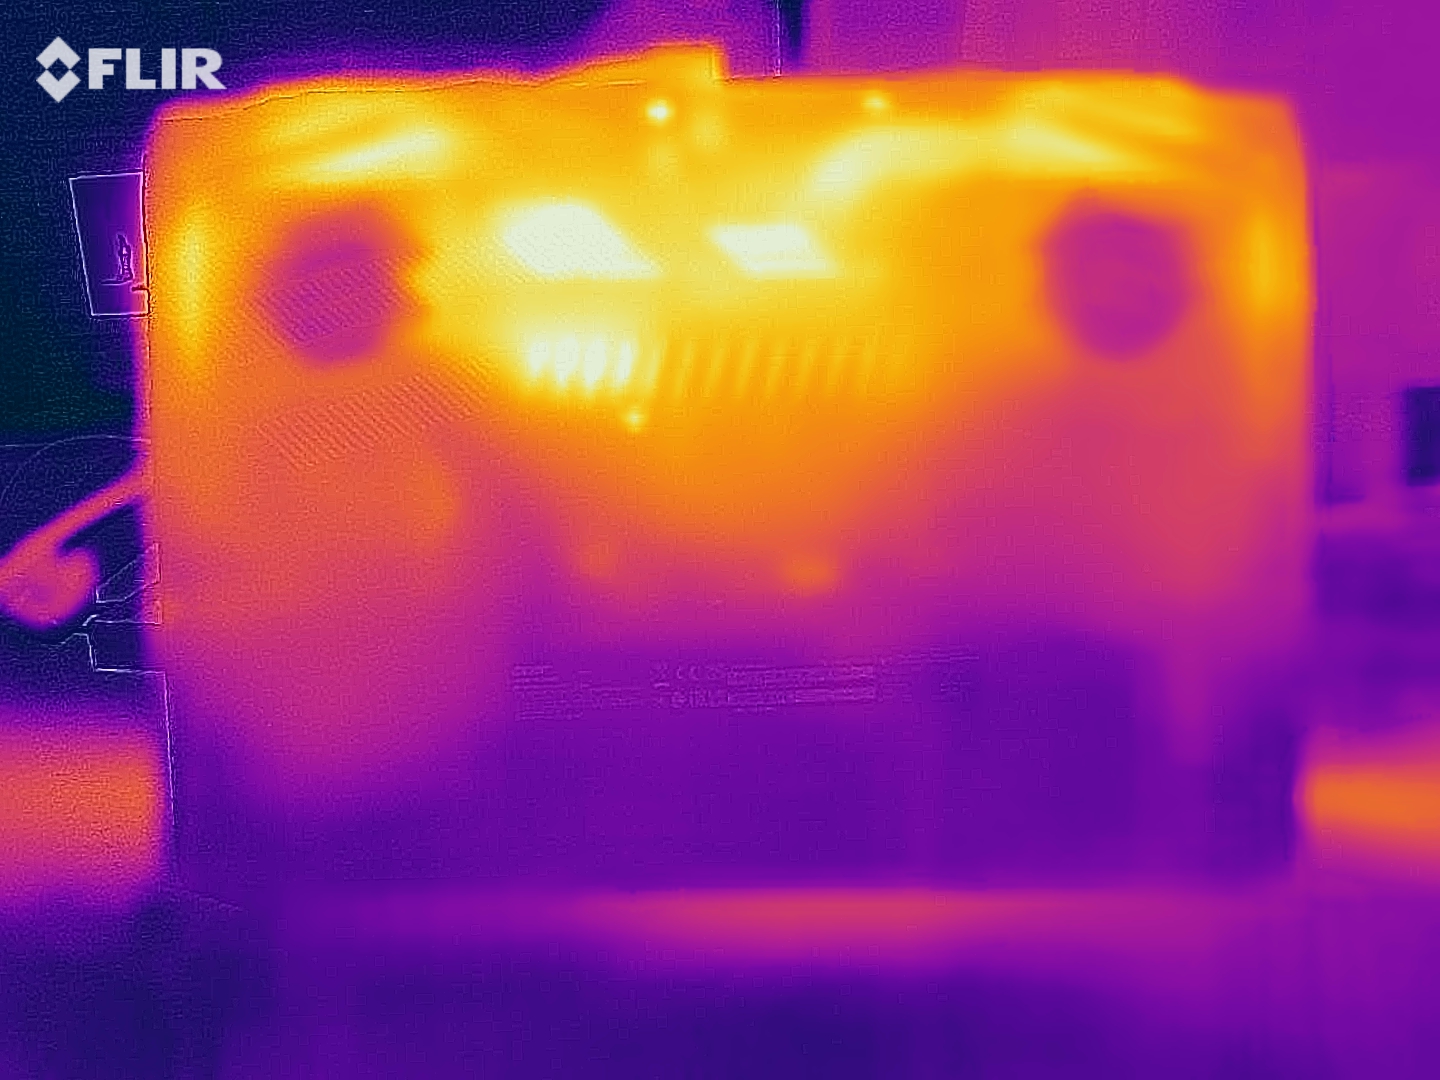
The 17-inch laptop is also quite inconspicuous in terms of temperature development. In view of the offered performance, the ascertained chassis rates are acceptable - at least on the upper side. The underside heated up to 54 °C (129.2 °F) in the stress test and after 60 minutes of The Witcher 3, which is why you should not necessarily place the notebook on your lap while gaming. When the Nitro 5 has nothing to do, the surfaces stay pleasingly cool (less than 30 °C/86 °F). You can see the temperatures of the components (CPU, GPU, etc.) in the screenshots.
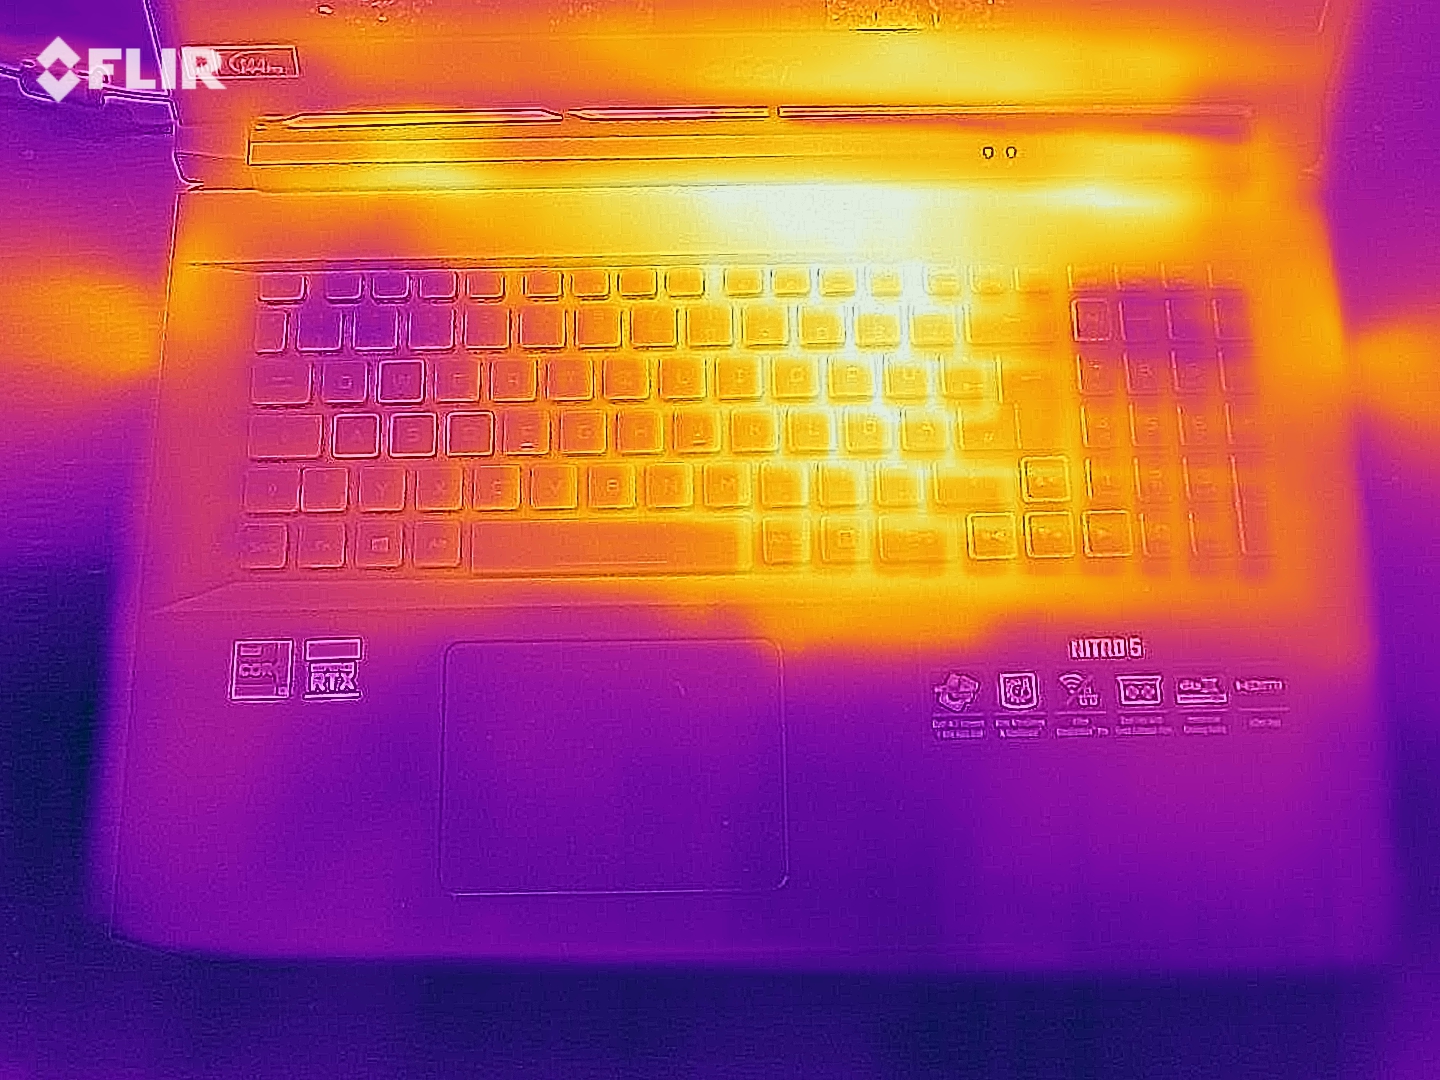
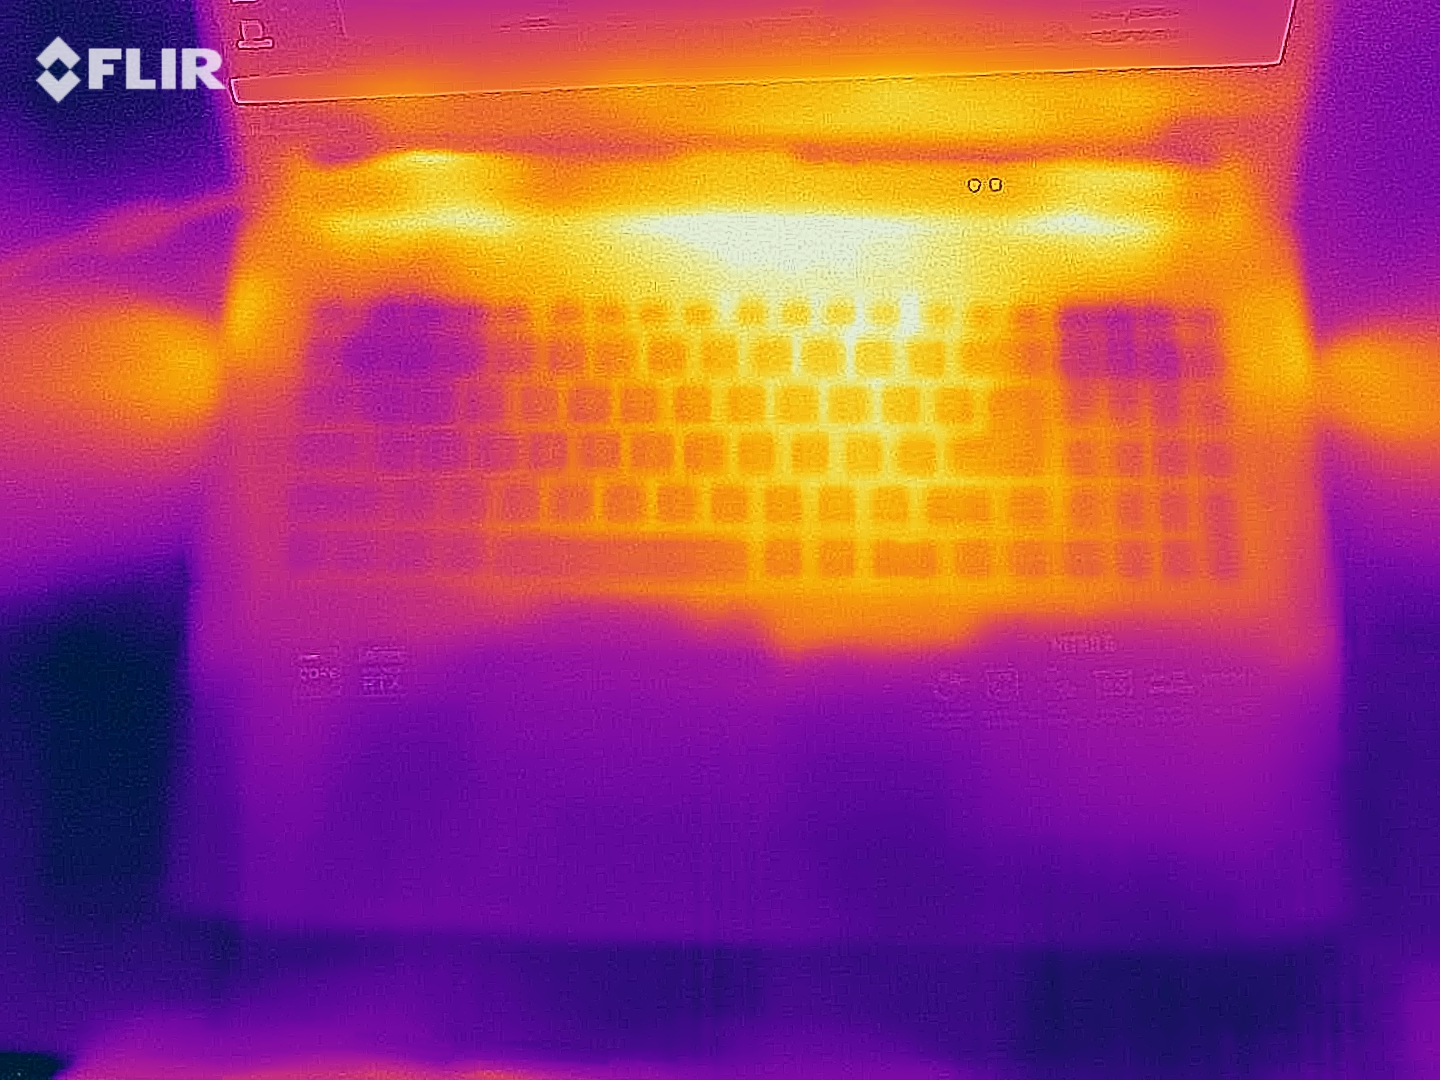
(-) The maximum temperature on the upper side is 47 °C / 117 F, compared to the average of 40.4 °C / 105 F, ranging from 21.2 to 68.8 °C for the class Gaming.
(-) The bottom heats up to a maximum of 54 °C / 129 F, compared to the average of 43.2 °C / 110 F
(+) In idle usage, the average temperature for the upper side is 24.6 °C / 76 F, compared to the device average of 33.9 °C / 93 F.
(-) Playing The Witcher 3, the average temperature for the upper side is 38.7 °C / 102 F, compared to the device average of 33.9 °C / 93 F.
(+) The palmrests and touchpad are reaching skin temperature as a maximum (32 °C / 89.6 F) and are therefore not hot.
(-) The average temperature of the palmrest area of similar devices was 28.8 °C / 83.8 F (-3.2 °C / -5.8 F).
| Acer Nitro 5 AN517-53-54DQ i5-11300H, GeForce RTX 3050 4GB Laptop GPU | HP Omen 15-ek0456ng i5-10300H, GeForce GTX 1660 Ti Mobile | Lenovo Legion 5 17IMH05 i5-10300H, GeForce GTX 1650 Mobile | MSI GF75 Thin 10SCXR i5-10300H, GeForce GTX 1650 Mobile | Asus TUF FX705DT-AU068T R5 3550H, GeForce GTX 1650 Mobile | Average of class Gaming | |
|---|---|---|---|---|---|---|
| Heat | 4% | -10% | -19% | -1% | -12% | |
| Maximum Upper Side * (°C) | 47 | 40.2 14% | 47 -0% | 42 11% | 41.6 11% | 45.2 ? 4% |
| Maximum Bottom * (°C) | 54 | 48.4 10% | 44 19% | 53.4 1% | 38 30% | 48.2 ? 11% |
| Idle Upper Side * (°C) | 25 | 25.6 -2% | 35 -40% | 34.2 -37% | 31.7 -27% | 31 ? -24% |
| Idle Bottom * (°C) | 25 | 26.7 -7% | 30 -20% | 37.4 -50% | 29.5 -18% | 34.3 ? -37% |
* ... smaller is better
Speaker
Acer Nitro 5 AN517-53-54DQ audio analysis
(±) | speaker loudness is average but good (79 dB)
Bass 100 - 315 Hz
(-) | nearly no bass - on average 19.2% lower than median
(±) | linearity of bass is average (10.7% delta to prev. frequency)
Mids 400 - 2000 Hz
(±) | higher mids - on average 5.5% higher than median
(+) | mids are linear (5.6% delta to prev. frequency)
Highs 2 - 16 kHz
(+) | balanced highs - only 2% away from median
(+) | highs are linear (3.6% delta to prev. frequency)
Overall 100 - 16.000 Hz
(±) | linearity of overall sound is average (17.9% difference to median)
Compared to same class
» 54% of all tested devices in this class were better, 9% similar, 37% worse
» The best had a delta of 6%, average was 18%, worst was 132%
Compared to all devices tested
» 37% of all tested devices were better, 8% similar, 55% worse
» The best had a delta of 4%, average was 23%, worst was 134%
HP Omen 15-ek0456ng audio analysis
(-) | not very loud speakers (58.1 dB)
Bass 100 - 315 Hz
(-) | nearly no bass - on average 17.3% lower than median
(±) | linearity of bass is average (13% delta to prev. frequency)
Mids 400 - 2000 Hz
(+) | balanced mids - only 3.4% away from median
(±) | linearity of mids is average (9.7% delta to prev. frequency)
Highs 2 - 16 kHz
(+) | balanced highs - only 3.2% away from median
(+) | highs are linear (5.4% delta to prev. frequency)
Overall 100 - 16.000 Hz
(±) | linearity of overall sound is average (22% difference to median)
Compared to same class
» 79% of all tested devices in this class were better, 6% similar, 15% worse
» The best had a delta of 6%, average was 18%, worst was 132%
Compared to all devices tested
» 64% of all tested devices were better, 6% similar, 30% worse
» The best had a delta of 4%, average was 23%, worst was 134%
Power management - High runtime
Power consumption
Since the notebook offers graphics switching and Acer does not use high-end hardware in the present configuration, the energy consumption is kept within limits with 4 to 15 watts (idle) and 85 to 135 watts (load), respectively. The 135 watt power supply seems to be sufficiently sized.
| Off / Standby | |
| Idle | |
| Load |
|
Key:
min: | |
| Acer Nitro 5 AN517-53-54DQ i5-11300H, GeForce RTX 3050 4GB Laptop GPU | HP Omen 15-ek0456ng i5-10300H, GeForce GTX 1660 Ti Mobile | Lenovo Legion 5 17IMH05 i5-10300H, GeForce GTX 1650 Mobile | MSI GF75 Thin 10SCXR i5-10300H, GeForce GTX 1650 Mobile | Asus TUF FX705DT-AU068T R5 3550H, GeForce GTX 1650 Mobile | Average of class Gaming | |
|---|---|---|---|---|---|---|
| Power Consumption | -49% | 13% | -57% | 17% | -103% | |
| Idle Minimum * (Watt) | 4 | 9.2 -130% | 2 50% | 13 -225% | 3.9 2% | 13 ? -225% |
| Idle Average * (Watt) | 9 | 14.6 -62% | 8 11% | 15.7 -74% | 9.6 -7% | 18.7 ? -108% |
| Idle Maximum * (Watt) | 15 | 18.1 -21% | 16 -7% | 21 -40% | 12.2 19% | 24.3 ? -62% |
| Load Average * (Watt) | 85 | 84 1% | 58 32% | 87 -2% | 59 31% | 110.2 ? -30% |
| Witcher 3 ultra * (Watt) | 104 | 142 -37% | 89 14% | 96.4 7% | ||
| Load Maximum * (Watt) | 135 | 194 -44% | 169 -25% | 145.8 -8% | 80 41% | 258 ? -91% |
* ... smaller is better
Power consumption Witcher 3 / Stresstest
Battery life
One of the biggest highlights of the tested Nitro 5 is the ample battery life. Despite the only mediocre battery capacity of 57 Wh (the competition has 51-80 Wh), the 17-incher lasts over 17 hours under perfect conditions, i.e. minimum display brightness and no load. This value is just as respectable for a gaming laptop as is around 7 hours of Internet surfing via WLAN with medium display brightness.
| Acer Nitro 5 AN517-53-54DQ i5-11300H, GeForce RTX 3050 4GB Laptop GPU, 57 Wh | HP Omen 15-ek0456ng i5-10300H, GeForce GTX 1660 Ti Mobile, 70.91 Wh | Lenovo Legion 5 17IMH05 i5-10300H, GeForce GTX 1650 Mobile, 80 Wh | MSI GF75 Thin 10SCXR i5-10300H, GeForce GTX 1650 Mobile, 51 Wh | Asus TUF FX705DT-AU068T R5 3550H, GeForce GTX 1650 Mobile, 64 Wh | Average of class Gaming | |
|---|---|---|---|---|---|---|
| Battery runtime | -7% | 38% | -37% | 12% | -15% | |
| Reader / Idle (h) | 17.4 | 11.7 -33% | 23.3 34% | 7.7 -56% | 13.6 -22% | 8.71 ? -50% |
| WiFi v1.3 (h) | 7.2 | 6.5 -10% | 11.4 58% | 4.7 -35% | 7.8 8% | 7.15 ? -1% |
| Load (h) | 1.4 | 1.7 21% | 1.7 21% | 1.1 -21% | 2.1 50% | 1.502 ? 7% |
| H.264 (h) | 6.4 | 14.3 | 8.1 | 8.64 ? |
Pros
Cons
Verdict - Good overall performance


The Acer Nitro 5 AN517-53-54DQ is a good choice for price-conscious gamers who want to spend a maximum of 1,000 Euros (~$1180) on a gaming notebook.
The 17-inch device offers - apart from the somewhat unfortunate memory configuration (single-channel, single-rank) - a balanced hardware mix that can render most current games smoothly in high to maximum details, as long as you use the native resolution of 1,920 x 1,080.
The Core i5-11300H and the GeForce RTX 3050 laptop GPU form a successful and price-performance appealing team.
The display leaves rather mixed feelings. On the one hand, the contrast and black value are pleasing, on the other hand, the color space and brightness could be much better. The other aspects (ports, case quality, input devices, etc.) hardly stand out from the crowd and are mostly in the midfield. One of the few unique selling points is the generous battery life of about 7 hours during Internet surfing.
Current counterparts based on RTX-3050 or 3050-Ti are rather rare or hardly available, not least because of the still prevailing chip shortage, but they should become more and more common in the coming weeks and months.
Price and availability
The Acer Nitro 5 AN517-53-54DQ is currently available for 999 Euros (~$1179) at notebooksbilliger.de.
Acer Nitro 5 AN517-53-54DQ
- 08/11/2021 v7 (old)
Florian Glaser
Price comparison

