10th gen Core i5 Comet Lake-H Debut: MSI GF75 Thin 10SCXR Laptop Review
MSI has been slowly rolling out its lineup of refreshed G Series laptops sporting Intel's 10th gen Comet Lake-H CPUs all month long. The GS75 with the Core i9-10980HK, for example, is shipping later this month. The budget GF75 Thin 10SCXR is on the other end of the spectrum with its Core i5-10300H CPU designed to replace last year's GF75 Thin 9SC and its Core i5-9300H.
The configuration for this review comes equipped with the aforementioned 10th gen Core i5 CPU, 1080p 120 Hz display, 512 GB PCIe SSD, and just 8 GB of single-channel RAM for a retail price of just under $800 USD. It's one of the least expensive laptops available with a Comet Lake-H CPU which makes it a perfect starting point for comparisons against other budget laptops like the HP Pavilion 17 Gaming, Acer Aspire Nitro 5, and the Lenovo IdeaPad L340.
More MSI reviews:
Rating | Date | Model | Weight | Height | Size | Resolution | Price |
|---|---|---|---|---|---|---|---|
| 78.5 % v7 (old) | 04 / 2020 | MSI GF75 Thin 10SCXR i5-10300H, GeForce GTX 1650 Mobile | 2.2 kg | 23.1 mm | 17.30" | 1920x1080 | |
| 84.3 % v6 (old) | 08 / 2019 | Acer Aspire Nitro 5 AN517-51-7887 i7-9750H, GeForce GTX 1660 Ti Mobile | 2.8 kg | 26.9 mm | 17.30" | 1920x1080 | |
| 85.1 % v6 (old) | 06 / 2019 | MSI GP75 Leopard 9SD i7-9750H, GeForce GTX 1660 Ti Mobile | 2.6 kg | 29 mm | 17.30" | 1920x1080 | |
| 77.9 % v7 (old) | 09 / 2019 | Lenovo Ideapad L340-17IRH 81LL001YGE i5-9300H, GeForce GTX 1650 Mobile | 2.5 kg | 25.3 mm | 17.30" | 1920x1080 | |
| 81.6 % v7 (old) | 07 / 2019 | HP Pavilion Gaming 17-cd0085cl i7-9750H, GeForce GTX 1660 Ti Max-Q | 2.8 kg | 25 mm | 17.30" | 1920x1080 |
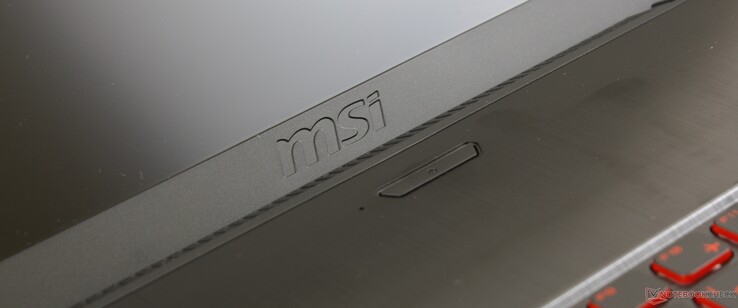
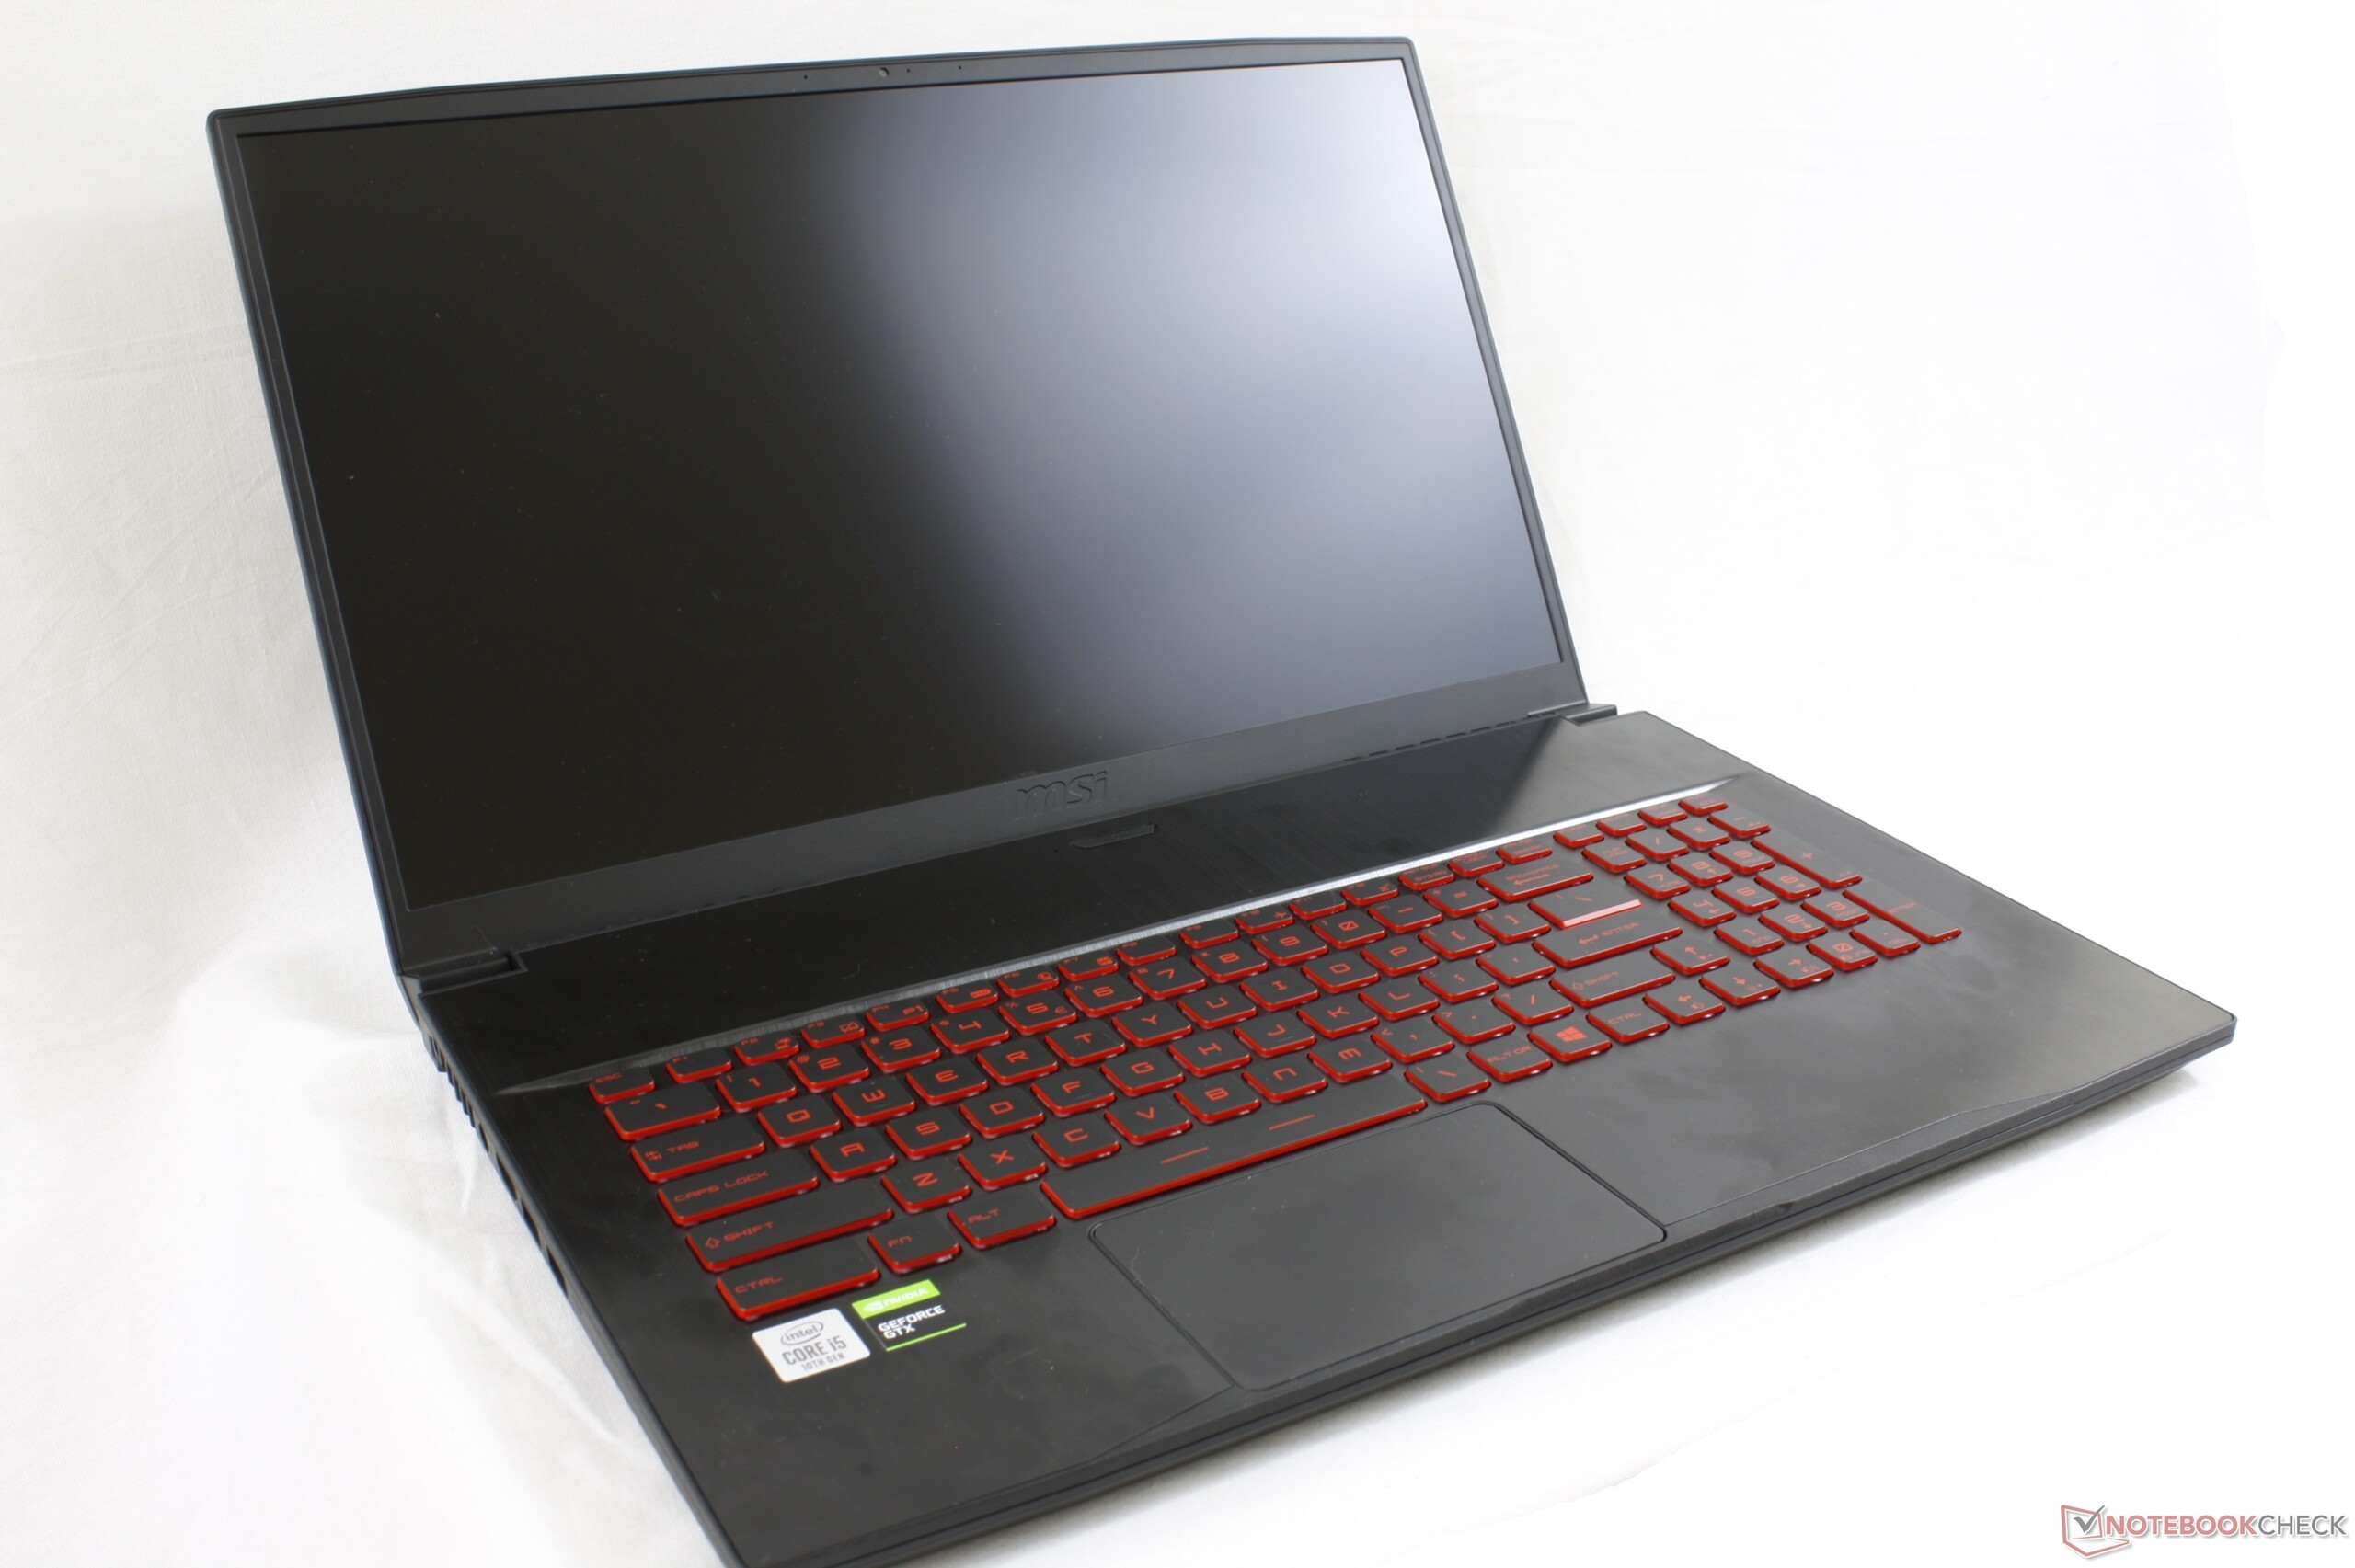
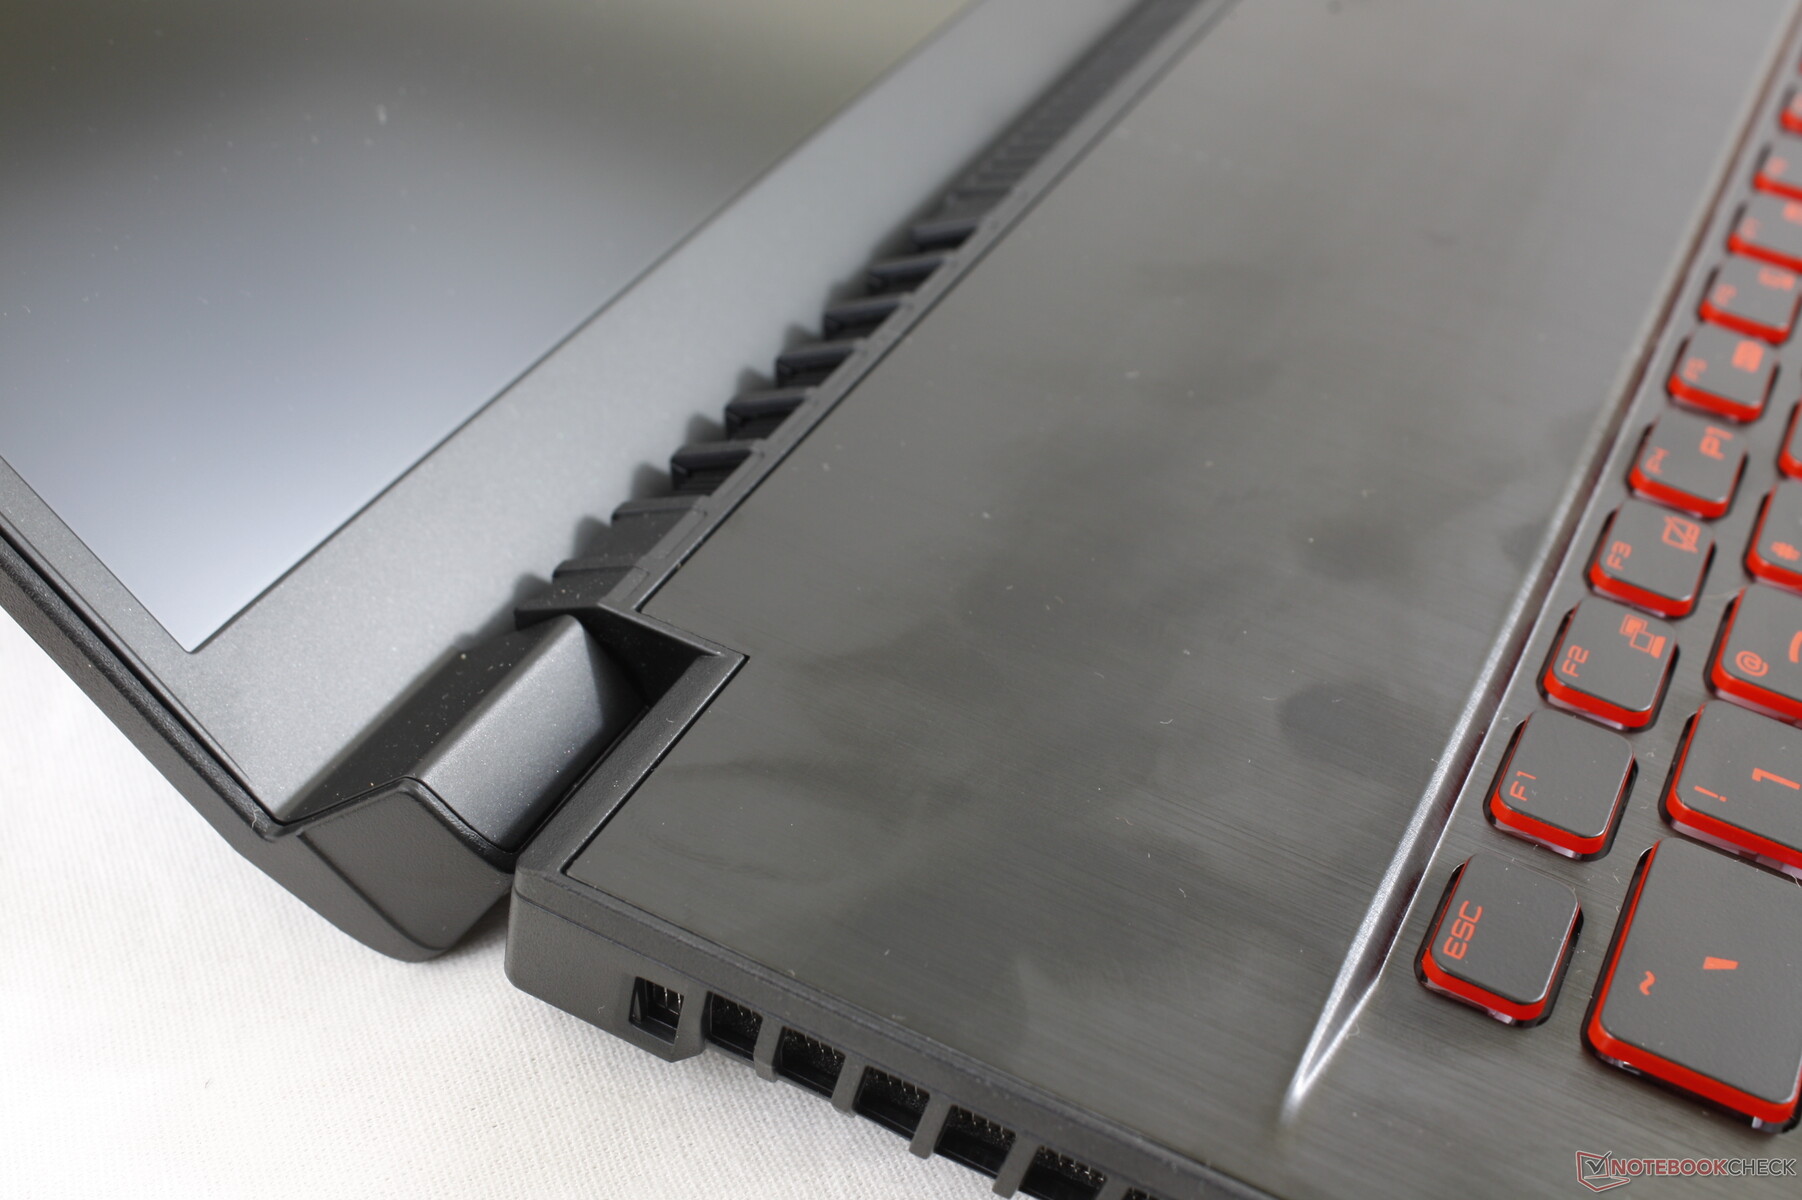
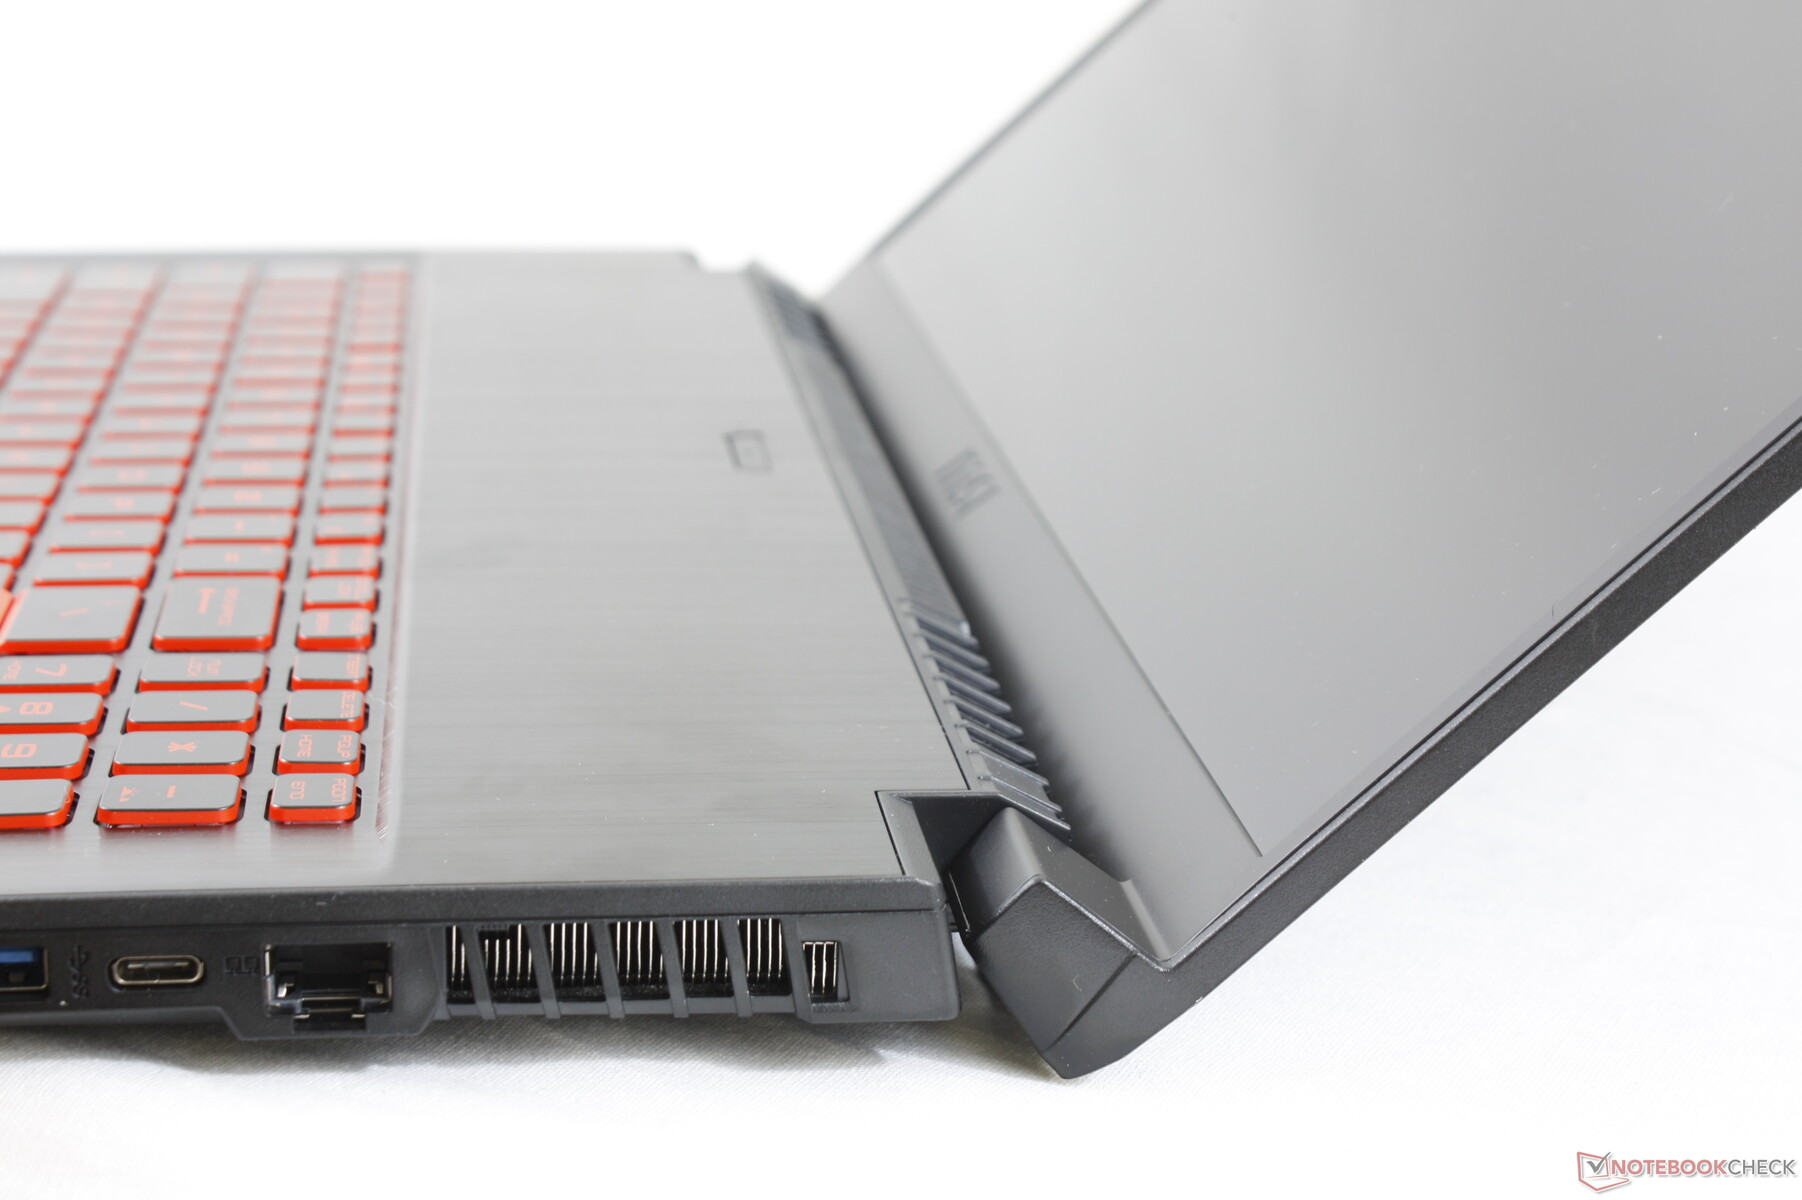
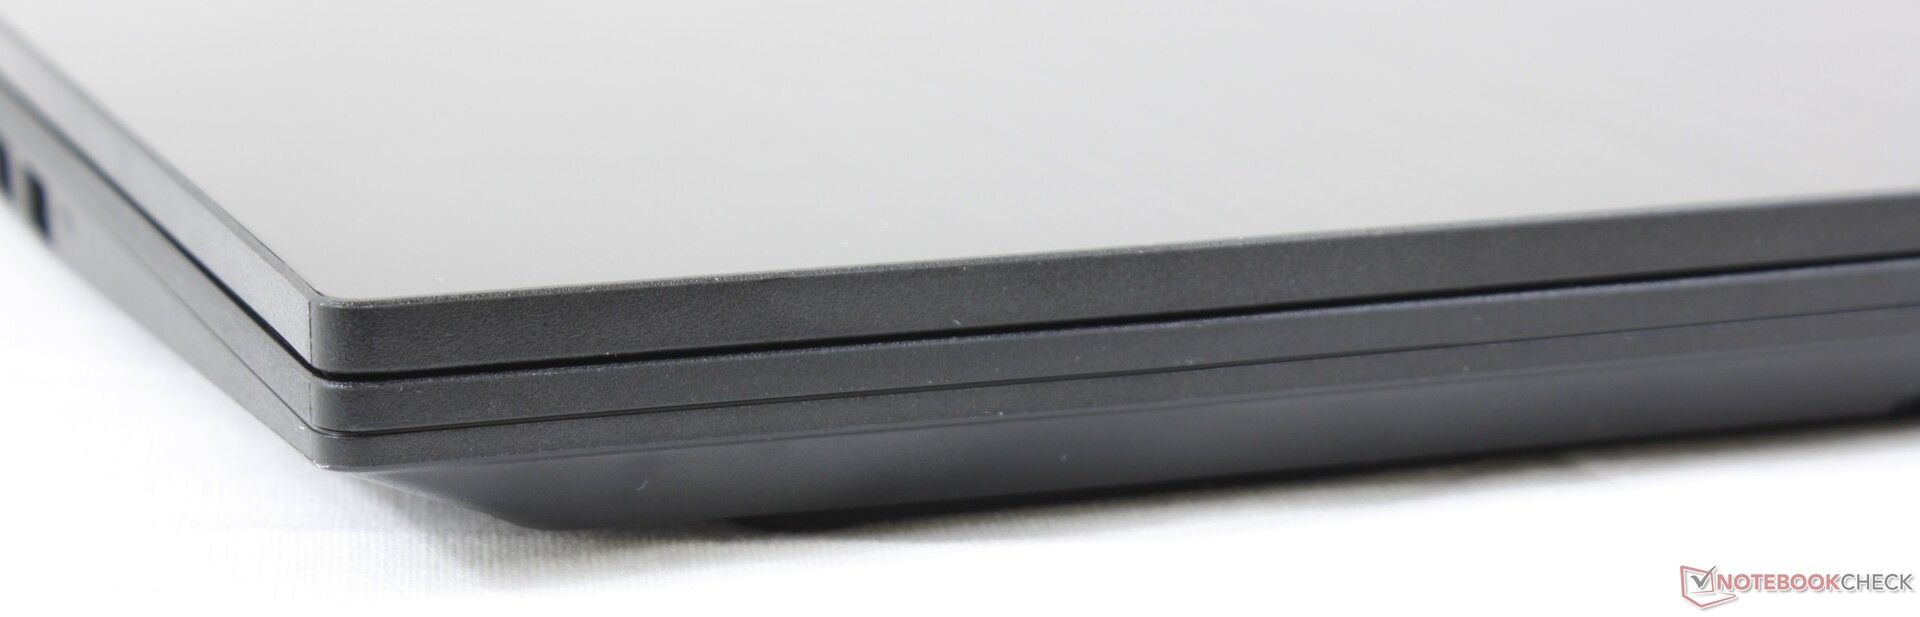
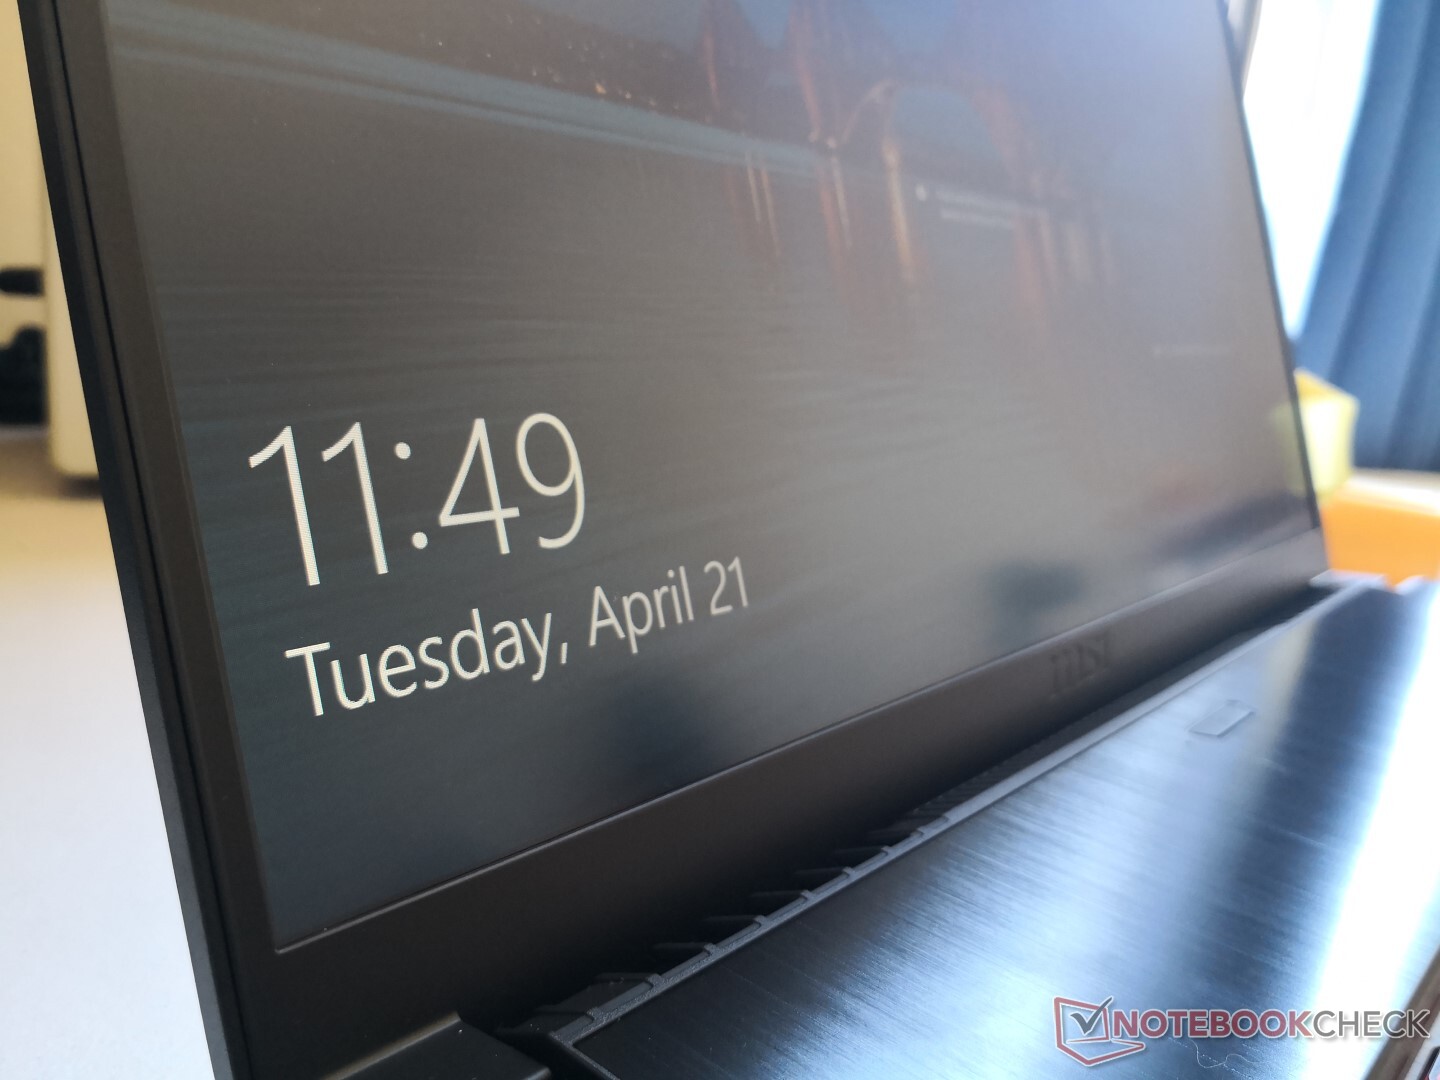
Case
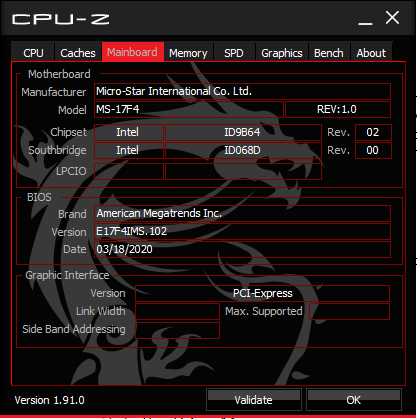
The chassis remains identical to last year's GF75 9SC and so our existing comments apply here. The most notable features of the design are the narrow bezels and low weight to replace the much older and thicker GF72 series.
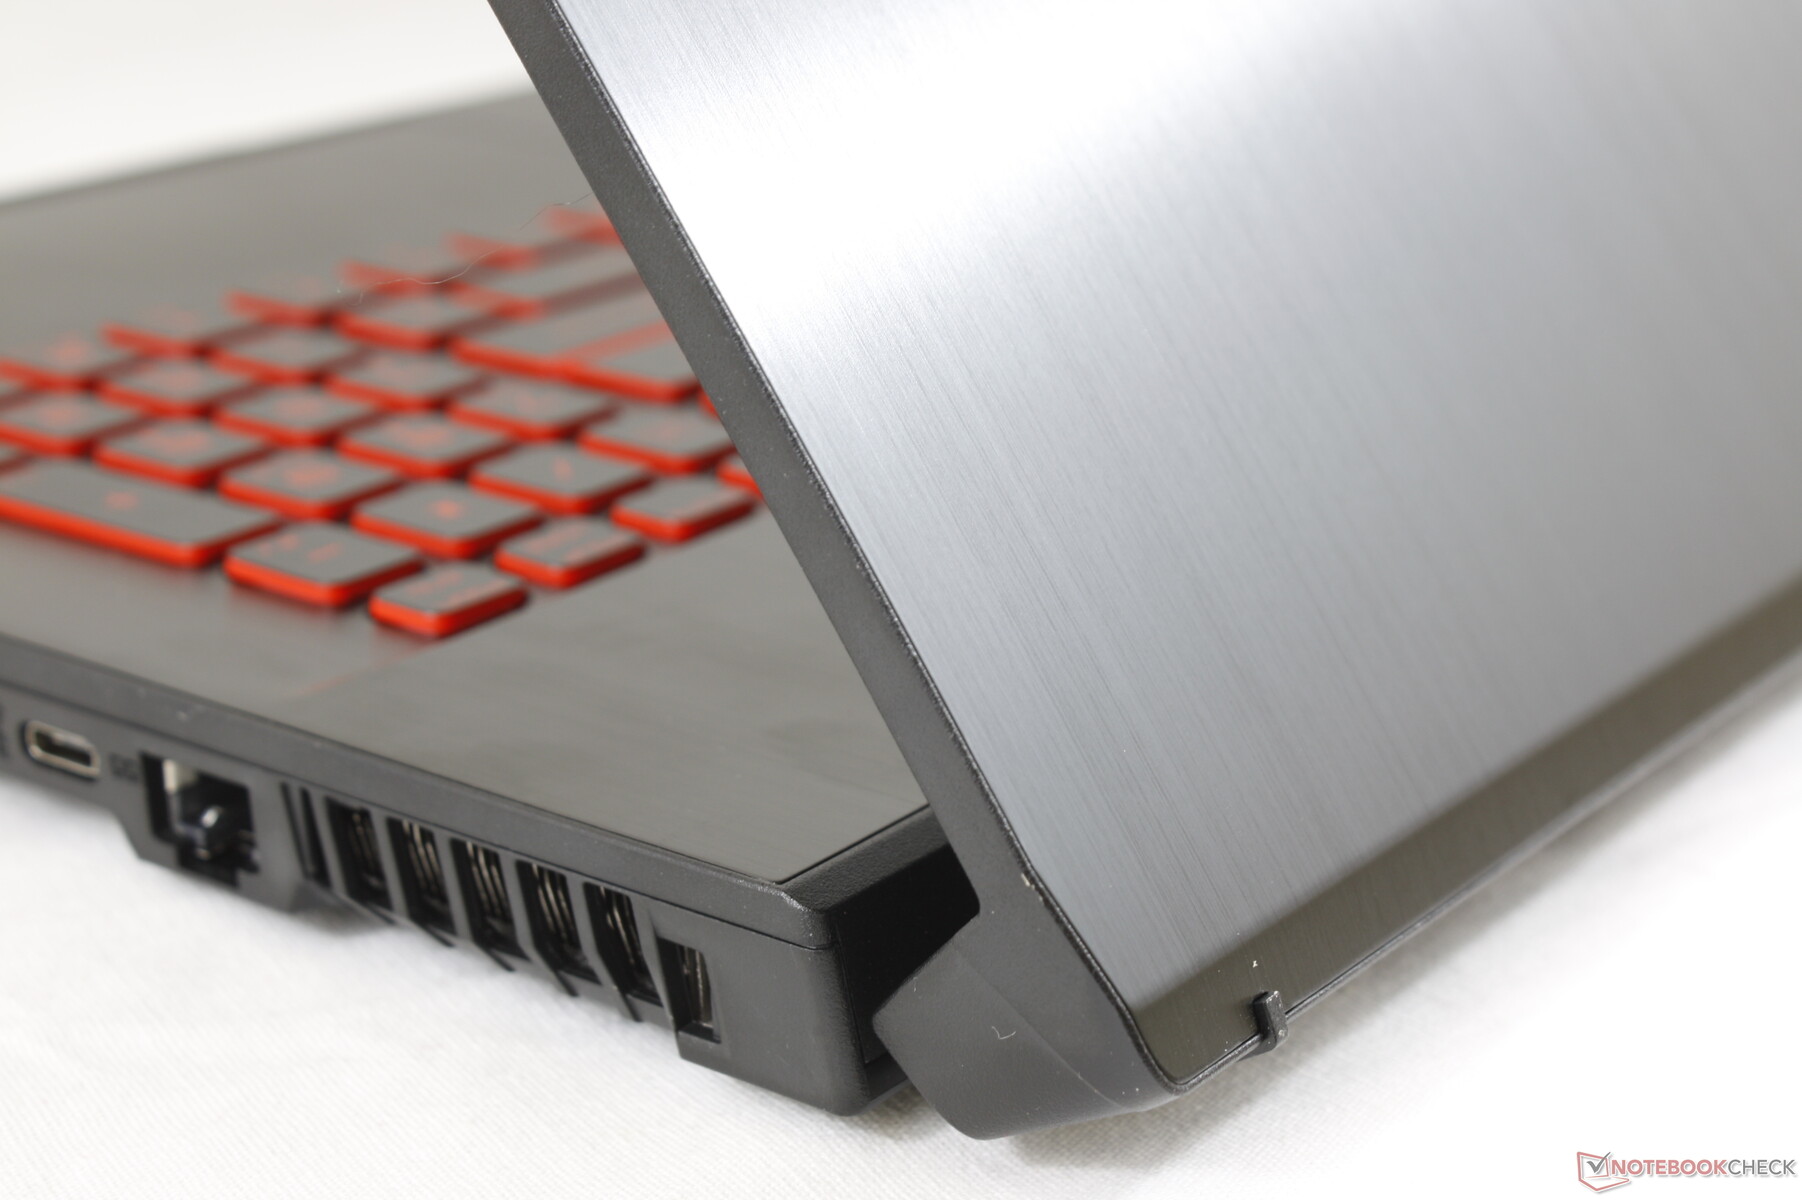
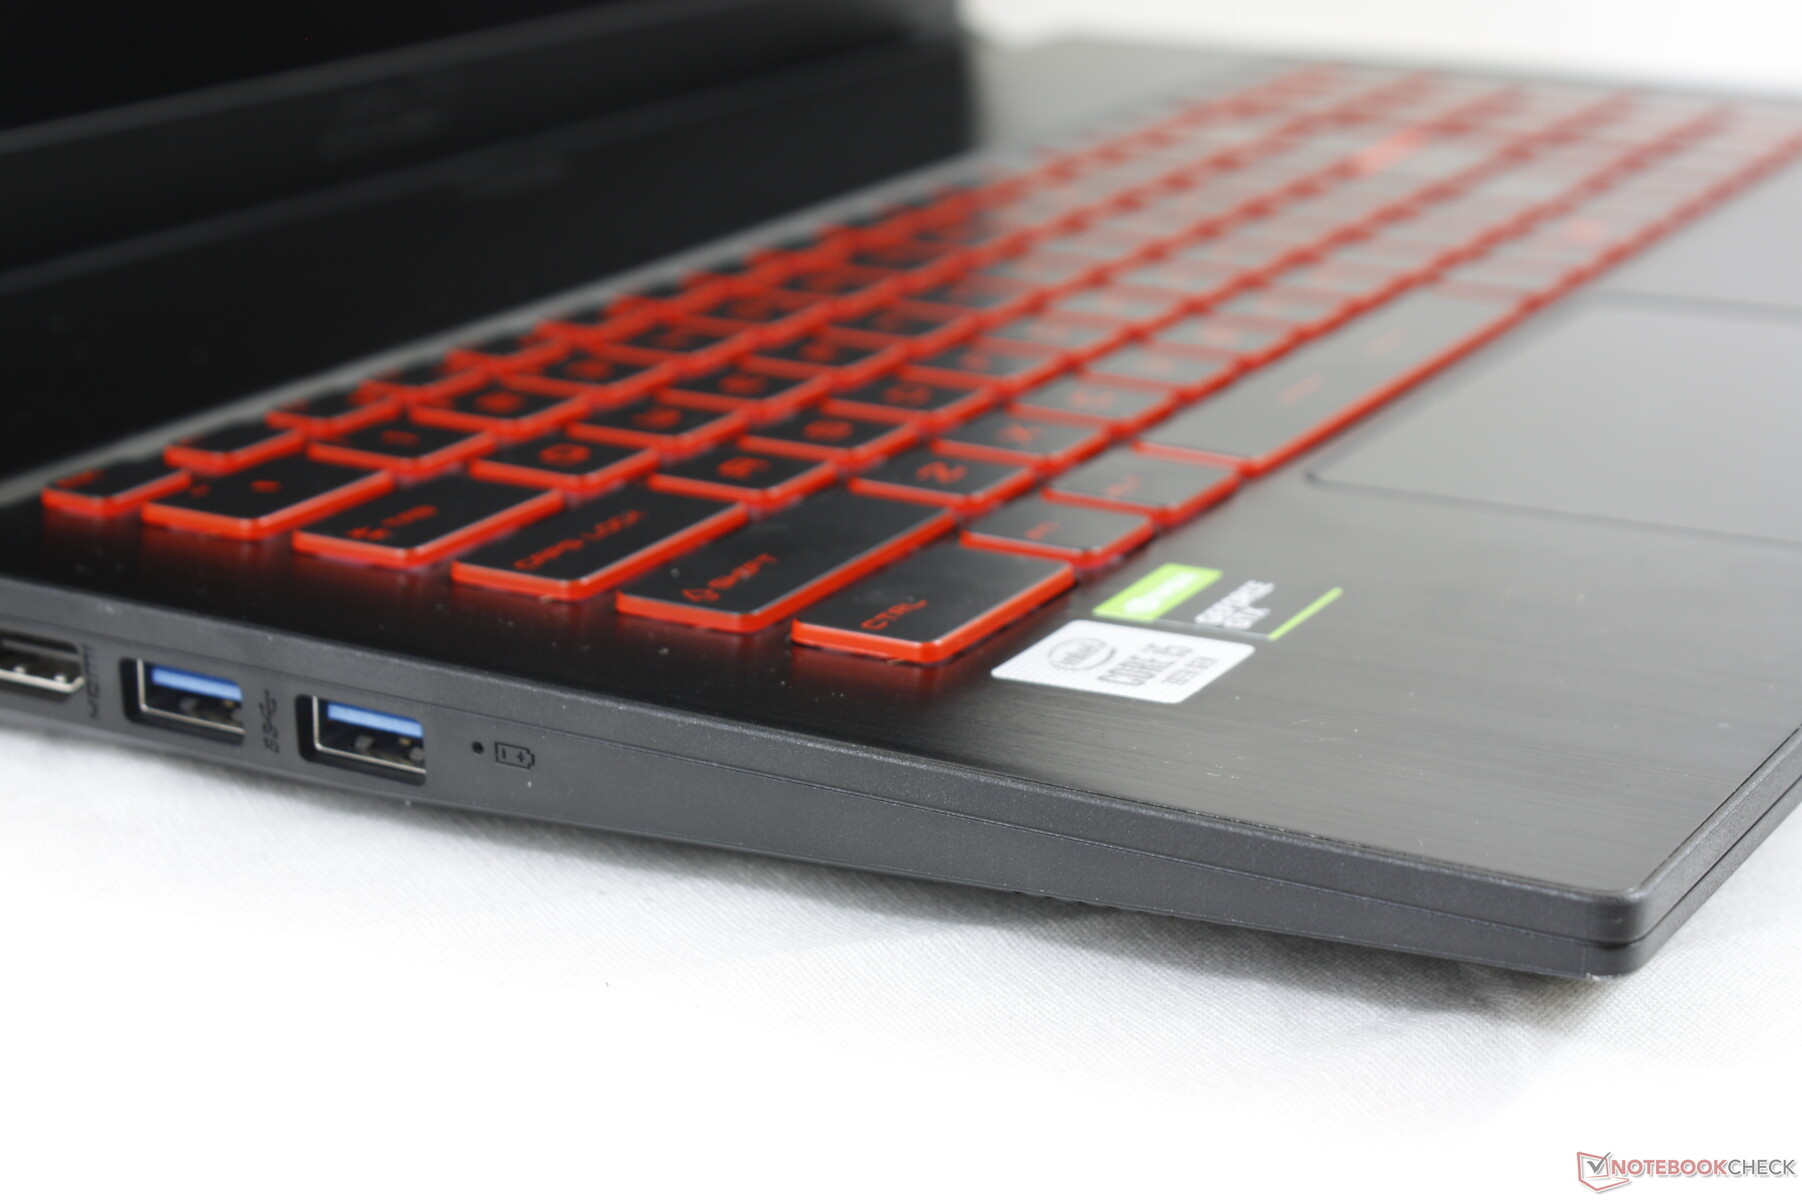
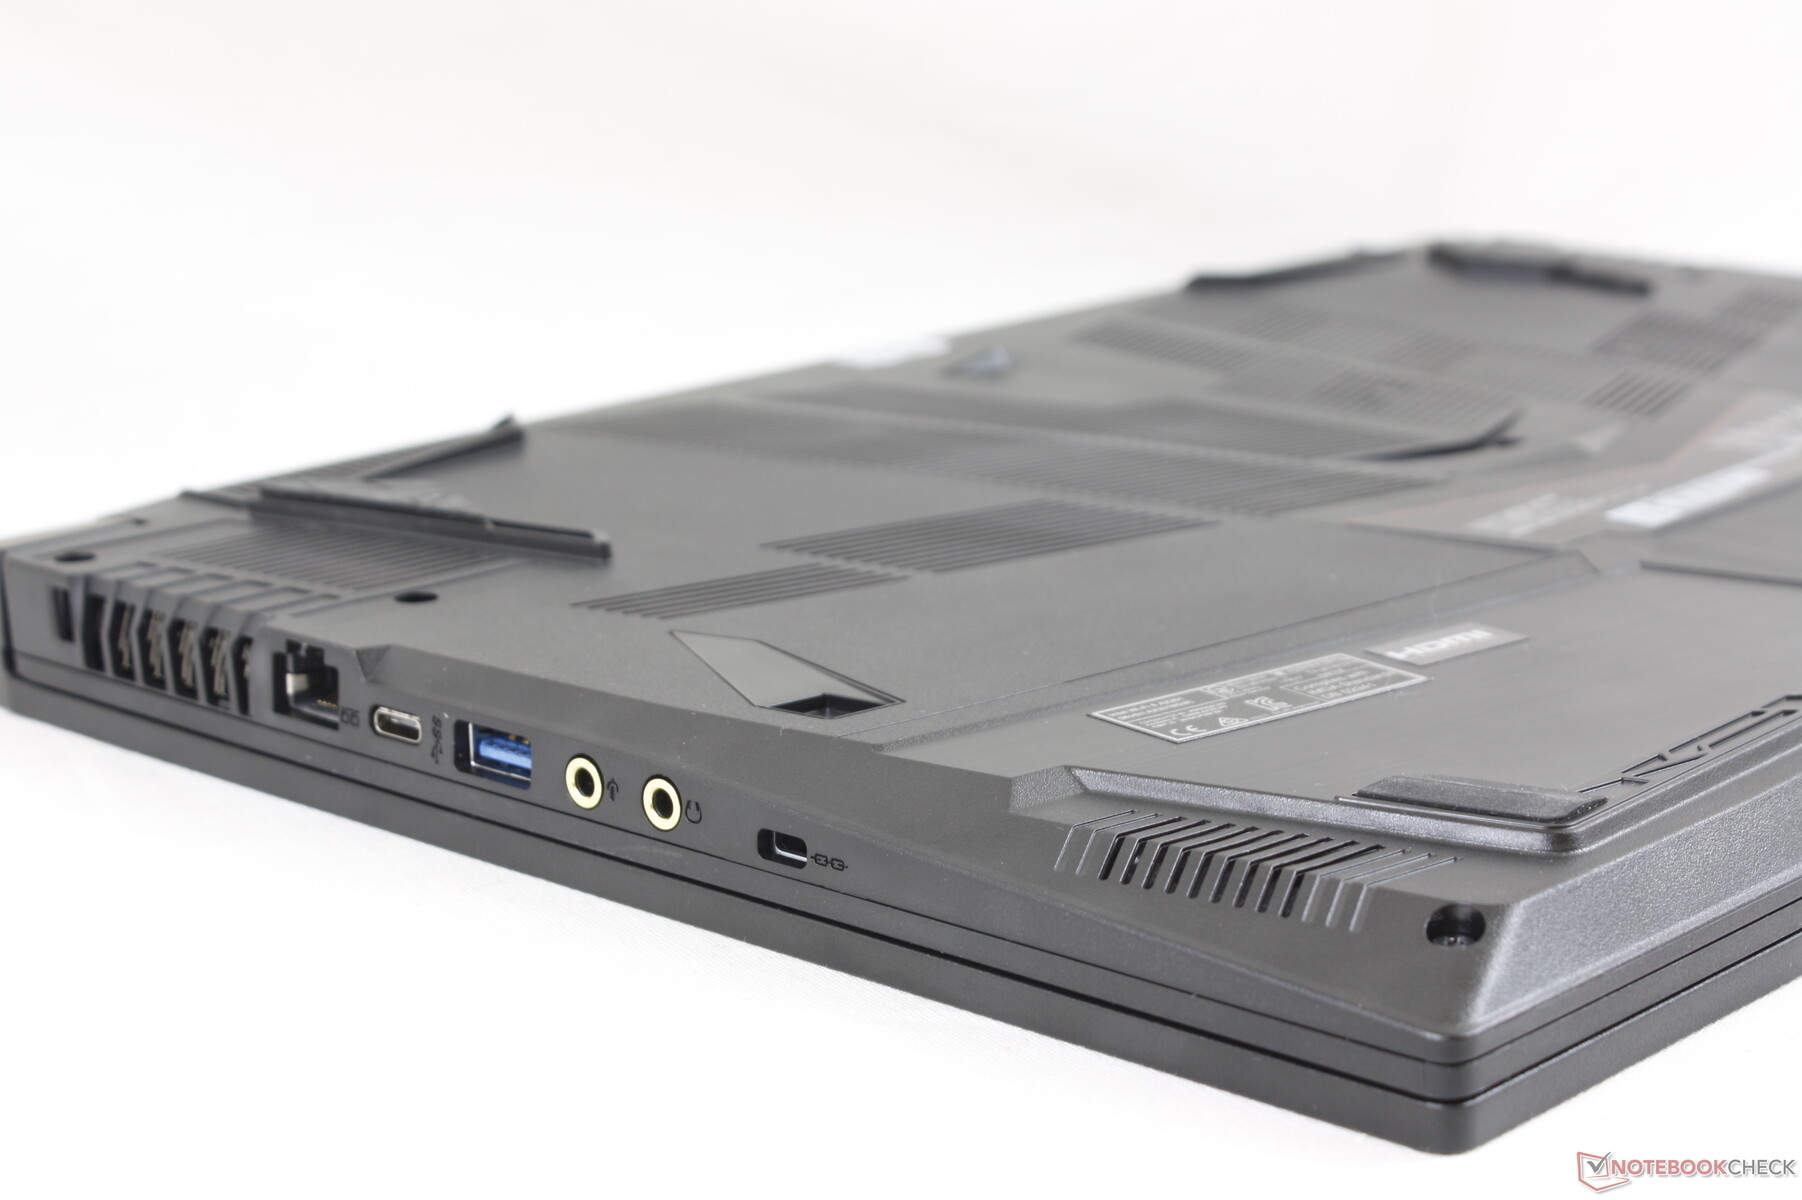
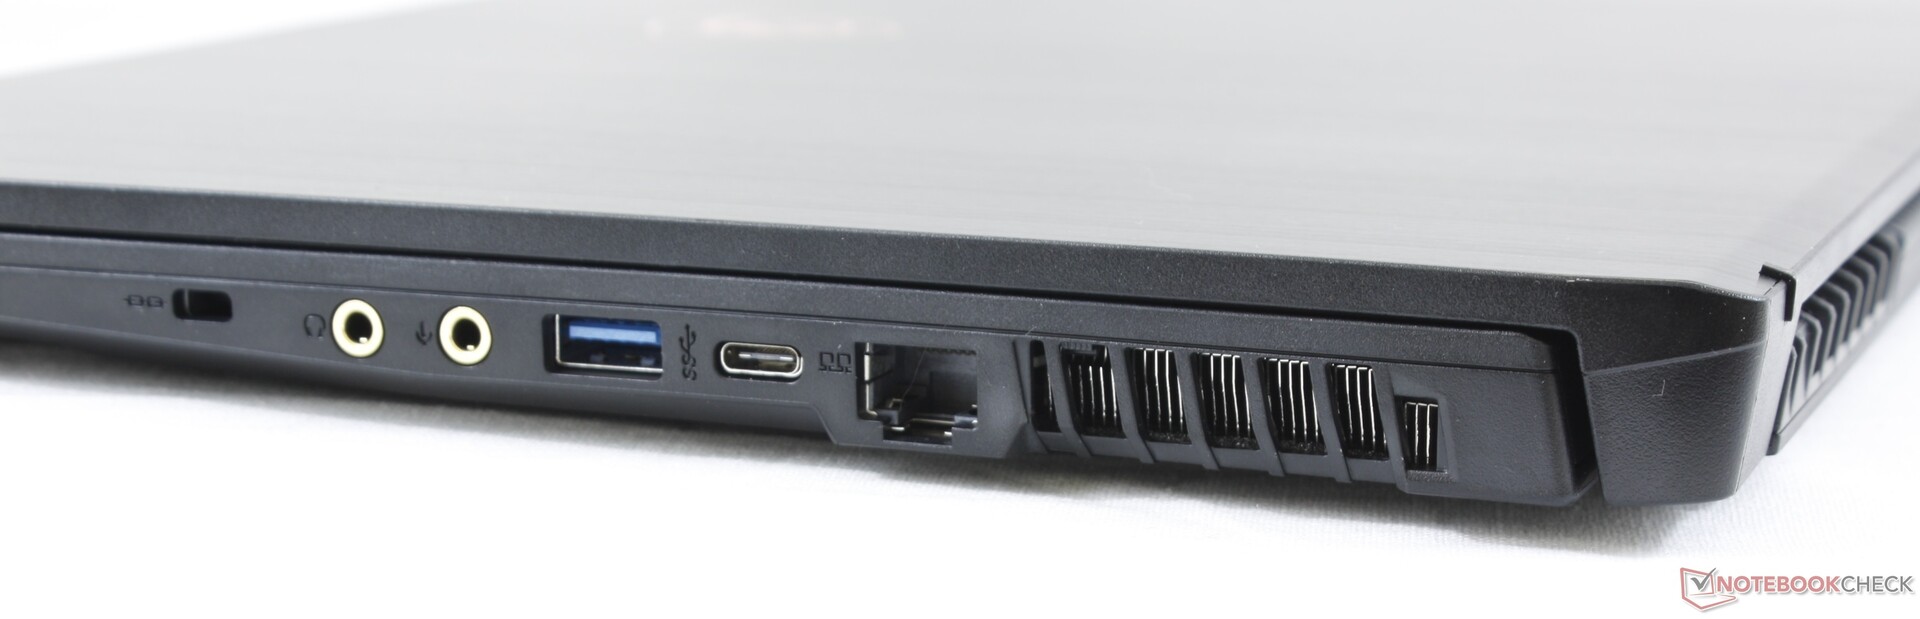
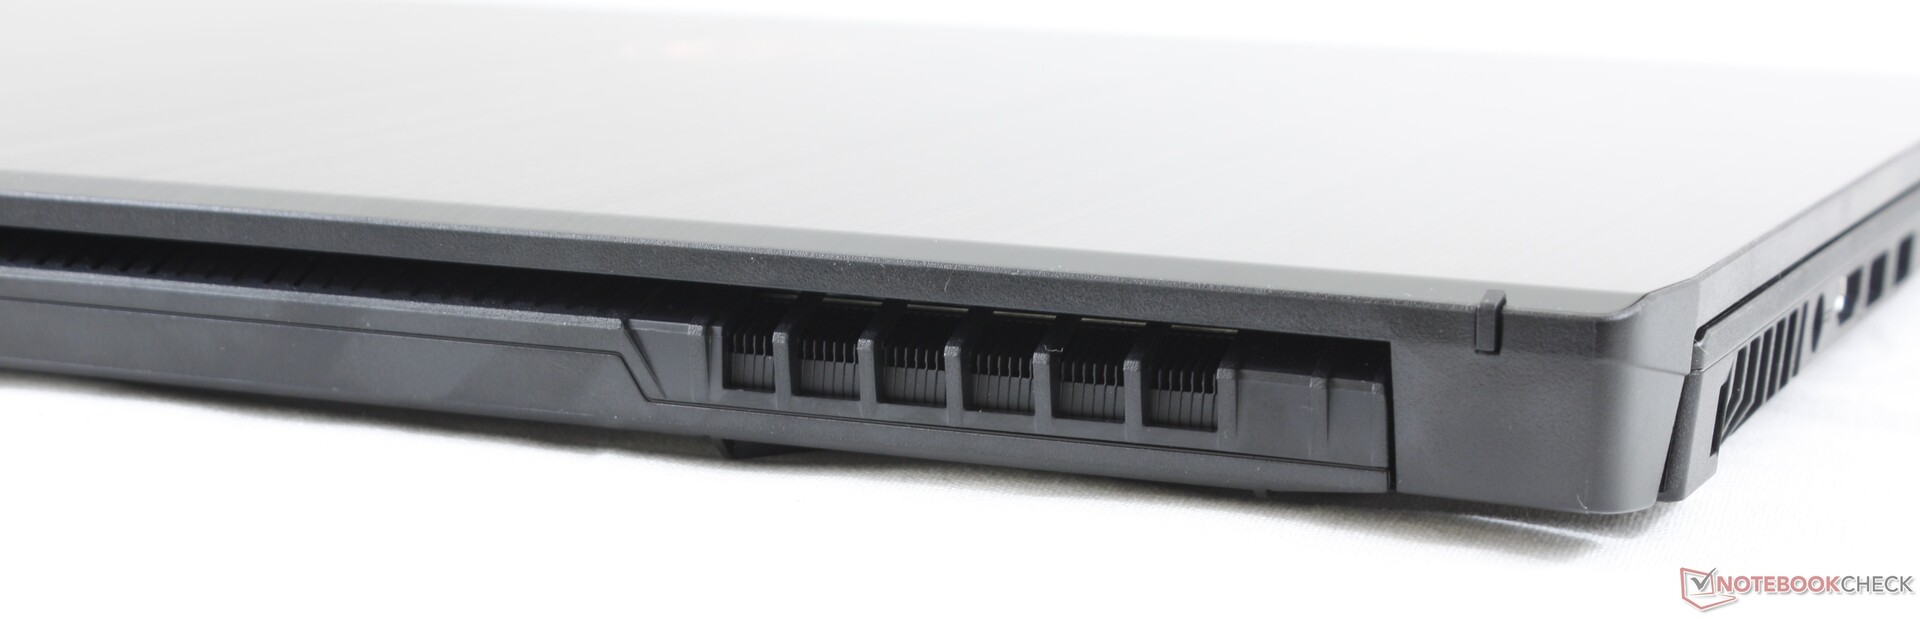
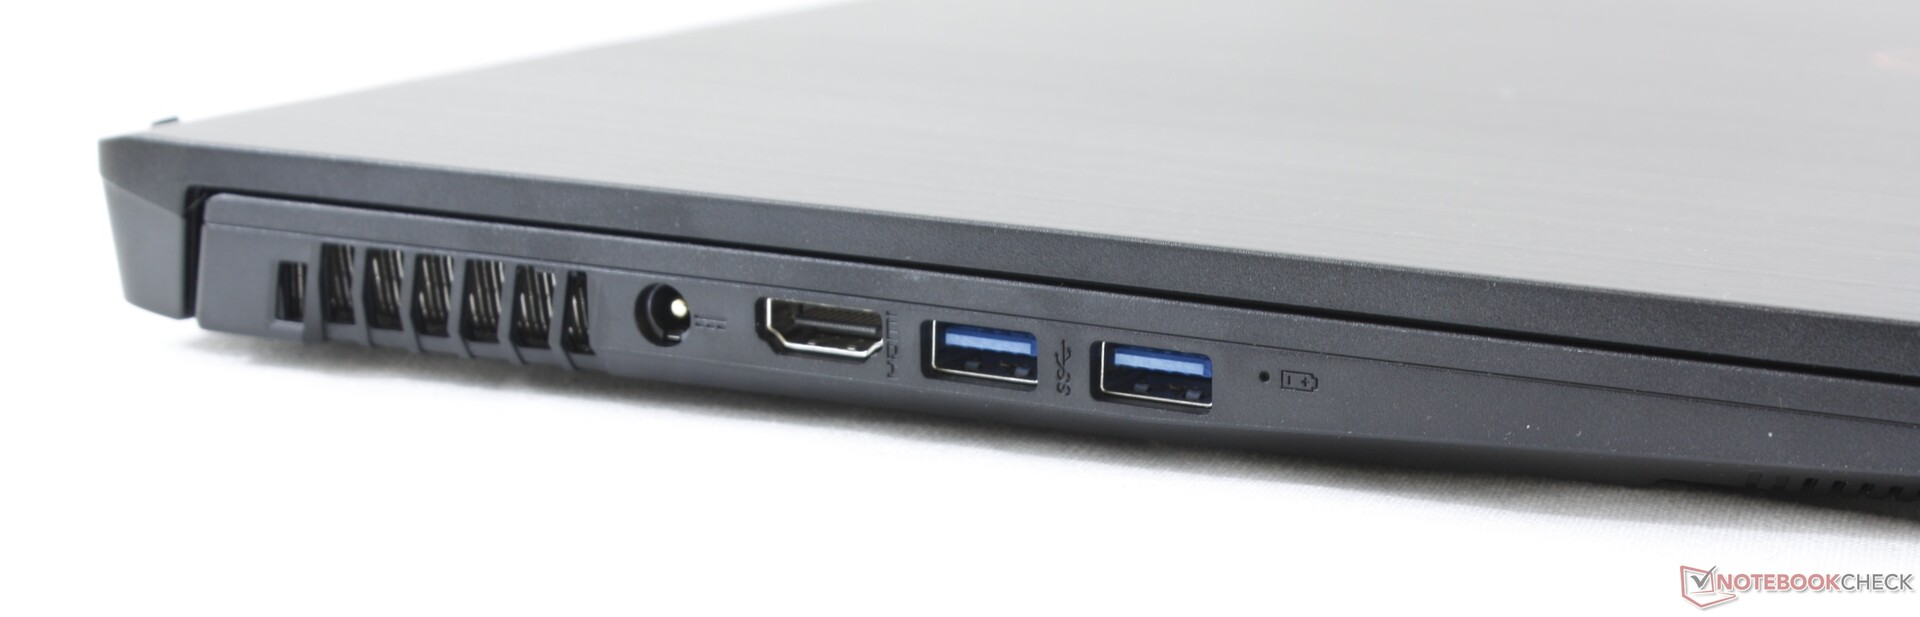
Connectivity
Port options are nearly identical to the Acer Aspire Nitro 5 AN517 and Asus ROG Strix G GL731GU. The major differences are the separated 3.5 mm ports on the MSI for headphones and mic and the lack of DisplayPort over USB. All ports are easy to reach at the cost of being tightly packed together. More expensive 17.3-inch MSI laptops like the GS75 or GT75 come with Thunderbolt 3 compatibility.
Communication
Wireless is provided by the removable Intel AX201 for 802.11ax connectivity and Bluetooth 5. We experienced no connectivity issues when paired with our Netgear RAX200 Wi-Fi 6 router, but transfer rates could have been steadier as shown by our graph below.
| Networking | |
| iperf3 transmit AX12 | |
| Asus Zephyrus G14 GA401IV | |
| Lenovo ThinkPad X1 Carbon G7 20R1-000YUS | |
| MSI GF75 Thin 10SCXR | |
| LG Gram 14T90N | |
| iperf3 receive AX12 | |
| MSI GF75 Thin 10SCXR | |
| Asus Zephyrus G14 GA401IV | |
| Lenovo ThinkPad X1 Carbon G7 20R1-000YUS | |
| LG Gram 14T90N | |
Webcam


Maintenance
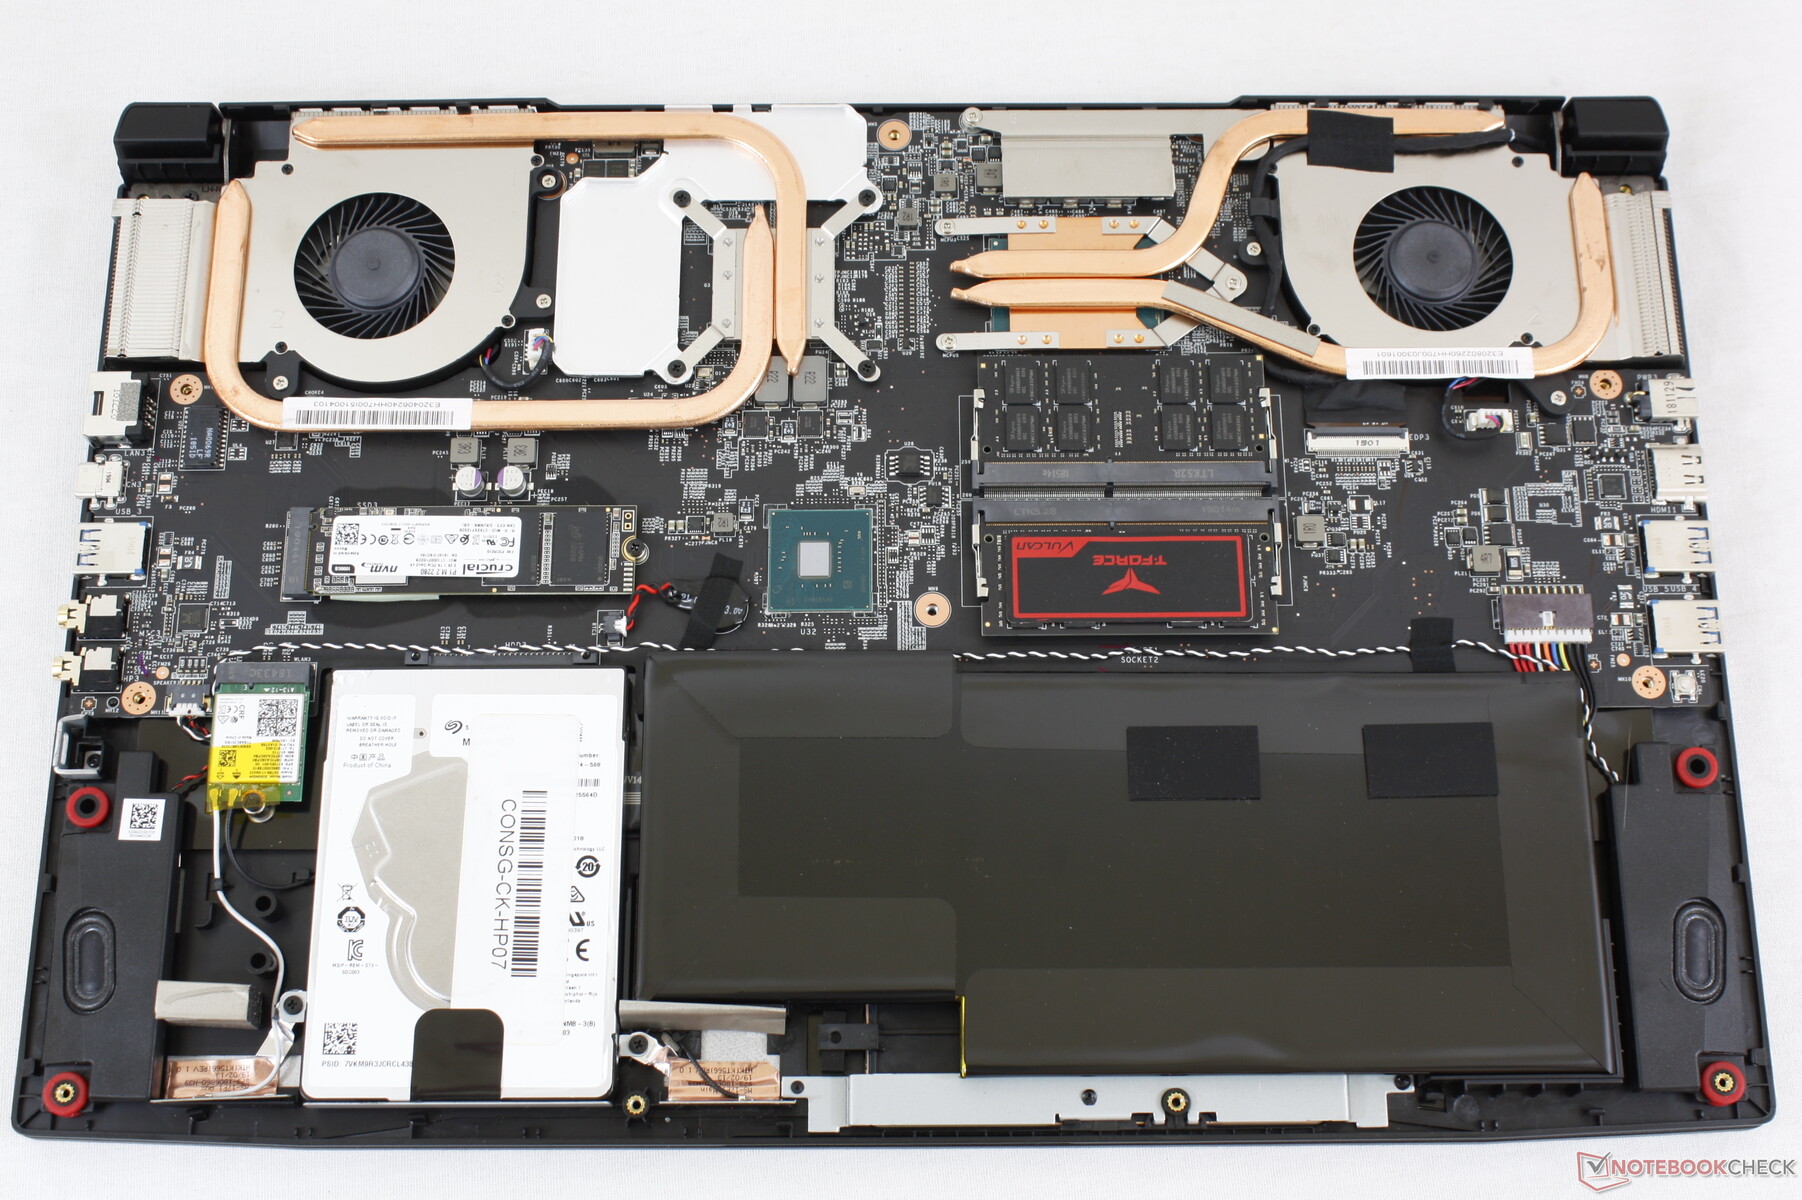
The bottom panel is secured by 12 Philips screws and removing it is relatively easy. The problem is that there is an anti-tamper sticker which might impact your warranty or return options. Thus, there is some risk involved even if you just want to upgrade your RAM or storage.
Accessories and Warranty
There are no included extras in the box outside of the AC adapter and paperwork. The standard one-year limited warranty applies.
Input Devices
Keyboard
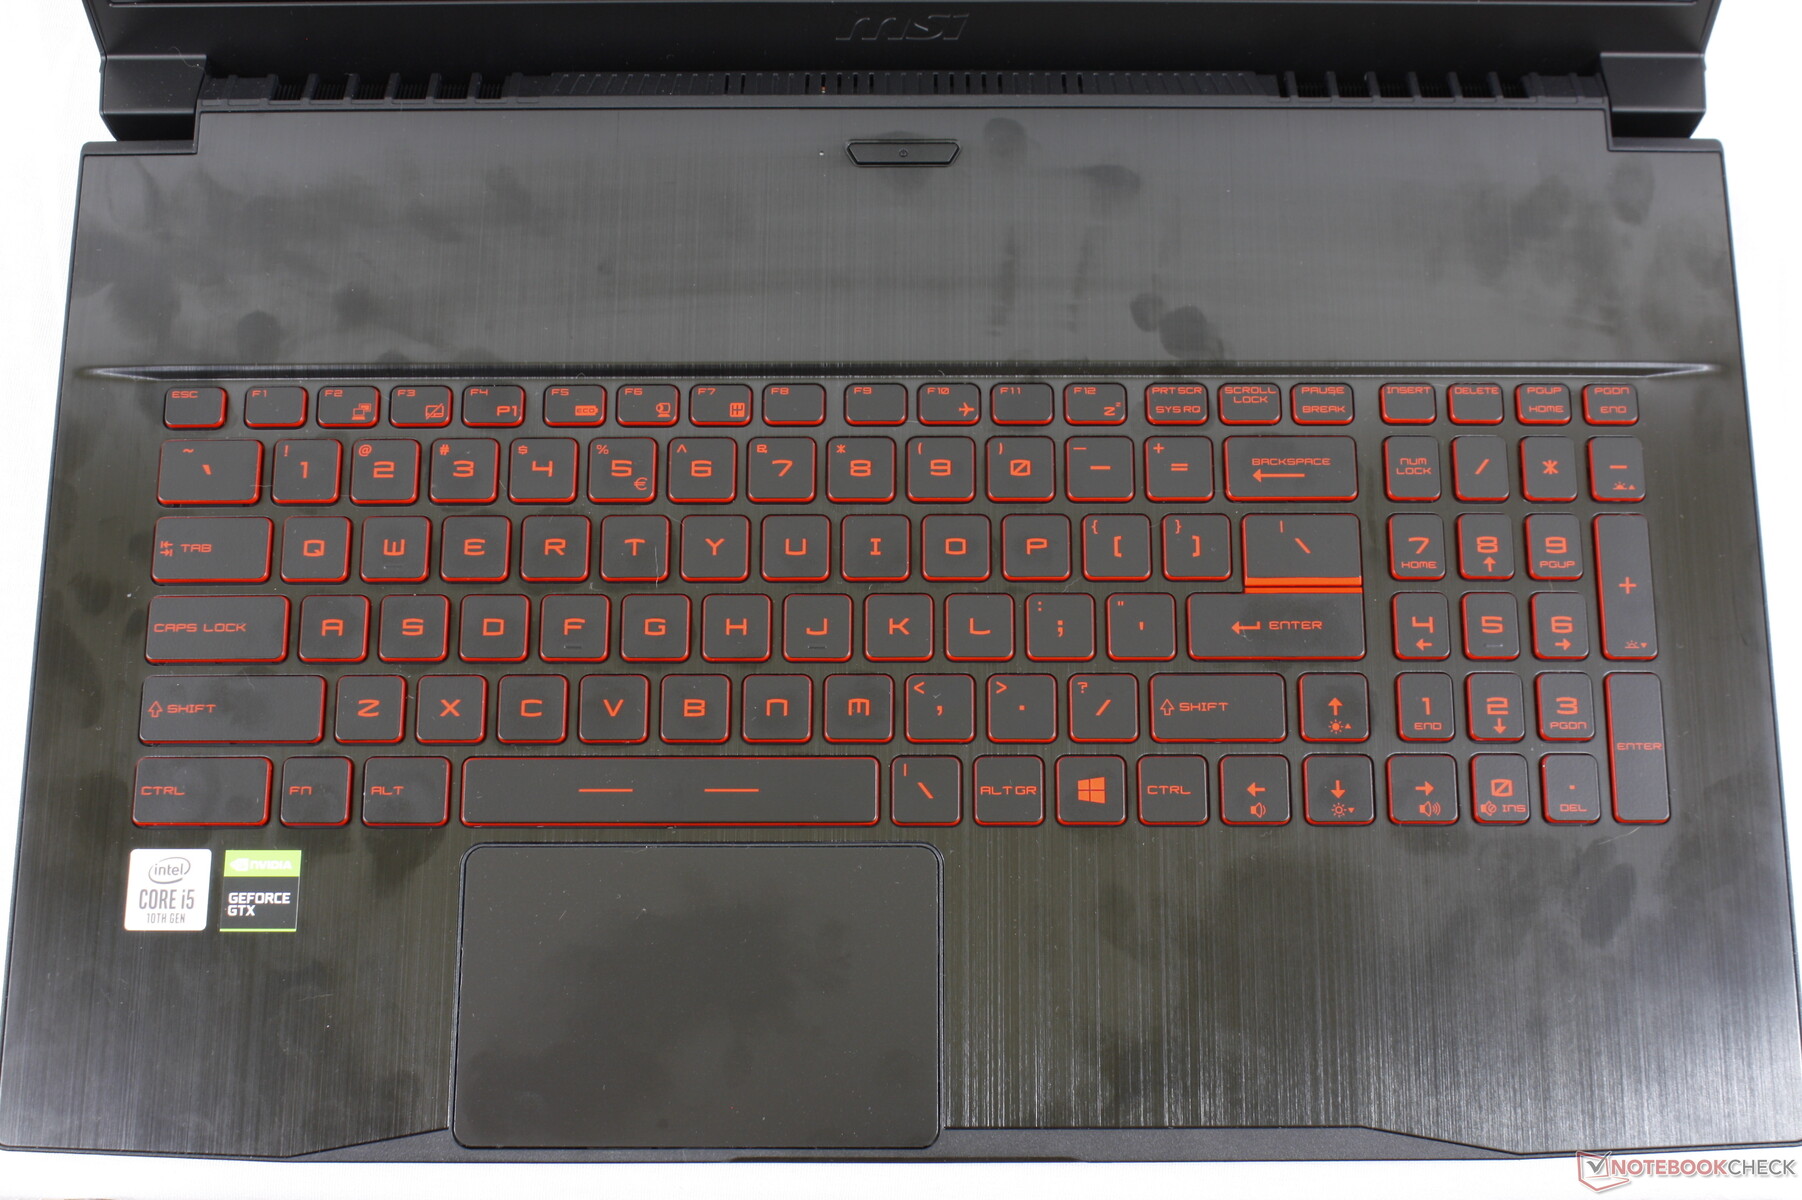
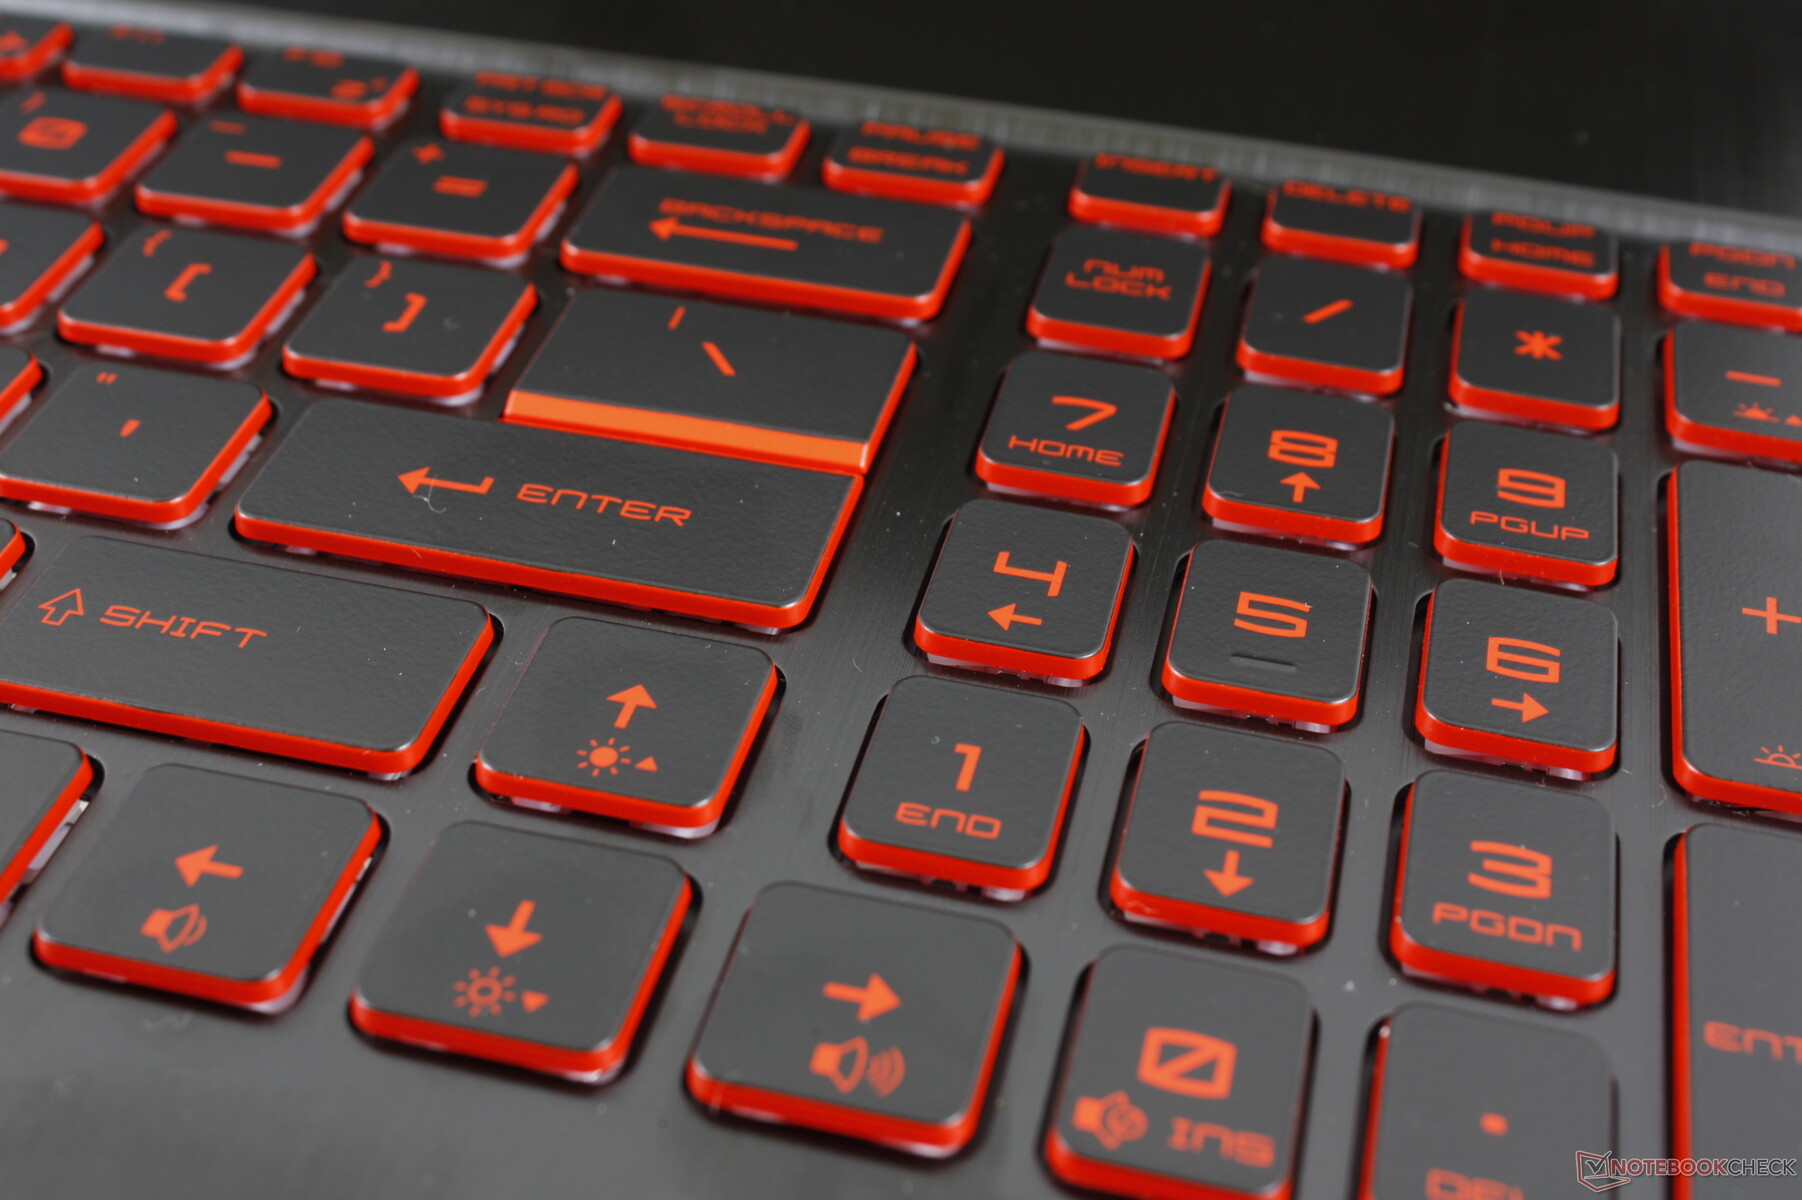
MSI keyboards are some of our favorite on any gaming laptop due to how consistent they are between models. The red backlit keyboard here is comfortable to type on with both quieter clatter and firmer feedback than on an Asus Zephyrus or HP Omen. If you have ever typed on a GF72, GF65, or any other GP or GL series laptop from MSI, then you will have a good idea of how the GF75 will feel like.
Touchpad
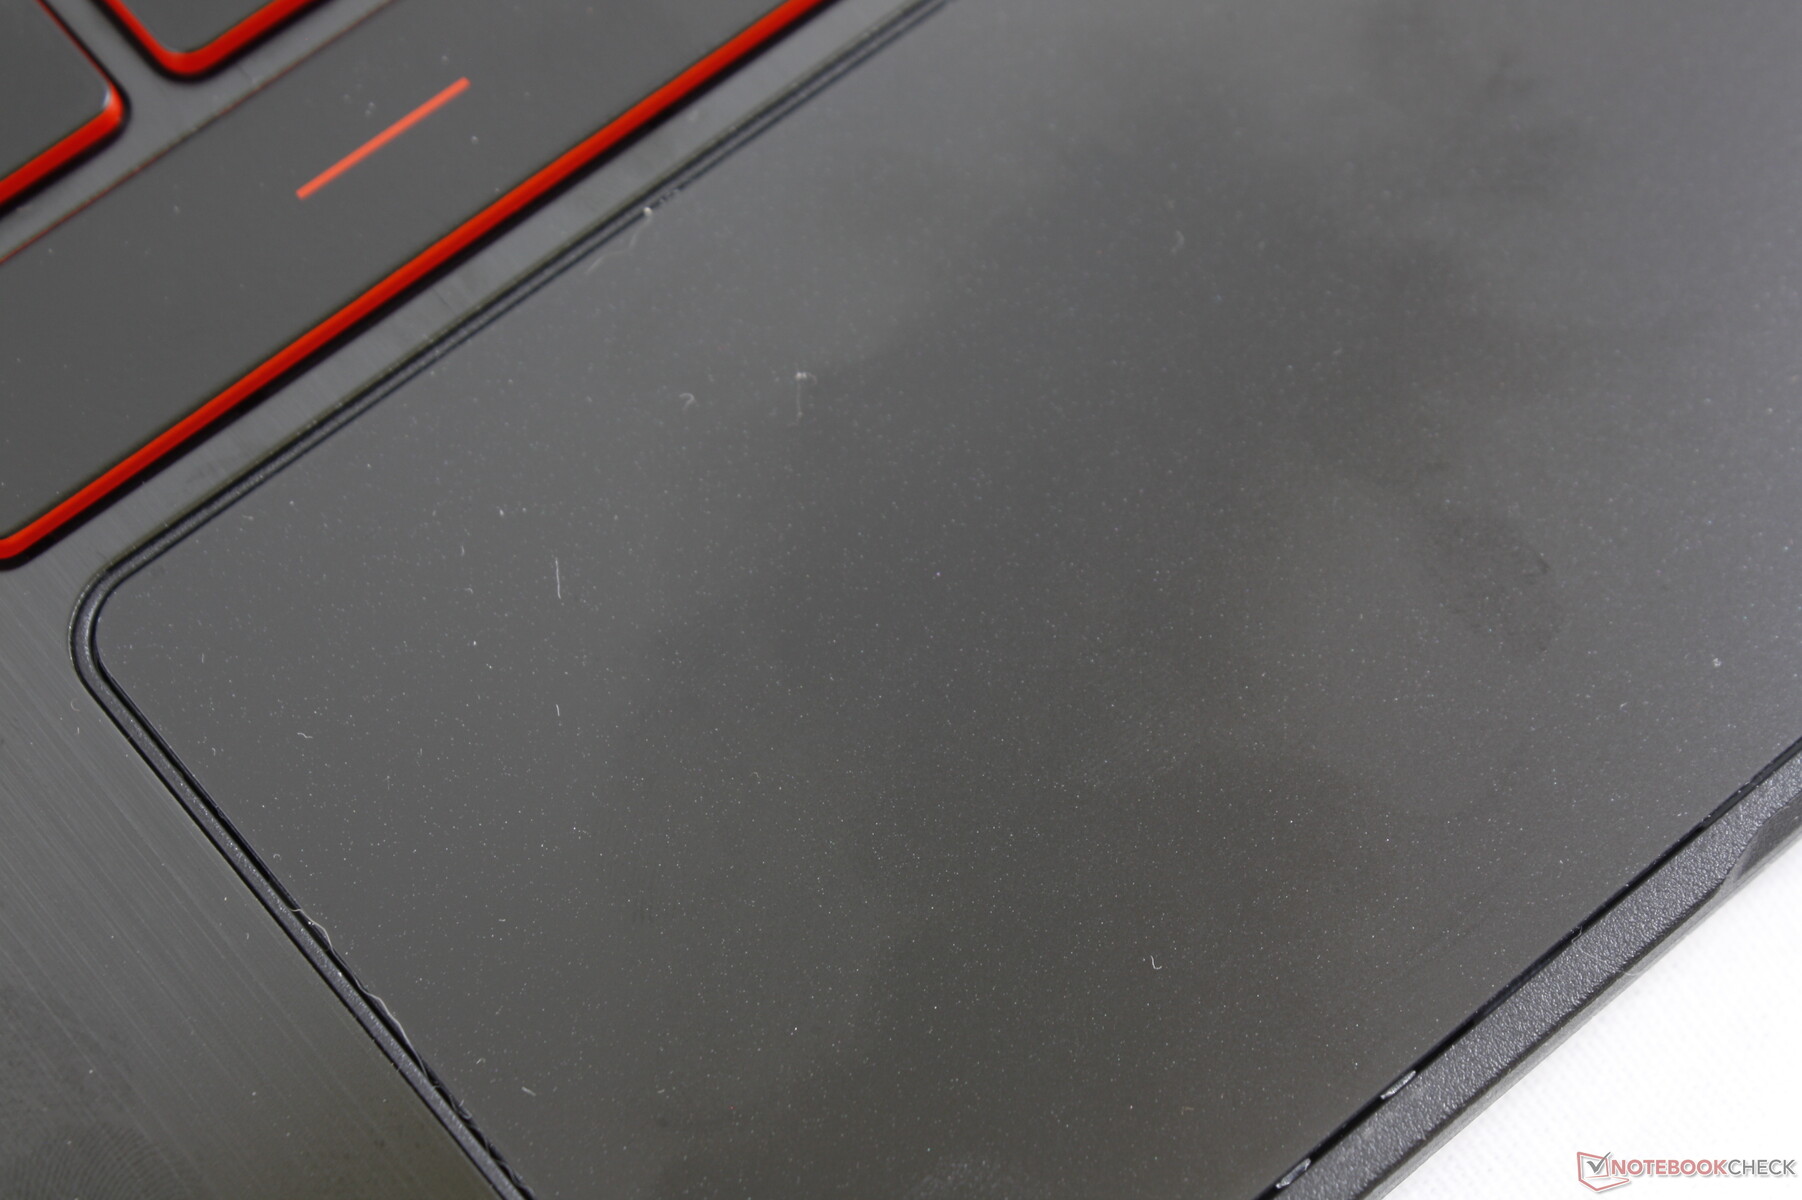
The clickpad (~10.5 x 6.6 cm) is slightly smaller than the one on the GS75 (10.5 x 7 cm). Though reliable for cursor control at all speeds and very responsive because of the 120 Hz display, its integrated mouse keys are too spongy and difficult to press. A lot of force is required to click the surface which can become tiring if clicking or dragging and dropping frequently.

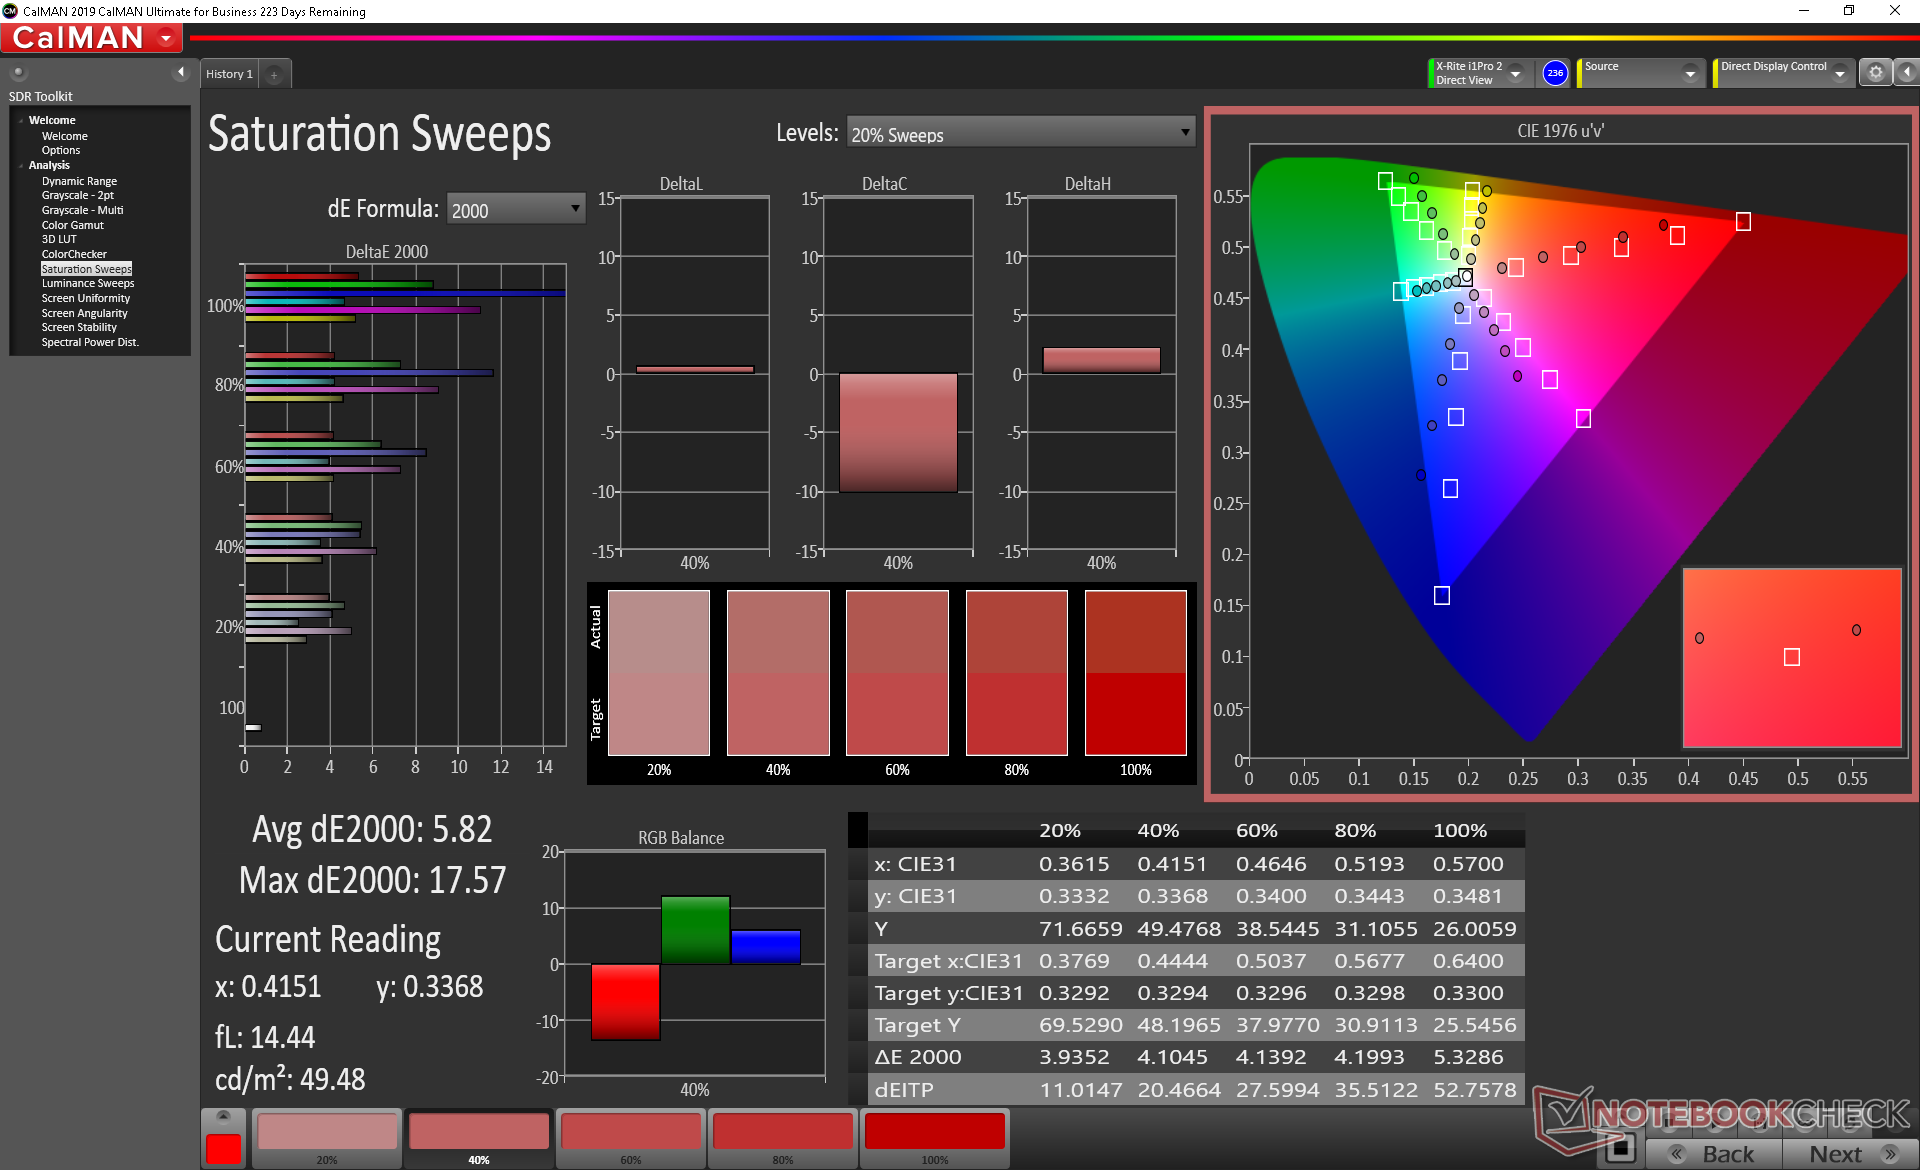
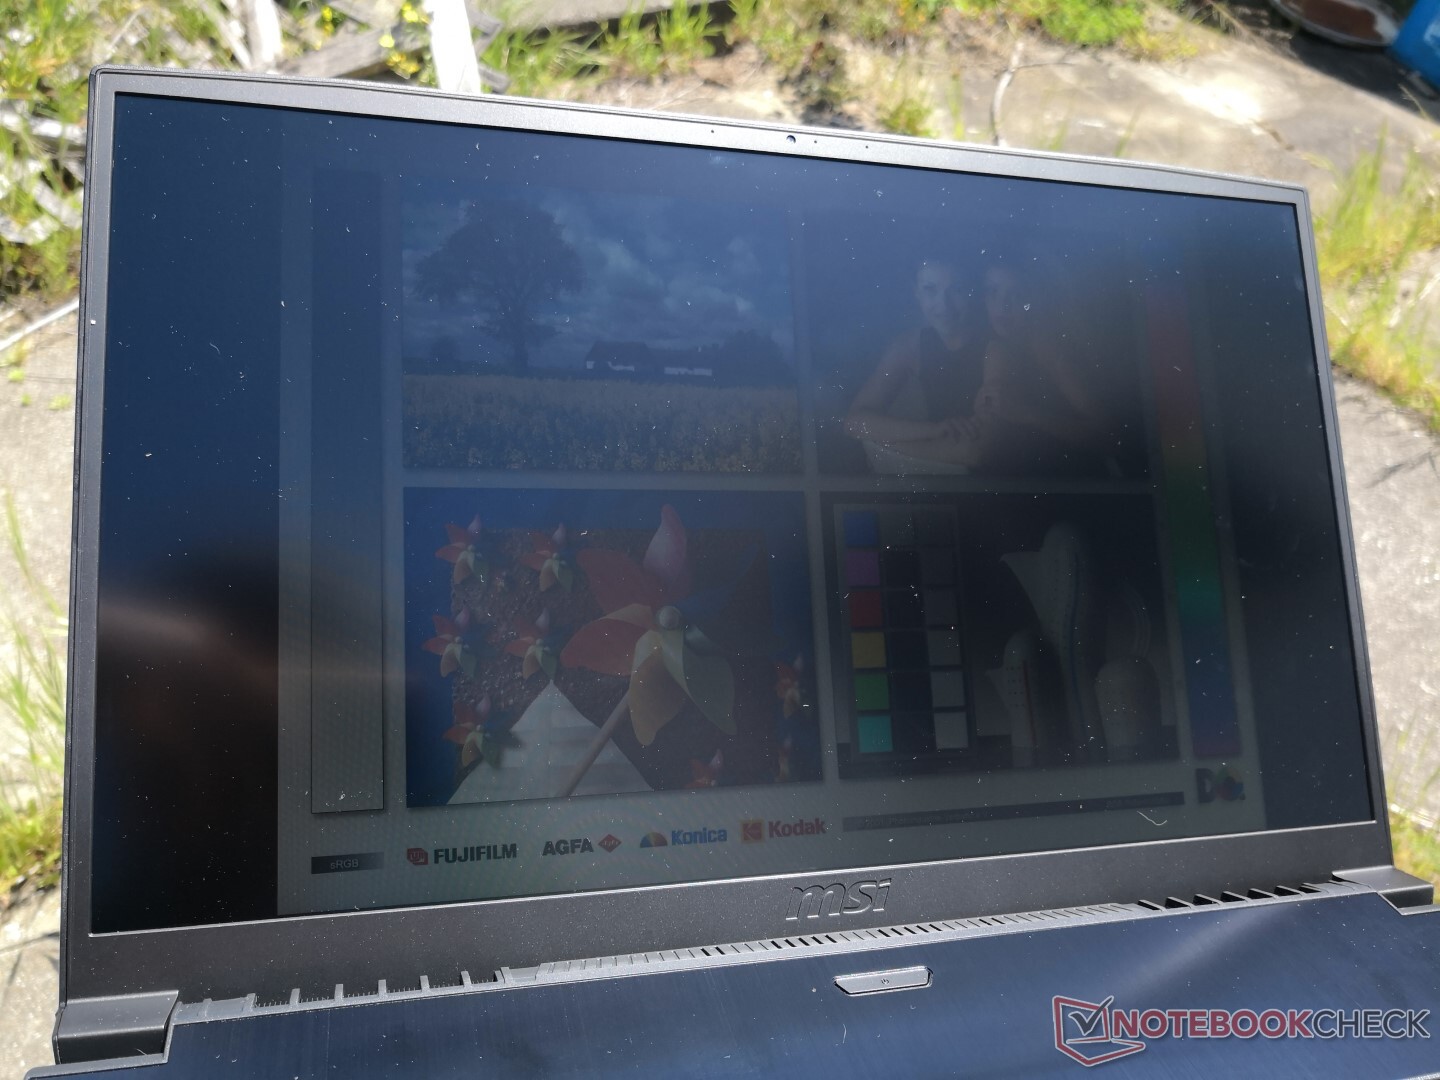
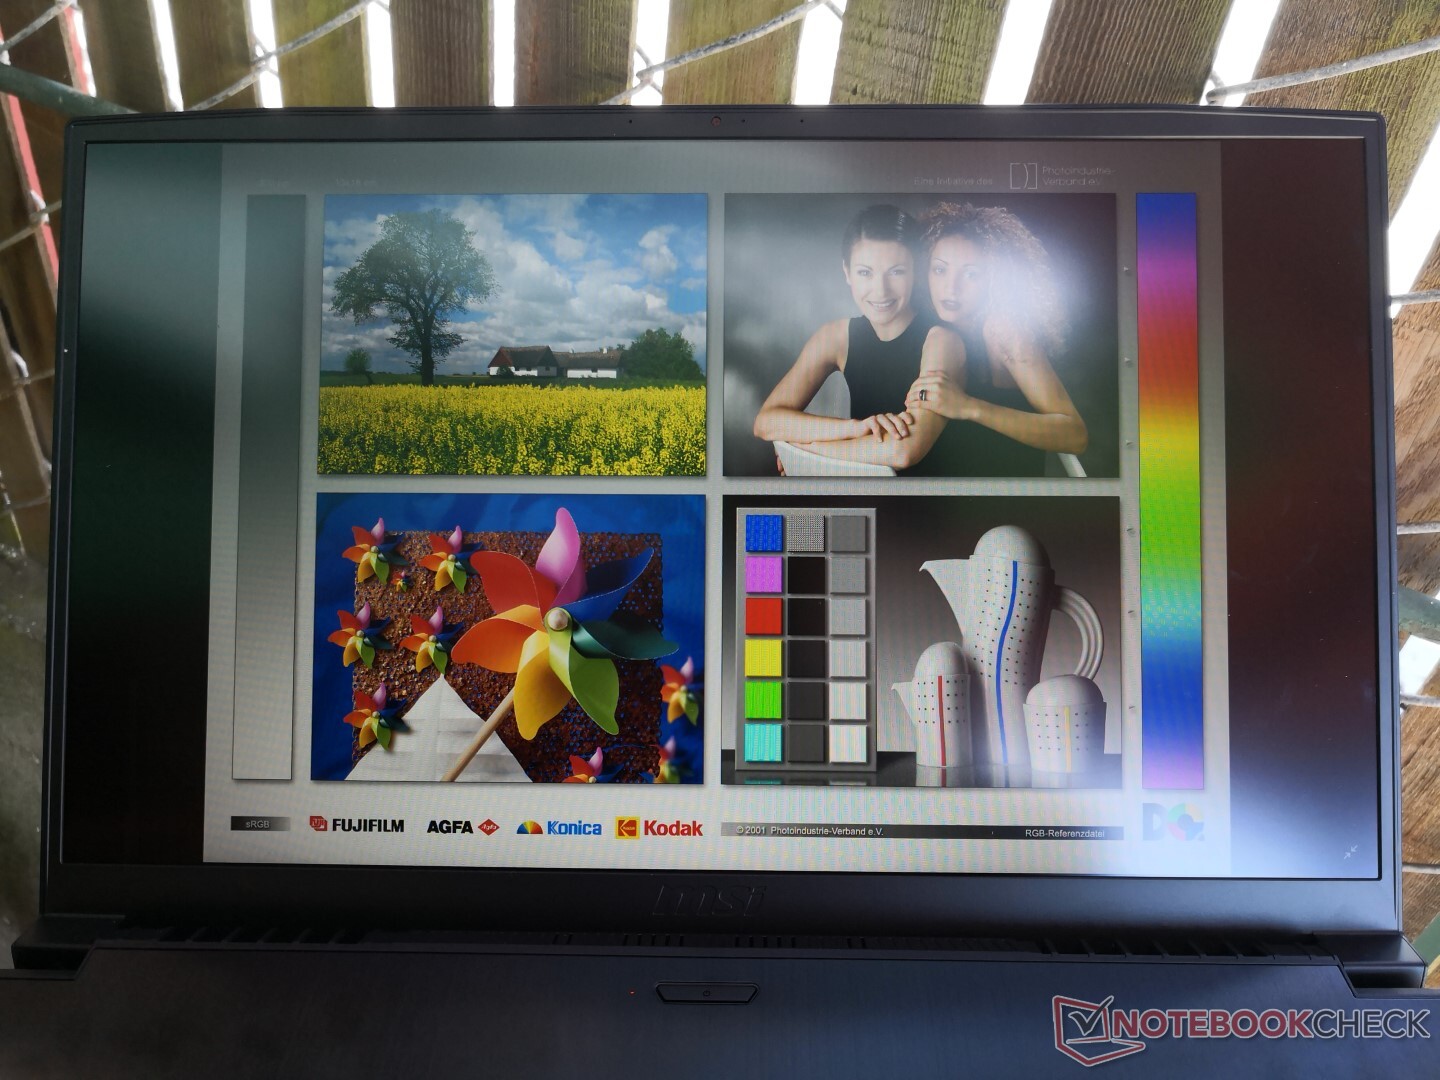
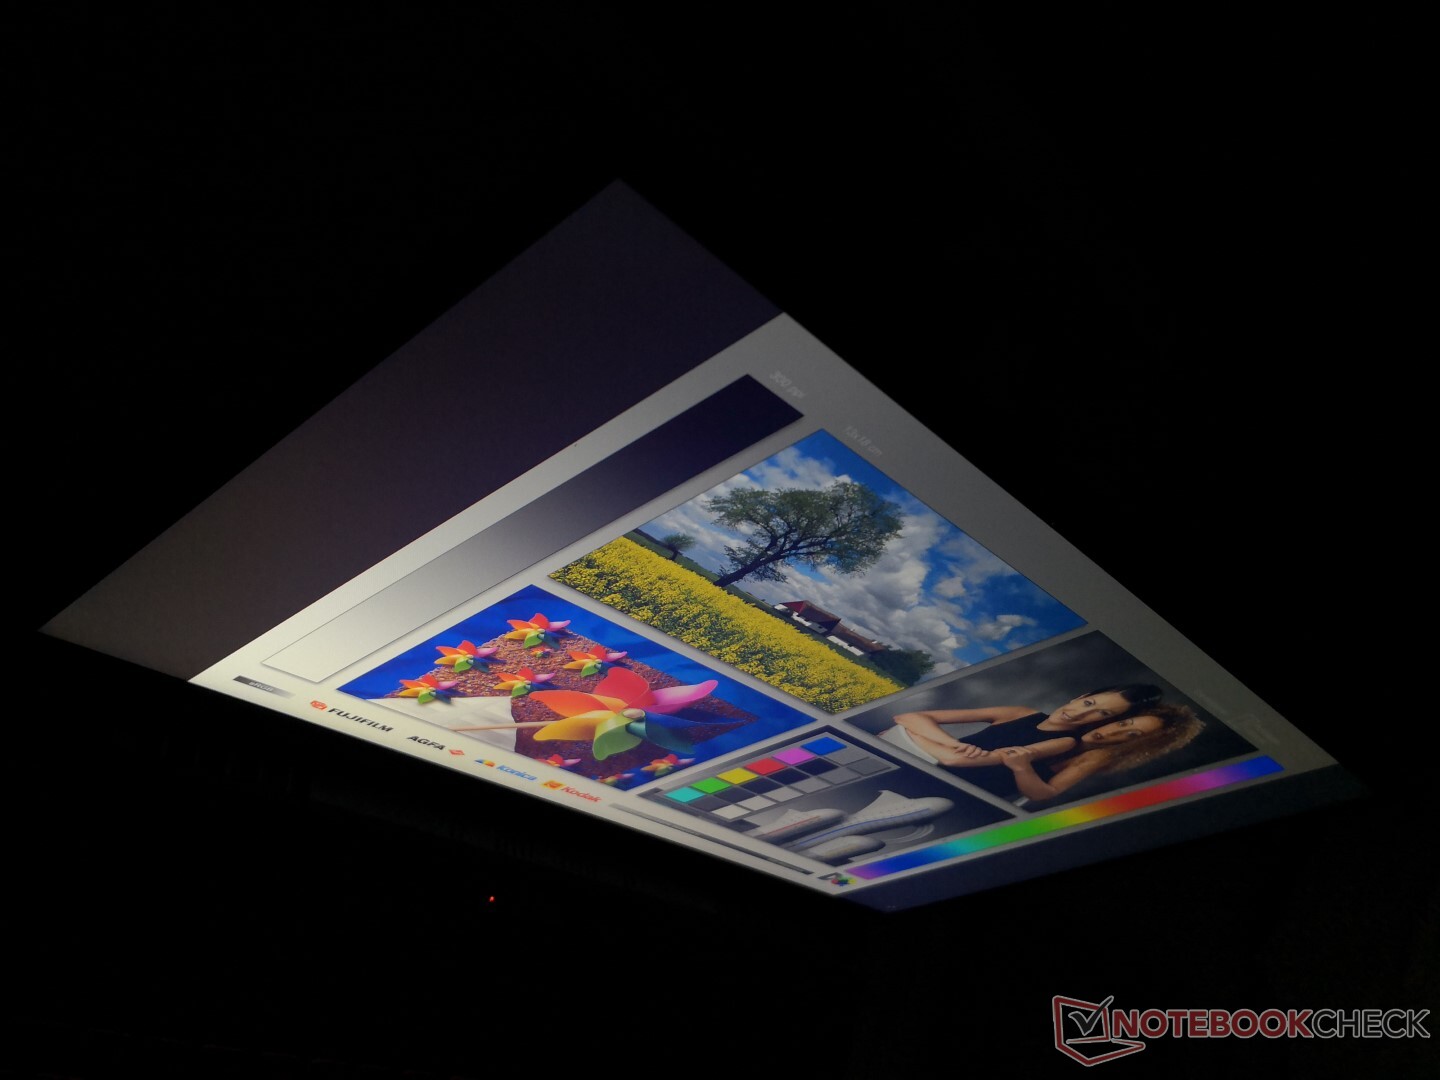
Display
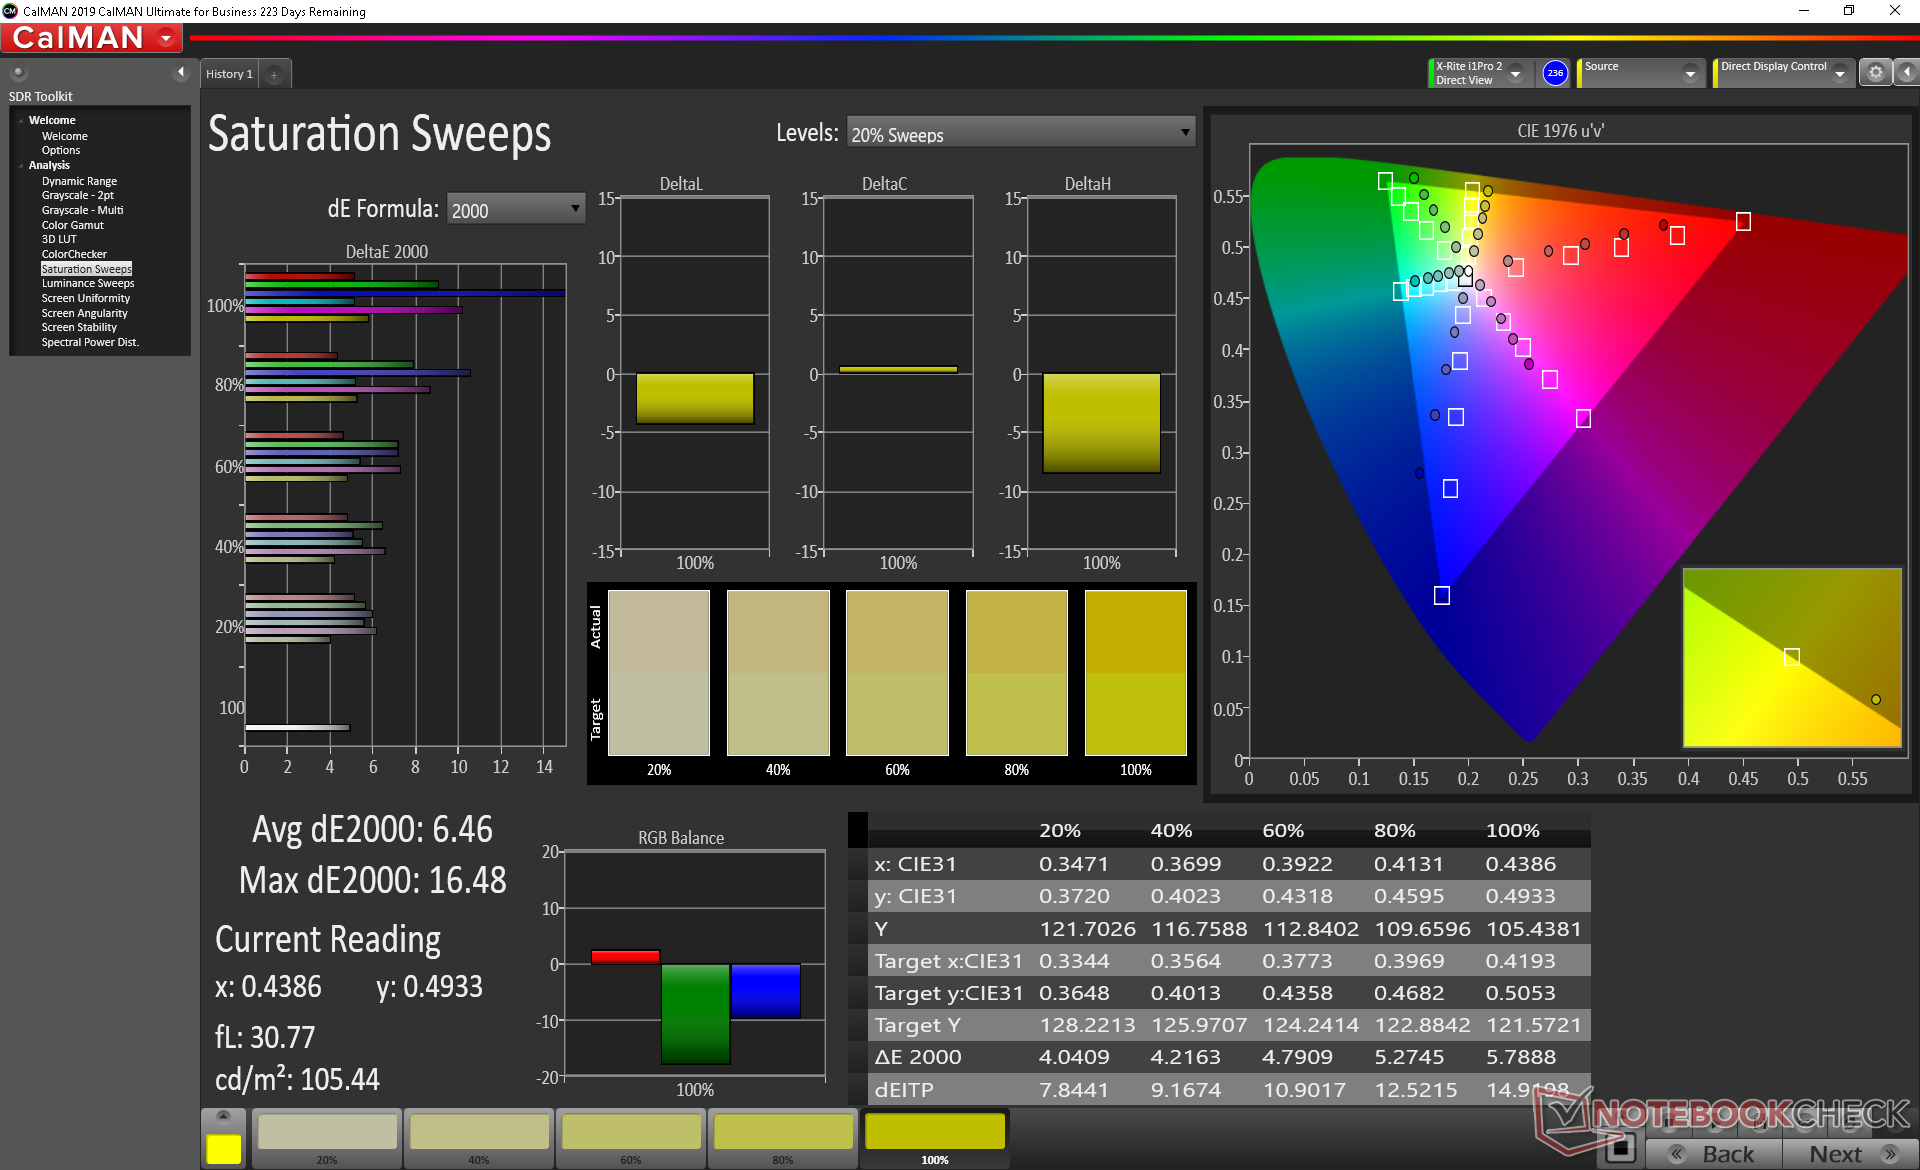
Our GF75 Thin 10SCXR uses the same AU Optronics B173HAN04.7 panel as found on the GL75 9SEK which is another one of MSI's budget gaming laptops. Though the silky-smooth 120 Hz refresh rate is clearly the highlight of the IPS panel, most everything else about it is average at best. The limited colors, average brightness, average contrast ratio, and average response times pale in comparison to the 144 Hz panels on pricier laptops like the MSI GS75 or the Asus Zephyrus series. Of course, these alternatives can retail for over twice the price of the GF75. Other budget gaming laptops like the Acer Aspire Nitro 5 AN517 or Lenovo IdeaPad L340-17IRH have higher contrast ratios and deeper colors albeit with a refresh rate of "only" 60 Hz. It's a trade-off users will have to make at this price range.
Display quality is decent if not middle-of-the-road. It's slightly grainy as expected on matte panels while colors are more muted than what most Ultrabooks or other gaming laptops have to offer.


| |||||||||||||||||||||||||
Brightness Distribution: 92 %
Center on Battery: 251.2 cd/m²
Contrast: 739:1 (Black: 0.34 cd/m²)
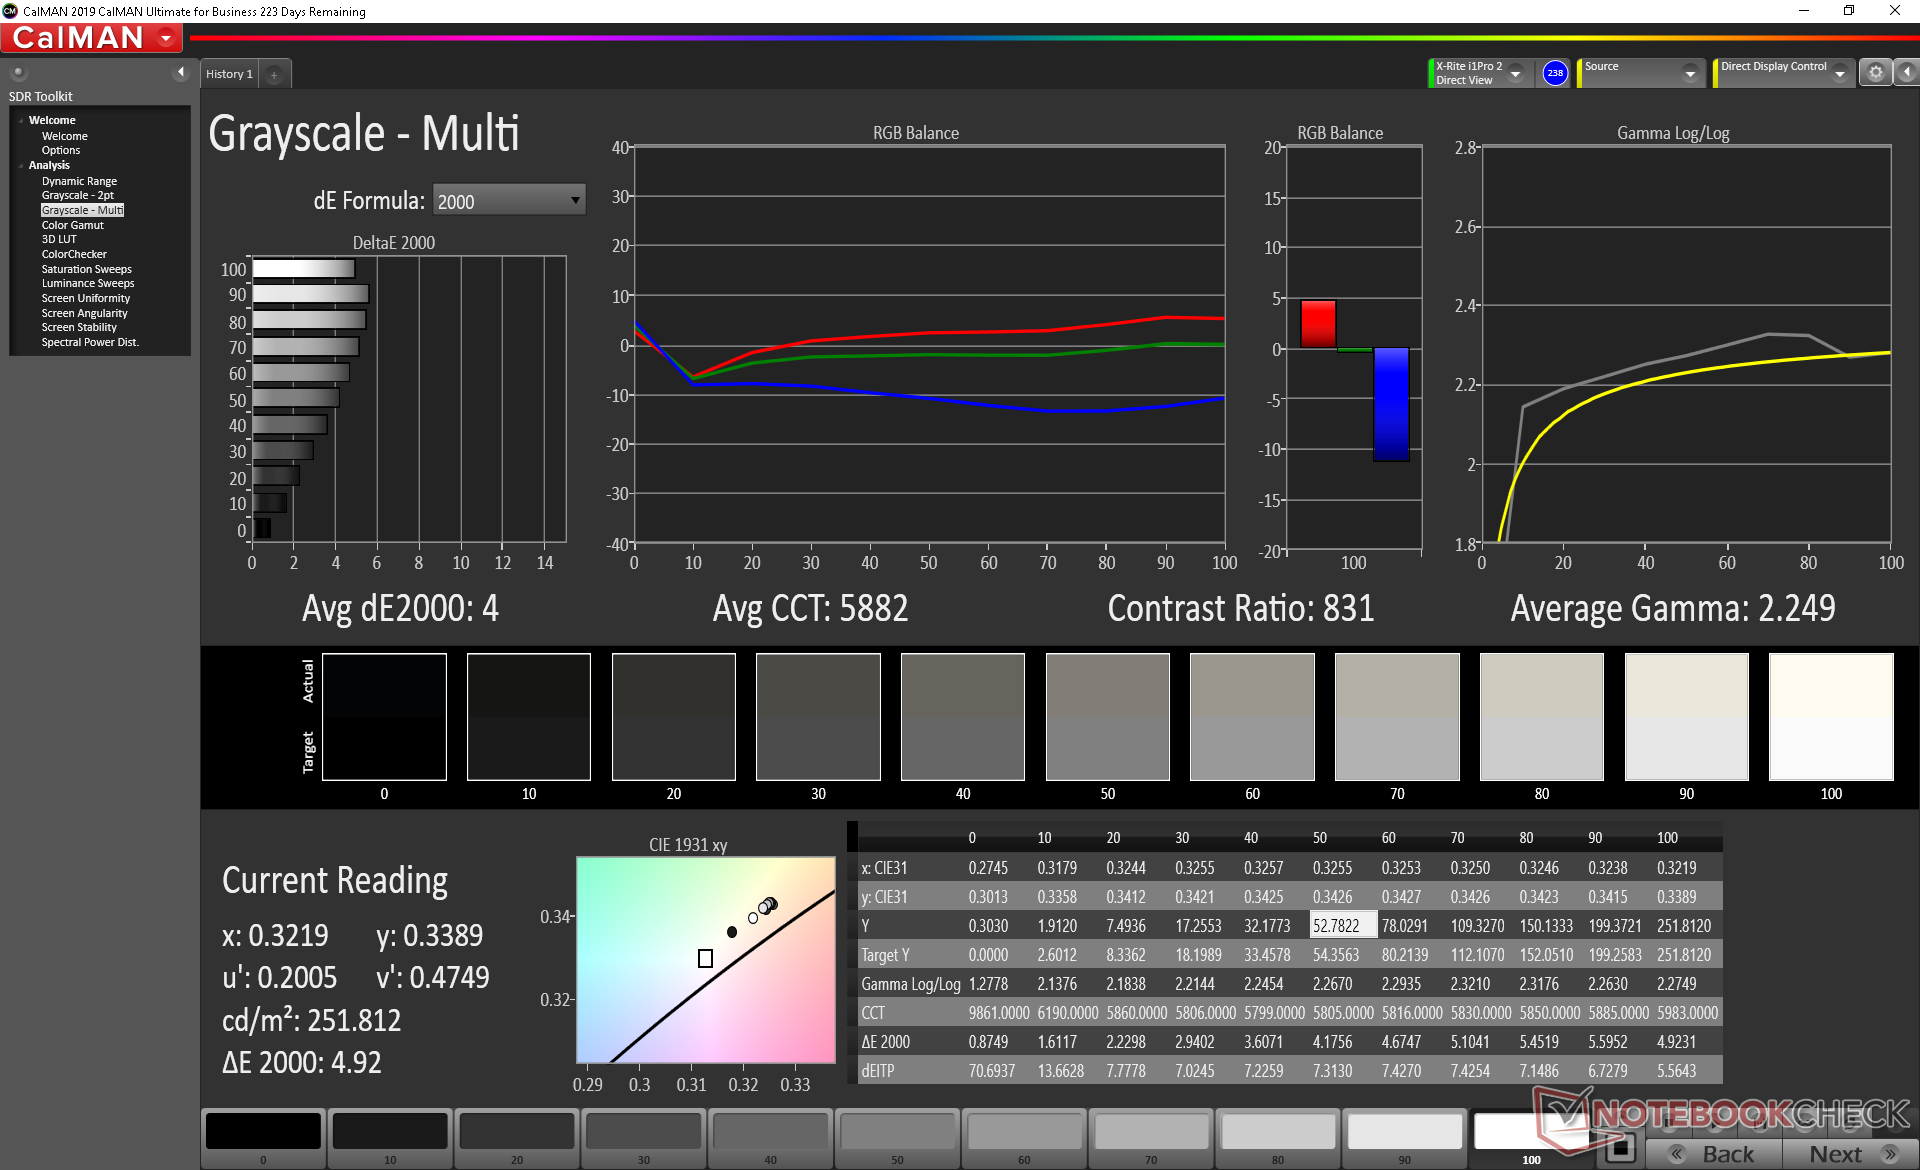
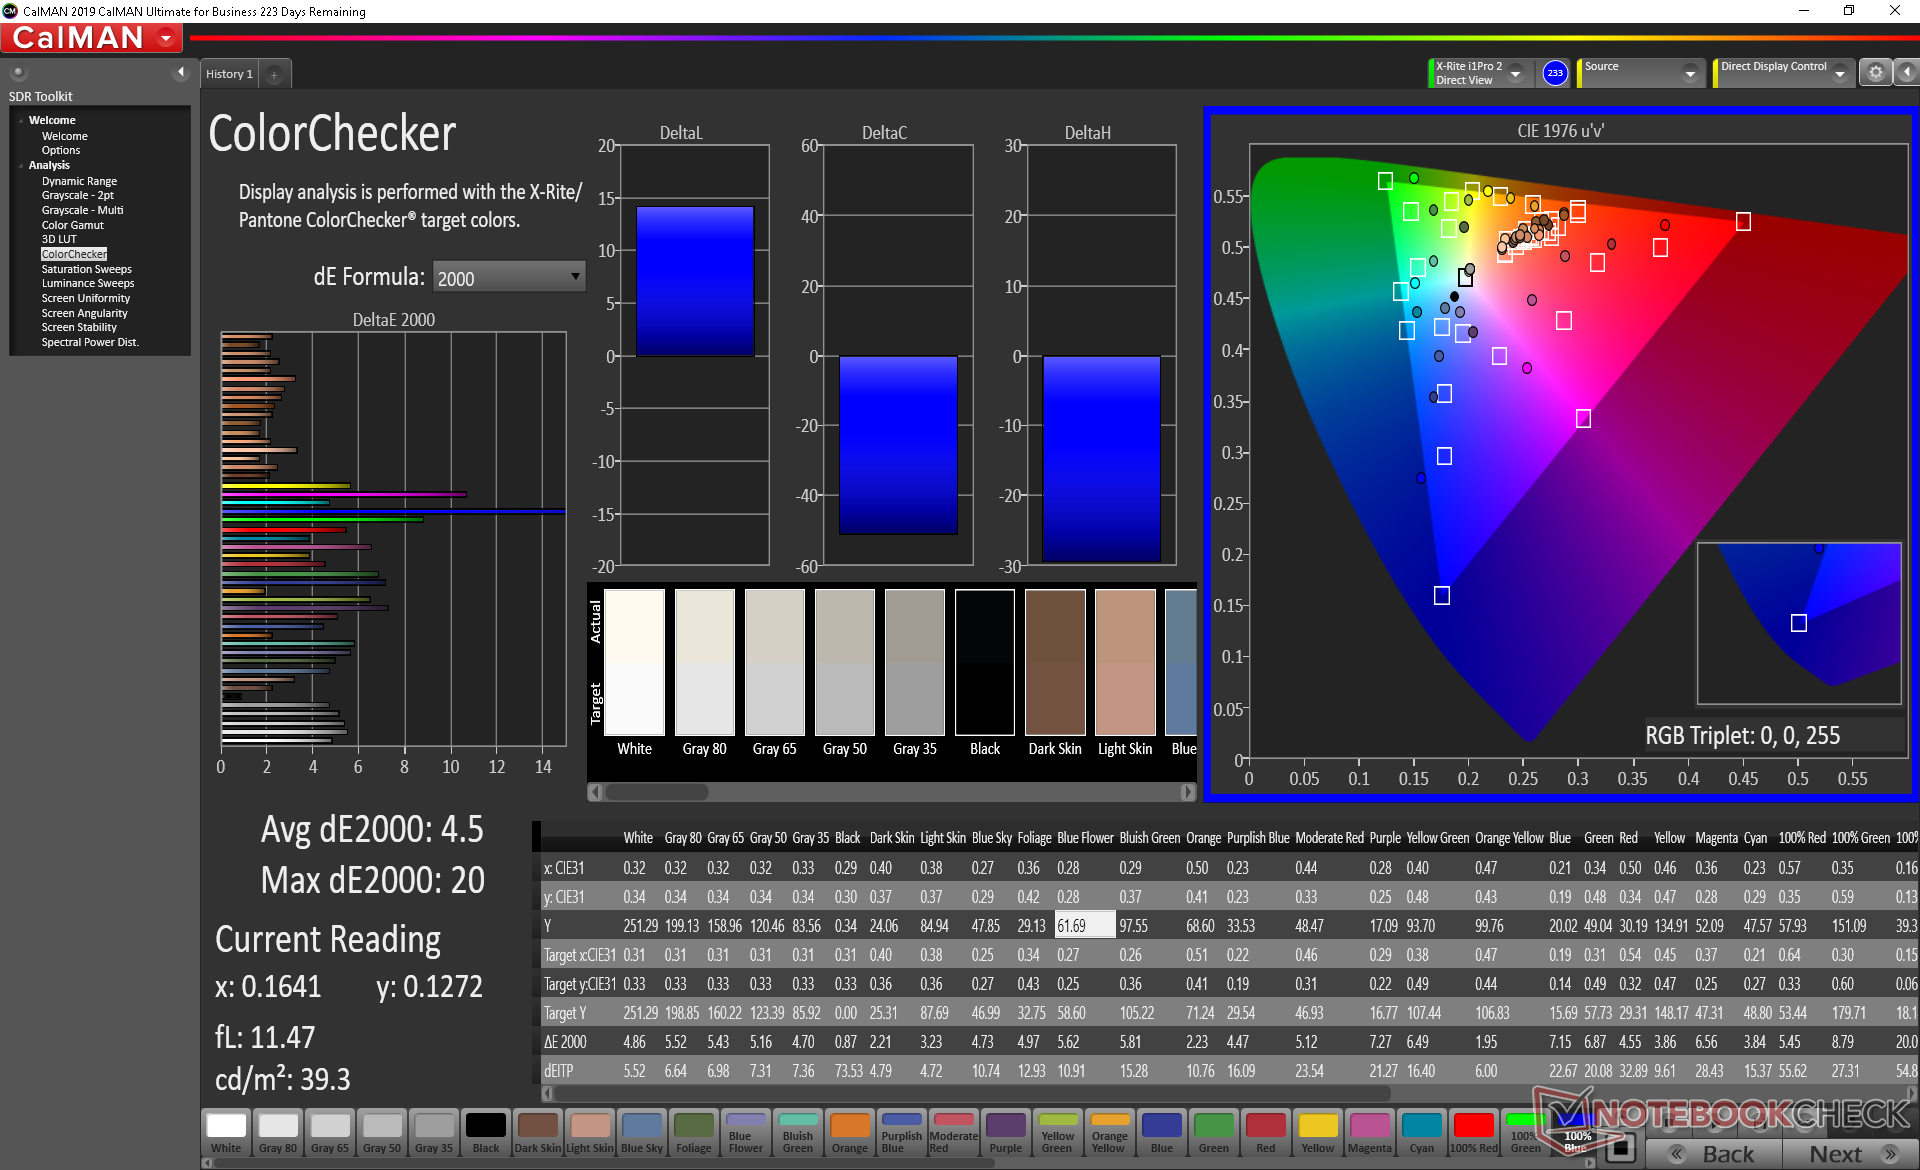
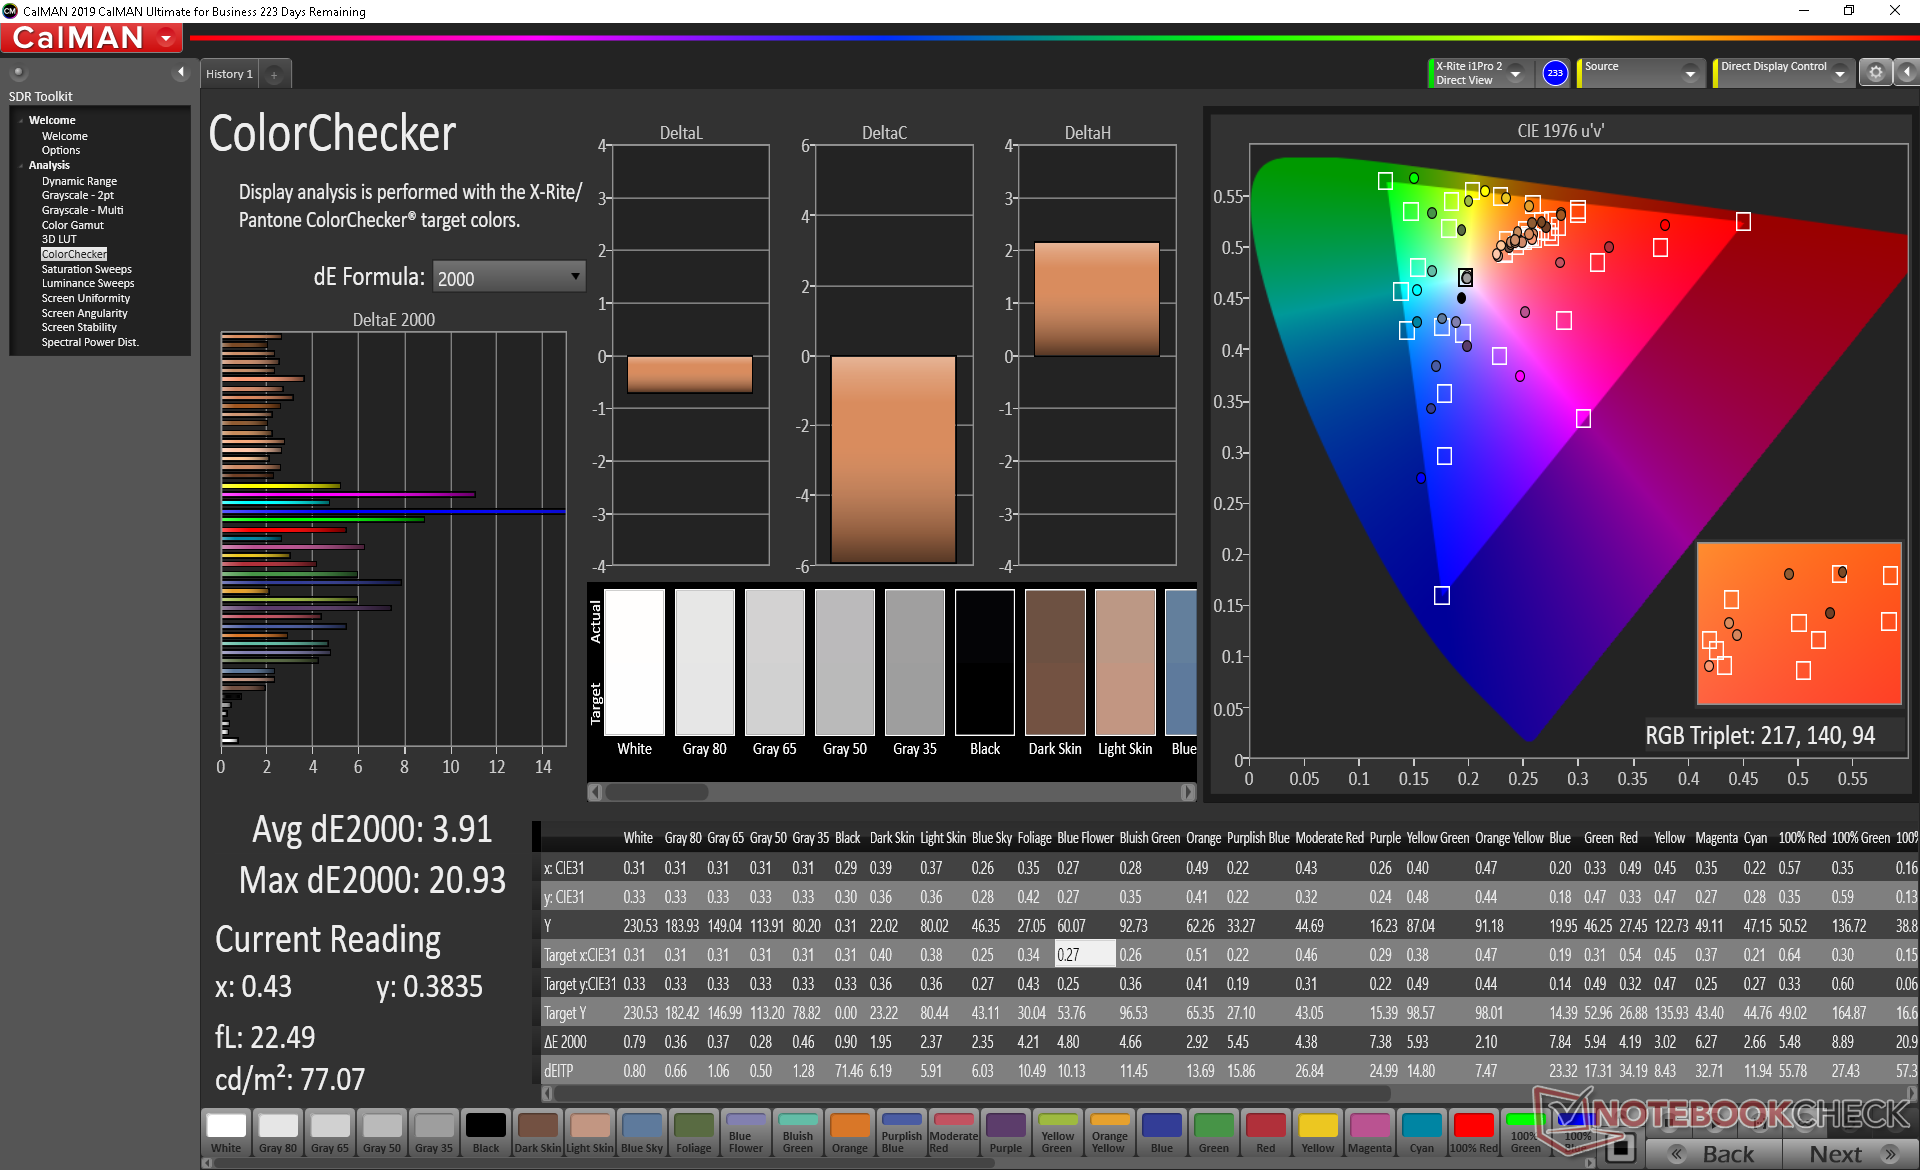
ΔE ColorChecker Calman: 4.5 | ∀{0.5-29.43 Ø4.73}
calibrated: 3.91
ΔE Greyscale Calman: 4 | ∀{0.09-98 Ø4.97}
58.1% sRGB (Argyll 1.6.3 3D)
37.3% AdobeRGB 1998 (Argyll 1.6.3 3D)
40.77% AdobeRGB 1998 (Argyll 3D)
58.4% sRGB (Argyll 3D)
39.46% Display P3 (Argyll 3D)
Gamma: 2.25
CCT: 5882 K
| MSI GF75 Thin 10SCXR AU Optronics B173HAN04.7, IPS, 17.3", 1920x1080 | Acer Aspire Nitro 5 AN517-51-7887 LP173WF5-SPB3, IPS, 17.3", 1920x1080 | Asus ROG Strix G GL731GU-RB74 AU Optronics B173HAN04.0, IPS, 17.3", 1920x1080 | Lenovo Ideapad L340-17IRH 81LL001YGE Chi Mei N173HCE-E31, IPS, 17.3", 1920x1080 | MSI GP75 Leopard 9SD Chi Mei N173HCE-G33 (CMN175C), IPS, 17.3", 1920x1080 | HP Pavilion Gaming 17-cd0085cl BOE0825, IPS, 17.3", 1920x1080 | MSI GF75 Thin 9SC AU Optronics B173HAN04.2, IPS, 17.3", 1920x1080 | |
|---|---|---|---|---|---|---|---|
| Display | 58% | 55% | 63% | 61% | 57% | 56% | |
| Display P3 Coverage (%) | 39.46 | 62.7 59% | 61.9 57% | 66.3 68% | 63.4 61% | 63.3 60% | 62.5 58% |
| sRGB Coverage (%) | 58.4 | 92.5 58% | 89.4 53% | 92.7 59% | 94.9 63% | 90.2 54% | 90 54% |
| AdobeRGB 1998 Coverage (%) | 40.77 | 63.5 56% | 63.3 55% | 66.6 63% | 65.1 60% | 64.3 58% | 64 57% |
| Response Times | -4% | 70% | 10% | 72% | 17% | -8% | |
| Response Time Grey 50% / Grey 80% * (ms) | 34 ? | 37 ? -9% | 6.4 ? 81% | 32 ? 6% | 8 ? 76% | 31.6 ? 7% | 34 ? -0% |
| Response Time Black / White * (ms) | 26.4 ? | 26 ? 2% | 11.2 ? 58% | 23 ? 13% | 8.8 ? 67% | 19.6 ? 26% | 30.4 ? -15% |
| PWM Frequency (Hz) | 250 ? | 25510 ? | |||||
| Screen | 26% | 27% | 38% | 47% | 24% | 34% | |
| Brightness middle (cd/m²) | 251.2 | 407 62% | 294.3 17% | 318 27% | 420 67% | 299.6 19% | 344.7 37% |
| Brightness (cd/m²) | 242 | 364 50% | 289 19% | 292 21% | 393 62% | 285 18% | 332 37% |
| Brightness Distribution (%) | 92 | 84 -9% | 89 -3% | 85 -8% | 91 -1% | 86 -7% | 91 -1% |
| Black Level * (cd/m²) | 0.34 | 0.3 12% | 0.3 12% | 0.21 38% | 0.32 6% | 0.33 3% | 0.3 12% |
| Contrast (:1) | 739 | 1357 84% | 981 33% | 1514 105% | 1313 78% | 908 23% | 1149 55% |
| Colorchecker dE 2000 * | 4.5 | 4.55 -1% | 3.95 12% | 4.04 10% | 3.04 32% | 3.68 18% | 3.08 32% |
| Colorchecker dE 2000 max. * | 20 | 12.44 38% | 6.49 68% | 6.59 67% | 7.22 64% | 8.05 60% | 6.32 68% |
| Colorchecker dE 2000 calibrated * | 3.91 | 3.08 21% | 2.06 47% | 0.89 77% | 3.15 19% | 2.94 25% | |
| Greyscale dE 2000 * | 4 | 7.61 -90% | 3.7 7% | 4.21 -5% | 3.91 2% | 3.8 5% | 3.8 5% |
| Gamma | 2.25 98% | 2.51 88% | 2.07 106% | 2.5 88% | 2.26 97% | 2.12 104% | 2.17 101% |
| CCT | 5882 111% | 7212 90% | 7155 91% | 7189 90% | 7138 91% | 7240 90% | 7284 89% |
| Color Space (Percent of AdobeRGB 1998) (%) | 37.3 | 59 58% | 57.7 55% | 60 61% | 60 61% | 58.1 56% | 58 55% |
| Color Space (Percent of sRGB) (%) | 58.1 | 92 58% | 89 53% | 93 60% | 95 64% | 89.8 55% | 89.6 54% |
| Total Average (Program / Settings) | 27% /
29% | 51% /
37% | 37% /
40% | 60% /
52% | 33% /
30% | 27% /
33% |
* ... smaller is better
Color space is narrow at just 58 percent and 37 percent of sRGB and AdobeRGB, respectively, in spite of the fast 120 Hz refresh rate. Higher-end gaming laptops are able to offer both fast refresh rates and near 100 percent sRGB coverage simultaneously. As a result, the panel will be sufficient for gaming but it should be avoided for professional graphics work.
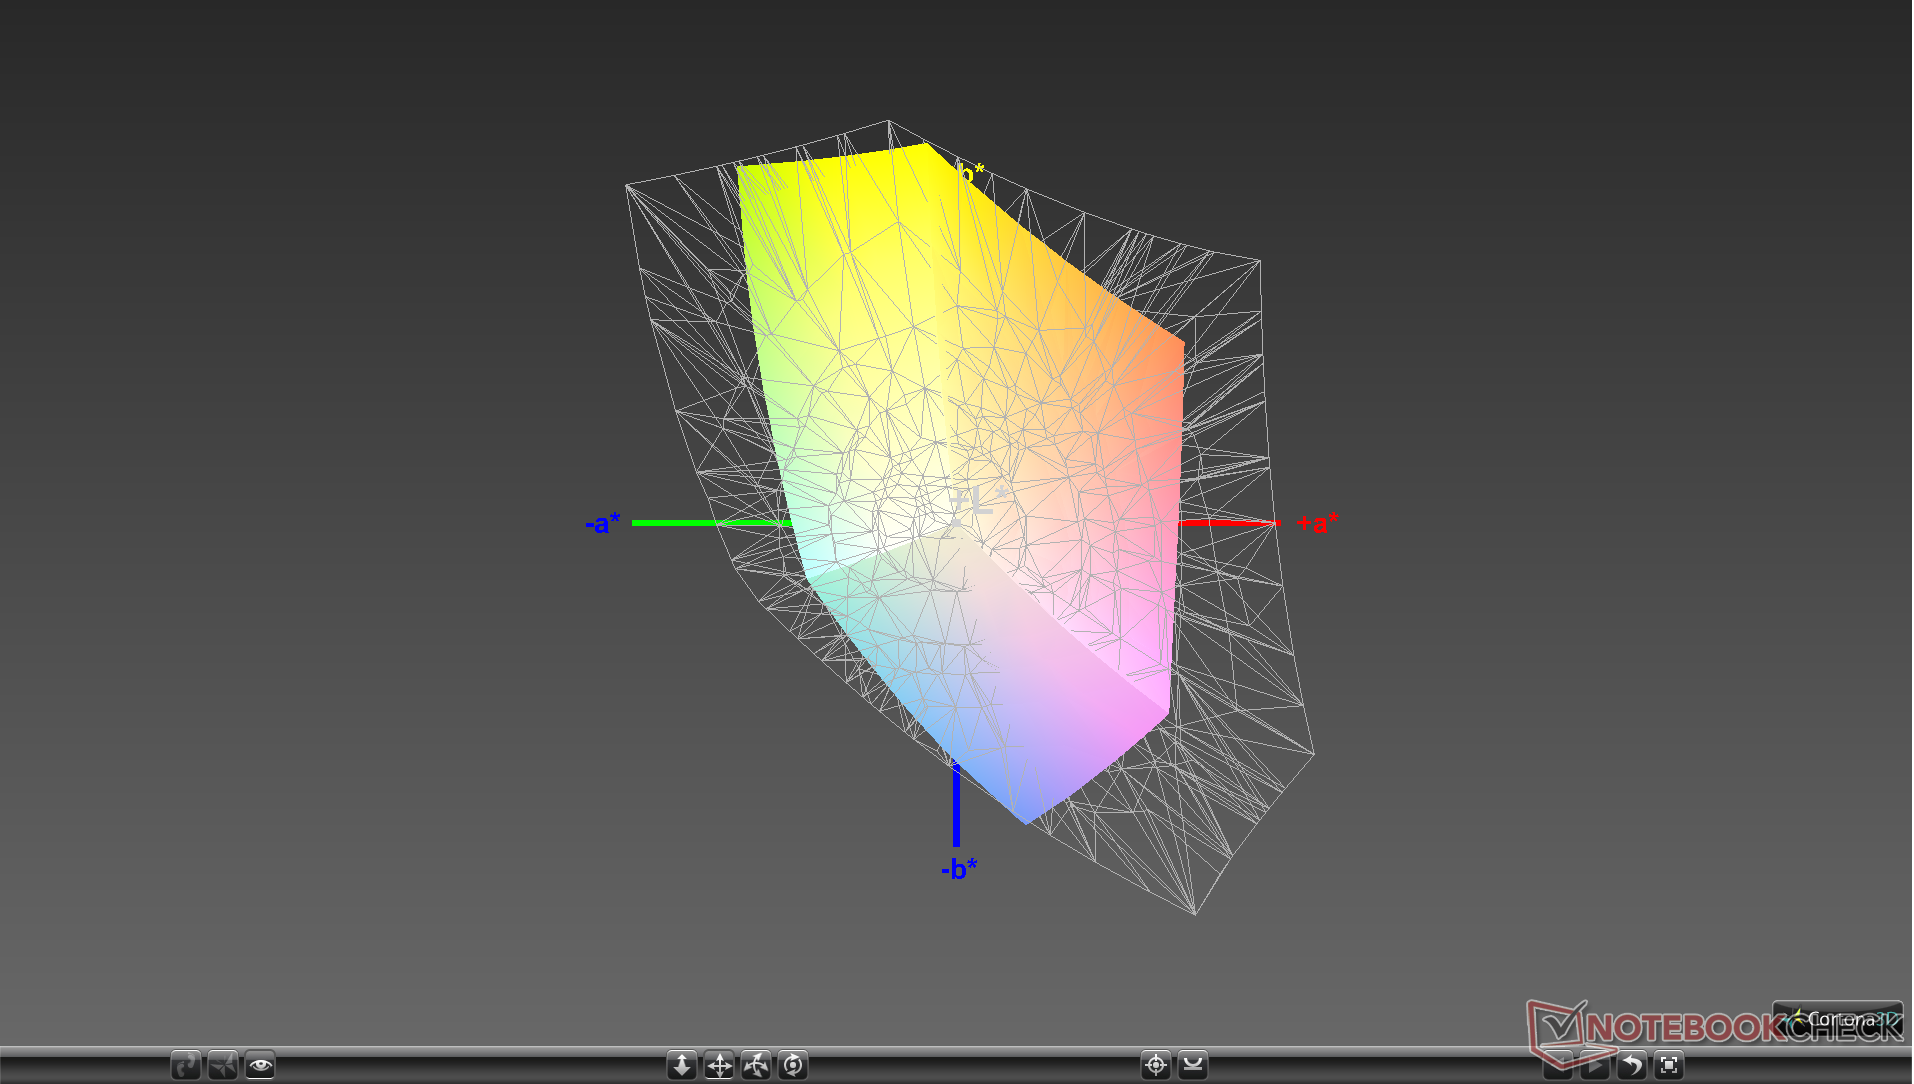
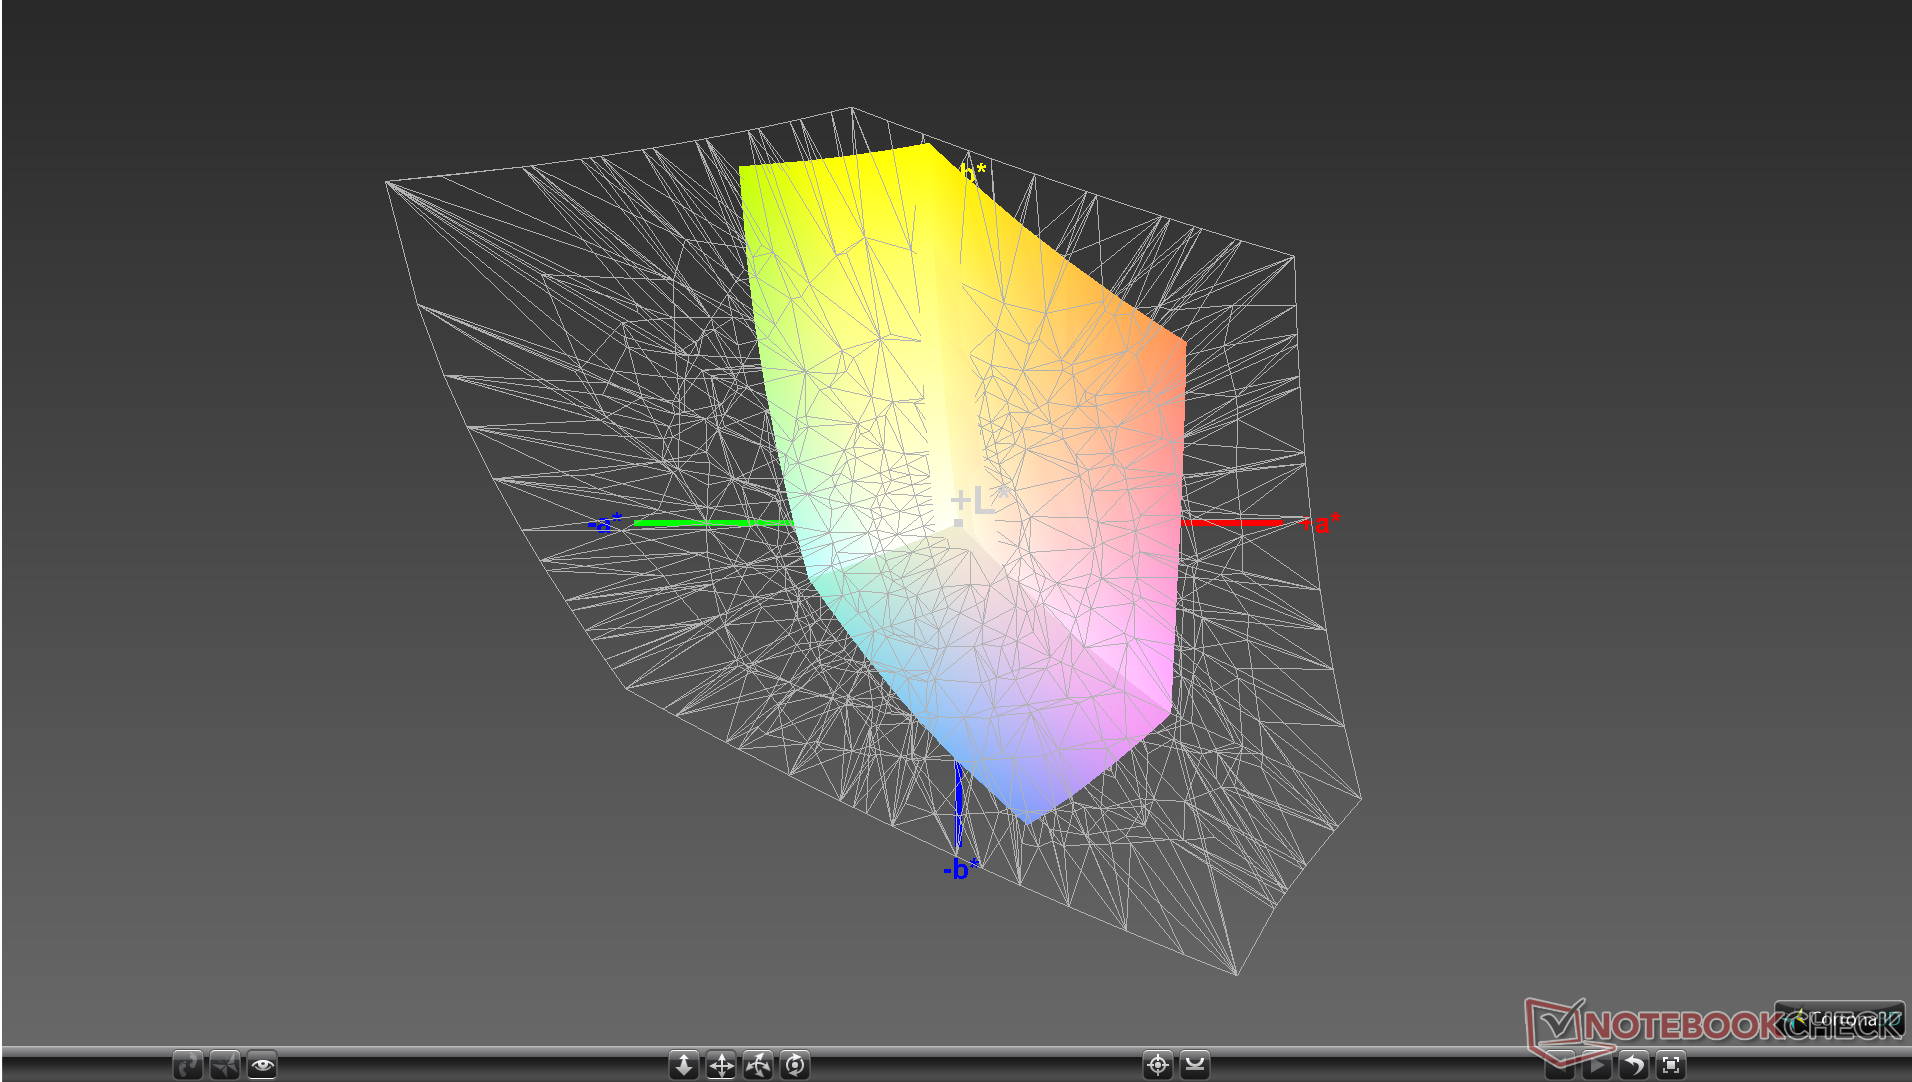
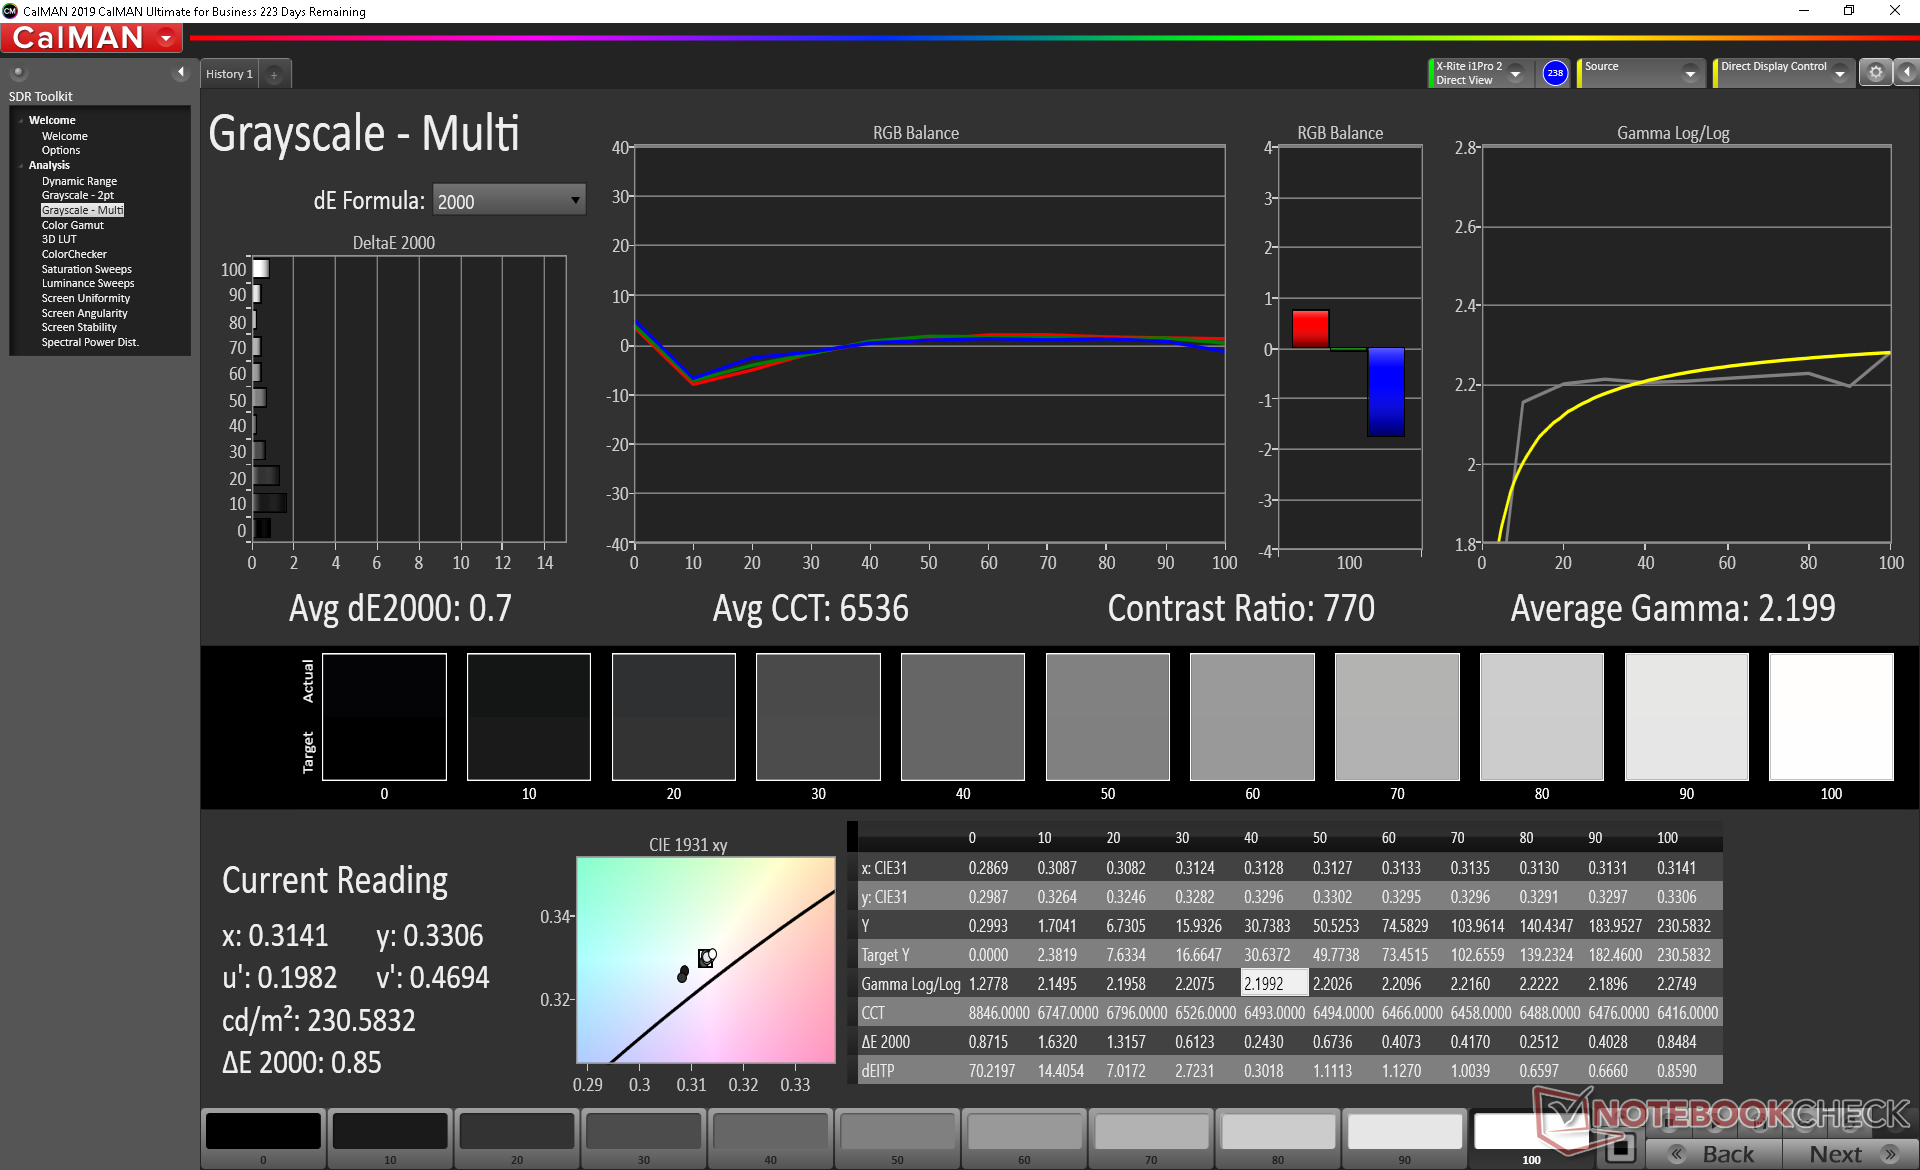
Further measurements with an X-Rite colorimeter reveal a decently calibrated display out of the box. Calibrating the panel ourselves will noticeably improve average grayscale DeltaE from 4 to 0.7 while upping the color temperature closer to 6500K, but color accuracy remains poor due to the narrow color space mentioned above. The color blue in particular is represented more inaccurately than any other tested color.
Display Response Times
| ↔ Response Time Black to White | ||
|---|---|---|
| 26.4 ms ... rise ↗ and fall ↘ combined | ↗ 15.6 ms rise | 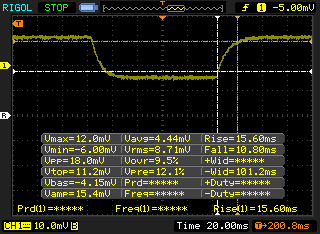 |
| ↘ 10.8 ms fall | ||
| The screen shows relatively slow response rates in our tests and may be too slow for gamers. In comparison, all tested devices range from 0.1 (minimum) to 240 (maximum) ms. » 66 % of all devices are better. This means that the measured response time is worse than the average of all tested devices (19.9 ms). | ||
| ↔ Response Time 50% Grey to 80% Grey | ||
| 34 ms ... rise ↗ and fall ↘ combined | ↗ 18 ms rise | 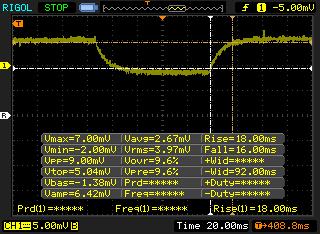 |
| ↘ 16 ms fall | ||
| The screen shows slow response rates in our tests and will be unsatisfactory for gamers. In comparison, all tested devices range from 0.165 (minimum) to 636 (maximum) ms. » 47 % of all devices are better. This means that the measured response time is similar to the average of all tested devices (31.1 ms). | ||
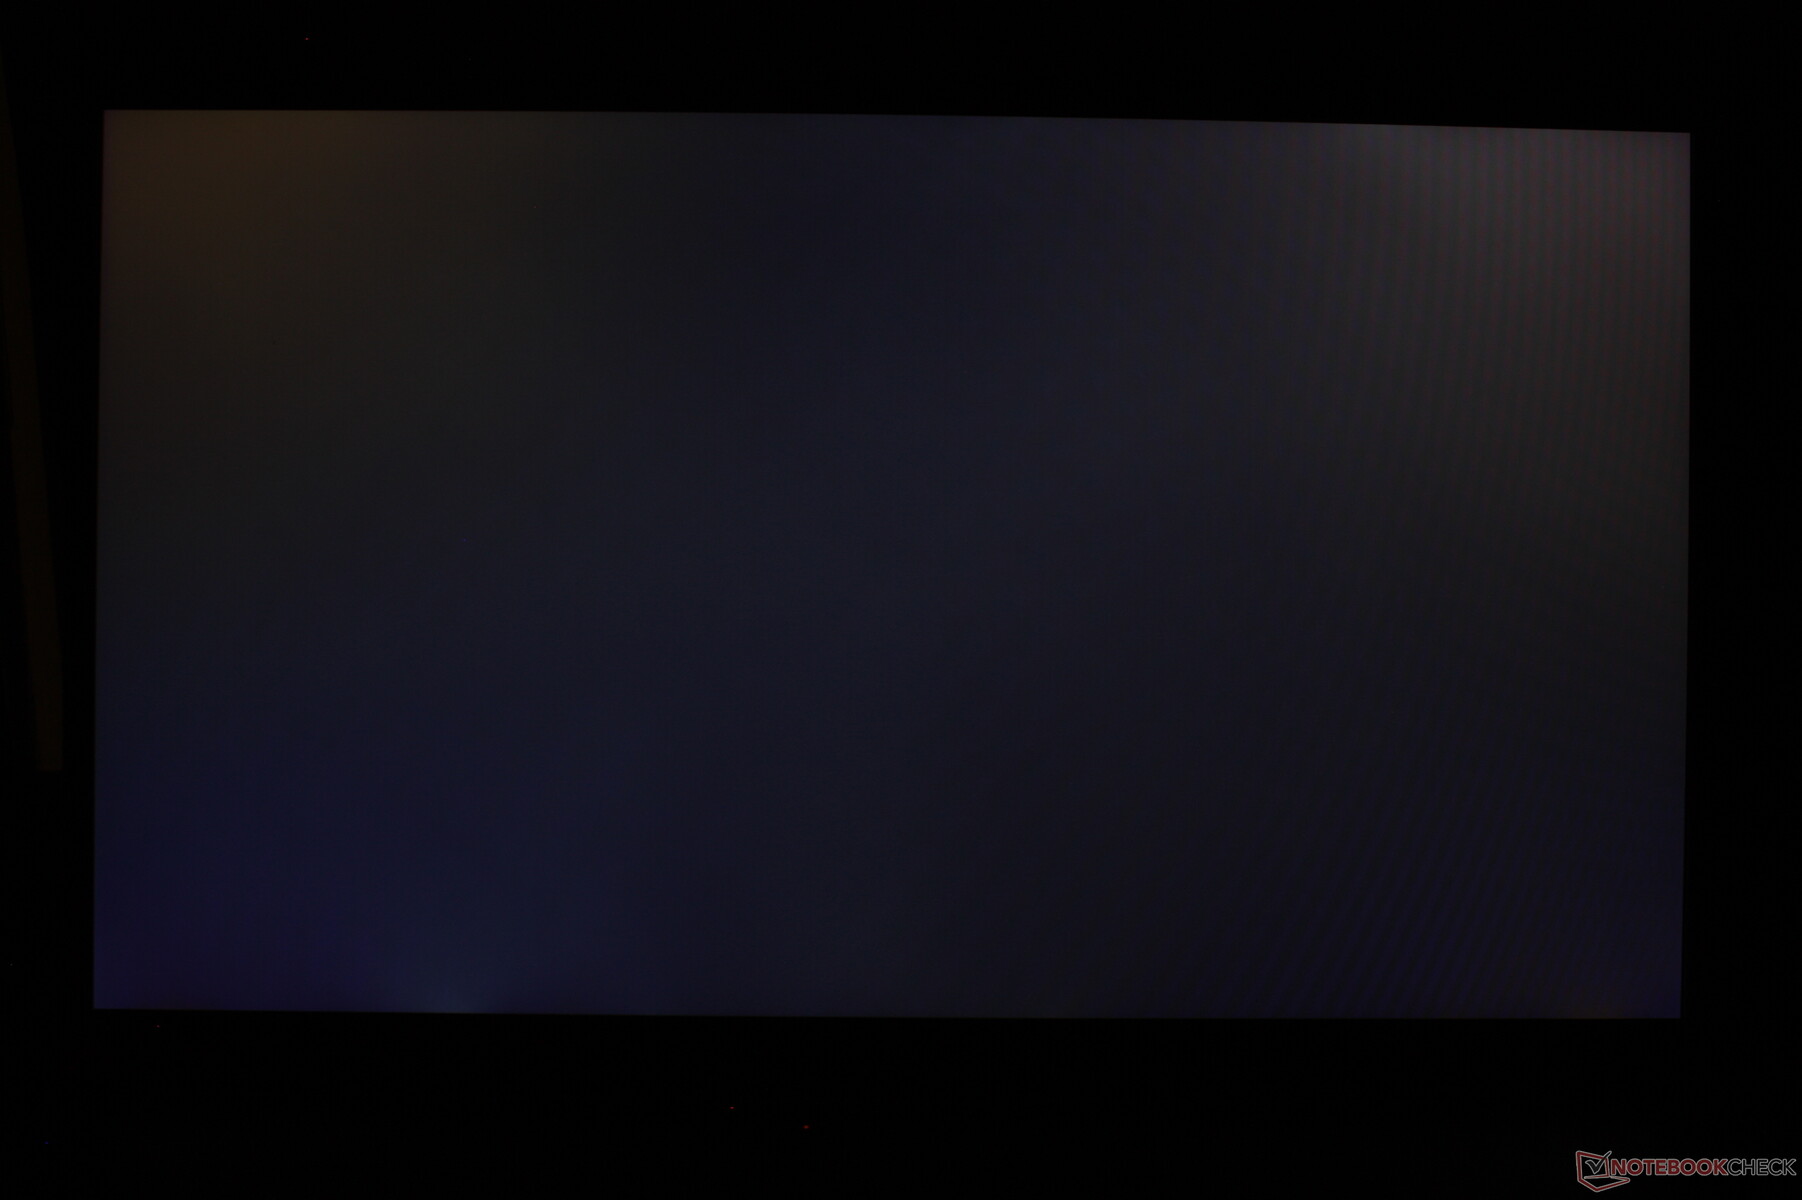
Screen Flickering / PWM (Pulse-Width Modulation)
| Screen flickering / PWM not detected | 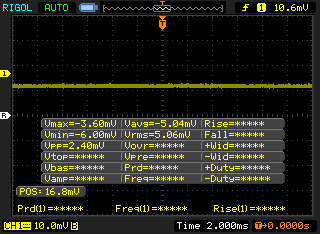 | ||
In comparison: 52 % of all tested devices do not use PWM to dim the display. If PWM was detected, an average of 7798 (minimum: 5 - maximum: 343500) Hz was measured. | |||
Outdoor visibility is poor as the display is not bright enough to overcome so much ambient light. For a budget 17.3-inch gaming laptop, however, this is not uncommon. Viewing angles are otherwise excellent with only slight changes to contrast and colors if viewing from obtuse angles.

Performance
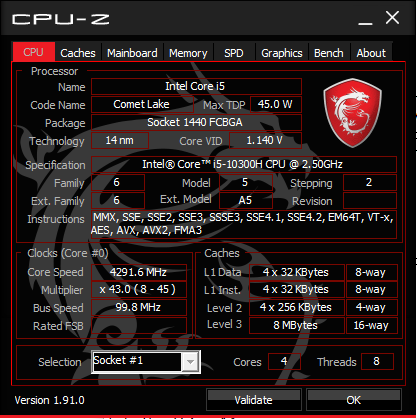
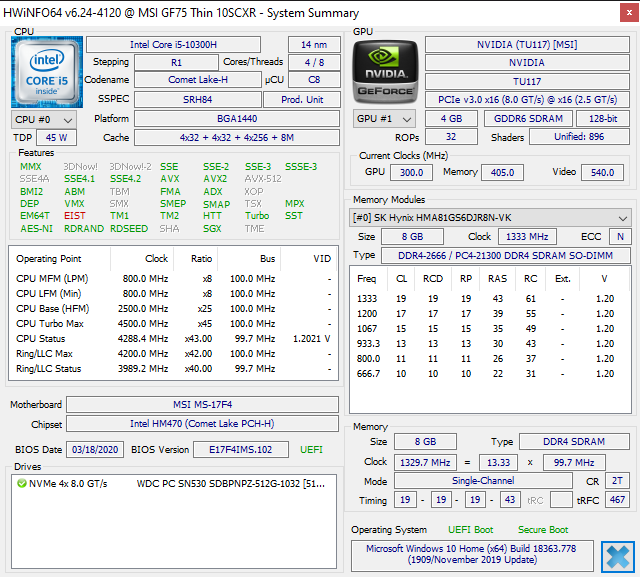
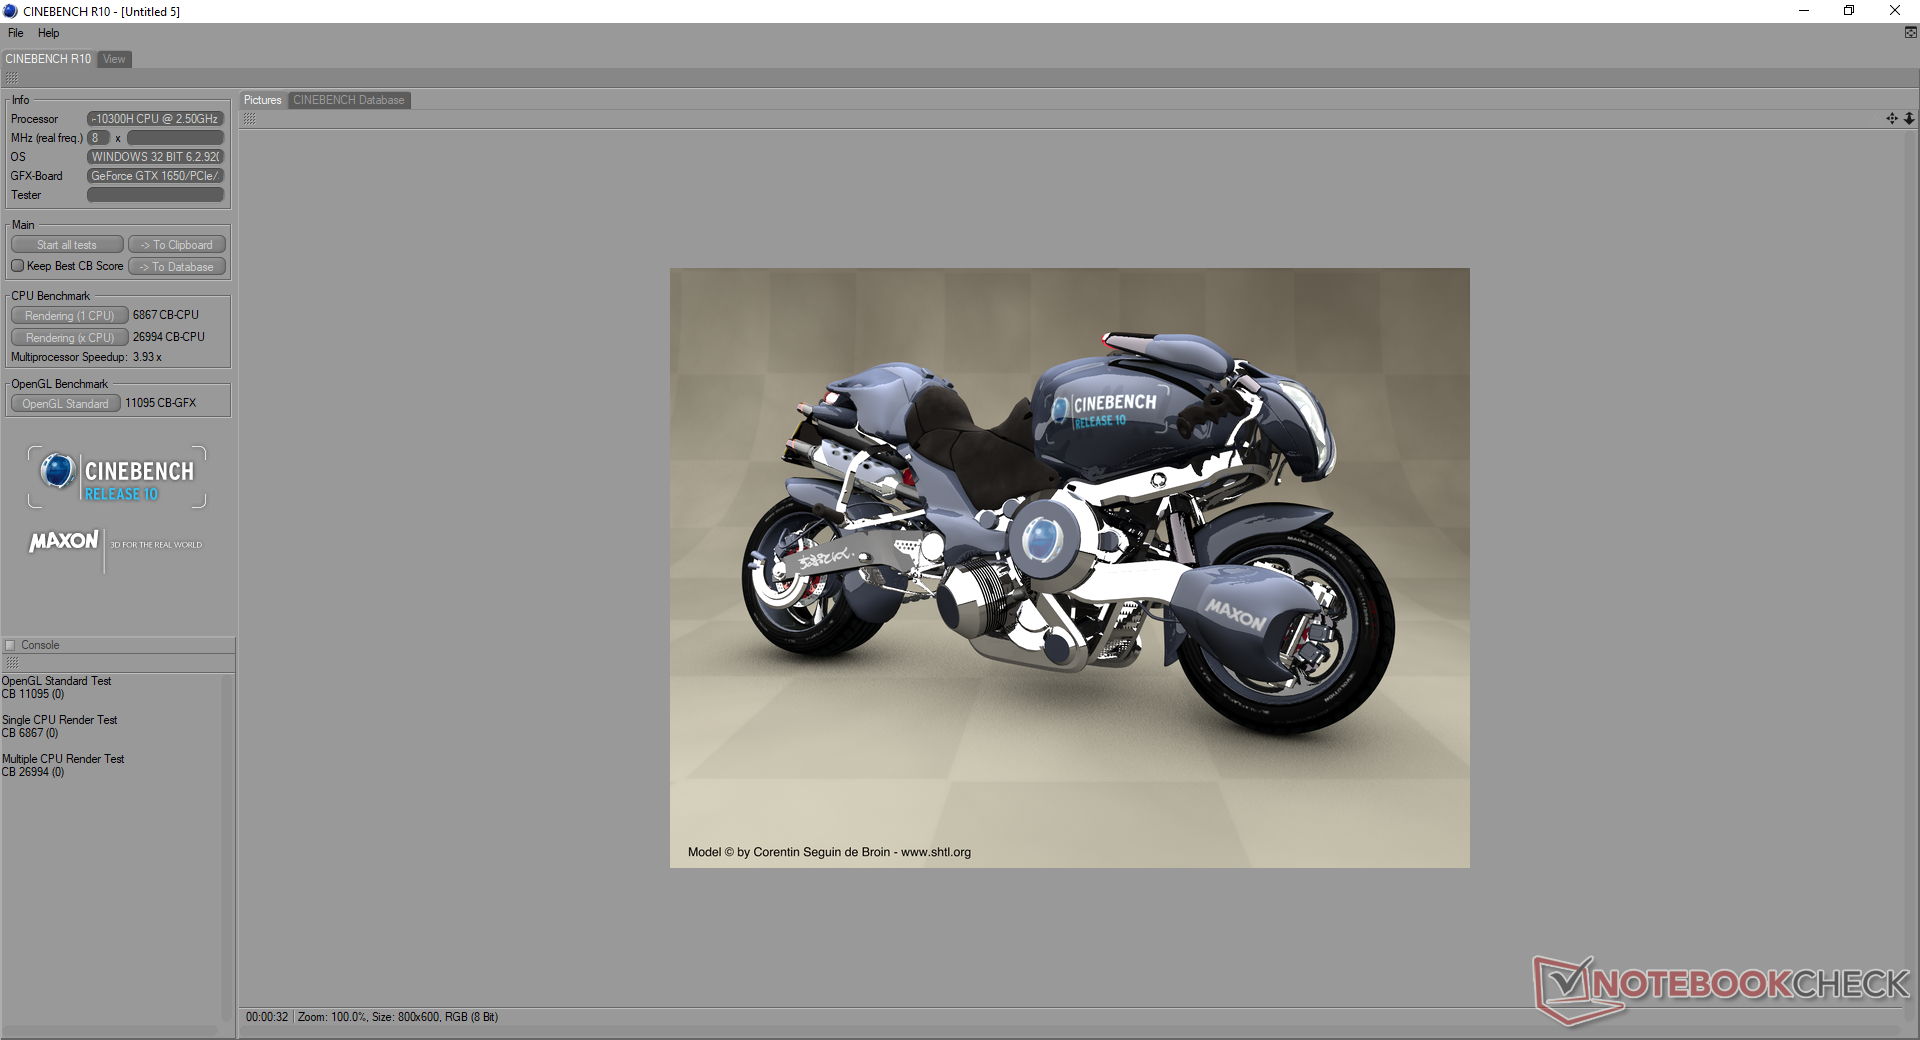
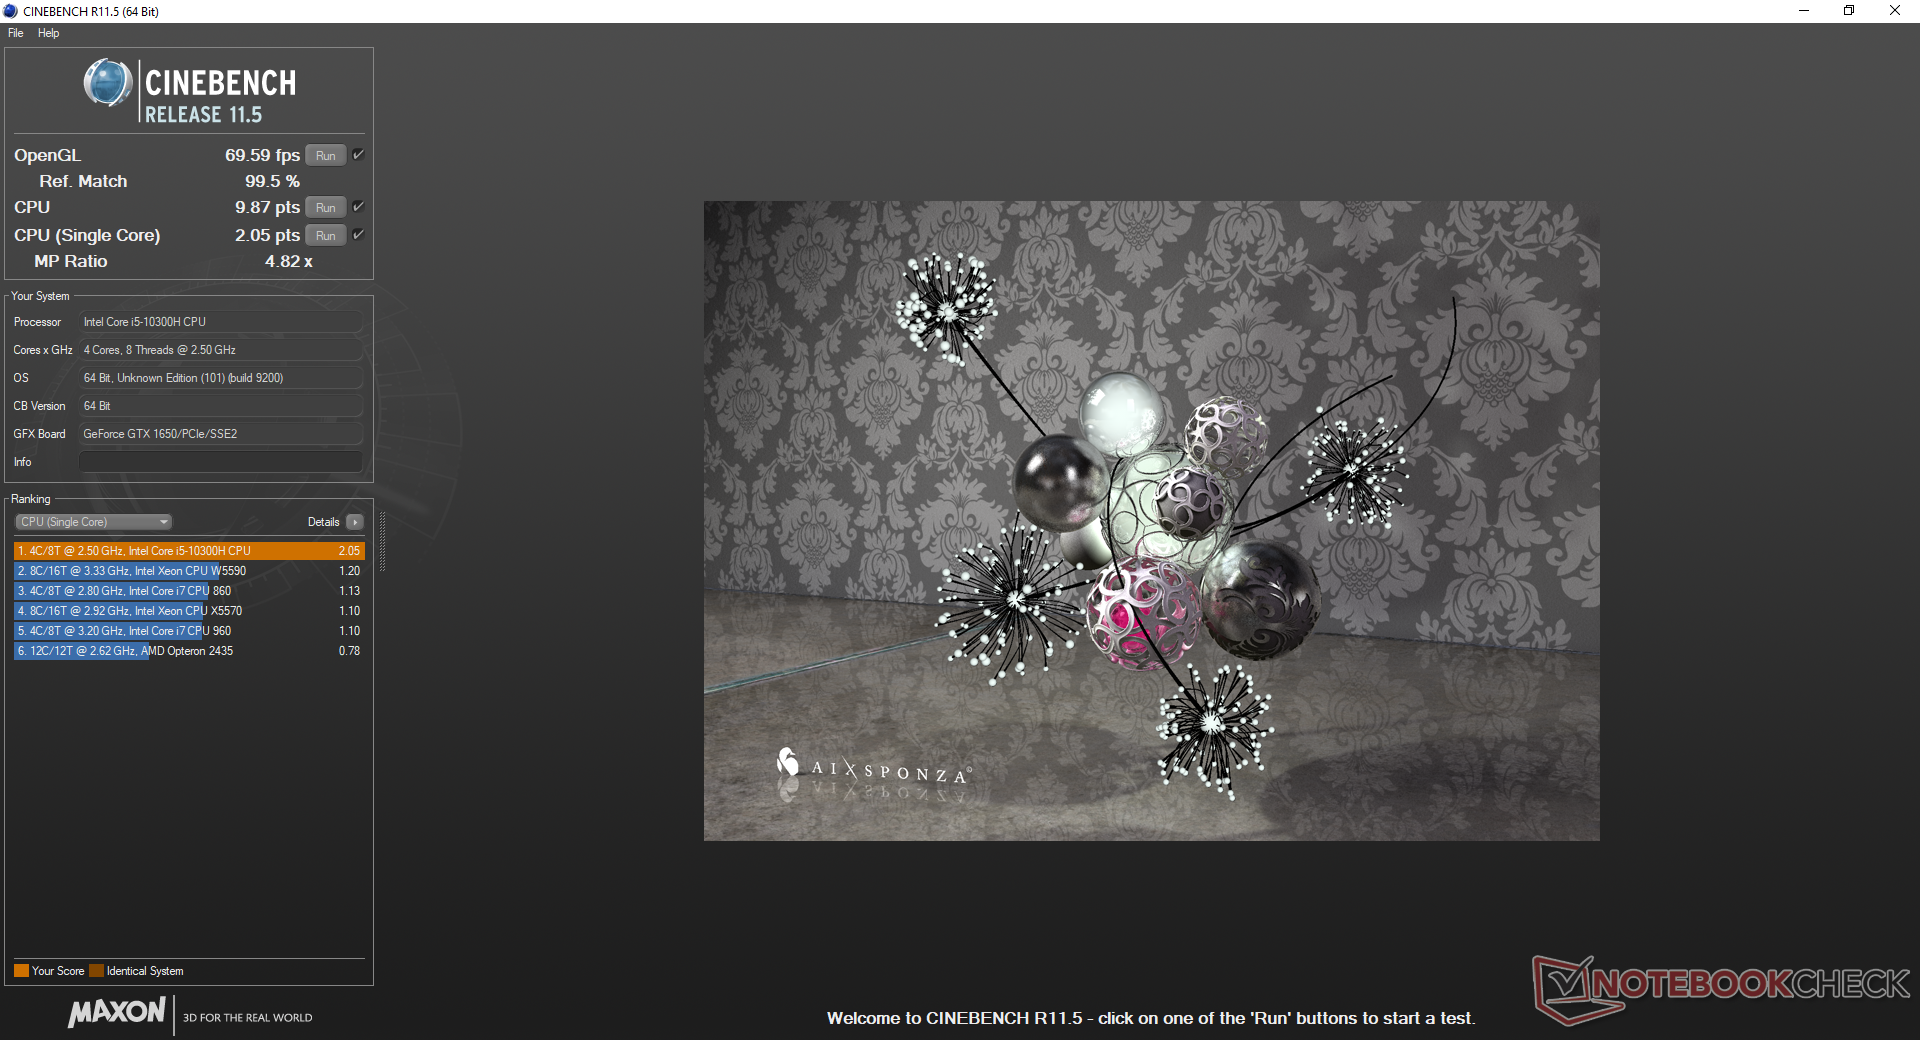
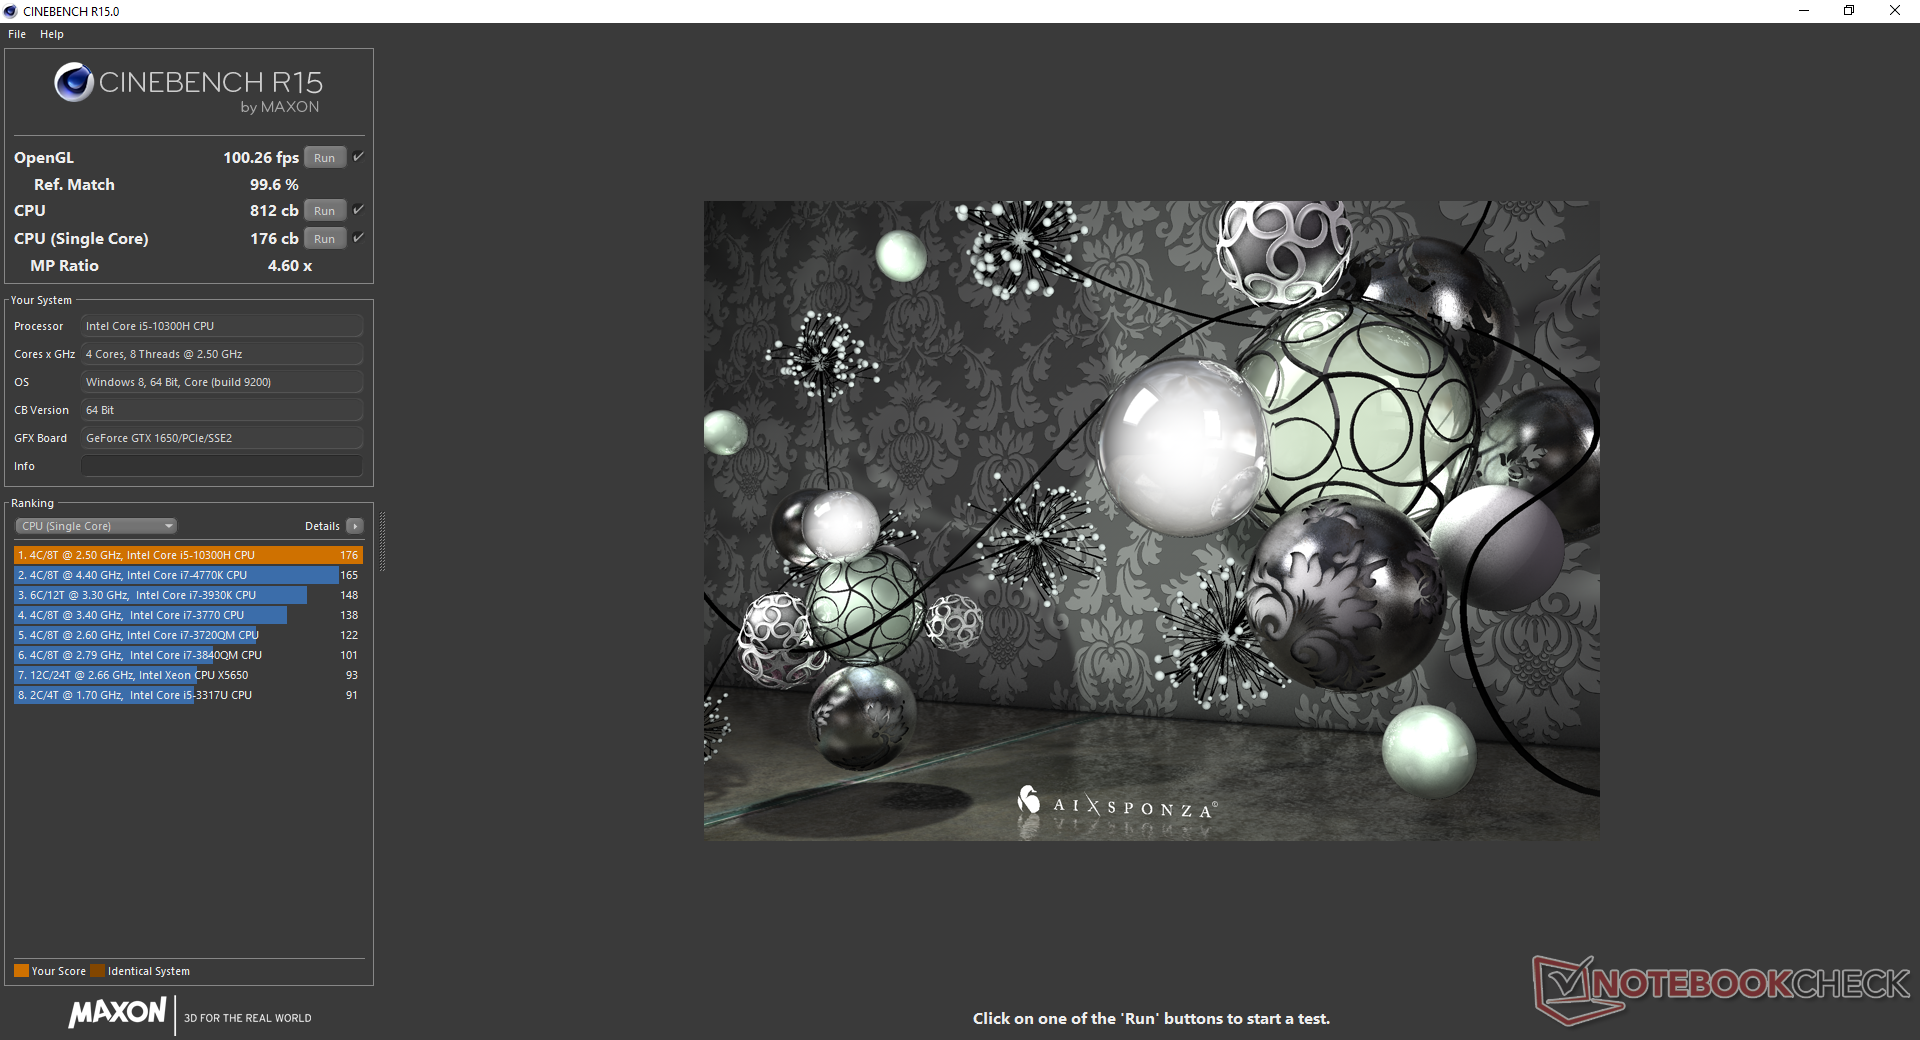
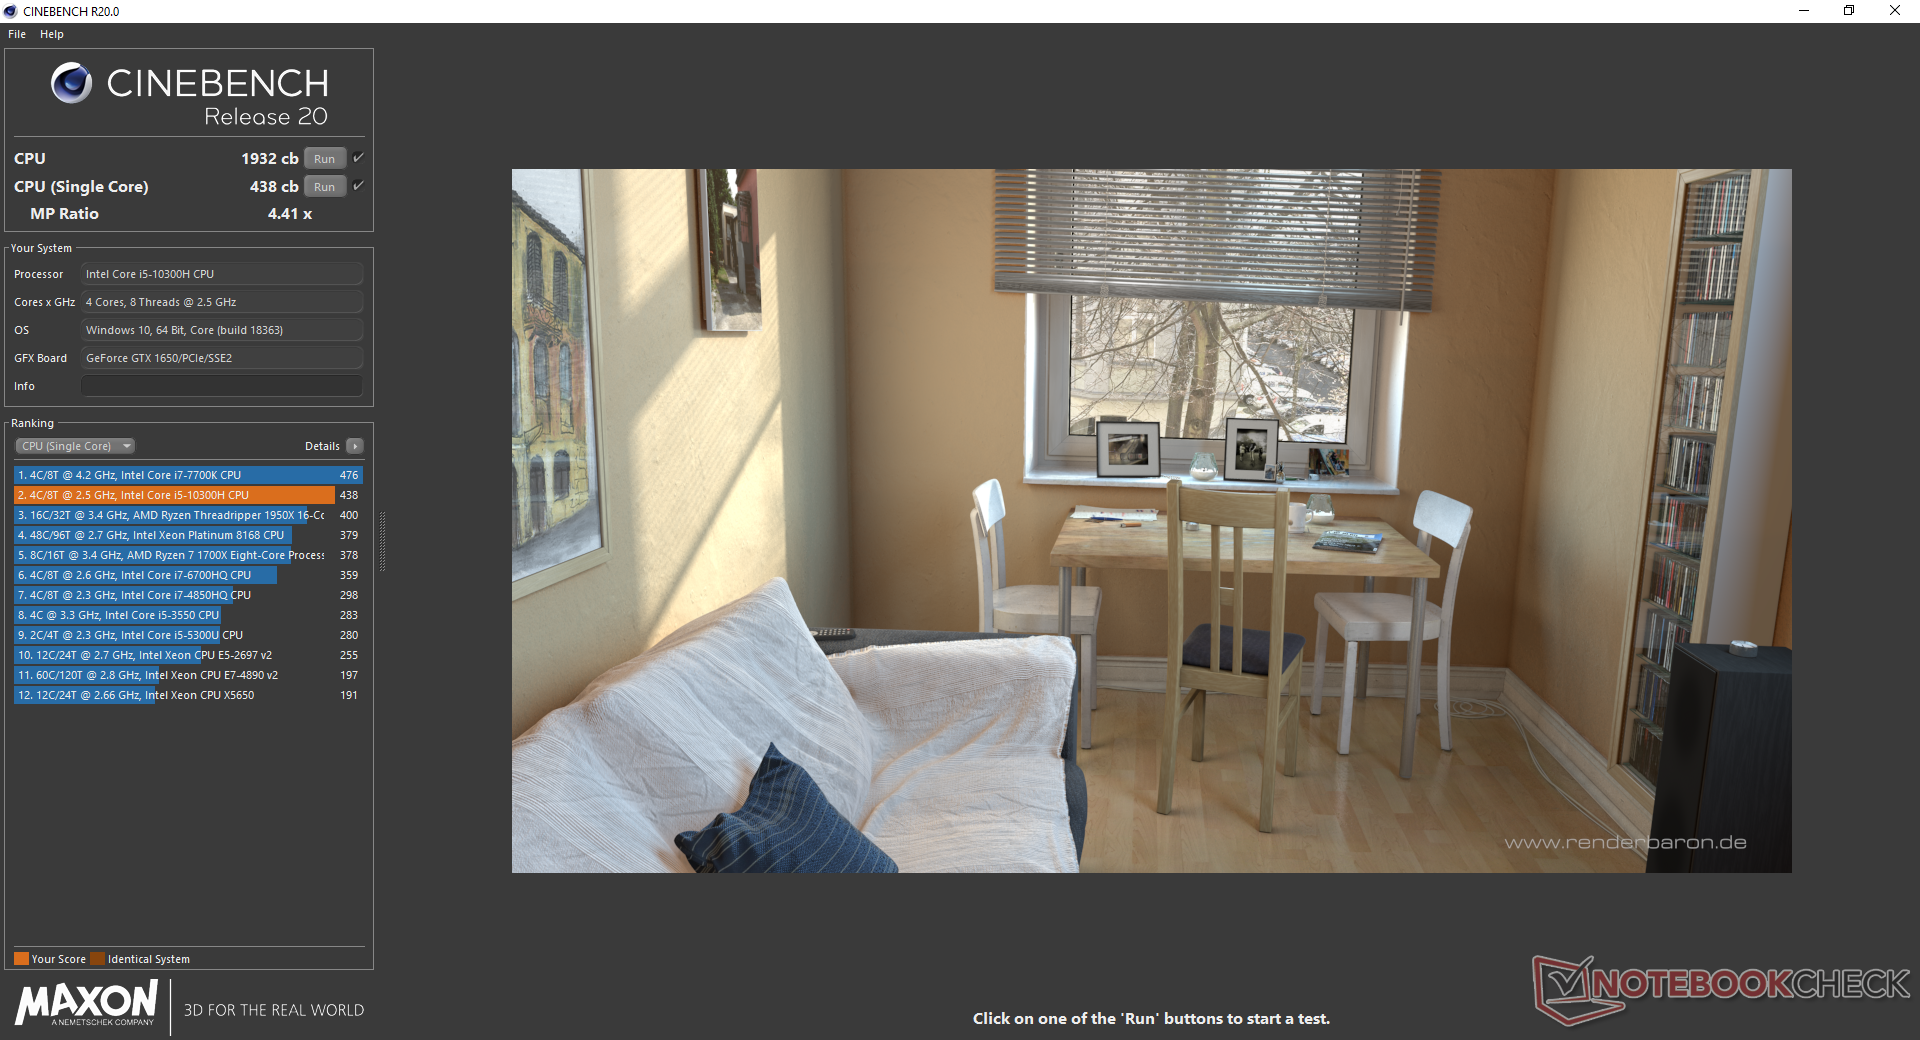
The 10th gen Comet Lake-H Core i5-10300H is designed to replace the 9th gen Coffee Lake-H Core i5-9300H. Unlike some of the newer and pricier 10th gen Core i7 parts, however, the budget Core i5-10300H comes with the same four cores and eight threads as its direct predecessor. Even the 14 nm fabrication process, cache sizes, integrated UHD Graphics 630, and TDP levels are identical gen-to-gen. Raw performance gains are therefore expected to be minimal.
The most comparable AMD options would be the 2nd gen Zen+ quad-core Ryzen 5 3550H or Ryzen 7 3750H launched early last year. AMD's newest 3rd gen Renoir Ryzen 5 4600H should easily outperform our Intel Core i5-10300H in multi-threaded loads due to its hexa-core setup.
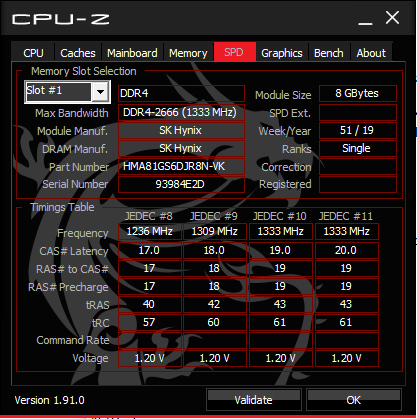
Our configuration comes with just 8 GB of single-channel DDR4-2666 RAM that is fortunately upgradeable to 32 GB.
Processor
As detailed here, the Core i5-10300H offers only marginally faster performance than the last generation Core i5-9300H and even the older Core i5-8300H. The GF63 Thin with the Core i5-9300H, for example, is only 5 to 9 percent slower than our GL75 in multi-threaded workloads and the delta becomes even narrower when looking at single-threaded loads. Only users upgrading from a Core i7-7700HQ or i5-7300HQ or older gaming laptop will see any significant gains.
Running CineBench R15 Multi-Thread in a loop reveals that the MSI system is unable to maintain maximum Turbo Boost indefinitely as shown by the graph below. The initial score of 840 points drops to 770 points over time to represent a performance dip of 8 percent.
See our dedicated page on the Core i5-10300H for more technical information and benchmark comparisons.
| wPrime 2.10 - 1024m | |
| MSI GF75 Thin 10SCXR | |
| Asus ROG Zephyrus G15 GA502DU | |
| Asus Zephyrus G14 GA401IV | |
* ... smaller is better
System Performance
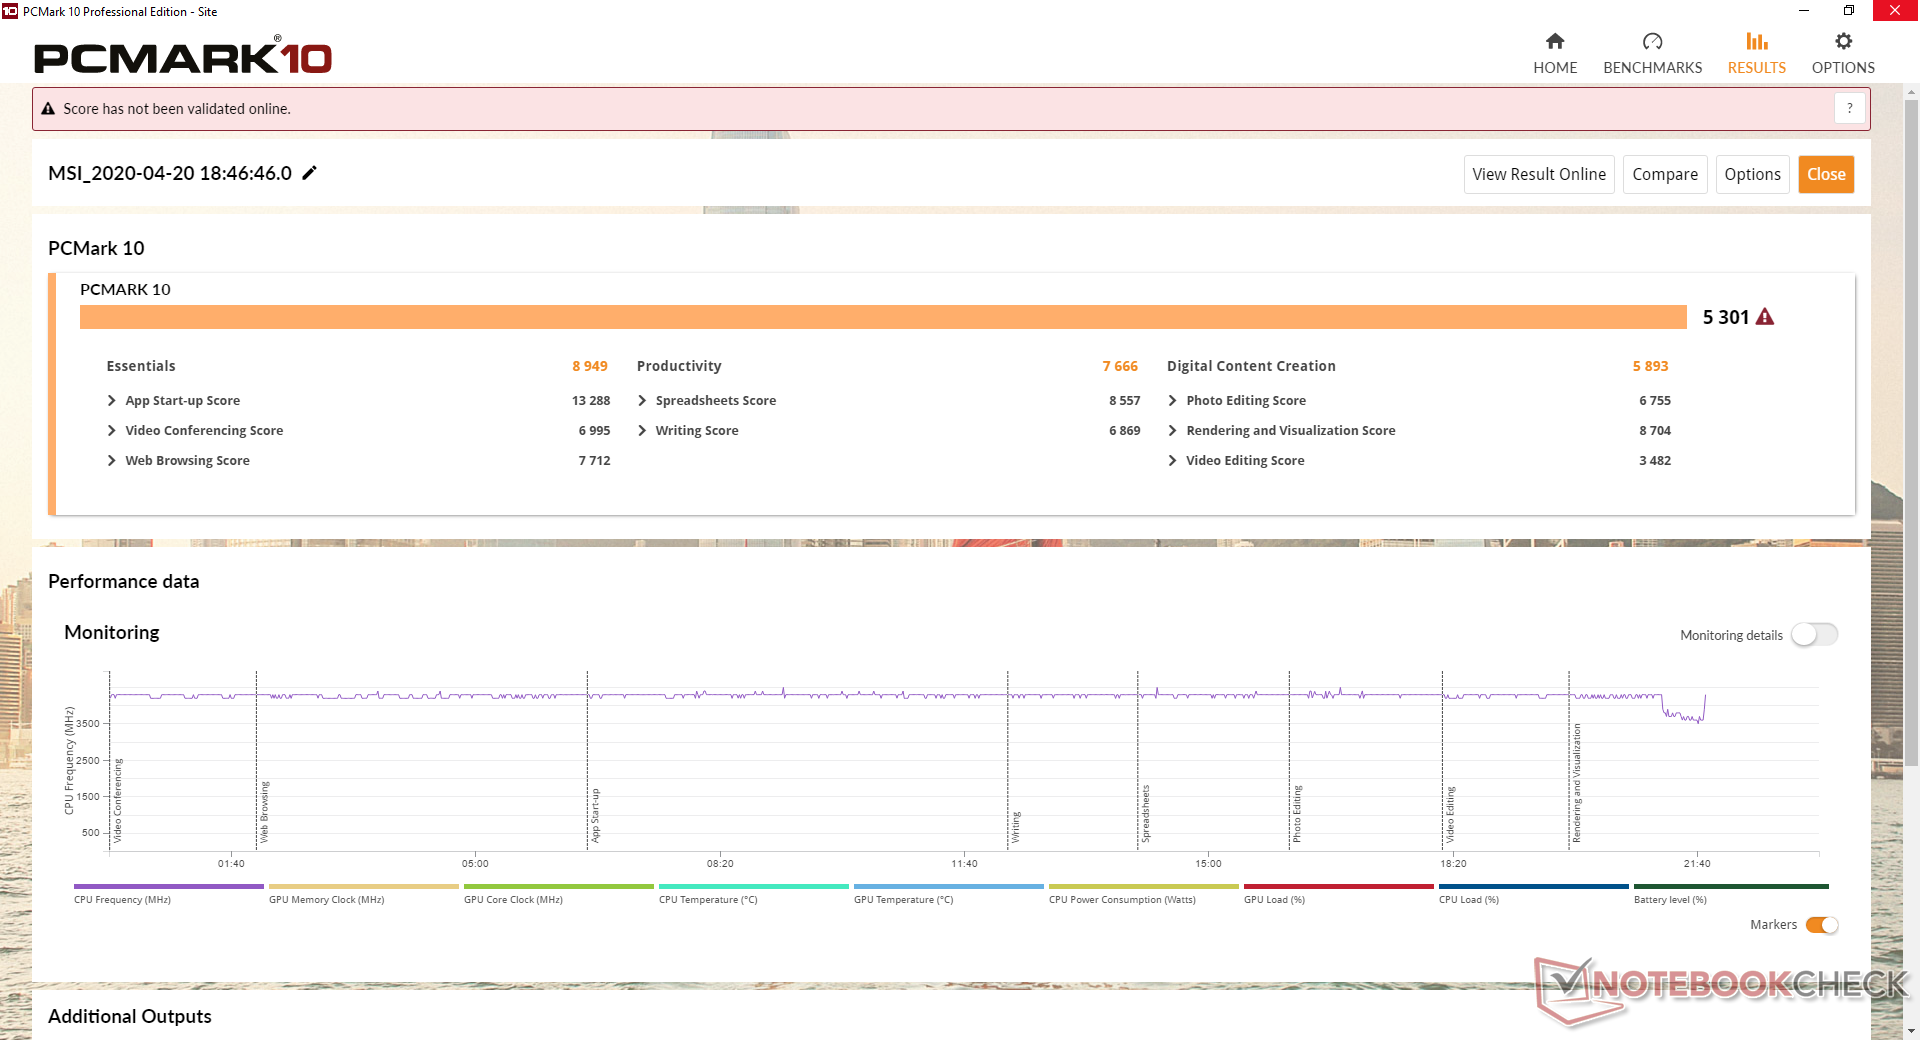
PCMark benchmarks are consistently higher than the MSI GF63 powered by the last-gen Core i5-9300H with slightly slower GTX 1650 Max-Q graphics. The margins are still quite narrow, however, so users shouldn't expect significant speed gains if jumping from 9th gen Intel to 10th gen Intel.
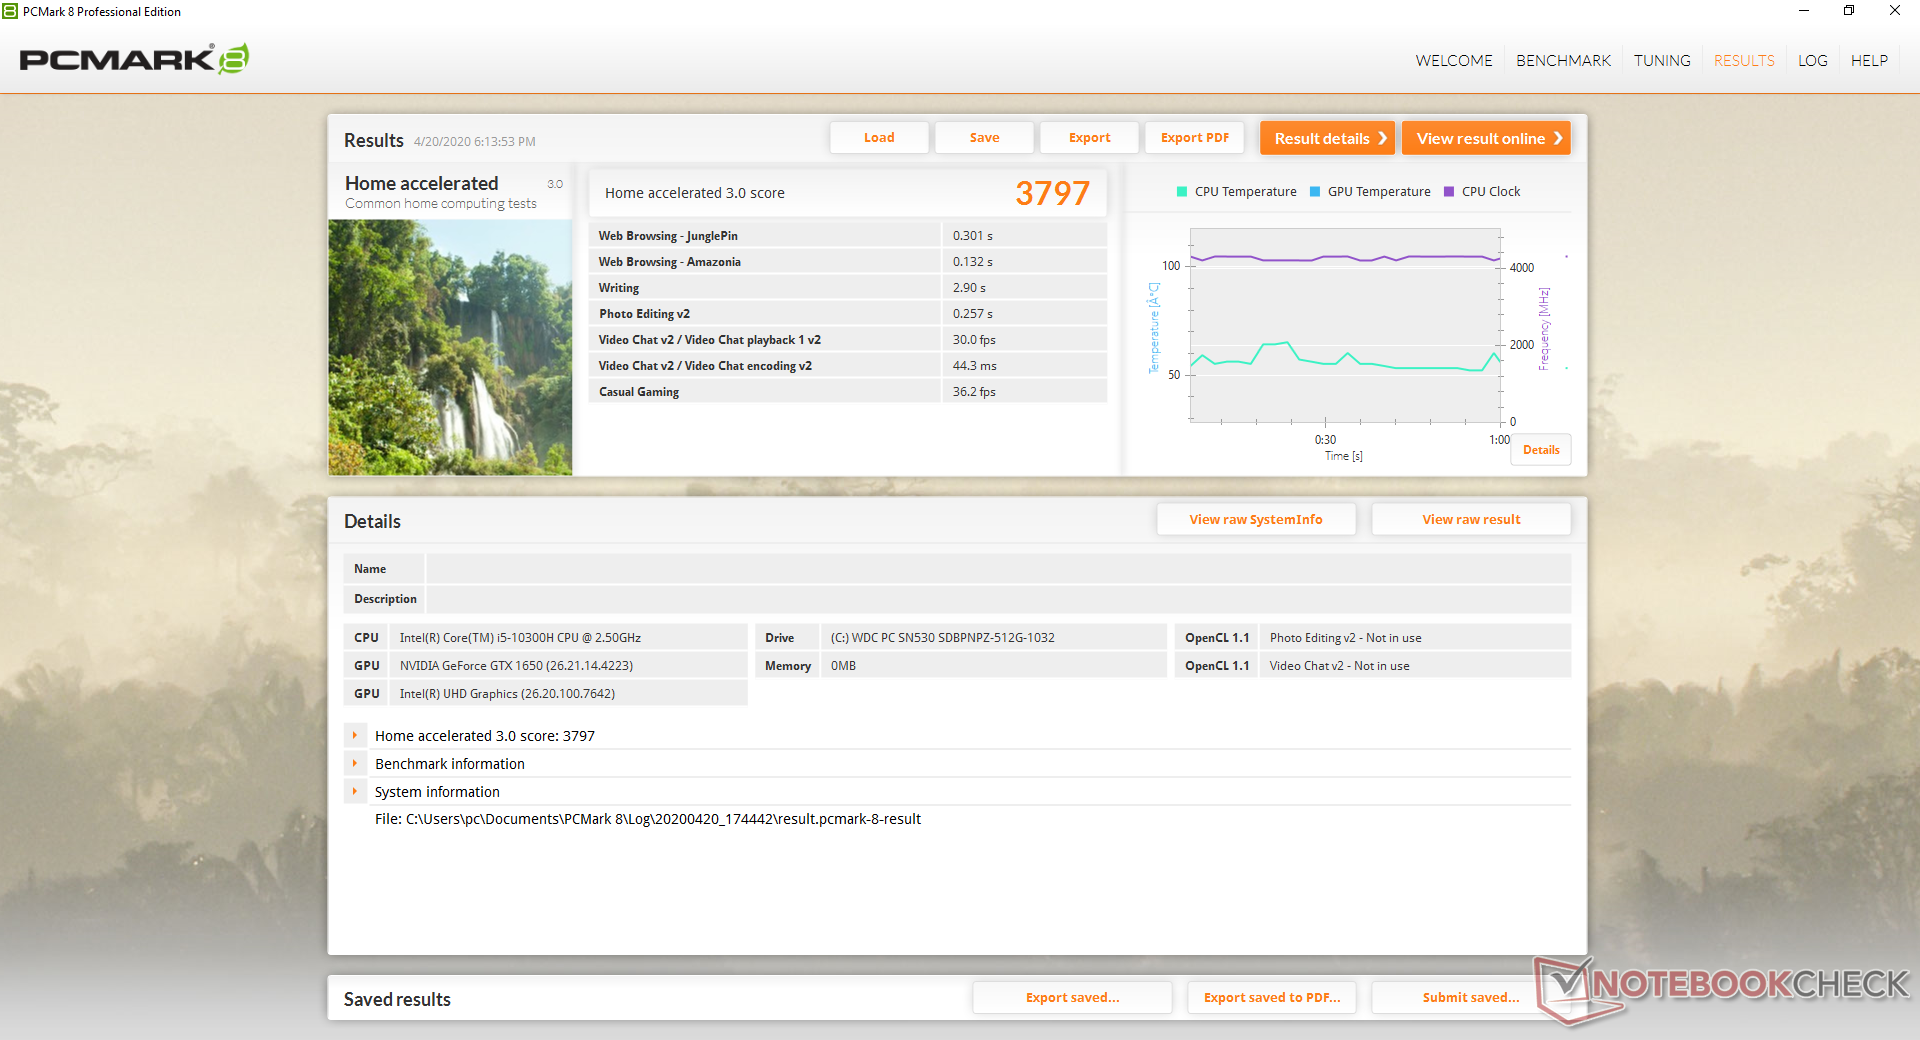
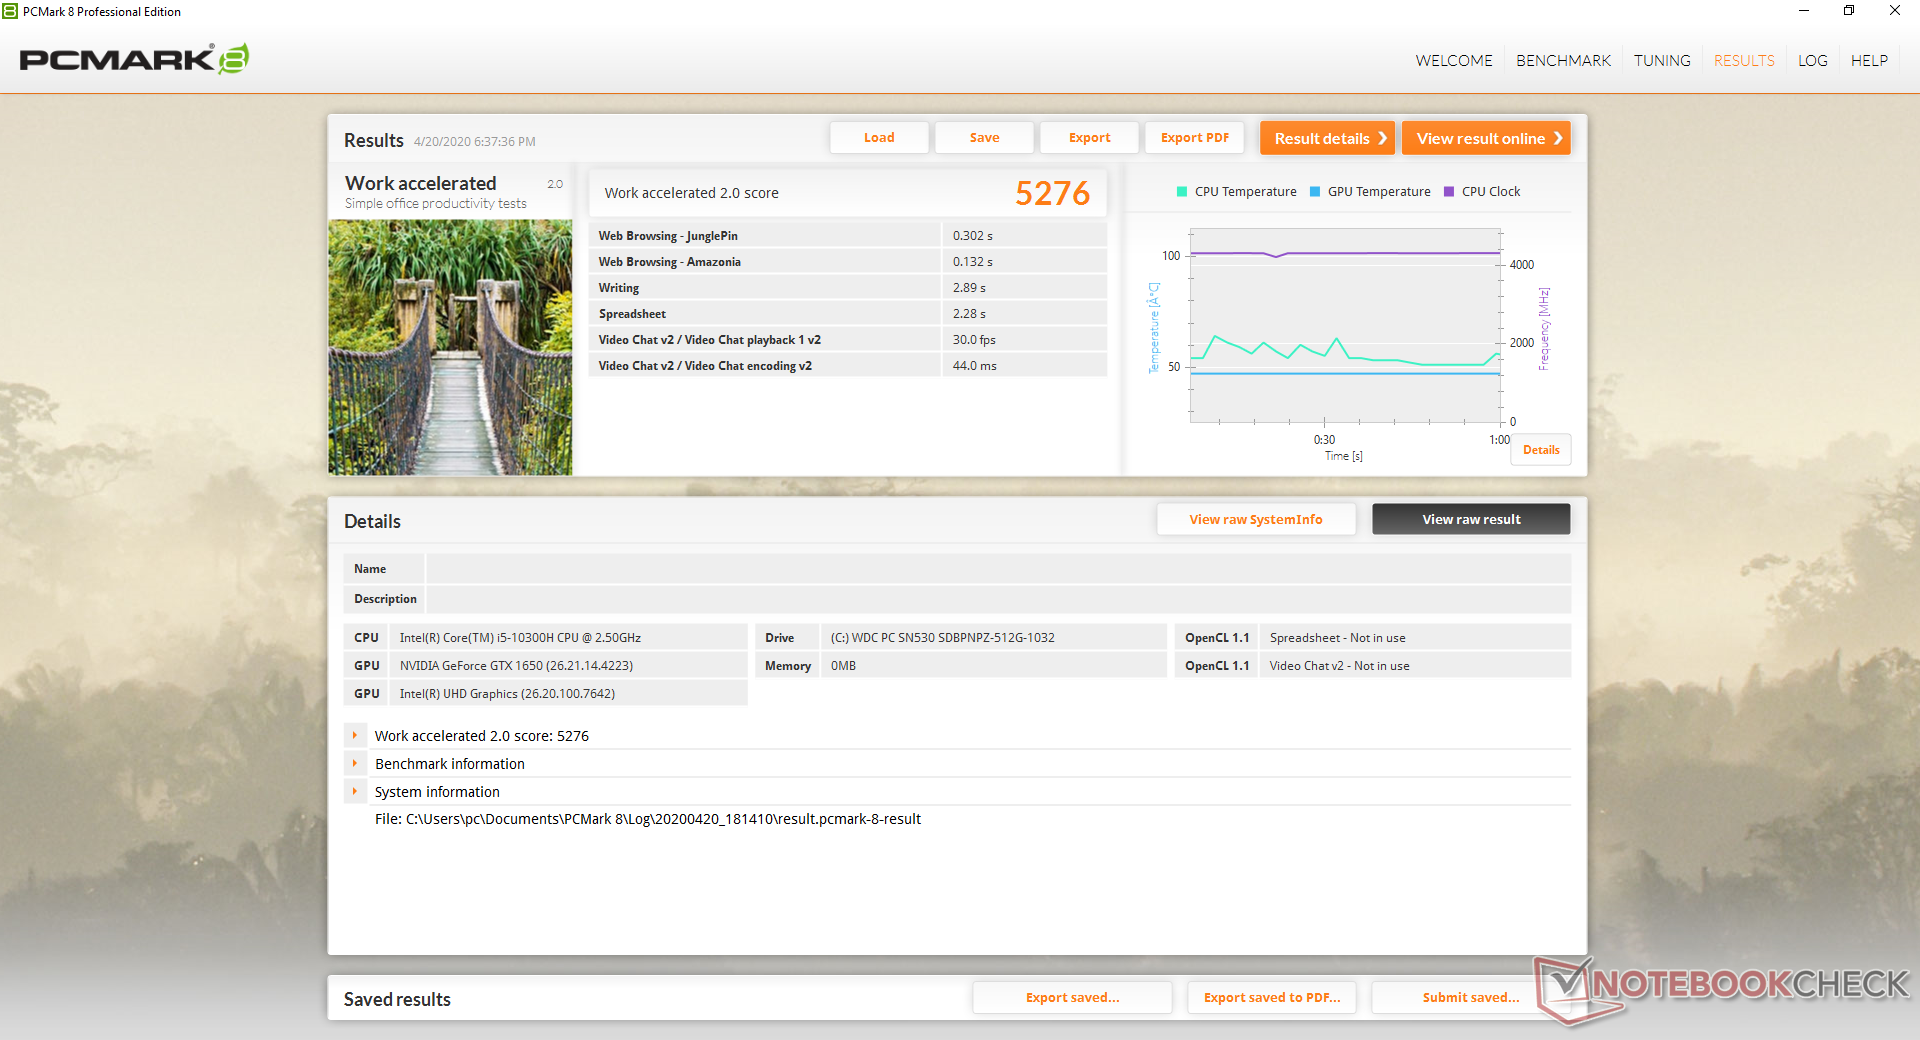
| PCMark 8 Home Score Accelerated v2 | 3797 points | |
| PCMark 8 Work Score Accelerated v2 | 5276 points | |
| PCMark 10 Score | 5301 points | |
Help | ||
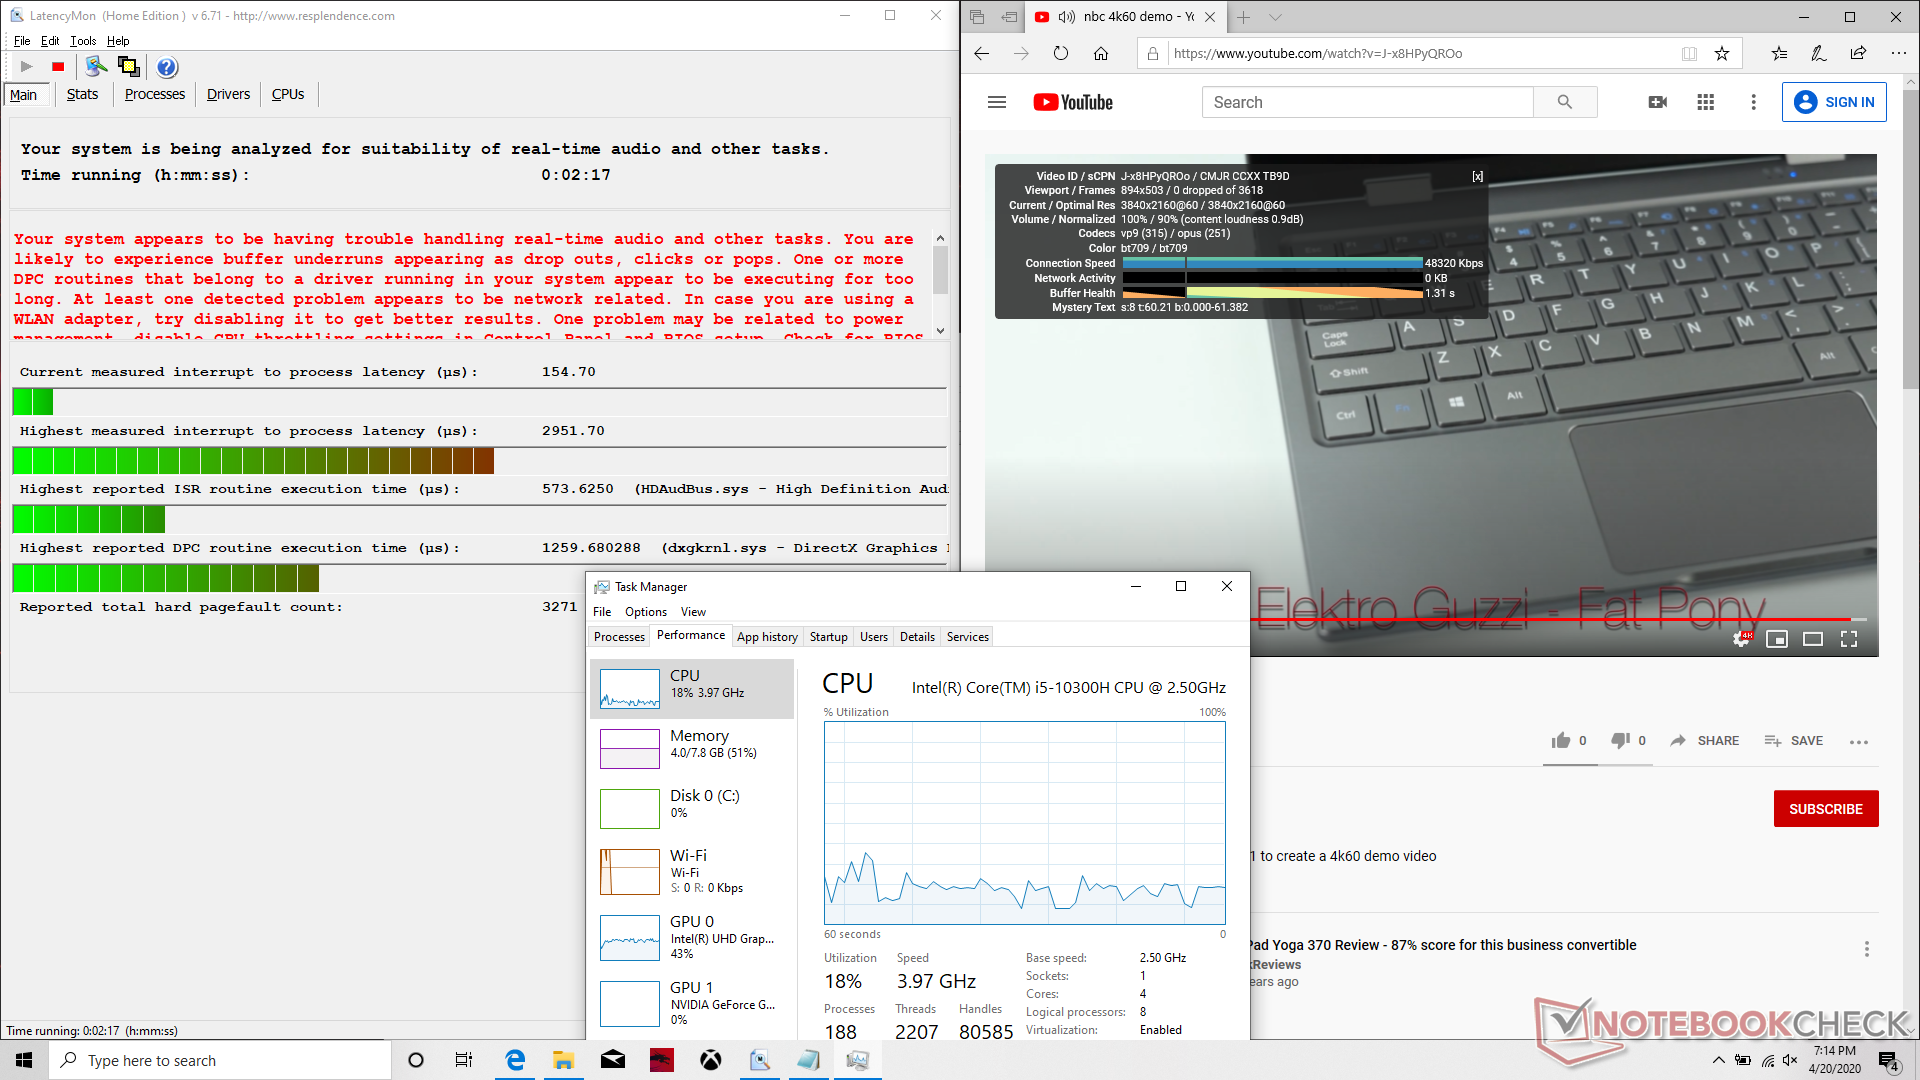
DPC Latency
LatencyMon shows DPC latency issues when opening multiple browser tabs, playing 4K video, and running Prime95 in sequence. On the bright side, we can record no dropped frames during our minute-long 4K video test.
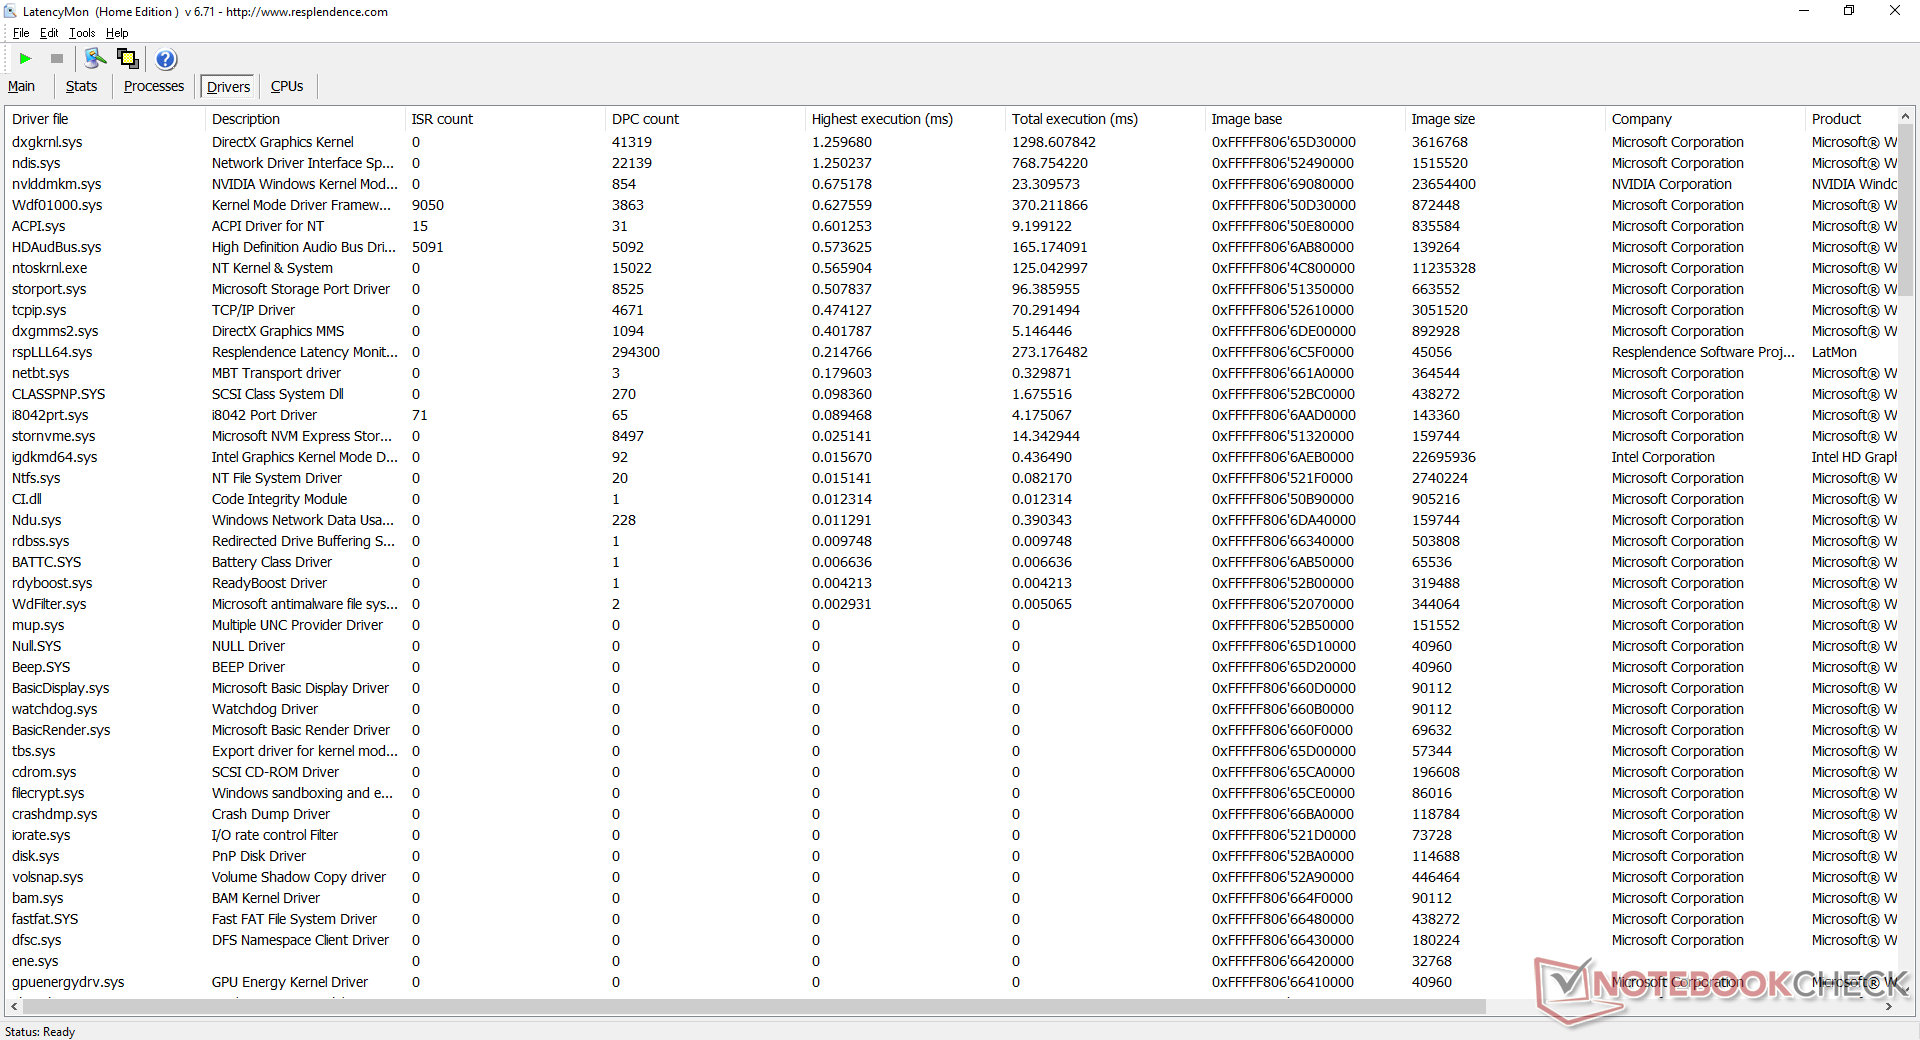
| DPC Latencies / LatencyMon - interrupt to process latency (max), Web, Youtube, Prime95 | |
| MSI GF75 Thin 10SCXR | |
* ... smaller is better
Storage Devices
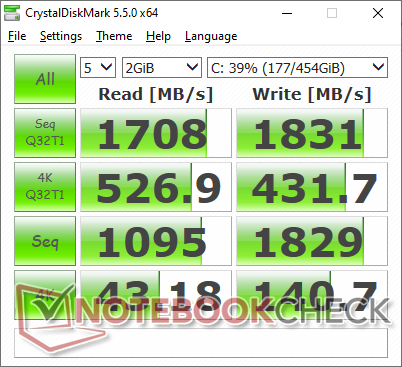
Our unit comes with a Western Digital SN530 SDBPNPZ-512G NVMe M.2 drive with sequential read and write rates of about 1000 MB/s and 1700 MB/s, respectively, according to AS SSD. It's not guaranteed that all SKUs will come with WD drives, however, as MSI and resellers may source from multiple manufacturers. Users can add an internal secondary 2.5-inch 2.5-inch SATA III drive to expand storage space.
See our table of HDDs and SSDs for more benchmark comparisons.
| MSI GF75 Thin 10SCXR WDC PC SN530 SDBPNPZ-512G | Acer Aspire Nitro 5 AN517-51-7887 WDC PC SN520 SDAPNUW-512G | MSI GF75 Thin 9SC Crucial P1 SSD CT1000P1SSD8 | MSI GP75 Leopard 9SD Kingston RBUSNS8154P3256GJ1 | Asus ROG Strix G GL731GU-RB74 Intel SSD 660p SSDPEKNW512G8 | |
|---|---|---|---|---|---|
| AS SSD | 42% | 30% | -45% | 22% | |
| Seq Read (MB/s) | 1007 | 1578 57% | 1079 7% | 748 -26% | 1319 31% |
| Seq Write (MB/s) | 1755 | 1381 -21% | 1566 -11% | 219 -88% | 930 -47% |
| 4K Read (MB/s) | 39.88 | 44.79 12% | 48.68 22% | 25.7 -36% | 49.43 24% |
| 4K Write (MB/s) | 111.6 | 108.7 -3% | 106.7 -4% | 82.4 -26% | 104.3 -7% |
| 4K-64 Read (MB/s) | 751 | 1045 39% | 656 -13% | 259.3 -65% | 321.9 -57% |
| 4K-64 Write (MB/s) | 402.6 | 1121 178% | 751 87% | 190.2 -53% | 774 92% |
| Access Time Read * (ms) | 0.084 | 0.083 1% | 0.044 48% | 0.159 -89% | 0.055 35% |
| Access Time Write * (ms) | 0.151 | 0.034 77% | 0.131 13% | 0.058 62% | 0.138 9% |
| Score Read (Points) | 892 | 1248 40% | 812 -9% | 360 -60% | 503 -44% |
| Score Write (Points) | 690 | 1368 98% | 1014 47% | 294 -57% | 971 41% |
| Score Total (Points) | 2085 | 3252 56% | 2281 9% | 821 -61% | 1731 -17% |
| Copy ISO MB/s (MB/s) | 1828 | 1254 -31% | 1414 -23% | 1707 -7% | |
| Copy Program MB/s (MB/s) | 307.2 | 443.8 44% | 531 73% | 852 177% | |
| Copy Game MB/s (MB/s) | 532 | 722 36% | 1483 179% | 930 75% | |
| CrystalDiskMark 5.2 / 6 | -15% | 7% | -41% | -6% | |
| Write 4K (MB/s) | 140.7 | 104.6 -26% | 133 -5% | 105.8 -25% | 127.6 -9% |
| Read 4K (MB/s) | 43.18 | 39.76 -8% | 55.6 29% | 27.89 -35% | 56 30% |
| Write Seq (MB/s) | 1829 | 1268 -31% | 1623 -11% | 270.8 -85% | 986 -46% |
| Read Seq (MB/s) | 1095 | 1414 29% | 1386 27% | 879 -20% | 1605 47% |
| Write 4K Q32T1 (MB/s) | 431.7 | 287.9 -33% | 501 16% | 273.3 -37% | 451.5 5% |
| Read 4K Q32T1 (MB/s) | 527 | 381.1 -28% | 584 11% | 361.2 -31% | 343.3 -35% |
| Write Seq Q32T1 (MB/s) | 1831 | 1319 -28% | 1696 -7% | 253 -86% | 983 -46% |
| Read Seq Q32T1 (MB/s) | 1708 | 1735 2% | 1572 -8% | 1505 -12% | 1810 6% |
| Write 4K Q8T8 (MB/s) | 768 | ||||
| Read 4K Q8T8 (MB/s) | 1090 | ||||
| Total Average (Program / Settings) | 14% /
21% | 19% /
22% | -43% /
-44% | 8% /
12% |
* ... smaller is better

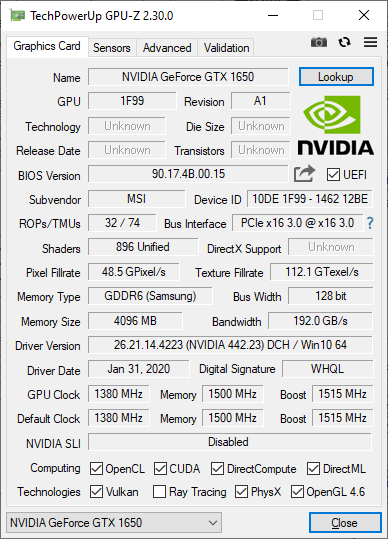
GPU Performance
The GTX 1650 GPU holds no surprises here. 3DMark results are where we expect them to be relative to the average GTX 1650 in our database in spite of the new CPU and limited RAM involved. Performance is much closer to the desktop GTX 1650 whereas the mobile RTX 2060 can be 20 to 25 percent slower than the desktop RTX 2060.
See our dedicated page on the GeForce GTX 1650 mobile for more technical information and benchmark comparisons.
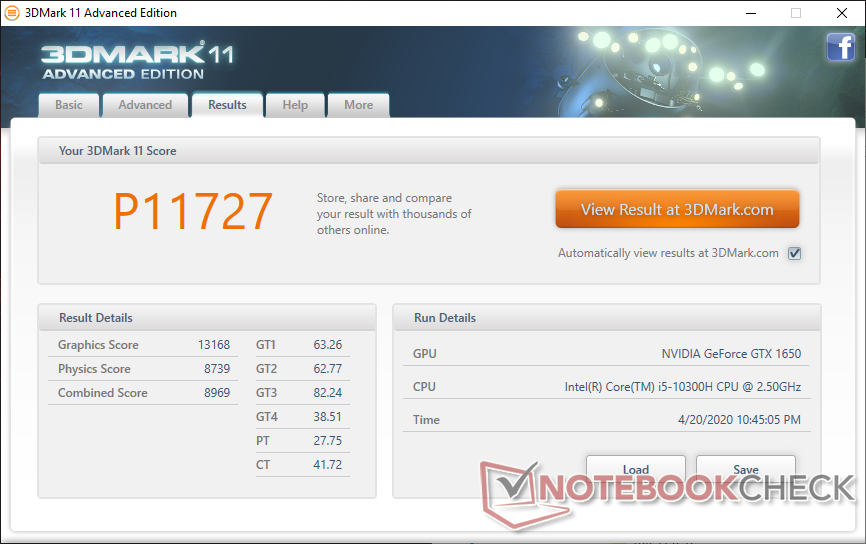

| 3DMark 06 Standard Score | 34955 points | |
| 3DMark 11 Performance | 11727 points | |
| 3DMark Ice Storm Standard Score | 77860 points | |
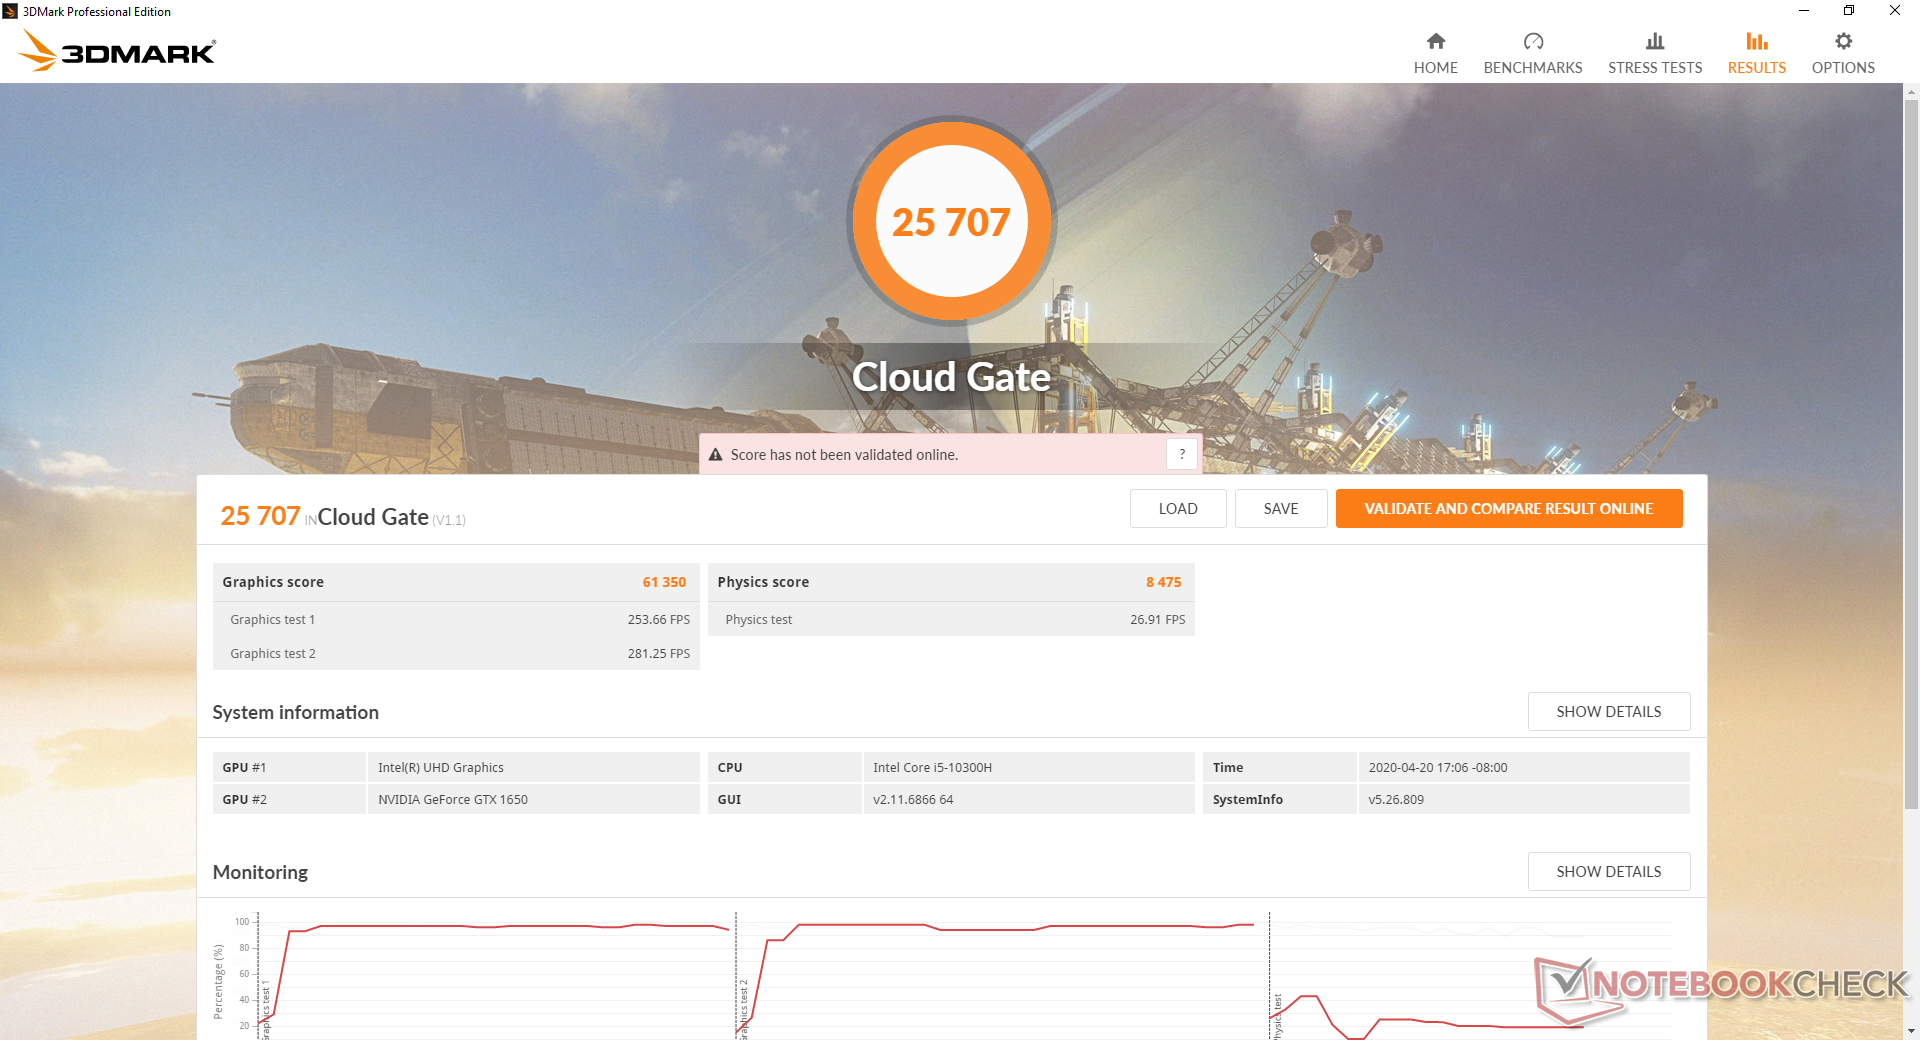
| 3DMark Cloud Gate Standard Score | 25707 points | |
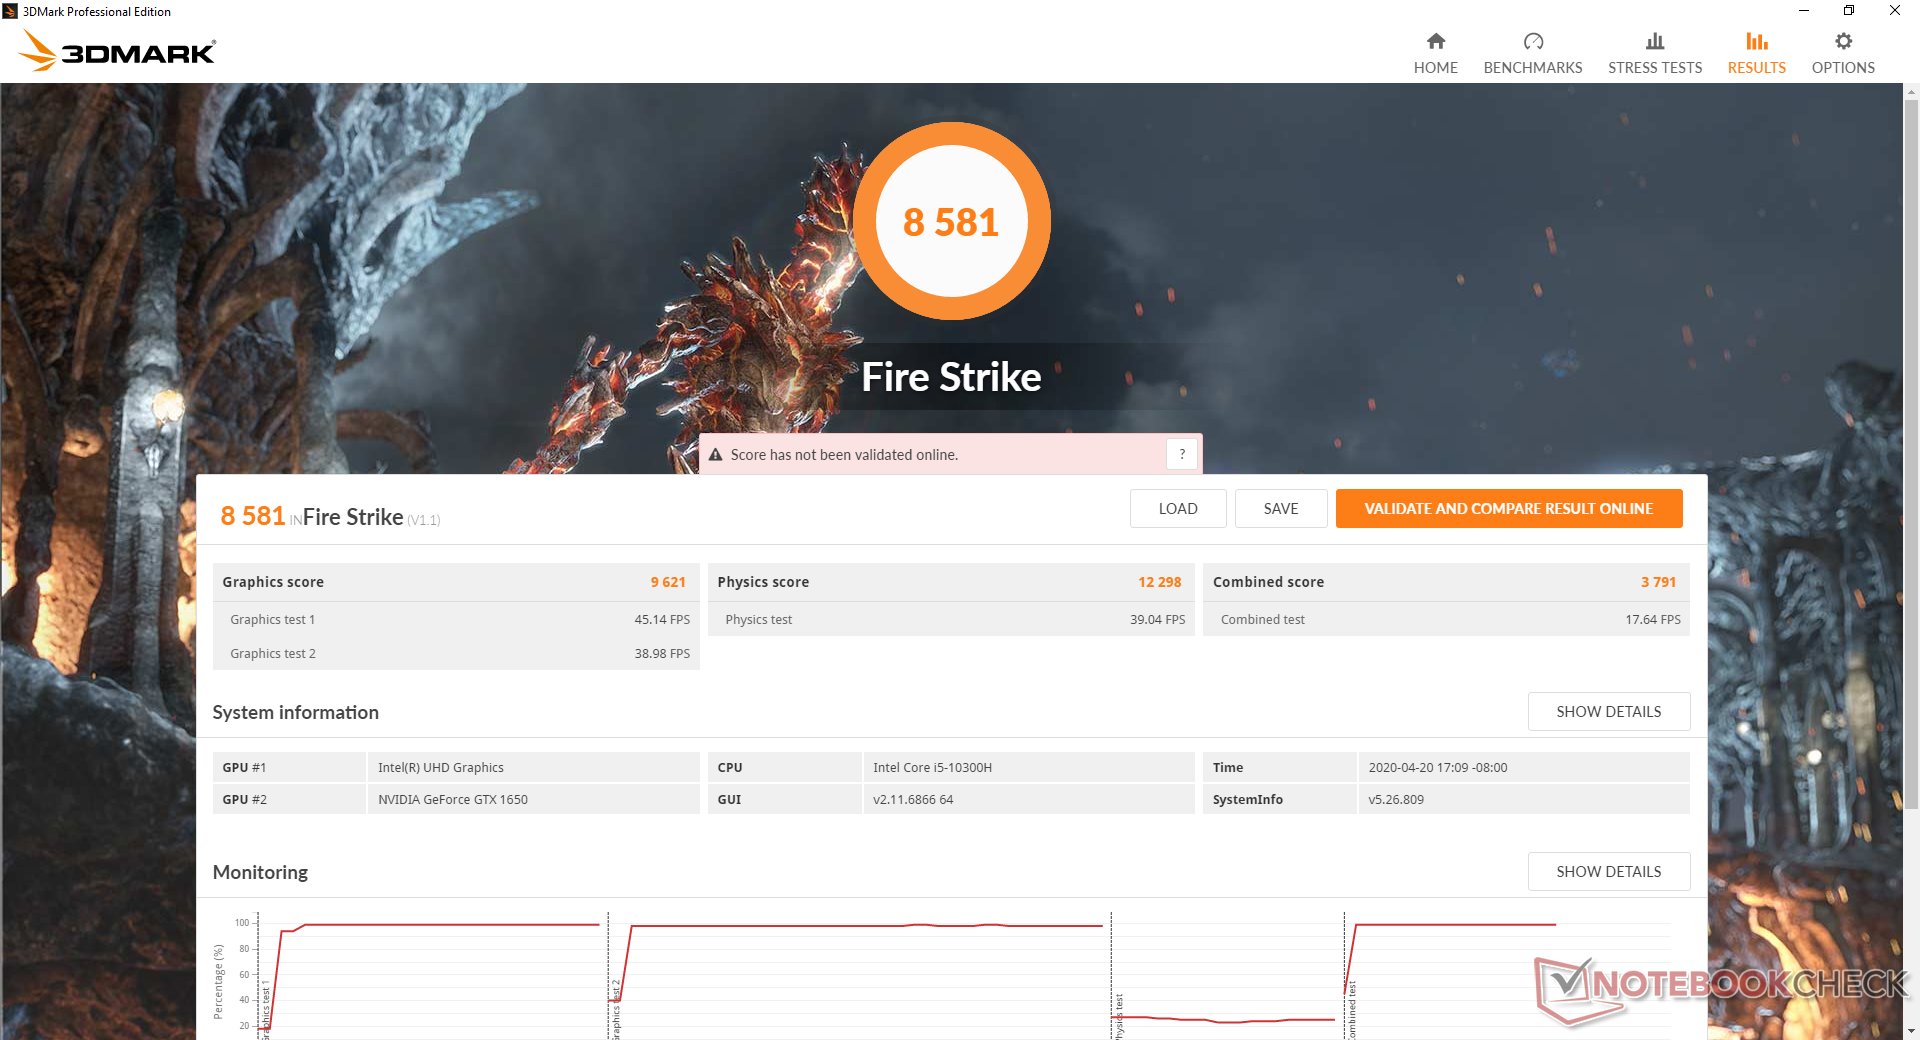
| 3DMark Fire Strike Score | 8581 points | |
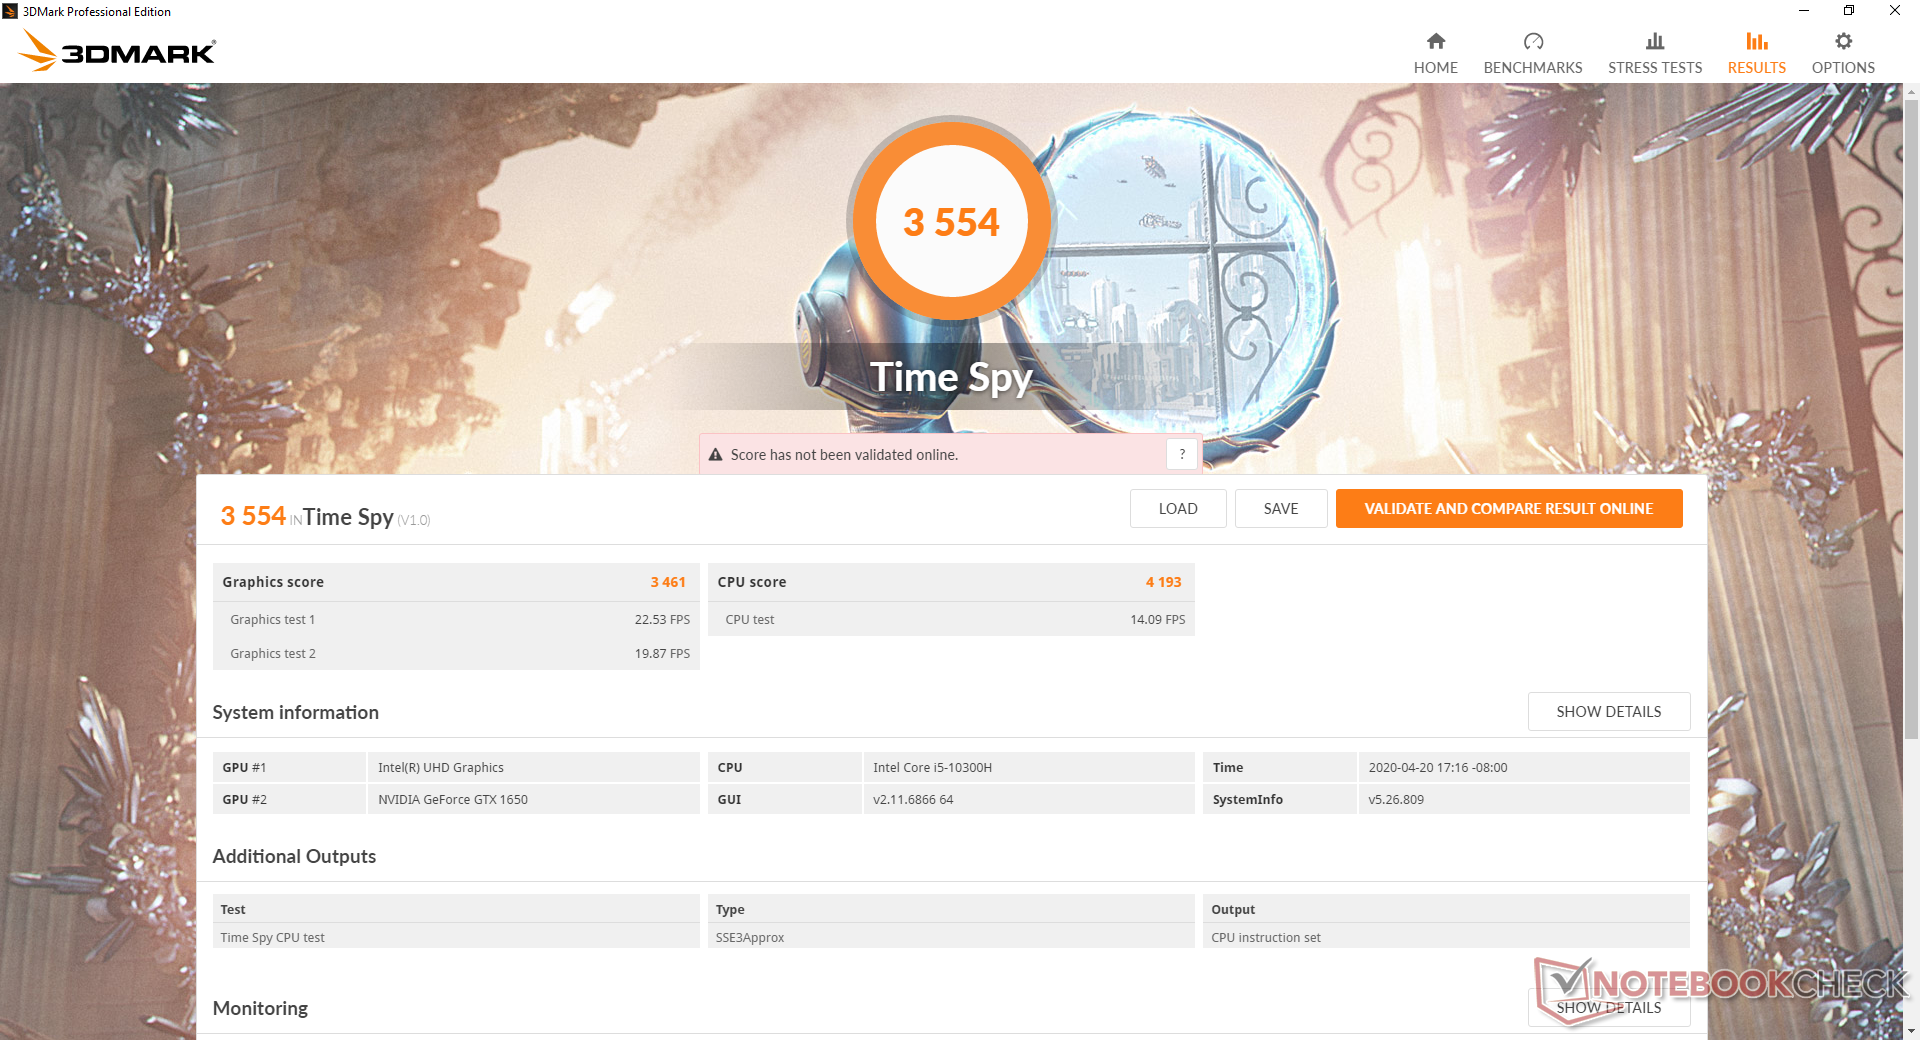
| 3DMark Time Spy Score | 3554 points | |
Help | ||
| The Witcher 3 | |
| 1024x768 Low Graphics & Postprocessing | |
| HP Omen 15-dc0015ng | |
| MSI GF75 Thin 9SC | |
| HP Pavilion Gaming 15-ec0017ng | |
| Dell G3 3590 | |
| MSI GF75 Thin 10SCXR | |
| Average NVIDIA GeForce GTX 1650 Mobile (127 - 209, n=22) | |
| MSI Alpha 15 A3DDK | |
| HP Pavilion Gaming 15-ec0002ng | |
| 1920x1080 Ultra Graphics & Postprocessing (HBAO+) | |
| HP Omen 15-dc0015ng | |
| HP Pavilion Gaming 15-ec0017ng | |
| MSI Alpha 15 A3DDK | |
| MSI GF75 Thin 9SC | |
| MSI GF75 Thin 10SCXR | |
| Asus TUF FX705GM | |
| Dell G3 3590 | |
| Average NVIDIA GeForce GTX 1650 Mobile (29.9 - 40.3, n=31) | |
| HP Pavilion Gaming 15-ec0002ng | |
| Rocket League | |
| 1280x720 Performance | |
| MSI GF75 Thin 10SCXR | |
| HP Pavilion Gaming 15-ec0017ng | |
| Dell G3 3590 | |
| Average NVIDIA GeForce GTX 1650 Mobile (214 - 249, n=5) | |
| 1920x1080 Performance | |
| MSI GF75 Thin 10SCXR | |
| Average NVIDIA GeForce GTX 1650 Mobile (189.8 - 228, n=3) | |
| 1920x1080 Quality AA:Medium FX | |
| HP Pavilion Gaming 15-ec0017ng | |
| MSI GF75 Thin 10SCXR | |
| Average NVIDIA GeForce GTX 1650 Mobile (152.5 - 229, n=6) | |
| Dell G3 3590 | |
| 1920x1080 High Quality AA:High FX | |
| MSI Alpha 15 A3DDK | |
| HP Pavilion Gaming 15-ec0017ng | |
| MSI GF75 Thin 10SCXR | |
| Dell G3 3590 | |
| Average NVIDIA GeForce GTX 1650 Mobile (96.4 - 162.2, n=6) | |
| low | med. | high | ultra | |
|---|---|---|---|---|
| BioShock Infinite (2013) | 241.5 | 212.7 | 200.1 | 93.6 |
| The Witcher 3 (2015) | 169.4 | 116.6 | 70.4 | 37.7 |
| Dota 2 Reborn (2015) | 117 | 104 | 93.7 | 87.5 |
| Rocket League (2017) | 248.4 | 198.5 | 162.2 | |
| X-Plane 11.11 (2018) | 75.7 | 65.1 | 57.4 | |
| Shadow of the Tomb Raider (2018) | 88 | 60 | 51 | 44 |
Emissions
System Noise
Unsurprisingly, fan noise and behavior are almost identical to what we measured on last year's GF75 with the Core i5-9300H. Note that fan noise will always be present even if the system is set to "Silent" mode.
Expect a fan noise of around 40 dB(A) when gaming to be quieter than most gaming laptops. If running extreme loads like Prime95 or FurMark, fan noise will jump to 46 dB(A).
Enabling Cooler Boost with the Dragon Center 2.0 software will bump the maximum fan noise from 46 dB(A) to an ear-screeching 57.5 dB(A). We recommend leaving the feature off as it will not improve performance by all that much when gaming relative to the increase in noise.
| MSI GF75 Thin 10SCXR GeForce GTX 1650 Mobile, i5-10300H, WDC PC SN530 SDBPNPZ-512G | Acer Aspire Nitro 5 AN517-51-7887 GeForce GTX 1660 Ti Mobile, i7-9750H, WDC PC SN520 SDAPNUW-512G | MSI GF75 Thin 9SC GeForce GTX 1650 Mobile, i7-9750H, Crucial P1 SSD CT1000P1SSD8 | MSI GP75 Leopard 9SD GeForce GTX 1660 Ti Mobile, i7-9750H, Kingston RBUSNS8154P3256GJ1 | Asus ROG Strix G GL731GU-RB74 GeForce GTX 1660 Ti Mobile, i7-9750H, Intel SSD 660p SSDPEKNW512G8 | Lenovo Ideapad L340-17IRH 81LL001YGE GeForce GTX 1650 Mobile, i5-9300H, WDC PC SN520 SDAPMUW-512 | |
|---|---|---|---|---|---|---|
| Noise | -3% | -1% | -14% | -11% | 2% | |
| off / environment * (dB) | 28.4 | 30 -6% | 28.2 1% | 29 -2% | 28.2 1% | 30 -6% |
| Idle Minimum * (dB) | 33 | 30.2 8% | 33.6 -2% | 29 12% | 31.8 4% | 30 9% |
| Idle Average * (dB) | 33 | 30.2 8% | 33.6 -2% | 34 -3% | 32 3% | 30 9% |
| Idle Maximum * (dB) | 33.1 | 31 6% | 33.8 -2% | 37 -12% | 40.6 -23% | 30.4 8% |
| Load Average * (dB) | 37.7 | 43.4 -15% | 37.2 1% | 53 -41% | 48 -27% | 40.9 -8% |
| Witcher 3 ultra * (dB) | 39.2 | 48.5 -24% | 40.6 -4% | 51 -30% | 48 -22% | 43.8 -12% |
| Load Maximum * (dB) | 46 | 45.5 1% | 44.4 3% | 55 -20% | 51.5 -12% | 40.9 11% |
* ... smaller is better
Noise level
| Idle |
| 33 / 33 / 33.1 dB(A) |
| Load |
| 37.7 / 46 dB(A) |
 | ||
30 dB silent 40 dB(A) audible 50 dB(A) loud |
||
min: | ||
Temperature
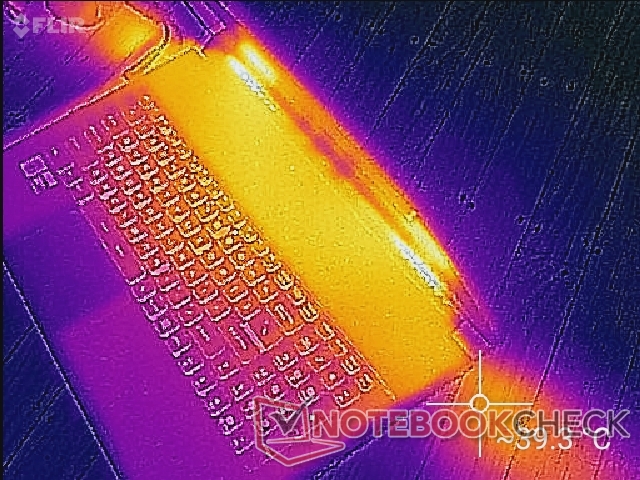
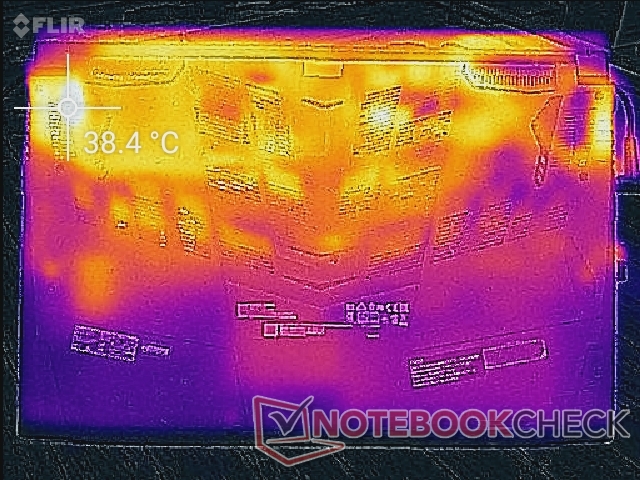
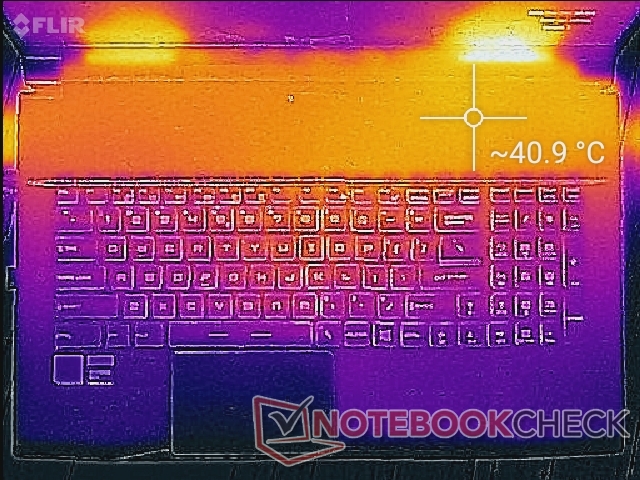
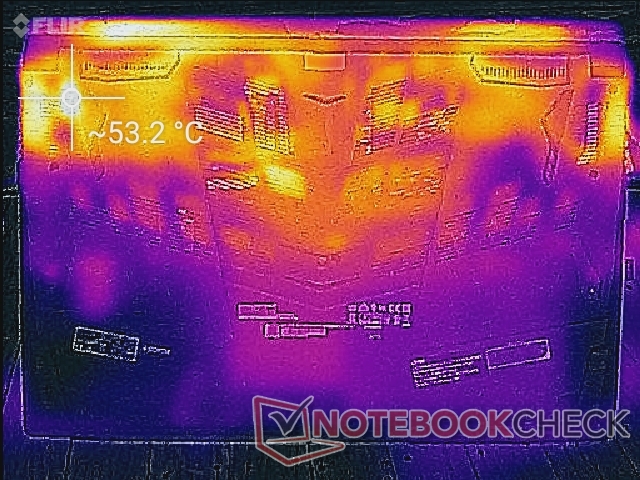
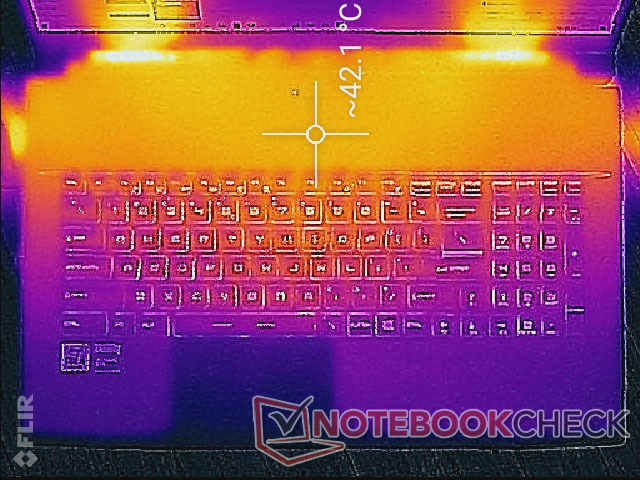
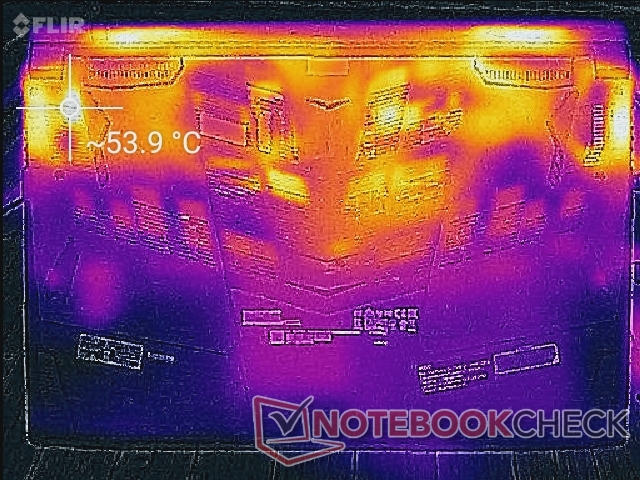
Surface temperatures are warmer toward the rear of the system than the front. In particular, the large flat area above the first row of keyboard keys will always be much warmer than the palm rests or keyboard. When gaming, this area can reach over 40 C compared to just 26 C and 29 C on the palm rests and WASD keys. Temperature development is more desirable than on the competing Lenovo IdeaPad L340-17 where the WASD keys can become much warmer at 41 C when under similar loads. Meanwhile, most of the bottom of the MSI laptop remains relatively cool due to the abundant number of ventilation grilles and the large form factor.
(±) The maximum temperature on the upper side is 42 °C / 108 F, compared to the average of 40.4 °C / 105 F, ranging from 21.2 to 68.8 °C for the class Gaming.
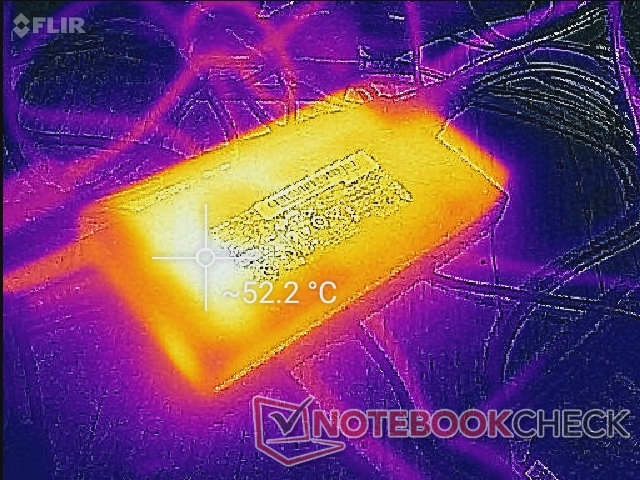
(-) The bottom heats up to a maximum of 53.4 °C / 128 F, compared to the average of 43.2 °C / 110 F
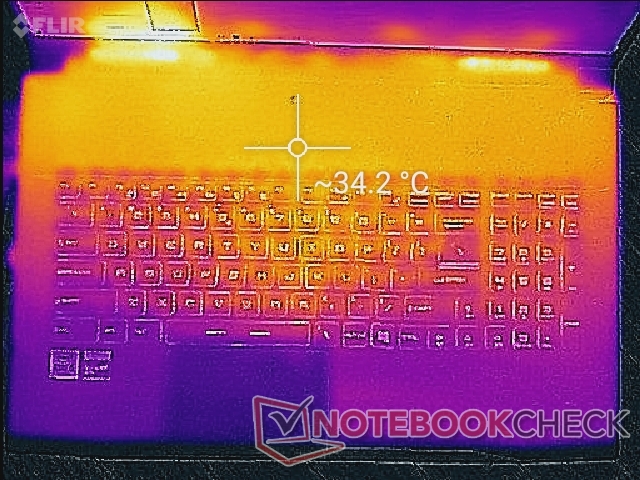
(+) In idle usage, the average temperature for the upper side is 31.5 °C / 89 F, compared to the device average of 33.9 °C / 93 F.
(+) Playing The Witcher 3, the average temperature for the upper side is 31.3 °C / 88 F, compared to the device average of 33.9 °C / 93 F.
(+) The palmrests and touchpad are cooler than skin temperature with a maximum of 29 °C / 84.2 F and are therefore cool to the touch.
(±) The average temperature of the palmrest area of similar devices was 28.8 °C / 83.8 F (-0.2 °C / -0.4 F).
Stress Test
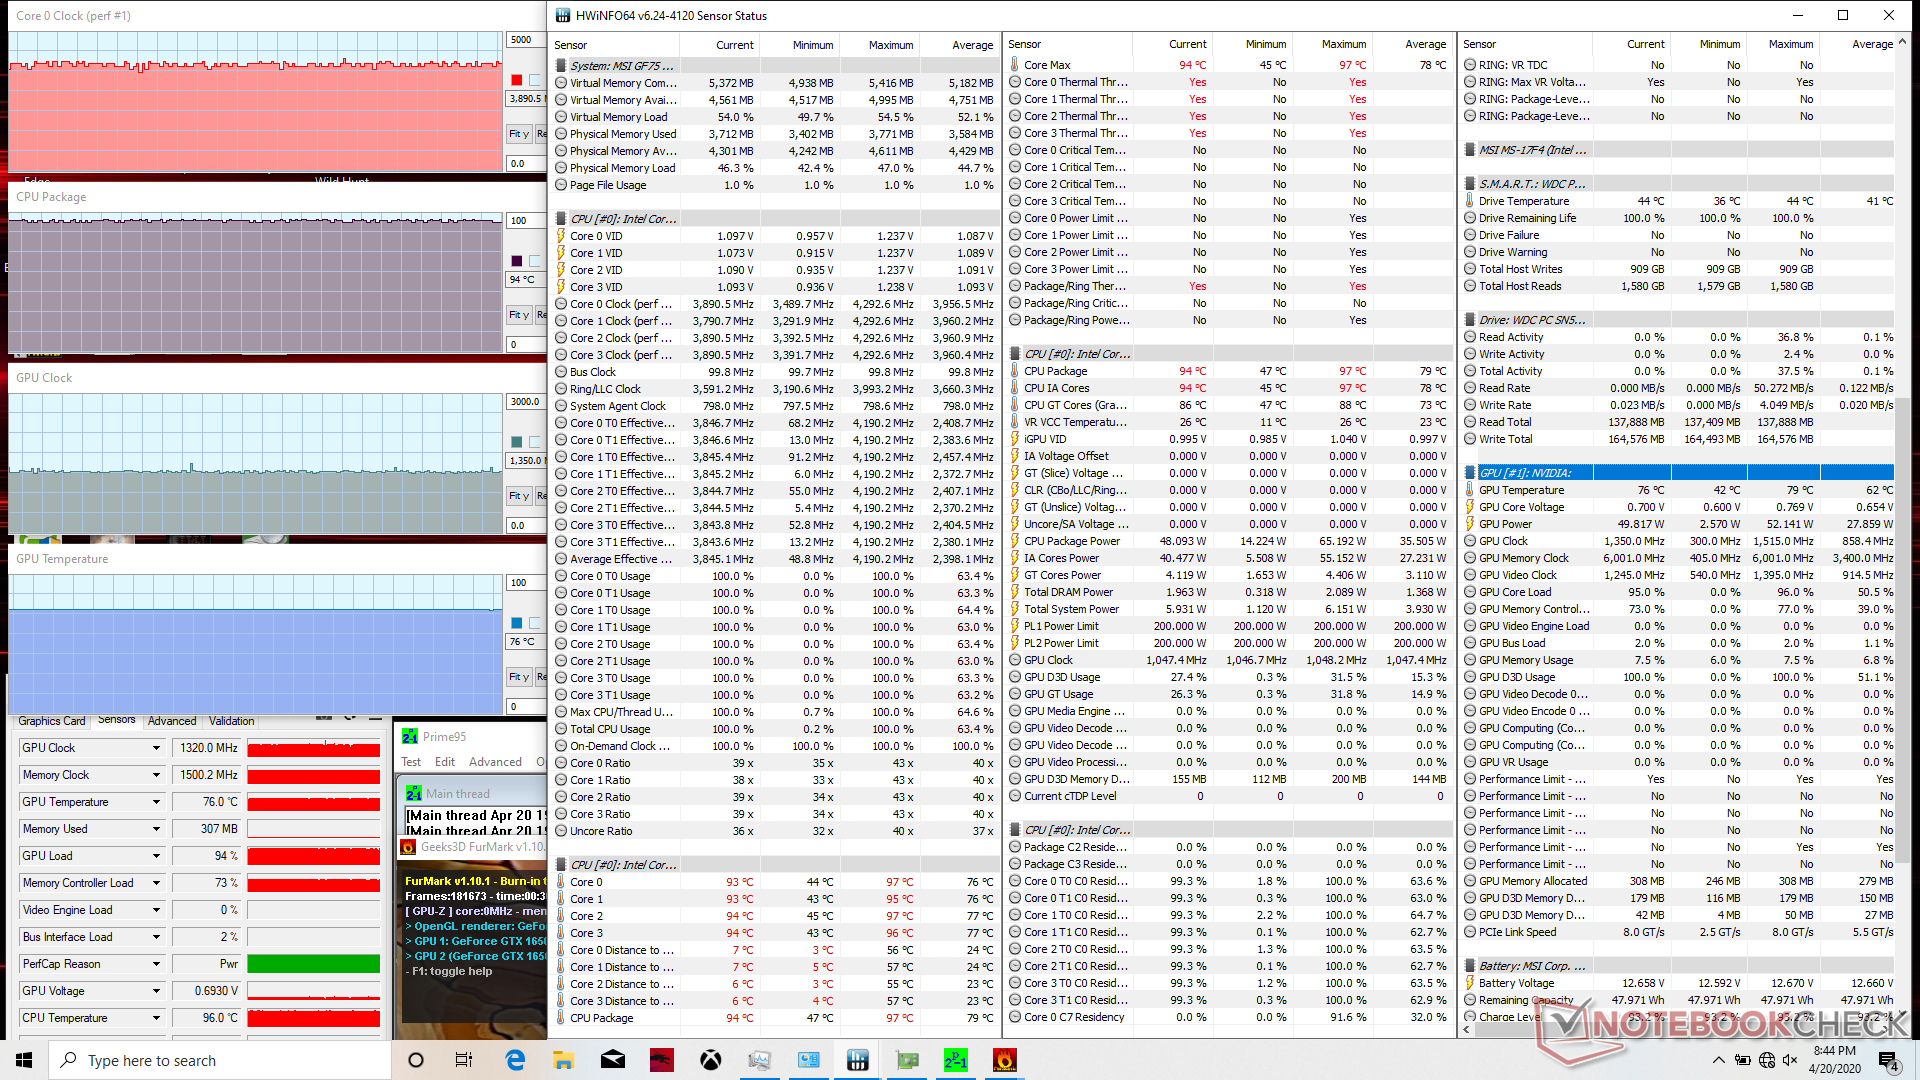
We stress the laptop with synthetic loads to observe clock rate behavior and any instability issues. When running Prime95, the CPU would boost up to the 4 to 4.2 GHz range for about 20 seconds until core temperature reaches 95 C. Thereafter, clock rates fall to the 3.8 to 3.9 GHz range in order to maintain the 95 C core temperature. Note that GPU temperature remains unchanged since the processors do not share any heat pipes.
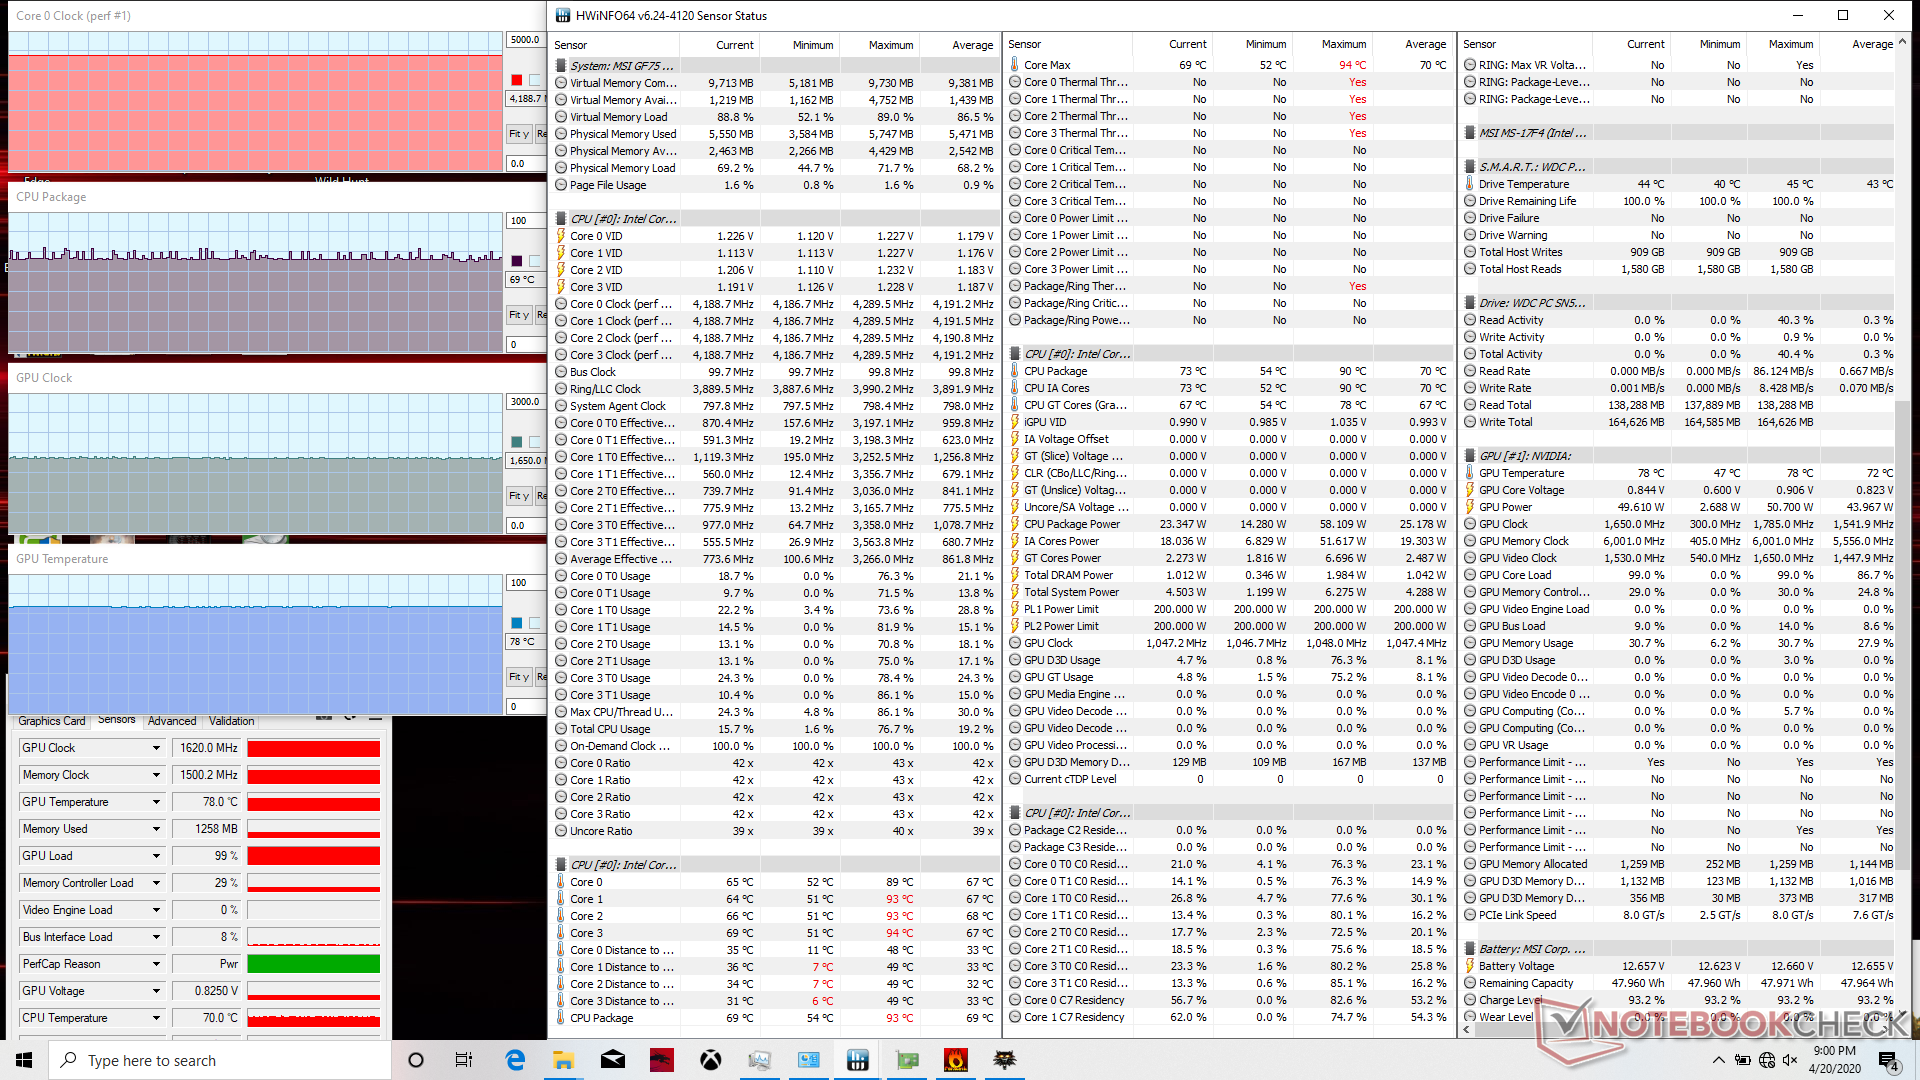
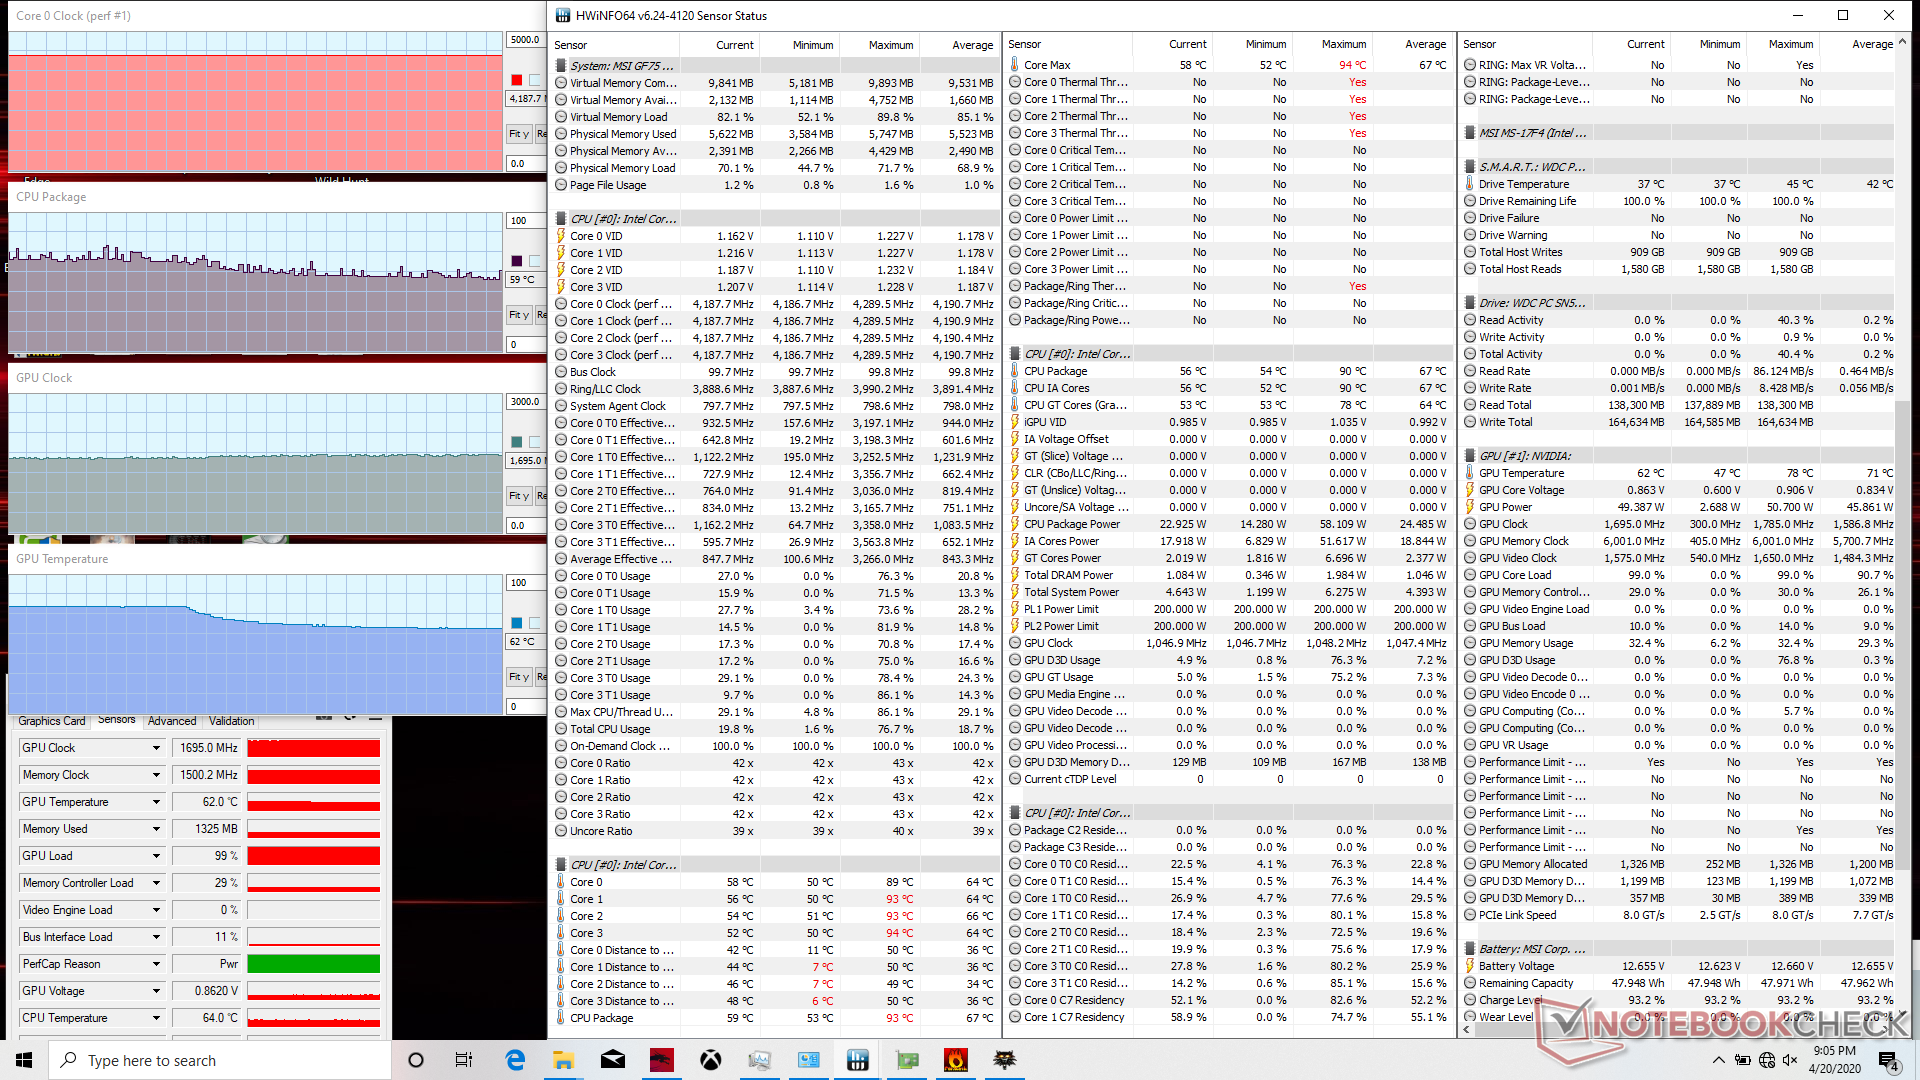
Running Witcher 3 is more representative of real-world gaming loads. The CPU and GPU can be observed stabilizing at 69 C and 78 C, respectively, to be nearly identical to what we recorded on last year's GF75 with the older Core i5-9300H. If Cooler Boost (a.k.a. Maximum Fan mode) is active, core temperatures can drop by as much as 14 C and the GPU will run at a slightly higher clock rate (1695 MHz vs. 1620 MHz). The marginal increase in GPU performance, however, does not make up for the extreme increase in fan noise in our opinion.
Running on battery power will limit performance as per usual on a gaming laptop. A 3DMark 11 run on batteries returns Physics and Graphics scores of 8290 and 9960 points, respectively, compared to 8739 and 13168 points when on mains.
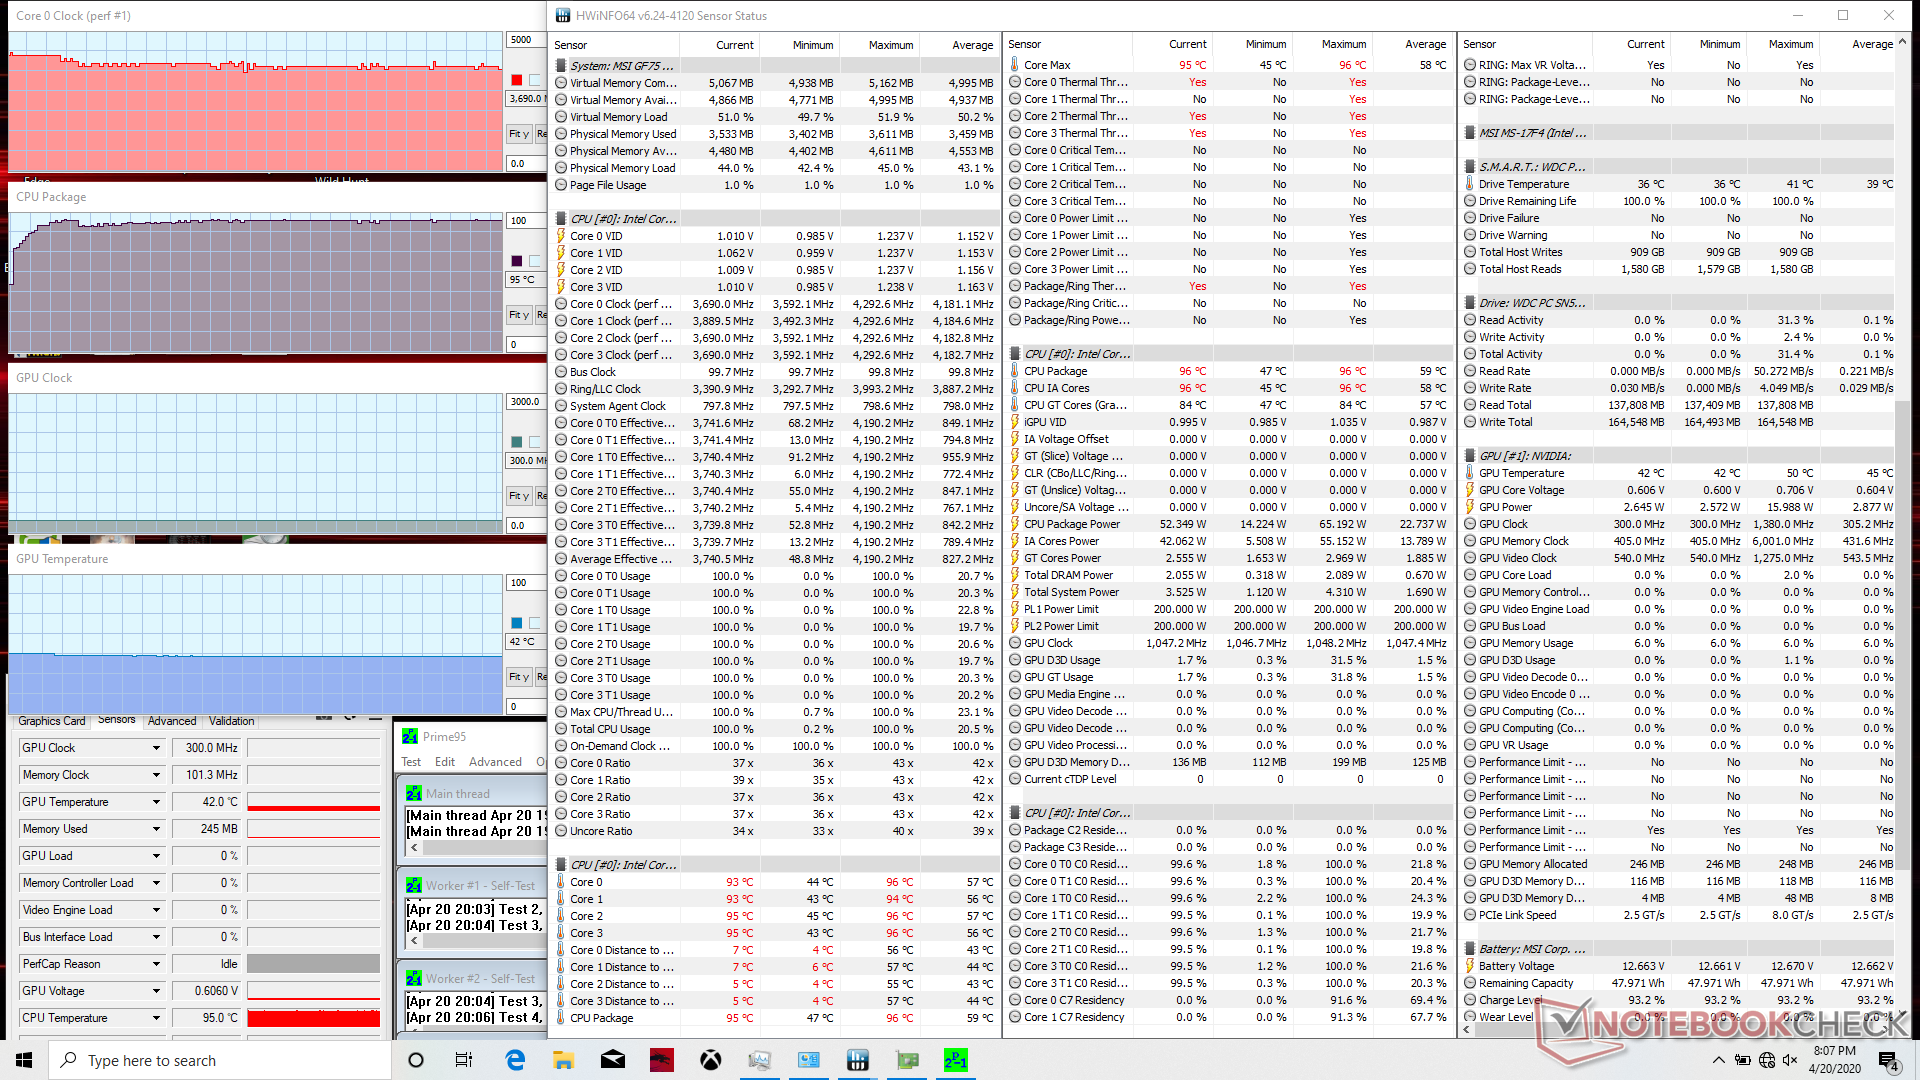

| CPU Clock (GHz) | GPU Clock (MHz) | Average CPU Temperature (°C) | Average GPU Temperature (°C) | |
| System Idle | -- | -- | 49 | 44 |
| Prime95 Stress | 3.7 - 3.8 | -- | 95 | 42 |
| Prime95 + FurMark Stress | 3.8 - 3.9 | 1320 | 94 | 76 |
| Witcher 3 Stress | 4.2 | 1620 | 69 | 78 |
| Witcher 3 Stress (Cooler Boost On) | 4.2 | 1695 | 59 | 62 |
Speakers

MSI GF75 Thin 10SCXR audio analysis
(+) | speakers can play relatively loud (83.6 dB)
Bass 100 - 315 Hz
(-) | nearly no bass - on average 18.5% lower than median
(±) | linearity of bass is average (14.2% delta to prev. frequency)
Mids 400 - 2000 Hz
(+) | balanced mids - only 2.2% away from median
(±) | linearity of mids is average (7.7% delta to prev. frequency)
Highs 2 - 16 kHz
(+) | balanced highs - only 3.4% away from median
(±) | linearity of highs is average (9.4% delta to prev. frequency)
Overall 100 - 16.000 Hz
(±) | linearity of overall sound is average (18.2% difference to median)
Compared to same class
» 57% of all tested devices in this class were better, 8% similar, 35% worse
» The best had a delta of 6%, average was 18%, worst was 132%
Compared to all devices tested
» 39% of all tested devices were better, 8% similar, 53% worse
» The best had a delta of 4%, average was 24%, worst was 134%
Apple MacBook 12 (Early 2016) 1.1 GHz audio analysis
(+) | speakers can play relatively loud (83.6 dB)
Bass 100 - 315 Hz
(±) | reduced bass - on average 11.3% lower than median
(±) | linearity of bass is average (14.2% delta to prev. frequency)
Mids 400 - 2000 Hz
(+) | balanced mids - only 2.4% away from median
(+) | mids are linear (5.5% delta to prev. frequency)
Highs 2 - 16 kHz
(+) | balanced highs - only 2% away from median
(+) | highs are linear (4.5% delta to prev. frequency)
Overall 100 - 16.000 Hz
(+) | overall sound is linear (10.2% difference to median)
Compared to same class
» 7% of all tested devices in this class were better, 2% similar, 91% worse
» The best had a delta of 5%, average was 18%, worst was 53%
Compared to all devices tested
» 5% of all tested devices were better, 1% similar, 94% worse
» The best had a delta of 4%, average was 24%, worst was 134%
Energy Management
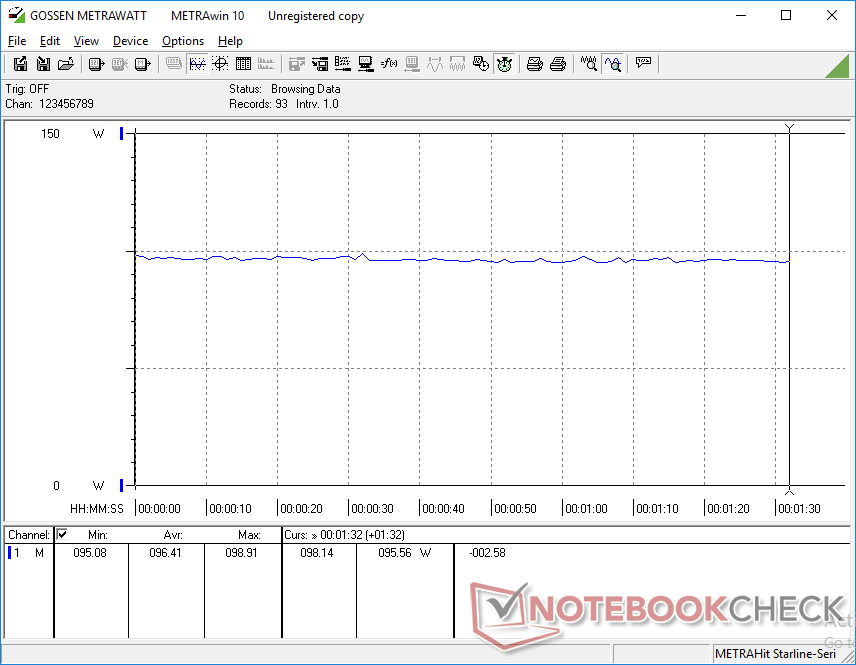
Power Consumption
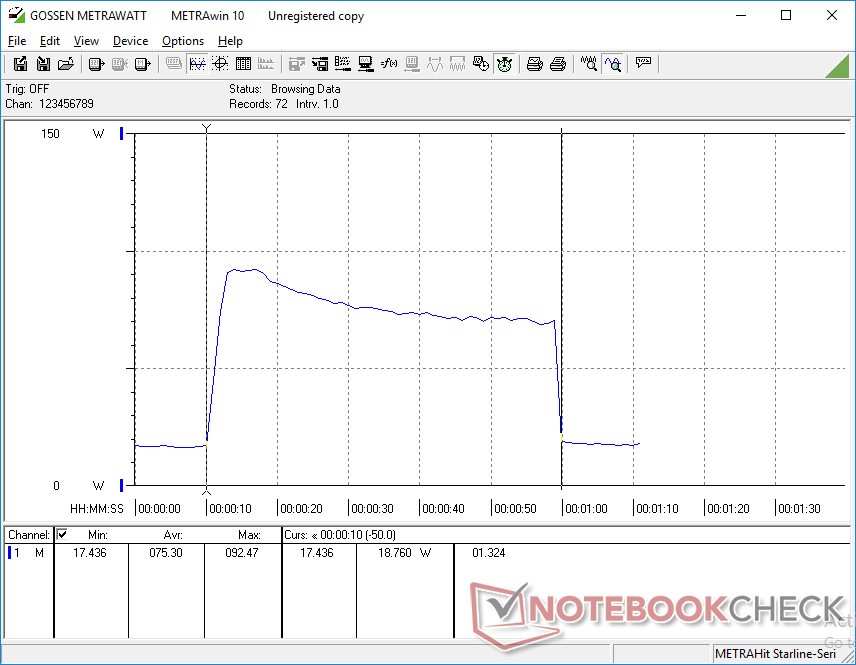
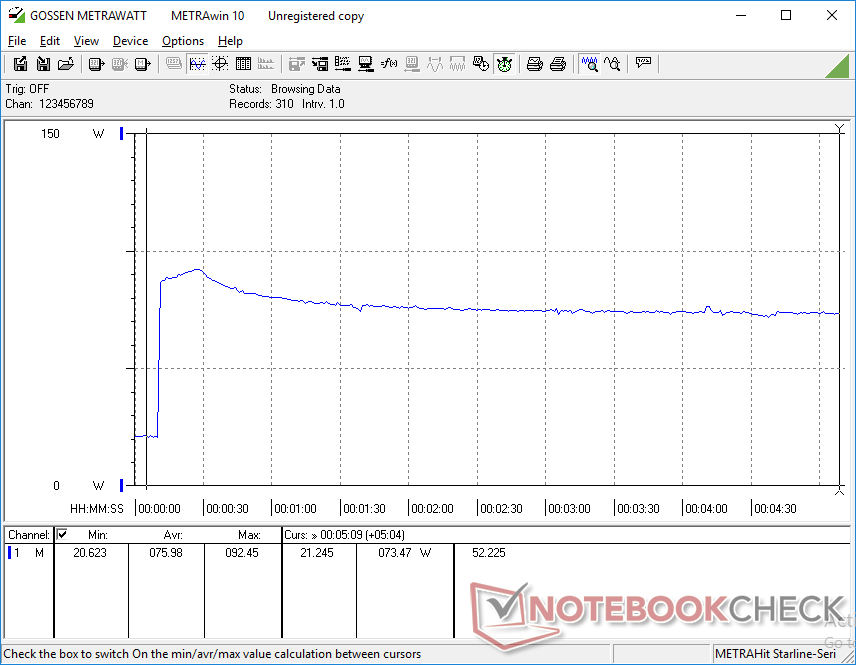
Power consumption when idling is slightly higher than expected at 13 W likely due to background activity. Otherwise, the system consumes about the same amount of power as last year's model when under heavier loads. Gaming consumes 87 W and 97 W compared to 94 W and 106 W on last year's GF75 with the more powerful Core i7 CPU or 75 W and 92 W on the Lenovo IdeaPad L340 with the comparable Core i5-9300H.
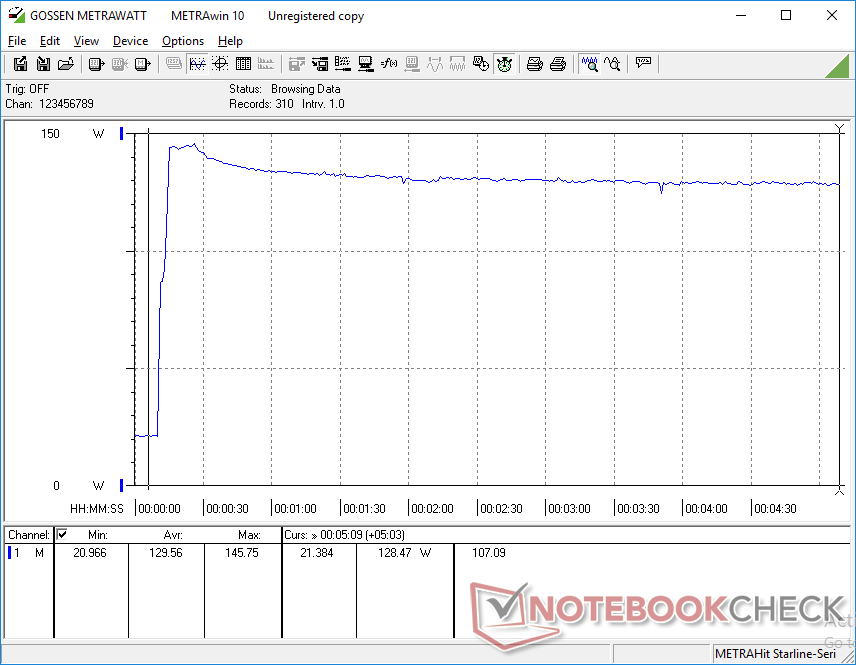
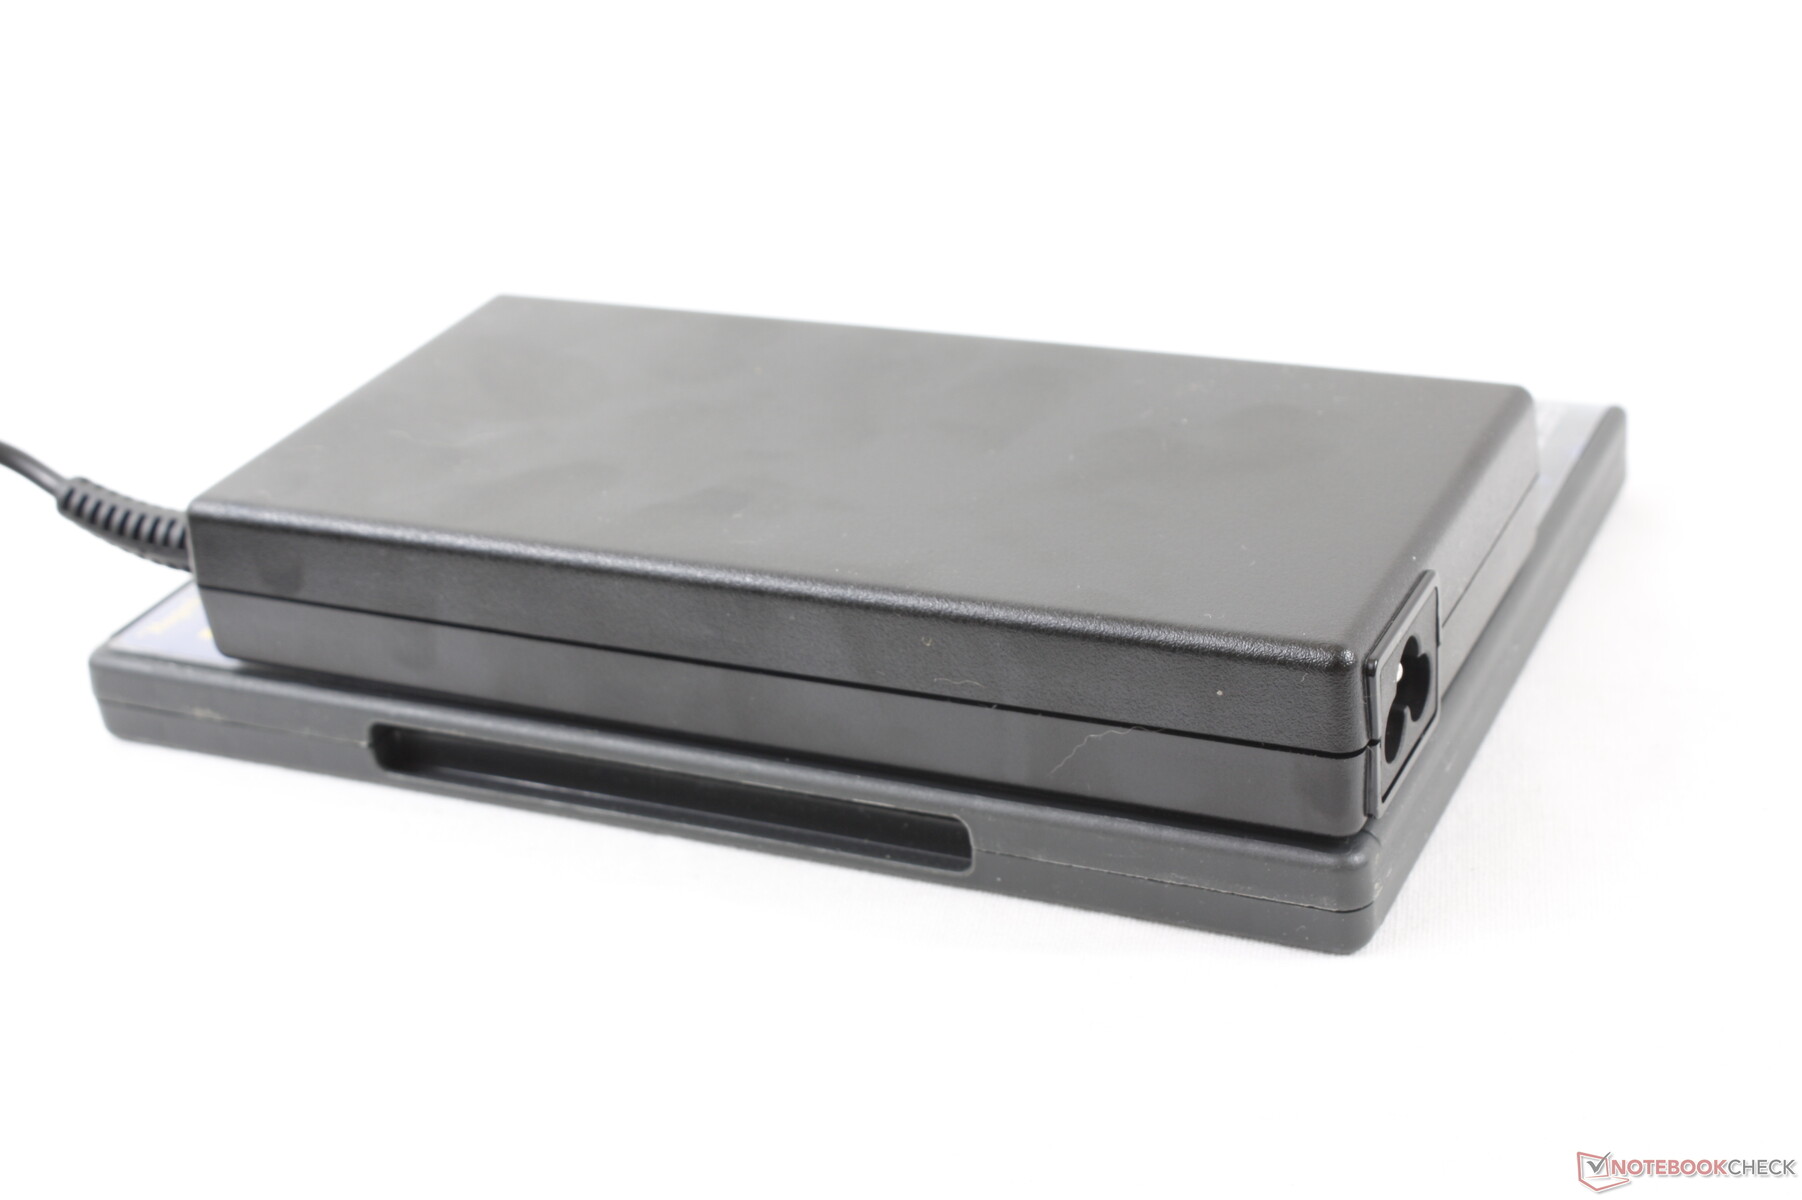
We're able to record a maximum draw of 145.8 W from the medium-sized (~16.5 x 8 x 2.5 cm) 150 W AC adapter when running both Prime95 and FurMark simultaneously. However, consumption rate falls over time when subjected to such extreme loads due to the performance throttling we observed in our Stress Test section above.
| Off / Standby | |
| Idle | |
| Load |
|
Key:
min: | |
| MSI GF75 Thin 10SCXR i5-10300H, GeForce GTX 1650 Mobile, WDC PC SN530 SDBPNPZ-512G, IPS, 1920x1080, 17.3" | Acer Aspire Nitro 5 AN517-51-7887 i7-9750H, GeForce GTX 1660 Ti Mobile, WDC PC SN520 SDAPNUW-512G, IPS, 1920x1080, 17.3" | MSI GF75 Thin 9SC i7-9750H, GeForce GTX 1650 Mobile, Crucial P1 SSD CT1000P1SSD8, IPS, 1920x1080, 17.3" | MSI GP75 Leopard 9SD i7-9750H, GeForce GTX 1660 Ti Mobile, Kingston RBUSNS8154P3256GJ1, IPS, 1920x1080, 17.3" | Asus ROG Strix G GL731GU-RB74 i7-9750H, GeForce GTX 1660 Ti Mobile, Intel SSD 660p SSDPEKNW512G8, IPS, 1920x1080, 17.3" | Lenovo Ideapad L340-17IRH 81LL001YGE i5-9300H, GeForce GTX 1650 Mobile, WDC PC SN520 SDAPMUW-512, IPS, 1920x1080, 17.3" | HP Pavilion Gaming 17-cd0085cl i7-9750H, GeForce GTX 1660 Ti Max-Q, Samsung SSD PM981 MZVLB256HAHQ, IPS, 1920x1080, 17.3" | |
|---|---|---|---|---|---|---|---|
| Power Consumption | 18% | 2% | -15% | -41% | 34% | 17% | |
| Idle Minimum * (Watt) | 13 | 3.9 70% | 6.1 53% | 10 23% | 13.6 -5% | 3.4 74% | 5.4 58% |
| Idle Average * (Watt) | 15.7 | 8.9 43% | 11.2 29% | 15 4% | 26.2 -67% | 7.7 51% | 9.2 41% |
| Idle Maximum * (Watt) | 21 | 12.2 42% | 24.5 -17% | 22 -5% | 35 -67% | 9.6 54% | 13 38% |
| Load Average * (Watt) | 87 | 83 5% | 94.7 -9% | 92 -6% | 113.6 -31% | 75 14% | 85.9 1% |
| Witcher 3 ultra * (Watt) | 96.4 | 130 -35% | 105.8 -10% | 153 -59% | 134.1 -39% | 92 5% | 107.9 -12% |
| Load Maximum * (Watt) | 145.8 | 168 -15% | 192.2 -32% | 216 -48% | 200.2 -37% | 135 7% | 182.2 -25% |
* ... smaller is better
Battery Life
The internal 51 Wh battery is small for the size but otherwise standard at this price range. We're able to record a real-world WLAN runtime of 4 hours and 43 minutes to be identical to what we recorded on last year's GF75. In other words, don't expect battery life to be all that much different gen-to-gen. The Lenovo IdeaPad L340-17, for example, can outlast our MSI by over an hour even though it comes with the lesser Core i5-9300H CPU.
Recharging from empty to full takes about 2 hours.
| MSI GF75 Thin 10SCXR i5-10300H, GeForce GTX 1650 Mobile, 51 Wh | Acer Aspire Nitro 5 AN517-51-7887 i7-9750H, GeForce GTX 1660 Ti Mobile, 57 Wh | MSI GF75 Thin 9SC i7-9750H, GeForce GTX 1650 Mobile, 51 Wh | MSI GP75 Leopard 9SD i7-9750H, GeForce GTX 1660 Ti Mobile, 51 Wh | Asus ROG Strix G GL731GU-RB74 i7-9750H, GeForce GTX 1660 Ti Mobile, 66 Wh | Lenovo Ideapad L340-17IRH 81LL001YGE i5-9300H, GeForce GTX 1650 Mobile, 45 Wh | |
|---|---|---|---|---|---|---|
| Battery runtime | 54% | 0% | -38% | 20% | 32% | |
| Reader / Idle (h) | 7.7 | 13.4 74% | 4.8 -38% | 8.6 12% | ||
| WiFi v1.3 (h) | 4.7 | 6.2 32% | 4.7 0% | 3.2 -32% | 4.9 4% | 6.2 32% |
| Load (h) | 1.1 | 1.7 55% | 0.6 -45% | 1.6 45% |
Pros
Cons
Verdict
The best part about the 2020 MSI GF75 10SCXR is that the 2019 model is now cheaper. Last year's Core i5-9300H is just barely behind the Core i5-10300H to the point where any performance benefits from the latter would be unnoticeable when gaming. That's great news if you're upgrading from a much older gaming laptop because it means you can save money by purchasing a 9th gen Core i5 laptop instead of a 10th gen one without sacrificing performance.
As for the laptop itself, its best attributes are the low weight, small size, and relatively quiet fans when gaming for a 17.3-inch form factor. It may not be quite as sleek as the GS75, but it's hard to argue against the low price and fast 120 Hz refresh rate. We recommend getting 16 GB of RAM instead of just 8 GB on the 2019 model and double-checking with customer service that simple RAM and HDD upgrades are possible since you'll have to break a warranty sticker to do so. Have a mouse ready as well to avoid the spongy clickpad.
A minor performance refresh to last year's model. You would be better off investing in a 9th gen Core i5 gaming laptop rather than this 10th gen one to get a bigger bang for the buck.
MSI GF75 Thin 10SCXR
- 04/24/2020 v7 (old)
Allen Ngo
Price comparison
