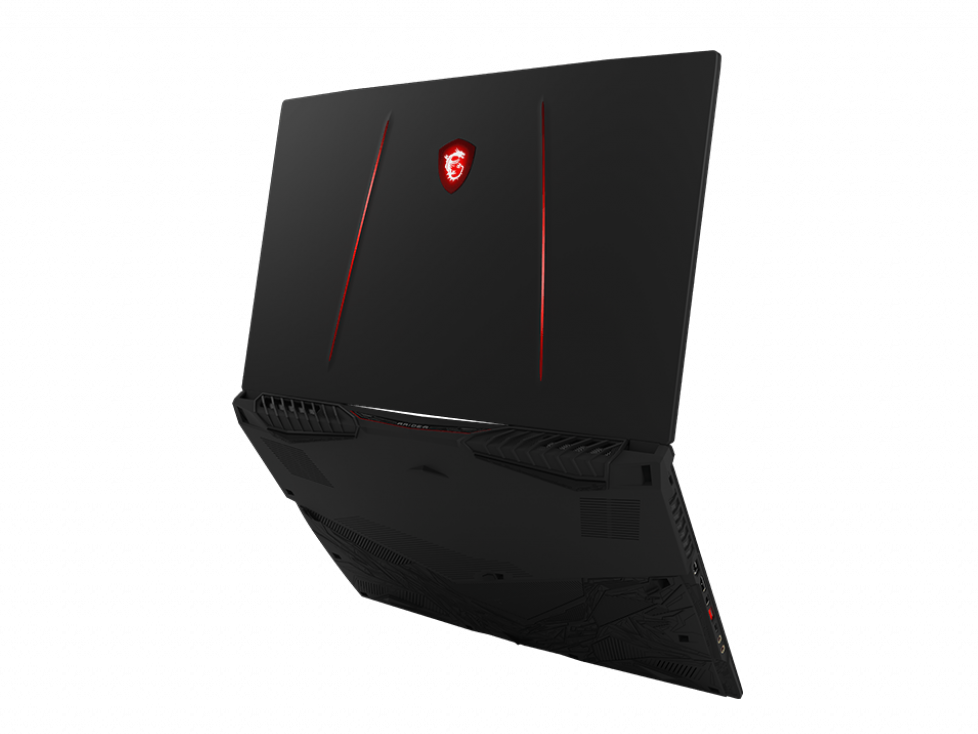
MSI GE75 Raider 10SE Laptop Review: 10th Gen Core i7 and GeForce RTX Combo
The MSI GE75 Raider 10SE is the Intel 10th gen Comet Lake-H update to last year's 9th gen Coffee Lake-H-powered GE75 9SE. Chassis features are otherwise identical and so we recommend checking out our existing reviews on the GE75 9SG, 8SG, or 8SF to learn more about the keyboard, ports, speakers, and other physical features of the laptop. This page will focus on the performance of the latest MSI system and how it compares to other mid-range to high-end 17.3-inch competitors.
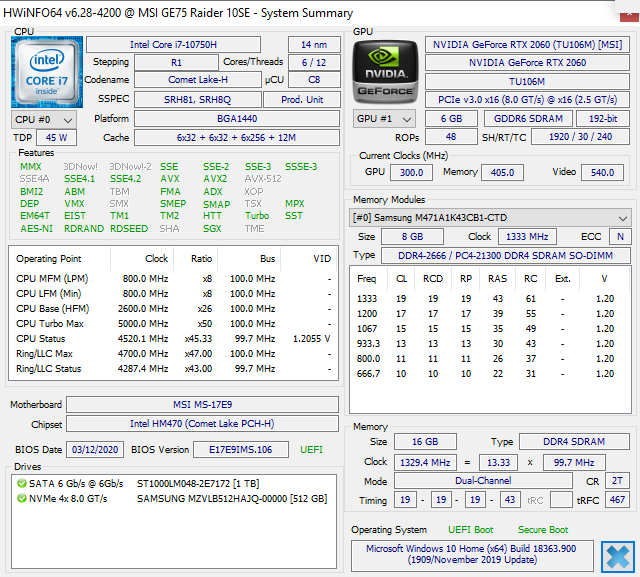
Our configured unit is a baseline offering with its 144 Hz 1080p display, 6-core Core i7-10750H CPU, and GeForce RTX 2060 GPU for approximately $1800 USD. Users can configure with up to a 300 Hz 1080p display, unlocked 8-core Core i9-10980HK CPU, and GeForce RTX 2080 Super graphics for approximately $3000. Storage and RAM options will vary greatly between SKUs.
More MSI reviews:
Rating | Date | Model | Weight | Height | Size | Resolution | Price |
|---|---|---|---|---|---|---|---|
| 85.1 % v7 (old) | 07 / 2020 | MSI GE75 Raider 10SE-008US i7-10750H, GeForce RTX 2060 Mobile | 2.6 kg | 27.5 mm | 17.30" | 1920x1080 | |
| 82.9 % v7 (old) | 06 / 2019 | MSI GS75 Stealth 9SG i7-9750H, GeForce RTX 2080 Max-Q | 2.3 kg | 18.9 mm | 17.30" | 1920x1080 | |
| 86 % v7 (old) | 08 / 2019 | Asus Strix Hero III G731GV i7-9750H, GeForce RTX 2060 Mobile | 2.9 kg | 26.2 mm | 17.30" | 1920x1080 | |
| 83.2 % v7 (old) | 10 / 2019 | Lenovo Legion Y740-17IRH i7-9750H, GeForce RTX 2060 Mobile | 3 kg | 23 mm | 17.30" | 1920x1080 | |
| 89.4 % v6 (old) | 08 / 2019 | Razer Blade Pro 17 RTX 2060 i7-9750H, GeForce RTX 2060 Mobile | 2.8 kg | 19.9 mm | 17.30" | 1920x1080 | |
| 86.5 % v7 (old) | 05 / 2020 | Aorus 17G XB i7-10875H, GeForce RTX 2070 Super Max-Q | 2.7 kg | 26 mm | 17.30" | 1920x1080 |
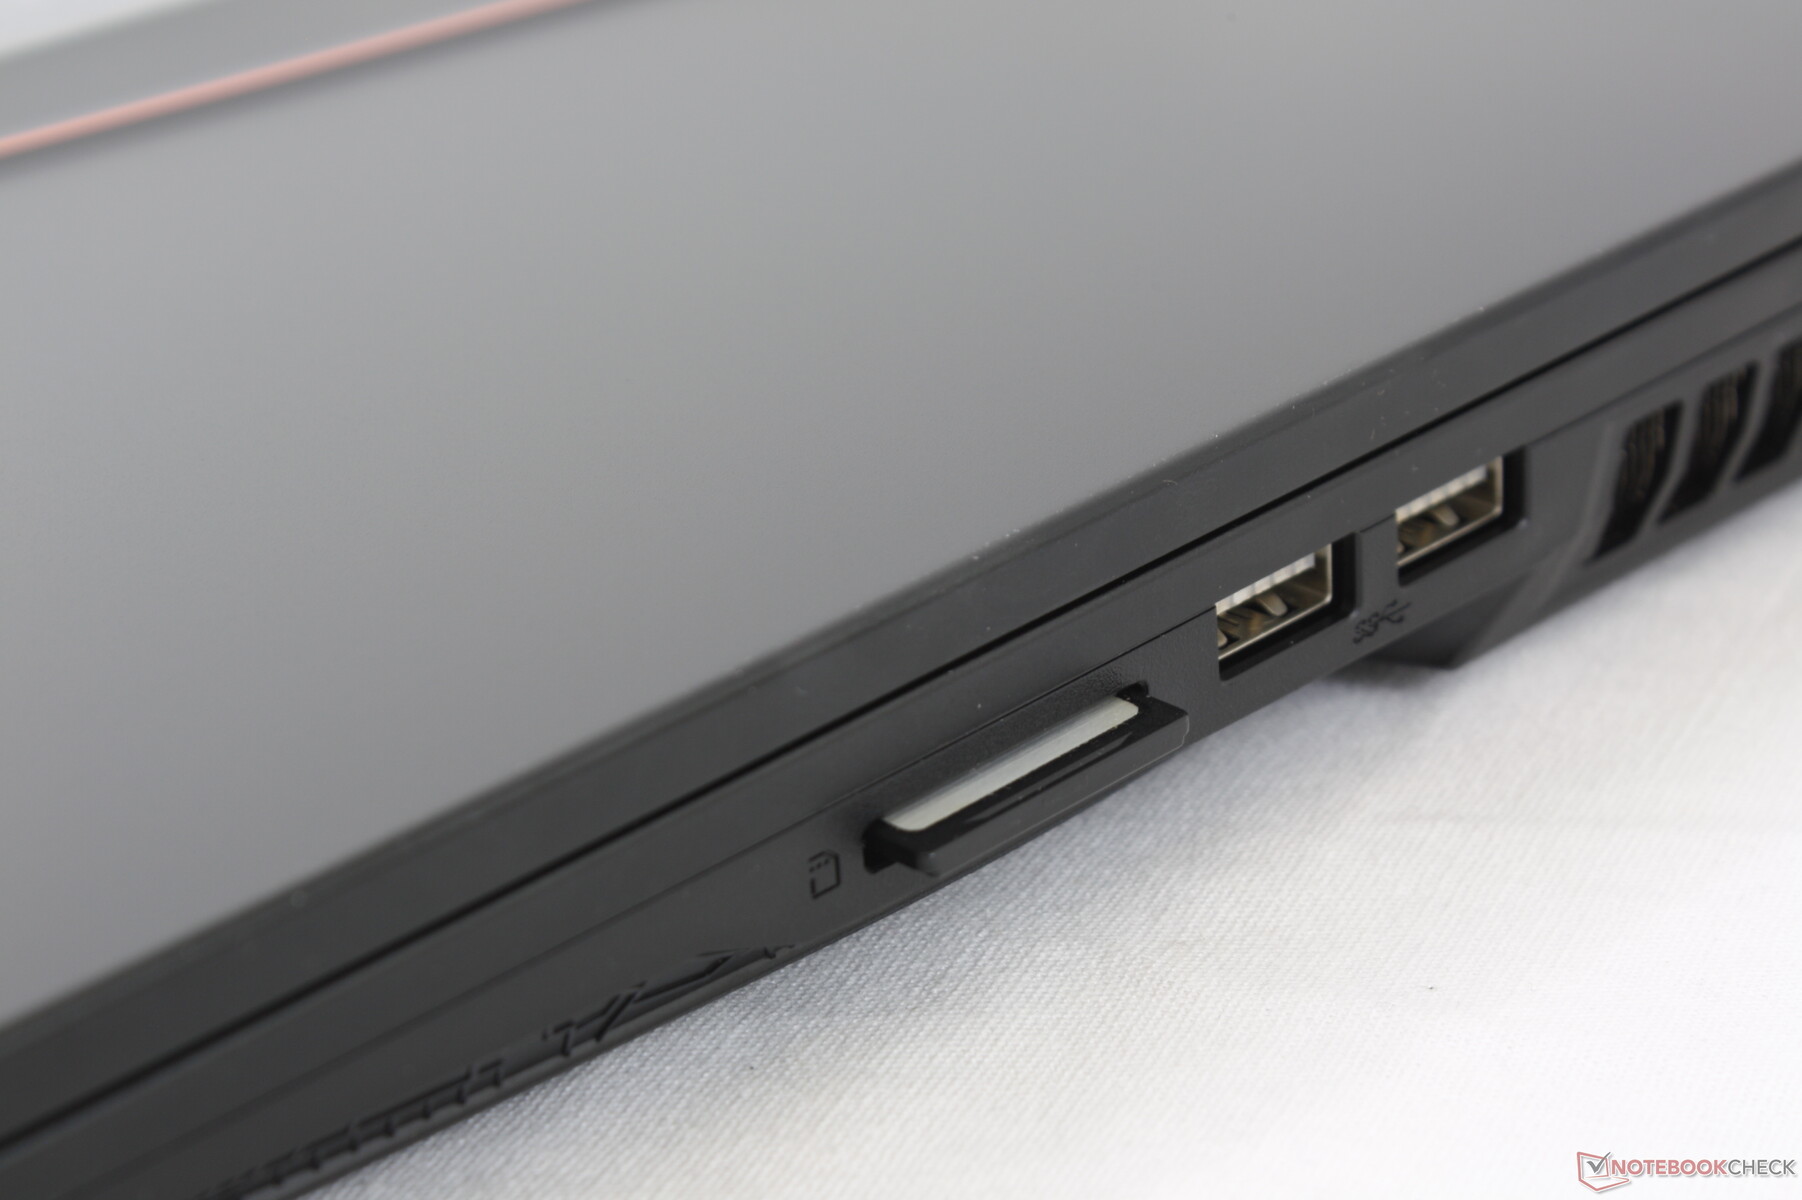
Case
SD Card Reader
| SD Card Reader | |
| average JPG Copy Test (av. of 3 runs) | |
| Aorus 17G XB (Toshiba Exceria Pro SDXC 64 GB UHS-II) | |
| Gigabyte Aero 17 HDR XB (Toshiba Exceria Pro SDXC 64 GB UHS-II) | |
| Dell XPS 15 9500 Core i7 4K UHD (Toshiba Exceria Pro SDXC 64 GB UHS-II) | |
| Razer Blade Pro 17 RTX 2060 (Toshiba Exceria Pro SDXC 64 GB UHS-II) | |
| MSI GT73VR 7RF-296 (Toshiba Exceria Pro SDXC 64 GB UHS-II) | |
| MSI GE75 Raider 10SE-008US (Toshiba Exceria Pro SDXC 64 GB UHS-II) | |
| maximum AS SSD Seq Read Test (1GB) | |
| Aorus 17G XB (Toshiba Exceria Pro SDXC 64 GB UHS-II) | |
| Gigabyte Aero 17 HDR XB (Toshiba Exceria Pro SDXC 64 GB UHS-II) | |
| MSI GT73VR 7RF-296 (Toshiba Exceria Pro SDXC 64 GB UHS-II) | |
| Razer Blade Pro 17 RTX 2060 (Toshiba Exceria Pro SDXC 64 GB UHS-II) | |
| Dell XPS 15 9500 Core i7 4K UHD (Toshiba Exceria Pro SDXC 64 GB UHS-II) | |
| MSI GE75 Raider 10SE-008US (Toshiba Exceria Pro SDXC 64 GB UHS-II) | |
Communication
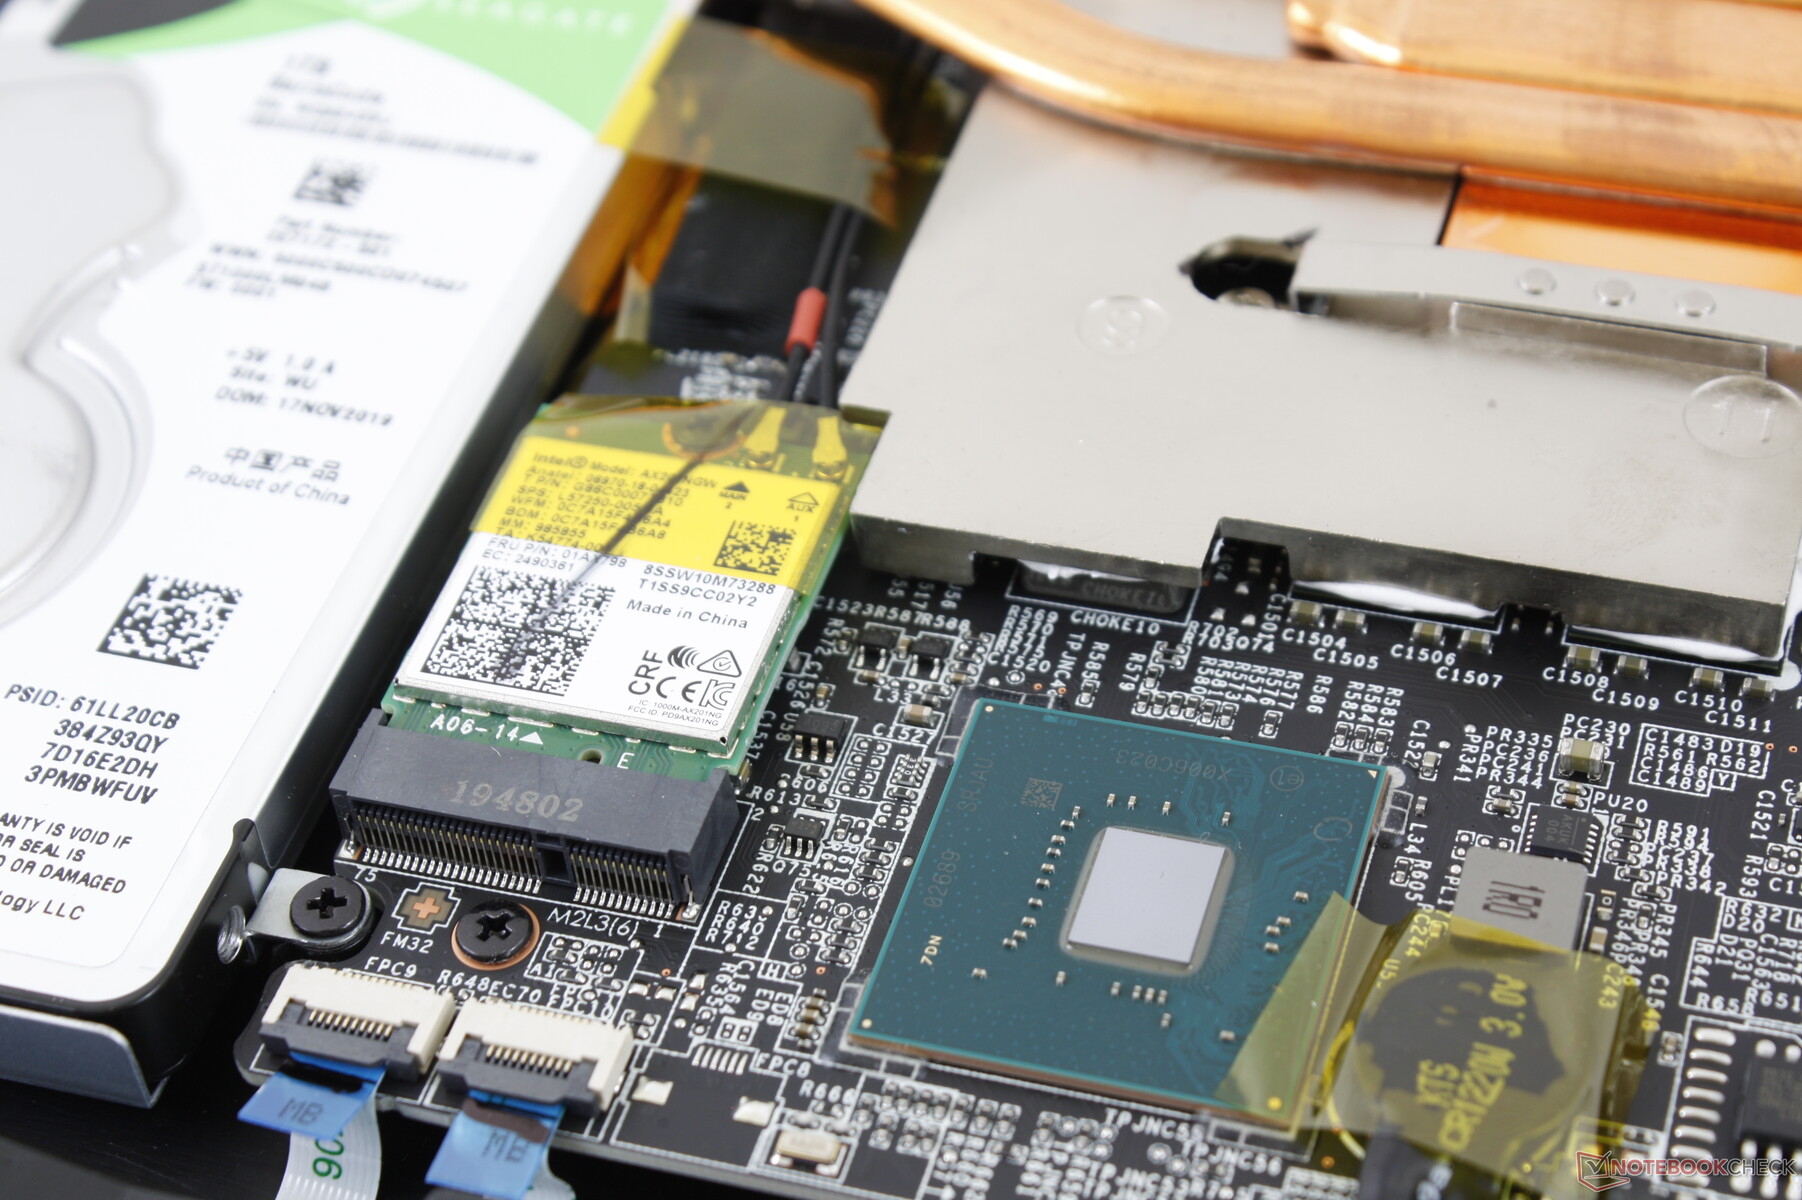
The Intel AX201 comes standard for Bluetooth 5.1 and Wi-Fi 6 connectivity. We experienced no issues when paired to our Netgear RAX200 test router.
Webcam


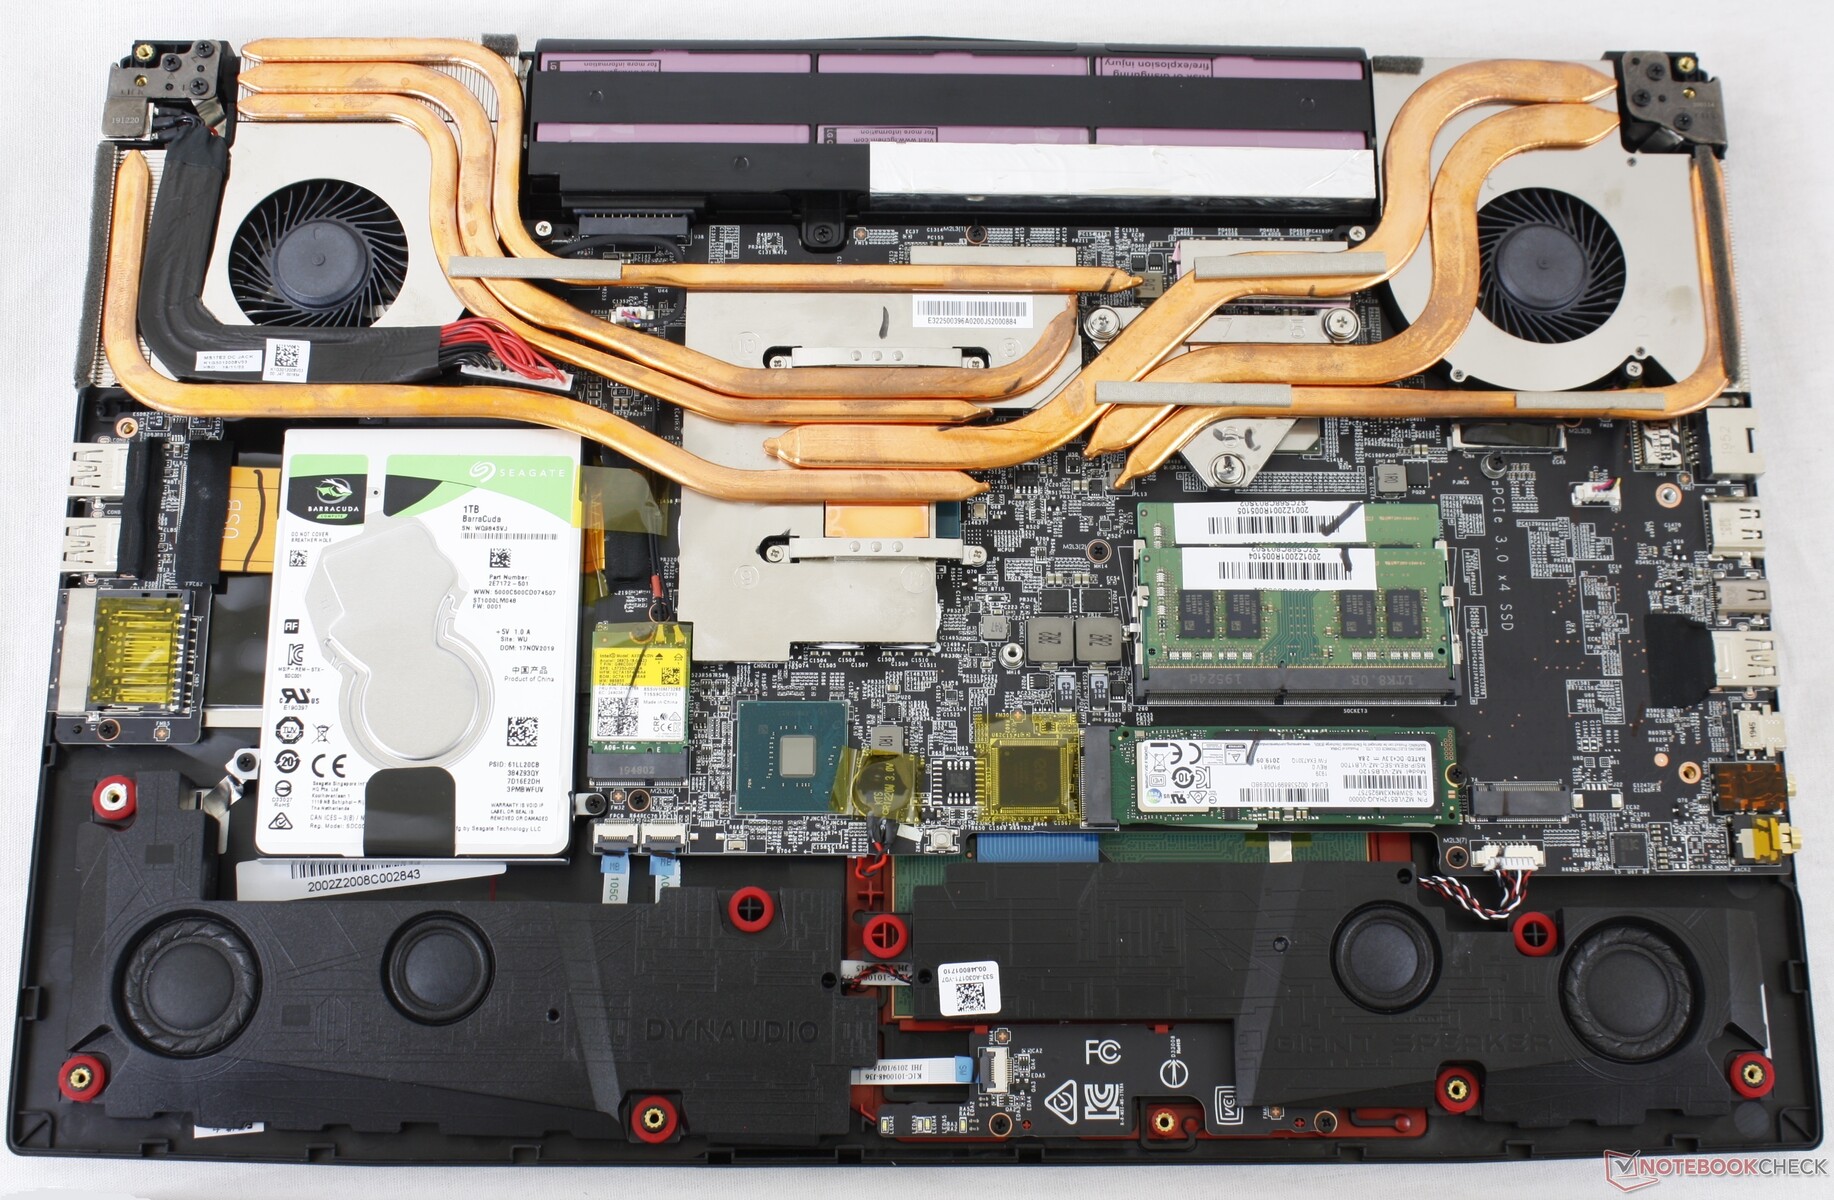
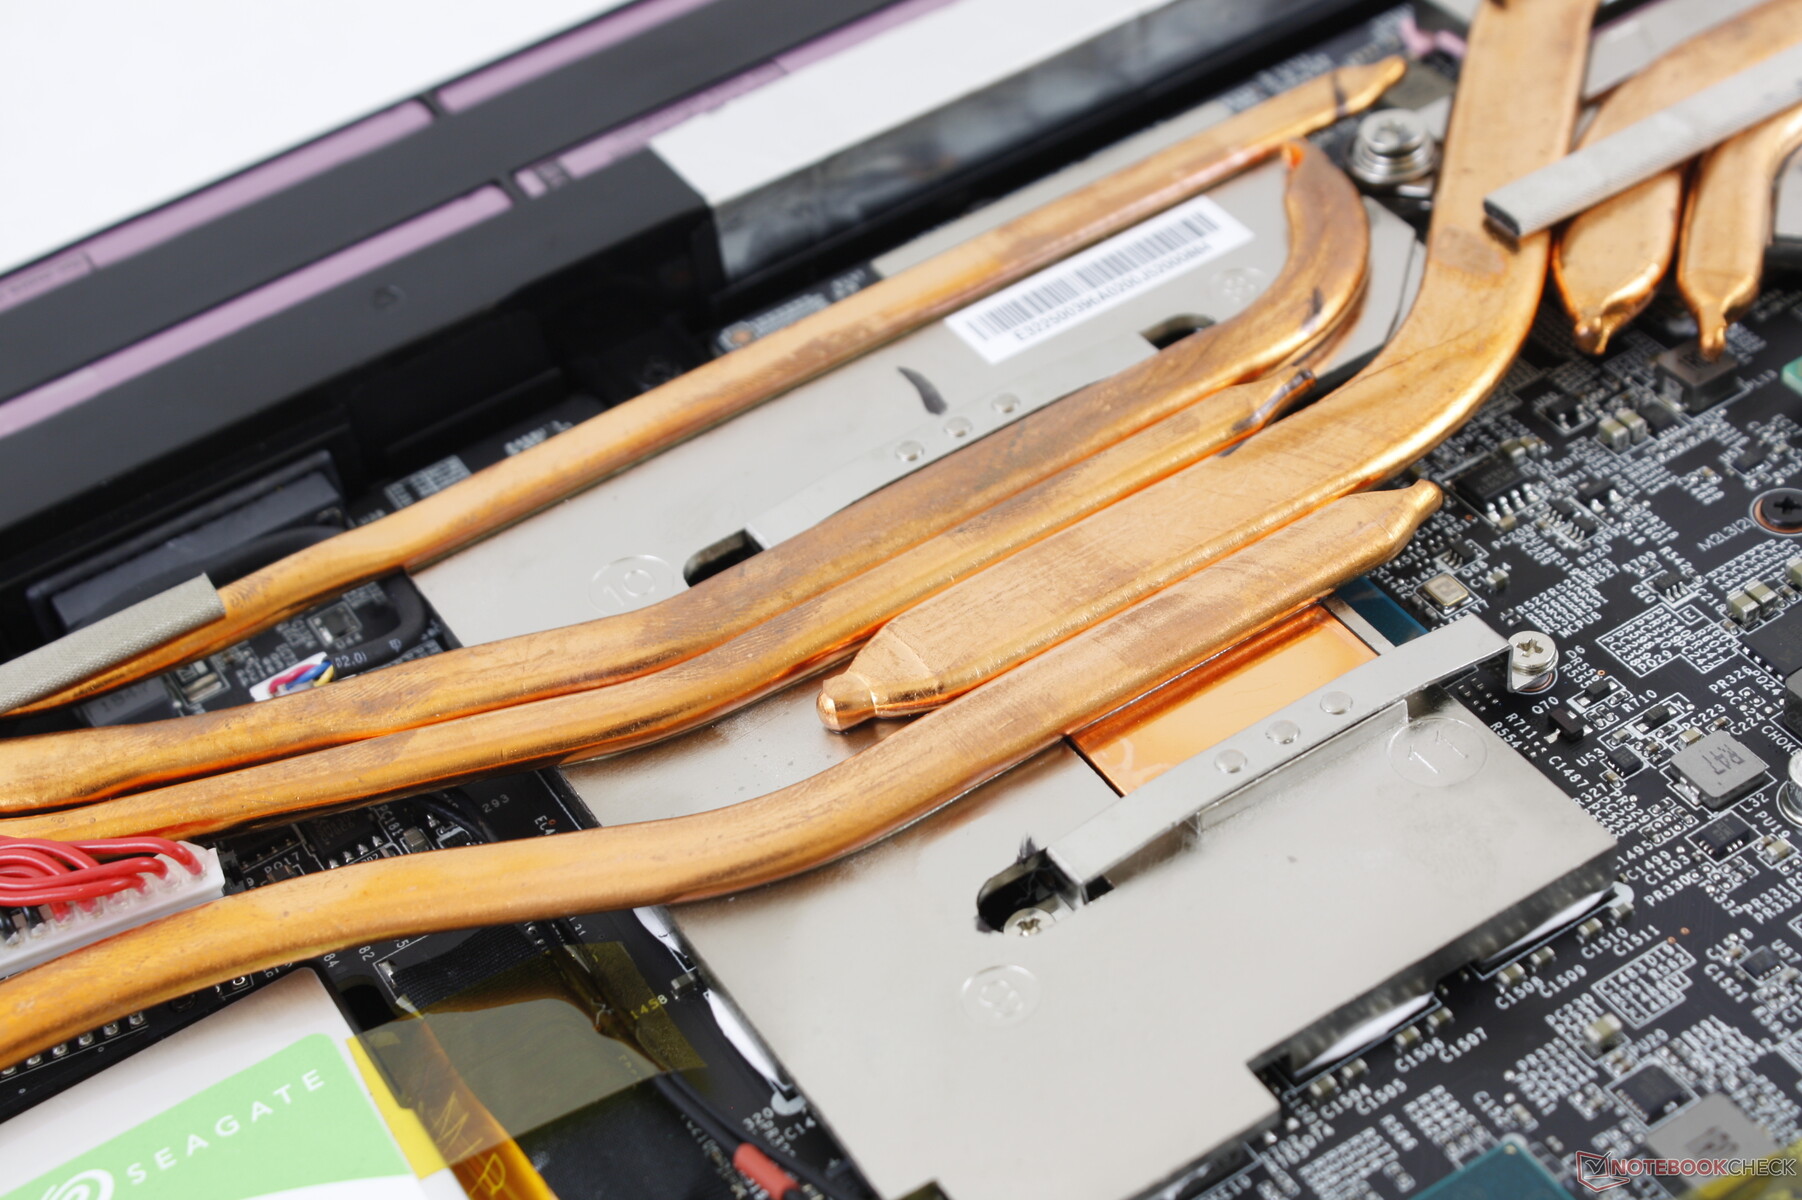
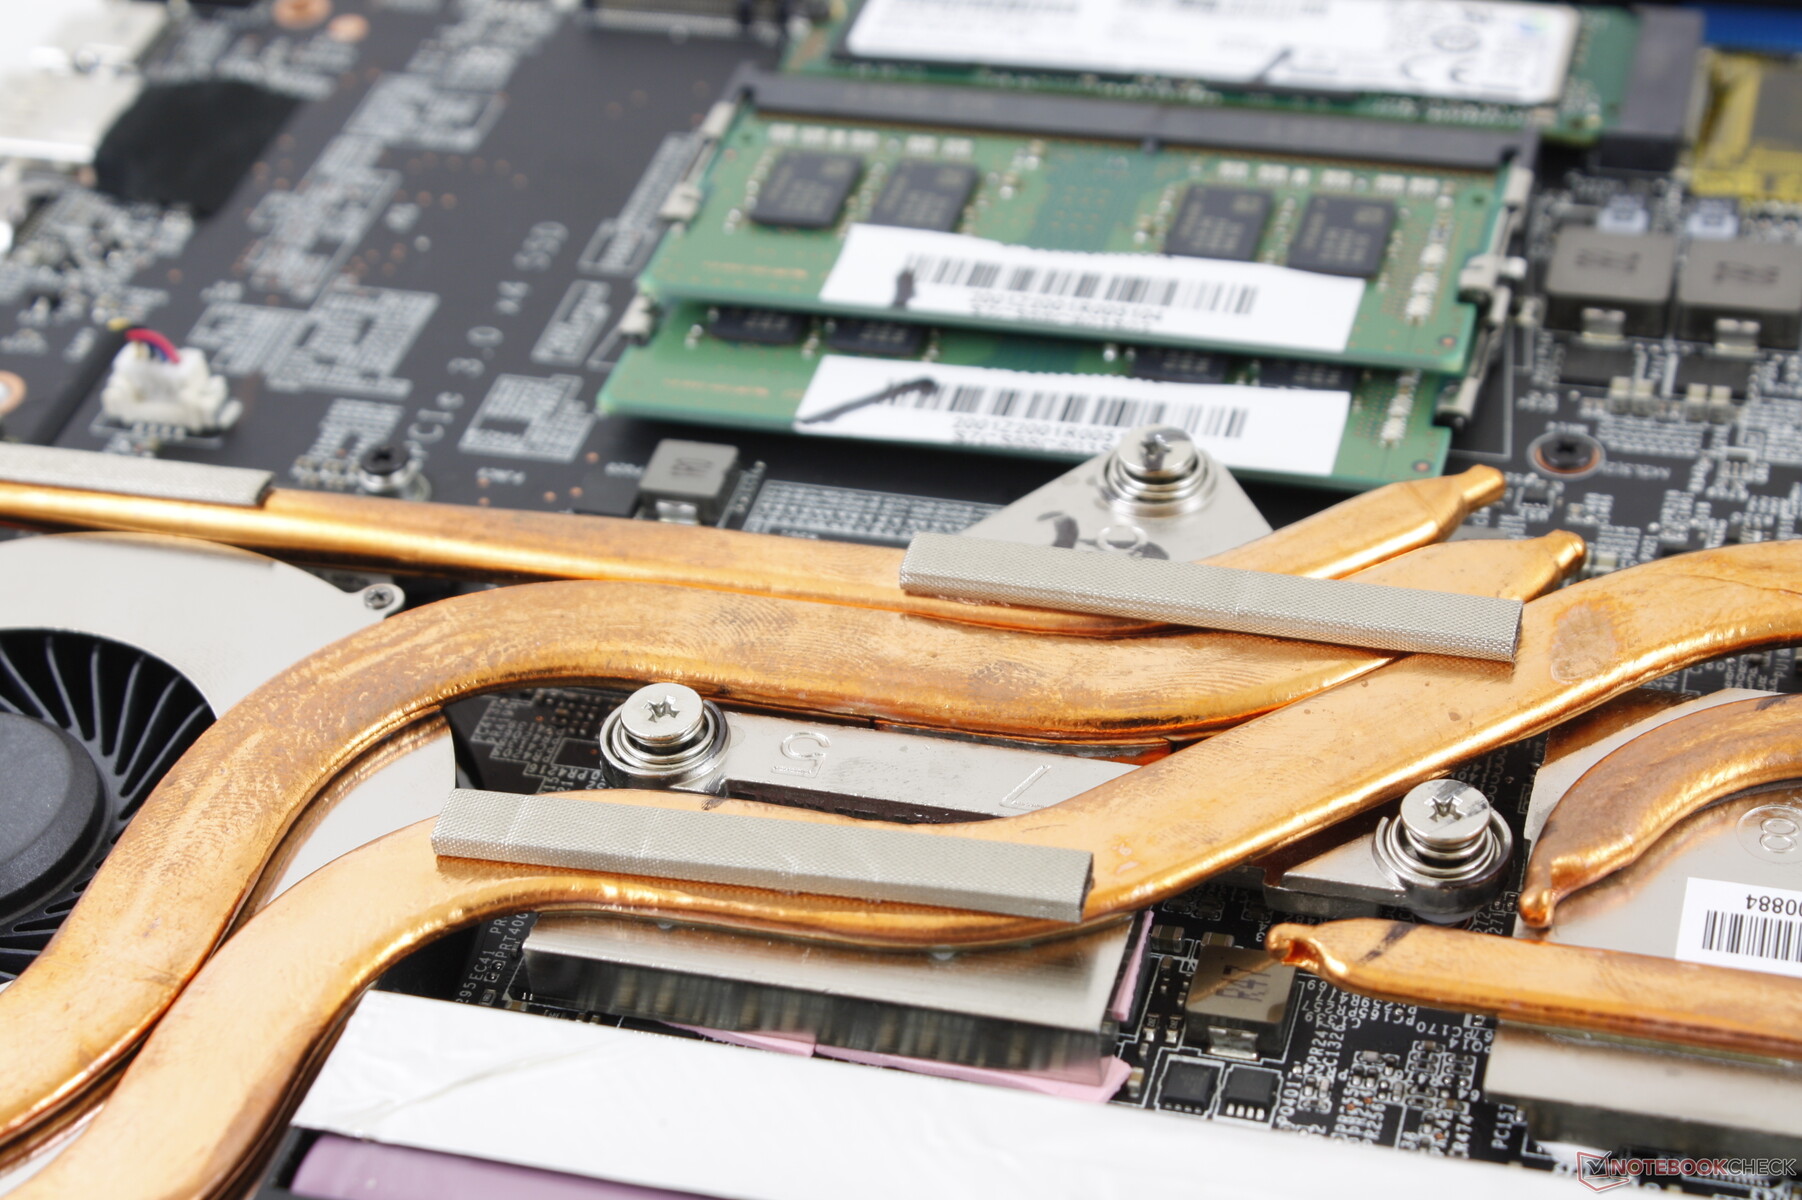
Maintenance
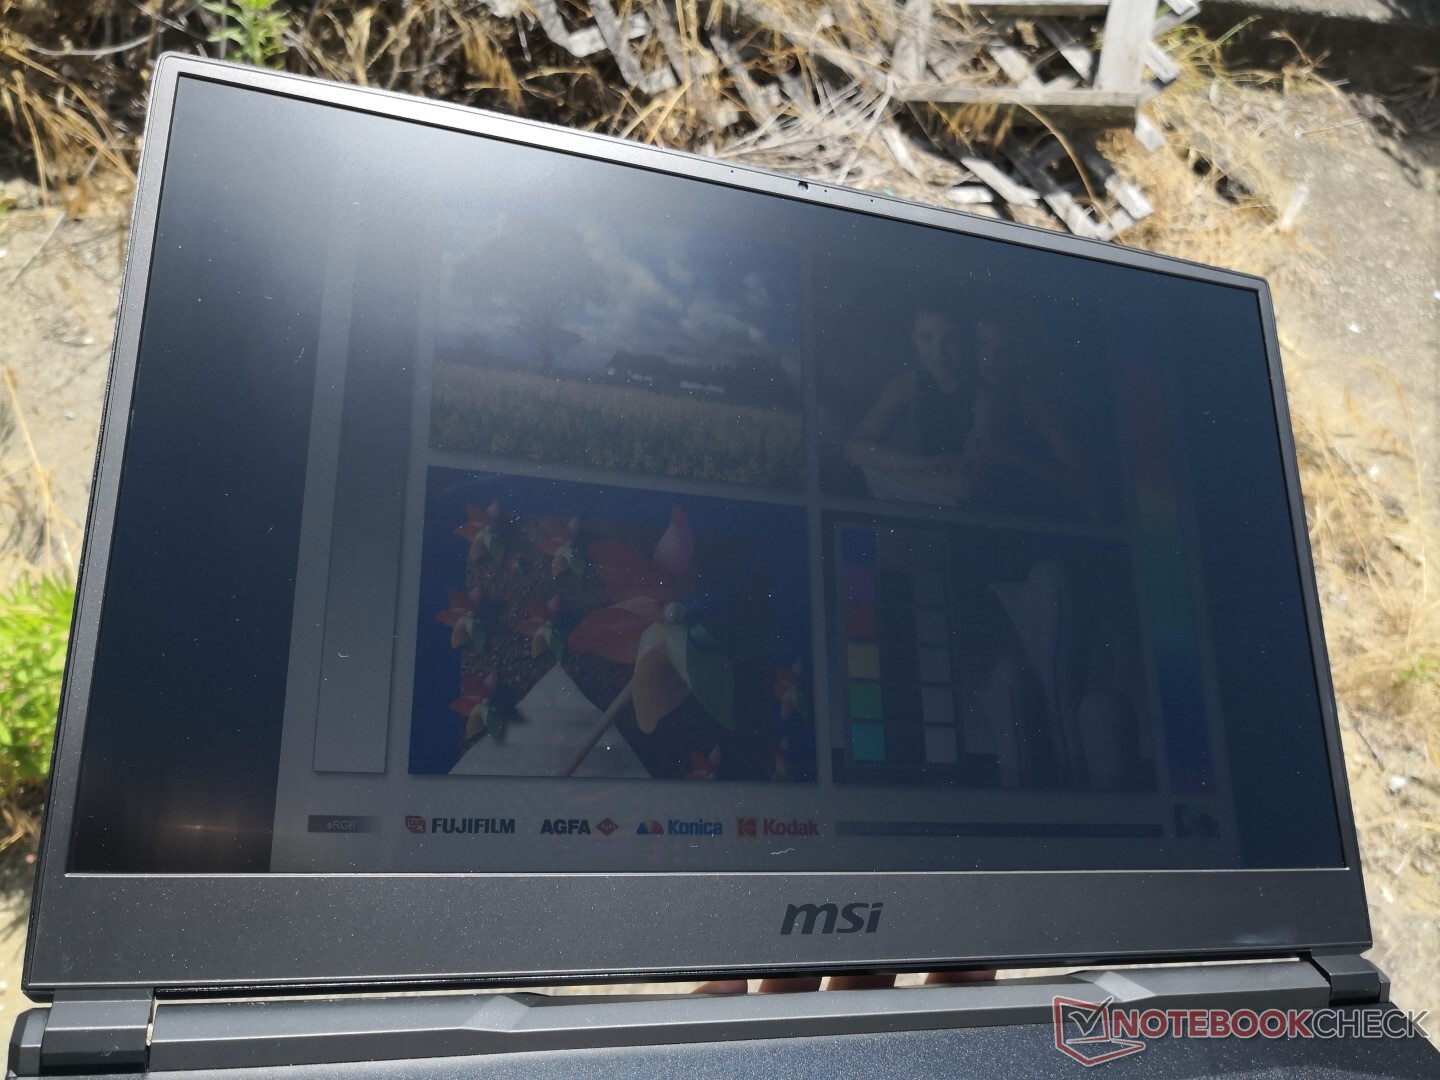
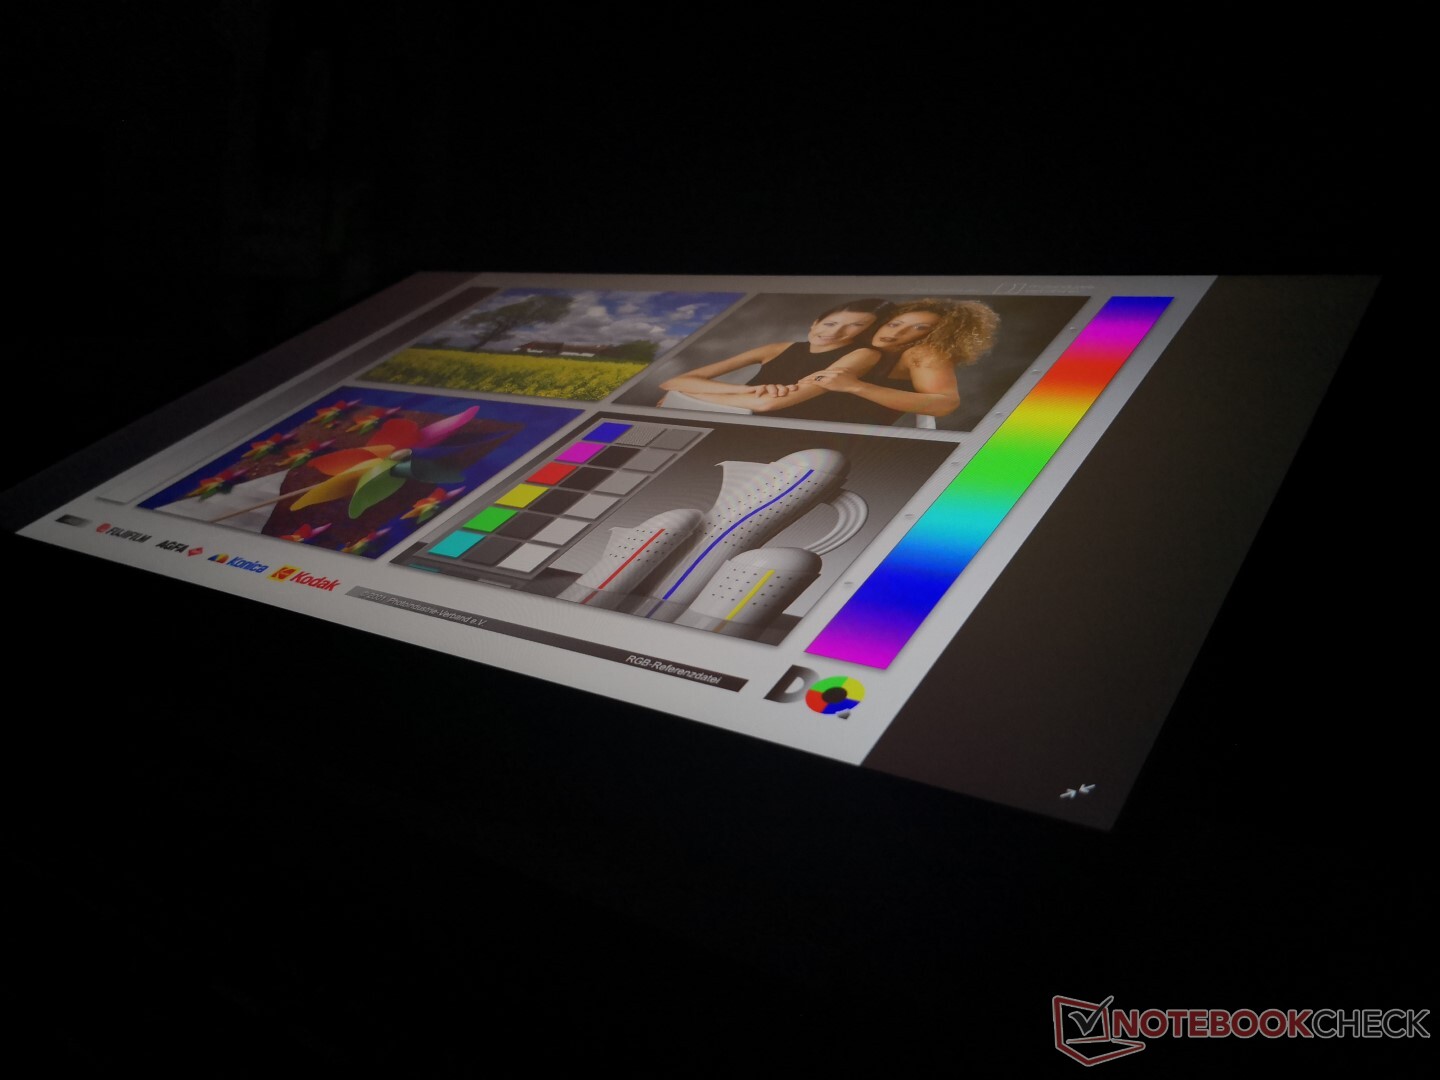
Display
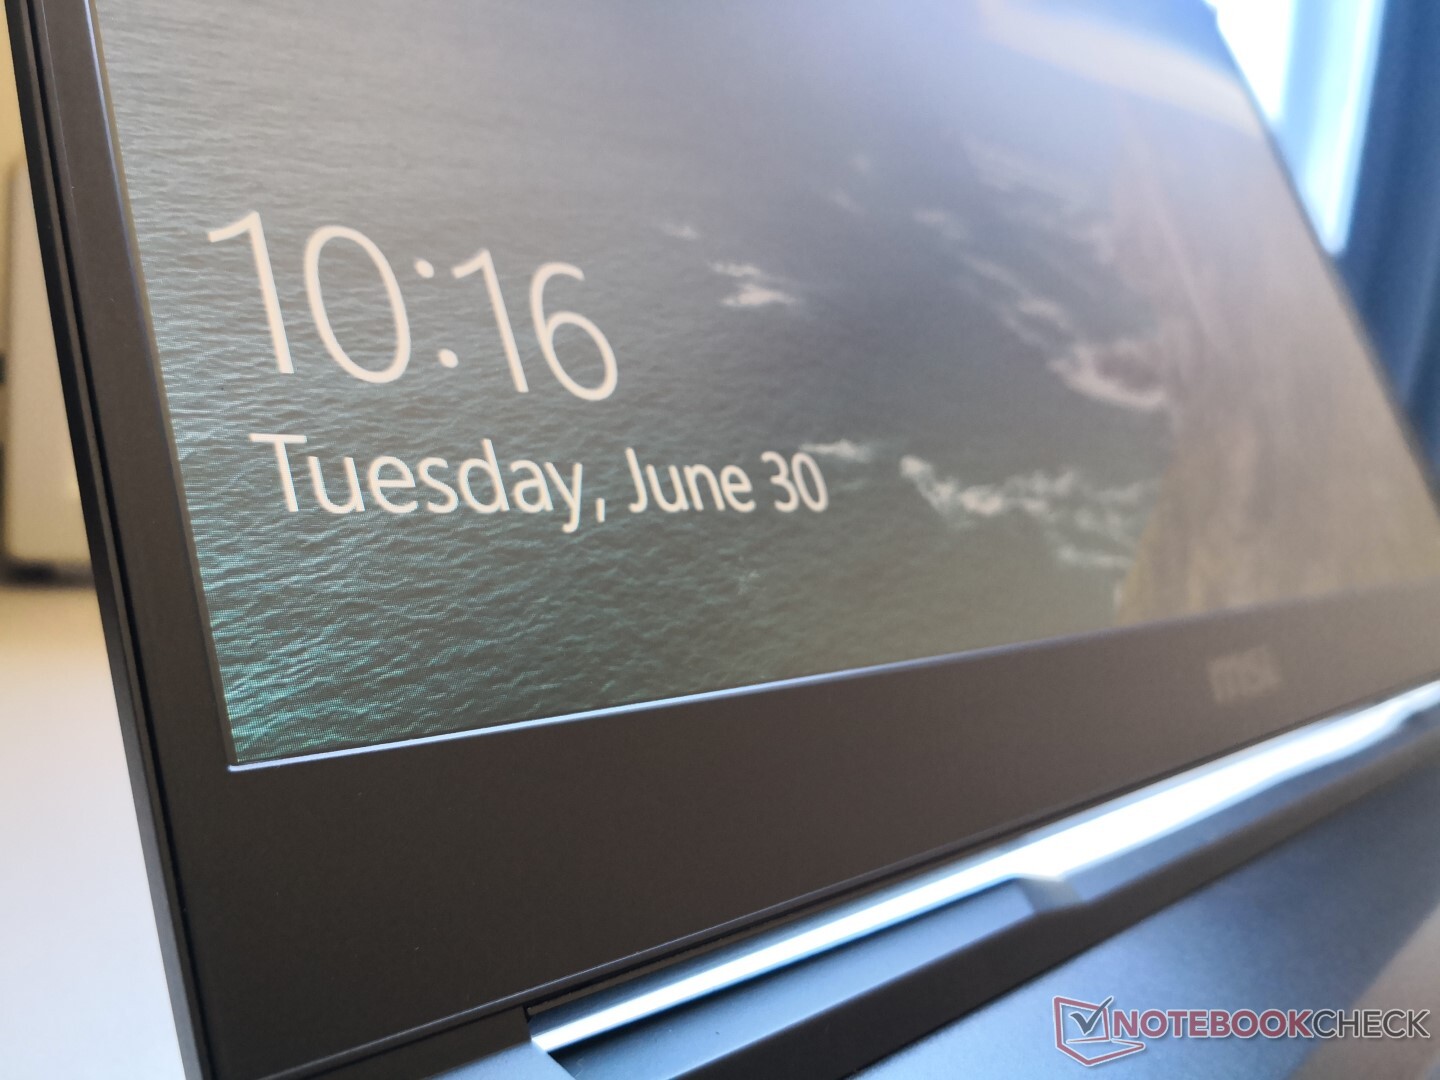
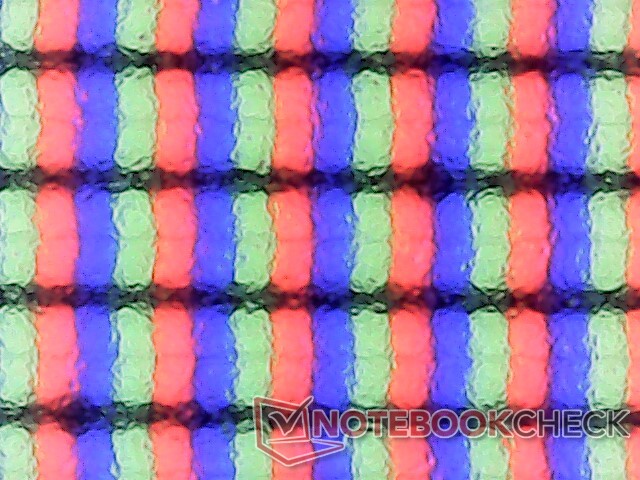
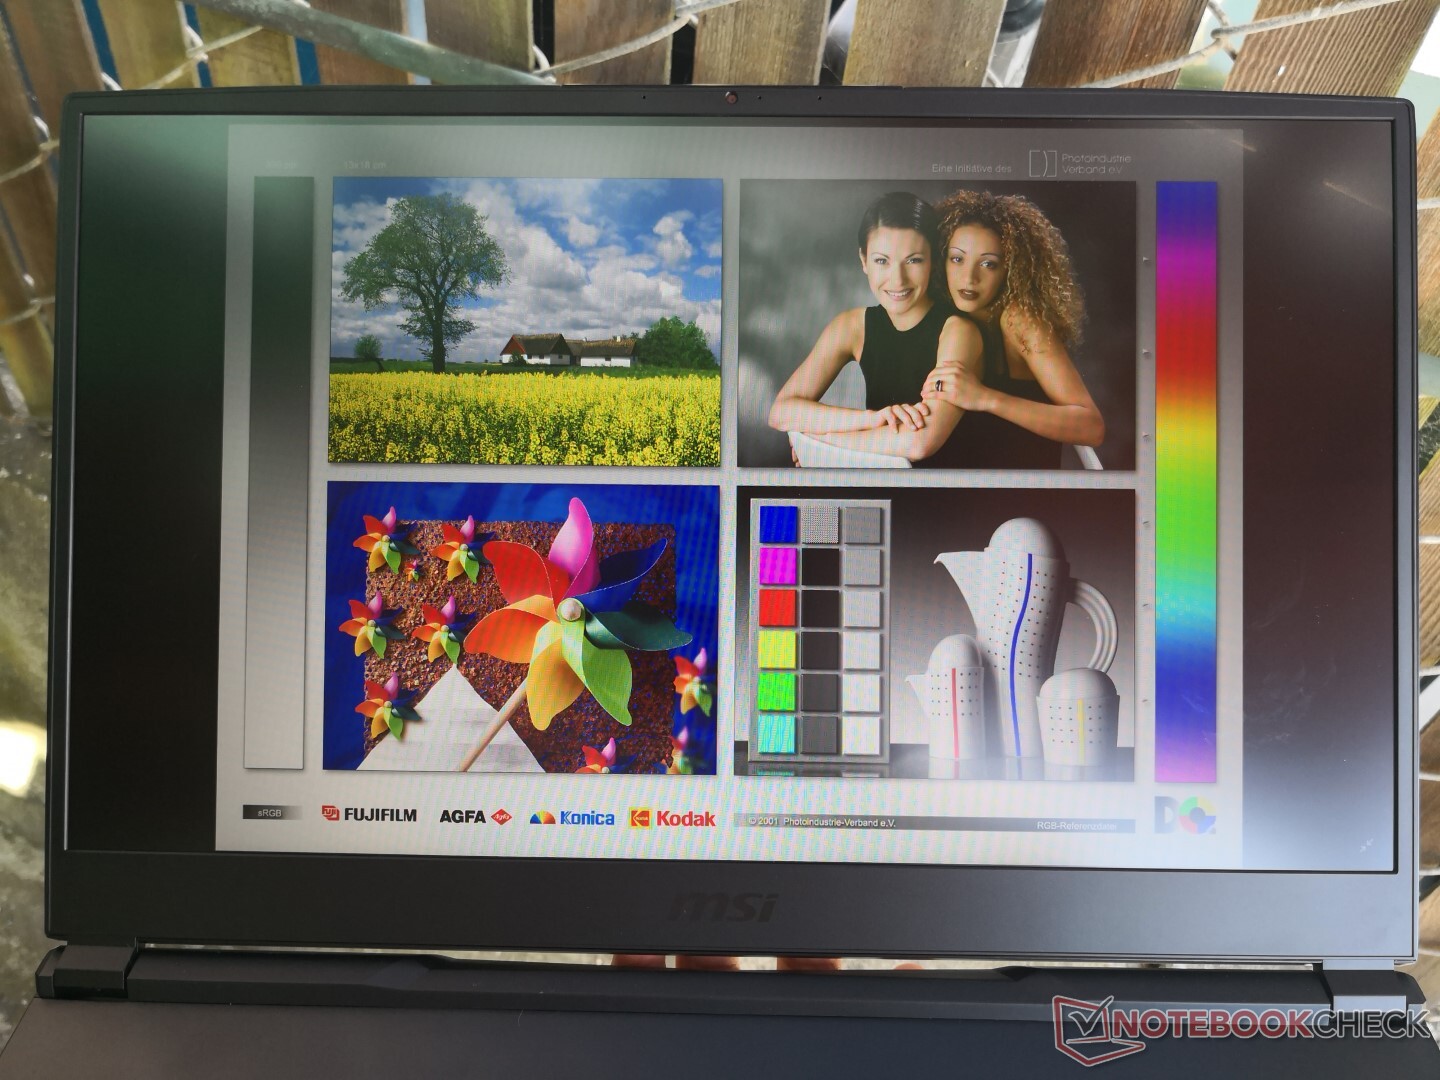
Our 2020 unit uses the same high-end 144 Hz Chi Mei N173HCE-G33 panel as found on the 2019 and 2018 GE75 models. In fact, MSI uses this exact same panel for its thinner GS75 series as well for similar characteristics between them as shown by our table below. Black-white and gray-gray response times in particular are very fast for an ultra-smooth and almost ghost-free experience when gaming.
MSI offers a 300 Hz panel option that we suspect will be from the same maker as the one on the recent Razer Blade Pro 17.
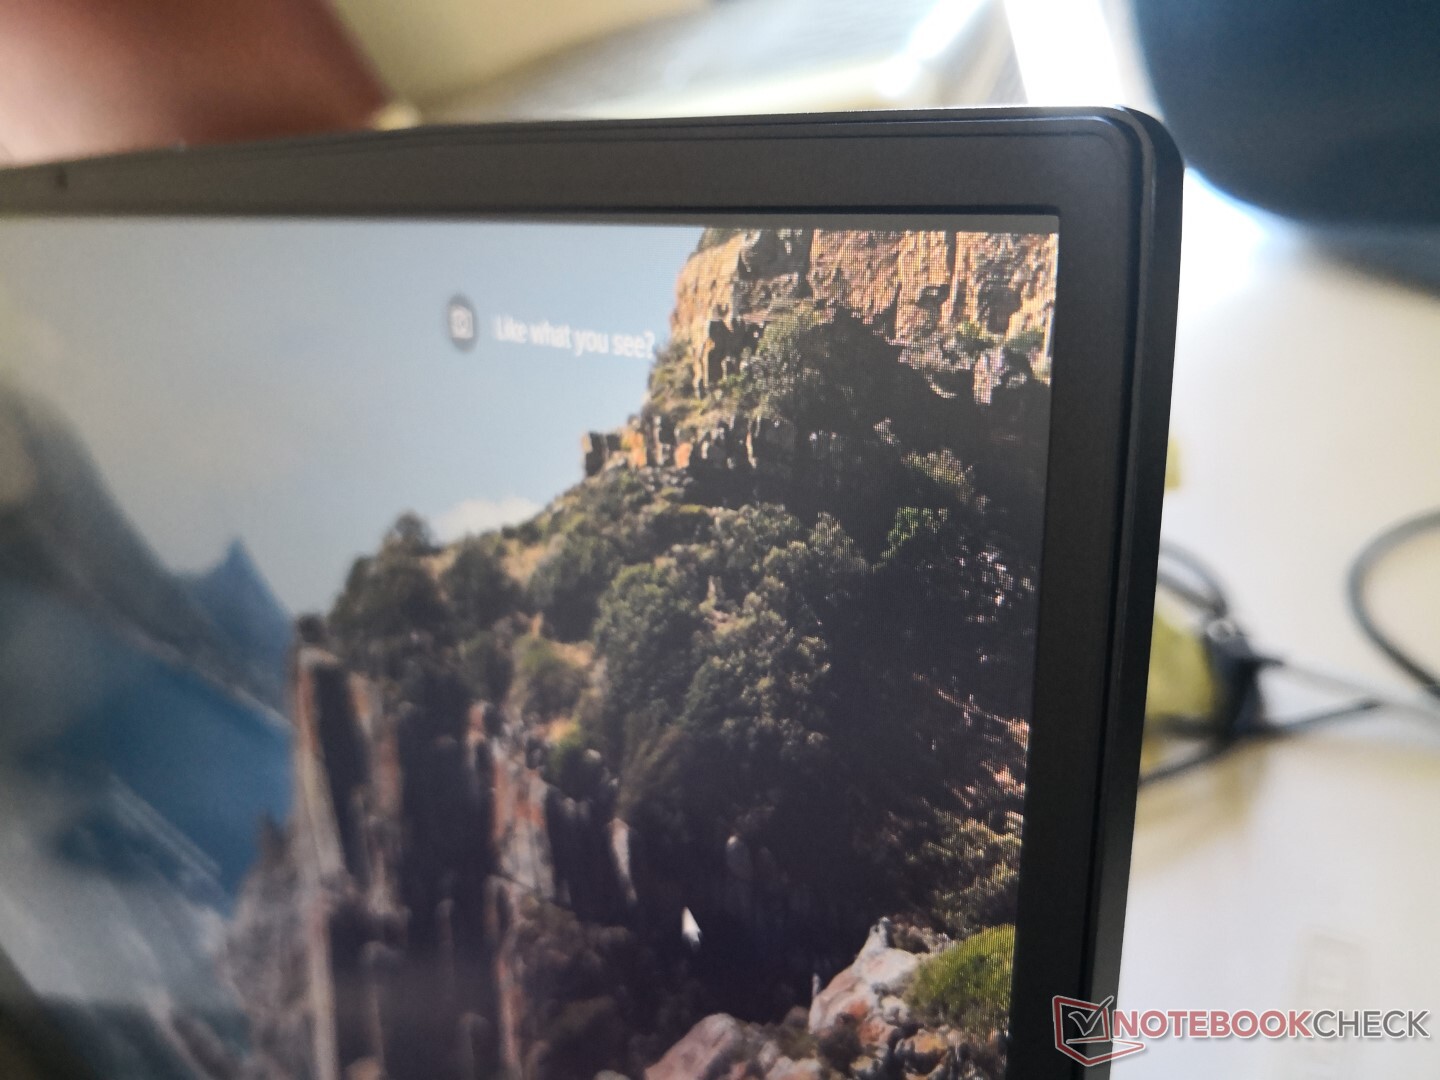
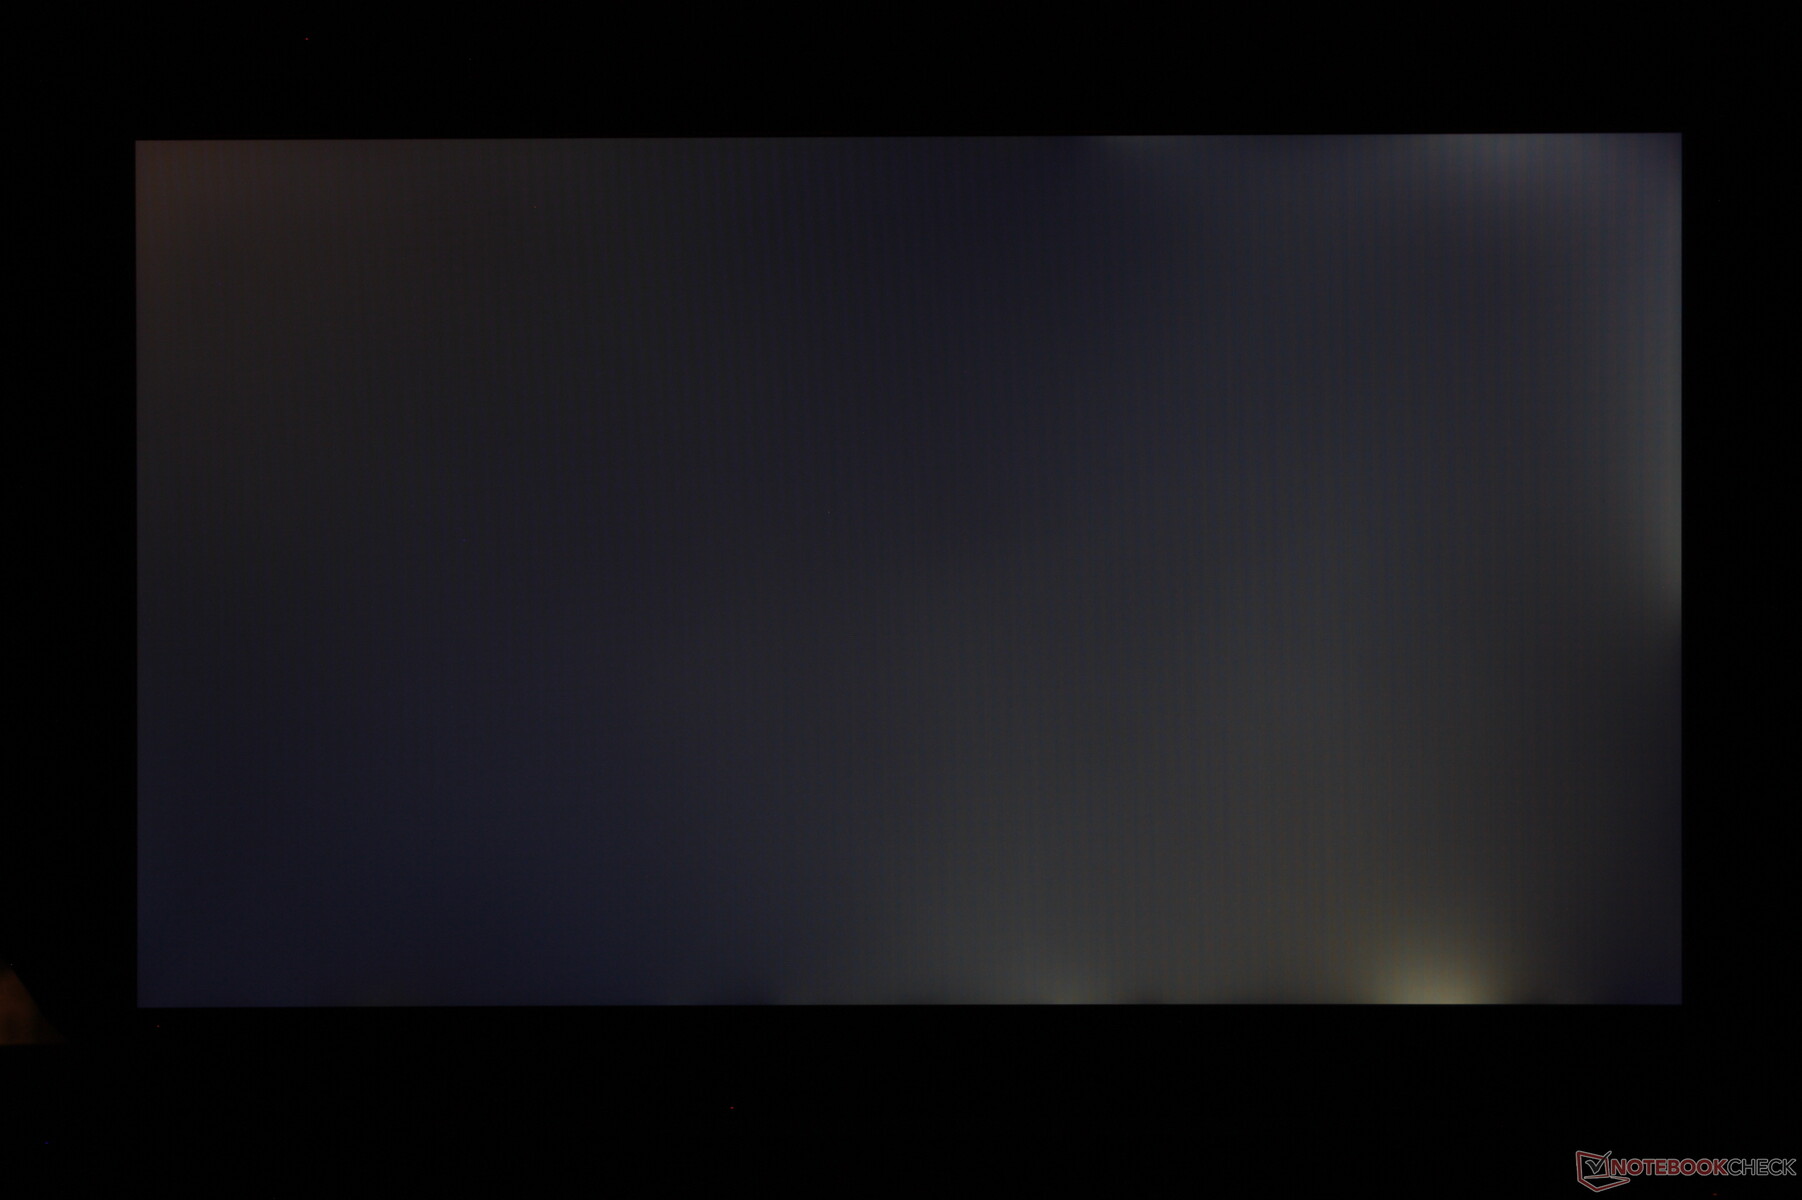
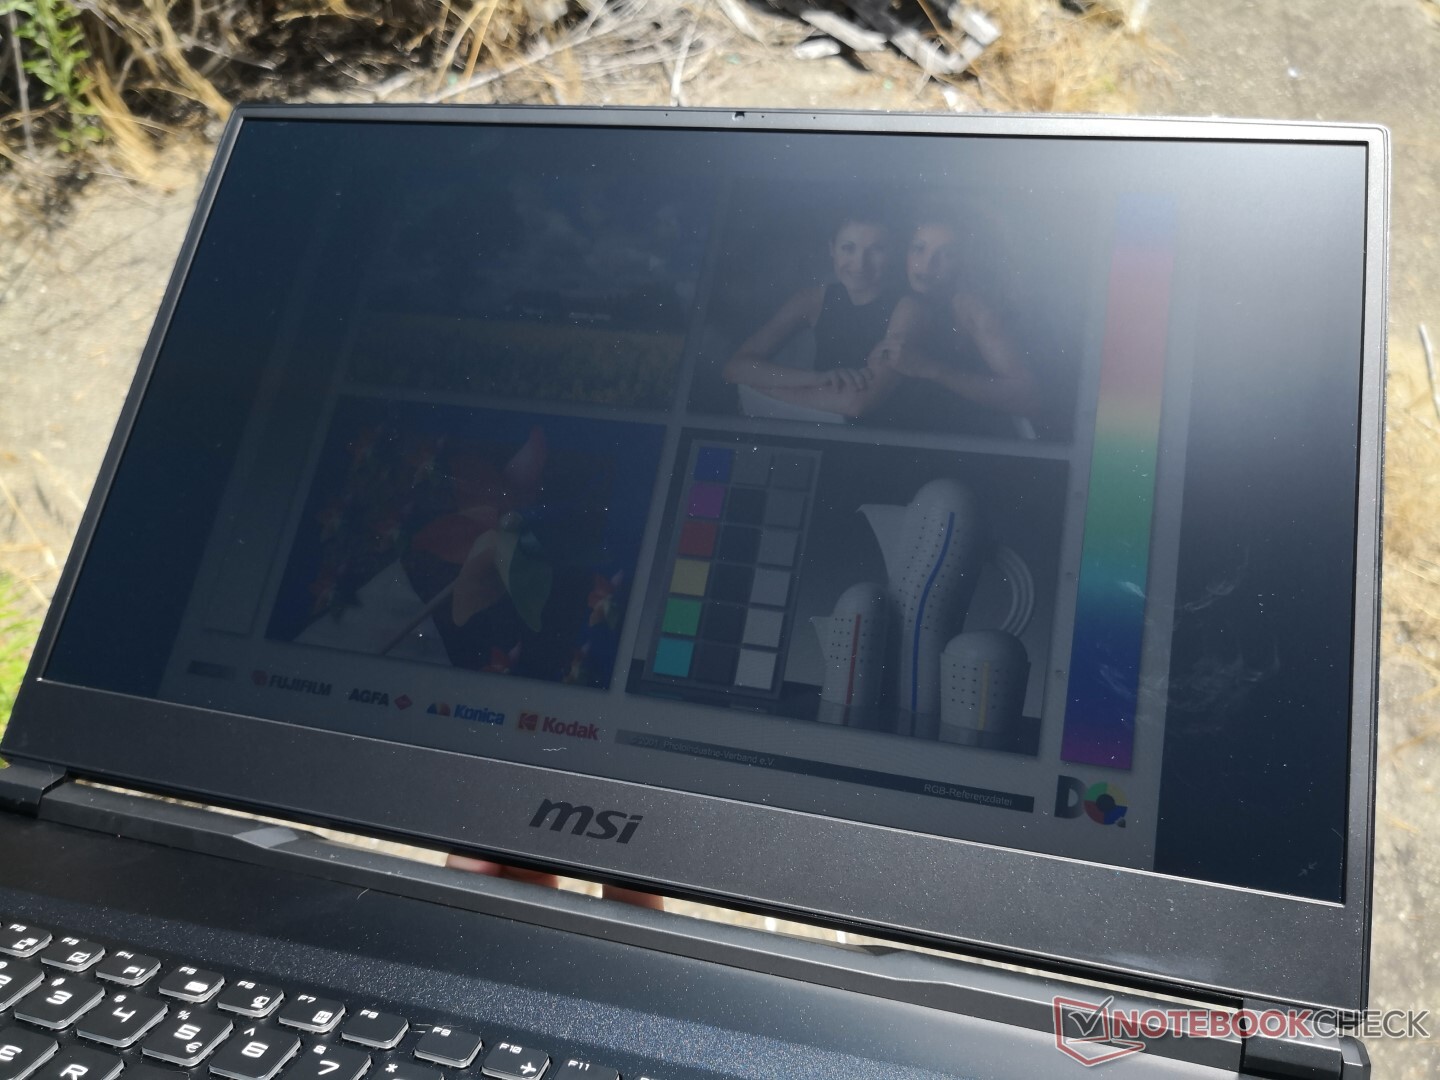
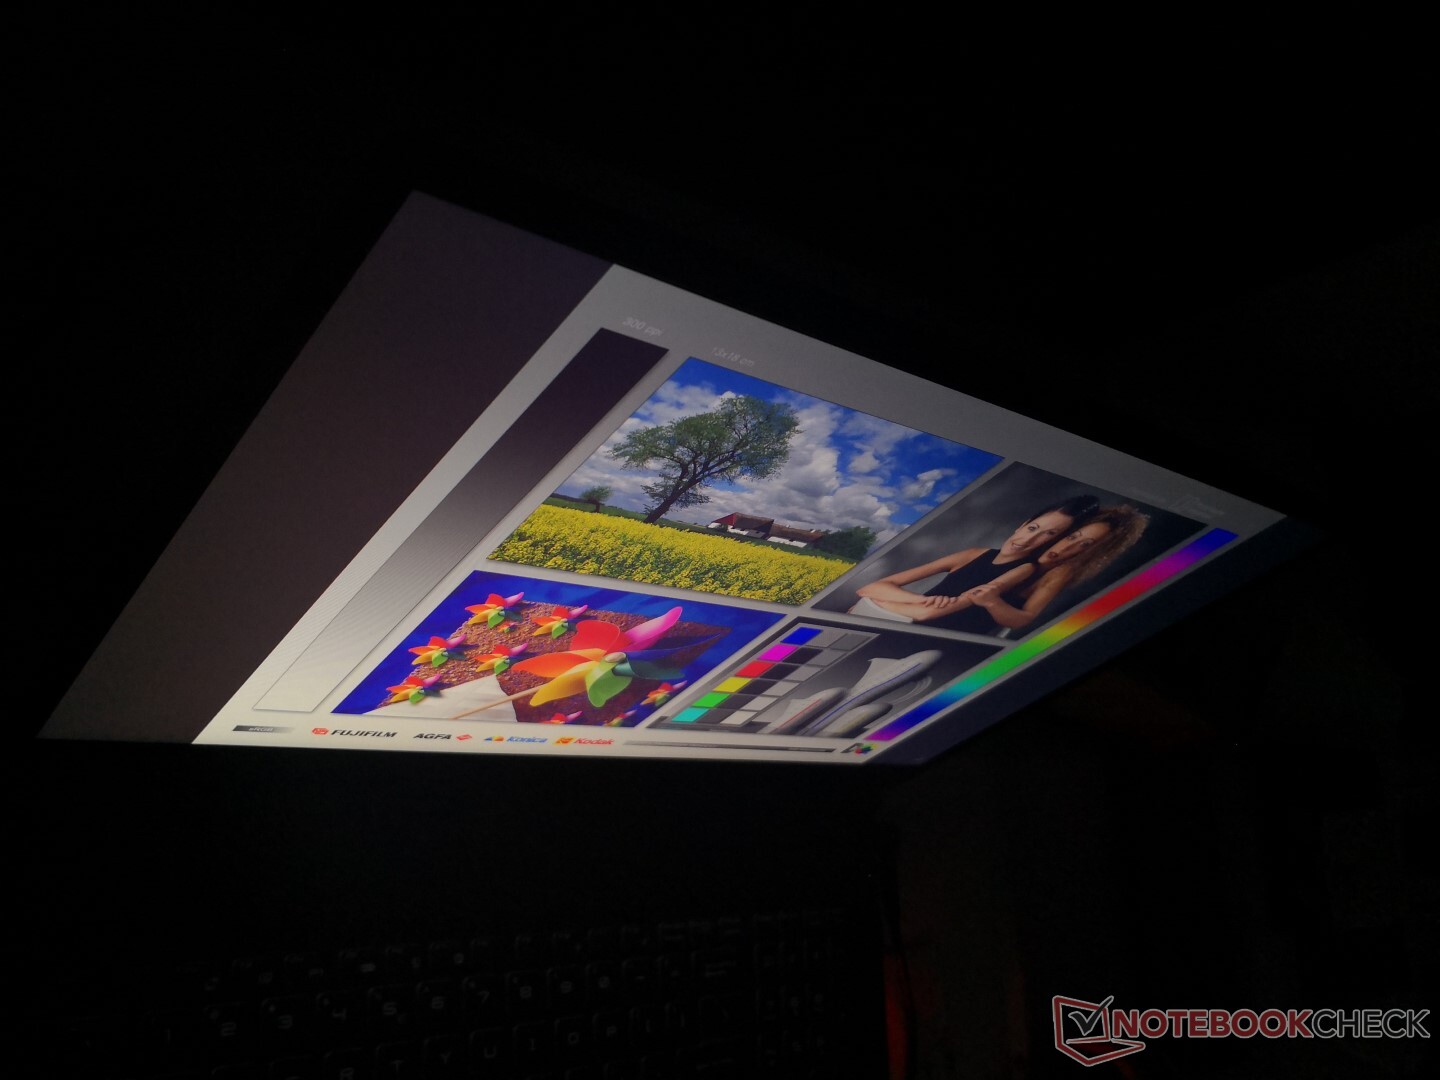
Pulse-width modulation is present at very low brightness levels and we're disappointed to see moderate backlight bleeding from the edges and corners especially on such a pricey gaming laptop. This is definitely an aspect for MSI to improve upon for the future.
| |||||||||||||||||||||||||
Brightness Distribution: 81 %
Center on Battery: 337.9 cd/m²
Contrast: 1165:1 (Black: 0.29 cd/m²)
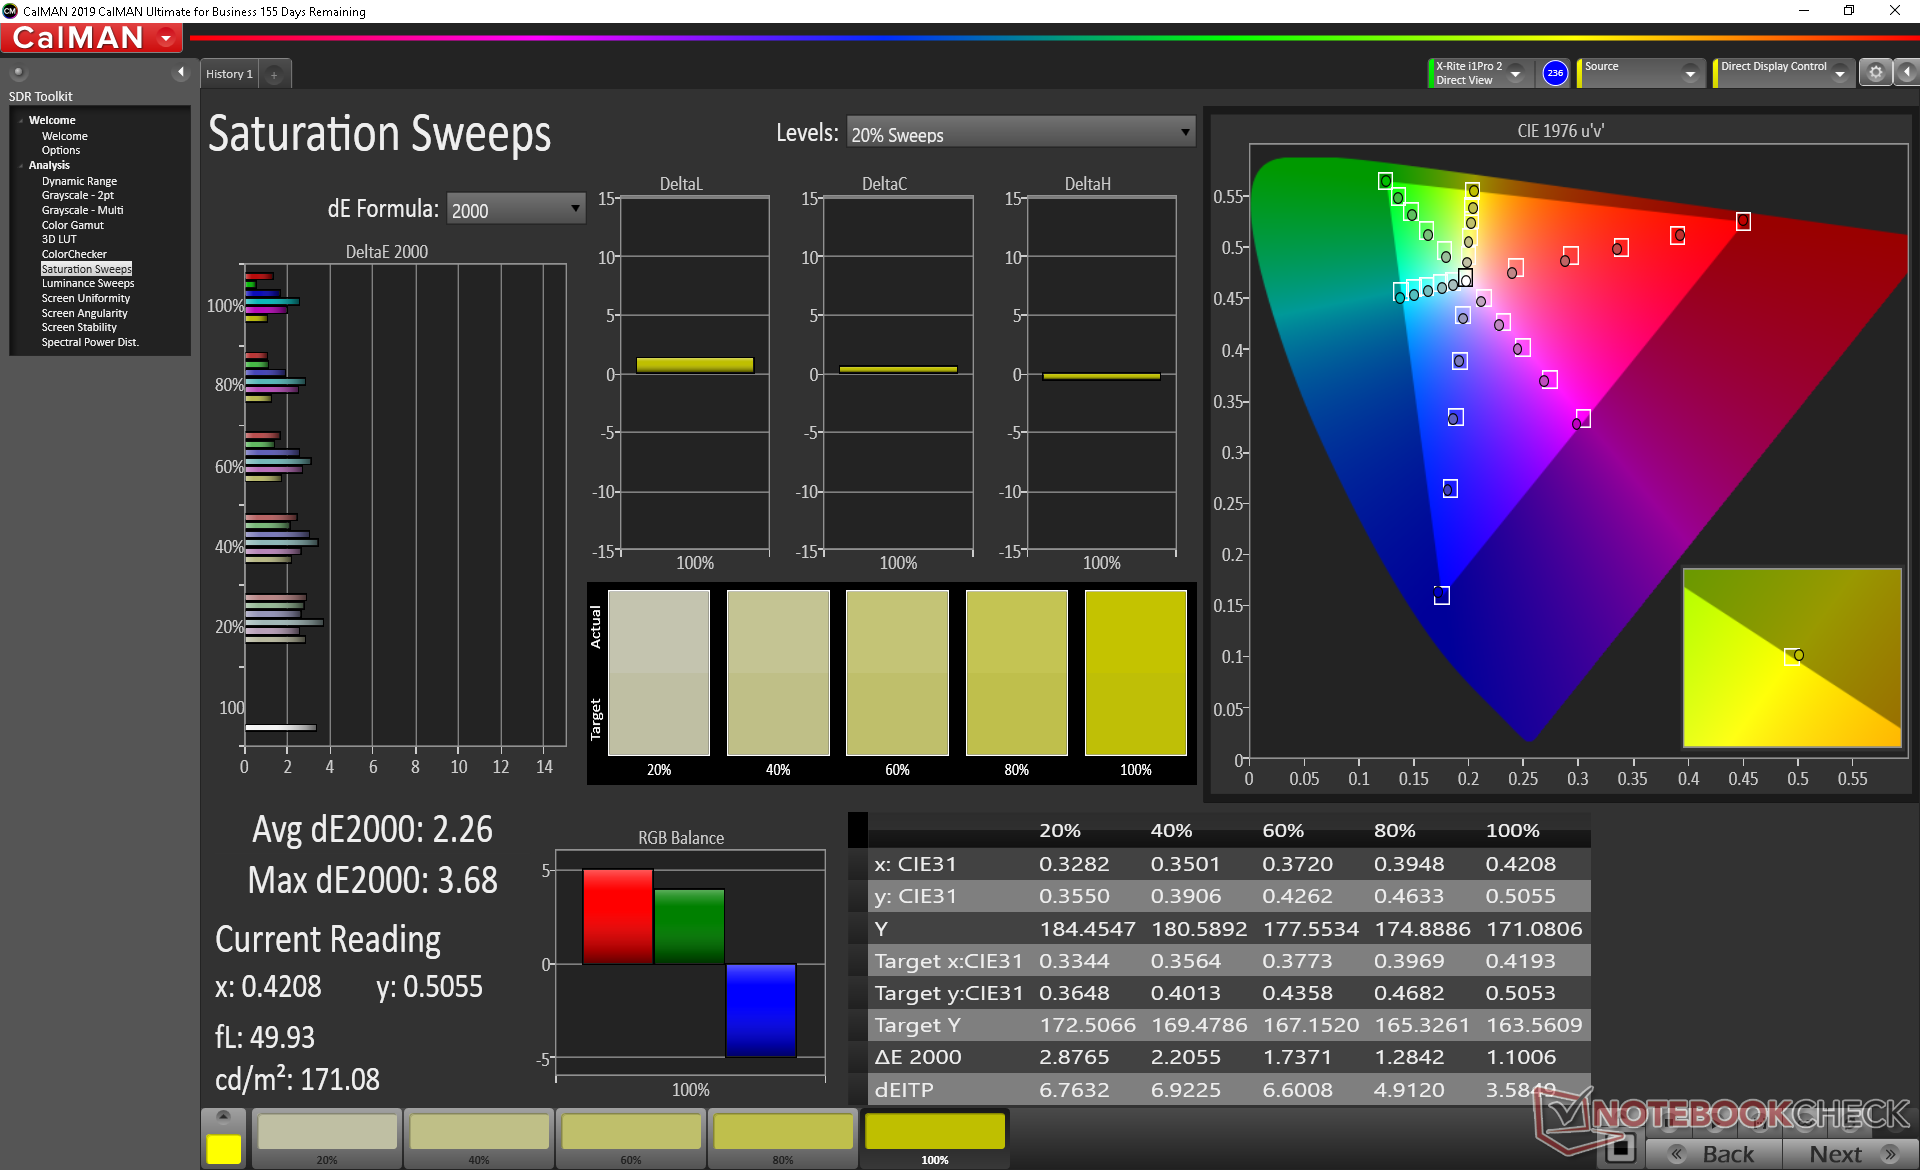
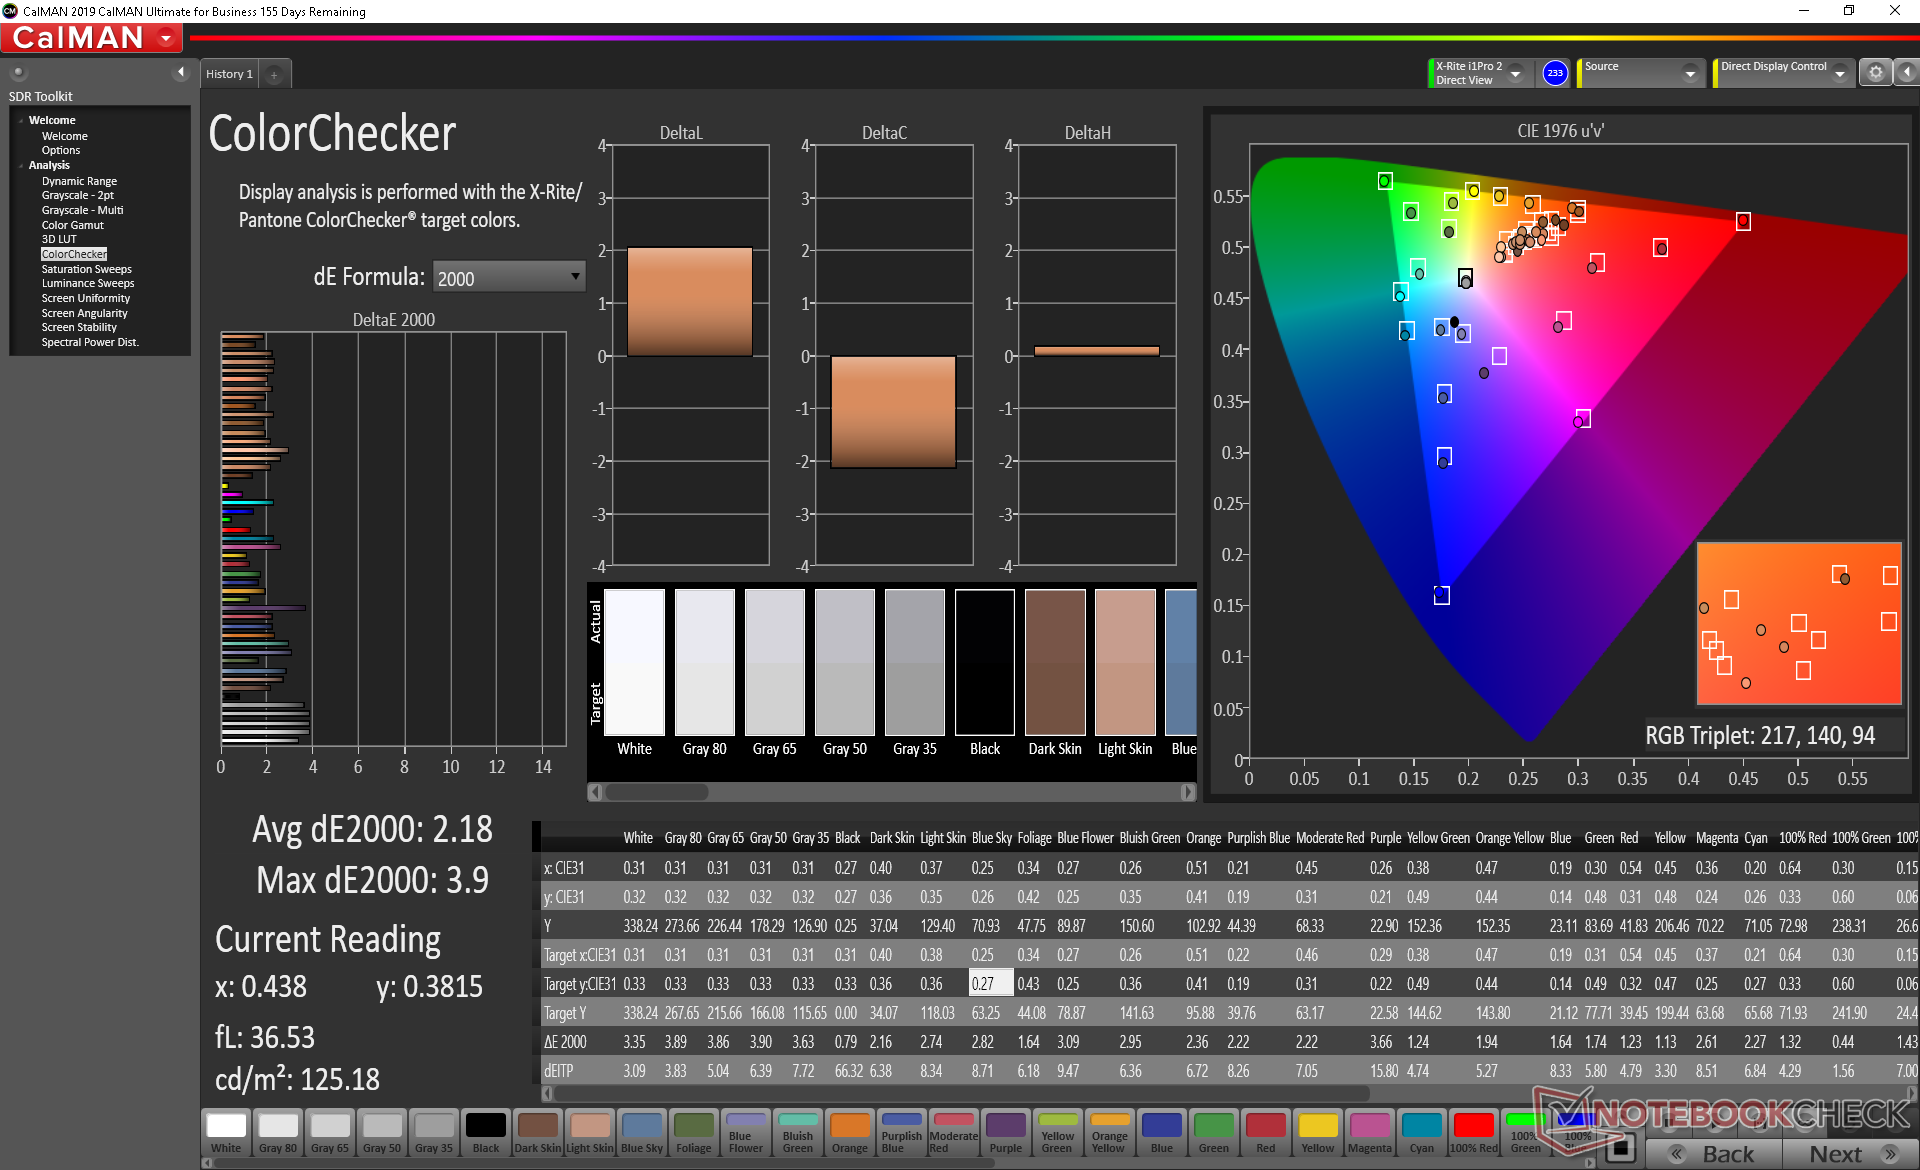
ΔE ColorChecker Calman: 2.18 | ∀{0.5-29.43 Ø4.73}
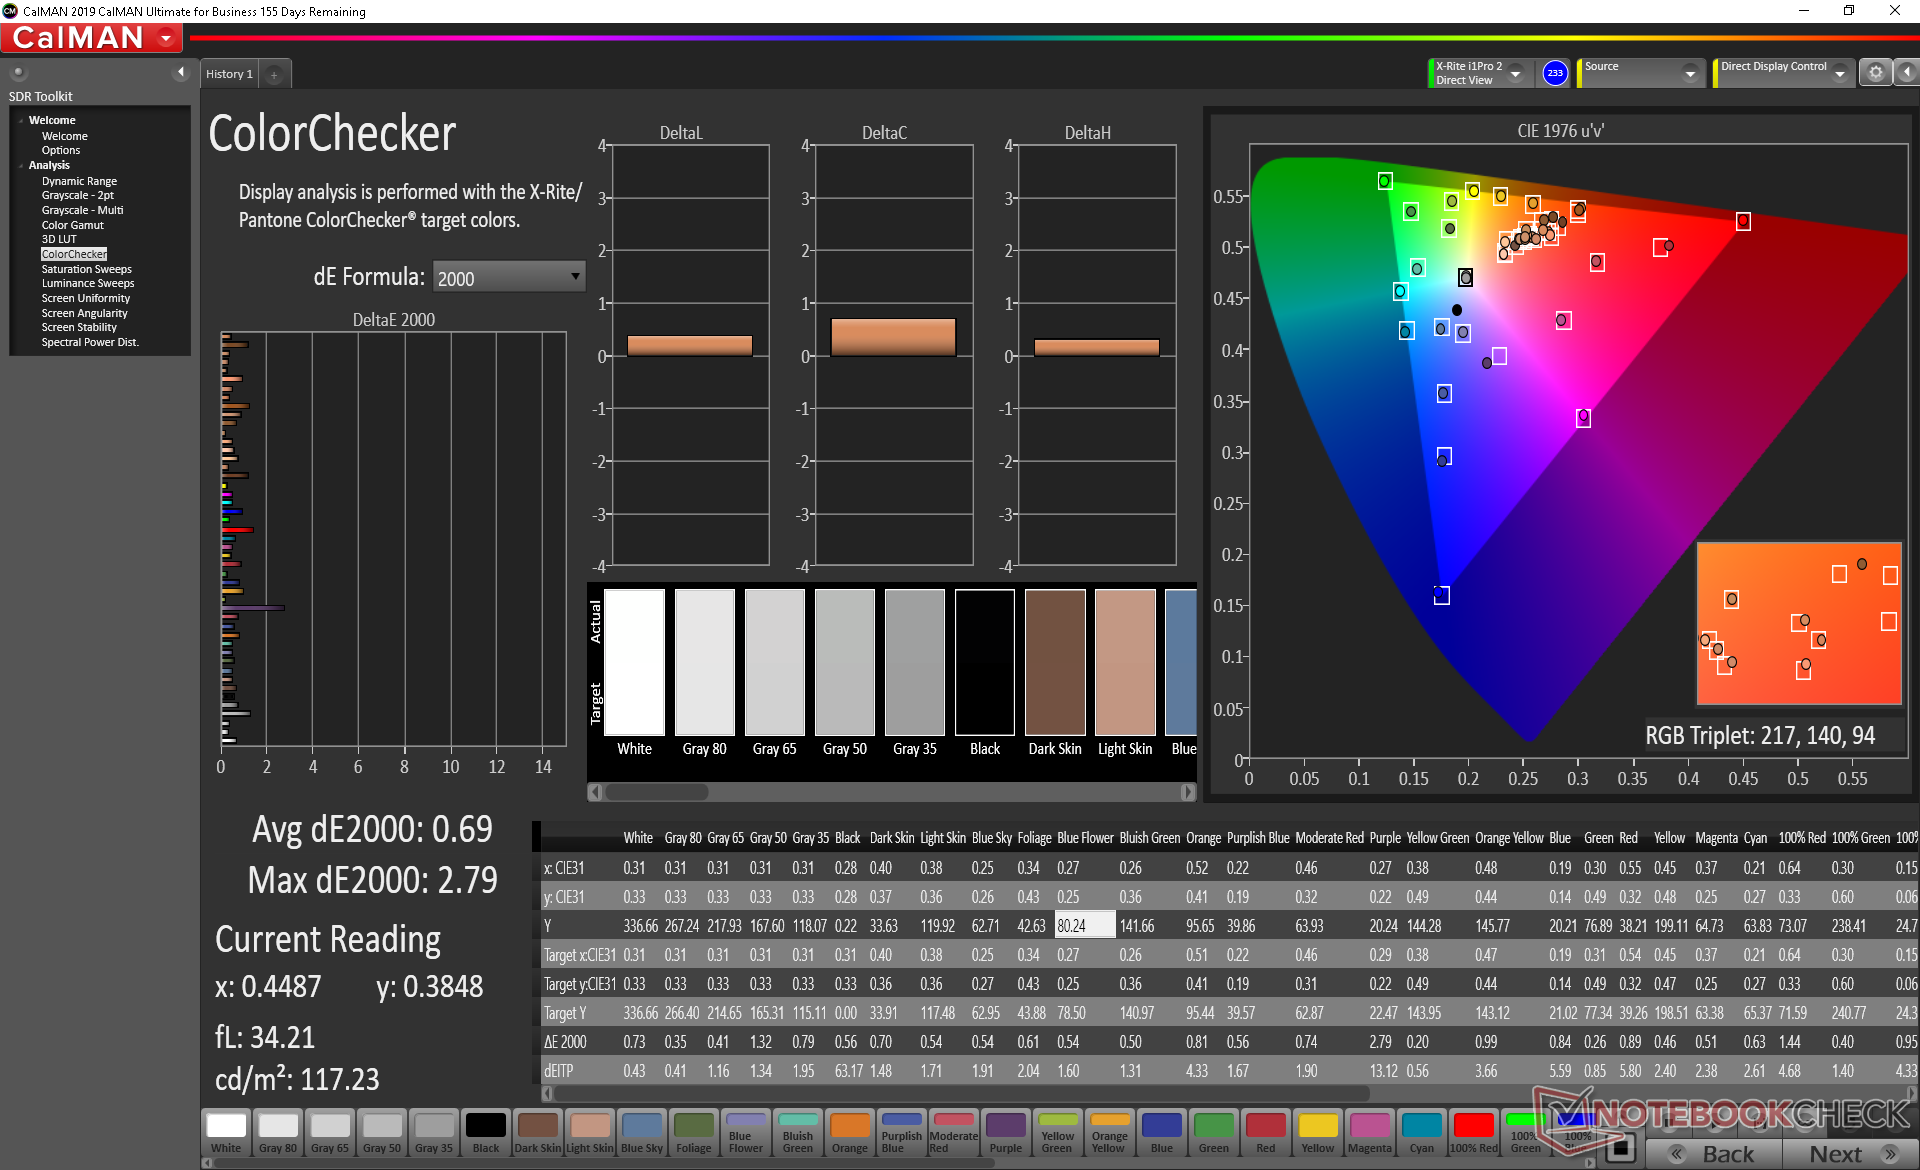
calibrated: 0.69
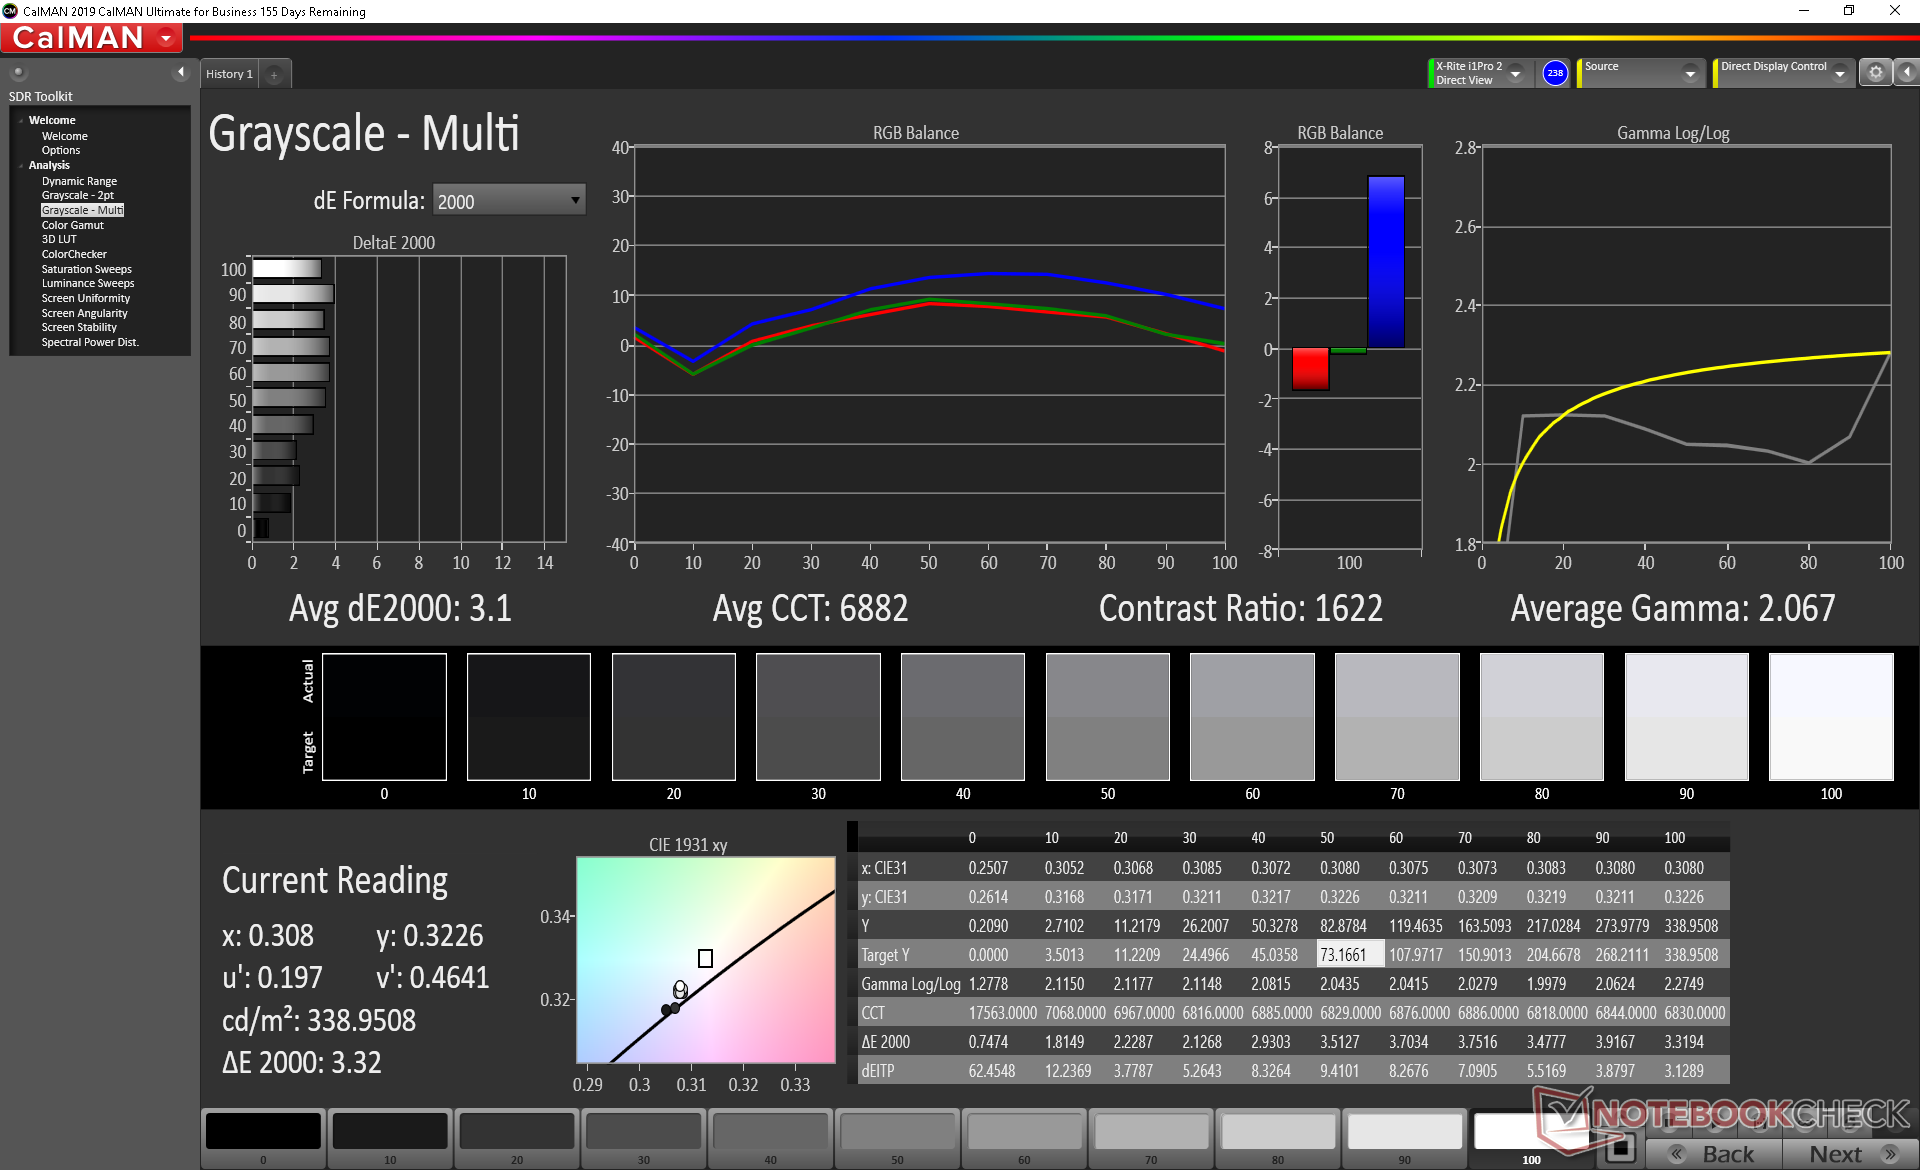
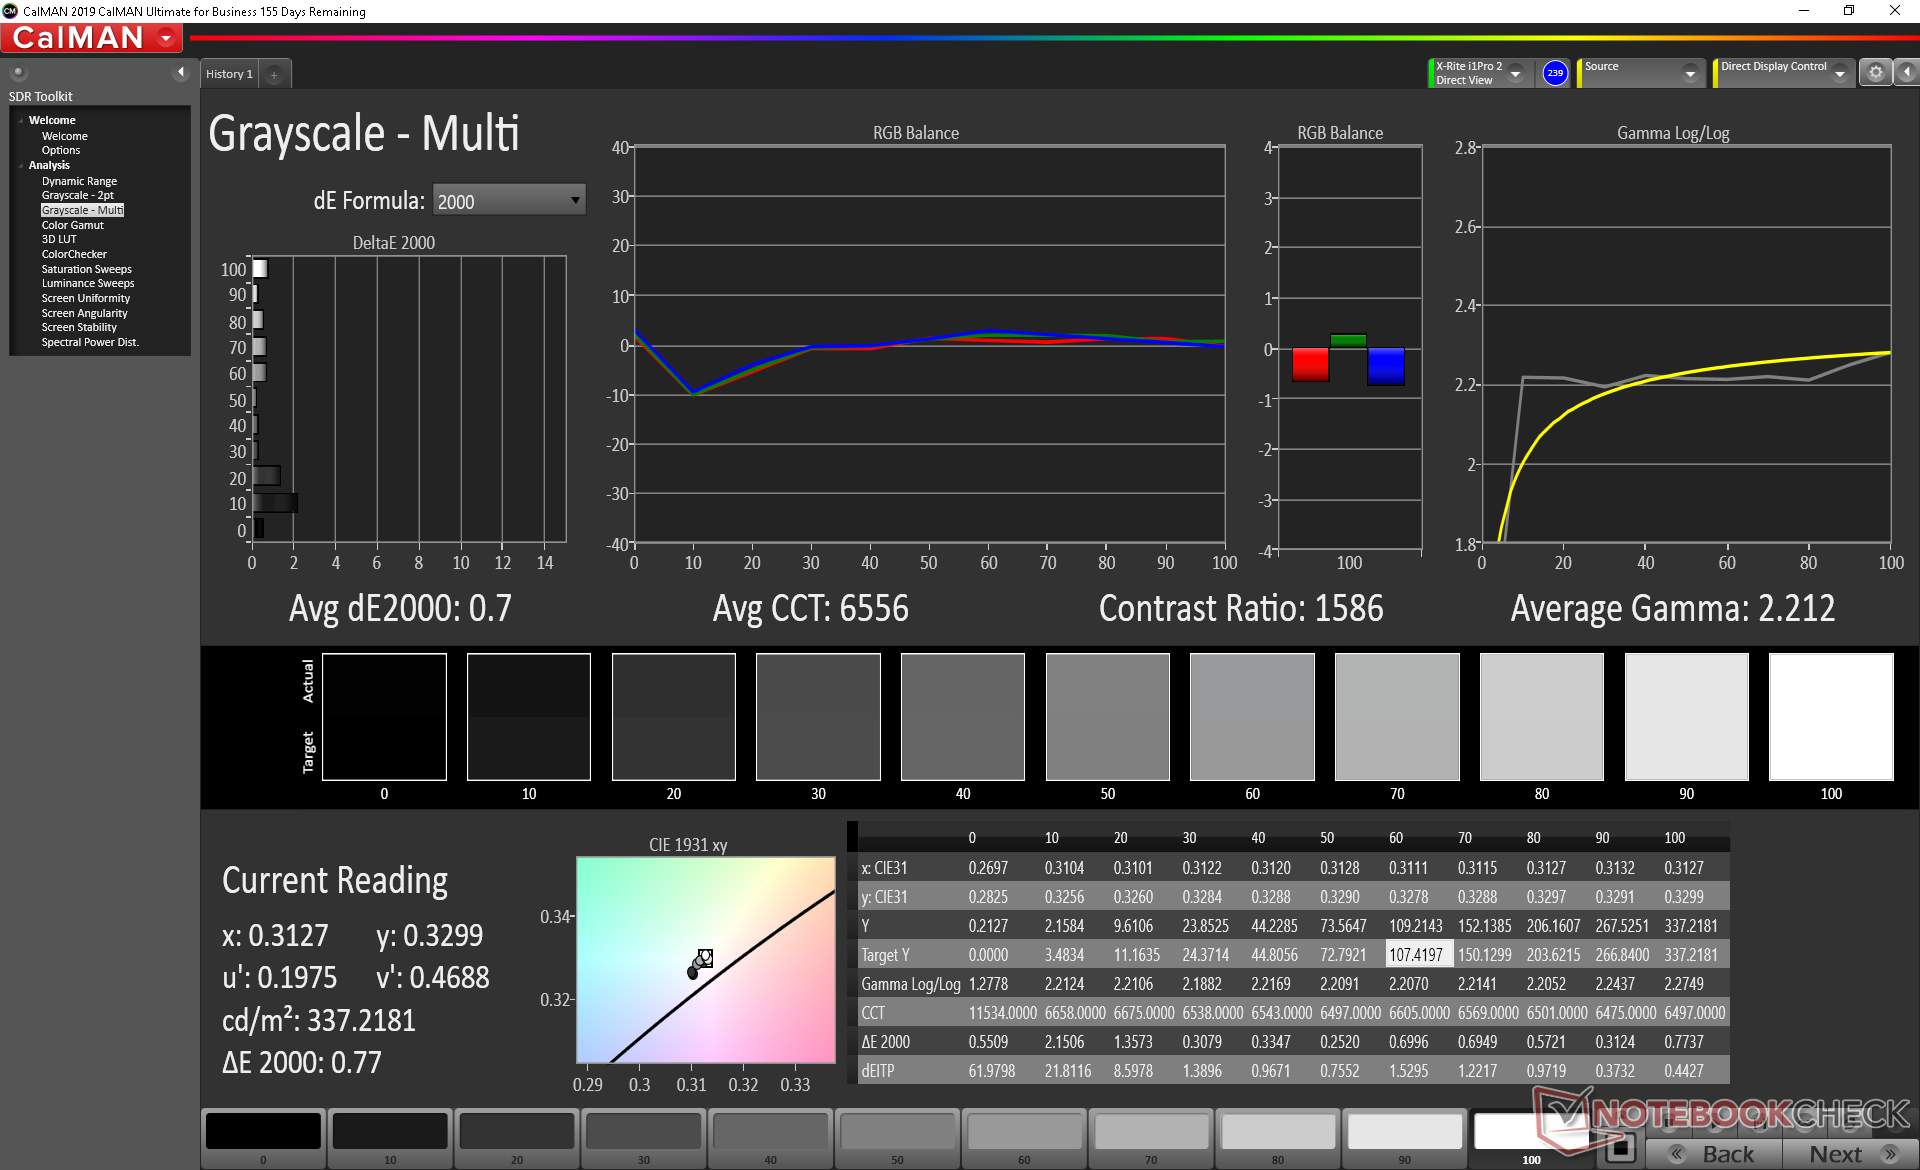
ΔE Greyscale Calman: 3.1 | ∀{0.09-98 Ø4.97}
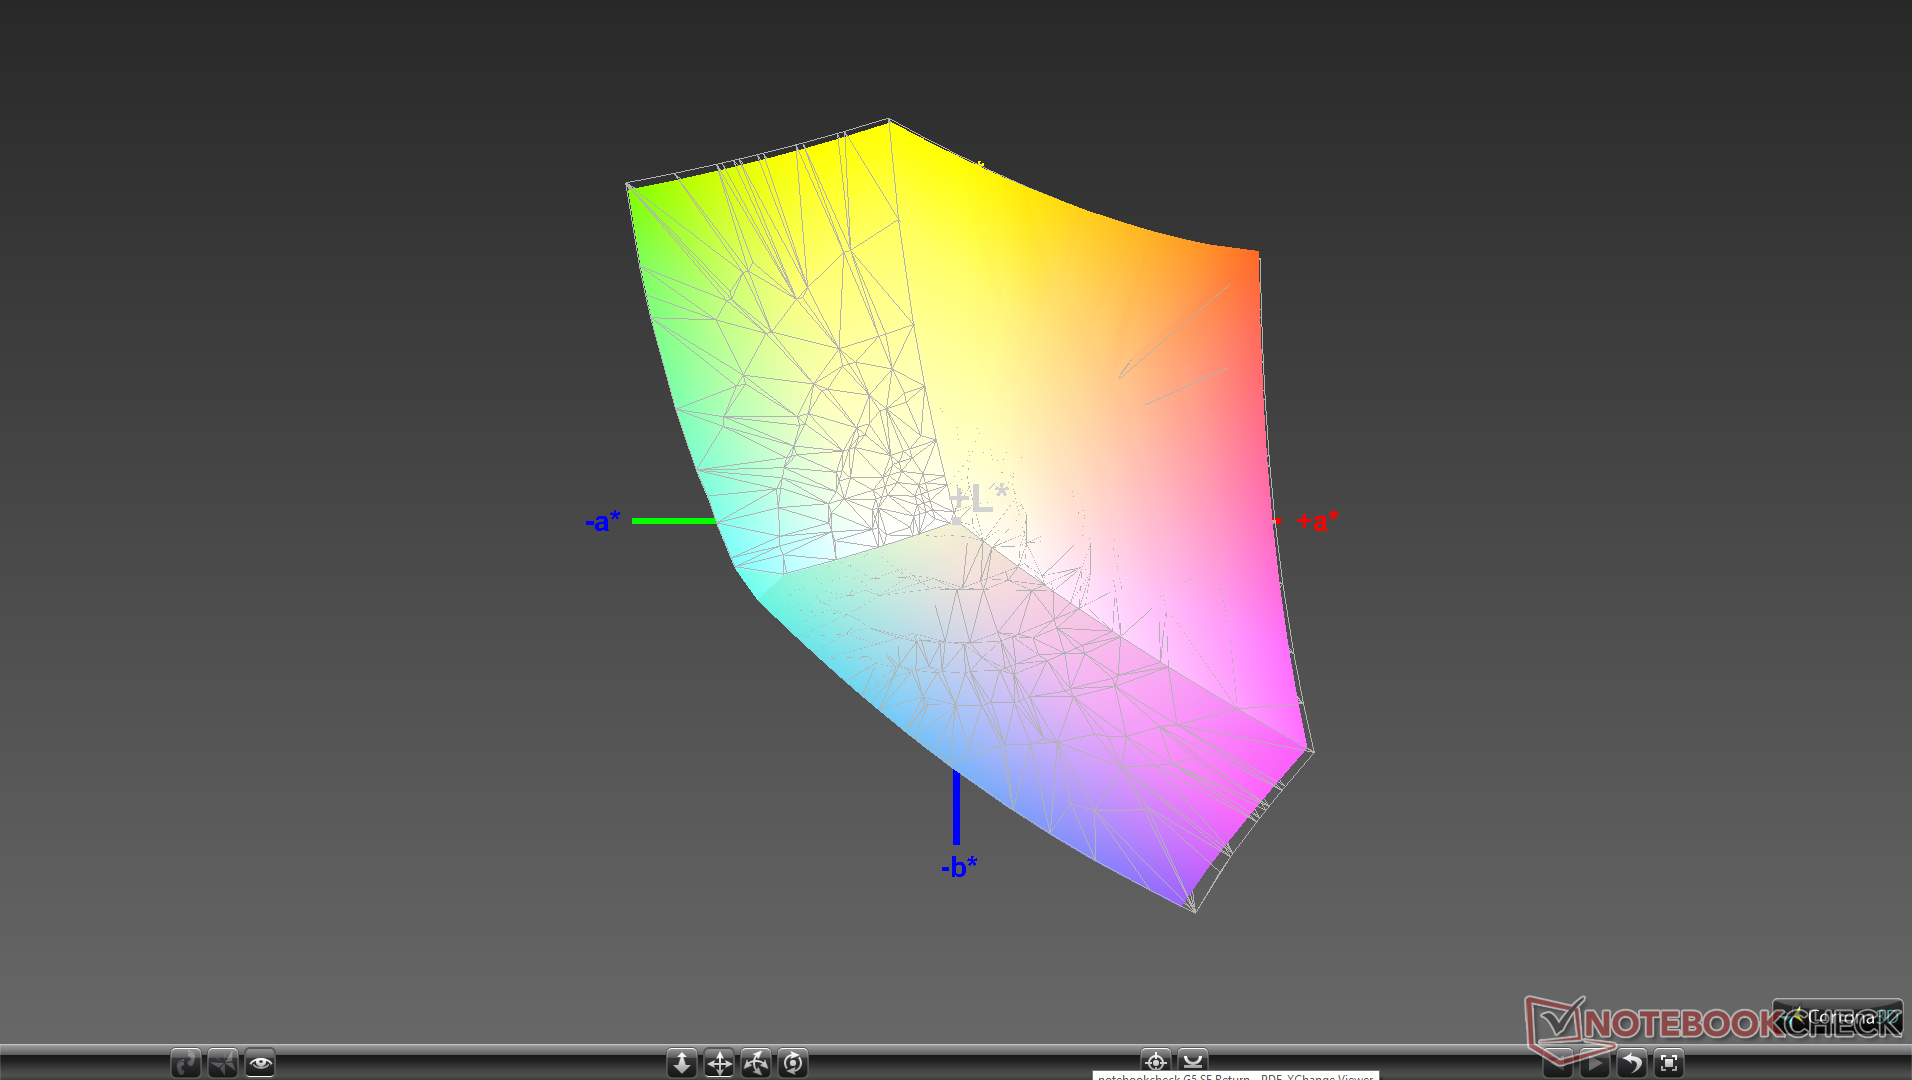
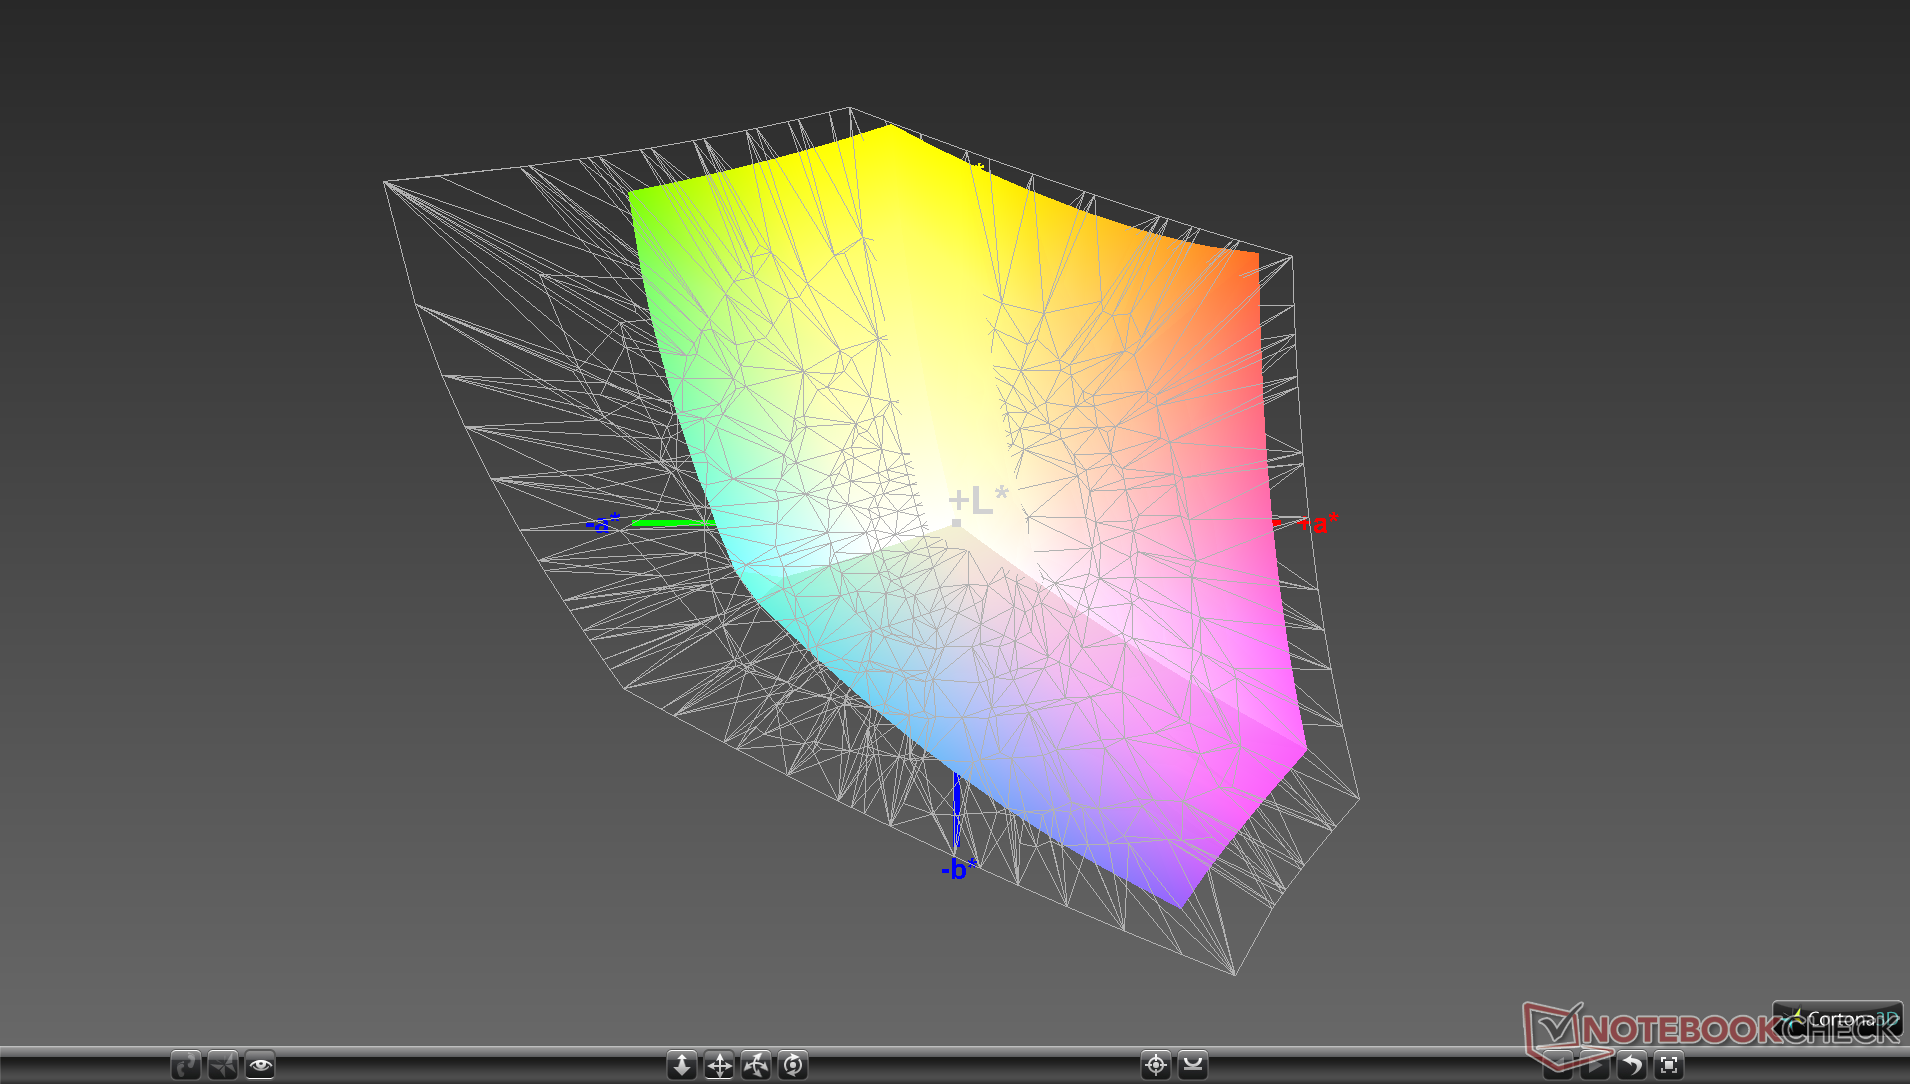
98.2% sRGB (Argyll 1.6.3 3D)
62% AdobeRGB 1998 (Argyll 1.6.3 3D)
67.8% AdobeRGB 1998 (Argyll 3D)
98.1% sRGB (Argyll 3D)
65.6% Display P3 (Argyll 3D)
Gamma: 2.07
CCT: 6882 K
| MSI GE75 Raider 10SE-008US Chi Mei N173HCE-G33, IPS, 17.3", 1920x1080 | MSI GS75 Stealth 9SG Chi Mei N173HCE-G33 (CMN175C), IPS, 17.3", 1920x1080 | Asus Strix Hero III G731GV AU Optronics AUO B173HAN04.0, IPS, 17.3", 1920x1080 | Lenovo Legion Y740-17IRH LG Philips LP173WFG-SPD2 (LGD05E0), IPS, 17.3", 1920x1080 | Razer Blade Pro 17 RTX 2060 AU Optronics B173HAN04.0, IPS, 17.3", 1920x1080 | Aorus 17G XB AU Optronics B173HAN05.0 (AUO509D), IPS, 17.3", 1920x1080 | |
|---|---|---|---|---|---|---|
| Display | -5% | -7% | -2% | -8% | 5% | |
| Display P3 Coverage (%) | 65.6 | 62.6 -5% | 62.9 -4% | 64.8 -1% | 61.1 -7% | 70.6 8% |
| sRGB Coverage (%) | 98.1 | 93.5 -5% | 87.2 -11% | 96 -2% | 89.4 -9% | 97.2 -1% |
| AdobeRGB 1998 Coverage (%) | 67.8 | 64.7 -5% | 63.8 -6% | 65.8 -3% | 62.5 -8% | 72.8 7% |
| Response Times | -10% | -18% | -73% | 0% | -86% | |
| Response Time Grey 50% / Grey 80% * (ms) | 6.8 ? | 7.2 ? -6% | 6.8 ? -0% | 14.8 ? -118% | 6.8 ? -0% | 16 ? -135% |
| Response Time Black / White * (ms) | 8.8 ? | 10 ? -14% | 12 ? -36% | 11.2 ? -27% | 8.8 ? -0% | 12 ? -36% |
| PWM Frequency (Hz) | 25000 ? | 25510 ? | ||||
| Screen | 11% | -52% | -24% | -30% | 11% | |
| Brightness middle (cd/m²) | 337.9 | 366 8% | 312.3 -8% | 282 -17% | 300.4 -11% | 293 -13% |
| Brightness (cd/m²) | 305 | 343 12% | 297 -3% | 261 -14% | 289 -5% | 285 -7% |
| Brightness Distribution (%) | 81 | 91 12% | 91 12% | 87 7% | 93 15% | 95 17% |
| Black Level * (cd/m²) | 0.29 | 0.29 -0% | 0.21 28% | 0.27 7% | 0.32 -10% | 0.24 17% |
| Contrast (:1) | 1165 | 1262 8% | 1487 28% | 1044 -10% | 939 -19% | 1221 5% |
| Colorchecker dE 2000 * | 2.18 | 1.51 31% | 3.6 -65% | 3.18 -46% | 2.32 -6% | 1.27 42% |
| Colorchecker dE 2000 max. * | 3.9 | 3.22 17% | 6.74 -73% | 8.39 -115% | 3.81 2% | 2.24 43% |
| Colorchecker dE 2000 calibrated * | 0.69 | 0.71 -3% | 3.95 -472% | 0.95 -38% | 2.95 -328% | 1.06 -54% |
| Greyscale dE 2000 * | 3.1 | 1.93 38% | 3.1 -0% | 4.1 -32% | 1.5 52% | 1.34 57% |
| Gamma | 2.07 106% | 2.38 92% | 2.26 97% | 2.55 86% | 2.3 96% | 2.38 92% |
| CCT | 6882 94% | 6881 94% | 7002 93% | 7260 90% | 6764 96% | 6542 99% |
| Color Space (Percent of AdobeRGB 1998) (%) | 62 | 60 -3% | 56.6 -9% | 61 -2% | 57.4 -7% | 73 18% |
| Color Space (Percent of sRGB) (%) | 98.2 | 94 -4% | 86.6 -12% | 96 -2% | 89 -9% | 94 -4% |
| Total Average (Program / Settings) | -1% /
5% | -26% /
-39% | -33% /
-26% | -13% /
-22% | -23% /
-2% |
* ... smaller is better
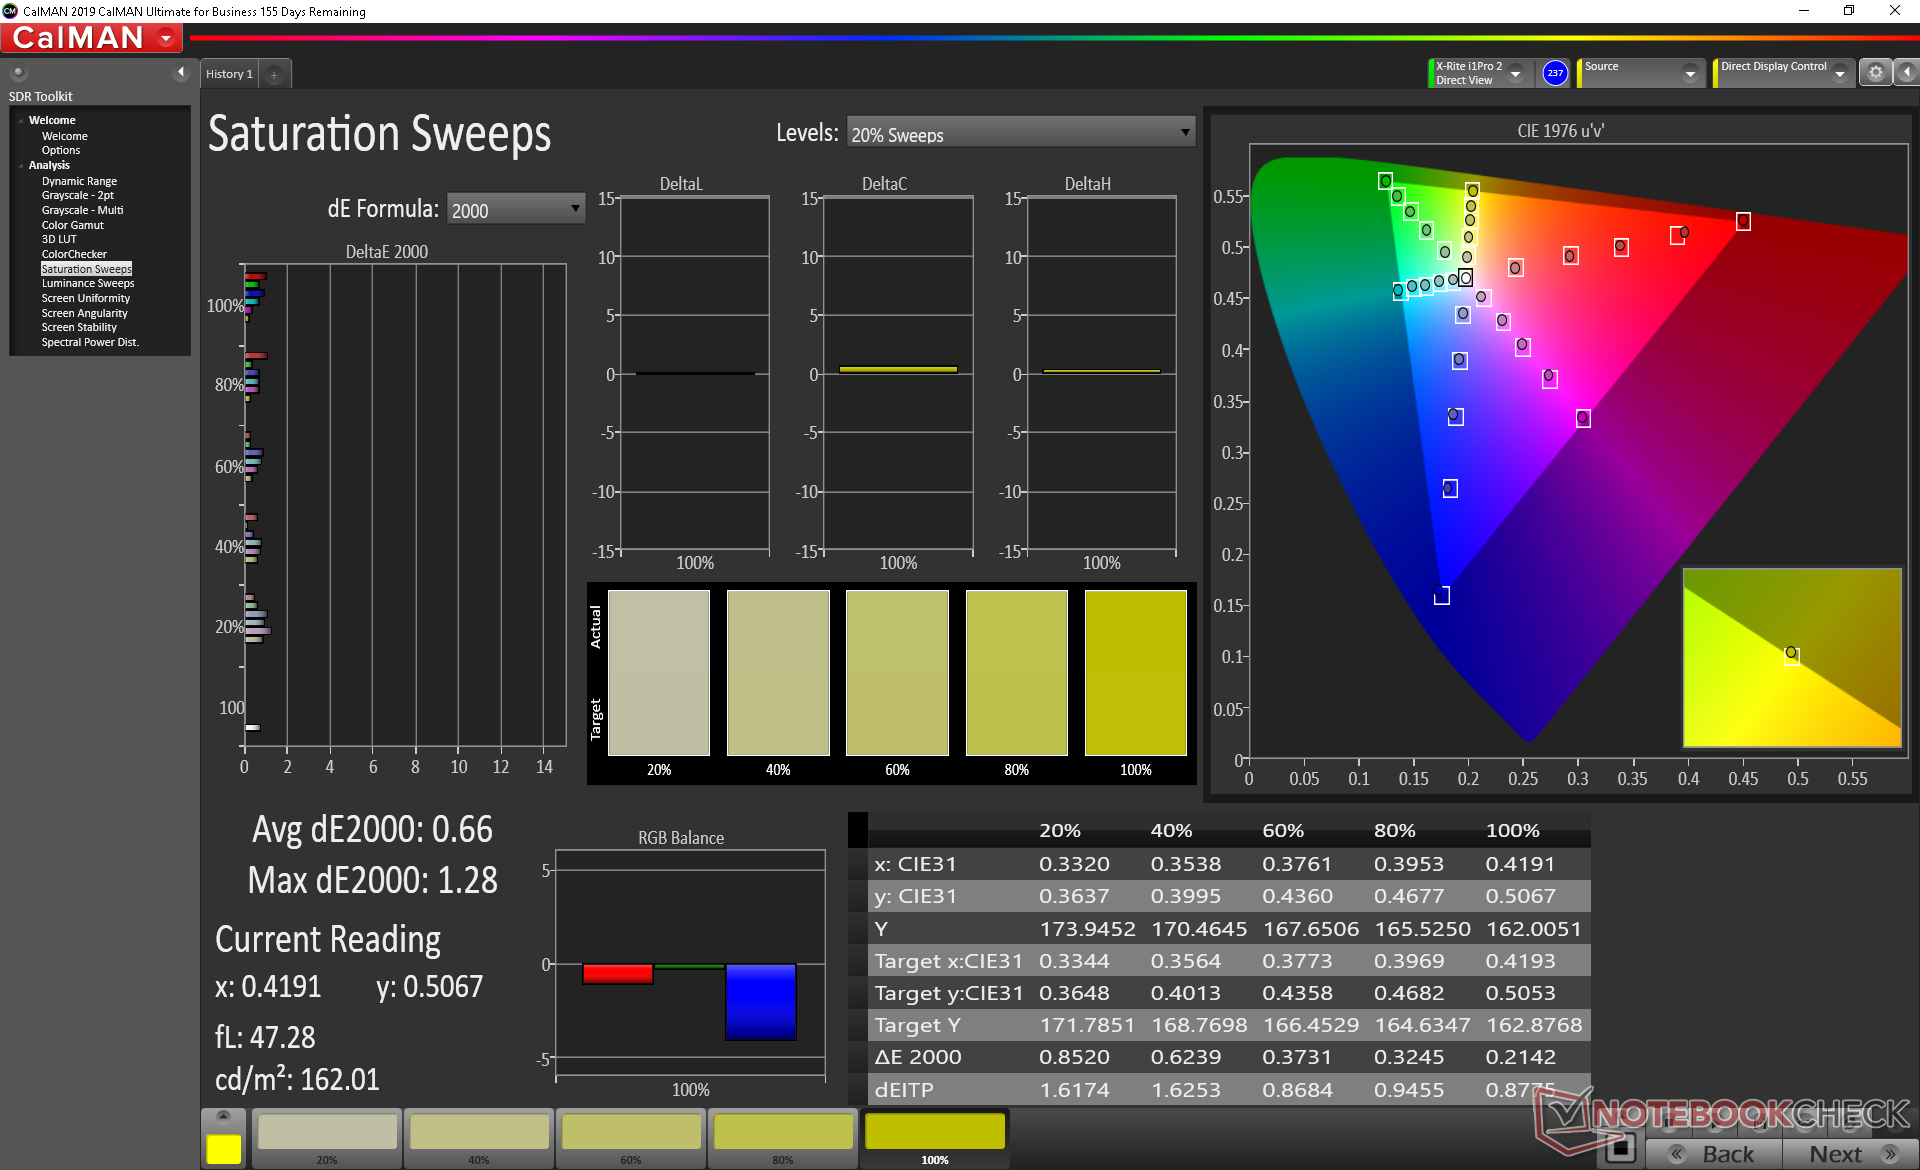
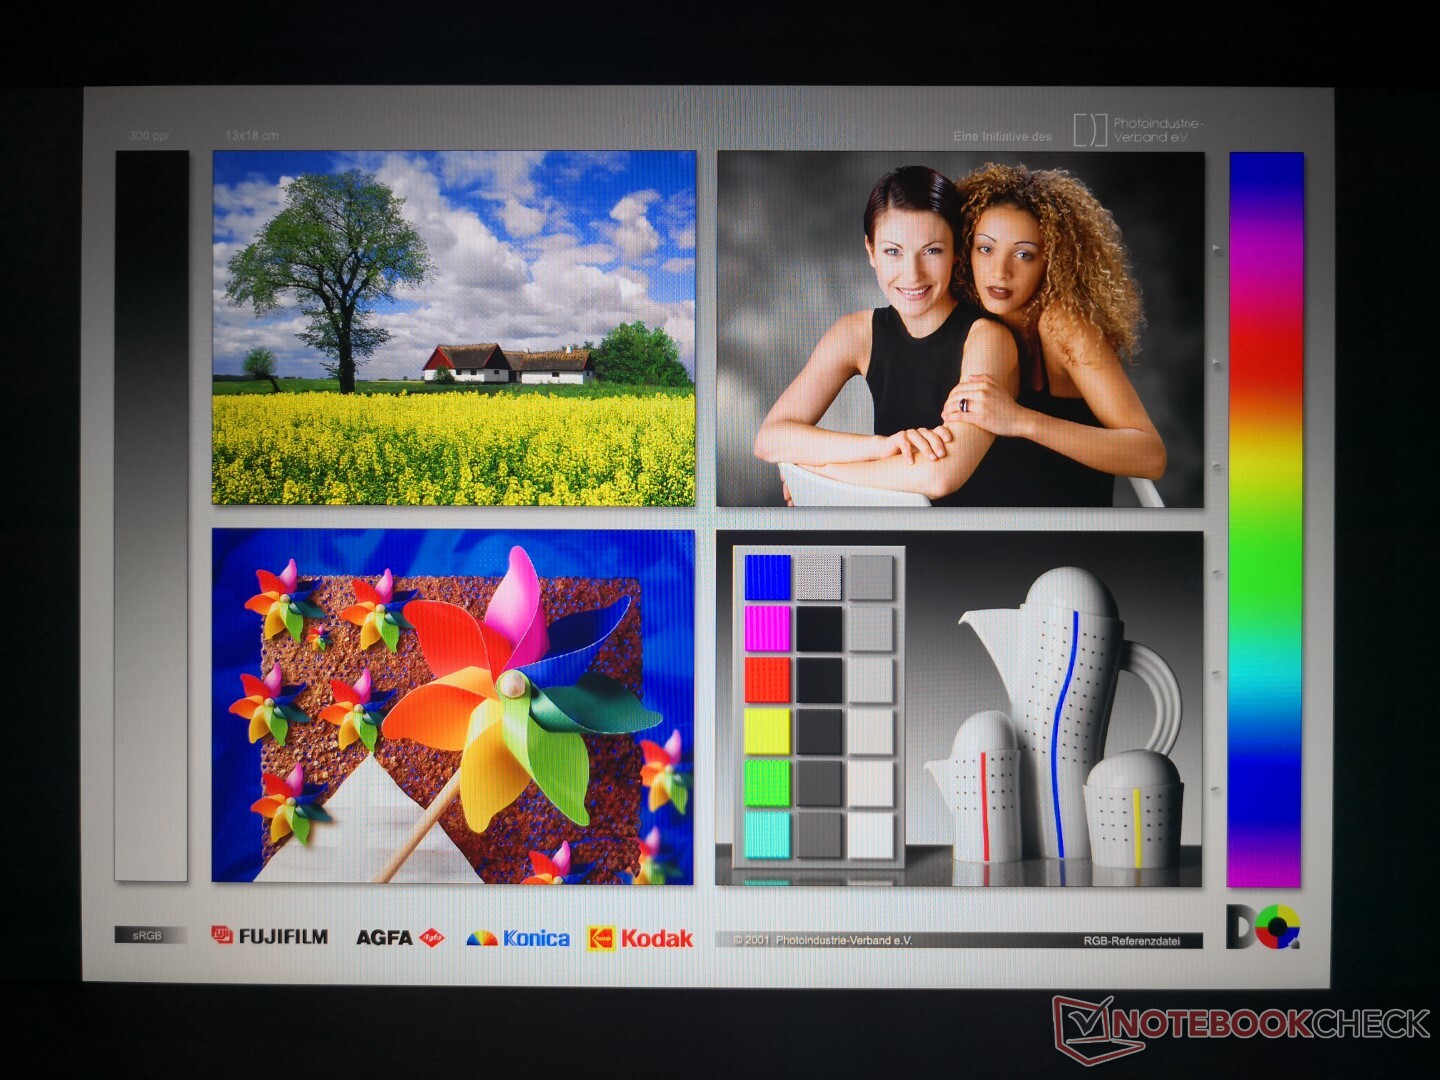
Color space covers all of sRGB which is typical of most high-end gaming laptops these days. Other models like the Gigabyte Aorus 17G XB may offer deeper color options, but they usually come with slower response times.
Measurements with a colorimeter show a well-calibrated display out of the box. Calibrating the panel ourselves would improve grayscale and colors even further with final average DeltaE values of just 0.7 and 0.69, respectively, against the sRGB spectrum.
Display Response Times
| ↔ Response Time Black to White | ||
|---|---|---|
| 8.8 ms ... rise ↗ and fall ↘ combined | ↗ 4.4 ms rise | 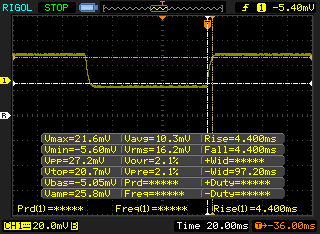 |
| ↘ 4.4 ms fall | ||
| The screen shows fast response rates in our tests and should be suited for gaming. In comparison, all tested devices range from 0.1 (minimum) to 240 (maximum) ms. » 24 % of all devices are better. This means that the measured response time is better than the average of all tested devices (19.9 ms). | ||
| ↔ Response Time 50% Grey to 80% Grey | ||
| 6.8 ms ... rise ↗ and fall ↘ combined | ↗ 3.4 ms rise | 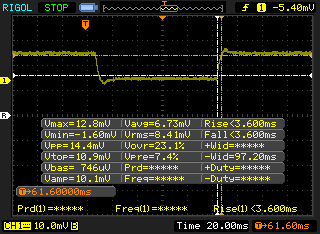 |
| ↘ 3.4 ms fall | ||
| The screen shows very fast response rates in our tests and should be very well suited for fast-paced gaming. In comparison, all tested devices range from 0.165 (minimum) to 636 (maximum) ms. » 19 % of all devices are better. This means that the measured response time is better than the average of all tested devices (31.1 ms). | ||
Screen Flickering / PWM (Pulse-Width Modulation)
| Screen flickering / PWM detected | 25000 Hz | ≤ 18 % brightness setting | 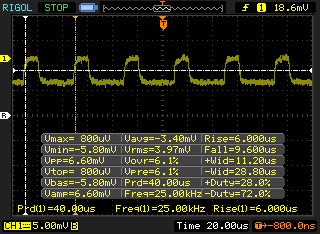 |
The display backlight flickers at 25000 Hz (worst case, e.g., utilizing PWM) Flickering detected at a brightness setting of 18 % and below. There should be no flickering or PWM above this brightness setting. The frequency of 25000 Hz is quite high, so most users sensitive to PWM should not notice any flickering. In comparison: 52 % of all tested devices do not use PWM to dim the display. If PWM was detected, an average of 7791 (minimum: 5 - maximum: 343500) Hz was measured. | |||
Performance
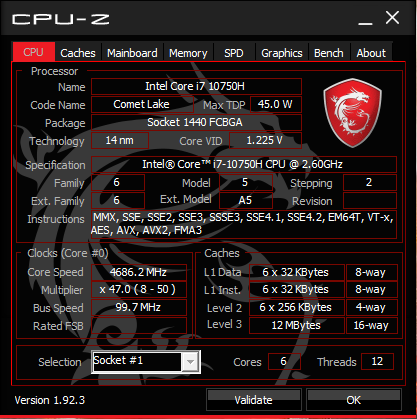
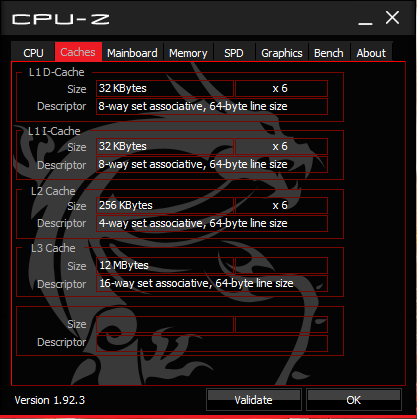
Processor
CPU performance is where we expect it to be relative to other Core i7-10750H laptops, if not slightly faster. Users will see 15 percent or 45 percent faster multi-thread performance if upgrading from the Core i7-9750H or Core i7-8750H, respectively. Raw performance is roughly on par with the less expensive AMD Ryzen 5 4600H. MSI offers Core i7-10875H and Core i9-10980HK options as well for approximately 10 percent and 25 percent faster multi-thread performance, respectively.
See our dedicated page on the Core i7-10750H for more technical information and benchmark comparisons.
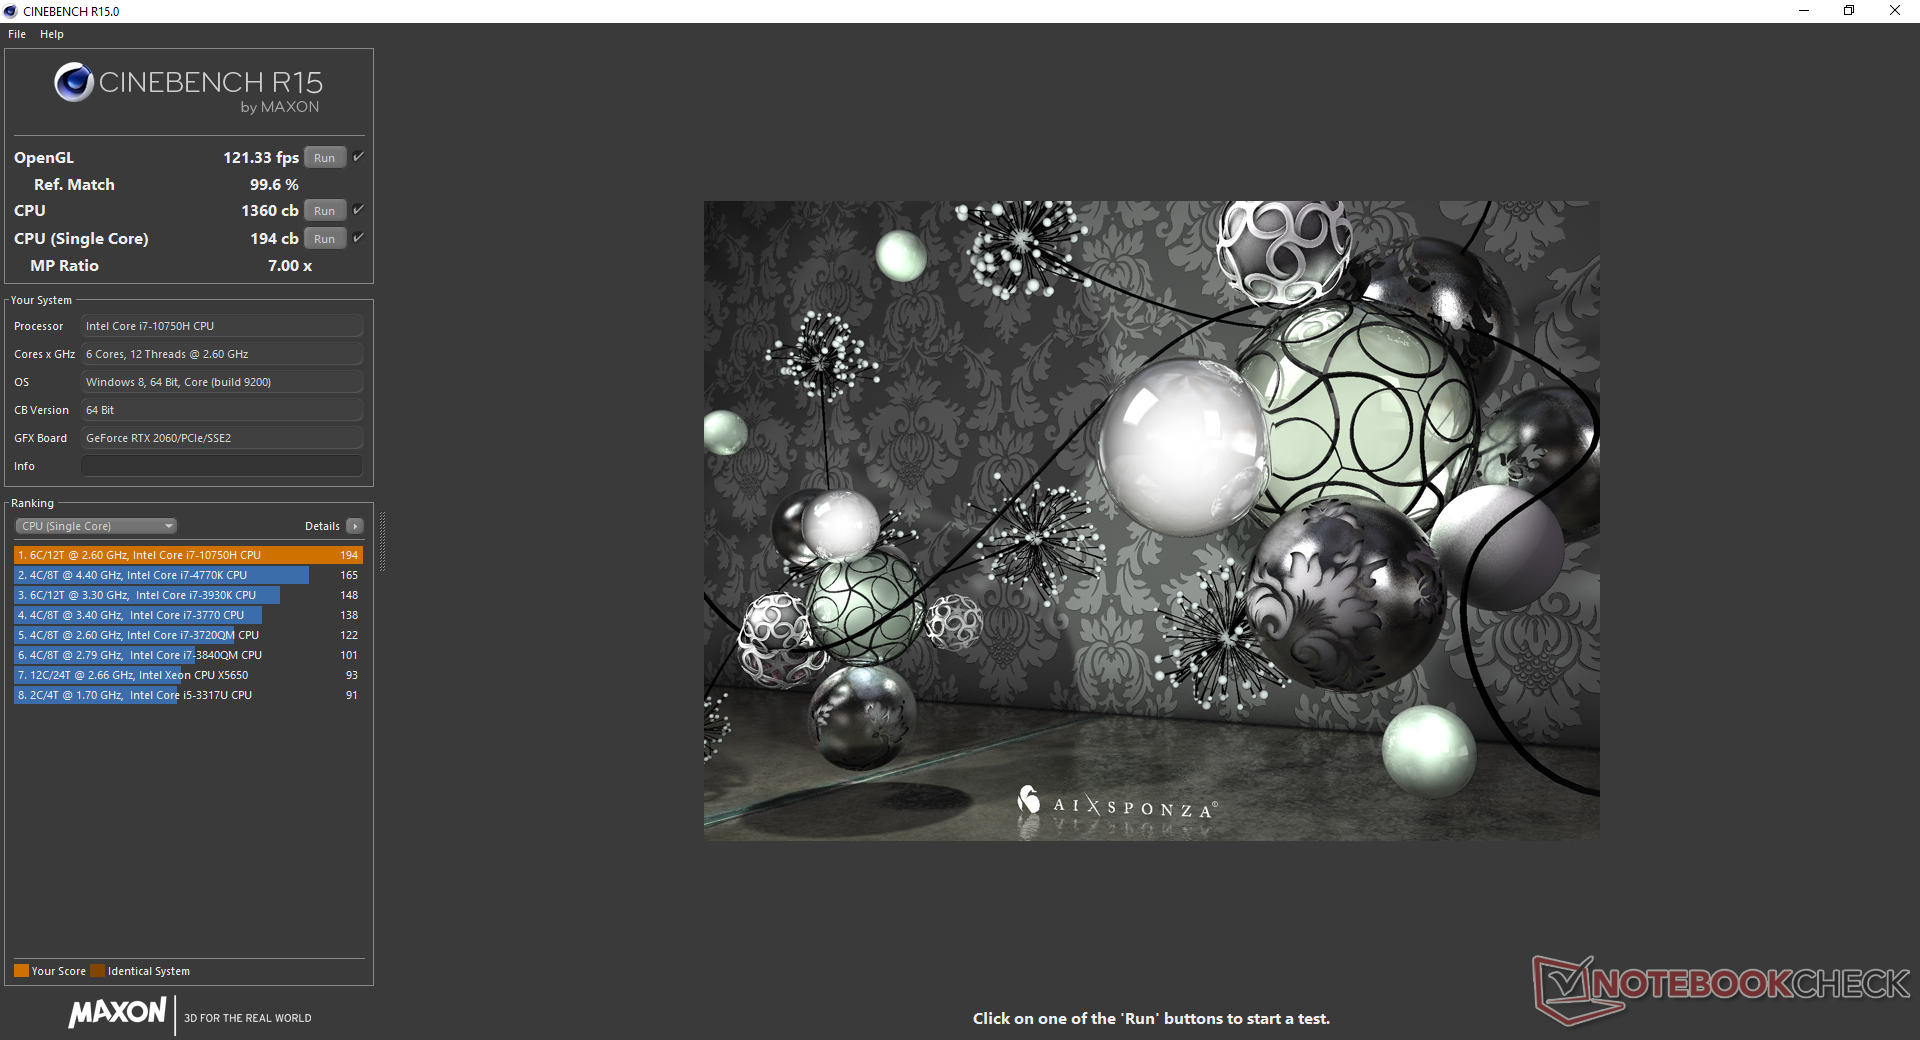
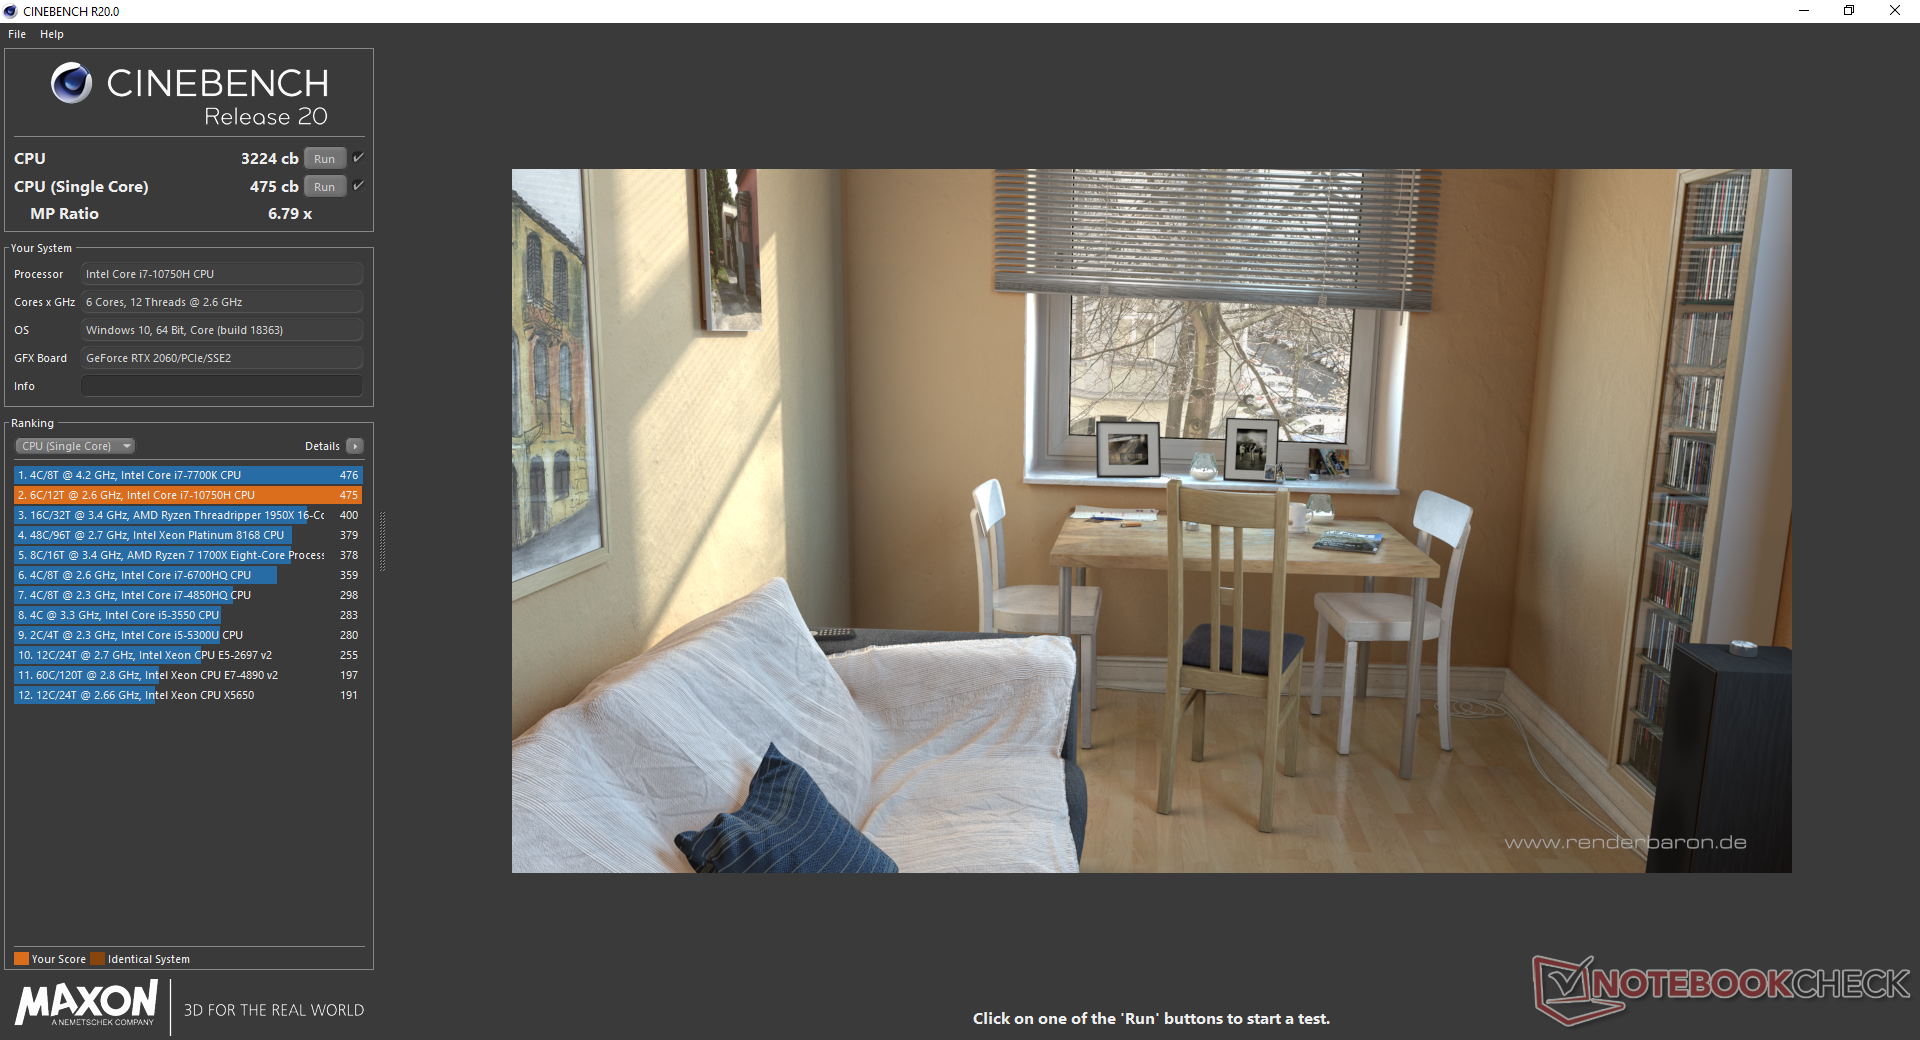
Cinebench R15: CPU Multi 64Bit | CPU Single 64Bit
Blender: v2.79 BMW27 CPU
7-Zip 18.03: 7z b 4 -mmt1 | 7z b 4
Geekbench 5.5: Single-Core | Multi-Core
HWBOT x265 Benchmark v2.2: 4k Preset
LibreOffice : 20 Documents To PDF
R Benchmark 2.5: Overall mean
| Geekbench 5.5 / Single-Core | |
| MSI GE66 Raider 10SFS | |
| Razer Blade Pro 17 RTX 2070 Max-Q 300 Hz | |
| Average Intel Core i7-10750H (1114 - 1333, n=43) | |
| MSI GE75 Raider 10SE-008US | |
| MSI Bravo 17 A4DDR | |
| MSI GF75 Thin 10SCXR | |
| Lenovo Legion Y740-17IRHg-81UJ001VGE | |
| Acer Nitro 5 AN515-44-R5FT | |
| Geekbench 5.5 / Multi-Core | |
| MSI GE66 Raider 10SFS | |
| MSI Bravo 17 A4DDR | |
| Razer Blade Pro 17 RTX 2070 Max-Q 300 Hz | |
| MSI GE75 Raider 10SE-008US | |
| Average Intel Core i7-10750H (4443 - 6674, n=43) | |
| Lenovo Legion Y740-17IRHg-81UJ001VGE | |
| Acer Nitro 5 AN515-44-R5FT | |
| MSI GF75 Thin 10SCXR | |
| HWBOT x265 Benchmark v2.2 / 4k Preset | |
| MSI Bravo 17 A4DDR | |
| MSI GE66 Raider 10SFS | |
| MSI GE75 9SG | |
| MSI GE75 Raider 10SE-008US | |
| Average Intel Core i7-10750H (5.54 - 11.6, n=43) | |
| Lenovo Legion Y740-17IRHg-81UJ001VGE | |
| Acer Nitro 5 AN515-44-R5FT | |
| MSI GF75 Thin 10SCXR | |
| Asus ROG Zephyrus G15 GA502DU | |
| LibreOffice / 20 Documents To PDF | |
| MSI Bravo 17 A4DDR | |
| Acer Nitro 5 AN515-44-R5FT | |
| MSI GF75 Thin 10SCXR | |
| Razer Blade Pro 17 RTX 2070 Max-Q 300 Hz | |
| MSI GE75 Raider 10SE-008US | |
| MSI GE66 Raider 10SFS | |
| Average Intel Core i7-10750H (43.1 - 99.2, n=43) | |
| R Benchmark 2.5 / Overall mean | |
| Lenovo Legion Y740-17IRHg-81UJ001VGE | |
| MSI GF75 Thin 10SCXR | |
| Acer Nitro 5 AN515-44-R5FT | |
| MSI GE75 Raider 10SE-008US | |
| Average Intel Core i7-10750H (0.578 - 0.708, n=42) | |
| MSI Bravo 17 A4DDR | |
| MSI GE66 Raider 10SFS | |
* ... smaller is better
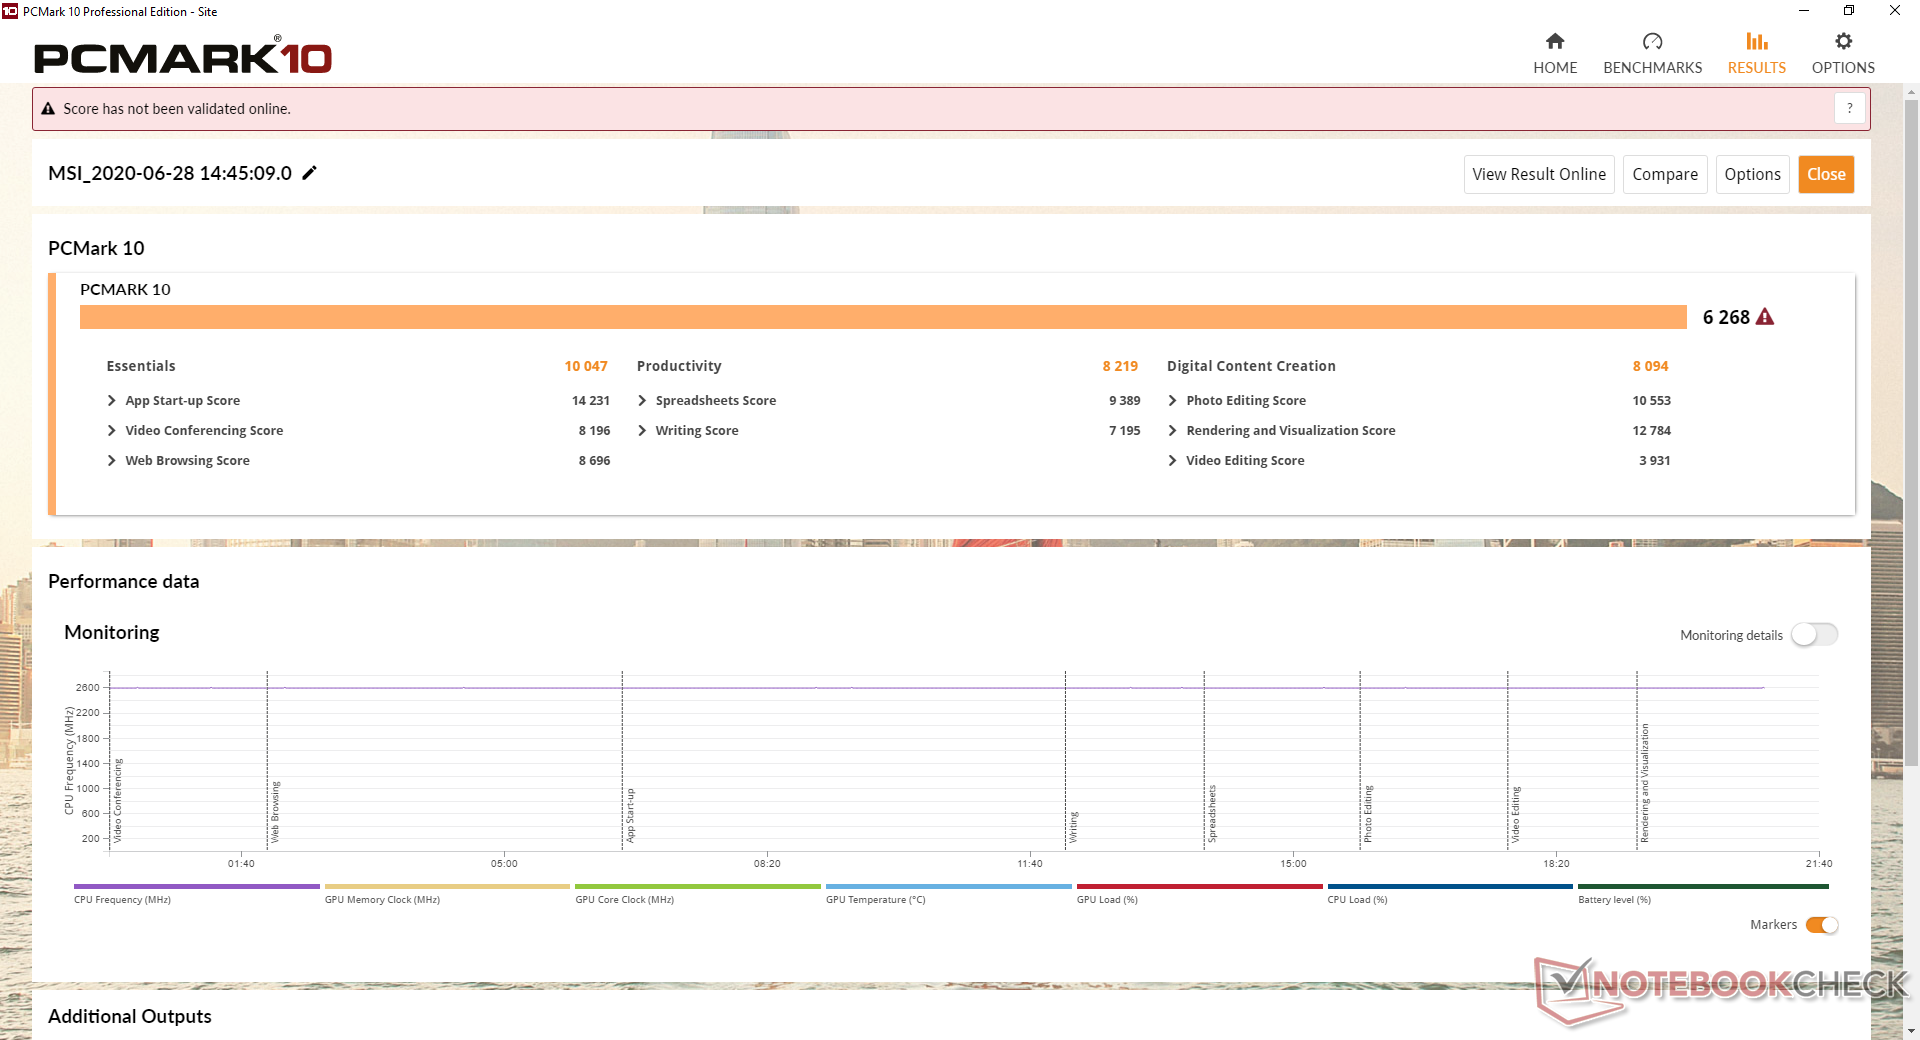
System Performance
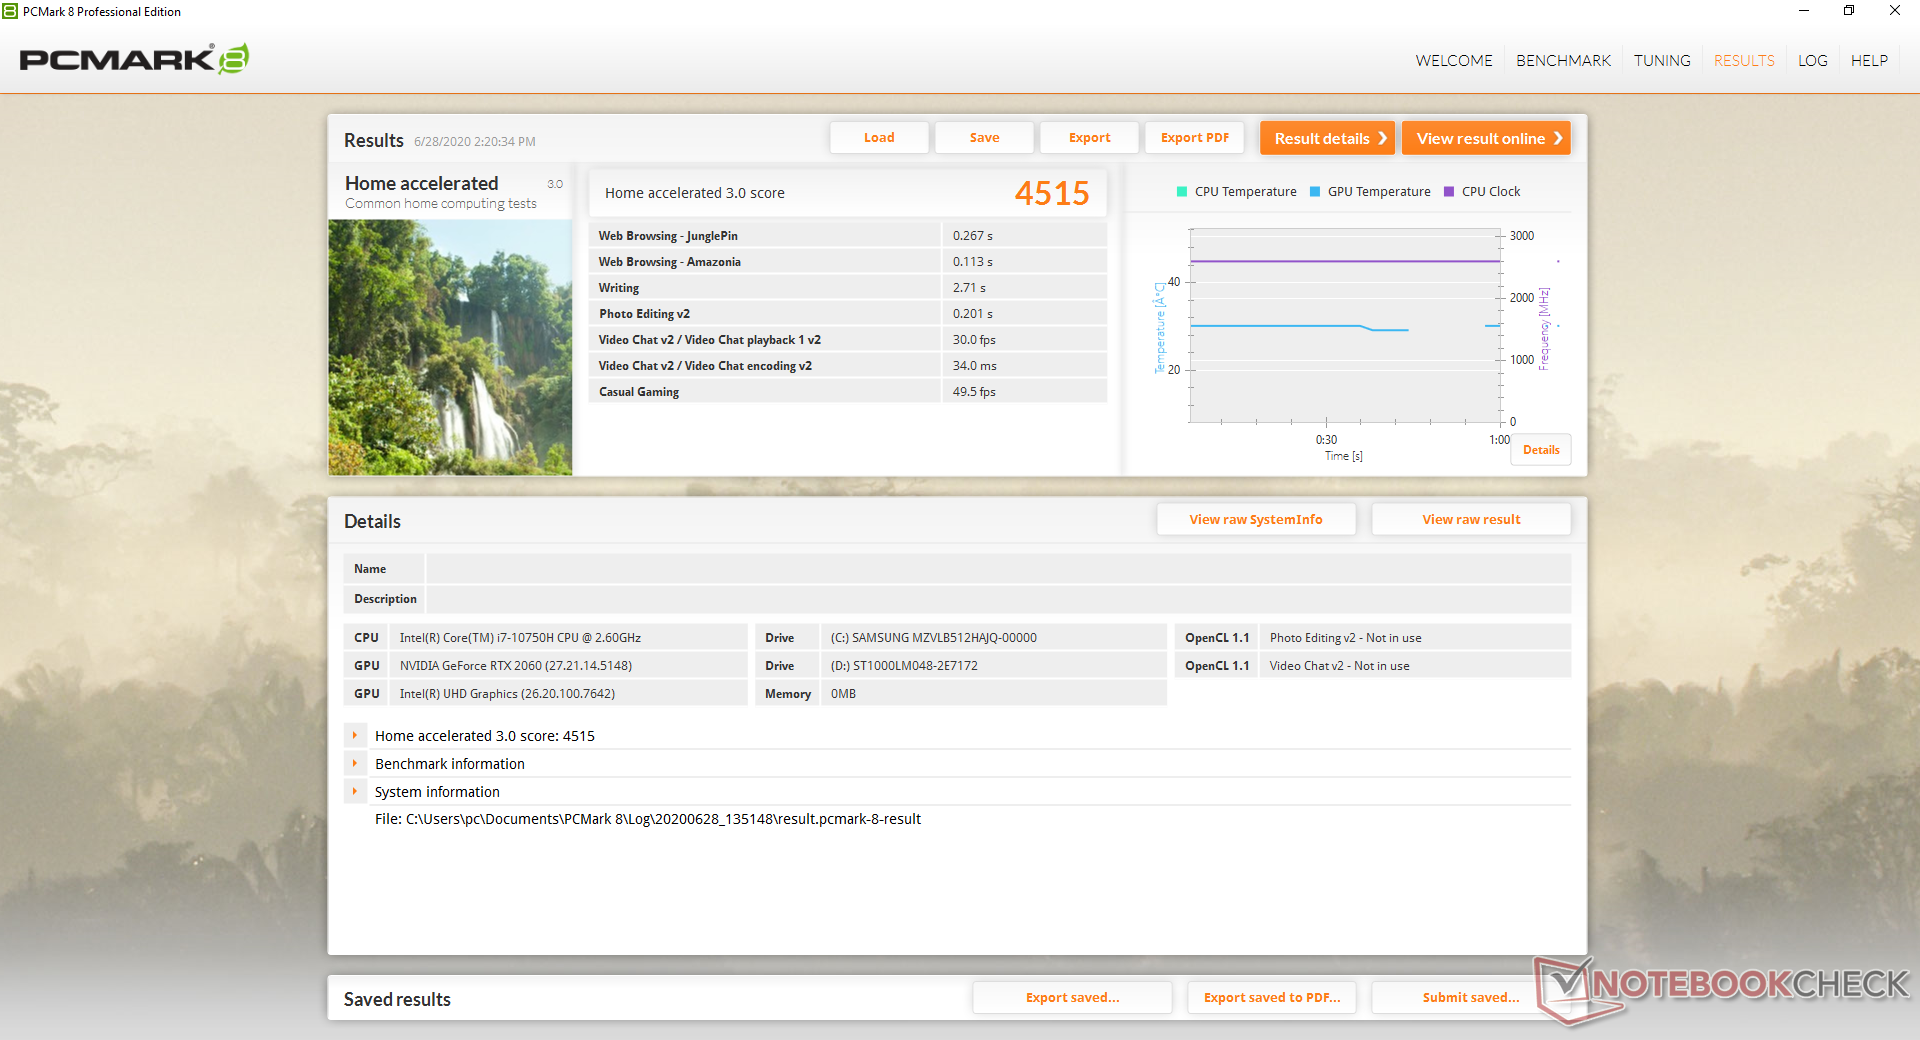
| PCMark 8 Home Score Accelerated v2 | 4515 points | |
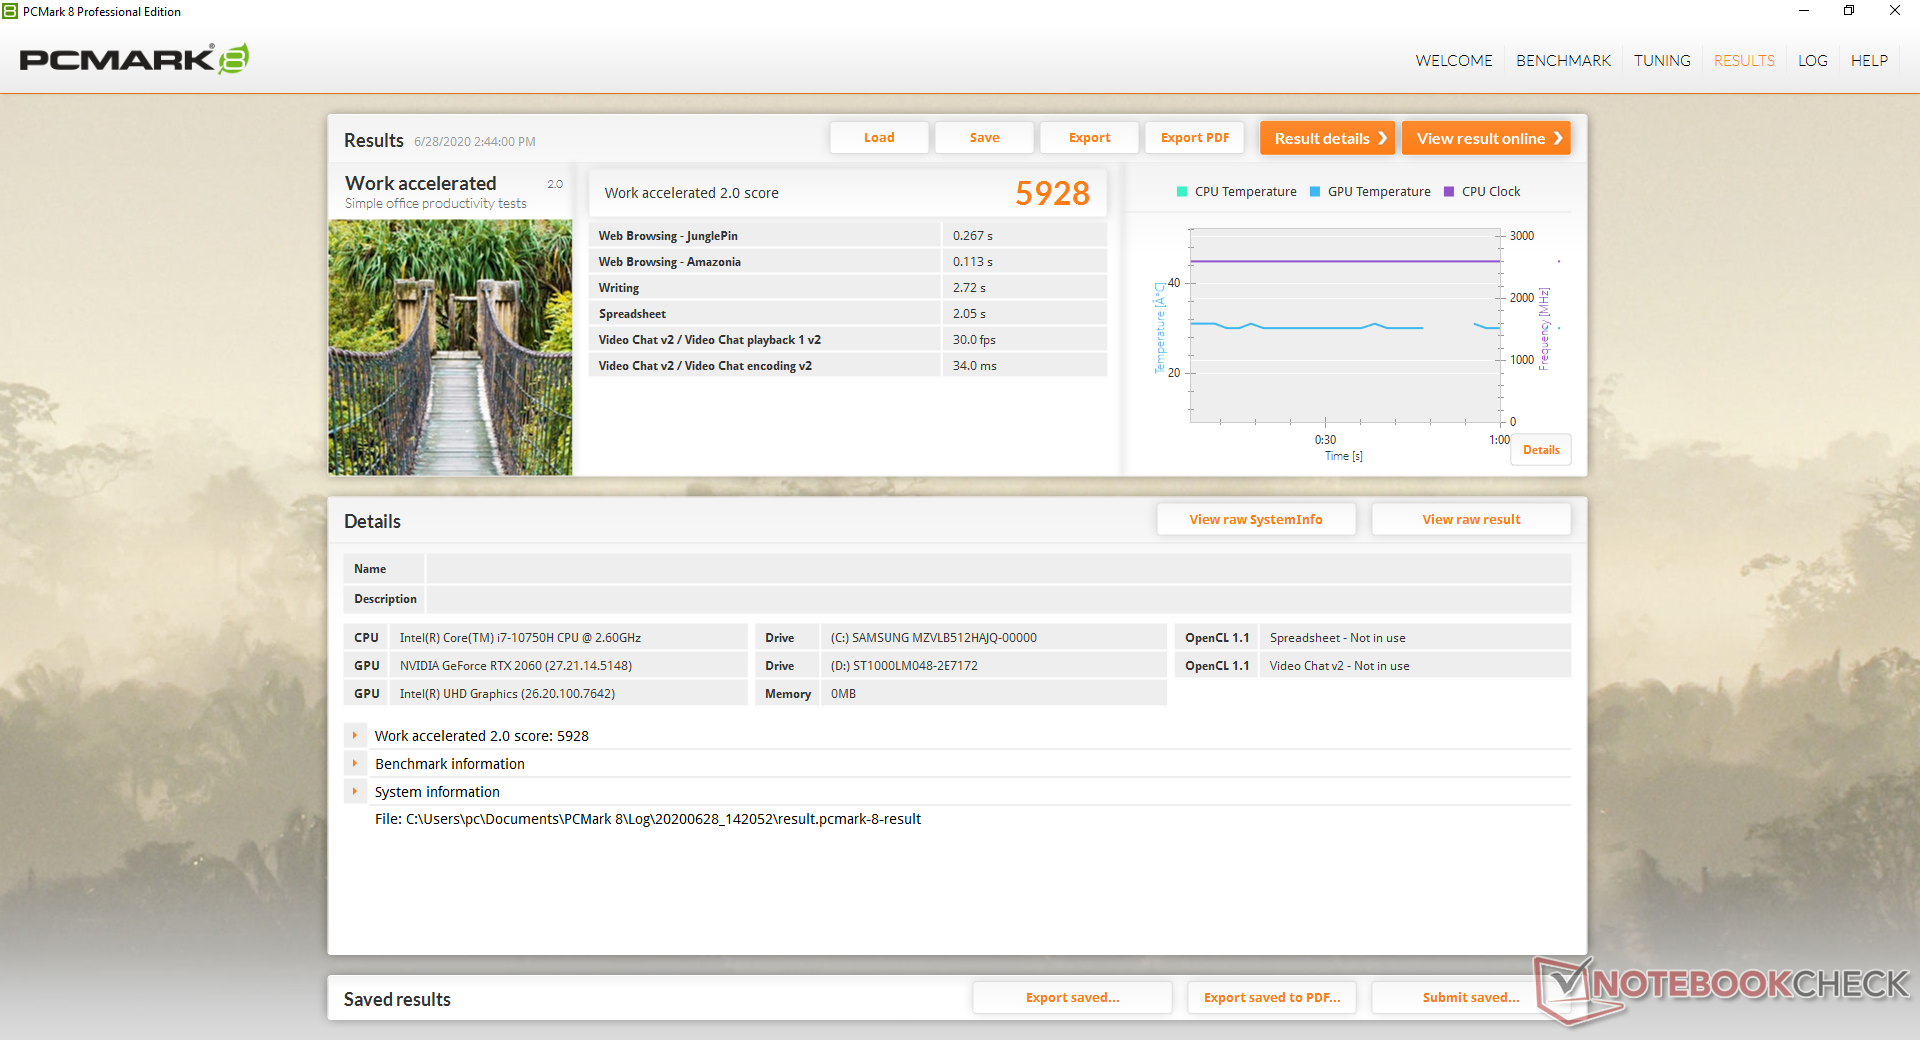
| PCMark 8 Work Score Accelerated v2 | 5928 points | |
| PCMark 10 Score | 6268 points | |
Help | ||
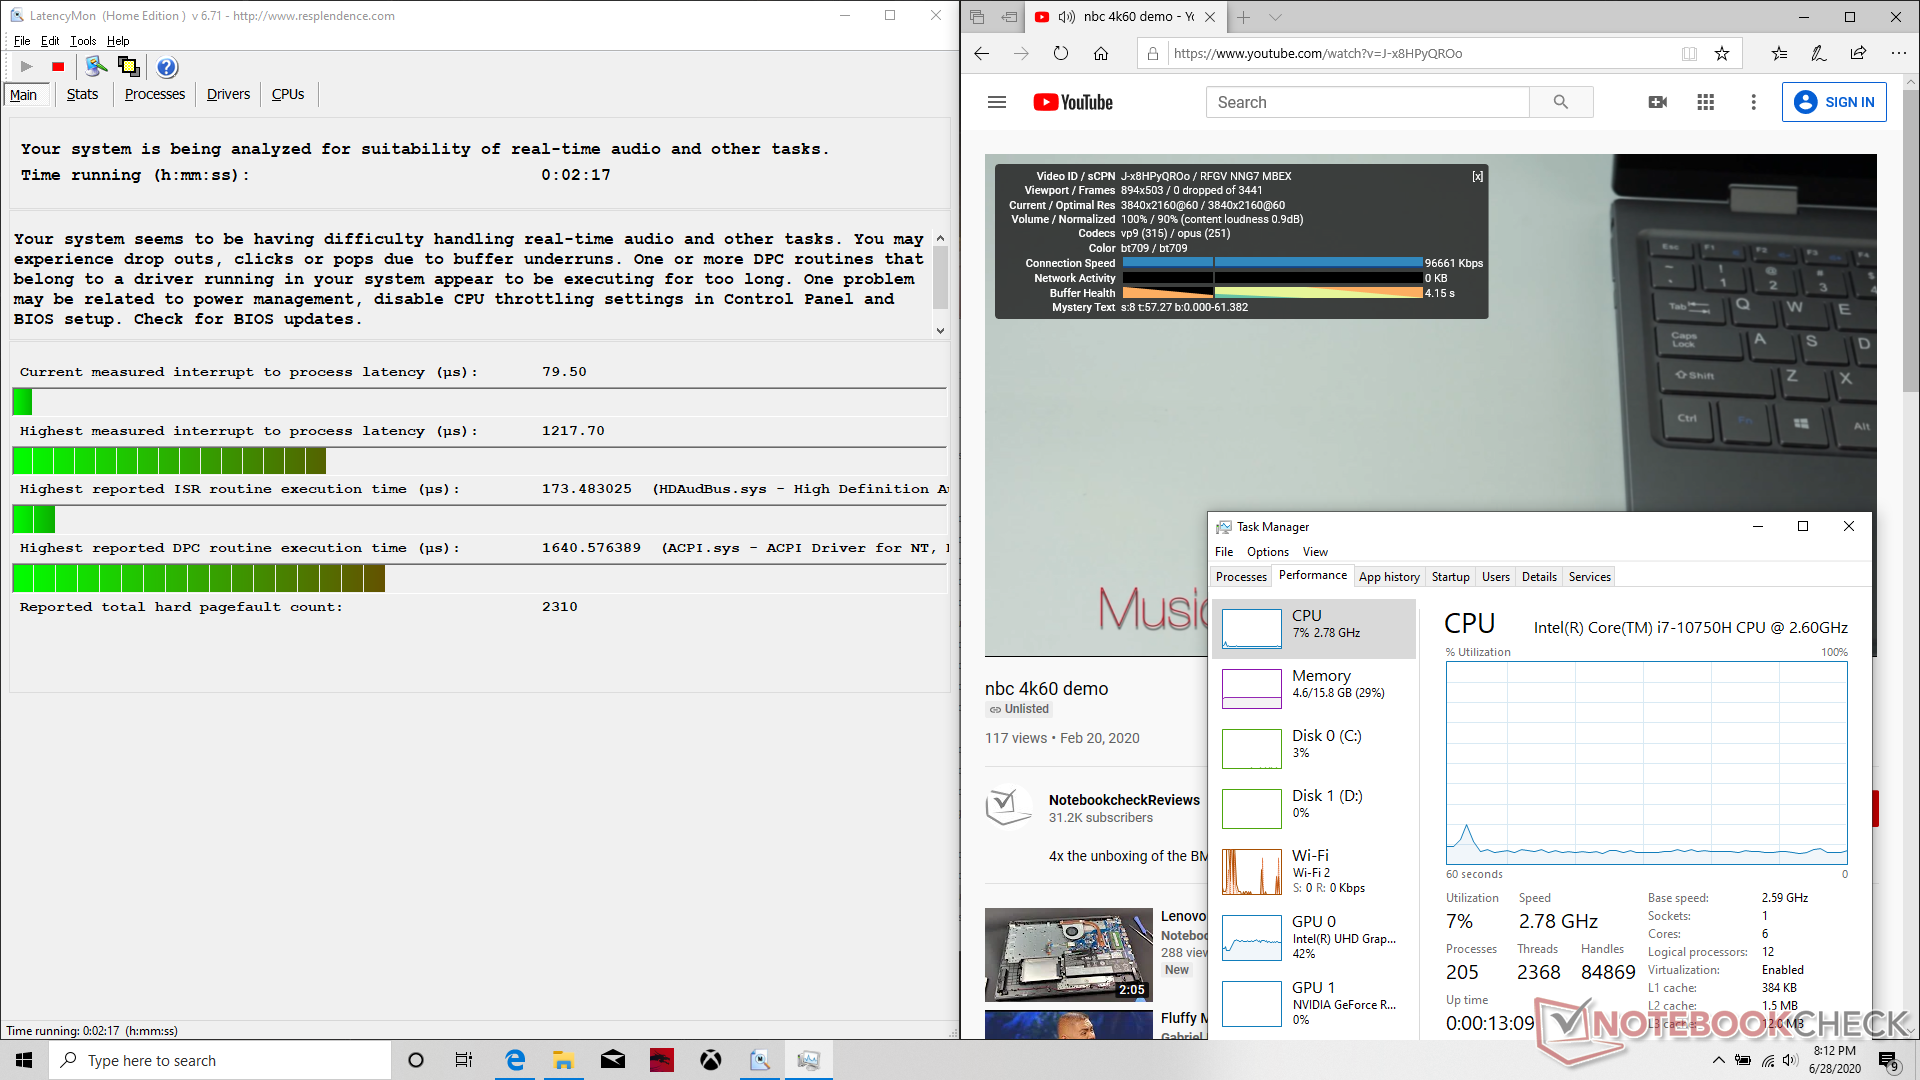
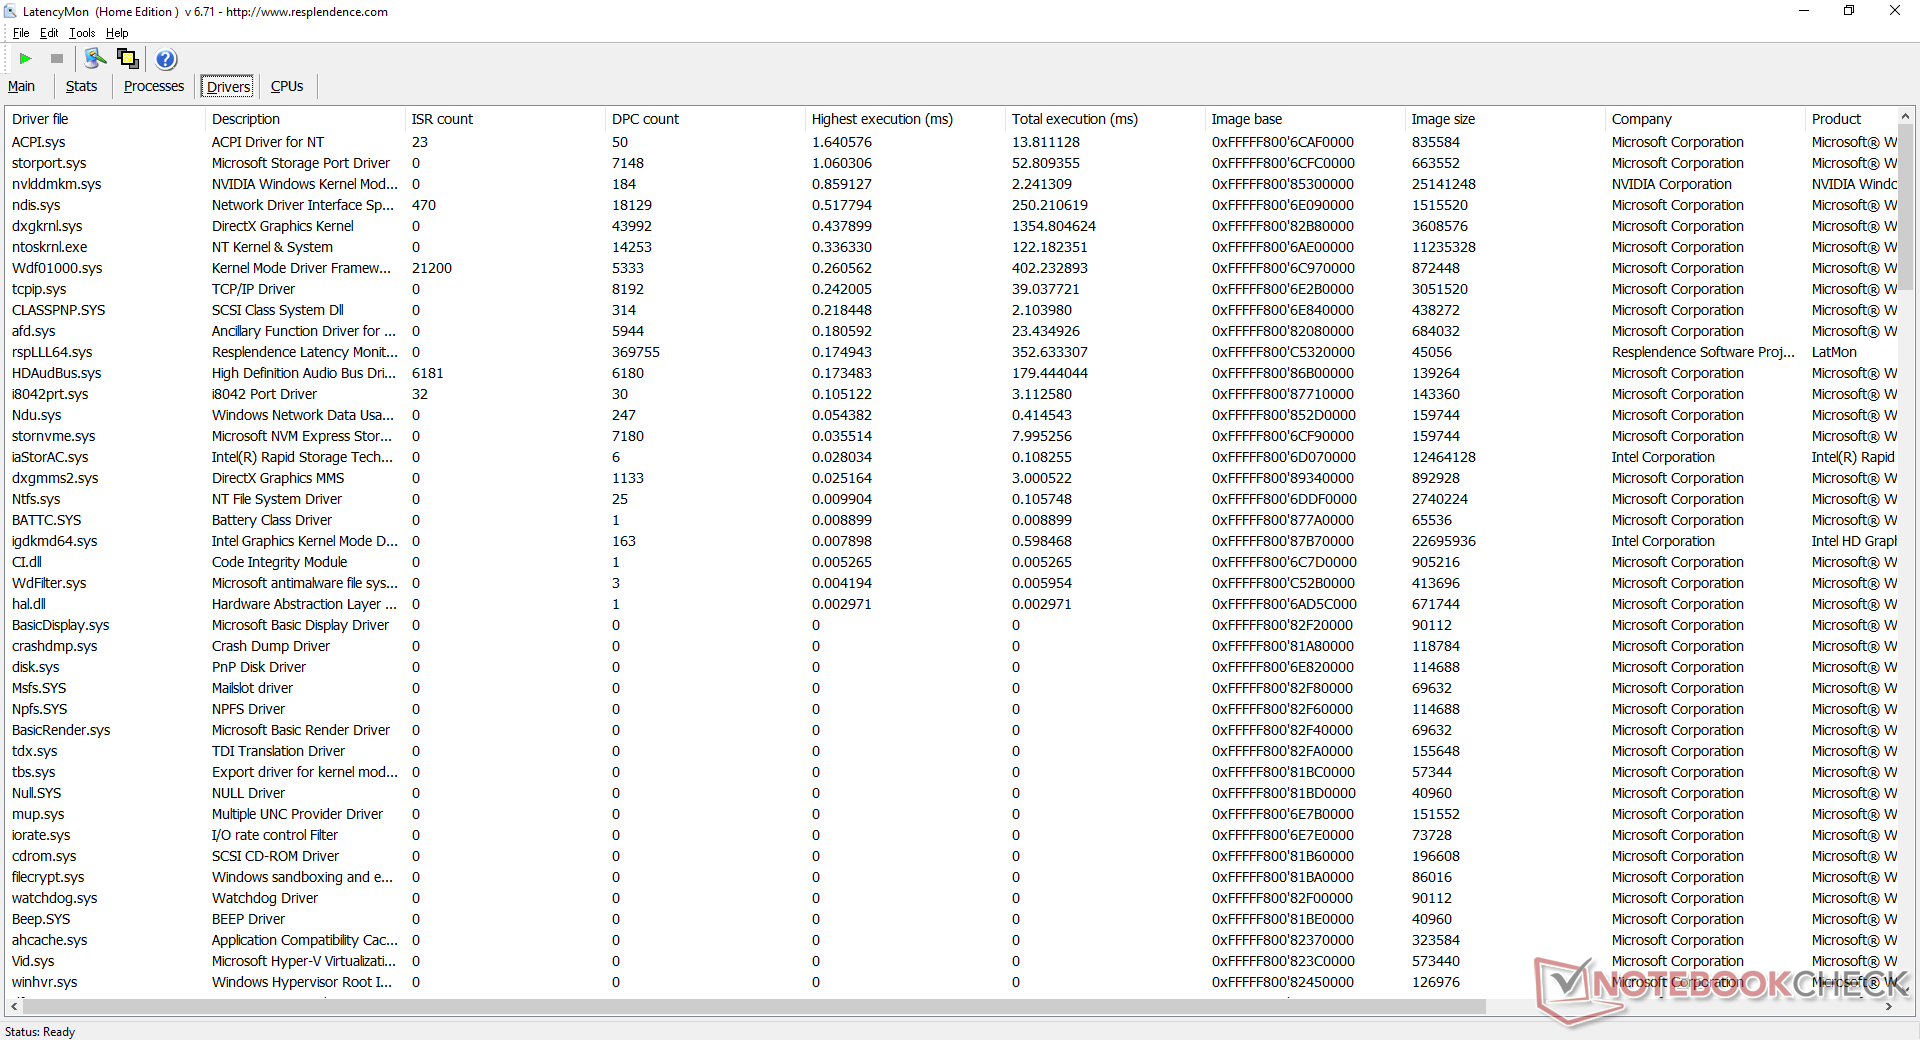
DPC Latency
LatencyMon shows minor DPC latency issues when opening multiple tabs on our homepage. 4K video playback on YouTube is otherwise smooth with no dropped frames.
| DPC Latencies / LatencyMon - interrupt to process latency (max), Web, Youtube, Prime95 | |
| Dell XPS 15 9500 Core i7 4K UHD | |
| Asus Zephyrus G14 GA401IV | |
| MSI GE75 Raider 10SE-008US | |
| Razer Blade Pro 17 RTX 2070 Max-Q 300 Hz | |
* ... smaller is better
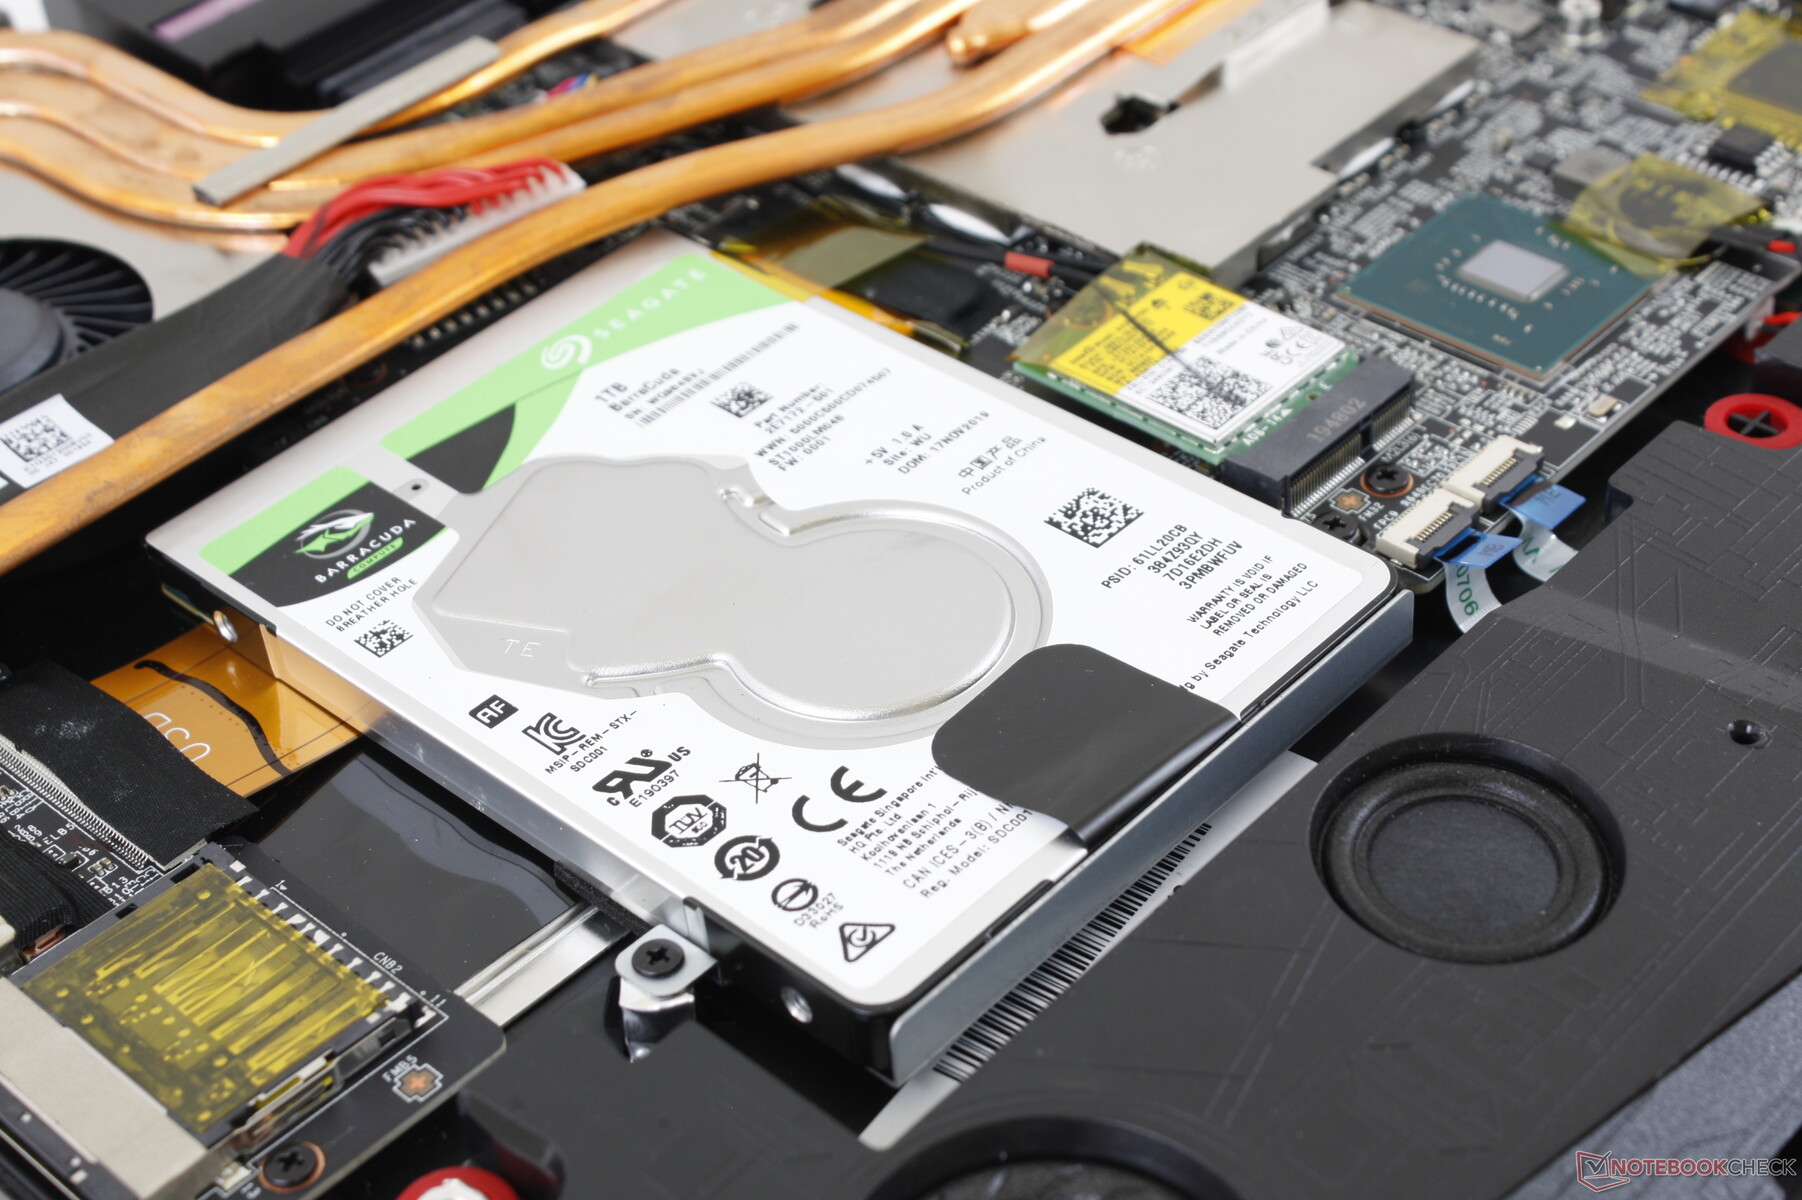
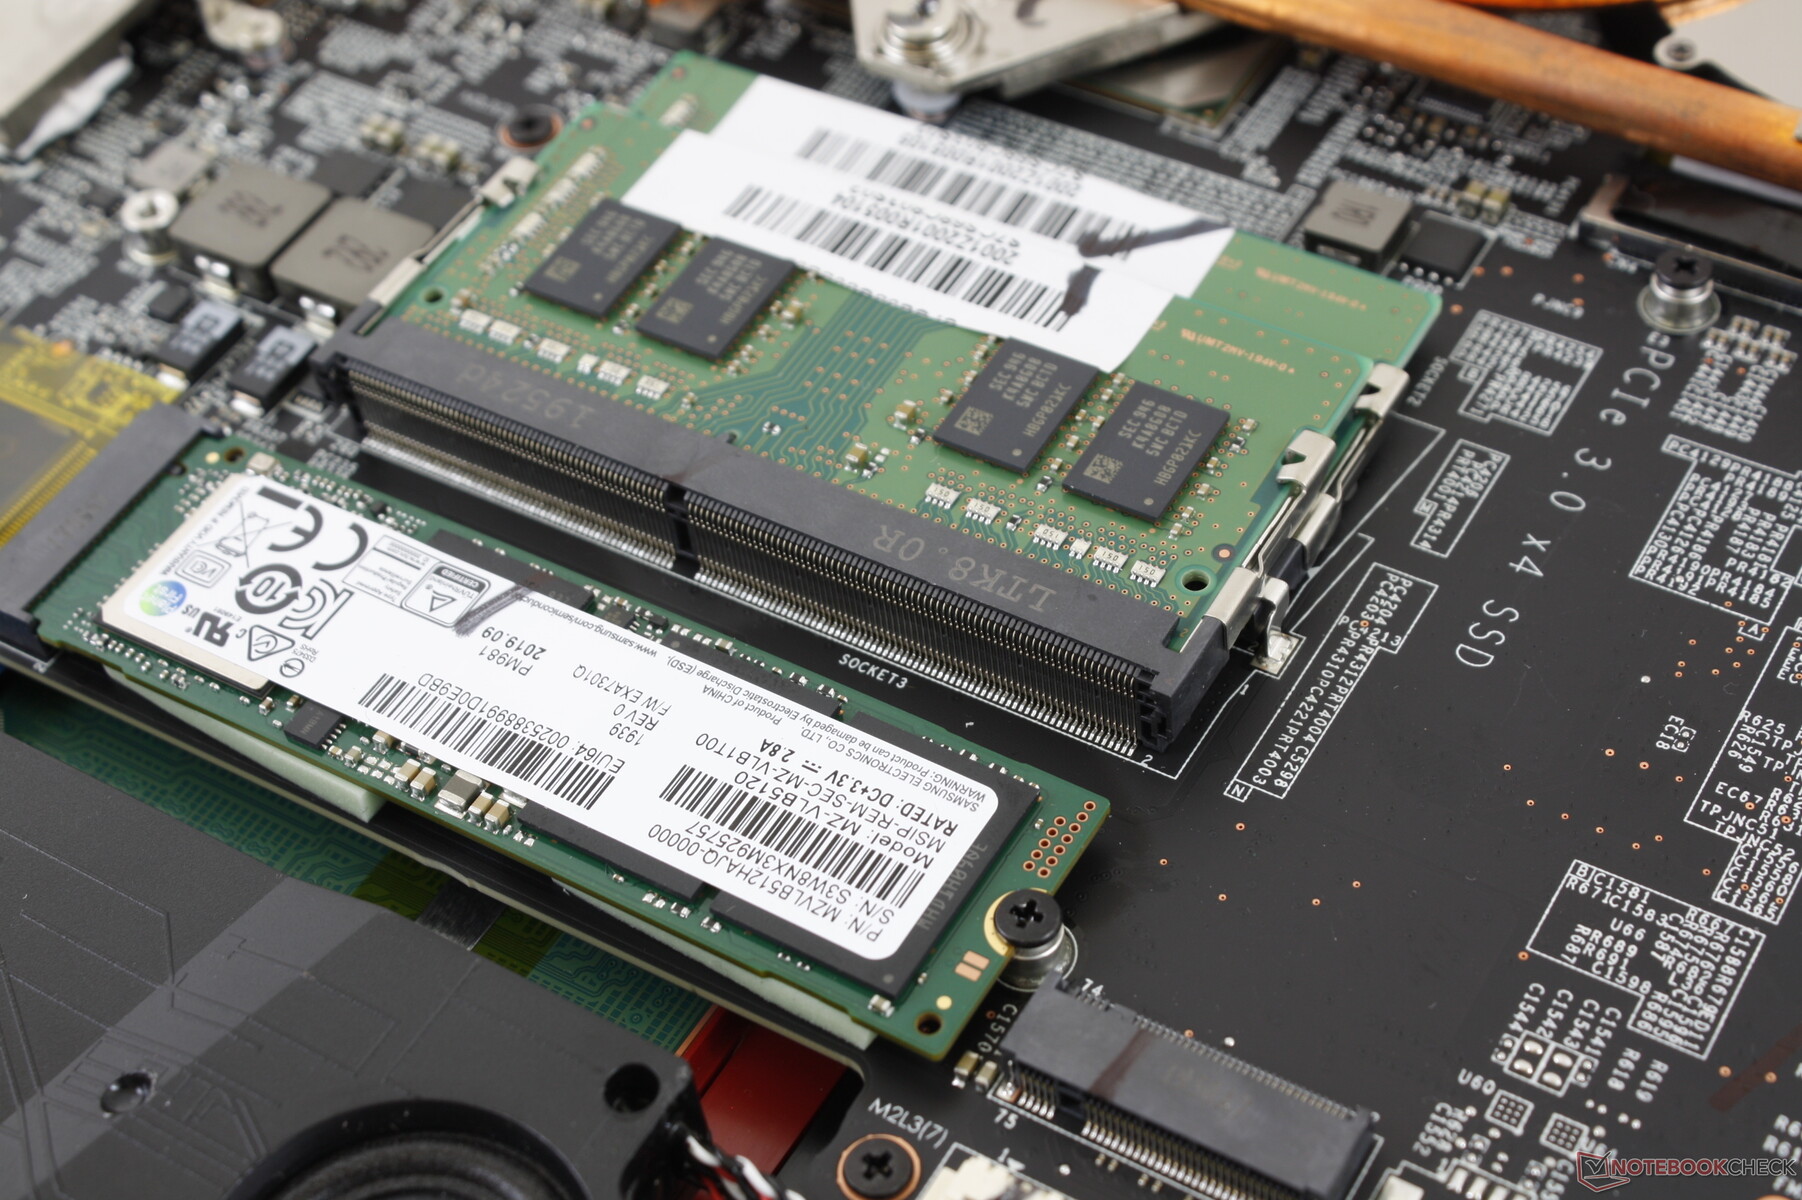
Storage Devices
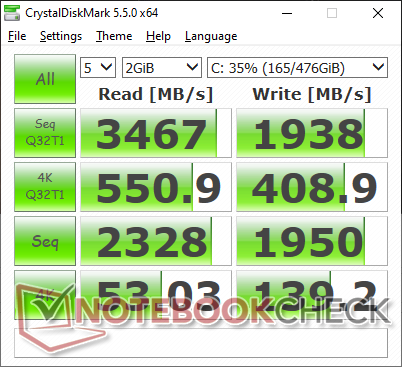
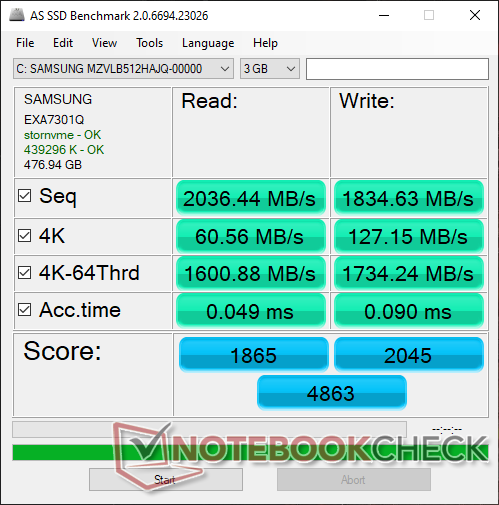
Owners have access to two M.2 2280 slots with RAID compatibility and a single 2.5-inch SATA III bay. Our specific unit comes with the high-end Samsung SSD PM981 MZVLB512HAJQ, but drives from other manufacturers are possible depending on where you decide to purchase the GE75.
| MSI GE75 Raider 10SE-008US Samsung SSD PM981 MZVLB512HAJQ | MSI GS75 Stealth 9SG 2x Samsung SSD PM981 MZVLB1T0HALR (RAID 0) | Asus Strix Hero III G731GV Intel SSD 660p SSDPEKNW512G8 | Lenovo Legion Y740-17IRH WDC PC SN520 SDAPMUW-128G | Razer Blade Pro 17 RTX 2060 Samsung SSD PM981 MZVLB512HAJQ | Aorus 17G XB Samsung SSD PM981a MZVLB512HBJQ | |
|---|---|---|---|---|---|---|
| AS SSD | 6% | -27% | -60% | 5% | 2% | |
| Seq Read (MB/s) | 2036 | 2855 40% | 940 -54% | 1339 -34% | 1810 -11% | 1791 -12% |
| Seq Write (MB/s) | 1835 | 2687 46% | 921 -50% | 688 -63% | 1797 -2% | 2193 20% |
| 4K Read (MB/s) | 60.6 | 30.31 -50% | 48.05 -21% | 23.23 -62% | 48.43 -20% | 50.7 -16% |
| 4K Write (MB/s) | 127.2 | 96.3 -24% | 104.3 -18% | 98.8 -22% | 106 -17% | 116.8 -8% |
| 4K-64 Read (MB/s) | 1601 | 1460 -9% | 320.1 -80% | 300.9 -81% | 1156 -28% | 1525 -5% |
| 4K-64 Write (MB/s) | 1734 | 1224 -29% | 703 -59% | 204.6 -88% | 1748 1% | 1958 13% |
| Access Time Read * (ms) | 0.049 | 0.054 -10% | 0.079 -61% | 0.184 -276% | 0.057 -16% | 0.07 -43% |
| Access Time Write * (ms) | 0.09 | 0.038 58% | 0.046 49% | 0.037 59% | 0.035 61% | 0.032 64% |
| Score Read (Points) | 1865 | 1776 -5% | 462 -75% | 458 -75% | 1385 -26% | 1755 -6% |
| Score Write (Points) | 2045 | 1589 -22% | 900 -56% | 372 -82% | 2033 -1% | 2294 12% |
| Score Total (Points) | 4863 | 4259 -12% | 1616 -67% | 1038 -79% | 4135 -15% | 4972 2% |
| Copy ISO MB/s (MB/s) | 1900 | 2226 17% | 1416 -25% | 988 -48% | 1984 4% | |
| Copy Program MB/s (MB/s) | 205.5 | 426.4 107% | 569 177% | 327.2 59% | 588 186% | |
| Copy Game MB/s (MB/s) | 1419 | 1152 -19% | 971 -32% | 758 -47% | 835 -41% | |
| CrystalDiskMark 5.2 / 6 | 8% | -27% | -49% | -10% | 9% | |
| Write 4K (MB/s) | 139.2 | 95.5 -31% | 129.3 -7% | 102.7 -26% | 124.1 -11% | 123.4 -11% |
| Read 4K (MB/s) | 53 | 42.59 -20% | 54.4 3% | 29.12 -45% | 44.75 -16% | 45.02 -15% |
| Write Seq (MB/s) | 1950 | 2851 46% | 978 -50% | 362.2 -81% | 1292 -34% | 2526 30% |
| Read Seq (MB/s) | 2328 | 2696 16% | 1447 -38% | 1010 -57% | 1272 -45% | 2062 -11% |
| Write 4K Q32T1 (MB/s) | 408.9 | 402.6 -2% | 476.8 17% | 298.1 -27% | 514 26% | 497.9 22% |
| Read 4K Q32T1 (MB/s) | 551 | 443.9 -19% | 338.1 -39% | 349.6 -37% | 596 8% | 579 5% |
| Write Seq Q32T1 (MB/s) | 1938 | 3420 76% | 982 -49% | 788 -59% | 1892 -2% | 2982 54% |
| Read Seq Q32T1 (MB/s) | 3467 | 3514 1% | 1622 -53% | 1490 -57% | 3209 -7% | 3440 -1% |
| Total Average (Program / Settings) | 7% /
7% | -27% /
-27% | -55% /
-56% | -3% /
-0% | 6% /
5% |
* ... smaller is better

Disk Throttling: DiskSpd Read Loop, Queue Depth 8
GPU Performance
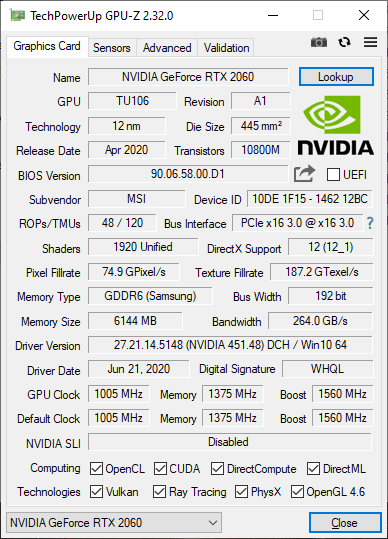
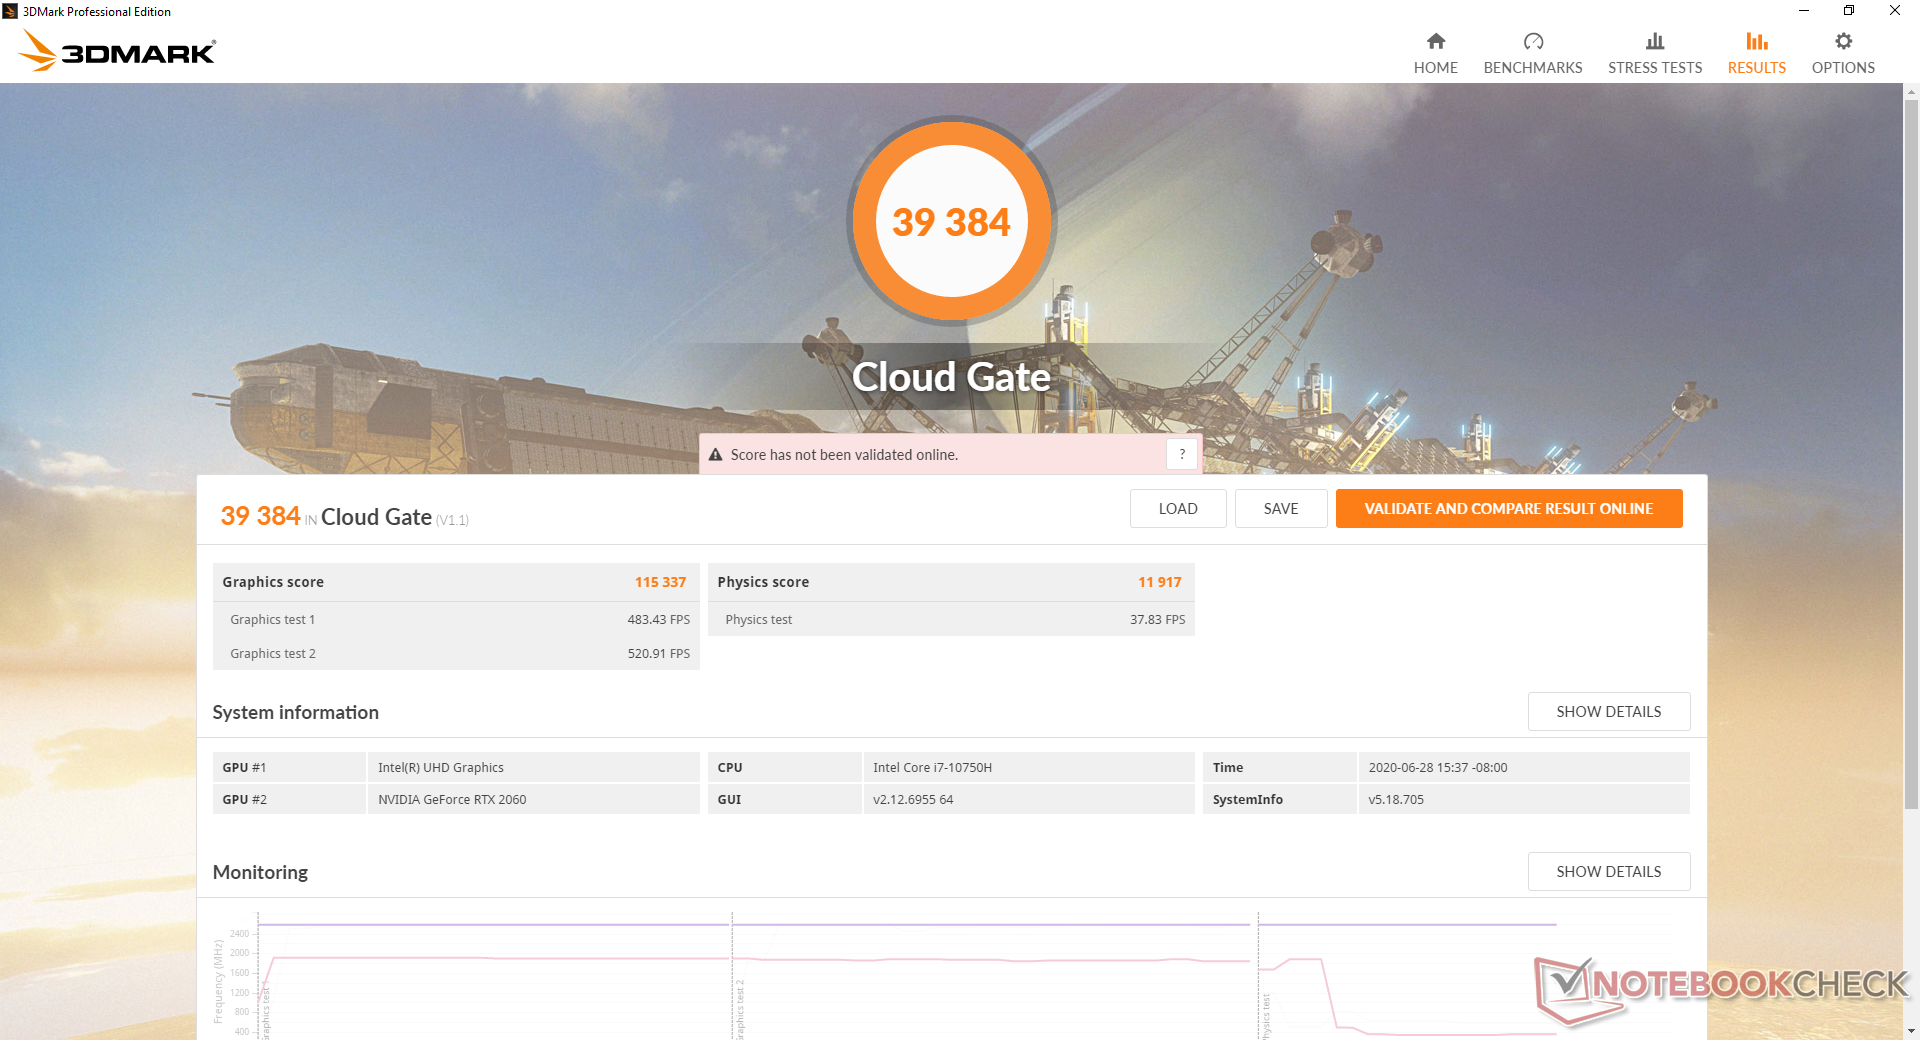
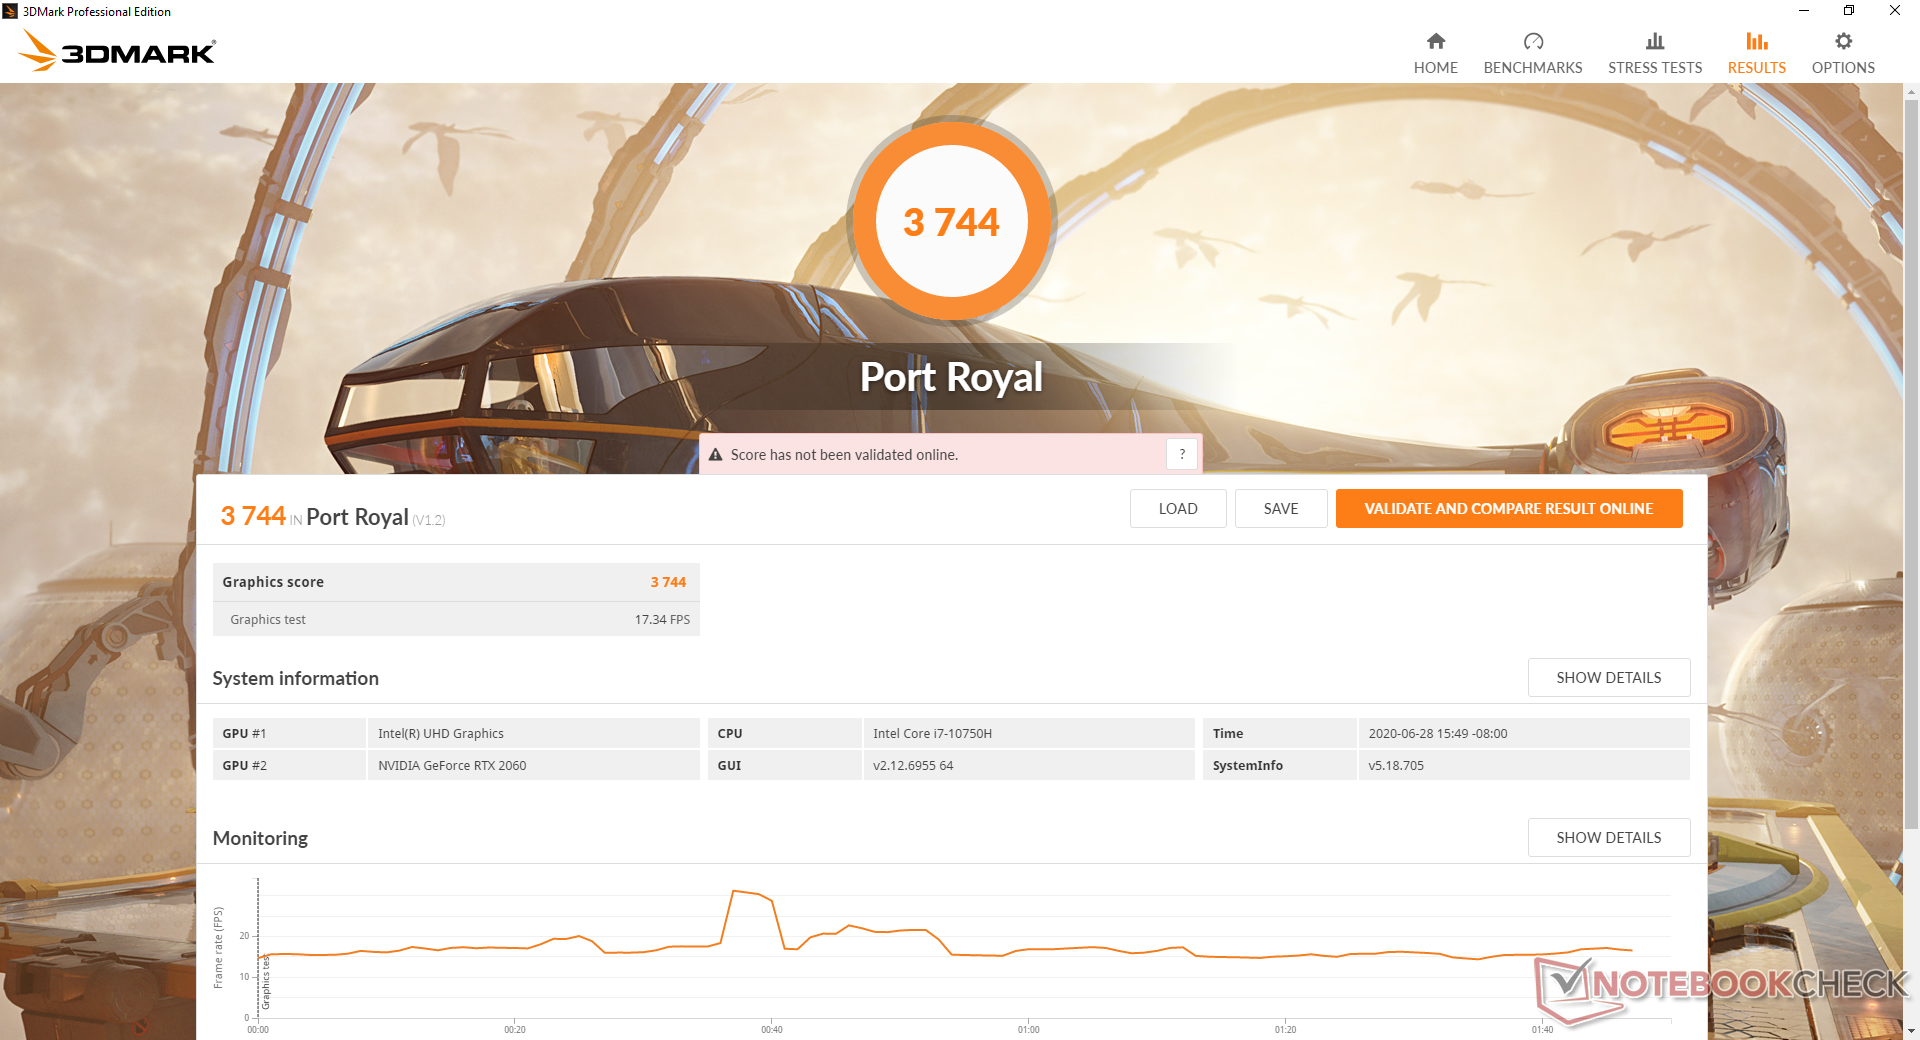
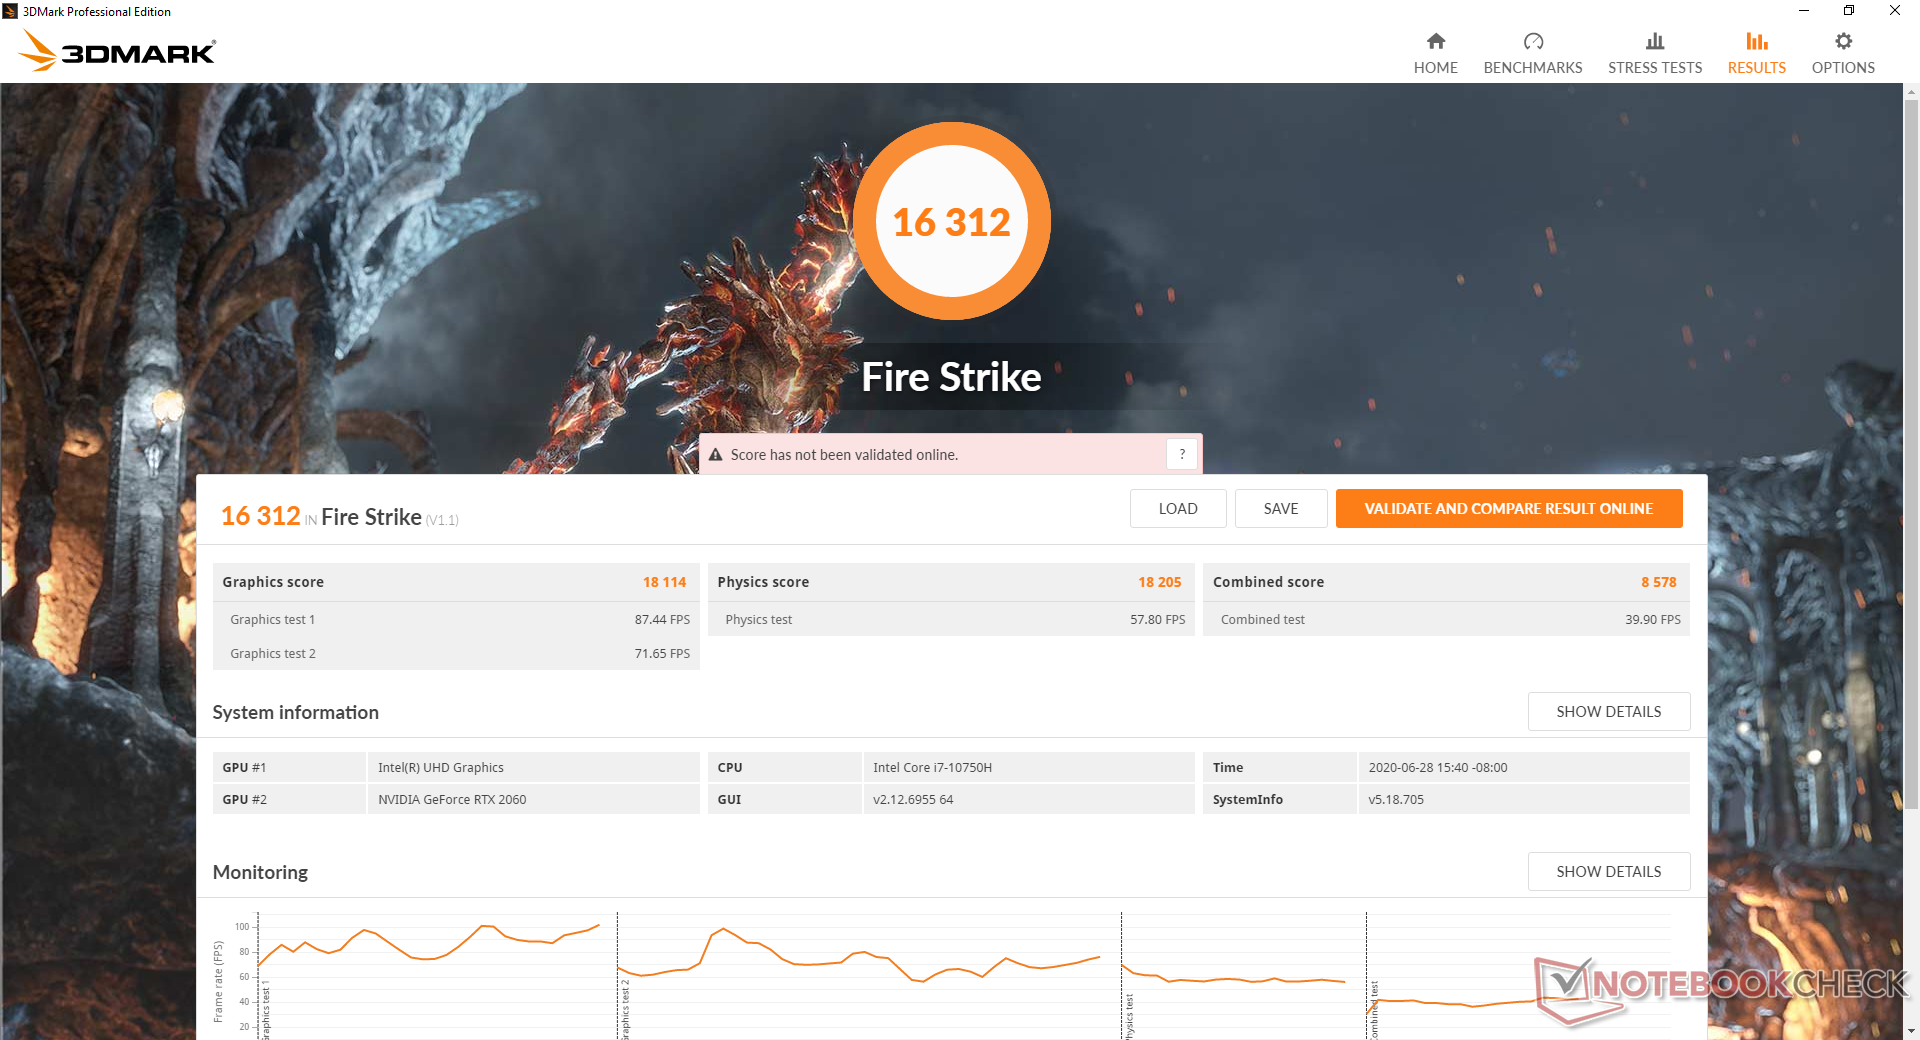
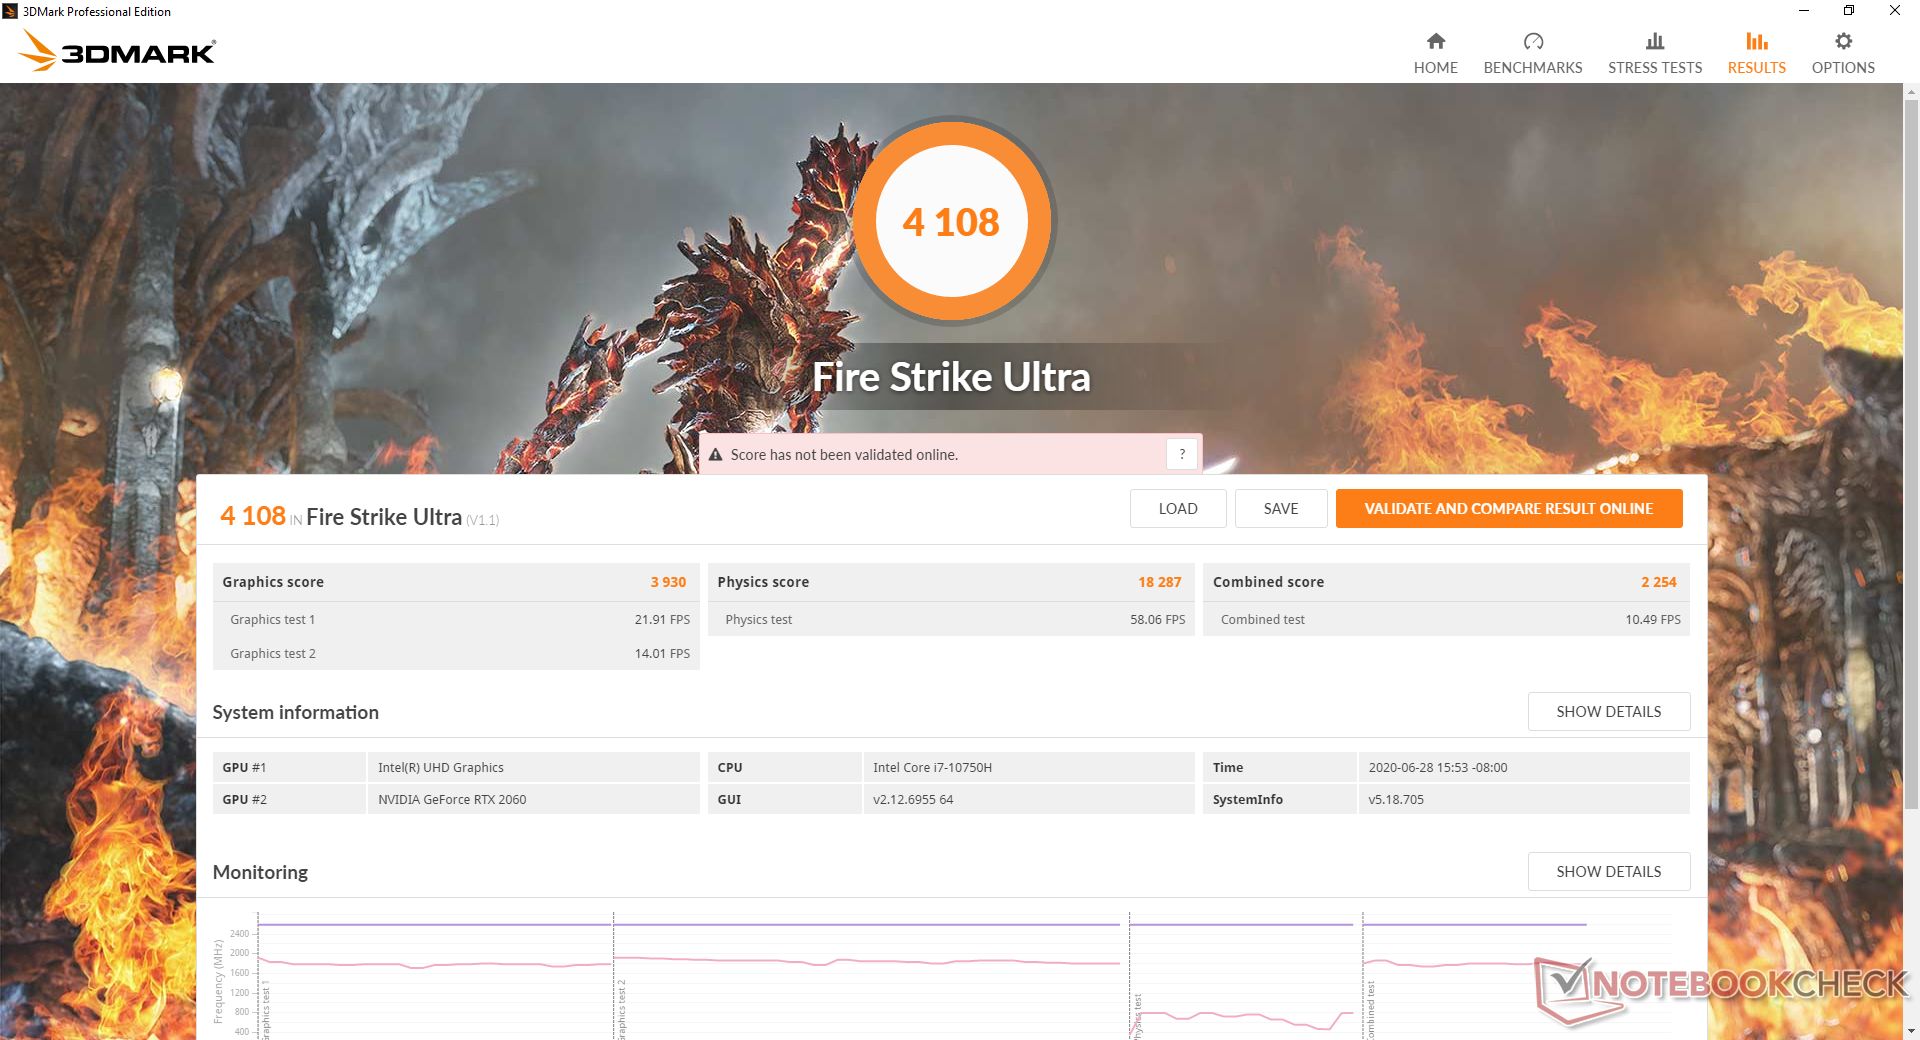
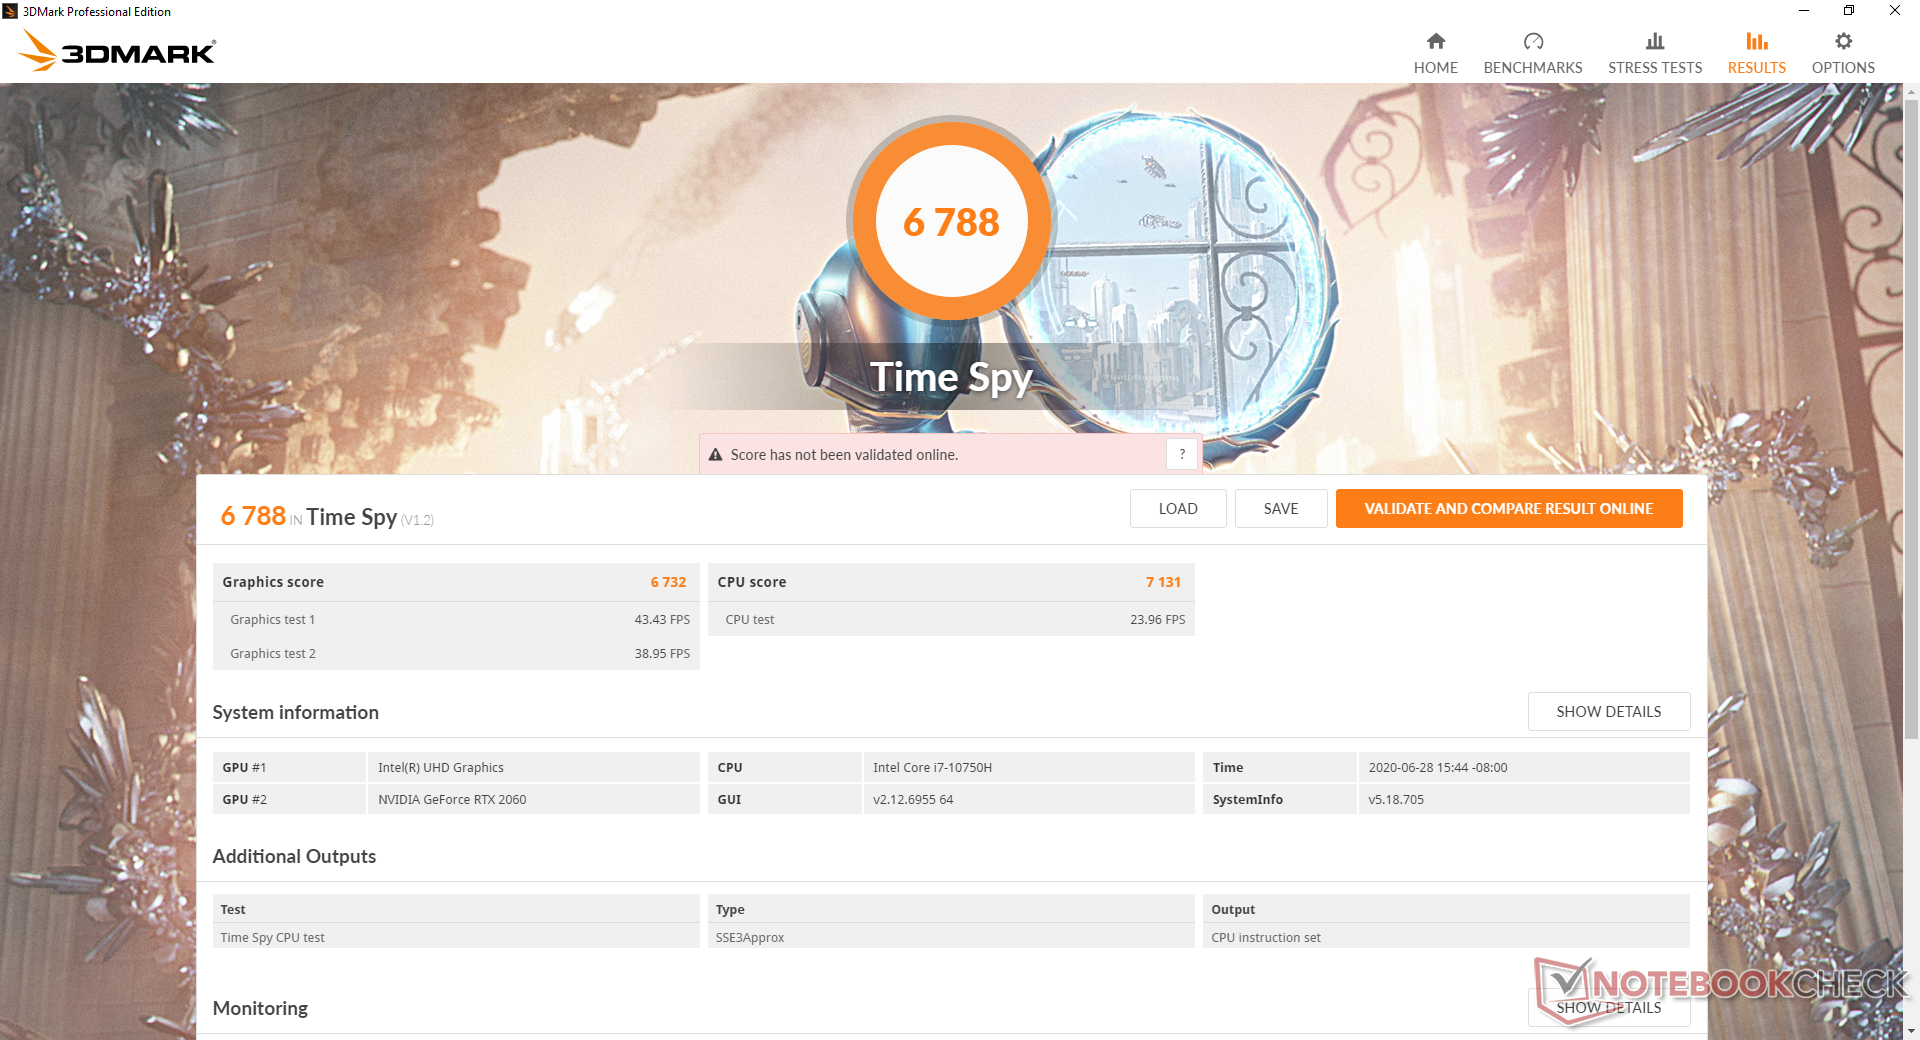
3DMark results are about 10 percent faster than the average mobile RTX 2060 GPU in our database. Upgrading to the RTX 2070 or RTX 2080 option for the GE75 will net users approximately 20 percent or 50 percent faster graphics performance, respectively.
See our dedicated page on the mobile GeForce RTX 2060 for more technical information and benchmark comparisons.
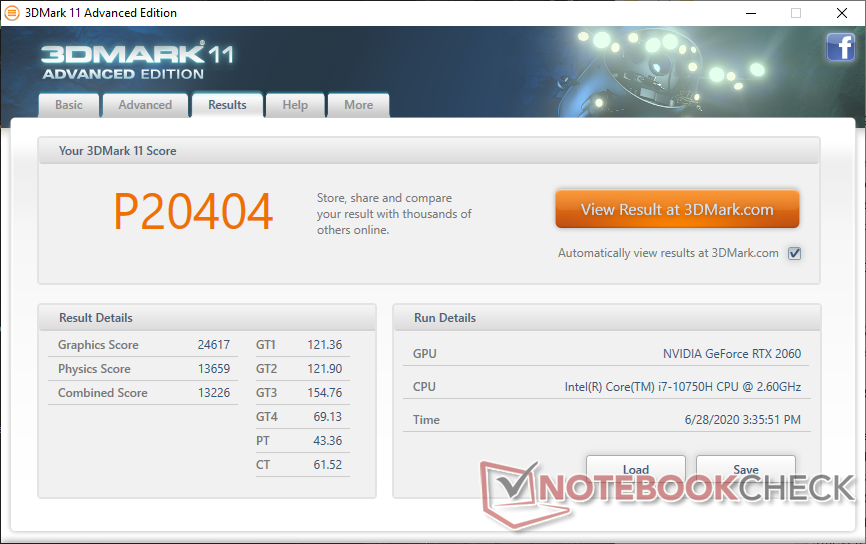
| 3DMark 11 Performance | 20404 points | |
| 3DMark Cloud Gate Standard Score | 39384 points | |
| 3DMark Fire Strike Score | 16312 points | |
| 3DMark Time Spy Score | 6788 points | |
Help | ||
| The Witcher 3 - 1920x1080 Ultra Graphics & Postprocessing (HBAO+) | |
| MSI GE75 9SG | |
| KFA2 GeForce RTX 2060 Super | |
| Aorus 17G XB | |
| MSI GE75 Raider 10SE-008US | |
| Schenker XMG Ultra 17 Coffee Lake Refresh | |
| Average NVIDIA GeForce RTX 2060 Mobile (50.6 - 74, n=40) | |
| Asus Zephyrus G14 GA401IV | |
| Asus TUF A17 FA706IU-AS76 | |
| HP Omen 15-dc0015ng | |
| MSI GF75 Thin 10SCXR | |
| low | med. | high | ultra | |
|---|---|---|---|---|
| The Witcher 3 (2015) | 293.5 | 214.9 | 123.9 | 65.9 |
| Dota 2 Reborn (2015) | 149 | 135 | 125 | 118 |
| X-Plane 11.11 (2018) | 103 | 90.6 | 77.2 | |
| Shadow of the Tomb Raider (2018) | 132 | 102 | 97 | 86 |
Emissions
System Noise
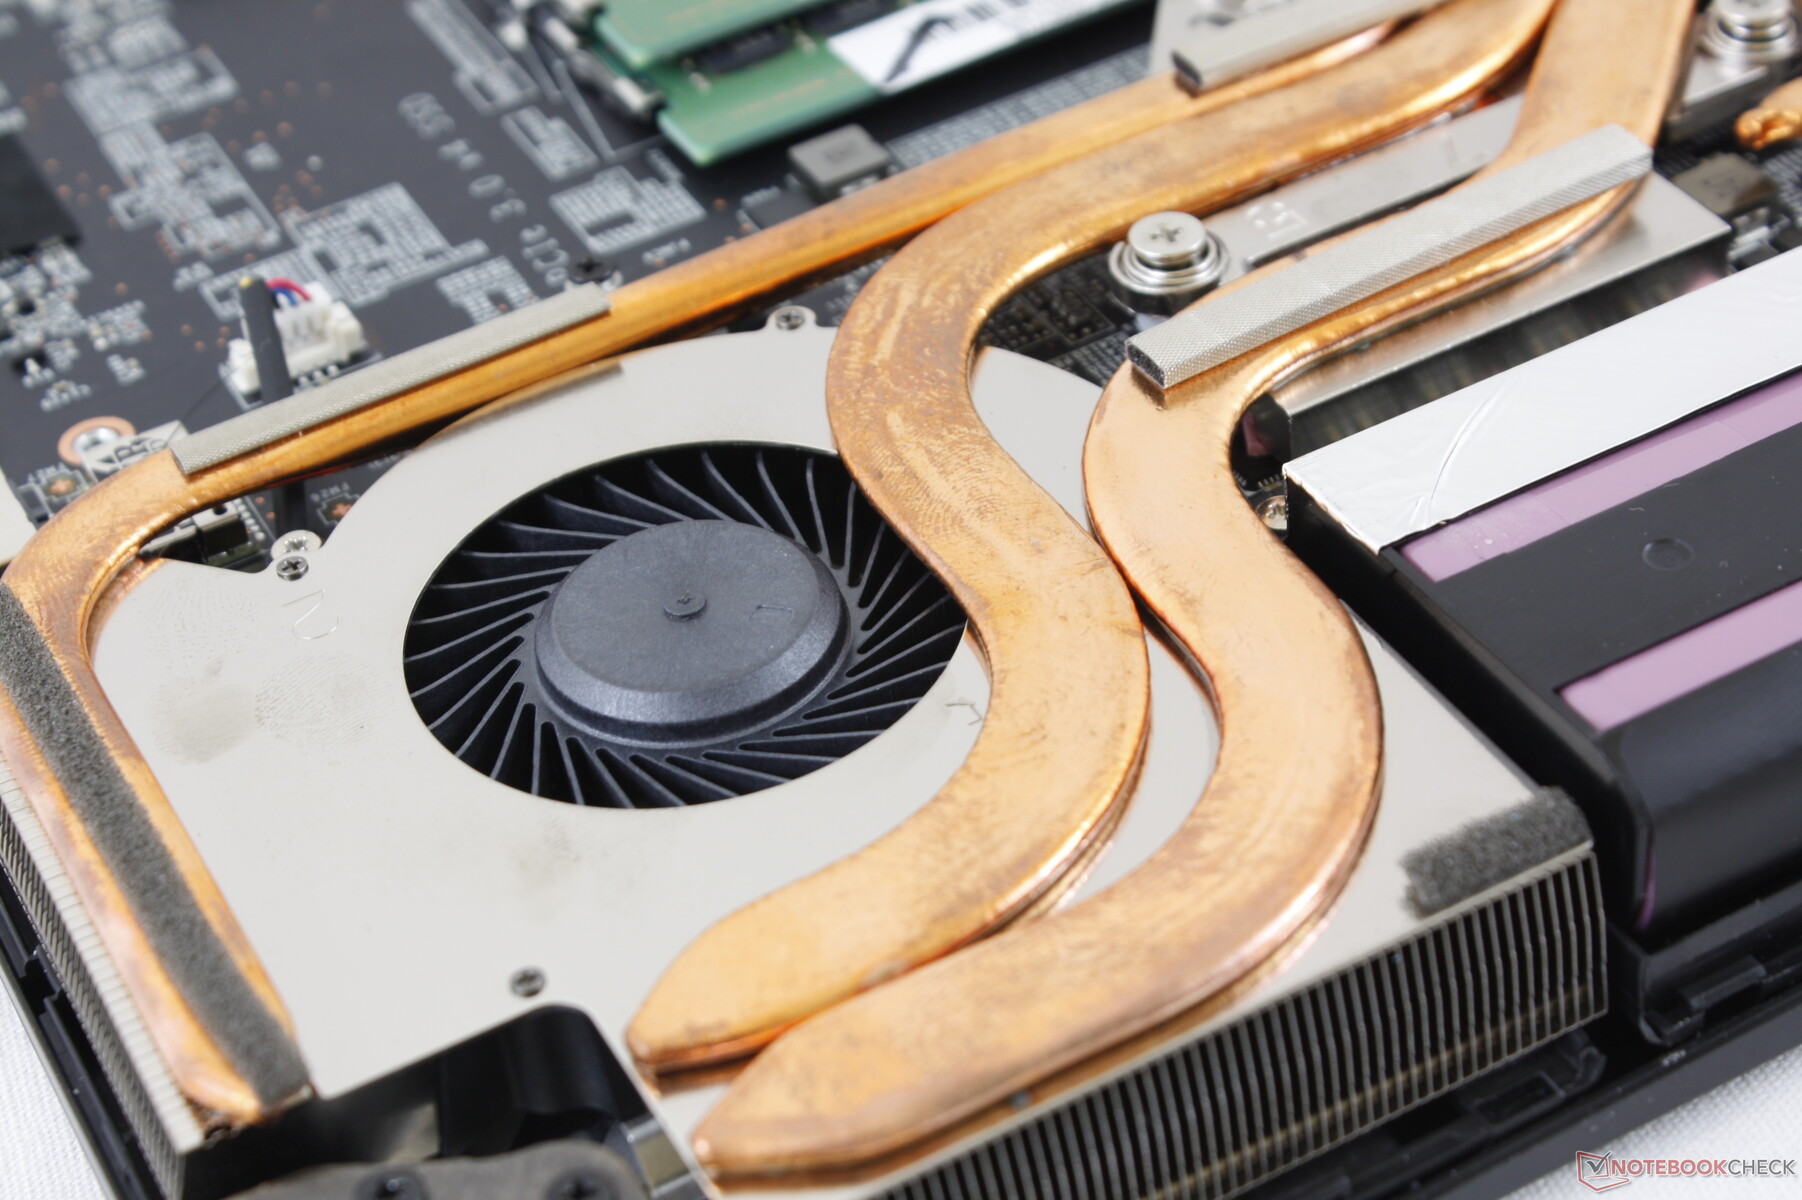
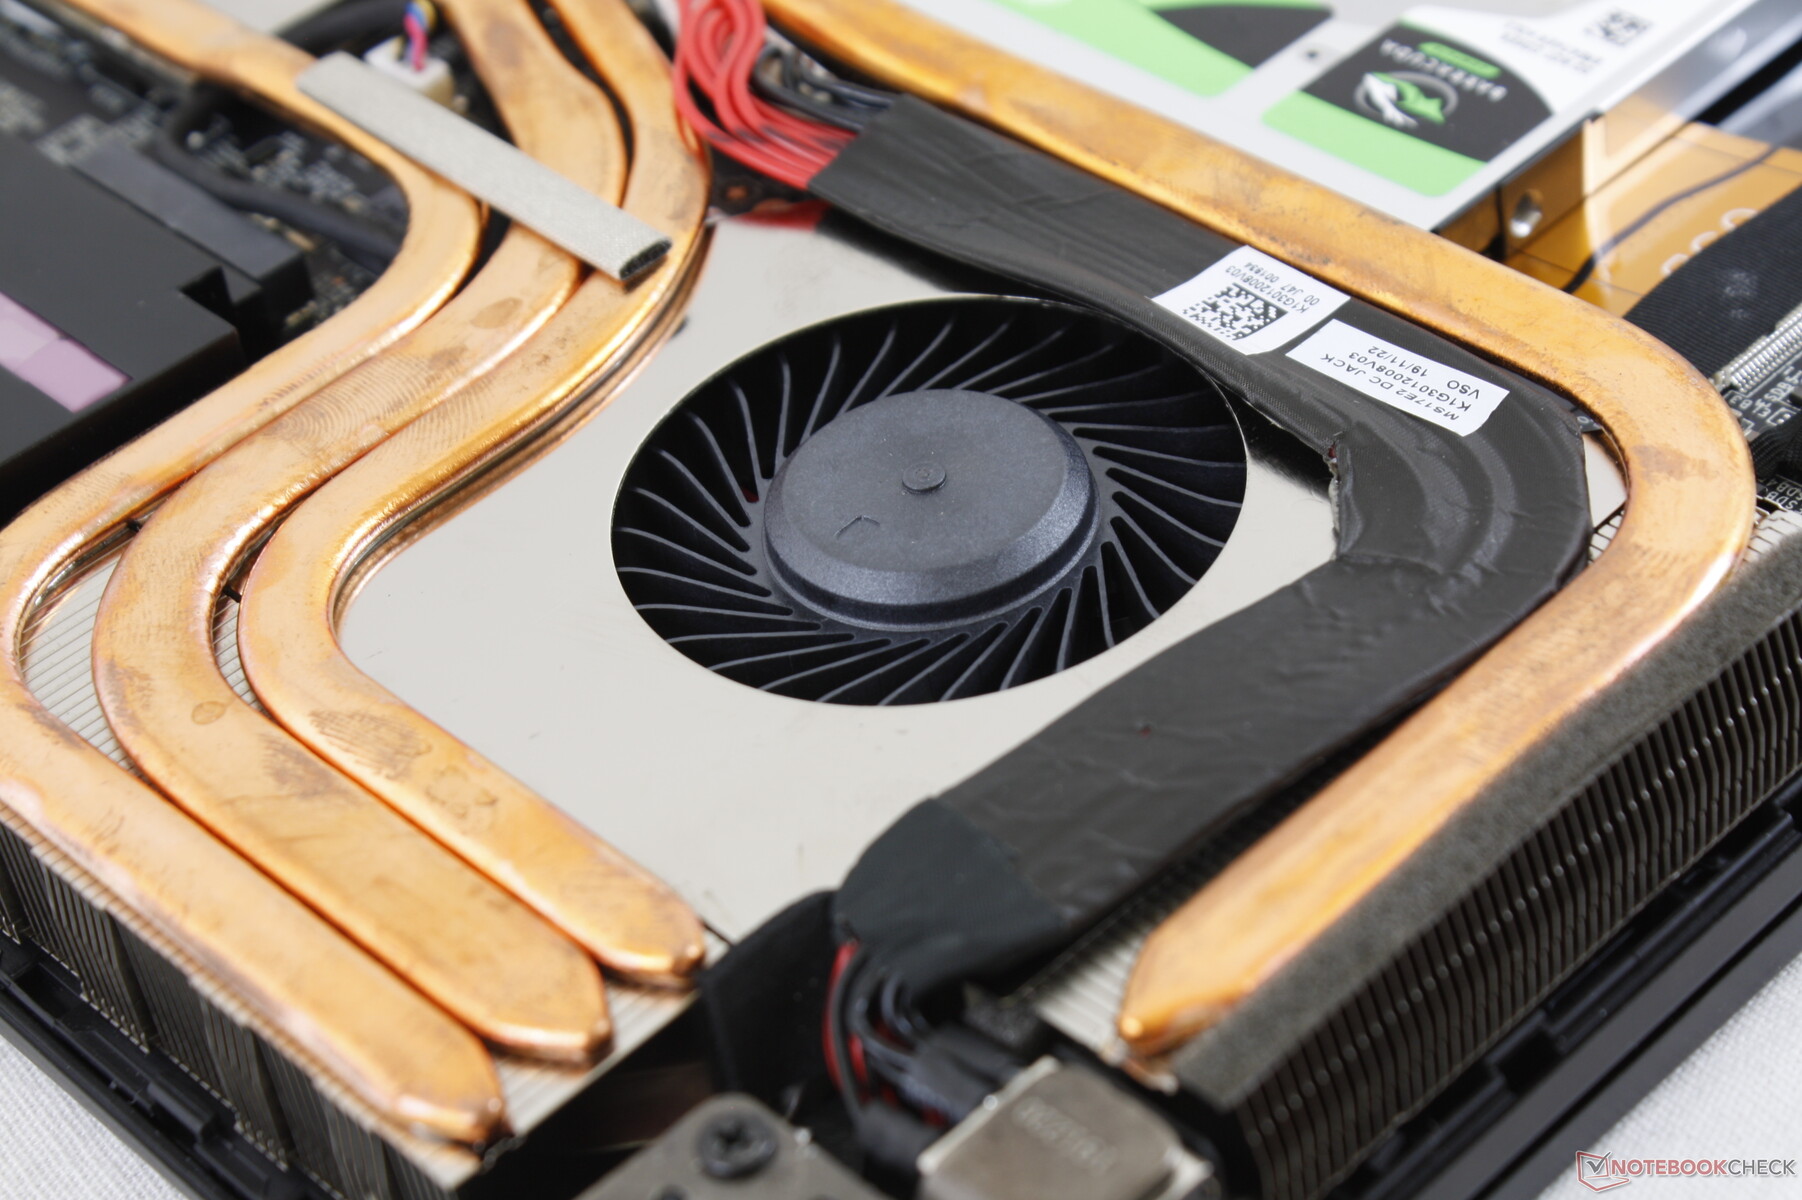
Both cooling solution and fan noise remain identical to last year's GE75. Interestingly, fan noise becomes essentially the same between the RTX 2060-powered GE75 10SE and RTX 2080-powered GE75 9SG when gaming despite the wide GPU performance gap between them. The fans will almost always be active even if set to the MSI "Silent" power profile.
We can notice very slight electronic noise or coil whine from our unit when placing an ear near the the keyboard keys. It's thankfully not acute enough to be of any concern especially since the fans will overwhelm it.
| MSI GE75 Raider 10SE-008US GeForce RTX 2060 Mobile, i7-10750H, Samsung SSD PM981 MZVLB512HAJQ | MSI GS75 Stealth 9SG GeForce RTX 2080 Max-Q, i7-9750H, 2x Samsung SSD PM981 MZVLB1T0HALR (RAID 0) | Asus Strix Hero III G731GV GeForce RTX 2060 Mobile, i7-9750H, Intel SSD 660p SSDPEKNW512G8 | Lenovo Legion Y740-17IRH GeForce RTX 2060 Mobile, i7-9750H, WDC PC SN520 SDAPMUW-128G | Razer Blade Pro 17 RTX 2060 GeForce RTX 2060 Mobile, i7-9750H, Samsung SSD PM981 MZVLB512HAJQ | Aorus 17G XB GeForce RTX 2070 Super Max-Q, i7-10875H, Samsung SSD PM981a MZVLB512HBJQ | |
|---|---|---|---|---|---|---|
| Noise | -7% | -4% | -8% | 2% | -12% | |
| off / environment * (dB) | 28.4 | 30 -6% | 28.2 1% | 30 -6% | 28.2 1% | 30 -6% |
| Idle Minimum * (dB) | 30.2 | 31 -3% | 29.5 2% | 33 -9% | 28.2 7% | 35 -16% |
| Idle Average * (dB) | 30.2 | 32 -6% | 30.3 -0% | 34 -13% | 28.2 7% | 36 -19% |
| Idle Maximum * (dB) | 32 | 38 -19% | 31.9 -0% | 35 -9% | 28.2 12% | 41 -28% |
| Load Average * (dB) | 33.2 | 47 -42% | 50.4 -52% | 48 -45% | 43 -30% | 47 -42% |
| Witcher 3 ultra * (dB) | 55 | 48 13% | 50.1 9% | 46 16% | 48.4 12% | 48 13% |
| Load Maximum * (dB) | 55 | 49 11% | 50.1 9% | 49 11% | 53.4 3% | 49 11% |
* ... smaller is better
Noise level
| Idle |
| 30.2 / 30.2 / 32 dB(A) |
| Load |
| 33.2 / 55 dB(A) |
 | ||
30 dB silent 40 dB(A) audible 50 dB(A) loud |
||
min: | ||
Temperature
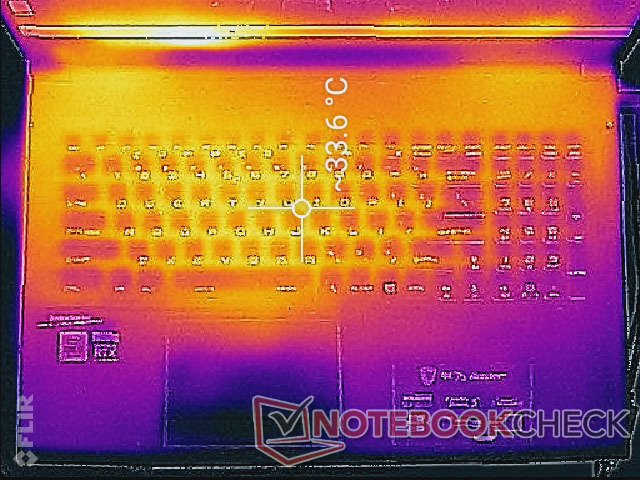
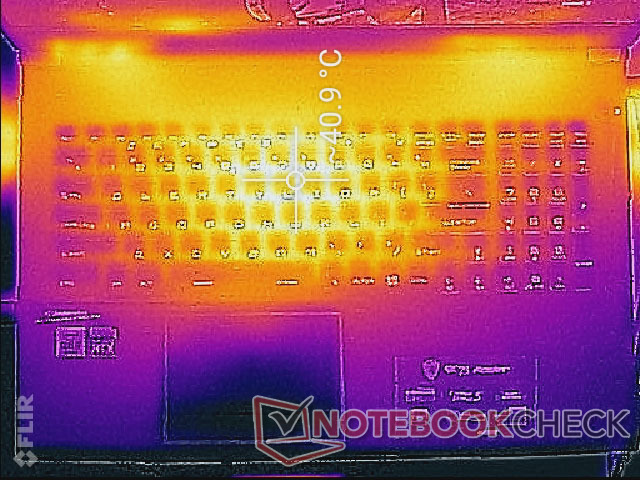
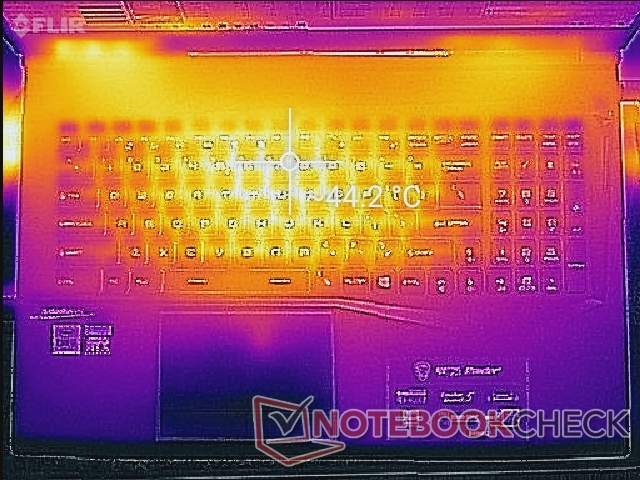
The relatively large base allows the palm rests and clickpad to remain cool no matter the processing load unlike what we observed on the super-thin Razer Blade Pro 17 or MSI GS75. When gaming, these frontal areas remain below 30 C on average compared to over 40 C on the aforementioned alternatives. Hot spots on the keyboard center can reach just over 44 C, but the main WASD keys never become uncomfortably warm.
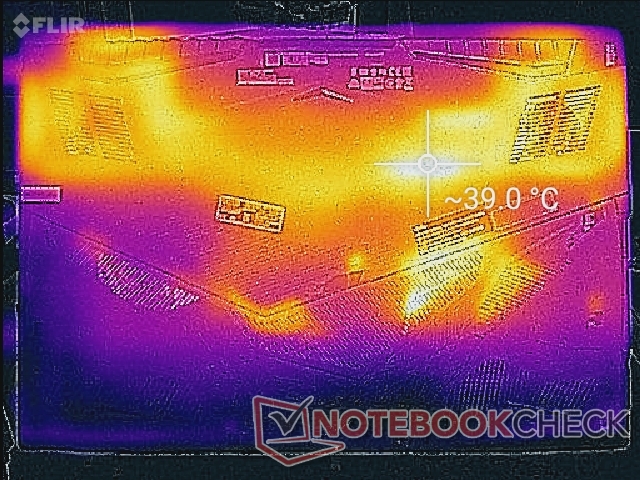
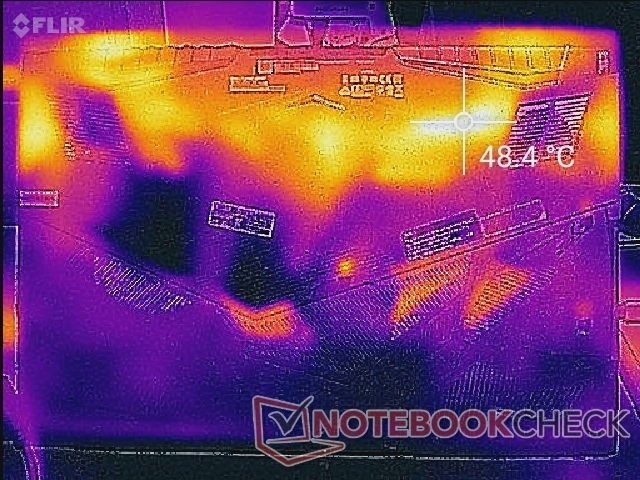
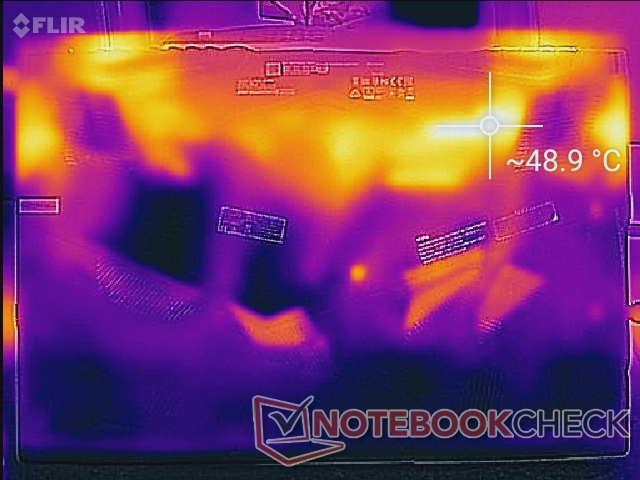
Excess heat exits from four different points along the sides so be sure to leave enough breathing room around the system.
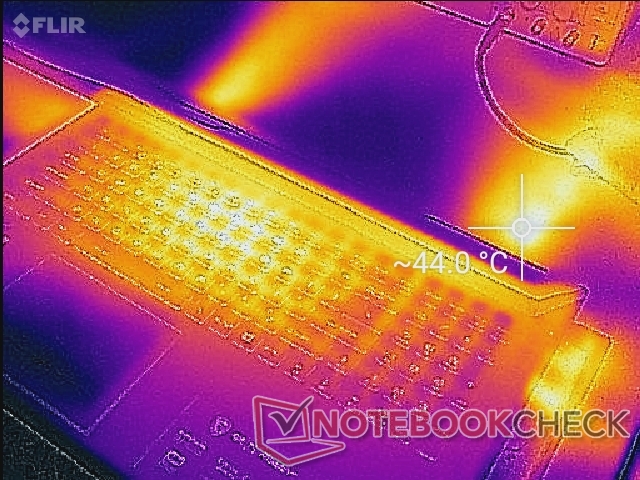
(±) The maximum temperature on the upper side is 44.2 °C / 112 F, compared to the average of 40.4 °C / 105 F, ranging from 21.2 to 68.8 °C for the class Gaming.
(-) The bottom heats up to a maximum of 49 °C / 120 F, compared to the average of 43.2 °C / 110 F
(+) In idle usage, the average temperature for the upper side is 31.2 °C / 88 F, compared to the device average of 33.9 °C / 93 F.
(±) Playing The Witcher 3, the average temperature for the upper side is 33.6 °C / 92 F, compared to the device average of 33.9 °C / 93 F.
(+) The palmrests and touchpad are cooler than skin temperature with a maximum of 29.2 °C / 84.6 F and are therefore cool to the touch.
(±) The average temperature of the palmrest area of similar devices was 28.8 °C / 83.8 F (-0.4 °C / -0.8 F).
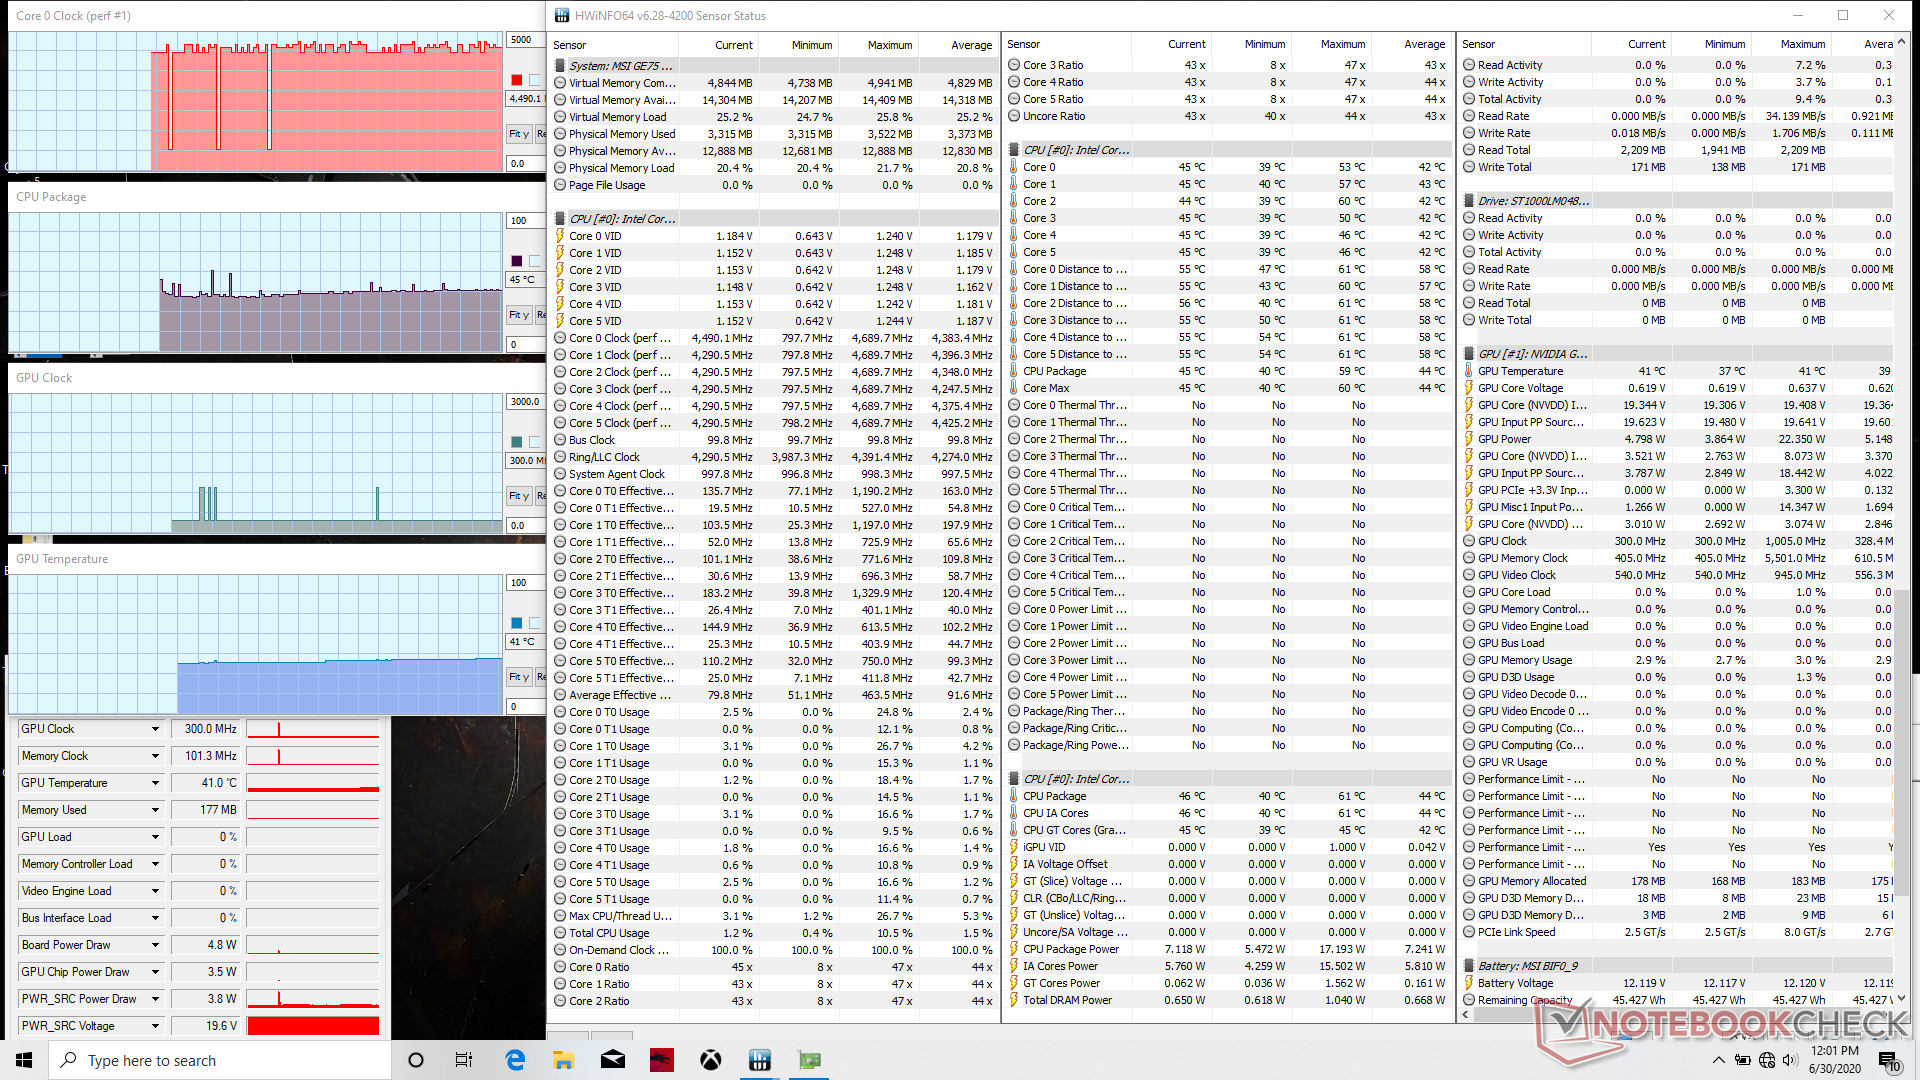
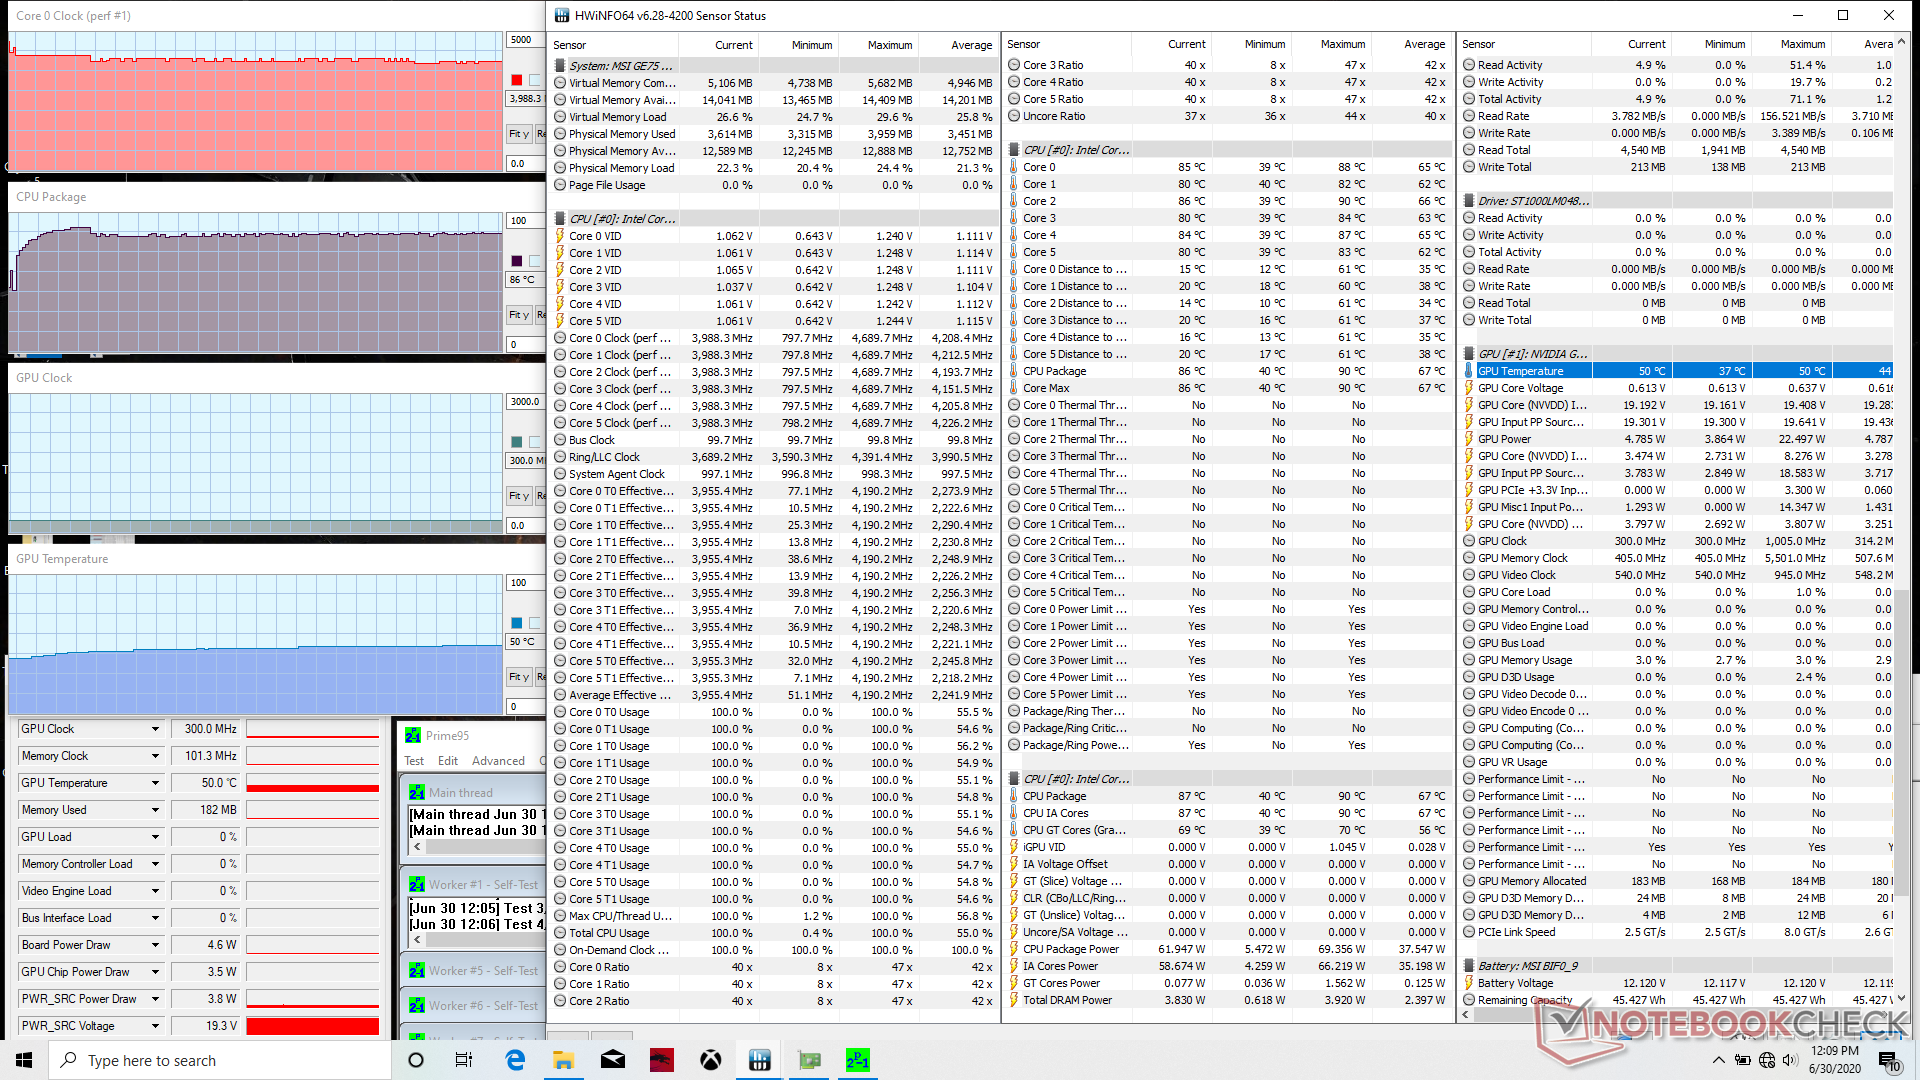
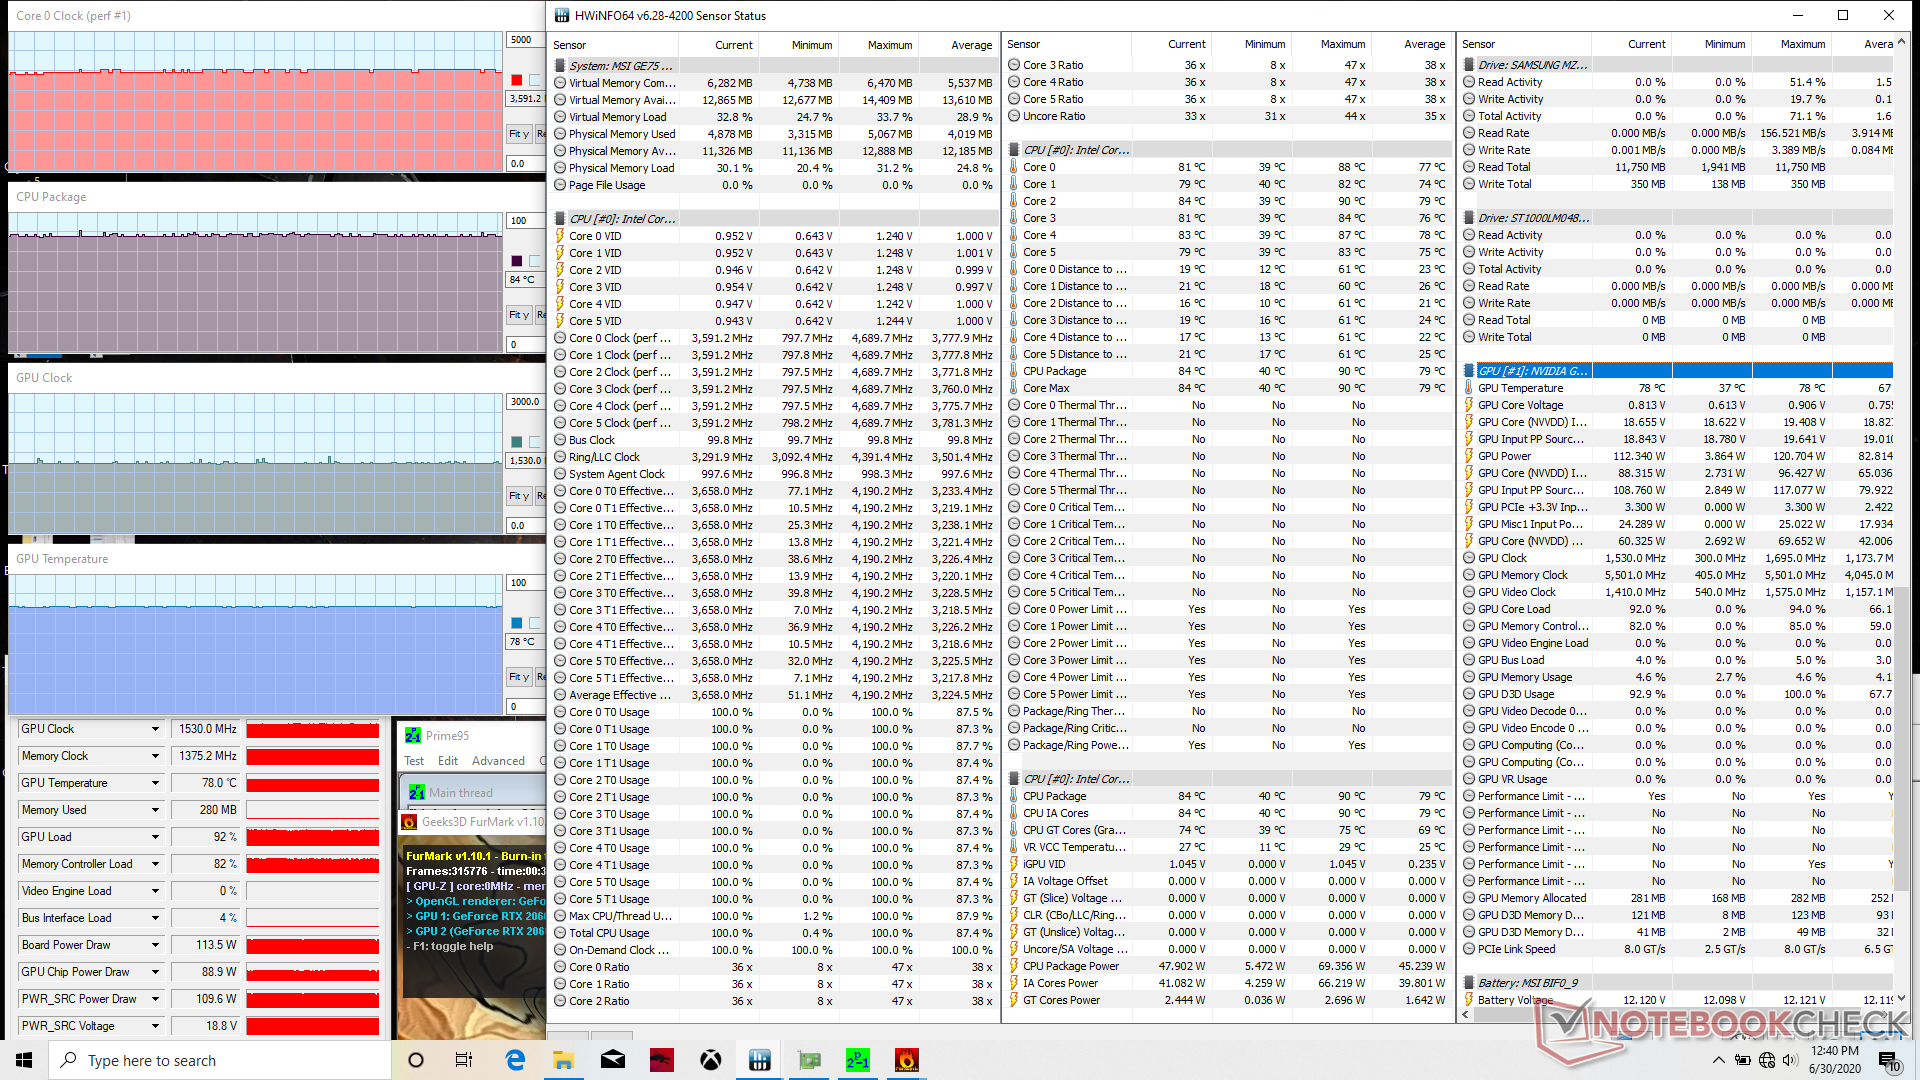
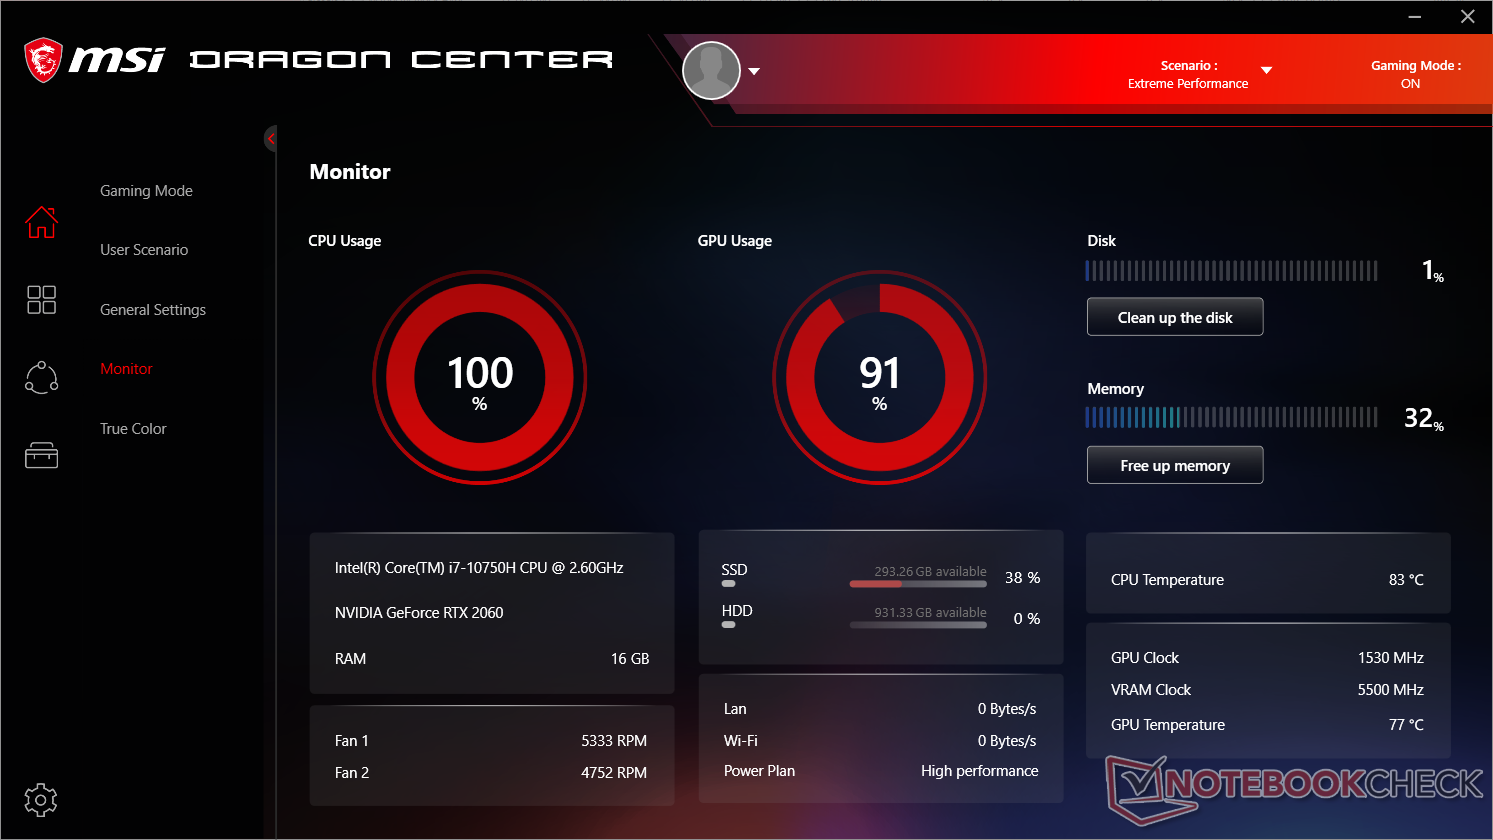
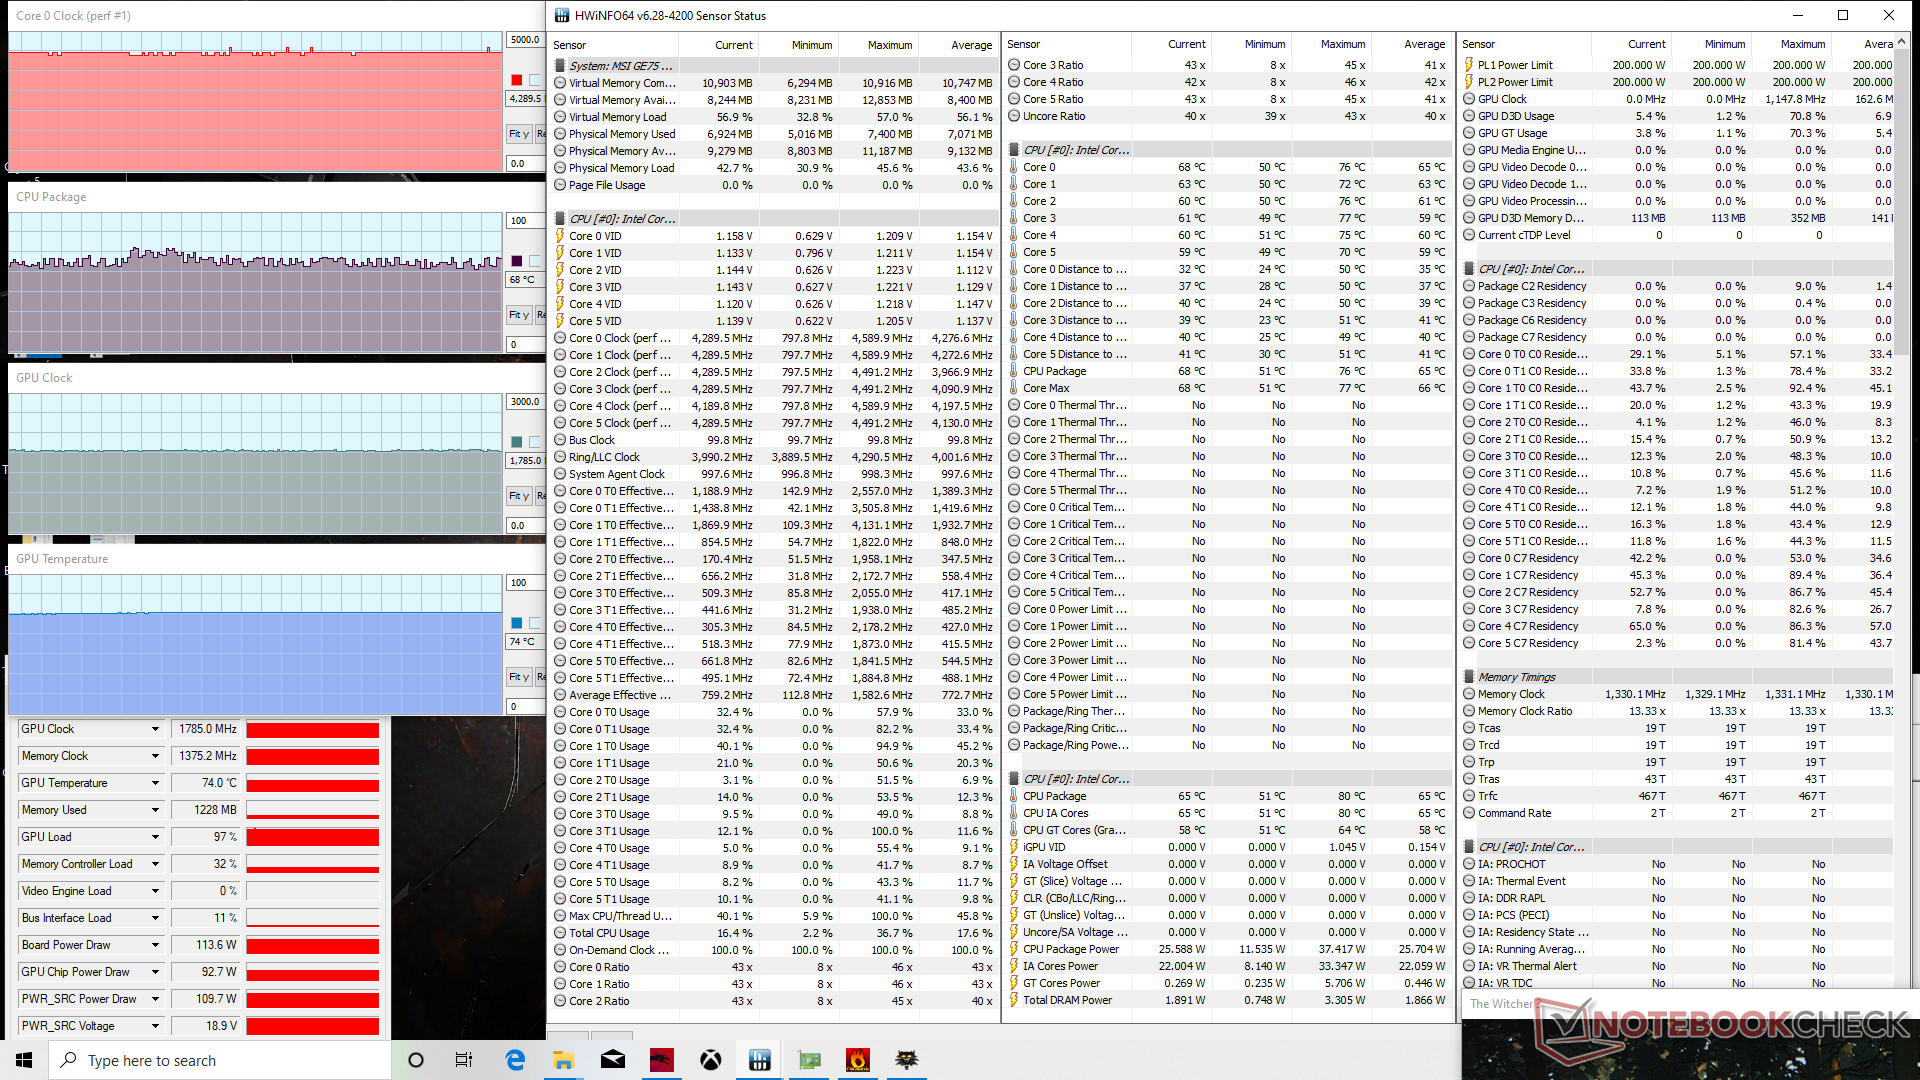
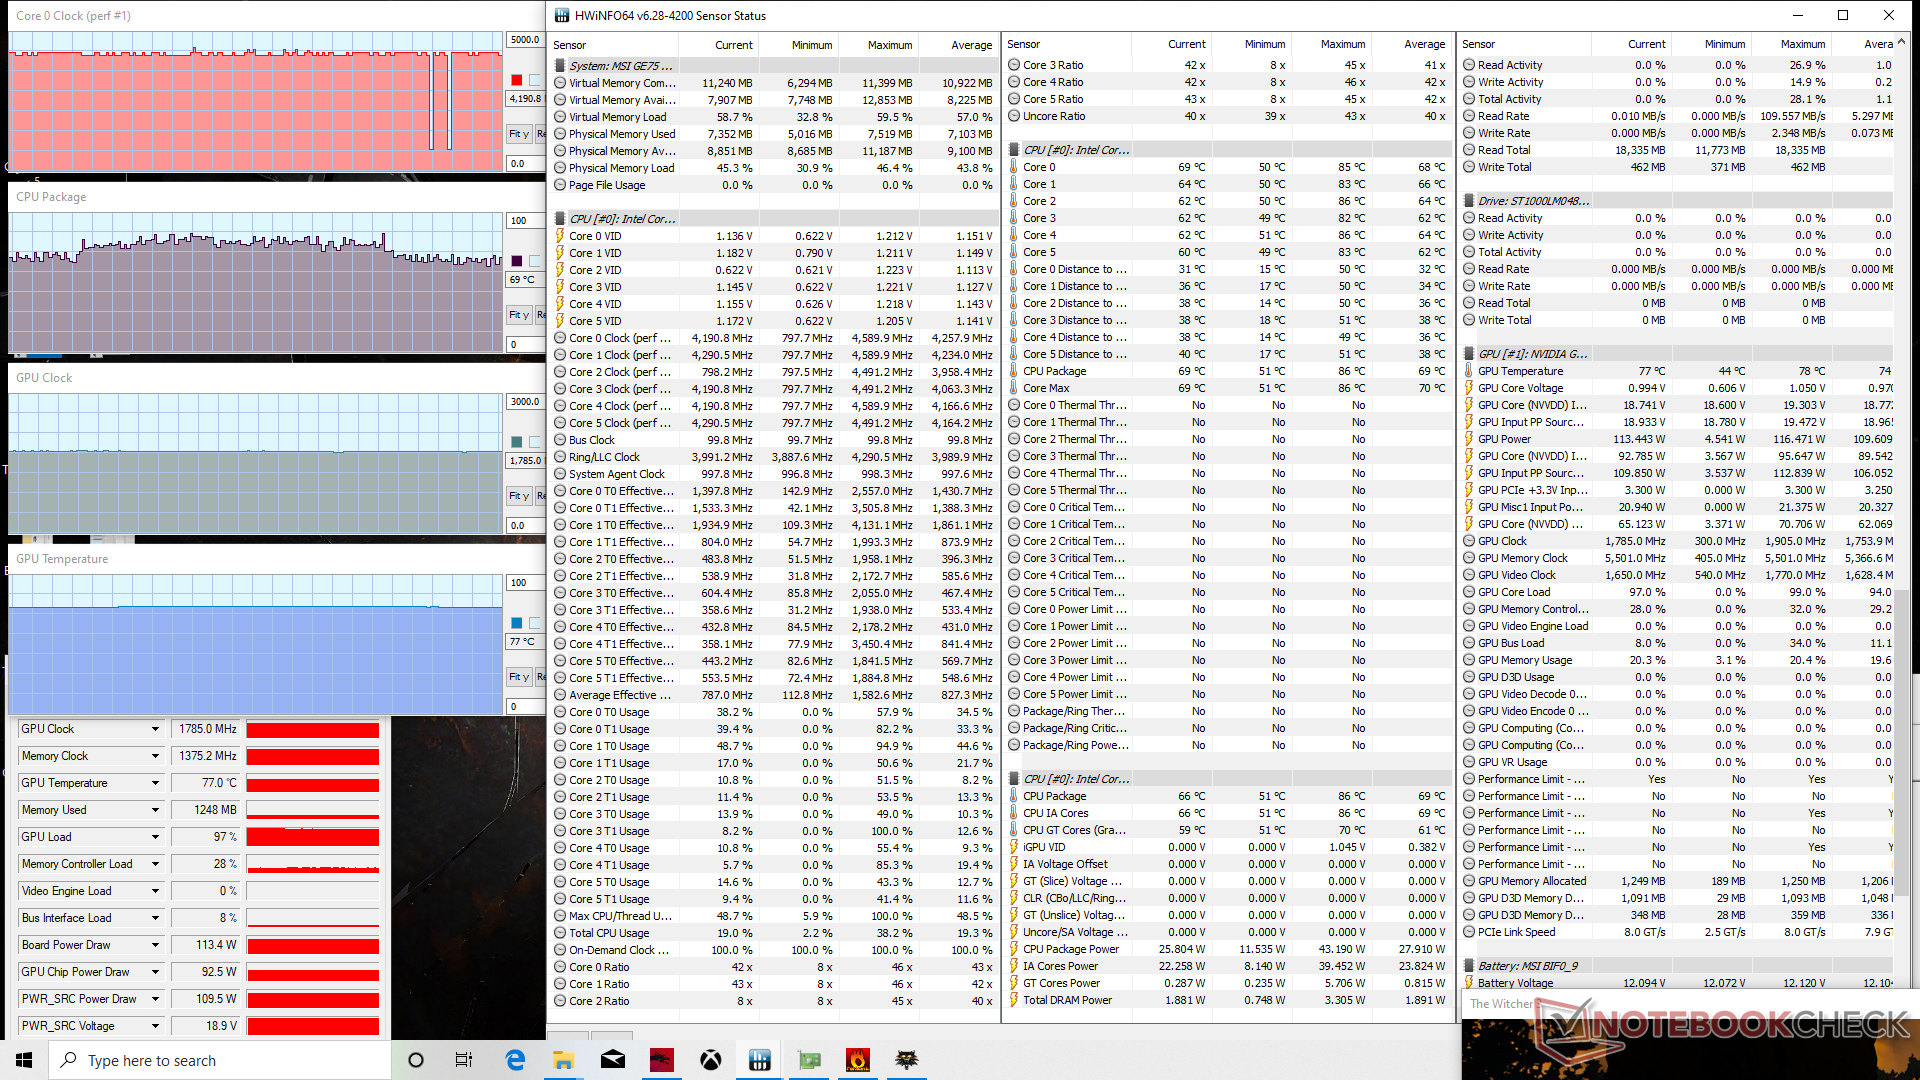
Stress Test
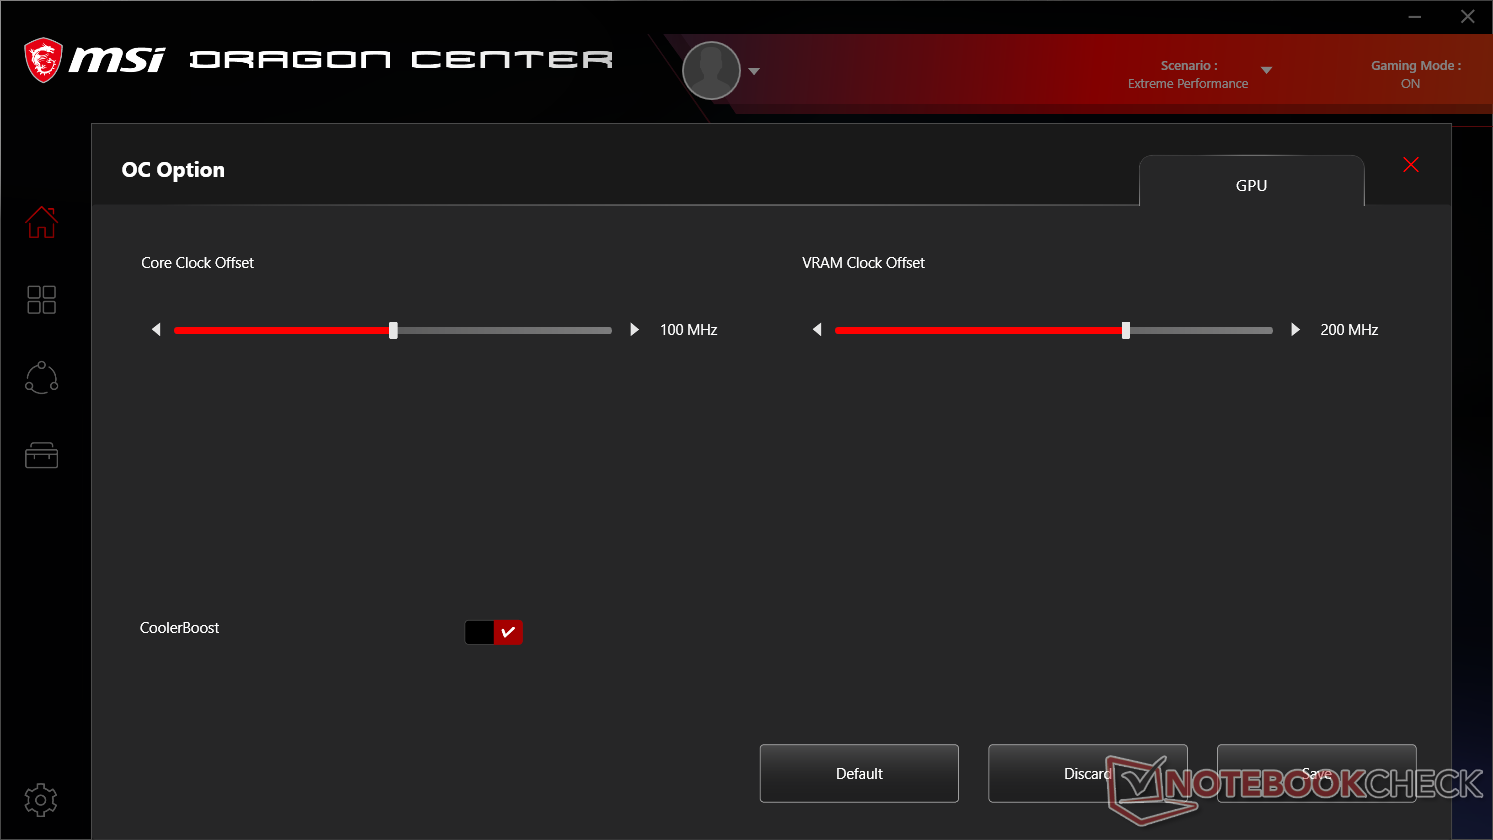
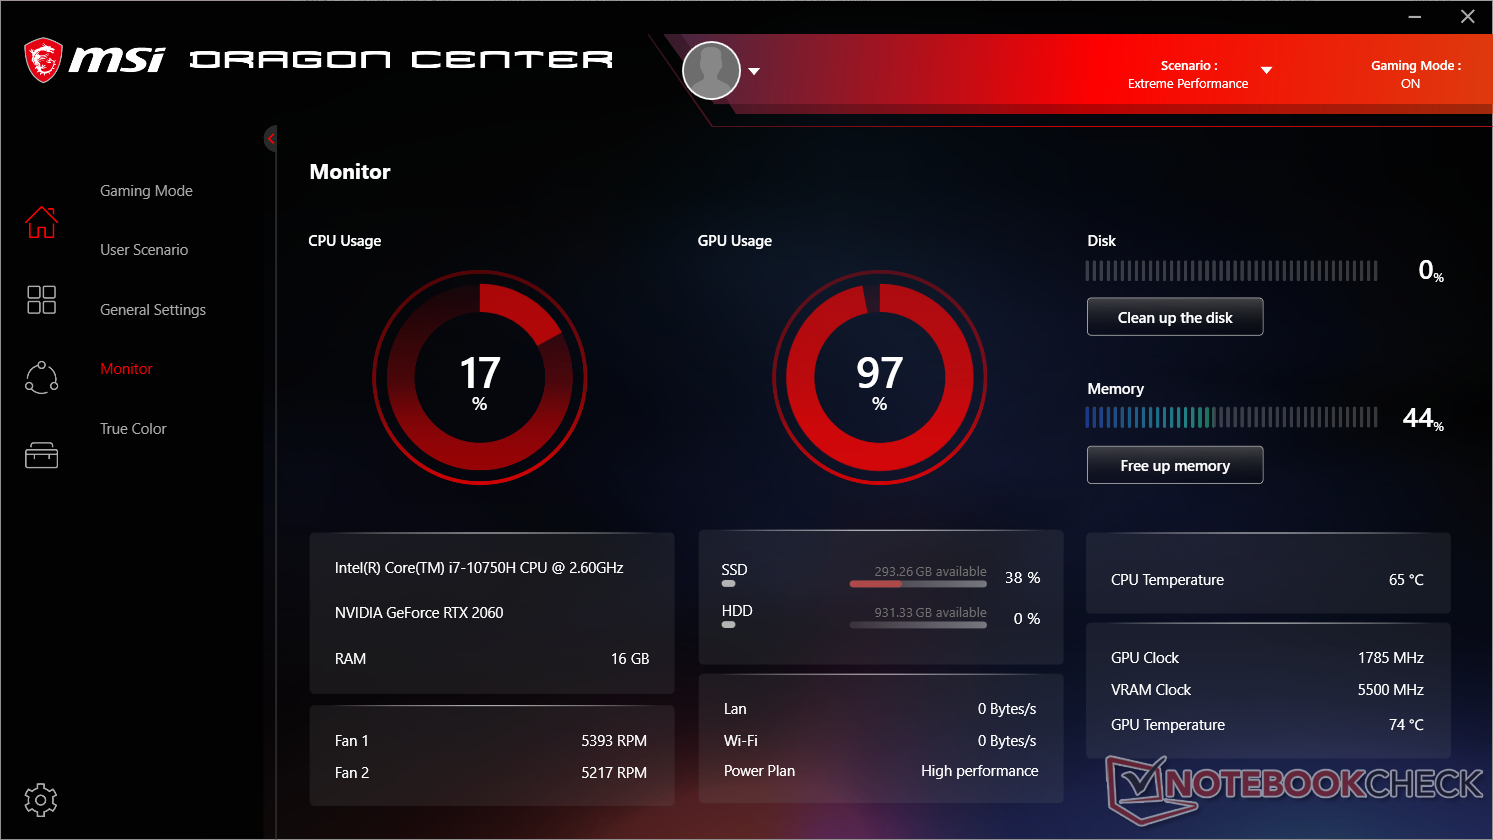
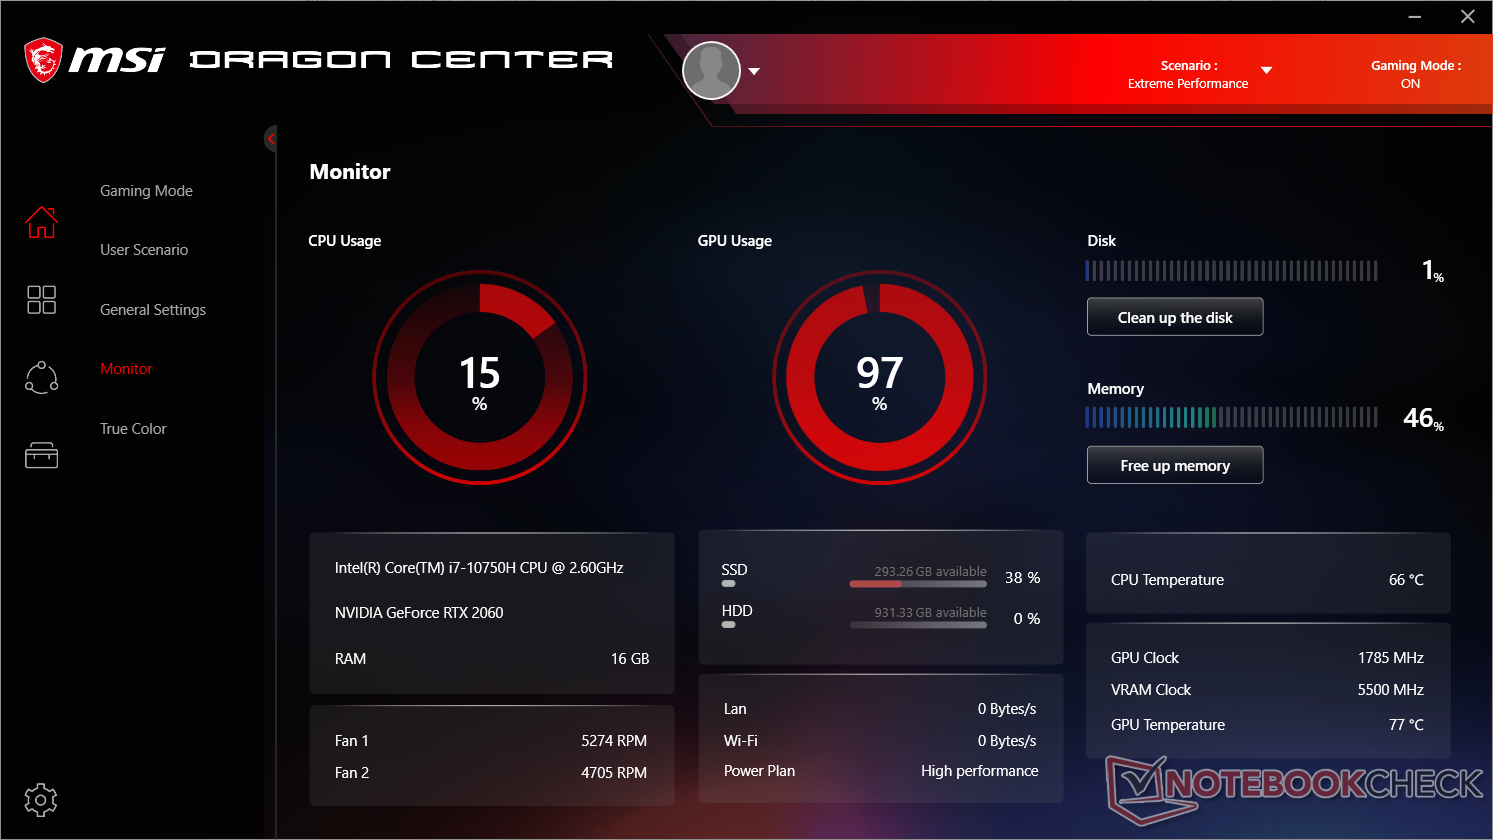
When running Prime95, the CPU would boost to 4.2 GHz for about a minute before hitting a core temperature of 90 C. Thereafter, clock rates drop to the 3.9 - 4.0 GHz range in order to maintain a stable core temperature of 85 C. When running Witcher 3, CPU and GPU temperature would stabilize at around 68 C and 77 C, respectively, compared to 80 C and 68 C on the Asus Strix Hero III G731GV under similar conditions. Interestingly, enabling Cooler Boost results in no noticeable performance advantages.
Running on batteries will impact performance. A Fire Strike test on battery power returns Physics and Graphics scores of 11890 and 4630 points, respectively, compared to 18205 and 18114 points when on mains.
| CPU Clock (GHz) | GPU Clock (MHz) | Average CPU Temperature (°C) | Average GPU Temperature (°C) | |
| System Idle | -- | -- | 45 | 41 |
| Prime95 Stress | 4.0 | -- | 86 | 50 |
| Prime95 + FurMark Stress | 3.6 - 3.7 | 1530 | 84 | 78 |
| Witcher 3 Stress (Cooler Boost off) | 4.3 | 1785 | ~68 | 77 |
| Witcher 3 Stress (Cooler Boost on) | 4.3 | 1785 | ~68 | 74 |
Speakers


MSI GE75 Raider 10SE-008US audio analysis
(+) | speakers can play relatively loud (95.5 dB)
Bass 100 - 315 Hz
(-) | nearly no bass - on average 20.2% lower than median
(+) | bass is linear (2.2% delta to prev. frequency)
Mids 400 - 2000 Hz
(±) | reduced mids - on average 5.7% lower than median
(+) | mids are linear (5.9% delta to prev. frequency)
Highs 2 - 16 kHz
(+) | balanced highs - only 2.8% away from median
(+) | highs are linear (5% delta to prev. frequency)
Overall 100 - 16.000 Hz
(±) | linearity of overall sound is average (15.2% difference to median)
Compared to same class
» 33% of all tested devices in this class were better, 6% similar, 61% worse
» The best had a delta of 6%, average was 18%, worst was 132%
Compared to all devices tested
» 21% of all tested devices were better, 4% similar, 74% worse
» The best had a delta of 4%, average was 24%, worst was 134%
Apple MacBook 12 (Early 2016) 1.1 GHz audio analysis
(+) | speakers can play relatively loud (83.6 dB)
Bass 100 - 315 Hz
(±) | reduced bass - on average 11.3% lower than median
(±) | linearity of bass is average (14.2% delta to prev. frequency)
Mids 400 - 2000 Hz
(+) | balanced mids - only 2.4% away from median
(+) | mids are linear (5.5% delta to prev. frequency)
Highs 2 - 16 kHz
(+) | balanced highs - only 2% away from median
(+) | highs are linear (4.5% delta to prev. frequency)
Overall 100 - 16.000 Hz
(+) | overall sound is linear (10.2% difference to median)
Compared to same class
» 7% of all tested devices in this class were better, 2% similar, 91% worse
» The best had a delta of 5%, average was 18%, worst was 53%
Compared to all devices tested
» 5% of all tested devices were better, 1% similar, 94% worse
» The best had a delta of 4%, average was 24%, worst was 134%
Energy Management
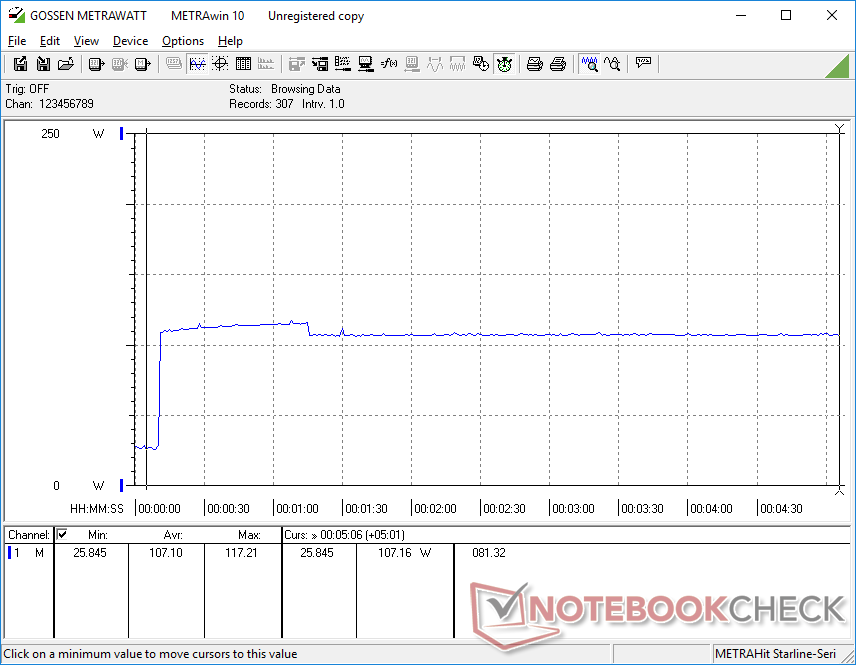
Power Consumption
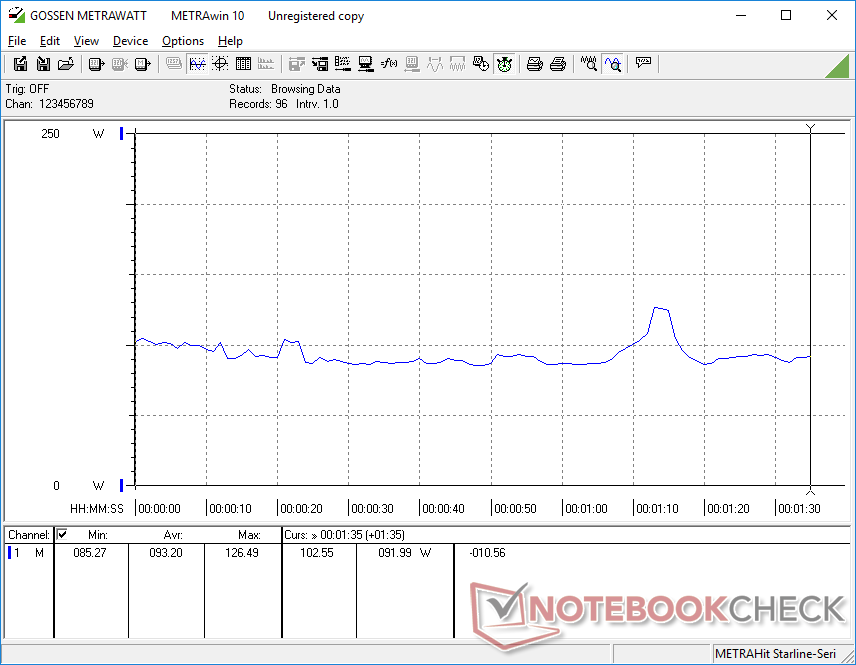
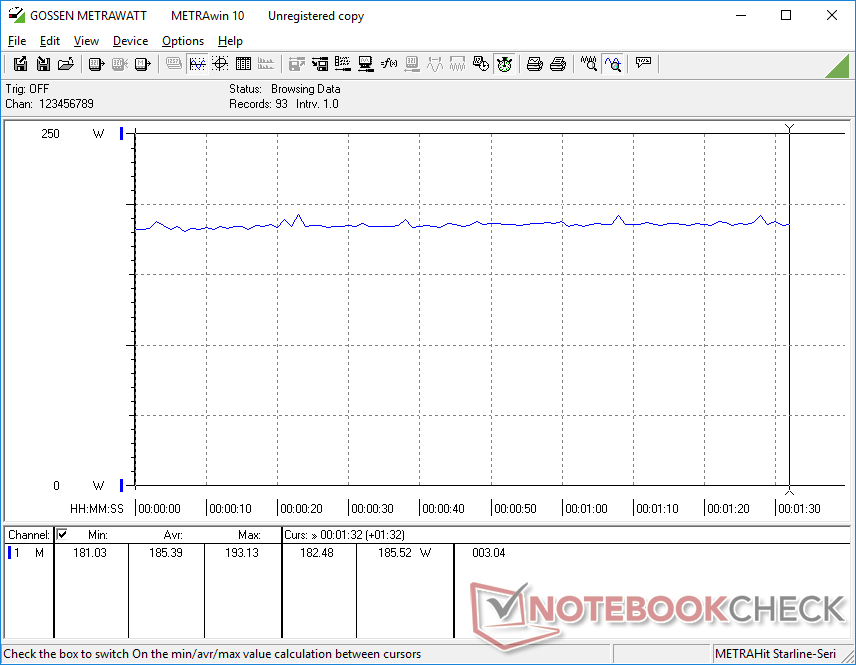
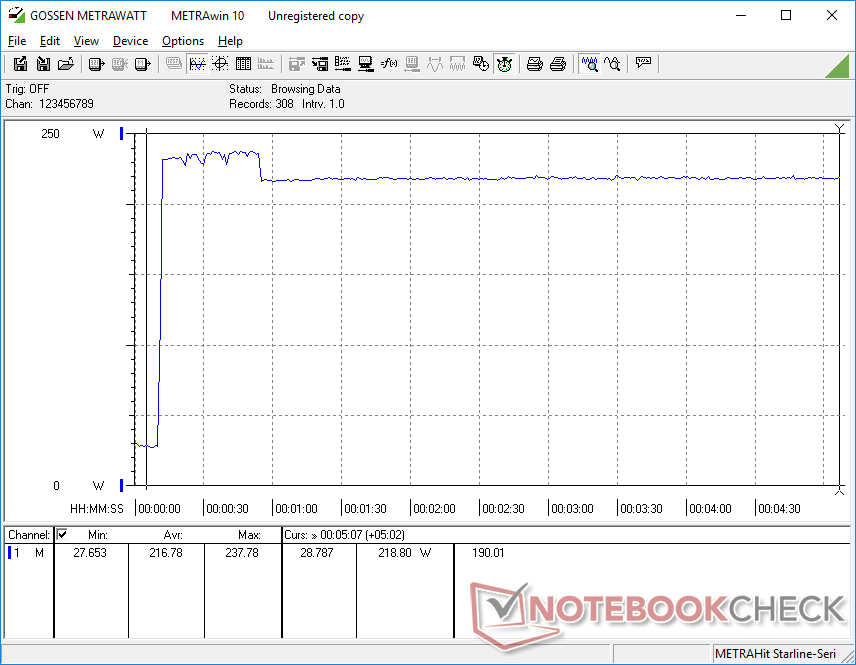
Idling demands between 14 W and 27 W depending on the power profile, brightness, and GPU setting. Power consumption when running Witcher 3 is higher than expected at 185 W compared to 147 W and 162 W on the Asus Strix Hero III G731GV and Razer Blade Pro 17, respectively, each with the same RTX 2060 GPU. The higher consumption correlates somewhat to the higher-than-average 3DMark scores above.
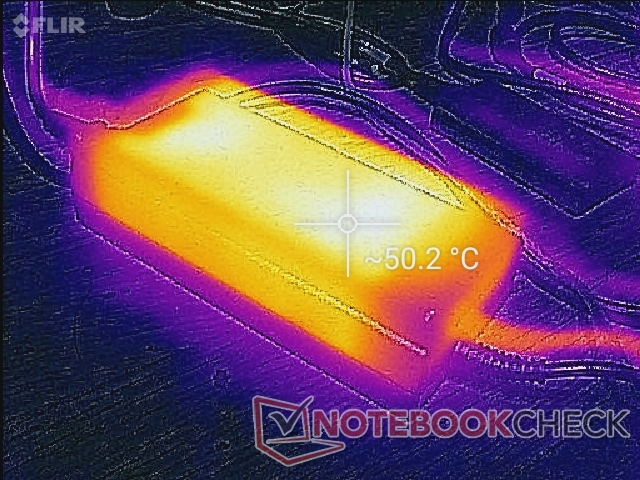
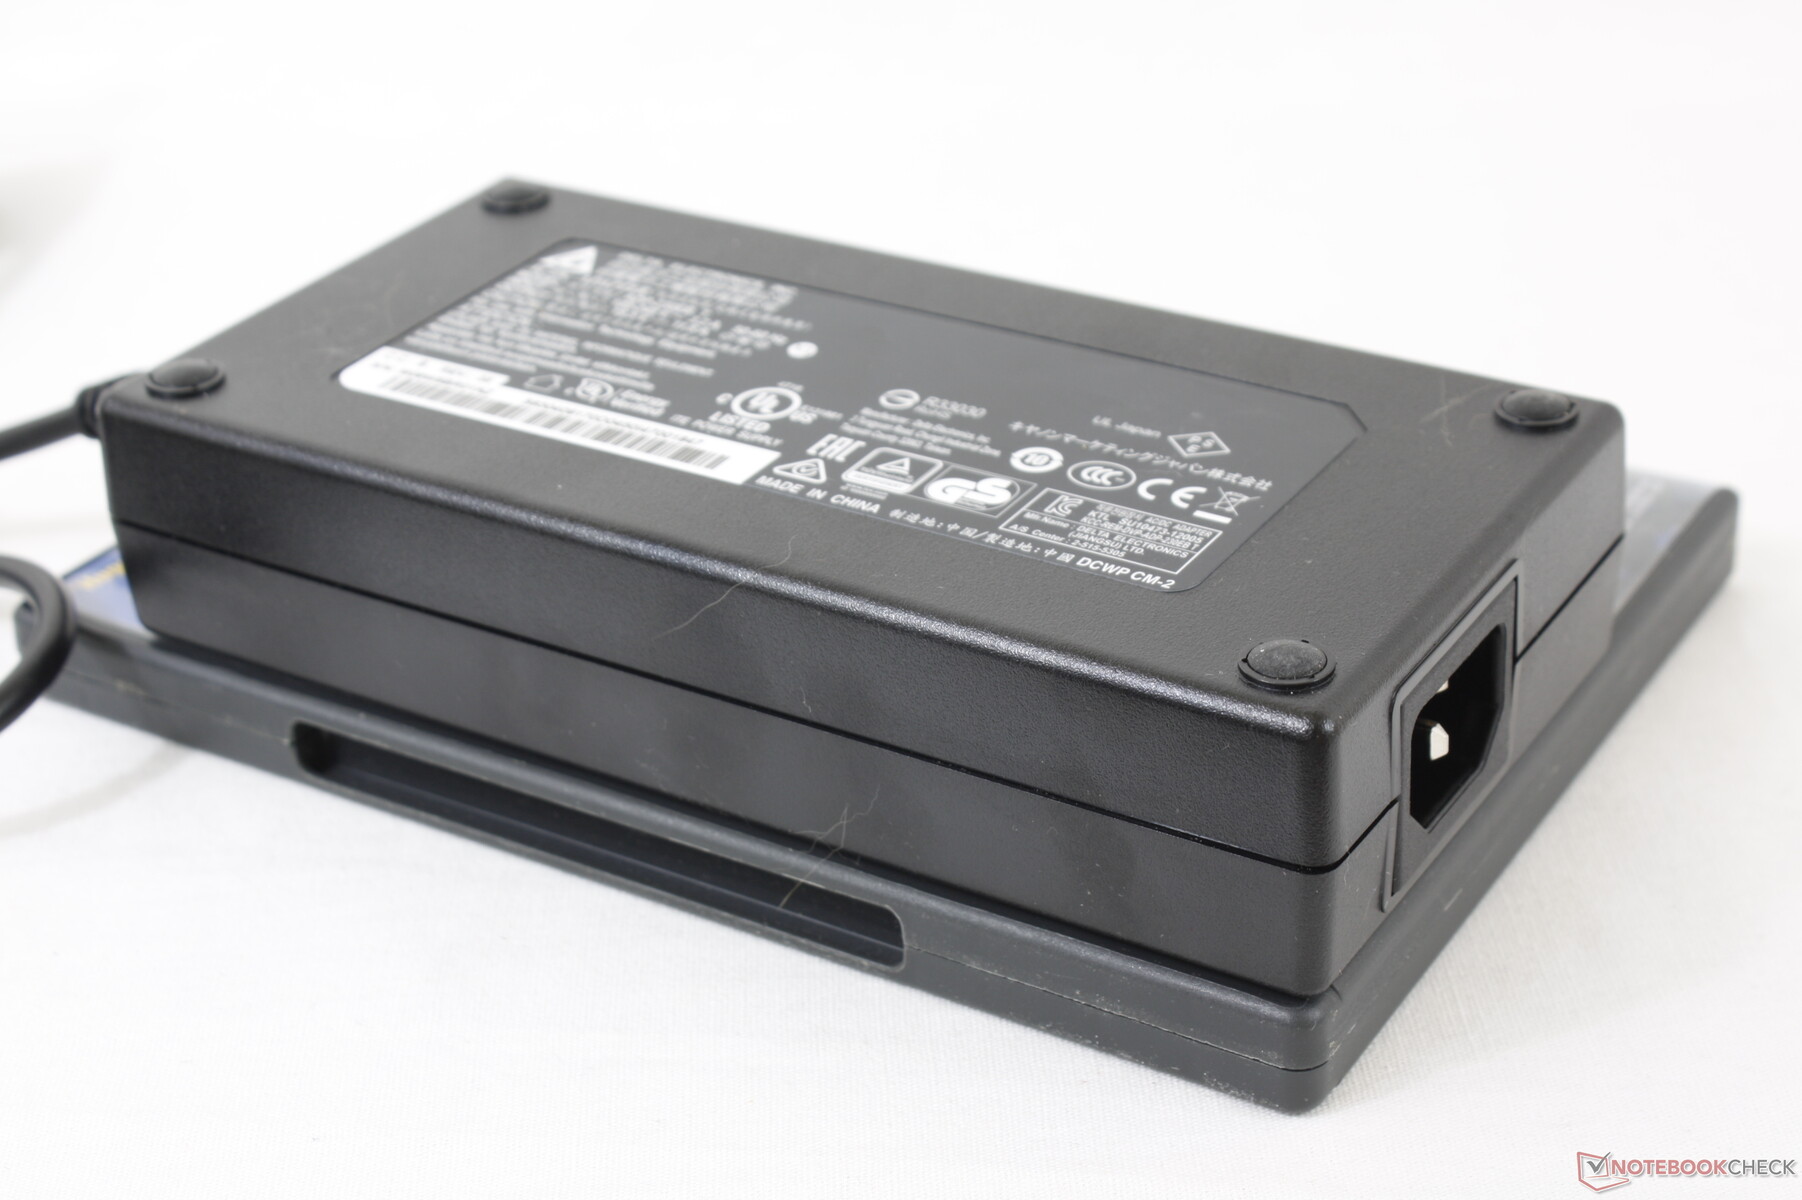
We're able to measure a maximum of 238 W from the relatively large ~(18 x 8.5 x 3.5 cm) 280 W AC adapter when running both Prime95 and FurMark simultaneously.
| Off / Standby | |
| Idle | |
| Load |
|
Key:
min: | |
| MSI GE75 Raider 10SE-008US i7-10750H, GeForce RTX 2060 Mobile, Samsung SSD PM981 MZVLB512HAJQ, IPS, 1920x1080, 17.3" | MSI GS75 Stealth 9SG i7-9750H, GeForce RTX 2080 Max-Q, 2x Samsung SSD PM981 MZVLB1T0HALR (RAID 0), IPS, 1920x1080, 17.3" | Asus Strix Hero III G731GV i7-9750H, GeForce RTX 2060 Mobile, Intel SSD 660p SSDPEKNW512G8, IPS, 1920x1080, 17.3" | Lenovo Legion Y740-17IRH i7-9750H, GeForce RTX 2060 Mobile, WDC PC SN520 SDAPMUW-128G, IPS, 1920x1080, 17.3" | Razer Blade Pro 17 RTX 2060 i7-9750H, GeForce RTX 2060 Mobile, Samsung SSD PM981 MZVLB512HAJQ, IPS, 1920x1080, 17.3" | Aorus 17G XB i7-10875H, GeForce RTX 2070 Super Max-Q, Samsung SSD PM981a MZVLB512HBJQ, IPS, 1920x1080, 17.3" | |
|---|---|---|---|---|---|---|
| Power Consumption | 8% | -7% | 2% | -1% | -15% | |
| Idle Minimum * (Watt) | 14.7 | 13 12% | 16.2 -10% | 20 -36% | 16 -9% | 20 -36% |
| Idle Average * (Watt) | 20.4 | 17 17% | 24.8 -22% | 21 -3% | 21.7 -6% | 23 -13% |
| Idle Maximum * (Watt) | 26.9 | 25 7% | 28.6 -6% | 26 3% | 26.1 3% | 38 -41% |
| Load Average * (Watt) | 93.2 | 96 -3% | 127.6 -37% | 97 -4% | 105.6 -13% | 105 -13% |
| Witcher 3 ultra * (Watt) | 185.4 | 156 16% | 147.1 21% | 139 25% | 161.8 13% | 158 15% |
| Load Maximum * (Watt) | 237.8 | 239 -1% | 212.7 11% | 168 29% | 225.3 5% | 243 -2% |
* ... smaller is better
Battery Life
Runtimes have not improved. We recorded just under 4 hours of real-world WLAN use to be almost identical to what we recorded on the older MSI GE75 8SF.
The system cannot be recharged via USB-C unlike on the latest Razer Blade Pro 17.
| MSI GE75 Raider 10SE-008US i7-10750H, GeForce RTX 2060 Mobile, 65 Wh | MSI GS75 Stealth 9SG i7-9750H, GeForce RTX 2080 Max-Q, 80.25 Wh | Asus Strix Hero III G731GV i7-9750H, GeForce RTX 2060 Mobile, 66 Wh | Lenovo Legion Y740-17IRH i7-9750H, GeForce RTX 2060 Mobile, 76 Wh | Razer Blade Pro 17 RTX 2060 i7-9750H, GeForce RTX 2060 Mobile, 70 Wh | Aorus 17G XB i7-10875H, GeForce RTX 2070 Super Max-Q, 94 Wh | |
|---|---|---|---|---|---|---|
| Battery runtime | 62% | 22% | 16% | 22% | 103% | |
| WiFi v1.3 (h) | 3.7 | 6 62% | 4.5 22% | 4.3 16% | 4.5 22% | 7.5 103% |
| Reader / Idle (h) | 7.7 | 6.9 | 10 | |||
| Load (h) | 1.2 | 1.1 | 2.2 |
Pros
Cons
Verdict
The GE75 10SE faces the same advantages and disadvantages as the older 2018 and 2019 models. Fan noise in particular when gaming is not any quieter, but core temperatures are generally cooler with faster overall performance than other gaming laptops equipped with the same CPU or GPU. If you want the most out of the Core i7-10875H or GeForce RTX 2060, then it helps to go with a thicker chassis like the GE75 rather than a thinner alternative.
After three years of the same design, however, some aspects are starting to show their age. The bottom bezel is relatively thick, there is no webcam shutter or Thunderbolt 3 support, and the uneven backlight bleeding is a huge bummer. Instead of going thinner for the inevitable redesign, we would love to see a decrease in fan noise while maintaining the same above-average performance level. Users on tighter budgets can still purchase the Coffee Lake-H-powered 2019 GE75 series for almost the same gaming performance as our Comet Lake-H-powered GE75.
The MSI GE75 series has proven its versatility across three generation of Intel H-series CPUs. Performance remains top notch due to the capable cooling solution within, but other aspects like fan noise and other physical features could be improved upon.
MSI GE75 Raider 10SE-008US
- 07/02/2020 v7 (old)
Allen Ngo
Price comparison
