MSI Prestige 14 A10SC-009 laptop review: Comet Lake for content creators

We were already able to get an idea of the MSI Prestige 14 configuration variant that we now have available in a hands-on in September 2019. Our rating is no longer as effusive as it was then, since particularly the performance of the Intel Core i7-10710U is a little lower. With 16 GB of RAM, a 1 TB SSD and Nvidia's GeForce GTX 1650 Max-Q GPU, the performance is still very good.
In this review, we compare the MSI Prestige 14 with the competing devices listed below. You can also add more laptops from our database for comparison under each table.
Rating | Date | Model | Weight | Height | Size | Resolution | Price |
|---|---|---|---|---|---|---|---|
| 84.2 % v7 (old) | 02 / 2020 | MSI Prestige 14 A10SC-009 i7-10710U, GeForce GTX 1650 Max-Q | 1.3 kg | 16 mm | 14.00" | 3840x2160 | |
| 85.2 % v7 (old) | 11 / 2019 | MSI Prestige 15 A10SC i7-10710U, GeForce GTX 1650 Max-Q | 1.7 kg | 16 mm | 15.60" | 3840x2160 | |
| 83.7 % v7 (old) | 11 / 2019 | Razer Blade Stealth 13, Core i7-1065G7 i7-1065G7, GeForce GTX 1650 Max-Q | 1.5 kg | 15.3 mm | 13.30" | 3840x2160 | |
| 83.1 % v7 (old) | 09 / 2019 | Asus ZenBook 15 UX534FT-DB77 i7-8565U, GeForce GTX 1650 Max-Q | 1.7 kg | 18.9 mm | 15.60" | 1920x1080 | |
| 80.8 % v7 (old) | 10 / 2019 | HP ZBook 15u G6 6TP54EA i7-8565U, Radeon Pro WX 3200 | 1.6 kg | 19 mm | 15.60" | 3840x2160 |
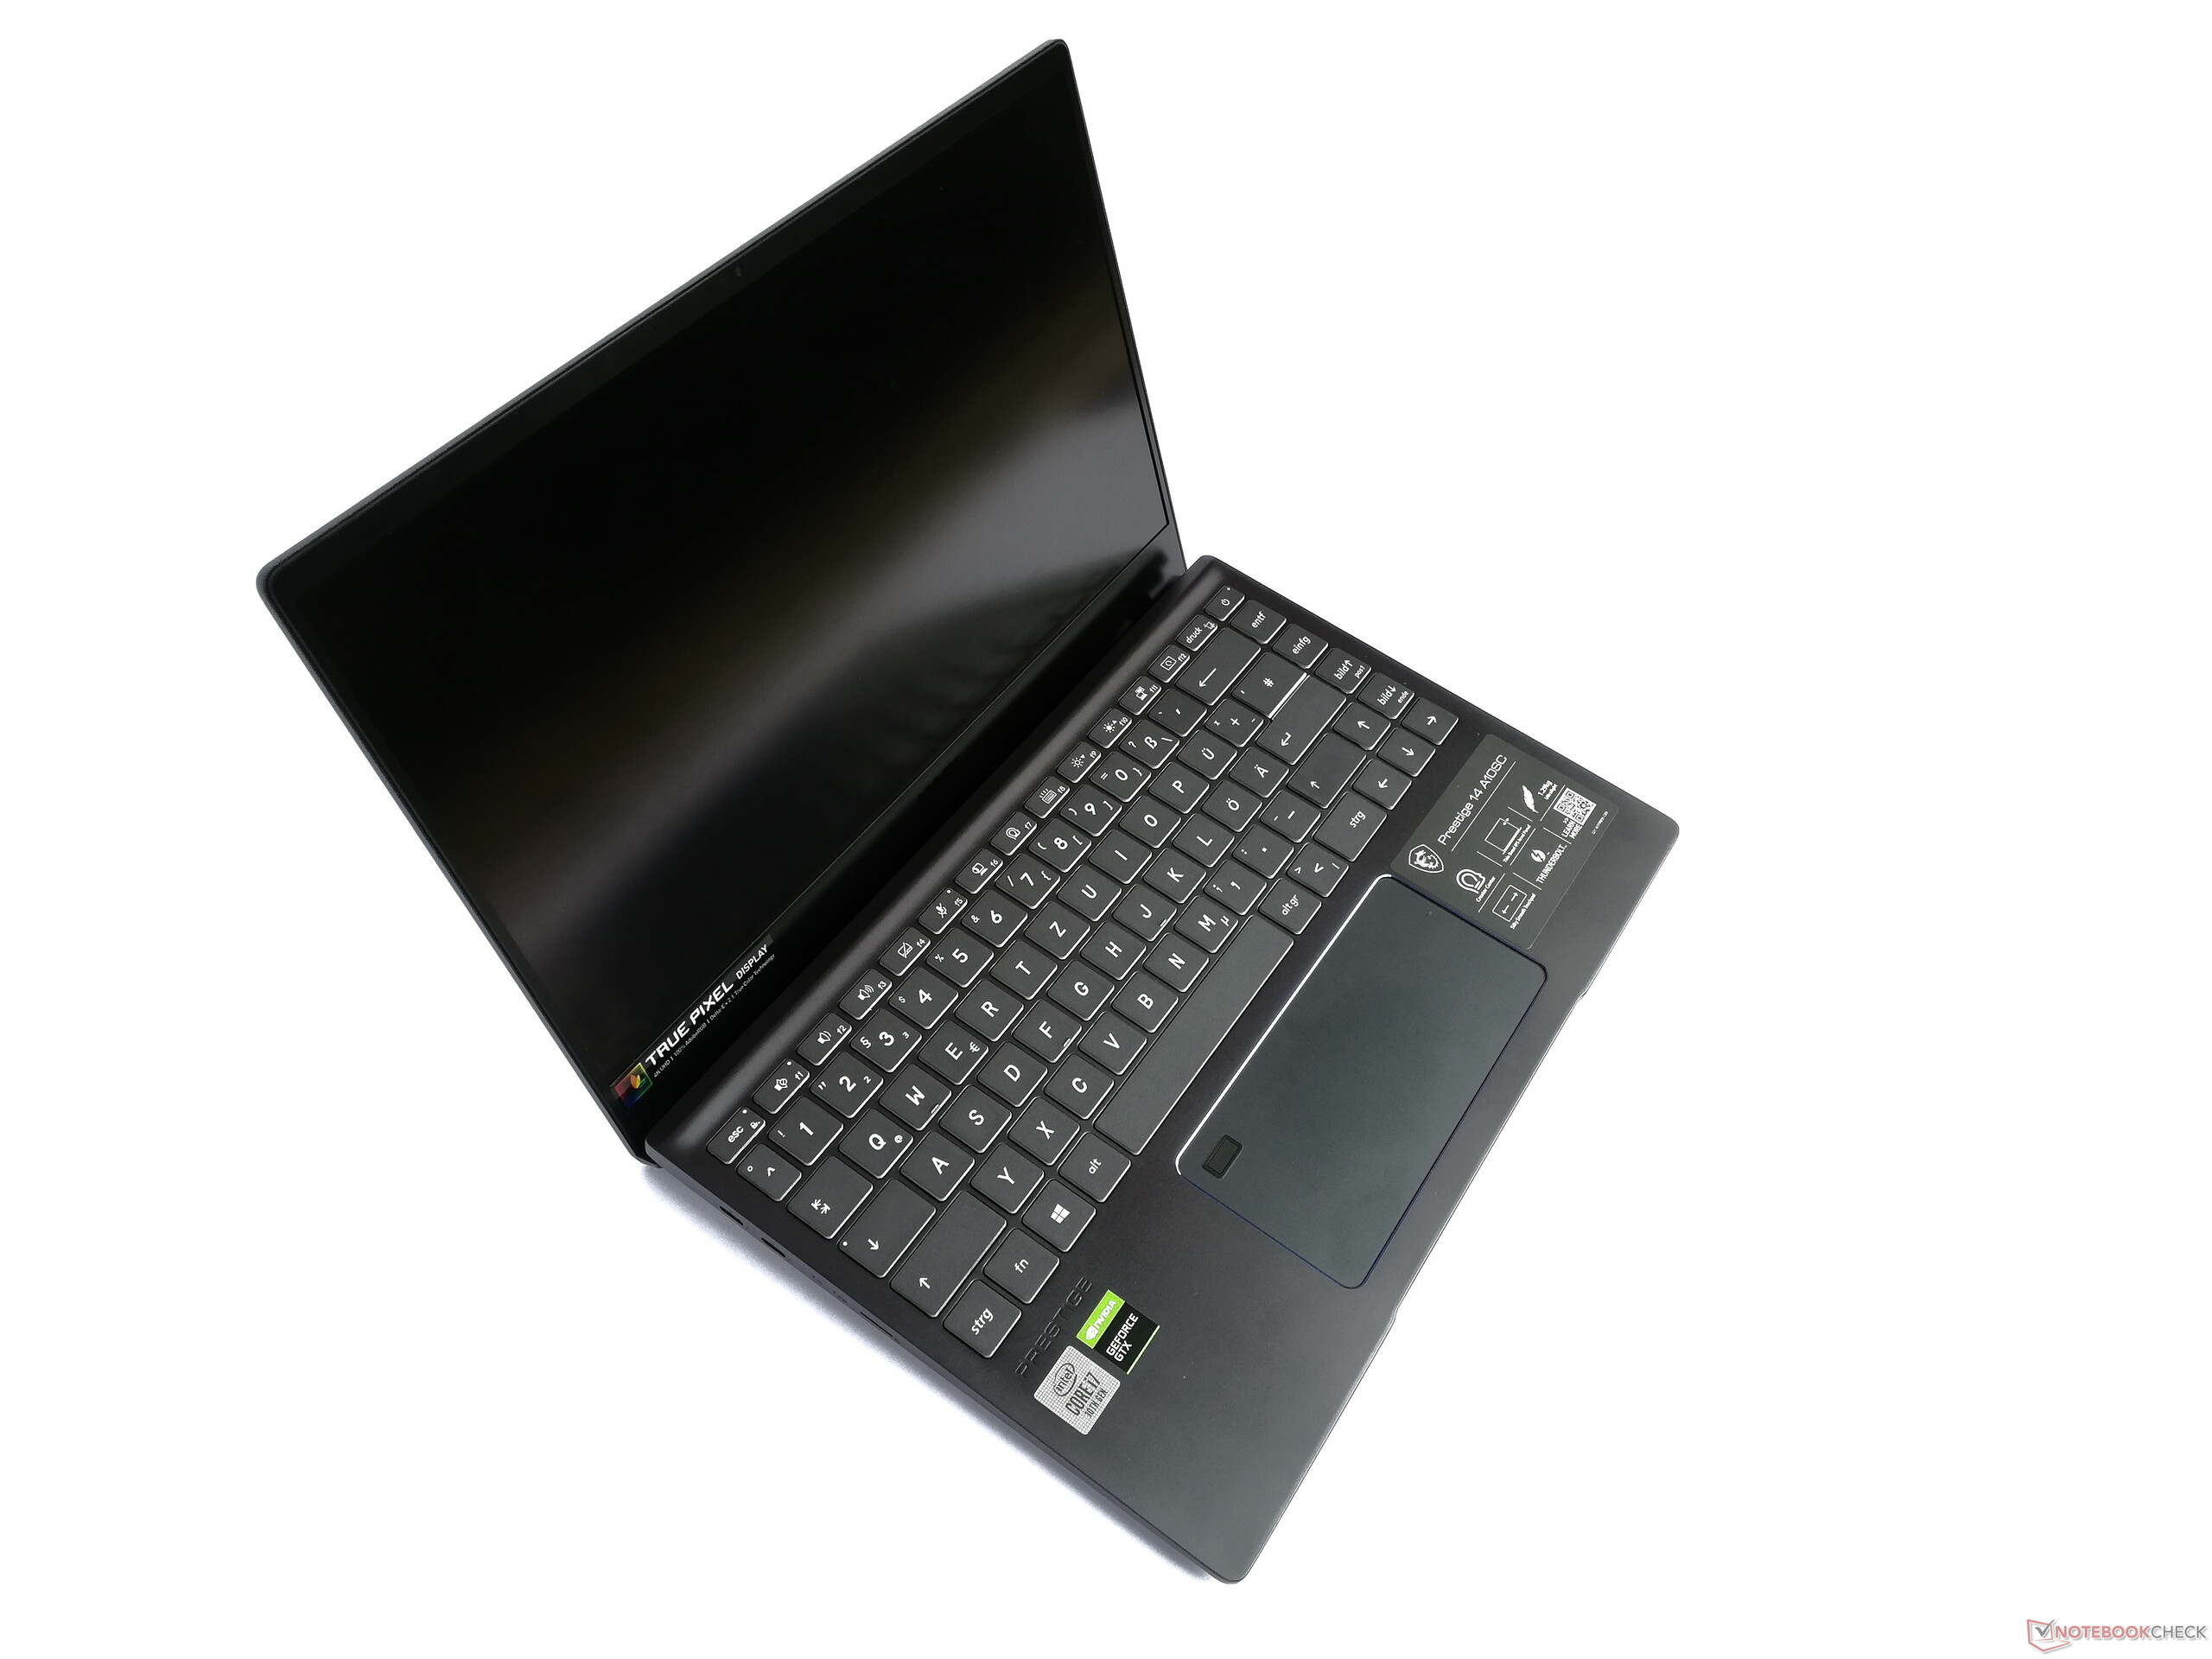
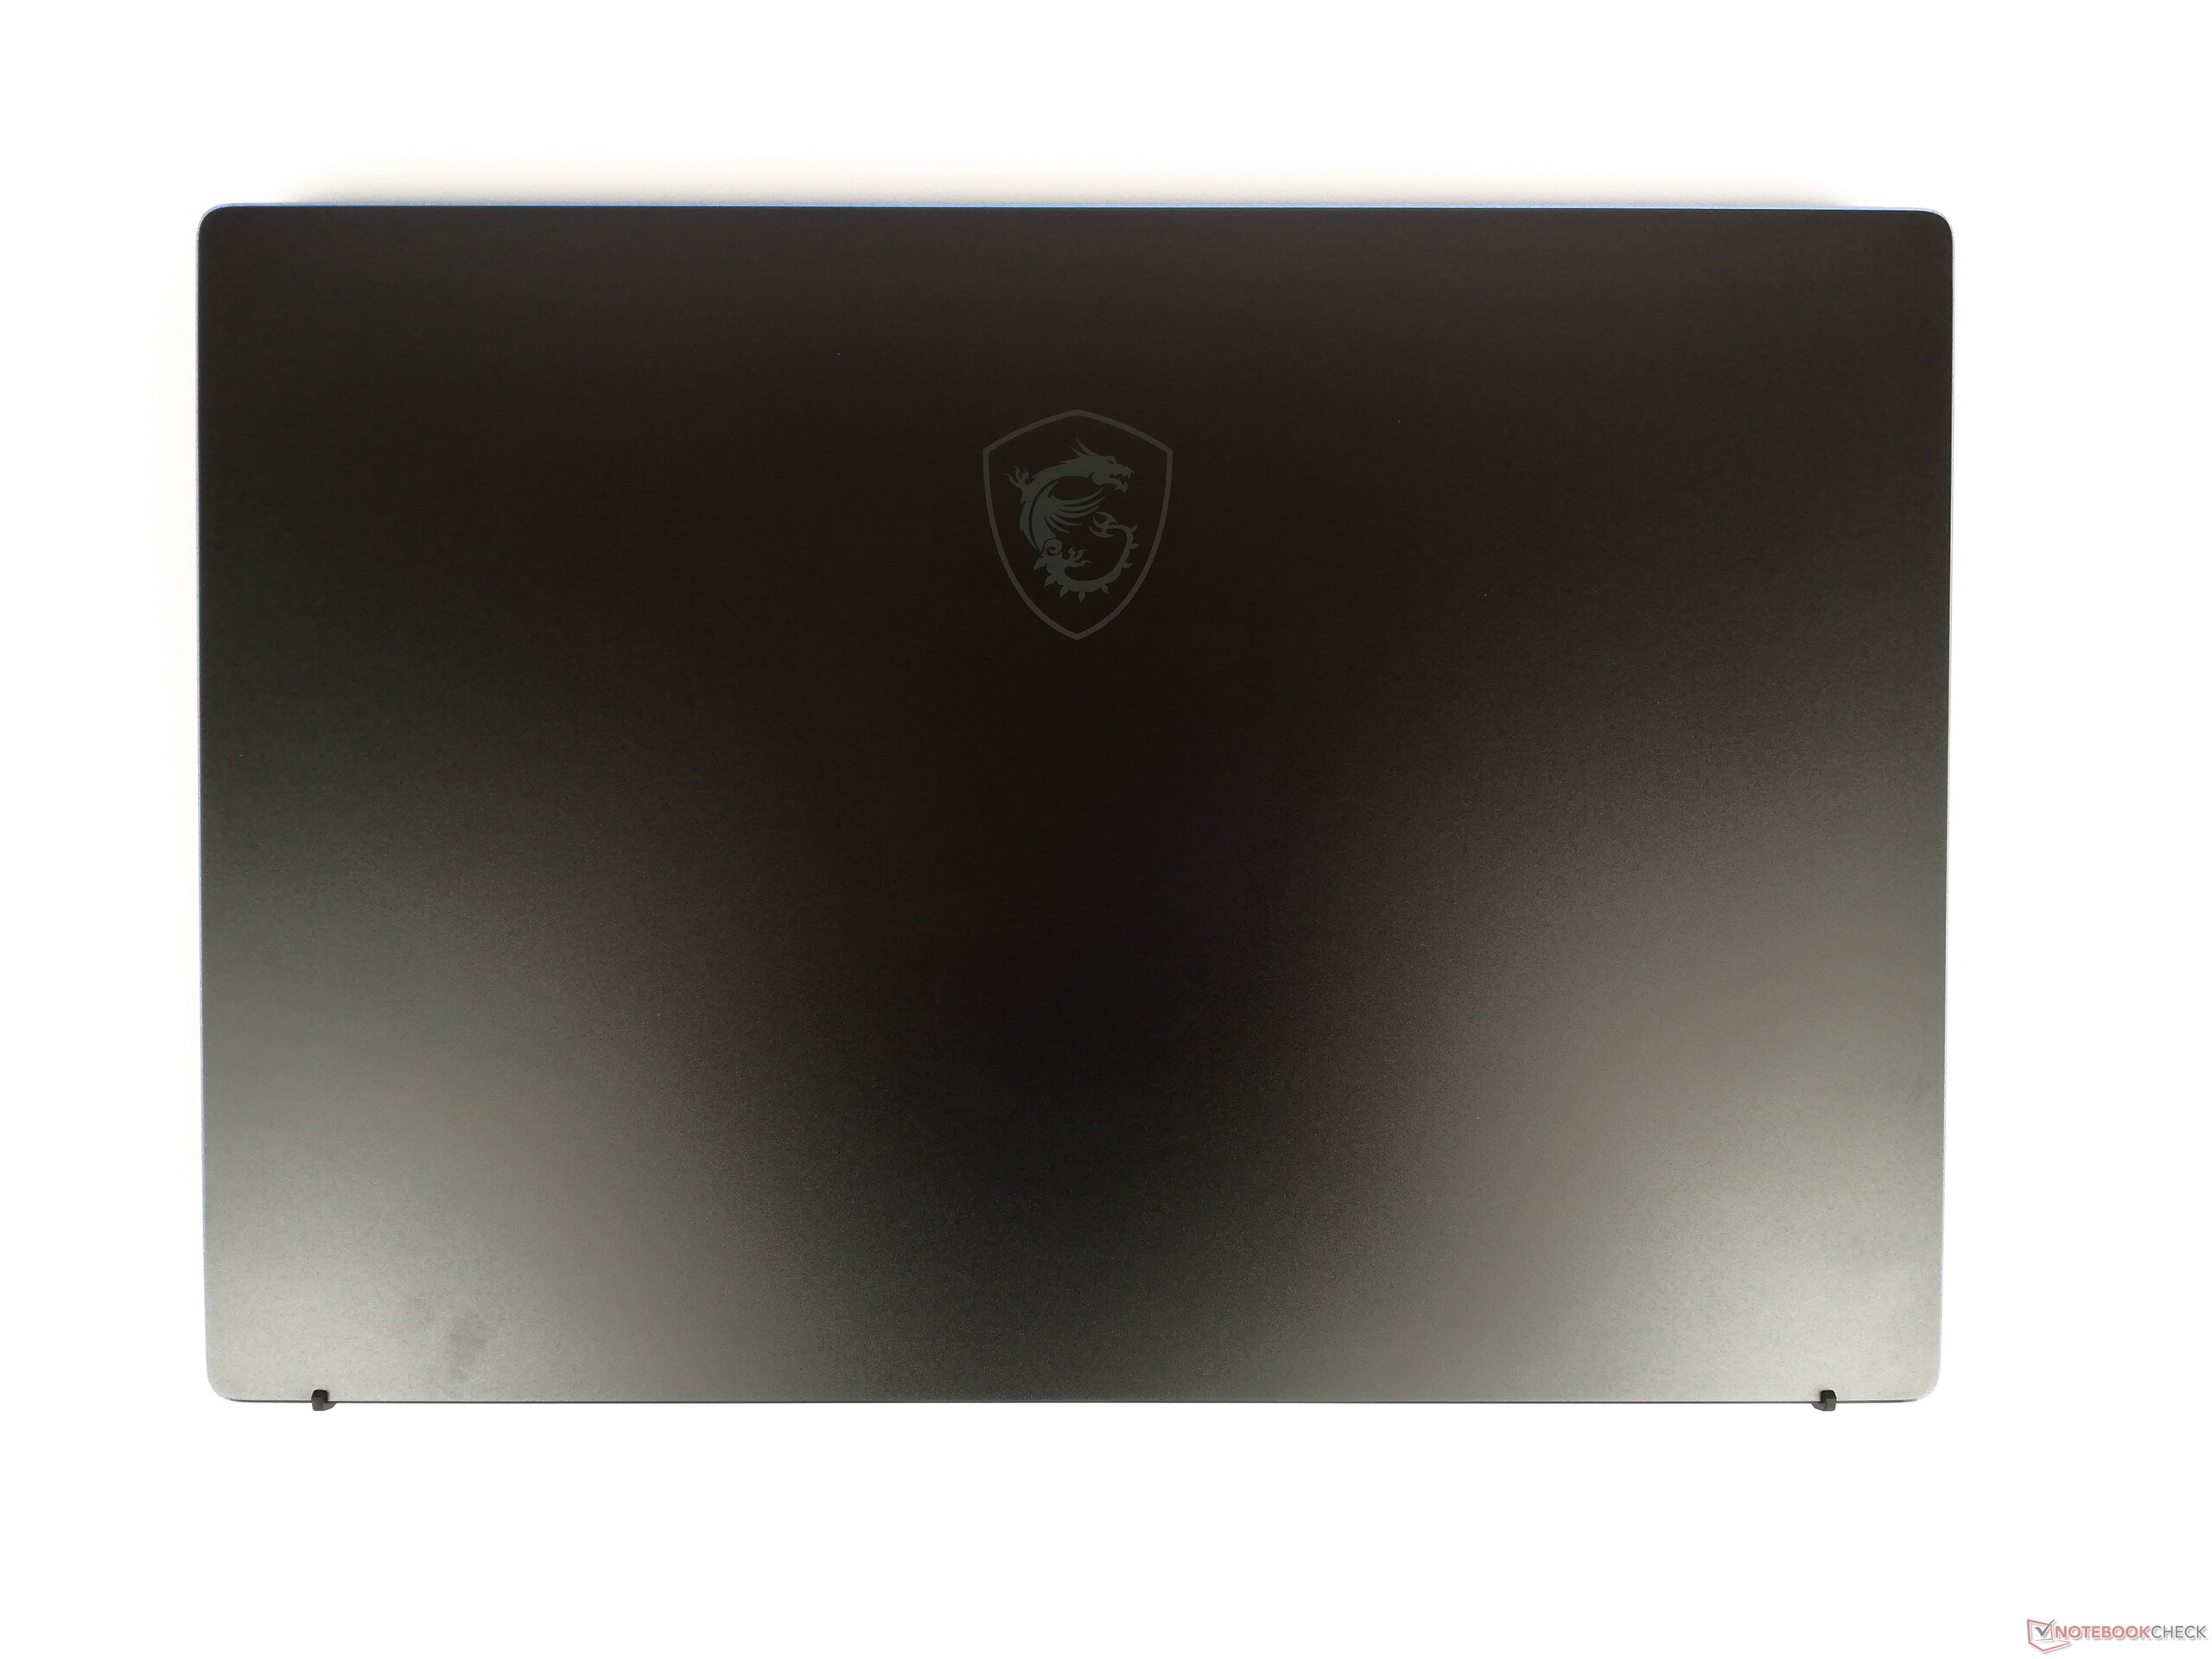
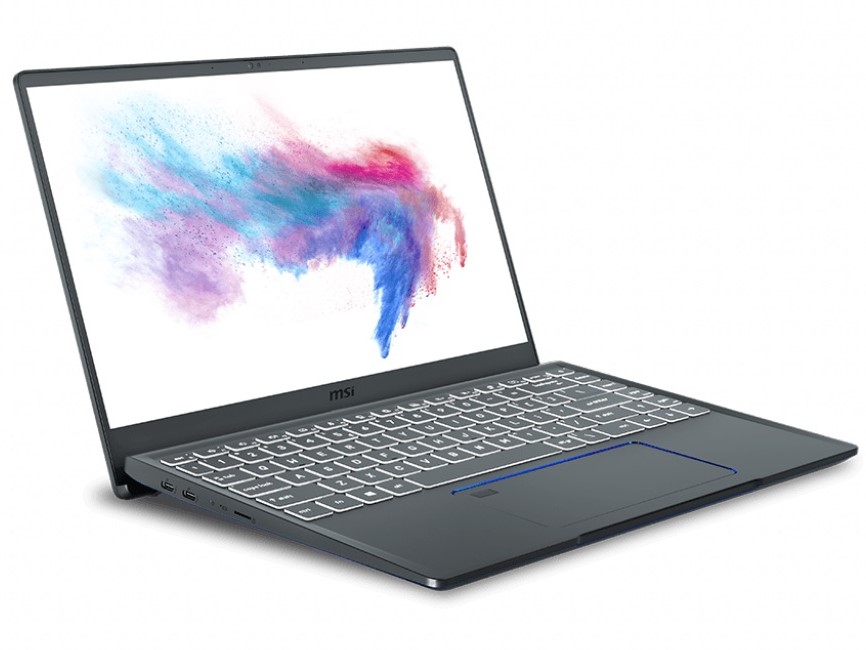
Case - Slim 14-inch laptop
MSI has manufactured the case of the Prestige 14 from metal, and in addition to the "Carbon Grey" color variant shown here which has polished blue edges, it's also available in "Pure White" and "Rose Pink". The workmanship is of very high quality and no uneven gap dimensions or other defects can be detected. If the lid of the Prestige 14 is opened, the base unit lifts slightly at the back. This creates an angle that favors air circulation on flat surfaces, but the resulting edge also digs into your skin in a slightly unpleasant way when the small laptop is placed on the lap.
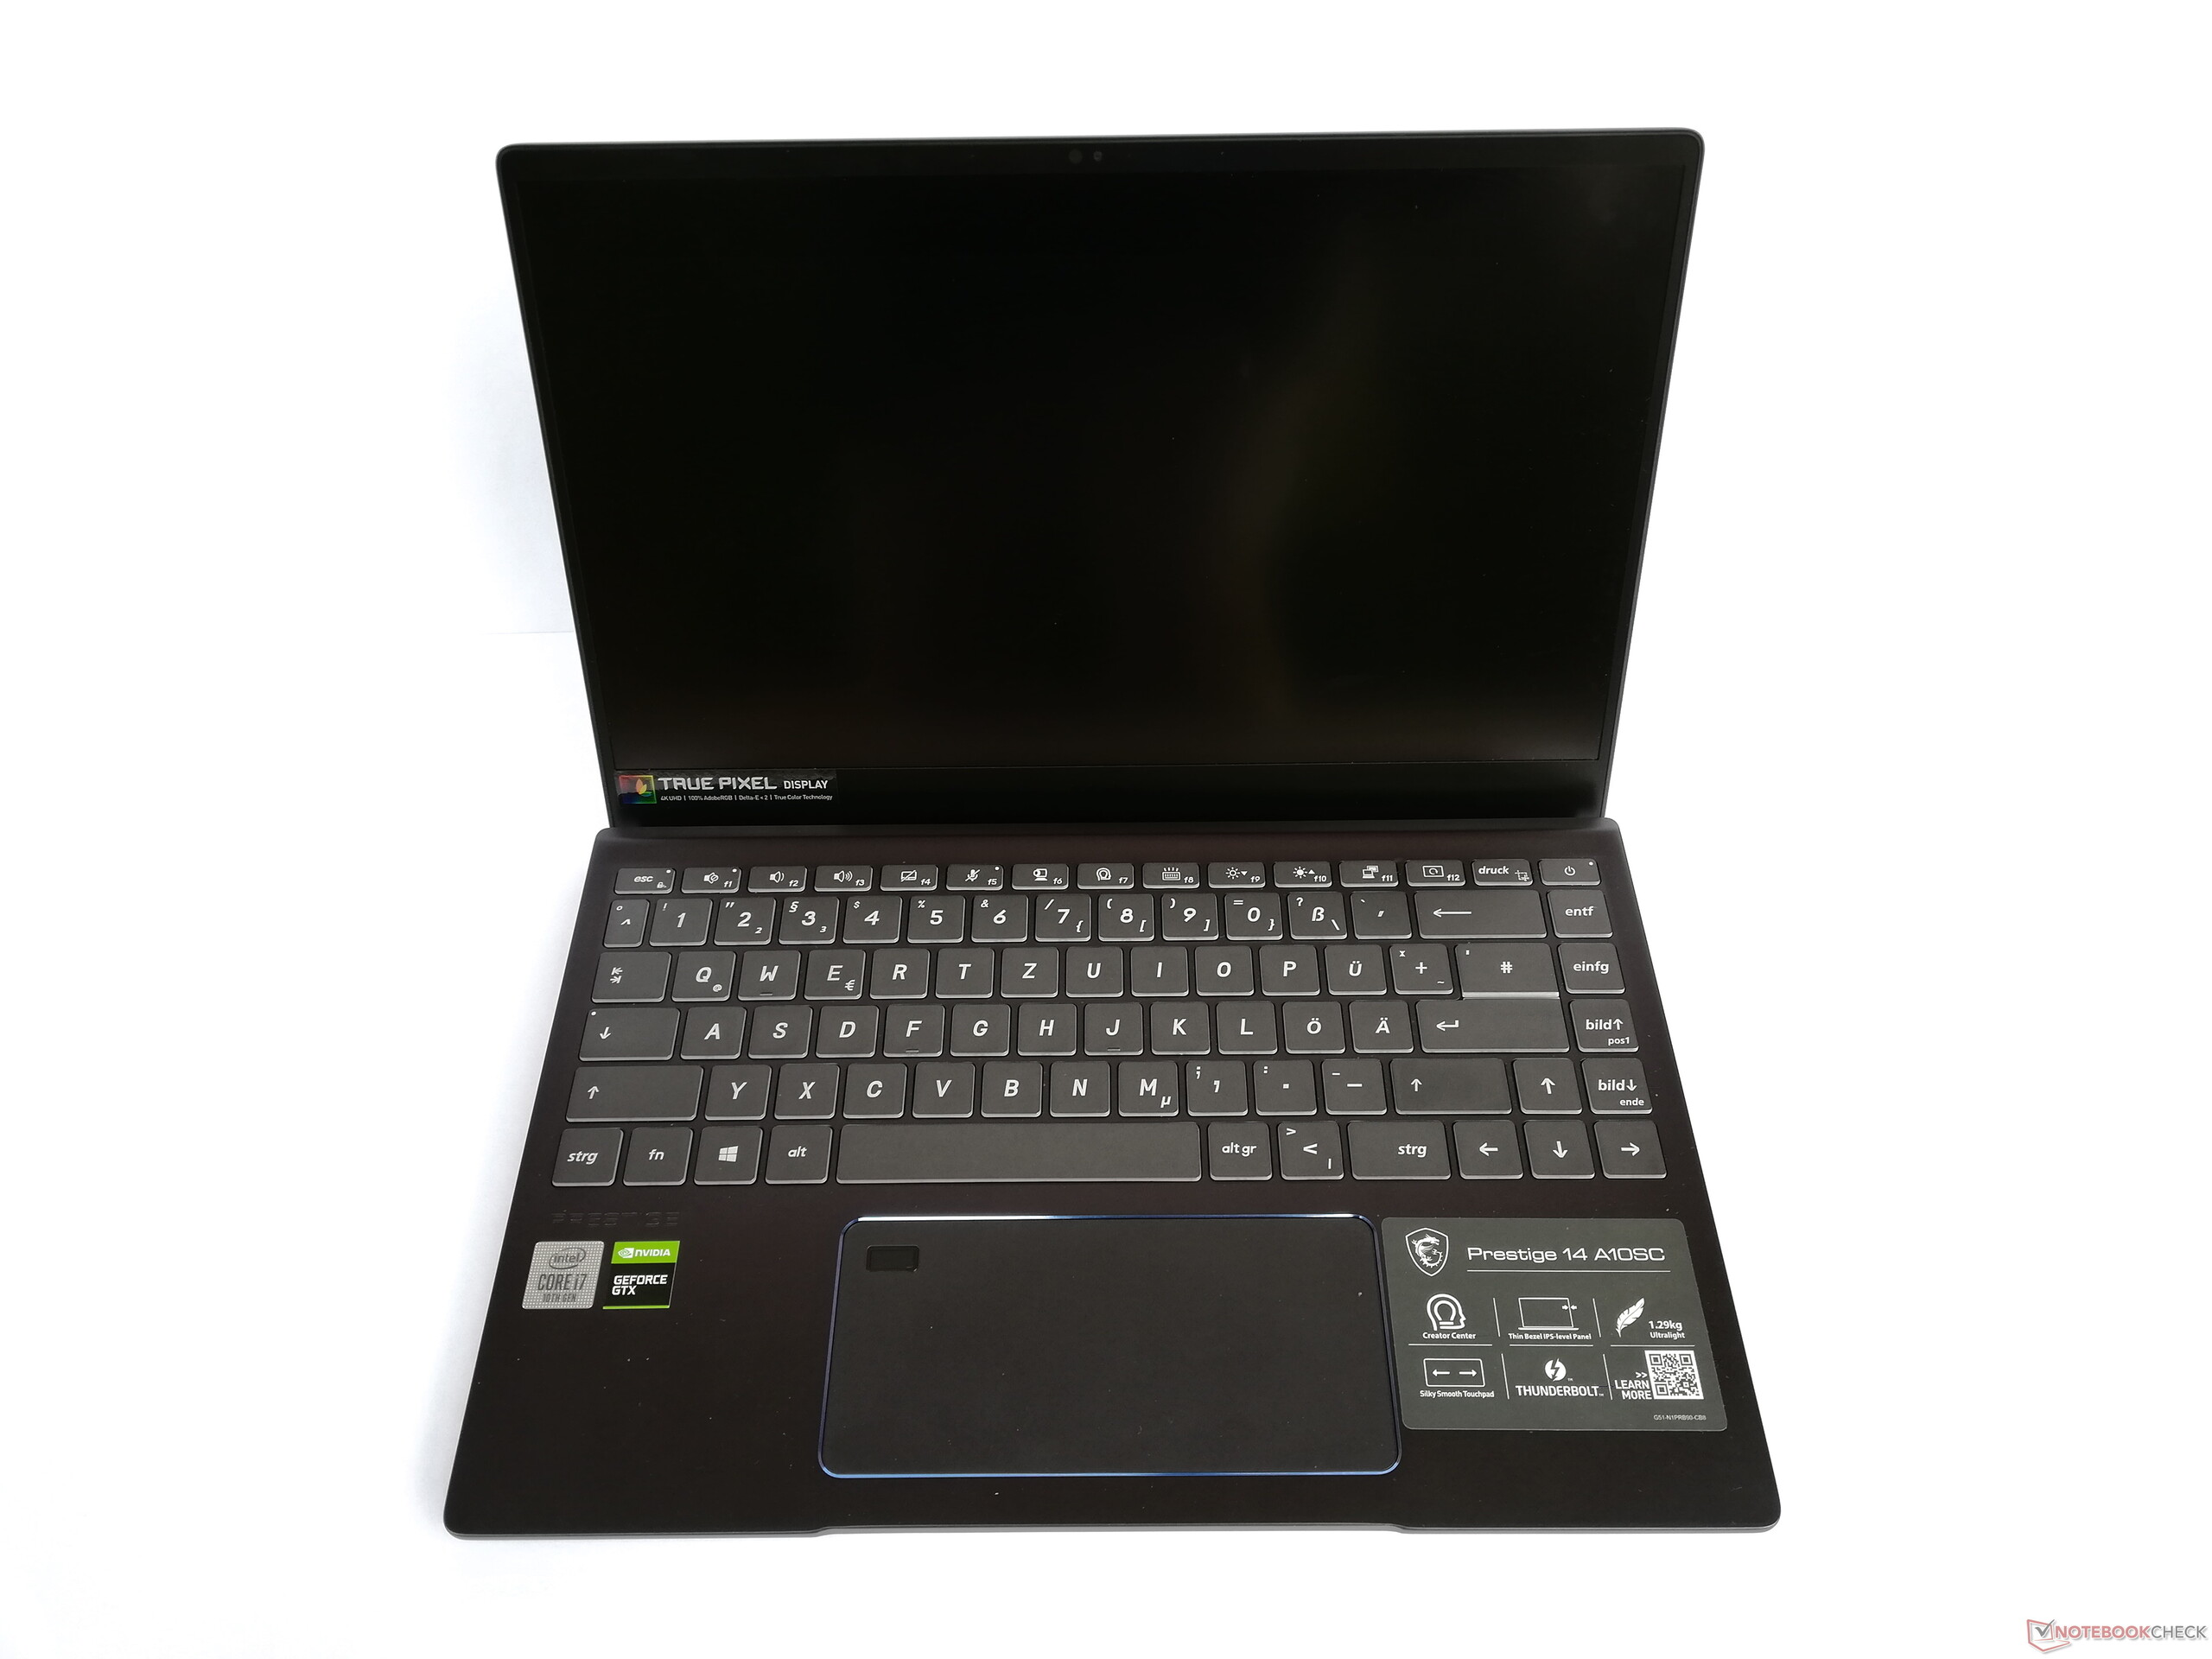


Weighing about 1,300 grams, the Prestige 14 is the lightest laptop in our test field. Due to the very narrow display bezel and the low height, the MSI laptop is also very slim and extremely compact.
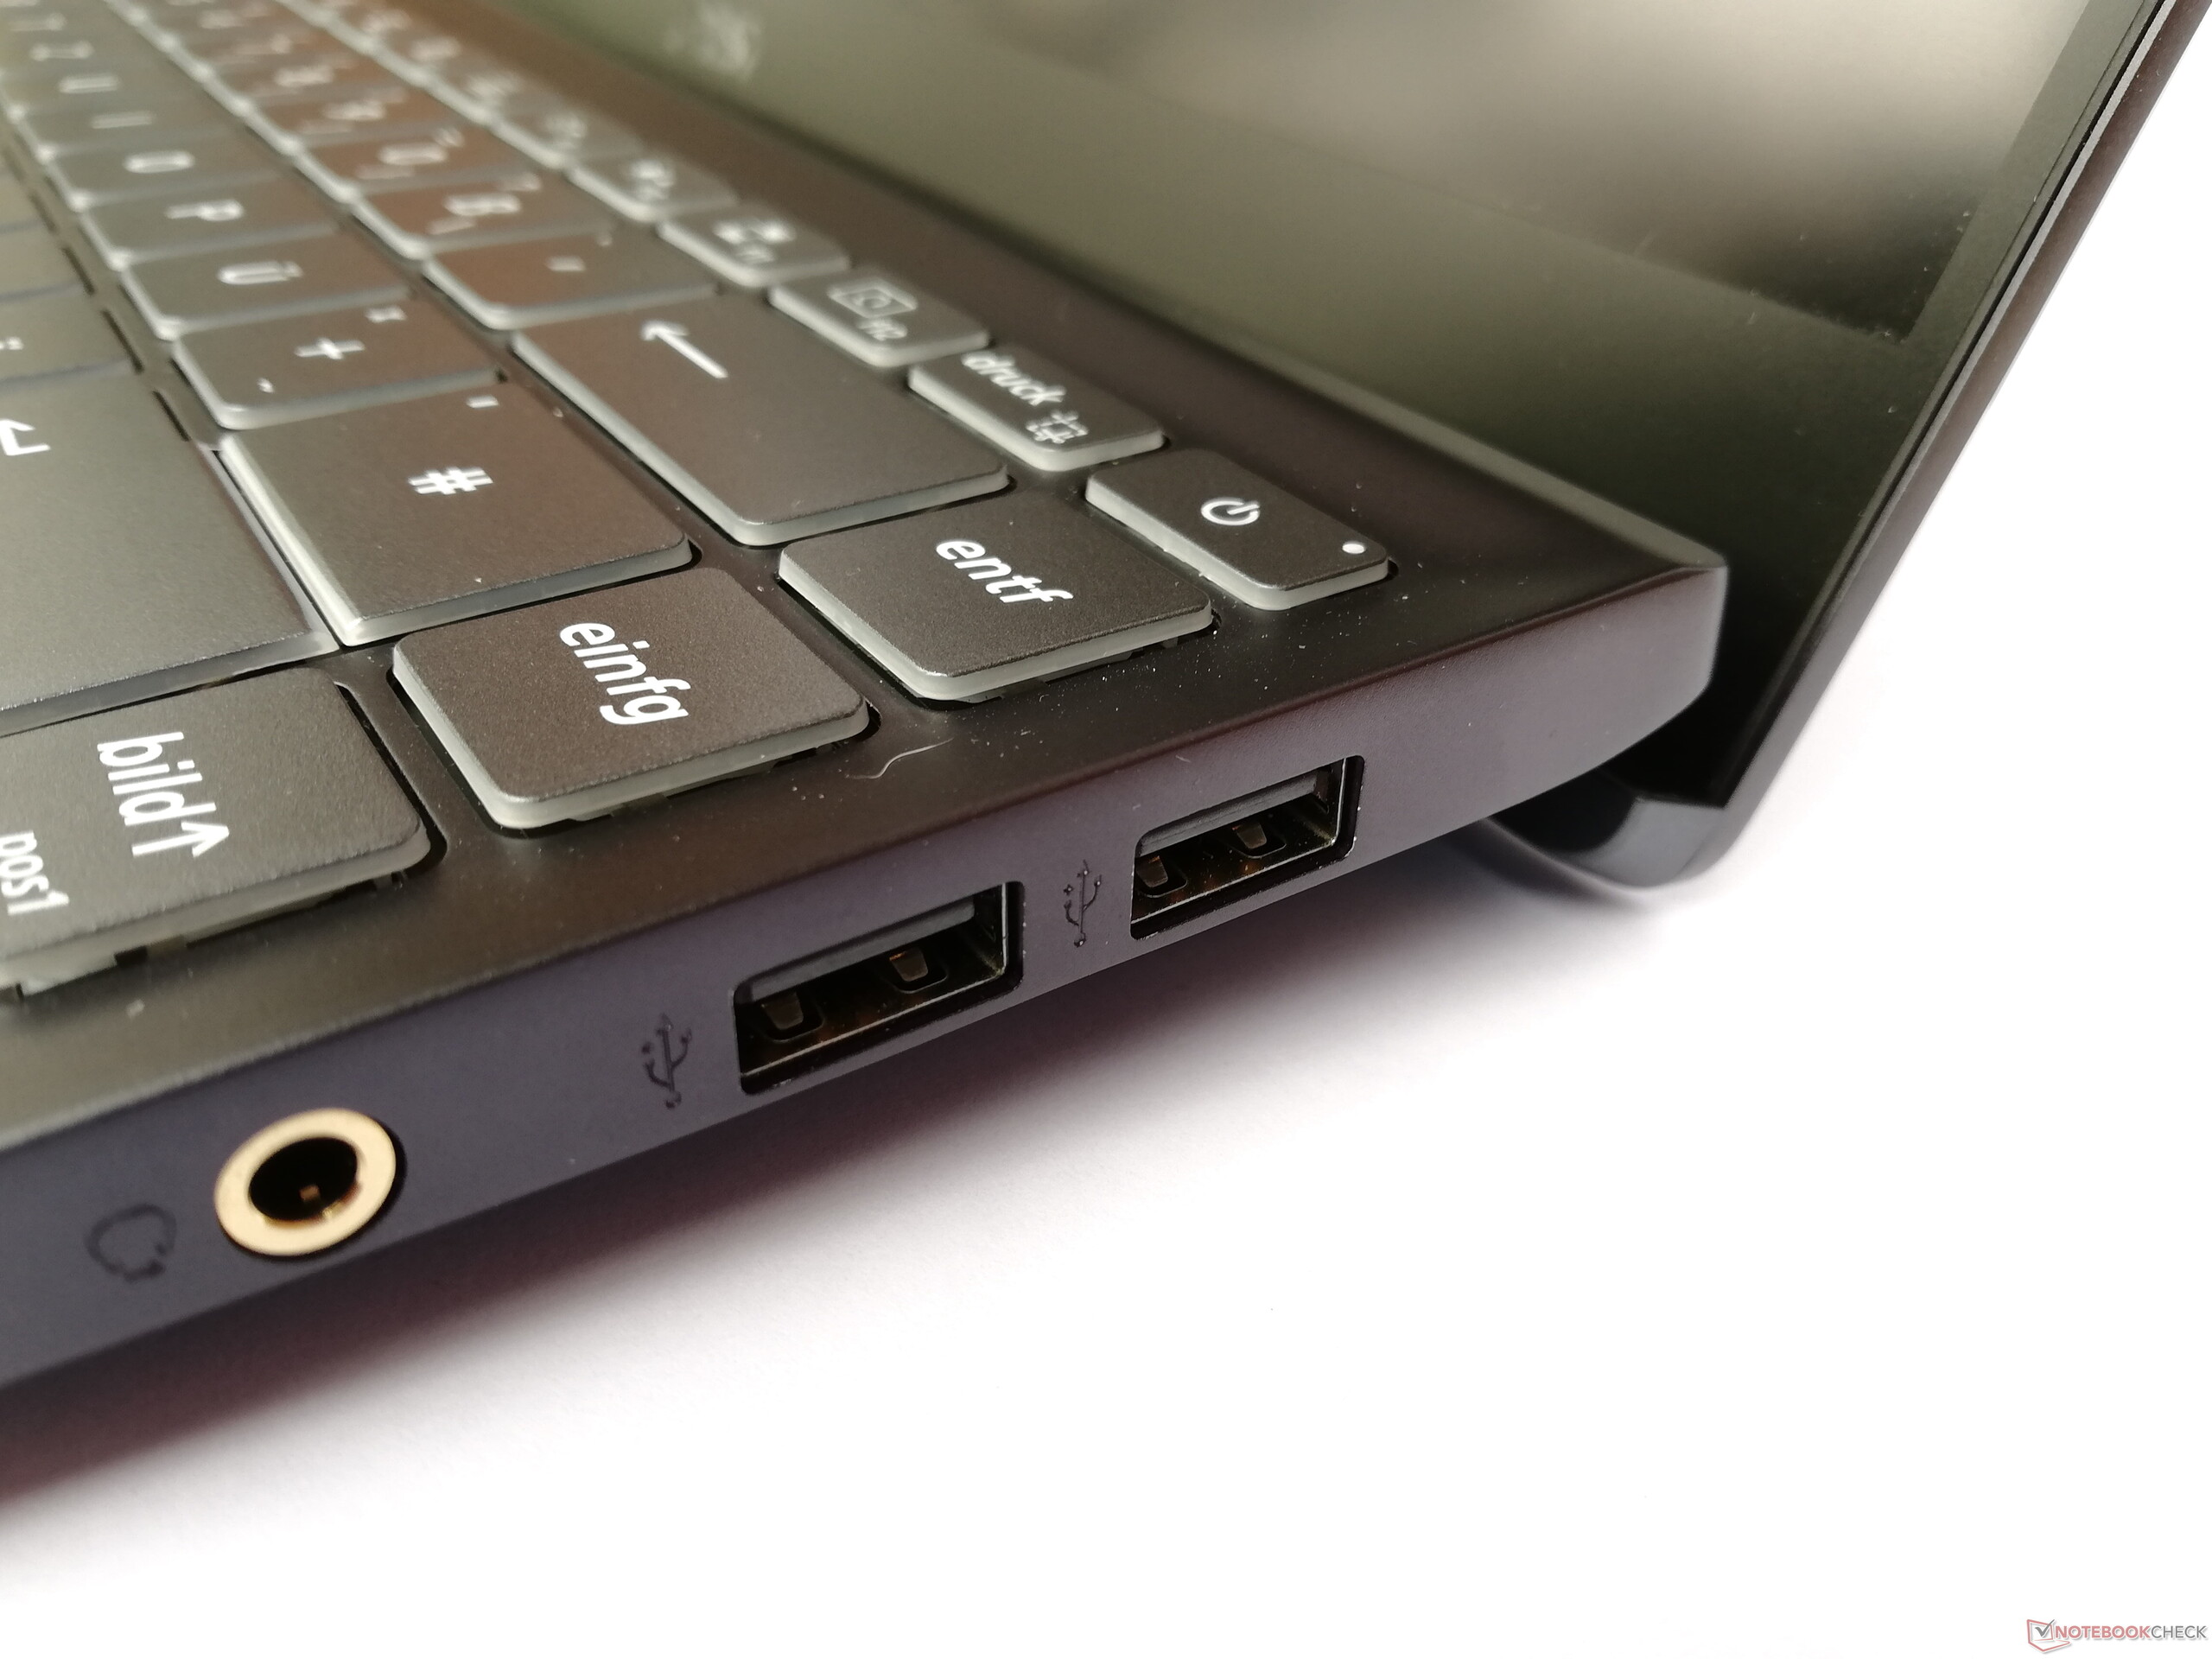
Connectivity - MSI laptop with two Thunderbolt ports
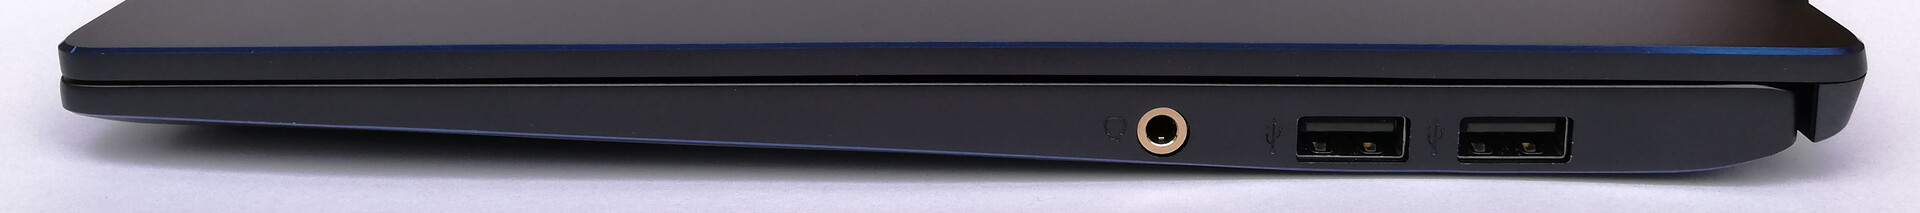
Without an adapter, the MSI Prestige 14 doesn't do much more. Although there are two Thunderbolt 3 ports, one of them is required for the power adapter, which can be used for charging on both ports. A direct monitor port, such as HDMI, has been completely forgone, and the two USB Type-A ports come only with USB 2.0 standard.
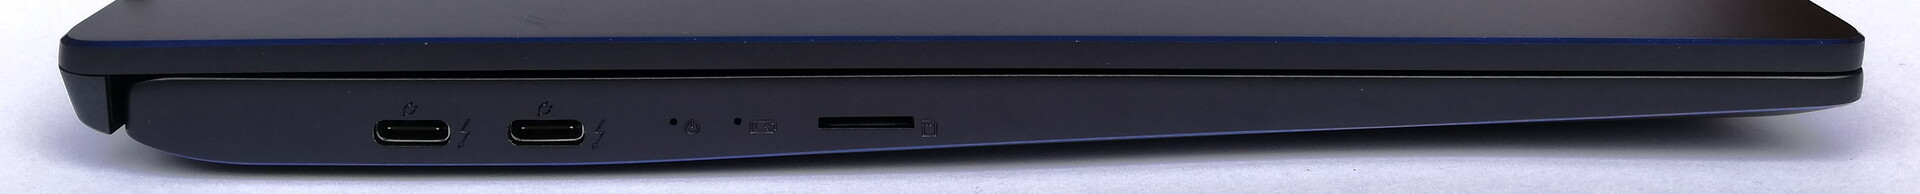
SD card reader
The MSI Prestige 14 has a memory card reader that accommodates microSD cards almost completely. Only an edge of about 2 millimeters sticks out, with which the spring mechanism for removing the card can be triggered well.
With our Toshiba Exceria Pro M501 microSDXC reference memory card, the card reader reaches 148.9 MB/s when copying and 176.5 MB/s when reading data. This result is well above the average of other devices we have tested.
| SD Card Reader | |
| average JPG Copy Test (av. of 3 runs) | |
| MSI Prestige 15 A10SC (Toshiba Exceria Pro M501 UHS-II) | |
| MSI Prestige 14 A10SC-009 (Toshiba Exceria Pro M501 microSDXC 64GB) | |
| Average of class Multimedia (23 - 531, n=43, last 2 years) | |
| Asus ZenBook 15 UX534FT-DB77 (Toshiba Exceria Pro SDXC 64 GB UHS-II) | |
| maximum AS SSD Seq Read Test (1GB) | |
| MSI Prestige 15 A10SC (Toshiba Exceria Pro M501 UHS-II) | |
| Average of class Multimedia (27.9 - 1455, n=42, last 2 years) | |
| MSI Prestige 14 A10SC-009 (Toshiba Exceria Pro M501 microSDXC 64GB) | |
| Asus ZenBook 15 UX534FT-DB77 (Toshiba Exceria Pro SDXC 64 GB UHS-II) | |
Communication
For wireless connections, Bluetooth 5.0 and Wi-Fi 6 with the fast 802.11ax standard are available to users of the Prestige 14. With our Netgear Nighthawk AX12 reference router, MSI's laptop reaches an average of 787 Mb/s for receiving and 640 Mb/s for sending data. Although these are very good values, the MSI Prestige 15 shows that the built-in WLAN module could be even faster.
Security
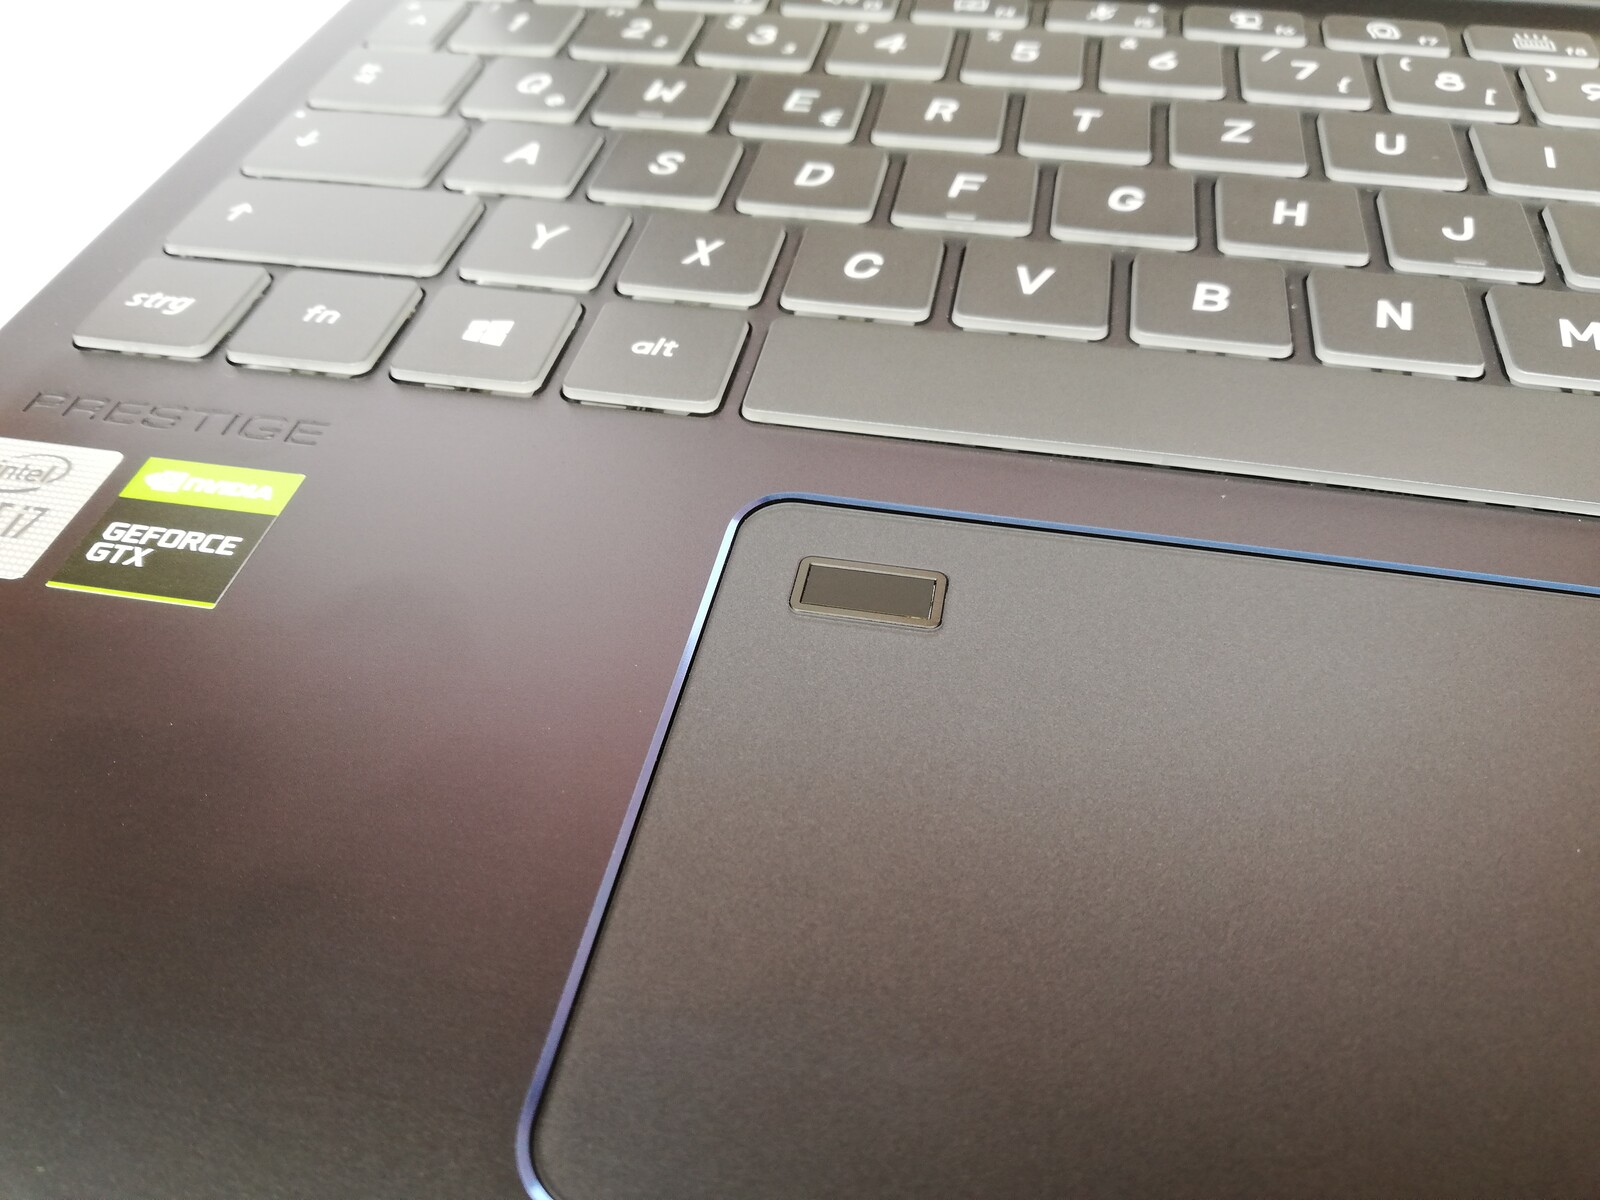
In addition to a TPM module, the MSI Prestige 14 also has a fingerprint scanner and supports facial recognition login via Windows Hello. The sensor responds very well to stored fingerprints and unlocks the system without delay.
Accessories
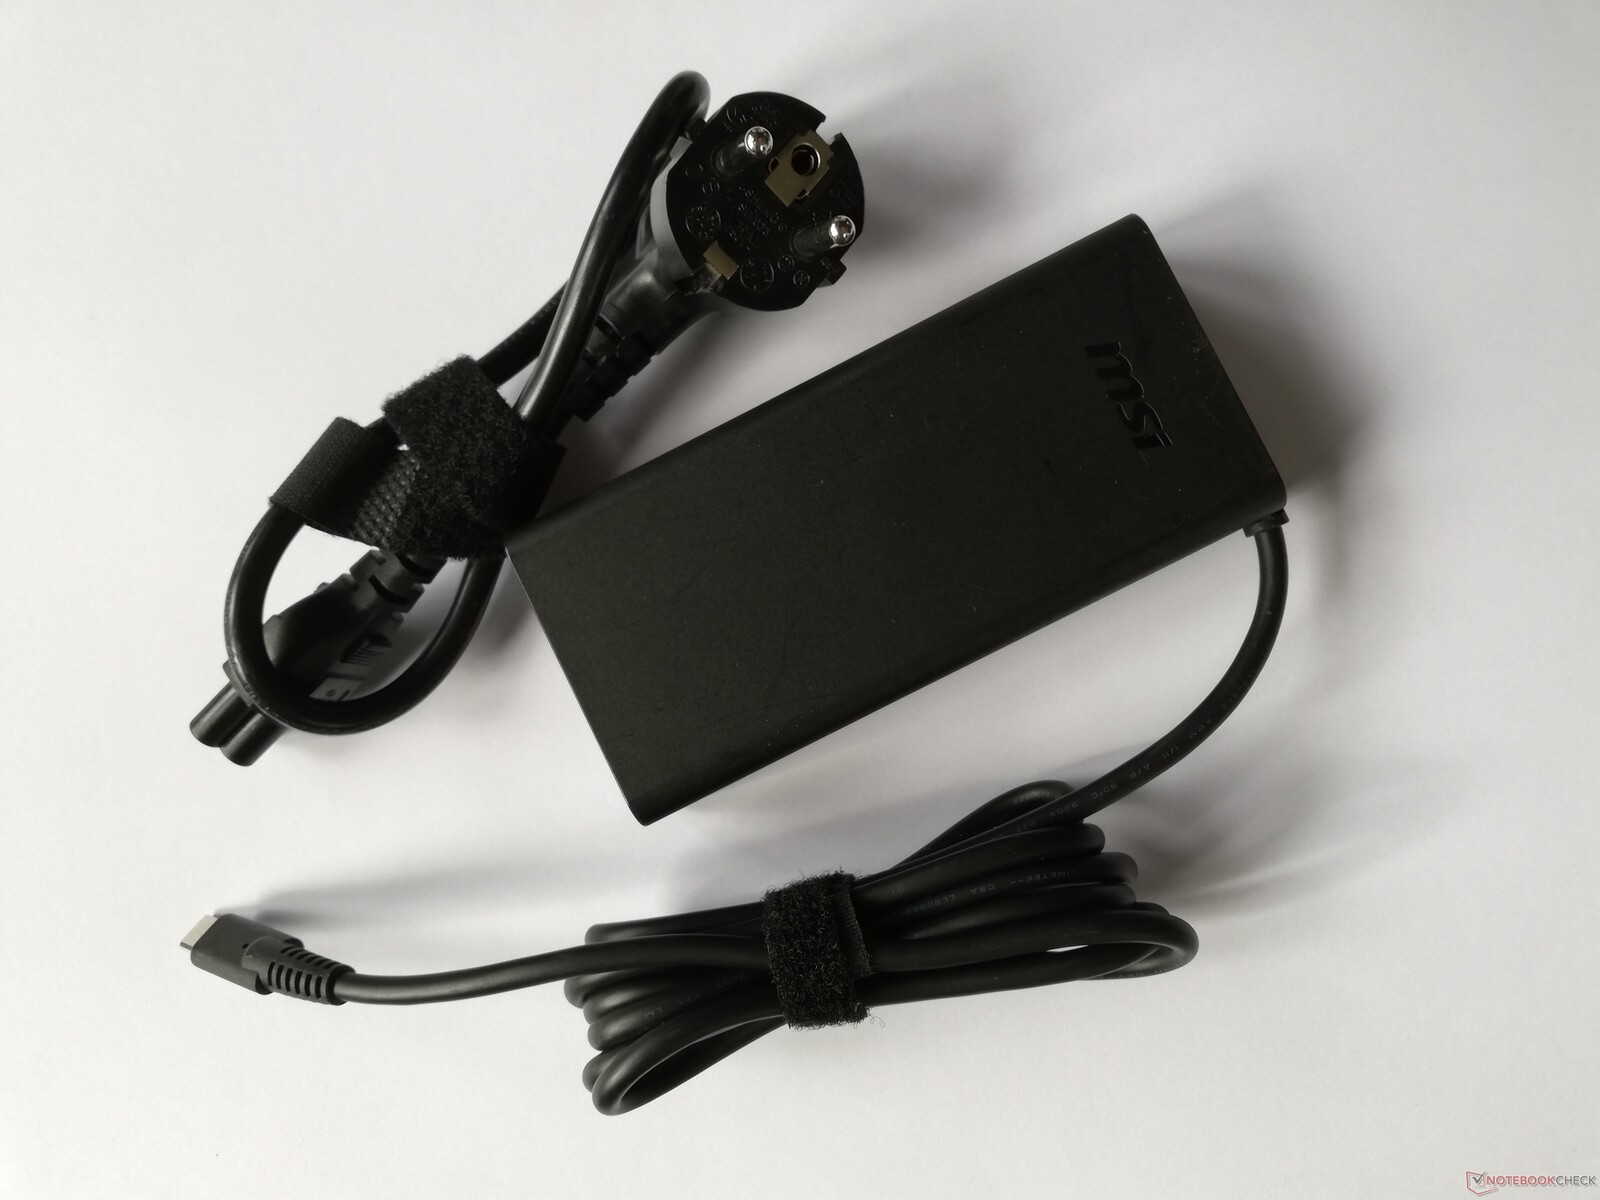
The MSI Prestige 14 only comes with the laptop itself and a 90-watt power adapter. MSI doesn't offer any other accessories specifically tailored to the Prestige 14.
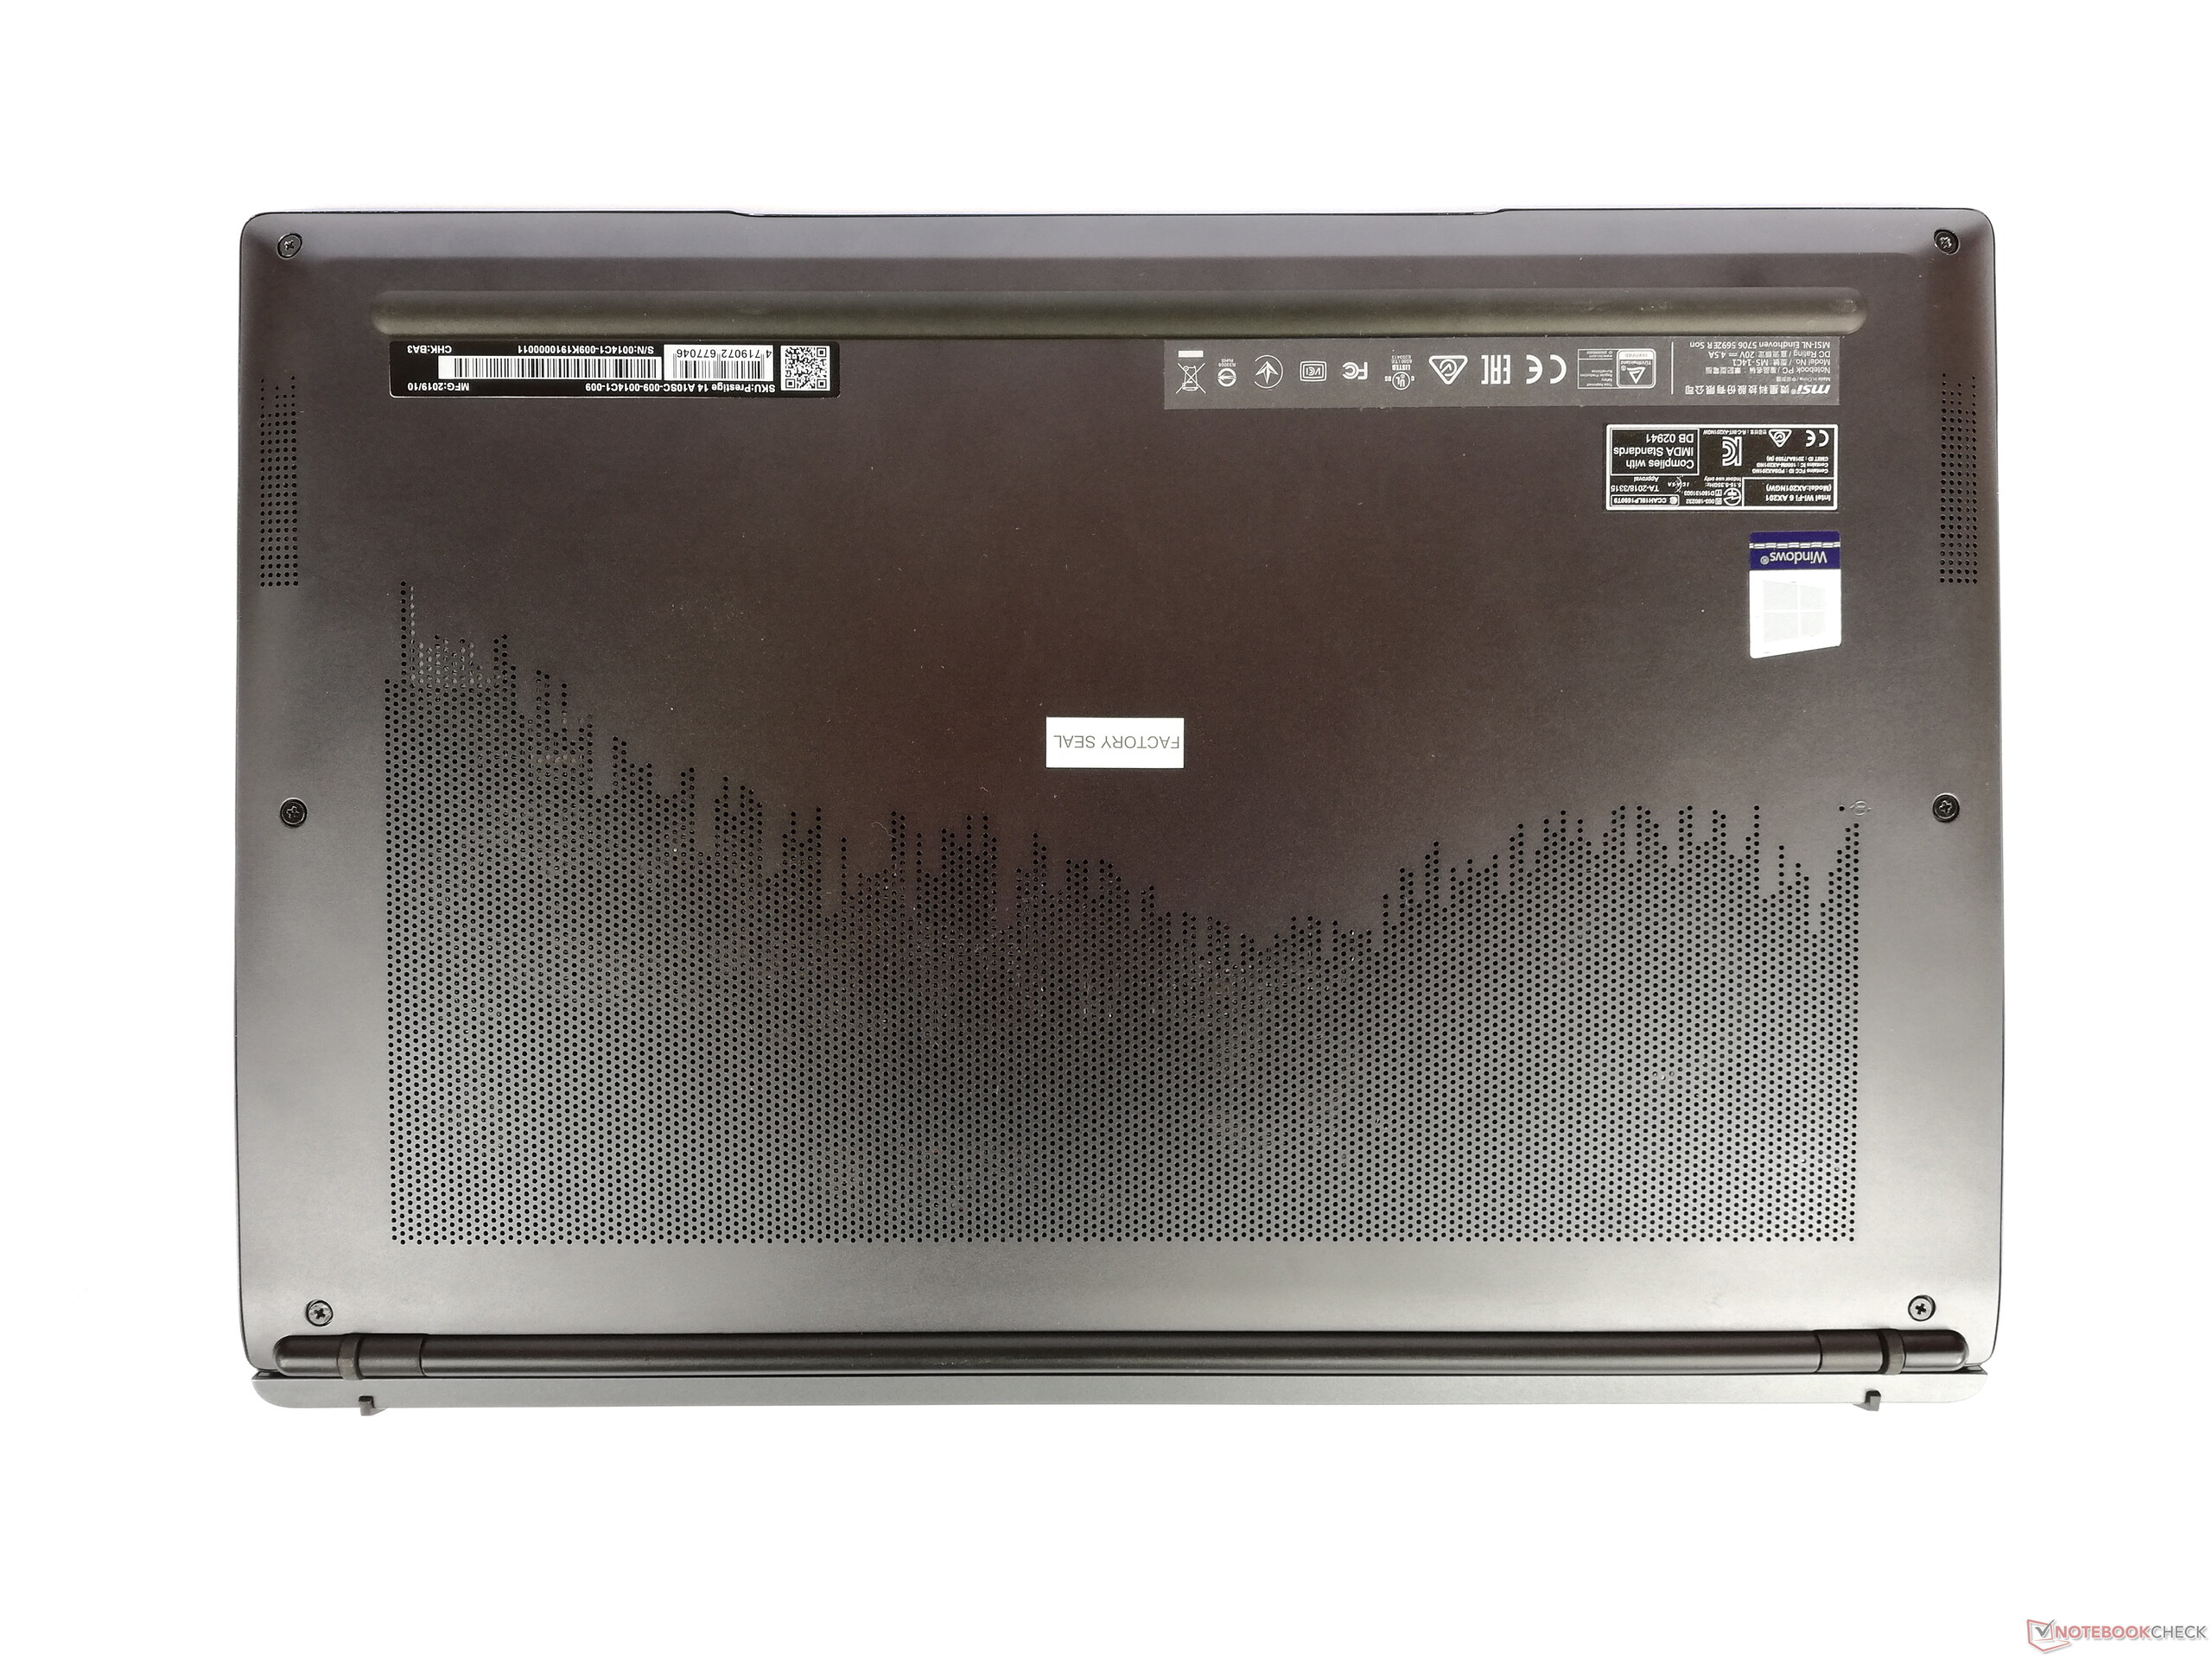
Maintenance
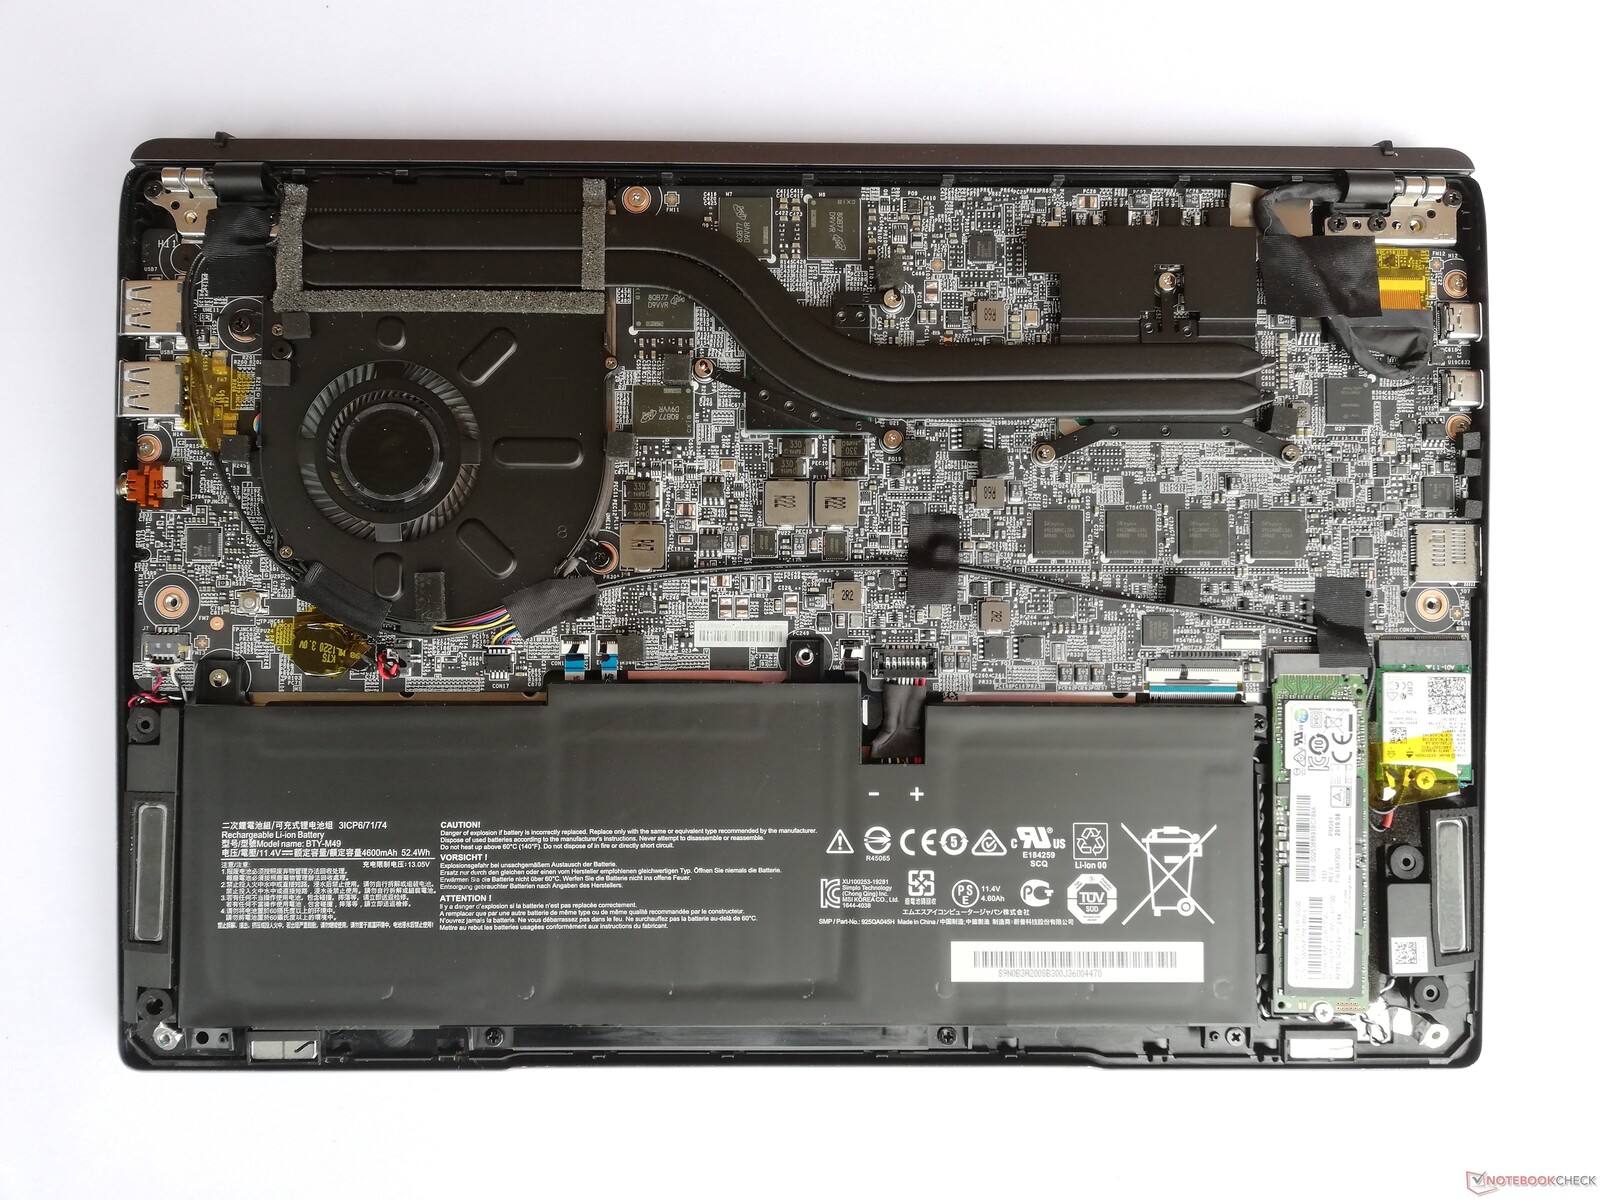
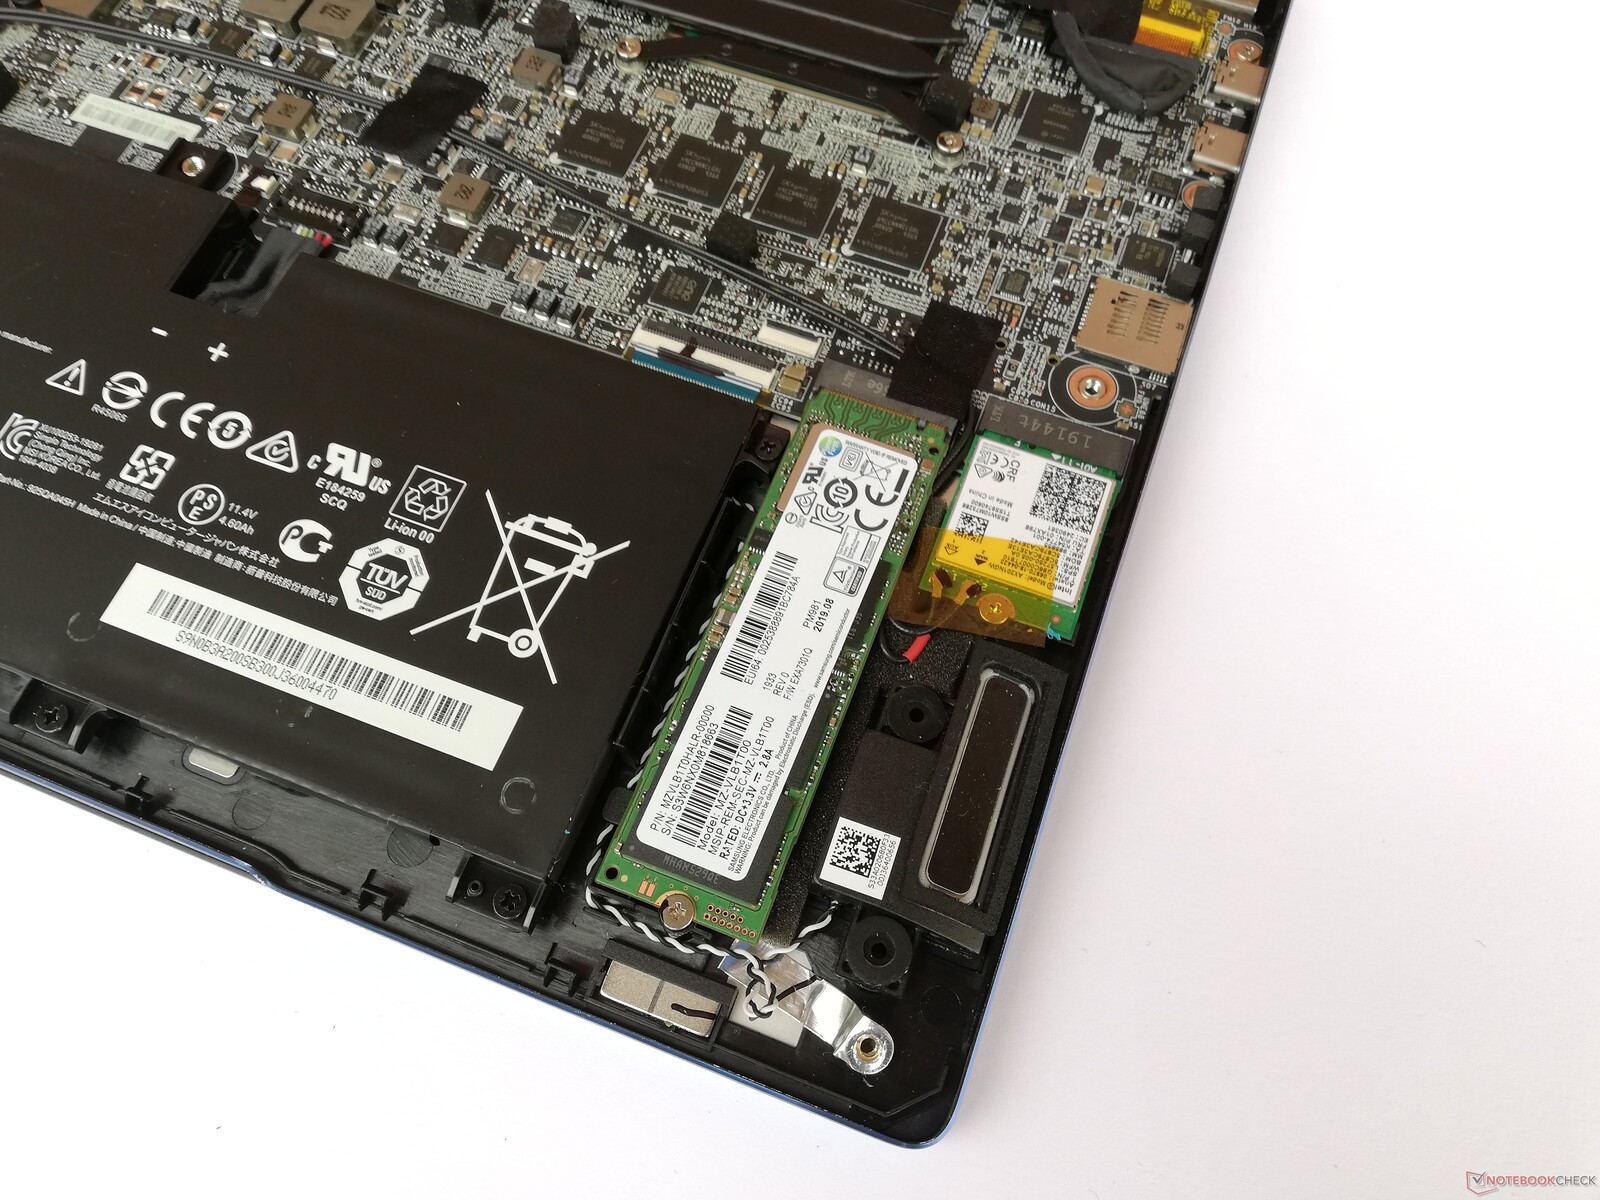
The base plate of the MSI Prestige 14 is relatively easy to detach after all the screws on the bottom have been removed. This allows access to the WLAN module and the SSD. The memory is firmly soldered and can't be replaced or expanded.
Warranty
MSI grants buyers of the Prestige 14 a 24-month warranty period.
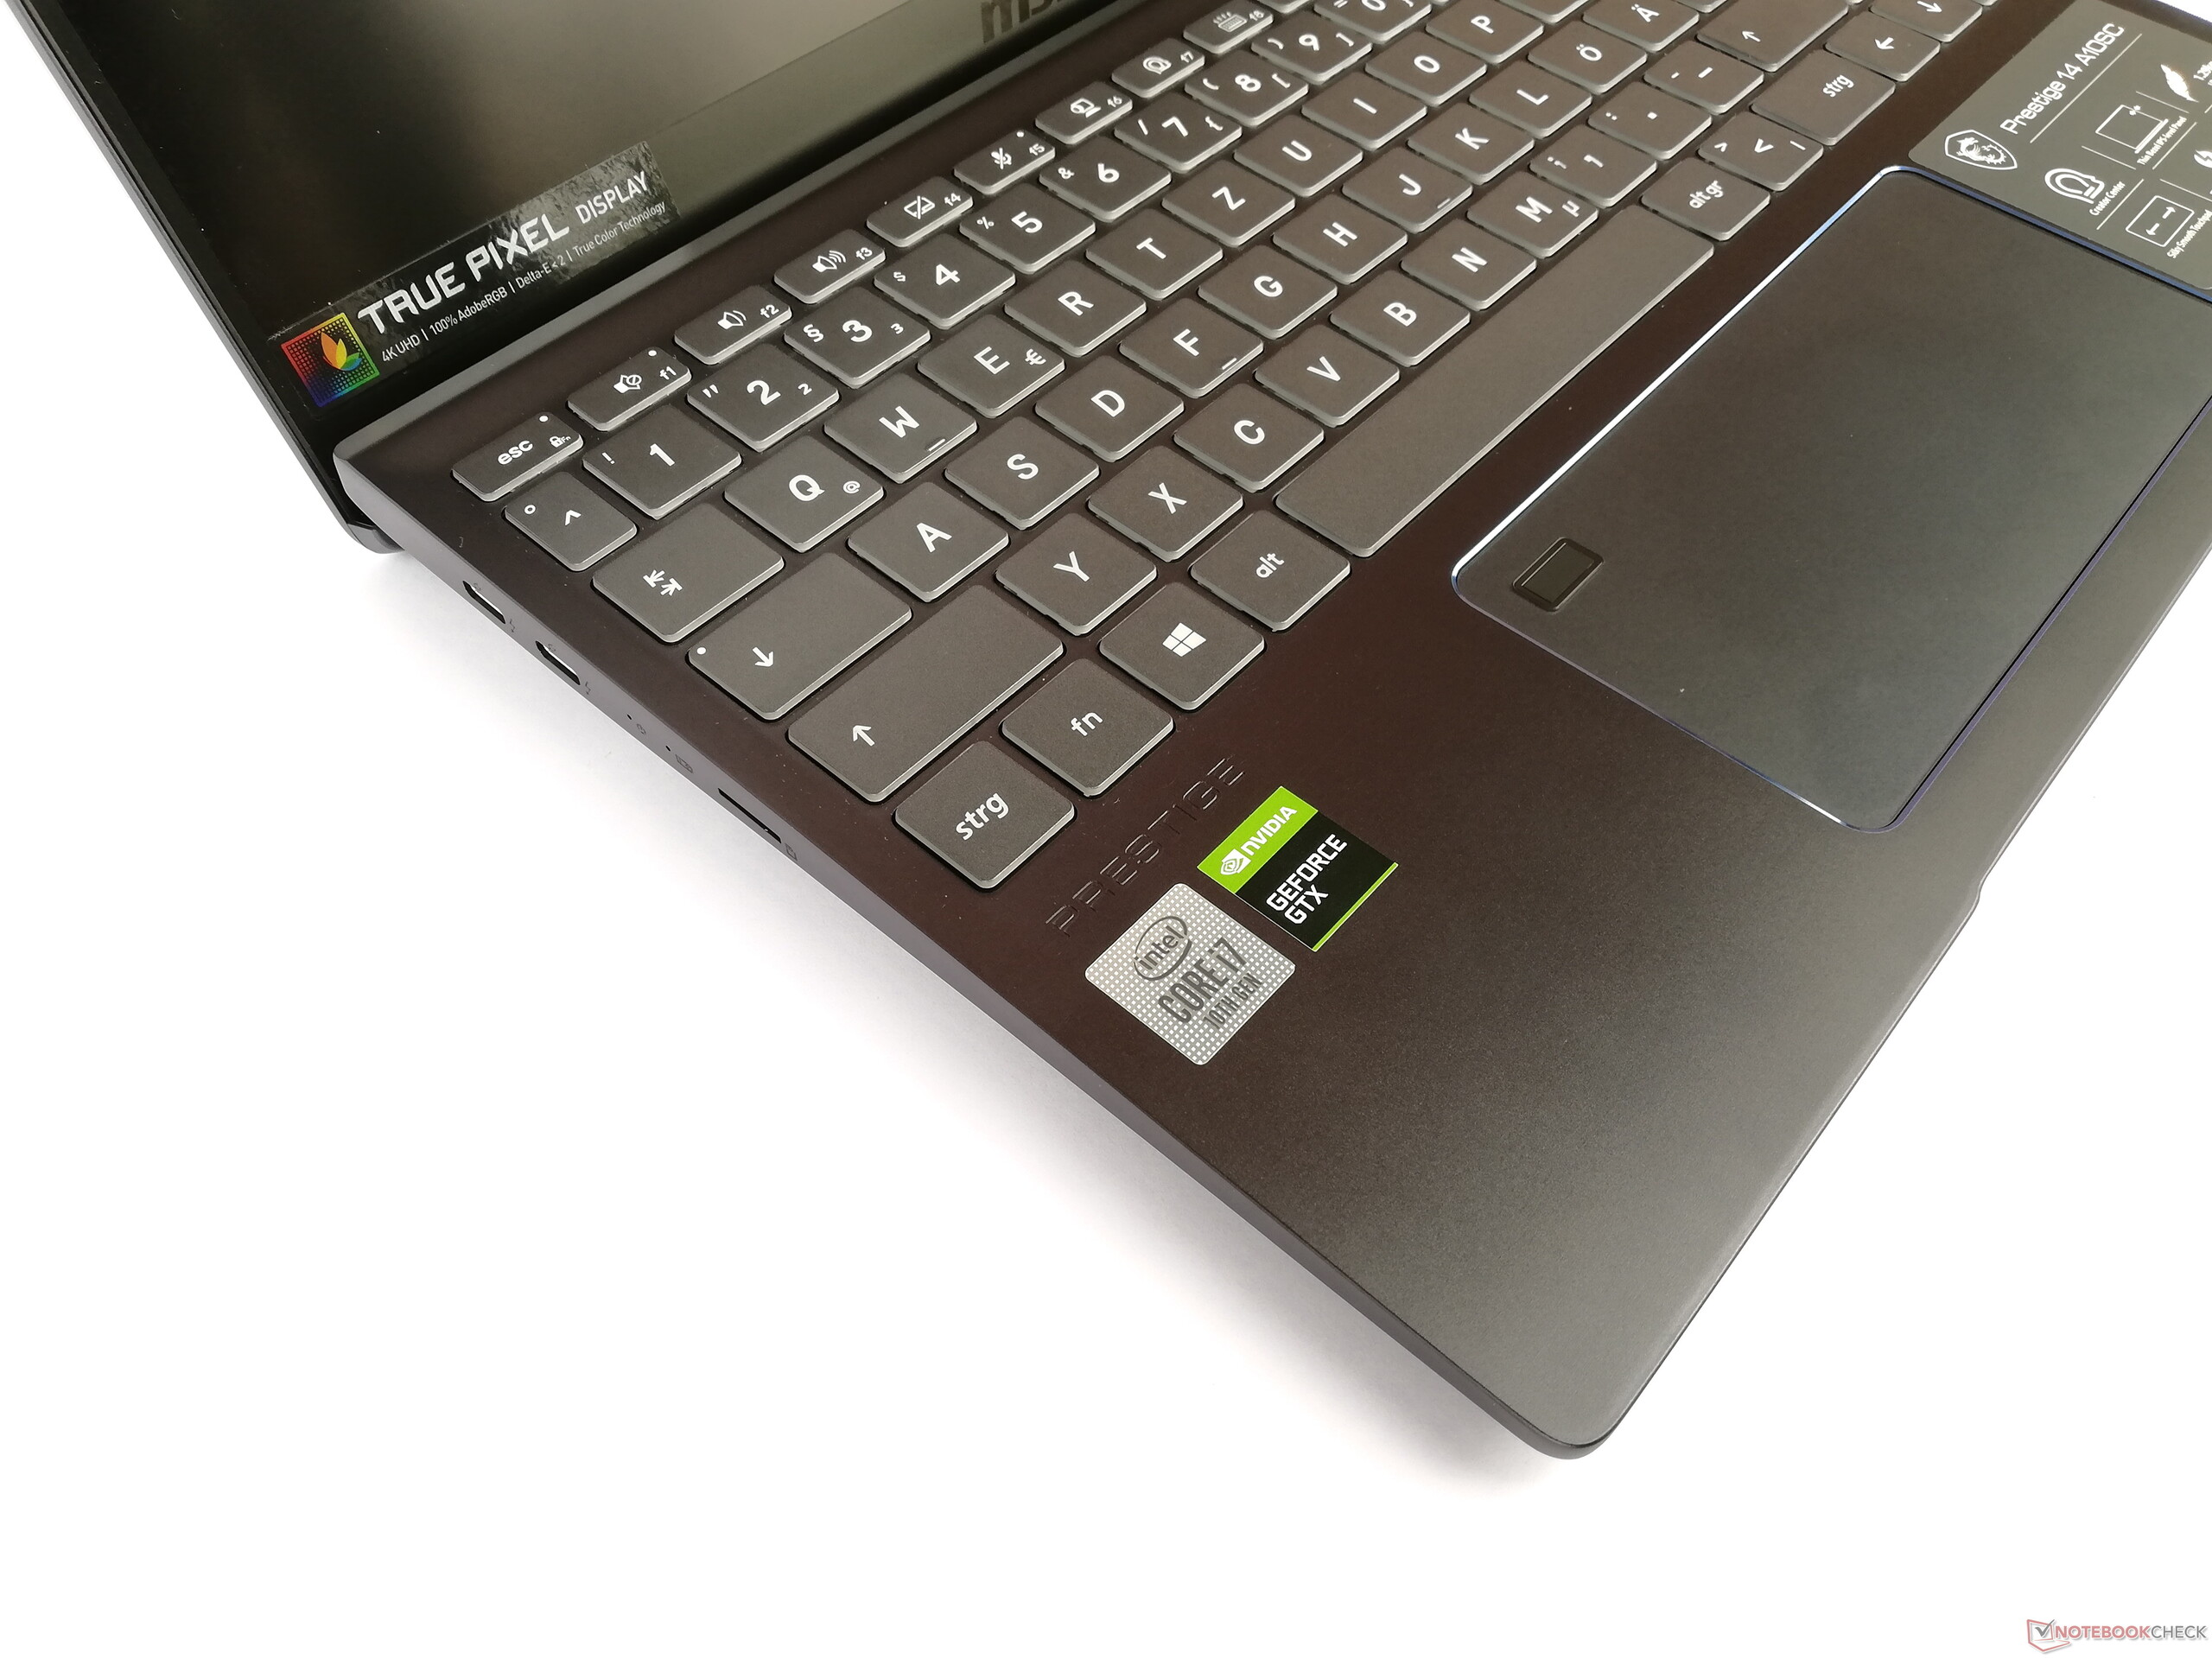
Input devices - Laptop with normal-sized arrow keys
Keyboard
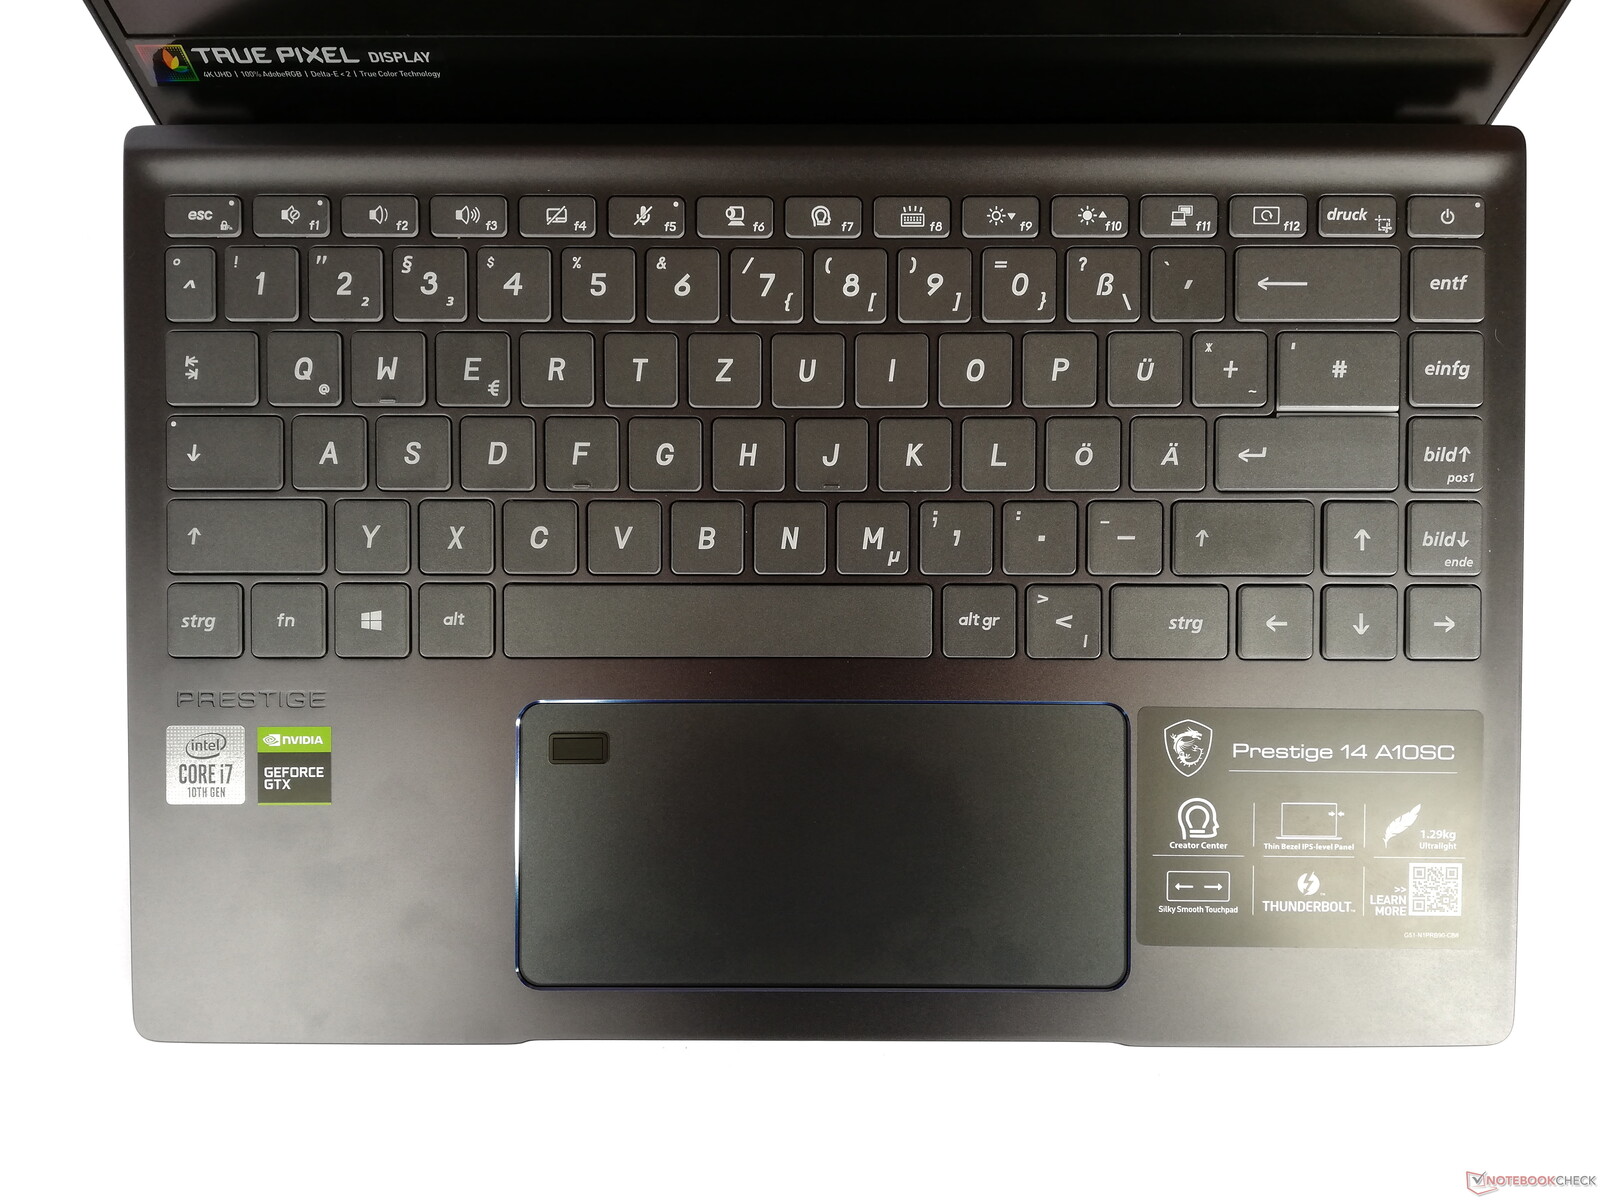
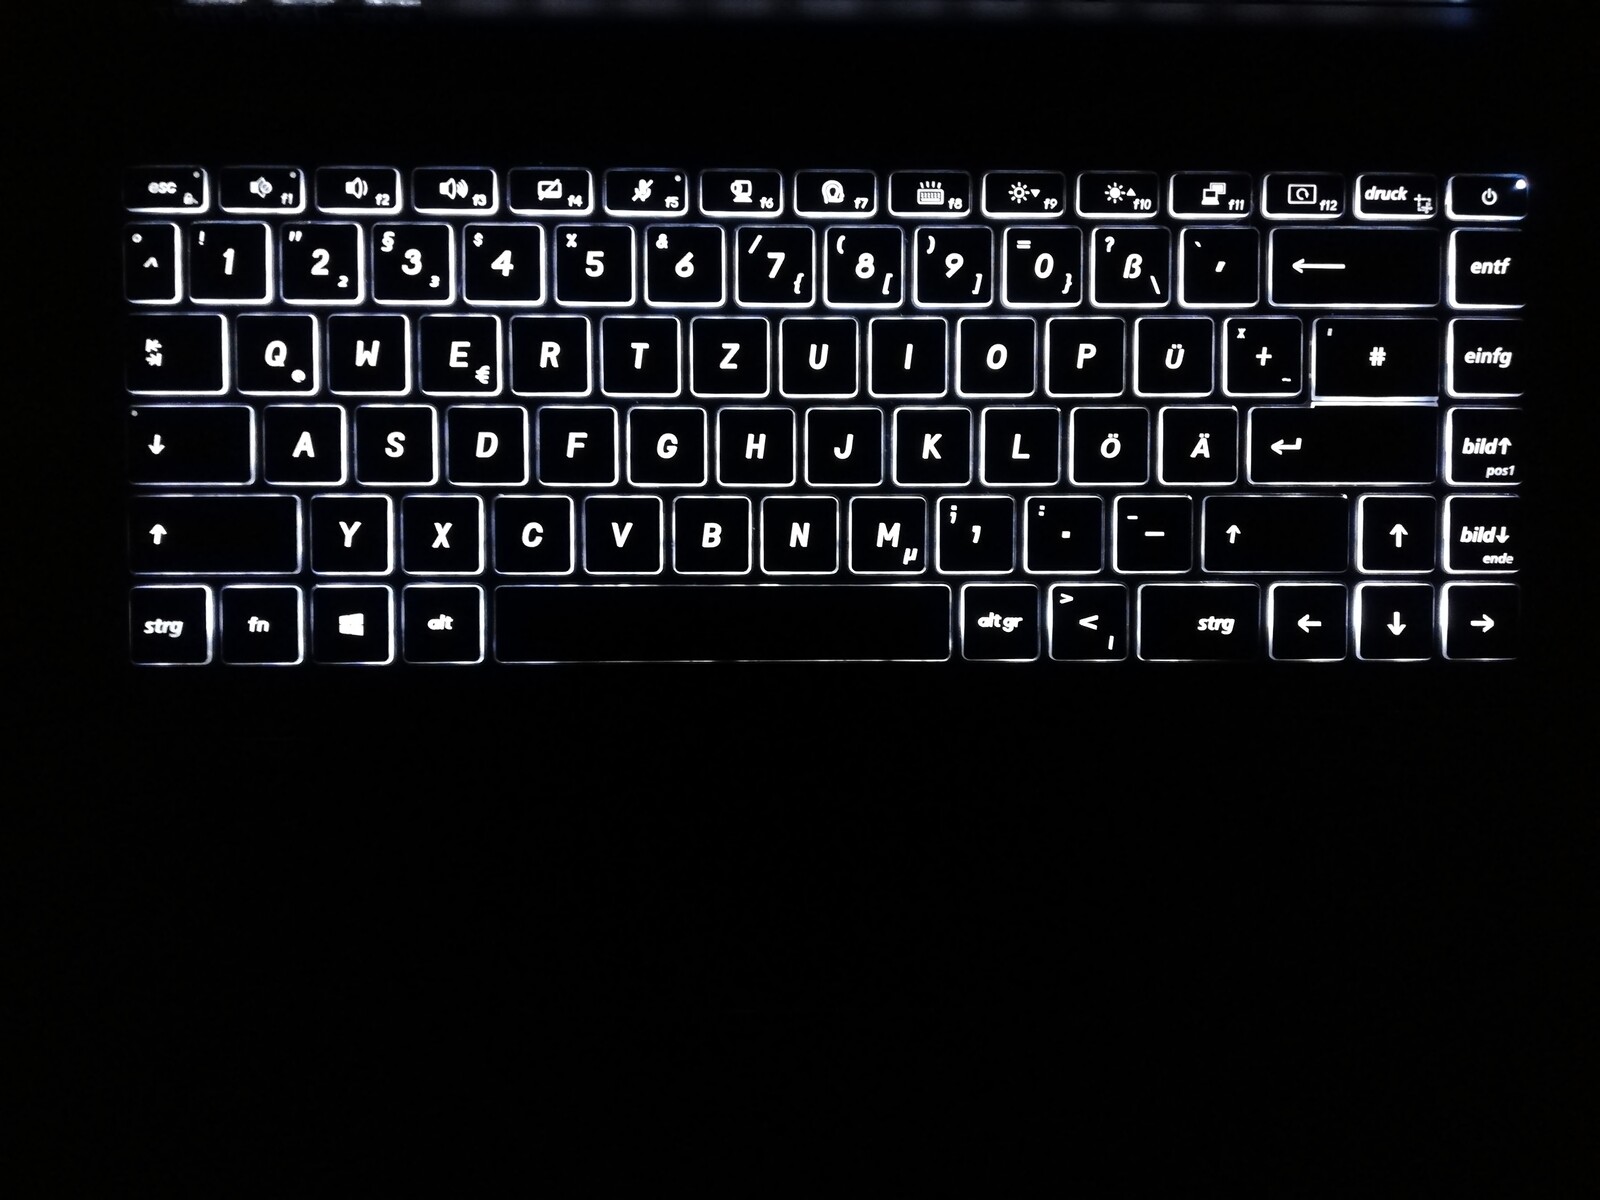
The keyboard of the Prestige 14 offers very large keys with a well though-out layout, especially for a 14-inch laptop. The arrow keys are full-size, and the function keys only have a slightly reduced size. Writing tasks can be done very well and quickly, since the feedback of the keys is also very clear. The only weak point is the double assignment of page up/page down with home and end, but this is a highly specific criticism.
A three-stage keyboard backlighting can be activated for working in poor lighting conditions. This illuminates the letters evenly and doesn't dazzle.
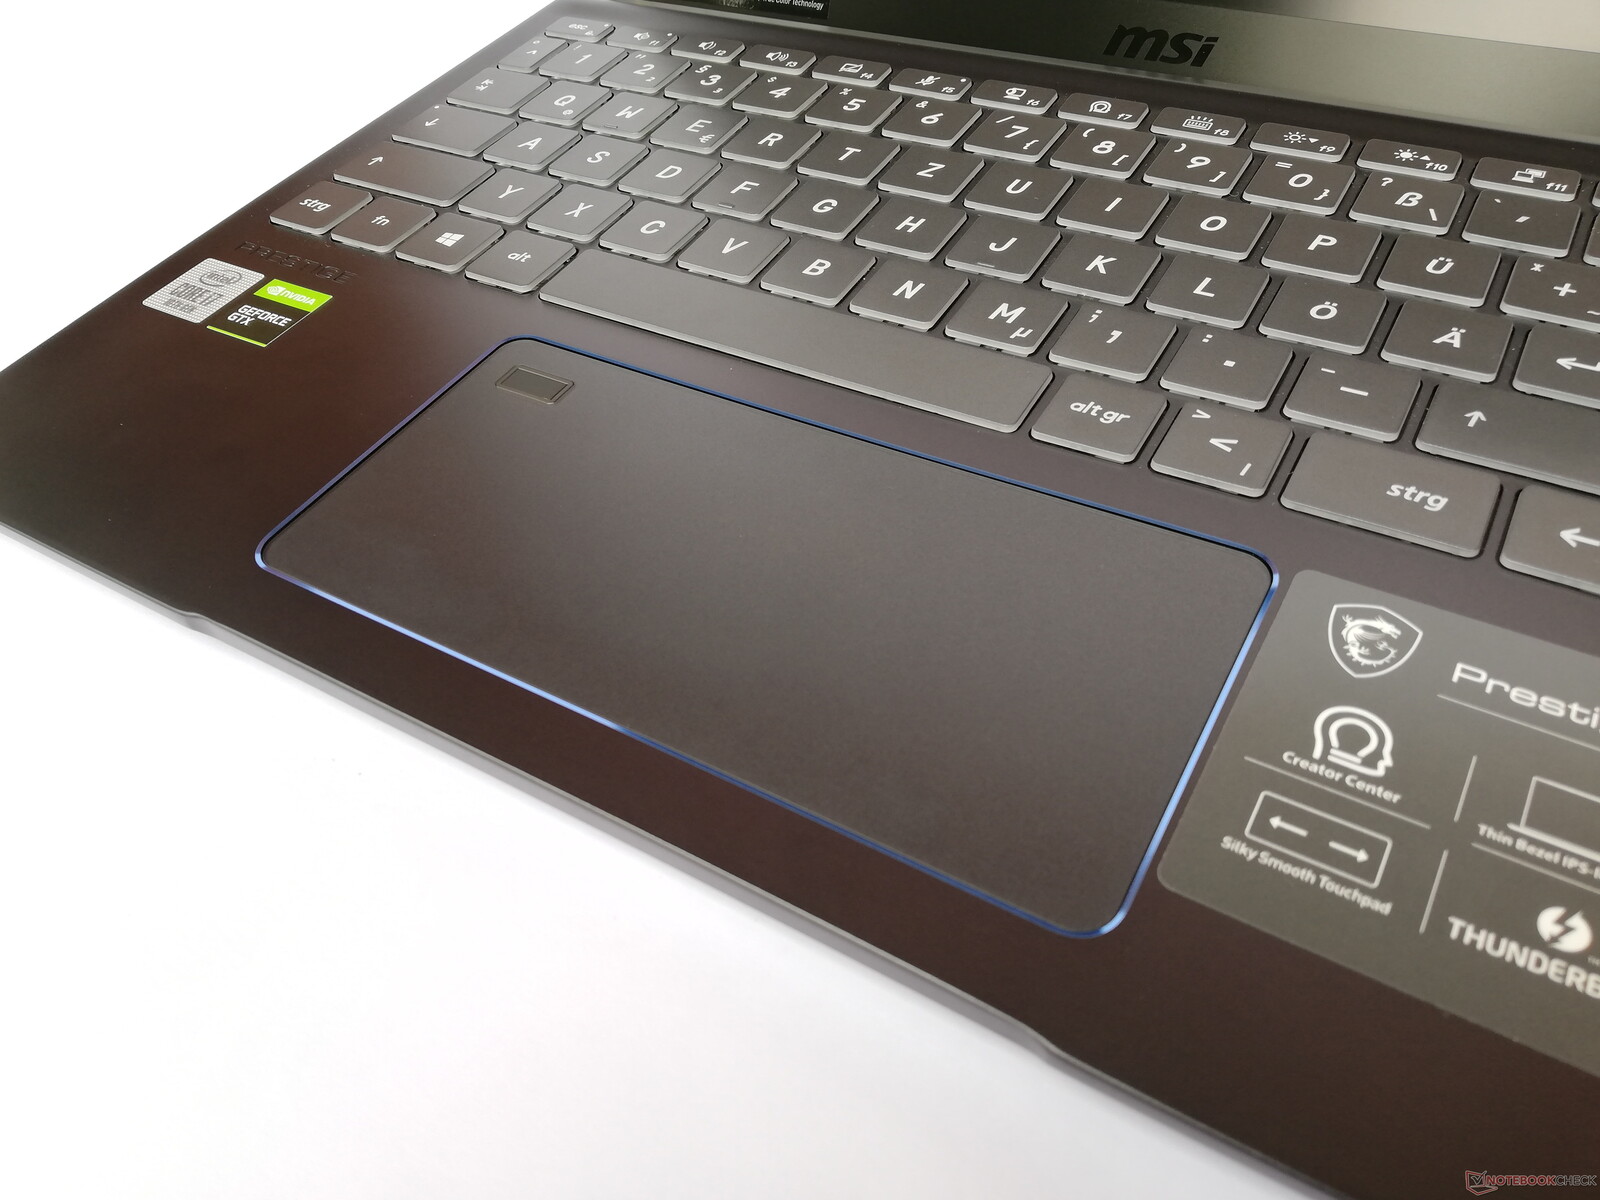
Touchpad
A very wide ClickPad is used as a mouse replacement. This provides a smooth surface that allows accurate navigation of the mouse pointer. Even with excessive movements of the mouse pointer, our finger didn't bump into the edge, and the fingerprint sensor wasn't in the way either. Touch-triggered clicks are registered reliably, and the mechanical activation of mouse inputs works smoothly too.
Display - 4K IPS panel in the MSI Prestige 14
The display of the MSI Prestige 14 consists of a 14-inch IPS panel and offers a resolution of 3840x2160 pixels. The brightness is very good with an average of 512 cd/m², while its distribution is only moderate at 86%. MSI has forgone the use of PWM for brightness control, which suits users with sensitive eyes better.
In addition to the 4K panel installed here, the MSI Prestige 14 is also available with an IPS panel with a resolution of 1920x1080 pixels.
| |||||||||||||||||||||||||
Brightness Distribution: 86 %
Center on Battery: 567 cd/m²
Contrast: 1274:1 (Black: 0.445 cd/m²)
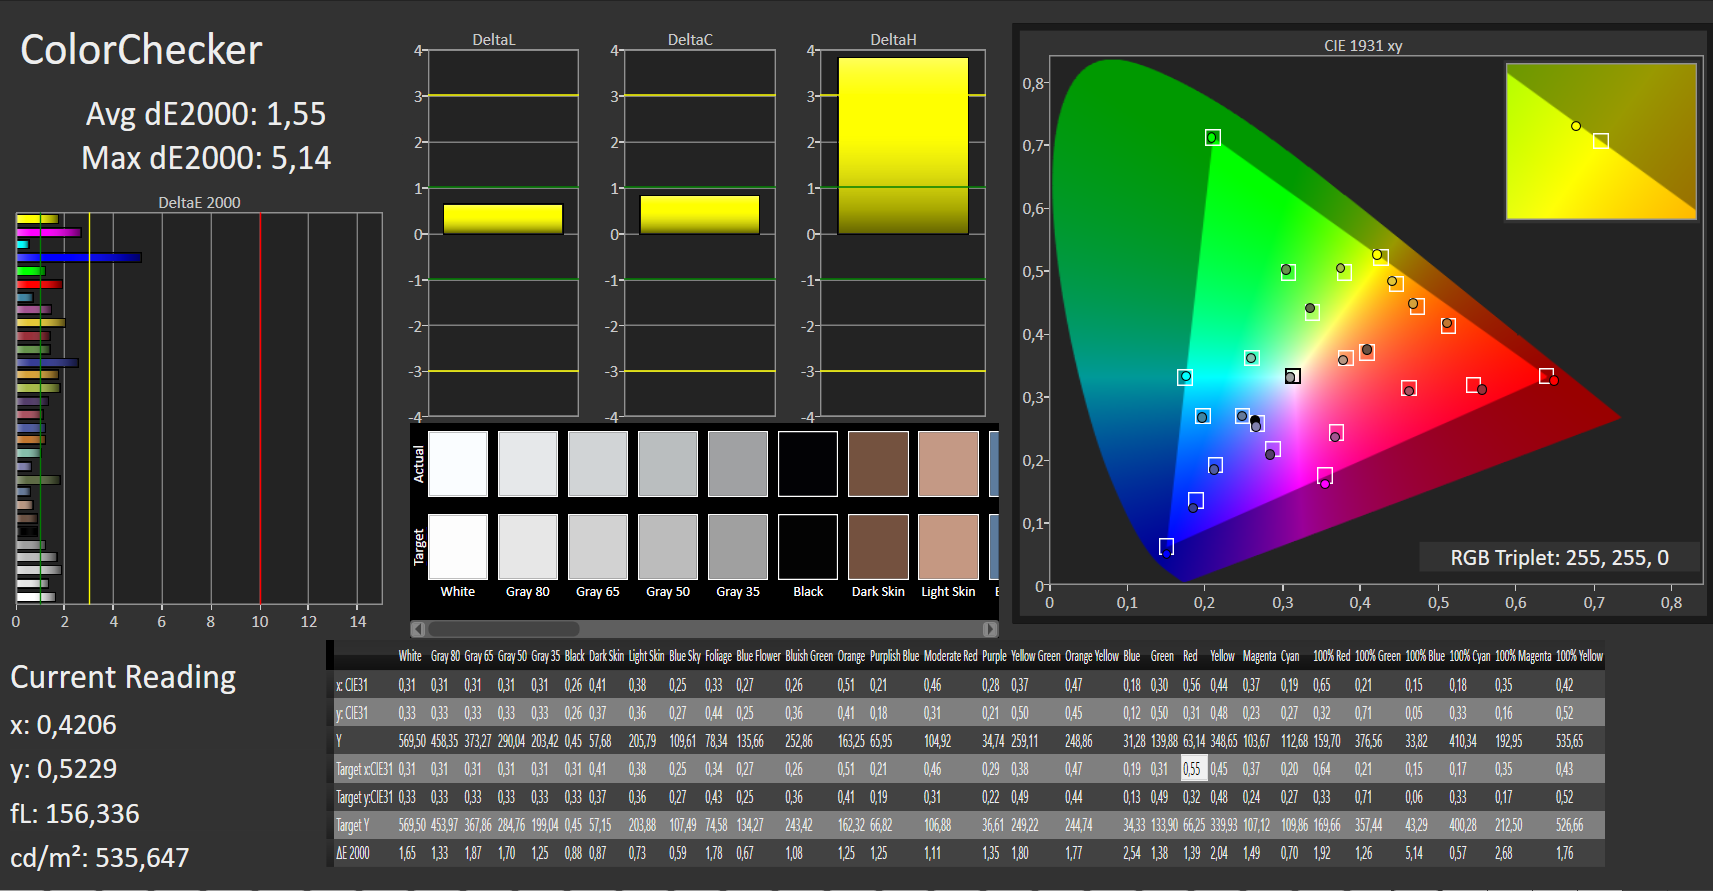
ΔE ColorChecker Calman: 1.55 | ∀{0.5-29.43 Ø4.73}
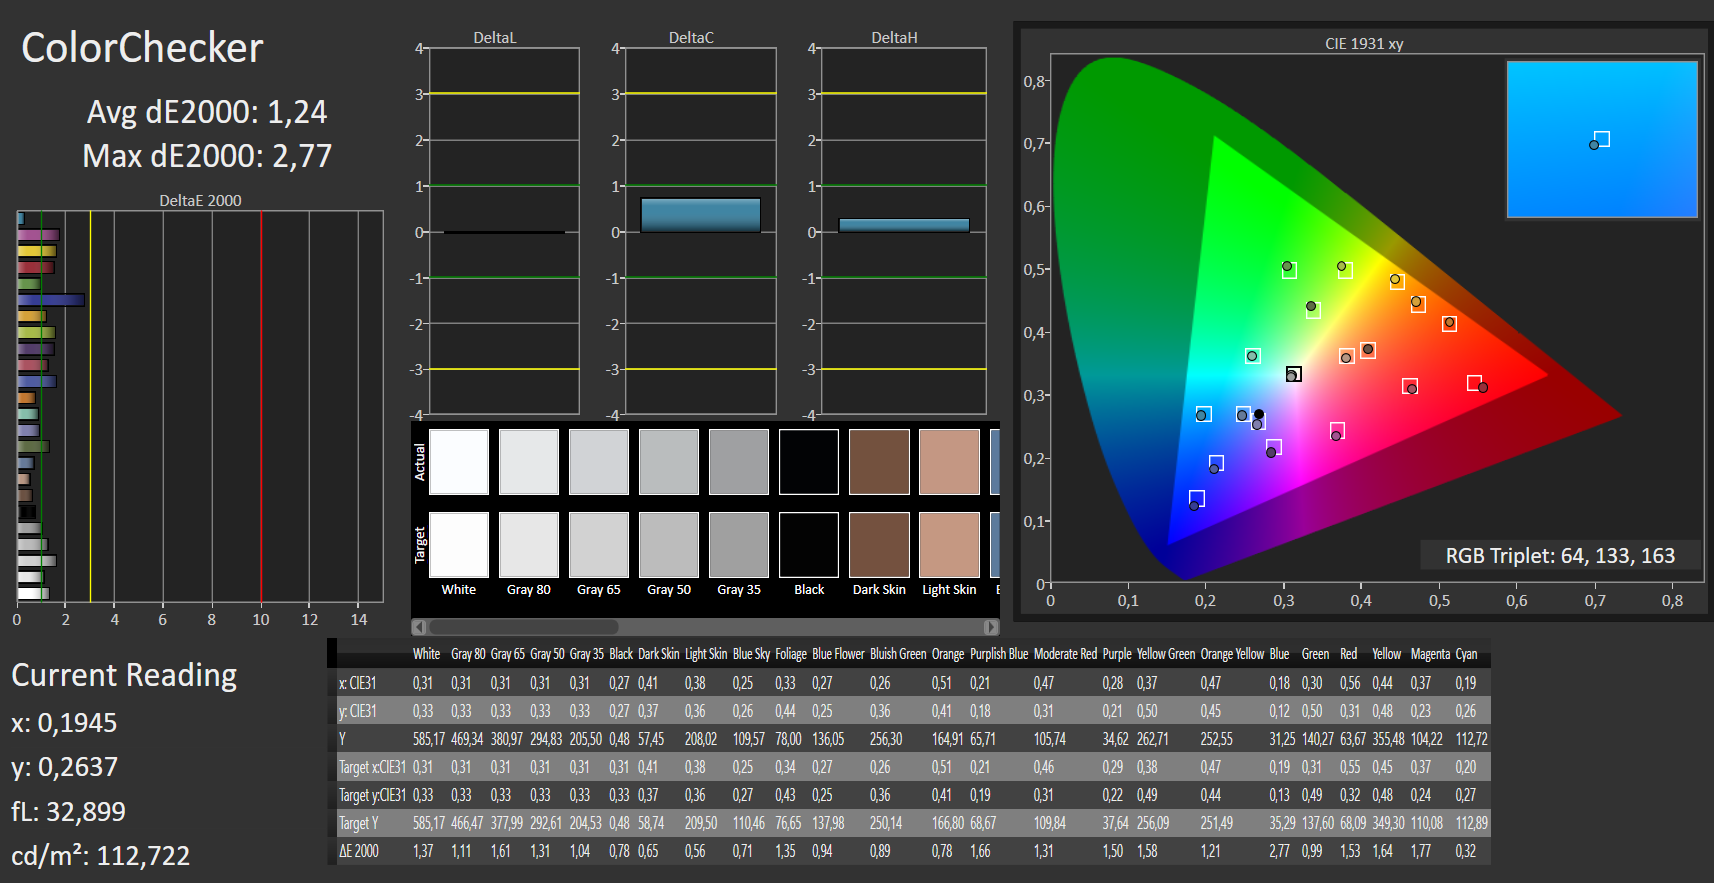
calibrated: 1.24
ΔE Greyscale Calman: 1.48 | ∀{0.09-98 Ø4.97}
Gamma: 2.19
CCT: 6741 K
| MSI Prestige 14 A10SC-009 IPS, 3840x2160, 14" | MSI Prestige 15 A10SC Sharp LQ156D1JW42, IPS, 3840x2160, 15.6" | Razer Blade Stealth 13, Core i7-1065G7 AUO202B, IPS LED, 3840x2160, 13.3" | Asus ZenBook 15 UX534FT-DB77 BOE NV156FHM-N63, IPS, 1920x1080, 15.6" | HP ZBook 15u G6 6TP54EA AU Optronics AUO30EB, IPS, 3840x2160, 15.6" | |
|---|---|---|---|---|---|
| Display | |||||
| Display P3 Coverage (%) | 82 | 64.3 | 66.6 | 69.2 | |
| sRGB Coverage (%) | 98.3 | 95.8 | 87.7 | 97.1 | |
| AdobeRGB 1998 Coverage (%) | 96.2 | 65.7 | 64.1 | 69.7 | |
| Response Times | -12% | -11% | 17% | -4% | |
| Response Time Grey 50% / Grey 80% * (ms) | 55 ? | 60 ? -9% | 62 ? -13% | 41.2 ? 25% | 68.8 ? -25% |
| Response Time Black / White * (ms) | 36 ? | 41.2 ? -14% | 39 ? -8% | 33.2 ? 8% | 29.6 18% |
| PWM Frequency (Hz) | 26040 ? | ||||
| Screen | -42% | -55% | -100% | -49% | |
| Brightness middle (cd/m²) | 567 | 464.5 -18% | 353 -38% | 312.6 -45% | 451 -20% |
| Brightness (cd/m²) | 516 | 451 -13% | 335 -35% | 290 -44% | 434 -16% |
| Brightness Distribution (%) | 86 | 92 7% | 90 5% | 85 -1% | 89 3% |
| Black Level * (cd/m²) | 0.445 | 0.5 -12% | 0.25 44% | 0.31 30% | 0.25 44% |
| Contrast (:1) | 1274 | 929 -27% | 1412 11% | 1008 -21% | 1804 42% |
| Colorchecker dE 2000 * | 1.55 | 3.36 -117% | 4.4 -184% | 5.78 -273% | 4.4 -184% |
| Colorchecker dE 2000 max. * | 5.14 | 7.06 -37% | 7.21 -40% | 8.86 -72% | 6.7 -30% |
| Colorchecker dE 2000 calibrated * | 1.24 | 3.42 -176% | 1.1 11% | 3.78 -205% | 1.8 -45% |
| Greyscale dE 2000 * | 1.48 | 1.3 12% | 5.49 -271% | 5.4 -265% | 5 -238% |
| Gamma | 2.19 100% | 2.14 103% | 2.26 97% | 2.21 100% | 2.31 95% |
| CCT | 6741 96% | 6596 99% | 7689 85% | 7864 83% | 7717 84% |
| Color Space (Percent of AdobeRGB 1998) (%) | 84.8 | 61 | 57.1 | 63 | |
| Color Space (Percent of sRGB) (%) | 98.3 | 96 | 87.4 | 97 | |
| Total Average (Program / Settings) | -27% /
-37% | -33% /
-47% | -42% /
-78% | -27% /
-41% |
* ... smaller is better
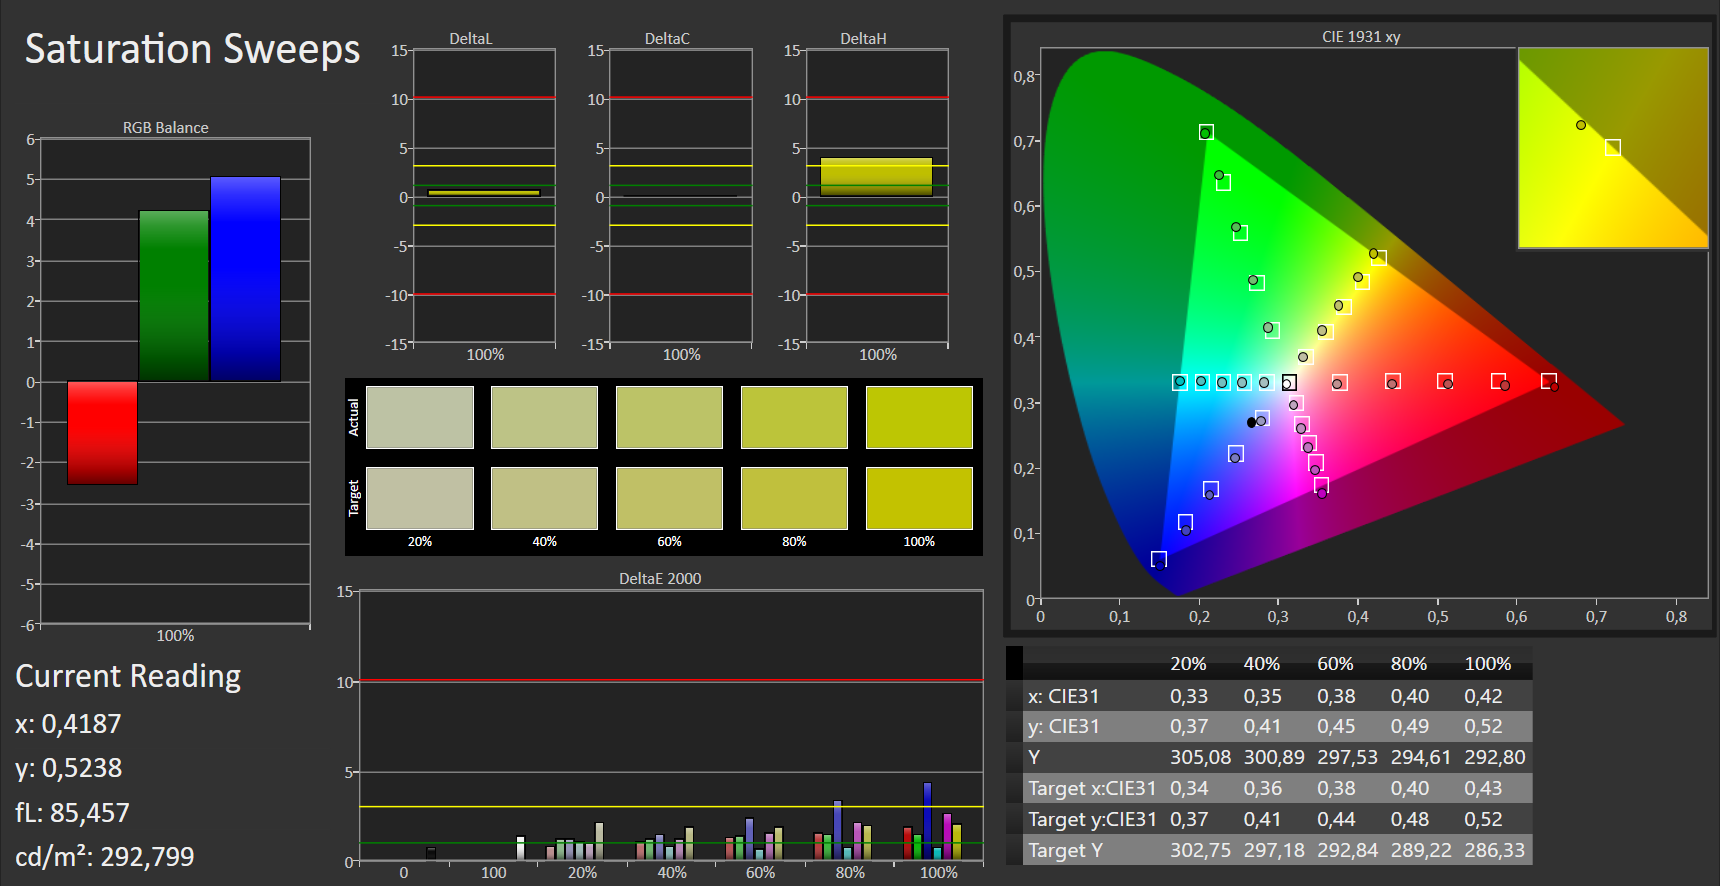
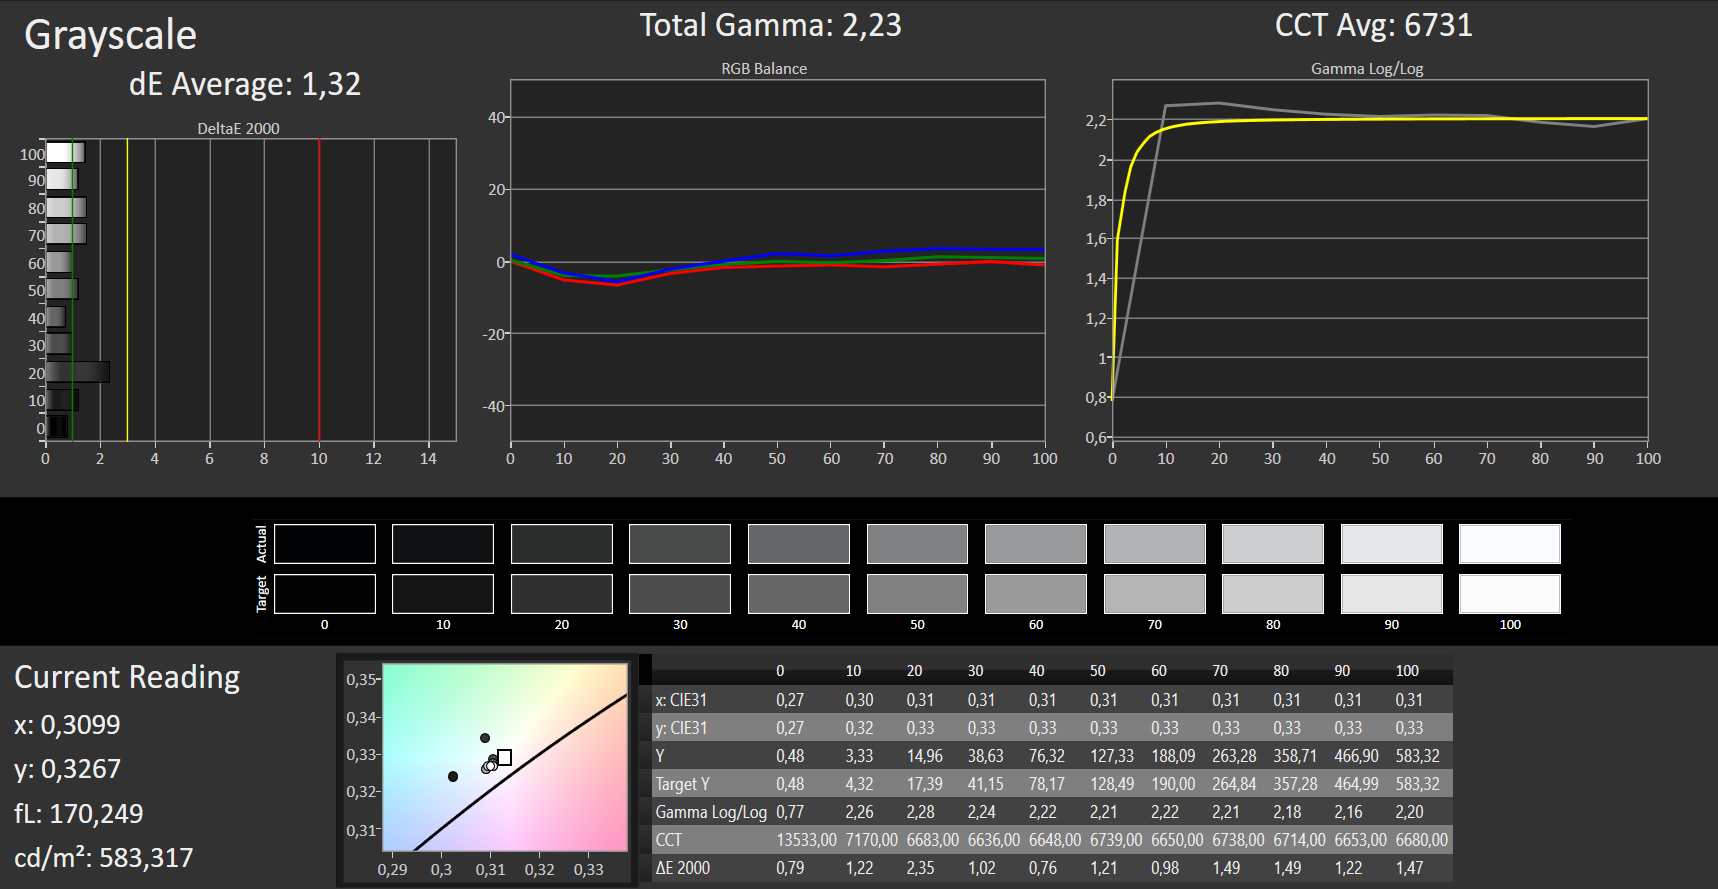
MSI promotes the Prestige 14 with a factory-calibrated True Tone display. According to our measurements, this shows a good contrast ratio of 1,274:1 and a slightly increased black value of 0.442 cd/m². As a result, colors appear well separated from each other, but blacks show a slight gray veil.
The CalMAN analysis also shows a very balanced image with a deviation that can only be improved minimally by calibration. The operation of storing the corresponding ICC file failed repeatedly with our test device, which is why we can't offer it for download here.


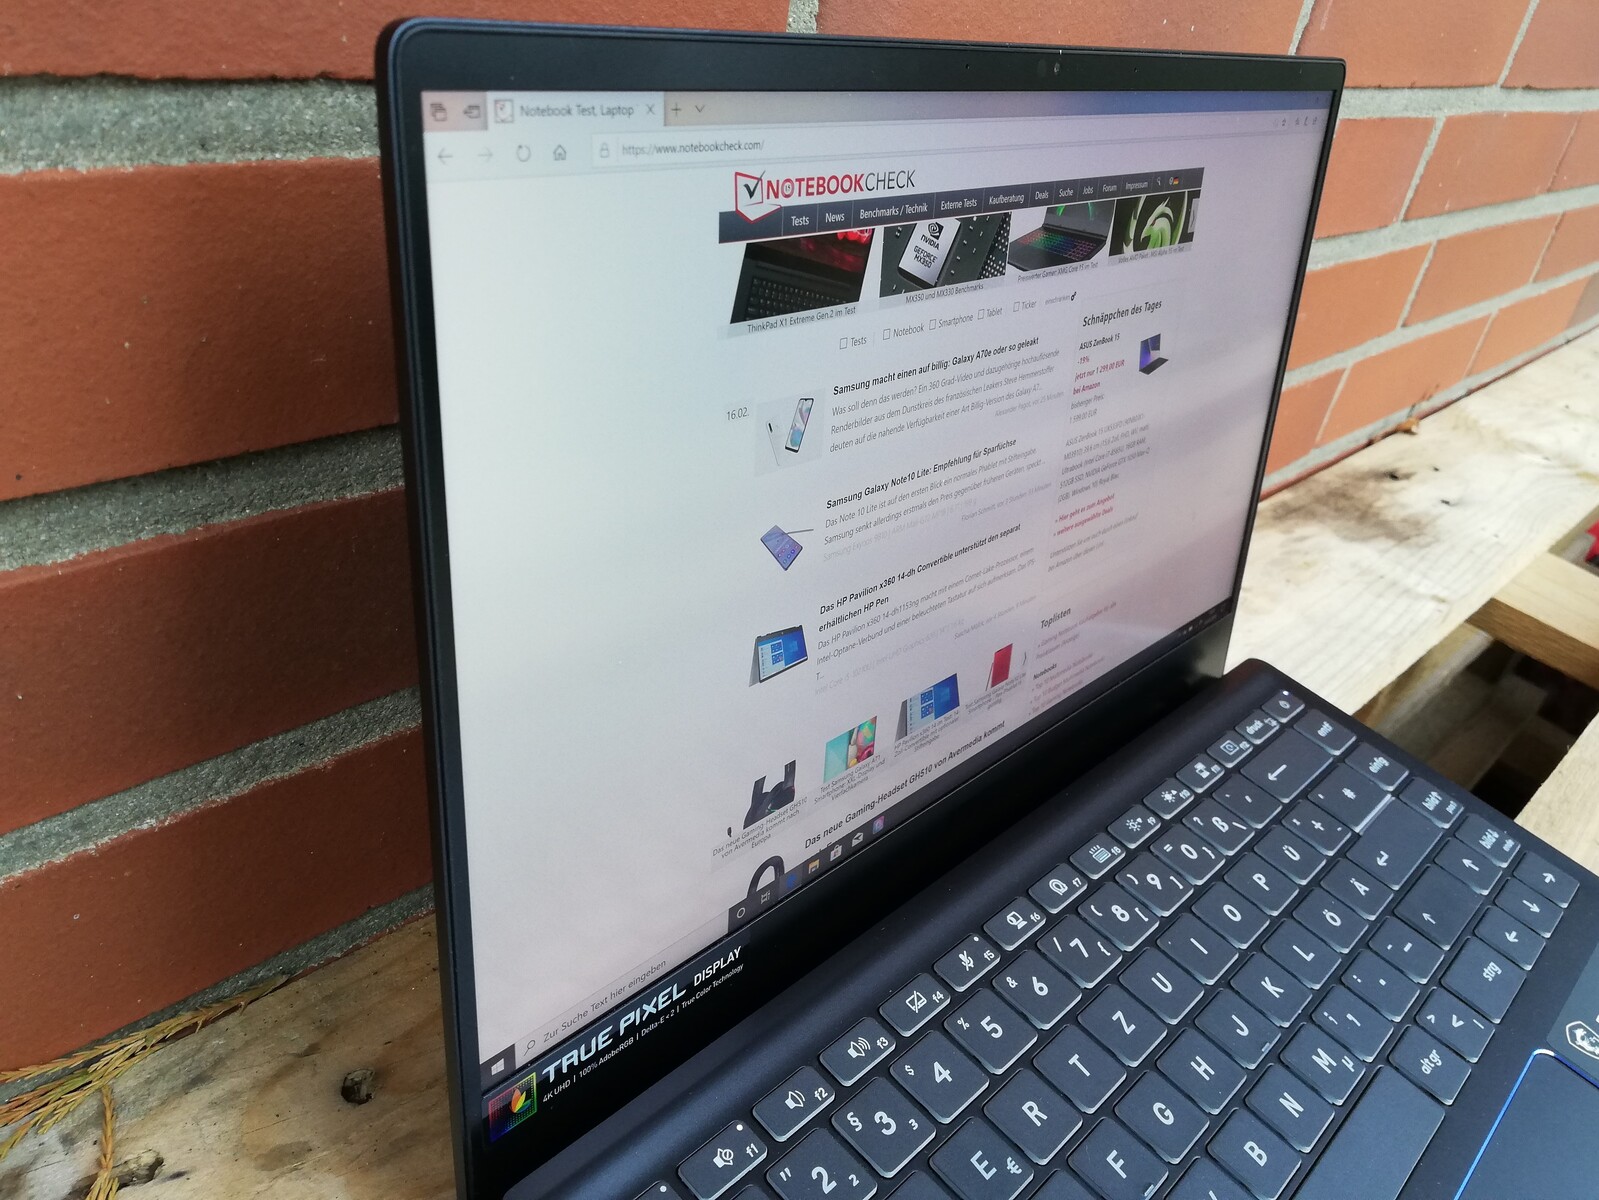
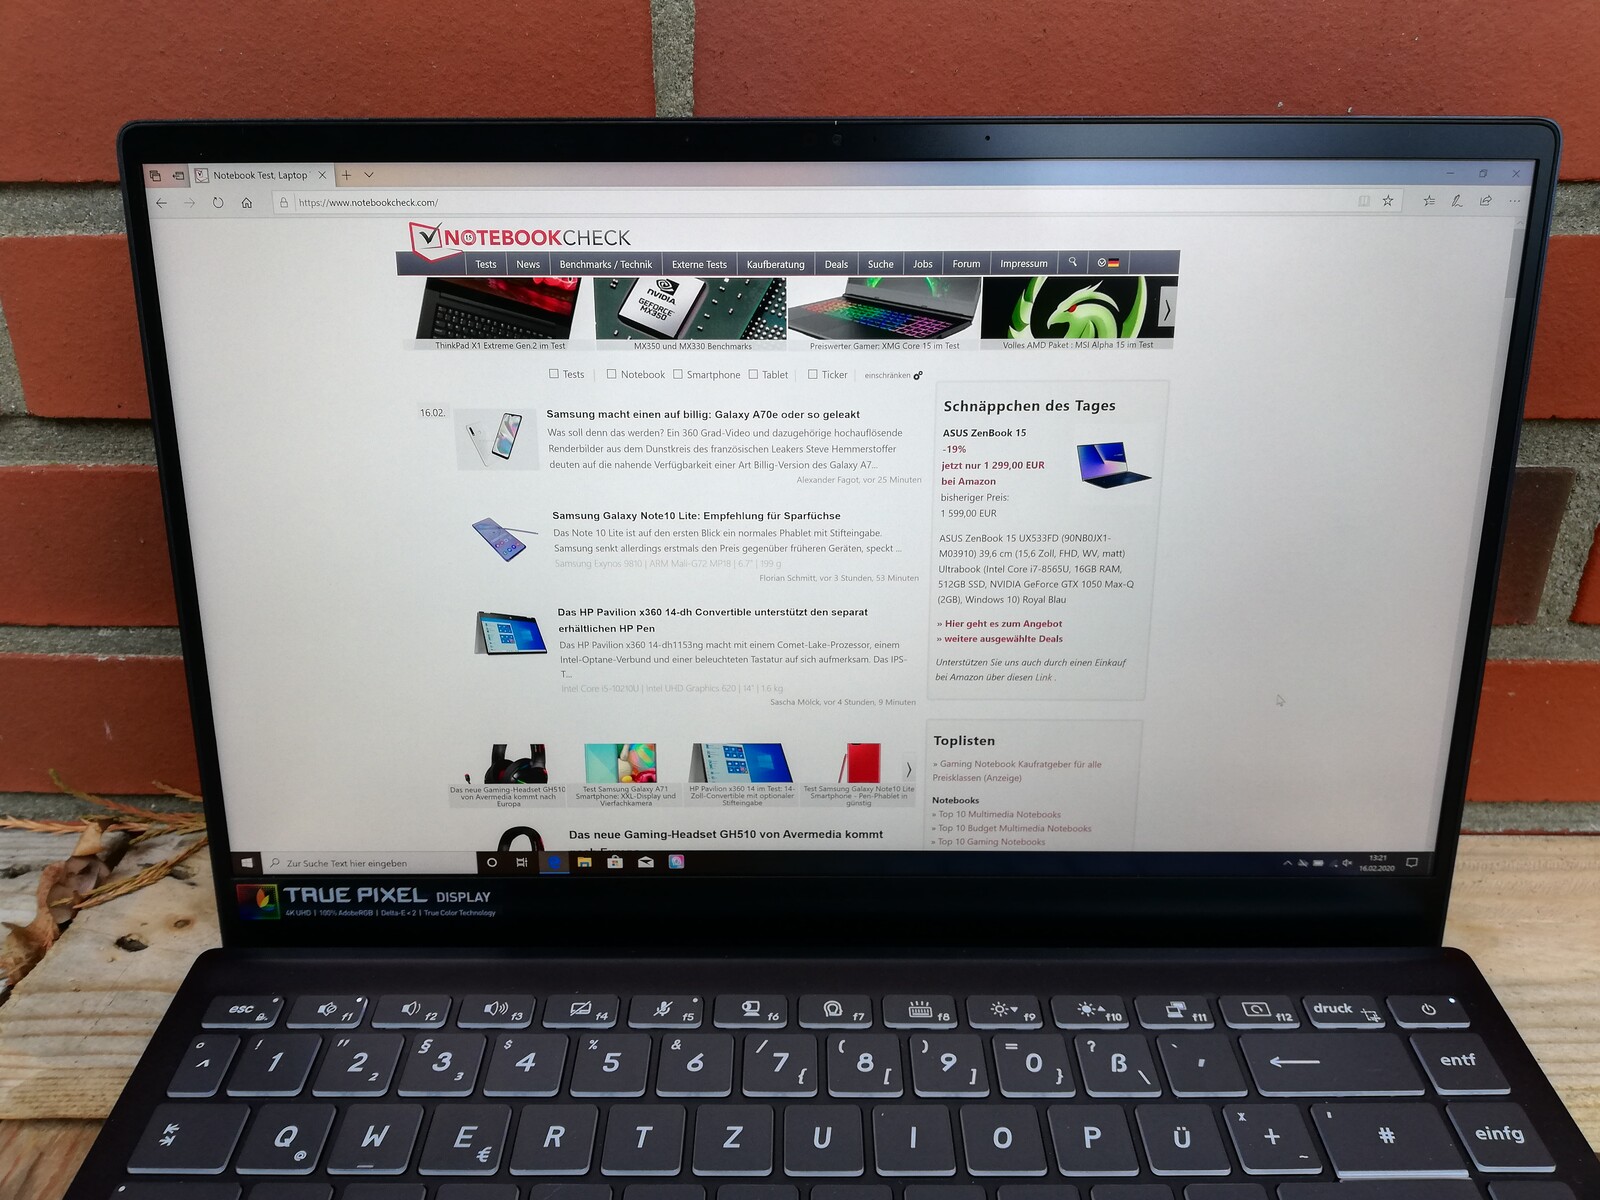
Due to the comparatively high brightness value and the matte display surface, the MSI Prestige 14 can be used well outdoors. However, users should still prefer places in the shade, as reflections can occur in direct sunlight.
Display Response Times
| ↔ Response Time Black to White | ||
|---|---|---|
| 36 ms ... rise ↗ and fall ↘ combined | ↗ 22 ms rise | 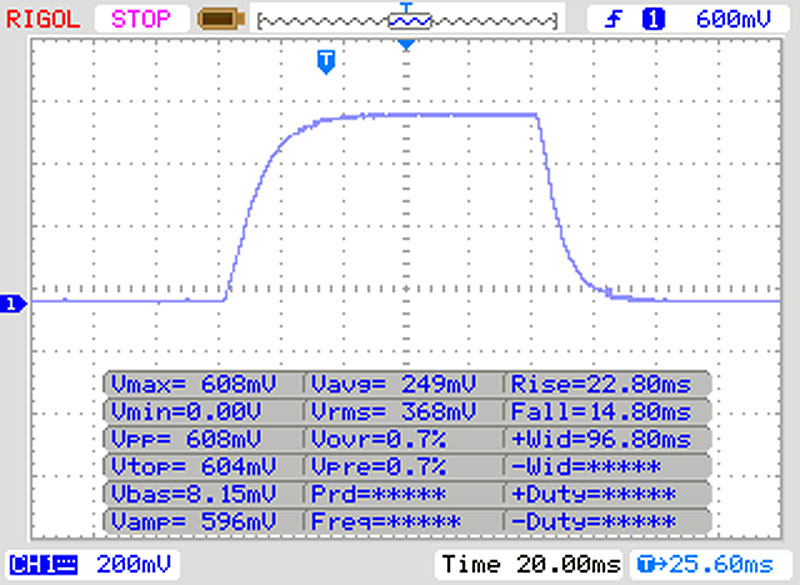 |
| ↘ 14 ms fall | ||
| The screen shows slow response rates in our tests and will be unsatisfactory for gamers. In comparison, all tested devices range from 0.1 (minimum) to 240 (maximum) ms. » 94 % of all devices are better. This means that the measured response time is worse than the average of all tested devices (19.9 ms). | ||
| ↔ Response Time 50% Grey to 80% Grey | ||
| 55 ms ... rise ↗ and fall ↘ combined | ↗ 27 ms rise | 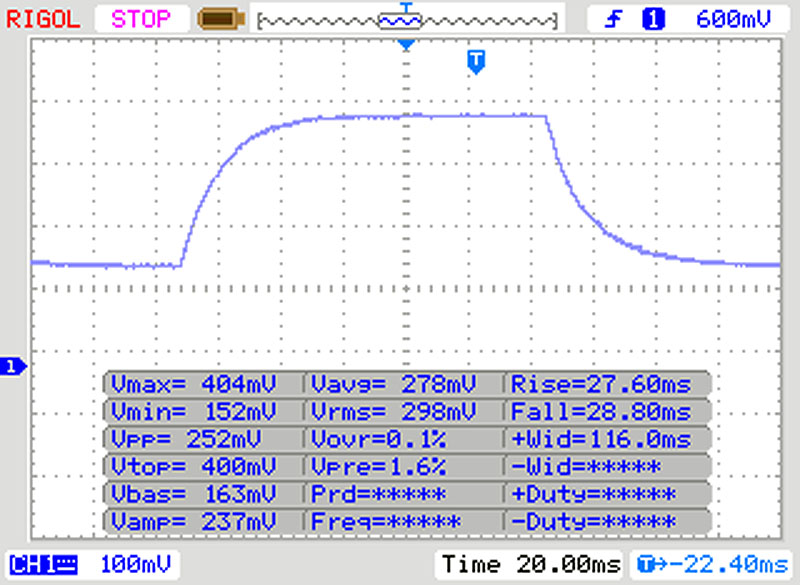 |
| ↘ 28 ms fall | ||
| The screen shows slow response rates in our tests and will be unsatisfactory for gamers. In comparison, all tested devices range from 0.165 (minimum) to 636 (maximum) ms. » 92 % of all devices are better. This means that the measured response time is worse than the average of all tested devices (31.1 ms). | ||
Screen Flickering / PWM (Pulse-Width Modulation)
| Screen flickering / PWM not detected | 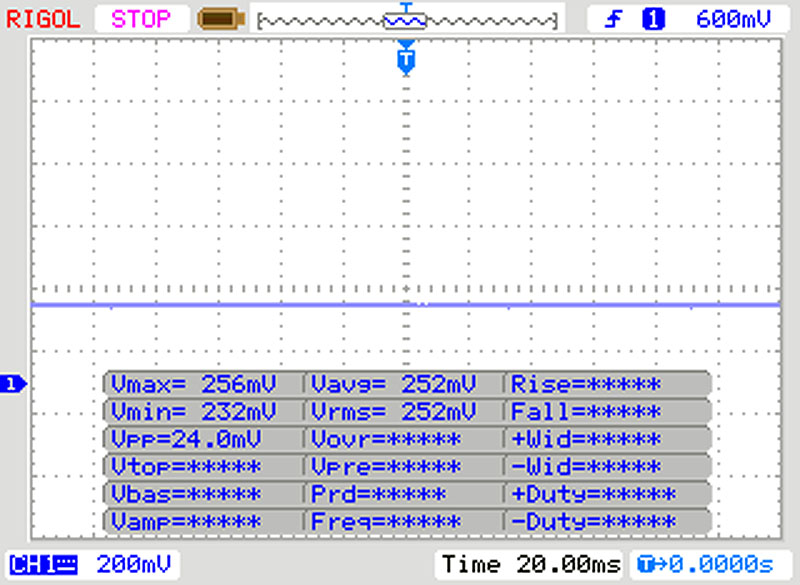 | ||
In comparison: 52 % of all tested devices do not use PWM to dim the display. If PWM was detected, an average of 7801 (minimum: 5 - maximum: 343500) Hz was measured. | |||
The IPS panel of the MSI laptop is very viewing-angle stable. Content can be read from almost any angle without it becoming distorted or showing the wrong colors.

Performance - Good performance that drops sharply in the long run
With the Prestige 14, MSI is targeting creatives who would like to do their work on a small and mobile laptop. Performance should be just as good as with larger laptops. In addition to the configuration variant tested here, other display and storage configurations are also available.
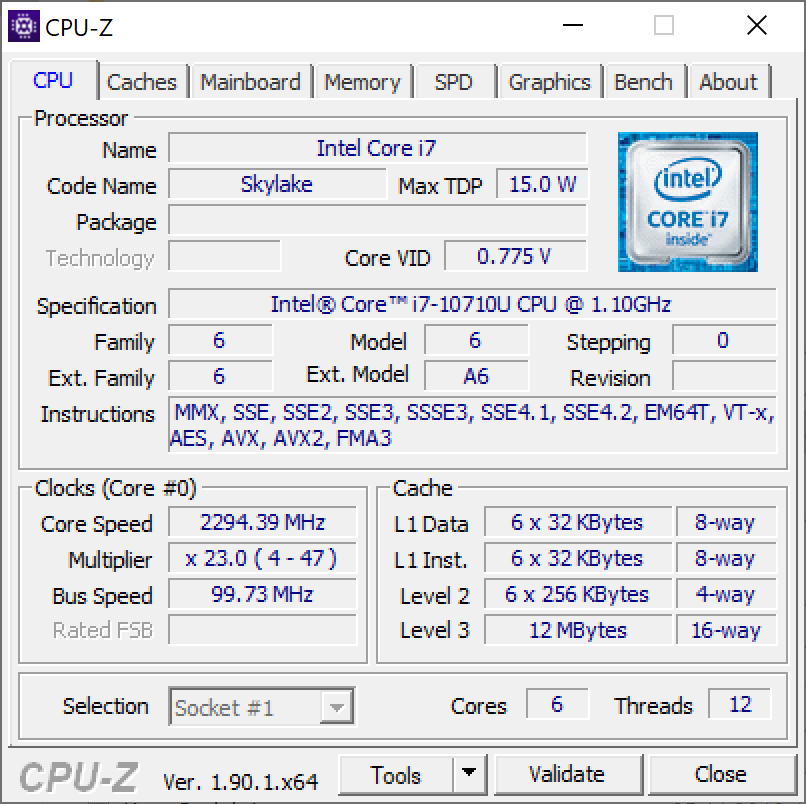

Processor
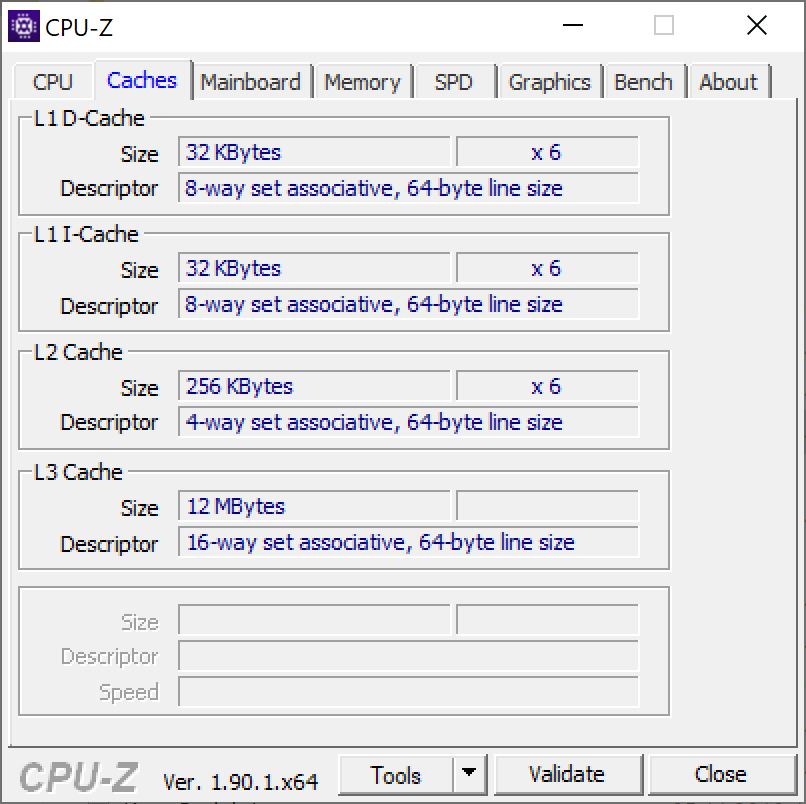
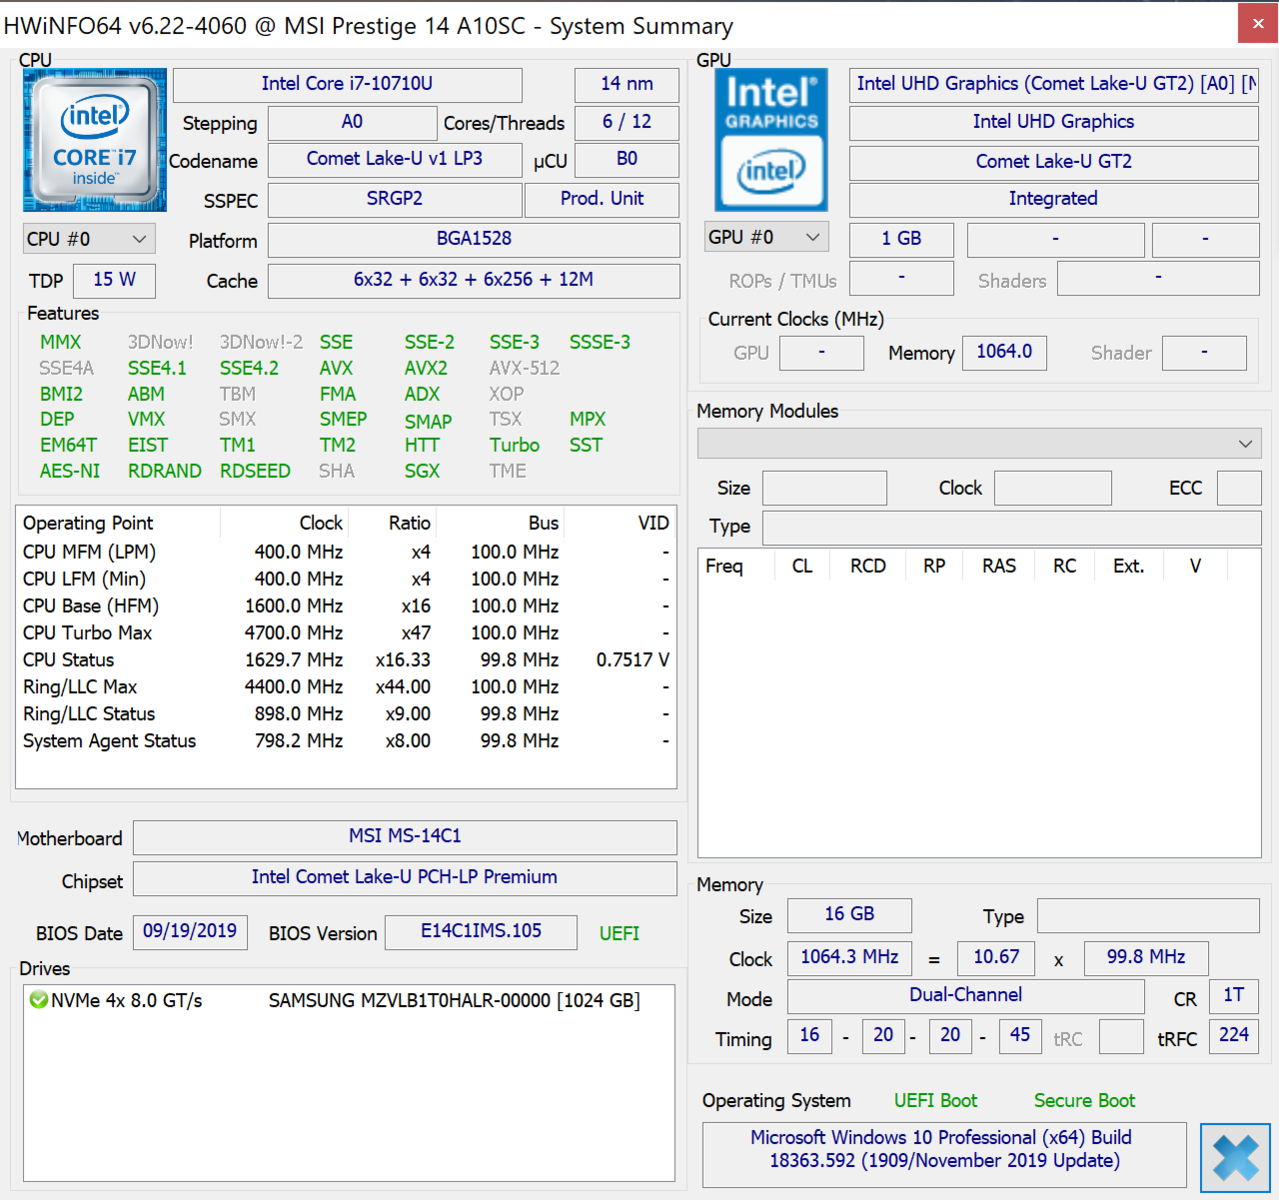
MSI uses an Intel Core i7-10710U in the Prestige 14. This processor offers six cores and can handle up to 12 threads simultaneously. The clock rates are between 1.1 and 4.7 GHz, whereby the maximum frequency can only be maintained longer with sufficient cooling. To control performance, MSI offers users four preconfigured profiles that affect maximum speed and therefore also loudness and battery life.
Our benchmarks were performed in the Performance profile, with which the MSI laptop reaches a very good value of 1,100 points at the beginning of our Cinebench R15 continuous load loop. Shortly thereafter, however, the performance drops by about 30% and this value can be maintained until the end of the test. In the individual disciplines for single-core and multi-core performance, the Prestige 14 can meet our expectations for the CPU. If the "Silent" profile is activated, the small laptop only reaches a value of 390 points in the Cinebench R15 Multi test.
System performance
In the PCMark 10 test, the MSI Prestige 14 can place itself ahead of our chosen competitors and clearly sets itself apart from the test field, especially in the "Content Creation" individual discipline. In the PCMark 8 individual ratings for "Home" and "Work", however, it's only enough for a place in the midfield. In everyday life, the Prestige 14 shows no weaknesses. We were able to operate the system smoothly and without micro-stuttering or anything similar at all times. Files were accessed without delays, and programs were also opened quickly.
The performance reached by other systems in our tests is listed in our CPU Benchmarks article.
| PCMark 8 Home Score Accelerated v2 | 3511 points | |
| PCMark 8 Work Score Accelerated v2 | 4422 points | |
| PCMark 10 Score | 5150 points | |
Help | ||
Storage
The Samsung SSD that's built into the MSI Prestige 14 achieves very fast write and read speeds in our storage benchmark. Since this storage device is also used in most competing products in our test field, the difference isn't too big.
How other storage devices performed in comparison to the SSD installed here can be found in our HDD/SSD Benchmarks article.
| MSI Prestige 14 A10SC-009 Samsung SSD PM981 MZVLB1T0HALR | MSI Prestige 15 A10SC Samsung SSD PM981 MZVLB1T0HALR | Razer Blade Stealth 13, Core i7-1065G7 Lite-On CA3-8D512 | Asus ZenBook 15 UX534FT-DB77 Samsung SSD PM981 MZVLB1T0HALR | HP ZBook 15u G6 6TP54EA Samsung SSD PM981 MZVLB512HAJQ | Average Samsung SSD PM981 MZVLB1T0HALR | |
|---|---|---|---|---|---|---|
| CrystalDiskMark 5.2 / 6 | -14% | 10% | 6% | -6% | 2% | |
| Write 4K (MB/s) | 163.8 | 150.8 -8% | 153 -7% | 141.6 -14% | 156 -5% | 165.7 ? 1% |
| Read 4K (MB/s) | 48.6 | 47.3 -3% | 59.5 22% | 45.28 -7% | 45.73 -6% | 44.6 ? -8% |
| Write Seq (MB/s) | 2269 | 981 -57% | 1608 -29% | 1975 -13% | 1158 -49% | 1982 ? -13% |
| Read Seq (MB/s) | 1963 | 976 -50% | 2293 17% | 2272 16% | 1132 -42% | 1764 ? -10% |
| Write 4K Q32T1 (MB/s) | 289.8 | 442.7 53% | 497 71% | 458.6 58% | 369.2 27% | 395 ? 36% |
| Read 4K Q32T1 (MB/s) | 373.6 | 499.7 34% | 544 46% | 391.4 5% | 573 53% | 434 ? 16% |
| Write Seq Q32T1 (MB/s) | 2395 | 1706 -29% | 1640 -32% | 2393 0% | 1969 -18% | 2351 ? -2% |
| Read Seq Q32T1 (MB/s) | 3479 | 1758 -49% | 3158 -9% | 3464 0% | 3138 -10% | 3234 ? -7% |
| Write 4K Q8T8 (MB/s) | 960 | 1408 ? | ||||
| Read 4K Q8T8 (MB/s) | 844 | 1449 ? | ||||
| AS SSD | -15% | -26% | -13% | 2% | -4% | |
| Seq Read (MB/s) | 2300 | 1274 -45% | 2666 16% | 1887 -18% | 2083 -9% | 1993 ? -13% |
| Seq Write (MB/s) | 2051 | 1395 -32% | 1497 -27% | 1432 -30% | 1715 -16% | 2036 ? -1% |
| 4K Read (MB/s) | 46.23 | 50.3 9% | 53.7 16% | 52.3 13% | 55.3 20% | 46.4 ? 0% |
| 4K Write (MB/s) | 84.6 | 119.8 42% | 133.7 58% | 146 73% | 137.6 63% | 109.7 ? 30% |
| 4K-64 Read (MB/s) | 1552 | 1599 3% | 652 -58% | 969 -38% | 1211 -22% | 1502 ? -3% |
| 4K-64 Write (MB/s) | 1789 | 1455 -19% | 272 -85% | 1375 -23% | 1446 -19% | 1625 ? -9% |
| Access Time Read * (ms) | 0.049 | 0.044 10% | 0.075 -53% | 0.034 31% | 0.039 20% | 0.05158 ? -5% |
| Access Time Write * (ms) | 0.045 | 0.092 -104% | 0.032 29% | 0.075 -67% | 0.026 42% | 0.05581 ? -24% |
| Score Read (Points) | 1828 | 1777 -3% | 972 -47% | 1210 -34% | 1474 -19% | 1747 ? -4% |
| Score Write (Points) | 2079 | 1714 -18% | 555 -73% | 1664 -20% | 1755 -16% | 1942 ? -7% |
| Score Total (Points) | 4831 | 4411 -9% | 1982 -59% | 3483 -28% | 3976 -18% | 4588 ? -5% |
| Total Average (Program / Settings) | -15% /
-14% | -8% /
-11% | -4% /
-5% | -2% /
-1% | -1% /
-1% |
* ... smaller is better

Graphics card
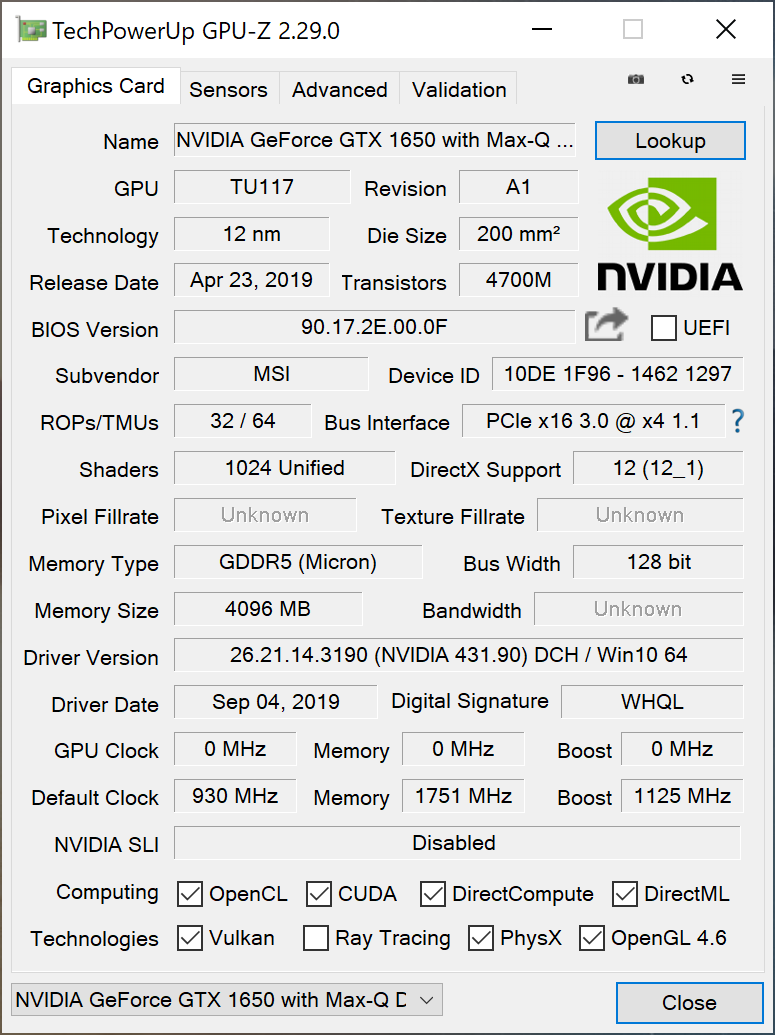
In MSI's Prestige 14, an Nvidia GeForce GTX 1650 in the more energy-saving Max-Q version takes care of displaying graphically demanding image content. In the benchmarks, it achieves results about 10% lower than other laptops with this graphics card. However, the performance is still sufficient for photo and video-editing.
Our GPU Benchmarks article shows the performance reached by other graphics cards in our tests.
| 3DMark 11 Performance | 10232 points | |
| 3DMark Cloud Gate Standard Score | 14259 points | |
| 3DMark Fire Strike Score | 6517 points | |
Help | ||
Gaming performance
Despite its focus on content creators, the MSI Prestige 14 could also be of interest to gamers. Here, however, the Full HD version is more suitable, since the 4K screen doesn't offer much added value at a size of 14 inches. The performance of the Nvidia GeForce GTX 1650 Max-Q is definitely sufficient to execute modern titles and also display them in Full HD with smooth frame rates to a greater extent.
The performance that can be expected in different titles from the GPU installed here can be found in our GPU Games article.
| BioShock Infinite - 1920x1080 Ultra Preset, DX11 (DDOF) | |
| MSI Prestige 15 A10SC | |
| Average NVIDIA GeForce GTX 1650 Max-Q (70.2 - 84.3, n=7) | |
| Asus ZenBook 15 UX534FT-DB77 | |
| Razer Blade Stealth 13, Core i7-1065G7 | |
| MSI Prestige 14 A10SC-009 | |
| HP ZBook 15u G6 6TP54EA | |
| Dota 2 Reborn | |
| 3840x2160 ultra (3/3) best looking | |
| Average of class Multimedia (31.8 - 139.3, n=5, last 2 years) | |
| HP ZBook 15u G6 6TP54EA | |
| 1920x1080 ultra (3/3) best looking | |
| Average of class Multimedia (29 - 179.9, n=68, last 2 years) | |
| Average NVIDIA GeForce GTX 1650 Max-Q (64.4 - 105.6, n=5) | |
| MSI Prestige 14 A10SC-009 | |
| HP ZBook 15u G6 6TP54EA | |
| 1920x1080 high (2/3) | |
| Average NVIDIA GeForce GTX 1650 Max-Q (71.2 - 128, n=5) | |
| Average of class Multimedia (31.1 - 196.9, n=68, last 2 years) | |
| MSI Prestige 14 A10SC-009 | |
| HP ZBook 15u G6 6TP54EA | |
| Final Fantasy XV Benchmark | |
| 3840x2160 High Quality | |
| Average of class Multimedia (8.98 - 83.4, n=5, last 2 years) | |
| Average NVIDIA GeForce GTX 1650 Max-Q (8.7 - 9.6, n=2) | |
| MSI Prestige 14 A10SC-009 | |
| 1920x1080 High Quality | |
| Average of class Multimedia (7.61 - 144.4, n=66, last 2 years) | |
| Average NVIDIA GeForce GTX 1650 Max-Q (23.1 - 33.1, n=3) | |
| MSI Prestige 14 A10SC-009 | |
| 1920x1080 Standard Quality | |
| Average of class Multimedia (11.4 - 181.1, n=66, last 2 years) | |
| Average NVIDIA GeForce GTX 1650 Max-Q (36.7 - 45.7, n=3) | |
| MSI Prestige 14 A10SC-009 | |
| 1280x720 Lite Quality | |
| Average of class Multimedia (21.4 - 232, n=65, last 2 years) | |
| Average NVIDIA GeForce GTX 1650 Max-Q (51.7 - 91.2, n=2) | |
| MSI Prestige 14 A10SC-009 | |
| low | med. | high | ultra | 4K | |
|---|---|---|---|---|---|
| BioShock Infinite (2013) | 70.2 | ||||
| Dota 2 Reborn (2015) | 86.2 | 76.5 | 71.2 | 64.4 | |
| Final Fantasy XV Benchmark (2018) | 51.7 | 36.7 | 23.1 | 8.7 | |
| Star Wars Jedi Fallen Order (2019) | 50.4 | 40.3 | 39.6 | 12.7 |
Emissions - Good speakers and a lot of heat
Noise emissions
Noise development in the MSI Prestige 14 depends strongly on the chosen performance profile. In the "High Performance" profile, the laptop can be heard clearly and is noticeable with a highly noisy fan. With the "Silent" profile, on the other hand, the MSI Prestige is also suitable for work in noise-sensitive areas.
Noise level
| Idle |
| 30.3 / 30.3 / 30.3 dB(A) |
| Load |
| 40.2 / 43.5 dB(A) |
 | ||
30 dB silent 40 dB(A) audible 50 dB(A) loud |
||
min: | ||
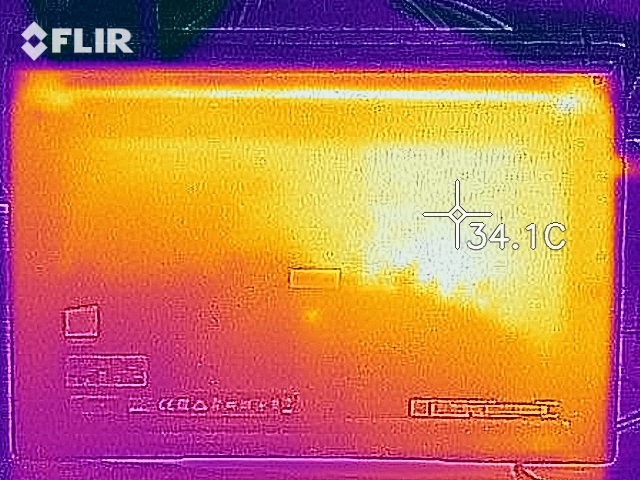
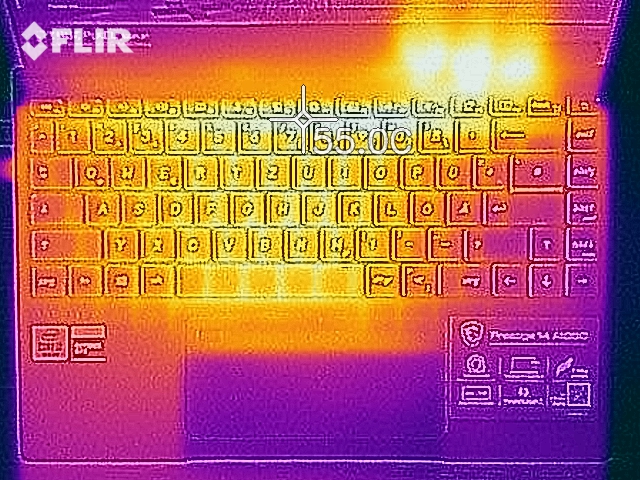
Temperature
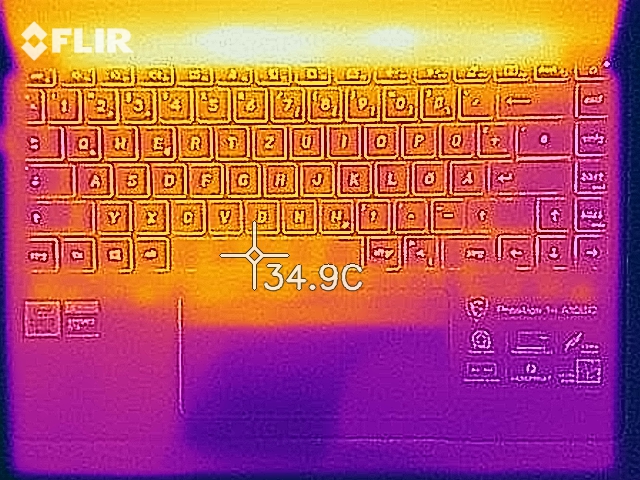
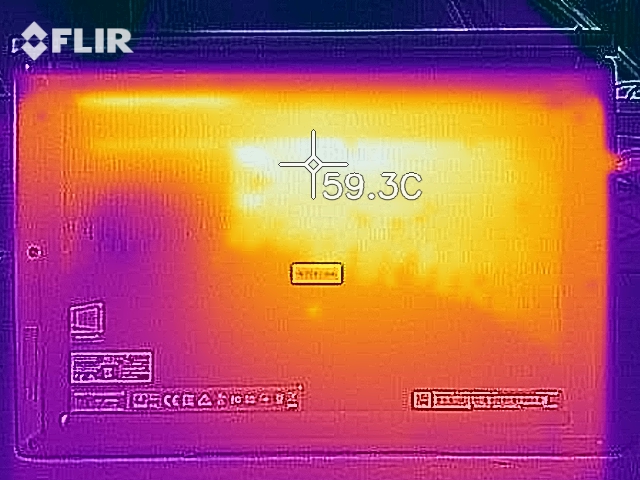
Our measurements certify that the MSI Prestige 14 reaches surface temperatures of 28.2 °C (~83 °F) maximum when idle and up to 51 °C (~124 °F) under load. In doing so, the palm rest also feels warm and the laptop gets hot in the rear center area. Therefore, using it on the lap is only just possible.
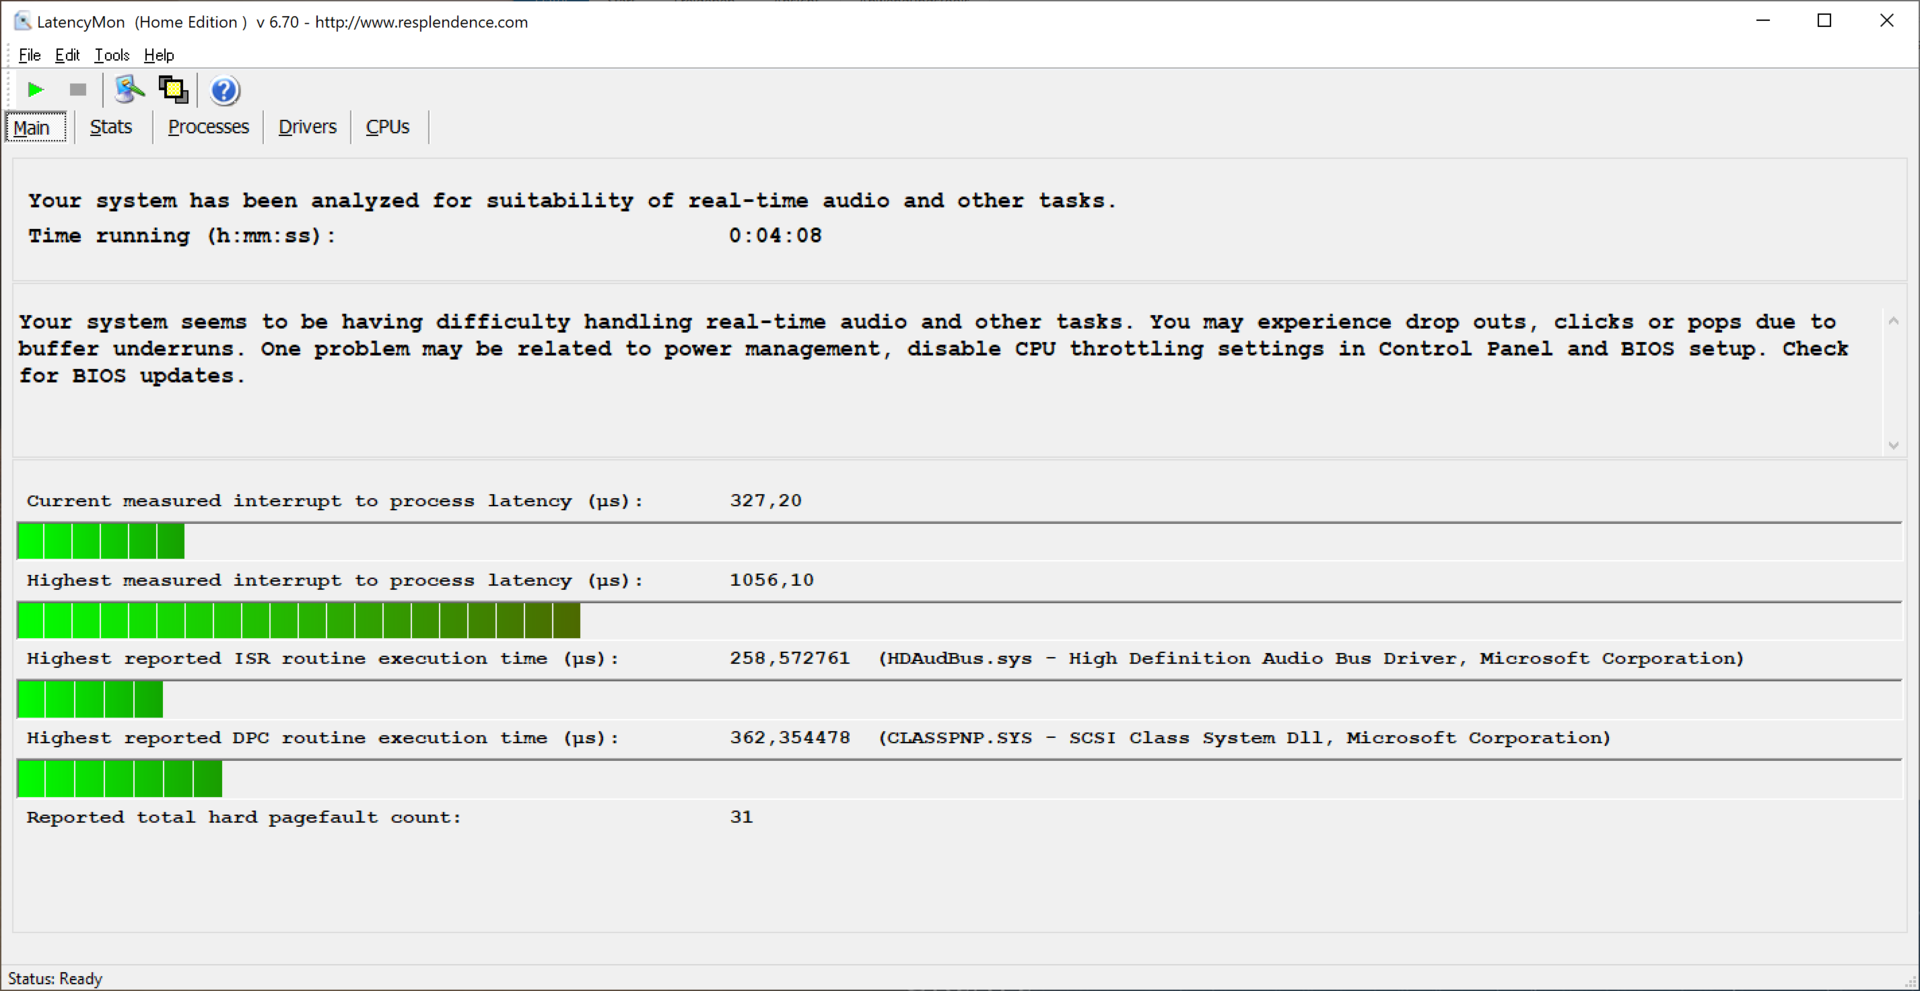
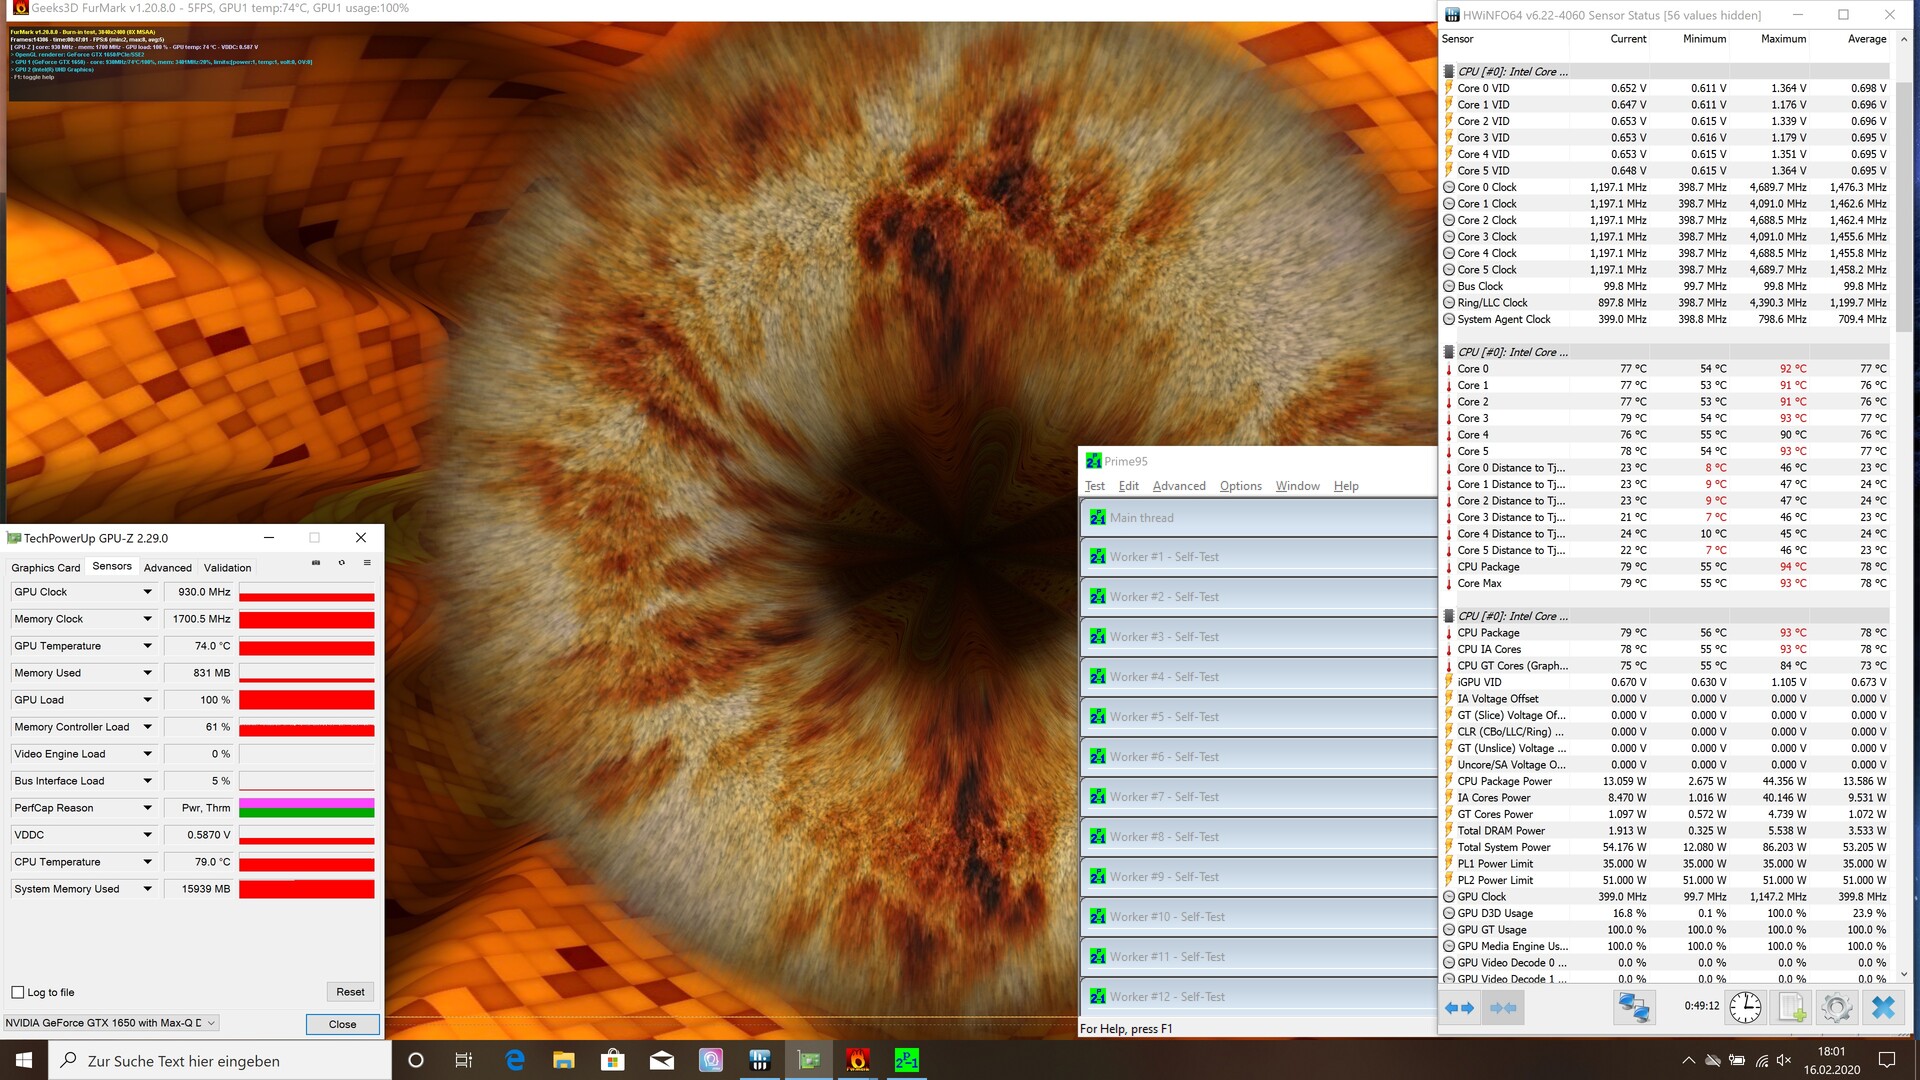
In our approximately one-hour-long stress test, the temperatures inside the Prestige 14 rise to over 90 °C (~194 °F). In the process, the clock rates drop extremely sharply for a short time but stabilize at about 1.4 GHz. This means that the system remains usable, and the cooling system can handle the heavy load. Therefore, users don't have to expect restrictions due to excessive temperatures even with prolonged use of the MSI laptop.
(-) The maximum temperature on the upper side is 48 °C / 118 F, compared to the average of 36.8 °C / 98 F, ranging from 21 to 71 °C for the class Multimedia.
(-) The bottom heats up to a maximum of 51 °C / 124 F, compared to the average of 39.1 °C / 102 F
(+) In idle usage, the average temperature for the upper side is 26.9 °C / 80 F, compared to the device average of 31.3 °C / 88 F.
(+) The palmrests and touchpad are reaching skin temperature as a maximum (35.2 °C / 95.4 F) and are therefore not hot.
(-) The average temperature of the palmrest area of similar devices was 28.7 °C / 83.7 F (-6.5 °C / -11.7 F).
Speakers
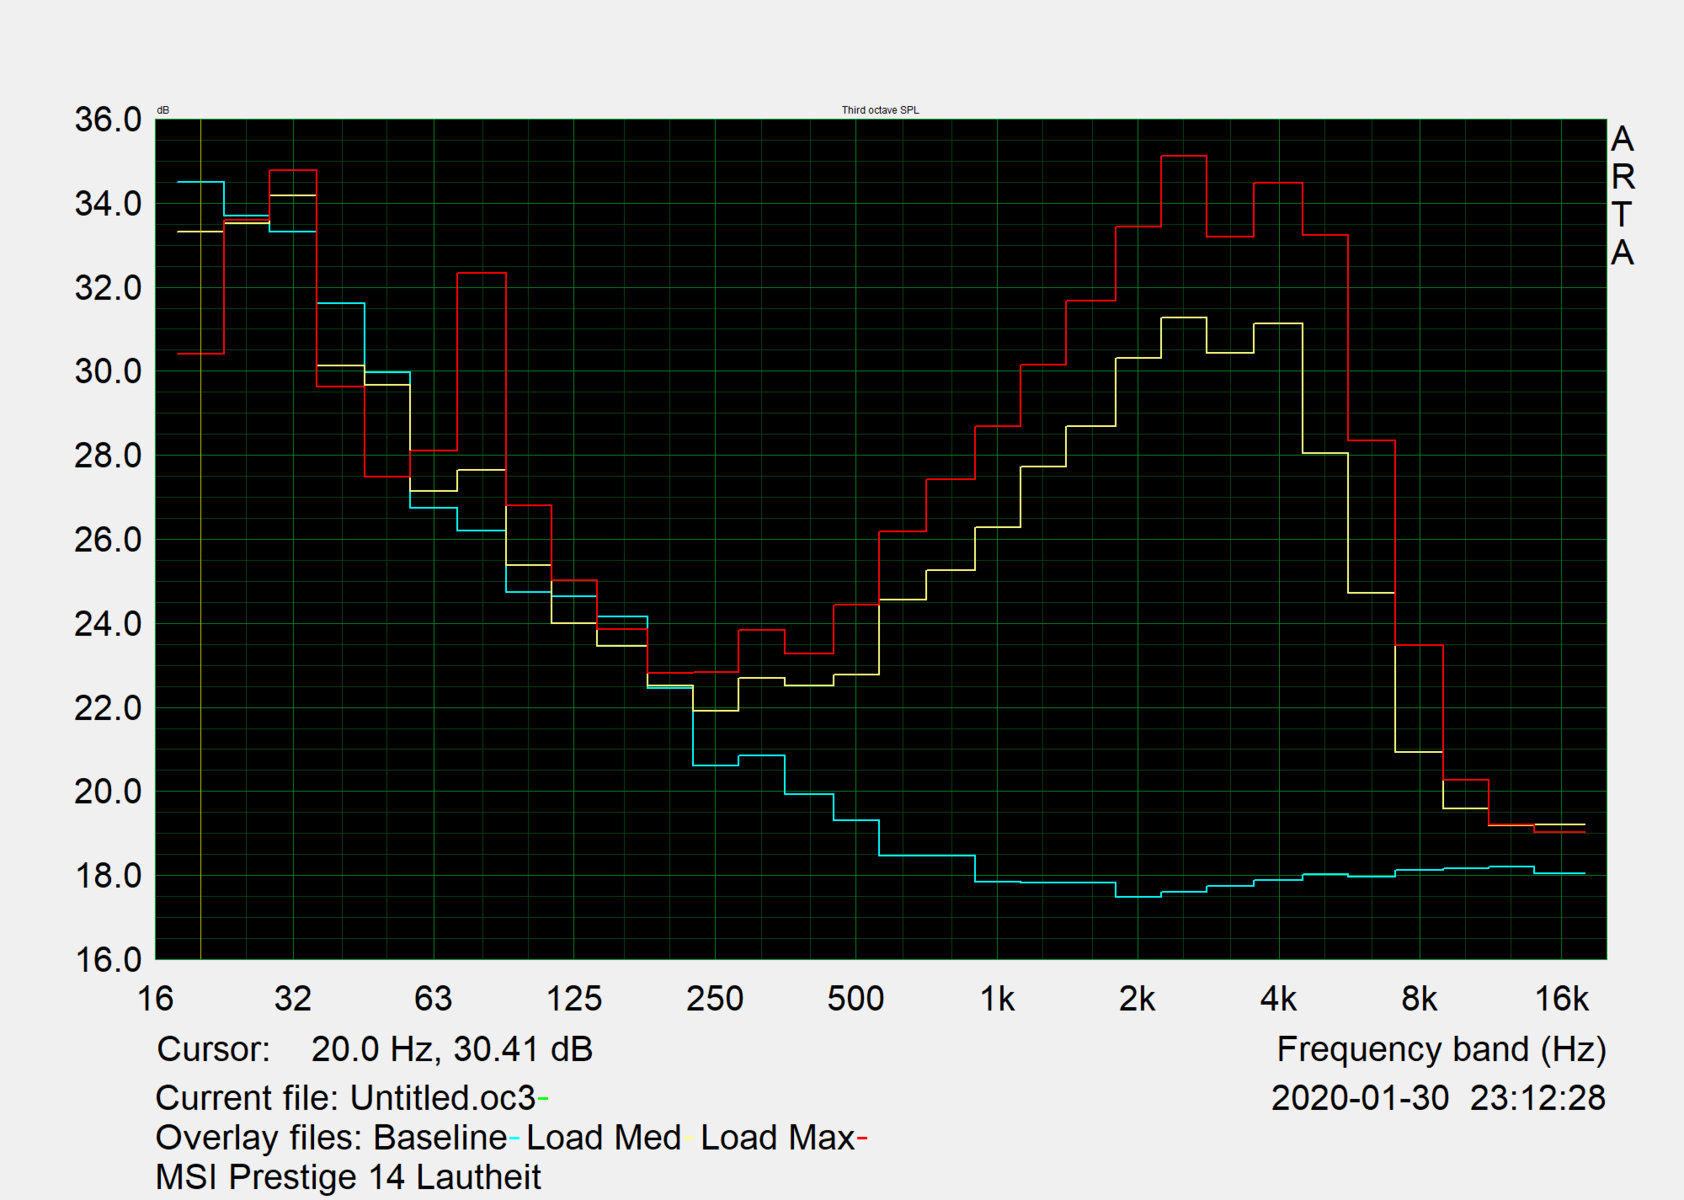
The Prestige 14's 2x2 W speakers offer a comparatively high volume and a wide sound spectrum, whereby only low tones are slightly underrepresented. This makes the MSI laptop also suitable for the occasional consumption of media content. External speakers or headphones can be connected to the laptop via the existing 3.5 mm audio jack.
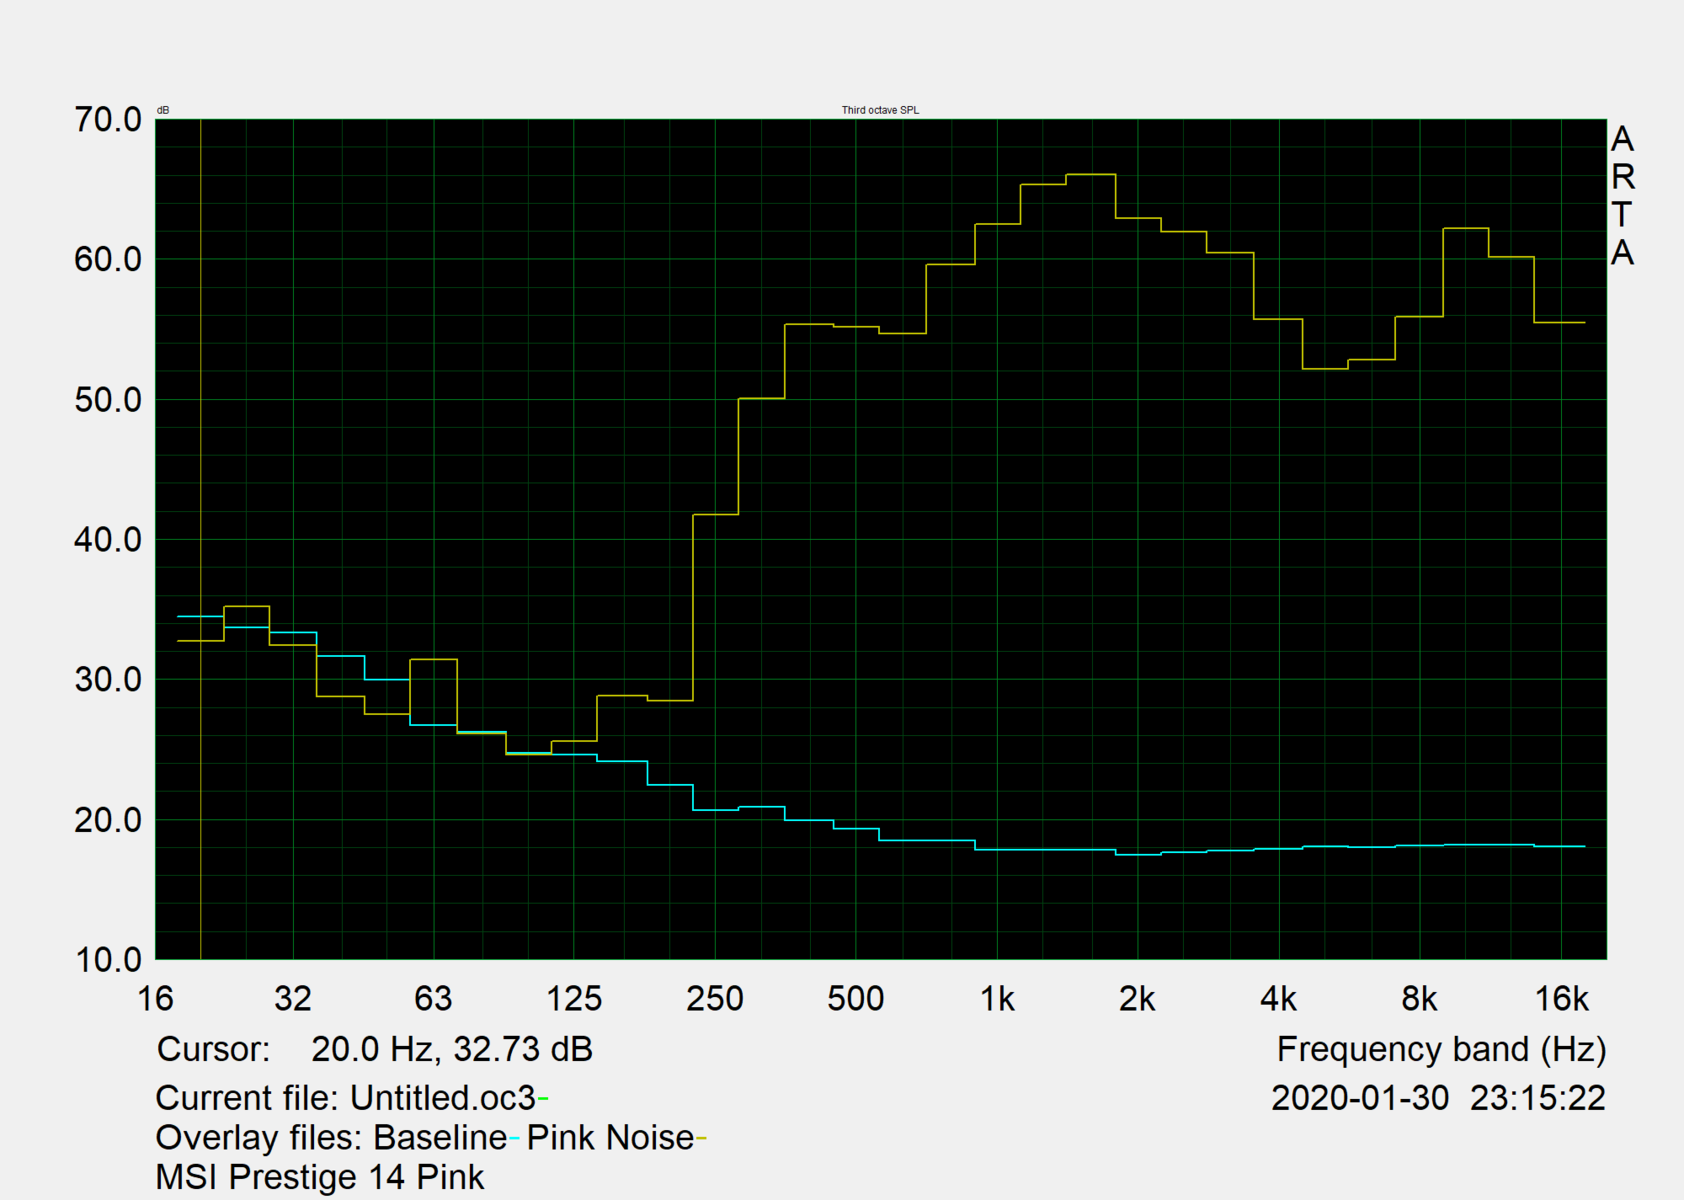
Razer Blade Stealth 13, Core i7-1065G7 audio analysis
(-) | not very loud speakers (68.5 dB)
Bass 100 - 315 Hz
(±) | reduced bass - on average 14.1% lower than median
(±) | linearity of bass is average (13.6% delta to prev. frequency)
Mids 400 - 2000 Hz
(±) | higher mids - on average 6.2% higher than median
(±) | linearity of mids is average (7.2% delta to prev. frequency)
Highs 2 - 16 kHz
(+) | balanced highs - only 1.5% away from median
(+) | highs are linear (5% delta to prev. frequency)
Overall 100 - 16.000 Hz
(±) | linearity of overall sound is average (18.2% difference to median)
Compared to same class
» 52% of all tested devices in this class were better, 7% similar, 41% worse
» The best had a delta of 5%, average was 18%, worst was 53%
Compared to all devices tested
» 39% of all tested devices were better, 8% similar, 53% worse
» The best had a delta of 4%, average was 24%, worst was 134%
Energy management - MSI laptop offers fast-charging function
Energy consumption
According to our measurements, the Prestige 14 shows a power consumption of at least 5.2 watts in idle usage and up to 67 watts under load. On average, energy demand is at a similar level to comparable devices.
The included power adapter offers an output of 90 watts and has therefore a sufficiently high capacity to reliably supply the MSI Prestige 14 with energy.
| Off / Standby | |
| Idle | |
| Load |
|
Key:
min: | |
| MSI Prestige 14 A10SC-009 i7-10710U, GeForce GTX 1650 Max-Q, Samsung SSD PM981 MZVLB1T0HALR, IPS, 3840x2160, 14" | MSI Prestige 15 A10SC i7-10710U, GeForce GTX 1650 Max-Q, Samsung SSD PM981 MZVLB1T0HALR, IPS, 3840x2160, 15.6" | Razer Blade Stealth 13, Core i7-1065G7 i7-1065G7, GeForce GTX 1650 Max-Q, Lite-On CA3-8D512, IPS LED, 3840x2160, 13.3" | Asus ZenBook 15 UX534FT-DB77 i7-8565U, GeForce GTX 1650 Max-Q, Samsung SSD PM981 MZVLB1T0HALR, IPS, 1920x1080, 15.6" | HP ZBook 15u G6 6TP54EA i7-8565U, Radeon Pro WX 3200, Samsung SSD PM981 MZVLB512HAJQ, IPS, 3840x2160, 15.6" | Average NVIDIA GeForce GTX 1650 Max-Q | Average of class Multimedia | |
|---|---|---|---|---|---|---|---|
| Power Consumption | -21% | -25% | -29% | 8% | -26% | -9% | |
| Idle Minimum * (Watt) | 5.2 | 6.1 -17% | 10.7 -106% | 5 4% | 5.5 -6% | 7.75 ? -49% | 5.71 ? -10% |
| Idle Average * (Watt) | 12.2 | 13.2 -8% | 13.6 -11% | 13.2 -8% | 9.8 20% | 11.8 ? 3% | 10.1 ? 17% |
| Idle Maximum * (Watt) | 14.3 | 19.2 -34% | 15.7 -10% | 24 -68% | 12 16% | 16.6 ? -16% | 12.4 ? 13% |
| Load Average * (Watt) | 67 | 75 -12% | 60 10% | 70 -4% | 59 12% | 75.2 ? -12% | 65 ? 3% |
| Load Maximum * (Watt) | 67 | 89.7 -34% | 71 -6% | 114 -70% | 70 -4% | 105.5 ? -57% | 112.2 ? -67% |
| Witcher 3 ultra * (Watt) | 74 | 64 | 63.3 | 51 |
* ... smaller is better
Battery life
In our practical Wi-Fi test, the MSI Prestige 14 achieves a runtime of just under 6 hours. This value is in order, especially for a laptop with a 4K panel. However, users who opt for the Full HD variant are likely to achieve a significantly longer runtime.
According to MSI, the Prestige 14 can be used again for 1.5 hours after 15 minutes of charging. With the included charger, the battery took about 2 hours to fully charge.
| MSI Prestige 14 A10SC-009 i7-10710U, GeForce GTX 1650 Max-Q, 52 Wh | MSI Prestige 15 A10SC i7-10710U, GeForce GTX 1650 Max-Q, 82 Wh | Razer Blade Stealth 13, Core i7-1065G7 i7-1065G7, GeForce GTX 1650 Max-Q, 53.1 Wh | Asus ZenBook 15 UX534FT-DB77 i7-8565U, GeForce GTX 1650 Max-Q, 71 Wh | HP ZBook 15u G6 6TP54EA i7-8565U, Radeon Pro WX 3200, 56 Wh | Average of class Multimedia | |
|---|---|---|---|---|---|---|
| Battery runtime | 41% | -11% | 66% | 17% | 79% | |
| Reader / Idle (h) | 9.9 | 19.1 93% | 8.3 -16% | 21.5 117% | 12.4 25% | 25.2 ? 155% |
| WiFi v1.3 (h) | 5.9 | 7.6 29% | 5.5 -7% | 8.4 42% | 6.9 17% | 12 ? 103% |
| Load (h) | 2.1 | 2.1 0% | 1.9 -10% | 2.9 38% | 2.3 10% | 1.675 ? -20% |
Pros
Cons
Verdict - Good performance with trade-offs
The MSI Prestige proved to be a contradicting laptop in our test. Performance is good, but it drops a bit more strongly than in our hands-on in September 2019. The display is already excellently calibrated out of the box and also has a good contrast ratio, but the slightly increased black value and the partly better competition cloud this point a little bit too. Two Thunderbolt 3 ports are also very good in terms of port configuration, but the fact that one of them is blocked by the charger and that the remaining USB Type-A ports are only designed in 2.0 versions is again not that great. Since there is no HDMI port, both Thunderbolt ports will be blocked in extreme cases, whereby a corresponding docking station will naturally remedy this.
The MSI Prestige 14 packs a lot of power. But buyers also have to put up with compromises.
But all of this is nitpicking. The Prestige 14 is equipped with good performance for its size and offers a lot of hardware for its price. There are hardly any maintenance options available, and the compromises that have to be made, for example, in the battery life with the 4K display, can be evaluated by any prospective buyer for themselves. Those who choose to buy this laptop will not be disappointed, but it's also recommended to take a look at the competition.
MSI Prestige 14 A10SC-009
- 02/17/2020 v7 (old)
Mike Wobker
Price comparison
