MSI Prestige 14 Evo laptop review: What are the capabilities of the new Core i7-1195G7?

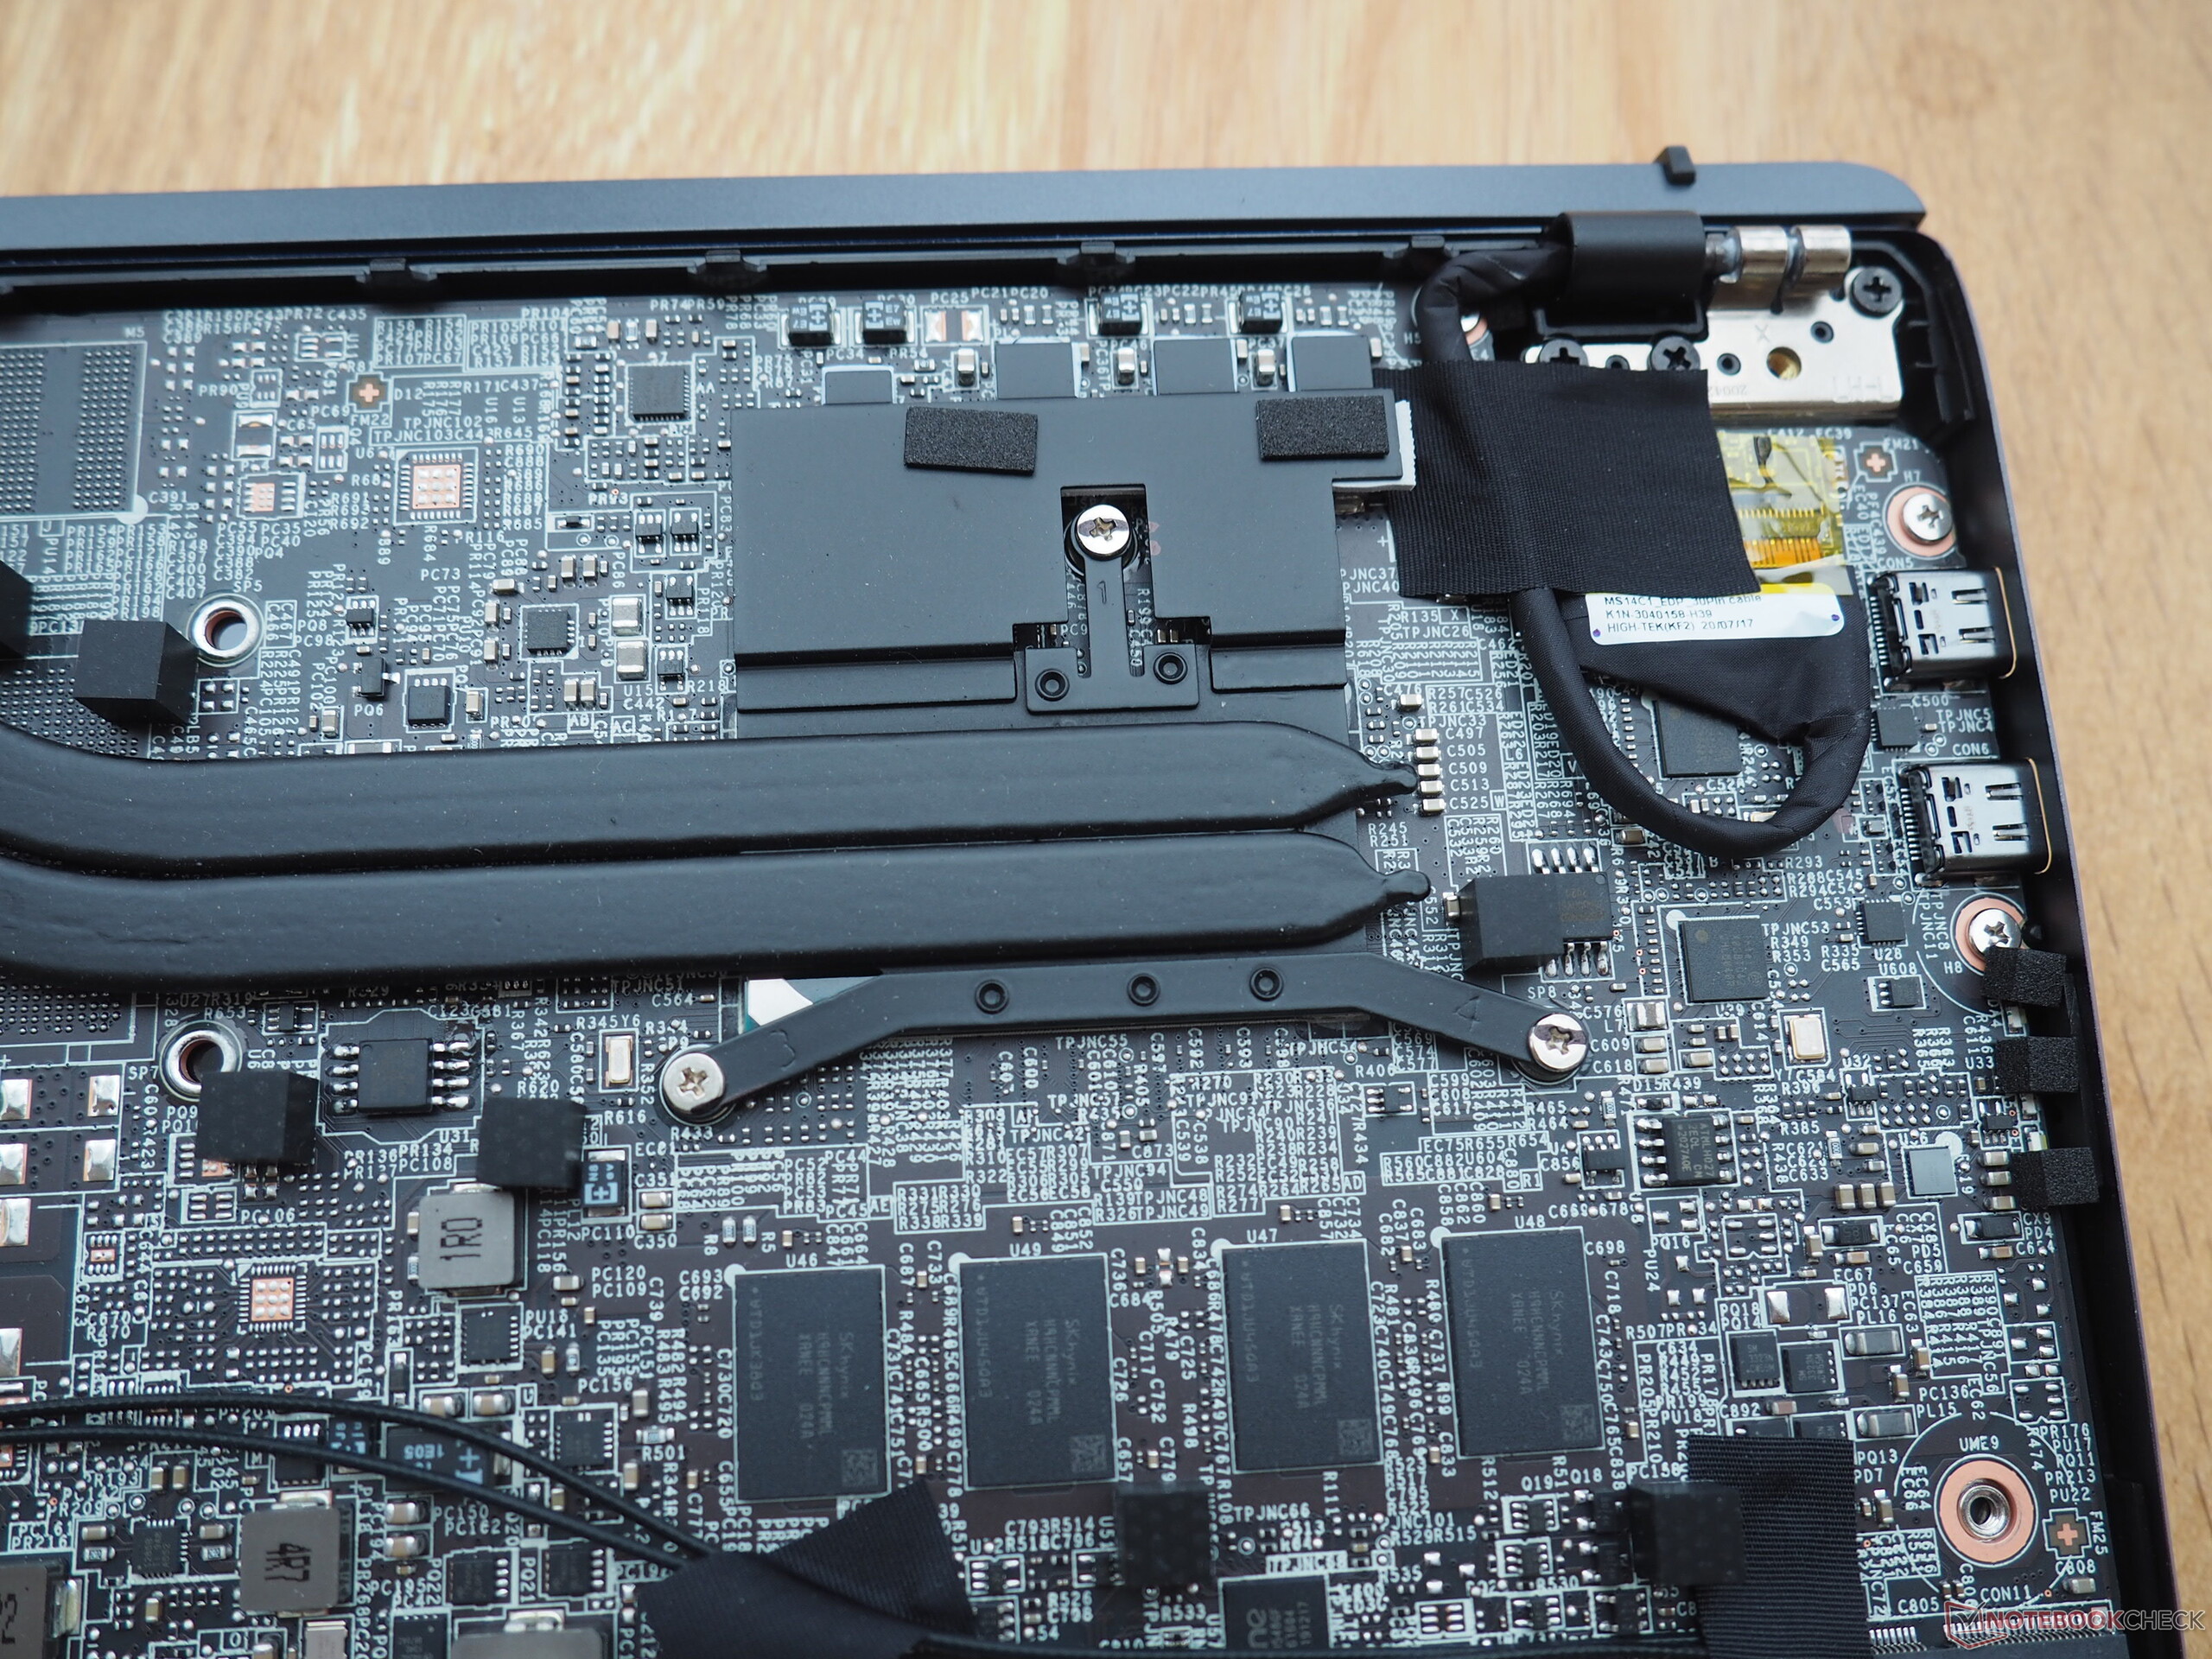
We already had the MSI Prestige 14 Evo with the model number A11M-005 in our test. That was equipped with an Intel Core i7-1185G7 processor, which led to a good system performance. Our current test unit is now equipped with the brand new Intel Core i7-1195G7, which currently represents the top of the line of the Tiger Lake mobile processors. The graphics output is again handled by the internal Intel Iris Xe Graphics G7 graphics unit. In addition, there are 16 GB of working memory and a 512-GB SSD.
Since nothing else has changed in terms of the equipment, we will only look at the system performance in more detail. All the other characteristics of this laptop are described in the review of the MSI Prestige 14 Evo with the Intel Core i7-1185G7. In addition to the comparison devices listed below, you can also select other laptops from our database below each section.
Possible Competitors for Comparison
Rating | Date | Model | Weight | Height | Size | Resolution | Price |
|---|---|---|---|---|---|---|---|
| 85.3 % v7 (old) | 08 / 2021 | MSI Prestige 14 Evo A11MO-026US i7-1195G7, Iris Xe G7 96EUs | 1.2 kg | 16 mm | 14.00" | 1920x1080 | |
| 82.5 % v7 (old) | 12 / 2020 | MSI Prestige 14 Evo A11M-005 i7-1185G7, Iris Xe G7 96EUs | 1.2 kg | 16 mm | 14.00" | 1920x1080 | |
| 89.1 % v7 (old) | 06 / 2021 | Schenker Vision 14 i7-1165G7, Iris Xe G7 96EUs | 1 kg | 15.6 mm | 14.00" | 2880x1800 | |
| 88.5 % v7 (old) | 05 / 2021 | Asus ZenBook 13 UM325S R7 5800U, Vega 8 | 1.2 kg | 13.9 mm | 13.30" | 1920x1080 |
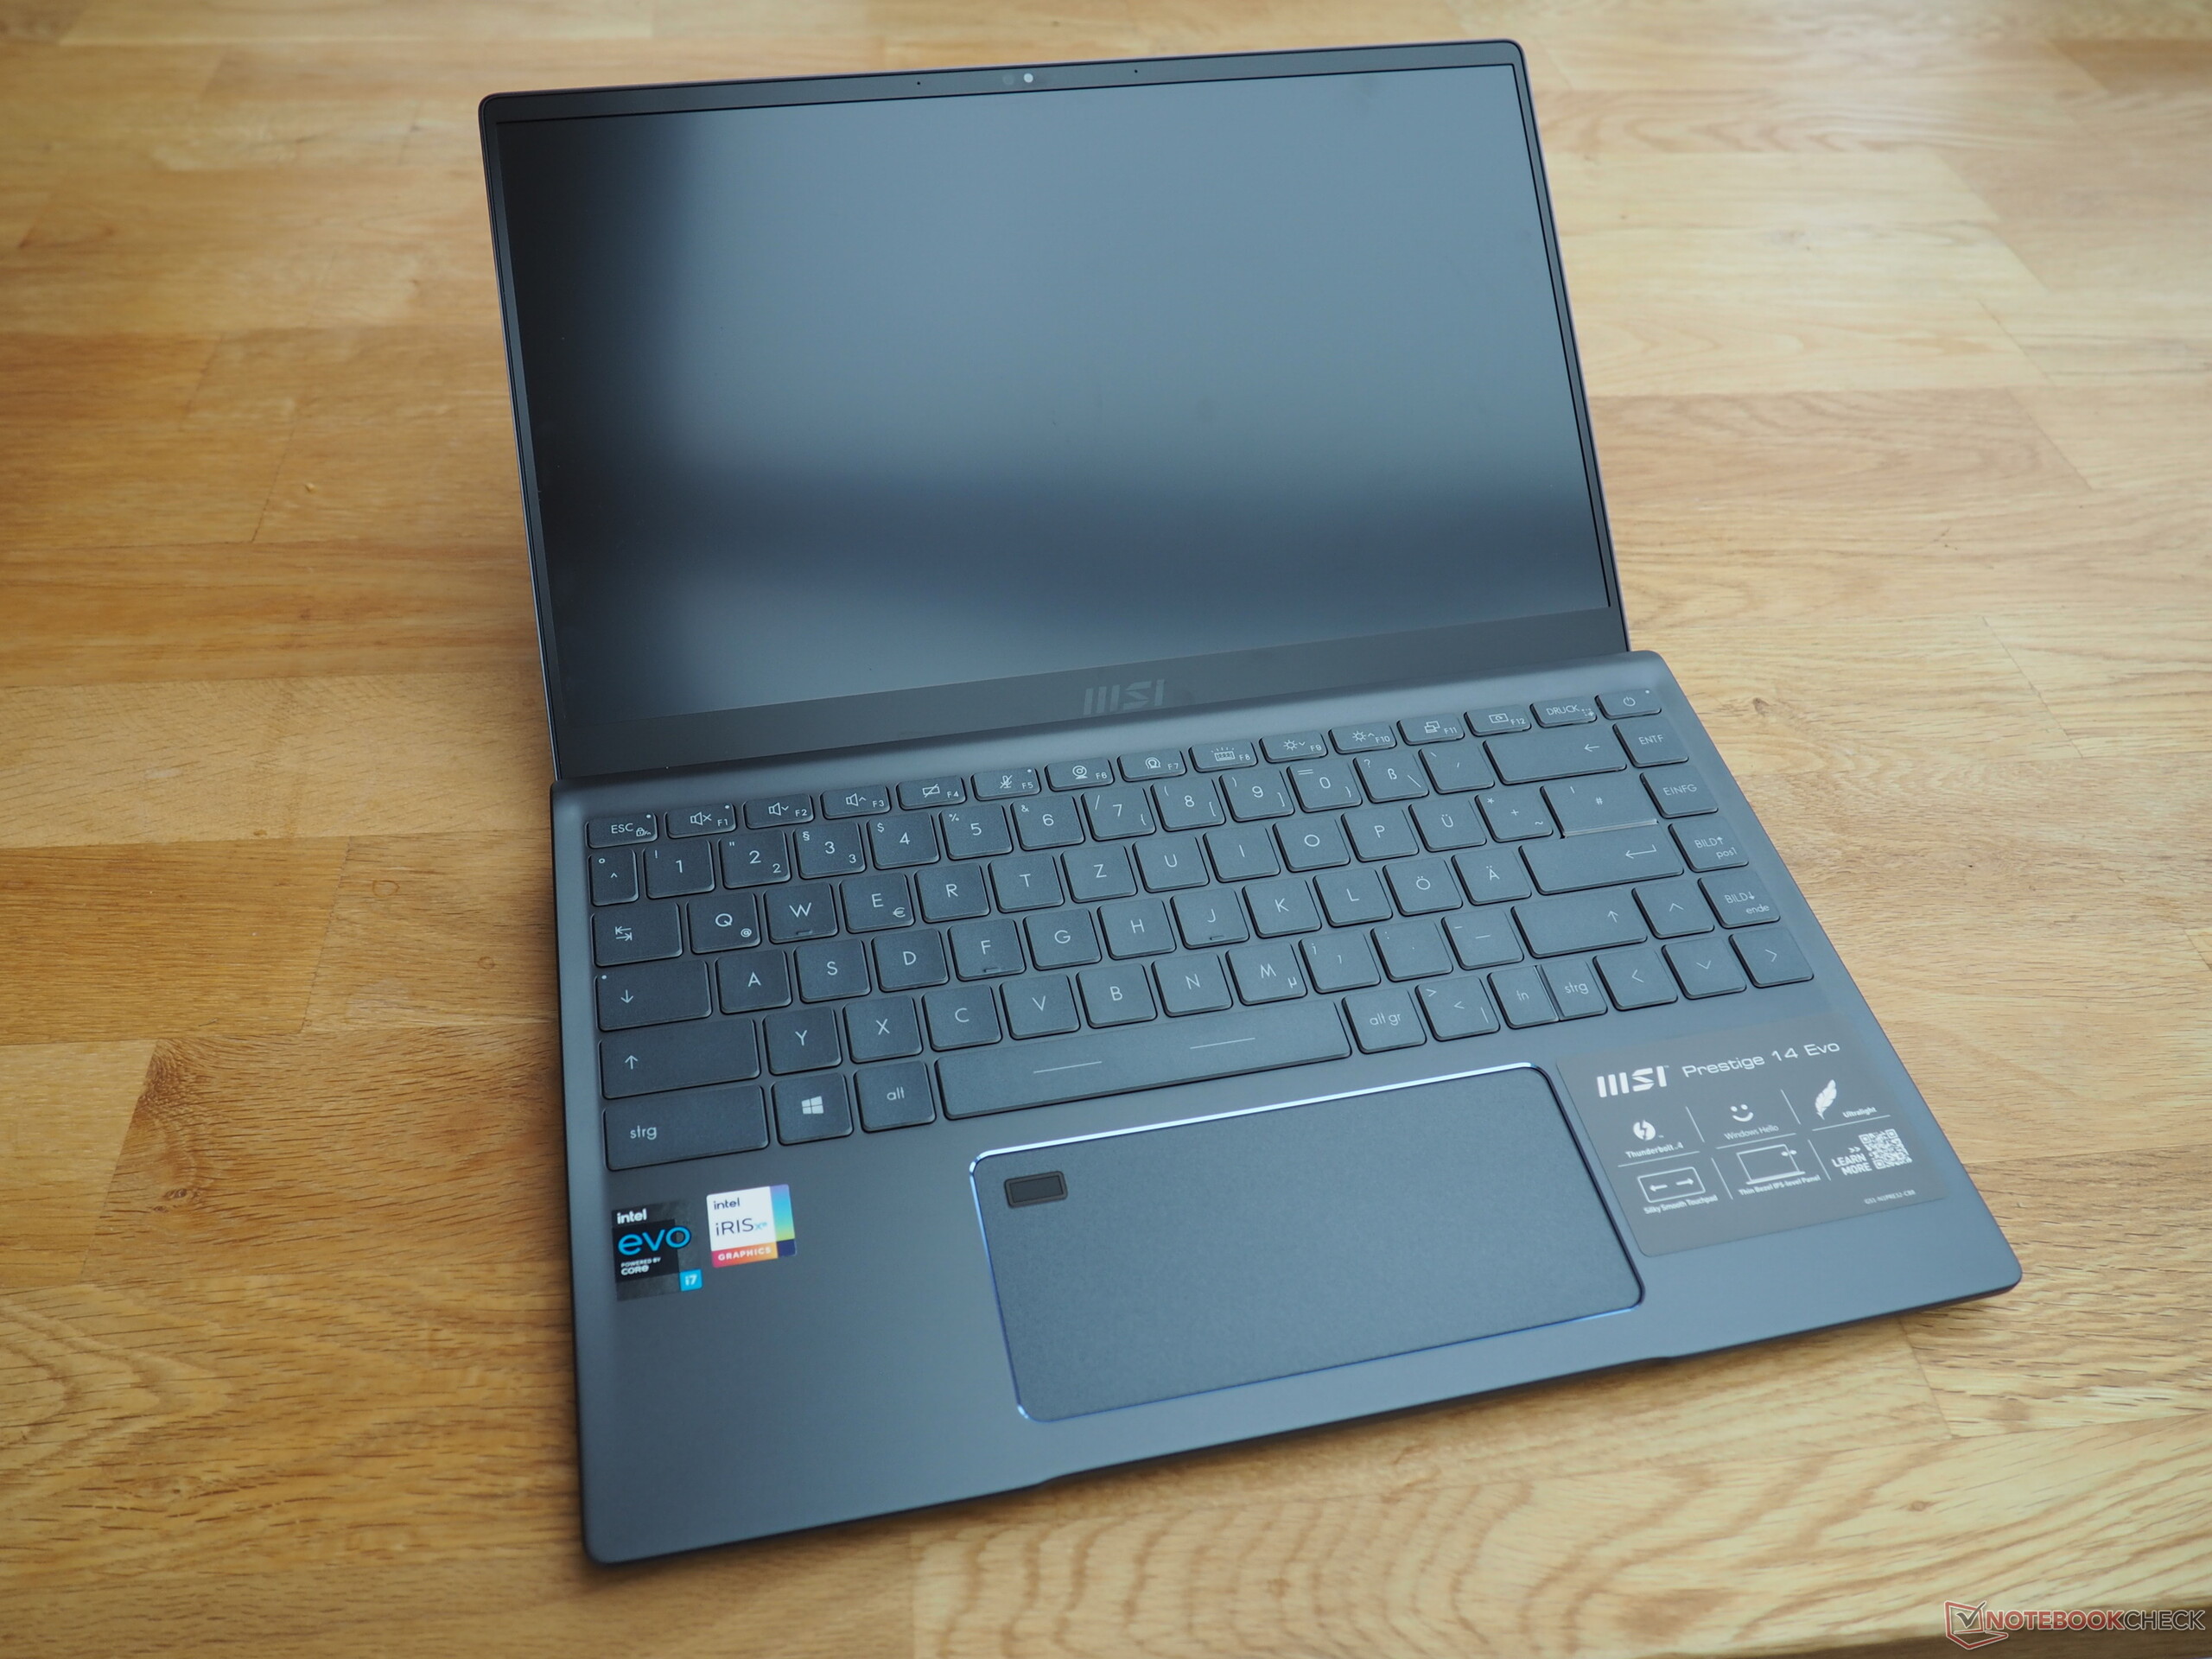
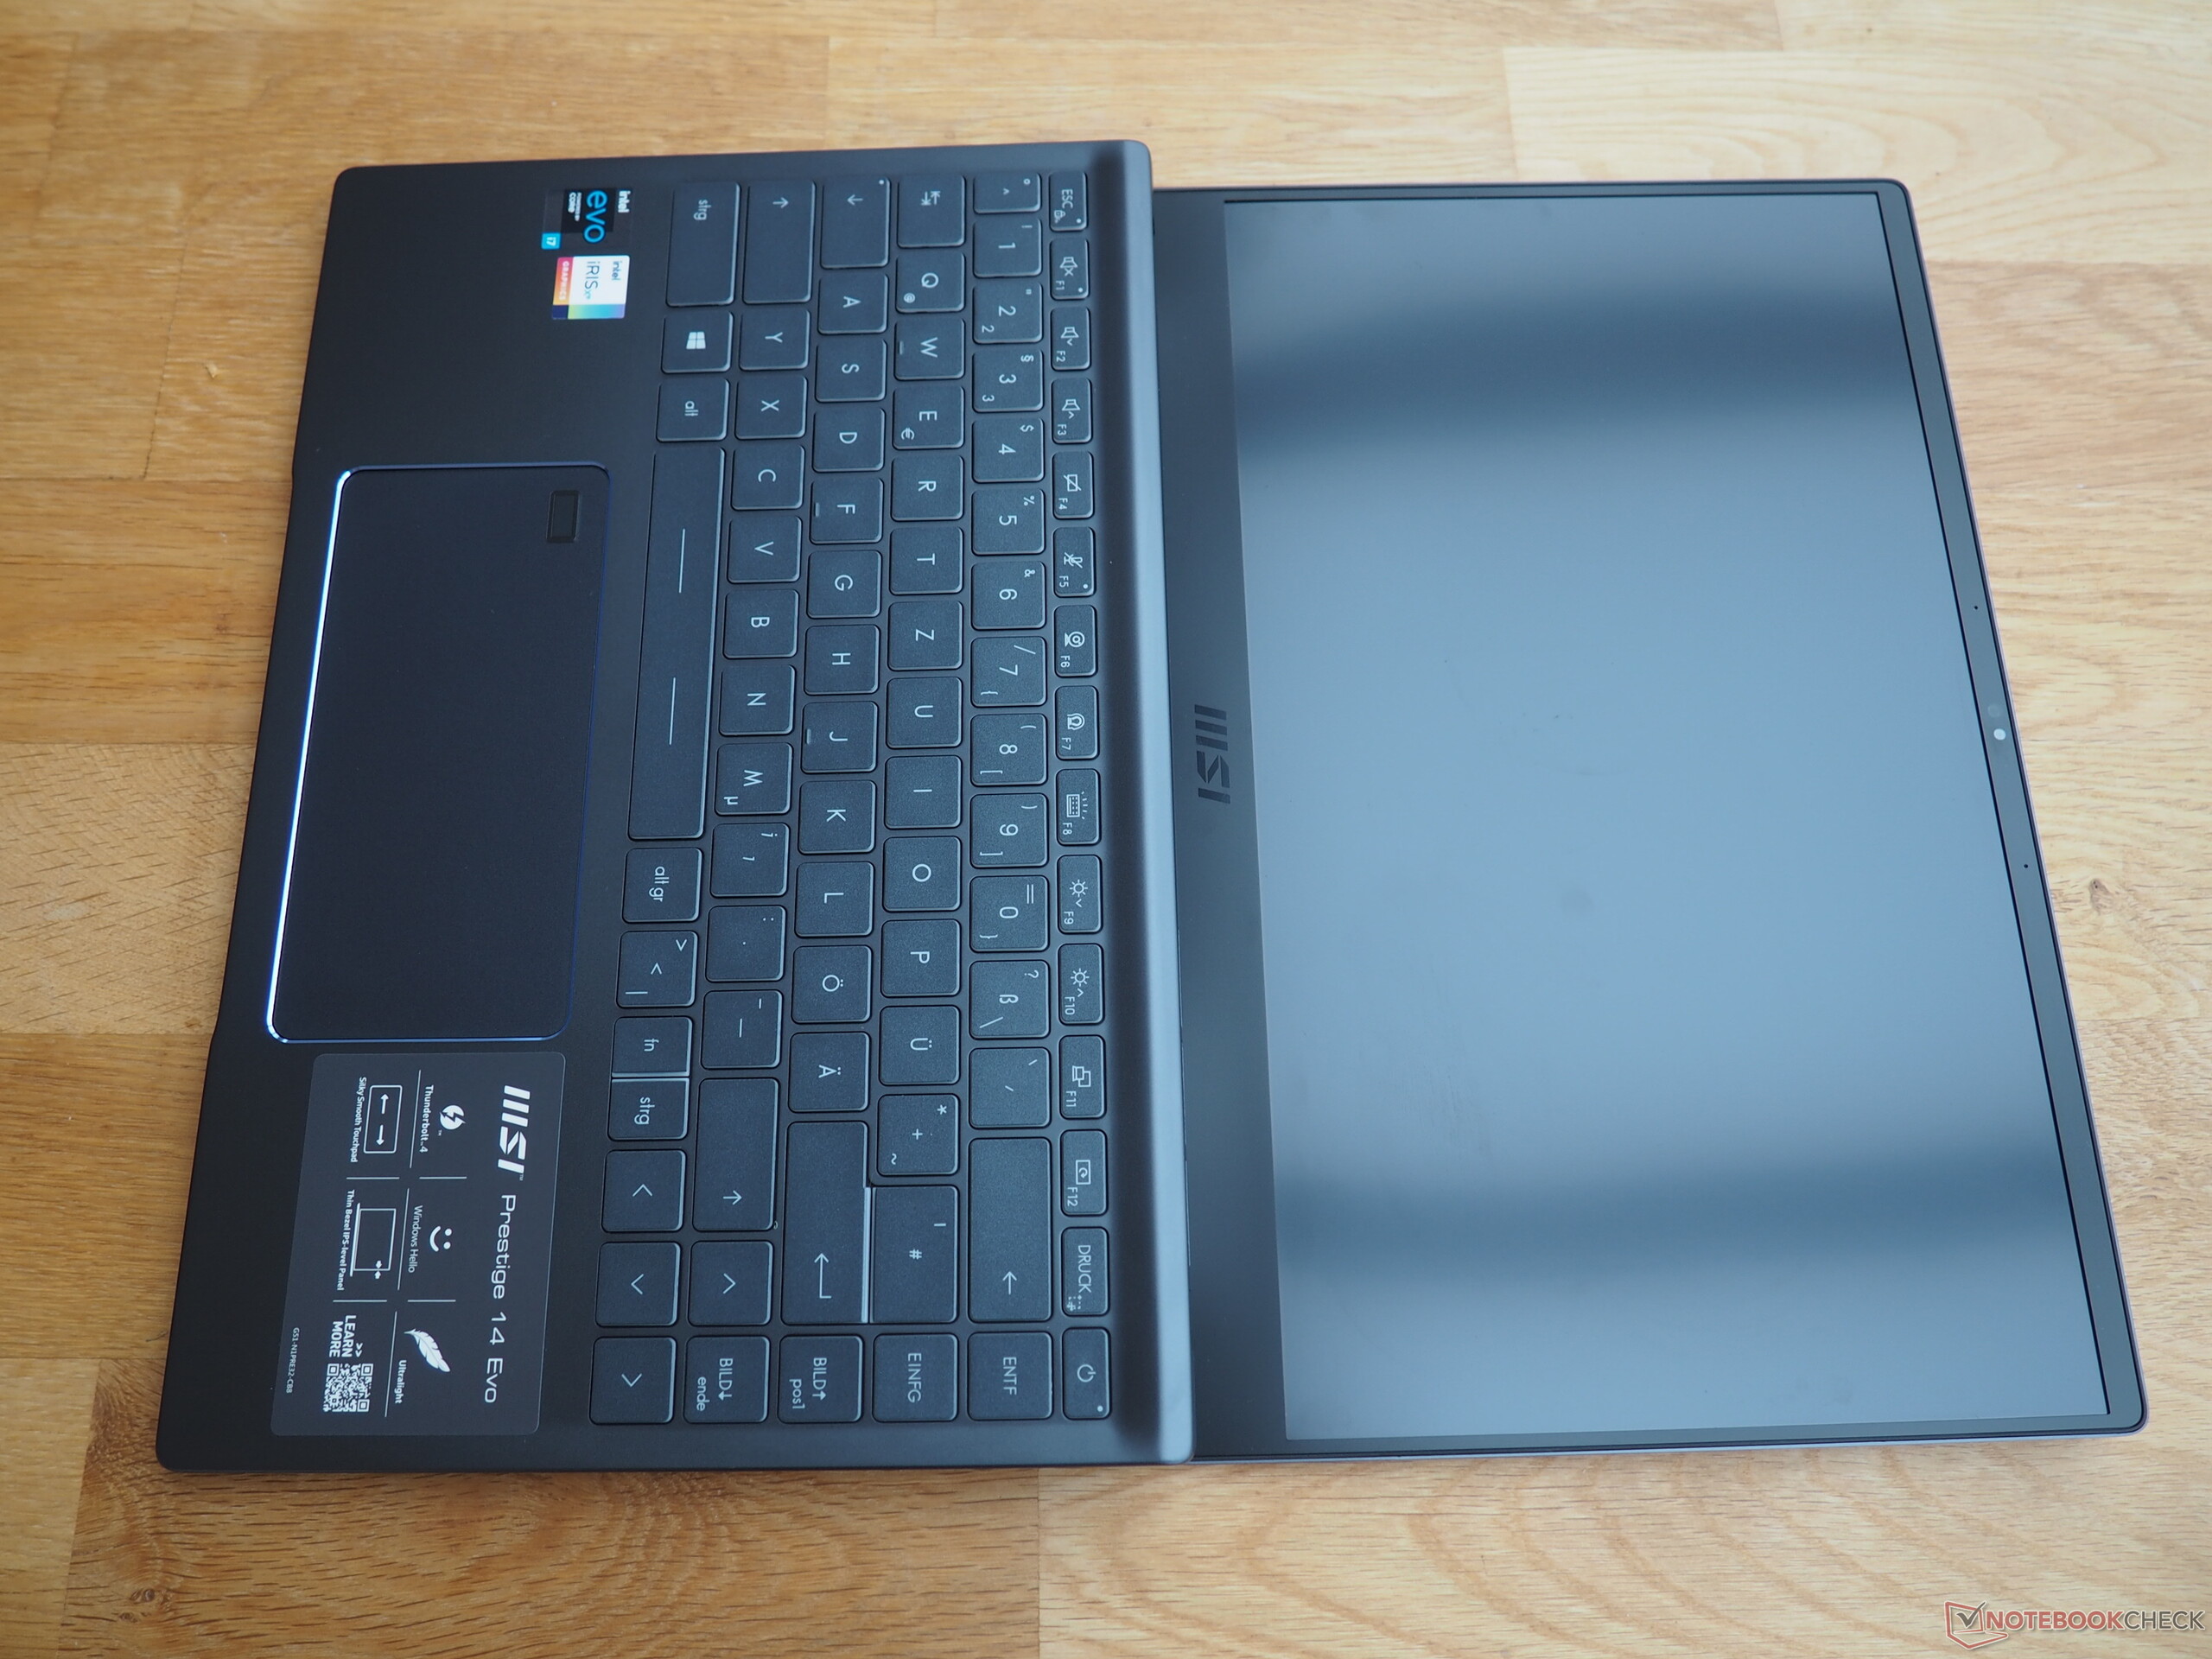
Case and Equipement - With Thunderbolt and fast WLAN
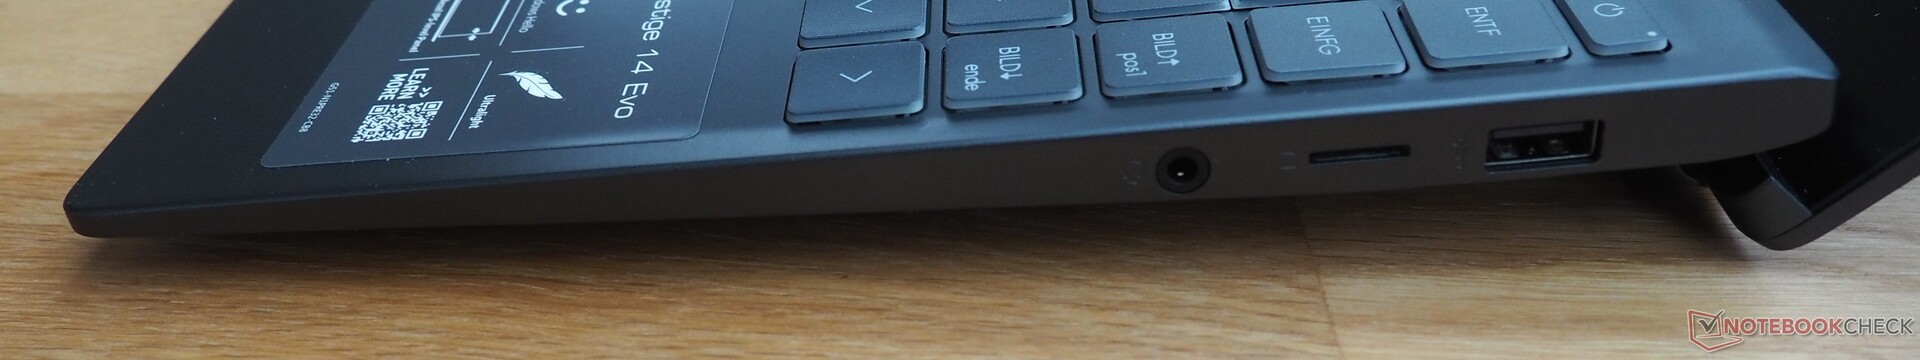
Connection Equipment


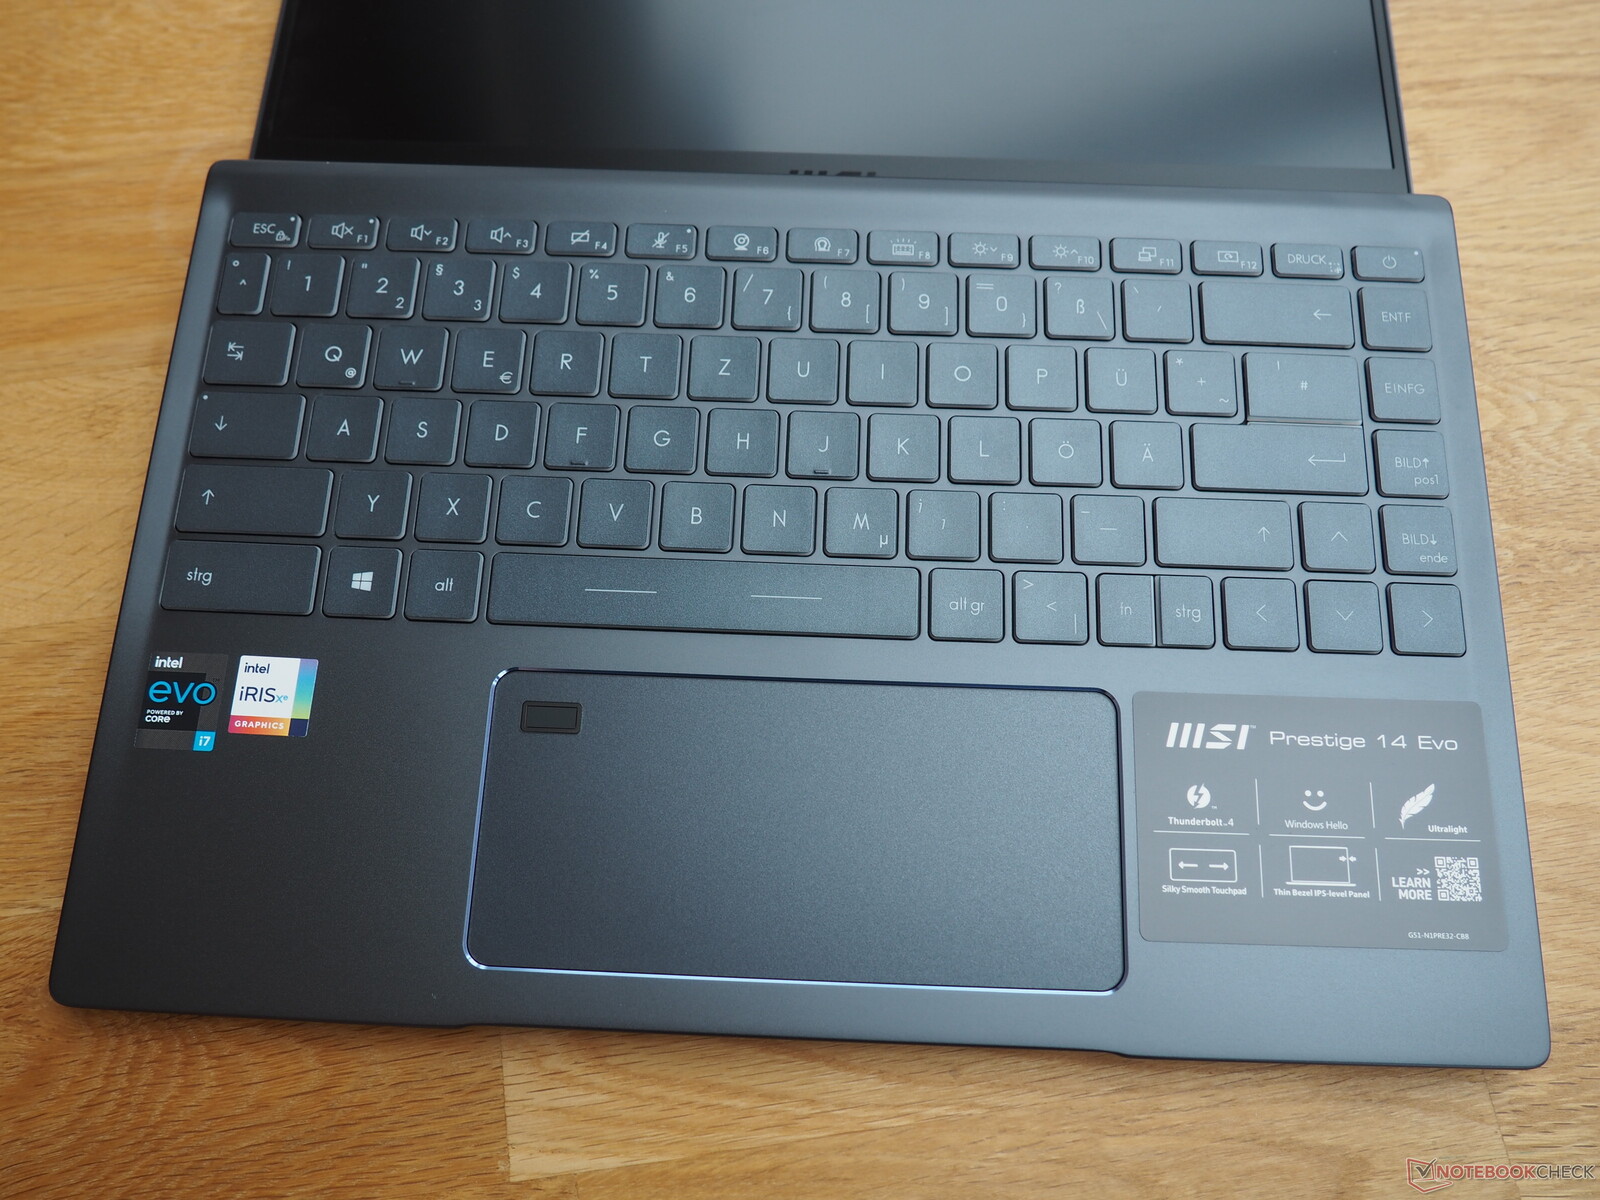
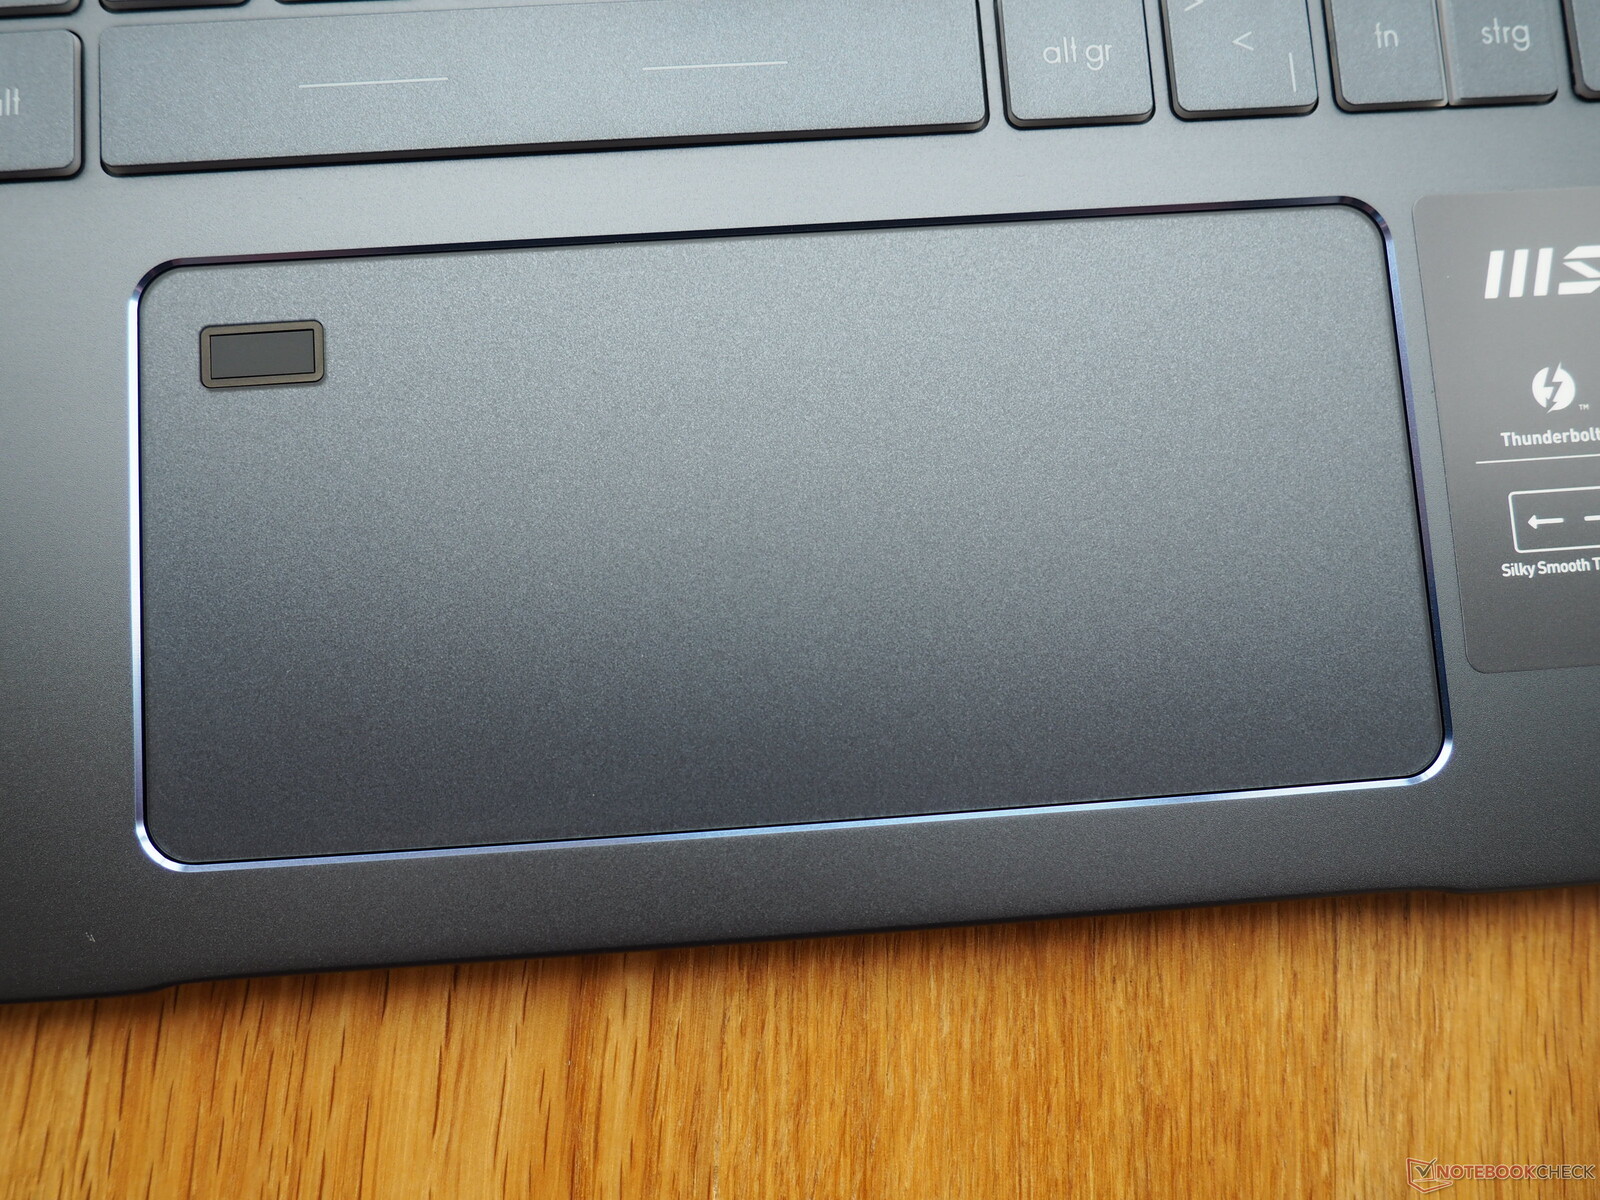
Input Devices - A good keyboard and large ClickPad
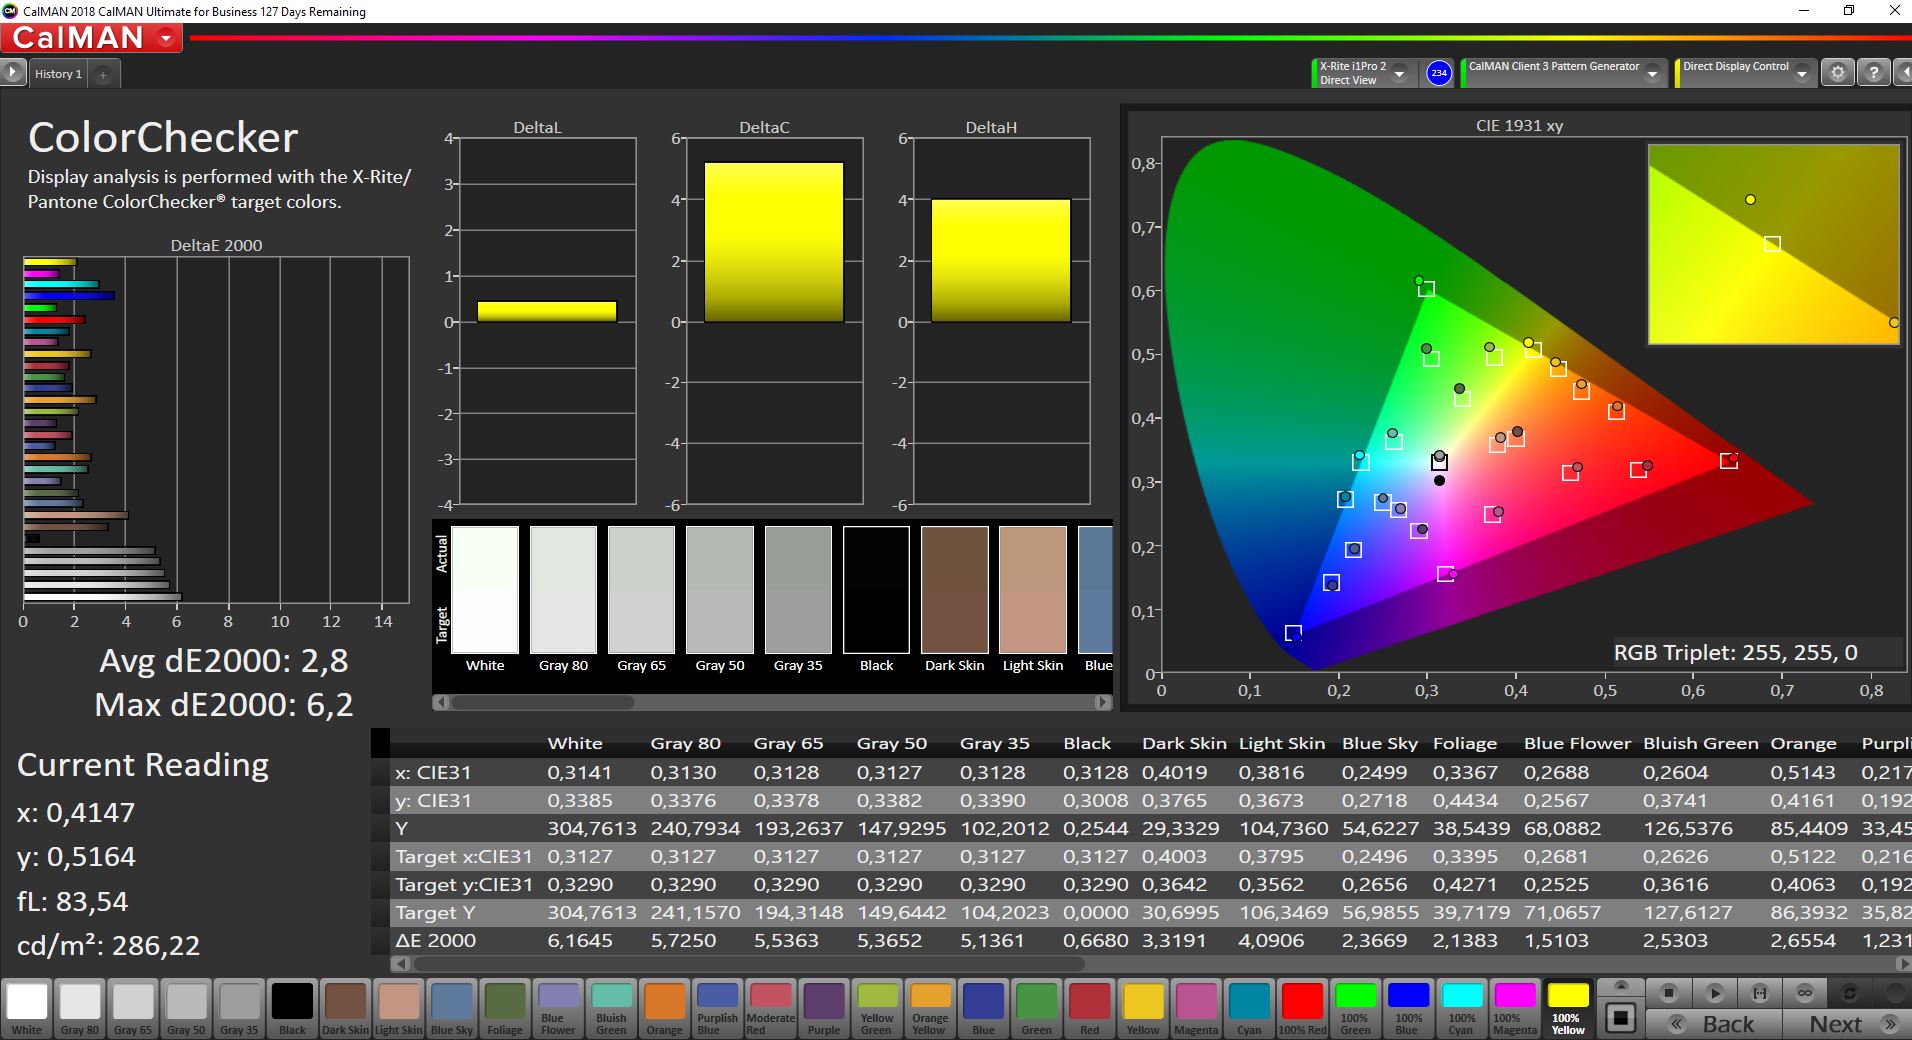
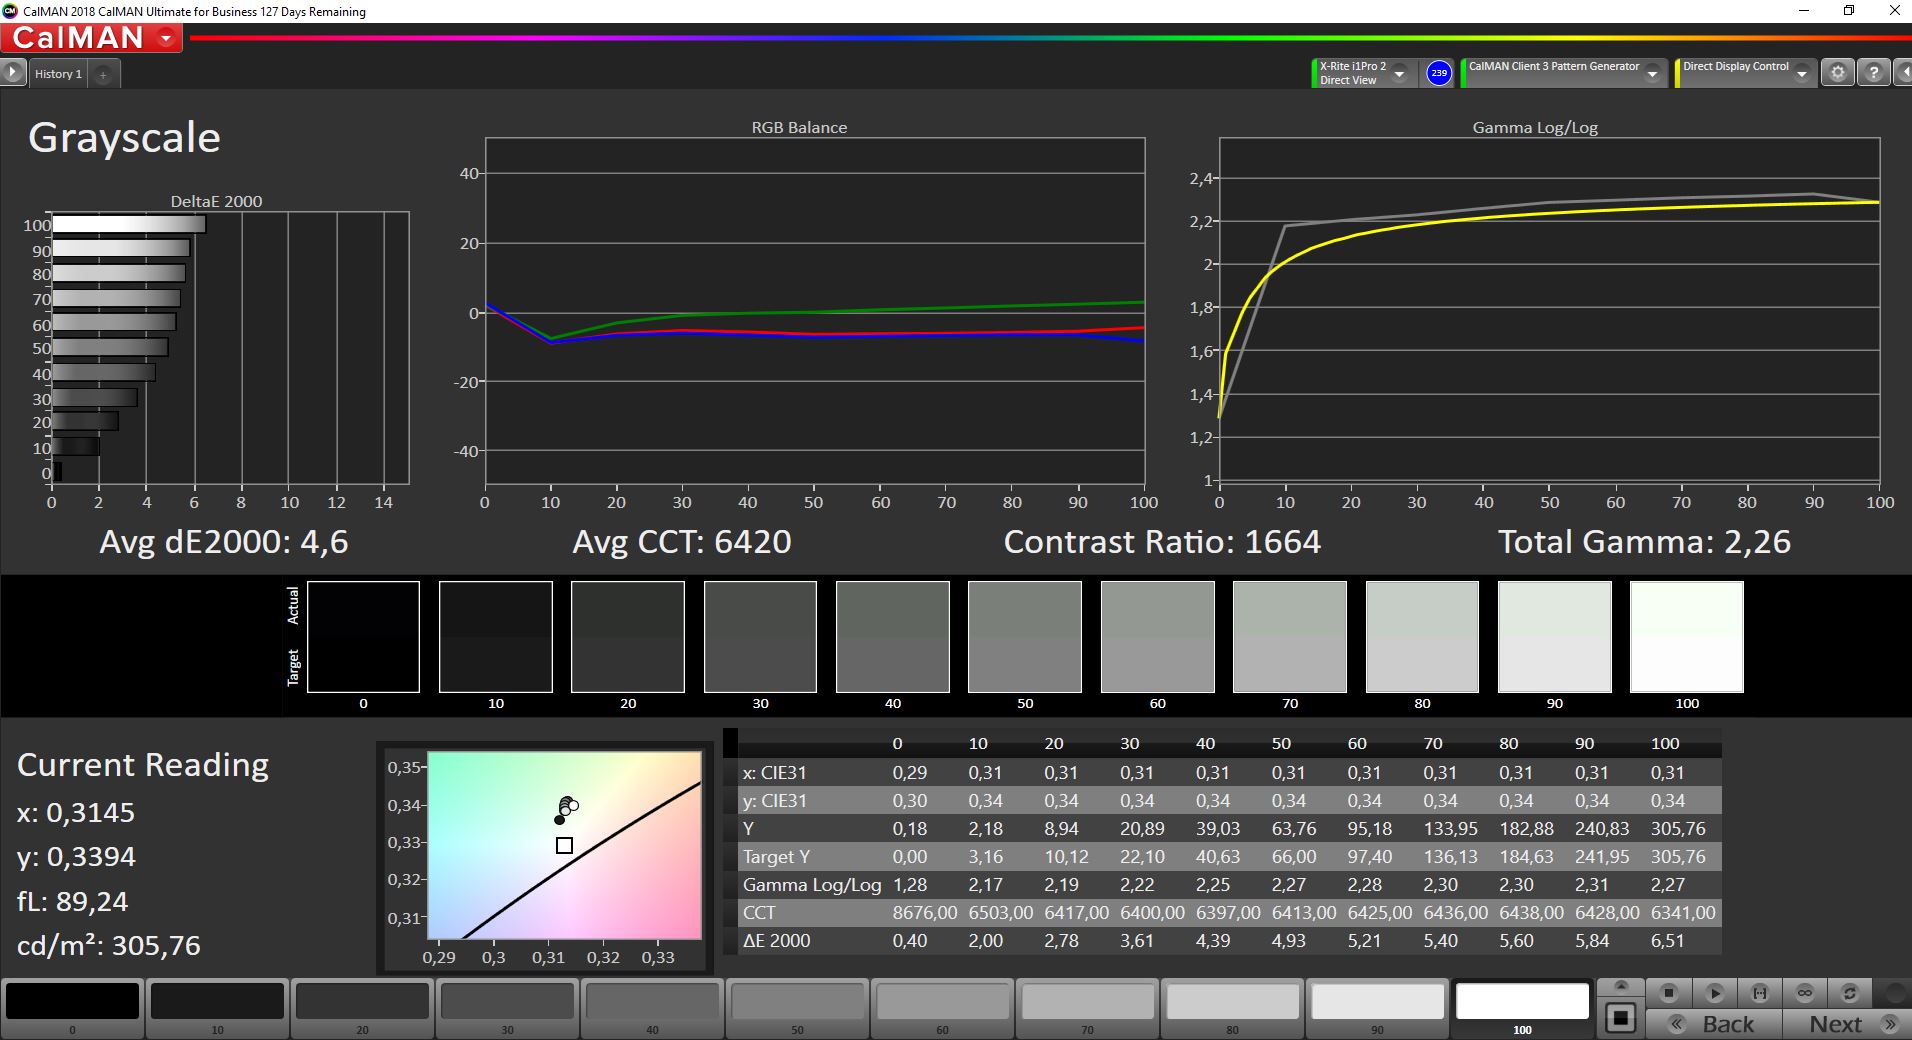
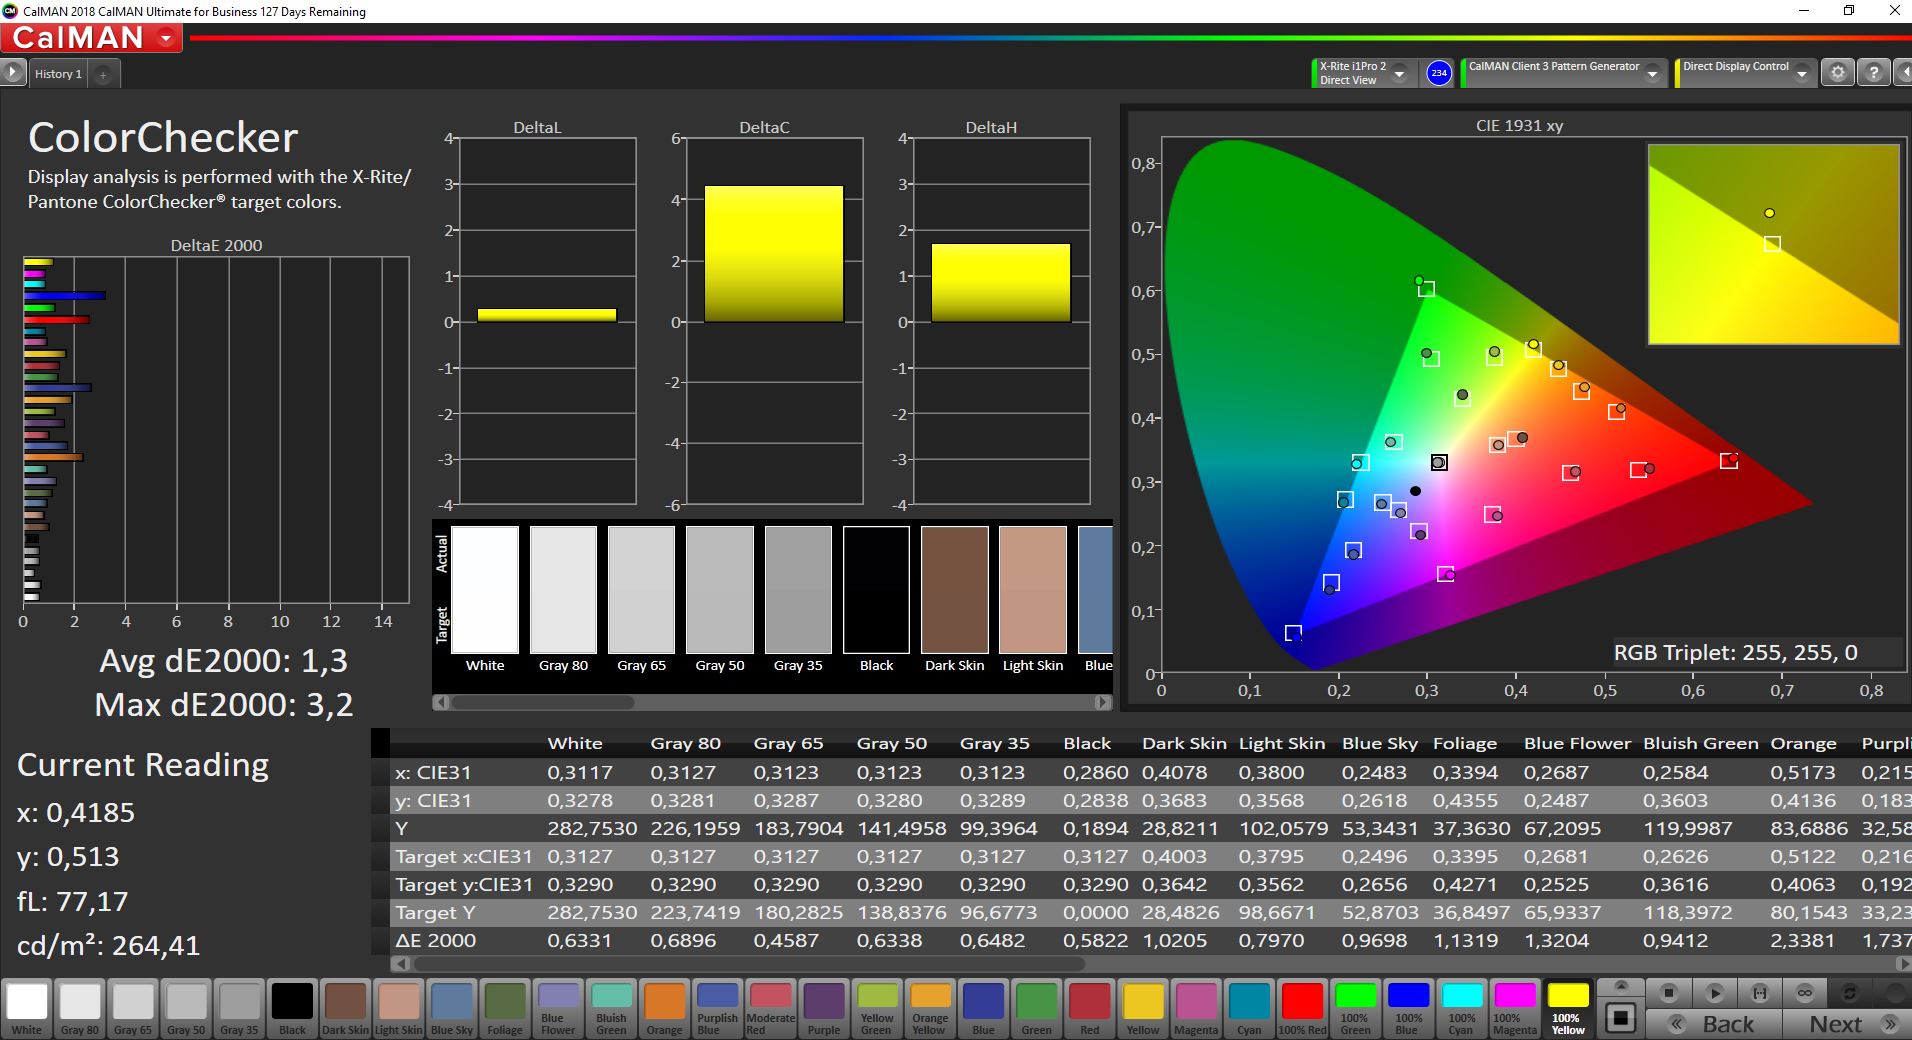
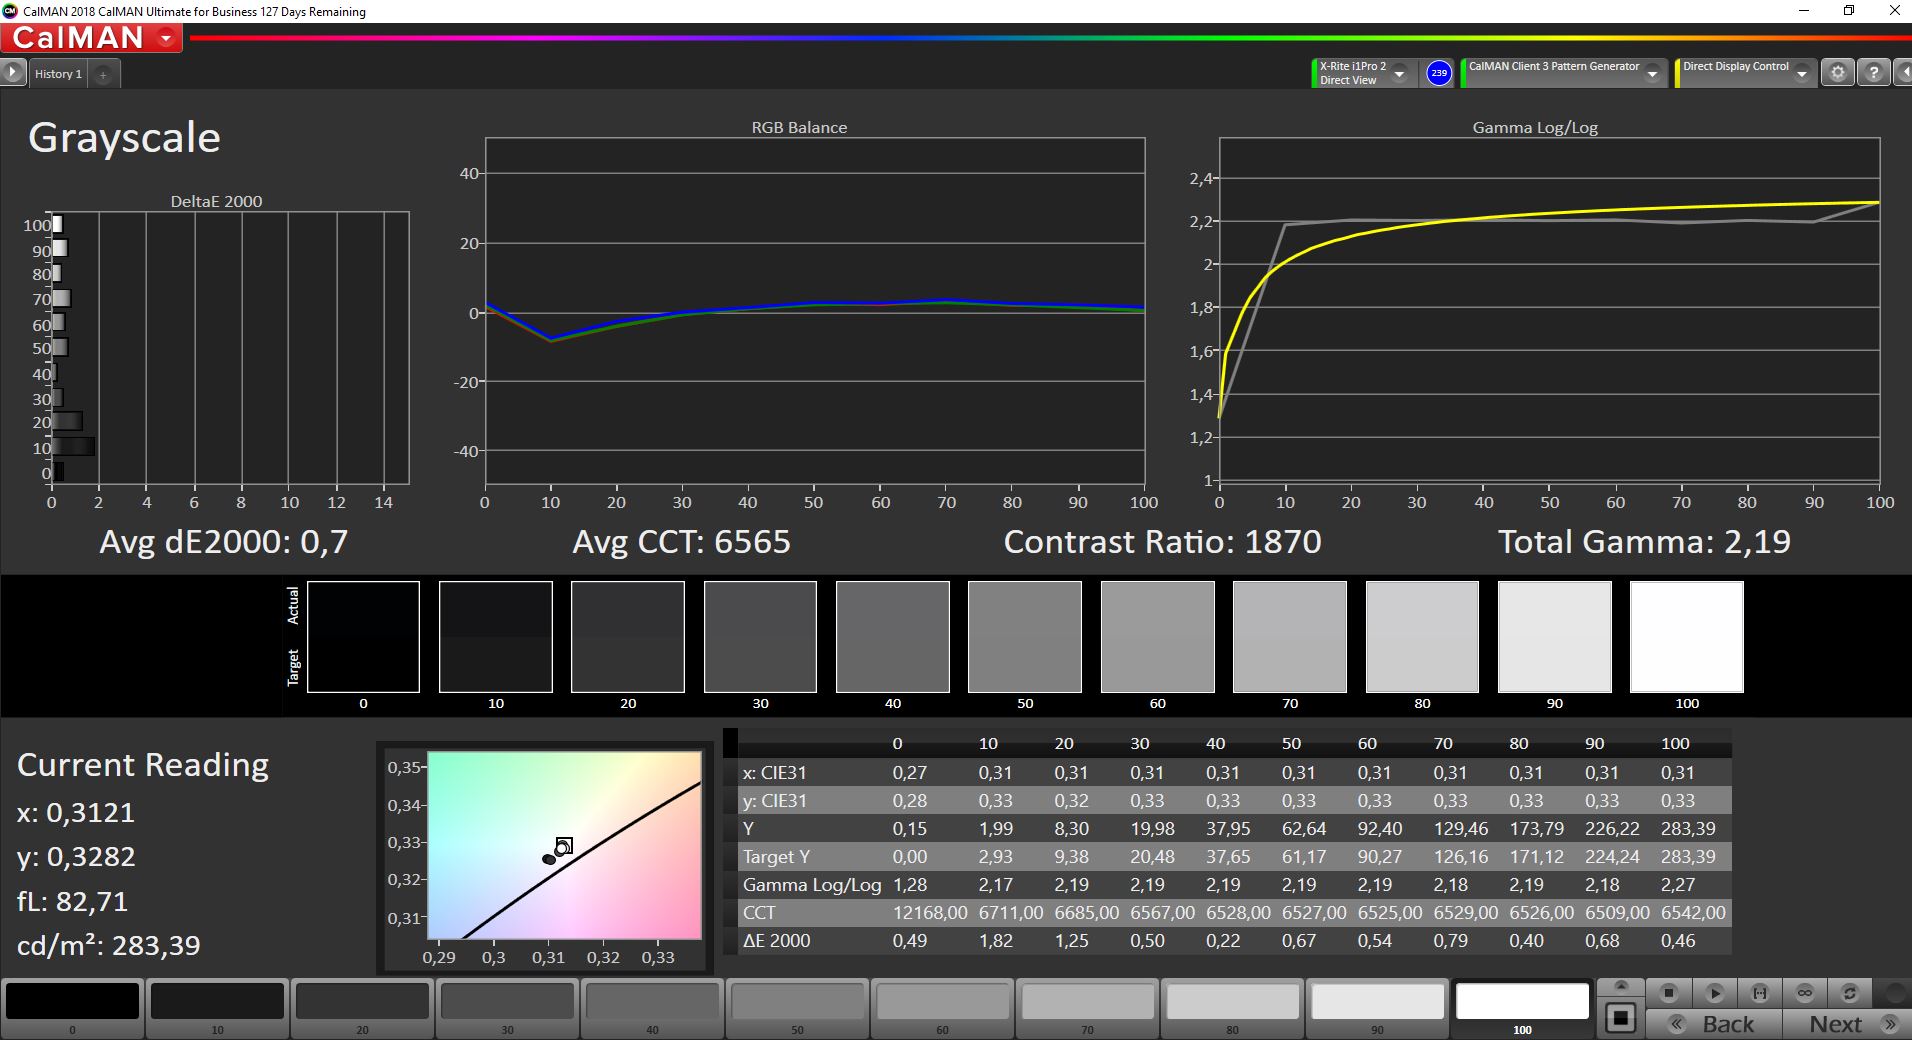
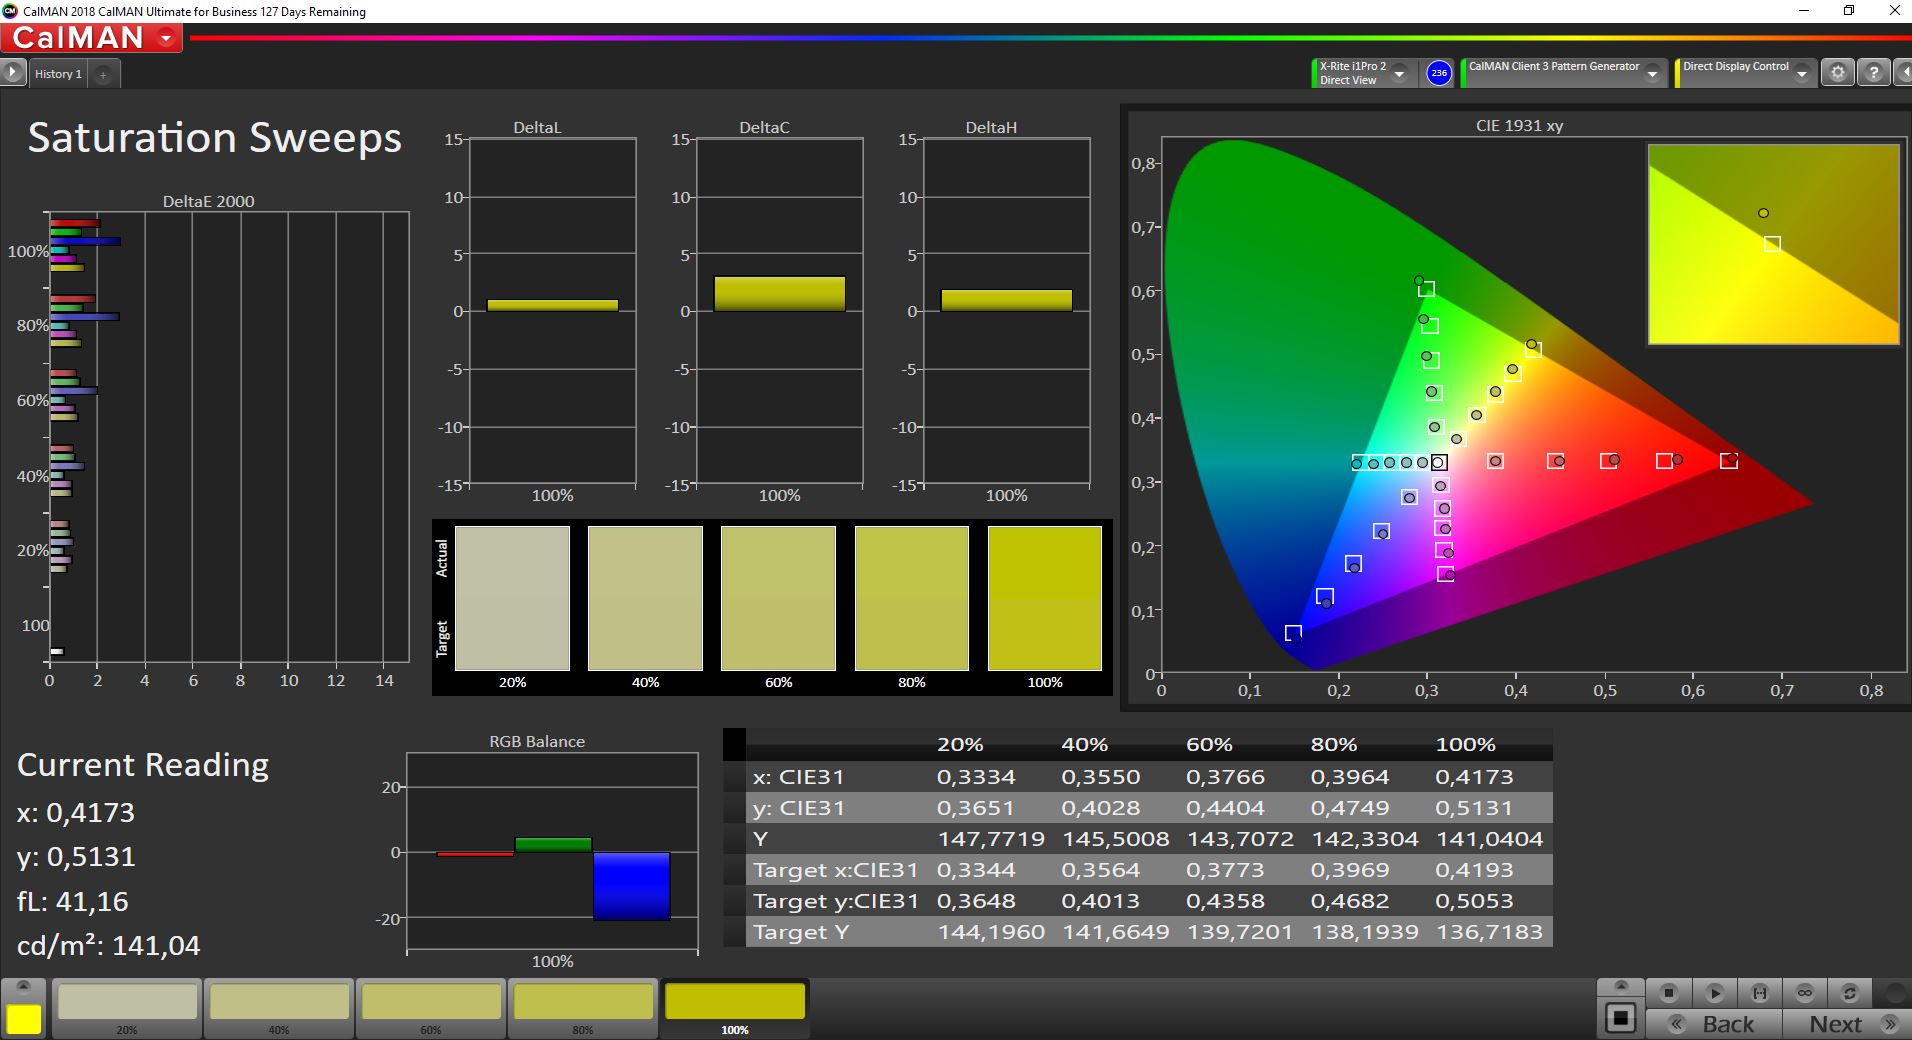
Display - Sufficiently bright and with a high contrast
In our test unit, MSI uses the same panel as in the Prestige 14 Evo A11M-005 that we already tested, and you can find the description of our impressions in the corresponding review.
| |||||||||||||||||||||||||
Brightness Distribution: 92 %
Center on Battery: 308 cd/m²
Contrast: 1700:1 (Black: 0.18 cd/m²)
ΔE ColorChecker Calman: 2.8 | ∀{0.5-29.43 Ø4.76}
calibrated: 1.3
ΔE Greyscale Calman: 4.6 | ∀{0.09-98 Ø5}
71.5% AdobeRGB 1998 (Argyll 3D)
99.2% sRGB (Argyll 3D)
70.3% Display P3 (Argyll 3D)
Gamma: 2.26
CCT: 6420 K
| MSI Prestige 14 Evo A11MO-026US B140HAN06.2, IPS, 1920x1080, 14" | MSI Prestige 14 Evo A11M-005 AUO B140HAN06.2 (AUO623D), IPS-Level, 1920x1080, 14" | Schenker Vision 14 CSOT T3_MNE007ZA1_1, IPS, 2880x1800, 14" | Asus ZenBook 13 UM325S Samsung (SDC4158), OLED, 1920x1080, 13.3" | |
|---|---|---|---|---|
| Display | -1% | 5% | 27% | |
| Display P3 Coverage (%) | 70.3 | 68.8 -2% | 75.4 7% | 99.9 42% |
| sRGB Coverage (%) | 99.2 | 99.4 0% | 99 0% | 100 1% |
| AdobeRGB 1998 Coverage (%) | 71.5 | 70.9 -1% | 76.4 7% | 99.7 39% |
| Response Times | 0% | 42% | 91% | |
| Response Time Grey 50% / Grey 80% * (ms) | 59.6 ? | 59.6 ? -0% | 32.8 ? 45% | 4 ? 93% |
| Response Time Black / White * (ms) | 32.8 ? | 32.8 ? -0% | 20.4 ? 38% | 4 ? 88% |
| PWM Frequency (Hz) | 60 ? | |||
| Screen | 2% | -1% | 28% | |
| Brightness middle (cd/m²) | 306 | 293 -4% | 390 27% | 370 21% |
| Brightness (cd/m²) | 299 | 277 -7% | 387 29% | 378 26% |
| Brightness Distribution (%) | 92 | 89 -3% | 94 2% | 96 4% |
| Black Level * (cd/m²) | 0.18 | 0.18 -0% | 0.29 -61% | 0.05 72% |
| Contrast (:1) | 1700 | 1628 -4% | 1345 -21% | 7400 335% |
| Colorchecker dE 2000 * | 2.8 | 2.95 -5% | 2.8 -0% | 4.33 -55% |
| Colorchecker dE 2000 max. * | 6.2 | 6.03 3% | 4.4 29% | 7.04 -14% |
| Colorchecker dE 2000 calibrated * | 1.3 | 0.9 31% | 1.8 -38% | 4.14 -218% |
| Greyscale dE 2000 * | 4.6 | 4.2 9% | 3.5 24% | 0.92 80% |
| Gamma | 2.26 97% | 2.099 105% | 2.24 98% | 2.38 92% |
| CCT | 6420 101% | 6622 98% | 6174 105% | 6394 102% |
| Color Space (Percent of AdobeRGB 1998) (%) | 71 | 76.4 | 89.4 | |
| Color Space (Percent of sRGB) (%) | 93 | 99 | 100 | |
| Total Average (Program / Settings) | 0% /
1% | 15% /
6% | 49% /
37% |
* ... smaller is better
Display Response Times
| ↔ Response Time Black to White | ||
|---|---|---|
| 32.8 ms ... rise ↗ and fall ↘ combined | ↗ 16.4 ms rise | 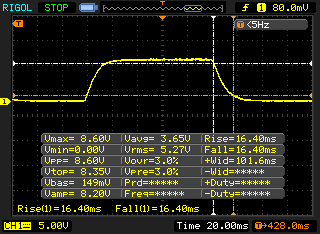 |
| ↘ 16.4 ms fall | ||
| The screen shows slow response rates in our tests and will be unsatisfactory for gamers. In comparison, all tested devices range from 0.1 (minimum) to 240 (maximum) ms. » 88 % of all devices are better. This means that the measured response time is worse than the average of all tested devices (20.1 ms). | ||
| ↔ Response Time 50% Grey to 80% Grey | ||
| 59.6 ms ... rise ↗ and fall ↘ combined | ↗ 26.4 ms rise | 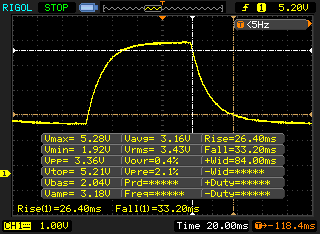 |
| ↘ 33.2 ms fall | ||
| The screen shows slow response rates in our tests and will be unsatisfactory for gamers. In comparison, all tested devices range from 0.165 (minimum) to 636 (maximum) ms. » 95 % of all devices are better. This means that the measured response time is worse than the average of all tested devices (31.5 ms). | ||
Screen Flickering / PWM (Pulse-Width Modulation)
| Screen flickering / PWM not detected | 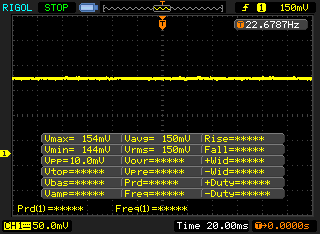 | ||
In comparison: 53 % of all tested devices do not use PWM to dim the display. If PWM was detected, an average of 8039 (minimum: 5 - maximum: 343500) Hz was measured. | |||


Performance - The dual-channel RAM ensures a good 3D performance
With the Prestige 14 Evo, MSI offers a laptop with good performance and pronounced mobile characteristics. This should allow you to run office applications and creative applications whose demands on the system performance aren't too high without any problems on the road.
Processor
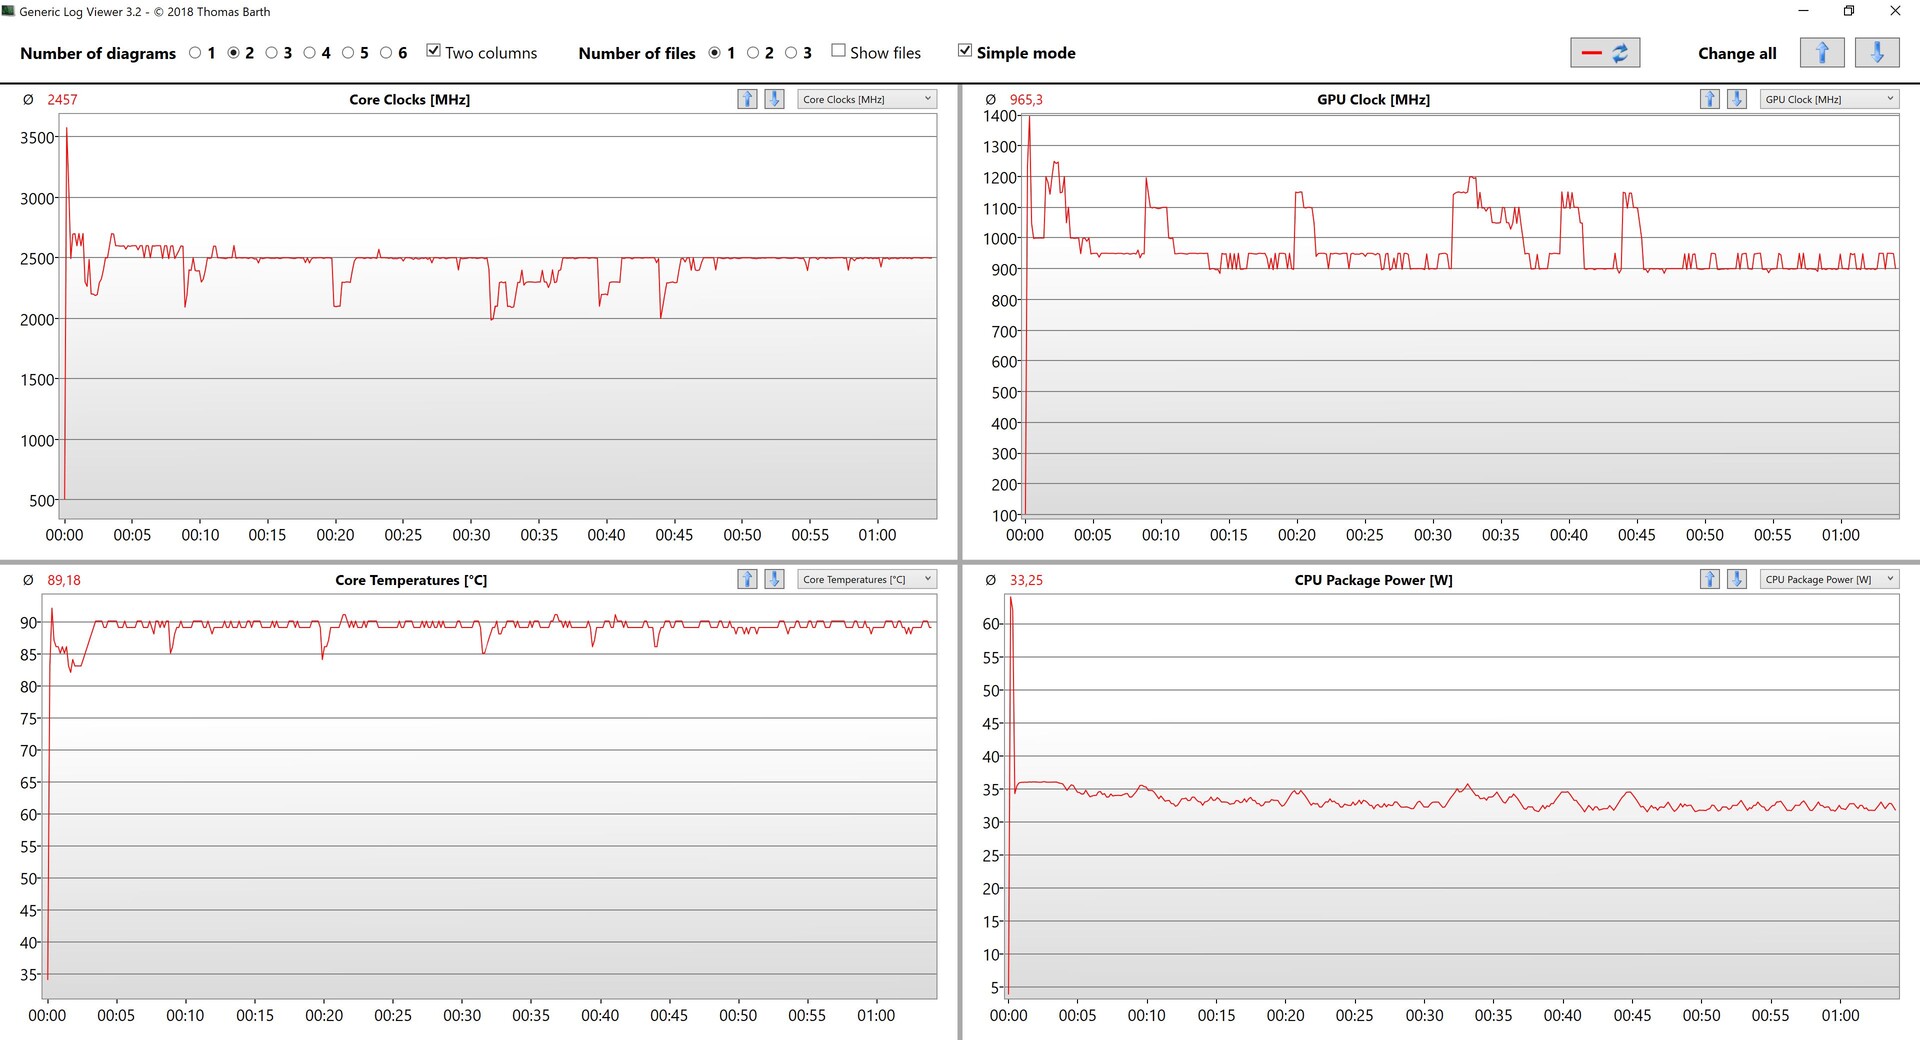
The Intel Core i7-1195G7 used here is a Tiger Lake processor that was manufactured in an improved process. The four cores are able to operate on up to eight tasks simultaneously and reach clock speeds between 2.9 and 5 GHz. However, the latter is only possible for a single core, while the simultaneous maximum for all cores is 4.9 GHz.
How much of this performance is available in everyday operation depends on the configured TDP value and the cooling system. With a short-time limit (PL2) of 64 watts and a constant limit (PL1) of 36 watts, MSI supplies the system with high power limits. As our Cinebench R15 constant load test shows, the Prestige 14 Evo achieves the same result with this as the predecessor model with the Intel Core i7-1185G7, which itself was only able to deliver the same performance as the Intel Core i7-1165G7 in the Schenker Vision 14.
Cinebench R15 Multi Constant Load Test
In the single disciplines, the Intel Core i7-1195G7 in the MSI Prestige 14 Evo is able to achieve one of the top places in our test field particularly in the multi-core performance. However, thanks to their higher number of cores, the current AMD mobile processors such as the AMD Ryzen 7 5800U in the ZenBook 13 have a clear advantage here (despite their lower power consumption). Only in the single-core tests, the Intel chips still have a slight advantage thanks to their high Turbo boost rates, and here, the new i7-1195G7 also has a slight advantage compared to the i7-1185G7.
In battery operation, we were unable to determine any performance drop, neither in the CPU, nor the GPU performance.
Cinebench R20: CPU (Single Core) | CPU (Multi Core)
Cinebench R15: CPU Single 64Bit | CPU Multi 64Bit
Blender: v2.79 BMW27 CPU
7-Zip 18.03: 7z b 4 -mmt1 | 7z b 4
Geekbench 5.5: Single-Core | Multi-Core
HWBOT x265 Benchmark v2.2: 4k Preset
LibreOffice : 20 Documents To PDF
R Benchmark 2.5: Overall mean
| Cinebench R23 / Single Core | |
| Average of class Subnotebook (358 - 2165, n=72, last 2 years) | |
| Schenker Vision 14 | |
| MSI Prestige 14 Evo A11MO-026US | |
| Average Intel Core i7-1195G7 (1290 - 1624, n=9) | |
| Asus ZenBook 13 UM325S | |
| Cinebench R23 / Multi Core | |
| Average of class Subnotebook (1555 - 21812, n=71, last 2 years) | |
| Asus ZenBook 13 UM325S | |
| MSI Prestige 14 Evo A11MO-026US | |
| Schenker Vision 14 | |
| Average Intel Core i7-1195G7 (3142 - 6806, n=9) | |
| Cinebench R20 / CPU (Single Core) | |
| Average of class Subnotebook (128 - 826, n=66, last 2 years) | |
| Schenker Vision 14 | |
| MSI Prestige 14 Evo A11M-005 | |
| MSI Prestige 14 Evo A11MO-026US | |
| Average Intel Core i7-1195G7 (498 - 620, n=9) | |
| Asus ZenBook 13 UM325S | |
| Cinebench R20 / CPU (Multi Core) | |
| Average of class Subnotebook (579 - 8541, n=66, last 2 years) | |
| Asus ZenBook 13 UM325S | |
| MSI Prestige 14 Evo A11MO-026US | |
| MSI Prestige 14 Evo A11M-005 | |
| Schenker Vision 14 | |
| Average Intel Core i7-1195G7 (1212 - 2590, n=9) | |
| Cinebench R15 / CPU Single 64Bit | |
| Average of class Subnotebook (72.4 - 322, n=66, last 2 years) | |
| MSI Prestige 14 Evo A11MO-026US | |
| Asus ZenBook 13 UM325S | |
| Schenker Vision 14 | |
| MSI Prestige 14 Evo A11M-005 | |
| Average Intel Core i7-1195G7 (198 - 238, n=8) | |
| Cinebench R15 / CPU Multi 64Bit | |
| Average of class Subnotebook (327 - 3345, n=66, last 2 years) | |
| Asus ZenBook 13 UM325S | |
| MSI Prestige 14 Evo A11MO-026US | |
| Schenker Vision 14 | |
| MSI Prestige 14 Evo A11M-005 | |
| Average Intel Core i7-1195G7 (574 - 999, n=9) | |
| Blender / v2.79 BMW27 CPU | |
| Average Intel Core i7-1195G7 (473 - 1211, n=10) | |
| MSI Prestige 14 Evo A11M-005 | |
| MSI Prestige 14 Evo A11MO-026US | |
| Schenker Vision 14 | |
| Asus ZenBook 13 UM325S | |
| Average of class Subnotebook (159 - 2271, n=69, last 2 years) | |
| 7-Zip 18.03 / 7z b 4 -mmt1 | |
| MSI Prestige 14 Evo A11MO-026US | |
| Average of class Subnotebook (2643 - 6442, n=68, last 2 years) | |
| Average Intel Core i7-1195G7 (5059 - 5890, n=9) | |
| Schenker Vision 14 | |
| Asus ZenBook 13 UM325S | |
| MSI Prestige 14 Evo A11M-005 | |
| 7-Zip 18.03 / 7z b 4 | |
| Average of class Subnotebook (11668 - 77867, n=66, last 2 years) | |
| Asus ZenBook 13 UM325S | |
| MSI Prestige 14 Evo A11MO-026US | |
| Schenker Vision 14 | |
| MSI Prestige 14 Evo A11M-005 | |
| Average Intel Core i7-1195G7 (17053 - 26183, n=9) | |
| Geekbench 5.5 / Single-Core | |
| Average of class Subnotebook (726 - 2350, n=61, last 2 years) | |
| MSI Prestige 14 Evo A11MO-026US | |
| Schenker Vision 14 | |
| Average Intel Core i7-1195G7 (1519 - 1649, n=7) | |
| Asus ZenBook 13 UM325S | |
| MSI Prestige 14 Evo A11M-005 | |
| Geekbench 5.5 / Multi-Core | |
| Average of class Subnotebook (2557 - 17218, n=61, last 2 years) | |
| Asus ZenBook 13 UM325S | |
| MSI Prestige 14 Evo A11MO-026US | |
| MSI Prestige 14 Evo A11M-005 | |
| Schenker Vision 14 | |
| Average Intel Core i7-1195G7 (4241 - 6349, n=7) | |
| HWBOT x265 Benchmark v2.2 / 4k Preset | |
| Average of class Subnotebook (0.97 - 25.1, n=66, last 2 years) | |
| Asus ZenBook 13 UM325S | |
| Schenker Vision 14 | |
| MSI Prestige 14 Evo A11MO-026US | |
| MSI Prestige 14 Evo A11M-005 | |
| Average Intel Core i7-1195G7 (4.23 - 8.8, n=9) | |
| LibreOffice / 20 Documents To PDF | |
| MSI Prestige 14 Evo A11M-005 | |
| Average of class Subnotebook (38.5 - 220, n=65, last 2 years) | |
| Asus ZenBook 13 UM325S | |
| Average Intel Core i7-1195G7 (39.2 - 83.9, n=9) | |
| Schenker Vision 14 | |
| MSI Prestige 14 Evo A11MO-026US | |
| R Benchmark 2.5 / Overall mean | |
| MSI Prestige 14 Evo A11M-005 | |
| MSI Prestige 14 Evo A11MO-026US | |
| Average Intel Core i7-1195G7 (0.53 - 0.611, n=9) | |
| Schenker Vision 14 | |
| Asus ZenBook 13 UM325S | |
| Average of class Subnotebook (0.403 - 1.456, n=67, last 2 years) | |
* ... smaller is better
System Performance
In the PCMark 10 test to evaluate the system performance, the MSI Prestige 14 Evo achieved a very good result that was only surpassed by the Asus ZenBook 13. In the single disciplines, it was able to achieve first place in the Essentials test, while only getting third place in the Productivity test.
During our testing period, the MSI laptop always ran smoothly, never showing any micro stutters or anything similar. Applications started up quickly, and the data access also succeeded without any delay. You can see how other devices fared in comparison in our CPU benchmark list.
| PCMark 10 / Score | |
| Average of class Subnotebook (4920 - 8424, n=53, last 2 years) | |
| Asus ZenBook 13 UM325S | |
| MSI Prestige 14 Evo A11MO-026US | |
| Average Intel Core i7-1195G7, Intel Iris Xe Graphics G7 96EUs (5067 - 5406, n=6) | |
| Schenker Vision 14 | |
| MSI Prestige 14 Evo A11M-005 | |
| PCMark 10 / Essentials | |
| MSI Prestige 14 Evo A11MO-026US | |
| Average of class Subnotebook (8552 - 11406, n=53, last 2 years) | |
| Average Intel Core i7-1195G7, Intel Iris Xe Graphics G7 96EUs (10156 - 10614, n=6) | |
| Schenker Vision 14 | |
| Asus ZenBook 13 UM325S | |
| MSI Prestige 14 Evo A11M-005 | |
| PCMark 10 / Productivity | |
| Asus ZenBook 13 UM325S | |
| Average of class Subnotebook (5435 - 16132, n=53, last 2 years) | |
| Average Intel Core i7-1195G7, Intel Iris Xe Graphics G7 96EUs (6637 - 7390, n=6) | |
| Schenker Vision 14 | |
| MSI Prestige 14 Evo A11MO-026US | |
| MSI Prestige 14 Evo A11M-005 | |
| PCMark 10 / Digital Content Creation | |
| Average of class Subnotebook (5722 - 12442, n=53, last 2 years) | |
| Asus ZenBook 13 UM325S | |
| MSI Prestige 14 Evo A11MO-026US | |
| Average Intel Core i7-1195G7, Intel Iris Xe Graphics G7 96EUs (4737 - 5941, n=6) | |
| Schenker Vision 14 | |
| MSI Prestige 14 Evo A11M-005 | |
| PCMark 10 Score | 5406 points | |
Help | ||
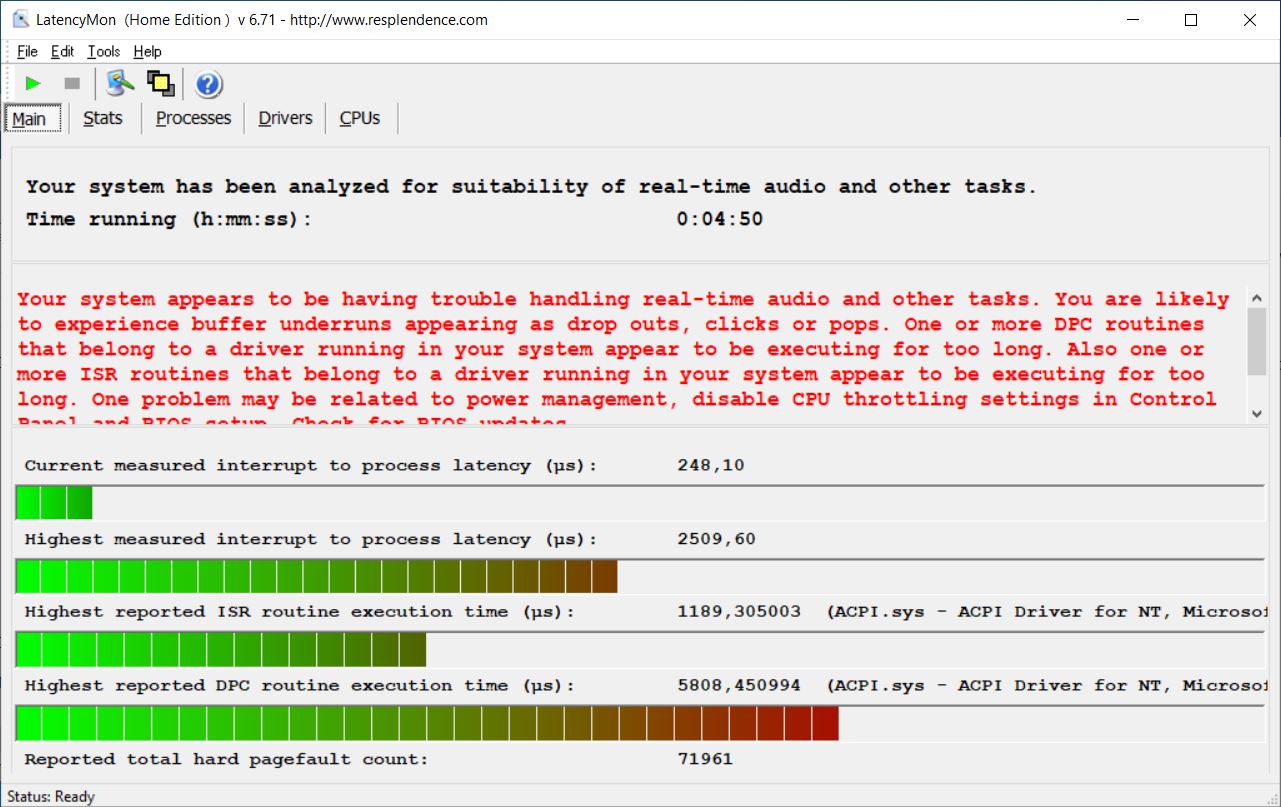
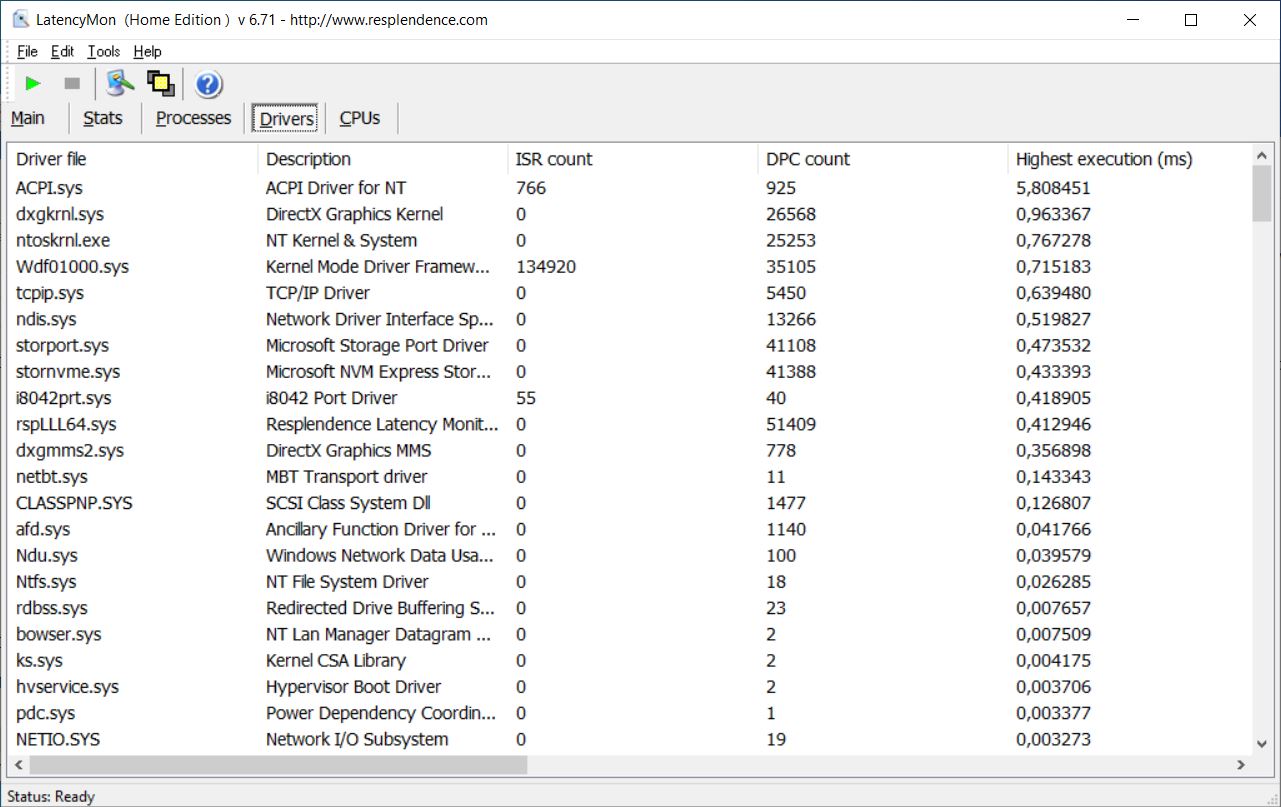
DPC Latencies
In the test with LatencyMon, the MSI Prestige 14 Evo showed some elevated latencies, which means that it is not suited for real-time applications or anything similar..
| DPC Latencies / LatencyMon - interrupt to process latency (max), Web, Youtube, Prime95 | |
| MSI Prestige 14 Evo A11MO-026US | |
| Schenker Vision 14 | |
| MSI Prestige 14 Evo A11M-005 | |
| Asus ZenBook 13 UM325S | |
* ... smaller is better
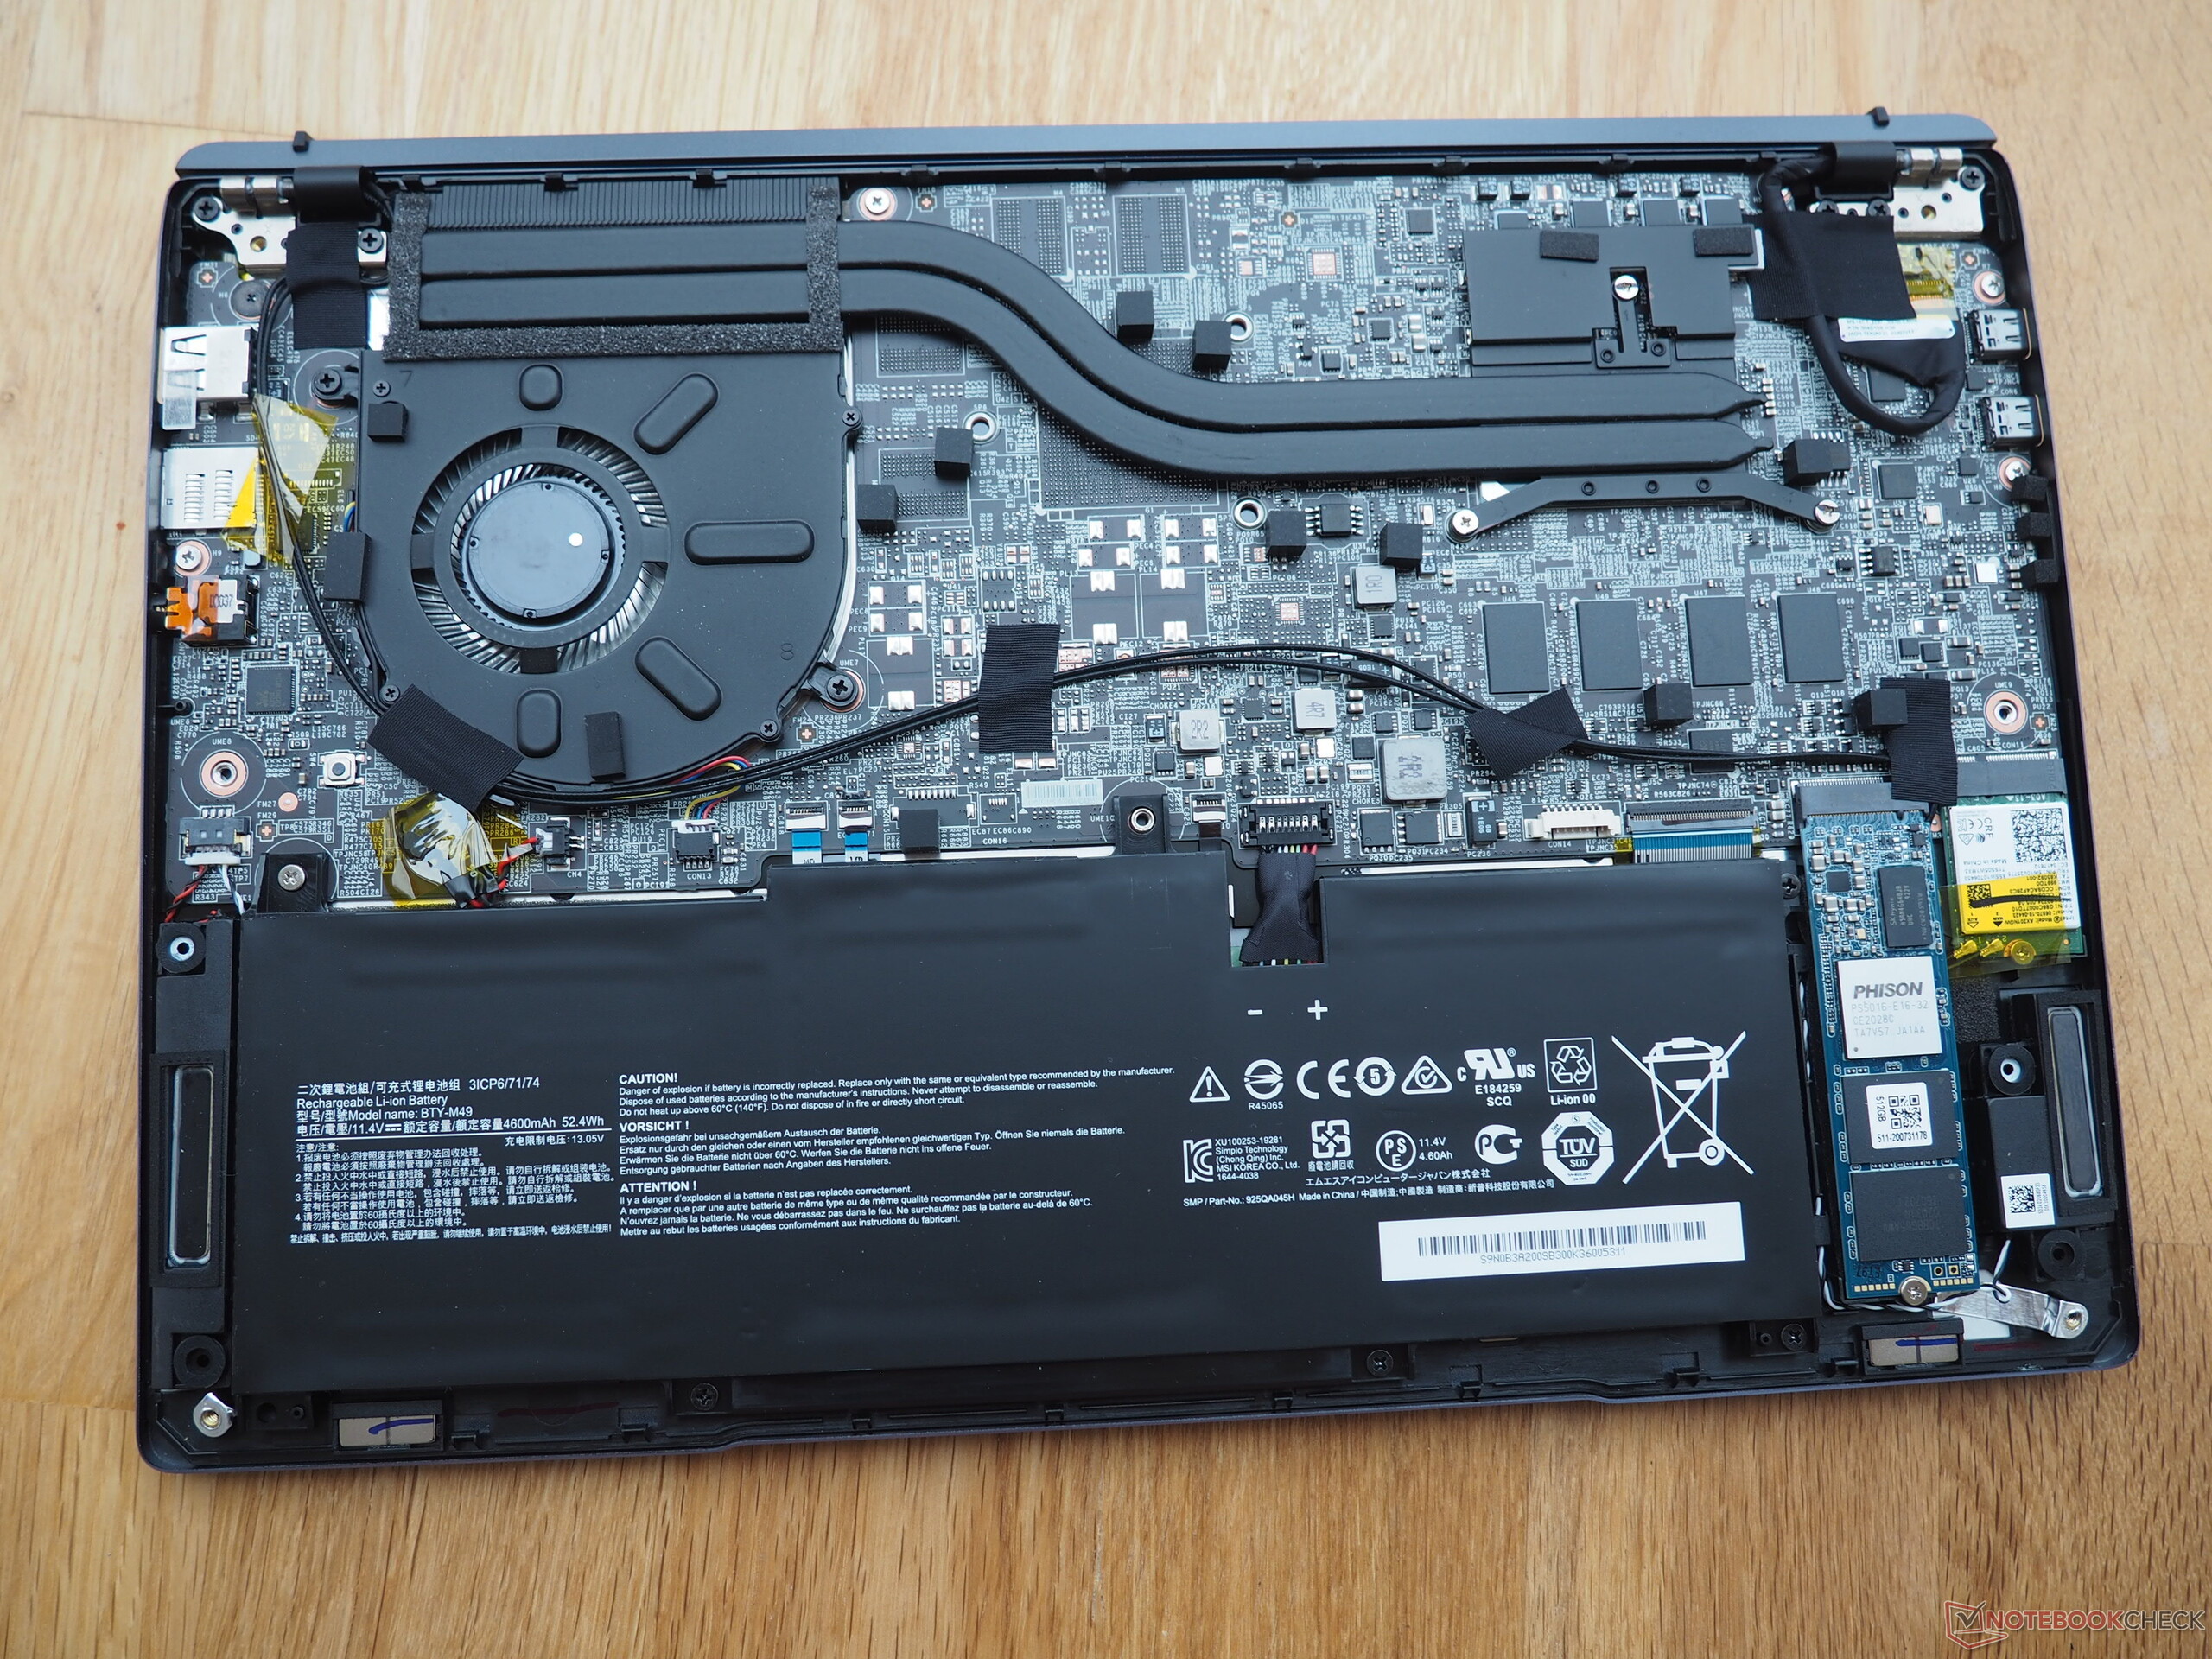
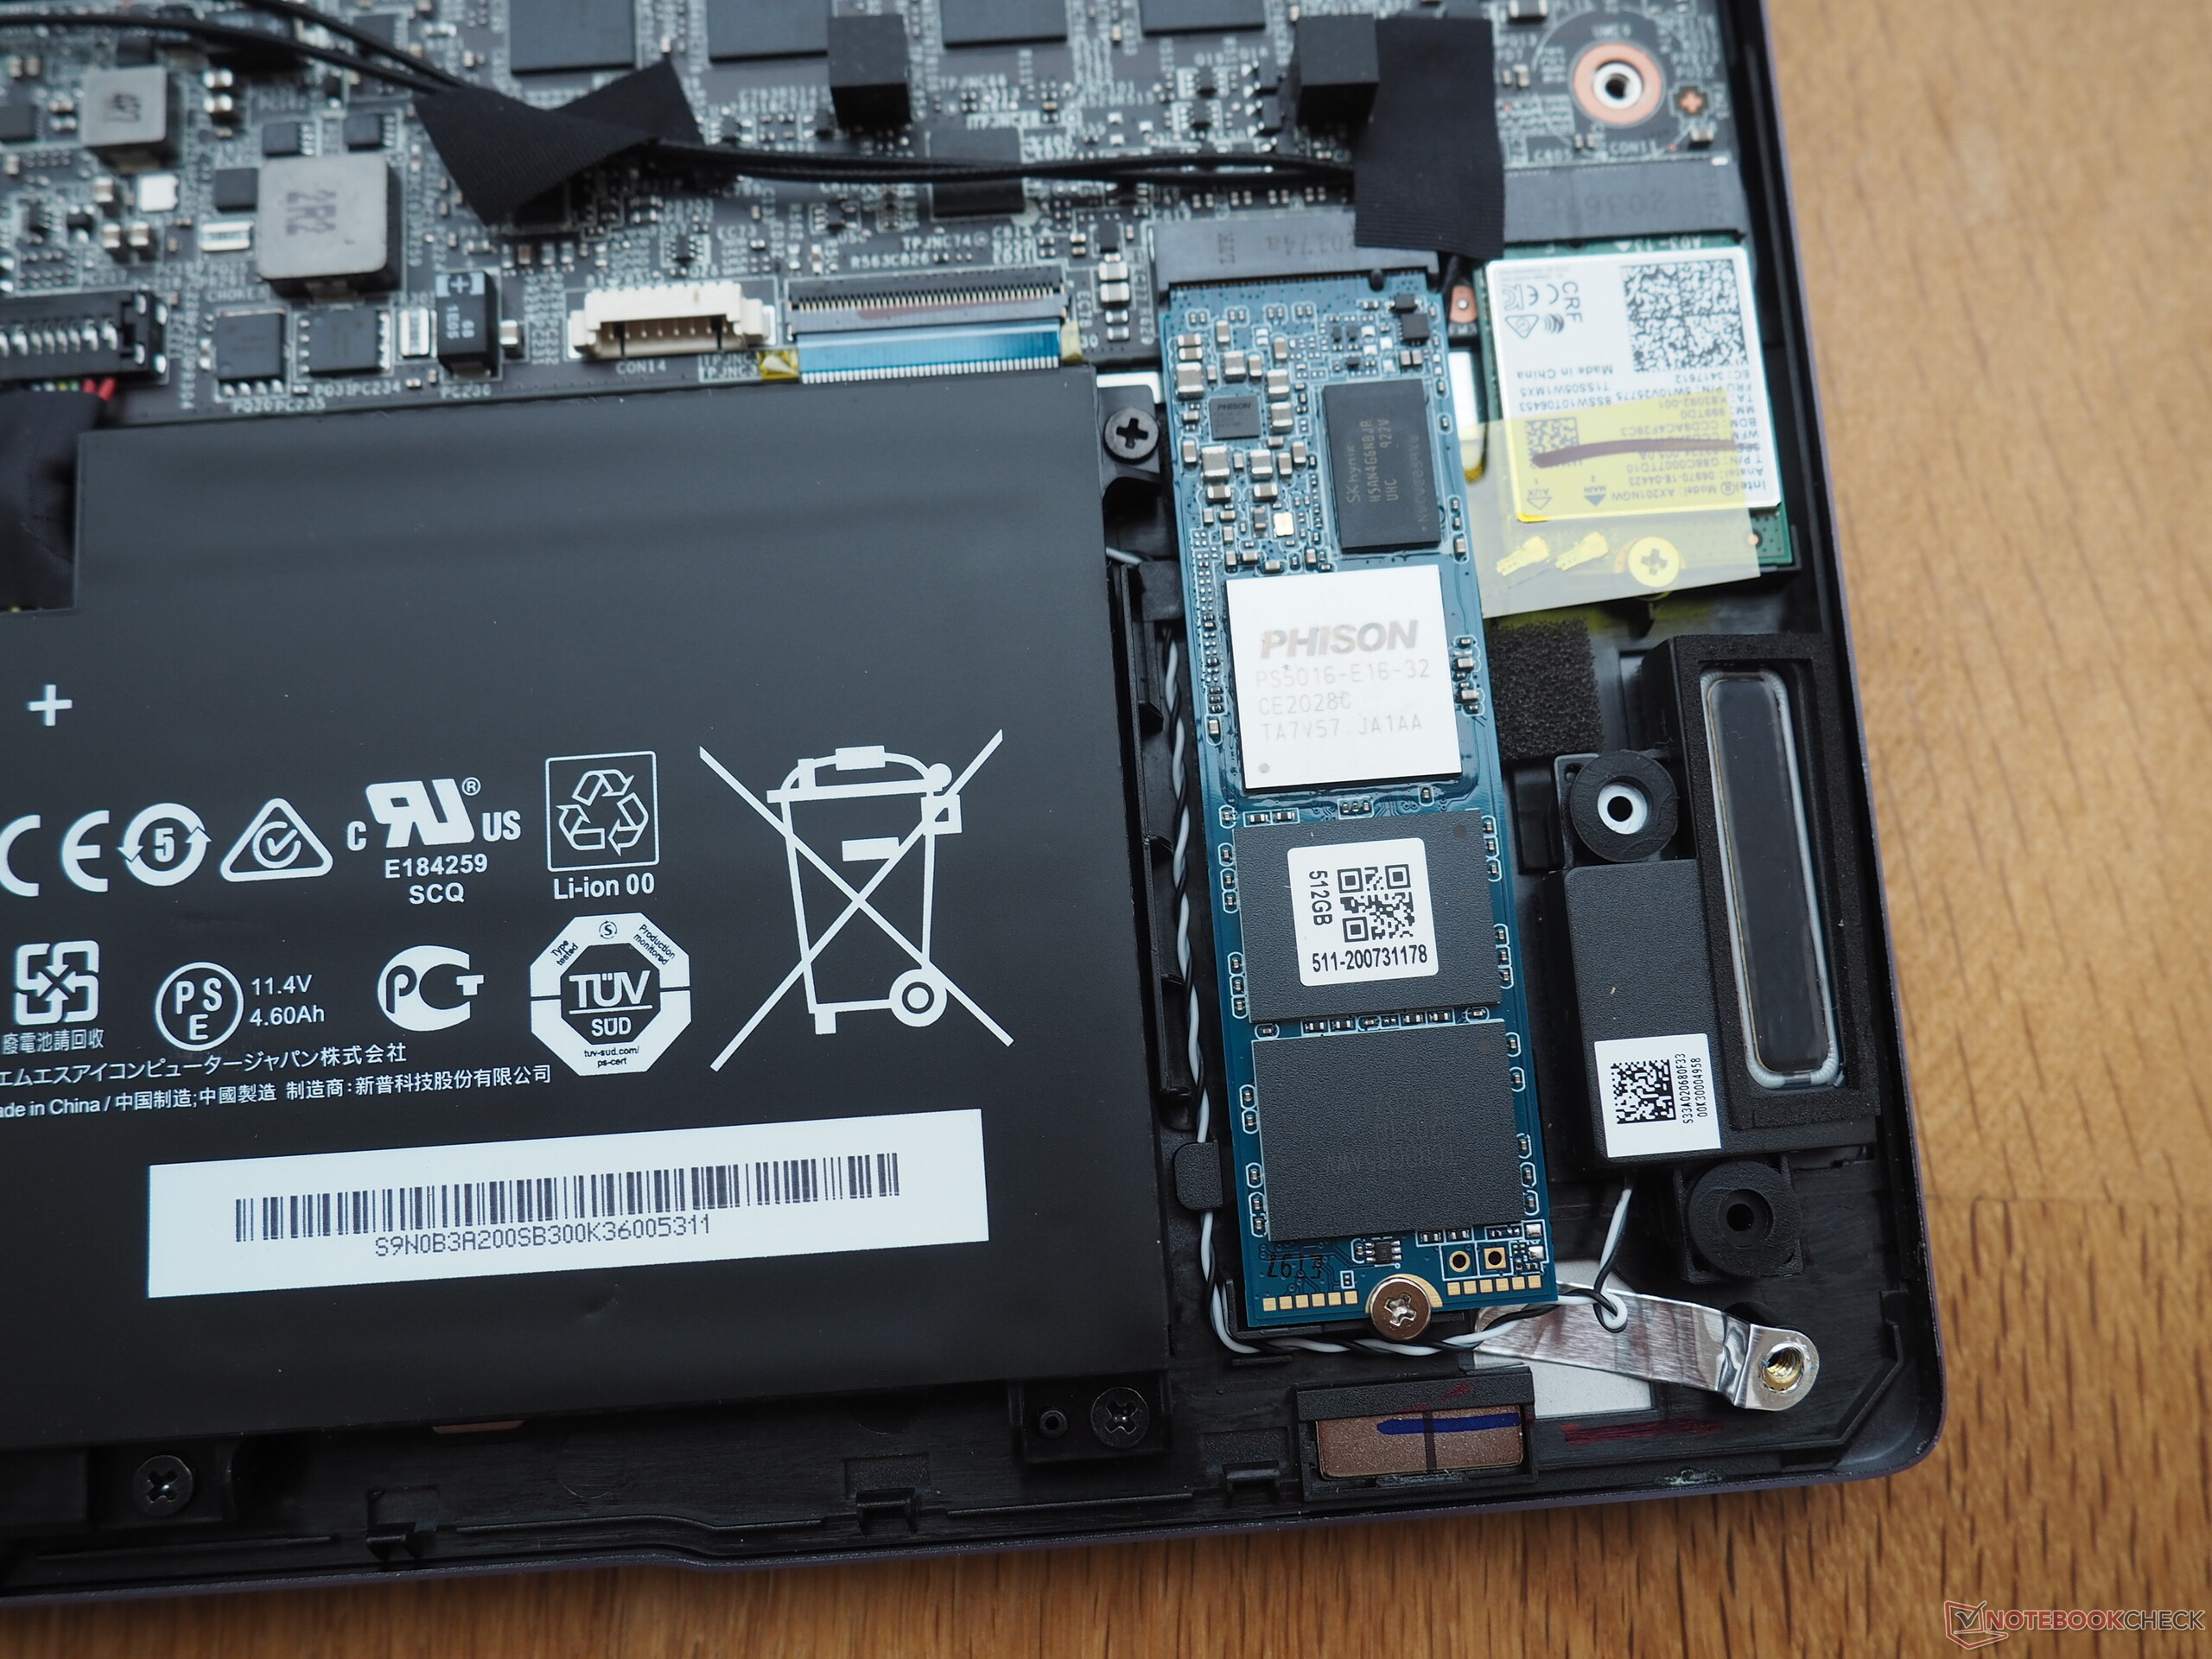
Storage Solution
MSI has equipped the Prestige 14 Evo with a 512-GB SSD from Samsung. In our storage benchmarks, this achieves very good read and write rates and is only surpassed by the SSD in the Schenker Vision 14, which also comes from Samsung.
Information on how other storage solutions fare in comparison can be found in our HDD/SSD benchmark list.
| MSI Prestige 14 Evo A11MO-026US Samsung PM9A1 MZVL2512HCJQ | MSI Prestige 14 Evo A11M-005 Phison 512GB SM280512GKBB4S-E162 | Schenker Vision 14 Samsung SSD 980 Pro 1TB MZ-V8P1T0BW | Asus ZenBook 13 UM325S SK Hynix HFM001TD3JX013N | Average Samsung PM9A1 MZVL2512HCJQ | Average of class Subnotebook | |
|---|---|---|---|---|---|---|
| CrystalDiskMark 5.2 / 6 | -6% | 32% | -22% | 4% | -6% | |
| Write 4K (MB/s) | 214.3 | 248.4 16% | 240 12% | 151.6 -29% | 179.1 ? -16% | 149 ? -30% |
| Read 4K (MB/s) | 88.5 | 56.4 -36% | 90.9 3% | 63.2 -29% | 75.6 ? -15% | 63.5 ? -28% |
| Write Seq (MB/s) | 3756 | 2513 -33% | 4236 13% | 2292 -39% | 3016 ? -20% | 2503 ? -33% |
| Read Seq (MB/s) | 1682 | 2250 34% | 4101 144% | 2073 23% | 3350 ? 99% | 3146 ? 87% |
| Write 4K Q32T1 (MB/s) | 511 | 589 15% | 662 30% | 505 -1% | 459 ? -10% | 424 ? -17% |
| Read 4K Q32T1 (MB/s) | 575 | 696 21% | 720 25% | 413.5 -28% | 554 ? -4% | 491 ? -15% |
| Write Seq Q32T1 (MB/s) | 4118 | 2515 -39% | 5222 27% | 3137 -24% | 4346 ? 6% | 4365 ? 6% |
| Read Seq Q32T1 (MB/s) | 6737 | 4915 -27% | 7102 5% | 3604 -47% | 6346 ? -6% | 5523 ? -18% |
| AS SSD | -33% | 20% | -24% | -14% | -41% | |
| Seq Read (MB/s) | 3970 | 3760 -5% | 4899 23% | 2916 -27% | 4656 ? 17% | 4293 ? 8% |
| Seq Write (MB/s) | 3048 | 2335 -23% | 3952 30% | 1566 -49% | 2742 ? -10% | 2858 ? -6% |
| 4K Read (MB/s) | 81 | 66.8 -18% | 83.8 3% | 56 -31% | 67 ? -17% | 58.7 ? -28% |
| 4K Write (MB/s) | 187.7 | 184.3 -2% | 205 9% | 159.8 -15% | 173.8 ? -7% | 168.3 ? -10% |
| 4K-64 Read (MB/s) | 1952 | 1801 -8% | 2938 51% | 1011 -48% | 1514 ? -22% | 850 ? -56% |
| 4K-64 Write (MB/s) | 2245 | 1754 -22% | 2077 -7% | 2136 -5% | 2355 ? 5% | 1694 ? -25% |
| Access Time Read * (ms) | 0.037 | 0.135 -265% | 0.025 32% | 0.028 24% | 0.04867 ? -32% | 0.06008 ? -62% |
| Access Time Write * (ms) | 0.022 | 0.018 18% | 0.02 9% | 0.028 -27% | 0.03605 ? -64% | 0.05891 ? -168% |
| Score Read (Points) | 2430 | 2244 -8% | 3512 45% | 1359 -44% | 2047 ? -16% | 1338 ? -45% |
| Score Write (Points) | 2737 | 2172 -21% | 2677 -2% | 2452 -10% | 2778 ? 1% | 2148 ? -22% |
| Score Total (Points) | 6377 | 5500 -14% | 7939 24% | 4451 -30% | 5812 ? -9% | 4112 ? -36% |
| Total Average (Program / Settings) | -20% /
-22% | 26% /
25% | -23% /
-23% | -5% /
-6% | -24% /
-26% |
* ... smaller is better

Constant Performance Reading: DiskSpd Read Loop, Queue Depth 8
Graphics Card
The internal Intel Iris Xe Graphics G7 96EUs graphics unit is responsible for the display of image contents in the Prestige 14 Evo. It shares the working memory with the processor and benefits from a dual-channel configuration as we see it here. It achieves results in the 3DMark benchmarks that are comparable with the level of other laptops with this GPU.
Since the graphics performance should not be improved by the Tiger Lake refresh, the values should be considered very good and above average. While in most of the single disciplines the predecessor model of the Prestige 14 is able to occupy first place, our test unit achieves the highest result of our comparison field in the Time Spy test.
You can find out what performance to expect from other graphics cards in comparison to this in our GPU benchmark list.
| 3DMark 06 Standard Score | 28857 points | |
| 3DMark 11 Performance | 7439 points | |
| 3DMark Cloud Gate Standard Score | 20559 points | |
| 3DMark Fire Strike Score | 5112 points | |
| 3DMark Time Spy Score | 2007 points | |
Help | ||
Gaming Performance
The Intel Iris Xe Graphics G7 in the Prestige 14 Evo is also able to display games with slightly higher demands on the graphics performance, as long as you use reduced detail levels. In this way, smooth frame rates around 30 fps are also possible in Full HD resolution. The Witcher 3 constant load test also shows that the performance remains constant in games over a longer time period.
You can find out what performance you can expect from other games in our GPU games list.
Witcher 3 FPS Chart
| The Witcher 3 - 1920x1080 High Graphics & Postprocessing (Nvidia HairWorks Off) | |
| Average of class Subnotebook (25.6 - 64, n=26, last 2 years) | |
| MSI Prestige 14 Evo A11MO-026US | |
| MSI Prestige 14 Evo A11M-005 | |
| Average Intel Iris Xe Graphics G7 96EUs (10.6 - 45.9, n=191) | |
| Schenker Vision 14 | |
| Far Cry 5 - 1920x1080 Medium Preset AA:T | |
| Average of class Subnotebook (21 - 59, n=37, last 2 years) | |
| MSI Prestige 14 Evo A11MO-026US | |
| Average Intel Iris Xe Graphics G7 96EUs (14 - 39, n=91) | |
| Asus ZenBook 13 UM325S | |
| Dota 2 Reborn - 1920x1080 ultra (3/3) best looking | |
| Average of class Subnotebook (13 - 94.9, n=70, last 2 years) | |
| MSI Prestige 14 Evo A11MO-026US | |
| MSI Prestige 14 Evo A11M-005 | |
| Average Intel Iris Xe Graphics G7 96EUs (20.6 - 78.5, n=221) | |
| Asus ZenBook 13 UM325S | |
| Schenker Vision 14 | |
| Final Fantasy XV Benchmark - 1920x1080 Standard Quality | |
| Average of class Subnotebook (15.1 - 51.3, n=66, last 2 years) | |
| MSI Prestige 14 Evo A11MO-026US | |
| Average Intel Iris Xe Graphics G7 96EUs (10.5 - 31.2, n=185) | |
| Schenker Vision 14 | |
| Asus ZenBook 13 UM325S | |
| Strange Brigade - 1920x1080 medium AA:medium AF:4 | |
| Average of class Subnotebook (29.8 - 87.7, n=61, last 2 years) | |
| MSI Prestige 14 Evo A11MO-026US | |
| Average Intel Iris Xe Graphics G7 96EUs (18.2 - 51.4, n=170) | |
| Schenker Vision 14 | |
| low | med. | high | ultra | QHD | 4K | |
|---|---|---|---|---|---|---|
| Sims 4 (2014) | 48.3 | |||||
| GTA V (2015) | 101 | 88.5 | 32.2 | 12.4 | ||
| The Witcher 3 (2015) | 34.8 | 15.7 | ||||
| Dota 2 Reborn (2015) | 148 | 90.2 | 65.5 | 61.9 | ||
| Deus Ex Mankind Divided (2016) | 47.9 | 38.9 | 22.3 | 9.8 | ||
| Final Fantasy XV Benchmark (2018) | 50.6 | 27.6 | 27.6 | |||
| X-Plane 11.11 (2018) | 26.3 | 37.3 | 32.9 | |||
| Far Cry 5 (2018) | 30 | 28 | 26 | |||
| Strange Brigade (2018) | 97.1 | 43.5 | 34.7 | 28.1 | ||
| Apex Legends (2019) | 70.1 | 35.4 | 28.5 | 28 | ||
| Fall Guys (2020) | 46.3 | |||||
| Horizon Zero Dawn (2020) | 0 severe graphical problems | |||||
| Star Wars Squadrons (2020) | 35.8 | 18.6 | ||||
| Call of Duty Black Ops Cold War (2020) | 0 game wont start | |||||
| Resident Evil Village (2021) | 34 small graphical problems | 20 small graphical problems | ||||
| Monster Hunter Stories 2 (2021) | 59 | 41.5 | 37.1 | 27.8 | 15.9 | |
| F1 2021 (2021) | 95.7 | 39.2 | 34.3 | 22.7 | ||
| Deathloop (2021) | ||||||
| FIFA 22 (2021) | 129 | 66 | 62.5 | 46 | ||
| Call of Duty Vanguard (2021) | 0 severe graphical problems | |||||
| Cyberpunk 2077 1.6 (2022) | 20.3 | 15.8 | 13.5 | 12.5 | ||
| Baldur's Gate 3 (2023) | 18.3 | 15.4 | 13.3 | 12.9 | ||
| Horizon Forbidden West (2024) | 0 game wont start | |||||
| Once Human (2024) | 18 | |||||
| Black Myth: Wukong (2024) | 10 |
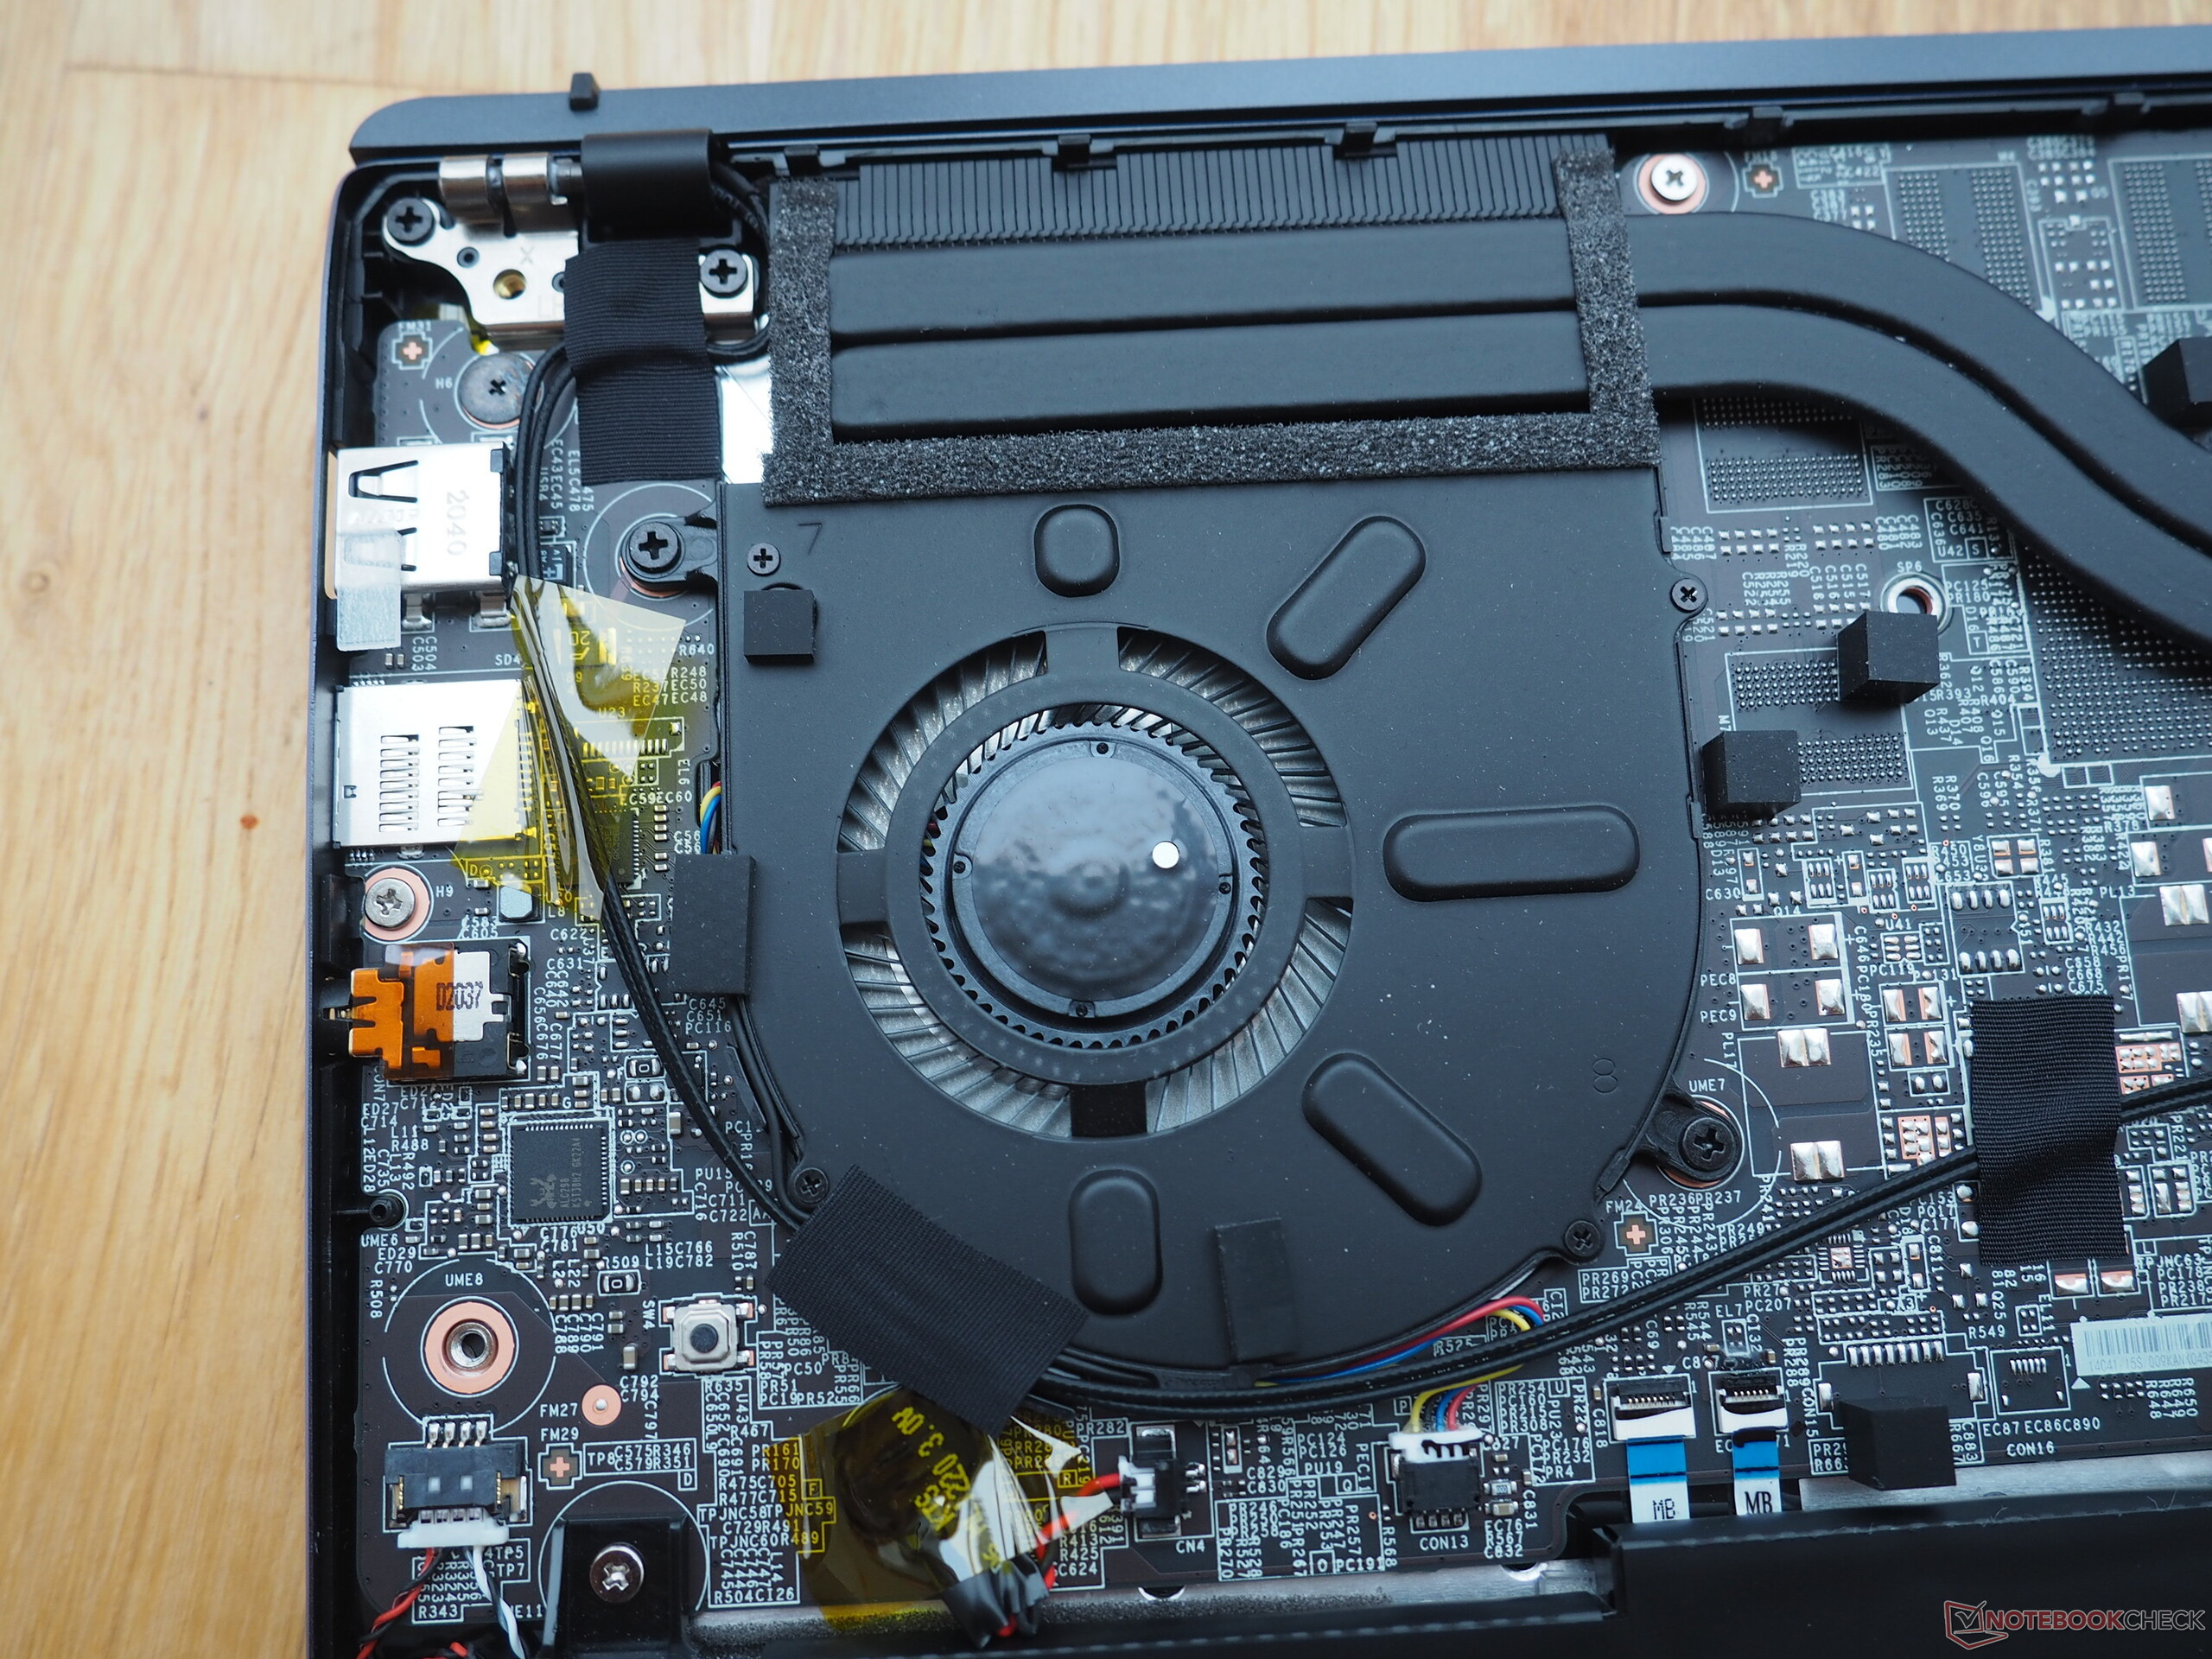
Emissions and Power Management - No coil whine anymore in the Prestige 14 Evo
Noise Emissions
With a noise level of up to 43.7 dB(A), the fan of the MSI Prestige 14 Evo is clearly noticeable under load. However, in daily operation with office applications and browsing the Internet, the Windows laptop remains mostly silent.
The coil whine from the Prestige 14 Evo A11M cannot be heard in our current test unit anymore.
Noise level
| Idle |
| 24.3 / 26.9 / 28.8 dB(A) |
| Load |
| 36.8 / 43.7 dB(A) |
 | ||
30 dB silent 40 dB(A) audible 50 dB(A) loud |
||
min: | ||
Temperatures
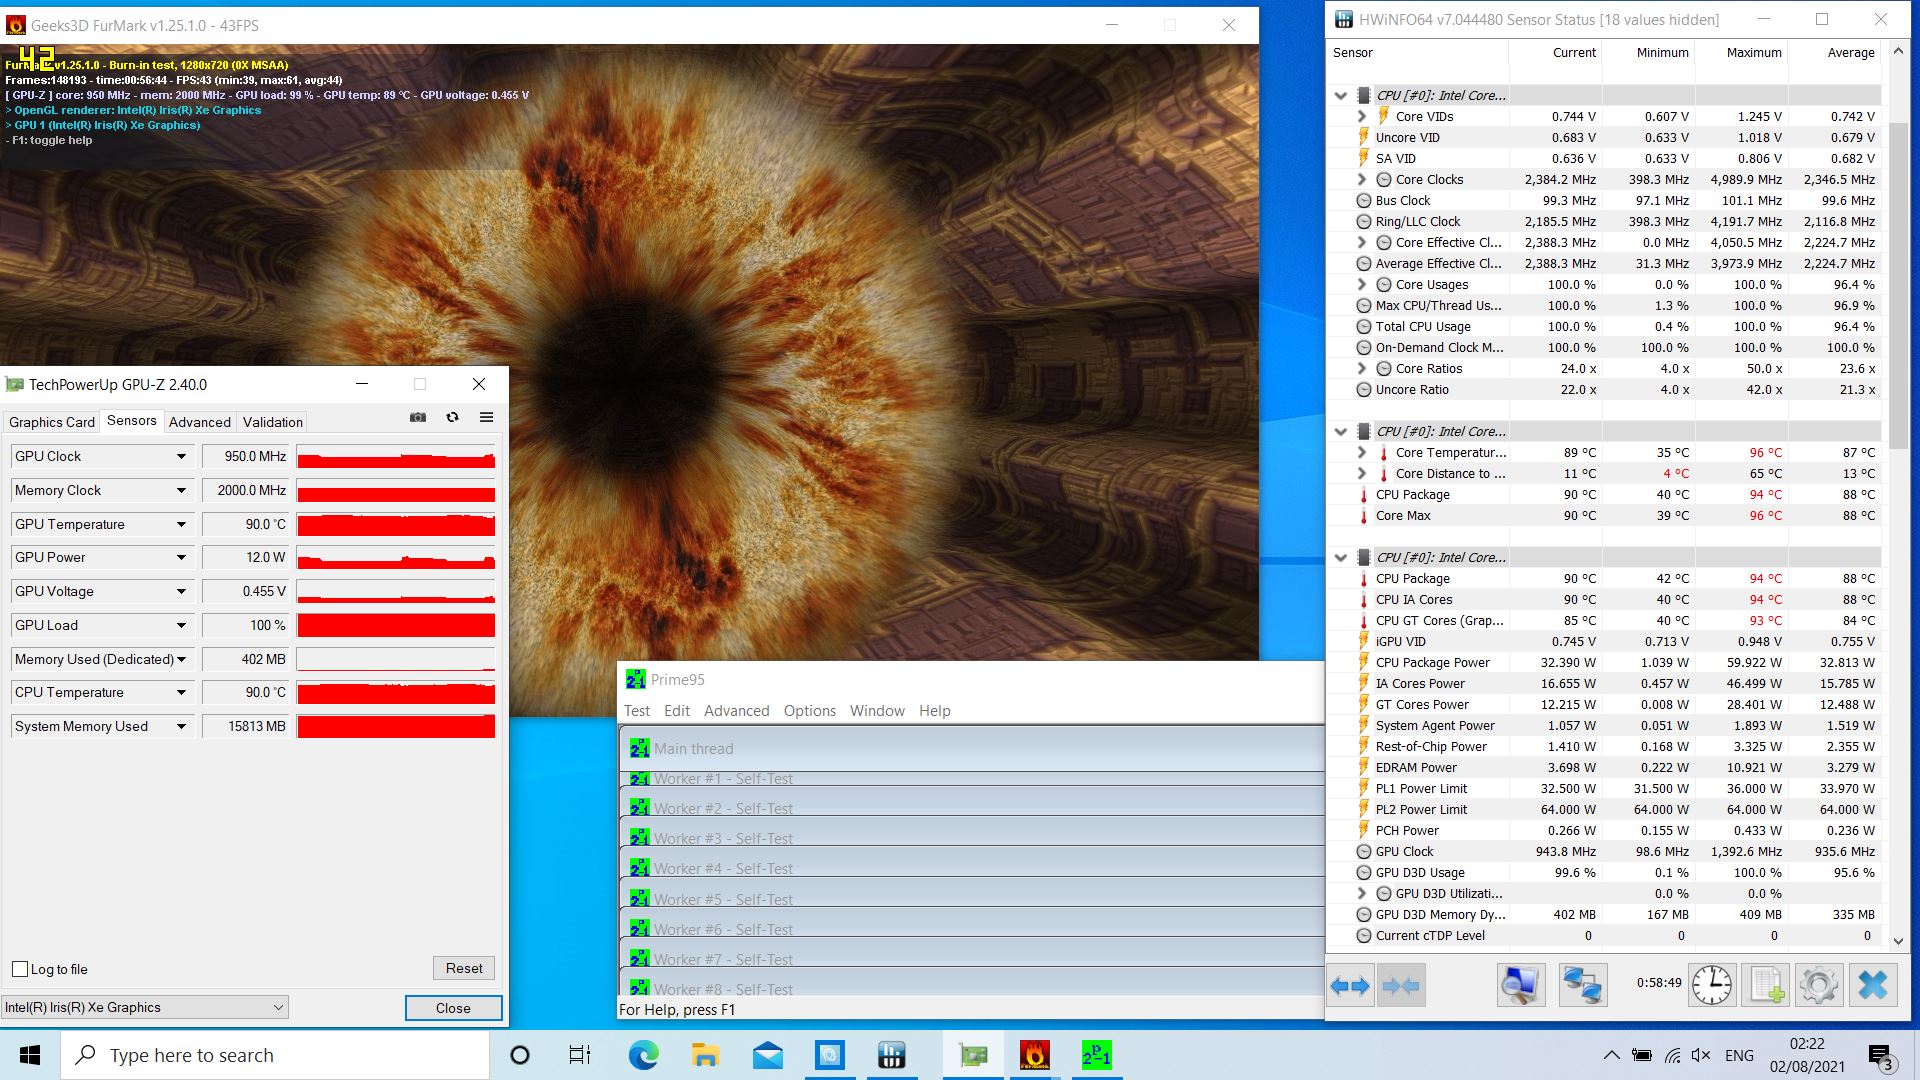
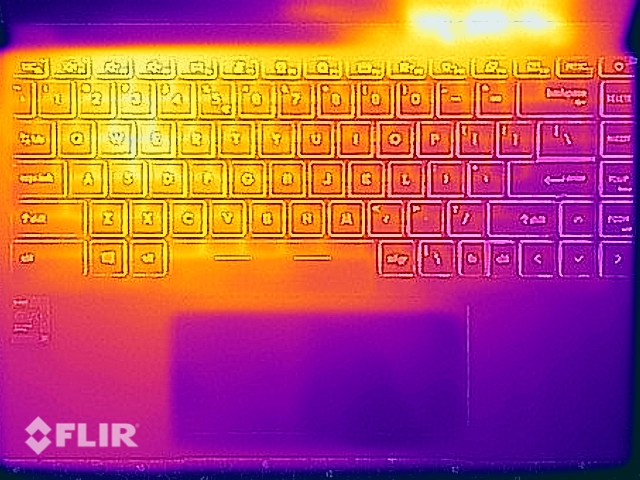
According to our measurements, the surfaces of the Prestige 14 Evo warm up to 58.1 °C (136.6 °F) under load. While the case still doesn't feel hot with this, it is noticeably warm. At slightly above 30 °C (86 °F), the temperatures at the palm rest are just barely within a moderate range.
During our stress test, which lasted about one hour, the temperatures inside the Prestige 14 Evo rose up to 94 °C (201 °F). While testing, the clock speeds dropped to an average value of about 2.4 GHz, which is less than the basic clock speed of 2.9 GHz. However, the system could still be operated smoothly during this time, and it also recovered quickly after the end of the test. This means that you should not have to expect any limitations due to temperatures being too high in everyday operation.
(-) The maximum temperature on the upper side is 46.1 °C / 115 F, compared to the average of 35.9 °C / 97 F, ranging from 21.4 to 72.4 °C for the class Subnotebook.
(-) The bottom heats up to a maximum of 58.1 °C / 137 F, compared to the average of 39.3 °C / 103 F
(+) In idle usage, the average temperature for the upper side is 24.8 °C / 77 F, compared to the device average of 30.8 °C / 87 F.
(±) Playing The Witcher 3, the average temperature for the upper side is 36.8 °C / 98 F, compared to the device average of 30.8 °C / 87 F.
(±) The palmrests and touchpad can get very hot to the touch with a maximum of 36.1 °C / 97 F.
(-) The average temperature of the palmrest area of similar devices was 28.2 °C / 82.8 F (-7.9 °C / -14.2 F).
Speakers
The speakers of the MSI Prestige 14 Evo produce a relatively high volume and a sound spectrum that emphasizes the mids, which makes them suited for the reproduction of voice content. However, for music and other media content, external speakers or headphones are recommended.
MSI Prestige 14 Evo A11MO-026US audio analysis
(+) | speakers can play relatively loud (82.3 dB)
Bass 100 - 315 Hz
(-) | nearly no bass - on average 17.7% lower than median
(+) | bass is linear (6.6% delta to prev. frequency)
Mids 400 - 2000 Hz
(±) | higher mids - on average 8.7% higher than median
(±) | linearity of mids is average (8.4% delta to prev. frequency)
Highs 2 - 16 kHz
(+) | balanced highs - only 2.6% away from median
(+) | highs are linear (5.4% delta to prev. frequency)
Overall 100 - 16.000 Hz
(±) | linearity of overall sound is average (20.5% difference to median)
Compared to same class
» 65% of all tested devices in this class were better, 7% similar, 27% worse
» The best had a delta of 5%, average was 18%, worst was 53%
Compared to all devices tested
» 54% of all tested devices were better, 8% similar, 39% worse
» The best had a delta of 4%, average was 24%, worst was 134%
Schenker Vision 14 audio analysis
(±) | speaker loudness is average but good (75.2 dB)
Bass 100 - 315 Hz
(-) | nearly no bass - on average 21.7% lower than median
(±) | linearity of bass is average (11% delta to prev. frequency)
Mids 400 - 2000 Hz
(+) | balanced mids - only 3.7% away from median
(+) | mids are linear (4.2% delta to prev. frequency)
Highs 2 - 16 kHz
(+) | balanced highs - only 3.2% away from median
(±) | linearity of highs is average (7.4% delta to prev. frequency)
Overall 100 - 16.000 Hz
(±) | linearity of overall sound is average (19.6% difference to median)
Compared to same class
» 61% of all tested devices in this class were better, 6% similar, 33% worse
» The best had a delta of 5%, average was 18%, worst was 53%
Compared to all devices tested
» 49% of all tested devices were better, 7% similar, 44% worse
» The best had a delta of 4%, average was 24%, worst was 134%
Power Consumption
Under load, we measure a maximum power consumption of 65.6 watts for the Prestige 14 Evo. However, this only lasts for a short time, before it drops to an even level of about 53 watts. This means that the included 65-watt power supply offers sufficient power.
With an average power consumption of 5.2 watts in our scenario of idle operation, the MSI laptop is also an efficient device.
| Off / Standby | |
| Idle | |
| Load |
|
Key:
min: | |
Power Consumption Witcher 3 / Stress Test
Battery Life
In our realistic WLAN test, the MSI Prestige 14 Evo achieves a runtime of 8.5 hours. With this, it lasts longer than the predecessor longer and is only surpassed by the Asus ZenBook 13.
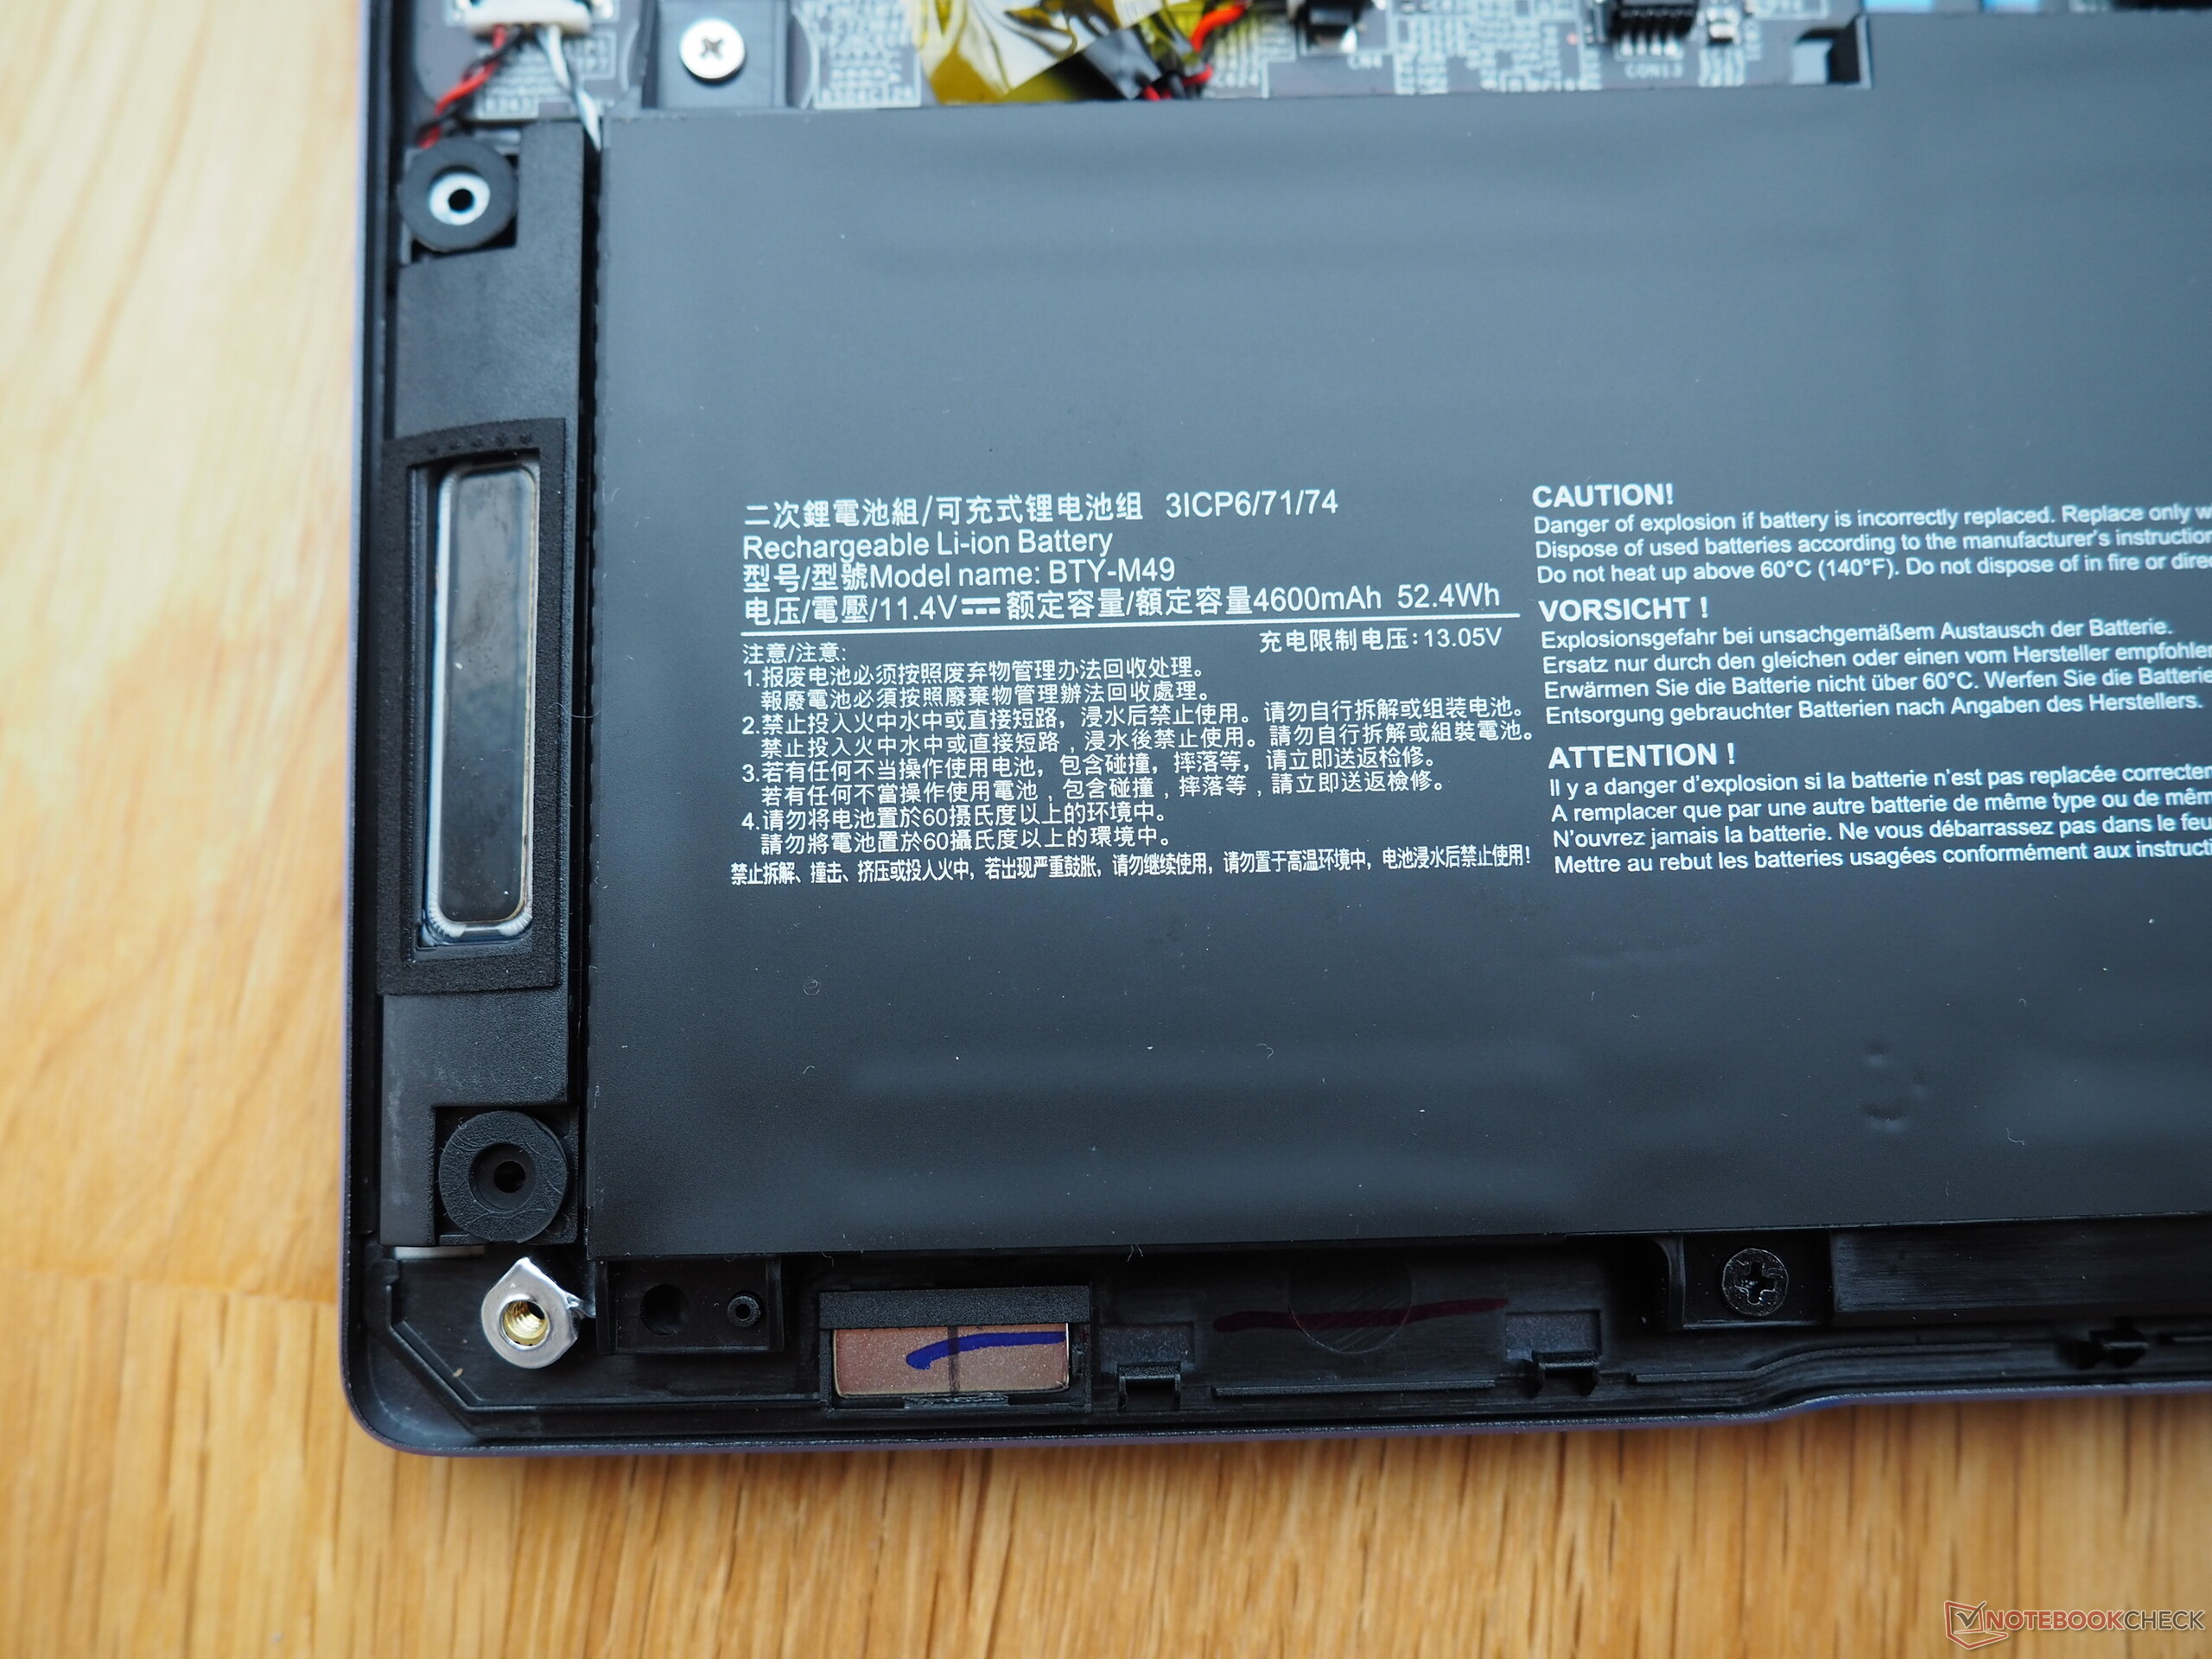
With the support for fast charging, the 52-Wh capacity battery can be completely recharged within about 1.5 hours.
Pros
Cons
Verdict - Intel's new flagship without any significant performance advantage
The performance of Intel's new high-end processor remains relatively pale in our test. While the MSI Prestige 14 Evo again represents a good base, even with the high power limit of more than 30 watts, there is only a small performance advantage at the beginning of the benchmark compared to the i7-1185G7 or even a fast i7-1165G7. The increased clock speed is mainly noticeable only on the spec sheet, but in practice, you would need a significantly better cooling system, which is almost impossible to integrate into slim and compact laptops. In addition, you would then already move within the range of the 45-watt CPUs (Tiger Lake-H) with 8 cores, which offer significantly higher multi-core performance. The regular Core i7-1165G7 is completely sufficient and not much slower with the same TDP configuration anyways.
With the new Core i7-1195G7, the MSI Prestige 14 Evo is again a good subnotebook, but Intel's new mobile high-end processor doesn't really offer any additional value. Without improvements in the efficiency, the well-known principle of just increasing the clock speed doesn't bring much improvement by itself.
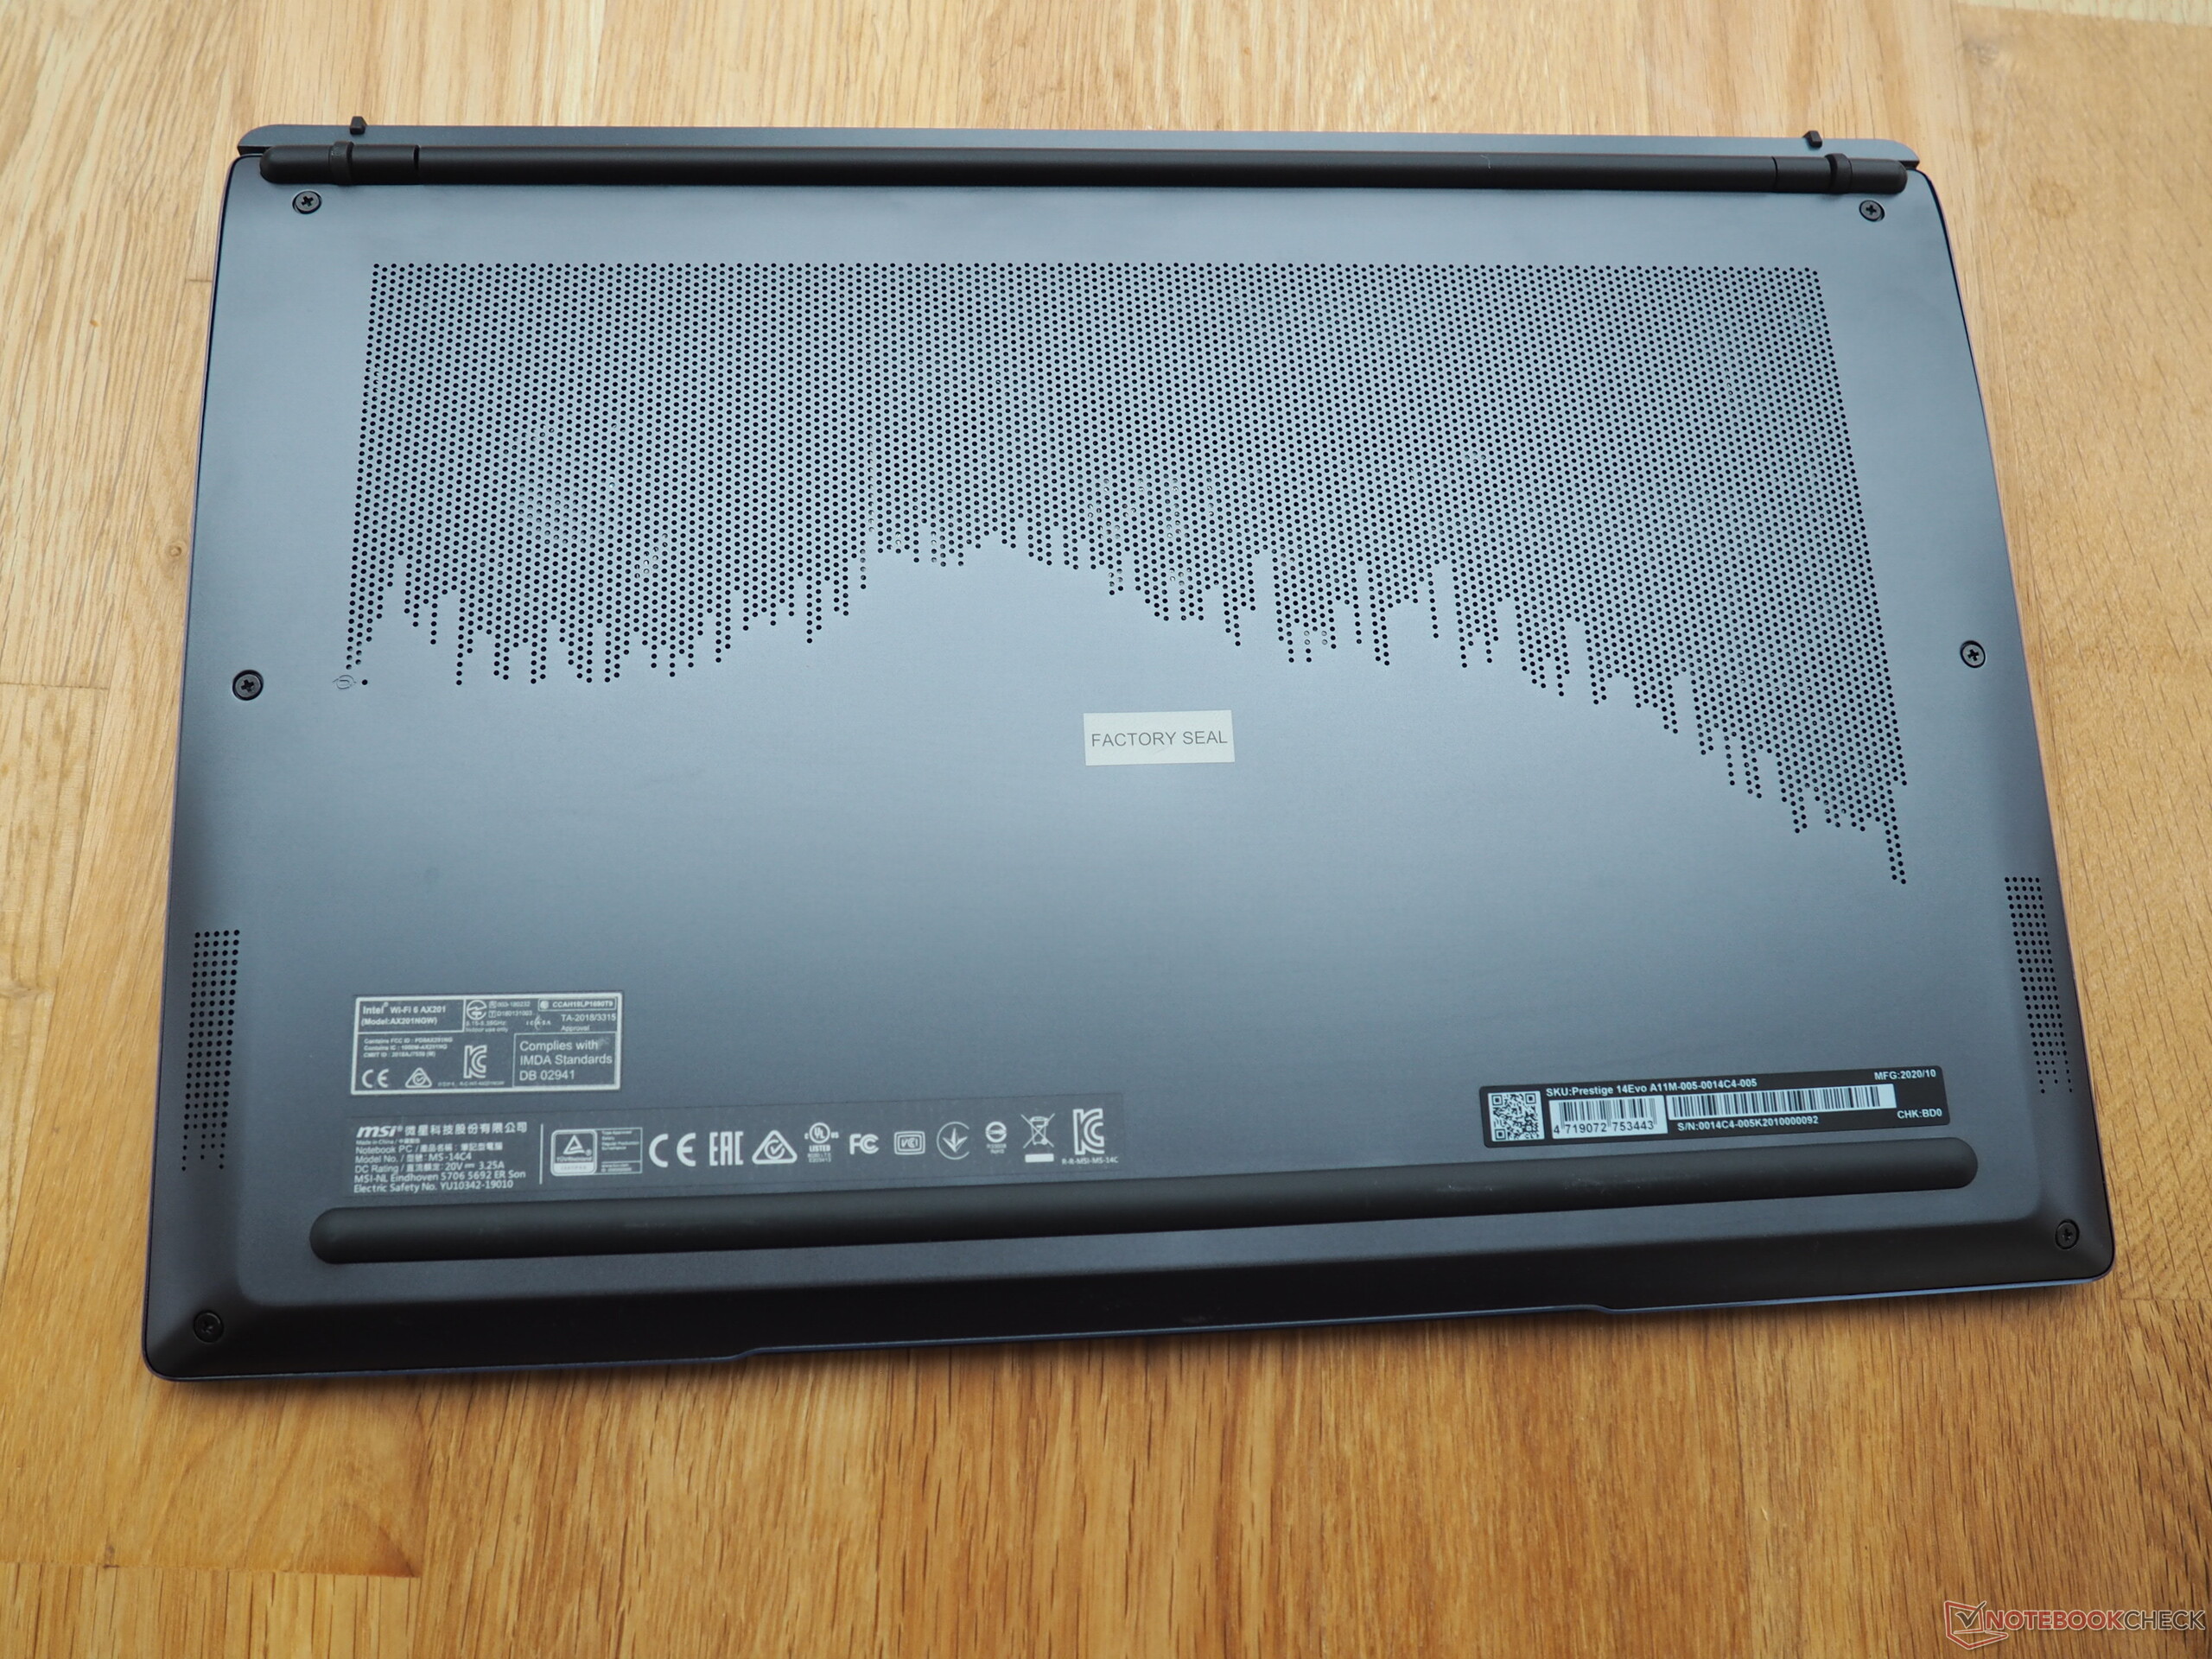
The MSI Prestige 14 Evo continues to be a good ultra book, but the known reasons for complaint remain. The selection of connections is still limited, and the Thunderbolt 4 connections often need additional adapters. The maintenance options continue to be as limited as before. On the other hand, the fact that there is no coil whine, which the predecessor still suffered from, is a very positive point.
This and the improved battery performance ensure that the MSI Prestige 14 Evo is a powerful competitor for devices such as the Asus Zenbook 13 and the Schenker Vision 14.
Price and Availability
A configuration of MSI Prestige 14 Evo A11MO with the new Core i7-1195G7 processor is currently available from Amazon for $1299, for example.
MSI Prestige 14 Evo A11MO-026US
- 08/02/2021 v7 (old)
Mike Wobker
Price comparison

